Aberrant protein expression in plasma and kidney tissue during experimental obstructive nephropathy
14
RESEARCH ARTICLE Aberrant protein expression in plasma and kidney tissue during experimental obstructive nephropathy Eleni Giannakis 1 , Chrishan S. Samuel 1,2 , Tim D. Hewitson 3,4 , Wee-Ming Boon 5 , Mary Macris 1 , Shane Reeve 6 , Josie Lawrence 6 , A. Ian Smith 6 , Geoffrey W. Tregear 1,2 and John D. Wade 1,7 1 Howard Florey Institute, The University of Melbourne, Victoria, Australia 2 Department of Biochemistry and Molecular Biology, The University of Melbourne, Victoria, Australia 3 Department of Nephrology, The Royal Melbourne Hospital, Victoria, Australia 4 Department of Medicine, Royal Melbourne Hospital, University of Melbourne, Victoria, Australia 5 Department of Physiology, Monash University, Victoria, Australia 6 Department of Biochemistry, Monash University, Victoria, Australia 7 School of Chemistry, University of Melbourne, Victoria, Australia Received: February 16, 2009 Revised: May 26, 2009 Accepted: June 29, 2009 Kidney failure is a major health problem worldwide. Patients with end-stage renal disease require intensive medical support by dialysis or kidney transplantation. Current methods for diagnosis of kidney disease are either invasive or insensitive, and renal function may decline by as much as 50% before it can be detected using current techniques. The goal of this study was, therefore, to identify biomarkers of kidney disease (associated with renal fibrosis) that can be used for the development of a non-invasive clinical test for early disease detection. We utilized two protein-profiling technologies (SELDI-TOF MS and 2-D) to screen the plasma and kidney proteome for aberrantly expressed proteins in an experimental mouse model of unilateral uretric obstruction, which mimics the pathology of human renal disease. Several differentially regulated proteins were detected at the plasma level of day-3-obstructed animals, which included serum amyloid A1, fibrinogen a, haptoglobin precursor protein, haptoglobin and major urinary proteins 11 and 8. Differentially expressed proteins detected at the tissue level included ras-like activator protein 2, haptoglobin precursor protein, malate dehy- drogenase, a enolase and murine urinary protein (all po0.05 versus controls). Immunohis- tochemistry was used to confirm the up-regulation of fibrinogen. Interestingly, these proteins are largely separated into four major classes: (i) acute-phase reactants (ii) cell-signaling molecules (iii) molecules involved in cell growth and metabolism and (iv) urinary proteins. These results provide new insights into the pathology of obstructive nephropathy and may facilitate the development of specific assay(s) to detect and monitor renal fibrosis. Keywords: 2-D / Protein profiling / Renal fibrosis / SELDI-TOF MS / Unilateral uretric obstruction 1 Introduction Obstructive nephropathy encompasses a group of disorders with impaired urine flow due to abnormalities of the urinary tract. Clinical outcomes depend on many factors including age, severity (complete or partial), totality (bilateral or unilateral) and duration of obstruction [1]. In the adult kidney, permanent unilateral obstruction leads to destruc- tion of the renal parenchyma through interstitial inflam- mation, tubular apoptosis and interstitial fibrosis [2]; ultimately leading to end-stage renal disease (ESRD), which requires intensive medical support by dialysis or trans- plantation. Despite its significance, the mechanisms associated with obstructive nephropathy remain poorly understood. A National Institutes of Health working party, therefore, Abbreviations: ESRD, end-stage renal disease; MUP, major urinary protein; SAA1, serum amyloid A1; UUO, unilateral ureteric obstruction Correspondence: Professor John D. Wade, School of Chemistry, University of Melbourne, Victoria 3010, Australia E-mail: john.wade@florey.edu.au Fax:161-3-9348-1707 & 2009 WILEY-VCH Verlag GmbH & Co. KGaA, Weinheim www.clinical.proteomics-journal.com Proteomics Clin. Appl. 2009, 3, 1211–1224 1211 DOI 10.1002/prca.200900021
-
Upload
independent -
Category
Documents
-
view
3 -
download
0
Transcript of Aberrant protein expression in plasma and kidney tissue during experimental obstructive nephropathy
RESEARCH ARTICLE
Aberrant protein expression in plasma and kidney tissue
during experimental obstructive nephropathy
Eleni Giannakis1, Chrishan S. Samuel1,2, Tim D. Hewitson3,4, Wee-Ming Boon5, Mary Macris1,Shane Reeve6, Josie Lawrence6, A. Ian Smith6, Geoffrey W. Tregear1,2 and John D. Wade1,7
1 Howard Florey Institute, The University of Melbourne, Victoria, Australia2 Department of Biochemistry and Molecular Biology, The University of Melbourne, Victoria, Australia3 Department of Nephrology, The Royal Melbourne Hospital, Victoria, Australia4 Department of Medicine, Royal Melbourne Hospital, University of Melbourne, Victoria, Australia5 Department of Physiology, Monash University, Victoria, Australia6 Department of Biochemistry, Monash University, Victoria, Australia7 School of Chemistry, University of Melbourne, Victoria, Australia
Received: February 16, 2009
Revised: May 26, 2009
Accepted: June 29, 2009
Kidney failure is a major health problem worldwide. Patients with end-stage renal disease
require intensive medical support by dialysis or kidney transplantation. Current methods for
diagnosis of kidney disease are either invasive or insensitive, and renal function may decline
by as much as 50% before it can be detected using current techniques. The goal of this study
was, therefore, to identify biomarkers of kidney disease (associated with renal fibrosis) that
can be used for the development of a non-invasive clinical test for early disease detection. We
utilized two protein-profiling technologies (SELDI-TOF MS and 2-D) to screen the plasma
and kidney proteome for aberrantly expressed proteins in an experimental mouse model of
unilateral uretric obstruction, which mimics the pathology of human renal disease. Several
differentially regulated proteins were detected at the plasma level of day-3-obstructed animals,
which included serum amyloid A1, fibrinogen a, haptoglobin precursor protein, haptoglobin
and major urinary proteins 11 and 8. Differentially expressed proteins detected at the tissue
level included ras-like activator protein 2, haptoglobin precursor protein, malate dehy-
drogenase, a enolase and murine urinary protein (all po0.05 versus controls). Immunohis-
tochemistry was used to confirm the up-regulation of fibrinogen. Interestingly, these proteins
are largely separated into four major classes: (i) acute-phase reactants (ii) cell-signaling
molecules (iii) molecules involved in cell growth and metabolism and (iv) urinary proteins.
These results provide new insights into the pathology of obstructive nephropathy and may
facilitate the development of specific assay(s) to detect and monitor renal fibrosis.
Keywords:
2-D / Protein profiling / Renal fibrosis / SELDI-TOF MS / Unilateral uretric obstruction
1 Introduction
Obstructive nephropathy encompasses a group of disorders
with impaired urine flow due to abnormalities of the urinary
tract. Clinical outcomes depend on many factors including
age, severity (complete or partial), totality (bilateral or
unilateral) and duration of obstruction [1]. In the adult
kidney, permanent unilateral obstruction leads to destruc-
tion of the renal parenchyma through interstitial inflam-
mation, tubular apoptosis and interstitial fibrosis [2];
ultimately leading to end-stage renal disease (ESRD), which
requires intensive medical support by dialysis or trans-
plantation.
Despite its significance, the mechanisms associated
with obstructive nephropathy remain poorly understood.
A National Institutes of Health working party, therefore,
Abbreviations: ESRD, end-stage renal disease; MUP, major
urinary protein; SAA1, serum amyloid A1; UUO, unilateral
ureteric obstruction
Correspondence: Professor John D. Wade, School of Chemistry,
University of Melbourne, Victoria 3010, Australia
E-mail: [email protected]
Fax:161-3-9348-1707
& 2009 WILEY-VCH Verlag GmbH & Co. KGaA, Weinheim www.clinical.proteomics-journal.com
Proteomics Clin. Appl. 2009, 3, 1211–1224 1211DOI 10.1002/prca.200900021
concluded that development of biomarkers in appropriate
clinical and experimental models was a major research
priority in obstructive nephropathy. These would enable
both the measurement of renal injury and the functional
impairment, and a means of elucidating the cellular and
molecular basis of the disorder [3, 4].
Although examination of biopsy tissue remains the best
current diagnostic tool for biomarker discovery, the proce-
dure is invasive, difficult to interpret and by its nature is
limited in frequency. Biochemical measures of renal func-
tion are therefore routinely used. The increase in serum
creatinine for instance is proportional to the loss of renal
output. However, such biochemical parameters are inher-
ently deficient, as they are both reactive and relatively
insensitive. The clinical reality is therefore that most
patients present with established renal damage, where their
renal function may have declined by as much as 50% before
it is detected.
It is therefore hypothesized that identifying biomarkers of
obstructive nephropathy will lead to the development of a
non-invasive clinical means for early detection of kidney
disease, which will allow timely therapeutic intervention
and prevention of established/irreversible renal damage.
This may subsequently lead to enhanced diagnosis, prognosis
and treatment monitoring of high-risk patients. The identi-
fication of biomarkers may also lead to the subsequent
discovery of potential drug targets to control the cascade of
destructive effects, thereby minimizing and ultimately
preventing the adverse outcomes associated with the disease
state. This is of particular importance since current treatment
strategies are only effective at impeding ESRD by a matter of
months.
The objective of this study was therefore to use protein-
profiling techniques to identify potential novel biomarkers
of renal disease in a murine model of unilateral ureteric
obstruction (UUO). Although complete unilateral obstruc-
tion is not a common form of renal disease in humans, it
closely mimics, in an accelerated manner, the different
stages of obstructive nephropathy [5, 6]. Furthermore, its
pathogenesis shares many features with other forms of
tubulointerstitial renal disease, where the final fibrotic
phase is very similar in all progressive renal diseases,
regardless of the underlying etiology. Thus, delineating the
factors that contribute to UUO will not only provide
potentially specific therapeutic targets, but will also contri-
bute to our understanding of renal disease in general.
In this study, we compared the protein profile of renal
tissue and plasma from normal mice and animals 3 days after
UUO. The experimental time point was chosen on the basis
of our previous studies demonstrating early rapidly progres-
sive inflammation and fibrogenesis in this model [7]. To
ensure extensive investigation of the proteome we coupled (i)
SELDI-TOF MS, which is useful for analyzing the lower-
molecular-weight proteome (o45 kDa) and (ii) complemen-
tary 2-D which, in contrast, is advantageous for assessing the
higher-molecular-weight proteome.
2 Materials and methods
2.1 Animals and experimental protocol
This study primarily focuses on protein profiling of plasma
and kidney tissue from the UUO model on the basis that
UUO is a widely used model of primary renal tubulointer-
stitial fibrosis, which occurs independently of species and
strain and demonstrates changes that mimic the pathology
of human progressive renal disease [5–8]. It should be noted
that urine was not analyzed in this study. UUO results in a
single non-functioning kidney (no urine output) and a
functioning contralateral kidney (normal or increased urine
output). We chose to examine tissue and plasma, and avoid
any confounding variables (e.g. urine flow and intact
glomerular filtration barrier) associated with the uninjured
contralateral kidney.
For studies involving the UUO model, 4- to 6-wk-old
male wild-type mice (on a C57B6J� 129SV background;
n 5 4 control and n 5 5 disease animals were supplied for
the SELDI MS studies) were generated from heterozygous
parents and housed in a controlled environment with a fixed
lighting schedule and free access to rodent lab chow (Bara-
stock Stockfeeds, Pakenham, Victoria, Australia) and water.
UUO surgery was performed under general anesthesia. The
left ureter of each mouse was ligated with 5.0 surgical silk
while the contralateral ureter remained intact. The incision
was sutured and mice were allowed to recover after temgesic
administration (Buprenorphine; Reckitt Benckiser, West
Ryde, NSW, Australia). The outlined experiments were
approved by the Howard Florey Institute’s Animal Ethics
Committee, which adheres to the Australian Code of Prac-
tice for the Care and Use of Laboratory Animals for Scien-
tific Purposes.
2.2 Tissue and plasma collection
Cardiac puncture was used to collect plasma while kidney
tissues were isolated from wild-type animals at day-0 (control;
n 5 4) and day-3 (n 5 5) post-UUO, as described previously
[7]. UUO affects different parts of the kidney in different
ways. In order to ensure that all anatomical compartments
were represented in our analysis, equivalent cross-sections of
the kidney were collected from each animal. All samples were
then stored at �801C until required.
2.3 Tissue extraction
Frozen tissue was pulverized into a fine powder using a
mortar and pestle and immediately transferred to 1.5 mL
tubes. Extraction buffer (10 mM Tris-HCl, 10 mM NaCl,
0.1% Triton X-100, pH 7.6, and protease inhibitor, complete
mini EDTA free, Roche Diagnostics, Mannheim, Germany)
was then added to the disrupted tissue (10 mL/mg tissue),
1212 E. Giannakis et al. Proteomics Clin. Appl. 2009, 3, 1211–1224
& 2009 WILEY-VCH Verlag GmbH & Co. KGaA, Weinheim www.clinical.proteomics-journal.com
before samples were further homogenized by passing the
extract through a 19G needle ten times. The homogenates
were incubated on ice for 1 h with periodic mixing, followed
by centrifugation at 15 000� g at 41C for 10 min. The
supernatants (containing total cellular proteins) were
aliquoted into fresh tubes and stored at �801C until
required.
2.4 Sample handling and standardization
All tissue and plasma samples were collected, stored and
processed according to a strict standard operating procedure
to ensure that both (i) conformity of sample preparations was
achieved and (ii) differences observed between groups were a
true reflection of the phenotypes being examined rather than
a consequence of variations introduced during processing.
Furthermore, analysis was performed with replicate samples
to ensure reproducibility, as described previously [9]. Protein
standardization was one of the key steps taken to ensure
conformity of the tissue preparations. Once protein concen-
trations from the tissue homogenates were quantified (as
described in Section 2.5), the concentration of samples was
subsequently standardized using extraction buffer; hence,
both the protein concentration and the buffer constituents of
all samples were identical prior to performing a final dilution
in the binding buffer. This is a critical step as the protein
concentration affects both peak number and intensity and the
buffer constituents determine the binding stringency. The
resulting protein patterns produced were similar, demon-
strating conformity of sample preparations.
2.5 Total protein quantitation assay
A Bradford protein quantification assay was performed
according to the manufacturer’s instructions (Quanti-
chrome Protein Determination Assay, Bio Assay Systems,
Hayward, CA, USA) to determine the total protein concen-
tration of each sample.
2.6 Biomarker detection – plasma preparation for
SELDI-TOF MS analysis
Plasma samples were diluted in 8 M urea, 1% CHAPS, PBS
(1:1.5) and incubated on a shaking platform for 30 min on ice.
Samples were then diluted in the appropriate wash buffer
(1:30) in preparation for analysis with SELDI-TOF MS.
2.7 Biomarker detection – tissue preparation for
SELDI-TOF MS analysis
Total protein concentrations of each sample were adjusted
to the same concentration by using the extraction buffer, to
ensure they were identical with respect to protein concen-
tration and buffer constituents. The samples were subse-
quently diluted to a final concentration of 1 mg/mL in the
appropriate wash buffers in preparation for analysis with
SELDI-TOF MS.
2.8 SELDI-TOF MS analysis
Samples were analyzed in duplicate using the following
arrays and wash buffers: (i) Q10 (anion exchange) and
100 mM Tris-HCl, pH 9, (ii) H50 (hydrophobic) and 5%
ACN, 0.1% TFA and (iii) IMAC30 (immobilized metal affi-
nity capture) pre-coated with 100 mM ZnSO4 according to
the manufacturer’s instructions (Bio-Rad Laboratories,
Hercules, CA, USA) and PBS, pH 7.2.
Arrays were initially assembled into a bioprocessor (Bio-
Rad Laboratories) and pre-equilibrated into the appropriate
wash buffer. Each well was loaded with 50 mL of wash
buffer, centrifuged for 1 min at 1500� g to remove air
bubbles, followed by an incubation step for 5 min on a
shaking table. The buffer was decanted and the equilibration
step was repeated for a total of two washes. The samples
(50 mL) were applied to each well in duplicate and incubated
for 1 h. Samples were discarded, chips were washed with
the appropriate wash buffer three times for 5 min, followed
by two 1 min washes with 1 mM HEPES, pH 7.2. The
chips were removed from the bioprocessor, air dried and
l mL of 50% saturated sinapinic acid in 50% v/v ACN,
0.5% TFA was applied onto each spot twice, arrays were air-
dried between each application. Chips were analyzed by
SELDI-TOF MS using a PBSIIc instrument (Bio-Rad
Laboratories) at the low (0–20 kDa) and high (20–100 kDa)
mass settings. Resulting spectra were examined using
ProteinChips software (Bio-Rad Laboratories) and the
expression difference mapping tool which groups peaks of
the same molecular weight across all samples and statisti-
cally displays the differences in expression between sample
groups.
2.9 Biomarker detection – 2-D
Tissue and serum were prepared for 2-D using the 2-D gel
clean up kit (Amersham Biosciences, Piscataway, NJ, USA)
according to the manufacturer’s instructions. Briefly, 500mg
of total protein was precipitated, the pellet was washed to
remove non-protein contaminants and finally resuspended
in rehydration buffer (8 M urea, 2% CHAPS and 0.002%
bromophenol blue) to a final volume of 100 mL.
In total, 100 mg of protein in rehydration buffer was then
combined with 2.5 mg DTT, 2.7 mL IPG buffer, pH 3–10
(Amersham Biosciences) and rehydration buffer to a
final volume of 125 mL. Samples underwent isoelec-
trofocusing (EttanTM IPGphorII; GE Healthcare Bios-
ciences, Chalfont, UK) with a 7 cm immobiline gel strip, pH
Proteomics Clin. Appl. 2009, 3, 1211–1224 1213
& 2009 WILEY-VCH Verlag GmbH & Co. KGaA, Weinheim www.clinical.proteomics-journal.com

3–10 (GE Healthcare Biosciences) under the following
conditions: rehydrate 50 V 14 h, focus 300 V 1 h, gradient
1000 V 0.5 h, gradient 5000 V 1.5 h, step 5000 V 0.5 h and
hold 50 V 12 h. IPG strips were subsequently washed for
15 min with 5 mL of equilibrating solution (0.5 M Tris-HCl,
235 mM urea, 4% SDS and 34.5% glycerol) containing
12.5 mg DTT, followed by a 15 min wash in equilibrating
buffer containing 0.225 g iodoacetamide. IPG strips were
assembled in the well of a 2-D gel (12% Tris-Tricine, Invi-
trogen, Carlsbad, CA, USA) and sealed with an agarose
solution containing 0.002% bromophenol blue, 100 mM
Tris base, 0.76 M glycine and 0.4% SDS. Protein standards
(10 mL, Bench Mark, Invitrogen) were loaded onto each gel.
Gels were run for 3 h at 40 mA (Hoefer miniVE vertical
electrophoresis system; Isogen Lifesciences, IJsselstein, The
Netherlands) and subsequently stained with 0.025%
Coomassie RT50 brilliant blue in 10% acetic acid overnight
followed by destaining in 10% acetic acid. Biomarker
analysis was conducted on samples run on three separate
gels, using PDQuest Advanced 8.0.1 (Bio-Rad Laboratories),
to ensure accuracy in the estimation of expression levels.
2.10 Protein purification and identification of
SELDI-TOF MS biomarkers
The protein markers identified by SELDI-TOF MS were
purified using RP-HPLC and/or resins matched to the
chemistry of the array surface, which was used to detect the
biomarker (Bio-Rad Laboratories). Resulting elution frac-
tions were screened on ProteinChip arrays to confirm the
fraction, which contained the peak of interest. In some
circumstances, it was necessary to complete several
column runs as the protein of interest was not present in
high concentrations. Elution fractions were subsequently
pooled, concentrated using a vacuum concentrator or
freeze drier and electrophoresed on a 1-D/2-D SDS-PAGE
gel as a final separation step. After excising the band
and eluting the protein from the gel, the purified
sample was analyzed on an NP20 array (Bio-Rad Labora-
tories) to confirm the band was having the correct molecular
mass. Once purified, biomarkers were digested with
trypsin and the masses of the proteolytic fragments
determined by MALDI-TOF MS (Applied Biosystems
Proteomics Analyser 4700) were submitted to the
MASCOT database for identification. Further confirmation
of the protein identification was achieved by performing
collision-induced dissociation using MALDI-TOF/TOF
MS (Applied Biosystems Proteomics Analyser 4700). Briefly,
MS spectra were acquired by reflectron in positive mode,
scanning a mass range of 800–4000 Da. Total shots perspectrum 5 1500 with a fixed laser intensity of 3400. The
spectra were assessed using a processing method with
internal calibrants (trypsin peaks), minimum signal-to-
noise 5 20 and a mass tolerance of m/z 1/�0.5. An inter-
pretation method was subsequently used to obtain MS/MS
information using a max precursor/spot 5 10 (strongest
first) as a precursor selection criteria, and weakest precursor
first as MS/MS selection criteria, also excluding
adducts such as sodium and potassium. The MS/MS
acquisition was in positive reflectron mode, total shot/
spectra 5 2500 and laser intensity of 3700. MS/MS proces-
sing was performed using a min. signal-to-noise 5 10 with a
default calibration. The acquisition, processing of both MS
and MS/MS spectra was done in batchmode using 4700
series explorer V3.0.
Sequencing of biomarkers was also achieved using
Edman degradation methodology as described previously
[10].
2.11 Protein purification and identification of 2-D gel
biomarkers
Protein markers identified by 2-D electrophoresis
were excised using a scalpel blade. Gel plugs were
washed with 40% methanol, 5% acetic acid for 15 min
followed by a 5 min wash in water to remove SDS.
Coomassie stain was removed from gel plugs by washing
with 50% ACN, 50 mM NH4HCO3 for 20 min. In some
circumstances, it was necessary to repeat this step to
ensure the stain was completely removed. Gel plugs were
then washed with 20 mM NH4HCO3 for 60 min and dehy-
drated by incubation in ACN for 10 min, followed by
centrifugation in a speed vacuum. Gel plugs were subse-
quently rehydrated in a trypsin solution (5 mL trypsin
500 ng/mL in 0.1% TFA) and 44 mL of 20 mM NH4HCO3,
1 mM CaCl2. Gel pieces were finally incubated at 371C
overnight and the identity of the peptide fragments was
determined by MALDI-TOF MS and MALDI-TOF/TOF MS
as described in Sections 2.8 and 2.10.
2.12 Immunohistochemistry
To further confirm that the identified biomarkers (by
SELDI-TOF MS and 2-D) could also be detected by a non-
proteomic-based method, immunohistochemistry was
performed to examine changes in fibrinogen expression in
4% formalin-fixed, paraffin-embedded sections from all
control and obstructed animals. Once paraffin-embedded
samples were de-waxed, they were quenched with
hydrogen peroxide, blocked with normal serum and incu-
bated with rabbit anti-fibrinogen (Dako, Glostrup,
Denmark) for 1 h. After washing, sections were incubated
with a species matched biotinylated anti-IgG (Vector,
Burlinghame, CA, USA). Sections were washed again and
incubated with avidin–biotin complex (ABC Elite; Vector).
The chromogenic substrate 3,30-diaminobenzidine (DAB;
Sigma-Aldrich) was used for detection. Finally, sections
were counterstained with haematoxylin and examined
microscopically.
1214 E. Giannakis et al. Proteomics Clin. Appl. 2009, 3, 1211–1224
& 2009 WILEY-VCH Verlag GmbH & Co. KGaA, Weinheim www.clinical.proteomics-journal.com
2.13 Statistical analysis
The SELDI-TOF MS data (using the Expression Difference
Mapping tool in ProteinChip software) and 2-D gel
analysis (using both PD Quest Advanced, version 8.0.1 and
Excel software) were analyzed by the Mann–Whitney
(non-parametric) test. Results are expressed as the
mean7SEM with statistical significance accepted at the
level of po0.05.
3 Results
3.1 SELDI-TOF MS analysis of kidney tissue
Kidney tissue extracts from control and obstructed
animals were screened on several arrays including H50,
Q10 and IMAC30 arrays pre-coated with 100 mM ZnSO4.
A total of 212 peaks with a signal-to-noise value of 3
present in at least 20% of spectra were detected over the
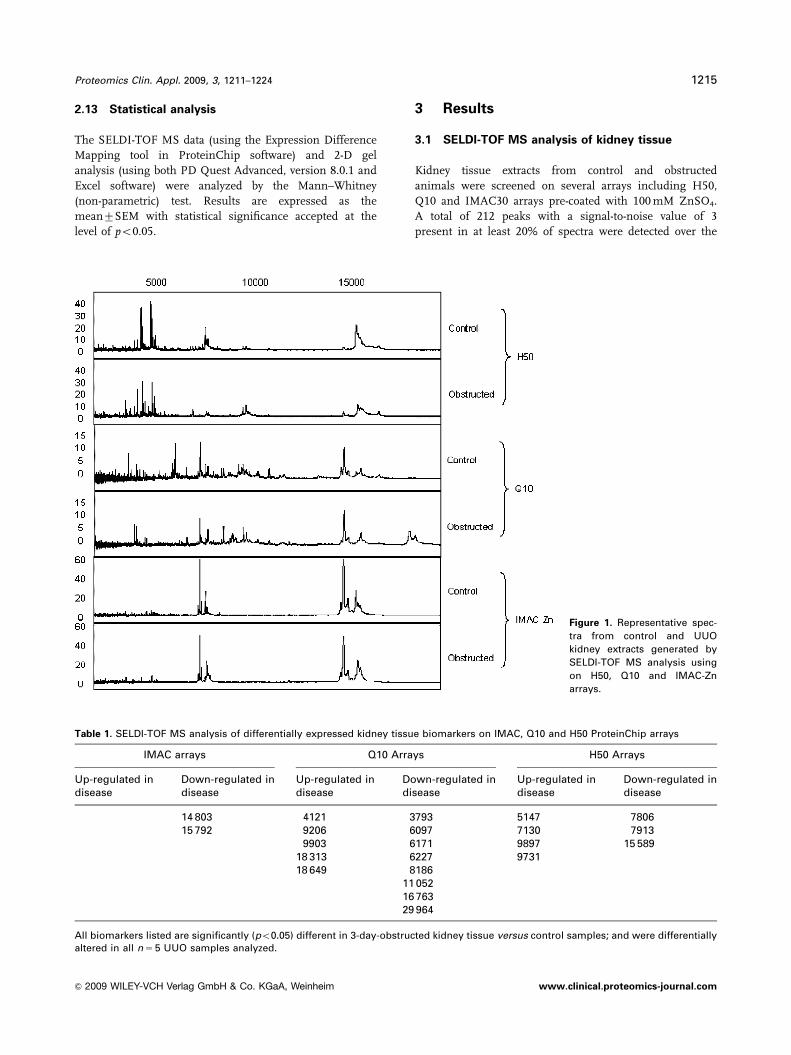
Figure 1. Representative spec-
tra from control and UUO
kidney extracts generated by
SELDI-TOF MS analysis using
on H50, Q10 and IMAC-Zn
arrays.
Table 1. SELDI-TOF MS analysis of differentially expressed kidney tissue biomarkers on IMAC, Q10 and H50 ProteinChip arrays
IMAC arrays Q10 Arrays H50 Arrays
Up-regulated indisease
Down-regulated indisease
Up-regulated indisease
Down-regulated indisease
Up-regulated indisease
Down-regulated indisease
14 803 4121 3793 5147 780615 792 9206 6097 7130 7913
9903 6171 9897 15 58918 313 6227 973118 649 8186
11 05216 76329 964
All biomarkers listed are significantly (po0.05) different in 3-day-obstructed kidney tissue versus control samples; and were differentiallyaltered in all n 5 5 UUO samples analyzed.
Proteomics Clin. Appl. 2009, 3, 1211–1224 1215
& 2009 WILEY-VCH Verlag GmbH & Co. KGaA, Weinheim www.clinical.proteomics-journal.com
three surfaces examined at both low- and high-molecular-
weight settings (H50: 58 peaks, Q10: 69 peaks, IMAC: 85
peaks).
The observed protein profiles were unique for each
surface examined (Fig. 1), demonstrating how specific
chromatographic chemistries can be utilized to enrich for
subsets of the proteome. The surface which revealed the
greatest peak count was the IMAC ZnSO4 arrays. However,
comparison of the protein profiles between control versusday-3-obstructed animals revealed that the Q10 arrays in fact
yielded the highest number of differentially expressed
proteins as determined by univariate t-test analysis with
p-valueso0.05. Q10 revealed 13 differentially expressed
proteins, eight of which were down-regulated, whereas the
IMAC analysis revealed two differentially expressed proteins
both of which were down-regulated and H50 arrays revealed
seven differentially expressed proteins, three of which were
down-regulated (Table 1).
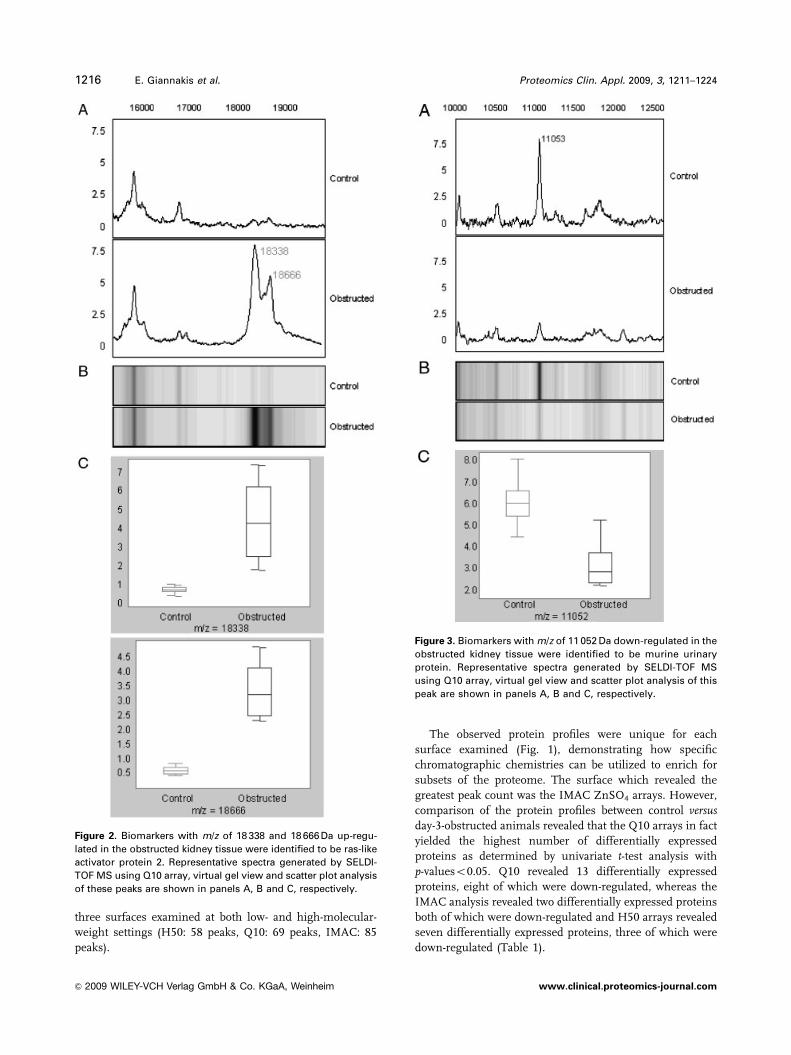
Figure 2. Biomarkers with m/z of 18 338 and 18 666 Da up-regu-
lated in the obstructed kidney tissue were identified to be ras-like
activator protein 2. Representative spectra generated by SELDI-
TOF MS using Q10 array, virtual gel view and scatter plot analysis
of these peaks are shown in panels A, B and C, respectively.
Figure 3. Biomarkers with m/z of 11 052 Da down-regulated in the
obstructed kidney tissue were identified to be murine urinary
protein. Representative spectra generated by SELDI-TOF MS
using Q10 array, virtual gel view and scatter plot analysis of this
peak are shown in panels A, B and C, respectively.
1216 E. Giannakis et al. Proteomics Clin. Appl. 2009, 3, 1211–1224
& 2009 WILEY-VCH Verlag GmbH & Co. KGaA, Weinheim www.clinical.proteomics-journal.com
One of the most significant changes detected at the tissue
level of the UUO model was that of a cluster of peaks with
m/z value of 18 338 (mean7SD; control: 0.5670.23 versusUUO: 4.2772.6) and 18 666 Da (mean7SD; control:
0.5170.16 versus UUO: 3.2971.19); which both showed
significant increases in average peak intensity in the
obstructed animals (both po0.02; Fig. 2). These peaks were
identified by MALDI-TOF/TOF MS analysis to represent
Ras-like activator protein 2, which is a small G protein
involved in signaling and cell communication.
A biomarker with m/z value of 11 052 Da (Fig. 3) was also
purified and subjected to MALDI-TOF/TOF MS and was
identified to be murine urinary protein, and which was
significantly (po0.05) down-regulated in obstructed animals.
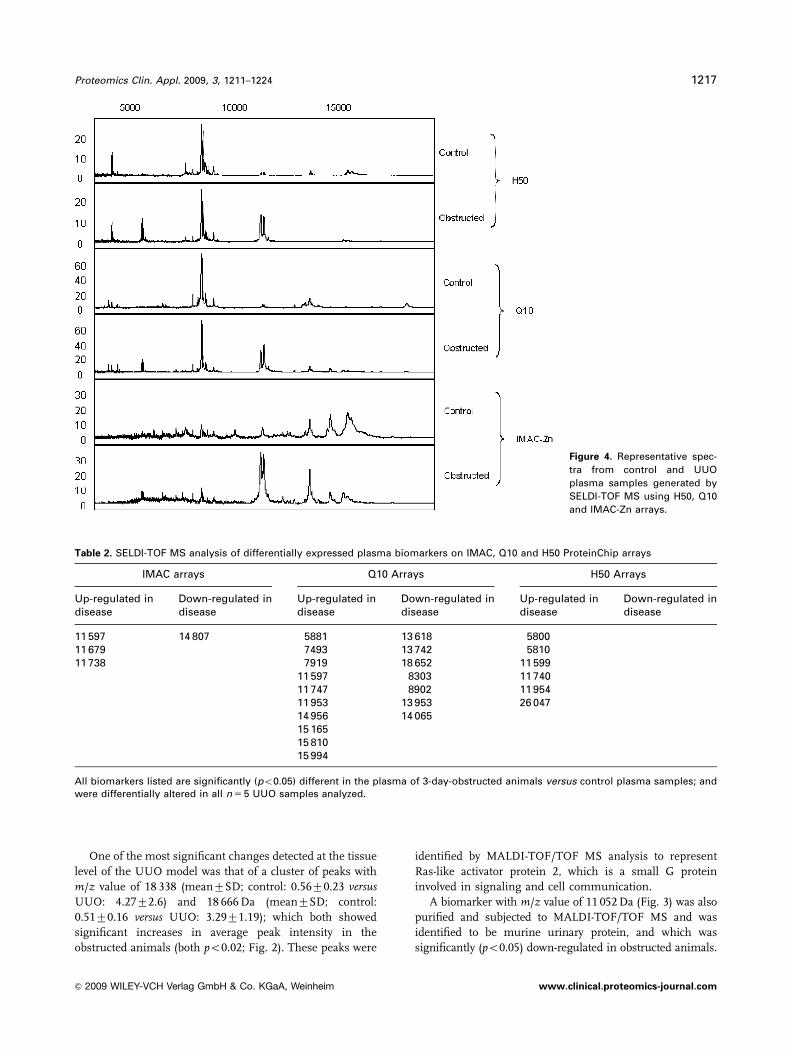
Figure 4. Representative spec-
tra from control and UUO
plasma samples generated by
SELDI-TOF MS using H50, Q10
and IMAC-Zn arrays.
Table 2. SELDI-TOF MS analysis of differentially expressed plasma biomarkers on IMAC, Q10 and H50 ProteinChip arrays
IMAC arrays Q10 Arrays H50 Arrays
Up-regulated indisease
Down-regulated indisease
Up-regulated indisease
Down-regulated indisease
Up-regulated indisease
Down-regulated indisease
11 597 14 807 5881 13 618 580011 679 7493 13 742 581011 738 7919 18 652 11 599
11 597 8303 11 74011 747 8902 11 95411 953 13 953 26 04714 956 14 06515 16515 81015 994
All biomarkers listed are significantly (po0.05) different in the plasma of 3-day-obstructed animals versus control plasma samples; andwere differentially altered in all n 5 5 UUO samples analyzed.
Proteomics Clin. Appl. 2009, 3, 1211–1224 1217
& 2009 WILEY-VCH Verlag GmbH & Co. KGaA, Weinheim www.clinical.proteomics-journal.com

3.2 SELDI-TOF MS analysis of plasma
Plasma samples collected from obstructed and control
animals were denatured in 8 M urea/1% CHAPS buffer and
screened on H50, Q10 and IMAC30 arrays pre-coated with
100 mM ZnSO4. In total, 210 peaks with a signal-to-noise
value of 3 present in at least 20% of spectra were detected
over the various surfaces examined at both low- and high-
molecular-weight settings (H50: 68 peaks; Q10: 80 peaks,
IMAC: 62 peaks).
The observed plasma profiles on each surface were
generally unique, however, considerable similarity was
observed between the H50 and Q10 profiles in the low-
molecular-weight range with a representative spectra being
shown in Fig. 4. The surface which revealed the greatest
peak count and the highest number of differentially
expressed proteins (n 5 17) was the Q10 arrays, the majority
of which (n 5 10) were up-regulated. The IMAC arrays
revealed four differentially expressed proteins, three of
which were up-regulated. H50 arrays revealed six differen-
tially regulated proteins, all of which were up-regulated
(Table 2).
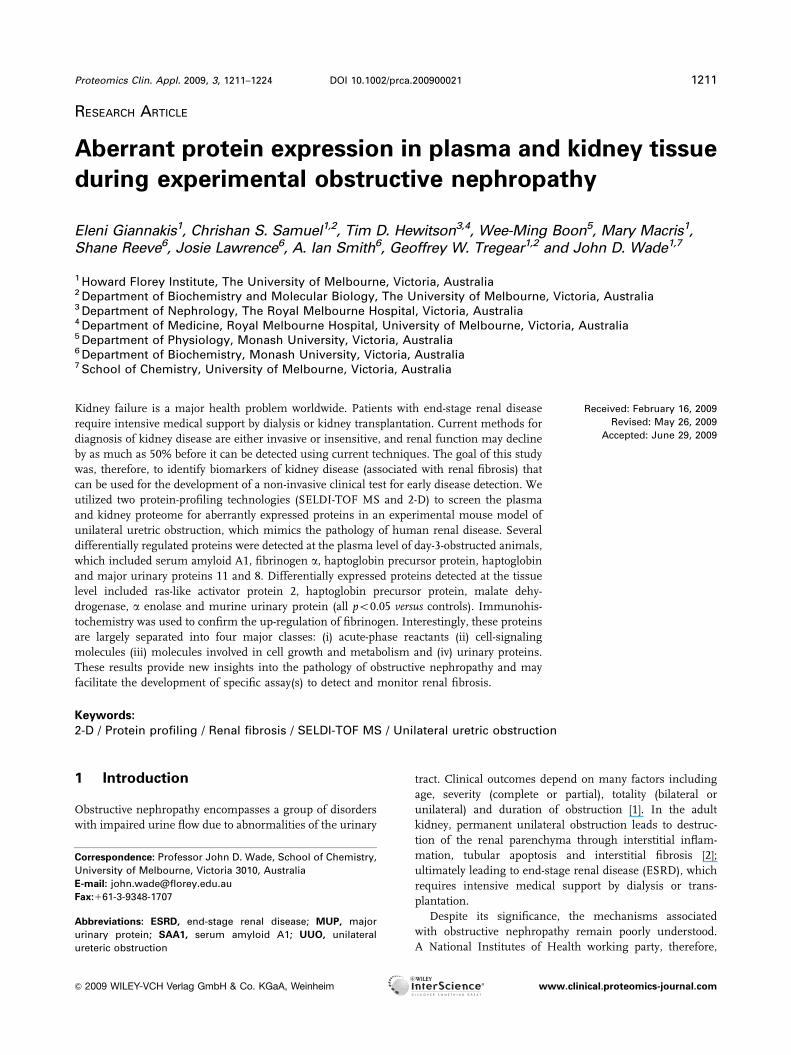
Figure 5. Plasma biomarkers with m/z of 11 592 and 11 737 Da up-
regulated in UUO animals were identified to be SAA1. Repre-
sentative spectra generated by SELDI-TOF MS using Q10 array,
virtual gel view and scatter plot analysis of these peaks are
shown in panels A, B and C, respectively.
Figure 6. Plasma biomarker with m/z of 13 742 Da was identified
to be down-regulated in the disease group, the identity of this
protein is unknown. Representative spectra generated by SELDI-
TOF MS Q10 arrays, virtual gel view and scatter plot analysis of
this peak are shown in panels A, B and C, respectively.
1218 E. Giannakis et al. Proteomics Clin. Appl. 2009, 3, 1211–1224
& 2009 WILEY-VCH Verlag GmbH & Co. KGaA, Weinheim www.clinical.proteomics-journal.com

One of the most significant changes detected in the
plasma, was the up-regulation of a cluster of peaks with m/zvalues of 11 592 and 11 737 Da which showed an approx-
imate four and sixfold increase in average peak intensity in
the disease group, respectively (both po0.02; Fig. 5). These
peaks were detected on all surfaces examined and on each
occasion showed significant increase in expression. During
the purification process, these peaks were difficult to sepa-
rate by chromatography methods suggesting that they may
potentially be related. Standard sequencing metholodologies
of tryptic digestion and MALDI-TOF/TOF MS analysis
revealed that this protein was serum amyloid A1 (SAA1).
A separate biomarker with m/z of 13 742 Da (Fig. 6) was
also purified and subjected to MALDI-TOF/TOF MS;
however, no significant hits were detected suggesting that
this protein may be novel. Several other peaks which were
differentially regulated remain to be identified.
3.3 2-D
Kidney extracts and plasma collected from control and
disease animals were separated by 2-D (pH 3–10, 12% Tris-
tricine). Up to 137 kidney proteins and 106 plasma proteins
(representing only the soluble proteins; as other fractions
caused substantial smearing on 2-D gels) were detected after
Coomassie blue staining. 2-D gel analysis software was
consequently used to match the corresponding spots among
gels and compare the spot intensity in pixel units. Of the
137 kidney proteins detected, 21 were identified to be
differentially regulated. The majority of these proteins were
identified to be down-regulated, which is consistent with the
SELDI analysis. Of the 106 plasma proteins, six were iden-
tified to be differentially expressed, all of which were up-
regulated. This also showed consistency with the SELDI
studies in which the majority of the plasma proteins were
identified to be up-regulated. Figures 7 and 8 show repre-
sentative 2-D kidney and plasma gels, respectively, from
control and disease animals with differentially regulated
spots labeled; whereas Tables 3 and 4 show the pixel unit
values and p-value calculations of these biomarkers,
respectively. Altered proteins were subsequently excised and
subjected to MALDI-TOF/TOF MS. Several differentially
regulated spots were, however, not subjected to further
assessment by MS analysis as the spot intensity was
considered to be too low for sequence analysis. Sequence
data were obtained from three of the differentially regulated
kidney proteins, which included haptoglobin precursor
protein, a enolase and malate dehydrogenase. The hapto-
globin precursor protein was significantly increased
(p 5 0.01 versus levels in control tissue), whereas a enolase
and malate dehydrogenase were markedly decreased (both
po0.05 versus levels in control tissue) in extracts obtained
from day-3-obstructed kidneys (Table 3). Many of the tissue
proteins subjected to MALDI-TOF/TOF MS were, however,
unidentified. These proteins could be post-translationally
modified, thus difficult to identify by classical proteomic
technologies. Additionally, of the several plasma proteins
that were subjected to sequencing, the identity of four was
confirmed to be haptoglobin, haptoglobin precursor, fibri-
nogen a and major urinary protein (MUP) (Table 4).
Interestingly, haptoglobin precursor protein was identified
to be up-regulated in both tissue extracts (Table 3) and
plasma (Table 4) obtained from day-3-obstructed animals.
3.4 Immunohistochemical confirmation of
biomarker detection
Although there is limited availability of suitable antibodies to
the identified biomarkers (characterized by SELDI-TOF MS
Figure 7. 2-D gel analysis of kidney extracts from UUO and
control groups. Statistically significant differentially regulated
spots are highlighted and numbered which correspond to data
summarized in Table 3.
Proteomics Clin. Appl. 2009, 3, 1211–1224 1219
& 2009 WILEY-VCH Verlag GmbH & Co. KGaA, Weinheim www.clinical.proteomics-journal.com

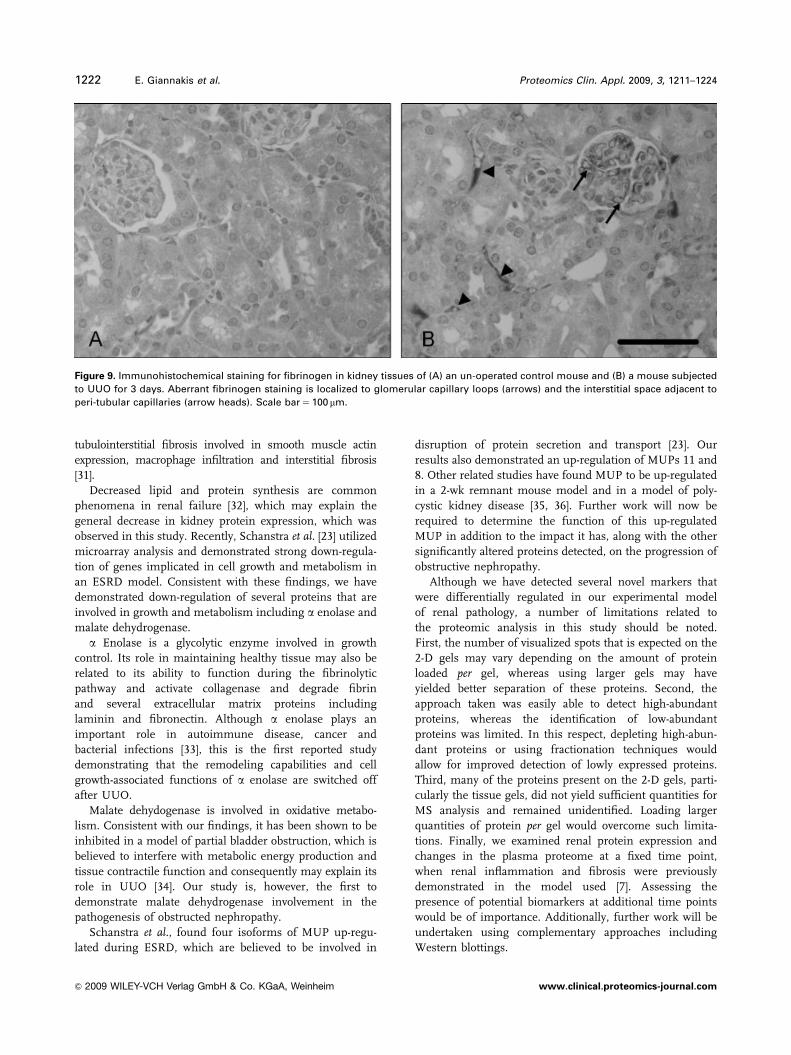
and 2-D gel analysis) in the mouse a polyclonal antibody to
fibrinogen was used to confirm (by immunohistochemical
means) that fibrinogen expression was up-regulated in all
kidney tissues of mice subjected to UUO (Fig. 9). The
increased staining was particularly evident in glomerular
capillary loops and the interstitial space adjacent to peri-
tubular capillaries (Fig. 9); and confirmed the increase in
fibrinogen detected by the proteomic-based methods.
4 Discussion
The prognostic significance of the proteome in renal
diseases is frequently speculated upon. Studies of the urine
proteome in the obstructed kidney of newborns identified a
number of biomarkers that were able to discriminate clinical
prognosis [11]. The pathogenesis after UUO in the adult is,
however, quite different from the neonate, and equates
better with the generic responses found in tubulointerstitial
fibrosis. This has been highlighted by the recent proteomic
identification of a hitherto unrecognized tissue mediator of
fibroblast recruitment in a rat model of UUO [12]. Our work
therefore extends these studies by examining the adult
kidney, and by specifically examining both plasma and
tissue in an attempt to better understand the relationship
with known pathological changes.
Using a well-described model of experimental obstructive
nephropathy [5–7], we describe the proteomic assessment of
changes that occur at both the tissue and the plasma
level during progression. We combined the proteomic
Table 3. Differentially regulated proteins from 2-D gel analysis of kidney tissue
Control DiseaseSpot IDno.
Protein ID Accessionnumber
Average SEM Average SEM
p-Value Up/down indisease
t1 Unidentified NA 10 425.7 2024.4343 No signal NA 0.001 Downt2 Unidentified NA 5561.1 1226.6559 No signal NA 0.003 Downt3 Unidentified NA 9055.3333 579.91917 No signal NA 0.00002 Downt4 Unidentified NA 6082 2383.8405 No signal NA 0.02 Downt5 Unidentified NA 11 846.1 3235.8772 No signal NA 0.006 Downt6 Unidentified NA 7907.8333 699.47674 No signal NA 0.00009 Downt7 Unidentified NA 5853.9 876.21646 No signal NA 0.0006 Downt8 Unidentified NA 7785 450 No signal NA 0.0003 Downt9 a Enolase ENOA_MOUSE 8247.3 854.21145 No signal NA 0.0001 Downt10 Unidentified NA 9288.9667 1221.8753 No signal NA 0.0004 Downt11 Unidentified NA 6912.3667 1527.0629 No signal NA 0.003 Downt12 Unidentified NA 4911.0667 2032.9963 No signal NA 0.02 Downt13 Unidentified NA 8696.7 1609.6994 No signal NA 0.001 Downt14 Unidentified NA 16 143 6981.1709 No signal NA 0.03 Downt15 Malate dehydrogenase MDHC_MOUSE 8642.5667 4638.8855 No signal NA 0.05 Downt16 Unidentified NA 17 113 3989 No signal NA 0.003 Downt17 Unidentified NA 12 000 180 No signal NA 0.0000001 Downt18 Haptoglobin precursor HPT_MOUSE No signal NA 229 809.9 73 821.61 0.01 Up
The pixel unit values of each protein and p-value calculations of these biomarkers (comparing levels detected in 3-day obstructed versuscontrol samples) are summarized, as are the results from the MS identification studies. All detailed differentially regulated proteins weredetected in all n 5 5 UUO samples analyzed.
Table 4. Differentially regulated proteins from 2-D gel analysis of plasma
Control DiseaseSpot IDno.
Protein ID Accessionnumber
Average SEM Average SEM
p-Value Disease
p1 Fibrinogen a gi/33563252 3008 2223 33 508 11 576 0.02 Upp2 Haptoglobin gi/8850219 2988 2055 12 065 1255 0.005 Upp3 Unidentified NA 4381 4677 40 083 10 229 0.009 Upp4 MUPs 11 and 8 MUP8_MOUSE No signal NA 5581 2460 0.03 Upp5 Haptoglobin Precursor HPT_MUSCR No signal NA 7925 3483 0.03 Up
The pixel unit values of each protein and p-value calculations of these biomarkers (comparing levels detected in 3-day obstructed vscontrol samples) are summarized, as are the results from the MS identification studies. All detailed differentially regulated proteins weredetected in all n 5 5 UUO samples analyzed.
1220 E. Giannakis et al. Proteomics Clin. Appl. 2009, 3, 1211–1224
& 2009 WILEY-VCH Verlag GmbH & Co. KGaA, Weinheim www.clinical.proteomics-journal.com

approaches of SELDI-TOF MS, MALDI-TOF/TOF MS and
2-D electrophoresis to search for and identify biomarkers in
animals 3-days after UUO when renal inflammation and
fibrogenesis are established [7]; and confirmed the differ-
ential regulation of one of these biomarkers by immuno-
histochemistry. Although the number of analyzed samples
is not large (five UUO versus four controls), the findings are
acceptable for this exploratory stage. We detected several
differentially regulated proteins at the plasma level of
obstructed animals which included SAA1, fibrinogen a,
haptoglobin precursor protein, haptoglobin and MUPs 11
and 8, whereas aberrantly expressed proteins detected at the
tissue level included ras-like activator protein 2, haptoglobin
precursor, malate dehydrogenase, a enolase and murine
urinary protein. Interestingly, these proteins are largely
separated into four major classes: (i) acute-phase reactants
(ii) cell-signaling molecules (iii) molecules involved in cell
growth and metabolism and (iv) urinary proteins.
SAA, haptoglobin and fibrinogen are all plasma proteins
that play a key role in the acute-phase response following
inflammation. The role of SAA in disease progression
after UUO may be related to its ability to induce matrix
metalloproteinases-1 (collagenase-I) and -3 (stromelysin-I)
[13, 14], which are responsible for the degradation of several
interstitial extracellular matrix proteins including collagens
I, II and III. Although this is the first reported study
demonstrating SAA as a marker for UUO, SAA has been
identified to be up-regulated in a number of related renal
pathologies where fibrosis is a final common pathway.
Examples include renal allograft rejection [15], renal abla-
tion [16] and glomerular basement membrane nephritis [17].
Interestingly, SAA has also been identified as a marker for
several other conditions including ovarian cancer [18],
coronary artery disease [19], chronic obstructive pulmonary
disease [20] and rheumatoid arthritis [21], suggesting that it
may be relatively non-specific as a univariate marker but
may provide the sensitivity and specificity required for
diagnosis when combined in a multimarker panel.
Haptoglobin plays a key role in the acute-phase response
by binding to and clearing toxic-free hemoglobin released
during hemolysis. It is a known marker for liver fibrosis,
believed to play a protective effect in response to organ
injury [22] and is part of the commercially available
FibroTest (Bioproductive, Houilles, France). Recently,
microarray analysis of kidney tissue from an ESRD model
revealed up-regulation of haptoglobin gene expression [23],
suggesting its potential importance in yielding a protective
response during renal disease, a result which we have
confirmed and extended by proteomic assessment in this
study.
Fibrinogen is involved in the coagulation cascade and is
converted to fibrin via thrombin activity to form a clot [24].
Elevated fibrinogen levels have been significantly associated
with cardiac/renal damage in hypertension [25] and severe
liver disease [26] potentially related to the thrombotic action of
the protein. Fibrin deposition has long been known to be an
important part of the pathogenesis of glomerulonephritis
[27]. Although less commonly associated with primary tubu-
lointerstitial disease [28], activation of the coagulation cascade
and deposition of fibrin have specifically been observed in
this model. Importantly, fibrinogen immunostaining was
also found to be up-regulated in kidney tissues.
Ras-like activator protein 2 is a GTPase involved in cell
signaling and communication. Although this is the first
reported study demonstrating up-regulation of ras-like acti-
vator protein 2 in UUO, ras-related molecules have been
shown to be involved in fibrotic disease, consistent with the
findings of this study. Activation of RhoGTPase is a key step
in epithelial mesenchymal transdifferentiation to form
myofibroblasts [29], Rap1b plays a critical role in various
signaling events of diabetic nephropathy [30], whereas
Rho-ROCK plays an important role in the development of
Figure 8. 2-D gel analysis of plasma from UUO and control
groups. Statistically significant differentially regulated spots are
highlighted and numbered which correspond to data summar-
ized in Table 4.
Proteomics Clin. Appl. 2009, 3, 1211–1224 1221
& 2009 WILEY-VCH Verlag GmbH & Co. KGaA, Weinheim www.clinical.proteomics-journal.com
tubulointerstitial fibrosis involved in smooth muscle actin
expression, macrophage infiltration and interstitial fibrosis
[31].
Decreased lipid and protein synthesis are common
phenomena in renal failure [32], which may explain the
general decrease in kidney protein expression, which was
observed in this study. Recently, Schanstra et al. [23] utilized
microarray analysis and demonstrated strong down-regula-
tion of genes implicated in cell growth and metabolism in
an ESRD model. Consistent with these findings, we have
demonstrated down-regulation of several proteins that are
involved in growth and metabolism including a enolase and
malate dehydrogenase.
a Enolase is a glycolytic enzyme involved in growth
control. Its role in maintaining healthy tissue may also be
related to its ability to function during the fibrinolytic
pathway and activate collagenase and degrade fibrin
and several extracellular matrix proteins including
laminin and fibronectin. Although a enolase plays an
important role in autoimmune disease, cancer and
bacterial infections [33], this is the first reported study
demonstrating that the remodeling capabilities and cell
growth-associated functions of a enolase are switched off
after UUO.
Malate dehydogenase is involved in oxidative metabo-
lism. Consistent with our findings, it has been shown to be
inhibited in a model of partial bladder obstruction, which is
believed to interfere with metabolic energy production and
tissue contractile function and consequently may explain its
role in UUO [34]. Our study is, however, the first to
demonstrate malate dehydrogenase involvement in the
pathogenesis of obstructed nephropathy.
Schanstra et al., found four isoforms of MUP up-regu-
lated during ESRD, which are believed to be involved in
disruption of protein secretion and transport [23]. Our
results also demonstrated an up-regulation of MUPs 11 and
8. Other related studies have found MUP to be up-regulated
in a 2-wk remnant mouse model and in a model of poly-
cystic kidney disease [35, 36]. Further work will now be
required to determine the function of this up-regulated
MUP in addition to the impact it has, along with the other
significantly altered proteins detected, on the progression of
obstructive nephropathy.
Although we have detected several novel markers that
were differentially regulated in our experimental model
of renal pathology, a number of limitations related to
the proteomic analysis in this study should be noted.
First, the number of visualized spots that is expected on the
2-D gels may vary depending on the amount of protein
loaded per gel, whereas using larger gels may have
yielded better separation of these proteins. Second, the
approach taken was easily able to detect high-abundant
proteins, whereas the identification of low-abundant
proteins was limited. In this respect, depleting high-abun-
dant proteins or using fractionation techniques would
allow for improved detection of lowly expressed proteins.
Third, many of the proteins present on the 2-D gels, parti-
cularly the tissue gels, did not yield sufficient quantities for
MS analysis and remained unidentified. Loading larger
quantities of protein per gel would overcome such limita-
tions. Finally, we examined renal protein expression and
changes in the plasma proteome at a fixed time point,
when renal inflammation and fibrosis were previously
demonstrated in the model used [7]. Assessing the
presence of potential biomarkers at additional time points
would be of importance. Additionally, further work will be
undertaken using complementary approaches including
Western blottings.
Figure 9. Immunohistochemical staining for fibrinogen in kidney tissues of (A) an un-operated control mouse and (B) a mouse subjected
to UUO for 3 days. Aberrant fibrinogen staining is localized to glomerular capillary loops (arrows) and the interstitial space adjacent to
peri-tubular capillaries (arrow heads). Scale bar 5 100 mm.
& 2009 WILEY-VCH Verlag GmbH & Co. KGaA, Weinheim www.clinical.proteomics-journal.com
1222 E. Giannakis et al. Proteomics Clin. Appl. 2009, 3, 1211–1224
5 Concluding remarks
In conclusion, we have reported a proteomic assessment of
the UUO model at the tissue and plasma levels. We have
identified several differentially expressed proteins, which
play diverse roles in regulating renal structure and function.
Although a number of these markers have altered expres-
sion in other disease states, when combined in a multi-
marker panel these biomarkers may facilitate the
development of a highly discriminatory assay for both
obstructive nephropathy and the progression of renal
disease in general. Such an approach offers vastly improved
sensitivity and specificity over a single marker detection
system and is likely to be used for future diagnostics/prog-
nostics. Finally, the biomarkers identified in this study may
provide directions for the development of potential ther-
apeutic targets against diseases associated with fibrosis.
This work was supported by an Ian Potter Grant to G.W.T.and J.D.W., a National Health & Medical Research Council(NHMRC) of Australia R. D. Wright/National Heart Foun-dation of Australia (NHFA) Career Development Fellowship toC.S.S. and NHMRC Fellowships to A.I.S., G.W.T. and J.D.W.
The authors have declared no conflict of interest.
6 References
[1] Provoost, A. P., Molenaar, J. C., Renal function during and
after a temporary complete unilateral ureter obstruction in
rats. Invest. Urol. 1981, 18, 242–246.
[2] Chevalier, R. L., Obstructive nephropathy: towards biomar-
ker discovery and gene therapy. Nat. Clin. Pract. Nephrol.
2006, 2, 157–168.
[3] Chevalier, R. L., Peters, C. A., Congenital urinary tract
obstruction: Proceedings of The State-of-The-Art Strategic
Planning Workshop. National Institutes of Health, Bethesda,
MD, USA, 11–12, March 2002. Pediatr. Nephrol. 2003, 18,
576–606.
[4] Lemley, K. V., An introduction to biomarkers: applications
to chronic kidney disease. Pediatr. Nephrol. 2007, 22,
1849–1859.
[5] Klahr, S., Morrissey, J., Obstructive nephropathy and renal
fibrosis. Am. J. Physiol. Renal. Physiol. 2002, 283,
F861–F875.
[6] Diamond, J. R., Ricardo, S. D., Klahr, S., Mechanisms of
interstitial fibrosis in obstructive nephropathy. Semin.
Nephrol. 1998, 18, 594–602.
[7] Hewitson, T. D., Mookerjee, I., Masterson, R., Zhao, C. et al.,
Endogenous relaxin is a naturally occurring modulator of
experimental renal tubulointerstitial fibrosis. Endocrinology
2007, 148, 660–669.
[8] Becker, G. J., Hewitson, T. D., The role of tubulointerstitial
injury in chronic renal failure. Curr. Opin. Nephrol. Hyper-
tens. 2000, 9, 133–138.
[9] Giannakis, E., Samuel, C. S., Boon, W. M., Macris, M. et al.,
SELDI-TOF mass spectrometry-based protein profiling of
kidney tissue. Methods Mol. Biol. 2009, 466, 237–249.
[10] Buzza, M. S., Zamurs, L., Sun, J., Bird, C. H. et al., Extra-
cellular matrix remodeling by human granzyme B via clea-
vage of vitronectin, fibronectin, and laminin. J. Biol. Chem.
2005, 280, 23549–23558.
[11] Decramer, S., Wittke, S., Mischak, H., Zurbig, P. et al.,
Predicting the clinical outcome of congenital unilateral
ureteropelvic junction obstruction in newborn by urinary
proteome analysis. Nat. Med. 2006, 12, 398–400.
[12] Kypreou, K. P., Kavvadas, P., Karamessinis, P., Peroulis, M.
et al., Altered expression of calreticulin during the devel-
opment of fibrosis. Proteomics 2008, 8, 2407–2419.
[13] O’Hara, R., Murphy, E. P., Whitehead, A. S., FitzGerald, O.
et al., Local expression of the serum amyloid A and formyl
peptide receptor-like 1 genes in synovial tissue is asso-
ciated with matrix metalloproteinase production in patients
with inflammatory arthritis. Arthritis Rheum. 2004, 50,
1788–1799.
[14] Mullan, R. H., Bresnihan, B., Golden-Mason, L., Markham, T.
et al., Acute-phase serum amyloid A stimulation of angio-
genesis, leukocyte recruitment, and matrix degradation in
rheumatoid arthritis through an NF-kappaB-dependent
signal transduction pathway. Arthritis Rheum. 2006, 54,
105–114.
[15] Hartmann, A., Eide, T. C., Fauchald, P., Bentdal, O. et al.,
Serum amyloid A protein is a clinically useful indicator of
acute renal allograft rejection. Nephrol. Dial. Transplant.
1997, 12, 161–166.
[16] Denk, G. U., Cai, S. Y., Chen, W. S., Lin, A. et al., A
comparison of gene expression in mouse liver and kidney
in obstructive cholestasis utilizing high-density oligonu-
cleotide microarray technology. World J. Gastroenterol.
2006, 12, 2536–2548.
[17] Kim, J. H., Ha, I. S., Hwang, C. I., Lee, Y. J. et al., Gene
expression profiling of anti-GBM glomerulonephritis
model: the role of NF-kappaB in immune complex kidney
disease. Kidney Int. 2004, 66, 1826–1837.
[18] Moshkovskii, S. A., Serebryakova, M. V., Kuteykin-Teplya-
kov, K. B., Tikhonova, O. V. et al., Ovarian cancer marker of
11.7 kDa detected by proteomics is a serum amyloid A1.
Proteomics 2005, 5, 3790–3797.
[19] Johnson, B. D., Kip, K. E., Marroquin, O. C., Ridker, P. M.
et al., Serum amyloid A as a predictor of coronary artery
disease and cardiovascular outcome in women: the
National Heart, Lung, and Blood Institute-Sponsored
Women’s Ischemia Syndrome Evaluation (WISE). Circula-
tion 2004, 109, 726–732.
[20] Bozinovski, S., Hutchinson, A., Thompson, M., Macgregor, L.
et al., Serum amyloid A is a biomarker of acute exacerba-
tions of COPD. Am. J. Respir. Crit. Care Med. 2007, 177,
269–278.
[21] O’Hara, R., Murphy, E. P., Whitehead, A. S., FitzGerald, O.
et al., Acute-phase serum amyloid A production by rheu-
matoid arthritis synovial tissue. Arthritis Res. 2000, 2,
142–144.
Proteomics Clin. Appl. 2009, 3, 1211–1224 1223
& 2009 WILEY-VCH Verlag GmbH & Co. KGaA, Weinheim www.clinical.proteomics-journal.com
[22] Tolosano, E., Fagoonee, S., Hirsch, E., Berger, F. G. et al.,
Enhanced splenomegaly and severe liver inflammation in
haptoglobin/hemopexin double-null mice after acute
hemolysis. Blood 2002, 100, 4201–4208.
[23] Schanstra, J. P., Bachvarova, M., Neau, E., Bascands, J. L.
et al., Gene expression profiling in the remnant kidney
model of wild type and kinin B1 and B2 receptor knockout
mice. Kidney Int. 2007, 72, 442–454.
[24] Hewitson, T. D., Martic, M., Kelynack, K. J., Pagel, C. N.
et al., Thrombin is a pro-fibrotic factor for rat renal fibro-
blasts in vitro. Nephron Exp. Nephrol. 2005, 101, e42–e49.
[25] Sechi, L. A., Zingaro, L., Catena, C., De Marchi, S., Increased
fibrinogen levels and hemostatic abnormalities in patients
with arteriolar nephrosclerosis: association with cardio-
vascular events. Thromb. Haemost. 2000, 84, 565–570.
[26] Arif, S., Khan, A. S., Khan, A. R., Changes in fibrinogen level in
liver cirrhosis. J. Ayub. Med. Coll. Abbottabad. 2002, 14, 19–21.
[27] Clarkson, A. R., Seymour, A. E., Jackson, B., Coagulation
and renal disease. Med. J. Aust. 1976, 1, 573–578.
[28] Wendt, T., Zhang, Y. M., Bierhaus, A., Kriegsmann, J . et al.,
Tissue factor expression in an animal model of hydrone-
phrosis. Nephrol. Dial. Transplant. 1995, 10, 1820–1828.
[29] Patel, S., Takagi, K. I., Suzuki, J., Imaizumi, A. et al.,
RhoGTPase activation is a key step in renal epithelial
mesenchymal transdifferentiation. J. Am. Soc. Nephrol.
2005, 16, 1977–1984.
[30] Lin, S., Chugh, S., Pan, X., Wallner, et al., Identification of
up-regulated Ras-like GTPase, Rap1b, by suppression
subtractive hybridization. Kidney Int. 2001, 60, 2129–2141.
[31] Nagatoya, K., Moriyama, T., Kawada, N., Takeji, M. et al., Y-
27632 prevents tubulointerstitial fibrosis in mouse kidneys
with unilateral ureteral obstruction. Kidney Int. 2002, 61,
1684–1695.
[32] Kalantar-Zadeh, K., Mehrotra, R., Fouque, D., Kopple, J. D.,
Metabolic acidosis and malnutrition-inflammation complex
syndrome in chronic renal failure. Semin. Dial. 2004, 17,
455–465.
[33] Liu, K.-J., Shih, N.-Y., The role of enolase in tissue invasion
and metastasis of pathogens and tumour cells. J. Canc.
Mol. 2007, 3, 45–48.
[34] Haugaard, N., Potter, L., Wein, A. J., Levin, R. M., Effect of
partial obstruction of the rabbit urinary bladder on malate
dehydrogenase and citrate synthase activity. J. Urol. 1992,
147, 1391–1393.
[35] Zhang, H., Wada, J., Kanwar, Y. S., Tsuchiyama, Y. et al.,
Screening for genes up-regulated in 5/6 nephrectomized
mouse kidney. Kidney Int. 1999, 56, 549–558.
[36] Valkova, N., Yunis, R., Mak, S. K., Kang, K. et al., Nek8
mutation causes overexpression of galectin-1, sorcin,
and vimentin and accumulation of the major urinary
protein in renal cysts of jck mice. Mol. Cell. Proteomics
2005, 4, 1009–1018.
1224 E. Giannakis et al. Proteomics Clin. Appl. 2009, 3, 1211–1224
& 2009 WILEY-VCH Verlag GmbH & Co. KGaA, Weinheim www.clinical.proteomics-journal.com