Streptozotocin-induced diabetic nephropathy in rats 2005
11
Streptozotocin-induced diabetic nephropathy in rats: The role of inflammatory cytokines E.P.K. Mensah-Brown a , E.N. Obineche b , S. Galadari c , E. Chandranath d , A. Shahin e , I. Ahmed a , S.M. Patel c , A. Adem d,f, * a Department of Anatomy, Faculty of Medicine and Health Sciences, UAE University, United Arab Emirates b Department of Internal Medicine, Faculty of Medicine and Health Sciences, UAE University, United Arab Emirates c Department of Biochemistry, Faculty of Medicine and Health Sciences, UAE University, United Arab Emirates d Department of Pharmacology, Faculty of Medicine and Health Sciences, UAE University, United Arab Emirates e Department of Microbiology, Faculty of Medicine and Health Sciences, UAE University, United Arab Emirates f Section of Experimental Geriatrics, NEUROTEC, Huddinge Hospital B84, Karolinska Institute, 141 86 Huddinge, Sweden Received 12 January 2004; received in revised form 13 April 2005; accepted 18 April 2005 Abstract The role of inflammatory cytokines in the pathogenesis of diabetic nephropathy has been studied in streptozotocin-induced diabetic rats. Rat kidneys were examined by light and electron microscopy and kidney homogenates were also analyzed by Western blot and flow cytometry for the expression of markers of inflammation namely, CD4C and CD8C T cells, macrophages, MHC classes I and II, the proinflammatory cytokines tumor necrosis factor-a, interferon-g and nitric oxide (NO). Light and electron microscope examination revealed infiltration of mononuclear cells throughout the renal parenchyma, with the glomeruli being more severely affected especially at 8 months after disease induction. Western blot and flow cytometric analyses revealed the infiltrating cells to be CD4C T cells, CD8C T cells and macrophages. Western blot analyses also revealed increased expression of the proinflammatory and Th1 cytokines tumor necrosis factor-a, interferon-g as well as nitric oxide. Using flow cytometry, we have shown that the difference in expression of CD4C T cells in control and diabetic kidneys is more significant at 1 month than at 8 months, while expression of CD8C T cells is more significant at 8 months. We speculate therefore that diabetic nephropathy is probably initiated and driven by a Th1 process. CD8C T cells, however, become more significant at later stages of the disease when tissue loss is evident. Since NO induction also occurs only after 8 months, we hypothesize that NO might be significant for the later stages of the disease. Our data implicate inflammation in the pathogenesis of diabetic nephropathy in view of the overexpression of the proinflammatory cytokines TNF-a and IFN-g and the cells that secrete them in the early and late phases of the disease. Ó 2005 Elsevier Ltd. All rights reserved. Keywords: Cytokines; Tumor necrosis factor-a; Interferon-g; Nitric oxide synthase 1. Introduction Diabetic nephropathy is a very common complica- tion of diabetes mellitus and is characterized by hypertrophy of the glomerular and tubular structures of the kidneys, thickening of the basement membrane, glomerular hyperfiltration and accumulation of extra- cellular matrix components in the glomerular mesan- gium and tubular interstitium [1,2]. The pathogenetic mechanisms underlying the development of these com- plications have been the subject of several studies in both humans and animal models of diabetes. Of these mechanisms, the roles of proinflammatory and * Corresponding author. Department of Pharmacology, Faculty of Medicine and Health Sciences, United Arab Emirates University, PO Box 17666, Al Ain, UAE. E-mail address: [email protected] (A. Adem). 1043-4666/$ - see front matter Ó 2005 Elsevier Ltd. All rights reserved. doi:10.1016/j.cyto.2005.04.006 Cytokine 31 (2005) 180e190 www.elsevier.com/locate/issn/10434666
-
Upload
independent -
Category
Documents
-
view
3 -
download
0
Transcript of Streptozotocin-induced diabetic nephropathy in rats 2005

Cytokine 31 (2005) 180e190
www.elsevier.com/locate/issn/10434666
Streptozotocin-induced diabetic nephropathy in rats:The role of inflammatory cytokines
E.P.K. Mensah-Brown a, E.N. Obineche b, S. Galadari c, E. Chandranath d,A. Shahin e, I. Ahmed a, S.M. Patel c, A. Adem d,f,*
a Department of Anatomy, Faculty of Medicine and Health Sciences, UAE University, United Arab Emiratesb Department of Internal Medicine, Faculty of Medicine and Health Sciences, UAE University, United Arab Emirates
c Department of Biochemistry, Faculty of Medicine and Health Sciences, UAE University, United Arab Emiratesd Department of Pharmacology, Faculty of Medicine and Health Sciences, UAE University, United Arab Emiratese Department of Microbiology, Faculty of Medicine and Health Sciences, UAE University, United Arab Emirates
f Section of Experimental Geriatrics, NEUROTEC, Huddinge Hospital B84, Karolinska Institute, 141 86 Huddinge, Sweden
Received 12 January 2004; received in revised form 13 April 2005; accepted 18 April 2005
Abstract
The role of inflammatory cytokines in the pathogenesis of diabetic nephropathy has been studied in streptozotocin-induceddiabetic rats. Rat kidneys were examined by light and electron microscopy and kidney homogenates were also analyzed by Western
blot and flow cytometry for the expression of markers of inflammation namely, CD4C and CD8C T cells, macrophages, MHCclasses I and II, the proinflammatory cytokines tumor necrosis factor-a, interferon-g and nitric oxide (NO). Light and electronmicroscope examination revealed infiltration of mononuclear cells throughout the renal parenchyma, with the glomeruli being more
severely affected especially at 8 months after disease induction. Western blot and flow cytometric analyses revealed the infiltratingcells to be CD4C T cells, CD8C T cells and macrophages. Western blot analyses also revealed increased expression of theproinflammatory and Th1 cytokines tumor necrosis factor-a, interferon-g as well as nitric oxide. Using flow cytometry, we have
shown that the difference in expression of CD4C T cells in control and diabetic kidneys is more significant at 1 month than at8 months, while expression of CD8C T cells is more significant at 8 months. We speculate therefore that diabetic nephropathy isprobably initiated and driven by a Th1 process. CD8C T cells, however, become more significant at later stages of the disease whentissue loss is evident. Since NO induction also occurs only after 8 months, we hypothesize that NO might be significant for the later
stages of the disease. Our data implicate inflammation in the pathogenesis of diabetic nephropathy in view of the overexpression ofthe proinflammatory cytokines TNF-a and IFN-g and the cells that secrete them in the early and late phases of the disease.� 2005 Elsevier Ltd. All rights reserved.
Keywords: Cytokines; Tumor necrosis factor-a; Interferon-g; Nitric oxide synthase
1. Introduction
Diabetic nephropathy is a very common complica-tion of diabetes mellitus and is characterized by
* Corresponding author. Department of Pharmacology, Faculty of
Medicine and Health Sciences, United Arab Emirates University,
PO Box 17666, Al Ain, UAE.
E-mail address: [email protected] (A. Adem).
1043-4666/$ - see front matter � 2005 Elsevier Ltd. All rights reserved.
doi:10.1016/j.cyto.2005.04.006
hypertrophy of the glomerular and tubular structuresof the kidneys, thickening of the basement membrane,glomerular hyperfiltration and accumulation of extra-cellular matrix components in the glomerular mesan-gium and tubular interstitium [1,2]. The pathogeneticmechanisms underlying the development of these com-plications have been the subject of several studiesin both humans and animal models of diabetes. Ofthese mechanisms, the roles of proinflammatory and

181E.P.K. Mensah-Brown et al. / Cytokine 31 (2005) 180e190
prosclerotic cytokines have been intensively studied[3e6]. Release of these cytokines and nitric oxide hasbeen linked to the infiltration of mononuclear cells,particularly macrophages and T lymphocytes [7e10].These studies seem to imply that proinflammatory, Th1cytokines and nitric oxide play significant roles in thedevelopment of features of diabetic nephropathy. Whilstmost of these studies have concentrated on the role ofcytokines in thickening of the basement membrane,and accumulation of extracellular matrix components inthe glomerular mesangium and tubular interstitium [5],recent studies have also shown that a significant lossof kidney tissue occurs in long-term diabetic rats [11].However, the mechanisms underlying tissue loss indiabetic nephropathy remain to be elucidated.
In this study we have used light and electronmicroscopy, Western blot and FACS analyses to demon-strate infiltration of cells in renal tissue and to define theirphenotypes. Immunohistochemistry has also been usedto confirm the presence of CD4C and CD8C T cells in8-month diabetic kidneys. In addition, expression of theMHC class I and II antigens, proinflammatory cytokineTNF-a, Th1 cytokine IFN-g and iNOS in 1 and 8-monthdiabetic kidneys have also been studied by Western blotanalysis to determine what role the inflammatory processplays in the development of long-term features of diabeticnephropathy in experimental diabetes.
2. Materials and methods
All experimental procedures were conducted usingaseptic techniques and were in accordance with theprotocol for projects involving the use of laboratoryanimals of the Animals Research Ethics Subcommitteeof the Research Grants Awarding Committee of theFaculty of Medicines and Health Sciences, United ArabEmirates University. Every effort was made to minimizethe number of animals used.
2.1. Induction of diabetes
Diabetes was induced by a single injection of strepto-zotocin (STZ) administered to male Wistar rats (230e270 g). Briefly, the male rats (nZ 30) received a singleintraperitoneal injection of STZ (60 mg kg�1; Sigma,S-0130). STZ was dissolved in a citrate buffer solution(0.1 M citric acid and 0.1 M sodium citrate, pH 4.5). Age-matched controls (nZ 25) received an equivalent volumeof citrate buffer solution alone. Control and diabetic ratswere caged separately but housed under similar con-ditions. Both groups were fed the same diet and water adlibitum until they were used either 1 month or 8 monthsafter induction of the disease. One and 8-month diabetic
rat kidneys were chosen firstly, so that the roles of thevarious inflammatory cytokines can be compared atboth early and late stages of the disease with the sameexperimental parameters. The rats were weighed dailybefore they were killed by decapitation. Diabetes wasverified by random and fasting blood sugar estimationusing a glucometer (one touch II glucometer, Life ScanInc.). Kidneys of both diabetic and normal rats wereremoved, weighed and their weights recorded per 100 gbody weight. Sections of 1 and 8-month diabetic kidneyswere subsequently placed in 4% paraformaldehydesolution overnight at 4 �C for light microscopy. Basedon the light microscopy result, sections of 8-monthdiabetic kidneys were also placed in McDowell andTrump fixative solution [12] for 4 h for electron micro-scopic studies. Sections of both 1 and 8-month diabetickidneys were also placed in homogenization buffermade up of 1 M TriseHCl pH 7.4, 5 M NaCl, 10%NP-40, 100 mM NaF, 100 mM NaVO4, 500 mM DTTand 1 mM fresh PMSF containing protease inhibitors10 mg/ml leupeptin, 10 mg/ml aprotinine, 10 mg/mltrypsin and 1 mg/ml pepstatin A for SDS-PAGE andWestern blot.
2.2. Light microscopy
The diabetic and non-diabetic kidneys were dividedinto four pieces, with each piece comprising all parts ofthe kidney. Alternate pieces were routinely embeddedin paraffin wax and sections of 6.0 mm thickness cutwith a Shandon A325 retraction microtome. Thesections were mounted on gelatin coated glass slides.The sections were then stained with haematoxylinand eosin for light microscopy studies. Sections from8-month diabetic kidneys and age-matched controlswere also stained with Periodic Acid Schiff (PAS) todetermine the extent of damage of the cells of theproximal convoluted tubules. The other two pieces werefrozen in liquid nitrogen and used for immunohisto-chemistry.
2.3. Electron microscopy
Kidney pieces (1 mm2) obtained from kidneysremoved from adult rats (nZ 5) diabetic for 8 monthsand normal rats (nZ 5) were placed in McDowell andTrump fixative solution [12] and routinely embeddedin Agar resin. Thick sections (1e2 mm) stained withtoluidine blue were examined under the light microscopeto confirm the areas to be studied. Ultrathin sections of60e90 nm thickness were cut with a Delaware diamondknife (Agar Scientific Ltd., Cambridge, UK) andmounted on 3 mm 200 carbon grids. The grids werecontrast stained with saturated aqueous uranyl acetate

182 E.P.K. Mensah-Brown et al. / Cytokine 31 (2005) 180e190
and lead citrate and examined with the Phillips CM10transmission electron microscope.
2.4. Immunohistochemistry
Kidneys from 8-month diabetic rats were used forthis experiment because haematoxylin and eosin stainingrevealed a high level of cellular infiltration which wasnot observed in the 1 month diabetic kidneys. It wasalso used to confirm the presence of CD4C and CD8CT cells at this stage of disease.
Kidneys of 8-month diabetic rats were frozen in liquidnitrogen immediately and stored at �80 �C. The spe-cimens were then mounted in cryomatrix (Shandon,Pittsburgh, USA) in the chamber of the cryostat and5e7 mm sections cut using amotorized cryostat (Shandon,Life Sciences Int. Cheshire, UK) and air dried over-night. Sections were fixed in cold (20 �C) acetone for10 min, air dried for 1 h and incubated in 3% hydrogenperoxide in absolute methanol for 30 min to blockendogenous peroxidase. After 3! 5 min washes in0.1 M PBS, the slides were incubated with mouse anti-rat CD4 and CD8 antibodies (Pharmingen, USA) diluted1:100 in 0.3% Triton X in 0.1 M PBS overnight at 4 �C.The sections were then incubated with the link antibodycomprising biotinylated anti-mouse IgG in PBS (JacksonImmuno Research Laboratories Inc., USA) diluted 1:500in 0.3% Triton X in 0.1 M PBS for 1 h and thenperoxidase labelled-extravidin (Sigma, USA) diluted1:1000 in 3% Triton X in 0.1 M PBS for 1 h, the slidesbeing washed in three 5 min changes of 0.1 M PBS bufferin between the link antibody and the tertiary antibody.The specimens were washed in 0.1 M PBS (3 steps, 5 mineach) and peroxidase activity was demonstrated withdiaminobenzidene. One 10 mg tablet of diaminobenzi-dene hydrochloride (Sigma Co., St. Louis, USA) wasdissolved in 15 ml of 0.1 M PBS and filtered, then 12 mlof 30% hydrogen peroxide was added to the filtrate.The light brown solution was placed on the sections for3e5 min. Sections were then counterstained with haema-toxylin, coverslipped using Cytoseal 60 mounting medium(Stephens Scientific, Riversdale, NJ, USA) and examinedon a Zeiss axiophot photomicroscope. For each primaryantibody used, control experiments consisted of thefollowing.
(i) Omission of primary antiserum, (ii) substitution ofprimary antiserum with antiserum adsorbed with thepurified antigen 10�6 M of sera of the various antibodies(obtained from the same source as the antisera), (iii)substitution of primary antibody with 0.1 M PBS buffer.For positive controls sections of the spleen were stainedwith the primary antibodies. These controls were carriedout on sections at the same time as the sections beingtreated with the primary antibody.
2.5. FACS analysis
Lymphocytes were prepared according to method ofAndo et al. [14]. Briefly, pieces of 1 and 8-monthdiabetic and normal kidney cortices were minced usingfrosted microscope slides to dislodge cells. The dislodgedcells were collected by centrifugation in RPMI-1640containing 5% fetal bovine serum. The cells weresuspended in 40% Percoll (Sigma) in RPMI-1640, andthen overlaid on 66.7% Percoll solution. Gradientseparation was performed at 2100 rpm for 20 min atroom temperature. The buffy coat layer was collectedand washed several times with RPMI-1640 for flowcytometric labelling.
2.6. Labelling of cells and FACS flowcytometric analysis
A single color staining technique for detecting cellsusing rat anti-CD4 clone OX-35 and rat anti-CD8 clone(OX-8) (BD Pharmingen, USA) was performed. Label-ling procedure was according to BD Pharmingenmanual. Briefly 0.5 million cells were suspended in 50 mlof staining buffer (5% fetal bovine serum) containing50 ml of fluorochrome conjugated monoclonal antibodyspecific for CD4C and CD8C T cells diluted 1:100. Cellswere incubated for 30 min at 4 �C and washed 2! in0.1 M PBS. FACS vantage (Becton Dickinson) was usedfor flow cytometric analysis.
2.7. SDS-PAGE and Western blot
Freshly isolated kidney tissues from 8-month-olddiabetic rats and their matched non-diabetic controlswere homogenized at 4 �C in homogenization buffer.The homogenate was centrifuged at 15 000 rpm(18 000! g) for 15 min at 4 �C. An aliquot of thesupernatant was kept for protein determination, and tothe rest, SDS sample buffer containing b-mercaptoethanolwas added. The samples were boiled for 3 min and aftercooling and centrifugation at 15 000 rpm for 1 min, theequivalent of 30 mg of protein/lane was loaded ontoa 15% polyacrylamide gel. The proteins were subjectedto electrophoresis under constant voltage [13], trans-ferred onto nitrocellulose membranes blocked with 5%non-fat milk. The blots were incubated for 2 h at roomtemperature with monoclonal rat anti-mouse CD4,CD8, ED1, interferon-g (IFN-g), tumor necrosis-a(TNF-a) HLA-DP, DQ, DR and OX-18 (MHC class I)(Pharmingen, USA); rabbit polyclonal inducible nitricoxide NOS2 (H-174) or iNOS (Santa Cruz Biotechnol-ogy) all diluted at 1:500. Blots were washed andincubated with secondary antibodies conjugated tohorseradish peroxidase and the binding of antibodies

183E.P.K. Mensah-Brown et al. / Cytokine 31 (2005) 180e190
visualized by enhanced chemiluminescence. Signalintensity was analyzed using a scanning densitometer(Image analyzer, Vilber Lourmat, France, and Bio-RadImage System, Bio-Rad laboratories, CA, USA).
2.8. Antisera specificity
All antisera purchased from Pharmingen were specificfor their intended antigens with no cross reactivities(manufacturer’s information). NOS2 or iNOS is non-cross reactive with NOS1 (nNOS) or NOS3 (ecNOS)and is reactive to rat, mouse, and human NOS2(manufacturer’s information).
2.9. Statistics
Statistical analysis was performed using one-wayanalysis of variance. Statistical significance was consid-ered at p! 0.05. Data expressed as meanG SE.
3. Results
Body weight loss was used as an index of diabetesmellitus. The body weight of rats was significantlyreduced from 251.1G 11.5 g in controls to 195G 10.2 g( p! 0.01) 1 month after STZ treatment (nZ 9). At8 months, the weight of rats decreased significantly from391.5G 5.69 g in controls to 179.3G 9.7 g ( p! 0.01) inthe experimental group (nZ 9).Kidneyweights increasedsignificantly ( p! 0.0001) from 0.689G 0.01 g in con-trols to 1.254G 0.09 g per 100 g body weight 1 monthafter induction of diabetes and while kidney weight wasalso significantly increased ( p! 0.0001) at 8 months(1.314G 0.059 g) compared to controls (0.678.G 0.014 g),the difference in weights between the 1 and 8-monthdiabetic kidneys was insignificant. Efficiency of STZtreatment was confirmed by measuring blood and urineglucose levels. Mean glycemic level of diabetic rats at1 month was significantly higher ( p! 0.001) comparedto controls. The level of glycemia in diabetic rats at8 months was also significantly higher ( p! 0.001) thanthe level in controls, but the difference in glycemic levelsbetween the 1 and 8 diabetic rats was not significant. Thedifferences in urine glucose levels between 1 and 8-monthdiabetic and their age-matched controls were significant( p! 0.0001). As with glycemic levels, there was nodifference in significance in the urine glucose levelsbetween the 1 and 8-month diabetic rats (Fig. 1).
3.1. Morphological studies
Using light microscopy we observed dilatation oftubular structures as the main feature of the diabetic
renal parenchyma at 1 month (Fig. 2aed). The 8 monthrenal parenchyma was characterized by infiltration ofmononuclear cells throughout the parenchyma with thehighest concentration of the cells occurring in the cortexespecially around groups of glomeruli which appearedto be at different stages of damage (Fig. 3). Loss oftissue was also observed particularly in the distalconvoluted tubules. The macula densa was also occa-sionally damaged (Fig. 4). PAS stain also revealeddamage of the proximal convoluted tubules witha number of cells showing loss of cytoplasmic stain(Fig. 5). In addition, electron microscopy revealed cellswith ultrastructural features characteristic of mono-nuclear cells within the glomeruli and the rest of theparenchyma of 8-month diabetic kidneys. Electron micros-copy also revealed disruption of the foot processes ofpodocytes, with disruption of the basal infoldings andloss of mitochondria between the folds of proximalconvoluted tubules (Fig. 6c, d).
3.2. Immunohistochemistry
A number of the infiltrating mononuclear cellsaround and within glomeruli and other parts of theparenchyma of the kidney were immunoreactive toantisera to CD4C and CD8C (Fig. 7a, b).
3.3. FACS
Flow cytometric analysis of renal infiltrating cellsrevealed that at both 1 and 8 months, diabetic kidneyscontained significantly higher levels of CD4C andCD8C T cells ( p! 0.001) with the former predominat-ing. It was also observed that 1 month diabetic kidneyscontained almost 20 times as much CD4C T cells
Fig. 1. Histogram showing blood and urine glucose levels (mg/dl) of
control, 1 and 8-month diabetic rats. Diabetic rats show significant
differences in blood glucose (***p ! 0.001) and urine glucose
(###p ! 0.001) from their respective controls. Note that the differences
in the levels of glycemia and urine glucose between 1 and 8 months are
not significant. Data are expressed as meanG S. E. M. (nZ 9).
184 E.P.K. Mensah-Brown et al. / Cytokine 31 (2005) 180e190
Fig. 2. Light micrograph of the cortex of a normal (a, b) and 1 month diabetic kidneys (c, d). Note the normal glomeruli (G) and macula densa (block
arrow) in (a), the proximal convoluted tubule (arrowhead), distal convoluted tubule (arrow) in (b). Note also the damaged glomerulus (G) and the
dilated distal tubules in (d). BarZ 7 mm.
(53.3% diabetic: 2.4% control) and 10 times as muchCD8C cells (7.8% diabetic: 0.8 control) compared tothe controls. While the comparative levels of CD8CT cells in the 8-month diabetic kidneys remain the
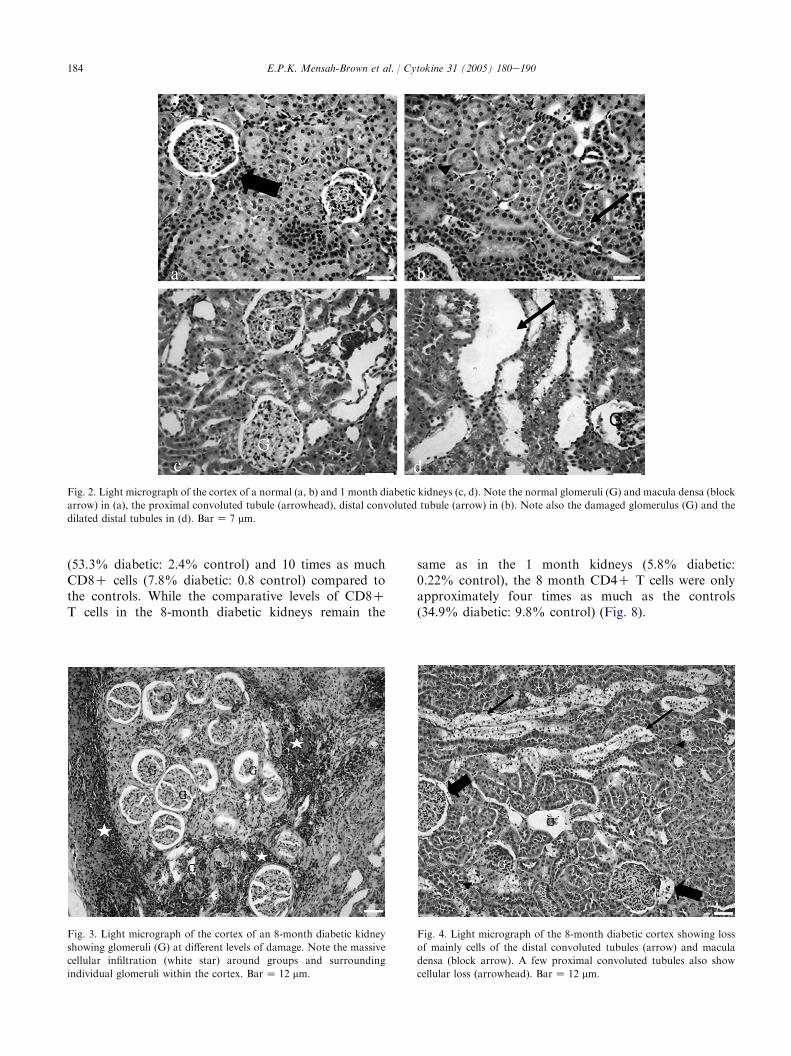
Fig. 3. Light micrograph of the cortex of an 8-month diabetic kidney
showing glomeruli (G) at different levels of damage. Note the massive
cellular infiltration (white star) around groups and surrounding
individual glomeruli within the cortex. BarZ 12 mm.
same as in the 1 month kidneys (5.8% diabetic:0.22% control), the 8 month CD4C T cells were onlyapproximately four times as much as the controls(34.9% diabetic: 9.8% control) (Fig. 8).
Fig. 4. Light micrograph of the 8-month diabetic cortex showing loss
of mainly cells of the distal convoluted tubules (arrow) and macula
densa (block arrow). A few proximal convoluted tubules also show
cellular loss (arrowhead). BarZ 12 mm.

185E.P.K. Mensah-Brown et al. / Cytokine 31 (2005) 180e190
3.4. SDS-PAGE and Western blot
In order to characterize the phenotype of infiltratingcells homogenates of kidneys of 1 and 8-month diabeticrats and normal controls were analyzed by SDS-PAGE and Western blot analyses. At 1 month, whilstall the antisera examined were higher in the diabetickidneys, the level of increase was particularly signifi-cant for MHC class I, CD4C, CD8C, and ED1( p! 0.0001) compared to the controls. Althoughthe expression of the 34 kDa MHC class II wasapproximately twice as much in the diabetic com-pared to the control, its expression was lower thanthat of the 28 kDa MHC class II in both control anddiabetic kidneys. At 8 months, CD4C, CD8C, ED1,MHC classes I and II were all significantly higher( p! 0.001) in diabetic kidneys compared to controls(Fig. 9).
Fig. 5. Light micrograph of PAS stained sections of proximal
convoluted tubules of a normal (a) and 8-month diabetic (b) kidneys.
Note the loss of cytoplasmic elements and the brush border in some of
the diabetic proximal convoluted tubules (arrowhead). BarZ 8 mm.
The expression of TNF-a, IFN-g and iNOS wereanalyzed to determine whether they were involved in thepathogenesis of the disease. The expression of TNF-a,IFN-g was significantly greater in the diabetic kidneyscompared to that in the control kidneys at 1 month( p! 0.01) and 8 months ( p! 0.001). iNOS was notdiscernible in both 1 month diabetic and control kidneysbut was observed in the 8-month diabetic kidney(Fig. 10). The optical density values of Western blotbands are summarized in Fig. 11.
4. Discussion
Diabetic nephropathy is characterized by hypertro-phy of the glomerular and tubular structures of thekidneys, thickening of the basement membrane, glomer-ular hyperfiltration and accumulation of extracellularmatrix components in the glomerular mesangium andtubular interstitium [1,2]. In this study we have usedlight and electron microscopy, immunohistochemistry,FACS and Western blot analyses to demonstrateinfiltration of cells and to define their phenotypes inkidney tissue. In addition, expression of the MHC class Iand II antigens, proinflammatory cytokine TNF-a,Th1 cytokine IFN-g and iNOS in 1 and 8-monthdiabetic kidneys have also been studied by Western blotanalysis to determine the role of inflammation in thedevelopment of diabetic nephropathy in experimentaldiabetes.
Our study has shown that diabetes causes significantbody weight loss at both 1 and 8 months. These resultsare in contrast to that of Barber et al. [15] whichreported that the weight loss had not worsened withtime. The work of Barber et al. [15] did not observe anyworsening in the reduction in weight probably becauseof the length of the experiment. Our results showeddiabetic kidney weights were significantly increased at 1and 8 months after induction of diabetes. These findingsare in line with previous reports [16,17].
Our morphological studies revealed the disease to bepresent throughout the renal parenchyma with groupsof glomeruli being affected by the disease process. Wehave previously shown the presence of similar morpho-logical changes in the medulla of the diabetic kidney[11]. Electron microscopy revealed disruption of thebasal infoldings and loss or damage of the mitochondrialying within the folds of the proximal convolutedtubules. The effect of the disease process on glomerularfiltration barrier was evidenced by the loss of footprocesses of podocytes at several sites of the barrier.This might explain the loss of protein in the urine ofdiabetic rats reported by Russo et al. [18].
The demonstration of overexpression of CD4C,CD8C and ED1 by immunohistochemistry and Western

186 E.P.K. Mensah-Brown et al. / Cytokine 31 (2005) 180e190
Fig. 6. An electron micrograph showing the filtration barrier (4) of a normal (a) and 8-month diabetic kidneys (b), a normal proximal convoluted
tubule (c) showing normal basal infoldings (block arrow) around mitochondria (asterisk). Note the loss of the basal infoldings and mitochondria in
the 8-month diabetic kidney (d). Note the presence of a monocyte (m) around the filtration barrier and the loss of podocytes (star) and their foot
processes in (b) of the diabetic kidney. BarZ 0.1 mm.
blot analyses indicates that the infiltrating cells presentin the diabetic kidney might be Th1, cytotoxic T cellsand macrophages. Overexpression of MHC class IIknown to be present on macrophages and endotheliumfurther confirms the presence of macrophages [19].
Both CD4C and CD8C play important roles inthe pathogenesis of both immune-mediated and non-immune-mediated inflammatory kidney diseases [20,21].FACS and Western blot analyses both showedsignificant increase in the levels of both CD4C andCD8C T cell 1 and 8 months after disease induction. It
is noteworthy, however, that while at 1 month, FACSanalyses showed that CD4C T cells were six times asmuch as those in controls, the difference in levelsdropped to approximately three times after 8 months.In contrast, the difference in concentration of CD8CT cells increased from three times at 1 month to almost10 times after 8 months. We speculate that this mightindicate a significant role for CD4C T cells for theinitiation and progress of disease while CD8C T cellsbecome more important towards the terminal stages ofthe disease when tissue loss is evident and significant.

187E.P.K. Mensah-Brown et al. / Cytokine 31 (2005) 180e190
CD8C cells are cytotoxic T lymphocytes that might beresponsible for the tissue damage observed in this study.CD8C T cells are attracted to sites of inflammation viatheir reaction with MHC class I antigens which areubiquitously expressed on all nucleated cells. CD8CT cells might also be attracted to sites of inflammationdownstream after the secretion of these cytokines. Thereis mounting evidence too, that the expression of MHCclass I is upregulated on tissues and cells in response toIFN-g and TNF-a [22e24]. The significant expressionof CD4C as well as both MHC class I and CD8C cells,1 and 8 months after induction of disease, are consistentwith the hypothesis that CD4C and CD8C lympho-cytes but especially the former, might be important forthe inflammatory process at the initial stages of diabeticnephropathy.
The role of cytokines notably transforming growthfactor b [4,5,7,25] and TNF-a [3,4,26] in diabeticnephropathy is well established. In line with these
Fig. 7. Light micrograph showing CD4C (a) and CD8C (b) (arrow)
immunoreactive T cells in and around the glomeruli (G) of 8-month
diabetic kidneys. BarZ 6 mm.
studies, our results demonstrated significant overexpres-sion of TNF-a. We have also demonstrated expressionof iNOS at 8 months but not at 1 month after inductionof diabetes. These observations suggest a link betweeninflammatory cytokines and NO in the pathogenesis ofdiabetic nephropathy, both of which have been impli-cated in the pathology of diabetic nephropathy [27].Another source of NO could be the kidney tubuleswhich are known to secrete NO under the influence ofIFN-g [28,29]. This source might be significant in lightof the overexpression of IFN-g in our study. Studies byMcLay et al. [29] have implicated nitric oxide in the celldestruction and progression of kidney tubular damageand we speculate that NO could be significant in thepathogenesis of tissue damage at the later stages ofexperimental diabetes mellitus. Interestingly, in spite ofthe overexpression of both markers for macrophagesand IFN-g at 1 month, induction of NO secretion doesnot seem to occur 1 month after disease induction. ThusNO might not be involved in the pathogenesis ofdiabetes at its inception. In this study, the observationof increased expression of TNF-a IFN-g, the markersfor T lymphocytes and macrophages as well as NO atthe late stages of the disease and the cells that secretethem [10] supports the role of inflammation in thepathogenesis of experimental STZ-induced diabeticnephropathy.
In summary, we have demonstrated that the proin-flammatory and Th1 cytokines, TNF-a and IFN-g areoverexpressed in kidneys of long-term streptozotocin-induced diabetic rats. We present evidence that in-filtrating cells which are probably macrophages, CD4Cand CD8C T lymphocytes might be the sources of thesecytokines. The overexpression of MHC class I and IIalso suggests a significant role for CD4C, CD8C T cellsand macrophages in the disease process. Our findingsimplicate inflammation in the disease process with bothCD4C and CD8C T cells being important at the initialstages of the disease. It seems, however, that CD8CT cells have become more important at the later stagesof the disease when tissues loss becomes evident. Theobservation that nitric oxide is also induced at 8 monthand not 1 month after disease induction seems toimplicate NO in the disease process.
The findings of this study could not be attributed tothe effects of streptozotocin since it is metabolized andtotally excreted from rats within 6 h of its administra-tion [30] and dosage employed in the present study hasbeen shown not to cause any structural damage in thekidney [31]. However, the fact that kidney weightsactually increased with progress of the disease makes theexplanation of our findings of tissue loss in the distaland proximal convoluted tubules difficult and furtherdetailed studies will be required.
In conclusion, our study demonstrates that inflam-mation plays a significant role in the pathology of

188 E.P.K. Mensah-Brown et al. / Cytokine 31 (2005) 180e190
Fig. 8. Flow cytometric plots of T lymphocytes infiltrating kidneys of 1 and 8-month diabetic rats. Mononuclear cells extracted from cortices of
healthy (B, F, D, H) and diabetic (A, E, C, G) kidneys stained with anti-CD4 (A, B, C, D) and rat anti-CD8 (E, F, G, H). Fluorescence intensity was
recorded as a two-dimensional display on a log scale. Note that a large number of infiltrating cells in the diabetic kidneys are CD4C ( p ! 0.01) and
CD8C ( p! 0.05) T cells.
experimental diabetic nephropathy and that this is detect-able as early as 1 month after induction of diabetes. Itcould be speculated that early anti-inflammatory thera-peutic intervention might be beneficial in the managementof diabetic nephropathy.
Acknowledgments
This work has been supported by grants from theFaculty of Medicine and Health Sciences. The authorsare also grateful to Mr. Dhanasekhar for technical help.
Fig. 9. Western blot analysis of 1 and 8-month diabetic kidney homogenates showing expression of CD4, CD8, ED1, MHC class I, MHC class II
(28 kDa and 34 kDa). Note the absence of MHC class II 34 kDa 1 month after induction of disease. Each blot represents a homogenate of three
kidneys; lanes 1, 2, and 3 represent control, 4, 5, and 6 represent homogenates from kidneys from diabetic rats. n Z 3 for each band.

189E.P.K. Mensah-Brown et al. / Cytokine 31 (2005) 180e190
Fig. 10. Western blot analysis of 1 and 8-month diabetic kidney homogenates showing the expression of the cytokine tumor necrosis factor-a
(TNF-a) (a) and interferon-g (IFN-g) (b) and inducible nitric oxide (iNOS) (c). Note the absence of iNOS in 1-month diabetic homogenate. Each
blot represents a homogenate of three kidneys; lanes 1, 2, and 3 represent control, 4, 5, and 6 represent homogenates from kidneys from diabetic rats
(nZ 3 per lane).
References
[1] Lane TA, Lamkin GE, Wancewicz EV. Protein kinase C
inhibitors block the enhanced expression of intercellular adhesion
molecule-1 of endothelial cells activated by interleukin-1, lipo-
polysaccharide and tumor necrosis factor. Biochem Biophys Res
Commun 1990;103:172e7.
[2] Ibrahim HN, Hostetter TH. Diabetic nephropathy. J Am Soc
Nephrol 1997;8:487e93.[3] Hasegawa G, Nakano K, Sawada M, Uno K, Shibayama Y,
Ienaga K, et al. Possible role of tumor necrosis factor and
interleukin-1 in the development of diabetic nephropathy. Kidney
Int 1991;40:1007e12.
[4] Flyvbjerg A. Putative pathophysiological role of growth factors
and cytokines in experimental diabetic kidney disease. Diabeto-
logia 2000;43:1105e223.
[5] Hill C, Flyvbjerg A, Rasch R, Bak M, Logan A. Transforming
growth factor-b2; antibody attenuates fibrosis in the experimental
diabetic rat kidney. J Endocrinol 2001;170:647e51.
Fig. 11. Histogram showing optical density readings of Western blot
bands of T cells (CD4 and CD8), macrophages (ED1), MHC classes I
and II, proinflammatory cytokines TNF-a and IFN-g and iNOS in
control and diabetic kidneys 1 and 8 months after disease induction.
Diabetic rats show significant differences in the expression of the
markers in 1 and 8-month diabetic kidneys (***p! 0.001) from their
respective controls. Note particularly that CD4C T cells are more
significantly expressed at 1 month than at 8 months while CD8C cells
remain highly significant at both time points. Note also that with the
exception of iNOS which is not expressed at 1 month, the differences in
expression of markers at 1 and 8 months are not significant.
[6] Korpinen E, Groop P-H, Fagerudd AM, Teppo AM,
Akerblom HK, Vaarala O. Increased secretion of TGF-b1by peripheral blood mononuclear cells from patients with type I
diabetes mellitus with diabetic nephropathy. Diabet Med 2001;18:
121e5.
[7] Furuta T, Saito T, Ootaka T, Soma J, Obara K, Abe K, et al. The
role of macrophages in diabetic glomerulosclerosis. Am J Kidney
Dis 1993;21:480e5.
[8] Young BA, Johnson RJ, Alpers CE, Eng E, Gordon K, Floege J,
et al. Cellular events in the evolution of experimental diabetic
nephropathy. Kidney Int 1995;47:935e44.
[9] Sassy-Pringent C, Heudes D, Mandet C, Belair MF, Micjhel O,
Perdereau B, et al. Early glomerular macrophage recruitment in
streptozotocin-induced diabetic rats. Diabetes 2000;49:466e75.[10] Wada T, Furuichi K, Sakai N, Iwata Y, Yoshimoto K,
Shimizu M, et al. Up-regulation of monocyte chemoattractant
protein-1 on tubulointerstitial lesions of human diabetic nephrop-
athy. Kidney Int 2000;58:1492e9.[11] Obineche EN, Mensah-Brown E, Chandranath SI, Arafat K,
Adem A. Loss of kidney IGF-1 receptors in experimental long-
term diabetic rats. Endocr Res 2001;27:293e302.[12] McDowell EM, Trump BE. Histologic fixatives for diagnostic
light and electron microscopy. Arch Pathol Lab Med 1976;100:
405e14.
[13] Ando T, Hu Wu, Watson D, Hirano T, Hiraka H, Fujishima M,
et al. Infiltration of canonical Vg4gdT cells in an adriamycin-
induced progressive renal failure model. J Immunol 2001;167:
3740e5.
[14] Laemmli UK. Cleavage of structural proteins during the assembly
of the head of bacteriophage T4. Nature 1970;277:6800e5.
[15] Barber M, Kasturi BS, Austin ME, Patel KP, MohanKumar SM,
MohanKumar PS. Diabetes-induced neuroendocrine changes in
rats: role of brain monoamines, insulin and leptin. Brain Res
2003;964:128e35.
[16] Ku DD, Roberts RB, Sellers BM, Meezan E. Regression of
renal hypertrophy and elevated NaC, KC ATPase activity after
insulin treatment in streptozotocin-dial rats. Endocrinology
1987;120:2166e73.
[17] Cho EJ, Yokozawa T, Kim HY, Shibahara N, Park JC. Rosa
rugosa attenuates diabetic oxidative stress in rats with streptozo-
tocin-induced diabetes. Am J Chin Med 2004;32:487e96.
[18] Russo LM, Osicka TM, Brammar GC, Candido R, Jerums G,
Co WD. Renal processing of albumin in diabetes and hyperten-
sion rats. Possible role of TGF-beta1. Am J Nephrol 2003;23:
61e70.
[19] Shevach EM. Organ-specific autoimmunity. In: Paul WE, editor.
Fundamental immunology. 4th ed. Philadelphia: LippincoteRaven Publishers; 1999. p. 1089e125.

190 E.P.K. Mensah-Brown et al. / Cytokine 31 (2005) 180e190
[20] RennkeHG,Klein PS, SandstromDJ,MendrickDL. Cell-mediated
immune injury in the kidney. Kidney Int 1994;45:1044e56.
[21] Kawasaki K, Yaoita E, Yamamoto T, Kihara I. Depletion of
CD8 positive cells in nephrotoxic serum nephritis of WKY rats.
Kidney Int 2000;58:1797e804.
[22] Harris HW, Gill III TJ. Expression of class I transplantation
antigens. Transplantation 1986;42:109e17.
[23] Chamberlain JW, Nolan PJ, Conrad HA, Vasavada HA,
Vasavada H, Ploegh HL, et al. Tissue-specific and cell surface
expression of human histocompatibility complex class I heavy
(HLA-B7) and light (b2-microglobulin) chain genes in transgenic
mice. Proc Natl Acad Sci U S A 1988;85:7690e4.[24] Singer DS, Maguire JE. Regulation of expression of class I MHC
genes. Crit Rev Immunol 1990;10:235e57.
[25] Katz JB, Wang B, Haskins K, Benoist C, Mathis D. Following
a diabetogenic T cell from genesis through pathogenesis. Cell
1993;74:1089e100.
[26] Wolf G, Ziyadeh N. Molecular mechanisms of diabetic renal
hypertrophy. Kidney Int 1999;56:393e405.
[27] Sugimoto H, Shikata K, Wada J, Horiuchi S, Makino H.
Advanced glycation end products-cytokine-nitric oxide sequence
pathway in the development of diabetic nephropathy: amino-
guanidine ameliorates the overexpression of tumor necrosis
factor-alpha and inducible nitric oxide synthase in diabetic rat
glomeruli. Diabetologia 1999;42(7):878e86.
[28] Markewitz BA, Michael JR, Kohan DE. Cytokine-induced
expression of nitric oxide synthase in rat renal tubule cells. J Clin
Invest 1993;9:2138e43.
[29] McLay JS, Chatterjee P, Nicolson AG, Jardine AG, Mckay NG,
Ralston SH, et al. Nitric oxide production by human proximal
tubular cells: a novel immunomodulatory mechanism? Kidney Int
1994;46:1043e9.
[30] Karunanayaka EH, Baker JR, Hearse DJ, Mellows G. Strepto-
zotocin: its excretion and metabolism in the rat. Diabetologia
1976;12:483e8.
[31] Evan AP, Mong SA, Gattone VH, Connors BA, Aronoff GR,
Luft FC. The effect of streptozotocin and streptozotocin-induced
diabetes on the kidney. Renal Physiol 1984;7(2):78e89.