Investigating structural and biochemical correlates of ganglion cell dysfunction in...
9
This article appeared in a journal published by Elsevier. The attached copy is furnished to the author for internal non-commercial research and education use, including for instruction at the authors institution and sharing with colleagues. Other uses, including reproduction and distribution, or selling or licensing copies, or posting to personal, institutional or third party websites are prohibited. In most cases authors are permitted to post their version of the article (e.g. in Word or Tex form) to their personal website or institutional repository. Authors requiring further information regarding Elsevier’s archiving and manuscript policies are encouraged to visit: http://www.elsevier.com/copyright
Transcript of Investigating structural and biochemical correlates of ganglion cell dysfunction in...

This article appeared in a journal published by Elsevier. The attachedcopy is furnished to the author for internal non-commercial researchand education use, including for instruction at the authors institution
and sharing with colleagues.
Other uses, including reproduction and distribution, or selling orlicensing copies, or posting to personal, institutional or third party
websites are prohibited.
In most cases authors are permitted to post their version of thearticle (e.g. in Word or Tex form) to their personal website orinstitutional repository. Authors requiring further information
regarding Elsevier’s archiving and manuscript policies areencouraged to visit:
http://www.elsevier.com/copyright

Author's personal copy
Investigating structural and biochemical correlates of ganglion cell dysfunctionin streptozotocin-induced diabetic rats
Bang V. Bui a, Michelle Loeliger b, Merlin Thomas c, Algis J. Vingrys a,*, Sandra M. Rees b,Christine T.O. Nguyen a, Zheng He a, Mary Tolcos b
a Department of Optometry & Vision Sciences, University of Melbourne, Parkville, Victoria 3010, Australiab Department of Anatomy & Cell Biology, University of Melbourne, Parkville, Victoria 3010, Australiac The Baker Heart Research Institute, Melbourne, Victoria 3004, Australia
a r t i c l e i n f o
Article history:Received 8 October 2008Received in revised form15 January 2009Accepted in revised form 19 January 2009Available online 7 February 2009
Keywords:streptozotocinretinaganglion cellsphysiologyelectroretinogramgrowth factorsoptic nerve
a b s t r a c t
The aim of this study was to determine whether inner retinal dysfunction in diabetic rats is correlatedwith structural and/or biochemical changes in the retina and optic nerve. Using the electroretinogram(ERG; �5.83 to 1.28 log cd.s.m�2) retinal function (photoreceptor, bipolar, amacrine and ganglion cellcomponents) was measured in control (n ¼ 13; citrate buffer) and diabetic (n ¼ 13; streptozotocin, STZ,50 mg kg�1) rats, 12 weeks following treatment. Retinae and optic nerves were analyzed for structuralchanges and retinae were assessed for alterations in growth factor/cytokine expression using quantita-tive real-time PCR. We found that phototransduction efficiency was reduced 12 weeks after STZ-induceddiabetes (�30%), leading to reduced amplitude of ON-bipolar (�18%) and amacrine cell (�29%) domi-nated responses; ganglion cell dysfunction (�84%) was more profound. In the optic nerve, nerve fasciclearea and myelin sheath thickness were reduced (p < 0.05), whereas the ratio of blood vessels andconnective tissue to total nerve cross-sectional area was increased (p < 0.05) in diabetic compared tocontrol rats. In the retina, connective tissue growth factor (CTGF), transforming growth factor beta, type 2receptor (TGFb-r2) mRNA and platelet-derived growth factor B (PDGF-B) mRNA were increased(p < 0.035). Reduced ganglion cell function was correlated with increased CTGF and TGFb-r2, but notPDGF-B mRNA. In summary, the ganglion cell component exhibited the greatest level of dysfunctionwithin the ERG components examined after 12 weeks of STZ-induced diabetes; the level correlated withincreased CTGF and TGFb-r2 mRNA, but not with gross morphological changes in the retina or opticnerve.
� 2009 Elsevier Ltd. All rights reserved.
1. Introduction
Diabetic retinopathy affects up to 90% of patients with diabetes,with 5% progressing to legal blindness. Although vascular changeswere considered the first clinical signs of retinopathy, a growingbody of evidence suggests that neural and glial complications may
precede such changes (Asnaghi et al., 2003; Barber et al., 1998;Lieth et al., 2000). Clinically, abnormal color vision and contrastsensitivity have been observed prior to vasculopathy (Shirao andKawasaki, 1998), indicating the early presence of neuropathy. Morerecently, it has been reported that indices of local neuronaldysfunction can predict the development of vascular compromise(Bearse et al., 2004). Studies in streptozotocin (STZ)-induced dia-betic rats have demonstrated abnormalities in both photoreceptorsand post-receptoral neurons (bipolar cells, amacrine cells andganglion cells) (Phipps et al., 2006; Qin et al., 2006; Ramsey et al.,2006). A number of studies suggest that neuropathy is moremarked in the inner retina (see review, Kern and Barber, 2008). Inparticular, increased cell loss has been observed in the ganglion celllayer of diabetic patients (Barber et al., 1998) as well as thinnerretinal nerve fiber layers (Takahashi and Chibara, 2007). Greaterganglion cell loss (Barber et al., 1998; Hammes et al., 1995; Kana-mori et al., 2004; Qin et al., 2006; Seigel et al., 2006; Zhang et al.,
Abbreviations: AGE, advanced glycation end products; CTGF, connective tissuegrowth factor; ECM, extracellular matrix; ERG, electroretinogram; NGF, nervegrowth factor; OP, oscillatory potential; PDGF, platelet-derived growth factor;PDGF-a, platelet-derived growth factor-alpha; PDGF-B, platelet-derived growthfactor-B; PDGF-b, platelet-derived growth factor-beta; SEM, standard error of themean; STR, scotopic threshold response (pSTR, positive-STR, nSTR, negative-STR);STZ, streptozotocin; TGFb1, transforming growth factor beta 1; TGFb-r2, trans-forming growth factor beta, type 2 receptor.
* Corresponding author. Tel.: þ61 3 9349 7406; fax: þ61 3 9349 7498.E-mail address: [email protected] (A.J. Vingrys).
Contents lists available at ScienceDirect
Experimental Eye Research
journal homepage: www.elsevier .com/locate/yexer
0014-4835/$ – see front matter � 2009 Elsevier Ltd. All rights reserved.doi:10.1016/j.exer.2009.01.009
Experimental Eye Research 88 (2009) 1076–1083
Author's personal copy
2007) and reduced axon volume (Scott et al., 1986) has also beenreported in STZ-induced diabetic rats. These outcomes are consis-tent with studies showing that ganglion cell dysfunction, assessedusing the electroretinogram (ERG), exists early in experimentaldiabetes (Kozaki et al., 2008). However, the underlying cause of thisganglion cell dysfunction remains unclear.
The aim of the present study is to assess whether there arebiochemical changes in the retina or gross structural alterations inthe retina and optic nerve of diabetic rats and to determinewhether such alterations are correlated with neuronal dysfunctionmeasured by ERG. We will focus on the following growth factors,connective tissue growth factor (CTGF), platelet-derived growthfactor B (PDGF-B), transforming growth factor beta 1 (TGFb1) andits receptor (TGFb-r2) which are all localized to the ganglion celllayer (Cox et al., 2003; Tikellis et al., 2004; Yamamoto et al., 1998;Yamanaka et al., 2002) in the normal adult rodent retina. Further-more, CTGF (Tikellis et al., 2004) and PDGF (Cox et al., 2003; Yokotaet al., 2003) are known to be altered in diabetes. In addition, CTGF(Kuiper et al., 2004) and TGFb1 (Pascal et al., 1999) are involved inextracellular matrix (ECM) formation and therefore alterations tothese factors in the retina following diabetes might influencefunction.
2. Materials and methods
2.1. Animals
Procedures conformed to the National Institutes of Health’s‘Principles of laboratory animal care’ and the Australian Code ofPractice for the Care and Use of Animals for Scientific Research.Adult male Sprague–Dawley rats (n ¼ 26, 6 weeks, ~200 g) werehoused at 20 �C with ad libitum food and water and under a 12 hlight/dark cycle.
2.2. STZ-induced diabetes
Rats were fasted overnight and randomized to receive either STZ(50 mg kg�1, n ¼ 13) or citrate buffer (n ¼ 13) by intravenous tailvein injection. Diabetes was diagnosed based on physiological andbiochemical parameters taken at 4, 8 and 12 weeks. Theseincluded: elevated blood glucose levels (>15 mmol L�1), abnormalglycosylated hemoglobin (HBA1c >7.0%), polyuria (>40 mL urinevolume over 24 h) and polydypsia (>60 mL fluid intake over 24 h).Fluid intake and urine volume was collected using metabolic cagesover a 24 h period at time points described above. All diabeticanimals were administered insulin daily (2 units of human proto-phane, subcutaneous) to mimic the human condition.
2.3. Electroretinography
Electroretinography was measured at 12 weeks following STZ-induced diabetes. After dark-adaptation (>12 h) animals wereanaesthetized under dim red light (lmax ¼ 650 nm) using intra-muscular ketamine and xylazine (60: 5 mg kg�1, Troy Laboratory,Frenchs Forest, NSW, Australia). Pupil dilation (�4 mm) and cornealanesthesia were induced with tropicamide (Mydriacyl 0.5%, Aller-gan, Frenchs Forest, NSW, Australia) and proxymetacaine (Oph-thetic 0.5%, Allergan), respectively. Signals were recorded witha silver-chloride electrode mounted on the cornea referenced to thesclera (ring shaped), both of which were grounded to a tail elec-trode (Grass Telefactor, West Warwick, RI, USA). Corneal lubricationwas maintained with 1.0% carboxymethylcellulose (Celluvisc,Allergan).
Stimulation (<2 ms, white) was provided by light emittingdiodes (5 Watt, 5500�K, Luxeon, Calgary, Alberta, Canada) via
a ganzfeld sphere. Responses were recorded (4 kHz, band-pass0.3–1000 Hz) over a range of scotopic luminous energies (�5.83 to1.28 log cd.s.m�2). Twenty signals were averaged at dim luminousenergies (<�5.28 log cd.s.m�2), whereas fewer were averaged atbrighter luminous energies, with interstimulus lengthened from 2to 180 s. Functional analysis was conducted by unmasked observersusing automated software developed in an Excel� spreadsheet(Microsoft, Redmond, WA, USA).
2.3.1. Photoreceptoral functionThe photoreceptoral a-wave (first negativity) can be described
using a model (P3) of the phototransduction cascade (Hood andBirch, 1990), which returns the saturated amplitude of the darkcurrent (RmP3, mV), and its sensitivity (S, m2.cd�1.s�3) after a delay(td, s). The P3 was modeled as an ensemble over the brightest threeintensities (0.98–1.28 log cd.s.m�2) with the delay fixed to thecontrol average (td ¼ 3.6 ms).
2.3.2. ON-bipolar cell activityThe ON-bipolar cell (Robson and Frishman, 1995) component
(P2) underlying the b-wave (large positivity) is isolated by sub-tracting the P3 from the raw data and band-pass filtering to removeoscillatory potentials (OPs). The amplitude at a fixed time of 100 msis extracted and modeled across the entire range of luminousenergies (I, log cd.s.m�2) using a hyperbolic function, to return themaximum amplitude (Vmax, mV), sensitivity (1/K, log cd.s.m�2) andslope (n).
2.3.3. Oscillatory potentialsOscillatory potentials were isolated by subtracting the P3 and
band-pass filtering (5th order Butterworth, �3 dB at 60 and300 Hz). The peak amplitude and time to the largest peak overa window of 25–100 ms was measured. At luminous energies(>�4 log cd.s.m�2) where the OP amplitude was greater thanrecording noise, the largest peak coincided with the third peak.
2.3.4. Scotopic threshold responseAt the dimmest four light levels the scotopic threshold response
(STR) is composed of positive (pSTR) and negative (nSTR) lobes,reflecting ganglion cell activity in rats (Bui and Fortune, 2004). Theamplitude of the pSTR and nSTR are sampled at fixed times of 100and 220 ms, respectively. Adopting a fixed time criterion for STRamplitudes avoids incorrect identification of responses, as in somecases the STR was absent in diabetic animals. To reduce noise pSTRand nSTR amplitude is derived from the average of the dimmestfour luminous energies (�5.83 to �4.96 log cd.s.m�2). The STZeffect is then expressed for each animal each animal relative to theabsolute magnitude of the control group mean ((control – STZ)/jcontrolj, %).
2.4. Structural analysis of the retina and optic nerve
Following electroretinography, anaesthetized rats were sacri-ficed by decapitation, their eyes enucleated, and the anteriorsegment and vitreous removed. The posterior eyecup from the lefteye was placed in 4% paraformaldehyde in 0.1 M phosphate buffer(pH 7.4) for 30 min, retinae from the right eyecup were dissectedand snap frozen in liquid nitrogen for analysis of gene expression.
Blocks (2 � 5 mm) of central (adjacent to the optic nerve in thetemporal quadrant) and peripheral (inferior temporal quadrant,strip collected half way between the optic disc and extending toapproximately 0.5 mm from the ora serrata) retina (control, n ¼ 6and diabetic, n ¼ 6), and a 5 mm section of the left optic nerve(2 mm from the point of insertion; control, n ¼ 11 and diabetic,n ¼ 10) were collected. Tissue was fixed in 1% glutaraldehyde in 4%
B.V. Bui et al. / Experimental Eye Research 88 (2009) 1076–1083 1077
Author's personal copy
paraformaldehyde in 0.1 M phosphate buffer (pH 7.4) for 24 h, post-fixed in 1% osmium tetroxide for 30 min, stained with 2% uranylacetate and embedded in Epon–Araldite (ProSciTech, Thuringowa,Qld, Australia). Semi-thin (1 mm) transverse sections were collectedand stained with methylene blue for qualitative and quantitativeanalysis.
Ganglion cell number and somal area were quantified usingimage analysis (Image Pro v4.1, Media Cybernetics, MD, USA;�1300). The number of ganglion cells was assessed in a 300 mmlength of central and peripheral retina in each of the five sectionsfrom each animal. The counts were averaged, expressed as thenumber of ganglion cells per mm length of retina, and the meandetermined for control and diabetic groups. Cells were identified asganglion cells only if they were located within the ganglion celllayer and had large, round cell bodies with positively-stained Nisselsubstance (Barber et al., 1998). To determine ganglion cell somalarea, 50 cells with a nucleolus for each animal were sampled (10cells each section, five sections each animal) in randomly selectedsites in both the central and peripheral retina, and average ganglioncell somal area was calculated. Mean retinal thickness wasmeasured in the peripheral retina. Sections were projected (�300;50 measurements each animal in total) using an image analysissystem and the mean retinal thickness calculated for each animal.In addition, ten sections (2 mm) of peripheral and central retinawere sampled for each animal and scanned for the presence ofapoptotic bodies in the ganglion cell layer. Cells undergoingapoptosis were identified by nuclear fragments, which appear asdiscrete basophilic masses of clumped chromatin (apoptoticbodies) and a clear cytoplasm (Wyllie et al., 1980).
Optic nerve assessments were made as previously described(Loeliger et al., 2005, 2007): (1) total cross-sectional area (fivesections each animal, �65); (2) ratio of connective tissue and bloodvessels to total cross-sectional area (20 sites each animal: �1300);(3) total nerve fascicle area (total cross-sectional area minusconnective tissue and blood vessels); (4) total number of axons (10sites, sample area 0.001 mm2, approximately 5% of each nervesampled: �2500) calculated as the product of axons mm2 multi-plied by the nerve fascicle area; (5) axonal diameter (200–250axons each animal: �30,000); and (6) myelin sheath thickness,calculated by subtracting the axonal diameter from the nerve(axon þmyelin sheath) diameter and dividing by 2 (200–250 axonseach animal: �30,000).
2.5. Isolation of total RNA and synthesis of cDNA
Snap frozen retinae (control, n ¼ 10; diabetic, n ¼ 9) werehomogenized using the Ultra-Turrax (Janke & Kunkel IKA, Labor-technik, Germany) in TRIZOL (Life Technologies Inc, Gaithersburg,MD, USA), and total RNA was isolated. cDNA was synthesized witha reverse transcriptase reaction using a standard technique(Superscript� First Strand Synthesis System for RT-PCR, LifeTechnologies Inc) with random hexamers, deoxy-NTPs, and totalRNA extracted from control and diabetic rat retinas. To assessgenomic DNA contamination, controls without reverse transcrip-tase were included.
2.6. Quantitative real-time PCR
Real-time (RT)-PCR is a fully quantitative method for thedetermination of amounts of mRNA. Briefly, primers and probes forthe genes of interest (Table 1) were designed using the softwareprogram, ‘Primer Express’ (PE Applied Biosystems, Foster City, CA,USA) and RT-PCR was carried out as previously described (Tikelliset al., 2003). 18S was used as the endogenous control to ensureequal starting amounts of cDNA. Samples from control retina were
assigned a value of 1, and samples from the diabetic group werecompared against this calibration (Tikellis et al., 2003).
2.7. Statistics
All measurements of the retina and optic nerve were made oncoded slides. Anatomical and RT-PCR outcomes are expressed asmean � SEM and statistical analyses carried out using t-tests(P < 0.05). Functional parameters were compared using a two-way(treatment and luminous energy) ANOVA (Prism, v4.00, GraphPadSoftware Inc., San Diego, CA, USA). As both functional andanatomical parameters contain variability, a Demings regressionwas employed to determine the association between theseparameters. A Spearman coefficient was calculated and an r > 0.7was considered a robust association.
3. Results
Fig. 1 shows representative waveforms 12 weeks followingtreatment. At the brightest light level (Fig. 1A, 1.28 log cd.s.m�2) thea-wave was unaffected by STZ, whereas the b-wave was reduced.The OPs were smaller and slower in diabetic rats (Fig. 1B). At dimlight levels, which elicits the STR (Fig. 1C, �4.9 log cd.s.m�2) thepositive component peaking at 100–120 ms was reduced, whereasthe later negative component was unaffected.
3.1. Outer and inner retinal function
The saturated photoreceptoral response (RmP3) in control anddiabetic animals showed similar amplitudes (control: �450 � 14vs. STZ: �503 � 33 mV, t12 ¼ 1.5, P ¼ 0.16). In contrast, photo-transduction sensitivity (log S) was significantly lower in the dia-betic group compared with controls (control: 3.73 � 0.01 vs. STZ:3.57 � 0.02, t12 ¼ 6.8, P < 0.001).
Fig. 1D shows that the energy-response functions (amplitude at100 ms) for controls and diabetic animals have different slopes (n).Amplitudes (F1,23 ¼ 146.9, P < 0.001) were significantly reduced indiabetic compared to control rats, with the different slopes meaningthat the magnitude of attenuation was greatest at dim light levels(F1,23 ¼ 2.3, P < 0.001). The hyperbolic function fitted to the rawdata reveals that STZ-induced diabetes resulted in maximal ampli-tude reduction (Vmax, control: 1132 � 41 vs. diabetic: 934 � 50 mV;t12 ¼ 3.4, P < 0.01). This reduction resulted in a semi-saturation
Table 1Probe and primer sequences used for RT-PCR analysis.
Probe/primer Sequence
CTGFForward primer 50-30 TGGCCCTGACCCAACTATGAProbe FAM ACTGCCTGGTCCAGAC-MGBReverse primer 50-30 CTTAGAACAGGCGCTCCACTCTPDGF-BForward primer 50-30 GACGCGTACAGAGGTGTTCCAProbe FAM TCGCGGAACCTC-MGBReverse primer 50-30 GGCATTGGTGCGATCGATTGFb1Forward primer 50-30 GAGGTGACCTGGGCACCATProbe FAM CATGACATGAACCGACC-MGBReverse primer 50-30 GGCCATGAGGAGCAGGAATGFb-r2Forward primer 50-30 TGACAACCAGAAGTCTTGCATGAProbe FAM CAACTGCAGCGTCAC-MGBReverse primer 50-30 GCGGCTTCTCACAGATGGA
CTGF, connective tissue growth factor; PDGF-B, platelet-derived growth factor B;TGFb1, transforming growth factor beta 1; TGFb-r2, transforming growth factor betatype 2 receptor.
B.V. Bui et al. / Experimental Eye Research 88 (2009) 1076–10831078

Author's personal copy
constant that was unaltered (K, control: �2.93 � 0.03 vs. diabetic:�2.89 � 0.07 log cd.s.m�2; t12 ¼ 0.5, P ¼ 0.59) but the slope of thefunction was significantly increased in diabetic animals (n, control:0.86 � 0.01 vs. diabetic: 1.07 � 0.04; t12 ¼ 4.7, P < 0.001).
Fig. 1E shows the energy-response for peak OP amplitude. Thiswas biphasic with a significantly reduced amplitude in diabeticanimals (F1,23 ¼ 4.6, P < 0.001) at high luminous energies (grayzone, P < 0.05). OP peak times were also significantly delayed indiabetic animals (at 1.28 log cd.s.m�2, control: 35.2 � 0.6 vs. dia-betic: 40.7 � 1.2 ms; F1,25 ¼ 18.9, P < 0.001).
3.2. Serial losses in ERG components
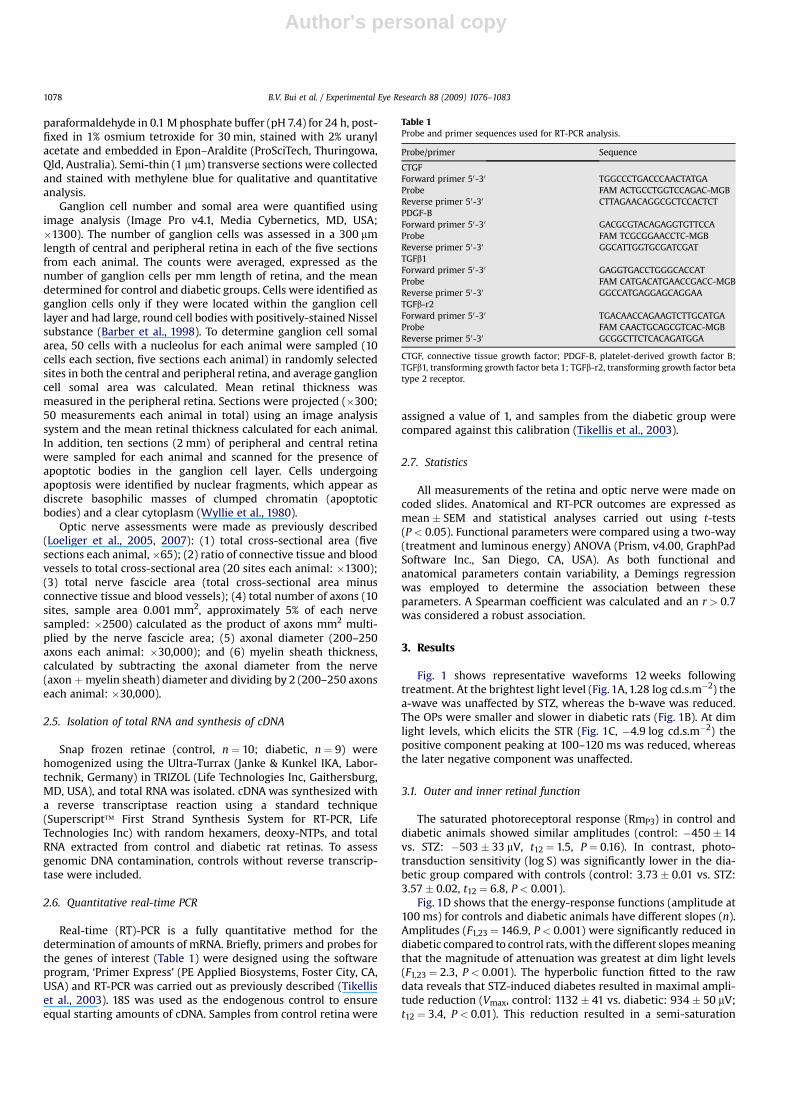
Fig. 2A shows that STZ-induced diabetes did not significantlyalter photoreceptor amplitude (RmP3, 11.8 � 7.3%). Although theON-bipolar cell dominated P2 (Vmax, �17.5 � 4.4%, P < 0.001) andOP amplitudes (�29.0 � 5.6%, P < 0.001) were significantlyreduced, these percentage changes were not significantly differentwhen compared against each other (P ¼ 0.21). The ganglion celldominated pSTR was more attenuated than any other ERGcomponent (�84.4 � 8.1%, P < 0.001), whereas the nSTR was larger(51 �13%, control: �15 � 1 vs. diabetic: �22 � 2 mV).
As the ERG reflects serial retinal processing it is possible thatdeficits in early components can produce apparent losses indownstream neurons (Hood and Birch, 1992). One method ofanalysis that can provide information about specific component
changes in individual animals is to express ERG amplitudes asratios. The underlying logic is that change in one component shouldaccount for change in a downstream component when the ampli-tude ratio remains constant. Fig. 2B shows that the ON-bipolar cell/photoreceptor (P2:P3) amplitude ratio was significantly reduced indiabetic rats (1.89 � 0.07) compared with controls (2.52 � 0.05,P < 0.001). Fig. 2C shows that the inner retina:ON-bipolar cell(OP:P2) ratio was similar in diabetic (0.09 � 0.01) and controlanimals (0.10 � 0.01, P ¼ 0.50). Finally, Fig. 2D shows that theganglion cell:ON-bipolar cell (pSTR:P2) ratio was significantlylower in diabetic animals (0.0004 � 0.0002) compared withcontrols (0.0022 � 0.0004, P < 0.001).
3.3. Optic nerve and retinal structure
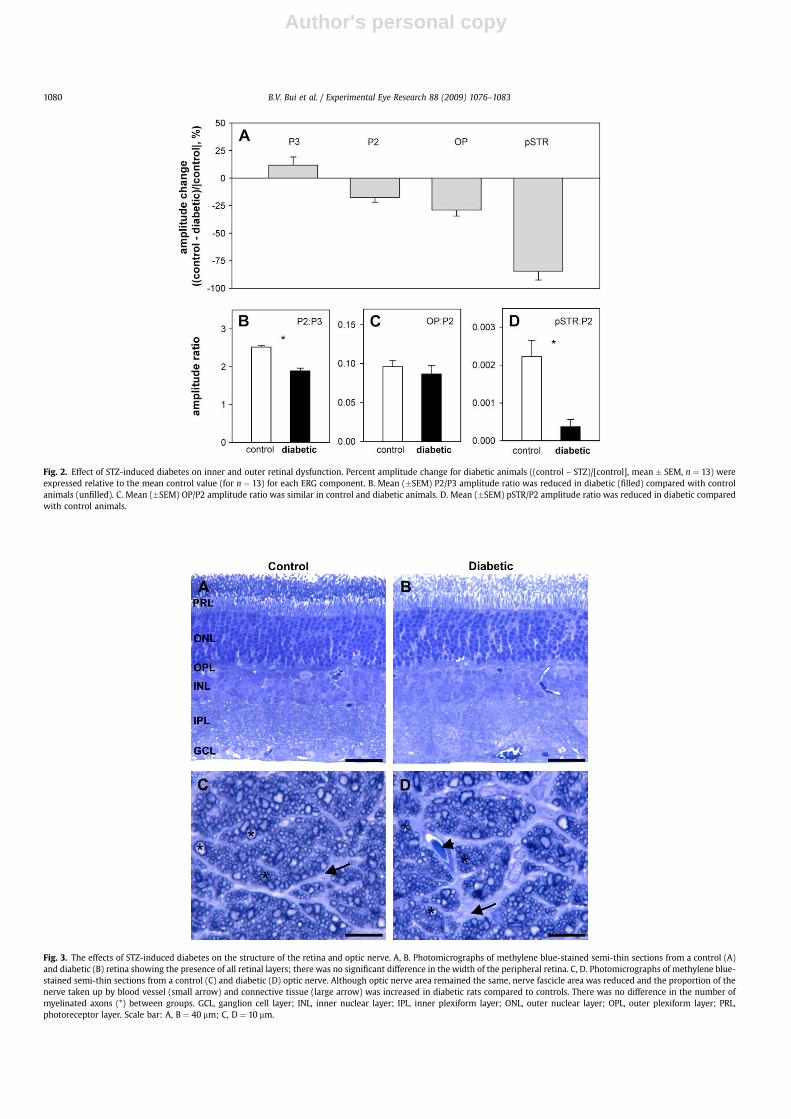
Qualitative observation did not reveal any pathological alter-ations in STZ-induced diabetic retina compared to controls; allretinal layers were present and apoptotic bodies were not evidentin the ganglion cell layer (Figs. 3A,B). There was no difference(P > 0.05) in the width of the peripheral retina (control: 197.4 � 8.6vs. diabetic: 198.4 � 7.2 mm), the number of ganglion cells (control:50.3 � 2.5 vs. diabetic: 49.7 � 2.1 per mm; P > 0.05) or in the areaof ganglion cell somata in the central (control: 124.6 � 7.0 vs. dia-betic: 124.1 � 6.3 mm2; P > 0.05) or peripheral retina (control:119.6 � 8.6 vs. diabetic: 118.2 � 5.3 mm2; P > 0.05).
Fig. 1. Effect of STZ-induced diabetes on visual function. Representative waveforms obtained from a control (thin) and diabetic (heavy) animal. A. At the brightest luminous energy(1.28 log cd.s.m�2) the b-wave was reduced, whereas the a-wave was largely unaffected. B. The isolated oscillatory potentials (OPs) were reduced and delayed in the diabetic animalat the brightest luminous energy. C. At dim luminous energies (�4.9 log cd.s.m�2) the pSTR is reduced. D. Energy-response functions for amplitudes at 100 ms (mean � SEM, n ¼ 13each) for diabetic (filled circles, heavy line) compared with controls (unfilled squares, thin line). Data were modeled using a hyperbolic function. Shaded area indicates intensitiesover which the STR was averaged for comparison with controls. E. Group (mean � SEM, n ¼ 13 each) OP peak amplitude as a function of luminous energy for control (unfilled) anddiabetic animals (filled). Shaded area indicates luminous energies over which OP amplitude was averaged for comparison with controls.
B.V. Bui et al. / Experimental Eye Research 88 (2009) 1076–1083 1079
Author's personal copy
Fig. 2. Effect of STZ-induced diabetes on inner and outer retinal dysfunction. Percent amplitude change for diabetic animals ((control – STZ)/[control], mean � SEM, n ¼ 13) wereexpressed relative to the mean control value (for n ¼ 13) for each ERG component. B. Mean (�SEM) P2/P3 amplitude ratio was reduced in diabetic (filled) compared with controlanimals (unfilled). C. Mean (�SEM) OP/P2 amplitude ratio was similar in control and diabetic animals. D. Mean (�SEM) pSTR/P2 amplitude ratio was reduced in diabetic comparedwith control animals.
Fig. 3. The effects of STZ-induced diabetes on the structure of the retina and optic nerve. A, B. Photomicrographs of methylene blue-stained semi-thin sections from a control (A)and diabetic (B) retina showing the presence of all retinal layers; there was no significant difference in the width of the peripheral retina. C, D. Photomicrographs of methylene blue-stained semi-thin sections from a control (C) and diabetic (D) optic nerve. Although optic nerve area remained the same, nerve fascicle area was reduced and the proportion of thenerve taken up by blood vessel (small arrow) and connective tissue (large arrow) was increased in diabetic rats compared to controls. There was no difference in the number ofmyelinated axons (*) between groups. GCL, ganglion cell layer; INL, inner nuclear layer; IPL, inner plexiform layer; ONL, outer nuclear layer; OPL, outer plexiform layer; PRL,photoreceptor layer. Scale bar: A, B ¼ 40 mm; C, D ¼ 10 mm.
B.V. Bui et al. / Experimental Eye Research 88 (2009) 1076–10831080

Author's personal copy
Although the cross-sectional area of the optic nerve wasunchanged in diabetic rats compared to controls there was a smallbut significant decrease in nerve fascicle area (P < 0.05), and theproportions of the nerve occupied by blood vessels (P < 0.05) andconnective tissue (P < 0.05) were increased (Table 2; Figs. 3C,D). Inaddition there was a reduction in myelin sheath thickness(P < 0.05). There was no difference in the total number of ganglioncell axons (P > 0.05) or axonal diameter (P > 0.05) in the opticnerve of diabetic compared to control rats.
3.4. Retinal biochemical parameters
Retinal CTGF (þ481 �105%, P < 0.001), PDGF-B (78 � 26%,P ¼ 0.017) and TGFb-r2 (þ99 � 29%, t8 ¼ 4.2, P < 0.001) mRNAlevels (Fig. 4A) were increased in the retinas of diabetic comparedto control rats. TGFb1 (�28 � 24%, t8 ¼ 0.9, P ¼ 0.4) mRNA levelsremained unaltered (Fig. 4A).
Associative analysis between functional and anatomicalparameters revealed a modest correlation between: the pSTRamplitude and increased CTGF mRNA (relative to control; Fig. 4B),and the slope (n) of the amplitude (100 ms criterion) energy-response function and increased TGFb-r2 mRNA levels (Fig. 4C). Allother functional parameters were not correlated with any opticnerve anatomical measures or retinal biochemical parameters(P > 0.035).
4. Discussion
Consistent with previous studies we found neuronal dysfunc-tion across all retinal layers 12 weeks following STZ-induced dia-betes in rats (for review please see Kern and Barber, 2008).However, the functional deficits observed here are in general moresevere than those reported previously (Kozaki et al., 2008). Thereasons for these discrepancies are unclear but may arise frominter-experiment variability. Such variability in physiologicalexpression has been noted across many experiments (Hancock andKraft, 2004; Phipps et al., 2004). Kowluru et al. (1992) suggest thatsuch discrepancies may reflect variable levels of residual insulin,which can modify expression of retinal proteins, including thosethat are involved in ERG generation. Nevertheless, we confirm thatthe ganglion cell pSTR is at least 50% more attenuated than otherERG components (Kozaki et al., 2008), which accounts for theincrease in the amplitude energy-response function slope (Fig. 1D).
Given the serial processing in the retina, a loss in photo-receptoral and ON-bipolar cell function (Fig. 1) should producea downstream pSTR reduction. However, our ratio analysis (Fig. 2)showed that the P3 deficit cannot account for the P2 attenuation.Although the P2 reduction can explain the OP loss, it is worthkeeping in mind that these data do not separate the contribution ofrod and cone pathways. A more detailed analysis by Phipps et al.(2004) showed that the cone mediated P2 and rod OPs are selec-tively affected.
Our analysis also showed that the P2 attenuation is less thanthat needed to account for the pSTR dysfunction. Furthermore, ifthe STR loss were simply downstream of the P2 deficit, then wemight expect both pSTR and nSTR components to be attenuated,which was not found. This analysis revealed that diabetes producesa selective ON-bipolar cell dysfunction (P2) and an additionalganglion cell deficit (pSTR). The selective nature of our pSTR lossargues against the possibility of glial cell dysfunction, which shouldattenuate both STR components (Frishman and Steinberg, 1989).
In the present study we found no significant difference in ourestimates of ganglion cell number nor in the number of axons in theoptic nerve of STZ-induced diabetic rats compared to controls.Combined, these results suggest that in our experimental paradigm,ganglion cell numbers are not affected. This is inconsistent withprevious reports of ganglion cell apoptosis after 12 weeks ofSTZ-induced diabetes (Barber et al.,1998; Kanamori et al., 2004; Qinet al., 2006). These previous studies however did not use insulinfrom the onset of diabetes, a treatment known to reduce retinal celldeath (Barber et al., 1998). Barber et al. (1998) did introduce 2 unitsof insulin once a week after the second month in their long-term(7.5 months) diabetic model. The dose of STZ used in previousstudies (Barber et al., 1998; Kanamori et al., 2004; Qin et al., 2006)was greater than that used in our study, which was designed toinduce a less severe diabetic milieu and thus provide a more clin-ically relevant model. While we observed no overt retinal changes,it is possible that subtle ultrastructural and/or neurochemicalchanges are occurring, but are below detection threshold with ourmethods. The absence of overt damage to the retina or a loss of opticnerve axons, raises the possibility that cells in the retina aredysfunctional after 12 weeks of STZ-induced diabetes in the ratwithout concomitant morphological change. Ganglion celldendritic field abnormalities have been detected in human eyeswith long standing diabetes (Meyer-Rusenberg et al., 2007),12 weeks after STZ-induced diabetes in rats (Qin et al., 2006) andafter 12 weeks of diabetes in Ins2 Akita mice (Gastinger et al., 2008).
We also investigated whether changes in growth factor/cyto-kine gene expression and/or optic nerve structure could contributeto ganglion cell dysfunction in STZ-induced diabetic animals. Wefound a significant up-regulation in the expression of TGFb-r2mRNA, without a concomitant increase in TGFb1 gene expression indiabetic rats compared to controls. This could possibly result inincreased TGFb receptor signaling and/or a greater capacity to bindlower levels of TGFb1 in the diabetic rat retina. Evidence for an up-regulation in the TGFb signaling pathway in the present study, isthe increase in the expression of CTGF, a TGFb gene target (Gro-tendorst, 1997). Our data is in line with a previous study showingthat CTGF protein and mRNA expression was significantly increasedin the ganglion cell layer in diabetic rat retina (Tikellis et al., 2004).
We also found a correlation between CTGF gene expression andpSTR attenuation, and TGFb-r2 gene expression and increased P2amplitude energy-response function slope. However, these corre-lations were modest and larger sample sizes are needed to betterdefine these relationships. Nevertheless, TGFb (Yamamoto et al.,1998), TGFb-r2 (Yamanaka et al., 2002) and CTGF (Tikellis et al.,2004) have all been localized to the ganglion cell layer in the adultrat retina, and are known to stimulate ECM production. Althoughthe precise consequences of increased TGFb receptor signaling andCTGF gene expression in the ganglion cell layer in the diabeticretina are unknown, it may be possible that an accumulation ofECM, particularly in the ganglion cell layer, could effect ganglioncell function by influencing the formation, maturation and plas-ticity of synapses (Dityatev et al., 2006). In support of this idea,a recent study by VanGuilder et al. (2008) shows that proteinsinvolved in synaptic function are down regulated in the retina after3 months of STZ-induced diabetes.
Table 2Optic nerve parameters in STZ-induced diabetic and control rats.
Parameter Control (n ¼ 11) Diabetic (n ¼ 10)
Optic nerve area (mm2) 0.26 � 0.01 0.25 � 0.01Blood vessel: cross-sectional area (%) 0.83 � 0.11 1.40 � 0.18*Connective tissue: cross-sectional area (%) 14.4 � 1.7 22.0 � 2.7*Nerve fascicle area (mm2) 0.22 � 0.01 0.20 � 0. 01*Total number of axons 92464 � 2489 84520 � 4069Axonal diameter (mm) 1.06 � 0.05 1.03 � 0.05Myelin sheath thickness (mm) 0.25 � 0.01 0.22 � 0.01*
Values are expressed as mean � SEM. *P < 0.05 compared to controls.
B.V. Bui et al. / Experimental Eye Research 88 (2009) 1076–1083 1081

Author's personal copy
PDGF-B mRNA is expressed in retinal ganglion cells in the adultrodent retina (Cox et al., 2003) where it functions principally asa paracrine and autocrine growth factor. Consistent with a study inrats following 4 and 8 weeks of STZ-induced diabetes (Yokota et al.,2003) we found a significant increase in the expression of PDGF-BmRNA in the diabetic compared to control rat retina following12 weeks of experimental diabetes. This finding is surprising as theloss of capillary pericytes is a specific and early pathological findingin diabetic retinopathy (Cogan et al., 1961) and PDGF has beenshown to be a potent survival factor for pericytes in the mouseretina (Hammes et al., 2002). A study in the diabetic mouse retinahas reported a significant decrease in PDGF-B mRNA expressionwith no change in the PDGF-a or PDGF-b receptors (Cox et al.,2003). In the present study, the consequences of an increasedPDGF-B gene expression during STZ-induced diabetes on the retinaremain unclear; we found no correlation between an increase inPDGF-B mRNA and ganglion cell dysfunction.
Diabetic neuropathy has been widely studied in experimentaldiabetes (Said, 2007), however little is known about alterations tothe gross structure of the optic nerve in STZ-induced diabetes. Inthe present study we report a significant decrease (9%) in nervefascicle area and myelin sheath thickness (12%), and a significantincrease in the percentage of connective tissue (52%) and bloodvessels (69%) in diabetic rats compared to controls. Our findingsconfirm previous studies that have shown an increase in thepercentage of connective tissue and blood vessels (Scott et al., 1986)and a reduction in myelin thickness (Ino-ue et al., 1998a, b),however they do not confirm reports of a reduction in axonaldiameter (Ino-ue et al., 1998a, b) in the rat optic nerve. Studies byIno-ue et al. (1998a, b) demonstrate that changes in the optic nervewere reversed using aminoguanidine (Ino-ue et al., 1998a), aninhibitor of advanced glycation end products (AGEs) and aldosereductase inhibitors (Ino-ue et al., 1998b), which can improvepolyol metabolism, suggesting that AGEs/oxidative stress and
polyol pathway metabolism may be involved in optic nervechanges. In the present study, alterations in optic nerve structurewere not correlated with ganglion cell dysfunction, which arguesthat the locus of ganglion cell dysfunction after 12 weeks ofSTZ-induced diabetes might occur at the level of the retina.
Ganglion cell dysfunction could also result from changes toaxonal transport mechanisms in the optic nerve of STZ-induceddiabetic rats. Studies have shown that anterograde (Chihara et al.,1982) and retrograde (Ino-Ue et al., 2000; Zhang et al., 2000)transport mechanisms are impaired in the optic nerve of diabeticrats. Interestingly, impaired optic nerve retrograde transport isthought to result in ganglion cell damage in glaucoma (Quigley,1999). The presence of ganglion cell dysfunction in diabetic eyesmight suggest that this condition shares common characteristicswith glaucoma (Nakamura et al., 2005), which is supported byepidemiological observations that diabetes significantly increasesthe risk of glaucoma (Mitchell et al., 1997). Studies have alsoreported a reduction in the retrograde axonal transport of NGF(Jakobsen et al., 1981) and a decrease in endogenous NGF content inperipheral sensory neuron target tissues in diabetic rats (Hellwegand Hartung, 1990). Thus, a lack of neurotrophic support may alsocontribute to the ganglion cell dysfunction reported in the presentstudy. Future studies to examine the expression of NGF protein andmRNA in the diabetic retina are planned.
We show that STZ-induced diabetes has a greater effect on theganglion cell pSTR than other ERG components. In the retina, therewas no difference in retinal thickness, ganglion cell number organglion cell somal area. Gene expression analysis revealed anincrease in the level of CTGF, TGFb-r2 and PDGF. Ganglion celldysfunction, but not other ERG parameters, was associated withincreased CTGF and TGFb-r2. In the optic nerve, reduced nervefascicle area, reduced myelin sheath thickness and increasedpercentage of blood vessels and connective tissue were observed.Changes in optic nerve structure were not correlated with
Fig. 4. STZ-induced diabetes altered the expression of retinal growth factors/cytokines and receptors. A. Data show mean (�SEM) fold increase for control (unfilled, n ¼ 10) anddiabetic rats (filled, n ¼ 9). CTGF: connective tissue growth factor, PDGF-B: platelet-derived growth factor B, TGFb1: transforming growth factor beta 1, TGFb-r2: transforminggrowth factor beta, type 2 receptor. *P < 0.035 (t-test). B. Association between CTGF expression and pSTR amplitude determined using a Demings regression for both control(unfilled) and diabetic (filled) rats. P-values derived from the Demings regression taking into account variability in both functional and anatomical parameters. The r-valuesrepresent goodness-of-fit estimate from a Spearman correlation. The relationship is more modest when only diabetic animals are correlated (r ¼ 0.58). C. TGFb-r2 is compared withamplitude energy-response function slope, with a steeper slope reflecting a selective loss of amplitude at dim light levels. The relationship is more modest when only diabeticanimals are correlated (r ¼ 0.52).
B.V. Bui et al. / Experimental Eye Research 88 (2009) 1076–10831082
Author's personal copy
dysfunction suggesting that after 12 weeks of STZ-induced diabetesthe locus of ganglion cell dysfunction may be at the level of the retina.
Acknowledgements
The authors wish to thank Ms Kathryn Munro for her assistancewith retinal and optic nerve processing and Dr Belinda Davis for herhelp with PCR analysis. This study was funded by Diabetes AustraliaResearch Trust Grant (M. Tolcos). B.V. Bui is supported by NHMRCgrant 400127.
References
Asnaghi, V., Gerhardinger, C., Hoehn, T., Adeboje, A., Lorenzi, M., 2003. A role for thepolyol pathway in the early neuroretinal apoptosis and glial changes induced bydiabetes in the rat. Diabetes 52, 506–511.
Barber, A.J., Lieth, E., Khin, S.A., Antonetti, D.A., Buchanan, A.G., Gardner, T.W., 1998.Neural apoptosis in the retina during experimental and human diabetes. Earlyonset and effect of insulin. J. Clin. Invest 102, 783–791.
Bearse Jr., M.A., Han, Y., Schneck, M.E., Adams, A.J., 2004. Retinal function in normaland diabetic eyes mapped with the slow flash multifocal electroretinogram.Invest. Ophthalmol. Vis. Sci. 45, 296–304.
Bui, B.V., Fortune, B., 2004. Ganglion cell contributions to the rat full-field elec-troretinogram. J. Physiol 555, 153–173.
Chihara, E., Sakugawa, M., Entani, S., 1982. Reduced protein synthesis in diabeticretina and secondary reduction of slow axonal transport. Brain Res. 250, 363–366.
Cox, O.T., Simpson, D.A., Stitt, A.W., Gardiner, T.A., 2003. Sources of PDGF expressionin murine retina and the effect of short-term diabetes. Mol. Vis 9, 665–672.
Dityatev, A., Frischknecht, R., Seidenbecher, C.I., 2006. Extracellular matrix andsynaptic functions. Results Probl. Cell Differ 43, 69–97.
Frishman, L.J., Steinberg, R.H., 1989. Light-evoked increases in [Kþ]o in proximalportion of the dark-adapted cat retina. J. Neurophysiol 61, 1233–1243.
Gastinger, M.J., Kunselman, A.R., Conboy, E.E., Bronson, S.K., Barber, A.J., 2008.Dendrite remodeling and other abnormalities in the retinal ganglion cells ofIns2 Akita diabetic mice. Invest. Ophthalmol. Vis. Sci. 49, 2635–2642.
Grotendorst, G.R., 1997. Connective tissue growth factor: a mediator of TGF-betaaction on fibroblasts. Cytokine Growth Factor Rev. 8, 171–179.
Hammes, H.P., Federoff, H.J., Brownlee, M., 1995. Nerve growth factor prevents bothneuroretinal programmed cell death and capillary pathology in experimentaldiabetes. Mol. Med 1, 527–534.
Hancock, H.A., Kraft, T.W., 2004. Oscillatory potential analysis and ERGs of normaland diabetic rats. Invest. Ophthalmol. Vis. Sci. 45, 1002–1008.
Hellweg, R., Hartung, H.D., 1990. Endogenous levels of nerve growth factor (NGF)are altered in experimental diabetes mellitus: a possible role for NGF in thepathogenesis of diabetic neuropathy. J. Neurosci. Res. 26, 258–267.
Hood, D.C., Birch, D.G., 1990. A quantitative measure of the electrical activity ofhuman rod photoreceptors using electroretinography. Vis. Neurosci 5, 379–387.
Hood, D.C., Birch, D.G., 1992. A computational model of the amplitude and implicittime of the b-wave of the human ERG. Vis. Neurosci 8, 107–126.
Ino-ue, M., Ohgiya, N., Yamamoto, M., 1998a. Effect of aminoguanidine on opticnerve involvement in experimental diabetic rats. Brain Res. 800, 319–322.
Ino-ue, M., Yokogawa, H., Yamamoto, M., Naka, H., Kuriyama, H., 1998b. Structuralimpairments in optic nerve of diabetic rats ameliorated with the aldosereductase inhibitor. Exp. Eye Res. 66, 397–401.
Ino-Ue, M., Zhang, L., Naka, H., Kuriyama, H., Yamamoto, M., 2000. Polyol metab-olism of retrograde axonal transport in diabetic rat large optic nerve fiber.Invest. Ophthalmol. Vis. Sci. 41, 4055–4058.
Jakobsen, J., Brimijoin, S., Skau, K., Sidenius, P., Wells, D., 1981. Retrograde axonaltransport of transmitter enzymes, fucose-labeled protein, and nerve growthfactor in streptozotocin-diabetic rats. Diabetes 30, 797–803.
Kanamori, A., Nakamura, M., Mukuno, H., Maeda, H., Negi, A., 2004. Diabetes has anadditive effect on neural apoptosis in rat retina with chronically elevatedintraocular pressure. Curr. Eye Res. 28, 47–54.
Kern, T.S., Barber, A.J., 2008. Retinal ganglion cells in diabetes. J. Physiol 586,4401–4408.
Kowluru, A., Kowluru, R.A., Yamazaki, A., 1992. Functional alterations of G-proteinsin diabetic rat retina: a possible explanation for the early visual abnormalitiesin diabetes mellitus. Diabetologia 35, 624–631.
Kozaki, K., Vingrys, A.J., Bui, B.V., 2008. Early inner retinal dysfunction in streptozotocininduced diabetic rats. Invest. Ophthalmol. Vis. Sci, 08–1679. DOI:10.1167/iovs.
Kuiper, E.J., Witmer, A.N., Klaassen, I., Oliver, N., Goldschmeding, R.,Schlingemann, R.O., 2004. Differential expression of connective tissue growth
factor in microglia and pericytes in the human diabetic retina. Br. J. Ophthalmol88, 1082–1087.
Lieth, E., Gardner, T.W., Barber, A.J., Antonetti, D.A., 2000. Retinal neurodegeneration:early pathology in diabetes. Clin. Experiment Ophthalmol 28, 3–8.
Loeliger, M., Duncan, J., Louey, S., Cock, M., Harding, R., Rees, S., 2005. Fetalgrowth restriction induced by chronic placental insufficiency has long-termeffects on the retina but not the optic nerve. Invest. Ophthalmol. Vis. Sci. 46,3300–3308.
Loeliger, M., Duncan, J., Cock, M., Harding, R., Rees, S., 2007. Vulnerability ofdopaminergic amacrine cells and optic nerve myelination to prenatal endotoxinexposure. Invest. Ophthalmol. Vis. Sci. 48, 472–478.
Meyer-Rusenberg, B., Pavlidis, M., Stupp, T., Thanos, S., 2007. Pathological changes inhuman retinal ganglion cells associated with diabetic and hypertensive reti-nopathy. Graefes Arch. Clin. Exp. Ophthalmol 245, 1009–1018.
Mitchell, P., Smith, W., Chey, T., Healey, P.R., 1997. Open-angle glaucoma and dia-betes: the Blue Mountains eye study, Australia. Ophthalmology 104, 712–718.
Nakamura, M., Kanamori, A., Negi, A., 2005. Diabetes mellitus as a risk factor forglaucomatous optic neuropathy. Ophthalmologica 219, 1–10.
Pascal, M.M., Forrester, J.V., Knott, R.M., 1999. Glucose-mediated regulation oftransforming growth factor-beta (TGF-beta) and TGF-beta receptors in humanretinal endothelial cells. Curr. Eye Res. 19, 162–170.
Phipps, J.A., Fletcher, E.L., Vingrys, A.J., 2004. Paired-flash identification of rod andcone dysfunction in the diabetic rat. Invest. Ophthalmol. Vis. Sci. 45, 4592–4600.
Phipps, J.A., Yee, P., Fletcher, E.L., Vingrys, A.J., 2006. Rod photoreceptor dysfunctionin diabetes: activation, deactivation, and dark adaptation. Invest. Ophthalmol.Vis. Sci. 47, 3187–3194.
Qin, Y., Xu, G., Wang, W., 2006. Dendritic abnormalities in retinal ganglion cells ofthree-month diabetic rats. Curr. Eye Res. 31, 967–974.
Quigley, H.A., 1999. Neuronal death in glaucoma. Prog. Retin. Eye Res. 18, 39–57.Ramsey, D.J., Ripps, H., Qian, H., 2006. An electrophysiological study of retinal
function in the diabetic female rat. Invest. Ophthalmol. Vis. Sci. 47, 5116–5124.Robson, J.G., Frishman, L.J., 1995. Response linearity and kinetics of the cat retina:
the bipolar cell component of the dark-adapted electroretinogram. Vis. Neu-rosci 12, 837–850.
Said, G., 2007. Diabetic neuropathyda review. Nat. Clin. Pract. Neurol 3, 331–340.Scott, T.M., Foote, J., Peat, B., Galway, G., 1986. Vascular and neural changes in the rat
optic nerve following induction of diabetes with streptozotocin. J. Anat 144,145–152.
Seigel, G.M., Lupien, S.B., Campbell, L.M., Ishii, D.N., 2006. Systemic IGF-I treat-ment inhibits cell death in diabetic rat retina. J. Diabetes Complications 20,196–204.
Shirao, Y., Kawasaki, K., 1998. Electrical responses from diabetic retina. Prog. Retin.Eye Res. 17, 59–76.
Takahashi, H., Chibara, E., 2007. Impact of diabetic retinopathy on quantitativeretinalnerve fiber layer measurement and glaucoma screening. Invest. Oph-thalmol. Vis. Sci. 49, 687–692.
Tikellis, C., Johnston, C.I., Forbes, J.M., Burns, W.C., Burrell, L.M., Risvanis, J.,Copper, M.E., 2003. Characterization of renal Angiotensin-converting enzyme 2in diabetic nephropathy. Hypertension 41, 392–397.
Tikellis, C., Cooper, M.E., Twigg, S.M., Burns, W.C., Tolcos, M., 2004. Connective tissuegrowth factor is up-regulated in the diabetic retina: amelioration by angio-tensin-converting enzyme inhibition. Endocrinology 145, 860–866.
VanGuilder, H.D., Brucklacher, R.M., Patel, K., Ellis, R.W., Freeman, W.M., Barber, A.J.,2008. Diabetes downregulates presynaptic proteins and reduces basal synapsinI phosphorylation in rat retina. Eur. J. Neurosci 28, 1–11.
Wyllie, A.H., Kerr, J.F., Currie, A.R., 1980. Cell death: the significance of apoptosis. Int.Rev. Cytol 68, 251–306.
Yamamoto, C., Ogata, N., Yi, X., Takahashi, K., Miyashiro, M., Yamada, H., Uyama, M.,Matsuzaki, K., 1998. Immunolocalization of transforming growth factor betaduring wound repair in rat retina after laser photocoagulation. Graefes Arch.Clin. Exp. Ophthalmol 236, 41–46.
Yamanaka, R., Ogata, N., Yamamoto, C., Matsushita, M., Matsuzaki, K., Uyama, M.,Matsumura, M., 2002. Expression of transforming growth factor-beta receptorsin normal rat retina and experimental choroidal neovascularization. Jpn.J. Ophthalmol 46, 525–532.
Yokota, T., Ma, R.C., Park, J.Y., Isshiki, K., Sotiropoulos, K.B., Rauniyar, R.K.,Bornfeldt, K.E., King, G.L., 2003. Role of protein kinase C on the expression ofplatelet-derived growth factor and endothelin-1 in the retina of diabetic ratsand cultured retinal capillary pericytes. Diabetes 52, 838–845.
Zhang, L., Ino-ue, M., Dong, K., Yamamoto, M., 2000. Retrograde axonal transportimpairment of large- and medium-sized retinal ganglion cells in diabetic rat.Curr. Eye Res. 20, 131–136.
Zhang, J., Wu, Y., Jin, Y., Ji, F., Sinclair, S.H., Luo, Y., Xu, G., Lu, L., Dai, W., Yanoff, M.,Li, W., Xu, G.-T., 2007. Intravitreal injection of erythropoietin protects bothretinal vascular and neuronal cells in early diabetes. Invest. Ophthalmol. Vis. Sci.49, 732–742.
B.V. Bui et al. / Experimental Eye Research 88 (2009) 1076–1083 1083