A Time Varying Parameter Approach to Analyze the Macroeconomic Consequences of Crime
28
A TIME VARYING PARAMETER APPROACH TO ANALYZE THE MACROECONOMIC CONSEQUENCES OF CRIME Claudio Detotto Edoardo Otranto WORKING PAPERS 2010/02 CONTRIBUTI DI RICERCA CRENOS CUEC
Transcript of A Time Varying Parameter Approach to Analyze the Macroeconomic Consequences of Crime

A TIME VARYING PARAMETER APPROACH TO ANALYZE THE
MACROECONOMIC CONSEQUENCES OF CRIME
Claudio Detotto Edoardo Otranto
WORKING PAPERS
2 0 1 0 / 0 2
C O N T R I B U T I D I R I C E R C A C R E N O S
CUEC

C E N T R O R I C E R C H E E C O N O M I C H E N O R D S U D
( C R E N O S ) U N I V E R S I T À D I C A G L I A R I U N I V E R S I T À D I S A S S A R I
I l C R E N o S è u n c e n t r o d i r i c e r c a i s t i t u i t o n e l 1 9 9 3 c h e f a c a p o a l l e U n i v e r s i t à d i C a g l i a r i e S a s s a r i e d è a t t u a l m e n t e d i r e t t o d a S t e f a n o U s a i . I l C R E N o S s i p r o p o n e d i c o n t r i b u i r e a m i g l i o r a r e l e c o n o s c e n z e s u l d i v a r i o e c o n o m i c o t r a a r e e i n t e g r a t e e d i f o r n i r e u t i l i i n d i c a z i o n i d i i n t e r v e n t o . P a r t i c o l a r e a t t e n z i o n e è d e d i c a t a a l r u o l o s v o l t o d a l l e i s t i t u z i o n i , d a l p r o g r e s s o t e c n o l o g i c o e d a l l a d i f f u s i o n e d e l l ’ i n n o v a z i o n e n e l p r o c e s s o d i c o n v e r g e n z a o d i v e r g e n z a t r a a r e e e c o n o m i c h e . I l C R E N o S s i p r o p o n e i n o l t r e d i s t u d i a r e l a c o m p a t i b i l i t à f r a t a l i p r o c e s s i e l a s a l v a g u a r d i a d e l l e r i s o r s e a m b i e n t a l i , s i a g l o b a l i s i a l o c a l i . P e r s v o l g e r e l a s u a a t t i v i t à d i r i c e r c a , i l C R E N o S c o l l a b o r a c o n c e n t r i d i r i c e r c a e u n i v e r s i t à n a z i o n a l i e d i n t e r n a z i o n a l i ; è a t t i v o n e l l ’ o r g a n i z z a r e c o n f e r e n z e a d a l t o c o n t e n u t o s c i e n t i f i c o , s e m i n a r i e a l t r e a t t i v i t à d i n a t u r a f o r m a t i v a ; t i e n e a g g i o r n a t e u n a s e r i e d i b a n c h e d a t i e h a u n a s u a c o l l a n a d i p u b b l i c a z i o n i . w w w . c r e n o s . i t i n f o @ c r e n o s . i t
C R E N O S – C A G L I A R I V I A S A N G I O R G I O 1 2 , I - 0 9 1 0 0 C A G L I A R I , I T A L I A
T E L . + 3 9 - 0 7 0 - 6 7 5 6 4 0 6 ; F A X + 3 9 - 0 7 0 - 6 7 5 6 4 0 2
C R E N O S - S A S S A R I V I A T O R R E T O N D A 3 4 , I - 0 7 1 0 0 S A S S A R I , I T A L I A
T E L . + 3 9 - 0 7 9 - 2 0 1 7 3 0 1 ; F A X + 3 9 - 0 7 9 - 2 0 1 7 3 1 2 T i t o l o : A TIME VARYING PARAMETER APPROACH TO ANALYZE THE MACROECONOMIC CONSEQUENCES OF CRIME I SBN: 978 -88 -84 -67 -569 -9 P r ima Ed i z i one : Febbra io 2010 © CUEC 2010 V i a I s M i r r i o n i s , 1 09123 C a g l i a r i T e l . / F a x 070 291201 w w w . c u e c . i t

A Time Varying Parameter Approach toAnalyze the Macroeconomic
Consequences of Crime
Claudio Detotto, Edoardo OtrantoDEIR and CRENoS,University of Sassari
AbstractCriminal activity performs like a tax on the entire econ-
omy: it discourages domestic and foreign direct investments,it reduces firms’ competitiveness, and reallocates resourcescreating uncertainty and inefficiency. Although the impactof economic variables on crime has been widely investigated,there is not much concern about crime also affecting theoverall economic performance. This work aims to bridgethis gap by presenting an empirical analysis of the macroe-conomic consequences of criminal activity. Italy is the casestudy for the time span 1979-2002. Dealing with a statespace framework, a time varying parameter approach is em-ployed to measure the impact of criminality on real GrossDomestic Product along time, and to measure the asymmet-ric impact in recession and expansion periods. The analysisis completed evaluating the effects of crime fluctuations inthe long period by an impulse response analysis.
Keywords: business cycle, crime, crowding-out effects, economicgrowth, impulse response analysis, Kalman filter.JEL classification: C22, E20, E32, K14.
1

1 IntroductionCrime has a significant impact on the society. On one hand, crim-inal activity allows the consumption of illicit goods or serviceswhich could not otherwise be consumed. On the other hand, crimeimposes great costs to the public and private actors, such as stolenand damaged goods, lost lives, security spending, pain and suf-fering. The estimation of such social cost of crime has becomean important field of study in the last few decades (Czabanski,2008), which shows how crime imposes a significant burden ontosociety. For example, Brand and Price (2000) estimate the totalcrime costs in Wales and England for the Home Office using surveydata. They estimate a total expenditure of 60 billion pounds peryear. Anderson (1999) finds that the total annual cost of criminalactivity in the United States exceeds one trillion dollars. A re-cent work of Detotto and Vannini (2009) evaluates the burden ofa subset of crime offenses in Italy (about 65% of all crime offenses)during the year 2006. The estimated total social cost is more than38 billion euros, which amounts to about 2.6% of Italian GrossDomestic Product (GDP).
Although the identification and the estimation of crime costshave received wide attention in economic literature, the detrimen-tal effect of crime to the (legal) economic activity is still neglected.Crime acts like a tax on the entire economy: it discourages domes-tic and foreign direct investments, reduces the competitiveness offirms, and reallocates resources, creating uncertainty and ineffi-ciency.
A way to measure the crowding out effect of crime is to esti-mate its impact on the economic performance of the country orregion. We can distinguish two approaches (Sandler and Enders,2008). The first approach is to compare the overall economic per-formance of countries or regions with high level of crime to that ofcountries with low levels of crime, controlling for other explanatory
2

variables. This approach descends from the cross-section models ofeconomic growth in which the economic performance is regressedon a number of socio-economic variables (Barro, 1996).
In this framework we can consider the works of Mauro (1995),who shows a significant negative relationship between “subjectivecorruption indices" and the growth rate among 70 countries in theearly 1980s; Forni and Paba (2000), who examine the impact ofseveral socio-economic variables on the economic performance ofthe Italian provinces during the period 1971-1991; Peri (2004),who, using a larger data set (from 1951 to 1991), shows that theannual per capita income growth is negatively affected by murdersafter controlling for other explanatory variables; Cardenas (2007),who focuses on the relationship between crime and growth rate inan unbalanced panel of 65 countries during the period 1971-1999.
This approach allows working with a large amount of infor-mation for the key variables, such as per capita GDP or crimeindexes; on the other hand, this approach is hampered by thedata source problems, the cross-border spillovers effects, and thedynamic effect identification. Moreover, it suffers from the selec-tion of countries (switching regions changes the frequency and theimportance of crimes).
The second framework consists in the univariate and multivari-ate time series methodology. Recently, there have been many con-tributions to this approach, where crime is considered along witheconomic variables. Masih and Masih (1996) estimate the relation-ship between different crime types and their socioeconomic deter-minants within a multivariate cointegrated system for the Aus-tralian case. Narayan and Smyth (2004) implement the Grangercausality tests to examine the relationship among seven differentcrime typologies, unemployment and real wage in Australia withinan AutoRegressive Distributed Lag (ARDL) model. Mauro andCarmeci (2007) empirically explore the link between crime, unem-ployment and economic growth using Italian regional data. Carde-
3

nas (2007) analyzes Colombia’s annual GDP growth between 1951and 2005. Habibullah and Baharom (2009), applying an ARDLmodel to the Malaysian case, analyze the relationship betweenreal gross national product and different crime offences. Recently,Detotto and Pulina (2009) applied an ARDL model to the Ital-ian data (1970 - 2004) to assess the relationship between severalcrime offences, deterrence indicators and economic variables. Chen(2009) implements a Vector AutoRegressive (VAR) model to ex-amine the long-run and causal relationships among unemployment,income and crime in Taiwan.
The time series approach seems to have several advantages interms of interpretability of results and application, because it al-lows the identification of dynamic processes and the forecastinganalysis. Moreover, it does not need to distinguish in advance theendogenous variables from exogenous ones. On the other hand, itneeds a large number of observations (rarely available for crimevariables) to guarantee the robustness of estimators and the per-formance of statistical tests. Furthermore, the choice of the eco-nomic model, in which to insert the crime variable, could affectthe analysis; changing the explicative variables, the effect of crimeon economic growth will change.
To avoid this problem, we propose an autoregressive time se-ries model, in which the GDP variations are explained by its pasthistory and a crime variable; in practice we choose the best modelwhich is able to explain the economic fluctuations and verify if acrime variable could explain more.
Moreover, we allow the variation along the time of the crimecoefficient, using a state space model (see, for example, Harvey,1989). This choice provides the measurement of the magnitude ofthe economic impact of crime on society over time. In addition,this approach can answer more questions than a fixed parametermodel. Firstly, if crime acts as a brake on economic growth, isit for the whole period? Secondly, the evolution of the crime ef-
4

fect, detecting its trends, cycles or break-points can be analyzed.Furthermore, we can answer the following relevant questions: Dothe wider economic distortions depend on the level of criminal ac-tivity? Is there a threshold beyond which any further increase incrime does not carry any wider economic distortions? Or is therea “natural" level of crime, after which the negative effects occur?Does the evolution of the crime distortions display different be-haviors in the different phases of the business cycles? Thus, theanalysis could lead to important policy implications. First, it addsa useful component in evaluating the cost of crime. This aspectwould allow the full understanding of the burden of crime, and thecomparison with other social diseases. Furthermore, the analysismay become a useful tool to calibrate policies for combating crime.Indeed, when implementing a cost-benefit analysis, it may be con-venient to increase the contrast level of crime when the economiccost of crime is greater.
We apply this model to the Italian case, for which a large dataset with monthly frequency (from January 1979 up to September2002) is available. Italy makes an interesting case study not onlybecause it accounts for about one-tenth of all crime offences inthe European Union (source Eurostat), but also, and especially,because Italian crime is historically characterized by a strong inci-dence of organized crime. Mafia, Camorra and ’Ndrangheta, alongwith other minor criminal organizations, strongly affect the eco-nomic performance of much of the country.
The paper is organized as follows. In the next section wepresent our model, which will be applied to the Italian data insection 3. In section 4 we propose an impulse response functionanalysis to evaluate the effects of crime on economy in the longperiod. Some remarks will conclude the paper.
5

2 A state-space model for evaluating the ef-fects of crime on economy
As said in the introduction, to avoid the dependence on the modelspecification and to detect the effect of the crime on the economicgrowth, we propose a pure autoregressive (AR) model, with thevariable representing the crime as the only explicative variable.The model is expressed by:
yt = α0 +k∑
i=1αiyt−i + (β̄ + ξt)ct−h + wt (2.1)
where yt represents the first differences of the logarithms of theGDP at time t, whereas ct−h is the crime variable at time t−h; h isthe lag for which the crime manifests its effect on GDP growth (itis quite reasonable that the impact of crime on economic outputappears with some time delay). The disturbance wt are Normallydistributed with mean 0 and variance σ2; αi (i = 0, 1, . . . , k) areunknown AR coefficients. The coefficient of ct−h can be split in twoparts: the steady state coefficient β̄ and the variation with respectto β̄ at time t, represented by ξt. In other words, the coefficient ofthe crime variable is time-varying, supposing that the crime effectcan vary along the time. Hereafter, we will call this coefficient:
βt = β̄ + ξt
The dynamics of ξt is represented by:
ξt = γξt−1 + vt (2.2)
where vt ∼ N(0, ν2).Equations (2.1) (observation equation) and (2.2) (state equa-
tion) constitute a particular kind of state-space model and can beeasily estimated using the Kalman filter to explicit the likelihood
6
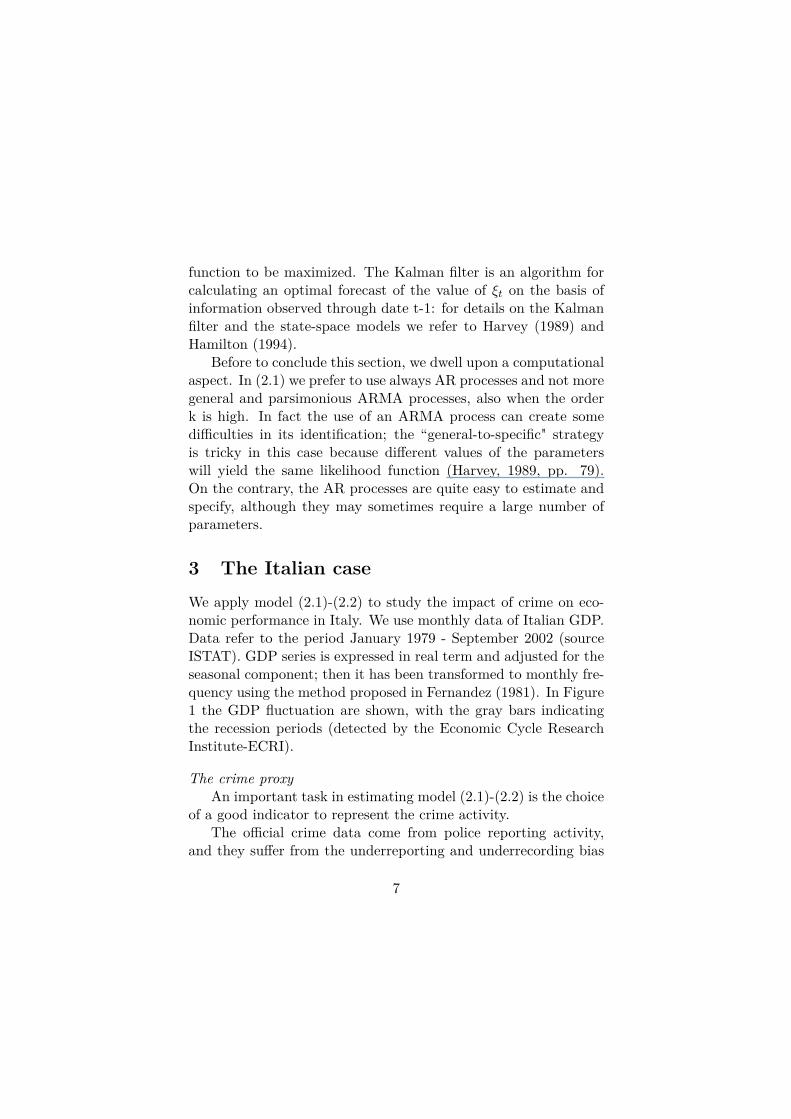
function to be maximized. The Kalman filter is an algorithm forcalculating an optimal forecast of the value of ξt on the basis ofinformation observed through date t-1: for details on the Kalmanfilter and the state-space models we refer to Harvey (1989) andHamilton (1994).
Before to conclude this section, we dwell upon a computationalaspect. In (2.1) we prefer to use always AR processes and not moregeneral and parsimonious ARMA processes, also when the orderk is high. In fact the use of an ARMA process can create somedifficulties in its identification; the “general-to-specific" strategyis tricky in this case because different values of the parameterswill yield the same likelihood function (Harvey, 1989, pp. 79).On the contrary, the AR processes are quite easy to estimate andspecify, although they may sometimes require a large number ofparameters.
3 The Italian caseWe apply model (2.1)-(2.2) to study the impact of crime on eco-nomic performance in Italy. We use monthly data of Italian GDP.Data refer to the period January 1979 - September 2002 (sourceISTAT). GDP series is expressed in real term and adjusted for theseasonal component; then it has been transformed to monthly fre-quency using the method proposed in Fernandez (1981). In Figure1 the GDP fluctuation are shown, with the gray bars indicatingthe recession periods (detected by the Economic Cycle ResearchInstitute-ECRI).
The crime proxyAn important task in estimating model (2.1)-(2.2) is the choice
of a good indicator to represent the crime activity.The official crime data come from police reporting activity,
and they suffer from the underreporting and underrecording bias
7

(Mauro and Carmeci, 2007). In other words, official data repre-sent only the tip of the crime iceberg. Moreover, in long periodanalysis we have to take into account the changes in reporting thatcome from technical innovations, police efficiency, depenalisationor, conversely, law intervention. Hence, we need a crime index thatis sufficiently well reported by Police and has the same definitionfor all period considered.
Following Forni and Paba (2000), Cardenas (2007) and Mauroand Carmeci (2007), the number of recorded committed inten-tional homicides are used here as the crime activity indicator. Thehomicide rates are chosen for their highest reliability among allcrime variables. Besides, a number of murder events are causedby mafia activity. In this sense, homicide incidents can be inter-preted as a roughly indicator of organized crime activity.
Figure 2 shows the plot of the monthly totals of intentionalhomicides and the total crime offences over the 1979 through 2002period. Notice that the two series track each other sufficientlywell.
Table 1 shows the correlation statistics of murder series withthe time series of the main crime offenses, namely robberies, drugoffenses, fraud and total crime. The homicide rates appear to bewell correlated to the other crime offenses, especially to the totalcrime offenses (the correlation coefficient is 0.60), the drug offenses(0.64) and the robberies (0.62).
Preliminary analysisDealing with stationary processes, before estimating the model,
we investigate the integration properties of the series LGDP (log-arithm of GDP) and LHOM (logarithm of homicide rates) usingthe usual unit root tests. In particular, we have applied the Aug-mented Dickey Fuller (ADF), Kwiatkowski-Phillips-Schmidt-Shin(KPSS) and Phillips Perron (PP) tests. The results are shown inTable 2. LGDP is found to be stationary in the first difference,
8

whereas the unit root tests for LHOM seem to be inconclusive.The PP test indicates LHOM is stationary, while ADF and KPSStest cannot reject the null hypothesis of unit root. It is impor-tant to note that the presence of a shift in the level of the seriescan reduce the power of the unit root tests if the shift is ignored(Lanne et al., 2002). More precisely, the unit root tests “are biasedtoward the nonrejection of a unit root" (Enders, 1995, p. 243).Featuring a break date in September 1990, the series is dividedin two parts and we perform the unit root tests in each portion.Both components seem to be stationary, even if “the power of thistests is reduced due to the smaller sample sizes" (Kirchgässner andWolters (2008), p. 176). Hence, we test the presence of a struc-tural break in the series, identified using the procedure proposedby Lanne et al. (2001); then we apply the modified ADF (MADF)test, as proposed by Saikkonen and Lütkepohl (2002) and Lanneet al. (2002).
As described in the last row of Table 3, the unit root test with alevel shift is performed. The unit root statistic test is -3.136, thatallows us to refuse the null hypothesis of absence of stationarityat 5% level. The critical values used here are tabulated in Lanneet al. (2002).
The previous analysis suggests to use, in (2.1)-(2.2), the dif-ferences of the logs of GDP as yt and the logs of the homicidesas ct. Moreover the presence of a break date in September 1990supports the use of a time varying parameter model.1 In fact, aspointed out by Harvey (1989, p. 308), when a model is subject toa change of regime, a time varying parameter model can be moreappropriate.
The last step we need to estimate model (2.1)-(2.2) is the choiceof the lag h with which the crime variable has effect on the real
1The presence of a structural change in September 1990 is confirmed by aclassical Chow test applied on a linear autoregressive model.
9

GDP variations. Following Enders et al. (1992) approach, we havetested different period lags for LHOM, and the model with h = 3is found to be the best fitting model in terms of BIC.
Estimation and validation of the modelThe model identified in the previous subsection is applied to
study the effect of crime on the economy in Italy, using the differ-ences of the logs of GDP as yt and the logs of the homicides as ct
and h = 3. The autoregressive order k was selected using a BICcriterion on a linear model (2.1) with ξt = 0 for every t.2 Thisprocedure provides k = 14.
The maximization of the likelihood was performed using theBerndt, Hall, Hall, Hausman (BHHH) optimization algorithm. Animportant computational task is constituted by the choice of start-ing points of the Kalman filter recursion. Clearly, the numericaloptimization methods work better if the starting values are chosenfrom a close neighborhood of their true vales (Zivot et al., 2004,p. 32). Unfortunately, how to identify an appropriate startingvalue for the unknown parameters of a state space model is stillan open question in literature. Following Hamilton’s (1994, p.3057) approach, the OLS estimates are used as starting values ofα0, . . . , α14 and β̄. Then, we impose the starting values of σ2 andν2 equal to one. For what concerns the γ coefficient, we do nothave any ex-ante information about this value; we use a simplegrid approach with 0.01 increase in the parameter and we selectthe model in correspondence of the minimum value of BIC.
Table 3 reports the estimated coefficients of our state spacemodel and some diagnostic statistics. The Ljung-Box statisticshows a clear evidence in favor of the hypothesis of no autocor-relation. Also, the goodness of fitting and prediction of the timevarying parameters model and the fixed parameters model are eval-uated. The RMSE (root mean square errors) of the one-step ahead
2The linear model explains the 92.6% of the variance of yt.
10

forecasts in-sample and out-of-sample prediction is calculated inboth models (bottom of Table 3). The in-sample forecasting eval-uates the goodness of fit of the model in the full data set, while theout-of-sample forecasting indicates the ability of a given model topredict future values.3 The RMSEs are compared with respect tothe RMSEs of the corresponding linear model without time vary-ing parameters; we can note that they are fewer in the case oftime varying parameters model, especially for the out-of-sampleforecasts, and the modified Diebold-Mariano test (Harvey et al.,1997) rejects the null hypothesis of equal RMSE. Hence, we canconclude that the time varying parameters model performs betterthan the fixed parameters model.
The crime effectOur interest mainly concerns the coefficients of crime. The
coefficient β̄ yields -0.040, whereas the γ parameter of the stateequation is equal to 0.89, that indicates a certain persistence ofthe crime coefficient.
Figure 3 shows the evolution of the smoothed estimation ofβt.4 The coefficient varies with a cyclical behavior around themean value β̄. The impact of homicides rates on real GDP growthin absolute term is remarkably high in two periods (1980-1983and 1992-1994) with a maximum in September 1992. Each βt issignificantly different from zero with high probability.
Interestingly, βt is quite lowly correlated to the homicide rates(r = -0.11). This fact implies that the evolution of the crime effectcannot be explained by the crime trend, but it seems to follow aspecific cycle. Moreover, this result, along with the low values of
3We have re-estimated the model excluding the last 21 observations, whichare used to compare the forecasts.
4The smoothed estimation is a by-product of the Kalman filter, which pro-vides the estimation of the parameter conditional on the full information avail-able.
11

βt, suggests that the economic costs of crime have a strong fixedcomponent.
Remarkably, the impact of crime on real GDP growth seemsto be more relevant during the recessions than the expansion pe-riods. The average value of βt is -0.039 during expansions, and-0.041 during recessions. Notably, the ANOVA F-test (=357.67)and the Welch F-test (=449.52) for equality of means between thetwo categories, are significant at one-percent level. This is reason-able if we consider that the crime activity imposes a cost to thelegal activity, and such a cost could be heavier during contractionregime. In other words, crime affects more when the economicgrowth slows down because they divert resources needed for eco-nomic recovery. Moreover, the marginal economic costs have thehighest dependency on crime level during slump: calculating thecorrelation coefficient between βt and the murder rate, it is notsignificantly different from zero for the overall period and duringexpansion, whereas it is significant at 1% size (and equal to -0.346)during recession. In other words, changes in crime rates are per-ceived better when the economy is slowing, conditioning its growthopportunities.
During recessions the economic costs are, on average, 5% morethan during expansions. During a recession, one percent increasein crime activity leads, on average, to a reduction of monthly eco-nomic growth by 0.00041%. In monetary values, it accounts forabout half a million of euros (base-year = 2006).
4 Long run crime effectsThe results illustrated before constitute a kind of short-run ef-fect. Following Enders (1995, pp. 277-290), the impulse responsefunction (IRF) is implemented to simulate the long-run effect of aone-percent shock in monthly crime.
12

In order to implement the IRF, we have to test for the exogene-ity between the homicide rates and GDP growth. If the murderrate is not exogenous, one shock in murders series would impactthe economic growth, which in turn affects the homicide rate. Inthis way, the impulse response analysis should be performed witha dynamic system of equations to capture the effect in both di-rections. Why would the homicide variable be endogenous? Asshown in the previous section, murder rates are correlated to sev-eral types of crime offenses, such as burglaries or frauds. On onehand, it is reasonable to expect that an increase in criminal activ-ity raises, directly or indirectly, the homicide rates, by increasingopportunities that may lead to the occurrence of murders. On theother hand, a vast literature shows how crime rates depend on thebusiness cycle. Hence, the economic growth may impact, althoughindirectly, the homicide rate. In order to establish the exogene-ity of homicide rates, a Granger causality test is implemented andthe statistic test is not significant at 5% level (F-statistic = 0.606).The null hypothesis is the absence of Granger causality, which im-plies the strong exogeneity of the variable of interest (Maddala,1992, pp.325-331). The null hypothesis cannot be rejected: DL-GDP does not Granger-cause LHOM, so the homicide rate doesnot seem to respond to variation of real economic growth. Moreevidence for exogeneity can be obtained applying the Hausmantest.
A version of the Hausman test proposed by Davidson andMacKinnon (1989, 1993) is used. In practice two OLS regres-sions are run. In the first regression, the variable suspected to beendogenous, namely homicides, is regressed on all exogenous vari-ables and the instrument, and the residuals are retrieved; then inthe second regression, the original (linear) model is re-estimatedincluding the residuals from the first regression as additional re-gressors.
Finding an instrument variable for homicide rates is not triv-
13

ial. Murder is a type of violent crime whose determinants can bedivided into two groups. On one hand, as explained earlier, theeconomic variables, such as business cycle, employment rate andincome distribution, directly or indirectly affect the murder rate.On the other hand, socio-demographic variables, such as culturalaspects, urbanization, modernization, demographic structure, playa significant role in explaining the rate of homicides. Then, ourgoal is to identify an instrumental variable that depends mostlyfrom socio-cultural variable instead of economic ones. Obviously,it is known that the economic and socio-cultural variables affecteach other, but we expect that they need a long period of time sothat the effect takes place.
After analyzing all crime cases, the sex assault rate was cho-sen; this offense is largely related to cultural aspect and socialphenomena, such as the role of women in society, urbanizationand civilization, and it does not seem to be correlated with theeconomic cycle in the short run. The correlation between the sea-sonally adjusted series of sex assaults and murders is sufficientlyhigh (0.58), while the one between sex assault and GDP growthrates is low (-0.10). Moreover, the correlation between the in-strumental variable and the residuals of the linear model is notsignificantly different from zero.
Sex assaults seem to offer a good instrument for murder rate;hence, the Hausman test can be implemented. In the first stage,the coefficient of the instrumental variable, namely the three monthlagged sex assaults, is significant. In the second step, the coeffi-cient on the first stage residuals is not significantly different fromzero. This result indicates that we could not reject the null hy-pothesis of exogeneity of homicide variable.
Hence, treating the homicide rate as an exogenous variable, weimplement the impulse response function as in Enders (1992). AsFigure 4 shows, after a three-period delay, GDP growth declinesand then returns to its initial value in a few months. Discounting
14

all subsequent GDP losses, it is possible to evaluate the cumula-tive value of a one percent crime shock, for recession and growthperiods separately. During recession (expansion) times, a rise incrime by 1% causes, on average, a reduction of GDP growth ofabout 2.6 million euros (2.4 million euros). In practice, the longrun crime costs are 5% higher during recession than expansion.
5 RemarksWe have proposed a state space model to analyze the effects ofcrime on economic growth and we have applied this methodologyto the Italian data. The model seems able to answer several ques-tions, that are relevant in the study of the effects of criminality oneconomy. We recall the questions made in section 1, and resumethe findings emerging from our study:
1. If crime acts as a brake on economic growth, is it for thewhole period? The results confirm that crime negatively im-pacts the economic performance; this may happen throughseveral channels: crime discourages investments, reduces thecompetitiveness of the firms, and reallocates resources creat-ing uncertainty and inefficiency. Our model shows that theentire sample period is affected by an economic cost, whichcan be deduced by Figure 3. On average, a rise in crimerates by 1% reduces the real economic growth by 0.00040%in a month. Furthermore, the findings suggests that theeconomic costs of crime exhibit a very significant fixed com-ponent.
2. Does the wider economic distortions depend on the level ofcriminal activity? We have shown that the correlation be-tween the time-varying effect of the crime and the murderrate is not significantly different from zero, so it seems that
15

there is no relationship between the marginal impact of crimeand its level.
3. Is there a threshold beyond which any further increase incrime does not carry any wider economic distortions? Oris there a “natural" level of crime, after which the negativeeffects occur? Figure 3 shows that the dynamics of theeconomic cost of crime is time-varying but always significant.Hence, it seems that there is not a threshold value.
4. Does the evolution of the crime distortions display differentbehaviors in the different phases of the business cycles? Weshow that the wider economic distortions of crime are notconstant over time and have an asymmetric effect in growthand recession periods. Specifically, the negative impact ofcrime on Italian economic performance is 5% stronger dur-ing recession than expansion periods. Moreover, through theIRF analysis, we have obtained that, during economic con-tractions, a one percent increase in crime rates causes, on av-erage, a reduction in the real economic growth by 0.00041%in a month and by 0.0022% in a year, which is equal to 0.5and 28 million of euros, respectively.
Finally, the analysis seems to suggest the presence of a cyclicalcomponent in the crime effects, strictly related to the economicbusiness cycle. It would be interesting for future research to in-vestigate this aspect.
AcknowledgementsWe are grateful to Juan de Dios Tena Horrillo and the participantsof the Workshop on “Applied analysis of crime: Implications forcost-effective criminal justice policies", held in Porto Conte (Italy)
16

in 26 October 2009, for the useful comments. Financial supportfrom Italian MIUR under grant 2006137221_001 is gratefully ac-knowledged.
References[1] Anderson, D.A. (1999): The aggregate burden of crime. Jour-
nal of Law and Economics 42, 611-642.
[2] Barro, R.J. (1996): Democracy and Growth. Journal of Eco-nomic Growth 1, 1-27.
[3] Brand, S., Price, R. (2000): The economic and social costsof crime. Home Office Research Study n.217, Home Office,London (UK).
[4] Cardenas, M. (2007): Economic growth in Colombia: a rever-sal of fortune? Ensayos Sobre Politica Economica 25, 220-259.
[5] Chen, S.W. (2009); Investigating causality among unemploy-ment, income and crime in Taiwan: evidence from the boundstest approach. Journal of Chinese Economics and BusinessStudies 7, 115-125.
[6] Czabanski, J. (2008): Estimates of cost of crime: history,methodologies, and implications. Berlin: Springer.
[7] Davidson, R. and MacKinnon, J.G. (1989): Testing for con-sistency using artificial regressions. Econometric Theory 5,363-384.
[8] Davidson, R. and MacKinnon, J.G. (1993): Estimation andinference in econometrics. Oxford: University Press.
[9] Detotto, C., Pulina, M. (2009). Does more crime mean fewerjobs? An ARDL model. Working Paper CRENoS 2009/05.
17

[10] Detotto, C., Vannini, M. (2009): Counting the cost of crimein Italy. Workshop on Applied analyses of crime: Implica-tions for cost-effective criminal justice policies, Porto ConteRicerche 26 October 2009.
[11] Enders, W., Sandler, T. and Parise, G.F. (1992): An econo-metric analysis of the impact of terrorism on tourism. Kyklos,International Review for Social Sciences 45, 531-554.
[12] Enders, W. (1995): Applied econometric time series. NewYork: John Wiley & Sons, Inc.
[13] Fernandez, R.B. (1981): A methodological note on the esti-mation of time series. Review of Economics and Statistics 63:471-478.
[14] Forni, M., Paba, S. (2000): The sources of local growth: Evi-dence from Italy. Giornale degli Economisti, Annali di Econo-mia, 59: 1-49.
[15] Habibullah, M.S., Baharom, A.H. (2009): Crime and eco-nomic conditions in Malaysia. International Journal of SocialEconomics 36, 1071-1081.
[16] Hamilton, J.D. (1994): State space models. In Engle, R.F.and McFadden, D.L. (eds.) Handbook of Econometrics 2, Am-sterdam: North Holland, Vol. 4: 3039-3080.
[17] Harvey, A.C. (1989): Forecasting, structural time series mod-els and the Kalman filter. Cambridge: Cambridge UniversityPress.
[18] Harvey, D., Leybourne, S., Newbold, P. (1997): Testingthe equality of prediction mean squared errors. InternationalJournal of Forecasting 13, 281-291.
18

[19] Kirchgässner, G. and Wolters, J. (2008): Introduction to mod-ern time series analysis. Berlin: Springer.
[20] Lanne, M., Lütkepohl, H., Saikkonen, P. (2001): Test proce-dures for unit roots in time series with level shifts at unknowntime. Oxford Bulletin of Economics and Statistics 65, 91-115.
[21] Lanne, M., Lütkepohl, H. and Saikkonen, P. (2002): Compar-ison of unit root tests for time series with level shifts. Journalof Time Series Analysis 23, 667-685.
[22] MacKinnon, J.G. (1996): Numerical Distribution Functionsfor Unit Root and Cointegration Tests. Journal of AppliedEconometrics 11, 601-618.
[23] Maddala, G.S. (1992): Introduction to econometrics NewYork: MacMillan.
[24] Masih, A.M.M., Masih, R. (1996): Temporal causality andthe dynamics of different categories of crime and their so-cioeconomic determinants: evidence from Australia. AppliedEconomics 28, 1093-1104.
[25] Mauro, P. (1995): Corruption and Growth. The QuarterlyJournal of Economics 110, 681-712.
[26] Mauro, L., Carmeci, G. (2007): A poverty trap of crime andunemployment. Review of Development Economics 11, 450-462.
[27] Narayan, P.K., Smyth, R. (2004): Crime rates, male youthunemployment and real income in Australia: evidence fromGranger causality tests. Applied Economics 36, 2079-2095.
[28] Peri, G. (2004): Socio-cultural variables and economic suc-cess: evidence from Italian provinces 1951-1991. Topics inMacroeconomics 4, 1-34.
19

[29] Phillips, P.C. and Perron, P. (1988): Testing for a unit rootin time series regression. Biometrika 75, 335-346.
[30] Saikkonen, P. and Lütkepohl, H. (2002): Testing for a unitroot in a time series with a level shift at unknown time. Econo-metric Theory 18, 313-348.
[31] Sandler, T., Enders, W. (2008): Economic consequencesof terrorism in developed and developing countries: Anoverview. In Keefer, P. and Loayza, N. (eds.) Terrorism,Economic Development and Political Openness. Cambridge:Cambridge University Press.
[32] Zivot, E., Wang, J., Koopman, S.J. (2004): State spacemodelling in macroeconomics and finance using SsfPack inS+Finmetrics. In Harvey A., Koopman, S.J., Shephard, N.(eds) State space and unobserved component models: The-ory and application. Cambridge: Cambridge University Press,284-335.
20

Table 1: Correlation of some crime variables (sample period: January 1979- September 2002)Total Homicides Drug offences Thefts Robberies Fraud
Total 1Homicides 0.603 1
Drug offences 0.702 0.640 1Thefts 0.887 0.593 0.526 1
Robberies 0.710 0.625 0.697 0.593 1Fraud 0.758 0.423 0.567 0.526 0.535 1
Table 2: Unit root testsVariable ADF lags KPSS lags PP lags Period MADF lags
LGDP -2.053 11 0.274*** 14 -1.552 2 1/79-9/02DLGDP -3.451** 10 0.221 3 -4.825*** 71 1/79-9/02LHOM -2.072 5 0.159** 13 -12.242*** 11 1/79-9/02LHOM -2.872* 3 0.25 8 -8.566*** 7 1/79-8/90LHOM -9.827*** 0 0.415* 7 -10.346*** 6 9/90-9/02LHOM 1/79-9/02 -3.136** 5
Notes: (1) All critical values for rejection of null hypothesis of a unit root are tabulated in MacKinnon (1996), except thecritical values of URSB, which are tabulated in Lanne et al. (2002); (2)***, ** and * indicate statistical significance at the1%, 5% and 10%, respectively; (3) D denotes the first difference operator; (4) The number of lags in ADF and URSB testsare set upon BIC criterion, in KPSS and PP tests upon Newey-West bandwidth; (5) The break date considered in URSB testis September 1990; (6) All variables are expressed in natural logarithm.
Table 3: Estimation results and diagnostic statistics for the state-space model (standard errors in parentheses)Parameters Estimation
α0 α1 α2 α3 α4
0.222 1.767 -0.807 -1.721 3.041(0.020***) (0.096***) (0.158***) (0.138***) (0.156***)
α5 α6 α7 α8 α9
-1.378 -1.562 2.744 -1.247 -1.016(0.179***) (0.162***) (0.176***) (0.152***) (0.153***)
α10 α11 α12 α13 α14
1.772 -0.808 -0.391 0.673 -0.308(0.147***) (0.123***) (0.115***) (0.084***) (0.045***)
β̄ γ σ2 ν2
-0.040 0.895 -5.558 -14.105(0.004***) (0.370**) (0.121***) (7.980*)
Diagnostic StatisticsLB24 in sample RMSE DM out of sample RMSE DM
22.32*** 0.062/0.063 2.443** 0.043/0.105 4.036***Notes:(1) ***, ** and * indicate significance at the 1%, 5% and 10%, respectively. (2)LB24 is the Ljung-Box statistic atlag 24;(3) in sample and out of sample RMSEs compare the RMSE of the time varying parameter model against the RMSEof the linear model; (4) DM is the Diebold-Mariano statistic.
21

Figure 1: First differences of the logarithms of real monthly seasonally adjusted Italian GDP. ).
Notes: The grey shadings present the recessions occurred in Italy during the period 1979 -2002. The dating of the Italianbusiness cycle is calculated by ECRI.
Figure 2: Dynamics of homicide rate (left scale) and total crime rate (right scale).
22

Figure 3: Dynamics of the βt coefficient.
Notes: The grey shadings present the recessions occurred in Italy during the time span 1979 up to 2002. The dating of theItalian business cycle is calculated by ECRI.
Figure 4: Italy’s wider economic distortions of crime (GDP growth response to an increase of crime by 1%).
23

Ultimi Contributi di Ricerca CRENoS I Paper sono disponibili in: Uhttp://www.crenos.itU
10/01 Manue la De idda , “Precaut ionary sav ing , f inanc ia l r i sk and port fo l io choice”
09/18 Manue la De idda , “Precaut ionary sav ings under l iqu id i ty constra ints : ev idence f rom Ita ly”
09/17 Edoardo Ot ran to , “Improving the Forecas t ing of Dynamic Condi t iona l Corre la t ion : a Vola t i l i ty Dependent Approach”
09/16 Emanue la Marro cu , Ra f fa e l e Pa c i , Mar co Pon t i s , “Intang ib le cap i ta l and f i rms product iv i ty”
09/15 Hel ena Marque s , Gabr i e l P ino , Juan d e Dio s Tena , “Regiona l inf la t ion dynamics us ing space- t ime models”
09/14 Ja ime Alvar ez , Dav id For r e s t , I smae l Sanz , Juan d e Dio s Tena , “Impact of Import ing Fore ign Ta lent on Performance Leve ls of Loca l Co-Workers”
09/13 Fab io Cer ina , Fran c e s c o Mureddu , “Is Agglomerat ion rea l ly good for Growth? Globa l Eff ic iency and Interreg iona l Equi ty”
09/12 Fede r i c o Crudu , “GMM, Genera l ized Empir ica l L ike l ihood, and Time Ser ies”
09/11 Franc e s ca Mame l i , Gera rdo Mar l e t t o , “Can nat iona l survey data be used to se lect a core se t of ind ica tors for moni tor ing the susta inabi l i ty of urban mobi l i ty pol ic ies?”
09/10 Emanue la Marro cu , Ra f fa e l e Pa c i , “They arr ive wi th new informat ion . Tour ism f lows and product ion eff ic iency in the European reg ions”
09/09 Oliv i e r o A. Carbon i , “An Empirical investigation of the Determinants of R&D Cooperation”
09/08 Fab iano S ch i va rd i , El iana Viv iano , “Entry Barr iers in Reta i l Trade”
09/07 Rina ldo Brau , Car l o Car ra ro , “The Des ign of Voluntary Agreements in Ol igopol i s t ic Markets”
09/06 Franc e s ca Mame l i , Gera rdo Mar l e t t o , “A par t ic ipat ive procedure to se lect ind ica tors of susta inable urban mobi l i ty pol ic ies”
09/05 Claud io De to t t o , Manue la Pu l ina , “Does more cr ime mean fewer jobs? An ARDL model”
09/04 Franc e s c o P i g l i a ru , “Pers i s tent Reg iona l Gaps and the Role of Soc ia l Capi ta l : Hints f rom the I ta l i an Mezzogiorno’s case”
09/03 Giovann i Su l i s , “Wage Returns to Exper ience and Tenure for Young Men in I ta ly”
09/02 Guido Fe r ra r i , Gio r g i o Garau , Pa t r iz i o Le c ca , “Construct ing a Soc ia l Account ing Matr ix for Sard in ia”
09/01 Gior g i o Garau , Pa t r iz i o Le c ca , Luc ia S ch i r ru , “Does Def la t ion Method Matter for Product iv i ty Measures?”
08/23 Barbara De t t o r i , Emanue la Marro cu , Ra f fa e l e Pa c i , “Total factor productivity, intangible assets and spatial dependence in the European regions”
08/22 Fab io Cer ina , Sauv eu r Giannon i , “Pol lut ion Adverse Tour is ts and Growth”
08/21 Car ina Hir s ch ,Giovann i Su l i s , “Schooling, Production Structure and Growth: An Empirical Analysis on Italian Regions”
08/20 Fab io Cer ina , Fran c e s c o Mureddu , “Agglomerat ion and Growth wi th Endogenous Expedi ture Shares”
08/19 Dimi t r i Pao l in i , “Screening and short – term contracts”

Finito di stampare nel mese di Febbraio 2010 Presso studiografico&stampadigitale Copy Right
Via Torre Tonda 8 – Tel. 079.200395 – Fax 079.4360444 07100 Sassari

www.crenos.it