
using decision trees to analyze online learning data
87
USING DECISION TREES TO ANALYZE ONLINE LEARNING DATA (updated)
-
Upload
khangminh22 -
Category
Documents
-
view
0 -
download
0
Transcript of using decision trees to analyze online learning data

USING DECISION TREES TO ANALYZE ONLINE LEARNING DATA
(updated)

PLAYING GOLF TODAY?(from sample faux data in RapidMiner Studio)
2
relative humidity as a % with 100% as fully saturated

IRIS DATASET(from sample open-source data in RapidMiner Studio)
3
length and width of petals in centimeters

GOOD AND BAD WORKPLACE PRACTICES IN “LABOR-NEGOTIATIONS” DATASET (from sample data in RapidMiner Studio)
4
number of days

GOOD AND BAD WAGE PRACTICES IN “LABOR-NEGOTIATIONS” DATASET (from sample data in RapidMiner Studio)
5
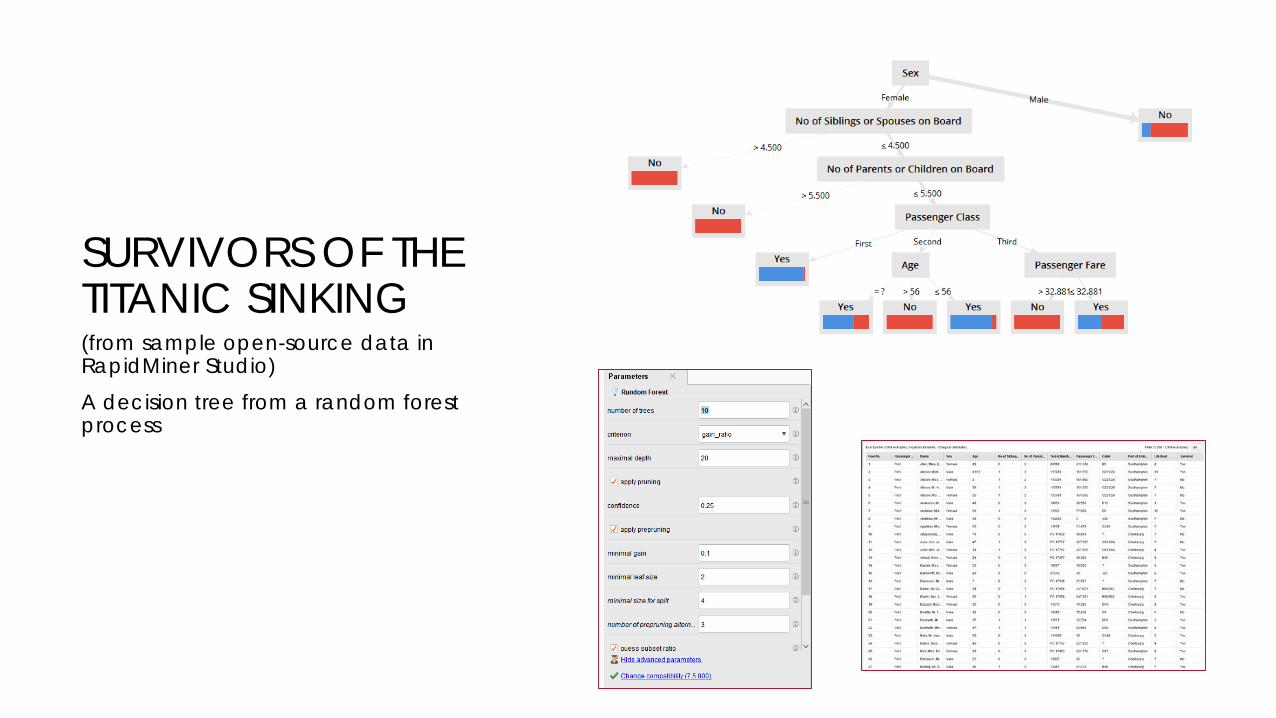
SURVIVORS OF THE TITANIC SINKING(from sample open-source data in RapidMiner Studio)
A decision tree from a random forest process
6

SURVIVORS OF THE TITANIC SINKING (CONT.)(from sample open-source data in RapidMiner Studio)
A “random forest” sequence of decision trees
7

SURVIVORS OF THE TITANIC SINKING (CONT.)(from sample open-source data in RapidMiner Studio)
A “random forest” sequence without auto-pre-pruning
More nuance More subdividing and branching Higher levels of accuracy
8

SESSION DESCRIPTION • In machine learning, decision trees enable researchers to identify possible indicators (variables)
that are important in predicting classifications, and these offer a sequence of nuanced groupings. For example, are there “tells” which would suggest that a particular student will achieve a particular grade in a course? Are there indicators that would identify learners who would select a particular field of study vs. another?
• This session will introduce how decision trees are used to model data based on supervised machine learning (with labeled training set data) and how such models may be evaluated for accuracy with test data, with the open-source tool, RapidMiner Studio. Several related analytical data visualizations will be shared: 2D spatial maps, decision trees, and others. Attendees will also experience how 2x2 contingency tables work with Type 1 and Type 2 errors (and how the accuracy of the machine learning model may be assessed) to represent model accuracy, and the strengths and weaknesses of decision trees applied to some use cases from higher education. In this session, various examples of possible outcomes will be discussed and related pre-modeling theorizing (vs. post-hoc) about what may be seen in terms of particular variables. The basic data structure for running the decision tree algorithms will be described. If time allows, relevant parameters for a decision tree model will be discussed: criterion (gain_ratio, information_gain, gini_index, and accuracy), minimal size for split, minimal leaf size, minimal gain, maximal depth (based on the need for human readability of decision trees), confidence, and pre-pruning (and the desired level).
9

PRESENTATION ORDER
1. Decision trees, classification, and predictive analytics2. Inducing decision trees from multivariate data 3. Data structures4. Model accuracy and decision tree validation: Type 1 and type 2 errors 5. RapidMiner Studio and drawing decision trees; parameters; sequential
walk-throughs6. Educational data with defined outcomes and candidate co-variates 7. Summary
10

1. DECISION TREES, CLASSIFICATION, AND PREDICTIVE ANALYTICS
11

DECISION TREES FOR MACHINE LEARNING
• Decision trees—in machine learning (formerly “data mining”)—can be applied for (1) classification (labeled categories, optimally mutually exclusive classes, un-pre-labeled categories), and / or (2) regression (continuous number outcomes, with potentially small numerical differences between categories).
• In our case, we are using decision trees to extract main factors which influence the ultimate classification of a population into respective classes.
• Decision trees may be “induced” from particular datasets. Rules are extracted based on the inherent structure in data, and they form the basis for classification models. (These do not require prior theorizing and framing in order to code for meaning.)
• These induced decision trees may be used to predict what a particular datapoint (or single record) or new set of (test) data may look like in terms of class, assuming the population is similar to the analyzed dataset used to “train” the particular decision tree (and the predictive power and accuracy of that decision tree).
12

BASIC PARTS OF A DECISION TREE
13

TOP-DOWN INDUCTION OF A DECISION TREE (TDIDT)
• The Top-Down Induction of a Decision Tree (TDIDT) refers to the drawing of a decision tree from the root node on down.
• “Top-Down” refers to the identification of the best attribute / indicator first. • A target attribute (classification) is indicated as select column data. • The most informative input attribute(s) that indicate a particular class is the
one that enables the first and top-most split based on the numerical measure that best identifies classification (along that dimension).
• The attributes are all part of a “feature vector” for the particular examples in the dataset.
• They all describe facets of the individuals (animate) or objects / phenomena (inanimate) in the dataset.
14

INTERPRETING A DECISION TREE: READING FROM ROOTS TO LEAVES
• Start with the root node of the tree at the top. This contains an attribute which is highly influential in the categorizing of the target population.
• In the next level of the tree, analyze the split (and the split attributes) to understand how the data may be categorized at the coarsest level with the most highly influential variable. Look at the leaf node labels. Read the edges to understand the test attribute values that determine the split.
• Work down the table, through each successive splitting of the training set. (Data is processed iteratively and sequentially, so prior splits inform future ones.)
• Explore branch by branch, towards the terminal nodes (leaves). • It helps to understand the underlying data well.
• Of all the possible co-variates, which affect each other (no naïve assumptions), which ones were the most influential in “predicting” or “identifying” class categorization?
15

HOW DECISION TREES MAY BE USED
• Growing decision trees: Decision trees are “induced” from data to enable • data exploration
• What’s in the data, broadly speaking? • discovery
• What latent data patterns are in the data? • What attributes or variables are the most informative of classification?
• the capturing of “rules” from the data that may be applied to similar (~)data in the future in a predictive way
• What extracted rules are apparent? What do these rules say about similar data? • What are accurate ways to label or classify ~ data in a future context of uncertainty?
• decision-making and action-taking • What does the decision tree suggest about ways to intervene in particular situations
for desirable outcomes? • What action-taking should be done?
16

HOW DECISION TREES MAY BE USED (CONT.)
• Labeled data for (human-)supervised machine learning: What is already known in many cases are the classes / categorizations (labeled data in supervised machine learning)…
• These categorization labels may be treated as “outcomes” data.
17

HOW DECISION TREES MAY BE USED (CONT.)
• Unlabeled data for unsupervised machine learning: In other cases, the decision trees themselves are used to extract the respective classes / bins / categories…and then to further identify the co-variates that are most predictive of membership in the particular classes.
• The categories are identified based on similarity analyses (like attracting like, ~ attracting ~), which can be built on a number of dimensions (depending on data dimensionality, built on attributes). Extracted categories are unlabeled by the computer but should be coherently human-interpretable in many cases.
• There are various clustering algorithms which identify similar objects across different dimensions.
18

HOW DECISION TREES MAY BE USED (CONT.)
• For numerical data, clustering may be done around close or similar values…or may be done based on the number of identified “k” desired by the researcher.
• Decision trees can also run on unlabeled data to see if the outcome categories are the same as the labeled data.
• Decision trees may be applied to “uncertain contexts” in which an instance’s classes are not known prior, with classes represented by “belief functions,” and with resulting “belief decision trees.”
19

AN ANALYSIS OF “PASSENGER FARE” FROM AN UNLABELED TITANIC DATASET AND THE
BASE DECISION TREE
20

DECISION TREES: STRENGTHS AND WEAKNESSES
Strengths• Human readable, human
interpretable • Enables finding of patterns in data • Reproducible, same results every
time (with same parameters) • Involves various types and may be
compounded in “random forests” (with iterated refinements)
Weaknesses• Are limits to predictivity based on
the data and based on the method • Predictive accuracy range is limited
• May output no findings (no root nodes, no splits), depending on the data
• May miss data nuances (because the focus is on the main variables that affect the targeted outcomes)
21
DECISION TREES: STRENGTHS AND WEAKNESSES (CONT.)
Strengths• Some with numeric values and
others not for outcomes [CHAID, ID3, and decision tree (weight based)]
• Does not require complex data cleaning or data preparation
• Is aesthetically pleasing as a visualization
Weaknesses• May output very different trees
based on input parameters (“tuning”)
• Requires some intimacy with the data
• Requires human interpretation of the outcomes
22

2. INDUCING DECISION TREES FROM MULTIVARIATE DATA
23

GENERAL SEQUENCE: EIGHT STEPS
1. Collect data. Or select existent data. Combine or “union” datasets as needed.
2. Clean the data. • If data columns are not particularly relevant, these should be removed. The idea
is not to pre-empt the process by removing data columns unthinkingly or doing other things that may change up the findings.
• If numeric indicators are required, depending on the decision tree type, change nominal variables to numeric dummy variables. These can sometimes work with multimodal variables, but it helps to have the data aligned for easier decision tree runs.
• Re-name column headers to information-rich labels (usually in camelCase). • Sometimes, running the decision tree initially helps surface what changes need
to be made. • If there is missing data, decide how that will be handled (either fill empty cells
with averages of the other cells, or use some other method to handle this).
24

BUT NOT SO MANY VARIABLES THAT THERE IS INCOHERENCEEnsemble of multiple trees induced from training data Tend to be shallow trees (aka “weak learners”) Makes fewer mistakes in each iteration; non-random tree building If high learning rate set, corrects more errors iteratively resulting in more complex trees (but may overfit to the training data and be less generalizable to other similar data) If low learning rate, simpler trees result but may be more generalizable and applicable to new test data
25
a gradient boosted tree
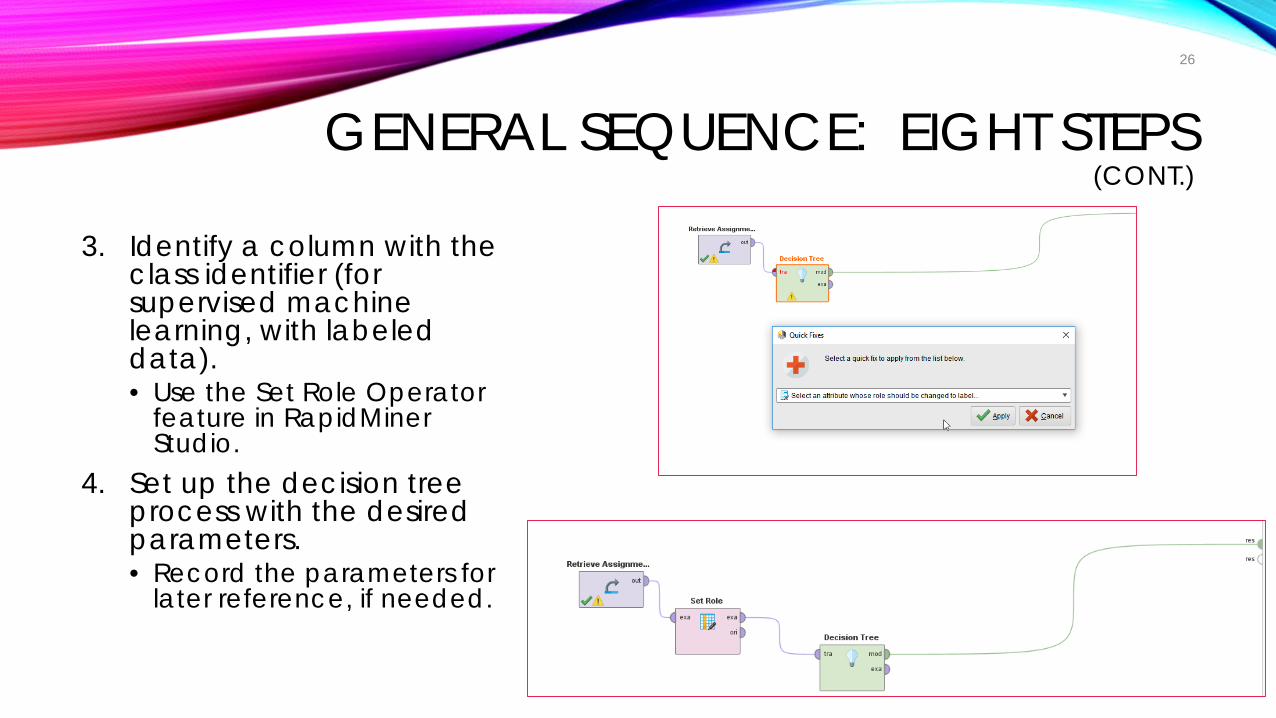
GENERAL SEQUENCE: EIGHT STEPS(CONT.)
3. Identify a column with the class identifier (for supervised machine learning, with labeled data). • Use the Set Role Operator
feature in RapidMiner Studio.
4. Set up the decision tree process with the desired parameters. • Record the parameters for
later reference, if needed.
26

GENERAL SEQUENCE: EIGHT STEPS (CONT.)
5. Run the decision tree induction process. • The first phase of the decision tree process is the “growth” stage. • A follow-on phase is the “pruning” phase. (Pre-pruning runs simultaneous or
parallel to the tree growth in the prior stage.)6. Analyze the decision tree visualization(s), from the root node through the
branches to the terminal leaf nodes (aka “answer nodes”). Examine the induced rules to see what those suggest about the particular data in the particular domain. • Hypothesize about why particular associations and relationships are seen in the
data. (In inductive logic, the person still has to take the collected data and make an assertion from it. The idea is to use clean logic.)
27

GENERAL SEQUENCE: EIGHT STEPS (CONT.)
7. Re-run the analysis with different parameters, if desired. 8. Test the efficacy of the induced decision tree on new data to see how
accurate the decision tree is for predictive analytics.
28

WHAT IS HAPPENING ON THE BACK END?
• Decision trees analyze the variables in the dataset to see which ones are most informative and predictive of classes in the dataset (the ones which are the best cues to category or class).
• The data is split recursively from the most coarse categories to the most nuanced.
• Once labeled, the data can only belong to that one leaf or node. There is a general assumption of mutual exclusivity.
• The more data that can be processed, the more informative the model can be. • The closer a decision tree is to is terminal leaves, the smaller and smaller the
segments. The decision tree ends when subsets cannot be partitioned further based on predefined parameter criteria.
29
WHAT IS HAPPENING ON THE BACK END? (CONT.)
• Decision tree depth (layers) are generally stopped at about 20 layers in default settings in this tool but can actually be iterated many more times.
• The data will likely often limit decision tree depth. • The co-variates that affect classifications (outcomes)are inherently within the
data, and there are other machine learning methods that can surface the same factors and data patterns. Machine learning methods enable the surfacing of otherwise-latent or hidden data patterns.
30

ASSIGNMENT DATA FROM THE K-STATE ONLINE CANVAS LMS DATA PORTALMay 2017 data dump
10,000/421,943 rows of data (2% of data analyzed)
RapidMiner Studio (free educational version) only allows 10,000 rows of data at a time to be analyzed
31

WHAT DETERMINES WHICH ASSIGNMENTS ARE PUBLISHED, UNPUBLISHED, OR DELETED?
32

RANDOMIZING A SMALLER DATASETCapture the .gz download from the LMS data portal. Expand zipped files with 7Zip. Open files in MS Access. Export table to Access format .accdb.Export to Excel from there. Randomize data in Excel by creating a column of random numbers and then sorting by random.
Use =RAND()Then sort so the top 10,000 records are actually pseudo-randomized.
Use “down-sampled” data for the induction of decision trees. Refer to the Canvas Data Portal’s “Schema Docs” (data dictionary) for understandings.
33

TURNING “TRUE” TO 1; TURNING “FALSE” TO 0
• 153,901 true-s • 3,223,550 false-s
34

35

MORE NUANCED DATA PREPARATION FOR DECISION TREES
• Combine co-variates that are co-linear to reduce multi-collinearity. • Rework the data types to align with the types of decision trees to run (some
can deal with numeric target classes and others cannot, for example). • Omit variables which may not have an effect on the target outcomes
classifications, or which may not make (any) sense in that context. • Sometimes, oftentimes, less is more.
36

SETTING PARAMETERS FOR DECISION TREES
Pre-pruning (during decision tree growth; || to decision tree growth)• Criterion: “which attributes will be selected for splitting”
• information_gain: selecting attributes with minimum entropy (and “a bias towards selecting attributes with a large number of values”)
• gain_ratio: “adjusts the information gain for each attribute to allow the breadth and uniformity of the attribute values” (default: gain_ratio)
• gini_index: “a measure of impurity of an ExampleSet” and splits on an attribute which “gives a reduction in the average gini index of the resulting subsets,” so resulting subsets are less dispersed and less variant(gini is a measure of inequality)
• accuracy: attributes selected “for split that maximizes the accuracy of the whole Tree”
• Maximal depth: the size of the decision tree in layers (default: 20)
37

SETTING PARAMETERS FOR DECISION TREES (CONT.)
Post-pruning (induced decision tree performance, accuracy, sensitivity)• After a decision tree has been induced, post-pruning can be brought into
play by assessing the tree’s ability to differentiate classifications with accuracy.
• Confidence level for the “pessimistic error calculation of pruning” (“Decision Tree (concurrency)”) (a measure to ensure that the generated rules hone pretty closely to the data, without expansive error bars)(default: yes, and 0.25)
38
SETTING PARAMETERS FOR DECISION TREES (CONT.)
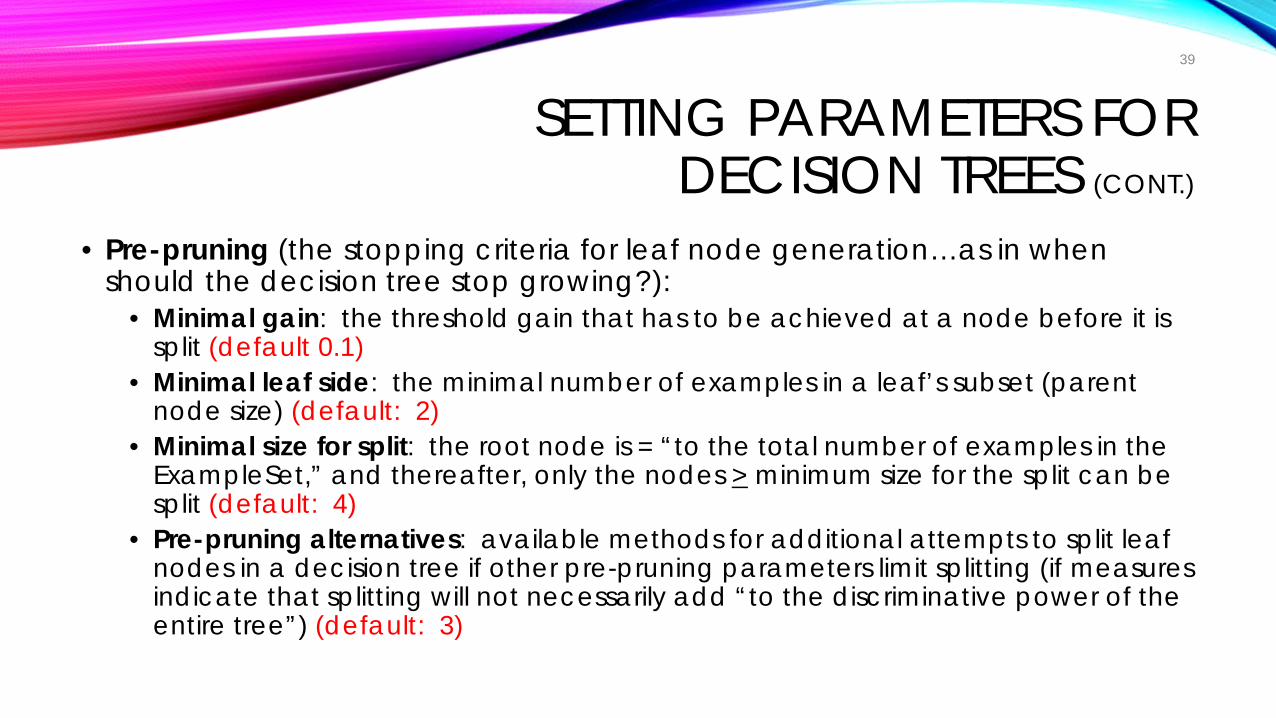
• Pre-pruning (the stopping criteria for leaf node generation…as in when should the decision tree stop growing?):
• Minimal gain: the threshold gain that has to be achieved at a node before it is split (default 0.1)
• Minimal leaf side: the minimal number of examples in a leaf’s subset (parent node size) (default: 2)
• Minimal size for split: the root node is = “to the total number of examples in the ExampleSet,” and thereafter, only the nodes > minimum size for the split can be split (default: 4)
• Pre-pruning alternatives: available methods for additional attempts to split leaf nodes in a decision tree if other pre-pruning parameters limit splitting (if measures indicate that splitting will not necessarily add “to the discriminative power of the entire tree”) (default: 3)
39

SETTING PARAMETERS FOR DECISION TREES (CONT.)
• If all objects belong to one class or category, in a particular leaf node, then tree growth stops at that particular node. (There is nothing else to divide / split.)
• The point of a decision tree is to identify the best split attribute (variable) and the optimal split point (the numerical or dummy information in the edges connecting the leaves).
• A risk with decision trees (if the parameters are set up a certain way) is that they overfit to the training data with so much specificity that the trees and rules cannot apply effectively to similar data; in other words, they do not generalize in an applicable way.
• Smaller and simpler decision trees are thought to be more generalizable / applicable to broader ranges of similar data.
40

SETTING PARAMETERS FOR DECISION TREES (CONT.)
• More training data (up to a certain point) enhances the rule-making and discriminant capability of decision trees.
• Caveat: Even with N = all, decision trees will not have full predictivity because of the nature of data, the inherent noise in data, the limits to the decision tree model, data cleaning and handling, the thin separations between some categories, and other factors.
41

AN UNPRUNED DECISION TREEFrom: unlabeled Titanic dataset in RapidMiner Studio, “Passenger Fare” focus; no pre-pruning (runs parallel to tree generation / growth), no post-pruning
More nuanced interaction effects between variables (but also a visual sense that the tree may have run amuck a little)
42

UNDERSTANDING MODEL ACCURACY
• It is possible to run statistical tests against a decision tree to see how well its induced rules apply to non-training data.
• Usually, a dataset is split 70:30 with the 70% used for training and the 30% used for testing. The test is for both the following:
• “sensitivity” (“true positive rate” / recall / “probability of detection”), and • “specificity” (“true negative rate”)
• How much noise or uncertainty is there in the classification assessment? (“Sensitivity and specificity,” Aug. 11, 2017)
• The error rate is the total number of misclassified points (whether Type 1 or Type 2 errors), divided by the total number of data points.
• The accuracy rate is one minus the error rate.
43

UNDERSTANDING MODEL ACCURACY (CONT.)
• Decision tree models are in competition with other means of finding patterns in data (like neural networks, like discriminant analysis, and others).
• The nature of datasets (and how they were cleaned) may affect how efficient particular models are.
• Some methods may be sensitive to noise and complexity. • There is a value to having parsimonious models or those that are pared-
down, spare, and simple enough to apply to other contexts. The power of decision trees is not in minute details…but the broad-scale co-variates and broad splits, when it comes to predictivity. [In contrast, a descriptive use of decision trees may be better un-pruned, so the various data nuances may be extracted. However, the human analyst(s) then have to be comfortable with complexity.]
44

3. DATA STRUCTURES
45

BASIC DATA STRUCTURE FOR DECISION TREES
Unique Identifier(Primary Key)
Variable 1 Variable 2 Variable 3 Classification (Label)
46

4. MODEL ACCURACY AND DECISION TREE VALIDATION
Type 1 and Type 2 Errors
47

2X2 CONTINGENCY TABLES(IN A BINARY CLASSIFICATION CONTEXT)
Table of Error Types Null Hypothesis Is…
Actually True / Only Chance at Play
Actually False / More than Chance at Play
Decision about Null Hypothesis Reject Null Hypothesis
(There is more than chance acting on this data.)
Type 1 ErrorFalse Positive +-Incorrect decision in identifying the null hypothesis as true (when it is actually false)
Correct InferenceTrue Positive++Correct decision in identifying the null hypothesis as false and correctly rejecting the null hypothesis
Do Not Reject the Null Hypothesis
(There is nothing more than chance acting on this data.)
Correct InferenceTrue Negative--Correct decision in identifying the null hypothesis as true and not rejecting the null hypothesis
Type 2 Error False Negative-+Incorrect decision in identifying the null hypothesis as false (when it is actually true)
48

CLASSIFICATION ERRORS / CONFUSION MATRIX
49
Classification Errors Actual Classification
Does Not Belong to Class
Belongs to Class
Decision about Classification Assess that Something Belongs to Target Class Decision
Type 1 ErrorFalse Positive +-
Correct InferenceTrue Positive++
Assess that Something Does Not Belong to Target Class Decision
Correct InferenceTrue Negative--
Type 2 Error False Negative-+

RECEIVER OPERATING CHARACTERISTIC (ROC CURVE)
The ROC Curve visualization shows the true positive rate (y-axis, indication of sensitivity) plotted against the false positive rate (x-axis) at different cut-off points of the assessment. A perfect test has an ROC curve that reaches the upper left corner, which suggests 100% sensitivity, and 100% specificity, without errors. A perfect test would have no overlap between the two distributions.
The diagonal shows what would be the test sensitivity if it were only going by chance (as with a “random classifier”). Above the diagonal are good classifiers, and below the diagonal are poor ones (with lots of false positives).
“Receiver Operating Characteristic,”Oct. 7, 2015, by Sharpr, on Wikipedia
TP = true positive FP = false positive FN = false negative TN = true negative
Vertical line or criterion value (which moves horizontally) determines sensitivity of the instrument for detection. What is to the right of the line is seen as positive, and what is to the left is seen as negative. The point is to minimize classification errors.
50
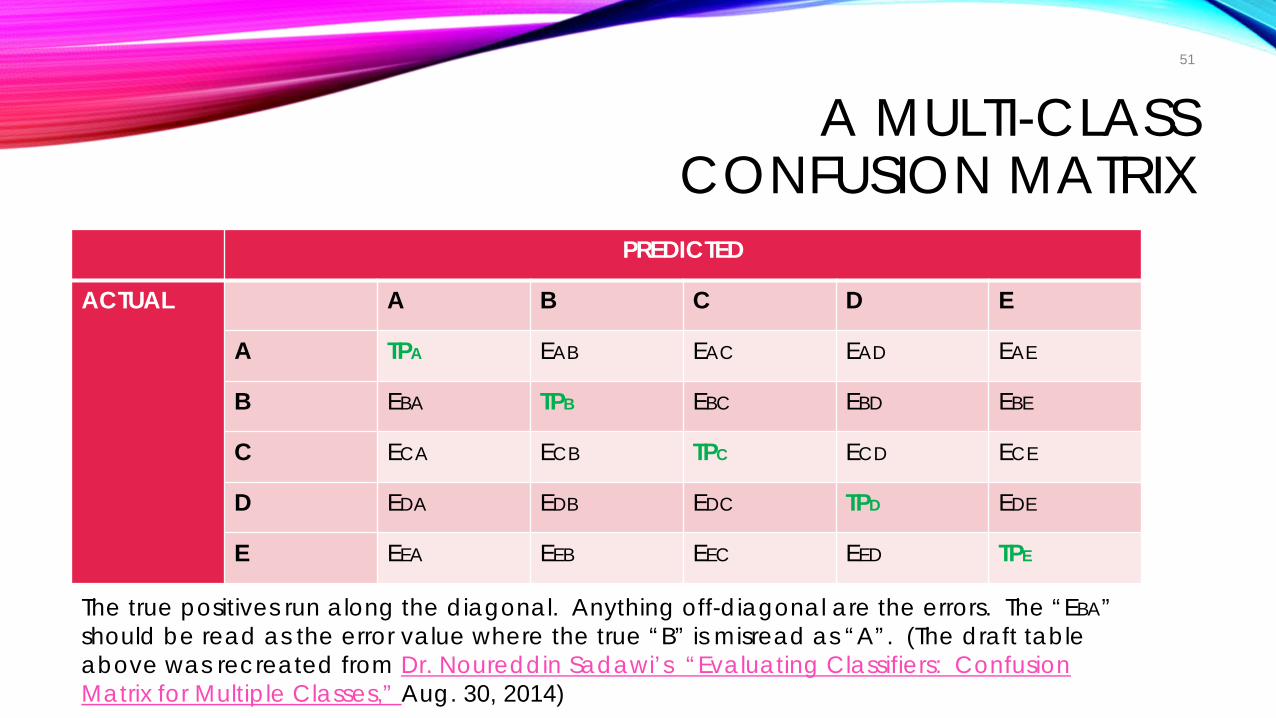
A MULTI-CLASS CONFUSION MATRIX
PREDICTED
ACTUAL A B C D E
A TPA EAB EAC EAD EAE
B EBA TPB EBC EBD EBE
C ECA ECB TPC ECD ECE
D EDA EDB EDC TPD EDE
E EEA EEB EEC EED TPE
51
The true positives run along the diagonal. Anything off-diagonal are the errors. The “EBA” should be read as the error value where the true “B” is misread as “A”. (The draft table above was recreated from Dr. Noureddin Sadawi’s “Evaluating Classifiers: Confusion Matrix for Multiple Classes,” Aug. 30, 2014)

ARRIVING AT “GENERALIZABLE” DECISION TREE MODELS
• The trick is to avoid “overfitting” a model to the training data. If a model is “overfit,” it is too closely specified to the data from which it was originate and so may tell you a lot about patterns in that data but does not transfer or generalize to independent datasets.
• Model “underfitting” occurs when a model does not sufficiently capture or describe the underlying training data.
• A “cross-validation” tests how well the model would perform against independent data.
• The independent data against which a model is tested may be excerpted from the original data and set aside as test data.
52

RUNNING A CROSS-VALIDATION ON THE
DECISION TREE MODEL1. On the process pane, delete the decision tree. In Validation -> Performance ->
Predictive, select “Performance (Classification). 2. Within the Cross-Validation tool, put the Decision Tree with the Set Role labels in the
Training pane (left)…and in the Testing pane, put Apply Model -> Set Role -> Performance. Define the column with the target classification.
3. In the Training pane, the links between the “ports” should be training -> example -> example -> training -> model -> model ports
4. In the Testing pane, the links between the ports should originate from two sources: model and testing || -> model and unlabeled data || -> labeled to example set input -> example set -> labeled -> performance -> performance ports
This cross-validation was run on 10 folds (subsets), and the data was sampled automatically. With such a large dataset, this cross-validation could have been run with fewer than 10 folds. Parallel execution was enabled. (All were default settings).

54

55

56
78.31% accurate with +/- 1.09%
So applied to similar data (generalizability), this decision tree model is about 78% accurate in its classifications, particularly when it comes to identifying the published category of assignments.

57

POST-RUN INTERNAL MODEL VALIDATION (TO THE DATA)Next steps in the model validation may be to change up the parameters of the decision tree model to see what may increase its performance.
One attempt to improve involved discretizing by frequency over the original data. Other attempts were made to discretize on other dimensions as well. These did not result in any change in performance accurate.
58

POST-RUN INTERNAL MODEL VALIDATION (TO THE DATA)
(CONT.)
• In this particular case, the model classification accuracy is high for one classification of assignments but not so much on two other classifications. This is an issue (which arises in part because the training data is overwhelmingly of one type).
• There are likely other issues as well, but exploring these will be beyond the purview of this live presentation and digital leave-behind slideshow.
59

EXPLORING AND HYPOTHESIZING FROM DECISION TREES
• The resultant decision trees are the basis for starting analyses…not the end point. • Each of the levels and splits of the decision trees have meaning (potentially). The
levels closer to the root node are more meaningful in a broad-scale way than those by the leaves because the processing is iterative, and each level affects subsequent ones.
• Each of the branches (and the related values: >, <, >, <) have meaning (potentially). • Researchers will be hypothesizing about what the decision trees mean. They will
need to articulate what the resulting decision trees mean (both informationally and action-wise). [Decision trees are not used in isolation but in a particular context.]
• It is important to know the data intimately: what it contains, how it was acquired, how it was sourced (provenance), how it was cleaned, and so on.
60

EXPLORING AND HYPOTHESIZING FROM DECISION TREES (CONT.)
• Surprises are good…but it is important to troubleshoot apparent “nonsense” results…
• It helps to know the theoretical background of the issue at hand, so theoretical frameworks and reasoning may be brought into play.
61

5. RAPIDMINER STUDIO AND DRAWING DECISION TREES; PARAMETERS; SEQUENTIAL
WALK-THROUGHS(a free delimited educational version of the software
for non-commercial research contexts)
62

DEMONSTRATION
63

6. EDUCATIONAL DATA WITH DEFINED OUTCOMES
AND CANDIDATE COVARIATES
64

FROM ONLINE LEARNING DATA: ONE DECISION TREE FROM A
RANDOM FOREST MODEL (NEXT SLIDE)• Note that the particular decision tree (one of 10 iterations from the random
forest approach) gives a sense of frequencies. • Assignment muting and peer review are surfaced as relevant co-variates
affecting the outcome states of the assignments: published, unpublished, or deleted.
• The other variables are not sufficiently influential on the outcome variables. • The following decision tree is one of 10 exported in the random forest
process.
65

66
Note that the largest numbers of exemplars are the unmuted,and these are represented at the right branch: 9856 total.
9856 total
3 total 141 total

DIFFERENT SPATIAL REPRESENTATIONS OF DECISION TREESThe underlying data, particularly its density or sparsity, will affect how the respective data visualizations look.
67
spring layout
TreeTree (Tight)RadialBalloonISOMKKLayoutFRLayoutCircleSpring

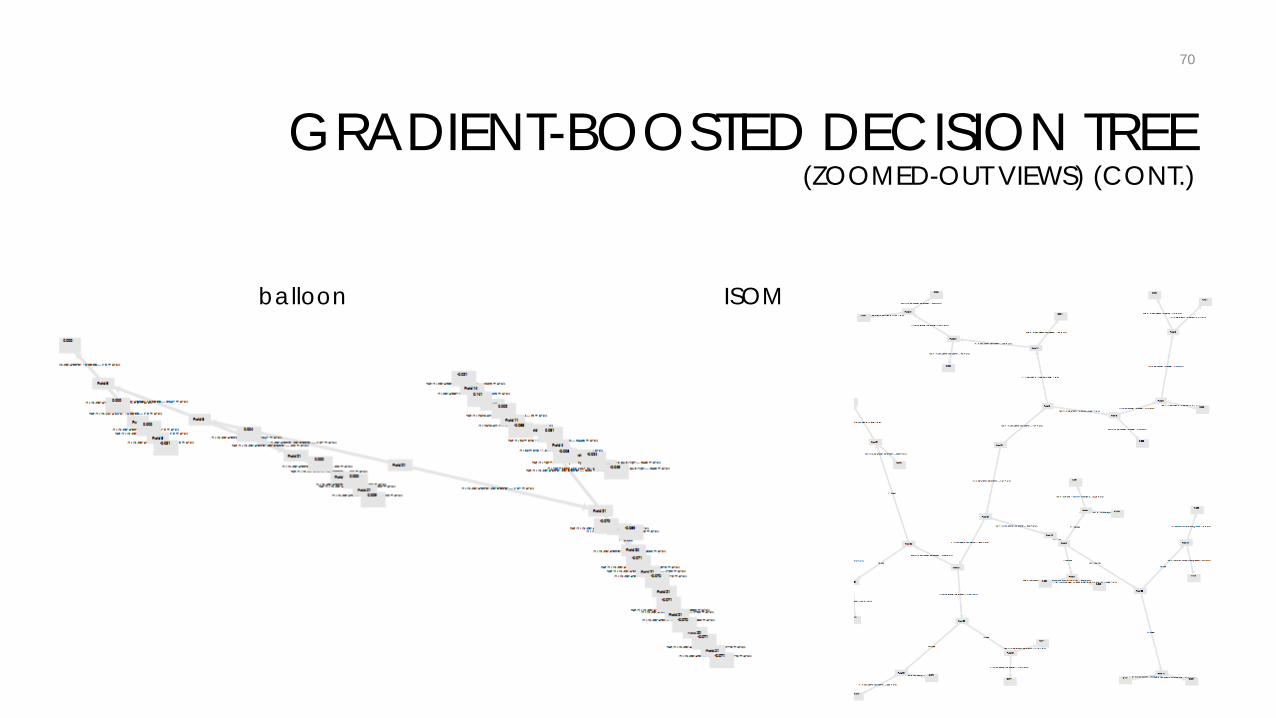
GRADIENT-BOOSTED DECISION TREE Gradient-boosted decision trees are a refinement on basic decision trees because they learn from the residual errors between actual data and the predicted data, in order to ensure closer predictivity modeling, by iterating over the data. The final tree should be more sensitive to the underlying data than the earlier trees.
68
Selected parameters: 20 trees deep Maximal depth: 5 Minimum rows: 10 Minimum split improvement: 0 Number of bins: 20 Learning rate: 0.1 Sample rate: 1Distribution: AutoEarly stopping: 0 Maximum runtime seconds: 0

GRADIENT-BOOSTED DECISION TREE (ZOOMED-OUT VIEWS)
69
radial
tree
tree (tight)
70
balloon ISOM
GRADIENT-BOOSTED DECISION TREE (ZOOMED-OUT VIEWS) (CONT.)

71
KKLayout
FRLayout
GRADIENT-BOOSTED DECISION TREE (ZOOMED-OUT VIEWS) (CONT.)

72
circle
spring
GRADIENT-BOOSTED DECISION TREE (ZOOMED-OUT VIEWS) (CONT.)

HOW DECISION TREES MAY BE USED IN EDUCATION AND
LEARNING• Understanding frequency distributions by class for particular populations
(how likely a population is to break out into particular categories, based on the data sample or a full set)
• Predicting the class membership of a single record based on a decision tree• Predicting the class membership frequency of a group set based on a decision
tree (with varying levels of accuracy) • Understanding key attributes / variables / co-variates in affecting
classification
73

HOW DECISION TREES MAY BE USED IN EDUCATION AND
LEARNING (CONT.)• Applying informed decision analysis in understanding particular critical co-
variates for classification and using that information to affect decision-making and action-taking
• Identifying a particular critical assignments that learners have to pass in order to pass a class
• Identifying particular behaviors / features of learners that predict success in a particular learning sequence
74

SOME SAMPLE ASKABLE QUESTIONS
• What are critical assignments and activities for learners to be placed in certain grade categories? Or in a binary pass / fail (P/F) classification?
• How can instructors and GTAs prepare learners to do better for high-value assignments and activities?
• What are ways to mitigate for gaps in preparedness? • What are necessary features (such as do-or-die activities) for learners who
select into a particular domain field vs. another? Or who end up in various percentile categories of earnings a year out after graduation? Or who end up in particular region-based relocations after graduation?
• Out of a set of possible influencers / contributory variables, which are the most potent in predicting target class labels? (And what of this data can surprise us?)
75

PRE-DATA EXPLORATION HYPOTHESIZING
• Explore the data, and in selecting the class outcomes grouping, hypothesize about possible associations that one might find in inducing a decision tree.
• Document the hypotheses. • Revisit these once the decision trees and random forests have been
created. • Revise the hypotheses with the new information. • It is important to capture thinking prior in order to be able to observe how
the thinking changed with new data and new data visualizations. • Post-hoc theorizing is valuable, too, but in a way that may be overly swayed
by the available outcomes.
76

INTERNAL VALIDITY
• Internal validity suggests the following: • The constructs are cleanly theorized. The concepts are accurately and precisely
defined. • The variables that may be indicators of the constructs are clearly defined.• The research is clean.• The data collection is sufficient. • The predictive analytics models applied are correct to the data. • The data is processed cleanly. • The algorithms run correctly. • The applied logics are correct.
• Models can work cleanly with internal validity and still have poor external validity.
77

EXTERNAL VALIDITY
• To be “externally valid,” a model has to achieve the following: It has to…• model the studied aspects of the real world accurately (usually both backwards
and forwards in time, historically and predictively…and in the present…descriptively)
• offer predictive insights about the world with a degree of accuracy • inform understandings • inform decision-making • be transferable or generalizable to other contexts
• In other words, a model may function wonderfully in a way that is separated from the world, but that is not particularly helpful in any applied way in the world.
78

EXTERNAL VALIDITY (CONT.)
• What can confound a decision tree analysis (in terms of external validity)? • There may be other contributing variables to the target outcomes…that are not
represented in the dataset. That relevant data may not have been collected. The available information is a limiting factor.
• The quality of the collected data may be an issue. If the quality is suspect, the insights will not necessarily apply.
• The theorizing may be off. The construct that the variables are supposed to represent may be poorly conceptualized and poorly defined, and the variables themselves may not be indicators of that construct.
• The in-world phenomenon may itself be elusive to observe, elusive to measure (or to collect on). (The in-world phenomenon may not exist.)
• A decision tree analysis approach may be the wrong type of analysis to find the relevant variables that contribute to the particular target outcomes / classifications.
• The outcome classifications themselves may be poorly conceptualized and poorly defined.
• And others…
79

EXTERNAL VALIDITY (CONT.)
• Assuming that the dataset captures authentic and sufficient data…in a thorough way…and the decision tree was properly induced from the data…and the tree itself was properly interpreted…the next step might be to explore whether the insights from the decision tree are externally valid:
• Do the insights from the decision tree reflect the real-world? (Do the data patterns identified inform accurately on real-world phenomena?)
• And further, will the interventions designed from the decision tree rules change ground truth in the world?
• Or are the suggestive data patterns identified actually “anti-patterns,” solutions that look good initially but result in failure and unintended negative outcomes in the real world?
80

EXTERNAL VALIDITY (CONT.)
• One other point: The world is constantly changing, so a model by definition may only be good for a time in the past, present, and future…and then has to be updated for applicability.
81

7. SUMMARY
82

A FEW POINTS
• Decision trees are a method of machine learning that identifies patterns in quantitative and categorical / nominal data. The data can be heterogeneous.
• In general, the data can be large and analyzed at-scale. • Decision trees capture macro-level patterns in the data, not more nuanced
analytics (which would require other methods and some human close-reading).
• The machine-learning process involves the induction of rules from the training data (variables that inform the classification of records) that identify data patterns but also enable predictive analytics of non-training (test) data.
83

A FEW POINTS (CONT.)
• Various techniques may be applied to strengthen the decision tree analysis method: data cleaning, data pre-processing, decision tree parameter-setting, and others.
• Decision trees are more effective with some types of data than others. The model is never perfect even with full data sets because of inherent noise in data.
• Machine learning is about finding patterns in data that may be invisible to the unaided human eye…and to theorizing…and other methods at getting at truth.
84

A FEW POINTS (CONT.)
• Model accuracy may be ascertained in RapidMiner Studio using various validation methods. Here, a cross-validation was run with output on classification accuracy performance.
• There are methods to apply to the decision tree sequence to enhance the decision tree classification performance.
• The decision tree machine learning method may be applied to educational and online learning data (as long as the data has a target classification and attributes / variables in the right data format or accurately convertible to the right data format).
85

CONCLUSION AND CONTACT
• Dr. Shalin Hai-Jew, Instructional Designer • iTAC, Kansas State University • 212 Hale Library • 785-532-5262 • [email protected]
• Notes: The presenter is an early user of machine-learning-based decision trees. The presenter has no tie to the software maker of RapidMiner Studio.
• Thanks! Thanks to the event organizers for accepting this presentation.
86

NOTES ABOUT RAPIDMINER’SSUPPORT FOR EDUCATION
• Free Educational Licenses: RapidMiner offers free licenses for academic usage to “students, professors and researchers” through their educational license program. The RapidMiner Academia team offers support for users of this license. These generally run on three-year cycles.
• RapidMiner Community Features: • There are forums for users of RapidMiner Studio. • The company offers commercial trainings and certification for “Certified
RapidMiner Analyst” standing. • In the tool, there is a “wisdom of crowds” aspect that provides “advice” based
on how users solve similar challenges that the user has arrived at.
87