FAmiLY TREES - Oxford Academic
44
ORBYTS and football The ups and downs of outreach Jodrell Bank Heritage matters after 60 years of the Lovell Telescope Earth system science Tools to look for extraterrestrial life A G NEWS & REVIEWS IN ASTRONOMY & GEOPHYSICS & OCTOBER 2017 • VOL. 58 • ISSUE 5 FAMILY TREES New ways to classify stars in the Milky Way Downloaded from https://academic.oup.com/astrogeo/article/58/5/ASTROG/4176289 by guest on 11 February 2022
-
Upload
khangminh22 -
Category
Documents
-
view
0 -
download
0
Transcript of FAmiLY TREES - Oxford Academic

ORBYTS and football The ups and downs of outreachJodrell Bank Heritage matters after 60 years of the Lovell TelescopeEarth system science Tools to look for extraterrestrial life
AGNEwS & REviEwS in ASTRONOmY & GEOphYSicS
&
OCTOBER 2017 • VOl. 58 • IssuE 5
FAmiLY TREES New ways to classify stars in the milky way
Dow
nloaded from https://academ
ic.oup.com/astrogeo/article/58/5/ASTR
OG
/4176289 by guest on 11 February 2022
www.oup.com/academic/ras
Exclusive 25% DISCOUNT for members of the Royal Astronomical SocietyVisit the Oxford University Press website today and receive 25% off our complete Physics catalogue.
The latest ASTROPHYSICS TITLES from Oxford
25% OFF
THE ORIGIN OF MASSElementary Particles and Fundamental SymmetriesJohn Iliopoulos2017
978-0-19-880517-5 HB | £25.00 £18.75
ECLIPSE — JOURNEYS TO THE DARK SIDE OF THE MOONFrank Close2017
978-0-19-879549-0 HB | £12.99 £9.74
THE PHYSICAL WORLDAn Inspirational Tour of Fundamental PhysicsNicholas Manton and Nicholas Mee2017
978-0-19-879611-4 PB | £29.99 £22.49978-0-19-879593-3 HB | £65.00 £48.75
BEFORE TIME BEGANThe Big Bang and the Emerging UniverseHelmut Satz2017
978-0-19-879242-0 HB | £19.99 £14.99
TOTALITY — THE GREAT AMERICAN ECLIPSES OF 2017 AND 2024Mark Littmann and Fred Espenak2017
978-0-19-879569-8 HB | £25.00 £18.75
GRAVITATIONAL WAVESVolume 1: Theory and ExperimentsMichele Maggiore2007
978-0-19-857074-5 HB | £60.00 £45.00
GRAVITATIONAL WAVESVolume 2: Astrophysics and CosmologyMichele Maggiore2017
978-0-19-857089-9 HB | £60.00 £45.00
SPECTROSCOPY AND RADIATIVE TRANSFER OF PLANETARY ATMOSPHERESKelly Chance and Randall V. Martin2017
978-0-19-966210-4 HB | £40.00 £30.00
NONLOCAL GRAVITYBahram MashhoonInternational Series of Monographs on Physics
2017
978-0-19-880380-5 HB | £65.00 £48.75
WAVES, PARTICLES, AND STORMS IN GEOSPACEA Complex InterplayEdited by Georgios Balasis, Ioannis A. Daglis, and Ian R. Mann2016
978-0-19-870524-6 HB | £80.00 £60.00
1
Dow
nloaded from https://academ
ic.oup.com/astrogeo/article/58/5/ASTR
OG
/4176289 by guest on 11 February 2022

?????
A&G • October 2017 • Vol. 58 • aandg.org 5.3
AGNews & Reviews in AstRoNomy & Geophysics
&
coveR A reconstruction of our galaxy based on data from nASA’s Wide-field infrared Survey Explorer (WiSE). Paula Jofré and Payel Das explore how an evolutionary approach can be modified to build family trees of star formation in the Milky Way – and how the technique might be applied to other spiral galaxies – beginning on page 5.13. (nASA/JPL-Caltech/R Hurt [SSC/Caltech])
News4 editoRiAl Take your time
News UK space sector • Whispers from Mars • Cassini ends • Voyager continues • Sentinel maps Harvey • Behind the scenes at the RAS • Mass flow on Antares • MUSE takes aim • Adaptive optics active • RAS research posts • Neural nets map lensing mass • Passes from stars perturb comets • General relativity at galactic centre • Fast radio bursts • New Fellows • Memoirs of Edward Knobel • Kepler determines variable Pleiades • Jellyfish galaxies feed black holes • Episodic star formation • Identifying 1437 nova.letteR Is that acronym really necessary?
ANAlysis10 Iowa in eclipse
Thomas Hockey considers the place of Iowa in US total solar eclipses.
11 Bringing pupils into the ORBYTS of researchThe Twinkle ORBYTS team discuss working with schools on research.
BRieF lives12 Founders of the RAS:
William PearsonMike Edmunds on the teacher, clergyman, orrery designer and astronomer.
FeAtURes13 The evolution of spiral galaxies
Paula Jofré and Payel Das categorize stars using the idea of the family tree.
18 Earth system science and the search for lifeDavid Waltham argues for collaboration in the search for extraterrestrial life.
22 Recycling, rockets and radio astronomy Tim O’Brien and Teresa Anderson on the heritage of Jodrell Bank.
28 Norway’s most celebrated scientistDavid Southwood and Pål Brekke celebrate the life of Kristian Birkeland.
32 London MIST 2016Sarah Badman, John Coxon, Katie Raymer and Arianna Sorba report from the annual meeting.
35 The forgotten genius of celestial mechanicsNeil Taylor and Janet Hyde rediscover 19th-century astronomer Félix Tisserand.
37 Outreach at the match: a cautionary taleJohn Baruch, Ulrich Kolb, Helen Fraser and Jen Heyes share outreach pitfalls.
39 Solar eclipse of 1207 BC helps to date pharaohsColin J Humphreys and W Graeme Waddington analyse an ancient eclipse.
pRoFile43 Q&A Ashley Spindler
The postgrad astronomer on scifi, galactic evolution and coming out as transgender in the science community.
Astronomy & Geophysics publishes news reviews and comment on topics of interest to astronomers and geophysicists. Topical material is preferred. Publication will be as fast as is compatible with authors’ responses. Contact the Editor or see http://www.ras.org.uk for further information.
editor Sue BowlerSchool of Earth and Environment, University of Leeds, Leeds LS2 9JT, UK Tel: +44 (0)113 343 6672Email: [email protected]
mAnAGement BoArdExecutive Director RASPress Officer RASTreasurer RAS
editoriAl AdvisorsAndrew Ball noordwijkTom Boles CoddenhamAllan Chapman Oxford University Roger Davies Oxford UniversityMike Edmunds University of Wales, CardiffJane Greaves University of CardiffMike Hapgood Rutherford Appleton Laboratory Richard Holme University of Liverpool Ian Howarth University College London David Hughes Sheffield Katherine Joy University of ManchesterMargaret Penston ioA, CambridgeClaire Parnell University of St AndrewsRoberto Trotta imperial College LondonAlthea Wilkinson University of ManchesterThe Council of the RAS
royAl AstronomicAl societyBurlington House, Piccadilly, London W1J 0BQTel: +44 (0)20 7734 4582 or 3307Fax: +44 (0)20 7494 0166Email: [email protected]: http://www.ras.org.uk
openinG hours (Monday to Friday)Offices: 9.30–17.00 Library: 10.00–17.00
stAff contActsDeputy Executive Director/ Press OfficerRobert Massey [email protected]
oxford university pressProduced for the RAS by OUP, Great Clarendon Street, Oxford OX2 6DP, UK Tel: +44 (0)1865 353895Email: [email protected]
This journal is available online at: http://www.astrogeo.oxfordjournals.org
Subscriptions: http://oxfordjournals.org/our_journals/astrogeo/access_purchase/price_list.html
desiGn And production Paul Johnson http://www.higgs-boson.com
A&G is published bimonthly ISSN 1366-8781 (print) ISSN 1468-4004 (online)
distriButor Mercury Media Processing, 1634 E. Elizabeth Ave, Linden, nJ 07036, USA. Periodicals postage paid at Rahway, nJ and at additional entry points. US Postmaster: send address changes to A&G, c/o Mercury Media Processing, 1634 E. Elizabeth Ave, Linden, nJ 07036, USA.
printed By Rotolito Lombarda, italy
© 2017 rAs & individuAl contriButors All rights reserved. Authorization to photocopy items for internal or personal use, or the internal or personal use of specific clients, is granted by the RAS for libraries and other users registered with the Copyright Clearance Center Transactional Reporting Service, provided that the base fee of $15 per copy is paid directly to CCC (http://www.copyright.com). Special requests should be addressed to the Editor.
disclAimer The contents and views expressed in A&G are the responsibility of the Editor. They do not represent the views or policies of the RAS or Oxford University Press, except where specifically identified as such. While great care is taken to provide accurate and helpful information and advice in the journal, the RAS, its Council and the Editor accept no responsibility for errors or omissions in this or other issues.
Dow
nloaded from https://academ
ic.oup.com/astrogeo/article/58/5/ASTR
OG
/4176289 by guest on 11 February 2022

5.4 A&G • October 2017 • Vol. 58 • aandg.org
NEWS & EDITORIAL
Take your timeEDITORIAL The Cassini–Huygens mission has ended, but there are plenty more planetary missions, both active and in the pipeline: BepiColombo is getting ready for launch, Juno is at Jupiter and JUICE is gearing up, not to mention the steady progress exploring Mars. But these missions take years, even decades, to plan and execute. Planetary scientists do indeed need to be patient, but they are not the only ones: major observatories now demand decades of planning, fund-raising and construction. The Hubble Space Telescope is a 50-year project, while the Square Kilometre Array has been taking shape for 25 years, so far.
These timescales are inevitable for projects of such tremendous complexity and cost. And it is the complexity that brings discoveries – it’s not an optional extra. Managing that complexity demands new skills and innovative processes, which are yet another form of the impact of our work. Big data has applications in the wider world beyond academia, but so does big project management, teamwork and coordination. Perhaps we should make more of that, alongside the discovery science and technological impacts of our work? We still face the problem that career-long science projects don’t fit well in the political timescale, however successful they are. But perhaps methods and processes to help large teams work together would have a certain appeal in today’s fragmented political landscape? We could do with a bit more effective international cooperation these days. Sue Bowler, Editor
UK space sector gets ready for lift-offUK LAUNCHES The UK Space Agency reports a strong response to its call for proposals for grants to boost the UK small satellite launch and sub-orbital flight market.
LaunchUK received 26 propos-als in all, including proposals for spaceports across the country
and a range of launch and sub-orbital flight technologies. “This funding call is about establishing initial capability in the UK, but our wider ambition remains to grow a strong market, making the UK the best destination in Europe to participate in small satellite launch and sub-orbital
flight,” said Ross James, deputy CEO of the UK Space Agency. Several of the proposals have been selected for further con-sideration, reflecting, in James’s words “the exceptional strength of the field, and the high level of interest in LaunchUK”.http://bit.ly/2xLTiUe
Big dishes combine to listen for whispers from Mars
EXOMARS TGO Deep space com-munications networks from NASA, ESA and Roscosmos joined together to detect signals from the latest Mars orbiter, ESA’s ExoMars Trace Gas Orbiter. The challenge was to pick up signals from the orbiter when in its low power “survival” mode, and the test was carried out when Mars was furthest away on the oppo-site side of the Sun to Earth, at a
distance of 397 million km. The test was successful.
NASA’s 70 m dish at Canberra, Australia, could receive signals and send commands, as could the Russian 64 m dish at Kalyazin, an upgraded radio telescope. ESA’s 35 m antenna at New Norcia, Australia, also picked up the sig-nal, but could upload commands at only 10 bits/s. While slow, this would be enough to send
instructions to recover the craft in an emergency.
“The test was all the more impressive given the weakness of the signals,” said Daniel Firre, ESA’s ground station engineer responsible for cooperation with other agencies. “They had a power upon receipt at Earth some 1000 times less than we would receive from a phone on the Moon.”http://bit.ly/2gJMHpG
…but Voyager continues, 40 years onEXPLORATION The Voyager space-craft are 40 years old this year, and still going strong. The stories and recollections of people asso-ciated with the project are now available to read on a website hosted by NASA’s Jet Propulsion Laboratory.
Voyager 1 and Voyager 2, launched in August and Septem-ber 1977, both visited Jupiter and Saturn, with Voyager 2 going on to fly past Uranus and Neptune. Voyager’s many discoveries – Io’s active volcanism, Titan’s smoggy atmosphere, Neptune’s record-breaking winds – led directly to later missions such as Cassini.
But the mission also changed the focus of planetary science, according to RAS Fellow Garry Hunt, who began his career as a Voyager scientist: “The ability to make observations simulta-neously with a range of multi-spectral instruments transformed the basic picture-taking mission
style of the past into a detailed atmospheric investigation of these distant worlds in a manner similar to terrestrial studies.” And the technological demands of communicating with the spacecraft – whose transmitters have the power of a fridge light-bulb – boosted the equipment and techniques of NASA’s Deep Space Network, for example.
Hunt feels that the longevity of the mission arose from the efforts and ethos of the whole Voyager team, based at JPL: “Voyager scientists and engineers had an ‘anything is possible’ approach to the mission. The brilliant JPL engineers had overcome some major problems encountered by Voyager 2, such as immediately after launch and again when the scan platform jammed after the Saturn fly-by, so the scientists had faith that the spacecraft would keep going and going.”http://voyager.jpl.nasa.gov/share
Cassini ends …
CASSINI–HUYGENS By the time you read this, the Cassini spacecraft should have ended its 20-year mission by plunging into Saturn after a series of orbits that saw it dip between the planet’s rings and its cloudtops (above). Cassini was sent into Saturn rather than risk contaminating moons such as Titan and Enceladus, which may provide habitats for extraterrestrial life. Cassini–Huygens, a joint NASA, ESA and Italian Space Agency mission, kept the focus on science to the end, with eight of the spacecraft’s instruments switched on and data transmitted back to Earth live in the final orbit. http://saturn.jpl.nasa.gov
The ExoMars Trace Gas Orbiter (left), New Norcia (middle) and Kalyazin (right). (ESA/ATG medialab; ESA/S Marti; ESA)
Dow
nloaded from https://academ
ic.oup.com/astrogeo/article/58/5/ASTR
OG
/4176289 by guest on 11 February 2022
NEWS
A&G • October 2017 • Vol. 58 • aandg.org 5.5
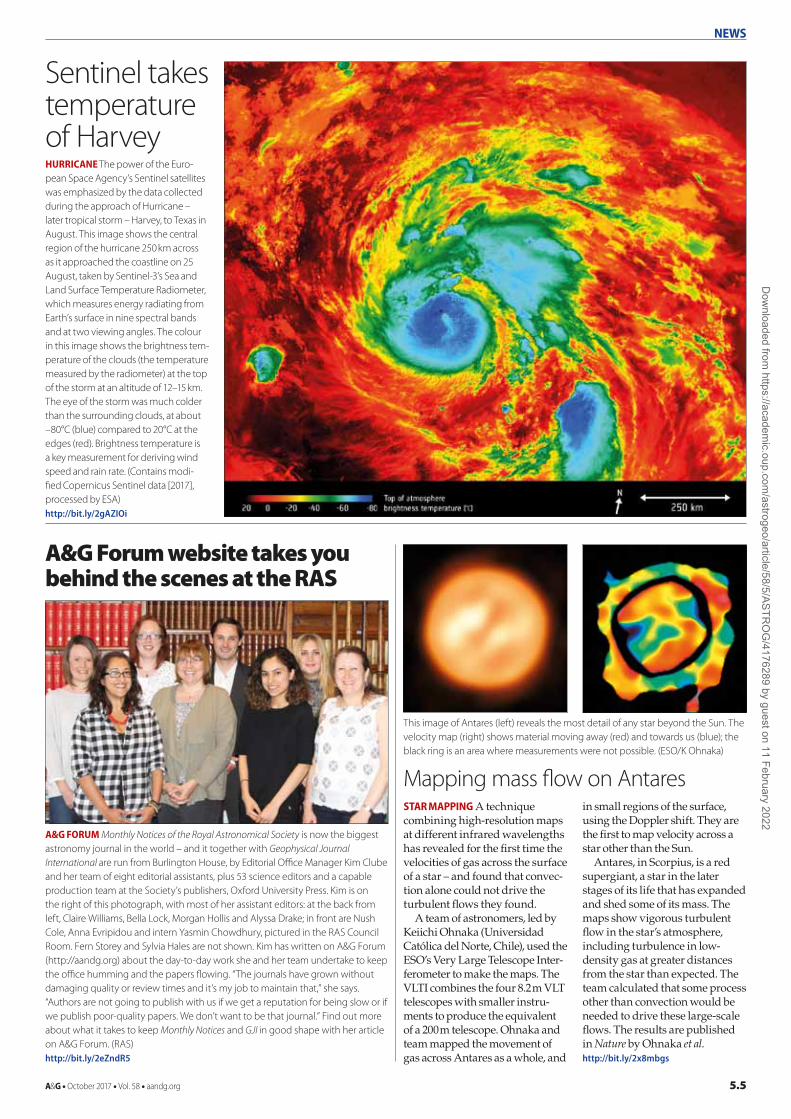
Sentinel takes temperature of HarveyHURRICANE The power of the Euro-pean Space Agency’s Sentinel satellites was emphasized by the data collected during the approach of Hurricane – later tropical storm – Harvey, to Texas in August. This image shows the central region of the hurricane 250 km across as it approached the coastline on 25 August, taken by Sentinel-3’s Sea and Land Surface Temperature Radiometer, which measures energy radiating from Earth’s surface in nine spectral bands and at two viewing angles. The colour in this image shows the brightness tem-perature of the clouds (the temperature measured by the radiometer) at the top of the storm at an altitude of 12–15 km. The eye of the storm was much colder than the surrounding clouds, at about –80°C (blue) compared to 20°C at the edges (red). Brightness temperature is a key measurement for deriving wind speed and rain rate. (Contains modi-fied Copernicus Sentinel data [2017], processed by ESA)http://bit.ly/2gAZIOi
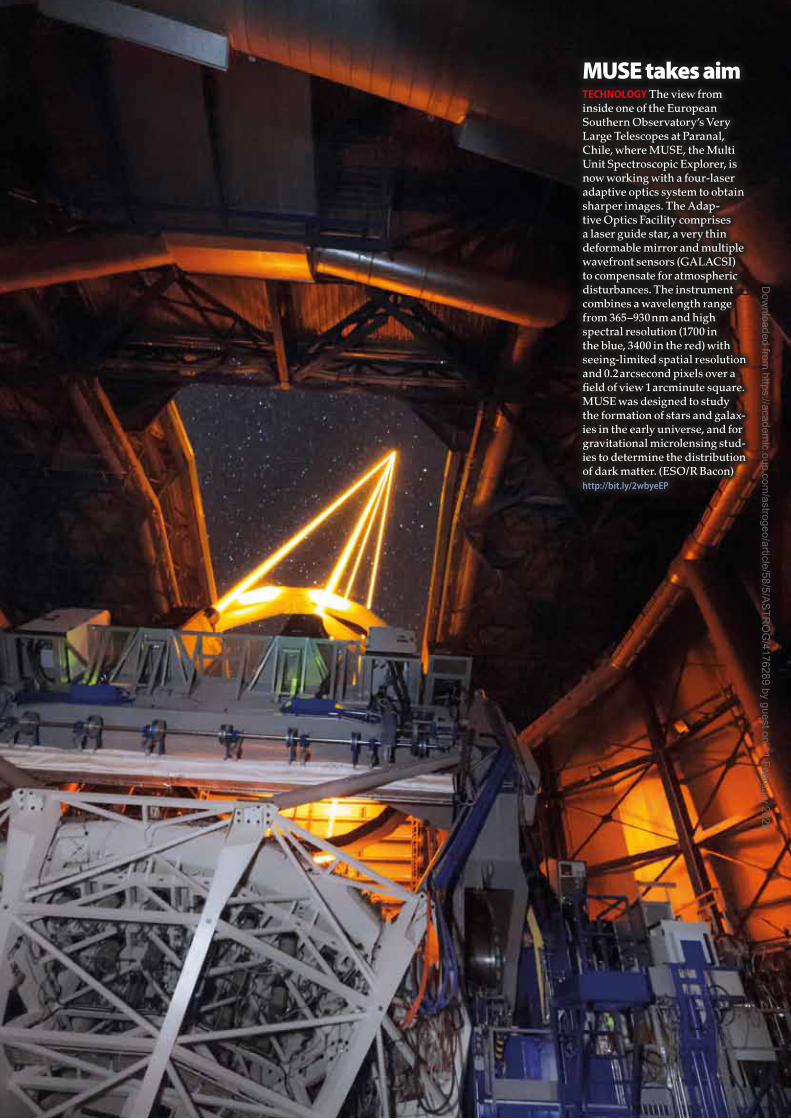
Mapping mass flow on Antares STAR MAPPING A technique combining high-resolution maps at different infrared wavelengths has revealed for the first time the velocities of gas across the surface of a star – and found that convec-tion alone could not drive the turbulent flows they found.
A team of astronomers, led by Keiichi Ohnaka (Universidad Católica del Norte, Chile), used the ESO’s Very Large Telescope Inter-ferometer to make the maps. The VLTI combines the four 8.2 m VLT telescopes with smaller instru-ments to produce the equivalent of a 200 m telescope. Ohnaka and team mapped the movement of gas across Antares as a whole, and
in small regions of the surface, using the Doppler shift. They are the first to map velocity across a star other than the Sun.
Antares, in Scorpius, is a red supergiant, a star in the later stages of its life that has expanded and shed some of its mass. The maps show vigorous turbulent flow in the star’s atmosphere, including turbulence in low-density gas at greater distances from the star than expected. The team calculated that some process other than convection would be needed to drive these large-scale flows. The results are published in Nature by Ohnaka et al. http://bit.ly/2x8mbgs
A&G Forum website takes you behind the scenes at the RAS
A&G FORUM Monthly Notices of the Royal Astronomical Society is now the biggest astronomy journal in the world – and it together with Geophysical Journal International are run from Burlington House, by Editorial Office Manager Kim Clube and her team of eight editorial assistants, plus 53 science editors and a capable production team at the Society’s publishers, Oxford University Press. Kim is on the right of this photograph, with most of her assistant editors: at the back from left, Claire Williams, Bella Lock, Morgan Hollis and Alyssa Drake; in front are Nush Cole, Anna Evripidou and intern Yasmin Chowdhury, pictured in the RAS Council Room. Fern Storey and Sylvia Hales are not shown. Kim has written on A&G Forum (http://aandg.org) about the day-to-day work she and her team undertake to keep the office humming and the papers flowing. “The journals have grown without damaging quality or review times and it’s my job to maintain that,” she says. “Authors are not going to publish with us if we get a reputation for being slow or if we publish poor-quality papers. We don’t want to be that journal.” Find out more about what it takes to keep Monthly Notices and GJI in good shape with her article on A&G Forum. (RAS)http://bit.ly/2eZndR5
This image of Antares (left) reveals the most detail of any star beyond the Sun. The velocity map (right) shows material moving away (red) and towards us (blue); the black ring is an area where measurements were not possible. (ESO/K Ohnaka)
Dow
nloaded from https://academ
ic.oup.com/astrogeo/article/58/5/ASTR
OG
/4176289 by guest on 11 February 2022
NEWS
5.6 A&G • October 2017 • Vol. 58 • aandg.org
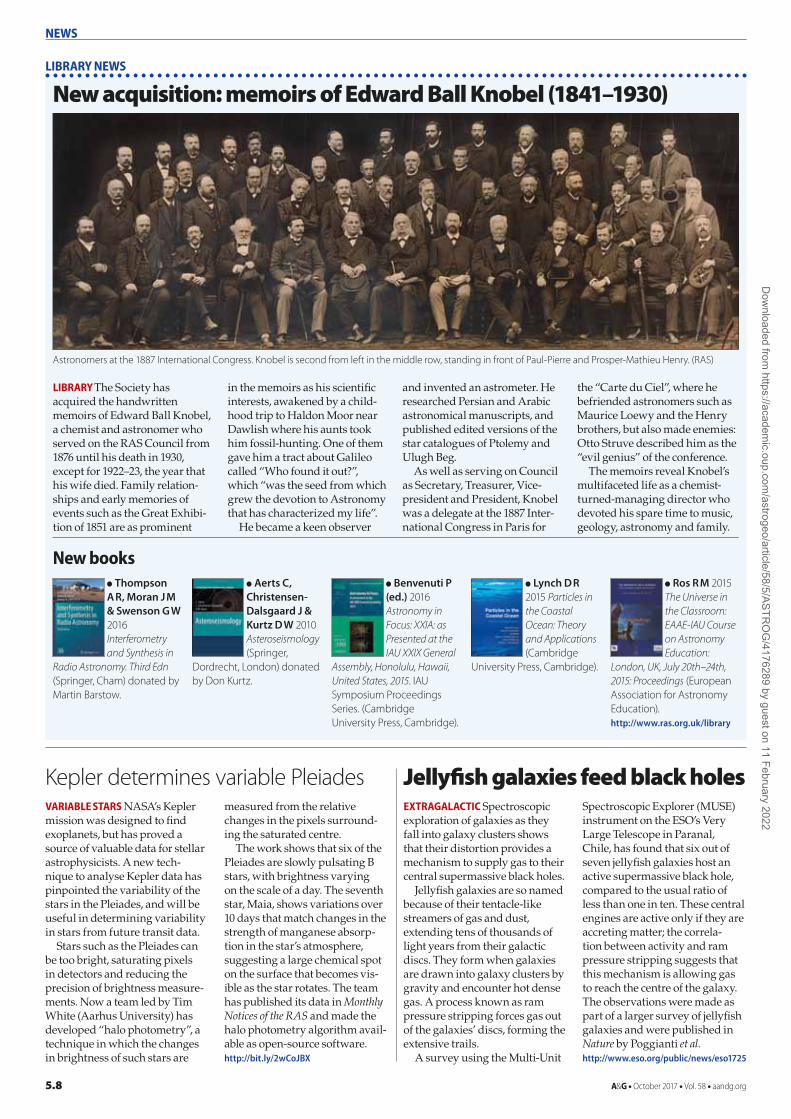
MUSE takes aim TECHNOLOGY The view from inside one of the European Southern Observatory’s Very Large Telescopes at Paranal, Chile, where MUSE, the Multi Unit Spectroscopic Explorer, is now working with a four-laser adaptive optics system to obtain sharper images. The Adap-tive Optics Facility comprises a laser guide star, a very thin deformable mirror and multiple wavefront sensors (GALACSI) to compensate for atmospheric disturbances. The instrument combines a wavelength range from 365–930 nm and high spectral resolution (1700 in the blue, 3400 in the red) with seeing-limited spatial resolution and 0.2 arcsecond pixels over a field of view 1 arcminute square. MUSE was designed to study the formation of stars and galax-ies in the early universe, and for gravitational microlensing stud-ies to determine the distribution of dark matter. (ESO/R Bacon)http://bit.ly/2wbyeEP
Dow
nloaded from https://academ
ic.oup.com/astrogeo/article/58/5/ASTR
OG
/4176289 by guest on 11 February 2022

A&G • October 2017 • Vol. 58 • aandg.org 5.7
NEWS
Neural nets map lensing massGRAVITATIONAL LENSES Using neural networks to map the matter responsible for strong gravitational lensing gets results up to 10 million times faster than existing methods. Researchers at the Kavli Institute for Particle Astrophysics and Cosmology in California, USA, used artificial intelligence systems that learn as children learn, finding out what a dog is by looking at pictures of dogs. The team trained four neu-ral networks with half a million images of simulated gravitational lenses, after which the networks worked automatically, map-ping and measuring lenses in a few seconds. Lead author of the study published in Nature, Yashar Hezaveh, said: “It’s as if they not only picked photos of dogs from a pile of photos, but also returned information about the dogs’ weight, height and age.”http://stanford.io/2vIbj8Q
Close passes from stars perturb cometsCOMETS Passing stars could send Oort Cloud comets onto potentially dangerous orbits into the inner solar system. Coryn Bailor-Jones (Max Plank Institute for Astronomy) used Gaia’s first data release (DR1) and Hipparcos data to model swarms of virtual stars. He estimated that between 19 and 24 stars would pass within 1 parsec of the Sun in a million years, making them a possible
trigger for comet incursions. Bailor-Jones published these data in Astronomy & Astrophysics. http://bit.ly/2wVcaDb
General relativity at the galactic centreBLACK HOLES General relativity appears to be shaping the orbit of a star at the galactic centre. This is the first documentation of the effects, which depend on a very precise determination of the orbit of the star, S2. It was achieved by a joint German and Czech team using the GRAVITY instrument on the ESO’s Very Large Telescope. The team hopes to track S2 as it reaches its closest approach to the black hole in 2018. The data will be published in The Astrophysical Journal by Parsa et al.http://bit.ly/2f2sjvY
The extragalactic half of the Milky WayGALAXY FORMATION Half the matter in our galaxy could come from elsewhere, according to simulations tracking the fate of supernova ejecta over billions of years. A reseach team based at Northwestern University found gas flowing from smaller galaxies to larger galaxies, such as the Milky Way, where it forms stars. This transfer of mass through galactic winds can account for as much as 50% of matter in the larger galaxies. The results are published by Anglés-Alcázar et al. in Monthly Notices of the RAS. http://bit.ly/2gD6eUZ
Spotting black hole mass from spiral armsSPIRAL GALAXIES A large galaxy survey has revealed an unex-pectedly strong correlation between the mass of a black hole at the centre of a galaxy and the tightness of the spiral made by the arms of the galaxy. They predict lower mass black holes in galaxies with more open spiral arms. Researchers from Swin-burne University of Technology, Australia, and the University of Minnesota Duluth found that the arm geometry is as good as other methods of estimating black hole mass – and a lot simpler. The data are published by Davis et al. in Monthly Notices of the RAS. http://bit.ly/2wCxEDE
15 fast radio bursts from one galaxySETI A source of the short but powerful radio frequency pulses called fast radio bursts has produced a series of 15 bursts in five hours, the highest frequency repeats known. The signals were collected from source FRB 121102 as part of the Breakthrough Lis-ten project, using the Green Bank Telescope in West Virginia, USA. Ideas for their origin include out-bursts from magnetars, but the repeated bursts rule out mecha-nisms involving the destruction of the source. The team also speculated that the signals could arise from alien technology. http://bit.ly/2eZl4F0http://bit.ly/2wCtJqs
The following were put forward to Council for election as a Fellow of the RAS on 5 July 2017:
Oliver Paul Bardsley, Cambridge Joanna Bates, London Antonia Bevan, Cambridge Robert Bows, Otley Stephen Chapman, Chester Kiran Chotalia, Harrow Peter Samuel James Clark, Broughshane Romain Raphael Marie Clement de Givry, London David Edwards, Bristol Isra Ezad, London Amelia Fraser-McKelvie, Nottingham Judit Maria Gonzalez Santana, Oxford Tim Greenfield, Southampton Louise Hawkins, Liverpool Kumiko Hori, Leeds Jennifer Jenkins, Cambridge Robert Jones, Newport Martin G H Krause, Hatfield Elizabeth Erin Amelia Lawley, Ipswich Linh Le Phuong, Newcastle Kuangdai Leng, Oxford Ronaldas Macas, Cardiff Sam Mangham, Southampton Thomas George Measey, Brading Chrissy Mitchell, Northampton Afsaneh Mohammad Zaheri, Oxford Sunil Mucesh, Leicester Amy Jade Newell, Telford Dez Ogunkolade, London James Panton, Cardiff Thomas Rees-Crockford, Pontyclun James Robinson, Belfast Armando Ruggiero Sena, Dhahran, Saudi ArabiaMichael Shara, New York, USAMartyn Patrick Steel, Seaton Burn Nuzhat Tabassum, Bristol Ajay Kumar Tiwari, Newcastle Vicente Valenzuela-Villaseca, Santiago, ChileJac van Driel, Pulborough Fiorenzo Vincenzo, Oxford Jack Walpole, Bristol Marion Weinzierl, Durham Tatiana Willson, Newhaven Marisa Wood, Sidcup
NEW FELLOWS
Adaptive optics activePLANETARY NEBULA The delicate structure of planetary nebula IC4406, in the constellation Lupus, is revealed in this image taken using the European Southern Observatory’s new Adaptive Optics Facility (AOF) and the MUSE spectrograph on one of the Very Large Tele scope’s unit telescopes, Yepun (UT4). The AOF corrects for atmospheric turbulence and allows the telescope to obtain good images even when the weather is less than excellent. For this planetary nebula, previously imaged by the VLT, the technology shows previously unseen shell structures within the bipolar rectangular ejecta.http://bit.ly/2j0ybKR
RAS research posts seeking applicationsFELLOWSHIPS If you are inter-ested in applying for one of two postdoctoral research fellowships currently being offered by the Royal Astronomical Society, you have until 23.59 on 20 October this year to submit your applica-tions.
The awards can be taken up on 1 October 2018, or in the follow-ing six months, and candidates must have completed their PhD in the previous five years. The awards are held at a UK univer-sity and only one award can be held at an institution at any one time. Full details are available on the RAS website. http://bit.ly/2eC1eiC
Dow
nloaded from https://academ
ic.oup.com/astrogeo/article/58/5/ASTR
OG
/4176289 by guest on 11 February 2022
5.8 A&G • October 2017 • Vol. 58 • aandg.org
NEWS
Kepler determines variable PleiadesVARIABLE STARS NASA’s Kepler mission was designed to find exoplanets, but has proved a source of valuable data for stellar astrophysicists. A new tech-nique to analyse Kepler data has pinpointed the variability of the stars in the Pleiades, and will be useful in determining variability in stars from future transit data.
Stars such as the Pleiades can be too bright, saturating pixels in detectors and reducing the precision of brightness measure-ments. Now a team led by Tim White (Aarhus University) has developed “halo photometry”, a technique in which the changes in brightness of such stars are
measured from the relative changes in the pixels surround-ing the saturated centre.
The work shows that six of the Pleiades are slowly pulsating B stars, with brightness varying on the scale of a day. The seventh star, Maia, shows variations over 10 days that match changes in the strength of manganese absorp-tion in the star’s atmosphere, suggesting a large chemical spot on the surface that becomes vis-ible as the star rotates. The team has published its data in Monthly Notices of the RAS and made the halo photometry algorithm avail-able as open-source software. http://bit.ly/2wCoJBX
Jellyfish galaxies feed black holes EXTRAGALACTIC Spectroscopic exploration of galaxies as they fall into galaxy clusters shows that their distortion provides a mechanism to supply gas to their central supermassive black holes.
Jellyfish galaxies are so named because of their tentacle-like streamers of gas and dust, extending tens of thousands of light years from their galactic discs. They form when galaxies are drawn into galaxy clusters by gravity and encounter hot dense gas. A process known as ram pressure stripping forces gas out of the galaxies’ discs, forming the extensive trails.
A survey using the Multi-Unit
Spectroscopic Explorer (MUSE) instrument on the ESO’s Very Large Telescope in Paranal, Chile, has found that six out of seven jellyfish galaxies host an active supermassive black hole, compared to the usual ratio of less than one in ten. These central engines are active only if they are accreting matter; the correla-tion between activity and ram pressure stripping suggests that this mechanism is allowing gas to reach the centre of the galaxy. The observations were made as part of a larger survey of jellyfish galaxies and were published in Nature by Poggianti et al. http://www.eso.org/public/news/eso1725
● Thompson A R, Moran J M & Swenson G W 2016 Interferometry and Synthesis in
Radio Astronomy. Third Edn (Springer, Cham) donated by Martin Barstow.
● Aerts C, Christensen-Dalsgaard J & Kurtz D W 2010 Astero seis mology (Springer,
Dordrecht, London) donated by Don Kurtz.
● Benvenuti P (ed.) 2016 Astronomy in Focus: XXIA: as Presented at the IAU XXIX General
Assembly, Honolulu, Hawaii, United States, 2015. IAU Symposium Proceedings Series. (Cambridge University Press, Cambridge).
● Lynch D R 2015 Particles in the Coastal Ocean: Theory and Applications (Cambridge
University Press, Cambridge).
● Ros R M 2015 The Universe in the Classroom: EAAE-IAU Course on Astronomy Education:
London, UK, July 20th–24th, 2015: Proceedings (European Association for Astronomy Education).http://www.ras.org.uk/library
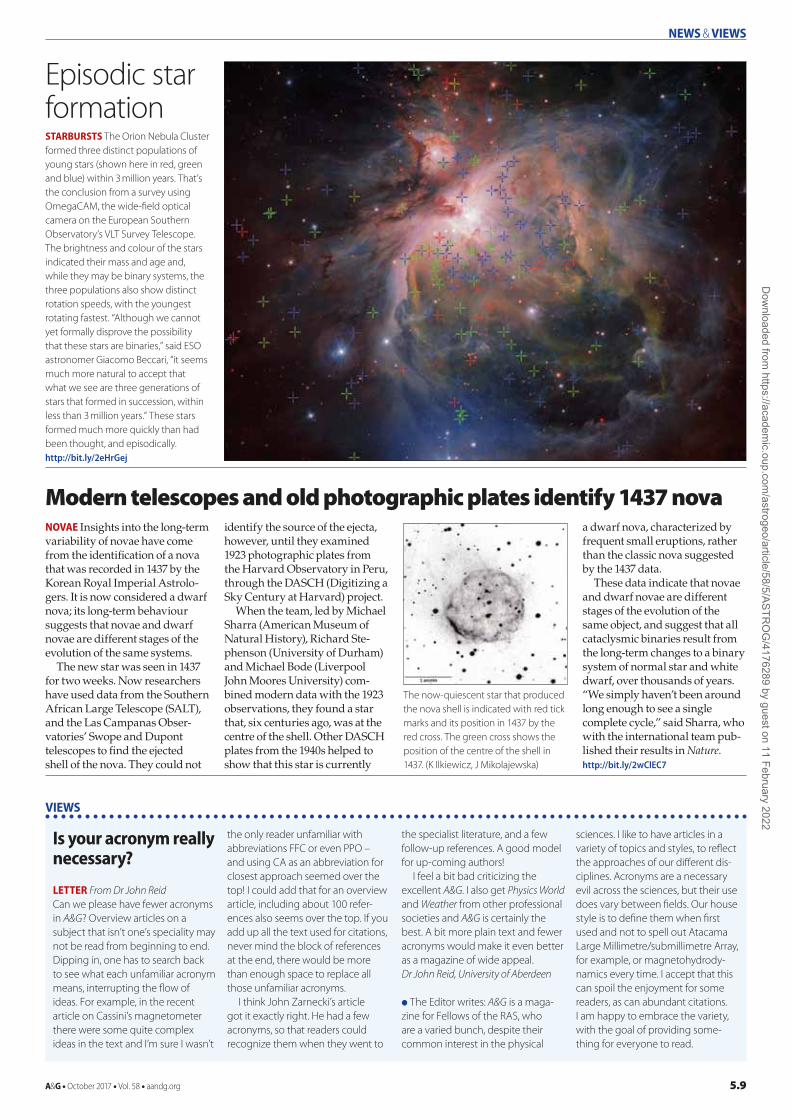
New acquisition: memoirs of Edward Ball Knobel (1841–1930)
LIBRARY The Society has acquired the handwritten memoirs of Edward Ball Knobel, a chemist and astronomer who served on the RAS Council from 1876 until his death in 1930, except for 1922–23, the year that his wife died. Family relation-ships and early memories of events such as the Great Exhibi-tion of 1851 are as prominent
in the memoirs as his scientific interests, awakened by a child-hood trip to Haldon Moor near Dawlish where his aunts took him fossil-hunting. One of them gave him a tract about Galileo called “Who found it out?”, which “was the seed from which grew the devotion to Astronomy that has characterized my life”.
He became a keen observer
and invented an astrometer. He researched Persian and Arabic astronomical manuscripts, and published edited versions of the star catalogues of Ptolemy and Ulugh Beg.
As well as serving on Council as Secretary, Treasurer, Vice-president and President, Knobel was a delegate at the 1887 Inter-national Congress in Paris for
the “Carte du Ciel”, where he befriended astronomers such as Maurice Loewy and the Henry brothers, but also made enemies: Otto Struve described him as the “evil genius” of the conference.
The memoirs reveal Knobel’s multifaceted life as a chemist-turned-managing director who devoted his spare time to music, geology, astronomy and family.
New books
LIBRARY NEWS
Astronomers at the 1887 International Congress. Knobel is second from left in the middle row, standing in front of Paul-Pierre and Prosper-Mathieu Henry. (RAS)
Dow
nloaded from https://academ
ic.oup.com/astrogeo/article/58/5/ASTR
OG
/4176289 by guest on 11 February 2022
A&G • October 2017 • Vol. 58 • aandg.org 5.9
NEWS & VIEWS
Is your acronym really necessary?
LETTER From Dr John ReidCan we please have fewer acronyms in A&G? Overview articles on a subject that isn’t one’s speciality may not be read from beginning to end. Dipping in, one has to search back to see what each unfamiliar acronym means, interrupting the flow of ideas. For example, in the recent article on Cassini’s magnetometer there were some quite complex ideas in the text and I’m sure I wasn’t
the only reader unfamiliar with abbreviations FFC or even PPO – and using CA as an abbreviation for closest approach seemed over the top! I could add that for an overview article, including about 100 refer-ences also seems over the top. If you add up all the text used for citations, never mind the block of references at the end, there would be more than enough space to replace all those unfamiliar acronyms.
I think John Zarnecki’s article got it exactly right. He had a few acronyms, so that readers could recognize them when they went to
the specialist literature, and a few follow-up references. A good model for up-coming authors!
I feel a bit bad criticizing the excellent A&G. I also get Physics World and Weather from other professional societies and A&G is certainly the best. A bit more plain text and fewer acronyms would make it even better as a magazine of wide appeal.Dr John Reid, University of Aberdeen
● The Editor writes: A&G is a maga-zine for Fellows of the RAS, who are a varied bunch, despite their common interest in the physical
sciences. I like to have articles in a variety of topics and styles, to reflect the approaches of our different dis-ciplines. Acronyms are a necessary evil across the sciences, but their use does vary between fields. Our house style is to define them when first used and not to spell out Atacama Large Millimetre/submillimetre Array, for example, or magnetohydrody-namics every time. I accept that this can spoil the enjoyment for some readers, as can abundant citations. I am happy to embrace the variety, with the goal of providing some-thing for everyone to read.
VIEWS
Modern telescopes and old photographic plates identify 1437 novaNOVAE Insights into the long-term variability of novae have come from the identification of a nova that was recorded in 1437 by the Korean Royal Imperial Astrolo-gers. It is now considered a dwarf nova; its long-term behaviour suggests that novae and dwarf novae are different stages of the evolution of the same systems.
The new star was seen in 1437 for two weeks. Now researchers have used data from the Southern African Large Telescope (SALT), and the Las Campanas Obser-vatories’ Swope and Dupont telescopes to find the ejected shell of the nova. They could not
identify the source of the ejecta, however, until they examined 1923 photographic plates from the Harvard Observatory in Peru, through the DASCH (Digitizing a Sky Century at Harvard) project.
When the team, led by Michael Sharra (American Museum of Natural History), Richard Ste-phenson (University of Durham) and Michael Bode (Liverpool John Moores University) com-bined modern data with the 1923 observations, they found a star that, six centuries ago, was at the centre of the shell. Other DASCH plates from the 1940s helped to show that this star is currently
a dwarf nova, characterized by frequent small eruptions, rather than the classic nova suggested by the 1437 data.
These data indicate that novae and dwarf novae are different stages of the evolution of the same object, and suggest that all cataclysmic binaries result from the long-term changes to a binary system of normal star and white dwarf, over thousands of years. “We simply haven’t been around long enough to see a single complete cycle,” said Sharra, who with the international team pub-lished their results in Nature. http://bit.ly/2wClEC7
Episodic star formation STARBURSTS The Orion Nebula Cluster formed three distinct populations of young stars (shown here in red, green and blue) within 3 million years. That’s the conclusion from a survey using OmegaCAM, the wide-field optical camera on the European Southern Observatory’s VLT Survey Telescope. The brightness and colour of the stars indicated their mass and age and, while they may be binary systems, the three populations also show distinct rotation speeds, with the youngest rotating fastest. “Although we cannot yet formally disprove the possibility that these stars are binaries,” said ESO astronomer Giacomo Beccari, “it seems much more natural to accept that what we see are three generations of stars that formed in succession, within less than 3 million years.” These stars formed much more quickly than had been thought, and episodically.http://bit.ly/2eHrGej
The now-quiescent star that produced the nova shell is indicated with red tick marks and its position in 1437 by the red cross. The green cross shows the position of the centre of the shell in 1437. (K Ilkiewicz, J Mikolajewska)
Dow
nloaded from https://academ
ic.oup.com/astrogeo/article/58/5/ASTR
OG
/4176289 by guest on 11 February 2022

ANALYSIS
5.10 A&G • October 2017 • Vol. 58 • aandg.org
Prior to the total solar eclipse of 2017, there was debate over how many American states would experience totality, with numbers ranging
from 12 to 14. Two states were problematic: the eclipse path hit one corner of Montana, in rugged territory reached only by backpacking; and Iowa was largely ignored, despite 0.7 square miles of Fremont County experiencing 33 seconds of totality.
More than a century earlier, though, Iowa was perfectly placed for eclipse watching, and the state was host to the first modern eclipse expeditions. Total solar eclipse expeditions in 1869 carried heavy and delicate instruments, requiring rail travel. This put the optimum eclipse observing station at the intersection of the eclipse path with the terminus of the railroad network which, in turn, meant the state of Iowa. Thus we find Simon Newcomb of the United States Naval Observatory (USNO) erecting a temporary observatory in Des Moines – the first government-sponsored eclipse expedition in the USA – and Alfred Mayer doing so for the Franklin Institute in Burlington. Maria Mitchell was also in Burlington, along with seven of her Vassar students. Others set up in Ottumwa, Mount Pleasant, Jefferson, Davenport, Cedar Falls and Iowa City. The USNO expedi-tion is most famous, because during the eclipse the supposed new element “coronium” was discovered by Wil-liam Harkness, independently of Charles Young.
Heavy baggage was required because eclipse expeditions were no longer focused on positional astronomy. 1869 was the first overtly astrophysi-cal eclipse in the USA; using new technology, such as the astronomical spectroscope, scientists were interested in the very nature of the phenomena they witnessed. Their instruments were bulky, delicate and expensive. The Des Moines expedition set up their observing “camp” just outside the local train station, minimizing their handling of luggage.
Advice to the publicAs well as formal observation, there was public and media interest in the eclipse, then as now. Burlington newspaper The Hawk Eye of 6 August printed the fol-lowing: “All persons wishing to view the Eclipse will do well to call at the Post Office Exchange this day from 8 a.m. to 1 p.m., and procure Smoked Eye Glass. No postponement on account of the weather. With these glasses the eclipse can be seen through the heaviest clouds or rain storms.” Other local papers gave short tutorials on the geometry of eclipses and what to expect. In the Davenport Gazette on 6 August we read: “Great preparations have been made by the various scientific organizations of the country for accurate observation and exhaustive investigation. All that most people will command for observation will be a piece of smoked or tinted glass. A common
opera glass, screened, will render the phenomena more distinctly visible – those wishing to see all the features must not let their attention wander, as the appearances are visible but a few moments.” Note that all these materials are ineffective solar filters.
Descriptions of totality filled many a column. The Cedar Rapids Times of 12 August wrote: “Doves Flew to their Cotes, Chickens went toward and looked
wistfully up at their roosting places, cocks crowed … and Geese marched in haste to their night quarters.” From the Fairfield Ledger: “At 4 minutes before 4 o’clock … the contact of the Moon’s shadow was first detected; a
shout went up from the street below, and hundreds of eyes were straining through pieces of smoked glass, in the direction of the Sun. Slowly and steadily the shadow of the Moon covered the face of the Sun … each moment now appeared more weird-like, more appalling. Suddenly from the far northwest, there fell upon the Earth a shadow so deep and dark that it seemed like thick black cloth hung from above and covering all beneath and behind it … looking up, we saw that the eclipse had reached its total phase. The grandeur and sublimity, the wonder and all of the moment can only be imagined.”
From the Davenport Gazette on 7 August comes a comment that could have been written about the 2017 eclipse: “The most beautiful sight was the gor-geous corona which surrounded the Moon at the moment of totality … [but then] the Sun had broken through his bonds and burst into glory.”
This brings us back to the present: did anybody see the latest total solar eclipse from Iowa? The answer is yes, although it was cloudy. According to the 24 August Sidney Argus-Herald, approximately 175 people crowded onto that tiny piece of Iowa that lay in the eclipse path. One watcher explained her presence: “It’s something different, something new for me to do.” Anyone wanting to repeat the experi-ence in Iowa will have to wait until 11 June 2048, when an annular eclipse will be visible from all but the extreme northwest and southeast of the state. ●
Iowa in eclipse
Thomas Hockey considers the part played by Iowa in the history of US total solar eclipses.
‘‘The grandeur and sublimity, the wonder and all of the moment can only be imagined’’
AUTHORThomas Hockey is professor of astronomy at University of Northern Iowa, USA.
1 This plaque marks the location of 1869 eclipse observations in Burlington, Iowa. (Daughters of the American Revolution)
Dow
nloaded from https://academ
ic.oup.com/astrogeo/article/58/5/ASTR
OG
/4176289 by guest on 11 February 2022

ANALYSIS
A&G • October 2017 • Vol. 58 • aandg.org 5.11
Most scientists would consider themselves lucky to publish a research paper while still an undergraduate, but a group of pupils
at Highams Park School in East London has co-authored a paper at age 18, thanks to ORBYTS.
Original Research By Young Twinkle Scientists (ORBYTS) comprises the core part of EduTwinkle, the education and outreach arm of the upcoming exoplanet space mission Twinkle, led by UK scien-tists and engineers, and is aimed at A-level students.
ORBYTS was founded in 2016 by Clara Sousa-Silva, who was splitting her time teaching at Highams Park School and working as a postdoc at University College London, via the Researchers in Schools programme. This blend of education and research inspired her to set up a scheme enabling young post-doc and PhD students from her research group at UCL, ExoMol, to perform novel research with some of her sixth-form students. ORBYTS now involves more than 30 pupils in eight schools across the UK.
Outreach, inclusivity and diversity are fundamental to ORBYTS: the programme is designed to be accessi-ble to pupils from groups traditionally under-represented in STEM subjects and the space and science communi-ties. Most of the tutors are female, as are the Twinkle mission’s lead scientist and lead engineer, something the team is proud of and wishes to build upon.
How ORBYTS worksAn early-career scientist, either a PhD student or postdoctoral researcher, is paired with a small group of schoolchildren and typically visits them fortnightly to teach the undergraduate-level physics they’ll need to understand the work they’ll be doing. If the ORBYTS work is good enough, the pupils will be co-authors on a paper in a peer-reviewed journal, while the scientists gain experience in supervising individuals and leading a research project. Teach-ing methods evolve as tutors’ careers develop. For example, one of the original ORBYTS tutors, Maire Gorman, moved to Aberystwyth University last year and now delivers ORBYTS projects remotely to pupils at St Brendan’s College, Bristol, using videos with transcripts, Skype calls and email. Also, both Aberystwyth and UCL have hosted six-week-long summer placements in 2016 and 2017.
ORBYTS projects have focused on molecular spectroscopy, but the range of topics will expand to include, for example, exoplanets and their stellar companions, the origin of life and the engineering side of the Twinkle mission. Specific projects can be tailored to the tutor’s interests and research area.
In one project, pupils were assigned a molecule relevant to exoplanet atmospheres. After locating, collating and formating a lot of experimental spec-troscopic data, they used software made by collabo-rators in Hungary to obtain accurate experimental
energy levels. This is essential research that will help the Twinkle mission to detect these molecules in the atmo-spheres of exoplanets. In another continuing project, pupils are updating the highly cited 1979 Huber & Herz-
berg database of spectroscopic constants of diatomic molecules by searching the literature to find any experimental results containing updated constants.
Research projects such as these are necessary but time-consuming for academics. ORBYTS demon-strates that school pupils can contribute valuable research information. Pupils not only increase their scientific knowledge, but also gain scientific skills such as literature searching and using advanced Excel; they also gain soft skills such as time manage-ment, presentation of complex research findings to general audiences and email communication skills. Participation changes pupils’ preconceived notions of what is involved in scientific research and who a scientist is.
Feedback from teachers of the pupils has been positive. “The opportunity to work with young scientists is gold dust to the students and they show their appreciation through their professionalism and dedication to the project,” says Jon Barker, physics teacher at Highams Park School. “To have three stu-dents as named authors on a published paper from the first year of the ORBYTS programme was a great honour to them as well as the school.”
The aim is to expand ORBYTS into more schools and universities, involving and inspiring students in real science. If you would like to be a part of this, please contact [email protected]. ●
Bringing pupils into the ORBYTS of research The Twinkle ORBYTS team discuss their approach to original research with school-aged scientists.
‘‘Participation changes pupils’ notions of scientific research and who a scientist is’’
AUTHORSThe ORBYTS tutorial team is Dr Laura K McKemmish, Katy L Chubb, Tom Rivlin, Jack S Baker and Dr Maire N Gorman, supported by Anita Heward, William Dunn, Marcell Tessenyi and the rest of the Twinkle team. Our thanks to ORBYTS creator Clara Sousa-Silva and former ORBYTS tutor Emma J Barton. ORBYTS is funded by SpaceLink Learning Foundation, High-gate School via its Chrysalis Partnership programme, the Nuffield Foundation and Widening Participation depart-ments of University College London and Aberystwyth University. ORBYTS teams have been based at Highams Park, Highgate School, St Brendan’s College and Westminster City.
MORE INFORMATIONORBYTS [email protected] in Schools http://www.researchersinschools.orgTwinkle http://www.twinkle-spacemission.co.uk
1 ORBYTS in action with (left) Laura McKemmish. (R L Coates)
Dow
nloaded from https://academ
ic.oup.com/astrogeo/article/58/5/ASTR
OG
/4176289 by guest on 11 February 2022
1820–2020 BRIEF LIVES
5.12 A&G • October 2017 • Vol. 58 • aandg.org
When the found-ers met in 1820, the Revd
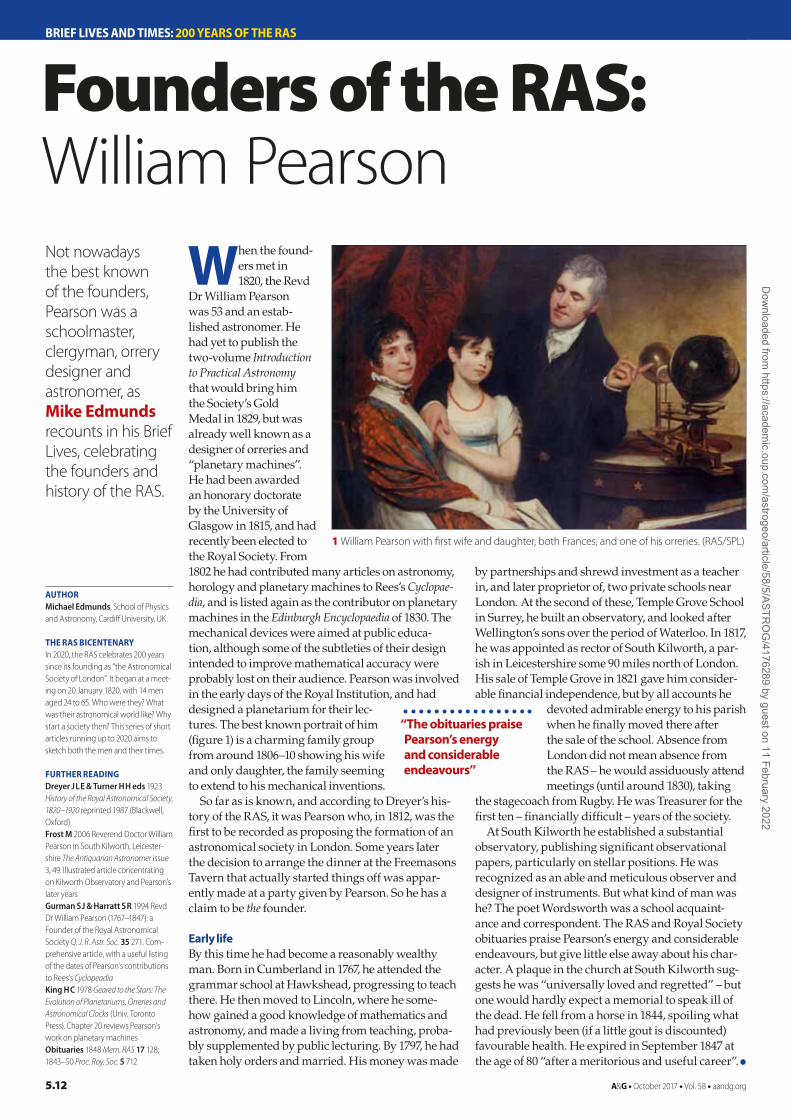
Dr William Pearson was 53 and an estab-lished astronomer. He had yet to publish the two-volume Introduction to Practical Astronomy that would bring him the Society’s Gold Medal in 1829, but was already well known as a designer of orreries and “planetary machines”. He had been awarded an honorary doctorate by the University of Glasgow in 1815, and had recently been elected to the Royal Society. From 1802 he had contributed many articles on astronomy, horology and planetary machines to Rees’s Cyclopae-dia, and is listed again as the contributor on planetary machines in the Edinburgh Encyclopaedia of 1830. The mechanical devices were aimed at public educa-tion, although some of the subtleties of their design intended to improve mathematical accuracy were probably lost on their audience. Pearson was involved in the early days of the Royal Institution, and had designed a planetarium for their lec-tures. The best known portrait of him (figure 1) is a charming family group from around 1806–10 showing his wife and only daughter, the family seeming to extend to his mechanical inventions.
So far as is known, and according to Dreyer’s his-tory of the RAS, it was Pearson who, in 1812, was the first to be recorded as proposing the formation of an astronomical society in London. Some years later the decision to arrange the dinner at the Freemasons Tavern that actually started things off was appar-ently made at a party given by Pearson. So he has a claim to be the founder.
Early lifeBy this time he had become a reasonably wealthy man. Born in Cumberland in 1767, he attended the grammar school at Hawkshead, progressing to teach there. He then moved to Lincoln, where he some-how gained a good knowledge of mathematics and astronomy, and made a living from teaching, proba-bly supplemented by public lecturing. By 1797, he had taken holy orders and married. His money was made
by partnerships and shrewd investment as a teacher in, and later proprietor of, two private schools near London. At the second of these, Temple Grove School in Surrey, he built an observatory, and looked after Wellington’s sons over the period of Waterloo. In 1817, he was appointed as rector of South Kilworth, a par-ish in Leicestershire some 90 miles north of London. His sale of Temple Grove in 1821 gave him consider-able financial independence, but by all accounts he
devoted admirable energy to his parish when he finally moved there after the sale of the school. Absence from London did not mean absence from the RAS – he would assiduously attend meetings (until around 1830), taking
the stagecoach from Rugby. He was Treasurer for the first ten – financially difficult – years of the society.
At South Kilworth he established a substantial observatory, publishing significant observational papers, particularly on stellar positions. He was recognized as an able and meticulous observer and designer of instruments. But what kind of man was he? The poet Wordsworth was a school acquaint-ance and correspondent. The RAS and Royal Society obituaries praise Pearson’s energy and considerable endeavours, but give little else away about his char-acter. A plaque in the church at South Kilworth sug-gests he was “universally loved and regretted” – but one would hardly expect a memorial to speak ill of the dead. He fell from a horse in 1844, spoiling what had previously been (if a little gout is discounted) favourable health. He expired in September 1847 at the age of 80 “after a meritorious and useful career”. ●
Founders of the RAS:William PearsonNot nowadays the best known of the founders, Pearson was a schoolmaster, clergyman, orrery designer and astronomer, as Mike Edmunds recounts in his Brief Lives, celebrating the founders and history of the RAS.
‘‘The obituaries praise Pearson’s energy and considerable endeavours’’
AUTHORMichael Edmunds, School of Physics and Astronomy, Cardiff University, UK.
THE RAS BICENTENARYIn 2020, the RAS celebrates 200 years since its founding as “the Astronomical Society of London”. It began at a meet-ing on 20 January 1820, with 14 men aged 24 to 65. Who were they? What was their astronomical world like? Why start a society then? This series of short articles running up to 2020 aims to sketch both the men and their times.
FURTHER READINGDreyer J L E & Turner H H eds 1923 History of the Royal Astronomical Society, 1820–1920 reprinted 1987 (Blackwell, Oxford)Frost M 2006 Reverend Doctor William Pearson in South Kilworth, Leicester-shire The Antiquarian Astronomer issue 3, 49. Illustrated article concentrating on Kilworth Observatory and Pearson’s later yearsGurman S J & Harratt S R 1994 Revd Dr William Pearson (1767–1847): a Founder of the Royal Astronomical Society Q. J. R. Astr. Soc. 35 271. Com-prehensive article, with a useful listing of the dates of Pearson’s contributions to Rees’s Cyclopeadia King H C 1978 Geared to the Stars: The Evolution of Planetariums, Orreries and Astronomical Clocks (Univ. Toronto Press). Chapter 20 reviews Pearson’s work on planetary machinesObituaries 1848 Mem. RAS 17 128; 1843–50 Proc. Roy. Soc. 5 712
BRIEF LIVES AND TImES: 200 YEARS OF THE RAS
1 William Pearson with first wife and daughter, both Frances, and one of his orreries. (RAS/SPL)
Dow
nloaded from https://academ
ic.oup.com/astrogeo/article/58/5/ASTR
OG
/4176289 by guest on 11 February 2022

GALACTIC EVOLUTION
A&G • October 2017 • Vol. 58 • aandg.org 5.13
A glance at the night sky reveals a myriad of multicoloured stars of varying brightnesses. On a par-
ticularly clear night we might even detect a coherent band of stars across the night sky (figure 1). Ancient Greeks called this blurry band the Milky Way. Galileo Galilei first resolved its individual stars with his telescope in 1610. Most astronomers believed that all the stars in the universe belonged to our Milky Way, until 1924, when Edwin Hubble showed that the Milky Way is just one of many galaxies, of a type called a spiral galaxy.
Spiral galaxies were first believed to be simple pancakes in which stars follow simple circular orbits but, over time, as astronomical data have become more accu-rate, our perception of their structure has
become increasingly complex. Many spiral galaxies exhibit discs composed of two populations that are distinct both kinemati-cally and chemically. The narrower “thin disc” contains dust and gas as well as stars, while the broader “thick disc” contains
only stars. Thick discs may have formed in a single burst of star formation, while thin discs may be forming stars continually. Spiral arms emanating from the thin disc
are thought to be the sites of ongoing star formation. They are easily visible in images of distant galaxies, but in our own Milky Way they can only be detected indirectly through star counts. Bulges are central dense concentrations of stars found in most spiral galaxies, and may be synonymous with the bars observed in some spiral gal-axies. These components may have formed
The evolution of spiral galaxiesPaula Jofré and Payel Das discuss galactic evolution by applying the biological concept of the family tree to the stars in the Milky Way.
“Many spiral galaxies exhibit discs composed of two distinct populations”
1 Edge-on view of the Milky Way’s plane above the European Southern Observatory at Mount Paranal in Chile. (B Fugate [FASORtronics]/ESO)
Dow
nloaded from https://academ
ic.oup.com/astrogeo/article/58/5/ASTR
OG
/4176289 by guest on 11 February 2022

GALACTIC EVOLUTION
5.14 A&G • October 2017 • Vol. 58 • aandg.org
from a dissipative collapse at the beginning of galaxy formation, secular evolution pro-cesses, or interactions with other galaxies. Finally, there is a fainter spherical concen-tration of stars called the stellar halo that is thought to have assembled from smaller stellar systems that have been accreted. The stars in each of these components therefore encodes their unique formation histories.
An invaluable laboratoryIt is only in the Milky Way that we can resolve individual stars from each of these components, thus offering a precious labo-ratory for studies of spiral galaxies and their place in the big picture of galaxy evolution.
High-resolution spectra of stars such as those in figure 2 show thousands of absorp-tion lines that reflect atomic and molecular transitions occurring in a range of elements in the stellar atmosphere surrounding the stellar core of stars. The frequencies of the transitions are known from laboratory measurements and therefore absorption lines at given frequencies show the pres-ence of a given chemical element in the star. The strength of the lines indicates the abundance of that given chemical element, but also its temperature, surface gravity and total metal content (the so-called atmo-spheric parameters). The more spectral lines astronomers can resolve from the observations, the better the atmospheric parameters and individual chemical abun-dances can be disentangled.
High-resolution spectra from world-class instruments make it possible to measure abundances of about 15 different chemi-cal elements in typical Milky Way stars. Each of these elements is produced in a range of nucleosynthetic processes, from stellar winds to different kinds of super-novae explosions of massive stars (figure 3). Super novae and stellar winds create new chemical elements, bringing fresh and more metal-rich material into the inter-stellar medium. A new generation of stars will form out of this enriched gas; chemical evolution happens with the metal content of the universe increasing with time.
The rate at which metals increase depends on the nucleosynthesis process of each chemical element, which in turn depends on the mass and the chemical com-position of the progenitor star. These rates come from the so-called “stellar yields”. Furthermore, gas density plays a key role as a critical mass is required to form new stars. More dense regions will form more stars and experience a faster chemical enrich-ment history than less dense regions.
Galactic fossilsStars with masses equal to that of the Sun or below, which have spectral class F, G and K (the Sun is a class G star), are the perfect
tracers for studies of the Milky Way for several reasons. First, their masses imply a very slow evolution, which means they are as old as the universe and, second, they are numerous. Thus, we can observe several stars that were born at the very early stages of the formation of the Milky Way. This is why astronomers call them fossils. Third, their evolution is quiescent, in the sense they experience no strong mass loss or mixing of material between the stellar interior and stellar atmo sphere. This means that the chemical pattern of these stars accurately encodes the interstellar medium chemi-cal pattern at the galactic position and time they were born; astronomers often compare the chemical pattern of such stars to DNA in living forms on Earth. This is rather unlike their dynamical properties, which may change over time as the stars experience secular processes such as radial migration through resonances with the bar or spiral arms, and heating through collisions with giant molecular clouds. Interactions with external systems can also lead to changes in dynamical properties. Fourth, stars of these spectral classes are bright enough to observe at large distances, allowing us to probe regions in the Milky Way beyond the solar neighbourhood. Lastly, the spectra of FGK-type stars are easy to analyse because they do not exhibit the strong molecular features typical of cooler supergiants, and do not suffer from strong non-local thermo-dynamical equilibrium effects as experi-enced by hotter and brighter stars.
Although the dynamical properties of stars can change with time, observa-tions related to their current dynamics are invaluable. More specifically, astrometric information provides astronomers with the positions of stars in the sky, as well as their parallax and proper motions. In addition to chemical abundances, stellar spectra contain information regarding their line-of-sight velocity: absorption lines in the spectra will be shifted from the rest-frame as a result of the Doppler effect. The paral-lax hints at the distance, while the proper motions combined with the distance hint at the transverse velocity. Knowledge
of the full 6-D phase-space coordinates allows derivation of the orbit. These orbits can be used to trace back or forward the trajectories of stars in our galaxy and find out where they were born or predict where they will die. However, processes such as radial migration and disc heating change orbital properties, so this is reliable only where these processes are not important. The type of orbit also helps identify which
component of the Milky Way the star belongs to.
The other question about Milky Way stars is when they formed. Knowledge of stellar ages is crucial to finding their
birthplace. Ages can be determined best with the help of stellar evolution models, which predict stellar parameters such as mass, effective temperature, luminosity and surface density of stars at a given chemical composition. As discussed above, the chem-ical composition, effective temperature and surface gravity can be obtained from analy-sis of stellar spectra. Spectral lines are not only shifted from their rest-frame positions as a result of their line-of-sight velocities, but also as a result of their stellar properties. By fitting synthetic spectra to observed spectra, it is possible to determine these parameters. If the distance is known, the intrinsic lumi-nosity of the star can be derived, and thus the mass and age can be constrained with stellar evolutionary models.
While this procedure seems straight-forward, stellar ages remain uncertain, in particular for old stars because the differ-ences predicted by different models are very small compared to the errors with which stellar parameters can be determined. Also, stellar evolutionary models are based on theories that are not well understood, such as convection. This range of hurdles makes stellar age determination one of the most challenging tasks in the field.
Assembling the cluesThe ease with which we can study the Milky Way provided the motivation for large investments in space missions such as the cornerstone Gaia mission. Astrometric information for more than two million stars was released by Gaia in September 2016.
552.6 552.8 553.0 553.2 553.4 553.6 553.8Wavelength (nm)
Fe
Fe
Sc
Ti
Mg
Fe Fe
Ti Ti
Co
Fe
FeM
o
V
Fe
Ba
Fe
Ni
Mn
Fe
Fe
ProcyonArcturus
“Chemical composition, temperature and surface gravity can be obtained from spectra”
2 High-resolution spectra show elemental abundances in the stars Procyon and Arcturus.
Dow
nloaded from https://academ
ic.oup.com/astrogeo/article/58/5/ASTR
OG
/4176289 by guest on 11 February 2022

GALACTIC EVOLUTION
A&G • October 2017 • Vol. 58 • aandg.org 5.15
This data set is complemented by accurate photometry from surveys including the Two Micron All-Sky Survey (2MASS) and the Sloan Digital Sky Survey (SDSS), and detailed spectroscopy from surveys such as the APO Galactic Evolution Experiment (APOGEE) and Gaia-ESO. Milky Way science is being revolutionized with the advent of asteroseismology. This analyses the power spectrum of acoustic stellar oscillations, related to the inner structure of the star, such as the radius and the mass of the core. This gives better input information for stellar evolutionary models and thus better ages. Unfortu-nately, only a small sample of stars have been observed this way so far, by missions such as Kepler.
We are at the beginning of a golden era in galactic archaeology: next year, the second data release of Gaia will provide parallaxes and proper motions of unprec-edented accuracy for a billion stars. In addition, in 2018 the William Herschel Tel-escope Enhanced Area Velocity Explorer (WEAVE) will begin commissioning, signalling the start of a new generation of multi-object spectroscopic surveys. This will be followed by the initiation of the 4 m Multi-Object Spectroscopic Telescope (4MOST) in 2020, which together with WEAVE will cover most of the sky. The Transiting Exoplanet Survey Satellite (TESS) and Planetary Transits and Oscilla-tions of stars (PLATO) are next-generation asteroseismic space surveys planned for 2018 and 2025 respectively, also surveying Gaia stars. Finally, the Large Synoptic Sur-vey Telescope in a 10-year survey sched-uled for the 2020s from Chile, will survey half of the sky hundreds of times, pro-ducing a photometric survey a thousand times larger than any other existing today, cataloguing the colours, brightnesses and proper motions of billions of new stars.
The ultimate goal in this field is to
combine information on chemical elements at different places and epochs in the history of our Milky Way to create models of its formation and evolution.
Evolution, pure and fundamentalThe theory of evolution by natural selec-tion set out by Charles Darwin states that all organic beings on our planet have descended from one primordial form. This view of descent with modification recognizes a “tree of life” (phylogeny) that
connects all forms of life. The key assumption in this approach is that there is continuity from one genera-tion to the next, with change occurring from ancestral to
descendant forms. Therefore, where two units share the same characteristics, they do so because they have inherited it from a common ancestor.
It was an encounter between one of us (Paula Jofré) and an evolutionary biologist (Robert Foley) in King’s College, Cambridge that made the connection: a phylogenetic approach can also be applied to stars in galaxies, even if the mechanisms of descent are very different. As discussed above, the most massive stars explode in super-novae, donating metal-enriched gas to the interstellar medium, which eventually accumulates to form new molecular clouds and produce a new generation of stars. This process of descent mirrors that of biological descent, even though the change or evolu-tion is driven by different processes. In the case of stars, as is also the case in some emerging fields of biology, it is the environ-ments that are inherited (i.e. information is passed down through time in a manner that conserves it), and phylogenetics is a method for tracking that history and inher-itance. It should be emphasized that this approach does not equate stellar evolution to biological evolution, but rather uses some properties shared by stars and organisms
to apply phylogenetic approaches. It is important to mention here that phy-
logenetic approaches are not only applied to living beings whose evolution is driven by survival and adaptation, but to other subjects as well, for example the evolution of languages, as discussed extensively by Pagel (2009). Features of lexical evolution can be studied by recording evolved simi-larities and differences among languages, which are used to infer linguistic phylo-genetic trees. As in biology, phylogenies in this case are used to describe histori-cal relationships. This forms the basis of comparative studies that aim to understand the evolution of linguistic traits, but also how other cultural traits have co-evolved with the languages. A language or a culture does not evolve because it needs to survive; the same can be said for the interstellar medium and the stars forming from it.
Phylogenetic techniques have existed for more than a century, but the strength of these approaches has been demonstrated recently with the expansion of genomics. The mechanisms of change in biology can be more easily quantified, because the rates and probabilities of change in DNA can be estimated from laboratory experiments. In astrophysics, as discussed above, the chemical pattern obtained from the spectral analysis of FGK-type stars can be inter-preted as stellar “DNA”. This provides the continuity and recorded history that is the equivalent of actual DNA of living beings, although obviously in many other ways it is very different. Stellar populations, for exam-ple, do not experience the need of adaptation as a population of organisms does, but will evolve if certain conditions are met, such as having the critical mass of gas to form stars.
As we will discuss in detail below, the greatest advantage of using trees is not only its efficient way of clustering the data, reducing its dimensionality, and providing diagrams that are comfortable to visualize, but the information they provide on the history of the system. Phylogenetics makes it possible to represent the shared and divergent history among stars, as measured by their degree of similarity, which is rep-resented in the branching sequence. Earlier this year, we led a publication in Monthly Notices of the RAS of the first phylogenetic tree of stars in the solar neighbourhood (figure 4; Jofré et al. 2017). In this article we describe our methodology.
Building a phylogenetic tree There are four steps to building a tree: (1) define taxa, (2) define distance matrix, (3) calculate branch length, (4) assess robustness of the tree. We explain in more detail below.
The first step, defining taxa, involves identifying the categories to be studied.
“The chemical pattern from spectral analysis can be interpreted as stellar DNA”
3 The origins of the solar system elements. (J Johnson/ESA/NASA/AASNova)
Dow
nloaded from https://academ
ic.oup.com/astrogeo/article/58/5/ASTR
OG
/4176289 by guest on 11 February 2022
GALACTIC EVOLUTION
5.16 A&G • October 2017 • Vol. 58 • aandg.org
In this context, the taxa can be individual stars or entire populations such as clusters or the bulge, thin disc, thick disc, halo, etc. We took a sample of 21 solar twins and the Sun. By construction, these stars are very similar to the Sun, of G-type spectral class and solar metallicities. The advantage of using solar twins was that a differential analysis of these stars with respect to the Sun could be performed. Furthermore, stellar evolutionary models are best tested in the Sun and are therefore more accurate. These stars, being close by, also benefit from accurate astrometry, which gives the extra information required to derive their dynamical properties. Indeed, it was shown in previous studies on these 21 stars by Nissen (2015) that tiny differences in cer-tain chemical elements of these stars were related to the chemical evolution in the solar neighbourhood. This was our motiva-tion for considering these stars, but stars in stellar clusters could also be used as taxa.
The solar twins have been observed with the High Accuracy Radial velocity Planet Searcher (HARPS) spectrograph in Chile. This instrument is of extremely high resolution and extended wavelength coverage. Furthermore, since the stars are close by, they are very bright, which means the spectra have very high signal-to-noise. This allowed Nissen to measure the elemental abundances of 17 different chemical elements with an accuracy better than 0.01 dex, spanning from light elements such as carbon to very heavy ones such as barium. These elements were treated as our “stellar DNA”. The ages were derived using standard methods, i.e. finding the best isochrone for the stellar parameters determined for the stars.
The second step involves generating the distance matrix. A tree determines the rela-tions between taxa and therefore a measure for their difference needs to be specified. Each pair of taxa has a difference that can be written in terms of a distance matrix of n × n dimensions (n = number of taxa). We define each matrix element as the total of the difference in elemental abundances between each pair of stars.
Then, with the distance matrix in place, a clustering algorithm needs to be applied in order to calculate the branching pattern of the taxa. There are several clustering algorithms and programs; a very popular one is the neighbour-joining (NJ) method. This method allows for different evolution-ary rates along different branches, which means that branch lengths are scaled as their divergence in the distance matrix. The NJ method (Saitou & Nei 1987) is the fastest tree-building algorithm used in molecular biology and allows for different evolution-ary rates in different branches, which is why it is so popular. When dealing with
large samples of taxa or extended DNA, a fast clustering algorithm is necessary, in particular when assessing the robustness of the tree (discussed below). A popular software that implements the NJ clustering method is MEGA (http://www.megasoft-ware.net), which was used in this work.
Because abundance measurements have errors, and because we do not know a priori which element dominates the chemical dif-ferences between taxa, a systematic study has to be performed in order to assess the robustness of the tree, the fourth step in the tree-building process. We employed a standard procedure following Monte Carlo simulations and bootstrap. We ran Monte Carlo simulations by assigning new random chemical patterns to each star, assuming a normal distribution for the errors. As each simulation will have a slightly different distance matrix, a different tree topol-ogy may be generated. This procedure can be repeated many times.
We also carried out a bootstrap analysis, consisting of randomly removing elements from the chemical pattern. To maintain the length of our stellar DNA, we randomly sampled with replacement 17 elements, and therefore some elements may not be selected, while others are picked multiple times. As in the Monte Carlo simulation, this procedure can be repeated many times, each time building a tree from a slightly different distance matrix.
Combining both procedures in each simulation, we computed 1000 different trees. A final consensus tree was created in which only the branches that appeared consistently in the same location at least in 50% of the trees were selected. The rest are part of an undetermined population, which either can be attributed to a branch if we have more chemical elements (more DNA information) or more stars.
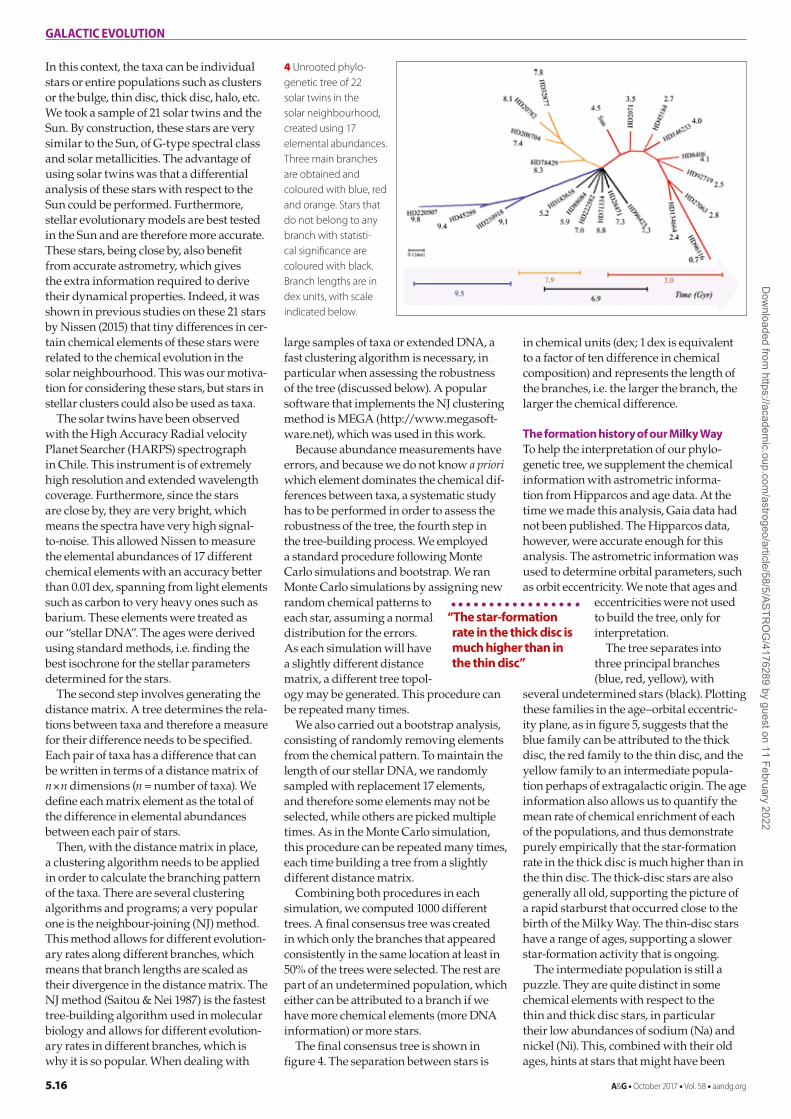
The final consensus tree is shown in figure 4. The separation between stars is
in chemical units (dex; 1 dex is equivalent to a factor of ten difference in chemical composition) and represents the length of the branches, i.e. the larger the branch, the larger the chemical difference.
The formation history of our Milky WayTo help the interpretation of our phylo-genetic tree, we supplement the chemical information with astrometric informa-tion from Hipparcos and age data. At the time we made this analysis, Gaia data had not been published. The Hipparcos data, however, were accurate enough for this analysis. The astrometric information was used to determine orbital parameters, such as orbit eccentricity. We note that ages and
eccentricities were not used to build the tree, only for interpretation.
The tree separates into three principal branches (blue, red, yellow), with
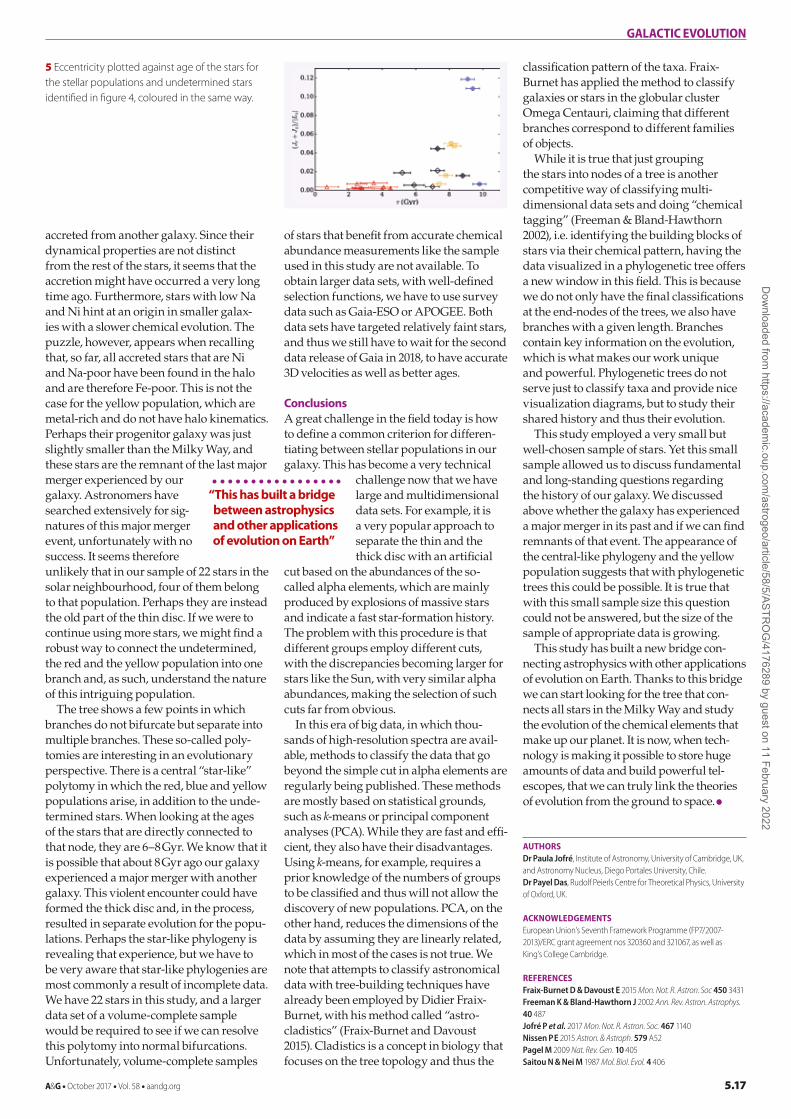
several undetermined stars (black). Plotting these families in the age–orbital eccentric-ity plane, as in figure 5, suggests that the blue family can be attributed to the thick disc, the red family to the thin disc, and the yellow family to an intermediate popula-tion perhaps of extragalactic origin. The age information also allows us to quantify the mean rate of chemical enrichment of each of the populations, and thus demonstrate purely empirically that the star-formation rate in the thick disc is much higher than in the thin disc. The thick-disc stars are also generally all old, supporting the picture of a rapid starburst that occurred close to the birth of the Milky Way. The thin-disc stars have a range of ages, supporting a slower star-formation activity that is ongoing.
The intermediate population is still a puzzle. They are quite distinct in some chemical elements with respect to the thin and thick disc stars, in particular their low abundances of sodium (Na) and nickel (Ni). This, combined with their old ages, hints at stars that might have been
“The star-formation rate in the thick disc is much higher than in the thin disc”
4 Unrooted phylo-genetic tree of 22 solar twins in the solar neighbourhood, created using 17 elemental abundances. Three main branches are obtained and coloured with blue, red and orange. Stars that do not belong to any branch with statisti-cal significance are coloured with black. Branch lengths are in dex units, with scale indicated below.
Dow
nloaded from https://academ
ic.oup.com/astrogeo/article/58/5/ASTR
OG
/4176289 by guest on 11 February 2022
GALACTIC EVOLUTION
A&G • October 2017 • Vol. 58 • aandg.org 5.17
accreted from another galaxy. Since their dynamical properties are not distinct from the rest of the stars, it seems that the accretion might have occurred a very long time ago. Furthermore, stars with low Na and Ni hint at an origin in smaller galax-ies with a slower chemical evolution. The puzzle, however, appears when recalling that, so far, all accreted stars that are Ni and Na-poor have been found in the halo and are therefore Fe-poor. This is not the case for the yellow population, which are metal-rich and do not have halo kinematics. Perhaps their progenitor galaxy was just slightly smaller than the Milky Way, and these stars are the remnant of the last major merger experienced by our galaxy. Astronomers have searched extensively for sig-natures of this major merger event, unfortunately with no success. It seems therefore unlikely that in our sample of 22 stars in the solar neighbourhood, four of them belong to that population. Perhaps they are instead the old part of the thin disc. If we were to continue using more stars, we might find a robust way to connect the undetermined, the red and the yellow population into one branch and, as such, understand the nature of this intriguing population.
The tree shows a few points in which branches do not bifurcate but separate into multiple branches. These so-called poly-tomies are interesting in an evolutionary perspective. There is a central “star-like” polytomy in which the red, blue and yellow populations arise, in addition to the unde-termined stars. When looking at the ages of the stars that are directly connected to that node, they are 6–8 Gyr. We know that it is possible that about 8 Gyr ago our galaxy experienced a major merger with another galaxy. This violent encounter could have formed the thick disc and, in the process, resulted in separate evolution for the popu-lations. Perhaps the star-like phylogeny is revealing that experience, but we have to be very aware that star-like phylogenies are most commonly a result of incomplete data. We have 22 stars in this study, and a larger data set of a volume-complete sample would be required to see if we can resolve this polytomy into normal bifurcations. Unfortunately, volume-complete samples
of stars that benefit from accurate chemical abundance measurements like the sample used in this study are not available. To obtain larger data sets, with well-defined selection functions, we have to use survey data such as Gaia-ESO or APOGEE. Both data sets have targeted relatively faint stars, and thus we still have to wait for the second data release of Gaia in 2018, to have accurate 3D velocities as well as better ages.
ConclusionsA great challenge in the field today is how to define a common criterion for differen-tiating between stellar populations in our galaxy. This has become a very technical
challenge now that we have large and multidimensional data sets. For example, it is a very popular approach to separate the thin and the thick disc with an artificial
cut based on the abundances of the so-called alpha elements, which are mainly produced by explosions of massive stars and indicate a fast star-formation history. The problem with this procedure is that different groups employ different cuts, with the discrepancies becoming larger for stars like the Sun, with very similar alpha abundances, making the selection of such cuts far from obvious.
In this era of big data, in which thou-sands of high-resolution spectra are avail-able, methods to classify the data that go beyond the simple cut in alpha elements are regularly being published. These methods are mostly based on statistical grounds, such as k-means or principal component analyses (PCA). While they are fast and effi-cient, they also have their disadvantages. Using k-means, for example, requires a prior knowledge of the numbers of groups to be classified and thus will not allow the discovery of new populations. PCA, on the other hand, reduces the dimensions of the data by assuming they are linearly related, which in most of the cases is not true. We note that attempts to classify astronomical data with tree-building techniques have already been employed by Didier Fraix-Burnet, with his method called “astro-cladistics” (Fraix-Burnet and Davoust 2015). Cladistics is a concept in biology that focuses on the tree topology and thus the
classification pattern of the taxa. Fraix-Burnet has applied the method to classify galaxies or stars in the globular cluster Omega Centauri, claiming that different branches correspond to different families of objects.
While it is true that just grouping the stars into nodes of a tree is another competitive way of classifying multi-dimensional data sets and doing “chemical tagging” (Freeman & Bland-Hawthorn 2002), i.e. identifying the building blocks of stars via their chemical pattern, having the data visualized in a phylogenetic tree offers a new window in this field. This is because we do not only have the final classifications at the end-nodes of the trees, we also have branches with a given length. Branches contain key information on the evolution, which is what makes our work unique and powerful. Phylogenetic trees do not serve just to classify taxa and provide nice visualization diagrams, but to study their shared history and thus their evolution.
This study employed a very small but well-chosen sample of stars. Yet this small sample allowed us to discuss fundamental and long-standing questions regarding the history of our galaxy. We discussed above whether the galaxy has experienced a major merger in its past and if we can find remnants of that event. The appearance of the central-like phylogeny and the yellow population suggests that with phylogenetic trees this could be possible. It is true that with this small sample size this question could not be answered, but the size of the sample of appropriate data is growing.
This study has built a new bridge con-necting astrophysics with other applications of evolution on Earth. Thanks to this bridge we can start looking for the tree that con-nects all stars in the Milky Way and study the evolution of the chemical elements that make up our planet. It is now, when tech-nology is making it possible to store huge amounts of data and build powerful tel-escopes, that we can truly link the theories of evolution from the ground to space. ●
AUTHORSDr Paula Jofré, Institute of Astronomy, University of Cambridge, UK, and Astronomy Nucleus, Diego Portales University, Chile. Dr Payel Das, Rudolf Peierls Centre for Theoretical Physics, University of Oxford, UK.
ACkNOwLEdGEmENTS European Union’s Seventh Framework Programme (FP7/2007-2013)/ERC grant agreement nos 320360 and 321067, as well asKing’s College Cambridge.
REfERENCESFraix-Burnet D & Davoust E 2015 Mon. Not. R. Astron. Soc 450 3431 Freeman K & Bland-Hawthorn J 2002 Ann. Rev. Astron. Astrophys. 40 487Jofré P et al. 2017 Mon. Not. R. Astron. Soc. 467 1140Nissen P E 2015 Astron. & Astroph. 579 A52Pagel M 2009 Nat. Rev. Gen. 10 405Saitou N & Nei M 1987 Mol. Biol. Evol. 4 406
“This has built a bridge between astrophysics and other applications of evolution on Earth”
5 Eccentricity plotted against age of the stars for the stellar populations and undetermined stars identified in figure 4, coloured in the same way.
Dow
nloaded from https://academ
ic.oup.com/astrogeo/article/58/5/ASTR
OG
/4176289 by guest on 11 February 2022

SEARCH FOR LIFE
5.18 A&G • October 2017 • Vol. 58 • aandg.org
No discipline of science stands alone. Astronomy gives context to Earth science, but the reverse is also true:
geology informs astronomy, especially when it comes to planets. For example, how do we know Olympus Mons is a volcano? It’s never been seen to erupt and there are, as yet, no direct samples of the rocks from which it is made. Neverthe-less, we’re pretty sure Olympus Mons is a volcano simply because it looks exactly like shield volcanoes on Earth (although it is a bit bigger). This need for planetary science to be constrained by Earth science is especially pertinent when it comes to the search for extraterrestrial life. Earth is the only place in the cosmos that we know possesses biology and so, in our search for life elsewhere, we must lean heavily on insights from Earth’s history. The search for life involves looking for biosignatures – observable features that are diagnostic of biology – and the easiest of these to spot remotely are those based on atmospheric composition. However, it is far from clear that the atmospheric biosignatures of Earth (e.g. the simultaneous presence of both oxygen and methane) have wide applicability across all potentially inhab-ited worlds. In this article I will concen-trate, in particular, on how Earth science might help any future remote detection of life on exoplanets, although much of what follows applies equally well to the search for life within the solar system.
Exoplanet spectraIt is remarkable that, within two decades of discovering our first exoplanets, we have been able to start analysing the contents of their atmospheres. Transmission spectra of the atmospheres of transiting exoplanets (i.e. planets that pass between us and their host star as they orbit) can be measured because the depth of the fall in brightness, during transit, increases with the appar-ent size of the planet. This apparent size, in turn, is slightly larger at wavelengths where the atmosphere is opaque than it is at wavelengths where it is transparent. A plot of transit depth against wavelength
therefore gives a transmission spectrum for the planet’s atmosphere and a way to determine atmospheric composition, as shown in figure 1.
So far, this technique has only been attempted for Jupiter-like gas giants orbit-ing close to their host stars, such as XO-1b, whose infrared (IR) spectrum is shown in figure 2, measured using the Hubble Space Telescope. A modelled spectrum is also shown, which assumes an atmosphere con-taining water, methane, carbon monoxide and carbon dioxide. The reasonable fit of data to model gives confidence that H2O, CH4 and CO2 are indeed present in the planet’s atmosphere, although the presence
of CO is less certain. It is also possible to obtain
reflection/emission spectra for transiting exoplanets (i.e. spectra of light reflected/emitted from the surface).
This is achieved by looking at the wave-length-dependent, tiny drop in bright-ness that occurs as an exoplanet passes behind the star. As with transmission spectra, these eclipse spectra can indicate composition but, in addition, they contain information about a planet’s temperature and clouds; it might even include specular reflection from liquids on the surface.
Both approaches require cutting-edge instruments. The launch of the James Webb Space Telescope (JWST) next year, ESA’s ARIEL mission, if selected (launch sched-uled for 2026, see http://ariel-spacemission.eu) and the commissioning of observatories such as the European Extremely Large Tele-scope (E-ELT) should ensure that we obtain many, high-quality exoplanet spectra over the coming decades. But will they show evidence of life?
Lunar spectroscopyOne way to test the idea that life can be detected in the spectra of exoplanets is to see if there is evidence of biology in similar spectra for Earth; such spectra can be obtained by pointing spectroscopes at our Moon. The reddish colour of the fully eclipsed Moon is the result of its illumination entirely by sunlight that has passed through the Earth’s atmosphere.
Earth system science and the search for life Earth system science can inform the search for extraterrestrial life – with the right cross-disciplinary approach. David Waltham makes the case for collaboration.
“In our search for life elsewhere, we must lean on insights from Earth’s history”
Dow
nloaded from https://academ
ic.oup.com/astrogeo/article/58/5/ASTR
OG
/4176289 by guest on 11 February 2022

SEARCH FOR LIFE
A&G • October 2017 • Vol. 58 • aandg.org 5.19
The spectrum of light reflected from the eclipsed Moon therefore shows absorp-tion features of the Earth’s atmosphere superimposed upon the spectrum of the Sun. Subtracting the solar spectrum from the eclipse spectrum gives a result equivalent to the spectrum obtained by transit spectroscopy of an exoplanet.
A resultant transmis-sion spectrum – in visible light and IR – is shown in figure 3 and exhibits the expected strong enhance-ment towards the red end of the visible wavelengths. It also shows absorption features resulting from molecular species present in the atmosphere, such as water
and carbon dioxide. Lines of oxygen and methane, which can also be seen, are of particular interest in the search for life. These molecules should react with each other, to produce carbon dioxide and water,
and hence one or other of these compounds should disappear on a timescale of a few decades. But on Earth, instead, the concentration of these mutually annihilating
compounds is maintained in the atmo-sphere by the processes of life.
An Earth-reflectivity spectrum (equiva-lent to an exoplanet eclipse spectrum) can also be obtained using the Moon but, this time, by taking the spectrum of Earthshine
– the Earth’s light reflected back at us by the unilluminated part of the Moon in solar shadow (see figure 4). The result-ant spectrum exhibits emission lines at many locations that were characterized by absorption in the transmission spectrum but, in addition, it shows a “red edge”; a step-up in reflectivity at around 0.7 µm that is well-known as the signature of chloro-phyll in our plants.
After Gaia The highly controversial Gaia hypothesis proposes that there is a virtuous loop in which life stabilizes the environment while a stable environment, in turn, helps life to thrive. The idea came to Gaia’s originator,
“All sides agree that, to understand Earth, we must treat her as a single, complex system”
1 (Left) A planet (red) with an atmosphere (blue) transiting across its host star. The transit lasts longer, and produces a bigger drop in star brightness, at wavelengths where the atmosphere is opaque because this makes the planet appear larger. (Right) A plot of transit depth against wavelength produces, in effect, a transmission spectrum for the transiting planet’s atmosphere.
3 Total eclipse of the Moon. Note red colour due to absorption of bluer light as it traversed Earth’s atmosphere (NASA). (Right) Visible light and IR spectrum of eclipsed Moon after removal of the solar spectrum (after Pallé et al. 2009). This spectrum is equivalent to that obtained by transit spectroscopy of an exoplanet and shows clear signs of life in the form of absorption features from the mutually annihilating gases methane and oxygen.
4 Three-day-old Moon showing Sun-illuminated crescent with the remainder illuminated faintly by light reflected off the Earth (courtesy Dylan O’Donnell). (Right) Spectrum of Earthshine after removal of solar spectrum (after Pallé et al. 2009). This spectrum is equivalent to that obtained by eclipse spectroscopy of an exoplanet and shows clear signs of life in the form of several peaks at the same wavelengths as the absorption lines in figure 3 and, in addition, the “red edge” associated with reflection by chlorophyll.
2 Infrared spectrum of the hot-Jupiter XO-1b (after Tinetti et al. 2010). Blue error bars show data from the Hubble Space Telescope. The red line is a model spectrum assuming an atmosphere containing water, methane, carbon monoxide and carbon dioxide.
Dow
nloaded from https://academ
ic.oup.com/astrogeo/article/58/5/ASTR
OG
/4176289 by guest on 11 February 2022
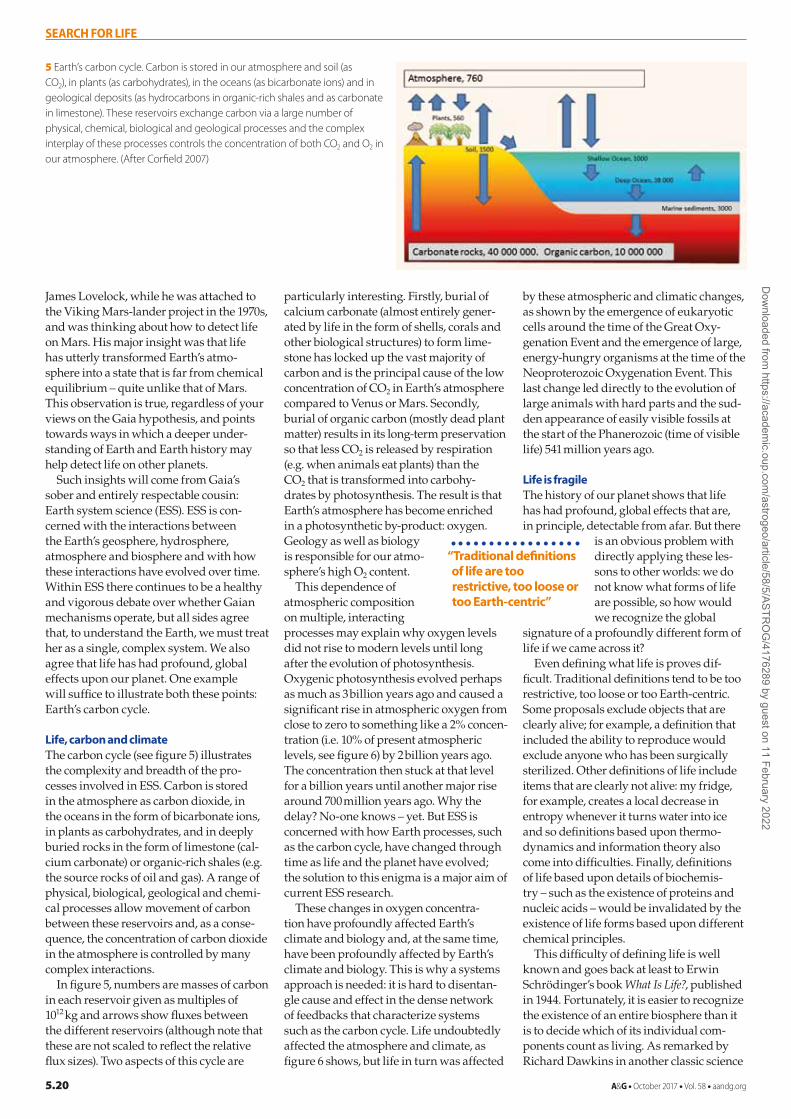
SEARCH FOR LIFE
5.20 A&G • October 2017 • Vol. 58 • aandg.org
James Lovelock, while he was attached to the Viking Mars-lander project in the 1970s, and was thinking about how to detect life on Mars. His major insight was that life has utterly transformed Earth’s atmo-sphere into a state that is far from chemical equilibrium – quite unlike that of Mars. This observation is true, regardless of your views on the Gaia hypothesis, and points towards ways in which a deeper under-standing of Earth and Earth history may help detect life on other planets.
Such insights will come from Gaia’s sober and entirely respectable cousin: Earth system science (ESS). ESS is con-cerned with the interactions between the Earth’s geosphere, hydrosphere, atmosphere and biosphere and with how these interactions have evolved over time. Within ESS there continues to be a healthy and vigorous debate over whether Gaian mechanisms operate, but all sides agree that, to understand the Earth, we must treat her as a single, complex system. We also agree that life has had profound, global effects upon our planet. One example will suffice to illustrate both these points: Earth’s carbon cycle.
Life, carbon and climateThe carbon cycle (see figure 5) illustrates the complexity and breadth of the pro-cesses involved in ESS. Carbon is stored in the atmosphere as carbon dioxide, in the oceans in the form of bicarbonate ions, in plants as carbohydrates, and in deeply buried rocks in the form of limestone (cal-cium carbonate) or organic-rich shales (e.g. the source rocks of oil and gas). A range of physical, biological, geological and chemi-cal processes allow movement of carbon between these reservoirs and, as a conse-quence, the concentration of carbon dioxide in the atmosphere is controlled by many complex interactions.
In figure 5, numbers are masses of carbon in each reservoir given as multiples of 1012 kg and arrows show fluxes between the different reservoirs (although note that these are not scaled to reflect the relative flux sizes). Two aspects of this cycle are
particularly interesting. Firstly, burial of calcium carbonate (almost entirely gener-ated by life in the form of shells, corals and other biological structures) to form lime-stone has locked up the vast majority of carbon and is the principal cause of the low concentration of CO2 in Earth’s atmosphere compared to Venus or Mars. Secondly, burial of organic carbon (mostly dead plant matter) results in its long-term preservation so that less CO2 is released by respiration (e.g. when animals eat plants) than the CO2 that is transformed into carbohy-drates by photosynthesis. The result is that Earth’s atmosphere has become enriched in a photo synthetic by-product: oxygen. Geology as well as biology is responsible for our atmo-sphere’s high O2 content.
This dependence of atmospheric composition on multiple, interacting processes may explain why oxygen levels did not rise to modern levels until long after the evolution of photosynthesis. Oxygenic photo synthesis evolved perhaps as much as 3 billion years ago and caused a significant rise in atmospheric oxygen from close to zero to something like a 2% concen-tration (i.e. 10% of present atmo spheric levels, see figure 6) by 2 billion years ago. The concentration then stuck at that level for a billion years until another major rise around 700 million years ago. Why the delay? No-one knows – yet. But ESS is concerned with how Earth processes, such as the carbon cycle, have changed through time as life and the planet have evolved; the solution to this enigma is a major aim of current ESS research.
These changes in oxygen concentra-tion have profoundly affected Earth’s climate and biology and, at the same time, have been profoundly affected by Earth’s climate and biology. This is why a systems approach is needed: it is hard to disentan-gle cause and effect in the dense network of feedbacks that characterize systems such as the carbon cycle. Life undoubtedly affected the atmosphere and climate, as figure 6 shows, but life in turn was affected
by these atmospheric and climatic changes, as shown by the emergence of eukaryotic cells around the time of the Great Oxy-genation Event and the emergence of large, energy-hungry organisms at the time of the Neoproterozoic Oxygenation Event. This last change led directly to the evolution of large animals with hard parts and the sud-den appearance of easily visible fossils at the start of the Phanerozoic (time of visible life) 541 million years ago.
Life is fragileThe history of our planet shows that life has had profound, global effects that are, in principle, detectable from afar. But there
is an obvious problem with directly applying these les-sons to other worlds: we do not know what forms of life are possible, so how would we recognize the global
signature of a profoundly different form of life if we came across it?
Even defining what life is proves dif-ficult. Traditional definitions tend to be too restrictive, too loose or too Earth-centric. Some proposals exclude objects that are clearly alive; for example, a definition that included the ability to reproduce would exclude anyone who has been surgically sterilized. Other definitions of life include items that are clearly not alive: my fridge, for example, creates a local decrease in entropy whenever it turns water into ice and so definitions based upon thermo-dynamics and information theory also come into difficulties. Finally, definitions of life based upon details of biochemis-try – such as the existence of proteins and nucleic acids – would be invalidated by the existence of life forms based upon different chemical principles.
This difficulty of defining life is well known and goes back at least to Erwin Schrödinger’s book What Is Life?, published in 1944. Fortunately, it is easier to recognize the existence of an entire biosphere than it is to decide which of its individual com-ponents count as living. As remarked by Richard Dawkins in another classic science
“Traditional definitions of life are too restrictive, too loose or too Earth-centric”
5 Earth’s carbon cycle. Carbon is stored in our atmosphere and soil (as CO2), in plants (as carbohydrates), in the oceans (as bicarbonate ions) and in geological deposits (as hydrocarbons in organic-rich shales and as carbonate in limestone). These reservoirs exchange carbon via a large number of physical, chemical, biological and geological processes and the complex interplay of these processes controls the concentration of both CO2 and O2 in our atmosphere. (After Corfield 2007)
Dow
nloaded from https://academ
ic.oup.com/astrogeo/article/58/5/ASTR
OG
/4176289 by guest on 11 February 2022

SEARCH FOR LIFE
A&G • October 2017 • Vol. 58 • aandg.org 5.21
book, The Selfish Gene, things that are plenti-ful in the universe are either long-lasting (e.g. rocks, stars and carbon dioxide) or the consequence of constant replication by life (e.g. viruses, rats and methane). Viruses illustrate this well. By some definitions they are not alive (they have no metabolism and no ability to self-reproduce) while, on other definitions, they clearly are (they evolve by natural selec-tion). But, regardless of your personal favourite definition of life, no-one would dispute that a world with active viruses in it is a world that has life.
Biospheres are therefore characterized by fragile, yet numerous, entities such as the one trillion blades of grass visible through my office window as I write. Living worlds can be detected by looking for such objects without worrying too much about whether those specific entities are alive. Fragile gases in a planet’s atmosphere may be particularly easy signs to spot, remotely, using spectroscopic techniques. Hence, we shouldn’t just look for obvious signs based upon direct application of Earth experi-ence (e.g. oxygen and methane) but, more generally, we need to look for surprises: combinations of compounds that are hard to explain from equilibrium chemistry. In other words, exactly what James Lovelock suggested 45 years ago.
Life on Titan?Application of such ideas will require complex modelling to rule out any pos-sibility that observed surprises cannot be explained by abiotic chemistry. Saturn’s moon, Titan, makes an interesting case study as we now have detailed measure-ments of atmospheric composition (from the Cassini–Huygens mission) and, fur-thermore, this moon has been considered a possible location for life beyond Earth. Intriguingly, sophisticated modelling of Titan’s atmospheric chemistry (Willacy et al. 2016) fails to reproduce the NH3 abun-dances observed by the Cassini probe. But is that a sign of life or is it just a sign that something is missing from the modelling?
Willacy et al.’s modelling involved 78 molecular species and included the effects of atmospheric condensation and sublima-tion. This modelling was able to approxi-mate reasonably well most observed abundances detected in Titan’s atmosphere. But there is a significant excess of NH3 in the atmosphere compared to chemical
expectations. Is this a sign of life? The authors them-selves suggest that better results might be obtained by including ion-molecule chemistry and so it would be
highly premature to jump to the conclusion that NH3 on Titan is enhanced by biologi-cal processes. This illustrates a significant difficulty with using unexpected gas abundances to look for life; it is hard to conclusively rule out abiotic explanations for anomalies.
Come and join usProgress is going to require collaboration between astrobiologists, Earth system scientists, atmospheric chemists, planetary scientists and those designing instruments for characterization of exoplanets. And there is a great deal of work to be done before we can claim to have reasonably robust approaches. The next step is to bring all the appropriate specialists together and, with this in mind, the Astrobiology Society of Britain (an affiliate society of the RAS) and the ESS special interest group of the Geological Society have together organized a one-day conference on Remote Detection of Life to be held at The Open University on 15 December 2017.
Keynote speakers will include Giovanna Tinetti (University College London, on exoplanet characterization), Manish Patel (Open University, on methane detection in the atmosphere of Mars) and Tim Lenton (University of Exeter, on the history of life’s impact on Earth). Abstracts from additional speakers are invited on any subjects relevant to biosignatures, the characterization of worlds within the solar system or beyond, and the global effects of life on Earth or on other worlds. Talks can
be data-based, instrument-led or theoreti-cal, but abstracts should be submitted by 17 November 2017. Further details can be found at http://earthsystemscience.org/events/remote-detection-life.
If such cross-disciplinary collaborations do develop robust procedures over the next few years, are we likely to detect life on exoplanets in the near future? A recent paper (Seager 2017) has tried to quantify this approach by constructing a “Biosigna-ture Drake Equation”, i.e. a simple algebraic expression for estimating the number of detections in the form N = N*FQFHZFOFLFS (1)where N is the number of detections, N* is the number of stars in a survey, FQ is the fraction of stars suitable for planet finding (i.e. non variable and non-binary), FHZ is the fraction of planets that are in the habit-able zone, FO is the fraction of HZ planets that are observable, FL is the fraction that have life and FS is the fraction of inhabited plants that produce detectable life-related gases in their atmospheres. For the James Webb Space Telescope and planned ground-based extremely large telescopes, Seager’s analysis gives N = 4FLFS and 11FLFS respectively. Seager, tentatively, suggested that FL ~ FS ~ 0.5 are reasonable guesses and that the chances of a life-detection in the next few decades are therefore reasonably good. I suspect that Seager’s figures are extremely optimistic but, if we don’t look, we’ll never know. ●
AUTHORDavid Waltham, Dept of Earth Sciences, Royal Holloway University of London, UK; [email protected]
MORE INFORMATIONRemote Detection of Life conference http://earthsystemscience.org/events/remote-detection-life
REFERENCESCorfield R 2007 in Earth-Life System ed. C Cockell (Cambridge University Press)Och L & Shields-Zhou G 2012 Earth Science Reviews 110 26Pallé E et al. 2009 Nature 459 814Seager S 2017 Int. J. Astrobiol. doi:10.1017/S1473550417000052Tinetti G et al. 2010 Astrophys. J. Lett. 712 L139Willacy K et al. 2016 Astrophys. J. 829 79
“We need to look for surprises: combinations of compounds that are hard to explain”
6 The oxygen history of Earth’s atmosphere. The concentration compared to present atmospheric levels (PAL) rose dramatically in the Great Oxygenation Event (GOE) 2.5 billion years ago and then again in a Neoproterozoic Oxygenation Event (NOE) around 600–800 million years ago. The blue bands indicate times of significant glaciation. (After Och & Shield-Zhou 2012)
Dow
nloaded from https://academ
ic.oup.com/astrogeo/article/58/5/ASTR
OG
/4176289 by guest on 11 February 2022
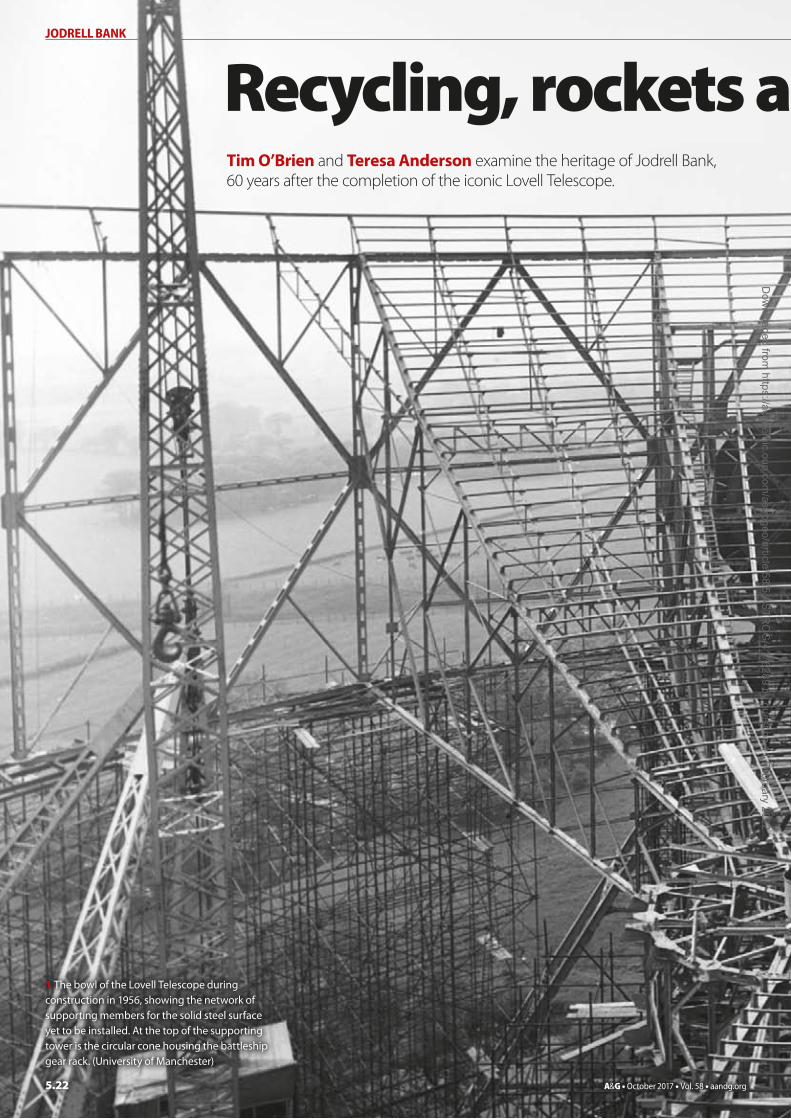
5.22 A&G • October 2017 • Vol. 58 • aandg.org
JODRELL BANK
Recycling, rockets and radio astronomyTim O’Brien and Teresa Anderson examine the heritage of Jodrell Bank, 60 years after the completion of the iconic Lovell Telescope.
1 The bowl of the Lovell Telescope during construction in 1956, showing the network of supporting members for the solid steel surface yet to be installed. At the top of the supporting tower is the circular cone housing the battleship gear rack. (University of Manchester)
Dow
nloaded from https://academ
ic.oup.com/astrogeo/article/58/5/ASTR
OG
/4176289 by guest on 11 February 2022

A&G • October 2017 • Vol. 58 • aandg.org 5.23
JODRELL BANK
Recycling, rockets and radio astronomyD
ownloaded from
https://academic.oup.com
/astrogeo/article/58/5/ASTRO
G/4176289 by guest on 11 February 2022

JODRELL BANK
5.24 A&G • October 2017 • Vol. 58 • aandg.org
Sixty years ago, the 76 m Lovell Telescope (figures 1, 2) at the University of Manchester’s Jodrell Bank Observa
tory began operations, right at the dawn of the space age. It was first moved in June 1957, received its first signals from space in August and was used with a radar to track the launch rocket of Sputnik 1 in October. Its highest point stands 89 m above the Cheshire plain and it is visible from the Peak District and the Welsh mountains. The telescope has become a landmark both in the region and in science and engineering. A truly remarkable achievement in 1950s Britain, its creation was driven by the vision and tenacity of Jodrell Bank’s founder, Bernard Lovell, and a Sheffield engineer, Charles Husband.
The Jodrell Bank site has been used continuously since 1945, leaving a record of the development of the new science of radio astronomy imprinted on the landscape. Plans are now in place to conserve the heritage of this unique site (through the listing of buildings, for example) and tell the story of Jodrell Bank – a classic mix of serendipity, tenacity and inspiration – for a new generation. Our aim is that visitors – to our existing Discovery Centre and to a proposed
new underground pavilion – will not only discover this story and the people who worked here, but will also experience the emotional power of the scientific mission to understand our place in the universe.
In the beginningBernard Lovell returned to the University of Manchester’s Physics Department in 1945, after developing airborne radar during the second world war. Proposing to study cosmicray trails in the atmosphere, he moved his equipment to the university’s Botany Grounds 20 miles south of Manchester in late 1945. Back then it was just him, two gardeners, a coke stove and an army radar set. Lovell never did detect echoes from cosmic rays, but along the way he and the team that gathered around him helped pioneer the new science of radio astronomy and built on the site what were at the time the largest radio telescopes in the world.
In 1957, the Lovell Telescope, at that time simply known as the 250 ft Telescope, was the largest in the world: its collecting area was almost 10 times more than the 25 m telescopes in the Netherlands and
Germany (Dwingeloo and Stockert) which had begun operations the previous year. Six decades on, it remains the third largest fully steerable telescope and a worldleading research instrument which can be used alone or as part of eMERLIN and the European Very Long Baseline Interferometry (VLBI) Network.
Continual upgrades in receivers and backend systems mean that it is now
more powerful than ever. There have been mechanical upgrades too: it is now on its third reflecting surface, each more accurate than the one before. But much of the
original steelwork remains – including the gear racks through which the huge bowl is tipped. These came from the 15inch gun turrets of two first world war battleships. Yes, one of the largest telescopes in the world still uses racks and pinions recycled from HMS Royal Sovereign and HMS Revenge, collected by Charles Husband from Inverkeithing as the battleships were being broken up after the end of the second world war. Their mechanical perfection had impressed Husband, who knew that they would do the job.
“It is now on its third reflecting surface, each more accurate than the one before”
2 The Mark II and Lovell Telescopes operating together as part of e-MERLIN. (University of Manchester)
Dow
nloaded from https://academ
ic.oup.com/astrogeo/article/58/5/ASTR
OG
/4176289 by guest on 11 February 2022
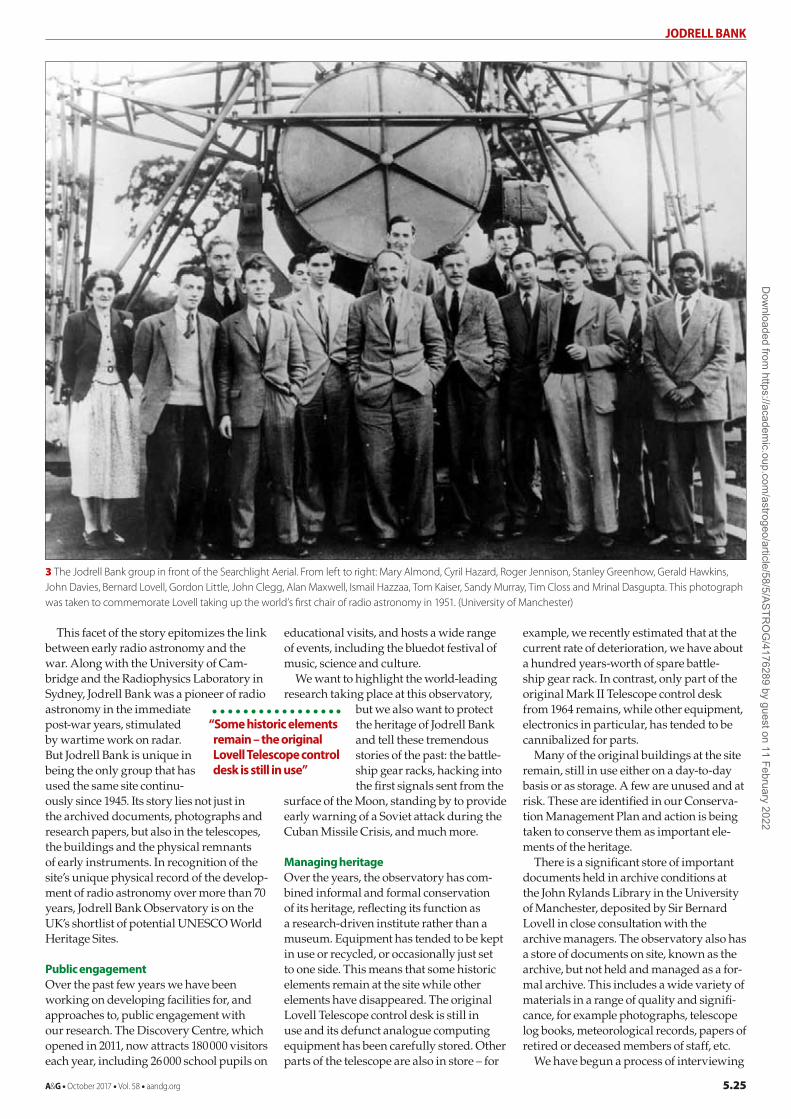
JODRELL BANK
A&G • October 2017 • Vol. 58 • aandg.org 5.25
This facet of the story epitomizes the link between early radio astronomy and the war. Along with the University of Cambridge and the Radiophysics Laboratory in Sydney, Jodrell Bank was a pioneer of radio astronomy in the immediate postwar years, stimulated by wartime work on radar. But Jodrell Bank is unique in being the only group that has used the same site continuously since 1945. Its story lies not just in the archived documents, photographs and research papers, but also in the telescopes, the buildings and the physical remnants of early instruments. In recognition of the site’s unique physical record of the development of radio astronomy over more than 70 years, Jodrell Bank Observatory is on the UK’s shortlist of potential UNESCO World Heritage Sites.
Public engagementOver the past few years we have been working on developing facilities for, and approaches to, public engagement with our research. The Discovery Centre, which opened in 2011, now attracts 180 000 visitors each year, including 26 000 school pupils on
educational visits, and hosts a wide range of events, including the bluedot festival of music, science and culture.
We want to highlight the worldleading research taking place at this observatory,
but we also want to protect the heritage of Jodrell Bank and tell these tremendous stories of the past: the battleship gear racks, hacking into the first signals sent from the
surface of the Moon, standing by to provide early warning of a Soviet attack during the Cuban Missile Crisis, and much more.
Managing heritage Over the years, the observatory has combined informal and formal conservation of its heritage, reflecting its function as a researchdriven institute rather than a museum. Equipment has tended to be kept in use or recycled, or occasionally just set to one side. This means that some historic elements remain at the site while other elements have disappeared. The original Lovell Telescope control desk is still in use and its defunct analogue computing equipment has been carefully stored. Other parts of the telescope are also in store – for
example, we recently estimated that at the current rate of deterioration, we have about a hundred yearsworth of spare battleship gear rack. In contrast, only part of the original Mark II Telescope control desk from 1964 remains, while other equipment, electronics in particular, has tended to be cannibalized for parts.
Many of the original buildings at the site remain, still in use either on a daytoday basis or as storage. A few are unused and at risk. These are identified in our Conservation Management Plan and action is being taken to conserve them as important elements of the heritage.
There is a significant store of important documents held in archive conditions at the John Rylands Library in the University of Manchester, deposited by Sir Bernard Lovell in close consultation with the archive managers. The observatory also has a store of documents on site, known as the archive, but not held and managed as a formal archive. This includes a wide variety of materials in a range of quality and significance, for example photographs, tele scope log books, meteorological records, papers of retired or deceased members of staff, etc.
We have begun a process of interviewing
“Some historic elements remain – the original Lovell Telescope control desk is still in use”
3 The Jodrell Bank group in front of the Searchlight Aerial. From left to right: Mary Almond, Cyril Hazard, Roger Jennison, Stanley Greenhow, Gerald Hawkins, John Davies, Bernard Lovell, Gordon Little, John Clegg, Alan Maxwell, Ismail Hazzaa, Tom Kaiser, Sandy Murray, Tim Closs and Mrinal Dasgupta. This photograph was taken to commemorate Lovell taking up the world’s first chair of radio astronomy in 1951. (University of Manchester)
Dow
nloaded from https://academ
ic.oup.com/astrogeo/article/58/5/ASTR
OG
/4176289 by guest on 11 February 2022

JODRELL BANK
5.26 A&G • October 2017 • Vol. 58 • aandg.org
former members of staff and receiving their records into the archive. The publicity over these heritage projects has already started to pay dividends in bringing to light previously unknown records, although we suspect there is much more to come. Readers of this article may be able to help further!
Protecting observatory heritageThe Lovell Telescope has been Grade I listed since 1988, giving it the highest possible heritage protection. This year, six more structures have been listed by the Department for Digital, Culture, Media & Sport on the advice of Historic England.
The Mark II Telescope (figure 2) has now also been listed at Grade I. It is the site’s second largescale fully steerable radio telescope, developed, like the Lovell Telescope, in collaboration between Lovell and Husband. Rather than using structural steel, Husband took a new approach, using a prestressed concrete mount for the reflector dish to improve rigidity. Notably, the Mark II was the first telescope in the world to be steered by a digital computer, the Ferranti Argus 100, one of the first computers designed for realtime control.
The Mark II was originally intended as the prototype of a vast telescope, with an elliptical bowl, somewhat incredibly, between 1500 and 15 000 ft wide and 500 ft high. The reason for an elliptical bowl was to maximize the collecting area by increasing the width but not the height, reducing problems with construction and differential windloading. The original idea soon developed into a suite of telescopes. It included building the Mark II (125 × 83 ft; completed in 1964) and the Mark III. This
was a potentially mobile version of the Mark II with a mesh dish, completed in 1966 at Wardle, Cheshire. It was never subsequently moved and was dismantled in 1996. It also included the Mark IV telescope, a huge but scaleddown version of the original massive concept, with a bowl measuring 1000 × 300–600 ft.
Funding limitations meant the Mark IV was never built although, in 1963, the Soviet Union offered to build it there if Lovell were to defect. He refused, saying: “I am an Englishman and I want to return to England.” Neither was its successor, the Mark V, built. In the end, Lovell abandoned his plans to build gigantic single dishes and the Jodrell Bank team concentrated on the success of their longbaseline interferometry, developing a fixed array of radiolinked tele scopes including the Lovell, the Mark II, and originally the Mark III, that has become today’s eMERLIN.
The Mark II telescope also has a link to the exploitation as well as the exploration of space. Asked at very short notice to build an antenna able to receive the first transatlantic TV transmissions from the Telstar satellite in summer 1962, Husband took a shortcut and used the Mark II design as the basis for the No.1 antenna at Goonhilly in Cornwall (now Grade II* listed). This was the first paraboloidal satellite communications dish, becoming the prototype for all those that followed. In just a few years, Husband had moved from designing bridges to building the first very large radio telescope, an instrument able to track the carrier rocket of the first
satellite, Sputnik, to designing the dish that received the first transatlantic satellite TV transmission. What a journey!
Searchlight AerialThe listing at Jodrell Bank does not just cover the operating telescopes: the remains of the Searchlight Aerial have also been listed at Grade II. After the war, Lovell soon realized that he needed a larger receiving aerial than the radars they had first brought to Jodrell Bank. It also needed to be steerable, to investigate reflections from meteor trails. John Clegg, one of the first to join Lovell at Jodrell Bank in 1946, was
a wartime aerial expert. He built a very large Yagi array mounted on a searchlight – borrowed from the army but never returned – so that the array could be turned in
azimuth and elevation. Manning Prentice, director of the
Meteor Section of the British Astronomical Association and the man responsible for changing Lovell from a physicist into an astronomer, suggested they attempt radar observations on the night of 9 October 1946. He predicted there might be a shower from the passage of the comet Giacobini–Zinner. As luck would have it, they were to witness one of the great meteor storms of the 20th century. Lovell later recalled: “The sky seemed to be ablaze with streaks of light … by 3 a.m. we were in a frantic daze, unable to count either the meteors in the sky or the echoes on the tube.”
Today, only the lower section of the searchlight mount survives, fixed to its concrete pad. It is the earliest remaining
4 The Cosmic Noise Hut and its dark-room extension to the right. The aerial above the building was used to study the bright “radio stars” Cygnus A and Cassiopeia A, while the “chimney” to the right was the entrance to a spectrohelioscope. (Glyn C Evans)
“Husband moved from designing bridges to building the first very large radio telescope”
Dow
nloaded from https://academ
ic.oup.com/astrogeo/article/58/5/ASTR
OG
/4176289 by guest on 11 February 2022

JODRELL BANK
A&G • October 2017 • Vol. 58 • aandg.org 5.27
example of a radioastronomical instrument at Jodrell Bank and further illustrates the link between wartime technology and the new understanding of our place in the universe that the radio astronomers were to eventually provide. Indeed, it was observations with the Searchlight Aerial which, when presented at the December 1946 meeting of the Royal Astronomical Society, led the President of the Society to announce the arrival of “an entirely new field of astronomical research”. Radio astronomy was becoming mainstream.
When the Searchlight Aerial was built in 1946, the Jodrell Bank group comprised only a few people working out of exarmy trailers stuck in the mud of a Cheshire field. Lovell had only been given permission to work there (part of the University of Manchester’s botany department) for two weeks. As things turned out, he never left. They realized the radar echoes they were receiving were not from cosmic rays, as Lovell had hoped, but from meteors. This started a whole new area of astronomical research (figure 3), but also led Lovell and Clegg, in an effort to detect weaker echoes from the elusive cosmic rays, to build in 1947 the world’s largest radio telescope – the 218 ft diameter Transit Telescope. As more discoveries were made using these instruments at Jodrell Bank and elsewhere, it became clear that the observatory was there to stay and proper buildings were required.
Simple concreteframed huts, like those found on airfields and similar installations, were sited around a central space, appropriately called the Green. As it filled with
all manner of unusual aerials and antennas, locals came up with another name for it: the Fairground.
Those buildings, some evocatively named after the research carried out by the occupants – Moon Hut, Radiant Hut, Cosmic Noise Hut (figure 4) – still remain, and several have now been Grade II listed: the Control Building, constructed in 1954–55 and housing the control room for
the Lovell Telescope; the Park Royal building, the control room for the Transit Telescope and later the Mark II Telescope; the Electrical Workshop, which was origi
nally the “Main Office” for the site, housing the library, lecture room and Lovell’s office; the Link Hut (originally Cosmic Noise Hut, figure 4), the control room for a 30 ft telescope used to investigate “cosmic noise” and the hydrogen line.
Pioneering experimentsIn 1955, the Noise Hut played host to a famous experiment. Robert Hanbury Brown, one of the original radar “boffins” and a driving force at Jodrell Bank in the 1950s, and Richard Twiss used its darkroom extension to develop optical intensity interferometry. The socalled Hanbury Brown and Twiss Effect led to the development of the new scientific field of “quantum optics” and to Hanbury’s measurements of the optical diameter of Sirius at Jodrell Bank and of other stars in the clearer skies of Narrabri, Australia. The original hut remains little altered, and the extension retains features relating to these pioneering experiments.
In 2015, we were successful in receiving
an offer of funding from the Heritage Lottery Fund for “First Light”, a project to conserve and celebrate our heritage, engaging our communities and the wider public using exhibitions, activities and educational programmes.
At the heart of the project we plan to build an underground pavilion in the arboretum planted by Sir Bernard Lovell. The First Light Pavilion (figure 5) will invoke the tradition of structures (including Stonehenge and Newgrange) that align with astronomical phenomena. It will be a circular structure within a grasscovered mound aligned along a north–south meridian line. The southern face is a curved reflective glass façade – a section of a cylinder, tilted so that its major axis points at the North Celestial Pole. The glass will reflect the sky and the landscape of the arboretum, illustrating the connection between the planet and the wider universe.
Inside the pavilion, there will be an exhibition telling the story of Jodrell Bank and featuring a range of items from the observatory archives. This exhibition will use a substrate of large sections of the original surface of the Lovell Telescope, currently being replaced on a likeforlike basis. Alongside the exhibition there will be an innovative auditorium showing largescale projected content including planetarium shows and live links to astronomers at other observatories around the world.
The project will also feature guided tours of the area around the Green at the south end of the site, the core of the historic observatory. Visitors will be able to see the original research huts and walk around the Mark II Telescope.
Work will take about two years to complete from the start of construction. Although we have received a number of generous donations in addition to the Heritage Lottery Fund contribution, at the time of writing around £5 million of the project cost still remains to be raised.
Jodrell Bank has a tremendous heritage story and we want visitors to this new facility not only to discover this story and the people who worked here, but also to appreciate the importance and excitement of the scientific drive to understand our place in the universe. ●
AUTHORSTim O’Brien is associate director of Jodrell Bank Centre for Astrophysics. Teresa Anderson is is director of the Jodrell Bank Discovery Centre.
ACKNOWLEDGEMENTSThe heritage projects at Jodrell Bank are supported by the Heritage Lottery Fund.
MORE INFORMATIONJodrell Bank Discovery Centre http://www.jodrellbank.netJodrell Bank Centre for Astrophysics http://www.jodrellbank.manchester.ac.uk
5 Artist’s impression of the First Light Pavilion, planned to be built in Lovell’s gardens at Jodrell Bank. (Hassell)
“As it filled with unusual aerials and antennas, locals named it the Fairground”
Dow
nloaded from https://academ
ic.oup.com/astrogeo/article/58/5/ASTR
OG
/4176289 by guest on 11 February 2022
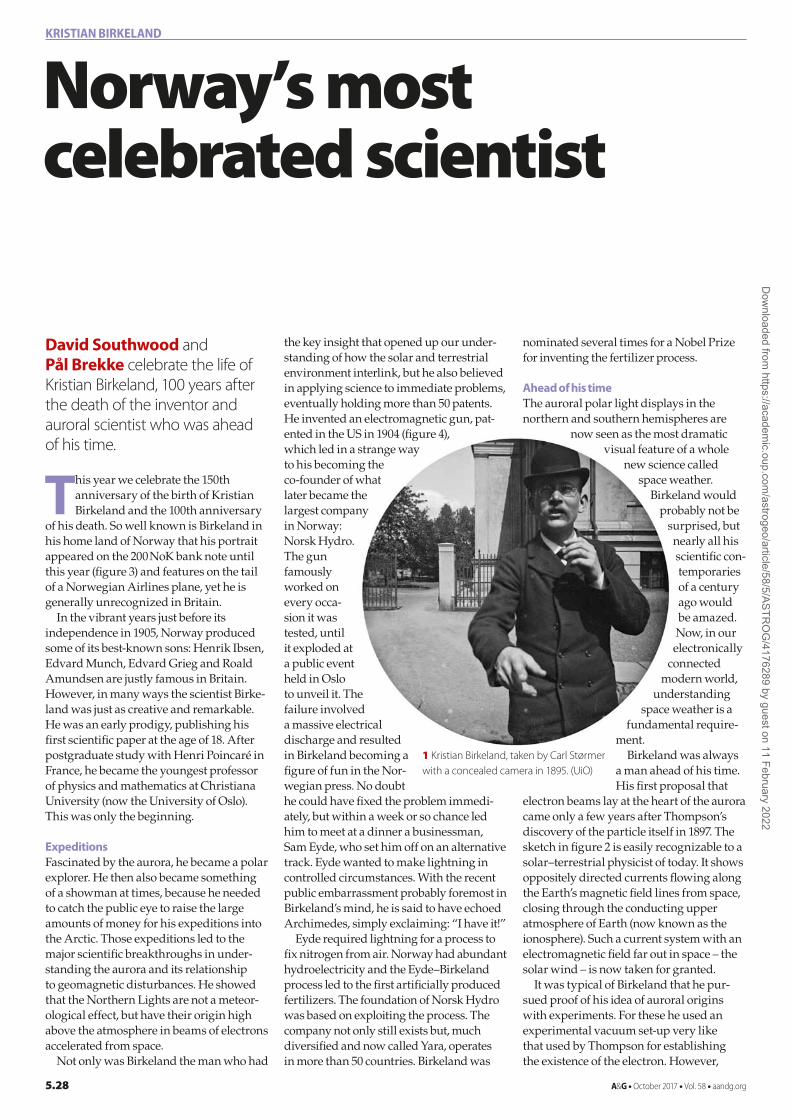
KRISTIAN BIRKELAND
5.28 A&G • October 2017 • Vol. 58 • aandg.org
This year we celebrate the 150th anniversary of the birth of Kristian Birkeland and the 100th anniversary
of his death. So well known is Birkeland in his home land of Norway that his portrait appeared on the 200 NoK bank note until this year (figure 3) and features on the tail of a Norwegian Airlines plane, yet he is generally unrecognized in Britain.
In the vibrant years just before its independence in 1905, Norway produced some of its best-known sons: Henrik Ibsen, Edvard Munch, Edvard Grieg and Roald Amundsen are justly famous in Britain. However, in many ways the scientist Birke-land was just as creative and remarkable. He was an early prodigy, publishing his first scientific paper at the age of 18. After postgraduate study with Henri Poincaré in France, he became the youngest professor of physics and mathematics at Christiana University (now the University of Oslo). This was only the beginning.
ExpeditionsFascinated by the aurora, he became a polar explorer. He then also became something of a showman at times, because he needed to catch the public eye to raise the large amounts of money for his expeditions into the Arctic. Those expeditions led to the major scientific breakthroughs in under-standing the aurora and its relationship to geomagnetic disturbances. He showed that the Northern Lights are not a meteor-ological effect, but have their origin high above the atmosphere in beams of electrons accelerated from space.
Not only was Birkeland the man who had
the key insight that opened up our under-standing of how the solar and terrestrial environment interlink, but he also believed in applying science to immediate problems, eventually holding more than 50 patents. He invented an electromagnetic gun, pat-ented in the US in 1904 (figure 4), which led in a strange way to his becoming the co-founder of what later became the largest company in Norway: Norsk Hydro. The gun famously worked on every occa-sion it was tested, until it exploded at a public event held in Oslo to unveil it. The failure involved a massive electrical discharge and resulted in Birkeland becoming a figure of fun in the Nor-wegian press. No doubt he could have fixed the problem immedi-ately, but within a week or so chance led him to meet at a dinner a businessman, Sam Eyde, who set him off on an alternative track. Eyde wanted to make lightning in controlled circumstances. With the recent public embarrassment probably foremost in Birkeland’s mind, he is said to have echoed Archimedes, simply exclaiming: “I have it!”
Eyde required lightning for a process to fix nitrogen from air. Norway had abundant hydroelectricity and the Eyde–Birkeland process led to the first artificially produced fertilizers. The foundation of Norsk Hydro was based on exploiting the process. The company not only still exists but, much diversified and now called Yara, operates in more than 50 countries. Birkeland was
nominated several times for a Nobel Prize for inventing the fertilizer process.
Ahead of his timeThe auroral polar light displays in the northern and southern hemispheres are
now seen as the most dramatic visual feature of a whole
new science called space weather.
Birkeland would probably not be
surprised, but nearly all his scientific con-temporaries of a century ago would be amazed. Now, in our electronically
connected modern world,
understanding space weather is a
fundamental require-ment.
Birkeland was always a man ahead of his time. His first proposal that
electron beams lay at the heart of the aurora came only a few years after Thompson’s discovery of the particle itself in 1897. The sketch in figure 2 is easily recognizable to a solar–terrestrial physicist of today. It shows oppositely directed currents flowing along the Earth’s magnetic field lines from space, closing through the conducting upper atmosphere of Earth (now known as the ionosphere). Such a current system with an electromagnetic field far out in space – the solar wind – is now taken for granted.
It was typical of Birkeland that he pur-sued proof of his idea of auroral origins with experiments. For these he used an experimental vacuum set-up very like that used by Thompson for establishing the existence of the electron. However,
Norway’s most celebrated scientist
David Southwood and Pål Brekke celebrate the life of Kristian Birkeland, 100 years after the death of the inventor and auroral scientist who was ahead of his time.
1 Kristian Birkeland, taken by Carl Størmer with a concealed camera in 1895. (UiO)
Dow
nloaded from https://academ
ic.oup.com/astrogeo/article/58/5/ASTR
OG
/4176289 by guest on 11 February 2022

KRISTIAN BIRKELAND
A&G • October 2017 • Vol. 58 • aandg.org 5.29
Birkeland introduced a magnetized sphere as the target for electron beams. He called his model Earth a terrella, following the Elizabethan scientist William Gilbert (1600). The experiments showed the residual gas in the vacuum chamber lit up in a ring around the pole of the sphere, just as occurs in practice around the Earth with its auroral zones.
Many research groups took up terrella experiments during the 20th century, hop-ing to understand the phenomena they demonstrated. Birkeland and his student, Fredrik Carl Mülertz Størmer (known as Carl Størmer), could never satisfactorily explain why the electrons avoided the poles of the magnet. Any hope of explanation had to await the discovery of a collision-free ionized plasma regime in a magnetic cavity surrounding the Earth, the magneto sphere, which came only with the advent of the space age. Nonetheless, Størmer’s calcula-tions of energetic charged particle motion in a dipole magnetic field underpinned work on cosmic rays worldwide; he was elected to the Royal Society of London in 1951.
Størmer’s entire career was founded on his work for Birkeland. A particular eccentricity of his merits mention here. In the 1890s, Størmer obtained a spy camera that he used to photograph surreptitiously the haut monde on Karl Johans Gate, the main street of Christiana, as Oslo was then known. Many well-known people, including the playwright Henrik Ibsen
and the botanist and linguist Ivar Aasen, were among the numerous well-dressed young men and ladies who were snapped; the men were almost always in the act of raising their hat to him. Figure 1 shows a picture he took of Birkeland in 1895. Størmer admitted that Birkeland was the only one of his subjects who ever spotted what he was doing.
A strange lifeDespite his great success, Birkeland died an unhappy man in obscure circumstances in a guesthouse in Tokyo in Japan at 50 years of age during the first world war. He had been visiting the University of Tokyo, but became almost stranded in Japan by the outbreak of the Russian Revolution.
Ironically, it would take another 50 years
3 The front of the Norwegian 200 krone note in circulation until 2017. The terrella experiment is shown above the 200, while schemata of auroral displays and snowflakes are included in the pattern.
2 Reproduction of the sketch on p105 of Birkeland (1908) (Southwood 2015). Birkeland envisages neutral streams of charged particles flowing down the magnetic field into the auroral ionosphere. It is not clear in the text, but the dotted and dashed lines presumably represent the streaming charges of opposite sign. The incident electrons (or cathode rays) cause the auroral light display. On the flanks, current flows in or out of the upper atmosphere (ionosphere). Within the ionosphere there is a horizontal current in the direction of the arrow. (Springer)
4 The heading of Birkeland’s 1904 US patent application no. 754637 for the electromagnetic gun.
Dow
nloaded from https://academ
ic.oup.com/astrogeo/article/58/5/ASTR
OG
/4176289 by guest on 11 February 2022
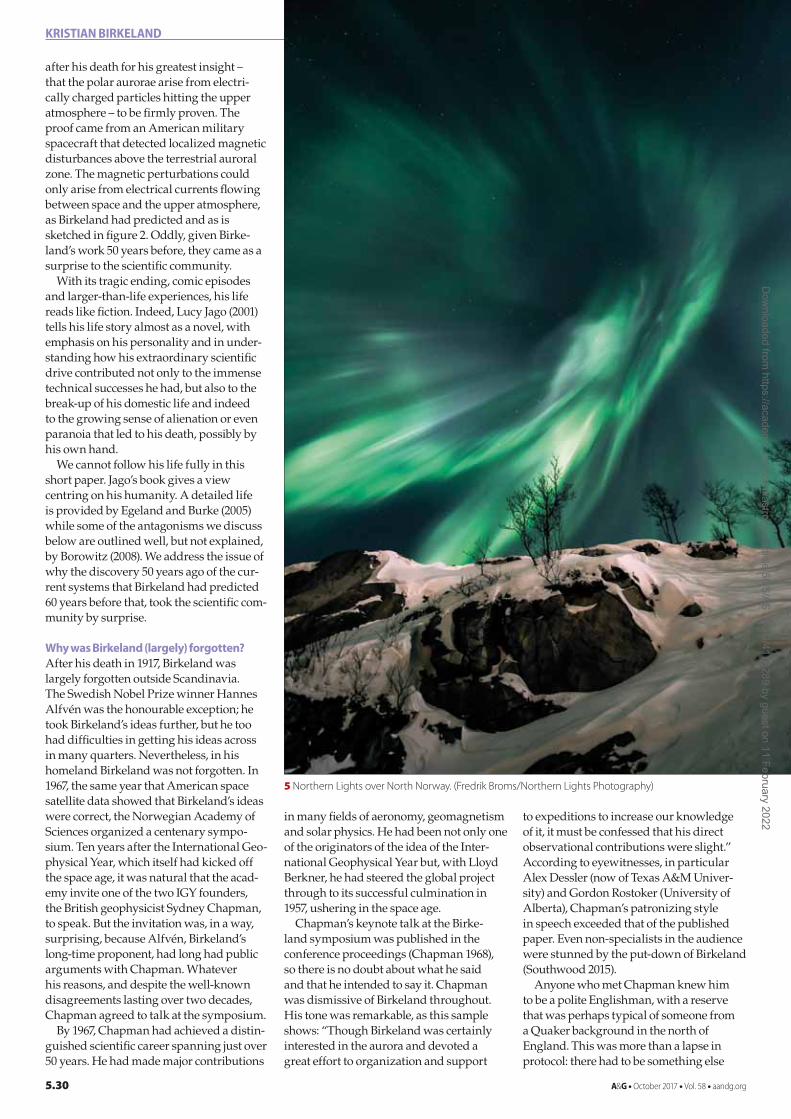
KRISTIAN BIRKELAND
5.30 A&G • October 2017 • Vol. 58 • aandg.org
after his death for his greatest insight – that the polar aurorae arise from electri-cally charged particles hitting the upper atmo sphere – to be firmly proven. The proof came from an American military spacecraft that detected localized magnetic disturbances above the terrestrial auroral zone. The magnetic perturbations could only arise from electrical currents flowing between space and the upper atmosphere, as Birkeland had predicted and as is sketched in figure 2. Oddly, given Birke-land’s work 50 years before, they came as a surprise to the scientific community.
With its tragic ending, comic episodes and larger-than-life experiences, his life reads like fiction. Indeed, Lucy Jago (2001) tells his life story almost as a novel, with emphasis on his personality and in under-standing how his extraordinary scientific drive contributed not only to the immense technical successes he had, but also to the break-up of his domestic life and indeed to the growing sense of alienation or even paranoia that led to his death, possibly by his own hand.
We cannot follow his life fully in this short paper. Jago’s book gives a view centring on his humanity. A detailed life is provided by Egeland and Burke (2005) while some of the antagonisms we discuss below are outlined well, but not explained, by Borowitz (2008). We address the issue of why the discovery 50 years ago of the cur-rent systems that Birkeland had predicted 60 years before that, took the scientific com-munity by surprise.
Why was Birkeland (largely) forgotten?After his death in 1917, Birkeland was largely forgotten outside Scandinavia. The Swedish Nobel Prize winner Hannes Alfvén was the honourable exception; he took Birkeland’s ideas further, but he too had difficulties in getting his ideas across in many quarters. Nevertheless, in his homeland Birkeland was not forgotten. In 1967, the same year that American space satellite data showed that Birkeland’s ideas were correct, the Norwegian Academy of Sciences organized a centenary sympo-sium. Ten years after the Inter national Geo-physical Year, which itself had kicked off the space age, it was natural that the acad-emy invite one of the two IGY founders, the British geophysicist Sydney Chapman, to speak. But the invitation was, in a way, surprising, because Alfvén, Birkeland’s long-time proponent, had long had public arguments with Chapman. Whatever his reasons, and despite the well-known disagreements lasting over two decades, Chapman agreed to talk at the symposium.
By 1967, Chapman had achieved a distin-guished scientific career spanning just over 50 years. He had made major contributions
in many fields of aeronomy, geomagnetism and solar physics. He had been not only one of the originators of the idea of the Inter-national Geophysical Year but, with Lloyd Berkner, he had steered the global project through to its successful culmination in 1957, ushering in the space age.
Chapman’s keynote talk at the Birke-land symposium was published in the conference proceedings (Chapman 1968), so there is no doubt about what he said and that he intended to say it. Chapman was dismissive of Birkeland throughout. His tone was remarkable, as this sample shows: “Though Birkeland was certainly interested in the aurora and devoted a great effort to organization and support
to expeditions to increase our knowledge of it, it must be confessed that his direct observational contributions were slight.” According to eyewitnesses, in particular Alex Dessler (now of Texas A&M Univer-sity) and Gordon Rostoker (University of Alberta), Chapman’s patronizing style in speech exceeded that of the published paper. Even non-specialists in the audience were stunned by the put-down of Birkeland (Southwood 2015).
Anyone who met Chapman knew him to be a polite Englishman, with a reserve that was perhaps typical of someone from a Quaker background in the north of England. This was more than a lapse in protocol: there had to be something else
5 Northern Lights over North Norway. (Fredrik Broms/Northern Lights Photography)
Dow
nloaded from https://academ
ic.oup.com/astrogeo/article/58/5/ASTR
OG
/4176289 by guest on 11 February 2022
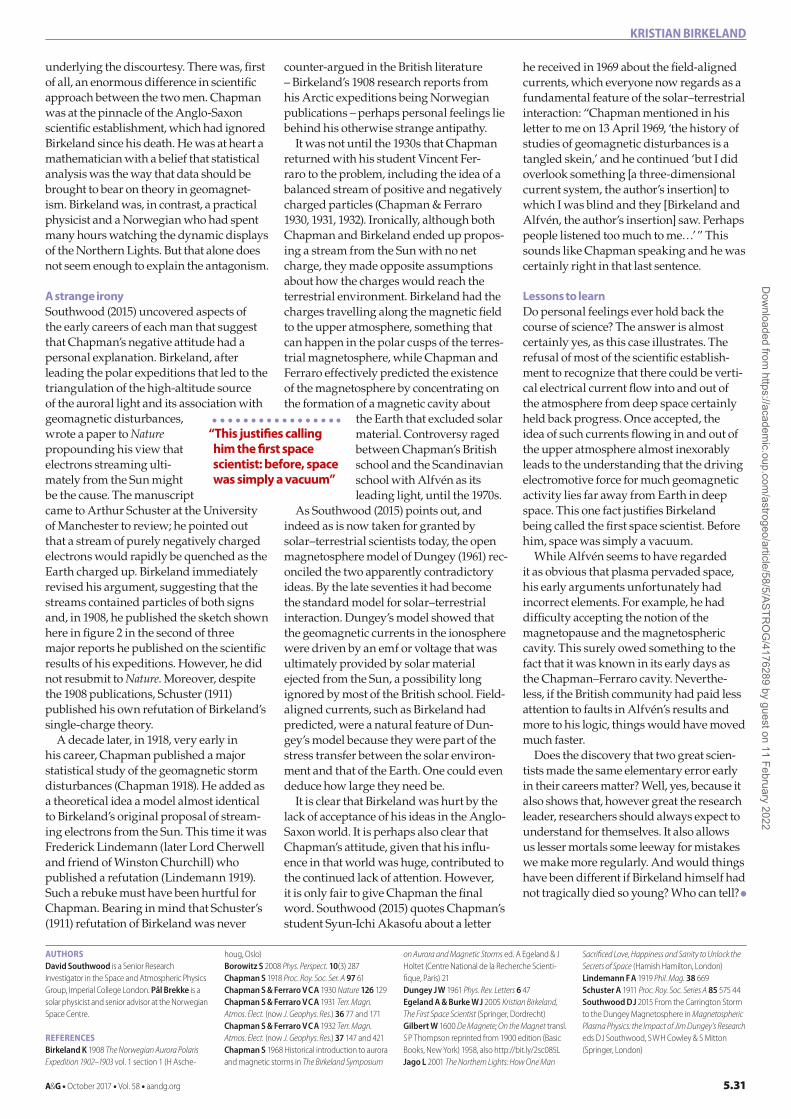
KRISTIAN BIRKELAND
A&G • October 2017 • Vol. 58 • aandg.org 5.31
underlying the discourtesy. There was, first of all, an enormous difference in scientific approach between the two men. Chapman was at the pinnacle of the Anglo-Saxon scientific establishment, which had ignored Birkeland since his death. He was at heart a mathematician with a belief that statistical analysis was the way that data should be brought to bear on theory in geomagnet-ism. Birkeland was, in contrast, a practical physicist and a Norwegian who had spent many hours watching the dynamic displays of the Northern Lights. But that alone does not seem enough to explain the antagonism.
A strange irony Southwood (2015) uncovered aspects of the early careers of each man that suggest that Chapman’s negative attitude had a personal explanation. Birkeland, after leading the polar expeditions that led to the triangulation of the high-altitude source of the auroral light and its association with geomagnetic disturbances, wrote a paper to Nature propounding his view that electrons streaming ulti-mately from the Sun might be the cause. The manuscript came to Arthur Schuster at the University of Manchester to review; he pointed out that a stream of purely negatively charged electrons would rapidly be quenched as the Earth charged up. Birkeland immediately revised his argument, suggesting that the streams contained particles of both signs and, in 1908, he published the sketch shown here in figure 2 in the second of three major reports he published on the scientific results of his expeditions. However, he did not resubmit to Nature. Moreover, despite the 1908 publications, Schuster (1911) published his own refutation of Birkeland’s single-charge theory.
A decade later, in 1918, very early in his career, Chapman published a major statistical study of the geomagnetic storm disturbances (Chapman 1918). He added as a theoretical idea a model almost identical to Birkeland’s original proposal of stream-ing electrons from the Sun. This time it was Frederick Lindemann (later Lord Cherwell and friend of Winston Churchill) who published a refutation (Lindemann 1919). Such a rebuke must have been hurtful for Chapman. Bearing in mind that Schuster’s (1911) refutation of Birkeland was never
counter-argued in the British literature – Birkeland’s 1908 research reports from his Arctic expeditions being Norwegian publications – perhaps personal feelings lie behind his otherwise strange antipathy.
It was not until the 1930s that Chapman returned with his student Vincent Fer-raro to the problem, including the idea of a balanced stream of positive and negatively charged particles (Chapman & Ferraro 1930, 1931, 1932). Ironically, although both Chapman and Birkeland ended up propos-ing a stream from the Sun with no net charge, they made opposite assumptions about how the charges would reach the terrestrial environment. Birkeland had the charges travelling along the magnetic field to the upper atmosphere, something that can happen in the polar cusps of the terres-trial magnetosphere, while Chapman and Ferraro effectively predicted the existence of the magnetosphere by concentrating on the formation of a magnetic cavity about
the Earth that excluded solar material. Controversy raged between Chapman’s British school and the Scandinavian school with Alfvén as its leading light, until the 1970s.
As Southwood (2015) points out, and indeed as is now taken for granted by solar–terrestrial scientists today, the open magnetosphere model of Dungey (1961) rec-onciled the two apparently contradictory ideas. By the late seventies it had become the standard model for solar–terrestrial interaction. Dungey’s model showed that the geomagnetic currents in the ionosphere were driven by an emf or voltage that was ultimately provided by solar material ejected from the Sun, a possibility long ignored by most of the British school. Field-aligned currents, such as Birkeland had predicted, were a natural feature of Dun-gey’s model because they were part of the stress transfer between the solar environ-ment and that of the Earth. One could even deduce how large they need be.
It is clear that Birkeland was hurt by the lack of acceptance of his ideas in the Anglo-Saxon world. It is perhaps also clear that Chapman’s attitude, given that his influ-ence in that world was huge, contributed to the continued lack of attention. However, it is only fair to give Chapman the final word. Southwood (2015) quotes Chapman’s student Syun-Ichi Akasofu about a letter
he received in 1969 about the field-aligned currents, which everyone now regards as a fundamental feature of the solar–terrestrial interaction: “Chapman mentioned in his letter to me on 13 April 1969, ‘the history of studies of geomagnetic disturbances is a tangled skein,’ and he continued ‘but I did overlook something [a three-dimensional current system, the author’s insertion] to which I was blind and they [Birkeland and Alfvén, the author’s insertion] saw. Perhaps people listened too much to me…’ ” This sounds like Chapman speaking and he was certainly right in that last sentence.
Lessons to learn Do personal feelings ever hold back the course of science? The answer is almost certainly yes, as this case illustrates. The refusal of most of the scientific establish-ment to recognize that there could be verti-cal electrical current flow into and out of the atmosphere from deep space certainly held back progress. Once accepted, the idea of such currents flowing in and out of the upper atmosphere almost inexorably leads to the understanding that the driving electromotive force for much geomagnetic activity lies far away from Earth in deep space. This one fact justifies Birkeland being called the first space scientist. Before him, space was simply a vacuum.
While Alfvén seems to have regarded it as obvious that plasma pervaded space, his early arguments unfortunately had incorrect elements. For example, he had difficulty accepting the notion of the magnetopause and the magnetospheric cavity. This surely owed something to the fact that it was known in its early days as the Chapman–Ferraro cavity. Neverthe-less, if the British community had paid less attention to faults in Alfvén’s results and more to his logic, things would have moved much faster.
Does the discovery that two great scien-tists made the same elementary error early in their careers matter? Well, yes, because it also shows that, however great the research leader, researchers should always expect to understand for themselves. It also allows us lesser mortals some leeway for mistakes we make more regularly. And would things have been different if Birkeland himself had not tragically died so young? Who can tell? ●
AUTHORSDavid Southwood is a Senior Research Investigator in the Space and Atmospheric Physics Group, Imperial College London. Pål Brekke is a solar physicist and senior advisor at the Norwegian Space Centre.
REfERENcESBirkeland K 1908 The Norwegian Aurora Polaris Expedition 1902–1903 vol. 1 section 1 (H Asche-
houg, Oslo) Borowitz S 2008 Phys. Perspect. 10(3) 287Chapman S 1918 Proc. Roy. Soc. Ser. A 97 61Chapman S & Ferraro V C A 1930 Nature 126 129Chapman S & Ferraro V C A 1931 Terr. Magn. Atmos. Elect. (now J. Geophys. Res.) 36 77 and 171Chapman S & Ferraro V C A 1932 Terr. Magn. Atmos. Elect. (now J. Geophys. Res.) 37 147 and 421Chapman S 1968 Historical introduction to aurora and magnetic storms in The Birkeland Symposium
on Aurora and Magnetic Storms ed. A Egeland & J Holtet (Centre National de la Recherche Scienti-fique, Paris) 21Dungey J W 1961 Phys. Rev. Letters 6 47 Egeland A & Burke W J 2005 Kristian Birkeland, The First Space Scientist (Springer, Dordrecht) Gilbert W 1600 De Magnete; On the Magnet transl. S P Thompson reprinted from 1900 edition (Basic Books, New York) 1958, also http://bit.ly/2sc085L Jago L 2001 The Northern Lights: How One Man
Sacrificed Love, Happiness and Sanity to Unlock the Secrets of Space (Hamish Hamilton, London)Lindemann F A 1919 Phil. Mag. 38 669Schuster A 1911 Proc. Roy. Soc. Series A 85 575 44 Southwood D J 2015 From the Carrington Storm to the Dungey Magnetosphere in Magnetospheric Plasma Physics: the Impact of Jim Dungey’s Research eds D J Southwood, S W H Cowley & S Mitton (Springer, London)
“This justifies calling him the first space scientist: before, space was simply a vacuum”
Dow
nloaded from https://academ
ic.oup.com/astrogeo/article/58/5/ASTR
OG
/4176289 by guest on 11 February 2022
MEETING REPORT
5.32 A&G • October 2017 • Vol. 58 • aandg.org
The breadth of magnetosphere, iono-sphere and solar–terrestrial science is reflected by the diverse interests
of the community and its involvement in numerous space and ground-based facili-ties probing the Sun–planet connections. Data assimilation, citizen science and reduction of large data sets were just three of the topics presented to the 92 delegates at the 47th annual meeting, which was held at Burlington House on 25 November 2016.
Space weatherThe meeting opened with an invited talk by Cathryn Mitchell (University of Bath), discussing how to assimilate data and models to allow space weather forecast-ing. Mitchell used the simple expression Result = Model + Weighting(Observations – Model) to describe the concept, and went on to explain the challenges involved in constraining models with the data. As an example, Multi-Instrument Data Analysis System (MIDAS) software has been used to quantify ionospheric electron density, using a model to fill gaps in maps of den-sity and flows (figure 1).
The theme of “new approaches” contin-ued through the morning talks, with Rob Shore (British Antarctic Survey) introduc-ing the empirical orthogonal function analysis technique to describe patterns of polar ionospheric current systems derived from SuperMAG ground magnetometer data. He showed how the patterns can be used to describe the variability in the currents over seasonal timescales. Next, Martin Archer (Queen Mary University of London) described a citizen science project called Magnetosonic Undulations Sonified
Incorporating Citizen Scientists (MUSICS), which takes advantage of the human ability to distinguish different audio frequencies in order to identify magnetospheric waves. GOES magnetometer data are filtered and scaled to audible frequencies, with one year compressed to ~6 min audio; these files are then analysed by schoolchildren to pick out different features.
The next two talks extended the theme into the solar wind, with Matthew Lang (University of Reading) describing the progress and problems in coupling the ENLIL solar wind propagation model to libraries of solar wind density, tem-perature and momentum. Simon Thomas (University of Reading/University College London) then posed the question of whether a new spacecraft at the L5 Lagrangian point could improve space weather forecasting abilities. This was tested by comparing solar wind measurements from the STEREO A and B and ACE spacecraft at suitable angular separations, with promis-ing results: the forecasted data from one spacecraft matched reasonably well with the data measured at another spacecraft.
The morning session closed with Sarah Bentley (University of Reading) aiming to identify the processes causing ULF waves in the magnetosphere by comparing observations made upstream of the Earth (the OMNI database) and ground mag-netometer measurements of disturbances. The ULF wave power was positively cor-related with solar wind velocity, density and magnitude of the southward compo-nent of the inter planetary field. However, the study highlighted the important point that correlation and causality need to be distinguished, while future work will incorporate the quantified results into a model of responses.
The space weather theme continued after lunch. Allan MacNeil (University College London) examined electron populations detected at 1 au and found no correla-tion between electron temperature and source region at the Sun (indicated by the ratio of oxygen charge states), contrary to
the results of previous studies. The next talk, by David Stansby (Imperial College London), suggested a possible cause for the lack of correlation: interaction with whistler waves, characterized by ARTEMIS space-craft measurements in the solar wind.
Moving further from the Sun, the com-peting influences of solar EUV and solar wind dynamic pressure on the position of the martian bow shock were presented by Ben Hall (University of Leicester). Mars Express data covering a full solar cycle showed that the bow shock was shifted further from the planet when Mars was at perihelion (and vice versa for aphelion), sug-gesting that enhancement of the ionosphere
by solar EUV has a stronger effect than compression by the solar wind (figure 2).
The terrestrial magneto-pause was the next region to come under scrutiny, as
Rungployphan Kieokaew (University of Exeter) tested via MHD simulation how Kelvin–Helmholtz vortices with different radius of curvature can be detected using multiple spacecraft separated by different distances, like the Cluster tetrahedron. Julia Stawarz (Imperial College Lon-don) probed the behaviour of electrons and ions affected by turbulence within Kelvin–Helmholtz vortices using another multispacecraft mission, Magnetospheric Multiscale (MMS). The velocity distribu-tions indicate that the ions and electrons were behaving differently on the scales detected by MMS.
Changing planet to Mercury, results from the MESSENGER mission were presented by Roger Leyser (University of Leicester). Hundreds of magnetic flux transfer events (FTEs) have been detected in about four Mercury years of magneto-pause crossings by MESSENGER. Their distribution shows more FTEs were identi-fied on the dawn side than at dusk, but also that there was a much stronger dependence on the angle between the interplanetary and planetary fields either side of the mag-netopause than previously found.
The next few talks considered the larger scale interaction of the solar wind and the
London MIST 2016
Sarah Badman, John Coxon, Katie Raymer and Arianna Sorba report from the annual magnetosphere, ionosphere and solar–terrestrial (MIST) meeting, which focused on new approaches to data analysis in MIST science.
“The theme of ‘new approaches’ continued through the morning talks”
Dow
nloaded from https://academ
ic.oup.com/astrogeo/article/58/5/ASTR
OG
/4176289 by guest on 11 February 2022

MEETING REPORT
A&G • October 2017 • Vol. 58 • aandg.org 5.33
magnetosphere. Rosie Hood (University College London) investigated a geomag-netic storm that occurred during 2004, and identified very large disturbances in ground magnetometer measurements induced by ionospheric currents. These were detected concurrently with meas-urements of field-aligned currents by the CHAMP spacecraft. Hayley Allison (Brit-ish Antarctic Survey) analysed 14 years of POES satellite measurements of electrons in the radiation belts, concentrating on intervals following substorms, and found the dusk side was depleted compared to the dawn side. This may be attributed to “shadowing” by the magnetopause, whereby electrons are lost as their paths cross the magnetopause, while acceleration by waves enhances the dawn-side popula-tion. The influence of solar activity on solar wind–magnetosphere coupling functions
1 Isocontours of electron density in steps of 2 x 10¹¹ m–3 at 22 UT on 30 October 2003 from the International Reference Ionosphere (IRI) statistical model (left)and Multi-Instrument Data Analysis System (MIDAS, right). (C Mitchell)
2 Long-term variation in normalized martian bow shock terminator distance (left ordinate) and extreme UV flux (right ordinate) imping-ing on martian iono-sphere. Both appear to vary almost in phase with each other, show-ing both annual (mar-tian year, MY, ~2 Earth years) and longer term solar cycle variations in the martian bow shock location. (B Hall)
3 Amplitude of aperiodic waves seen on Saturn’s equatorial current sheet versus radial distance from Saturn in the morning sector of the magnetosphere (03:00–09:00 Saturn local time). (C Martin)
4 The average difference in the electric potential of the ionosphere between large positive IMF By and large negative IMF By intervals (left panel) and corresponding anomaly seen in surface air pressure (right panel). The increase in polar pressure also causes a change in the planetary wave structure at lower latitudes, seen by the longitudinally alternating positive and negative pressure regions. (M Freeman)
Dow
nloaded from https://academ
ic.oup.com/astrogeo/article/58/5/ASTR
OG
/4176289 by guest on 11 February 2022
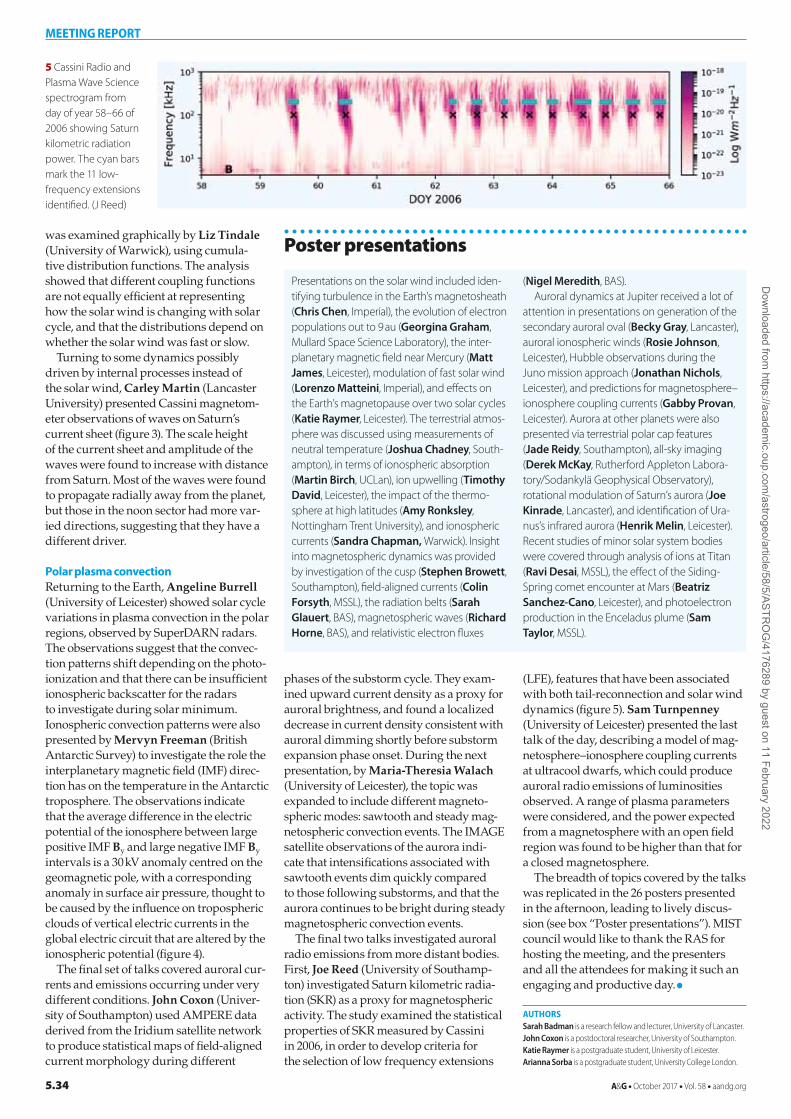
MEETING REPORT
5.34 A&G • October 2017 • Vol. 58 • aandg.org
was examined graphically by Liz Tindale (University of Warwick), using cumula-tive distribution functions. The analysis showed that different coupling functions are not equally efficient at representing how the solar wind is changing with solar cycle, and that the distributions depend on whether the solar wind was fast or slow.
Turning to some dynamics possibly driven by internal processes instead of the solar wind, Carley Martin (Lancaster University) presented Cassini magnetom-eter observations of waves on Saturn’s current sheet (figure 3). The scale height of the current sheet and amplitude of the waves were found to increase with distance from Saturn. Most of the waves were found to propagate radially away from the planet, but those in the noon sector had more var-ied directions, suggesting that they have a different driver.
Polar plasma convectionReturning to the Earth, Angeline Burrell (University of Leicester) showed solar cycle variations in plasma convection in the polar regions, observed by SuperDARN radars. The observations suggest that the convec-tion patterns shift depending on the photo-ionization and that there can be insufficient ionospheric backscatter for the radars to investigate during solar minimum. Ionospheric convection patterns were also presented by Mervyn Freeman (British Antarctic Survey) to investigate the role the interplanetary magnetic field (IMF) direc-tion has on the temperature in the Antarctic troposphere. The observations indicate that the average difference in the electric potential of the ionosphere between large positive IMF By and large negative IMF By intervals is a 30 kV anomaly centred on the geomagnetic pole, with a corresponding anomaly in surface air pressure, thought to be caused by the influence on tropospheric clouds of vertical electric currents in the global electric circuit that are altered by the ionospheric potential (figure 4).
The final set of talks covered auroral cur-rents and emissions occurring under very different conditions. John Coxon (Univer-sity of Southampton) used AMPERE data derived from the Iridium satellite network to produce statistical maps of field-aligned current morphology during different
phases of the substorm cycle. They exam-ined upward current density as a proxy for auroral brightness, and found a localized decrease in current density consistent with auroral dimming shortly before substorm expansion phase onset. During the next presentation, by Maria-Theresia Walach (University of Leicester), the topic was expanded to include different magneto-spheric modes: sawtooth and steady mag-netospheric convection events. The IMAGE satellite observations of the aurora indi-cate that intensifications associated with sawtooth events dim quickly compared to those following substorms, and that the aurora continues to be bright during steady magnetospheric convection events.
The final two talks investigated auroral radio emissions from more distant bodies. First, Joe Reed (University of Southamp-ton) investigated Saturn kilometric radia-tion (SKR) as a proxy for magnetospheric activity. The study examined the statistical properties of SKR measured by Cassini in 2006, in order to develop criteria for the selection of low frequency extensions
(LFE), features that have been associated with both tail-reconnection and solar wind dynamics (figure 5). Sam Turnpenney (University of Leicester) presented the last talk of the day, describing a model of mag-netosphere–ionosphere coupling currents at ultracool dwarfs, which could produce auroral radio emissions of luminosities observed. A range of plasma parameters were considered, and the power expected from a magnetosphere with an open field region was found to be higher than that for a closed magnetosphere.
The breadth of topics covered by the talks was replicated in the 26 posters presented in the afternoon, leading to lively discus-sion (see box “Poster presentations”). MIST council would like to thank the RAS for hosting the meeting, and the presenters and all the attendees for making it such an engaging and productive day. ●
Presentations on the solar wind included iden-tifying turbulence in the Earth’s magnetosheath (Chris Chen, Imperial), the evolution of electron populations out to 9 au (Georgina Graham, Mullard Space Science Laboratory), the inter-planetary magnetic field near Mercury (Matt James, Leicester), modulation of fast solar wind (Lorenzo Matteini, Imperial), and effects on the Earth’s magnetopause over two solar cycles (Katie Raymer, Leicester). The terrestrial atmos-phere was discussed using measurements of neutral temperature (Joshua Chadney, South-ampton), in terms of ionospheric absorption (Martin Birch, UCLan), ion upwelling (Timothy David, Leicester), the impact of the thermo-sphere at high latitudes (Amy Ronksley, Nottingham Trent University), and ionospheric currents (Sandra Chapman, Warwick). Insight into magnetospheric dynamics was provided by investigation of the cusp (Stephen Browett, Southampton), field-aligned currents (Colin Forsyth, MSSL), the radiation belts (Sarah Glauert, BAS), magnetospheric waves (Richard Horne, BAS), and relativistic electron fluxes
(Nigel Meredith, BAS). Auroral dynamics at Jupiter received a lot of
attention in presentations on generation of the secondary auroral oval (Becky Gray, Lancaster), auroral ionospheric winds (Rosie Johnson, Leicester), Hubble observations during the Juno mission approach (Jonathan Nichols, Leicester), and predictions for magnetosphere–ionosphere coupling currents (Gabby Provan, Leicester). Aurora at other planets were also presented via terrestrial polar cap features (Jade Reidy, Southampton), all-sky imaging (Derek McKay, Rutherford Appleton Labora-tory/Sodankylä Geophysical Observatory), rotational modulation of Saturn’s aurora (Joe Kinrade, Lancaster), and identification of Ura-nus’s infrared aurora (Henrik Melin, Leicester). Recent studies of minor solar system bodies were covered through analysis of ions at Titan (Ravi Desai, MSSL), the effect of the Siding-Spring comet encounter at Mars (Beatriz Sanchez-Cano, Leicester), and photoelectron production in the Enceladus plume (Sam Taylor, MSSL).
Poster presentations
5 Cassini Radio and Plasma Wave Science spectrogram from day of year 58–66 of 2006 showing Saturn kilometric radiation power. The cyan bars mark the 11 low-frequency extensions identified. (J Reed)
AUTHORSSarah Badman is a research fellow and lecturer, University of Lancaster. John Coxon is a postdoctoral researcher, University of Southampton. Katie Raymer is a postgraduate student, University of Leicester. Arianna Sorba is a postgraduate student, University College London.
Dow
nloaded from https://academ
ic.oup.com/astrogeo/article/58/5/ASTR
OG
/4176289 by guest on 11 February 2022

TISSERAND
A&G • October 2017 • Vol. 58 • aandg.org 5.35
On 13 January 1845, Claude Tis-serand, a cooper in the town of Nuits-Saint-Georges, Burgundy,
France, and his wife Anne Marie celebrated the birth of their second son. François Félix was destined through his intellect, hard work, commitment and ability to work with people of all characters, to become one of the great astronomers of the 19th century. Today, however, he is remembered only through the “Tisserand invariant”, his mathematical solution for uniquely identifying comets and asteroids (see box “Tisserand criterion”). So who was this remarkable man (figure 1)?
After excelling in his early education at Nuits-Saint-Georges, Beaune and Dijon, Félix completed his university studies at the École Normale Superiéure in Paris and started his career as a teacher at Lycée Fabert in Metz. However, his mathemati-cal intellect had been recognized and on the recommendation of Louis Pasteur (the then director of science studies at École Normale) Urbain Le Verrier offered Félix a position as assistant astronomer at the Paris Observatory. Joining the staff in September 1866, he was initially assigned duties in the meridian and geodesic ser-vices, together with teaching duties at the Paris-Sorbonne University.
ProgressThe 19th century was a time of great progress in astronomy. The foundations of scientific observation and analysis had built upon the pivotal works of great scientists such as Brahe, Kepler, Newton and Herschel. Developments in telescopes and observational technologies had allowed for the accurate creation of star maps, and stellar, lunar and planetary position ephemerides had been produced. The Royal Observatories in Paris and London had been established (1667 and 1675 respectively); the Royal Society (1660) and Royal Astronomical Society (1812) had been formed in England; and the Académie des Sciences (1666) established in France.
The challenge of determining longitude at sea had effectively been solved. The first asteroid had been discovered in 1801 by
Piazzi and Cacciatore; by the year of Tisserand’s birth, five asteroids had been discov-ered. Neptune had been discovered in 1846 using predictions derived using
gravitational mechanics.Yet many fundamental challenges
remained. Although the relative scale of the solar system had been determined by Kepler, absolute distances were a challenge and the length of the astronomical unit remained poorly determined. Although Newtonian gravitation provided the key to understanding planetary orbits, the motion of the planet Mercury was not quite in accordance with gravitation theory. This had led Le Verrier to show that this anomaly may have been due to another missing planet (named Vulcan), closer to the Sun than Mercury.
The nature of the Sun and the stars had started to become understood, but the way in which stars produced their energy and radiation was unknown, and would remain unsolved for another hundred years (until around 1930). The emerging science of
The forgotten genius of celestial mechanics
The Tisserand criterion is used to uniquely identify comets and asteroids – but who now remembers the man behind it? Neil Taylor and Janet Hyde rediscover Félix Tisserand, an influential 19th-century mathematician and astronomer.
“Most comets and asteroids have no clear features that can uniquely identify them”
1 Félix Tisserand.
Dow
nloaded from https://academ
ic.oup.com/astrogeo/article/58/5/ASTR
OG
/4176289 by guest on 11 February 2022
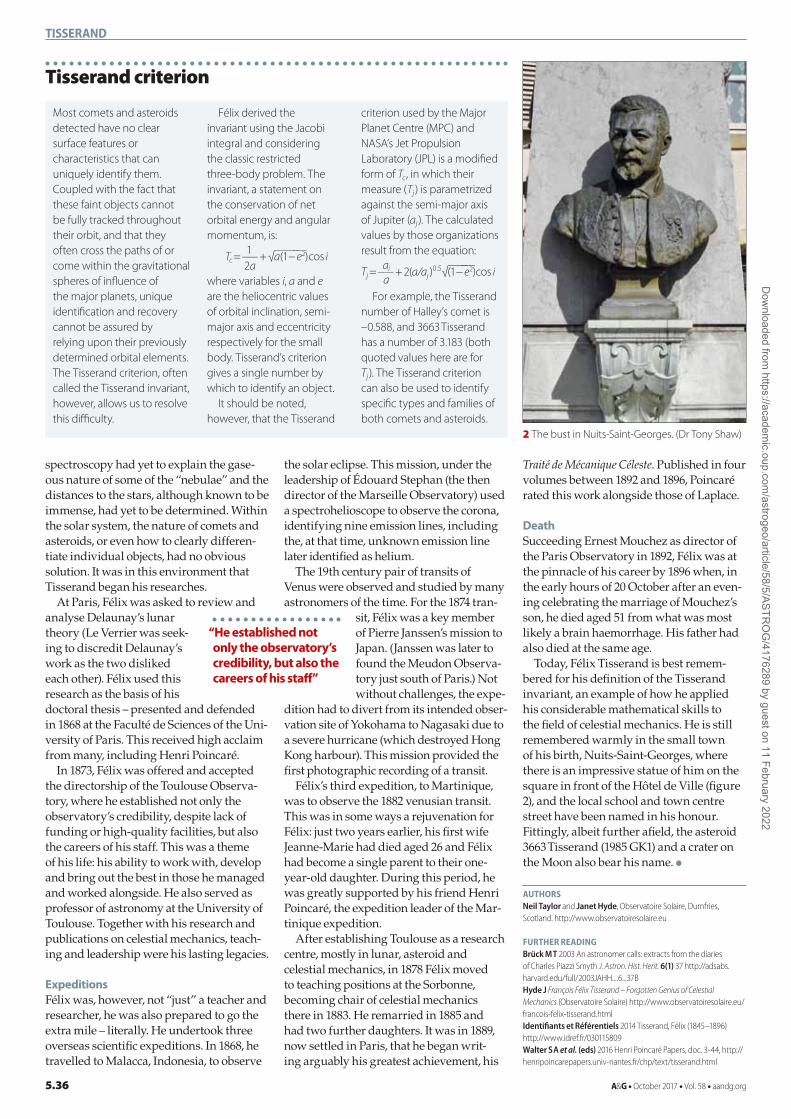
TISSERAND
5.36 A&G • October 2017 • Vol. 58 • aandg.org
spectroscopy had yet to explain the gase-ous nature of some of the “nebulae” and the distances to the stars, although known to be immense, had yet to be determined. Within the solar system, the nature of comets and asteroids, or even how to clearly differen-tiate individual objects, had no obvious solution. It was in this environment that Tisserand began his researches.
At Paris, Félix was asked to review and analyse Delaunay’s lunar theory (Le Verrier was seek-ing to discredit Delaunay’s work as the two disliked each other). Félix used this research as the basis of his doctoral thesis – presented and defended in 1868 at the Faculté de Sciences of the Uni-versity of Paris. This received high acclaim from many, including Henri Poincaré.
In 1873, Félix was offered and accepted the directorship of the Toulouse Observa-tory, where he established not only the observatory’s credibility, despite lack of funding or high-quality facilities, but also the careers of his staff. This was a theme of his life: his ability to work with, develop and bring out the best in those he managed and worked alongside. He also served as professor of astronomy at the University of Toulouse. Together with his research and publications on celestial mechanics, teach-ing and leadership were his lasting legacies.
ExpeditionsFélix was, however, not “just” a teacher and researcher, he was also prepared to go the extra mile – literally. He undertook three overseas scientific expeditions. In 1868, he travelled to Malacca, Indonesia, to observe
the solar eclipse. This mission, under the leadership of Édouard Stephan (the then director of the Marseille Observatory) used a spectrohelioscope to observe the corona, identifying nine emission lines, including the, at that time, unknown emission line later identified as helium.
The 19th century pair of transits of Venus were observed and studied by many astronomers of the time. For the 1874 tran-
sit, Félix was a key member of Pierre Janssen’s mission to Japan. (Janssen was later to found the Meudon Observa-tory just south of Paris.) Not without challenges, the expe-
dition had to divert from its intended obser-vation site of Yokohama to Nagasaki due to a severe hurricane (which destroyed Hong Kong harbour). This mission provided the first photographic recording of a transit.
Félix’s third expedition, to Martinique, was to observe the 1882 venusian transit. This was in some ways a rejuvenation for Félix: just two years earlier, his first wife Jeanne-Marie had died aged 26 and Félix had become a single parent to their one-year-old daughter. During this period, he was greatly supported by his friend Henri Poincaré, the expedition leader of the Mar-tinique expedition.
After establishing Toulouse as a research centre, mostly in lunar, asteroid and celestial mechanics, in 1878 Félix moved to teaching positions at the Sorbonne, becoming chair of celestial mechanics there in 1883. He remarried in 1885 and had two further daughters. It was in 1889, now settled in Paris, that he began writ-ing arguably his greatest achievement, his
Traité de Mécanique Céleste. Published in four volumes between 1892 and 1896, Poincaré rated this work alongside those of Laplace.
DeathSucceeding Ernest Mouchez as director of the Paris Observatory in 1892, Félix was at the pinnacle of his career by 1896 when, in the early hours of 20 October after an even-ing celebrating the marriage of Mouchez’s son, he died aged 51 from what was most likely a brain haemorrhage. His father had also died at the same age.
Today, Félix Tisserand is best remem-bered for his definition of the Tisserand invariant, an example of how he applied his considerable mathematical skills to the field of celestial mechanics. He is still remembered warmly in the small town of his birth, Nuits-Saint-Georges, where there is an impressive statue of him on the square in front of the Hôtel de Ville (figure 2), and the local school and town centre street have been named in his honour. Fittingly, albeit further afield, the asteroid 3663 Tisserand (1985 GK1) and a crater on the Moon also bear his name. ●
Most comets and asteroids detected have no clear surface features or characteristics that can uniquely identify them. Coupled with the fact that these faint objects cannot be fully tracked throughout their orbit, and that they often cross the paths of or come within the gravitational spheres of influence of the major planets, unique identification and recovery cannot be assured by relying upon their previously determined orbital elements. The Tisserand criterion, often called the Tisserand invariant, however, allows us to resolve this difficulty.
Félix derived the invariant using the Jacobi integral and considering the classic restricted three-body problem. The invariant, a statement on the conservation of net orbital energy and angular momentum, is: 1 ––––––– Tc = ––– + √a(1 − e2)cos i 2awhere variables i, a and e are the heliocentric values of orbital inclination, semi-major axis and eccentricity respectively for the small body. Tisserand’s criterion gives a single number by which to identify an object.
It should be noted, however, that the Tisserand
criterion used by the Major Planet Centre (MPC) and NASA’s Jet Propulsion Laboratory (JPL) is a modified form of Tc, in which their measure (Tj ) is parametrized against the semi-major axis of Jupiter (aj ). The calculated values by those organizations result from the equation: aj ––––––Tj = ––– + 2(a/aj )
0.5√(1 − e2)cos i a
For example, the Tisserand number of Halley’s comet is –0.588, and 3663 Tisserand has a number of 3.183 (both quoted values here are for Tj ). The Tisserand criterion can also be used to identify specific types and families of both comets and asteroids.
Tisserand criterion
AUTHORSNeil Taylor and Janet Hyde, Observatoire Solaire, Dumfries, Scotland. http://www.observatoiresolaire.eu
FURTHER READINGBrück M T 2003 An astronomer calls: extracts from the diaries of Charles Piazzi Smyth J. Astron. Hist. Herit. 6(1) 37 http://adsabs.harvard.edu/full/2003JAHH....6...37BHyde J François Félix Tisserand – Forgotten Genius of Celestial Mechanics (Observatoire Solaire) http://www.observatoiresolaire.eu/francois-felix-tisserand.htmlIdentifiants et Référentiels 2014 Tisserand, Félix (1845–1896) http://www.idref.fr/030115809Walter S A et al. (eds) 2016 Henri Poincaré Papers, doc. 3-44, http://henripoincarepapers.univ-nantes.fr/chp/text/tisserand.html
“He established not only the observatory’s credibility, but also the careers of his staff”
2 The bust in Nuits-Saint-Georges. (Dr Tony Shaw)
Dow
nloaded from https://academ
ic.oup.com/astrogeo/article/58/5/ASTR
OG
/4176289 by guest on 11 February 2022

OUTREACH
A&G • October 2017 • Vol. 58 • aandg.org 5.37
Science is a passion for most of us in the profession; we cannot compre-hend that everyone else is not equally
enchanted. When we venture out to engage with the wider world through our rose-tinted spectacles, we can fail dramatically.
The UK government started to take science seriously half a century ago, after Sputnik 1 burst into the skies. Despite national investment in the science base, it took a long time before the science com-munity began to consider the democratic dimension and put significant effort into outreach work and public engagement. Forty years ago, one university head of department expressed a common academic opinion about public lectures on physics and astronomy: “We shouldn’t be telling the public what we do, they might stop us.”
Today we recognize that the taxpayer has a right to know and influence or at least comment on its direction. For a long time it was considered enough to engage with the enthusiasts. But now we recognize that we need to look beyond those who are already interested, and talk to everyone. In the Science and Technology Facilities Council Public Engagement Strategy “Inspiring and Involving”, one objective is “Working with appropriate partners to increase the proportion of our activities that reach low science capital audiences”.
The jargon may be discouraging, but the
goals are important. Science capital, like social or economic capital, can be seen as the resources you have to engage with science, including your personal science environ-ment, how many scientists you know as friends or family, and the level of science that your family is involved in. They also include the degree to which you involve yourself in science, how much you read science books or magazines, watch science on TV or other media, and visit museums or science centres.
Low science capitalAmong communities with low science cap-ital there can be few better examples than the typical 38 000-strong Everton football crowd. As a group, these fans have the low-est average earnings of all the UK league clubs; they include many families with children and retired people. The crowd is also local to Liverpool, with more than 25 000 of their season-ticket holders living within 30 miles of the centre of Liverpool. Liverpool is the fourth most deprived city in England, with 8.6% of the city popula-tion living within the 1% most deprived areas in England, and 45% living within the 10% most deprived areas nationally.
Everton Football Club prides itself on being a leader in the community, with one
of the first free schools and sixth-form col-leges in the country. Its charity Everton in the Community has a wide range of activi-ties, including mental health initiatives, and works with Edge Hill University in a healthy living for veterans programme. It
has a football youth acad-emy and a notably positive approach to employing peo-ple with disability. When we first suggested that Everton in the Community might be
interested in a programme to bring science to the Saturday match crowd on the back of Tim Peake’s space trip, the executive direc-tor expressed a strong interest and put us in touch with all the key Everton people we would need to work with to realize such an event. A successful application was made to the STFC small awards for public engage-ment with science, for delivery in 2016.
Our project, Science in the Stadium, focused on the search for life in the uni-verse; we were all convinced that this topic was as good as it gets for excitement in science. We planned a 90-second video on the big screens at half time, leaflets for all the attending fans, a slot in the programme and a range of activities and displays at the ground on the day. The video would be introduced on the pitch by the winner of a local schools competition. A phone app linking to our website (http://www.
Outreach at the match: a cautionary taleJohn Baruch, Ulrich Kolb, Helen Fraser and Jen Heyes share some of the pitfalls they encountered when combining outreach with football; they advocate a different sort of wow factor.
“We were all convinced that this topic was as good as it gets for excitement in science”
1 Football fans were the target market, but Science in the Stadium failed to score.
2 The Science in the Stadium logo, expressing our idea of a wow factor.
Dow
nloaded from https://academ
ic.oup.com/astrogeo/article/58/5/ASTR
OG
/4176289 by guest on 11 February 2022

OUTREACH
5.38 A&G • October 2017 • Vol. 58 • aandg.org
scienceinthestadium.org) would lead on to The Open University Open Learn modules and 60-Second Adventures in Astronomy films. The Liverpool Robotic Telescope and The Open University’s robotic telescopes were made available for fans and local schools. Our success would be judged by the numbers of people we were reaching at the stadium and beyond, particularly those who engaged with the follow-up activities.
Jen Heyes and her company Cut-to-the-Chase Productions in Liverpool, which specializes in bringing together innovative ideas, culture, audiences and world-class artists, donated a considerable amount of her time. She worked closely with Robot Foundry to produce our video with the aca-demic team, exploring how best to immerse the science in the football environment. We learnt a lot; did you know, for example, that a football pitch has about a billion blades of grass? But when we met the key outreach and community people at Everton, we discovered that their main focus was the celebrity status of Tim Peake. The search for life went down like a lead balloon and leaflets had to be abandoned as a fire risk.
Real life versus Star WarsOn the day, we delivered a presentation to the crowd (attendance was 36 691) as fans arrived. We also had a stand at the Everton Free School, where many fans assemble before the match. We invited space teams from The Open University, the UK Space Agency, the National Schools Observa-tory at Liverpool John Moores University, and the Faulkes Telescopes. We showed our video and we filmed the whole thing. Tim Peake helped us, tweeting: “Science shouldn’t be alien to any of us, that’s why I’m really excited about the Science in the Stadium event happening at Goodison Park today. Science helps us in all walks of life, both on Earth and here in space.” He also shared on his Facebook page the video we had generated linking football with the search for life in the universe. The tweets and the video went out with a reach of 670 000, but we did not feel that it was a
success. On Twitter, #Scienceinthestadium got 579 likes and 207 retweets; http://Scien-ceinthestadium.org recorded just 157 hits on the video. In fact, the value of the event can be measured primarily in what we learned from our failure to engage with this low science capital crowd.
One of the things we strive for in science outreach is the wow factor. But what is a wow factor for an audience steeped in science fiction, aliens and zombies, without the science capital to assess where reality ends and fiction starts? The question of whether there is life elsewhere in the universe may simply not be interesting to those who have grown up with Star Trek, Star Wars and the like.
Perhaps this is where science has got it wrong. Perhaps the appeal of the science in which we are immersed is drowned out for other people by daily worries, especially among young people facing a life of zero-hours contracts, university debt, food banks and no pensions. Science needs to find ways of talking to a public whose main focus for their children is a decent job. A study by Kings College London assessed science capital as high for only 5% of UK young people, medium for 68% and low for 27%. For those young people, understanding and engagement with science is taking on a new importance, as robots and artificial intelli-gence systems increasingly take over estab-lished jobs. Andy Haldane, chief economist of the Bank of England, has predicted that technology will take over 15 million jobs in the UK – 50% of the total. Pricewaterhouse-Coopers predicted a similar result, 38% for the USA between 2025 and 2030. The jobs that will go are in occupations focused on process, whether a truck driver, a doctor sorting out a diagnosis, a lawyer building a case from precedent, or a surgeon following an operating procedure. New jobs will ride on the explosive growth of science in all aspects of our lives. We need a society that is scientifically literate and able to engage with science at all levels.
At the start of the 19th century in Britain, 95% of the workforce were in agriculture; by the end, 95% worked in mines, mills and factories. We are facing a similar social and economic upheaval, but compressed into a dozen or so years. The first industrial revo-lution imposed an educational threshold for jobs: no education was needed to follow the plough or milk cows, but operatives in the coal mines, the steel mills, the factories and railways needed to be able to read and write and do sums. It may be that there is an educational threshold for the current indus-trial revolution, and one that we need to cross to deliver a workforce of technological innovators. Practical science – including astronomy, space science and geophysics – can deliver the thinking behind innova-tion, equipping people to grapple with a problem, define it with a model or theory and test it out before implementing it. This is the same thinking that is behind entre-preneurship. So how do we deliver practical science? How do we inspire our communi-ties, especially the young and the hard to
reach, with science? How can communities with low sci-ence capital be reached?
On the stands, talking to the Everton fans, science jobs and careers were a recurring
issue – perhaps the only common concern. Can we guarantee their children a career with a secure and rewarding future? One of the reasons the UK government funds our sciences is in the belief that doing so will drive industrial, commercial and economic advantages for the country. We need to do more to demonstrate this link, and do so on a level that highlights the future-proof jobs that science can bring to the next genera-tion. And then we have to find ways to insert into education the experiences, prac-tical science and imagination that will help our young people to envisage millions of new products beyond the vacuum cleaners and iPhones of James Dyson and Steve Jobs. That would bring much more of a wow fac-tor to the people we spoke to at Everton. ●
AUTHORSJohn Baruch, [email protected], Ulrich Kolb, [email protected], and Helen Fraser, [email protected], The Open University. Jen Heyes, [email protected].
ACKNOWLEDGMENTSThe authors are indebted for the unstinting support of Jo Jarvis and The Open University for the exhibition on the match day, and for the Liverpool John Moores Telescope, the Faulkes Telescopes and UK Space Agency teams for their displays. It was funding from the STFC small awards grants (ST/N005775/1) that made it all possible.
MORE INFORMATIONEnterprising Science is a five-year study conducted by King’s College London, and the Science Museum and funded by BP: http://bit.ly/2wAQ9GOOpen University 60 Second Adventures http://bit.ly/2x4GEmwPricewaterhouseCoopers report http://pwc.to/2okzPomSpeech by Andy Haldane, Bank of England http://bit.ly/2gcubU6
“We need a scientifically literate society that is able to engage with science at all levels”
3 Science in the Stadium organizers were left feeling blue after Toffees fans refused to bite.
4 Project member Ulrich Kolb on the Science in the Stadium day at Goodison Park. D
ownloaded from
https://academic.oup.com
/astrogeo/article/58/5/ASTRO
G/4176289 by guest on 11 February 2022

ANCIENT ECLIPSE
A&G • October 2017 • Vol. 58 • aandg.org 5.39
A puzzling event in The Bible that men-tions both the Moon and the Sun can be interpreted as describing a
solar eclipse. We have dated it to 30 October 1207 BC, making it possibly the oldest dat-able solar eclipse recorded. This enables us to refine the dates of certain Egyptian pharaohs, including Ramesses the Great. It also suggests that the expressions currently used for calculating changes in the Earth’s rate of rotation can be reliably extended back 500 years, from 700 BC to 1200 BC.
In modern astronomy, solar eclipses are categorized into three types: total, annular and partial. In the ancient world, however, observers did not distinguish between total and annular solar eclipses. For example, the Han and later Chinese records indis-criminately apply the same expression chi (“total”) to both total and annular eclipses. On the other hand, the Chinese records do have a separate word for a partial solar eclipse (chin; Stephenson 1997). It is only when we get to the eclipse of 28 July AD 873, observed in Nishapur, Iran, that we have an unambiguously explicit statement of annularity from Al-Biruni.
In a total solar eclipse, the Moon covers the disc of the Sun with only an annulus of white light from the surrounding corona being visible, the level of illumination from which is roughly equivalent to that from a full Moon. In an annular eclipse, the silhou-ette of the Moon’s disc is surrounded by a thin annulus of light from the uneclipsed Sun and the level of illumination on the
Earth is roughly equivalent to dusk. In early times, both were called total and what was important was whether such eclipses happened or not.
To put our proposed ancient eclipse into context, we consider briefly the earliest recorded solar eclipses that have previ-ously been suggested. A list of these is given by Espenak (2009). He gives four possible recorded solar eclipses before 1000 BC (the path of a total or annular eclipse is narrow, so the likelihood of ancient eclipse records occurring and surviving is small). His earliest suggested eclipse is ascribed to two Chinese observers, Ho and Hi. Legend says they were too drunk to see the eclipse and report it to the Emperor, so he had them executed. Espenak (2009) has calculated a possible eclipse for this time period and suggests it may have been an annular solar eclipse on 22 October 2137 BC. However, this well known story is most probably apocryphal and Stephenson (2008) does not even mention it in his detailed survey of ancient eclipses, so we rule this out as being a reliable eclipse record.
Clay tabletThe next oldest eclipse listed by Espenak (2009) was dated originally to 3 May 1375 BC (Stephenson 1970) and was thought to be a total solar eclipse recorded on a clay tablet found at Ugarit, in what is now Syria. However, a reanalysis gave a revised date
of 5 March 1223 BC (de Jong & van Soldt 1989). Further analysis showed that the text on this tablet is best translated as: “During the six days of the (rituals of) the new moon of (the month of) Hiyyaru, the sun set, her gatekeeper (being) Rashep.” Since this text does not seem to refer to an eclipse at all, the eclipse interpretation has been firmly rejected (Pardee & Swerdlow 1993, Pardee 2002). We therefore rule out this suggested
record of an eclipse.The subsequent solar
eclipse on Espenak’s (2009) list is dated 5 June 1302 BC. This refers to Chinese writ-ings on animal bones which
have been translated as: “Three flames ate the Sun, and big stars were seen” (Pang et al. 2002). Stephenson (2008) has reanalysed this eclipse in detail, stating that this trans-lation is not widely accepted and that other Chinese scholars believe the text refers to the weather. In addition, he considers that the technique Pang et al. (2002) used in revealing a date of c. 1300 BC for the sup-posed eclipse is “singularly unscientific” and concludes that this supposed eclipse record is “valueless” for astronomical purposes.
The only other eclipse record in the pre-1000 BC list of Espenak (2009) is a total solar eclipse dated 16 April 1178 BC, known as the Odyssey Eclipse on account of a passage in Homer’s Odyssey, prob-ably written in about 800 BC: “Ghosts … are going to Erebus beneath the dark; the
Solar eclipse of 1207 BC helps to date pharaohs
Colin J Humphreys and W Graeme Waddington report on the oldest recorded solar eclipse, a biblical reference which may be used to date precisely the reign of Ramesses the Great.
“They were too drunk to report the eclipse to the Emperor, so he had them executed”
1 Map of ancient Canaan showing the route taken by the Israelites, starting at Gilgal, according to Joshua 10:9–10.
Dow
nloaded from https://academ
ic.oup.com/astrogeo/article/58/5/ASTR
OG
/4176289 by guest on 11 February 2022

ANCIENT ECLIPSE
5.40 A&G • October 2017 • Vol. 58 • aandg.org
Sun has perished from the sky, and an evil mist hovers over all.” Gainsford (2012) has made a detailed assessment of this text and concludes that it cannot plausibly refer to an eclipse. He states: “the passage refers to souls descending to Erebus (Hades) where notoriously the Sun does not shine.” Again, Stephenson (2008) does not even men-tion this supposed eclipse in his survey of ancient eclipses.
We therefore concur with Stephenson (2008) that, until now, there have been no reliable references to solar eclipses being observed before 1000 BC.
A possible observationThere is a possible reference to a solar eclipse in a puzzling passage in the biblical Old Testament book of Joshua. This records that, after Joshua had led the people of Israel into Canaan, he prayed: “Sun, stand still [Hebrew dôm] at Gibeon, and Moon, in the Valley of Aijalon.” The passage contin-ues: “And the Sun stood still, and the Moon stopped [Hebrew ‘amad], until the nation took vengeance on their enemies,” (Joshua 10:12–13, New Revised Standard Version [NRSV]). The locations of Gibeon and the Valley of Aijalon are shown in figure 1.
If these words are describing a real observation, then a major astronomical event was being reported (“There has been no day like it, before or since”, Joshua 10:14), but what does the text mean? The Hebrew word dôm means to be silent, dumb or still. The term ‘amad is a broader word meaning to stop or stand. Modern English transla-tions of this passage, such as the NRSV quoted above, have all followed the King James Authorized Version (KJAV) of The Bible, translated in 1611, and assumed that the Hebrew text means that the Sun and Moon stopped moving. However, a plausi-ble alternative meaning is that the Sun and Moon stopped doing what they normally do: they stopped shining. In other words the text is referring to a solar eclipse, when the Sun stops shining. As a solar eclipse can only occur when the Moon is directly between the Earth and the Sun, the Moon itself is not visible and so it is not reflecting sunlight to the Earth – like the Sun, it has “stopped shining” as well.
The first person to suggest that Joshua 10:12–14 was referring to a solar eclipse seems to have been the linguist Robert Wil-son (1918), who almost 100 years ago gave the following translation:
Be eclipsed, O sun, in Gibeon,And the moon in the valley of Aijalon!And the sun was eclipsed and the moon
turned back, while the nation was avenged on its enemies.
Wilson claimed that in Babylonian cuneiform texts there are words with the same root as the Hebrew dôm that are
used in Babylonian astronomical tablets in connection with eclipses, meaning “to be dark”. However, at that time, 100 years ago, it was not deemed possible to investigate this further because of the laborious nature of the calculations required (Russell 1918).
If the solar eclipse interpretation of this passage in Joshua is correct, then the text describes it as having been seen by the Israelites in Gibeon, in Canaan. Independ-ent Egyptian evidence that the Israelites were in Canaan comes from the Merneptah Stele, a large inscribed granite block now housed in the Egyptian Museum in Cairo. The Egyp-tian Pharaoh Merneptah was the son of the well known Ramesses the Great (Ramesses II). The inscription on the Stele says it was carved in the fifth year of the reign of Merneptah and mentions a campaign in Canaan in which he defeated people of Israel. So the Israelites must have been in Canaan by Merneptah’s fifth year.
The dates agreed by mainstream Egyp-tologists for the reign of Ramesses II are c. 1279–1213 BC, with his son Merneptah reigning from c. 1213–1203 BC (Shaw 2003, Horning et al. 2006, Kitchen 2013). These dates are subject to some uncertainty, with the latest possible dates for Ramesses II being 1270–1204 BC, and for Merneptah 1204–1194 BC (Kitchen 2013). The fifth year of Merneptah was therefore probably c. 1209/08 BC, with the latest possible date being 1200/1199 BC. Some other research-ers, most notably including Rohl (1995), have proposed an alternative chronology for ancient Egypt in which these dates are advanced by several hundred years. Their “New Chronology” has achieved wide-spread publicity alongside widespread criticism from mainstream Egyptologists. In this “New Chronology”, the fifth year of Merneptah is 867 BC.
Sawyer (1972) followed up the suggestion of Wilson (1918) that Joshua 10:12–14 refers to a solar eclipse and considered the dates of all total solar eclipses visible from Gibeon between 1500 and 1050 BC (giving generous
limits to the possible dates of the entry of Joshua into Canaan). He finds that there were only two such eclipses, on 19 August 1157 BC and on 30 September 1131 BC. However, both of these dates are signifi-cantly later than the latest possible date for Joshua to have entered Canaan, considered as the latest possible date for the fifth year of Merneptah, 1200/1199 BC. Historians and biblical scholars have therefore, to date, ruled out a solar eclipse interpretation of
Joshua 10:12–14 (Walton 1994).People in the ancient world
did not distinguish between total and annular solar eclipses. It is not until as late as AD 1292, for instance, that
we find a separate expression in the Chi-nese eclipse records to describe an annular eclipse; both of the annular eclipses of 7 August 198 BC and 27 July AD 306, for instance, were recorded by the Chinese as being total. We have therefore revisited the solar eclipse interpretation of Joshua 10:12–14 to see if there was an annular eclipse visible in the same time frame as was used by Sawyer.
In investigating the visibility of eclipses for this period we have used our own eclipse code, which conforms to the IAU 2006 recommendations (Hilton et al. 2006). The code uses our own fit of the French VSOP87/ELP2000-82b semi-analytical ephemerides to the JPL DE406 long-term integration. This fit required not only the adjustment of the secular terms to conform to the underlying basis of the JPL integra-tion, but also the addition of a number of higher-order perturbation terms that were omitted from the French lunar ephemeris. At an epoch of 1000 BC, the r.m.s. deviation of the position of the Moon given by our code from that of DE406 is 0.3ʺ in ecliptic longitude and 0.2ʺ in ecliptic latitude. Thus, to all intents and purposes, our calculations may be said to have effectively used DE406. To facilitate the calculations we adopted the latest solution for the historical varia-tions in the Earth’s rotation (Stephenson et al. 2016); because these used a different
2 The path of the annular solar eclipse of 30 October 1207 BC, which passed directly over the land of Canaan in the afternoon. The shadow leaves the Earth’s surface at sunset over modern day Iraq. The map is centred on Azekah, which is marked with a circle.
“We have revisited Joshua 10 to see if there was an annular eclipse in the time frame”
Dow
nloaded from https://academ
ic.oup.com/astrogeo/article/58/5/ASTR
OG
/4176289 by guest on 11 February 2022

ANCIENT ECLIPSE
A&G • October 2017 • Vol. 58 • aandg.org 5.41
ephemeris (DE432), due allowance has been made for the differing assumed lunar secular accelerations.
From our calculations we find that the only annular eclipse visible from Gibeon between 1500 and 1050 BC (using the same generous limits to the possible dates of entry of Joshua into Canaan as did Saw-yer [1972]) was on 30 October 1207 BC, in the afternoon. Our calculated track of the annular eclipse of 30 October 1207 BC is shown in figure 2. This eclipse passed directly over the land of Canaan.
Solar eclipse of 1207 BCAccording to the book of Joshua in the Old Testament, after an all-night march from Gilgal, the Israelites attacked the Amorites at Gibeon, they then pursued them to Azekah and then to Makkedah (figure 1). We have evidence from histori-cal geography of where these places were: Gibeon was about 10 km northwest of Jerusalem, Aze-kah about 30 km southwest of Gibeon and Makkedah about 20 km south of Azekah (Notley & Rainey 2014). Because the eclipse occurred in the afternoon, it was probably seen from near Azekah, from where the partial eclipse would have started at 15:27 (local apparent time as given by a sundial), with annularity occurring between 16:48 and 16:53. The Sun would still have been partially eclipsed at sunset, which occurred at 17:38. During annularity, 86% of the solar disc’s area was covered by the Moon.
An interesting feature of the Joshua text is the observation that it is stated that not only did the Sun stop (shining) but that the Moon also stopped (shining). As the Moon is in conjunction at the time of a solar eclipse it is effectively absent from the sky for a couple of days (it has “stopped shin-ing”). As the Israelites used an observation-ally based lunar calendar they would have been well aware of this monthly period of lunar invisibility and so could have timed their surprise night-time attack at Gibeon to take advantage of the lack of natural
night-time illumination at this time.After reporting that the Sun stopped
(shining), the book of Joshua states further that “The Sun did not hurry to set for about a whole day” (Joshua 10:13, NRSV), which has given rise to the term “Joshua’s Long Day”. What did the writer mean? Figure 3 shows the level of illumination on the ground at Azekah during the annular eclipse and figure 4 shows the appearance of the Sun as viewed from Azekah at three-minute intervals.
All ancient civilizations would have been accustomed to the Sun going down in the afternoon, leading to daylight turning into dusk, and then turning into night. However, on this occasion, in the afternoon the light from the Sun on Canaan started decreasing
from its normal level at about 15:30 until at about 16:50 it was approximately ten times less intense than normal and dusk set in (notice that figure 3 is plotted on a logarithmic
scale to match the approximate response of the human visual system). However, by around 17:10 the level of illumination would have been somewhat restored before dusk fell again and then the Sun finally set at about 17:38. In pre-scientific cultures such an unexpected deviation from normal behaviour on the part of the Sun could only inspire awe and the perceived change in the ambient light level would naturally lend itself to description in terms of the normal order of things – namely, dusk. What the Israelites would have witnessed was a double dusk. To the awe-inspired Israelites of 1207 BC, the amazing spectacle in the sky would have appeared to be long and drawn-out; the reaction to such events tends to be exaggerated, particularly with regard to perceived duration. For example, the solar eclipse of 18 July AD 1860 was observed in Sudan by Mahmoud Bey who reported: “To everyone the two minutes of the eclipse were like two hours … Several people whom I questioned after the eclipse regard-ing the duration of totality replied that it had lasted for two hours” (see Faye 1860).
In attempting to describe this double dusk it is only natural that the Israelites would have done so in terms of their normal experience of the diurnal cycle. Although aware that on this occasion the time interval between the two dusks was less than the normal day, the book of Joshua records “about a whole day” (NRSV) for this period of time. In fact the Hebrew text here is “like a whole day”, the preposition like also means as, and so the phrase can mean “as on a whole day” (Millard, private communication). Thus the analogy being employed is one of following the diurnal rise and fall of the ground illumination.
The appearance of the annular eclipse of 30 October 1207 BC we are consider-ing is shown in figure 4. Both before and after annularity, the eclipse takes on the appearance of a crescent, mimicking the form of the Moon around both the end and beginning of a lunar month. This changing appearance of the Sun may well have brought to mind the period of lunar invisibility at the changing of the lunar month when the Moon stops shining. So the description in the book of Joshua of a celestial event in which both the Sun and the Moon stopped shining is consistent with the observation by an ancient Israelite layman of an annular solar eclipse.
Historical implicationsPre-telescopic eclipse records are of consid-erable chronological interest; the total solar eclipse of 15 June 763 BC, for example, was recorded in Assyrian records (Rawlinson 1867) and is now used as a key fixed point to date Assyrian kings objectively over most of the surrounding three centuries. If our solar eclipse interpretation of Joshua chapter 10 is accepted, it has consequences for the chronology of the ancient world.
As stated above, the Israel Stele of Merneptah refers to his confrontation with people of Israel. The Stele is dated to Merneptah’s year 5, which was the year of his most recent victory against the Libyans. The confrontation with Israel probably occurred in his year 2 to 4 (Kitchen 2006), so 1207 BC is probably year 2, 3 or 4 of Mernep-tah. If accepted, this would conclusively rule out the “New Chronology” of Rohl (1995) and others for ancient Egyptian Phar-aohs. It also enables us to revise by a few years the mainstream Egyptian chronology.
The standard Egyptian chronology gives the dates of Merneptah as 1213–1203 BC, with the latest possible dates being 1204–1194 BC. If the confrontation with Israel was in year 4 of the reign of Merneptah, then his reign would have started in 1211/1210 BC, if in year 3, 1210/1209 BC, and if in year 2, 1209/1208 BC. Hence we can pinpoint the first year of Merneptah as 1210/1209±1 year. As the length of his reign is known from
3 The level of illumina-tion on the ground at Azekah during the annular eclipse of 30 October 1207 BC, as a function of the local apparent time as given by a sundial. The thin line shows the normal illumination in the absence of an eclipse. The red line gives the illumination during the eclipse, showing the double-dusk effect.
“To the Israelites, the amazing spectacle in the sky would have appeared to be long”
Dow
nloaded from https://academ
ic.oup.com/astrogeo/article/58/5/ASTR
OG
/4176289 by guest on 11 February 2022

ANCIENT ECLIPSE
5.42 A&G • October 2017 • Vol. 58 • aandg.org
Egyptian texts, his reign would have lasted between 1210 BC and 1200 BC (with ±1 year in each case). The dates of the previous and subsequent pharaohs can be similarly adjusted; for example, the reign-dates of Ramesses II (Ramesses the Great) would be 1276–1210 BC ±1 year.
The Earth’s rotationPre-telescopic observations of ancient eclipses are of considerable scientific value in studying the long-term variations in the rate of rotation of the Earth. However, only a small number of eclipse records are avail-able from before 700 BC.
Such variations are mainly produced by the lunar and solar tides, but non-tidal mechanisms are also significant (Stephen-son 1997). The accumulated clock error arising from changes in the Earth’s rate of rotation is known as ΔT. Values of ΔT before AD 1600 pre-date the telescope and are based on historical records of naked-eye
observations of eclipses going back to 700 BC. These observations show that the rate of rotation of the Earth is slowing at an average value over the last 2700 years of about 1.8 ms per day per century (about one minute per century) (Stephenson 1997).
The theoretical tidal con-tribution to ΔT is a constant deceleration of the Earth’s rotation of about 2.4 ms per day per century, hence there is about –0.6 ms per day per
century to be explained. As Stephenson and Morrison have shown (Stephenson et al. 2016, Stephenson & Morrison 1995, Mor-rison & Stephenson 2001), this discrepancy is consistent with post-glacial rebound following the last Ice Age, changing the Earth’s moment of inertia as the polar ice caps shrank. In addition there appears to be a pseudo-periodic contribution to the length of day with a period of about 1500 years, the nature and reality of which is uncertain (Stephenson et al. 2016, Huber
2006). Fortuitously, the phase of this pro-posed periodic contribution is such that at 1207 BC its contribution is effectively zero (Stephenson et al. 2016).
In our calculations we have extrapolated back 500 years to 1207 BC expressions for ΔT based on observations extending back to only 700 BC. Although it may be consid-ered unwise to extrapolate these back prior to 1000 BC (Morrison & Stephenson 2004), Stephenson (2008) states that his solution for the long-term variation of ΔT “should provide a useful first approximation to ΔT as far back as 1500 BC”. We also note that paleorotation data from fossil bivalves going back 640 million years (Varga et al. 1998) give an average rate of change of the length of day in agreement with the astro-nomical data going back 2700 years.
Our analysis of the text of the book of Joshua suggests there was an annular eclipse seen over Canaan. Calculations, using the best available value of ΔT, are con-sistent with this and date the eclipse to 30 October 1207 BC. If this is accepted, it sug-gests that the long-term trend of ΔT going back to 700 BC can be reliably extended a further 500 years, back to 1207 BC.
ConclusionA reinterpretation of a puzzling passage in the Old Testament book of Joshua suggests that a solar eclipse was being reported. Cal-culations show that this event could be the annular solar eclipse of 30 October 1207 BC. If accepted, this appears to be the oldest solar eclipse recorded. When combined with Egyptian records, this eclipse enables us to hone the most accurate dates available for the reign of the famous Egyptian phar-aoh Ramesses the Great to be 1276–1210 BC ±1 year. This work further suggests that the expressions currently used for calculat-ing ΔT, the accumulated clock error due to changes in the Earth’s rate of rotation, can be extended back 500 years from 700 BC to 1200 BC. ●
AUTHORSColin Humphreys, Dept of Materials Science and Metallurgy and Selwyn College, University of Cambridge, is a Fellow of the Royal Society and of the Royal Academy of Engineering; [email protected]. Graeme Waddington is an astrophysicist and independent scholar, North Oxford, UK.
ACKNOWLEDGMENTSThe authors thank Alan Millard, Emeritus Professor of Hebrew and Ancient Semitic Languages at the University of Liverpool, for his help with under-standing ancient texts, and Colin Bell at Tyndale House, Cambridge, for drawing figure 1. We also thank Michael Treacy, Professor of Physics at Ari-zona State University, for stimulating discussions.
REfERENCESde Jong T & van Soldt W H 1989 Nature 338 238
Espenak F 2009 Solar eclipses of historical interest NASA Eclipse Web Site http://eclipse.gsfc.nasa.gov/SEhistory/SEhistory.html Faye H A E A 1860 Comptes rendus hebdomadaires des séances de l’Académie des Sciences 51 680Gainsford P 2012 Trans. Amer. Phil. Assoc. 142 1Hilton J L et al. 2006 Celestial Mechanics and Dynamical Astronomy 94 351 Horning E et al. (eds) 2006 Ancient Egyptian Chronology (Brill)Huber P J 2006 J. Geod. 80 283Kitchen K A 2006 On the Reliability of the Old Testament (Eerdmans)Kitchen K A 2013 Establishing chronology in pharaonic Egypt and the Ancient Near East, in Radiocarbon and the Chronologies of Ancient Egypt Shortland A J & Ramsey C B (eds) (Oxbow Books)Morrison L V & Stephenson F R 2001 J. Geodynamics 32 247Morrison L V & Stephenson F R 2004 J. Hist. Astr.
35 327 Notley R S & Rainey A F 2014 The Sacred Bridge: Carta’s Atlas of the Biblical World, Second Edition (Carta)Pang K D et al. 2002 Astronomical dating and statistical analysis of ancient eclipse data, in History of Oriental Astronomy Ansari S M R (ed.) (Kluwer Academic) 95Pardee D 2002 Ritual and Cult at Ugarit (Society of Biblical Literature)Pardee D & Swerdlow N 1993 Nature 363 406 Rawlinson H C 1867 The Assyrian Canon Verified by the Record of a Solar Eclipse, B.C. 763 Athenaeum #2064 660 (18 May)Rohl D 1995 A Test of Time (Century). Pharaohs and Kings (Crown)Russell H N 1918 The standing still of the Sun (Joshua 10:12–14), Princeton Theological Review 16 103Sawyer J F A 1972 Palestine Exploration Quarterly
104 139Shaw I (ed.) 2003 The Oxford History of Ancient Egypt (Oxford)Stephenson F R 1970 Nature 228 651Stephenson F R 1997 Historical Eclipses and Earth’s Rotation (Cambridge)Stephenson F R 2008 J. Hist. Astr. 39 229Stephenson F R & Morrison L V 1995 Phil. Trans. Roy. Soc. A 351 165Stephenson F R et al. 2016 Proc. R. Soc. A 472 20160404 Varga P et al. 1998 J. Geodynamics 25 61Walton J H 1994 Joshua 10:12–15 and Mesopota-mian celestial omen texts, in Faith, Tradition and History Millard A R, Hoffmeier J K & Baker D W (eds) (Eisenbrauns)Wilson R D 1918 Princeton Theological Review 16 46
4 The appearance of the Sun viewed from Azekah on 30 October 1207 BC at three-minute intervals. The Sun was still partially eclipsed at sunset.
“If accepted, this appears to be the oldest solar eclipse recorded”
Dow
nloaded from https://academ
ic.oup.com/astrogeo/article/58/5/ASTR
OG
/4176289 by guest on 11 February 2022

PROFILE
A&G • October 2017 • Vol. 58 • aandg.org 5.43
What drew you to science and astronomy?I was raised on a healthy diet of sci-fi TV – Stargate SG-1, Star Trek (Voyager was my favourite) and Firefly were all regular viewings in my house. I never stopped asking questions and was obsessed with sharing every bit of weird trivia that I knew. I had teachers who were supportive and my parents gave me a real drive to do well. All those things added up to me doing really well in science at school. And let’s not forget that space is just really cool!
What is the subject of your PhD?I’m an extragalactic astronomer, study-ing galaxy evolution and star forma-tion in the local universe. The bulk of my thesis has focused on working with the MaNGA (Mapping Nearby Galaxies at APO) data set from the fourth Sloan Digital Sky Survey, which uses integral field spectroscopy on thousands of galaxies. With that data I’ve been creating spatial maps of star forma-tion in local galaxies and studying how those maps vary with their internal and external properties.
Who has been the biggest influence on your career?My fiancée, Sarah. I don’t want to get all soppy, but Sarah really is the light of my life. She makes me want to be the best version of myself and to push myself in the things that I love. Sarah is doing a PhD at the University of Edinburgh, so we are very busy trying to solve that two-body problem.
What will you do after your PhD?I would love to stay in academia – the work I do is fascinating and I enjoy every day of it. I’m looking for postdocs, but time on my PhD is running low and I’ll need to find something to do once I finish. I’d be happy with a data science or software development job, but in my heart I want to stay in astronomy.
Is the science community safe for transgender people?My experience has been overwhelmingly positive. I can only think of one time where my gender identity has been an issue and that was just a small mis under-standing. I don’t think anywhere is really “safe” for trans people right now, there is a lot of struggle that we still need to work through. I think universities strive to be ahead of society when it comes to social issues, in part due to the efforts of progressive stu-dents forcing the universities to change, but also due to organizations like the RAS and the IOP who work hard to promote diversity in our ranks.
What could be improved for the LGBTQ community?I think that the RAS is doing a good job on the diver-sity front – there’s a push to open up science to more people and you could really feel that energy at NAM this year. Intersectionalism is a place the RAS can do more work: there’s all these different groups within the Society working on specific minorities, but they could work together more. On trans issues in particu-lar, one thing to do would be to encourage attendees to events to introduce themselves with their pro-nouns, ask for people’s pronouns and provide a space on conference badges for people to write down their pronouns. That’s a great way to make trans people and gender-nonconforming people feel welcome.
What gets you up in the mornings?Tea. Earl Grey with two sugars.
What keeps you awake at night?Video games. Overwatch is a serious time sink for me right now and I need to stop playing until 2 a.m.
Do you have any advice for other young scientists?Never stop asking questions. Never let anyone tell you who to be. And learn to code.
What’s your favourite astronomical object?NGC 4402. It’s an edge-on spiral galaxy plunging into the heart of its cluster. I love this galaxy because you can see all the hallmarks of ram pressure strip-ping at work. The bowed shape of the dust, the abla-tion of gas causing filament structures to form on its underside and these weird tendrils of dust that seem to be pulled away from the disc – it’s amazing.
What are you looking forward to in the next 10 years?The next 10 years are going to be crazy for astron-omy. JWST, LSST, Euclid, E-ELT, SKA – there are so many exciting projects coming online that are going to change the game completely. First organic molecules in the universe? We’ll find those. Gravi-tational lenses? More than you can shake a stick at. Space is about to get a lot smaller and a lot bigger at the same time – and I can’t wait. ●
Q&A Ashley SpindlerA young postgrad astronomer at The Open University, Ashley Spindler discusses sci-fi, galactic evolution and coming out as transgender in the science community.
“Space is about to get a lot smaller and a lot bigger at the same time”
COntACt dEtAILsAshley Spindler is a research student in the Dept of Physical Sciences, Open University, Milton Keynes, UK. [email protected]
Dow
nloaded from https://academ
ic.oup.com/astrogeo/article/58/5/ASTR
OG
/4176289 by guest on 11 February 2022

1
ROYALASTRONOMICAL
SOCIETY
of the journalsof the
Proud Publisher
O x f o r d U n i v e r s i t y P r e s s
Don’t missan issueSign up forfree email
table of contentsonline
www.astrogeo.oxfordjournals.org
www.gji.oxfordjournals.org
www.mnras.oxfordjournals.org
Dow
nloaded from https://academ
ic.oup.com/astrogeo/article/58/5/ASTR
OG
/4176289 by guest on 11 February 2022