stv1451.pdf - Oxford Academic
20
MNRAS 452, 3795–3814 (2015) doi:10.1093/mnras/stv1451 Comparison of observed and predicted Lyα and ultraviolet lines in galaxy spectra at redshifts z < 3.7, adopting photoionization + shock composite models M. Contini ‹ School of Physics, and Astronomy, Tel Aviv University, Tel Aviv 69978, Israel Accepted 2015 June 29. Received 2015 June 29; in original form 2015 May 31 ABSTRACT We explore the origin of the observed Lyα and other ultraviolet (UV) lines from galaxies at z< 3.7 by detailed modelling of their spectra. The objects are chosen from among those showing (a) UV–optical–near-IR lines, (b) only UV lines and (c) Lyα in the UV and a few optical lines. The total sample is heterogeneous, including galaxies in an all-sky radio survey, hard X-ray-emitting sources, a type 2 quasar (QSR)identified as a X-ray source, a type 2 active galactic nucleus (AGN) at high z (3.7), a very extended Lyα-emitting nebula, objects in a multi-band imaging survey for Lyman-break galaxies and in a slitless spectroscopic survey for Lyman-alpha emitters (LAEs), etc. We also present UV line predictions for a sample of galaxies in the 0.0686 <z< 0.8829 range. For calculation of the line and continuum spectra, we use the code SUMA, which accounts consistently for photoionizing flux from an external source and shocks. Dust-reprocessed radiation is also calculated. The results show that calculated Lyα/Hβ values are generally higher than observed, except for a few starburst (SB)-dominated models. Some spectra are better reproduced by shock-dominated models. The sample of galaxies including the Lyα line shows neither peculiar gas physical conditions nor abnormal element abundances. The line profiles have complex full widths at half maximum (FWHM) with two main components, which translate into two types of emitting gas clouds. High T ∗ values (>10 5 K), which indicate that SB stars are close to outburst, were found in a few objects. Traces of supernova events are suggested by a scandium emission line from the SST24 nebula and by shock-dominated models. Key words: radiation mechanisms: general – shock waves – ISM: abundances – galaxies: high-redshift – galaxies: Seyfert – galaxies: starburst. 1 INTRODUCTION Lyα is one of the strongest lines in the ultraviolet (UV), because H is the most abundant element and because it corresponds to the 1s–2p transition. The Lyαλ1215 line in the far-UV is now reported in observations of galaxies at high redshifts (e.g. Vernet et al. 2001; Norman et al. 2002; Stern et al. 2002; Dawson et al. 2003; Fosbury et al. 2003; Dey et al. 2005; Humphrey et al. 2008; Erb et al. 2010; Finkelstein et al. 2011, etc). The line flux is absorbed by dust, depending on the environment of the Lyα-emitting nebula. Grains embedded in the gaseous clouds or distributed throughout the photon’s path to Earth can lead to a significant drop in flux (Finkelstein et al. 2011). The escape probability was treated by Atek et al. (2014), who confirmed that the Lyα escape fraction E-mail: [email protected] depends on the dust extinction, but the correlation does not follow the expected curve for simple dust attenuation. They claim that higher attenuation can also be attributed to a scattering process and that the strength of Lyα and the escape fraction appear unrelated to the galaxy’s metallicity. Supernova (SN) events throughout galaxies lead to specific shocks in the regions surrounding SN explosions (Heng & Sunyaev 2008) and close to outbursts in novae and symbiotic stars (Contini, Angeloni & Rafanelli 2009). Heng & Sunyaev (2008) claim that charge transfer reactions between hydrogen atoms and protons in collisionless shocks of SN remnants produce broad Balmer, Lyman and other hydrogen lines with increased Lyα/Hβ . In general, photoionization by active galactic nuclei (AGN), star- bursts (SB) or evolved stars (Flores-Fajardo et al. 2011) is the main heating and ionizing mechanism of gas throughout the galaxy. When no photoionization source is seen and much of the energy is pro- vided by the conversion of kinetic energy of motion into heat, C 2015 The Author Published by Oxford University Press on behalf of the Royal Astronomical Society Downloaded from https://academic.oup.com/mnras/article/452/4/3795/1055269 by guest on 22 January 2022
-
Upload
khangminh22 -
Category
Documents
-
view
3 -
download
0
Transcript of stv1451.pdf - Oxford Academic

MNRAS 452, 3795–3814 (2015) doi:10.1093/mnras/stv1451
Comparison of observed and predicted Lyα and ultraviolet lines in galaxyspectra at redshifts z < 3.7, adopting photoionization + shockcomposite models
M. Contini‹School of Physics, and Astronomy, Tel Aviv University, Tel Aviv 69978, Israel
Accepted 2015 June 29. Received 2015 June 29; in original form 2015 May 31
ABSTRACTWe explore the origin of the observed Lyα and other ultraviolet (UV) lines from galaxiesat z < 3.7 by detailed modelling of their spectra. The objects are chosen from among thoseshowing (a) UV–optical–near-IR lines, (b) only UV lines and (c) Lyα in the UV and a fewoptical lines. The total sample is heterogeneous, including galaxies in an all-sky radio survey,hard X-ray-emitting sources, a type 2 quasar (QSR)identified as a X-ray source, a type 2 activegalactic nucleus (AGN) at high z (3.7), a very extended Lyα-emitting nebula, objects in amulti-band imaging survey for Lyman-break galaxies and in a slitless spectroscopic surveyfor Lyman-alpha emitters (LAEs), etc. We also present UV line predictions for a sampleof galaxies in the 0.0686 < z < 0.8829 range. For calculation of the line and continuumspectra, we use the code SUMA, which accounts consistently for photoionizing flux from anexternal source and shocks. Dust-reprocessed radiation is also calculated. The results showthat calculated Lyα/Hβ values are generally higher than observed, except for a few starburst(SB)-dominated models. Some spectra are better reproduced by shock-dominated models. Thesample of galaxies including the Lyα line shows neither peculiar gas physical conditions norabnormal element abundances. The line profiles have complex full widths at half maximum(FWHM) with two main components, which translate into two types of emitting gas clouds.High T∗ values (>105 K), which indicate that SB stars are close to outburst, were found in afew objects. Traces of supernova events are suggested by a scandium emission line from theSST24 nebula and by shock-dominated models.
Key words: radiation mechanisms: general – shock waves – ISM: abundances – galaxies:high-redshift – galaxies: Seyfert – galaxies: starburst.
1 IN T RO D U C T I O N
Lyα is one of the strongest lines in the ultraviolet (UV), becauseH is the most abundant element and because it corresponds to the1s–2p transition. The Lyα λ1215 line in the far-UV is now reportedin observations of galaxies at high redshifts (e.g. Vernet et al. 2001;Norman et al. 2002; Stern et al. 2002; Dawson et al. 2003; Fosburyet al. 2003; Dey et al. 2005; Humphrey et al. 2008; Erb et al.2010; Finkelstein et al. 2011, etc). The line flux is absorbed bydust, depending on the environment of the Lyα-emitting nebula.Grains embedded in the gaseous clouds or distributed throughoutthe photon’s path to Earth can lead to a significant drop in flux(Finkelstein et al. 2011). The escape probability was treated byAtek et al. (2014), who confirmed that the Lyα escape fraction
� E-mail: [email protected]
depends on the dust extinction, but the correlation does not followthe expected curve for simple dust attenuation. They claim thathigher attenuation can also be attributed to a scattering process andthat the strength of Lyα and the escape fraction appear unrelated tothe galaxy’s metallicity.
Supernova (SN) events throughout galaxies lead to specificshocks in the regions surrounding SN explosions (Heng & Sunyaev2008) and close to outbursts in novae and symbiotic stars (Contini,Angeloni & Rafanelli 2009). Heng & Sunyaev (2008) claim thatcharge transfer reactions between hydrogen atoms and protons incollisionless shocks of SN remnants produce broad Balmer, Lymanand other hydrogen lines with increased Lyα/Hβ.
In general, photoionization by active galactic nuclei (AGN), star-bursts (SB) or evolved stars (Flores-Fajardo et al. 2011) is the mainheating and ionizing mechanism of gas throughout the galaxy. Whenno photoionization source is seen and much of the energy is pro-vided by the conversion of kinetic energy of motion into heat,
C© 2015 The AuthorPublished by Oxford University Press on behalf of the Royal Astronomical Society
Dow
nloaded from https://academ
ic.oup.com/m
nras/article/452/4/3795/1055269 by guest on 22 January 2022

3796 M. Contini
e.g. when fast-moving matter collides with ambient interstellarmedium (ISM) gas, ionization and thermal energy are released.They will be partly radiated as recombination and collisional lineemission (Osterbrock 1989).
It was suggested that high-redshift galaxies originate from merg-ing (e.g. Ryan et al. 2008). Therefore strong shocks could appear insome regions of the product galaxy, for instance in the local galaxyNGC 3393 (Contini 2012). Yajima, Li & Zhu (2013) proposed a for-mation model from major mergers of gas-rich galaxies emitting theLyα line. They claim that at z ≥ 2 the merger rate is higher in denseregions and the progenitors are more gas-rich. The Lyman-breaktechnique could be employed to explore galaxies at 0.8 ≤ z ≤ 2.5(Oteo et al. 2012). Merging galaxies emit Lyα as well as manyother lines. Observations of UV lines are now available from galax-ies at high z, in particular N V 1240, C IV 1550, He II 1640, etc.and eventually O VI 1034. They are emitted by high-ionization-levelions that are easily produced in shock-heated gas corresponding tosuitable velocities. High-ionization-level lines are strong from C,N, O, Ne, etc. in the infrared (IR), optical and UV frequency ranges.Most of the UV lines (e.g. O IV, O V, N V) are permitted, while e.g.[N V], [O V], etc. in the optical and IR are forbidden and thus colli-sionally de-excited at high densities. Permitted lines originate fromrecombination and depend on radiative processes. Both radiationand collisional processes should be considered in the calculation ofline spectra rich enough to constrain the models. Composite mod-els (shock + photoionization) were adopted to explain the spectrafrom local merging galaxies (e.g. NGC 7212, NGC 3393, NGC6240, Arp 220: Contini 2013 and references therein) and were usedin the spectral line analysis of galaxies at a relatively high z (Contini2014a and references therein.)
In this article, we explore the origin of observed Lyα and otherlines in the UV from galaxies at z < 3.7 through detailed modellingof spectra, which strictly constrains the physical conditions of theemitting gas, element abundances and radiation source when thespectra show suitable lines. Comparison with diagnostic diagramsis less constraining. The code SUMA1 is adopted for calculation ofthe spectra, because it simulates the physical conditions in an emit-ting gaseous cloud under the combined effect of photoionizationfrom an external radiation source and shocks. The line and contin-uum emission from the gas are calculated consistently with dust-reprocessed radiation. Our aim is not only to find the gas physicalconditions and element abundances throughout the emitting clouds,but to determine the nature of the radiation source, e.g. AGN, SBor shocks only. The presence of an AGN and/or SB, collision heat-ing and ionization of ISM gas by shocks, element abundances anddust survival throughout the clouds are important issues for middleand high-redshift galaxies, which are tracers of star formation andevolution.
The objects were chosen from among those showing (a) UV–optical–near-IR lines (Stern et al. 2002; Dawson et al. 2003;Fosbury et al. 2003; Humphrey et al. 2008; Erb et al. 2010), (b)only UV lines (Vernet et al. 2001; Norman et al. 2002; Dey et al.2005) and (c) Lyα in the UV and a few optical lines (Finkelsteinet al. 2011). We also present UV line predictions for a sampleof galaxies (Ly et al. 2014) in the range 0.0686 ≤ z ≤ 0.8829,where the physical conditions of the emitting gas are constrainedby the observed optical lines, in particular [O III] 4363. The to-tal sample, which includes galaxies in an all-sky radio survey, hardX-ray-emitting sources, a type 2 quasar (QSR) identified as an X-ray
1 http://wise-obs.tau.ac.il/˜marcel/suma/index.htm
source, a type 2 AGN at high z (3.7), a very extended Lyα-emittingnebula, objects in a multi-band imaging survey for Lyman-breakgalaxies and in a slitless spectroscopic survey for LAEs, etc., israther heterogeneous. However, the observed spectra from high-zobjects accounting for the Lyα line and for a sufficient number oflines constraining the models are few, therefore we gathered themfrom different classes.
The calculation models are described briefly in Section 2. Mod-elling results of the galaxy spectra are presented in Section 3. Resultsand concluding remarks are discussed in Section 4.
2 TH E C A L C U L ATI O N C O D E
We use composite models to calculate line and continuum fluxesemitted from a gas nebula. First, the temperature, density and ele-ment abundances should be known. In a shock-dominated hydrody-namical regime, the density profile throughout the nebula is shapedby the shock, while radiative and collisional heating and ionizationof the gas are due to radiation from the external source (AGN, SB)and the shock, respectively.
2.1 Input parameters
The parameters that characterize the shock are roughly suggestedby the data, e.g. the shock velocity Vs by the full width at half-maximum (FWHM) of the line profile and the pre-shock density n0
by the characteristic line ratios and the pre-shock magnetic field B0.We adopt B0 = 10−4 G, which is suitable for the narrow-line region(NLR) of AGN (Beck 2012). Changes in B0 are compensated byopposite changes in n0. A model rearrangement on a small scale (seeContini 2009), which will not alter the conclusion of the modelling,will follow.
The ionizing radiation from an external source is characterizedby its spectrum and flux intensity. The flux is calculated in 440energy ranges, ranging from a few eV to keV. If the photoioniza-tion source is an active nucleus, the input parameter that refers tothe radiation field is the power-law flux from the active centre Fin photon cm−2 s−1 eV−1 at the Lyman limit, with spectral indicesαUV = −1.5 and αX = −0.7. It was found by modelling the spec-tra of many different AGNs that these indices were in general themost suitable (see e.g. Contini & Aldrovandi 1983; Aldrovandi &Contini 1984; Rodrıguez-Ardila et al. 2005, and references therein).For UV line ratios of a sample of galaxies at z > 1.7, Villar-Martin,Tadhunter & Clark (1997) found that αUV = −1 provided a verygood fit. The power law in the X-ray domain was found to be flatterfrom observations of local galaxies (αX = −1, e.g. Crenshaw et al.2002; Turner et al. 2001). Nevertheless, for all models presented inthe following we will adopt αUV = −1.5 and αX = −0.7, recallingthat the shocked zone also contributes to the emission-line inten-sities. Therefore our results are less dependent on the shape of theionizing radiation.
F is combined with the ionization parameter U by
U = [F/(nc(αUV − 1)][(EH)−αUV+1 − (EC)−αUV+1]
(Contini & Aldrovandi 1983), where EH is the H ionization poten-tial and EC the high-energy cut-off, n the density, αUV the spectralindex and c the speed of light. If stars with a colour temperatureT∗ are the photoionization source, the number of ionizing pho-ton cm−2 s−1 produced by the hot source is N = ∫ ∞
ν0Bν/hν dν,
where ν0 = 3.29 × 10¹⁵ Hz and Bν is the Planck function. The fluxfrom the star is combined with U and n by N(r/R)2 = Unc, where
MNRAS 452, 3795–3814 (2015)
Dow
nloaded from https://academ
ic.oup.com/m
nras/article/452/4/3795/1055269 by guest on 22 January 2022

Lyα and UV lines in galaxies at z < 3.7 3797
r is the radius of the hot source and R the radius of the nebula (interms of distance from the stars). Therefore, T∗ and U compensateeach other, but only in a qualitative way, because the blackbodyradiation (which depends on T∗) determines the frequency distribu-tion of the primary flux, while U represents the number of photonsper number of electrons reaching the nebula. The choice of T∗ andU is made by the fit of the line ratios.
In addition to radiation from the primary source, the effect of dif-fuse radiation created by hot gas is also calculated, using 240 energybands for the spectrum. The geometrical thickness of the emittingnebula D determines whether the model is radiation-bounded ormatter-bounded. The dust-to-gas ratio (d/g) with an initial grainradius agr= 1 µm and the abundances of He, C, N, O, Ne, Mg, Si, S,A, Fe relative to H, is also accounted for. Different solar O/H valuesare reported by Asplund et al. (2009), Allen (1976) and Anders& Grevesse (1989), namely O/H = 4.9 × 10⁻⁴, 6.6 × 10⁻⁴ and8.5 × 10−4, respectively. Table 2 shows that the Allen (1976) rel-ative abundance values range between the two more recent results(Contini 2014a). Hereafter, we will refer to Allen (1976). However,the relative abundances are calculated consistently for each spec-trum, so the values that appear in Table 2 are important only asreferences for discussion.
2.2 Calculation process
The code accounts for the direction of cloud motion relative to theexternal photoionizing source. A parameter switches between in-flow (radiation flux from the source reaches the shock-front edgeof the cloud) and outflow (flux reaches the edge opposite to theshock front). The calculations start at the shock front, where the gasis compressed and thermalized adiabatically, reaching a maximumtemperature in the immediate post-shock region (T ∼ 1.5 × 10⁵
(Vs/100 km s−1)2). T decreases downstream at the cooling rate andthe gas recombines. The downstream region is cut into a maxi-mum of 300 plane-parallel slabs with different geometrical widthscalculated automatically, in order to account for the temperaturegradient (Contini 2009, and references therein). In each slab, com-pression (n/n0) is calculated by the Rankine–Hugoniot equationsfor the conservation of mass, momentum and energy throughoutthe shock front (Cox 1972). Compression ranges between 4 (theadiabatic jump) and >100, depending on Vs and B0. The strongerthe magnetic field, the lower the compression downstream, whilea higher shock velocity corresponds to a higher compression. Thecooling rate is calculated in each slab by free–free (bremsstrahlung),free–bound and line emission. Therefore, the most significant linesmust be calculated in each slab even if only a few are observed,because they contribute to the temperature slope downstream.
In pure photoionization models, the density n is constant through-out the nebula. In models accounting for the shocks, both electrontemperature Te and density ne show a characteristic profile through-out each cloud. The density reaches its upper limit at a certaindistance from the shock front and remains nearly constant, while ne
decreases following recombination.The primary and secondary radiation spectra calculated by ra-
diation transfer change throughout the downstream slabs, each ofthem contributing to the optical depth. In each slab of gas, the frac-tional abundance of the ions of each chemical element is obtainedby solving the ionization equations that account for photoionization(by primary and diffuse secondary radiation and collisional ioniza-tion) and recombination (radiative, dielectronic), as well as chargetransfer effects, etc. The ionization equations are coupled to the en-
ergy equation when collision processes dominate (Cox 1972) andto the thermal balance if radiative processes dominate (Williams1967). The latter balances the heating of the gas due to primary anddiffuse radiation reaching the slab with the cooling due to line emis-sion, dust collisional ionization and thermal bremsstrahlung. Theline intensity contributions from all slabs are integrated through-out the cloud. In particular, the absolute line fluxes referring to theionization level i of element K are calculated by the term nK(i),which represents the density of the ion X(i). We consider thatnK(i) = X(i)[K/H]nH, where X(i) is the fractional abundance ofion i calculated by the ionization equations, [K/H] is the relativeabundance of element K with respect to H and nH is the densityof H (in cm−3). In models including shock, nH is calculated bythe compression equation in each slab downstream. The elementabundances relative to H therefore appear as input parameters. Toobtain the N/H relative abundance for each galaxy, we consider thecharge exchange reaction N++H � N+H+ (Steigman, Werner &Geldon 1971). Charge exchange reactions occur between ions withsimilar ionization potential (I(H+) = 13.54 eV, I(N+) = 14.49 eVand I(O+) = 13.56 eV). It was found that N ionization equilibriumin the ISM is strongly affected by charge exchange. This process,as well as O++H � O+H+ (Field & Steigman 1971), is includedin the SUMA code. The N+/N ion fractional abundance follows thebehaviour of O+/O so, comparing the [N II]/Hβ and [O II]/Hβ lineratios with the data, the N/H relative abundances can be easilydetermined (see Contini et al. 2012).
Dust grains are coupled to the gas across the shock front bythe magnetic field. They are heated radiatively by photoioniza-tion and collisionally by the gas up to the evaporation temperature(Tdust ≥ 1500 K). The distribution of grain radii downstream is de-termined by sputtering (Dwek 1981), which depends on the shockvelocity and gas density. Throughout shock fronts and downstream,the grains might be completely destroyed by sputtering. The dust-to-gas ratio d/g affects the mutual heating and cooling of gas anddust.
The calculations proceed until the gas cools down to a temper-ature below 103 K (the model is radiation-bounded) or the calcu-lations are interrupted when all the lines reproduce the observedline ratios (the model is matter-bounded). In the case in which pho-toionization and shocks act on opposite edges, i.e. when the cloudpropagates outwards from the radiation source, the calculations re-quire some iterations until the results converge. In this case, thecloud geometrical thickness plays an important role. Actually, ifthe cloud is very thin, the cool gas region may disappear, leading tolow or negligibly low ionization level lines.
Summarizing, the code starts in the first gas slab by adoptingthe input parameters given by the model. Then it calculates thedensity, fractional abundances of the ions from each level for eachelement, free–free, free–bound and line emission fluxes. It calcu-lates Te through thermal balancing or the enthalpy equation andthe optical depth of the slab, in order to obtain the primary andsecondary fluxes by radiation transfer for the next slab. Finally, theparameters calculated in slab i are adopted as initial conditions forslab i + 1. Integrating the line intensities from each slab, the ab-solute fluxes of the lines and of bremsstrahlung are obtained at thenebula. The line ratios to a certain line (generally Hβ for the optical–UV spectrum) are then calculated and compared with the observeddata, in order to avoid problems of distances, absorption, etc. Thenumber of lines calculated by the code (over 300) does not dependon the number of observed lines nor does it depend on the num-ber of input parameters, but rather on the elements composing thegas.
MNRAS 452, 3795–3814 (2015)
Dow
nloaded from https://academ
ic.oup.com/m
nras/article/452/4/3795/1055269 by guest on 22 January 2022

3798 M. Contini
8 9 10 11 12 1320
25
30
35
40
45
50
log F
(a) (b) (c)
Lyα
/Hβ
−2 −1 0 120
25
30
35
40
45
50
log U
Lyα
/Hβ
200 400 600 800 1000
20
40
60
80
100
120
140
160
Vs [km/s]
Lyα
/Hβ
Figure 1. The Lyα/Hβ ratio calculated by the grid of models for (a) NLR of AGN (symbols are given in Table 1), (b) SB (symbols in Table 1) and (c)shock-dominated spectra (red line D = 1017 cm; blue line D = 1019 cm).
2.3 Selection of the models: the grids
The physical parameters are combined throughout calculation ofthe forbidden and permitted lines emitted from a shocked nebula.The range of physical conditions in the gas is deduced, as a firstguess, from the observed line ratios, because they are more con-straining than the continuum spectral energy distribution (SED).We make use of the grids presented by Contini & Viegas (2001a,b)for AGN (GRID1) and SB (GRID2), respectively, for a first esti-mate of the gas physical conditions. The grids were calculated by agradual increase of the input parameters adapted from the observedissues. Grid results give a rough approximation to the observed spec-tra. Diagnostic diagrams for Lyα/Hβ calculated by the code SUMA
for ejected clouds (Fig. 1) show that radiation-dominated models(+shocks) lead to Lyα/Hβ between 20 and 30, with some highervalues (up to 50) for low-velocity, high-density extended clouds.For shock-dominated clouds, Lyα/Hβ ranges between ∼150 and∼15.
The parameters are then refined by detailed modelling of thespectrum. Specific grids of models are calculated for each galaxy,modifying the parameters on small scales in order to reproduce allthe observed line ratios in each spectrum as closely as possible.We generally consider that the observed spectrum is satisfactorilyfitted by a model when the strongest lines are reproduced by thecalculation within 20 per cent and the weak ones within 50 per cent.
The final gap between observed and calculated line ratios is dueto observational errors, both random and systematic, as well asuncertainties in the atomic parameters adopted by the code, suchas recombination coefficients, collision strengths, etc., which arecontinuously updated, and the choice of model itself.
The observed spectra provide averages throughout the wholegalaxy, particularly at high redshifts. When the observed line en-semble is not reproduced satisfactorily by one model, the con-tribution of other regions within the galaxy at different physicalconditions must be accounted for, leading to pluri-cloud models.The different results are summed up by relative weights (see e.g.Rodrıguez-Ardila et al. 2005) when they compensate each other(e.g. in Table 2). When they show similar results, they are left asalternative proposals (e.g. Table 3).
The models selected by the fit of the line spectrum are cross-checked by fitting the continuum SED. In the UV range, thebremsstrahlung from the nebula is blended with blackbody emis-sion from the star population background. The maximum frequencyof the bremsstrahlung peak in the UV–X-ray domain depends onthe shock velocity. In the IR range, dust reprocessed radiation isgenerally seen (Contini, Viegas & Prieto 2004). In the radio range,synchrotron radiation by the Fermi mechanism at the shock front iseasily recognized by the slope of the SED.
Table 1. Symbols used in Fig. 1.
Vs n0 log T∗ log D Symbolskm s−1 cm−3 [104 K] [cm]
AGN 100 100 – 17 black dotted100 100 – 19 black dash-dotted200 200 – 18 blue dotted200 200 – 19 blue dash–dotted100 300 – 17 magenta dotted100 300 – 19 magenta dash–dotted300 300 – 17 green dotted300 300 – 19 green dash–dotted500 300 – 18 red dotted500 300 – 19 red dash–dotted
SB 100 100 4.0 19 red solid100 100 4.7 19 red dash–dotted100 100 5.0 19 red dashed200 200 4.0 19 blue solid200 200 4.7 19 blue dash–dotted200 200 5.0 19 blue dashed300 300 4.0 19 magenta solid300 300 4.7 19 magenta dash–dotted300 300 5.0 19 magenta dashed500 300 4.0 19 black solid500 300 4.7 19 black dash–dotted500 300 5.0 19 black dashed
Table 2. Solar element abundances.
Element Allen Anders & Grevesse Asplund et al.(1976) (1989) (2009)
H 12 12 12C 8.52 8.56 8.43N 7.96 8.05 7.83O 8.82 8.93 8.69Ne 8. 8.09 7.93Mg 7.4 7.58 7.6Si 7.52 7.55 7.51S 7.2 7.21 7.12Cl 5.6 5.5 5.5Ar 6.52 6.56 6.4Fe 7.5 7.67 7.5
The set of input parameters that leads to the best fit of the ob-served line ratios determines the physical and chemical proper-ties of the emitting gas. They are considered as the ‘results’ ofmodelling.
MNRAS 452, 3795–3814 (2015)
Dow
nloaded from https://academ
ic.oup.com/m
nras/article/452/4/3795/1055269 by guest on 22 January 2022

Lyα and UV lines in galaxies at z < 3.7 3799
Table 3. Modelling the spectra observed by Humphrey et al. (2008).
0211–122 1 FWHM2 MH1 MH2 MH3 av 0406–2441 MH4 MH5 av
z 2.340 2.440SFR (M� yr−1) 24.85 911.Lyα 1216 0.21 ± 0.01 1000 9.7 13.3 9.9 10.0 7.0 ± 0.4 25.6 21.2 25.5N V 1240 0.35 ± 0.03 1. 3.87 0.005 0.2 <0.2 0.005 10.9 0.25Si IV+O IV 1403 0.074 ± 0.008 0.33 3.33 0.01 0.15 0.3 ± 0.1 0.04 10.0 0.27N IV] 1485 0.024 ± 0.005 0.07 0.83 0.007 0.04 <0.1 0.02 2.17 0.069C IV 1549+ 0.65 ± 0.02 1. 7.67 0.15 0.5 0.9 ± 0.1 0.31 20.7 0.772He II 1640 0.36 ± 0.01 600 0.83 0.67 0.4 0.42 1.2 ± 0.1 1.44 5.27 1.53O III] 1667 0.028 ± 0.003 0.13 1.23 0.04 0.1 0.2 ± 0.1 0.09 3.6 0.17C III] 1909 0.17 ± 0.03 0.33 3.67 0.46 0.5 0.9 ± 0.1 0.8 9.9 1.0C II] 2326 – 0.2 1.57 0.1 0.17 0.6 ± 0.1 0.46 3.85 0.54[Ne IV] 2423 0.11 ± 0.01 0.07 0.7 0.03 0.06 1.0 ± 0.3 0.09 8.0 0.3[Ne V] 3426 <0.3 0.07 0.7 0.02 0.05 0.5 ± 0.1 0.05 1.8 0.1[O II] 3728+ 0.39 ± 0.08 730 0.17 1.33 0.45 0.48 2.6 ± 0.2 2.65 3.7 2.67[Ne III] 3869 0.31 ± 0.08 390 0.13 0.67 0.34 0.36 1.0 ± 0.1 1.13 2.0 1.15[O III] 4363 <0.4 0.02 0.2 0.032 0.04 – – – –He II 4686 <0.2 0.07 0.07 0.03 0.036 0.21 ± 0.06 0.2 0.4 0.21Hβ quiescent <0.5 0.33 0.33 0.33 0.33 1. ± 0.74 1. 1. 1.[O III] 5007+ quiescent 2.81 ± 0.1 < 500 0.4 2.67 4.3 4.2 12.6 ± 0.1 13. 10.0 12.9[O III] 5007+ perturbed 1.61 ± 0.06 1300 – – – – – – – –[O I] <0.2 0.10 0.67 0.09 0.11 – 1.3 0.58 1.28Hα quiescent 0.77 ± 0.153 < 500 1 1 1 1.0 3.3 2.9 3.1 2.9Hα perturbed 0.23 ± 0.08 – – – – – – – – –[N II] 6585+ <0.2 – 0.43 1.33 0.58 0.6 – – – –[S II] 6725+ <0.2 – 0.013 0.13 0.05 0.055 – – – –Vs (km s−1) <0.2 – 1000 500 300 – – 100 700 –n0 (cm−3) – – 400 300 300 – – 100 300 –F5 – – – – 20 – – 1.3 – –D6 – – 1 1 0.01 – – 1 0.028 –C/H7 – – 3.3 3.3 3.3? – – 3.3 3.3 –N/H7 – – 1 1 1 – – 1. 1. –O/H7 – – 6.6 6.6 6.6 – – 6.6 6.6 –S/H7 – – – – – – – 0.02 0.02 –Hβ calc8 – – 0.1 0.037 1.1 – – 0.05 0.006 –w – – 0.014 0.58 0.40 – – 0.833 0.167 –
1In 10−16 erg cm−2 s−1; 2in km s−1; 3flux of narrow Hα is 6.4 ± 0.5 × 10⁻¹⁶ erg cm−2 s−1; 4flux of Hβ is 3.3 ± 0.2 × 10⁻¹⁷; 5in1010 photon cm−2 s−1 eV−1 at the Lyman limit; 6in 1019 cm; 7in 10−4 units; 8in erg cm−2 s−1.
3 MO D E L L I N G S I N G L E G A L A X Y S P E C T R A
3.1 Spectra of radio galaxies at z ∼ 2.5 from theHumphrey et al. (2008) survey
The long-slit NIR spectra obtained by the Infrared SpectrometerAnd Array Camera (ISAAC) instrument at the Very Large Telescope(VLT) and completed with optical lines (by Keck and Subaru) con-tain a collection of lines in the wavelength range 1200–7000 Å. Theobserved Lyα/Hβ line ratios bridge UV and optical data. Humphreyet al. (2008), modelling the spectra by pure radiation and pure shockmodels, concluded that the galaxies are most probably AGNs in dif-ferent physical conditions, with roughly solar abundances. We haveselected dereddened (Hα/Hβ ∼ 3) spectra of galaxies containingthe Hβ flux in order to compare the Lyα/Hβ line ratios (calculatedat the nebula) with the observation data. We wish to investigatewhether an SB contributes to some of the observed line ratios.
We consider all the line ratios in each spectrum (Tables 3 and 4),trying to reproduce them by models that account for the coupledeffect of photoionization and shocks. The models are describedat the bottom of the tables. Models corresponding to F = 0 areshock-dominated, i.e. photoionizing flux from the source outsidethe emitting nebula is hidden or absent. Similar shock-dominated
models are used to model supernova remnant spectra. The FWHMof the line profiles gives a hint about the shock velocity. DifferentFWHM of lines in the UV and optical ranges indicate that spectraemitted from different clouds within the galaxy should be consid-ered. Therefore, pluri-cloud models are adopted. The weighted sumof the line ratios calculated by different theoretical models for eachspectrum (e.g. columns 7 and 11 in Table 3) is compared with theobserved line ratios. The weights adopted to sum the models arereported in the bottom row of the table.
In Table 3, we show the modelling of galaxies 0211–122 and0406–244. The line fluxes are referred to Hα = 1 for 0211–122and to Hβ = 1 for 0406–244, following the Humphrey et al. (2008)notation. The Hβ flux is given as an upper limit for 0211–122.Considering that the calculated Hα/Hβ line ratio is ∼3 and thelines are referred to Hα = 1, the resulting Hβ ∼0.33, which iswithin the upper limit (0.5). Moreover, the spectrum is rich inlines from different elements at different ionization levels that canconstrain the models. We focus on the [O II] 3727+/[O III] 5007+and C IV 1549+/C III] 1909+/C II] 2326+ line ratios (the + indi-cates that the doublet is summed). We could not find any modelshowing Lyα/Hα as low as 0.2. Using a shock-dominated modelwith Vs = 2000 km s−1 and n0 = 1300 cm−3, it is possible toobtain Lyα/Hβ = 7 (as for the 0406–244 galaxy) and even lower.
MNRAS 452, 3795–3814 (2015)
Dow
nloaded from https://academ
ic.oup.com/m
nras/article/452/4/3795/1055269 by guest on 22 January 2022
3800 M. Contini
Table 4. Modelling the spectra by Humphrey et al. (2008).
Flux1 0529–549 MH6 MH7 0828 MH8 MH9 av 1138–262 MH10 MH11 4C+23.56 MH12 MH13
z 2.575 2.572 2.156 2.479SFR (M� yr−1) 150 86. 56. 163.Lyα 1216 – 27.0 21.2 21.7 45. 32.5 33.8 – 29. 27.6 2.17 47.5 30.4N V 1240 – 0.07 10.9 0.9 24. 0.02 2.6 – 0.024 0.017 0.31 0.03+ 0.06+Si IV+O IV 1403 – 0.09 10. 0.78 2.3 0.05 0.3 – 0.02 0.013 0.05 0.19 0.13N IV] 1485 – 0.02 2.17 0.18 1.3 0.02 0.16 – 0.002 0.002 0.06 0.08 0.02C IV 1549+ – 0.2 20.7 4.5 30.3 0.2 3.5 – 0.054 0.01 0.51 1.63 0.33He II 1640 – 0.83 5.27 2.57 5.8 1. 1.5 – 0.6 0.011 0.43 3.7 1.32O III] 1667 – 0.065 3.6 0.46 3.15 0.1 0.43 – 0.04 0.009 0.11 0.37 0.11C III] 1909 – 0.55 9.9 1.4 4.2 1.1 1.43 – 0.46 0.1 0.28 0.7 1.C II] 2326 – 0.56 3.85 0.48 3.4 0.9 1.17 – 0.35 0.1 0.22 0.19 0.85[Ne IV] 2423 – 0.04 8. 1.2 2. 0.05 0.26 – 0.02 0.0027 0.37 0.26 0.06[Ne V] 3426 <2.1 0.018 1.8 0.76 8.85 0.012 0.98 – 0.01 0.0028 0.74 0.2 0.[O II] 3728+ 3.2 3.3 3.7 1.75 2.1 3.7 3.5 1.44 1.35 1.2 2.57 2.7 3.4[Ne III] 3869 < 2.1 1.0 2. – 1.6 1.48 1.5 0.82 0.68 0.29 0.74 1.36 1.5[O III] 4363 <1 0.04. 0.63 – – – – – – – – – –He II 4686 <1 0.12 0.4 0.29 0.44 0.15 0.18 <0.88 0.09 0.002 <0.86 0.53 0.2Hβ 1. 1. 1 1 1 1 1 1 1 1 1 1 1[O III] 5007+ 10.7 9.0 10 9.53 8. 11.8 11.4 6. 6.3 6.16 13.05 12.5 13.5[O I] 6300+ 0.58 1.1 – – – – – <0.59 0.5 0.002 <0.28 0.7 1Hα 5.2 3.0 3.1 3 3 3 3 3 3 3 3 3 3[N II] 6585+ 2.6 2.76 0. – – – – 2.35 1.9 0.8 0.8 1.0 1.86[S II] 6725 1.58 0.6 0. – – – – 0.85 0.63 0.1 0.86 0.8 0.7Vs (km s−1) – 180 700 – 700 1200 – – 300 300 – 200 200n0 (cm−3) – 100 300 – 400 400 – – 300 300 – 300 300T∗ 2 – – – – – – – – – 4 – 25. –U – – – – – – – – – 0.8 – 0.16 –F3 – 1.0 – – – 6 – – 8 – – – 4D4 – 1 0.028 – 0.019 0.3 – – 0.01 0.01 – 1. 0.01C/H5 – 3.3 3.3 – 3.3 3.3 – – 3.3 3.3 – 0.8 0.8N/H5 – 1 1 – 1 1 – – 1. 1 – 0.5 0.5O/H5 – 6.6 6.6 – 6.6 6.6 – – 6.6 6.6 – 6.6 6.6S/H5 – – – – – – – – 0.3 0.3 – 0.3 0.3Hβ calc6 – 0.06 0.0058 – 0.0089 0.29 – – 0.62 1.6 – 0.59 0.14w – – – – 0.8 0.2 – – – – – – –
Notes. 1In 10−16 erg cm−2 s−1; 2in 104 K; 3in 1010 photon cm−2 s−1 eV−1 at the Lyman limit; 4in 1019 cm; 5in 10−4 units; 6in erg cm−2 s−1.
However, in this case, He II 1640/Hβ = 9 and all other line ratios = 0destroys the good fit obtained by the radiation-dominated model.High FWHM values are adapted to the AGN BLR (≥1000 km s−1)rather than NLR. Forbidden lines such as [O II] 3727 are generallycollisionally de-excited in the BLR, due to the high density. LowLyα/Hα perhaps indicates strong absorption by dust in the nebula.The results presented in Table 3 show that the lines come from dif-ferent clouds within the galaxy. The highest ionization level lines arestronger where collisional ionization dominates. He II 1640, whichis a recombination line, increases with both the temperature of thegas and the photoionization flux.
For 0211–122, we group the shock velocities into two prototypes.Vs ∼ 1000 km s−1, representing high-velocity shocks, fits the UVlines, while Vs ≤ 500 km s−1 reproduces the lines in the opticalrange. The results of selected models appear in columns 4, 5 and 6.The weighted sum of the line fluxes appears in column 7 of Table 3.Models MH1 and MH2, which refer to Vs = 1000 and 500 km s−1,respectively, are shock-dominated (SD, F = 0), while model MH3with Vs = 300 km s−1 is radiation-dominated (RD) + shock. ModelMH2 is included because overpredicting the C IV and [O II] 3727lines improves the approximation of the averaged spectrum. O/H issolar and N/H seems lower than solar by a factor of ∼3, consideringthe [N II]/Hβ line ratio. We refer to the solar abundances by Allen
(1976) presented in Table 2. The average model overpredicts theO IV]/Hα, N IV]/Hα and C III]/Hα multiplet ratios relative to Hα.Both the calculations and the data account for the sum of all themultiplet terms. Different geometrical thickness of the clouds Dindicates fragmentation by shock in a turbulent regime. The 0406–244 spectrum is satisfactorily reproduced by the weighted sum (avin column 11) of models MH4, dominated by AGN radiation, andMH5, dominated by the shock. The relative weights were calculatedphenomenologically in order to obtain the best approximation to thespectrum, even if some line ratios (e.g. [Ne V]) are less fitted. Also,for this galaxy the SD model (MH5) corresponds to the highest Vs
(700 km s−1).More spectra of selected galaxies from the Humphrey et al. (2008)
sample are shown and modelled in Table 4. The FWHM of the lineprofiles range between 600 and 900 km s−1. They are not reportedin the table, due to space limitations. In Table 4, we refer all thespectra to Hβ = 1 in order to compare observed line ratios easilywith model results from different galaxies. The spectrum presentedfor 0529–549 in Table 4 shows a few line ratios. Most are up-per limits. [O III] 5007+/Hβ line ratios calculated by both high Vs
and low Vs models reproduce the data satisfactorily. [N II]/Hβ and[S II]/Hβ depend strongly on the N/H and S/H relative abundances,respectively. Therefore, an averaged model is not significant. The
MNRAS 452, 3795–3814 (2015)
Dow
nloaded from https://academ
ic.oup.com/m
nras/article/452/4/3795/1055269 by guest on 22 January 2022

Lyα and UV lines in galaxies at z < 3.7 3801
modelling of 0828 by model MH8 suggests that carbon should bedepleted by a factor of ∼5 from the gaseous phase, most probablytrapped into grains throughout the nebula. Neon cannot be includedin dust grains because of its atomic structure, so we determine therelative weights of the averaged model av by fitting the [Ne V]/Hβ
line ratio. Model av (column 8) shows that, considering the contri-bution of model MH9, in contrast to our previous hypothesis, C/Hsolar agrees with 0828 observations. The observed lines of 1138–262 are few and the oxygen lines are well approximated by bothAGN and SB-dominated models, therefore the relative weights inan eventual average spectrum are less constrained. The spectrumfor galaxy 4C+23.56 shows a non-negligible [Ne V] while modelMH13 yields [Ne V] = 0; therefore the SB-dominated model MH12is more appropriate.
The main conclusions of Humphrey et al. (2008) are in agreementwith our modelling. These are as follows.
(1) AGN photoionization with U varying between the objects isgenerally indicated. However, we find an SB contribution to 1138–262 and 4C+23.56 spectra.
(2) Single-slab photoionization models are unable to reproducehigh- and low-ionization lines satisfactorily simultaneusly.
(3) Shocks do not provide a valid explanation alone, but must beadded to a photoionization source.
(4) N/H is nearly solar for all objects and does not vary as muchas by a factor of 2–3.
(5) The line FWHM and ionization state are the result of inter-action between clouds in terms of shocks, when radiation from anAGN or SB is absent.
3.2 HDFX 28, a spiral galaxy at z = 2.011 from theobservations of Dawson et al. (2003)
In search for type 2 QSRs, HDFX 28 was identified as a face-onspiral galaxy at z = 2.011. Initially, it was considered as an ex-tended radio source powered by star formation (Richards 2000), butthe hard X-ray source and the spectroscopy demonstrated that thisgalaxy contains an obscured type 2 AGN (Dawson et al. 2003, andreferences therein). The galaxy was observed by Infrared SpaceObservatory Camera and Chandra. Table 5 shows that an SB-dominated model (MDS) roughly reproduces the data. The Dawsonet al. (2003) spectrum contains too few narrow lines, [N II] 6548,6548and Hα, to provide a consistent modelling of the low Vs gas.On the basis of [N II] 6548+6584/Hα, we can predict that, if thereddening is negligible and Hα/Hβ = 3, [N II]/Hβ = 4.11, which in-dicates for a SB model U ≤ 0.1, T∗ = 1–4 × 10⁴ K, Vs = 220 km s−1,n0 = 200 cm−3, D = 1019 cm and solar abundances. For an AGNmodel, such line ratios can be obtained by N/H solar, Vs = 100–250 km s−1 and F ≤ 109 photon cm−2 s−1 eV−1 at the Lyman limitand by Vs = 500 km s−1 and F ≤ 1010 photon cm−2 s−1 eV−1
at the Lyman limit. Similar [N II]/Hβ can be also obtained by aSD (F = 0) model with Vs = 300 km s−1. The preshock densitiesare 100–300 cm−3 and the geometrical thicknesses of the emittingclouds are between 1017 and 1019 cm. In conclusion, the [N II]/Hβ
line ratio alone cannot constrain the narrow-line model.In Fig. 2, we present the modelling of the continuum SED.
The data are given by Dawson et al. (2003, their table 1). Thecontinuum SED calculated by the code SUMA shows two curvesfor each model. One represents bremsstrahlung from gas and thesecond one, in the IR, represents reprocessed radiation from dust.
Table 5. Modelling UV spectra by Dawson et al. (2003), Stern et al. (2002) and Erb et al. (2010).
HDF1 FWHM2 MDS CX03 FWHM2 MSS MSR BX4184 FWHM ME1-0 ME2-0 ME3 MESB
z 2.011 3.288 2.3SFR (M� yr−1) 4.73 18.75 17.5O VI 1035 – – 44.4 1.5: 2640 12.8 0.25 – – – – – –O V 1215 – – 2.4 – – – – – – – – – –Lyα 1216 1.68 1270 1.5 18.9 1520 29.9 35. 11.27 840 35. 34.5 29.6 26.6N V 1240 2.3 2100 2.2 0.6: 1820 0.65 0.16 – – – – – –Si IV+O IV 1403 – – – 0.4 1320 0.3+0.86 0.22 – – – – – –C IV 1549+ 2.47 1300 2.2 3.5 1350 3.5 3.4 – – – – – –He II 1640 0.45 1400 1.0 1.7 940 2. 3.0 0.31 612 0.3 0.31 0.89 0.003O III] 1667 – – – 0.9 1290 0.3 0.4 0.23 235 0.033 0.06 0.14 0.02C III] 1909 0.19 900 0.3 2.1 1090 2. 1.9 0.54 225 0.16 0.27 0.88 0.2Ne IV] 2424 0.3 1470 0.20 – – – – – – – – – –[O II] 3727 – – – – – – – <0.73 −225 0.045 0.09 0.65 0.66Hβ 4861 – – 0.1 1.2 170 1 1 1 <102 1 1 1 1[O III] 5007+ – – 0.7 18.1 300-430 2.7 17.1 8.5 140 0.2 0.49 8. 8.88[N II] 6584+6548 0.96 380 0.02 – – – 2.74 <0.12 – 0.28 0.48 0.2 0.22Hα n 0.7 240 – – – – 3. 3.08 155 3. 2.9 3.3 3.Hα b 2.3 2500 0.278 – – 2.7 – – – – – – –Vs (km s−1) – – 1300 – – 1500 200 – – 840 600 260 260n0 (cm−3) – – 300 – – 110 350 – – 3000 3000 200 200F 5 – – 0 – – – 100 – – 50 50 30 –T∗6 – – 2.5 – – – – – – – – 6.U – – 8 – – – – – – – – 0.7D (1016 cm) – – 9.0 – – 41.5 100 – – 3.6 2. 400 400C/H7 – – 2.6 – – 3.3 3.3 – – 3.3 3.3 3.3 3.3N/H7 – – 1. – – 0.4 0.1 – – 0.3 1.0 0.3 0.3O/H7 – – 6.6 – – 3.6 6.6 – – 6.6 6.6 6.6 6.6Hβ calc8 – – 0.0085 – – 0.035 1.77 – – 10.8 4.5 1.65 0.91
1HDFx28 (Dawson et al. 2003) in 10−17 erg cm−2 s−1; 2in km s−1; 3CXO J084837.9+445352 (Stern et al. 2002) in 10−17 erg cm−2 s−1; 4BX418 (Erb et al.2010) in 2.6 × 10⁻¹⁷ erg cm−2 s−1; 5in 1010 photon cm−2 s−1 eV−1at the Lyman limit; 6in 104 K; 7in 10−4; 8in erg cm−2 s−1.
MNRAS 452, 3795–3814 (2015)
Dow
nloaded from https://academ
ic.oup.com/m
nras/article/452/4/3795/1055269 by guest on 22 January 2022

3802 M. Contini
8 10 12 14 16 18
−12
−10
−8
−6
−4
log (ν [Hz])
log
(νFν [e
rg/c
m2 /s
])
HDFX 28
Figure 2. Modelling the continuum SED observations of Dawson et al.(2003, table 1 and references therein). Blue lines: shock-dominated modelMDS model; black lines: AGN radiation-dominated model calculated byVs = 220 km s−1, n0 = 200 cm−3, log F = 9 and solar abundances; redlines: SB radiation-dominated model calculated by T∗ = 3 × 10⁴ K andU = 0.1.
The data in the radio–UV–soft X-ray range are well fitted by thehigh Vs, SB-dominated model MDS. Harder X-ray data in Fig. 2could be reproduced by a model calculated using a shock velocityeven higher than 1500 km s−1, as suggested by the FWHM of someline profiles. The AGN and SB-dominated models calculated byVs = 220 km s−1, which were predicted on the basis of the [N II]/Hβ
line ratio, reproduce the data in the optical range, in agreementwith the Hα narrow-line FWHM. The modelling of the HubbleDeep Field (HDF) galaxy continuum SED constrains the choice oflow-velocity model, but, on the basis of the present data, it cannotdistinguish between an AGN or SB.
3.3 Spectrum from CXO 52 using Stern et al. (2002)observations
CXO 52 was identified as an optical, colour-selected, high-redshiftsource (Stern et al. 2002) and by optical follow-up of X-ray sourcesin the Lynx field (e.g. Stanford et al. 1997). Stern et al. (2002) reportobservations of a type 2 quasar at z = 3.288 that was identifiedas a hard X-ray source by the Chandra X-ray observatory. Theoptical spectrum of CXO 52 was obtained by the Keck I telescope.Line-profile FWHM values are broad (≥1000 km s−1). A shock-dominated model with Vs = 1500 km s−1 and pre-shock densityn0 = 110 cm−3, resembling those found in other galaxies at similarredshifts, fits most of the UV lines (MSS, Table 5). Lyα/Hβ isoverpredicted by a factor of 1.6. O VI 1035/Hβ is underpredicted andN V 1240/Hβ is well reproduced. The maximum temperature of thegas downstream, near the shock front, depends on the shock velocity(Section 2). Therefore, the MSS model fits N V/Hβ because N V is ahigh ionization level line. O VI, which shows FWHM = 2640 km s−1,cannot be well reproduced by model MSS.
Hβ and the forbidden lines [O III] 5007+ correspond to lowerFWHM (170–430 km s−1). The lines are emitted from clouds withinthe galaxy with different Vs. A radiation-dominated model (MSR)with Vs = 200 km s−1 and n0 = 350 cm−3 reproduces the UVlines (except O VI and N V) within a factor of 2 and explains the
8 10 12 14 16 18
−13
−12
−11
−10
−9
−8
−7
−6
−5
−4
log (ν [Hz])
log
(νFν [e
rg/c
m2 /s
])
CX0
Figure 3. Modelling the continuum SED observations of Stern et al. (2002,their table 1 and references therein). Blue lines: shock-dominated model,MSS; red lines: radiation-dominated model, MSR.
high [O III] 5007+4959/Hβ. The flux from the AGN correspondsto a Seyfert 2. The results of the two models are not summed up,because they show very different gas conditions in (most probably)well separated regions throughout the galaxy.
To cross-check the models, we compare the bremsstrahlung cal-culated by models MSS and MSR with the data presented by Sternet al. (2002) (in their table 1) in Fig. 3. The datum at 2–10 keVis well reproduced by model MSS, calculated by a high shock ve-locity. The bremsstrahlung maximum depends on the maximumtemperature of the gas downstream. Dust grains can be completelydestroyed by sputtering at high shock velocities (>1000 km s−1).The grains in the nebulae represented by models MDS and MSSare characterized by a relatively large initial radius (agr = 1 µm) inorder to survive strong sputtering throughout a high velocity shockfront. However, they can be completely destroyed by sputtering andevaporation, as happens for model MSS, depending on the down-stream cooling rate. The relatively low Vs that characterizes the gasconditions in model MSR yields grain survival. The bremsstrahlungcalculated by model MSR, which corresponds to gas ionized andheated by the flux from the AGN (+shocks), roughly fits the datain the UV–optical and radio ranges. The reprocessed radiation dueto dust in the IR is constrained by only one datum, which leads tod/g = 10−4 by mass.
3.4 The spectrum observed from Q2343–BX418by Erb et al. (2010)
In column 9 of Table 5, we present the observed line ratios forgalaxy BX418 at z = 2.3, defined by Erb et al. (2010) as ‘oneof the youngest and lowest stellar mass continuum-selected z ∼2galaxies’.
The spectral lines show different FWHM for different wave-lengths, decreasing from ∼840 km s−1 for Lyα to 640 km s−1 forHe II 1640 down to ≤260 km s−1 for lines in the optical–near–UVrange (Table 5, column 10). The observations show that differentcomponents contribute to different lines. Although permitted linefluxes (e.g. Lyα and He II) depend strongly on the photoionizing ra-diation reaching the nebula, they also increase with the temperatureof the emitting gas (see Section 3.8). Therefore, models accounting
MNRAS 452, 3795–3814 (2015)
Dow
nloaded from https://academ
ic.oup.com/m
nras/article/452/4/3795/1055269 by guest on 22 January 2022
Lyα and UV lines in galaxies at z < 3.7 3803
for shock + photoionization are used. The models are presented inTable 5. We first investigate whether an AGN (hidden?) is present.The high Lyα and He II 1640 FWHM suggest shock velocitiesof ∼850 and ∼600km s−1, respectively. They are accompanied by aAGN flux characteristic of Seyfert 2 galaxies. The densities are highenough throughout the nebula to reduce the primary and secondaryfluxes rapidly. The temperature drop will lead to very low lineintensities in the optical range. Actually, broad optical lines werenot observed. We could not obtain reasonable results with modelscorresponding to outflow of the gas. On the contrary, gas inflowtowards the AGN is indicated (models ME1-0 and ME2-0). Wereproduced the near-UV and optical line ratios using models corre-sponding to the NLR conditions. Models ME3 and MESB roughlyfit the [O II]/Hβ and [O III]/Hβ line ratios. ME3 refers to an AGN,while MESB refers to a SB radiation source. Both show outlow ofgas from the SB and are similar to those found in other galaxies atthose redshifts. We suggest that all the gas conditions representedby the models in Table 5 are present within BX418, contributingto different lines in the spectrum. The models are not co-added,in order to show individual contributions to each line. BX418has been placed among metal-poor galaxies (Erb et al. 2010).However, the low metallicity (0.05 solar) was calculated by Erbet al. (2010) using strong-line metallicity diagnostics as well as bydirect methods. They found 12 + log (O/H) = 7.9 ± 0.2,while the results of detailed modelling yield solar12 + log (O/H) = 8.812. The discrepancy between metallicitiescalculated by direct methods and modelling has been discussed byContini (2014b).
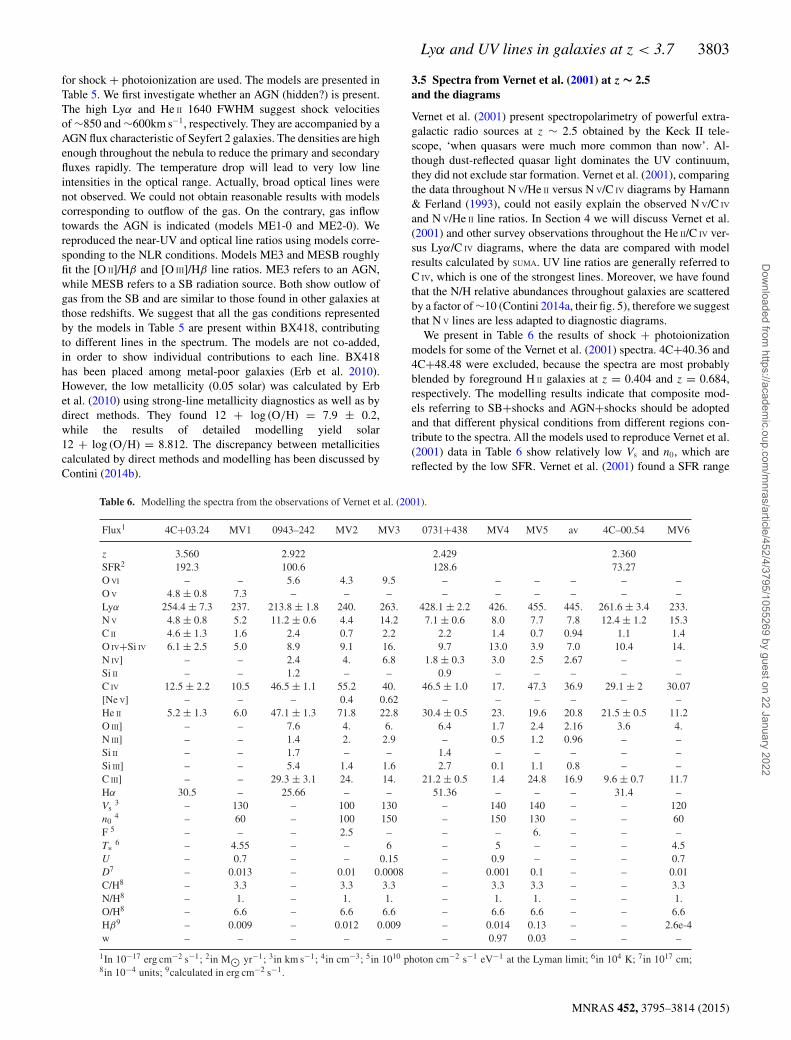
3.5 Spectra from Vernet et al. (2001) at z ∼ 2.5and the diagrams
Vernet et al. (2001) present spectropolarimetry of powerful extra-galactic radio sources at z ∼ 2.5 obtained by the Keck II tele-scope, ‘when quasars were much more common than now’. Al-though dust-reflected quasar light dominates the UV continuum,they did not exclude star formation. Vernet et al. (2001), comparingthe data throughout N V/He II versus N V/C IV diagrams by Hamann& Ferland (1993), could not easily explain the observed N V/C IV
and N V/He II line ratios. In Section 4 we will discuss Vernet et al.(2001) and other survey observations throughout the He II/C IV ver-sus Lyα/C IV diagrams, where the data are compared with modelresults calculated by SUMA. UV line ratios are generally referred toC IV, which is one of the strongest lines. Moreover, we have foundthat the N/H relative abundances throughout galaxies are scatteredby a factor of ∼10 (Contini 2014a, their fig. 5), therefore we suggestthat N V lines are less adapted to diagnostic diagrams.
We present in Table 6 the results of shock + photoionizationmodels for some of the Vernet et al. (2001) spectra. 4C+40.36 and4C+48.48 were excluded, because the spectra are most probablyblended by foreground H II galaxies at z = 0.404 and z = 0.684,respectively. The modelling results indicate that composite mod-els referring to SB+shocks and AGN+shocks should be adoptedand that different physical conditions from different regions con-tribute to the spectra. All the models used to reproduce Vernet et al.(2001) data in Table 6 show relatively low Vs and n0, which arereflected by the low SFR. Vernet et al. (2001) found a SFR range
Table 6. Modelling the spectra from the observations of Vernet et al. (2001).
Flux1 4C+03.24 MV1 0943–242 MV2 MV3 0731+438 MV4 MV5 av 4C–00.54 MV6
z 3.560 2.922 2.429 2.360SFR2 192.3 100.6 128.6 73.27O VI – – 5.6 4.3 9.5 – – – – – –O V 4.8 ± 0.8 7.3 – – – – – – – – –Lyα 254.4 ± 7.3 237. 213.8 ± 1.8 240. 263. 428.1 ± 2.2 426. 455. 445. 261.6 ± 3.4 233.N V 4.8 ± 0.8 5.2 11.2 ± 0.6 4.4 14.2 7.1 ± 0.6 8.0 7.7 7.8 12.4 ± 1.2 15.3C II 4.6 ± 1.3 1.6 2.4 0.7 2.2 2.2 1.4 0.7 0.94 1.1 1.4O IV+Si IV 6.1 ± 2.5 5.0 8.9 9.1 16. 9.7 13.0 3.9 7.0 10.4 14.N IV] – – 2.4 4. 6.8 1.8 ± 0.3 3.0 2.5 2.67 – –Si II – – 1.2 – – 0.9 – – – – –C IV 12.5 ± 2.2 10.5 46.5 ± 1.1 55.2 40. 46.5 ± 1.0 17. 47.3 36.9 29.1 ± 2 30.07[Ne V] – – – 0.4 0.62 – – – – – –He II 5.2 ± 1.3 6.0 47.1 ± 1.3 71.8 22.8 30.4 ± 0.5 23. 19.6 20.8 21.5 ± 0.5 11.2O III] – – 7.6 4. 6. 6.4 1.7 2.4 2.16 3.6 4.N III] – – 1.4 2. 2.9 – 0.5 1.2 0.96 – –Si II – – 1.7 – – 1.4 – – – – –Si III] – – 5.4 1.4 1.6 2.7 0.1 1.1 0.8 – –C III] – – 29.3 ± 3.1 24. 14. 21.2 ± 0.5 1.4 24.8 16.9 9.6 ± 0.7 11.7Hα 30.5 – 25.66 – – 51.36 – – – 31.4 –Vs
3 – 130 – 100 130 – 140 140 – – 120n0
4 – 60 – 100 150 – 150 130 – – 60F 5 – – – 2.5 – – – 6. – – –T∗ 6 – 4.55 – – 6 – 5 – – – 4.5U – 0.7 – – 0.15 – 0.9 – – – 0.7D7 – 0.013 – 0.01 0.0008 – 0.001 0.1 – – 0.01C/H8 – 3.3 – 3.3 3.3 – 3.3 3.3 – – 3.3N/H8 – 1. – 1. 1. – 1. 1. – – 1.O/H8 – 6.6 – 6.6 6.6 – 6.6 6.6 – – 6.6Hβ9 – 0.009 – 0.012 0.009 – 0.014 0.13 – – 2.6e-4w – – – – – – 0.97 0.03 – – –
1In 10−17 erg cm−2 s−1; 2in M� yr−1; 3in km s−1; 4in cm−3; 5in 1010 photon cm−2 s−1 eV−1 at the Lyman limit; 6in 104 K; 7in 1017 cm;8in 10−4 units; 9calculated in erg cm−2 s−1.
MNRAS 452, 3795–3814 (2015)
Dow
nloaded from https://academ
ic.oup.com/m
nras/article/452/4/3795/1055269 by guest on 22 January 2022

3804 M. Contini
Table 7. Modelling the spectrum of the SST24 J1434110+331733 nebula (Dey et al. 2005), CDF–S202 (Norman et al. 2002) and the Lynx arc (Fosburyet al. 2003).
Flux SST241 MDR MDOS MDSB av CDF–S2022 FWHM3 MNR MNS Lynx4 MF0 MFSB
z 2.656 3.7 3.36SFR (M� yr−1) 134.6 136.2 177.8Lyα 1216 28.9 ± 0.15 – – – – – – – – – – –Lyα 1216 4.05 ± 0.01 – – – – – – – – – – –Lyα 1216 3.10 ± 0.01 3.03 3.3 4.9 3.39 16.4 <1130 28. 22.6 10.8 31.8 38.N V 1240 <0.05 0.017 0.03 0.1 0.03 5.9 <1680 0. 8.75 ≤0.09 0.3 0.001Si IV 1397 – – – – – – – – – ≤0.09 0.09 -N IV] 1483+ – – – – – – – – – 0.42 0.15 0.05C IV 1549+ 0.417 ± 0.001 0.6 0.47 0.4 0.49 9.9 <1680 3.19 12.2 3.65 3.6 0.46He II 1640 0.4 ± 0.004 0.82 0.39 0.3 0.45 2.8 <680 0.7 6.48 0.11 0.11 0.12O III] 1661+ – – – – – – – – – 0.56 0.48 0.09N III] 1750 – – – – – – – – – 0.18 0.1 0.12Si III] 1883+ – – – – – – – – – 0.15 0.14 0.06C III] 1909 0.05 ± 0.01 0.0013 0.18 0.03 0.13 – – 12.8 4.8 0.59 1.4 1.0[O II] 3727+ – – – – – – – – – ≤0.25 0.17 0.57[Ne III] 3869+ – – – – – – – – – ≤0.91 0.2 1.16He II 4686 – – – – – – – – – ≤0.22 0.01 0.02Hβ – 0.1 0.1 0.1 0.1 1 – 1 1 1 1. 1[O III] 5007+ – – – – – – – – – 10.1 0.7 9.5081 0.52 ± 0.004 – – – – – – – – – – –Hα 6563 0.371 0.3 0.3 0.3 0.3 1.97 – 3. 3. – 3.7 3.1Vs (km s−1) – 1700 1700 300 – – – 1600 1600 – 320 100n0 (cm−3) – 110 110 150 – – – 120 120 – 2000 300F 5 – 100 – – – – – 1 – – – –T∗6 – – – 2.5 – – – – – – – 1.1U – – – 8 – – – – – – – 0.3D (1017 cm) – 300 3. 5. – – – 100 15 – 1 4900C/H7 – 3.3 3.3 3.3 – – – 3.3 3.3 – 3.3 3.3N/H7 – 1. 0.1 1. – – – 1. 1. – 0.2 1.0O/H7 – 6.6 6.6 6.6 – – – 6.6 6.6 – 6.6 3.6Hβ calc8 – 0.0336 0.024 5.68 – – – 200. 0.0085 – 0.15 8.7w – 0.137 0.822 0.041 – – – – – – – –
110−16 erg cm−2 s−1(Dey et al. 2005); 210−16 erg cm−2 s−1(Norman et al. (2002); 3in km s−1 ; 4in 10−17 erg cm−2 s−1(Fosbury et al. 2003); 5in 1010 pho-ton cm−2 s−1 eV−1 at the Lyman limit; 6in 105 K; 7in 10−4 units; 8in erg cm−2 s−1.
from ∼60 M� yr−1 to ≤2 M� yr−1. In particular, they calculateSFR between 30 and 120 M� yr−1 for 0731+438, the only objectwhere reprocessed radiation from an AGN does not dominate thecontinuum (for the other objects, starlight contributes less than halfof the UV continuum; see Vernet et al. 2001, their table 5), assum-ing E(B − V) = 0.1 and a stellar population age of 109 yr. Ourcalculations give SFR ∼ 128 M� yr−1 for 0731+438, a minimumSFR ∼24.4 for 4C+23.56a, etc. (see Table 6). Cimatti et al. (1998)noticed that the properties of 4C 23.56, 4C 00.54 and 4C 41.17 sug-gest an evolutionary scenario in which high-z radio galaxies have amajor episode of star formation and the AGN component is dilutedby stellar light, but becomes observable at lower z when the star-burst ceases. This will be seen throughout the T∗, U and F profilesas a function of z, in Section 4.
3.6 Line and continuum observations of an extended nebulaby Dey et al. (2005)
Massive ellipticals at high z (≥3) are surrounded by large (100–200 kpc) luminous (>1043 erg s−1) Lyα nebulae and small em-bedded star-forming objects. Investigating haloes >100 kpc andenvironments of luminous radio galaxies affected by AGNs andejecta of similarly large Lyα nebulae, Dey et al. (2005) reportedobservations of a very extended (160 kpc) Lyα-emitting nebula atz = 2.656. SST24 J1434110+331733 data were obtained by the
Low Resolution Imaging Spectrometer (LRIS) on the Keck I tele-scope.
The spectroscopic observations reveal very complex regionswithin the extended nebula, including several continuum sources.Dey et al. (2005) suggest that many active galaxies are forming inthat region, which leads to three main contributions to the continuumspectrum. Galaxy A shows interstellar absorption lines and no Lyα
emission; the spectrum of the second continuum source is quite redand shows weak C IV and C III] emission at z = 2.656. Star formationis suggested because the source is close to the Multiband ImagingPhotometer for Spitzer (MIPS) 24-µm location. The third contin-uum source lies in the centre of the Lyα nebula associated with C IV
and He II. The velocity structure of the nebula deduced from the lineprofiles shows that the velocity varies uniformly across the centralregion. If this is due to gas kinematics, the variation can be due toinfall, outflow or rotation.
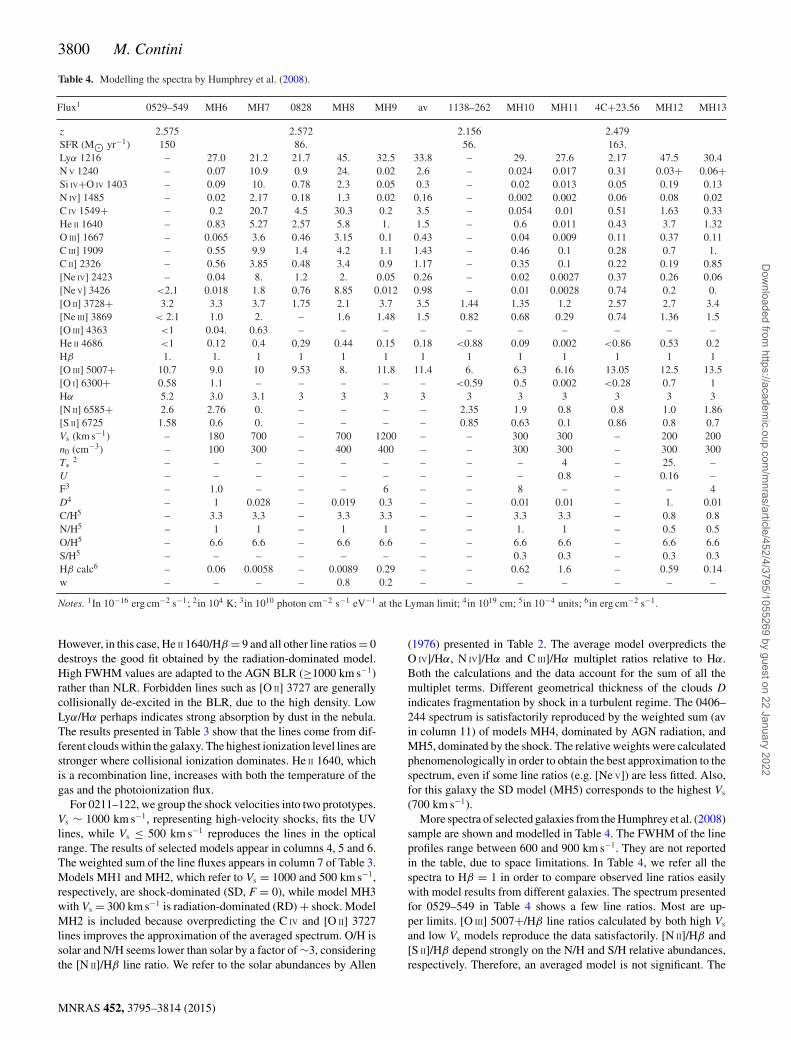
We refer to the line and continuum observations by Dey et al.(2005). The results of modelling are presented in Table 7. On thebasis of the observed lines corresponding to broad profiles, we haverun models with Vs >1000 km s−1. We find large contributions to theline fluxes from high-velocity (Vs = 1700 km s−1) shock-dominatedgas (models MDOS) and gas photoionized by an AGN (modelMDR). Moreover, the contribution from gas with Vs = 300 km s−1
and photoionized by an SB is evident (MDSB). The high velocitiesare at the limit of those observed in AGN NLR. The AGN flux
MNRAS 452, 3795–3814 (2015)
Dow
nloaded from https://academ
ic.oup.com/m
nras/article/452/4/3795/1055269 by guest on 22 January 2022

Lyα and UV lines in galaxies at z < 3.7 3805
8 10 12 14 16 18−19
−18
−17
−16
−15
−14
−13
−12
−11
−10
log (ν [Hz])
log
(νFν [e
rg/c
m2 /s
])
SST24
Figure 4. Continuum SED modelling of the Dey et al. (2005) data. Bluelines: AGN model; red lines: SB model; black lines: shock-dominated modeland reradiation by dust at 1000 K.
is characteristic of Seyfert 2s. The starburst temperature that leadsto a satisfactory fit of the line ratios (2.5 × 10⁵ K) is as high asthat found in galaxies showing activity (Contini 2014b). Also, theionization parameter is high. The gas throughout the SB shows‘normal physical conditions’ in the emitting nebulae of galaxies atsuch redshifts. However, to have a good fit of the N V 1240 line,we have adopted N/H lower than solar by a factor of ∼10 in theshock-dominated gas. This indicates that it is located in a differentregion of the galaxy. The weighted sum of the calculated spectra (av)appears in Table 7, column 6. We suggest that the λ5081 line refersto scandium (4F3/2–4F0
9/2, White 1934, their fig. 14.7). Scandiumlines are observed in SN spectra (Bose et al. 2015).
Fig. 4 shows that the continuum SED calculated by the modelsselected by fitting the line ratios reproduce the observed continuumdata presented by Dey et al. (2005, their fig. 2). Bremsstrahlungfrom gas heated by the strong shock shows a maximum at highfrequency (Contini et al. 2004). X-ray emission is predicted. Themass of the emitting gas (6 × 10¹² M� ) was calculated by Deyet al. (2005). The mass of dust can be calculated by d/g = 0.003by mass. The dust-to-gas ratio results from the fit of the continuumSED in the IR.
3.7 A classic type 2 QSO at z = 3.7: CDF–S202 observationsby Norman et al. (2002)
Norman et al. (2002) observed the AGN detected at z = 3.7 bya Chandra Deep Field South 1-Ms exposure. It is a distant type2 AGN, with the UV showing a FWHM of ∼1500 km s−1. Theoptical spectrum was obtained with the multislit mode on the Fo-cal Reducer and Low Dispersion Spectrograph #1 on the EuropeanSouthern Observatory (ESO)/VLT–ANTU. Detailed modelling (Ta-ble 7, columns 9 and 10) indicates that a shock-dominated model(MNS) fits the lines within a maximum discrepancy factor of 2.3 forHe II 1640 (Table 7). This model calculated using Vs = 1600 km s−1
would provide O VI 1035/Hβ ∼ 200. Norman et al. (2002) found ahigh metallicity, while we suggest N/H lower by a factor of 1.5 thansolar and C/H about solar, considering the uncertainty of the linefluxes. Referring the lines to C IV = 10, as is generally done for UVspectra, an acceptable fit of all the line ratios is obtained. The radia-tion (AGN + shock) dominated model (MNR) calculated using high
8 10 12 14 16 18−19
−18
−17
−16
−15
−14
−13
log (ν [Hz])
log
(νFν [e
rg/c
m2 /s
])
SDF−S202
Figure 5. Continuum SED modelling of SFD-S202. The data are adaptedfrom Norman et al. (2002, their fig. 6) Blue lines: shock-dominated model,MNS; red lines: AGN model, MNR; black solid line: X-ray data.
Vs reproduces the line ratios approximately. In Fig. 5, we presentthe modelling of the continuum SED. The data were adapted fromNorman et al. (2002) (their fig. 6). The continuum calculated by theradiation (+ shock) dominated model MNR reproduces the data inthe optical–UV better than the shock-dominated model MNS, sothe MNR model should be accounted for, but with a low relativeweight.
3.8 Spectrum of the Lynx arc at z = 3.357 fromFosbury et al. (2003)
The Lynx arc (z = 3.357) is characterized by a very red R − K colourand strong, narrow emission lines. Fosbury et al. (2003) claim thatanalysis by Hubble Space Telescope (HST) WFPC2 imaging andKeck optical and IR spectroscopy indicate a H II galaxy magni-fied by a factor of 10 by a cluster environment including starswith T∗ ∼ 106 K, U ∼ 1 and low metallicity (0.05 solar). In Ta-ble 7, column 11, the observed spectrum of the Lynx arc presentedby Fosbury et al. (2003, their table 2) is reported. The spectrumshows a relatively large number of line ratios including [O II]/Hβ
and [O III]/Hβ in the optical range, reproduced by Fosbury et al.(2003) using a pure photoionization model with T∗ = 8 × 10⁴ K,log U = −1 and Z = 0.05 Z�. These parameters were suggestedby comparison with synthetic SEDs calculated by STARBURST99 (Lei-therer et al. 1999). The FWHM of the profiles are ≤ 100 km s−1
for lines in the optical range and higher for those in the UV. Wesearched by modelling the spectrum for a (hidden) AGN, but AGN-dominated models lead to He II/Hβ ≥1, higher by a factor ≥ 10than observed. The shock-dominated model MF0 (Table 7, col-umn 12) calculated by a relatively low shock velocity (320 km s−1)and high preshock density (n0 = 2000 cm−3) fits most of the UVline ratios, but underpredicts [O III] 5007+/Hβ by a factor ≥ 10. SBradiation-dominated model MFSB, calculated by T∗ = 1.1 × 10⁵ K,U = 0.3, D = 4.9 × 1020 cm, Vs = 100 km s−1, n0 = 300 cm−3 andO/H ∼ 0.5 solar, reproduces most of the line ratios from relativelylow ionization levels satisfactorily. Model MFSB, which accountsfor photoionization by SB + shocks, represents gas ejected out-wards, while for model MF0 the direction of the emitting gas isambiguous.
MNRAS 452, 3795–3814 (2015)
Dow
nloaded from https://academ
ic.oup.com/m
nras/article/452/4/3795/1055269 by guest on 22 January 2022

3806 M. Contini
4
6
log(
Te,
n e) a) a)
−4
−2
0
log(
Xi/X
) b) b)
14.5 15 15.5 16 16.5 170
1
2
log distance from shock front [cm]
Lyα
/Hβ,
Hα
/Hβ
c) c)
Figure 6. Profiles of physical quantities throughout the emitting nebula forthe SD model MF0. The shock front is on the left. Top: electron temper-ature (solid black), electron density (dashed black). Middle: H+/H (solidblack), He++/He (dashed black), C2 +/C (dashed red), C3 +/C (solid red),N4 +/N (solid blue), O+/O (dashed green), O2 +/O (solid green). Bottom:log (Lyα/Hβ) (solid black), log (Hα/Hβ) (dashed black) and log (Lyα/Hα)(dot–dashed red).
Finally, we show in Figs 6 and 7 the profiles of the physicalparameters throughout the emitting nebula for models MF0 andMFSB, respectively, in order to understand the results. In Figs 6and 7, the electron temperature (in K) and electron density (incm−3) appear in the top diagrams. In Fig. 7, the nebula is dividedinto two halves in order to obtain a comparable view at the twoedges. Logarithmic symmetric scales are used for the x-axis. Theshock front is on the left of the left panel and the right edge ofthe right panel is reached by the radiation flux from the SB. Inthe middle panels of Figs 6 and 7, the fractional abundances ofthe ions corresponding to significant lines are shown. The bottomdiagrams are dedicated to the Lyα/Hβ, Hα/Hβ and Lyα/Hα lineratios (in logarithm). Figs 6 and 7 show that Lyα/Hα follows the H+
recombination trend. The two sides of the nebula (shock-dominatedat the left and radiation-dominated at the right of Fig. 7) are bridgedby diffuse secondary radiation. In fact, the temperature is ∼ 104 Keven in the extended internal region of the nebula. Most of the C,N, O lines come from the radiation-dominated side of the nebula.
3.9 Finkelstein et al. (2011) survey
Finkelstein et al. (2011) present in their table 1 the measured linefluxes for a sample of galaxies at 0.24 ≤ z ≤ 0.324 from spec-troscopy of LAE using the Hectospec spectrograph with the 6-mMultiple Mirror Telescope (MMT) telescope.
We report in Table 8 the results of modelling the observed lineratios and we add the UV lines N V, C IV and He II, calculated con-sistently by the same models. Those lines that are not observedby Finkelstein et al. (2011) will be discussed in the following.In Table 8, the observed line ratios (EGS7–EGS25, corrected byHα/Hβ = 3) are followed in the next rows by the results of SBmodels (MSB7–MSB25) and AGN models (MAG7–MAG25). Theinput parameters are reported in Tables 9 and 10.
Lyα lines are calculated consistently with the other lines. Lyα/Hβ
calculated line ratios (column 3) reproduce the data within a factor of2. In column 4, SFR are indicated for each galaxy. The percentageuncertainty appears in column 5. The galaxies of the Finkelsteinet al. (2011) sample present rather homogeneous characteristics.The O/H relative abundances are solar at most, while the N/H ratiosare lower than solar by a factor < 10. Densities and velocities arerelatively low. The flux from the active nucleus is in the range ofthat found in low-luminosity AGNs. The star temperatures do notreach the maxima corresponding to outbursts (Contini 2014b). Thegeometrical thickness of the clouds shows fragmentation in the SBrather than AGN neighbourhood.
3.10 Predicted Lyα and UV lines from galaxies at0.06 < z < 0.9
The R[O III] ([O III] 5007+/[O III] 4363) line ratios indicate that gasdensities and temperatures in ranges larger than those deduced onaverage from the observations should be accounted for. This is validfor the AGN NLR spectra (see e.g. Contini & Aldrovandi 1986,their fig. 4 and references therein) and for most objects throughoutthe Galactic medium (e.g. SN remnants, novae, symbiotic stars)and the extragalactic one. In Seyfert type 1 galaxies, [O III] linesfrom the BLR are collisionally de-excited. In Seyfert type 2s, the[O III] lines correspond to gas with Vs = 300–500 km s−1 and densi-ties of 104–105 cm−3. In intermediate-type galaxies, R[O III] rangesbetween > 100 and < 20. Low-Ionization Nuclear Emission-lineRegions (LINERs: Heckman 1980; Ferland & Netzer 1983; Ho,Filippenko & Sargent 1993) cannot be considered as a low-F case(Contini & Aldrovandi 1983, fig. 3). Problems can be solved by
Figure 7. Same as Fig. 6, for model MFSB.
MNRAS 452, 3795–3814 (2015)
Dow
nloaded from https://academ
ic.oup.com/m
nras/article/452/4/3795/1055269 by guest on 22 January 2022

Lyα and UV lines in galaxies at z < 3.7 3807
Table 8. Modelling the line ratios corrected to Hβ = 1 observed by Finkelstein et al. (2011).
ID z SFR Lyα per cent N V C IV He II [O II] [O III] Hα [N II]M� yr−1 1215 – 1240 1550 1640 3727+ 5007+ 6563 6584
EGS7 0.2440 0.4 17.53 15.9 – – – 2.14 5.65 3. 0.134MSB7 24.3 – 0.0014 0.34 0.078 2.3 5.6 2.93 0.16MAG7 28.6 – 0.0009 0.15 1.22 2. 6.4 3.3 0.18EGS8∗ 0.2395 0.035 16.7 32.8 – – – 2.47 3.7 3. <0.03MSB8 23.8 – 0.0024 0.28 0.0037 2. 3.5 2.95 0.1MAG8 28.6 – 0.0005 0.14 0.89 2. 3.46 3.34 0.1EGS10 0.2466 0.12 33.9 16.7 – – – 3.06 4.37 3. <0.06MSB10 24.6 – 0.016 0.46 0.044 3.2 4.5 2.94 0.12MAG10 28. – 0.001 0.029 1.1 3.1 4.65 3.2 0.14EGS11 0.2524 0.059 41.1 35.3 – – – 2.78 1.53 3. 0.84MSB11 24.5 – 0.1 0.3 0.0026 2.3 1.5 2.96 0.87MAG11 26.5 – 0.0027 0.1 0.67 2.5 1.57 3.3 0.9EGS12 0.2515 0.062 48.7 20.8 – – – 2.8 2.7 3. 0.38MSB12 24.5 – 0.067 0.42 0.01 2.9 2.63 3. 0.46MAG12 28. – 0.0027 0.28 0.8 2.5 2.8 3.3 0.37EGS13 0.2607 0.46 17.96 21. – – – 2.8 2.26 3. 0.43MSB13 24.5 – 0.067 0.42 0.0092 2.9 2.45 2.95 0.47MAG13 31.54 – 0.017 0.25 0.73 3. 2.35 3.3 0.46EGS19 0.2666 0.11 33.96 21.9 – – – 2.4 1.23 3. 0.86MSB19 24.4 – 0.1 0.31 0.0046 2.36 1.3 3. 0.86MAG19 26.4 – 0.0027 0.1 0.61 2.5 1.25 3. 0.96EGS20∗ 0.2680 0.073 11.57 27.2 – – – 3.04 4.2 2.9 <0.137MSB20 24.3 – 0.024 0.46 0.015 2.96 4.12 2.93 0.14MAG20 28. – 0.001 0.29 1.1 3. 4.5 3. 0.14EGS21 0.2814 0.06 46.4 21.6 – – – 1.98 0.415 3. 0.12–1.4MSB21 32. – 0.063 0.155 0.0015 2.2–1.8 0.47–0.4 3.3 0.13–1.2MAG21a 30.5 – 0.002 0.3 0.27 1.8 0.45 3.46 1.5MAG21b 28.3 – 0.0027 0.14 0.31 2.1 0.42 3.4 0.15EGS22 0.2828 0.12 242. 35.9 – – – 3.17 0.74 3. <0.14MSB22 25.5 – 0.023 0.9 0.011 3. 0.75 2.96 0.13MAG22 27.9 – 0.002 0.22 0.5 3.2 0.72 3.3 0.12EGS23 0.2865 0.42 18.4 15.8 – – – 2.65 3.7 3. 0.32MSB23 24.2 – 0.045 0.55 0.012 2.65 3.74 2.93 0.31MAG23 27.1 – 0.004 0.3 1.0 2.60 3.88 3.2 0.37EGS25 0.3243 1.06 6.5 16.6 – – – 1.76 5.94 3. 0.16MSB25 24. – 0.04 0.68 0.023 1.8 6.2 2.93 0.15MAG25 28.9 – 0.0005 0.11 1.13 1.8 5.95 3.3 0.14
∗ Not Balmer-corrected, because the observed Hα/Hβ ∼ 3.
Table 9. Input parameters for Finkelstein et al. (2011) MSB models.
Model Vs n0 T∗ U N/H O/H D Hβ
1 2 3 4 5 6 7 8
MSB7 100 100 6.4 0.02 0.1 5. 9. 0.02MSB8 100 100 4.2 0.03 0.2 6.6 3. 0.0196MSB10 150 100 5.9 0.02 0.1 6.0 4. 0.019MSB11 150 100 4. 0.03 0.9 6.6 4. 0.027MSB12 180 100 4.8 0.025 0.4 6.6 5. 0.024MSB13 180 100 4.7 0.025 0.4 6.6 5. 0.025MSB19 210 100 3.9 0.04 0.8 6.6 5. 0.038MSB20 220 100 4.8 0.035 0.13 6.6 1. 0.029MSB21 170 100 4. 0.015 0.1 6.6 300 0.058MSB22 200 150 4.2 0.015 0.06 5.2 80 0.023MSB23 190 100 4.4 0.034 0.2 5.6 1. 0.022MSB25 170 100 4.9 0.034 0.15 5. 1. 0.023
1: in km s−1; 2: in cm−3; 3: in 104 K; 4: in 1015 cm; 5: in 10−4; 6: in 10−4;7: in 1017 cm; 8: in erg cm−2 s−1.
Table 10. Input parameters for Finkelstein et al. (2011) MAG models.
Model z Vs n0 F N/H O/H D Hβ
1 2 3 4 5 6 7
MAG7 0.2440 100 150 7. 0.2 5.6 3 0.066MAG8 0.2395 100 150 3. 0.1 5.6 3 0.064MAG10 0.2466 100 150 3. 0.1 6.6 3 0.029MAG11 0.2524 100 150 1.4 0.8 6.6 3 0.072MAG12 0.2515 100 150 2.5 0.3 6.0 1.4 0.03MAG13 0.2607 120 150 2.6 0.3 6.0 1.9 0.045MAG19 0.2666 100 150 1.2 0.8 6.6 3 0.072MAG20 0.2680 100 150 2.9 0.1 6.6 1 0.03MAG21a 0.2814 100 150 0.77 0.2 6.6 1.6 0.026MAG21b 0.2814 110 150 0.8 0.15 6.6 4 0.068MAG22 0.2828 110 150 0.86 0.08 6.0 4 0.045MAG23 0.2865 100 100 1.8 0.3 6.6 2 0.018MAG25 0.3243 100 150 6. 0.15 5.8 4 0.086
1: in km s−1; 2: in cm−3; 3: in 109 photon cm−2 s−1 eV−1 at the Lymanlimit; 4: in 10−4; 5: in 10−4; 6: in 1019 cm; 7: in erg cm−2 s−1.
MNRAS 452, 3795–3814 (2015)
Dow
nloaded from https://academ
ic.oup.com/m
nras/article/452/4/3795/1055269 by guest on 22 January 2022

3808 M. Contini
Table 11. The data observed by Ly et al. (2014).
ID zspec FWHM [O II] Hβ [O III] [O III] Hα [N II] log([O II]/Hβ) log([O III] 5007+/Hβ) log(R[O III])km s−1 3727+ 4861 4363 5007+ 6563 6583 – – –
MMT01 0.6380 220.0 10.58 9.21 2.25 73.32 0.00 0.00 0.1840.1950.174 0.8860.082
0.065 1.4620.2110.226
MMT02 0.4327 247.0 18.20 5.76 0.60 25.83 0.00 0.00 0.6210.2870.173 0.6440.040
0.044 1.5490.2820.394
MMT03 0.4809 256.4 20.40 5.81 0.95 12.23 0.00 0.00 0.7350.2110.200 0.3390.052
0.049 1.0860.2690.285
MMT04 0.3933 248.6 49.30 21.70 1.38 130.05 0.00 0.00 0.3550.0260.009 0.7740.007
0.008 1.9500.1290.141
MMT05 0.3846 232.1 3.70 7.02 1.29 57.92 0.00 0.00 − 0.2660.1470.102 0.9210.029
0.034 1.6590.1580.192
MMT06 0.3995 260.2 21.33 6.04 0.83 21.97 0.00 0.00 0.7340.0690.061 0.5430.054
0.051 1.3190.2550.408
MMT07 0.3896 238.0 19.84 20.84 2.25 153.87 0.00 0.00 0.1020.1660.129 0.8720.008
0.007 1.7770.1320.123
MMT08 0.6335 239.4 27.33 10.90 1.88 42.30 0.00 0.00 0.6130.3550.269 0.5840.100
0.096 1.2600.3320.411
MMT09 0.4788 235.2 16.74 6.82 1.49 39.48 0.00 0.00 0.5850.1270.121 0.7620.093
0.086 1.3380.2610.285
MMT10 0.0683 286.1 22.46 18.19 2.02 121.87 59.04 1.26 0.1440.0440.056 0.8240.018
0.021 1.7170.2100.335
MMT11 0.1752 276.9 42.42 22.01 2.05 144.89 78.37 3.13 0.3860.0390.034 0.8230.024
0.021 1.8030.1570.209
MMT12 0.6405 214.5 23.57 6.18 1.31 40.13 0.00 0.00 0.8400.6010.360 0.8120.131
0.119 1.3180.4390.542
MMT13 0.4696 209.1 6.03 6.51 1.15 39.59 0.00 0.00 0.0720.2310.160 0.7800.034
0.037 1.5240.2680.307
MMT14 0.4644 280.6 100.27 56.75 2.01 354.12 0.00 0.00 0.2660.0330.019 0.7940.005
0.005 2.2150.1120.150
Keck1 0.8390 124.6 4.62 7.80 0.80 61.10 0.00 0.00 − 0.0160.0600.081 0.8970.011
0.010 1.8110.0910.094
Keck2 0.6230 89.5 3.49 2.33 0.67 17.60 0.00 0.00 0.1440.0410.040 0.8430.019
0.021 1.4400.1340.148
Keck3 0.7906 121.2 27.88 12.50 0.27 59.17 0.00 0.00 0.6580.0380.042 0.6760.008
0.007 2.1420.1620.224
Keck4 0.8829 178.5 13.77 7.28 0.33 35.60 0.00 0.00 0.2750.0170.017 0.6830.014
0.014 2.0180.2350.290
Keck5 0.8353 101.1 1.85 1.10 0.58 7.99 0.00 0.00 0.3620.2160.163 0.8790.035
0.035 1.1020.2520.367
Keck6 0.8237 90.5 0.05 0.88 0.19 5.36 0.00 0.00 − 1.0160.5950.937 0.7700.031
0.030 1.3460.2310.320
Note: Line fluxes are in 10−17 erg cm−2 s−1 with 68 per cent confidence uncertainties.
adding shock-wave hydrodynamics to the calculations of the spec-tra (Contini 1997 and references therein) or by assuming a den-sity gradient or a stratification of emitting filaments (Filippenko1985; Pequignot 1984; etc.) The importance of the [O III] 4363line recently emerged for high-z galaxies, constraining the mod-els. To cross-check this issue, we calculate the Lyα/Hβ line ratiosfor galaxy spectra constrained by the [O III] 4363 line (see Contini2014a, Ly et al. 2014). We choose the Ly et al. (2014) survey be-cause the reddening-corrected spectra contain [O III] 5007+4959,[O III] 4363, [O II] 3727, Hβ and Hα.
In Table 11, the results of Ly et al. (2014) observations obtainedby the Subaru telescope are reported. We compare calculated andobserved line ratios in Table 12. The uncertainty for model calcu-lations is about 10 per cent.
In Table 13, models m1–m20 are calculated using SB-dominated(+shock) models, while models mpl1–mpl20 (described in Ta-ble 14) are calculated by AGN (+shocks) dominated models.Table 11 shows that [O II]/Hβ and [O III]/Hβ line ratios arewell fitted by both SB and AGN models, but, regarding the[O III] 5007+/[O III] 4363 line ratios, the SB-dominated models fitthe data of nearly all galaxies, while MMT5, MMT12 and Keck3 arebetter reproduced by AGN-dominated models. For MMT4, Keck4and Keck6, the SB and AGN photoionizing models act with similarweights.
[O III] 4363/Hβ is the key line ratio for choosing between SB orAGN-dominated models, but the shock also plays an important role.The ionization parameter (U) and the SB effective temperature (T∗)for SB and the power-law flux from the AGN are determined byfitting the [O III] 5007+/Hβ and [O II] 3727/Hβ line ratios. With theinput parameters presented in Tables 13 and 14, the [O III] 4363/Hβ
line ratios for SB are higher by factors of ∼10 than those calculatedfor the AGNs, indicating that the shock effect is relatively strong.Thus [O III] 5007+/[O III] 4363 are lower for starbursts.
The densities in the downstream emitting regions are higher thann0 by a factor of ∼10, depending on Vs. Regarding the [N II]/Hβ
line ratios, the Hα/Hβ line ratios for MMT10 and MMT11 areroughly between 3 and 4 and the [N II]/Hβ line ratios were directlycalculated. The result of N/H is given only for the SB-dominatedmodels, which reproduce all the other line ratios well. We obtainedlow N/H relative abundances (0.25 × 10⁻⁴) for the two galaxiesMMT10 and MMT11. The results for O/H (in 10−4 units) are shownin Tables 12 and 13. O/H relative abundances calculated by detailedmodelling are closer to solar and higher than those calculated bydirect methods.
4 D I S C U S S I O N A N D C O N C L U D I N G R E M A R K S
In previous sections, we have been investigating the gas physicalconditions and element abundances in galaxies at relatively highz, selected by their characteristic line spectra, i.e. including theLyα line and the lines that constrain the models. All the modelsare calculated at the emitting nebulae in the different galaxies. Adetailed modelling process has been used, trying to reproduce allthe line ratios consistently in each spectrum. The results are moreconstrained than modelling by diagnostic diagrams, which do notalways refer to the entire set of lines. For instance, Humphrey &Binette (2014) select the best model by fitting the C II 1335/2326line ratios. Hayashi et al. (2015) investigate the physical conditionsin the star-forming galaxy ISM at z ∼ 1.5 by the analysis of singleline ratios and stacking spectra by Baldwin–Phillips–Terlevich dia-grams, etc. Their methods become necessary for surveys containinga large number of objects.
To show the role of diagnostic diagrams for Lyα-emitting galax-ies, we compare the observed data (Tables 3– 8) with emission-linegrids calculated in general for AGN and SB in Fig. 8 (top andbottom diagrams, respectively). We consider He II 1640/C IV 1549
MNRAS 452, 3795–3814 (2015)
Dow
nloaded from https://academ
ic.oup.com/m
nras/article/452/4/3795/1055269 by guest on 22 January 2022

Lyα and UV lines in galaxies at z < 3.7 3809
Table 12. Modelling the line ratios corrected to Hβ = 1 observed by Ly et al. (2014).
ID O VI O V Lyα N V C IV He II [O II] [O III] [O III]1034 1215 1215 1240 1549 1640 3727+ 4363 5007+
MMT01 – – – – – – 1.53 0.26 7.69m1 38.7 7.86 25.89 3. 7.82 0.26 1.53 0.26 7.69mpl1 5.3 1.11 32. 0.43 0.68 1.45 1.5 0.05 7.8MMT02 – – – – – – 4.18 0.124 4.4m2 57.8 10.6 26.2 3.75 9.7 0.14 3.9 0.23 4.2mpl2 5. 1. 30.9 0.39 0.98 1.44 4. 0.035 4.74MMT03 – – – – – – 5.43 0.18 2.18m3 54.9 10.9 36.7 4.2 10.9 0.117 5.2 0.2 2.5mpl3 10.3 1.93 30.8 0.65 1.64 1.15 5. 0.04 2.4MMT04 – – – – – – 2.26 0.07 5.94m4 46.8 9. 26. 3.65 9.28 0.18 2.7 0.2 5.43mpl4 2.7 0.6 30.7 0.32 0.79 1.78 3. 0.034 5.8MMT05 – – – – – – 0.54 0.18 8.33m5 3.16 0.67 24.6 0.37 0.96 0.48 0.9 0.04 8.33mpl5 2.42 0.52 32.2 0.36 0.91 2.11 1.2 0.07 8.4MMT06 – – – – – – 5.42 0.167 3.49m6 69.4 16. 49.7 13.4 30 0.425 6. 0.25 3.1mpl6 8.3 1.52 30.5 0.51 1.31 1.29 5.1 0.038 3.5MMT07 – – – – – – 1.26 0.12 7.44m7 36.7 7.74 26. 3.45 8.73 0.3 1.35 0.19 7.33mpl7 5.3 1.11 32. 0.43 0.68 1.65 1.4 0.05 7.8MMT08 – – – – – – 4.1 0.21 3.84m8 57.5 10.5 26. 3.73 9.61 0.14 4. 0.226 3.94mpl8 6.65 1.3 30.9 0.5 1.25 1.28 4.4 0.036 3.88MMT09 – – – – – – 3.84 0.265 5.78m9 59.2 11.1 26.2 4.2 10.8 0.18 3.5 0.264 5.9mpl9 4.1 0.83 31.2 0.37 0.92 1.66 3.71 0.04 5.75MMT10 – – – – – – 1.39 0.128 6.67m10 26.8 6.35 25.9 0.86 8.75 0.23 1.41 0.16 6.42mpl10 7. 1.38 32.3 0.54 0.58 1.54 1.3 0.04 6.5MMT11 – – – – – – 2.43 0.1 6.65m11 30.5 6.63 25.6 0.63 6.75 0.123 2. 0.167 6.0mpl11 2.66 0.52 32.8 0.21 0.53 1.43 2.3 0.04 6.3MMT12 – – – – – – 6.9 0.31 6.5m12 118.7 21.8 27.8 7.7 19.8 0.27 6.7 0.45 6.2mpl12 57.6 20.4 27.1 3. 8.2 1.17 6.2 0.28 6.4MMT13 – – – – – – 1.18 0.18 6.03m13 26. 6,25 25.9 0.9 9.12 0.21 1.39 0.15 6.0mpl13 4.74 1.04 32.3 0.47 1.23 1.53 1.2 0.055 6.28MMT14 – – – – – – 1.85 0.04 6.22m14 72.4 17. 28.3 3.12 30.3 0.38 2.4 0.2 6.1mpl14 4.64 1.17 26.45 1.47 3.3 2.55 1.8 0.059 6.1Keck1 – – – – – – 0.96 0.12 7.89m15 28.9 6.3 25.8 2.8 7.25 0.47 0.9 0.16 7.8mpl15 2.4 0.52 32.4 0.36 0.9 2.02 1.2 0.063 7.88Keck2 – – – – – – 1.39 0.25 6.97m16 0. 0.02 24.3 0.043 10.9 0.165 1.3 0.29 6.7mpl16 1.41 0.33 34.9 0.23 0.59 1.96 1.27 0.05 7.Keck3 – – – – – – 4.55 0.034 4.74m17 13.6 10.4 27.4 4.12 12.9 0.07 4. 0.32 4.57mpl17 0.081 0.3 26.4 0.42 1.81 1.55 4.4 0.049 4.75Keck4 – – – – – – 1.88 0.046 4.82m18 10.7 2.2 24.9 0.68 1.78 0.047 1.8 0.057 4.8mpl18 2.45 0.54 35. 0.3 0.72 2.57 1.6 0.035 5.0Keck5 – – – – – – 2.3 0.6 7.56m19 0.003 0.3 27.3 0.74 20.7 0.15 2.5 0.45 8.mpl19 0.03 0.095 34.4 0.14 0.64 1.95 2.1 0.05 7.6Keck20 – – – – – – 0.096 0.27 5.9m20 0. 0.03 23.8 0.07 14.0 3.72 0.11 0.15 6.4mpl20 420. 190. 38. 85. 22.5 7.9 0.08 0.43 6.
MNRAS 452, 3795–3814 (2015)
Dow
nloaded from https://academ
ic.oup.com/m
nras/article/452/4/3795/1055269 by guest on 22 January 2022

3810 M. Contini
Table 13. The physical parameters and the relative abundances for Ly et al.(2014) SB-dominated models (m1–m20).
Model Vs1 n0 T∗ U D O/H Hβ calc
1 2 3 – 4 5 6
m1 220 120 5. 0.05 8. 6.5 0.00176m2 260 120 3.8 0.03 8.6 7.3 0.0016m3 240 130 1. 0.001 8. 6.6 0.0015m4 260 110 4.7 0.03 10. 6.3 0.0016m5 250 110 7. 0.06 40. 4.5 0.018m6 260 130 8. 0.0005 28. 3. 0.0008m7 220 120 5.1 0.05 8. 5.6 0.0017m8 260 120 3.7 0.03 8.6 7.3 0.0016m9 260 110 4.4 0.03 9.5 6.8 0.0013m10 200 120 5. 0.04 8. 4.7 0.0018m11 200 120 4.5 0.04 8. 6.6 0.003m12 260 120 3.6 0.02 7.7 7.3 0.00076m13 200 120 4.9 0.04 8. 4.4 0.00176m14 200 120 4.6 0.03 7. 5.5 0.0014m15 200 120 5.4 0.06 8. 5.5 0.0019m16 90 120 4.3 0.06 5. 6.6 0.0004m17 140 120 3.4 0.03 2.8 7.35 0.00064m18 200 140 4.5 0.04 13. 8. 0.0075m19 100 120 4.5 0.03 3. 5.5 0.0003m20 90 100 5.7 0.2 8. 5.5 0.00035
1: in km s−1; 2: in cm−3; 3: in 104 K; 4: in 1015 cm; 5: in 10−4; 6: inerg cm−2 s−1.
Table 14. The physical parameters and the relative abundances for Ly et al.(2014) AGN dominated models (mpl1–mpl20).
Model Vs n0 F D O/H Hβ calc1 2 3 4 5 6
mpl1 220 1000 8 1 6.6 0.124mpl2 220 370 2 10 6.6 0.048mpl3 240 330 1 20 7.6 0.025mpl4 220 320 2.8 30 4.6 0.06mpl5 280 620 10 3 3.6 0.158mpl6 250 300 1.2 15 7.6 0.03mpl7 220 1000 8 1 6.6 0.124mpl8 240 330 1.5 10 6.6 0.036mpl9 240 330 2.4 12 5.6 0.053mpl10 250 1000 7.6 1 6.6 0.11mpl11 250 550 6 7 6.6 0.15mpl12 240 160 0.25 5.6 8.9 0.0021mpl13 220 1000 7.4 1 5.6 0.125mpl14 250 160 1 12 2 0.01mpl15 220 780 1.3 4 3.6 0.24mpl16 220 720 12 4 3.6 0.24mpl17 120 260 0.6 9 5. 0.114mpl18 230 720 7.3 4 4.5 0.17mpl19 120 920 7 4 4.6 0.13mpl20 90 100 6 2 4.6 0.00005
1: in km s−1; 2: in cm−3; 3 in 1010 photon cm−2 s−1 eV−1 at the Lymanlimit; 4: in 1015 cm; 5: in 10−4; 6: in erg cm−2 s−1.
versus Lyα/C IV 1549; because this work focuses on the Lyα line,C IV is generally the strongest line in the UV and He II is a strongradiation ionized line in the UV. However, it is known that theselines can be absorbed close to the emitting nebulae in galaxies ate.g. z > 2 (Binette et al. 2000). Note that for the Finkelstein surveyonly Lyα lines are observed, while C IV and He II are calculated byhighly constrained models. In the Ly et al. (2014) survey also, theLyα lines are calculated by the models. In the top diagram we use
the models presented in GRID1, considering gas in conditions suit-able for the NLR of AGN. The line ratios were calculated by twodifferent geometrical thicknesses of the emitting clouds, D = 1017
and 1019 cm. For each set of n0 and Vs, a series of models withdifferent F (log F = 8, 9, 10, 11, 12) were adopted. F = 0 representsthe shock-dominated case and corresponds to the lowest He II/C IV
and Lyα/C IV. Solar (Allen 1976) element abundances were used tocalculate the spectra. The He II/C IV and Lyα/C IV trends (for eachVs) follow increasing photoionization flux, because both He II andLyα are recombination lines that depend on photoionization.
The data observed for nearly all AGN-dominated objects arenested between models calculated by Vs ∼ 100 and 200 km s−1,the fluxes ranging over a large scale and both geometrically thinand thick clouds. Also shown in Fig. 8 are spectral data observedfrom the local galaxy Mrk3 (Collins et al. 2005), because these in-clude the Lyα and UV lines. The data (reddening corrected) refer todifferent regions within the galaxy. The spectra represent averageconditions covering small regions. They tend to show the intrin-sic conditions of the gas, rather than the average ones obtainedby modelling the observed spectra throughout the entire galaxy,as necessarily occurs for high-z galaxies. The Mrk3 data are lessscattered than those observed from high-z galaxies and follow themodel trends. In Fig. 8, we added data based on the Finkelstein et al.(2011) and Ly et al. (2014) observations. They do not represent ob-served He II/C IV versus observed Lyα/C IV, but the calculated lineratios are strongly constrained by the observed optical lines. Finkel-stein et al. (2011) and Ly et al. (2014) objects follow the trends ofAGN (+ shock) dominated models with roughly constant velocities,while the observed line ratios from the other galaxies are scatteredfor different F. The Finkelstein et al. (2011) and Ly et al. (2014)samples are situated close to higher shock velocity models. Theresults of the Ly et al. (2014) modelling are shifted relative to theother data, due to strong absorption of the observed Lyα line atthe source.
In Fig. 8 (bottom diagram), the data are compared with mod-els calculated for SB galaxies. We added to the GRID2 models(calculated by D = 1019 cm) the results of models with different D(5 × 10¹⁵–1017 cm) and different starburst temperatures T∗ (5 × 10⁴
and 8 × 10⁴ K). For all models Vs = 200 km s−1, n0 = 120 cm−3,U = 0.03. The models are represented in the diagram by blacksolid lines. The lowest Lyα/C IV and He II/C IV line ratios corre-spond to the lowest T∗ and D. In particular, for Ly et al. (2014)objects D ≥ 5 × 1015 cm and for Finkelstein et al. (2011) objectsD ≥ 1017 cm, most probably as a result of fragmentation. The shockvelocities for Ly et al. (2014) objects are higher, leading to higherfragmentation. For both Finkelstein et al. (2011) and Ly et al. (2014)galaxies, the dominant SB temperature is ≥5 × 10⁴ K. The new gridresults also show that for most of the objects observed in the UV,starburst temperatures as high as 8 × 10⁴ K may contribute to theline fluxes.
Some results of the detailed modelling method are presentedin Fig. 9, comparing calculated and observed Lyα/Hβ (top left),He II/Hβ (top right), [O III] 5007+/Hβ (bottom left) and [O II]3728+/Hβ (bottom right) ratios. The Lyα/Hβ diagram indicatesthat in different galaxies the Lyα lines are absorbed by differentamounts, which can be evaluated approximately from the diagram.A few objects of the Finkelstein et al. (2011) survey show higherobserved than calculated line ratios, perhaps due to the contributionof interacting matter.
In Figs 10 and 11, the physical parameters (Vs, n0, T∗, U, F,D), Hα flux at the nebula and O/H and N/H relative abundancescalculated for the present sample of galaxies are shown as functions
MNRAS 452, 3795–3814 (2015)
Dow
nloaded from https://academ
ic.oup.com/m
nras/article/452/4/3795/1055269 by guest on 22 January 2022

Lyα and UV lines in galaxies at z < 3.7 3811
−0.5 0 0.5 1 1.5 2 2.5 3−3
−2.5
−2
−1.5
−1
−0.5
0
0.5
1
1.5
2
log Lyα/CIV
log
HeI
I/CIV
−0.5 0 0.5 1 1.5 2 2.5 3−3
−2.5
−2
−1.5
−1
−0.5
0
0.5
1
1.5
2
log Lyα/CIV
log
HeI
I/CIV
15.7 16 17 19
Figure 8. He II/C IV versus Ly/C IV for NLR of AGN. The X symbols indicate the model results from GRID1 and GRID2. The other symbols refer to the data(Tables 3–8). Open circle: Norman et al. (2002), hexagon: Dawson et al. (2003), diamond: Stern et al. (2002), large pentagram: Dey et al. (2005), red asterisks:Collins et al; triangles: Vernet et al. (2001), open squares: Humphrey et al. (2008), filled pentagrams (small for SB and large for AGN models): Ly et al. (2014),black filled squares (small for SB and large for AGN models): Finkelstein et al. (2011), small circle: Erb et al. (2010), Fosbury et al. (2003), line symbols:see Table 1. Black solid lines in the bottom diagram show models calculated using different D (indicated in logarithm near each line); blue dashed: modelcalculated using T∗ = 5 × 10⁴ K; solid blue: models calculated using T∗ = 8 × 10⁴ K.
of SFR and z, respectively. Previous results (Contini 2014a, fig. 5)also appear for comparison. In particular, SFR were calculated usingthe Hα flux measured at the Earth by observers. We have chosenHα instead of Lyα because the former is less affected by scatteringand absorption problems. For galaxies for which Hα data were notavailable, we used Lyα and calculated Hα line fluxes by noticingthat the Lyα/Hβ line ratios can be approximated to ∼25 for manymodels (Fig. 1) and that Hα/Hβ ∼ 3.
Fig. 10 shows that the SFR between ∼1 and ∼300 M� yr−1 isaccompanied by relatively high shock velocities (>1000 km s−1).For SFR ≥ 10 M� yr−1, gaseous cloud densities are relativelylow, similarly to those in the AGN NLR and the SB surroundingit (n0 ≤ 350 cm−3). O/H reaches a lower-limit minimum for somegalaxies at SFR< 10 M� yr−1, then grows with SFR towards solarvalues at SFR ∼ 300 M� yr−1. The geometrical thickness of theemitting clouds has a minimum of ≤ 1016 cm. D and consequently
MNRAS 452, 3795–3814 (2015)
Dow
nloaded from https://academ
ic.oup.com/m
nras/article/452/4/3795/1055269 by guest on 22 January 2022

3812 M. Contini
0 10 20 30 40 500
10
20
30
40
50
Lyα/Hβ obs
Lyα
/β c
alc
0 1 2 3 4 5 60
1
2
3
4
5
6
HeII 1640 /Hβ obs
HeI
I 164
0 /Hβ
calc
0 5 10 15 200
5
10
15
20
[OIII]5007+ /Hβ obs
[OIII
]500
7+ /H
β ca
lc
0 2 4 6 80
1
2
3
4
5
6
7
8
[OII]3728+ /Hβ obs
[OII]
3728
+ /H
β ca
lc
Figure 9. Comparison of observed and calculated line ratios using detailed modelling. Data in Tables 3–8 are compared with the averaged and best-fittingmodels (black circles); the Finkelstein et al. (2011) survey data are compared with AGN models (red asterisks) and SB models (red squares); Ly et al. (2014)data are compared with AGN models (blue plus signs) and with SB models (blue triangles). The error bars are not shown in the Lyα/Hβ diagram, for the sakeof clarity.
1
2
3
log(
n 0 [cm
−3 ])
a) a)
−4 −2 0 2 41
2
3
log(SFR [Mo/yr])
log(
Vs [k
m s
−1 ])
b) b)
0.5
1
1.5
log(
T4)
log(SFR [Mo/yr])
a) a)
−2
0
2
log(SFR [Mo/yr])
log(
F10
)
b) b)
−4 −2 0 2 4−4
−2
0
2
log(SFR [Mo/yr])
log(
U)
c) c)
0
0.5
1
log(
O/H
)
a)
−4 −2 0 2 4
−1
−0.5
0
0.5
1
log(SFR [Mo/yr])
log(
N/H
)
b)
−2
0
2
log(
Hα
[erg
cm
−2 s
−1 ])
a) a)
−4 −2 0 2 414
16
18
20
log(SFR [Mo/yr])
log(
D [c
m])
b) b)
Figure 10. The physical parameters calculated for the galaxy surveys as a function of the SFR. Symbols as in Contini (2014a), fig. 5. blue open squares:Finkelstein et al. (2011) for AGN; red open squares: Finkelstein et al. (2011) for SB. The results for Ly et al. (2014) data are represented by pentagrams, red forstarbursts and black for AGN; black filled circles: Dey et al. (2005), Dawson et al. (2003), Norman et al. (2002), Stern et al. (2002), Humphrey et al. (2008),Vernet et al. (2001), Erb et al. (2010) and Fosbury et al. (2003). AGN models; red filled circles: the same for SB-dominated models.
MNRAS 452, 3795–3814 (2015)
Dow
nloaded from https://academ
ic.oup.com/m
nras/article/452/4/3795/1055269 by guest on 22 January 2022

Lyα and UV lines in galaxies at z < 3.7 3813
1
2
3
log(
n 0 [cm
−3 ])
a) a)
−1 −0.5 0 0.51
2
3
log(z)
log(
Vs [k
m s
−1 ])
b) b)
0.5
1
1.5
log(
T4)
a)
−2
0
2
log(z)
log(
F10
)
b)
−1 −0.5 0 0.5−4
−2
0
2
log(
U)
log(z)
c)
0
0.5
1
log(
O/H
)
log(z)
a)
−1 −0.5 0 0.5
−1
0
1
log(
N/H
)
log(z)
b)
−3
−2
−1
0
1
log10(z) lo
g(Hα
[erg
cm
−2 s
−1 ])
a) a)
−1 −0.5 0 0.514
16
18
20
log(z)
log(
D [c
m])
b) b)
Figure 11. The physical parameters calculated for the galaxy surveys as a function of the redshift. Symbols as in Fig. 10.
also Hα fluxes calculated at the nebula show large scattering cov-ering roughly four orders of magnitude for SFR between 1 and650 M� yr−1, indicating fragmentation by turbulence in a shock-dominated regime.
Fig. 11 suggests that activity in terms of T∗ (Contini 2014b) isaccompanied by relatively high shock velocities at z > 2.3. TheO/H relative abundances calculated by detailed modelling are so-lar for most of the objects and lower than solar within a factorof ∼2 for some galaxies at 0.3 < z < 1. For comparison, Humphreyet al. (2008) claim that nuclear activity and star formation, whichlead to solar metallicities at early times, are seen through lack ofvariability and high metallicity between z = 2.5 and 0. The N/Hrelative abundances show large scattering. N/H values are particu-larly low for a few galaxies in the Finkelstein et al. (2011) survey atz ∼ 0.25.
Summarizing, we have found the following.
(1) Calculated Lyα/Hβ values are generally higher than observedones, except for some SB-dominated models, MDS (Table 5), MV1and MV6 (Table 6) and some models in the Finkelstein et al. (2011)survey (Tables 8–10).
(2) Tables 3–7 show that most of the spectra are fitted by thesummed contributions of two types of model: those emitted fromhigh-velocity (∼700–1500 km s−1) clouds, generally close to anAGN, which explain the high ionization level line flux and UV–X-ray data in the continuum SED, and those emitted from rela-tively low Vs (∼100–300 km s−1), n0 (100–300 cm−3) radiation-dominated (by an AGN or SB) clouds, which correspond to narrowoptical line profiles and fit the optical spectral and continuum data.
(3) In the HDF galaxy (Dawson et al. 2003), high Vs
(1300 km s−1) clouds are found in the surroundings of a SB corre-sponding to a high T∗. In the BX418 galaxy (Erb et al. 2010), thehighest velocity component is relatively low (Vs = 600–800 km s−1)and is accompanied by a preshock density higher by a factor >10than in the other objects. The shock velocities were most probablyreduced by collision with high density gas. These clouds are locatedin the surroundings of an AGN. High Vs and relatively low n0 alsocharacterize the shock-dominated clouds (model MF0, Table 7) inthe Lynx arc (Fosbury et al. 2003). A few galaxies from the radiosurvey of Humphrey et al. (2008) (Table 4) do not show the highVs component, which is not present in the galaxies selected fromthe Vernet et al. (2001) survey (Table 6) either. Here, the cloudsare characterized by very low Vs and n0, similar to or lower thanthose calculated to reproduce the Finkelstein et al. (2011) spectra(Tables 9 and 10).
(4) In some cases, one or more model components show thatphotoionizing flux from the active source is prevented from reachingthe gas or that the source is absent. Then the clouds within thegalaxies are ionized and heated only by the shock.
(5) We identified the scandium line λ5081 in the SST24J1434110+331733 nebula observed by Dey et al. (2005). Scan-dium lines are characteristic of SN spectra.
(6) High T∗ values (>105 K), which indicate that the SB starsare close to outburst (Contini 2014b), were found in a few objects(4C+23.56 at z = 2.479 from the Humphrey et al. (2008) survey,SST24 at z = 2.858 from the Dey et al. (2005). survey and the Lynxarc at z = 3.357 from the Fosbury et al. (2003) observations). Theseexceptional SB temperatures are isolated events at the state of the art.Considering evolutionary paths in the Hertzsprung–Russell (H–R)
MNRAS 452, 3795–3814 (2015)
Dow
nloaded from https://academ
ic.oup.com/m
nras/article/452/4/3795/1055269 by guest on 22 January 2022

3814 M. Contini
diagram for stars of different mass during the pre-main-sequencephase, these temperatures can be reached by ≥9 M� stars in alifetime of ≥105 yr (Prialnik 2000, their fig. 8.1), which is veryshort compared with the redshift z age (>2 Gyr).
Finally, the sample of galaxies that emit Lyα and UV linesshows neither peculiar physical conditions of the emitting gasnor abnormal element abundances. However, for some galaxiesof the Humphrey et al. (2008), Dawson et al. (2003), Stern et al.(2002), Dey et al. (2005) and Norman et al. (2002) surveys, emit-ting gas with relatively high Vs (>1000 km s−1) is revealed bythe complex FWHM of the line profiles. Such velocities are up-per limits to those characteristic of an AGN NLR. Generally,higher preshock densities accompany higher shock velocities, lead-ing to collisionally de-excited forbidden lines. This is not thecase for the Lyα-line-emitting galaxies modelled throughout thisarticle. For instance, the Humphrey et al. (2008) galaxy 0211–122 spectrum reported in Table 3 shows observed [O III] 5007lines with FWHM = 1300 ± 60 km s−1 and [O II] 3727 withFWHM = 730 ± 160 km s−1. Some of the spectra emitted byhigh-velocity gas are shock-dominated, similar to those of evolvedSN.
The evolution diagrams in Figs 10 and 11 show that the trendsare still uncertain. We hope that detailed modelling of more spectrafrom low (<0.1) to high z (>3) in the future will provide furtherinformation about element abundance evolution, star formation his-tory, SN events, etc.
AC K N OW L E D G E M E N T S
I am very grateful to the referee, Dr Andrew Humphrey, for criti-cal suggestions that substantially improved the presentation of thearticle. I thank Dr Chun Ly for providing the data in suitable format.
R E F E R E N C E S
Aldrovandi S. M. V., Contini M., 1984, A&A, 140, 368Allen C. W., 1976, Astrophysical Quantities, 3rd edn. Athlone Press, LondonAnders E., Grevesse N., 1989, Geochimica et Cosmochimica Acta, 53, 197Asplund M., Grevesse N., Sauval A. J., Scott P., 2009, ARA&A, 47, 481Atek H., Kunth D., Schaerer D., Mas-Hesse J., Hayes M., Ostlin G., Kneib
J.-P., 2014, A&A, 561, 89Beck R., 2012, J. Phys. Conf. Ser., 372, 02051Binette L., Kurk J. D., Villar-Martin M., Rottingen H. J. A., 2000, A&A,
356, 23Bose S. et al., 2015, preprint (arXiv:1504.06207)Cimatti A., di Serego Alighieri S., Vernet J., Cohen M., Fosbury R. A. E.,
1998, ApJ, 499, L21Collins N. R., Kraemer S. B., Crenshaw D. M., Ruiz J., Deo R., Bruhweiler
F. C., 2005, ApJ, 619, 116Contini M., 1997, A&A, 323, 71Contini M., 2009, MNRAS, 399, 1175Contini M., 2012, MNRAS, 425, 1205Contini M., 2013, MNRAS, 429, 242Contini M., 2014a, A&A, 564, 19Contini M., 2014b, A&A, 572, 65Contini M., Aldrovandi S. M., 1983, A&A, 127, 15
Contini M., Aldrovandi S. M., 1986, A&A, 168, 41Contini M., Viegas S. M. A., 2001a, ApJS, 132, 211Contini M., Viegas S. M. A., 2001b, ApJS, 137, 75Contini M., Viegas S. M., Prieto M. A., 2004, MNRAS, 348, 1065Contini M., Angeloni R., Rafanelli P., 2009, A&A, 496, 759Contini M., Cracco V., Ciroi S., La Mura G., 2012, A&A, 545, A72Cox D. P., 1972, ApJ, 178, 143Crenshaw D. M. et al., 2002, ApJ, 566, 187Dawson S., McCrady N., Stern D., Eckart M. E., Spinrad H., Liu M. C.,
Graham J. R., 2003, AJ, 125, 1236Dey A. et al., 2005, ApJ, 629, 654Dwek E., 1981, ApJ, 247, 614Erb D. K., Pettini M., Shapley A. E., Steidel C. C., Law D. R., Naveen
A. R., 2010, ApJ, 719, 1168Ferland G., Netzer H., 1983, ApJ, 264, 105Field G. B., Steigman G., 1971, ApJ, 166, 59Filippenko A. V., 1985, ApJ, 289, 475Finkelstein S. L., Cohen S. H., Moustakas J., Malhotra S., Rhoads J. E.,
Papovich C., 2011, ApJ, 733, 117Flores-Fajardo N., Morisset C., Stasinska G., Binette L., 2011, Revista
Mexicana de Astronomıa y Astrofısica, 40, 118Fosbury R. A. E. et al., 2003, ApJ, 596, 797Hamann F., Ferland G., 1993, ApJ, 418, 11Hayashi M. et al., 2015, preprint (arXiv:1504.05589)Heckman T. M., 1980, A&A, 87, 152Heng K., Sunyaev R. A., 2008, A&A, 481, 117Ho L. C., Filippenko A. V., Sargent W. I. W., 1993, ApJ, 417, 63Humphrey A., Binette L., 2014, MNRAS, 442, 753Humphrey A., Villar-Martin M., Vernet J., Fosbury R., di Serego Alighieri
S., Binette L., 2008, MNRAS, 383, 11Leitherer et al., 1999, ApJS, 123, 3Ly C., Malkan M. A., Nagao T., Kashikawa N., Shimasaku K., Hayashi M.,
2014, ApJS, 780, 122Norman C. et al., 2002, ApJ, 571, 218Osterbrock D. E., 1989, Astrophysics of Gaseous Nebulae and Active Galac-
tic Nuclei. University Science Books, Mill Valley, CAOteo I. et al., 2012, A&A, 541, 650Pequignot D., 1984, A&A, 131, 159Prialnik D., 2000, An Introduction to the Theory of Stellar Structure and
Evolution. Cambridge Univ. Press, CambridgeRichards E. A., 2000, ApJ, 533, 611Rodrıguez-Ardila A., Contini M., Viegas S. M., 2005, MNRAS, 357, 220Ryan R. E., Jr, Cohen S. H., Windhorst R. A., Silk J., 2008, ApJ, 678, 751Stanford S. A., Elston R., Eisenhardt P. R. M., Spinrad H., Stern D., Dey A.,
1997, AJ, 114, 2232Steigman G., Werner M. W., Geldon F. M., 1971, ApJ, 168, 373Stern D. et al., 2002, ApJ, 568, 71Turner T. J., Romano P., George I. M., Edelson R., Collier S. J., Mathur S.,
Peterson B. M., 2001, ApJ, 561, 131Vernet J., Fosbury R. A. E., Villar-Martin M., Cohen M. H., Cimatti A.,
di Serego Alighieri S., Goodrich R. W., 2001, A&A, 366, 7Villar-Martin M., Tadhunter C., Clark N., 1997, A&A, 323, 21White H. E., 1934, Introduction to Atomic Spectra. McGraw–Hill,
New YorkWilliams R. E., 1967, ApJ, 147, 552Yajima H., Li Y., Zhu Q., 2013, ApJ, 773, 151
This paper has been typeset from a TEX/LATEX file prepared by the author.
MNRAS 452, 3795–3814 (2015)
Dow
nloaded from https://academ
ic.oup.com/m
nras/article/452/4/3795/1055269 by guest on 22 January 2022