arv141.pdf - Oxford Academic
8
© The Author 2015. Published by Oxford University Press on behalf of the International Society for Behavioral Ecology. All rights reserved. For permissions, please e-mail: [email protected] The official journal of the ISBE International Society for Behavioral Ecology Behavioral Ecology Original Article No phenotypic signature of acoustic competition in songs of a tropical cricket assemblage Arne K.D. Schmidt, a Klaus Riede, b and Heiner Römer a a Department of Zoology, Karl-Franzens University, Universitaetsplatz 2, 8010 Graz, Austria and b Zoological Research Museum Alexander Koenig (ZFMK), Museumsmeile Bonn, Adenauerallee 160, 53113 Bonn, Germany Received 30 January 2015; revised 24 July 2015; accepted 10 August 2015; Advance Access publication 26 August 2015. Efficient acoustic communication in multispecies assemblages is challenging due to the presence of heterospecific signals. Masking interference and signal confusion of similarly structured signals can impose fitness costs and, thus, drive evolutionary processes that shape acoustic signals to reduce their overlap in signal space. Although the partitioning of signal space has been frequently studied in frog and bird communities, this topic has received much less attention with reference to insects that communicate acoustically. In this study, we examined the role of acoustic competition in a tropical cricket community and tested the following hypotheses: 1) cosig- naling species are expected to exhibit more dissimilar calling songs as compared with species that are spatially and/or temporally separated and 2) species signaling with similar song frequencies, who are thereby subject to energetic masking, are more likely to differ in the temporal domain of their calling songs. Using non-metric multidimensional scaling and pairwise comparison methods to measure acoustic dissimilarity, we found no evidence for either hypothesis: the acoustic signals of species pairs that cosignaled or used similar calling frequencies did not significantly differ from those of species that were spatially/temporally segregated or had large song frequency differences. In conclusion, for the acoustically communicating cricket community investigated, no supportive evidence for the partitioning hypothesis and the widespread belief that acoustic competition has led to divergent selection pressures on signal structure to avoid masking interference was found. Instead, we argue that selection pressures on sensory/neuronal mechanisms seem to more strongly drive reliable communication. Key words: acoustic assemblages, acoustic communication, acoustic masking interference, insects, signal divergence, signal space partitioning. INTRODUCTION Acoustic signaling in animals plays a key role in mate attraction, mate choice decisions, and in the process of sexual selection and speciation (Gray and Cade 2000; Panhius et al. 2001; Mendelson and Shaw 2005; Boul et al. 2007; Hoskin and Higgie 2010; Wilkins et al. 2013). The messages encoded in acoustic signals, which usu- ally include information about the sender’s identity, condition, and location, must emerge from a background of concurrent signals from other individuals, both conspecifics and heterospecifics. Thus, it is not surprising that the acoustic environment is a major con- straint factor that evidently affects acoustic signal evolution (Otte 1992; Gröning and Hochkirch 2008; Grant BR and Grant PR 2010; Brumm 2013; Wilkins et al. 2013). The influence of interfer- ing signals in species-rich assemblages on acoustic communication systems has frequently been studied, especially in birds (Luther 2009; Tobias et al. 2014), frogs (Chek et al. 2003; Amézquita et al. 2006, 2011), and insects (Sueur 2002; Schmidt et al. 2011, 2013; Balakrishnan et al. 2014; Jain et al. 2014). Irrespective of the taxonomic group, acoustic signal interference in multispecies assemblages impairs the detection, recognition, and localization of relevant (mating) signals (Wiley 2006). Moreover, signals that are greatly similar might cause signal confusion and lead to mate choice errors (Blackwell and Jennions 1993; Gerhardt et al. 1994; Wiley 2013) that can result in high fitness costs for both the sender and receiver. Heterospecific mating can impose both direct and indirect fitness costs, but even without interbreeding, acoustic interference could lead to waste of time and energy due to the acoustic displays produced, or increases the risk of preda- tion and parasitization while the insects call and search for mates. Selection should, therefore, act on signals and signaling behaviors that reduce their overlap in signal space (Otte 1992; Gröning and Address correspondence to A.K.D. Schmidt. E-mail: [email protected]. Behavioral Ecology (2016), 27(1), 211–218. doi:10.1093/beheco/arv141 Downloaded from https://academic.oup.com/beheco/article/27/1/211/1744419 by guest on 01 June 2022
-
Upload
khangminh22 -
Category
Documents
-
view
1 -
download
0
Transcript of arv141.pdf - Oxford Academic
© The Author 2015. Published by Oxford University Press on behalf of the International Society for Behavioral Ecology. All rights reserved. For permissions, please e-mail: [email protected]
The official journal of the
ISBEInternational Society for Behavioral Ecology
Behavioral Ecology
Original Article
No phenotypic signature of acoustic competition in songs of a tropical cricket assemblageArne K.D. Schmidt,a Klaus Riede,b and Heiner Römera aDepartment of Zoology, Karl-Franzens University, Universitaetsplatz 2, 8010 Graz, Austria and bZoological Research Museum Alexander Koenig (ZFMK), Museumsmeile Bonn, Adenauerallee 160, 53113 Bonn, GermanyReceived 30 January 2015; revised 24 July 2015; accepted 10 August 2015; Advance Access publication 26 August 2015.
Efficient acoustic communication in multispecies assemblages is challenging due to the presence of heterospecific signals. Masking interference and signal confusion of similarly structured signals can impose fitness costs and, thus, drive evolutionary processes that shape acoustic signals to reduce their overlap in signal space. Although the partitioning of signal space has been frequently studied in frog and bird communities, this topic has received much less attention with reference to insects that communicate acoustically. In this study, we examined the role of acoustic competition in a tropical cricket community and tested the following hypotheses: 1) cosig-naling species are expected to exhibit more dissimilar calling songs as compared with species that are spatially and/or temporally separated and 2) species signaling with similar song frequencies, who are thereby subject to energetic masking, are more likely to differ in the temporal domain of their calling songs. Using non-metric multidimensional scaling and pairwise comparison methods to measure acoustic dissimilarity, we found no evidence for either hypothesis: the acoustic signals of species pairs that cosignaled or used similar calling frequencies did not significantly differ from those of species that were spatially/temporally segregated or had large song frequency differences. In conclusion, for the acoustically communicating cricket community investigated, no supportive evidence for the partitioning hypothesis and the widespread belief that acoustic competition has led to divergent selection pressures on signal structure to avoid masking interference was found. Instead, we argue that selection pressures on sensory/neuronal mechanisms seem to more strongly drive reliable communication.
Key words: acoustic assemblages, acoustic communication, acoustic masking interference, insects, signal divergence, signal space partitioning.
INTRODUCTIONAcoustic signaling in animals plays a key role in mate attraction, mate choice decisions, and in the process of sexual selection and speciation (Gray and Cade 2000; Panhius et al. 2001; Mendelson and Shaw 2005; Boul et al. 2007; Hoskin and Higgie 2010; Wilkins et al. 2013). The messages encoded in acoustic signals, which usu-ally include information about the sender’s identity, condition, and location, must emerge from a background of concurrent signals from other individuals, both conspecifics and heterospecifics. Thus, it is not surprising that the acoustic environment is a major con-straint factor that evidently affects acoustic signal evolution (Otte 1992; Gröning and Hochkirch 2008; Grant BR and Grant PR 2010; Brumm 2013; Wilkins et al. 2013). The influence of interfer-ing signals in species-rich assemblages on acoustic communication
systems has frequently been studied, especially in birds (Luther 2009; Tobias et al. 2014), frogs (Chek et al. 2003; Amézquita et al. 2006, 2011), and insects (Sueur 2002; Schmidt et al. 2011, 2013; Balakrishnan et al. 2014; Jain et al. 2014).
Irrespective of the taxonomic group, acoustic signal interference in multispecies assemblages impairs the detection, recognition, and localization of relevant (mating) signals (Wiley 2006). Moreover, signals that are greatly similar might cause signal confusion and lead to mate choice errors (Blackwell and Jennions 1993; Gerhardt et al. 1994; Wiley 2013) that can result in high fitness costs for both the sender and receiver. Heterospecific mating can impose both direct and indirect fitness costs, but even without interbreeding, acoustic interference could lead to waste of time and energy due to the acoustic displays produced, or increases the risk of preda-tion and parasitization while the insects call and search for mates. Selection should, therefore, act on signals and signaling behaviors that reduce their overlap in signal space (Otte 1992; Gröning and Address correspondence to A.K.D. Schmidt. E-mail: [email protected].
Behavioral Ecology (2016), 27(1), 211–218. doi:10.1093/beheco/arv141
Dow
nloaded from https://academ
ic.oup.com/beheco/article/27/1/211/1744419 by guest on 01 June 2022
Behavioral Ecology
Hochkirch 2008; Mendelson and Shaw 2012). In fact, a typical result of competition for signal space consists of spatial and tem-poral partitioning; insects simply signal at different locations or at different times (Hödl 1977; Greenfield 1988; Römer et al. 1989; Sueur 2002; Brumm and Slabbekoorn 2005).
Signal space partitioning (usually with respect to song frequency) is another option for which mixed results have been reported (Sueur 2002; Chek et al. 2003; Planqué and Slabbekoorn 2008; Luther 2009; Amézquita et al. 2011; Schmidt et al. 2013; Tobias et al. 2014). In a comparative study in which 11 frog communi-ties were investigated, Chek et al. (2003) found evidence for acous-tic resource partitioning in only 3 communities. Additionally, in 2 studies with Amazonian birds, one found significant less spectral overlap between species, indicating spectral partitioning (Planqué and Slabbekoorn 2008), whereas another yielded opposite results (Tobias et al. 2014). Only a few studies have demonstrated acoustic interference to be a key factor for song divergence (Kirschel et al. 2009; Grant BR and Grant PR (2010). Grant BR and Grant PR (2010), for example, found that temporal features of finch songs (i.e., trill rate and song duration) diverged as a result of changes in a community, supporting the idea that acoustic interactions in spe-cies-rich environments can trigger species-specific song parameter shifts with important implications for song evolution and speciation.
According to the sensory drive framework, signals are selected and optimized for the local environment in which they are used (Endler 1992, 1993; Boughman 2002). Therefore, in order to mini-mize the effects of attenuation and distortion, acoustic signals of different species may adaptively evolve to the habitat acoustics in which the species communicate (acoustic adaptation hypothesis; Morton 1975; Couldridge and van Staaden 2004).
Across species, adult male crickets (Orthoptera: Grylloidea) produce stereotypical, genetically fixed songs with their modi-fied forewings (tegmina) to attract females from a distance. Most importantly, males produce calling songs that are almost pure in tone within a species-specific, relatively small frequency band that ranges between 2 and 10 kHz (Bennet-Clark 1998; Gerhardt and Huber 2002; for an exception, see Robillard et al. 2007). However, the temporal domain of songs is equally important for species rec-ognition (Thorson et al. 1982; Stout and McGhee 1988). The dif-ference in temporal patterns between species is striking (Otte 1992), suggesting that the temporal domain plays at least some role in the way acoustic communities are assembled to ensure efficient com-munication. This is particularly true for tropical cricket communi-ties, which usually consist of a large number of species (Schmidt et al. 2013; Jain et al. 2014). Thus, crickets are ideally suited to test the hypothesis that signal structuring and adaptation occur as a result of acoustic competition.
In this study, we tested the following hypotheses about com-munity composition in a tropical cricket assemblage: 1) cosignal-ing species are expected to exhibit more dissimilar calling songs as compared with species that are spatially and/or temporally sepa-rated and 2) species signaling with similar song frequencies and, thus, subject to energetic masking are more likely to differ in the temporal domain of their calling songs.
MATERIAL AND METHODSSound recordings
Field and laboratory recordings were conducted on Barro Colorado Island in Panama (9°9′N, 79°51′W) during September and October in 2008, from January to April in 2009 and from
May to July in 2010. We used a Marantz PDM670 digital recorder (D&M Holdings Inc., Kanagawa, Japan; sampling rate 44.1 kHz) and a Telinga parabolic microphone (Pro7W, Tobo, Sweden) to record sounds in the field. The acoustic census consisted of 5-min recordings taken along marked trails, whereby each recording point was spaced at least 100 m apart. Due to the strong attenuation of cricket songs over a distance (about 30 dB over 16 m; Jain and Balakrishnan 2012 and our own unpublished data), we were confi-dent that the song community recorded at one spot did not overlap with the one recorded 100 m away.
Site sampling was generally conducted in a time window between 6 and 11 PM, at a time of night when the highest level of call activity in the rainforest was expected (up to 70-dB sound pressure level, Lang et al. 2005). During 7 out of 43 nights, we extended the time window to 6 AM the following morning. Some sites were sampled more intensively than others or repeatedly dur-ing the same night at regular intervals of 1 h (Schmidt et al. 2013). In 2008, we sampled a total of 16 sites and collected 121 record-ings (mean number of recordings per site: 8.64 ± 12.53), in 2009, 94 recordings were obtained at 37 sites (mean number of record-ings per site: 2.47 ± 2.06), and in 2010, we obtained 23 recording at 22 different sites (mean number of recordings per site: 1 ± 0.22). In total, we obtained 237 recordings at 54 different sites to deter-mine the rate of cosignaling. There was no significant difference in the rate of cosignaling between years (Kruskal–Wallis test, chi square = 2.671, P = 0.263).
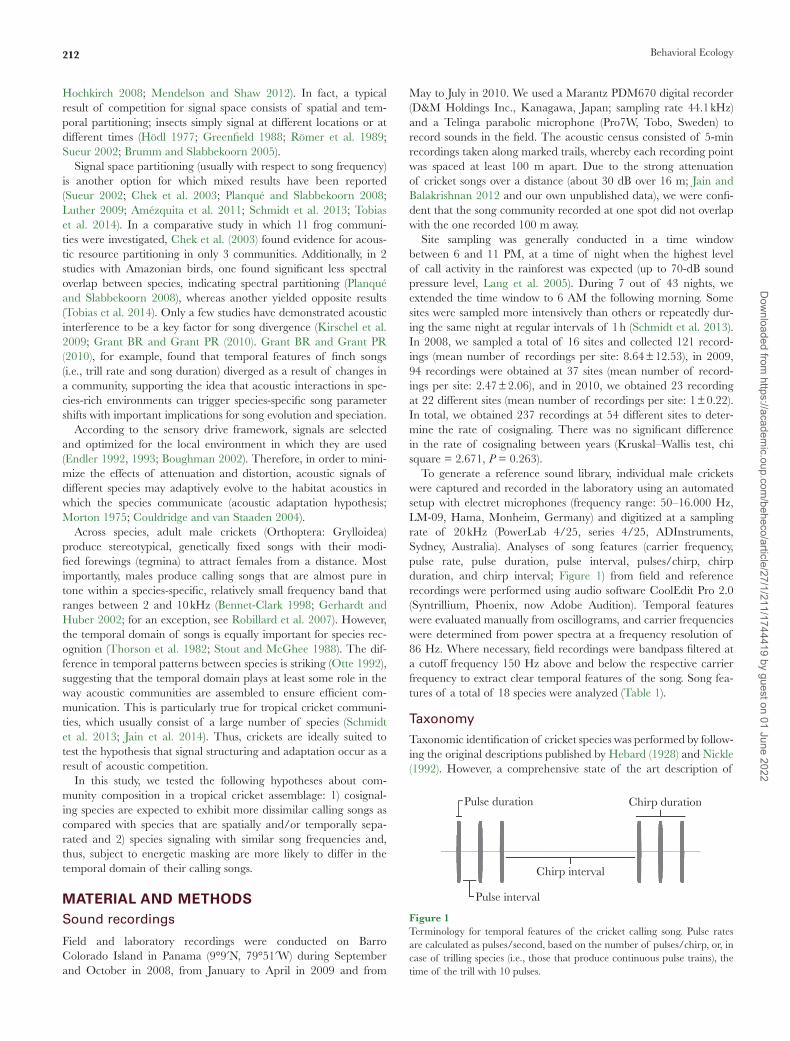
To generate a reference sound library, individual male crickets were captured and recorded in the laboratory using an automated setup with electret microphones (frequency range: 50–16.000 Hz, LM-09, Hama, Monheim, Germany) and digitized at a sampling rate of 20 kHz (PowerLab 4/25, series 4/25, ADInstruments, Sydney, Australia). Analyses of song features (carrier frequency, pulse rate, pulse duration, pulse interval, pulses/chirp, chirp duration, and chirp interval; Figure 1) from field and reference recordings were performed using audio software CoolEdit Pro 2.0 (Syntrillium, Phoenix, now Adobe Audition). Temporal features were evaluated manually from oscillograms, and carrier frequencies were determined from power spectra at a frequency resolution of 86 Hz. Where necessary, field recordings were bandpass filtered at a cutoff frequency 150 Hz above and below the respective carrier frequency to extract clear temporal features of the song. Song fea-tures of a total of 18 species were analyzed (Table 1).
Taxonomy
Taxonomic identification of cricket species was performed by follow-ing the original descriptions published by Hebard (1928) and Nickle (1992). However, a comprehensive state of the art description of
Pulse duration
Pulse interval
Chirp interval
Chirp duration
Figure 1Terminology for temporal features of the cricket calling song. Pulse rates are calculated as pulses/second, based on the number of pulses/chirp, or, in case of trilling species (i.e., those that produce continuous pulse trains), the time of the trill with 10 pulses.
212
Dow
nloaded from https://academ
ic.oup.com/beheco/article/27/1/211/1744419 by guest on 01 June 2022

Schmidt et al. • Signal space partitioning in crickets
Panamanian cricket species is still lacking, and their taxonomic determinations are still under discussion. While a consensus that the superfamily Grylloidea is monophyletic exists (Song et al. 2015), the hierarchical structure and relationships among the sub-families, particularly within the Gryllidae, are controversial (see Jost and Shaw 2006, and most recent references in the Orthoptera Species File, Eades et al. 2015). Voucher specimens were deposited at the Zoological Research Museum Alexander Koenig in Bonn, Germany and the Muséum National d’Histoire Naturelle in Paris, France, for further examination, and if necessary, will be rede-scribed and phylogenetically analyzed.
Cosignaling
Based on the 237 outdoor sound recordings taken, species pres-ence–absence data extracted from each of the single 5-min recordings were evaluated. To quantify the degree of cosignaling, a similarity index after Kulczynski (Krebs 1999) was measured between each species pair (15 species in total, 105 pairwise com-parisons) using the software package PAST (Hammer et al. 2001). The Kulczynski index for binary data (presence–absence, encoded as 1 or 0) was calculated as: djk = [M/(M + N1) + M/(M + N2)]/2. When comparing 2 rows (i.e., species), a match M was counted for all columns (i.e., recordings) when a presence was observed in both rows. N is the total number of presence occurrences for either of the species (N1 and N2 refer to the 2 rows being compared). Values could range between 0 (species pairs never detected in the same recordings) and 1 (species co-occurring in all recordings). Not included in this data set were Paroecanthus podagrosus, Anaxipha sp. 2, and Anaxipha platyptera, which were not or were only rarely detected in sound recordings.
Tropical rainforests are characterized by their complex vertical structure (Leigh 1999). Thus, in order to identify species compo-sition in this dimension more precisely, sound recordings were obtained at 5 m intervals from a canopy tower (height 40 m) in order to estimate the vertical stratification of signalers, incorporat-ing a total of 16 species (not detected: ethospecies 3 and A. platyp-tera). Sampling was performed between 7 and 11 PM on 4 sampling nights in 2009 and 10 nights in 2010, resulting in a total of 112 recordings.
Acoustic dissimilarities, spatiotemporal, and signal space partitioning
To determine the differences in signal space among all 18 species, mean values for carrier frequency, pulse rate, pulse duration, and pulse interval (Table 1) were log transformed, and the Euclidean distances were calculated using PAST (Hammer et al. 2001). We used only these 4 acoustic parameters for 2 reasons: 1) because they are the most important ones for species recognition (Gerhardt and Huber 2002) and 2) to ensure that all species pair comparisons made among the 18 chirping and trilling species were based on the same acoustic parameters when calculating the similarity/dissimi-larity matrix (i.e., the Euclidean distance).
In order to investigate partitioning between species within the community, the differences in cosignaling and acoustic dissimilar-ity were tested separately for randomness. During the first step, the presence–absence matrix of cosignaling and the mean acous-tic values were subjected to a non-metric multidimensional scal-ing (NMDS) analysis. The NMDS analysis allowed us to project object similarities in a 2D scatterplot while preserving pairwise object distances (indicated by a stress factor for which a value <0.2 T
able
1Su
mm
ary
of s
pec
ies-
spec
ific
acou
stic
par
amet
ers
and
cal
lin
g h
eigh
t (m
ean
± s
tan
dar
d d
evia
tion
)
NC
arri
er fr
eque
ncy
(kH
z)Pu
lse r
ate
(Hz)
Pulse
dur
atio
n (m
s)Pu
lse in
terv
al (m
s)Pu
lses/
chir
pC
hirp
dur
atio
n (m
s)C
hirp
inte
rval
(ms)
Cal
ling
heig
ht (m
)
Aclo
des
sp. 2
243.
13 ±
0.1
727
.5 ±
2.0
28.5
± 1
.78.
2 ±
1.8
13 ±
145
2 ±
56
977
± 2
311.
5 ±
1.4
Aclo
des
sp. 1
193.
16 ±
0.1
269
.8 ±
3.0
9.8
± 0
.54.
3 ±
0.5
38 ±
555
0 ±
82
1470
6 ±
951
16.
3 ±
5.6
Paro
ecan
thus
pod
agro
sus
263.
84 ±
0.2
520
6.2
± 1
7.0
2.3
± 0
.72.
0 ±
0.7
5 ±
123
.7 ±
3.3
13.2
± 2
.138
.5 ±
2.2
Oro
char
is sp
. 219
4.07
± 0
.38
270.
8 ±
30.
22.
2 ±
0.4
1.1
± 0
.458
± 2
220
9 ±
62
887
± 7
4228
.7 ±
8.0
Ambl
yrhe
thus
sp.
204.
41 ±
0.2
016
.7 ±
1.5
30.0
± 2
.633
.0 ±
6.3
——
—33
.5 ±
5.0
Aclo
des
sp. 3
254.
77 ±
0.1
936
.0 ±
2.8
21.0
± 1
.310
.6 ±
1.4
3 ±
083
.1 ±
6.5
1226
± 3
561.
6 ±
2.0
Eth
ospe
cies
114
4.91
± 0
.18
46.5
± 5
.016
.9 ±
1.3
7.1
± 0
.82
± 0
44.4
± 5
.726
9 ±
70
36.2
± 4
.8D
iatry
pa s
p. 1
145.
20 ±
0.1
413
4.9
± 4
.35.
7 ±
0.5
1.1
± 0
.418
± 2
137
± 1
331
9 ±
70
34.8
± 6
.0O
roch
aris
sp. 2
185.
34 ±
0.1
590
.6 ±
3.4
6.9
± 0
.73.
3 ±
0.8
95 ±
12
1050
± 1
4531
97 ±
367
9.6
± 7
.4E
thos
peci
es 2
225.
77 ±
0.2
620
.2 ±
2.1
37.4
± 3
.223
.4 ±
2.2
2 ±
010
1 ±
813
45 ±
288
28.9
± 8
.7E
thos
peci
es 3
135.
92 ±
0.2
615
6.2
± 5
.13.
6 ±
0.5
1.9
± 0
.370
± 1
545
2 ±
99
1165
± 4
53—
Dia
trypa
sp.
222
6.38
± 0
.20
15.2
± 0
.824
.3 ±
2.3
45.4
± 4
.3—
——
10.6
± 5
.6An
axip
ha s
p. 1
327.
43 ±
0.3
554
.9 ±
9.8
13.7
± 3
.04.
9 ±
1.5
8 ±
113
7 ±
20
1046
± 3
9024
.9 ±
10.
6An
axip
ha s
p. 2
317.
49 ±
0.5
870
.1 ±
5.7
9.9
± 1
.43.
8 ±
1.3
10 ±
315
1 ±
42
884
± 3
0532
.9 ±
8.9
Anax
ipha
pla
typt
era
197.
61 ±
0.3
045
.4 ±
3.0
14.4
± 1
.57.
5 ±
1.4
——
——
Orn
ebiu
s sp
. 133
8.37
± 0
.24
83.6
± 4
.78.
6 ±
1.1
3.0
± 0
.89
± 1
109
± 1
130
4 ±
22
27.3
± 9
.4O
rneb
ius
sp. 2
318.
50 ±
0.2
976
.9 ±
5.1
9.3
± 0
.93.
9 ±
0.7
4 ±
052
.1 ±
3.7
164
± 1
418
.1 ±
9.7
Cyc
lopt
iloid
es s
p.22
9.39
± 0
.32
3.8
± 0
.513
.9 ±
1.9
323
± 2
8—
——
4.5
± 1
.7
213
Dow
nloaded from https://academ
ic.oup.com/beheco/article/27/1/211/1744419 by guest on 01 June 2022
Behavioral Ecology
was considered acceptable; Clarke 1993). In our case, the selected similarity index of cosignaling was based on that of Kulczynski (Figure 2a) and for acoustic parameters, on Euclidean distance (Figure 3a); differences among all multidimensional acoustic fea-tures between any 2 species were considered. The resulting simi-larity/distance matrix was then projected into a 2D space based on ranked differences such that the relative distance between the species was retained. The point pattern distribution of NMDS was then statistically analyzed using Ripley’s K method (PAST, Hammer et al. 2001). This method reveals patterns that deviate from random distribution effects (clustered or dispersed patterns) by incorporat-ing distance effects such as regularity on a small scale or dispersion on a large scale (Dixon 2002; Wiegand and Moloney 2004). A 95% confidence interval for complete spatial randomness was estimated using 1000 Monte Carlo simulations (PAST, Hammer et al. 2001).
We also considered phylogenetic correlations with reference to acoustic distance and cosignaling. However, because of the current lack of clarity about phylogenetic relationships among Panamanian crickets, we followed the method applied by Tobias et al. (2014). We used standard taxonomic sources to generate pairwise taxonomic distances between all species and scored pairs of congeners as 1,
members of the same subfamily as 2, members of the same family as 3, and members of different families as 4. We then tested these taxonomic relationships for their effects on acoustic distance and cosignaling using general linear models. Acoustic distances were Box–Cox transformed to ensure normal distribution.
Finally, to test the hypothesis that cosignaling species are expected to exhibit more dissimilar calls than those that do not signal together, we compared the acoustic dissimilarity of species pairs between 3 groups that had 1) low, intermediate, and high rate of cosignaling and 2) small, intermediate, and large call-ing height differences, respectively. To examine whether species that use spectrally similar calling songs differed in their temporal call structures, we compared the temporal acoustic dissimilar-ity of species pairs between 3 groups with small, intermediate, and large differences in song frequency. In order to create the 3 groups, the total number of species pairs obtained for the rate of cosignaling (N = 105), calling height differences (N = 120), and differences in song frequency (N = 153) were divided into thirds. Statistical comparisons between the 3 groups were based on repeated measurements with Anova. To ensure the normality of data, values were Box–Cox transformed. Mean values are pre-sented ± standard deviation.
0.15
0.10
0.05
0.00
0.000.00
0.01
0.02
0.03
0.04
0.05
0.06
0.04 0.08 0.12Distance
Axis 1
(a)
(b)
Axi
s 2
K(d
)
0.0 0.2 0.4 0.6
–0.05
–0.10
–0.15–0.4 –0.2–0.6
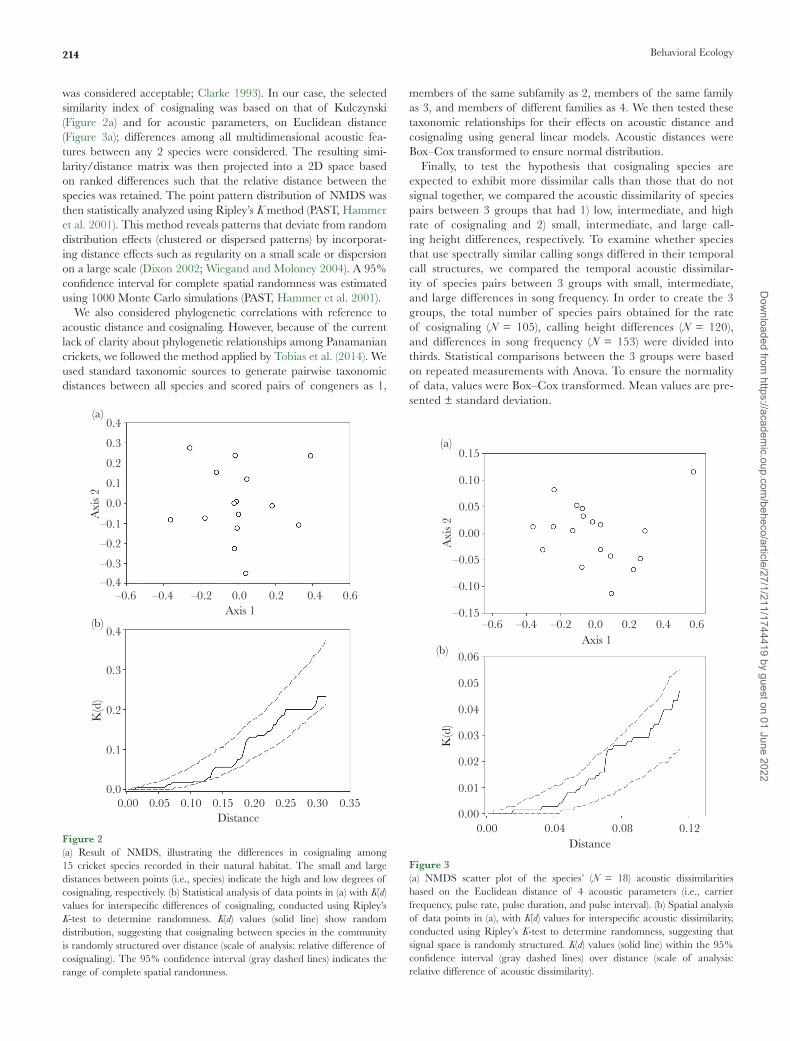
Figure 3(a) NMDS scatter plot of the species’ (N = 18) acoustic dissimilarities based on the Euclidean distance of 4 acoustic parameters (i.e., carrier frequency, pulse rate, pulse duration, and pulse interval). (b) Spatial analysis of data points in (a), with K(d) values for interspecific acoustic dissimilarity, conducted using Ripley’s K-test to determine randomness, suggesting that signal space is randomly structured. K(d) values (solid line) within the 95% confidence interval (gray dashed lines) over distance (scale of analysis: relative difference of acoustic dissimilarity).
0.4
0.4
0.3
0.3
0.2
0.2
0.1
0.1
0.0
0.00.00 0.05 0.10 0.15 0.20
Distance
Axis 1
(a)
(b)
Axi
s 2
K(d
)
0.25 0.350.30
0.0 0.2 0.4 0.6
–0.1
–0.2
–0.3
–0.4–0.4 –0.2–0.6
Figure 2(a) Result of NMDS, illustrating the differences in cosignaling among 15 cricket species recorded in their natural habitat. The small and large distances between points (i.e., species) indicate the high and low degrees of cosignaling, respectively. (b) Statistical analysis of data points in (a) with K(d) values for interspecific differences of cosignaling, conducted using Ripley’s K-test to determine randomness. K(d) values (solid line) show random distribution, suggesting that cosignaling between species in the community is randomly structured over distance (scale of analysis: relative difference of cosignaling). The 95% confidence interval (gray dashed lines) indicates the range of complete spatial randomness.
214
Dow
nloaded from https://academ
ic.oup.com/beheco/article/27/1/211/1744419 by guest on 01 June 2022

Schmidt et al. • Signal space partitioning in crickets
RESULTSSpatiotemporal partitioning
Cosignaling species were sufficiently well represented in a 2D scat-terplot, based on species presence–absence data in the habitat (NMDS analysis: stress factor = 0.18; Figure 2a). Small differences between the points indicated a high degree of cosignaling, whereas large differences illustrated small degree of cosignaling. In order to test for community-wide partitioning of cosignaling, the spatial distribution of data points in Figure 2a was analyzed. No segrega-tion between species was revealed (P > 0.05, random distribution; Figure 2b).
Acoustic dissimilarity and signal space partitioning
The Euclidean distances, measures of acoustic dissimilarity between the species, ranged from 0.07 to 3.21 with a mean of 1.02 ± 0.67 (N = 153 species pairs, 18 species). Acoustic param-eters were subjected to an NMDS analysis (stress factor = 0.02; Figure 3a), and the subsequent spatial analysis of data points (i.e., differences among acoustic signals between species) revealed a ran-dom distribution (P > 0.05; Figure 3b).
Effect of cosignaling on signal structure
We found no correlation between species cosignaling and the dis-similarity of their acoustic signals. Thus, the 3 groups with low (0.06–0.36), intermediate (0.36–0.49), and high (0.50–0.68) rates of cosignaling were not statistically different (Anova repeated mea-surements: F0.165 = 0.350, P = 0.706; N/group = 35; Figure 4a).
Likewise, the analysis of vertical stratification showed that signals communicated between species pairs that were signaling at similar heights (i.e., calling height differences of 0.1–8 m) were not signifi-cantly dissimilar as compared with those signaling with intermedi-ate (8–23 m) and large (>23 m) differences in calling height (Anova repeated measurements: F1.158 = 2.262, P = 0.111, N/group = 40; Figure 4b).
Song frequency and temporal acoustic dissimilarity
We found no significant difference between temporal acoustic dis-similarity and the degree of song frequency difference (small = 0.03–1.23 kHz; intermediate = 1.24–2.73 kHz; large = 2.74–6.26 kHz; Anova repeated measurements: F0.363 = 0.707, P = 0.496; N/group = 51; 18 species; Figure 5a). Incorporating 3 additional temporal parameters such as pulses per chirp, chirp duration, and chirp interval in the analysis led to an overall increase in the tem-poral dissimilarity (Figure 5b), but again, no significant difference between the 3 groups could be measured (Anova repeated measure-ments: F0.150 = 0.460, P = 0.634; N/group = 30; 14 species). Taken together, none of the variables (i.e., song frequency difference, rate of cosignaling, and calling height difference) were predictors for the temporal acoustic dissimilarity of the species pairs (multiple regres-sion analysis, Anova: R2 = 0.01, F0.129 = 0.245, P = 0.865, N = 91).
Phylogenetic patterns of acoustic distance and cosignaling
When considering phylogenetic relationships, we found only a weak and inconsistent correlation between these and acoustic dis-tance and cosignaling. Although the significance test for an over-all effect of taxonomic distance on acoustic signals was positive
(F1.482 = 3.32, P = 0.023), the post hoc pairwise comparisons of the 4 taxonomic rankings revealed no significant group differences (Tamhane T2 test for unequal group variances, P > 0.05). Testing the rate of cosignaling (i.e., species calling at the same time and place) for phylogenetic correlations yielded in a significant result (F0.015 = 3.304, P = 0.026). However, this effect was only detect-able between taxonomic groups 3 (members of the same family) and 4 (members of different families) (post hoc analyses: Tukey test, P = 0.017).
DISCUSSIONIn this study, we examined the role of acoustic competition on call-ing song structure in a species-rich, tropical cricket community. We hypothesized that species exhibiting 1) a high rate of cosignaling or 2) calling with similar song frequencies are expected to have songs that are acoustically dissimilar or differ in their temporal domains, respectively. However, based on the present results, we found no support for the hypothesis that signal structure in the observed acoustic community was shaped by acoustic competition. One explanation for this negative result may be the overall low degree of call overlap between species. Some conclusive evidence suggest-ing that acoustic overlap is weaker than is usually assumed has been presented for a paleotropic cricket and katydid acoustic assemblage in India, where the amount of masking interference was rigorously
0.5
1.0
1.5
2.0
2.5
3.0
3.5
4.0
0.0low intermediate high
Rate of cosignaling
Calling height di�erencesmall intermediate large
(a)
(b)
Aco
ustic
dis
sim
ilari
ty
0.5
1.0
1.5
2.0
2.5
3.0
3.5
4.0
0.0
Aco
ustic
dis
sim
ilari
ty
Figure 4Comparison of acoustic dissimilarity of calling songs between species pairs depending (a) on the rate of cosignaling and (b) calling height difference. Boxes show the range from the 25th to 75th percentiles, the solid horizontal line depicts the median value, and circles represent the 5th and 95th percentile outliers.
215
Dow
nloaded from https://academ
ic.oup.com/beheco/article/27/1/211/1744419 by guest on 01 June 2022

Behavioral Ecology
tested (Balakrishnan et al. 2014; Jain et al. 2014). In these studies, in addition to temporal and spectral overlaps, as well as the relative positions of individuals in the habitat, the authors considered the hearing sensitivity and tuning properties of the receivers. Together with the call intensities and attenuation profiles of calls in the habi-tat, they integrated these data in 3D acoustic space simulation mod-els and noted that the effective acoustic overlap (EAO) was close to 0 (Jain et al. 2014). Thus, where sufficiently large signal space is available, such a low level of acoustic overlap may be present in contemporary communities, suggesting that masking interference does not constitute a major problem. The observed contemporary community and its low associated EAO may be the result of a spe-cies sorting process, in which acoustic competition between any newcomer and the pre-existing species inevitably results in local extinction for one of them.
Tobias et al. (2014) addressed the issue of signal space segrega-tion in birds and argued that acoustic competition is too weak to exert significant costs that might drive the evolution of structurally dissimilar signals and signal partitioning. On the contrary, consider-ing only the spectral axis of the signal as a direct source of masking interference for the cricket community investigated here, we found some support for the spectral niche hypothesis (Schmidt et al. 2013; see also acoustic niche hypothesis: Krause 1987; Farina 2014). The results of our study demonstrated that call frequency overlap
between most species pairs in the cricket assemblage was extremely low and significantly smaller than what was expected to occur by chance (Schmidt et al. 2013; Schmidt and Balakrishnan 2015). Nonetheless, even species that show no frequency overlap are not acoustically separated, but in one another’s detection ranges when they use similar calling frequencies. This is especially true when spe-cies tend to call together, as demonstrated by Jain et al. (2014). The authors found low spectral overlap between the majority of spe-cies pairs in the assemblage, but a relatively high temporal overlap (i.e., species calling together) for a considerable number of pairs. However, when considering the differences in song frequencies, we found no partitioning in the temporal domain of signals (Figure 5).
Grasshopper communities should be more strongly affected by the problem of masking interference because of the broadband fre-quency spectra of their signals; only the temporal domain of their songs remains for species recognition. Moreover, because grasshop-pers usually inhabit simply structured grassland areas, they have fewer possibilities for spatial segregation as compared with species distributed in communities in tropical rainforests. Therefore, one could expect a higher selection pressure on signal structure in a densely packed communication channel. Indeed, a few studies have provided evidence that songs in syntopic, species-rich Eurasian grasshopper communities exhibit pronounced differences in tem-poral fine structure, leading to partitioning of the acoustic signal space (Bukhvalova 2006; Tishechkin and Bukhvalova 2009).
Reasonable explanations for the absence of signal partitioning can be found when we look at the problem of signal interference from a receiver’s perspective (the receiver psychology; Guilford and Dawkins 1991). For example, it has already been shown that some of the species in the cricket community investigated here possess a more sharply tuned song carrier frequency than field crickets, which communicate without the competitive signals of heterospe-cific signalers (Schmidt et al. 2011; Schmidt and Römer 2011). Such frequency selectivity enables receivers to effectively suppress the noise (i.e., adjacent neighboring frequencies) from heterospe-cific signalers and reliably extract the species-specific song pattern. Simulation models have indeed confirmed that frequency tuning is the most powerful mechanism used to reduce masking interference (Jain et al. 2014). With respect to the temporal song pattern, crick-ets possess very effective filters for species-specific song characteris-tics, and the respective filters in the brain do respond selectively to a given pulse pattern, even when only 2–3 pulse intervals have been perceived (Kostarakos and Hedwig 2012; see also Hennig et al. 2014). Thus, species-specific differences in song structure alone might be sufficient, allowing receivers to avoid confusing signals from conspecifics with those from other calling species in the com-munity (Seddon and Tobias 2010; Amézquita et al. 2011; Tobias et al. 2014).
Apart from acoustic competition, other factors have been dis-cussed that potentially influence signal diversity (Wilkins et al. 2013), one of which is related to physical features of the habitat and their sound transmission properties (Morton 1975; Hunter and Krebs 1979; Endler 1992; Couldridge and van Staaden 2004; Ey and Fischer 2009; Tobias et al. 2010). Although the role of trans-mission properties for the cricket songs was not explicitly addressed for the community examined in this study, no compelling evidence that sound signals of crickets and katydids are shaped for optimal transmission thus far exists (Diwakar and Balakrishana 2007; Jain and Balakrishnan 2012; Montealegre et al. 2014). A reason for this is that the transmission distance might be constrained by preda-tion and and/or parasitization risks, which exert selective pressure
0.5
1.0
1.5
2.0
2.5
3.0
3.5
4.0
0.0
Di�erence in song frequencysmall intermediate large
(a)
(b)
Tem
pora
l aco
ustic
dis
sim
ilari
tyT
empo
ral a
cous
tic d
issi
mila
rity
0.5
1.0
1.5
2.0
2.5
3.0
3.5
4.0
0.0
Figure 5Analysis of temporal signal structure for 18 species based on pulse rate, pulse duration, and pulse interval (a) and for 14 chirping species based on pulse rate, pulse duration, pulse interval, pulses/chirp, chirp duration, and chirp interval (b) depending on differences in calling song frequencies. Species pairs using similar calling song frequencies were expected to show a higher degree of temporal acoustic dissimilarity. Boxes show the range from the 25th to 75th percentiles, the solid horizontal line depicts the median value, and circles represent the 5th and 95th percentile outliers.
216
Dow
nloaded from https://academ
ic.oup.com/beheco/article/27/1/211/1744419 by guest on 01 June 2022

Schmidt et al. • Signal space partitioning in crickets
against conspicuous calling songs (Cade 1975; Zuk and Kolluru 1998; Gerhardt and Huber 2002; Zuk et al. 2006; Römer et al. 2010). In addition, no support has been presented for indirect selec-tion in crickets due to pleiotropic effects that link song differentia-tion as a by-product to ecological or morphological adaptions to the environment (Otte 1992; Jones 1997; Podos 2001).
Acoustic competition has been hypothesized to lead to diver-gent selection pressures on signal structure in order to avoid mask-ing interference (Wilkins et al. 2013). However, in this study, we found no support for the hypothesis that acoustic signal partition-ing occurs. Instead, we argue that selection on sensory mechanisms seems to play a more important role for reliable communication. The community described here, however, is not complete and is possibly derived from a larger species pool. Specifically, not all existing species were considered in the analysis; some were left out because they were too rare, whereas others might not have been detected at all. Cricket populations can fluctuate considerably from season to season, thereby creating a strong stochastic element that would argue against stable evolutionary outcomes. For this reason, the current ecological factors (e.g., the presence of new species that compete for acoustic space with the existing, local pool of species) play important roles in determining the acoustic signature of the assemblage and reduce the importance of the fine-tuned evolution-ary response of a single species.
FUNDINGThis work was supported by the Austrian Science Fund (FWF): Project Grant P20882-B09 to H.R.
We are grateful to the Smithsonian Tropical Research Institute (STRI) and the National Authority for the Environment (ANAM) for providing research permits and logistical support, which ensured that all work was conducted in conformity with current Panamanian laws. We thank S. Hirtenlehner and A. Einhäupl for their work as field assistants. We also thank the editor G. Machado and 3 anonymous referees for their valuable comments, which improved the manuscript.
Handling editor: Glauco Machado
REFERENCESAmézquita A, Flechas SV, Lima AP, Gasser H, Hödl W. 2011. Acoustic
interference and recognition space within a complex assemblage of den-drobatid frogs. Proc Natl Acad Sci USA. 108:17058–17063.
Amézquita A, Hödl W, Lima AP, Castellanos L, Erdtmann L, de Araújo MC. 2006. Masking interference and the evolution of the acoustic com-munication system in the Amazonian dendrobatid frog Allobates femoralis. Evolution. 60:1874–1887.
Balakrishnan R, Bahuleyan J, Nandi D, Jain M. 2014. Modelling the effects of chorus species composition and caller density on acoustic mask-ing interference in multispecies choruses of crickets and katydids. Ecol Inform. 21:50–58.
Bennet-Clark HC. 1998. Size and scale effects as constraints in insect sound communication. Philos Trans R Soc Lond B Biol Sci. 353:407–419.
Blackwell PRY, Jennions MD. 1993. Mate choice in the neotropical frog, Hyla ebraccata: sexual selection, mate recognition and signal selection. Anim Behav. 45:1248–1250.
Boughman JW. 2002. How sensory drive can promote speciation. Trends Ecol Evol. 17:571–577.
Boul KE, Funk WC, Darst CR, Cannatella DC, Ryan MJ. 2007. Sexual selection drives speciation in an Amazonian frog. Proc Biol Sci. 274:399–406.
Brumm H. 2013. Animal communication and noise. Berlin (Germany): Springer.
Brumm H, Slabbekoorn H. 2005. Acoustic communication in noise. Adv Stud Behav. 35:151–209.
Bukhvalova MA. 2006. Partitioning of acoustic transmission channels in grasshopper communities. In: Drosopoulos S, Claridge MF, editors. Insect sounds and communication. Physiology, behaviour, ecology and evolution. Boca Raton (FL): CRC Press, Taylor and Francis Group. p. 199–205.
Cade W. 1975. Acoustically orienting parasitoids: fly phonotaxis to cricket song. Science. 190:1312–1313.
Chek AA, Bogart JP, Lougheed SC. 2003. Mating signal partitioning in multi-species assemblages: a null model test using frogs. Ecol Lett. 6:235–247.
Clarke KR. 1993. Non-parametric multivariate analysis of changes in com-munity structure. Aust J Ecol. 18:117–143.
Couldridge VC, van Staaden MJ. 2004. Habitat-dependent transmis-sion of male advertisement calls in bladder grasshoppers (Orthoptera; Pneumoridae). J Exp Biol. 207:2777–2786.
Diwakar S, Balakrishnan R. 2007. Vertical stratification in an acoustically communicating ensiferan assemblage of a tropical evergreen forest in southern India. J Trop Ecol. 23:479–486.
Dixon PM. 2002. Ripley’s K function. Encycl Environ. 3:1796–1803.Eades DC, Otte D, Cigliano MM, Braun H. 2015. Orthoptera Species File.
Available from: http://Orthoptera.SpeciesFile.org.Endler JA. 1992. Signals, signal conditions, and the direction of evolution.
Am Nat. 139:125–153.Endler JA. 1993. Some general comments on the evolution and design of
animal communication systems. Philos Trans R Soc Lond B Biol Sci. 340:215–225.
Ey E, Fischer J. 2009. The “Acoustic Adaptation Hypothesis”—a review of the evidence from birds, anurans and mammals. Bioacoustics. 19:21–48.
Farina A. 2014. Bioacoustics theories. In: Farina A, editor. Soundscape ecology. Principles, patterns, methods, and applications. Dordrecht (The Netherlands): Springer. p. 43–61.
Gerhardt HC, Dyson ML, Tanner SD, Murphy CG. 1994. Female tree-frogs do not avoid heterospecific calls as they approach conspecific calls: implications for mechanisms of mate choice. Anim Behav. 47:1323–1332.
Gerhardt HC, Huber F. 2002. Acoustic communication in insects and anurans: common problems and diverse solutions. Chicago (IL): University of Chicago Press.
Grant BR, Grant PR. 2010. Songs of Darwin’s finches diverge when a new species enters the community. Proc Natl Acad Sci USA. 107:20156–20163.
Gray DA, Cade WH. 2000. Sexual selection and speciation in field crickets. Proc Natl Acad Sci USA. 97:14449–14454.
Greenfield MD. 1988. Interspecific acoustic interactions among katydids Neoconocephalus: inhibition-induced shifts in diel periodicity. Anim Behav. 36:684–695.
Gröning J, Hochkirch A. 2008. Reproductive interference between animal species. Q Rev Biol. 83:257–282.
Guilford T, Dawkins MS. 1991. Receiver psychology and the evolution of animals signals. Anim Behav. 42:1–14.
Hammer Ø, Harper DAT, Ryan PD. 2001. PAST: Paleontological Statistics Software Package for Education and Data Analysis. Palaeontol Electron. 4:9.
Hebard M. 1928. Studies in the Gryllidae of Panama (Orthoptera). Trans Am Entomol Soc. 54:233–294.
Hennig RM, Heller KG, Clemens J. 2014. Time and timing in the acoustic recognition system of crickets. Front Physiol. 5:286.
Hödl W. 1977. Call differences and calling site segregation in anuran species from Central Amazonian Floating Meadows. Oecologia. 28:351–363.
Hoskin CJ, Higgie M. 2010. Speciation via species interactions: the diver-gence of mating traits within species. Ecol Lett. 13:409–420.
Hunter ML, Krebs JR. 1979. Geographical variation in the song of the great tit Parus major in relation to ecological factors. J Anim Ecol. 48:759–785.
Jain M, Balakrishnan R. 2012. Does acoustic adaptation drive verti-cal stratification? A test in a tropical cricket assemblage. Behav Ecol. 23:343–354.
Jain M, Diwakar S, Bahuleyan J, Deb R, Balakrishnan R. 2014. A rain for-est dusk chorus: cacophony or sounds of silence? Evol Ecol. 28:1–22.
Jones G. 1997. Acoustic signals and speciation: the roles of natural and sexual selection in the evolution of cryptic species. Adv Study Behav. 26:317–354.
Jost MC, Shaw KL. 2006. Phylogeny of the Ensifera (Hexapoda: Orthoptera) using 3 ribosomal loci, with implications for the evolution of acoustic communication. Mol Phylogenet Evol. 38:510–530.
217
Dow
nloaded from https://academ
ic.oup.com/beheco/article/27/1/211/1744419 by guest on 01 June 2022

Behavioral Ecology
Kirschel ANG, Blumstein DT, Smith TB. 2009. Character displacement of song and morphology in African tinkerbirds. Proc Natl Acad Sci USA. 106:8256–8261.
Kostarakos K, Hedwig B. 2012. Calling song recognition in female crick-ets: temporal tuning of identified brain neurons matches behavior. J Neurosci. 32:9601–9912.
Krause BL. 1987. Bioacoustics, habitat ambience in ecological balance. Whole Earth Rev. 57:14–18.
Krebs CJ. 1999. Ecological methodology. 2nd ed. Menlo Park (CA): Benjamin/Cummings.
Lang A, Teppner I, Hartbauer M, Römer H. 2005. Predation and noise in communication networks of neotropical katydids. In McGregor P, editor. Animal communication networks. Cambridge (MA): Cambridge University Press. p. 152–169.
Leigh EG. 1999. Tropical forest ecology: a view from Barro Colorado Island. Oxford: Oxford University Press.
Luther DA. 2009. The influence of the acoustic community on songs of birds in a neotropical rain forest. Behav Ecol. 20:864–871.
Mendelson TC, Shaw KL. 2005. Sexual behavior: rapid speciation in an arthropod. Nature. 433:375–376.
Mendelson TC, Shaw KL. 2012. The (mis)concept of species recognition. Trends Ecol Evol. 27:421–427.
Montealegre ZF, Sarria SFA, Pimienta MC, Mason AC. 2014. Lack of cor-relation between vertical distribution and carrier frequency, and prefer-ence for open spaces in arboreal katydids that use extreme ultrasound in Gorgona, Colombia (Orthoptera: Tettigoniidae). Int J Trop Biol Conserv. 62(Suppl 1):289–296.
Morton ES. 1975. Sources of selection on avian sounds. Am Nat. 109:17–34.Nickle DA. 1992. The crickets and mole crickets of Panama (Orthoptera:
Gryllidae and Gryllotalpidae). In: Quintero DA, Aiello A, editors. Insects of Panama and Mesoamerica: selected studies. p. 185–197.
Otte D. 1992. Evolution of cricket songs. J Orthop Res. 1:25–49.Panhius TM, Butlin R, Zuk M, Tregenza T. 2001. Sexual selection and spe-
ciation. Trends Ecol Evol. 16:364–371.Planqué R, Slabbekoorn H. 2008. Spectral overlap in songs and temporal
avoidance in a Peruvian bird assemblage. Ethology. 114:262–271.Podos J. 2001. Correlated evolution of morphology and vocal signal struc-
ture in Darwin’s finches. Nature. 409:185–188.Robillard T, Grandcolas P, Desutter-Grandcolas L. 2007. A shift toward
harmonics for high-frequency calling shown with phylogenetic study of frequency spectra in Eneopterinae crickets (Orthoptera, Grylloidea, Eneopteridae). Can J Zool. 85:1264–1275.
Römer H, Bailey WJ, Dadour I. 1989. Insect hearing in the field. III. Masking by noise. J Comp Physiol. 164:609–620.
Römer H, Lang A, Hartbauer M. 2010. The signaller’s dilemma: a cost-ben-efit analysis of public and private communication. PLoS One. 5:e13325.
Schmidt AKD, Balakrishnan R. 2015. Ecology of acoustic signalling and the problem of masking interference in insects. J Comp Physiol A. 201:133–142.
Schmidt AKD, Riede K, Römer H. 2011. High background noise shapes selective auditory filters in a tropical cricket. J Exp Biol. 214:1754–1762.
Schmidt AKD, Römer H. 2011. Solutions to the cocktail party problem in insects: selective filters, spatial release from masking and gain control in tropical crickets. PLoS One. 6:e28593.
Schmidt AKD, Römer H, Riede K. 2013. Spectral niche segregation and community organization in a tropical cricket assemblage. Behav Ecol. 24:470–480.
Seddon N, Tobias JA. 2010. Character displacement from the receiver’s perspective: species and mate recognition despite convergent signals in suboscine birds. Proc Biol Sci. 277:2475–2483.
Song H, Amédégnato C, Cigliano MM, Desutter-Grandcolas L, Heads SW, Huang Y, Otte D, Whiting MF. 2015. 300 million years of diversification: elucidating the patterns of orthopteran evolution based on comprehen-sive taxon and gene sampling. Cladistics. doi: 10.1111/cla.12116.
Stout J, McGhee R. 1988. Attractiveness of the male Acheta domesticus calling song to females. II. The relative importance of syllable period, intensity and chirp rate. J Comp Physiol A. 164:277–287.
Sueur J. 2002. Cicada acoustic communication: potential sound partitioning in a multispecies community from Mexico (Hemiptera: Cicadomorpha: Cicadidae). Biol J Linn Soc. 75:379–394.
Thorson J, Weber T, Huber F. 1982. Auditory behaviour of the cricket. II. Simplicity of calling-song recognition in Gryllus, and anoma-lous phonotaxis at abnormal carrier frequencies. J Comp Physiol A. 146:361–378.
Tishechkin DY, Bukhvalova MA. 2009. Acoustic communication in grass-hopper communities (Orthoptera: Acrididae: Gomphocerinae): segrega-tion of acoustic niches. Russ Entomol J. 18:165–188.
Tobias JA, Aben J, Brumfield RT, Derryberry EP, Halfwerk W, Slabbekoorn H, Seddon N. 2010. Song divergence by sensory drive in Amazonian birds. Evolution. 64:2820–2839.
Tobias JA, Planqué R, Cram DL, Seddon N. 2014. Species interactions and the structure of complex communication networks. Proc Natl Acad Sci USA. 111:1020–1025.
Wiegand T, Moloney KA. 2004. Rings, circles, and null-models for point pattern analysis in ecology. Oikos. 104:209–229.
Wiley RH. 2006. Signal detection and animal communication. Adv Stud Behav. 36:217–247.
Wiley RH. 2013. Signal detection, noise, and the evolution of communi-cation. In: Brumm H, editor. Animal communication and noise. Berlin (Germany): Springer. p. 7–30.
Wilkins MR, Seddon N, Safran RJ. 2013. Evolutionary divergence in acous-tic signals: causes and consequences. Trends Ecol Evol. 28:156–166.
Zuk M, Kolluru GR. 1998. Exploitation of sexual signals by predators and parasitoids. Q Rev Biol. 73:415–438.
Zuk M, Rotenberry JT, Tinghitella RM. 2006. Silent night: adaptive disap-pearance of a sexual signal in a parasitized population of field crickets. Biol Lett. 2:521–524.
218
Dow
nloaded from https://academ
ic.oup.com/beheco/article/27/1/211/1744419 by guest on 01 June 2022