ery109.pdf - Oxford Academic
14
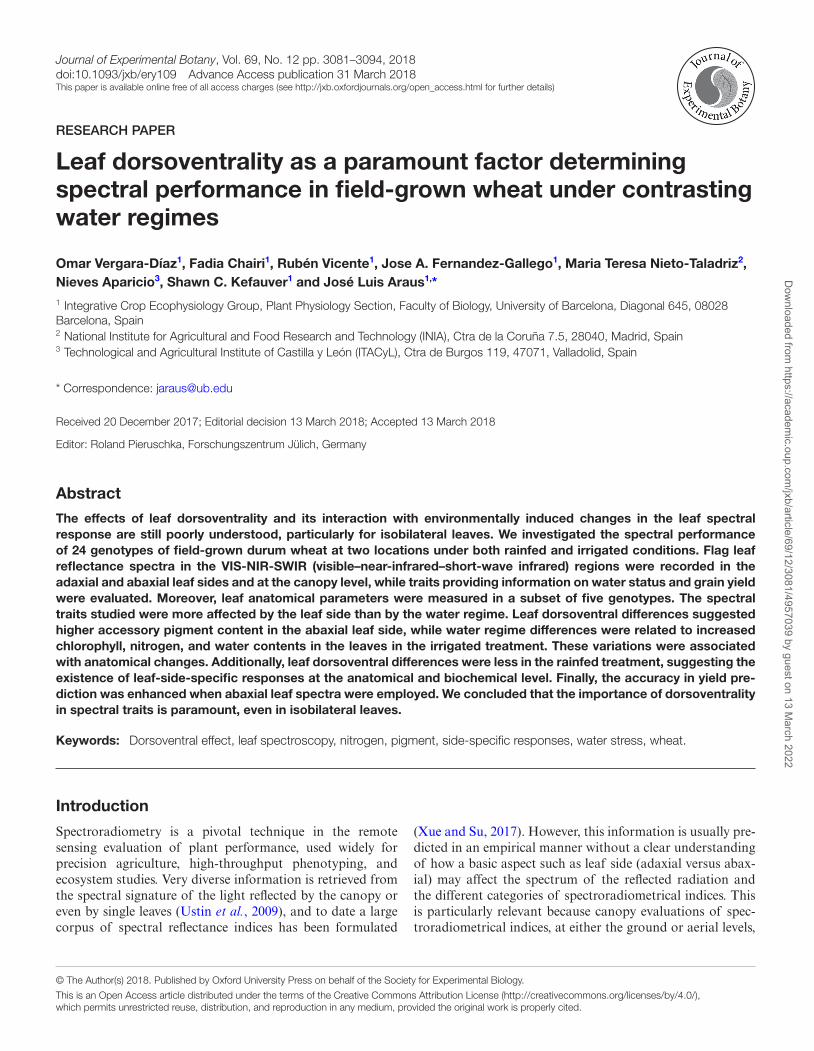
Journal of Experimental Botany, Vol. 69, No. 12 pp. 3081–3094, 2018 doi:10.1093/jxb/ery109 Advance Access publication 31 March 2018 This paper is available online free of all access charges (see http://jxb.oxfordjournals.org/open_access.html for further details) RESEARCH PAPER Leaf dorsoventrality as a paramount factor determining spectral performance in field-grown wheat under contrasting water regimes Omar Vergara-Díaz 1 , Fadia Chairi 1 , Rubén Vicente 1 , Jose A. Fernandez-Gallego 1 , Maria Teresa Nieto-Taladriz 2 , Nieves Aparicio 3 , Shawn C. Kefauver 1 and José Luis Araus 1, * 1 Integrative Crop Ecophysiology Group, Plant Physiology Section, Faculty of Biology, University of Barcelona, Diagonal 645, 08028 Barcelona, Spain 2 National Institute for Agricultural and Food Research and Technology (INIA), Ctra de la Coruña 7.5, 28040, Madrid, Spain 3 Technological and Agricultural Institute of Castilla y León (ITACyL), Ctra de Burgos 119, 47071, Valladolid, Spain * Correspondence: [email protected] Received 20 December 2017; Editorial decision 13 March 2018; Accepted 13 March 2018 Editor: Roland Pieruschka, Forschungszentrum Jülich, Germany Abstract The effects of leaf dorsoventrality and its interaction with environmentally induced changes in the leaf spectral response are still poorly understood, particularly for isobilateral leaves. We investigated the spectral performance of 24 genotypes of field-grown durum wheat at two locations under both rainfed and irrigated conditions. Flag leaf reflectance spectra in the VIS-NIR-SWIR (visible–near-infrared–short-wave infrared) regions were recorded in the adaxial and abaxial leaf sides and at the canopy level, while traits providing information on water status and grain yield were evaluated. Moreover, leaf anatomical parameters were measured in a subset of five genotypes. The spectral traits studied were more affected by the leaf side than by the water regime. Leaf dorsoventral differences suggested higher accessory pigment content in the abaxial leaf side, while water regime differences were related to increased chlorophyll, nitrogen, and water contents in the leaves in the irrigated treatment. These variations were associated with anatomical changes. Additionally, leaf dorsoventral differences were less in the rainfed treatment, suggesting the existence of leaf-side-specific responses at the anatomical and biochemical level. Finally, the accuracy in yield pre- diction was enhanced when abaxial leaf spectra were employed. We concluded that the importance of dorsoventrality in spectral traits is paramount, even in isobilateral leaves. Keywords: Dorsoventral effect, leaf spectroscopy, nitrogen, pigment, side-specific responses, water stress, wheat. Introduction Spectroradiometry is a pivotal technique in the remote sensing evaluation of plant performance, used widely for precision agriculture, high-throughput phenotyping, and ecosystem studies. Very diverse information is retrieved from the spectral signature of the light reflected by the canopy or even by single leaves (Ustin et al., 2009), and to date a large corpus of spectral reflectance indices has been formulated (Xue and Su, 2017). However, this information is usually pre- dicted in an empirical manner without a clear understanding of how a basic aspect such as leaf side (adaxial versus abax- ial) may affect the spectrum of the reflected radiation and the different categories of spectroradiometrical indices. This is particularly relevant because canopy evaluations of spec- troradiometrical indices, at either the ground or aerial levels, This is an Open Access article distributed under the terms of the Creative Commons Attribution License (http://creativecommons.org/licenses/by/4.0/), which permits unrestricted reuse, distribution, and reproduction in any medium, provided the original work is properly cited. © The Author(s) 2018. Published by Oxford University Press on behalf of the Society for Experimental Biology. Downloaded from https://academic.oup.com/jxb/article/69/12/3081/4957039 by guest on 13 March 2022
-
Upload
khangminh22 -
Category
Documents
-
view
0 -
download
0
Transcript of ery109.pdf - Oxford Academic
Journal of Experimental Botany, Vol. 69, No. 12 pp. 3081–3094, 2018doi:10.1093/jxb/ery109 Advance Access publication 31 March 2018This paper is available online free of all access charges (see http://jxb.oxfordjournals.org/open_access.html for further details)
RESEARCH PAPER
Leaf dorsoventrality as a paramount factor determining spectral performance in field-grown wheat under contrasting water regimes
Omar Vergara-Díaz1, Fadia Chairi1, Rubén Vicente1, Jose A. Fernandez-Gallego1, Maria Teresa Nieto-Taladriz2, Nieves Aparicio3, Shawn C. Kefauver1 and José Luis Araus1,*1 Integrative Crop Ecophysiology Group, Plant Physiology Section, Faculty of Biology, University of Barcelona, Diagonal 645, 08028 Barcelona, Spain2 National Institute for Agricultural and Food Research and Technology (INIA), Ctra de la Coruña 7.5, 28040, Madrid, Spain3 Technological and Agricultural Institute of Castilla y León (ITACyL), Ctra de Burgos 119, 47071, Valladolid, Spain
* Correspondence: [email protected]
Received 20 December 2017; Editorial decision 13 March 2018; Accepted 13 March 2018
Editor: Roland Pieruschka, Forschungszentrum Jülich, Germany
Abstract
The effects of leaf dorsoventrality and its interaction with environmentally induced changes in the leaf spectral response are still poorly understood, particularly for isobilateral leaves. We investigated the spectral performance of 24 genotypes of field-grown durum wheat at two locations under both rainfed and irrigated conditions. Flag leaf reflectance spectra in the VIS-NIR-SWIR (visible–near-infrared–short-wave infrared) regions were recorded in the adaxial and abaxial leaf sides and at the canopy level, while traits providing information on water status and grain yield were evaluated. Moreover, leaf anatomical parameters were measured in a subset of five genotypes. The spectral traits studied were more affected by the leaf side than by the water regime. Leaf dorsoventral differences suggested higher accessory pigment content in the abaxial leaf side, while water regime differences were related to increased chlorophyll, nitrogen, and water contents in the leaves in the irrigated treatment. These variations were associated with anatomical changes. Additionally, leaf dorsoventral differences were less in the rainfed treatment, suggesting the existence of leaf-side-specific responses at the anatomical and biochemical level. Finally, the accuracy in yield pre-diction was enhanced when abaxial leaf spectra were employed. We concluded that the importance of dorsoventrality in spectral traits is paramount, even in isobilateral leaves.
Keywords: Dorsoventral effect, leaf spectroscopy, nitrogen, pigment, side-specific responses, water stress, wheat.
Introduction
Spectroradiometry is a pivotal technique in the remote sensing evaluation of plant performance, used widely for precision agriculture, high-throughput phenotyping, and ecosystem studies. Very diverse information is retrieved from the spectral signature of the light reflected by the canopy or even by single leaves (Ustin et al., 2009), and to date a large corpus of spectral reflectance indices has been formulated
(Xue and Su, 2017). However, this information is usually pre-dicted in an empirical manner without a clear understanding of how a basic aspect such as leaf side (adaxial versus abax-ial) may affect the spectrum of the reflected radiation and the different categories of spectroradiometrical indices. This is particularly relevant because canopy evaluations of spec-troradiometrical indices, at either the ground or aerial levels,
This is an Open Access article distributed under the terms of the Creative Commons Attribution License (http://creativecommons.org/licenses/by/4.0/), which permits unrestricted reuse, distribution, and reproduction in any medium, provided the original work is properly cited.
© The Author(s) 2018. Published by Oxford University Press on behalf of the Society for Experimental Biology.
Dow
nloaded from https://academ
ic.oup.com/jxb/article/69/12/3081/4957039 by guest on 13 M
arch 2022
3082 | Vergara-Díaz et al.
are usually performed using the spectrum reflected from the adaxial part of the leaves (Jacquemoud and Baret, 1990; Sims and Gamon, 2002; Lu and Lu, 2015).
For its part, water stress is known to trigger mechanisms of acclimation in the leaf such as changes in gene expression and modification of plant physiology, morphology, and anatomy, leading to homeostatic compensation (Flexas et al., 2006). At the leaf level, changes in morphology, anatomy, turgor status, and biochemical content can directly and/or indirectly impact the reflected radiation. In fact, this is the basis for plant status studies using a spectroscopic approach. Moreover, few stud-ies have considered leaf-side-specific responses, and those focusing on the leaf dorsoventral effect have usually been performed on plant species with a clear bifacial leaf anatomy (Evans, 1999; Lu et al., 2015).
In contrast, monocots such as wheat have typical isobi-lateral leaves whereby dorsoventral differences tend to be underestimated, considering the relative homogeneity in the mesophyll anatomy (lack of a clear dorsoventral gradient in terms of palisade versus spongy cells) and even on the epi-dermal surface of these leaves (which are amphystomatous). However, the abaxial epidermis is thinner and lacks bulliform cells and furrows, while the usually relatively erect position of the flag leaf and the fact that it is placed in the uppermost part of the canopy suggest that the light gradient through the leaf is not too strong.
Recent studies in monocots have reported side-specific ana-tomical and physiological responses that are usually depend-ent on genotypic and environmental effects (Soares et al., 2008; Soares-Cordeiro et al., 2011; Jafarian et al., 2012). For instance, leaf side-specific responses of photosynthesis and stomatal closure to light intensity and CO2 enrichment, as well as to chilling and water stresses, have been reported in C3 and C4 species (Wang et al., 1998; Soares et al., 2008; Soares-Cordeiro et al., 2011). Even so, there is a notable lack of understanding of how and to what extent these leaf-side-specific responses to environmental stress might affect the reflected radiation at the leaf and plant canopy scales. To the best of our knowledge, this is the first study addressing side-specific responses of wheat leaves to varying water conditions using a spectroscopic approach.
The spectral signatures in the range of visible (VIS; 400–700 nm), near-infrared (NIR; 700–1400 nm), and short-wave infrared (SWIR, 1400–2500 nm) wavelengths were investi-gated in the flag leaves of a set of 24 wheat genotypes grow-ing under different water regimes in the field. Leaf reflectance spectra were recorded for the two leaf sides (adaxial and abaxial) and at the canopy level. Additionally, leaf size as well as some specific morphological and anatomical traits (epider-mis, mesophyll, and xylem vessel metrics) were measured, and the stable carbon (δ13C) isotope composition of the flag leaves and grains as well as the total carbon (%C) and nitro-gen (%N) content of the flag leaves were further analysed. Although the δ13C and total nitrogen content may provide information on the water and nitrogen status of the leaves (Araus et al., 1997; Yousfi et al., 2012), the total carbon and nitrogen and their ratio provide a broad indication of leaf
chemical composition and the prevalence of structural sup-porting elements (Taylor et al., 1989).
The aim of the present study was to investigate the effect of water regime as well as leaf-side-specific responses on leaf reflectance traits in field-grown durum wheat. Spectral reflect-ance indices are discussed in the context of their relationship to different physiological, biochemical, and anatomical traits of the leaf. The similarity and dissimilarities between both leaf spectra and of the spectrum of the canopy, and their implica-tions for yield prediction were also addressed. The study was performed in the flag leaf because it has been reported to be the most isobilateral leaf in wheat (Araus et al., 1986).
Materials and methods
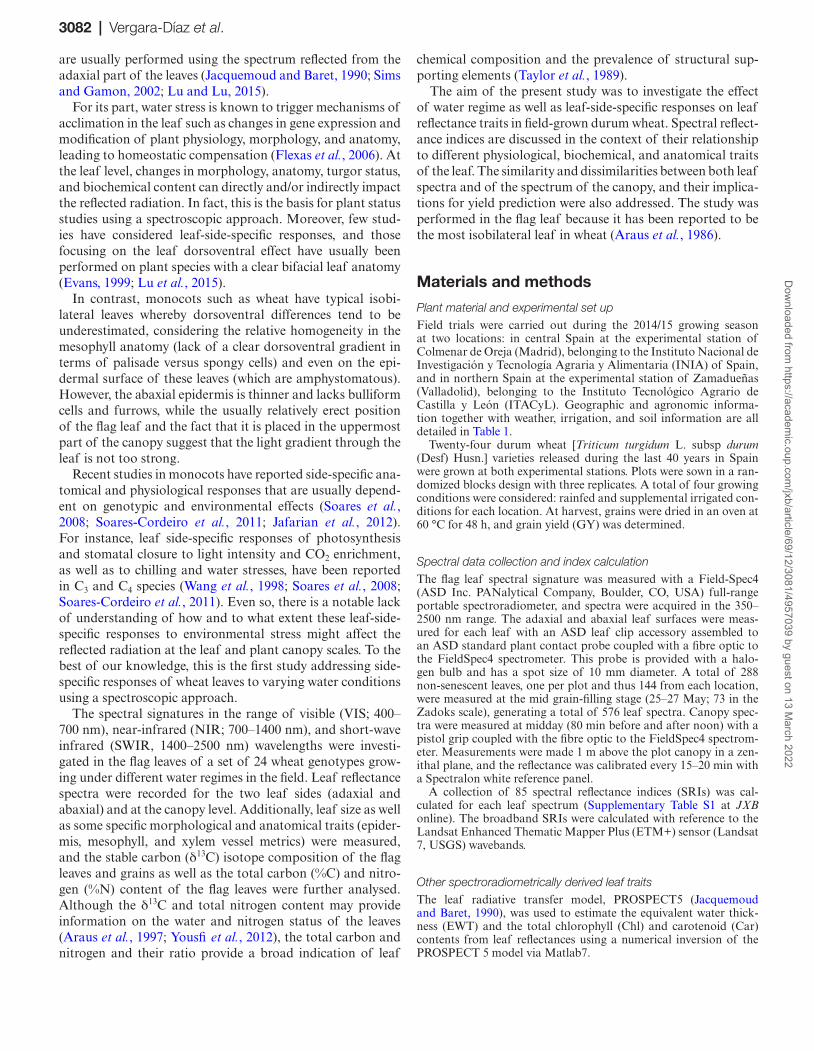
Plant material and experimental set upField trials were carried out during the 2014/15 growing season at two locations: in central Spain at the experimental station of Colmenar de Oreja (Madrid), belonging to the Instituto Nacional de Investigación y Tecnología Agraria y Alimentaria (INIA) of Spain, and in northern Spain at the experimental station of Zamadueñas (Valladolid), belonging to the Instituto Tecnológico Agrario de Castilla y León (ITACyL). Geographic and agronomic informa-tion together with weather, irrigation, and soil information are all detailed in Table 1.
Twenty-four durum wheat [Triticum turgidum L. subsp durum (Desf) Husn.] varieties released during the last 40 years in Spain were grown at both experimental stations. Plots were sown in a ran-domized blocks design with three replicates. A total of four growing conditions were considered: rainfed and supplemental irrigated con-ditions for each location. At harvest, grains were dried in an oven at 60 °C for 48 h, and grain yield (GY) was determined.
Spectral data collection and index calculationThe flag leaf spectral signature was measured with a Field-Spec4 (ASD Inc. PANalytical Company, Boulder, CO, USA) full-range portable spectroradiometer, and spectra were acquired in the 350–2500 nm range. The adaxial and abaxial leaf surfaces were meas-ured for each leaf with an ASD leaf clip accessory assembled to an ASD standard plant contact probe coupled with a fibre optic to the FieldSpec4 spectrometer. This probe is provided with a halo-gen bulb and has a spot size of 10 mm diameter. A total of 288 non-senescent leaves, one per plot and thus 144 from each location, were measured at the mid grain-filling stage (25–27 May; 73 in the Zadoks scale), generating a total of 576 leaf spectra. Canopy spec-tra were measured at midday (80 min before and after noon) with a pistol grip coupled with the fibre optic to the FieldSpec4 spectrom-eter. Measurements were made 1 m above the plot canopy in a zen-ithal plane, and the reflectance was calibrated every 15–20 min with a Spectralon white reference panel.
A collection of 85 spectral reflectance indices (SRIs) was cal-culated for each leaf spectrum (Supplementary Table S1 at JXB online). The broadband SRIs were calculated with reference to the Landsat Enhanced Thematic Mapper Plus (ETM+) sensor (Landsat 7, USGS) wavebands.
Other spectroradiometrically derived leaf traitsThe leaf radiative transfer model, PROSPECT5 (Jacquemoud and Baret, 1990), was used to estimate the equivalent water thick-ness (EWT) and the total chlorophyll (Chl) and carotenoid (Car) contents from leaf reflectances using a numerical inversion of the PROSPECT 5 model via Matlab7.
Dow
nloaded from https://academ
ic.oup.com/jxb/article/69/12/3081/4957039 by guest on 13 M
arch 2022

Linking leaf spectroscopy and leaf traits in wheat | 3083
Total leaf Chl content on an area basis was also assessed with a portable Chl meter (Minolta SPAD-502, Spectrum Technologies Inc., Plainfield, IL, USA).
Leaf morphological, anatomical, and physiological traitsThe leaf lamina length and width were measured in three flag leaves from each plot. Additionally, five genotypes representative of yield variability (data not shown) were selected for the anatomical observa-tions. Flag leaf blade segments of 10 × 5 mm were sampled and sub-merged in Visikol clearing solution (Visikol Inc., New Brunswick, NJ, USA). The samples were incubated with 1% osmium tetroxide and 0.8% potassium ferrocyanide, washed with MiliQ water, dehydrated with acetone at 4 °C, embedded in epoxy resin at room temperature, and blocks were left in the oven for 72 h at 80 °C. Cross-sections were obtained with an Ultracut E ultramicrotome (Reichert-Jung, Vienna, Austria) and stained with methylene blue and Van Gieson’s solution. Digital images were taken with an Olympus CX41 optical microscope at ×100 and ×200 magnifications.
Images were scale-calibrated, and anatomical metrics were meas-ured with Image J software. For the whole leaf cross-section, meas-urements were recorded of the leaf thickness, leaf sectional area, xylem vessel area and diameter, mesophyll cell sectional area and perimeter, epidermis cell sectional area and cell wall thickness, epi-dermis length, and areas of both the adaxial and the abaxial epi-dermis. For the cross-sections, the following ratios were calculated: total epidermis length to leaf cross-section area, the epidermis area to epidermis length ratio for the adaxial and abaxial epidermises (hereafter considered as epidermis thickness), the epidermis area to leaf area ratio for both epidermises, and the mesophyll cell area to cell perimeter ratio.
The stable carbon (13C:12C) isotope ratio as well as the nitro-gen (N) and carbon (C) concentrations (%) were measured in leaf and grain dry matter using an elemental analyser (Flash 1112 EA; Thermo Finnigan, Bremen, Germany) coupled with an iso-tope ratio mass spectrometer (Delta C IRMS, Thermo Finnigan) operating in a continuous flow mode. Samples of 0.7–1 mg of leaf dry matter from each plot, together with reference materials, were weighed and sealed into tin capsules. Measurements were conducted at the Scientific Facilities of the University of Barcelona. Isotopic
values were expressed in composition notation (δ) as follows: δ13C=[(13C/12C)sample/(
13C/12C)standard]–1, where ‘sample’ refers to plant material and ‘standard’ to international secondary standards of known 13C:12C ratios (IAEA CH7 polyethylene foil, IAEA CH6 sucrose, and USGS 40 l-glutamic acid) calibrated against Vienna Pee Dee Belemnite calcium carbonate with an analytical precision (standard deviation) of 0.15‰.
In addition, a JEOL JSM-7100F scanning electron microscope (JEOL, Akishima, Japan) in the Scientific and Technological Facilities of the University of Barcelona was employed to observe the epicuticular wax structure of the adaxial and abaxial sides of the flag leaf. Lyophilized leaves were gold-coated and subsequently observed operating at 10 kV.
Finally, air (Testo 177-H1 Logger, Germany) and plot canopy temperature (PhotoTemp MXS, Raytek Corporation, CA, USA) were simultaneously recorded and the canopy temperature depres-sion (CTD) was calculated as the difference between them.
Statistical analysisMultivariate ANOVAs were conducted using SPSS 21 (IBM SPSS Statistics 21, Inc., Chicago, IL, USA). Principal component analysis (PCA) of reflectances was performed with CANOCO 4.5 software (Ter Braak and Smilauer, 2002). Figures were drawn with SigmaPlot 10.0 (Systat Software Inc., San Jose, CA, USA). Finally, the clus-tered heatmap, the LASSO, and the backward stepwise regression analyses were performed with R 3.2.2 using the GPLOTS (Warnes et al., 2009), the GLMNET (Friedman et al., 2010), and the MASS (Ripley et al., 2013) packages, respectively.
Results
GY was significantly affected by water regime (Table 2), decreasing by 47% in Zamadueñas (from 7.17 Mg ha−1 to 3.77 Mg ha−1) and by 10% in Aranjuez (from 5.13 Mg ha−1 to 4.65 Mg ha−1) under rainfed compared with irrigated condi-tions. Yield differences in Aranjuez were lower due to severe lodging during grain filling in the irrigated treatment.
The CTD and leaf blade size (length and width) were sig-nificantly higher in irrigated conditions, whereas there was no difference in leaf Chl content assessed by a SPAD meter due to water regime. Regarding isotope composition, the δ13C of leaves and grains increased significantly in rainfed compared with irrigated conditions. Total leaf nitrogen content (%N) was significantly reduced in rainfed conditions, whereas the C:N ratio was increased (Table 2).
Leaf spectrum performance
Water regime significantly affected leaf reflectance in the NIR and SWIR regions (Fig. 1a). Regardless of the leaf side, leaf reflectance was significantly higher under irrigated conditions in the NIR region (756–948 nm and 997–1000 nm), whereas in rainfed conditions it was higher in the violet (350–375 nm) and SWIR regions (1289–1886 nm and 1988–2254 nm).
This performance changed when studying each leaf side separately (Fig. 1b, c). Differences in NIR reflectance between water regimes were only detected in the abaxial leaf side (747–1000 nm), whereas leaves belonging to the irrigated treatment had higher reflectance. In contrast, in the second half of the SWIR region, reflectance differences between water regimes were detected only in the adaxial leaf side (1988–2240 nm),
Table 1. Geographic, climatic, agronomic, and soil information for each study site
Zamadueñas experimental station
Colmenar de Oreja experimental station
Altitude (m asl) 700 590Co-ordinates 41°42'N, 4°42'W 40°04'N, 3°31'WMean temp.a (°C) 10.73 13.01Max. mea n temp.a (°C) 17.45 21.45Min. mean temp.a (°C) 4.64 5.36Precipitationa (mm) 258.4 206.8Sowing date 24 November 2014 21 November 2014Harvest date 22 July 2015 20 July 2015Sowing density (seeds m−2)
250 250
Plot surface (m2) 10.5 (7 × 1.5) 10.5 (7 × 1.5)Irrigation providedb (mm) 125 180Fertilization First application 300 kg ha−1 NPK 8:15:15 400 kg ha−1 NPK 15:15:15 Second application 300 kg ha−1 CAN 27%N 150 kg ha−1 Urea 46%Soil texture Loam Clay-loamSoil pH 8.44 8.1
a During the growing season.b In the irrigated treatments.
Dow
nloaded from https://academ
ic.oup.com/jxb/article/69/12/3081/4957039 by guest on 13 M
arch 2022

3084 | Vergara-Díaz et al.
and were higher in the rainfed treatment. Finally, leaf reflect-ance from the end of the NIR region to the SWIR region (1300–1900 nm) was quite similar in both leaf sides, with the leaf reflectance being higher in the rainfed than in the irri-gated treatment.
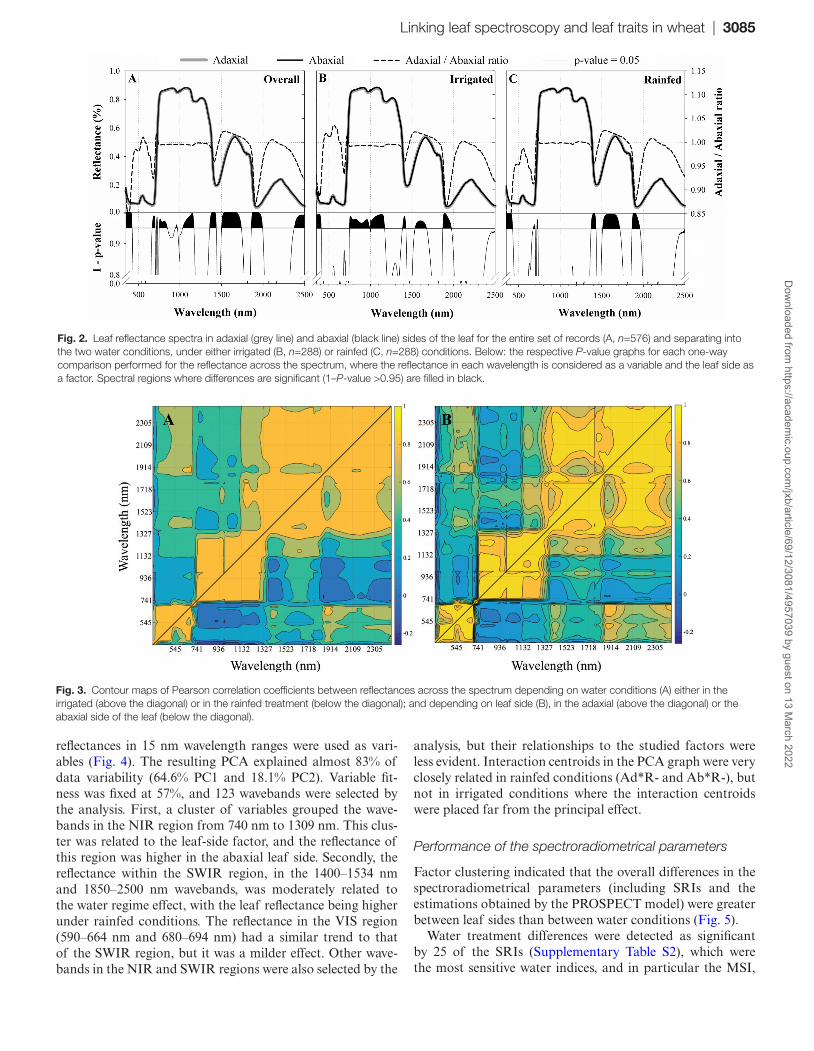
On the other hand, and regardless of the water condi-tions during cultivation, the reflectances of the adaxial and abaxial leaf surfaces were significantly different across sev-eral wavebands of the spectrum (Fig. 2a). In the violet region (350–425 nm), the abaxial reflectance was always significantly higher compared with the adaxial reflectance. In the red-edge region, abaxial reflectance was initially higher from 666 nm to 702 nm and then decreased significantly from 719 nm to 731 nm. Abaxial reflectance was always higher in the NIR plateau, and these differences were significant in the ranges of 752–850, 949–969, and 1035–1169 nm. Finally, in the SWIR region, adaxial reflectance was significantly higher from 1501 nm to 1739 nm and significantly lower from 1357 nm to 1437 nm, 1859 nm to 1994 nm, and 2377 nm to 2500 nm.
Additionally, differences in reflectance between leaf sides changed considerably within water regimes (Fig. 2b, c). The differences in the red-edge region between leaf sides were evident only under rainfed conditions (676–699 nm; 721–733 nm). In contrast, reflectance differences between leaf sides throughout the NIR plateau were present only under irrigated conditions (747–991 nm; 1000–1170 nm).
Additionally, four contour maps were generated of reflect-ance cross-correlations from across the spectrum (Fig. 3) with the aim of further investigating the intrinsic relationships of the waveband reflectances for each experimental condition. The following trends can be highlighted: cross-correlation coefficients were always higher in the adaxial side of the leaf than in the abaxial leaf side (i.e. wavebands were more closely correlated in the spectrum of the adaxial leaf side). Similarly, when water regimes were compared, higher correlation coef-ficients were always obtained under rainfed conditions.
Principal component analysis of reflectance ranges
To determine the most influential spectral ranges that accounted for data variability, a PCA was performed and
Fig. 1. Leaf reflectance spectra in irrigated (grey line) and rainfed (black line) water conditions for the entire set of records (A, n=576) and separated according to the leaf side measured, either in the adaxial (B, n=288) or in the abaxial (C) leaf side. Below: the respective P-value graphs for each of the one-way comparisons performed for the reflectance throughout the spectrum, where the reflectance in each wavelength is considered as a variable and the water regime as a factor. Spectral regions where differences are significant (1–P-value >0.95) are shaded in black.
Table 2. Means and deviations of grain yield, leaf blade length and width, leaf SPAD readings, leaf nitrogen and carbon concentration (%N and %C), and its ratio (C:N), grain and leaf stable carbon isotope composition (δ13C), and the canopy temperature depression (CTD) for each water regime (R+, irrigated; R–, rainfed) along with the significance level of the respective one-way ANOVA
Water regime ANOVA
R+ R– PWR
Grain y ield (Mg ha−1) 6.95 4.81 <0.0010.097 0.097
Leaf length (cm) 20.9 19.11 <0.0014.35 3.36
Leaf width (cm) 1.679 1.547 0.0380.484 0.257
SPAD reading 55.467 55.692 0.6995.189 4.621
Plot CTD (°C) 4.89 0.63 <0.0011.199 1.92
Leaf C (%) 40.13 40.42 0.4863.46 3.36
Leaf N (%) 4.045 3.893 <0.0010.362 0.385
Leaf C:N ratio 9.95 10.46 <0.0010.798 1.098
Leaf δ13C (‰) –28.1 –27.83 <0.001
0.635 0.472
Grain δ13C (‰) –26.16 –25.34 <0.001
0.494 1.18
Dow
nloaded from https://academ
ic.oup.com/jxb/article/69/12/3081/4957039 by guest on 13 M
arch 2022
Linking leaf spectroscopy and leaf traits in wheat | 3085
reflectances in 15 nm wavelength ranges were used as vari-ables (Fig. 4). The resulting PCA explained almost 83% of data variability (64.6% PC1 and 18.1% PC2). Variable fit-ness was fixed at 57%, and 123 wavebands were selected by the analysis. First, a cluster of variables grouped the wave-bands in the NIR region from 740 nm to 1309 nm. This clus-ter was related to the leaf-side factor, and the reflectance of this region was higher in the abaxial leaf side. Secondly, the reflectance within the SWIR region, in the 1400–1534 nm and 1850–2500 nm wavebands, was moderately related to the water regime effect, with the leaf reflectance being higher under rainfed conditions. The reflectance in the VIS region (590–664 nm and 680–694 nm) had a similar trend to that of the SWIR region, but it was a milder effect. Other wave-bands in the NIR and SWIR regions were also selected by the
analysis, but their relationships to the studied factors were less evident. Interaction centroids in the PCA graph were very closely related in rainfed conditions (Ad*R- and Ab*R-), but not in irrigated conditions where the interaction centroids were placed far from the principal effect.
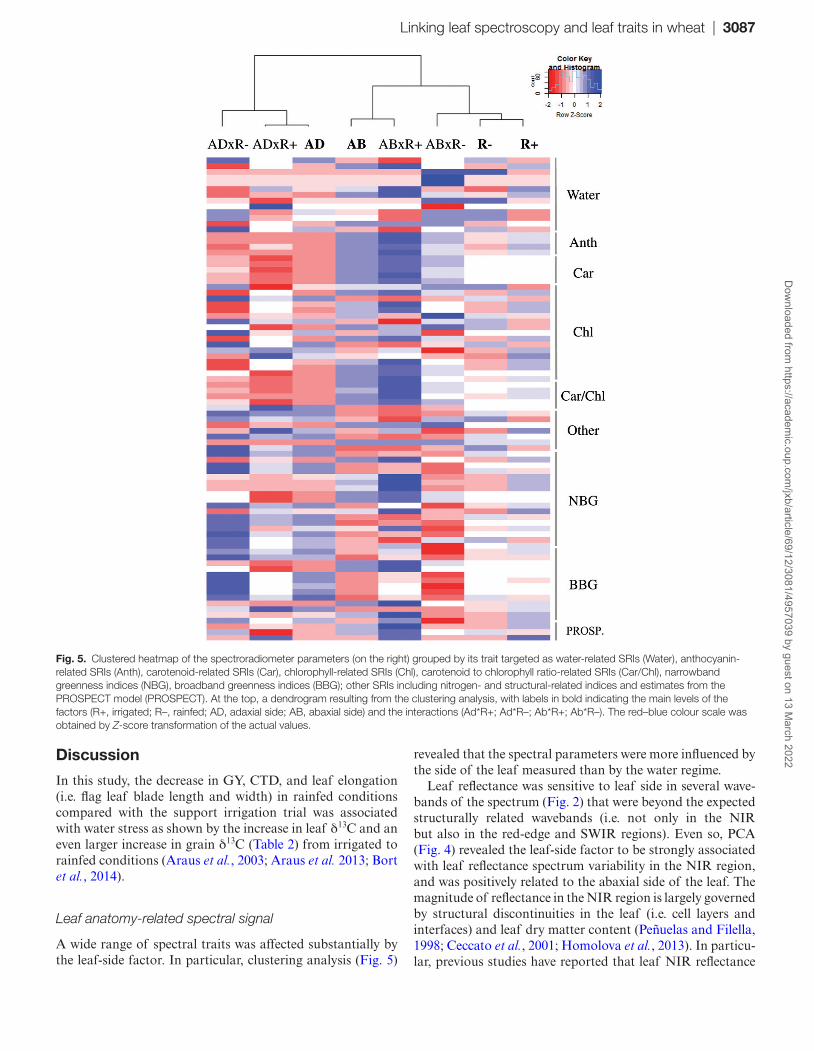
Performance of the spectroradiometrical parameters
Factor clustering indicated that the overall differences in the spectroradiometrical parameters (including SRIs and the estimations obtained by the PROSPECT model) were greater between leaf sides than between water conditions (Fig. 5).
Water treatment differences were detected as significant by 25 of the SRIs (Supplementary Table S2), which were the most sensitive water indices, and in particular the MSI,
Fig. 2. Leaf reflectance spectra in adaxial (grey line) and abaxial (black line) sides of the leaf for the entire set of records (A, n=576) and separating into the two water conditions, under either irrigated (B, n=288) or rainfed (C, n=288) conditions. Below: the respective P-value graphs for each one-way comparison performed for the reflectance across the spectrum, where the reflectance in each wavelength is considered as a variable and the leaf side as a factor. Spectral regions where differences are significant (1–P-value >0.95) are filled in black.
Fig. 3. Contour maps of Pearson correlation coefficients between reflectances across the spectrum depending on water conditions (A) either in the irrigated (above the diagonal) or in the rainfed treatment (below the diagonal); and depending on leaf side (B), in the adaxial (above the diagonal) or the abaxial side of the leaf (below the diagonal).
Dow
nloaded from https://academ
ic.oup.com/jxb/article/69/12/3081/4957039 by guest on 13 M
arch 2022

3086 | Vergara-Díaz et al.
NDII, NDWI, NMDI, and SWWI (P<0.001). Many other biochemical and structurally related indices (pigment, lignin, and nitrogen) such as ARI1, ARI2, NDNI, mDATT, NDLI, FRI (P<0.001), mCARI2, and MRCI (P<0.05) also varied significantly between water conditions. Finally, some red-edge indices including VREI1, VREI2 (P<0.01), and NDRE (P<0.05) were also shown to be sensitive to the water treat-ment factor.
Regarding the dorsoventral effect, 42 of the SRIs tested were sensitive to this factor. These SRIs mainly corresponded to biochemical, structural, and water indices, but also to some narrow and broadband greenness indices. The most robust differences between leaf sides were found by pigment-sensi-tive indices [Chl, Car, and anthocyanin (Anth)], and struc-tural and water-related indices (P<0.001).
The interaction between leaf side and water regime was sig-nificant for some indices (ARI, mARI, GATB, SIPI, NPCI, SRPI, and PSRI) whose formulation included a red-edge alongside a blue or green wavelength. In such cases, the vari-ation in these SRIs in response to water regime was clearly dependent on the side of the leaf.
Regarding the PROSPECT estimated leaf traits, only the EWT varied significantly between water regimes, and it was higher in the irrigated treatment.
Leaf anatomy
Leaf anatomy was studied in a subset of five genotypes with the aim of gaining insights into the relationship between leaf anatomy and spectral signature. The representativeness
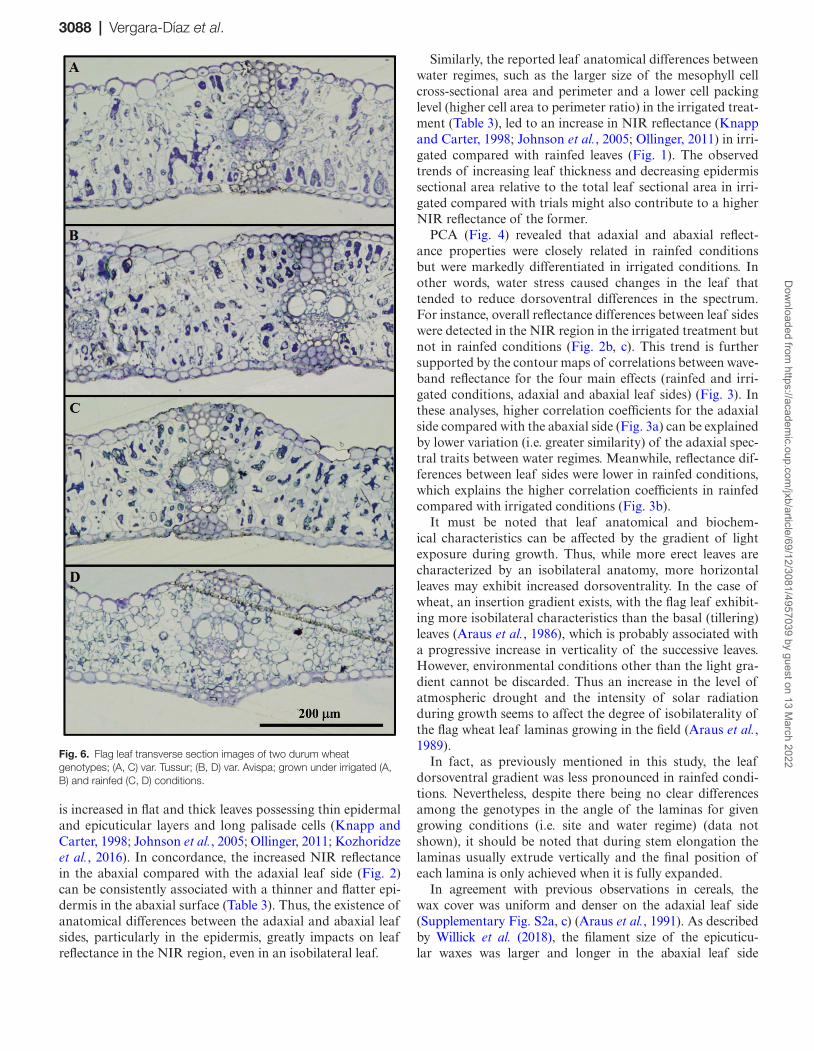
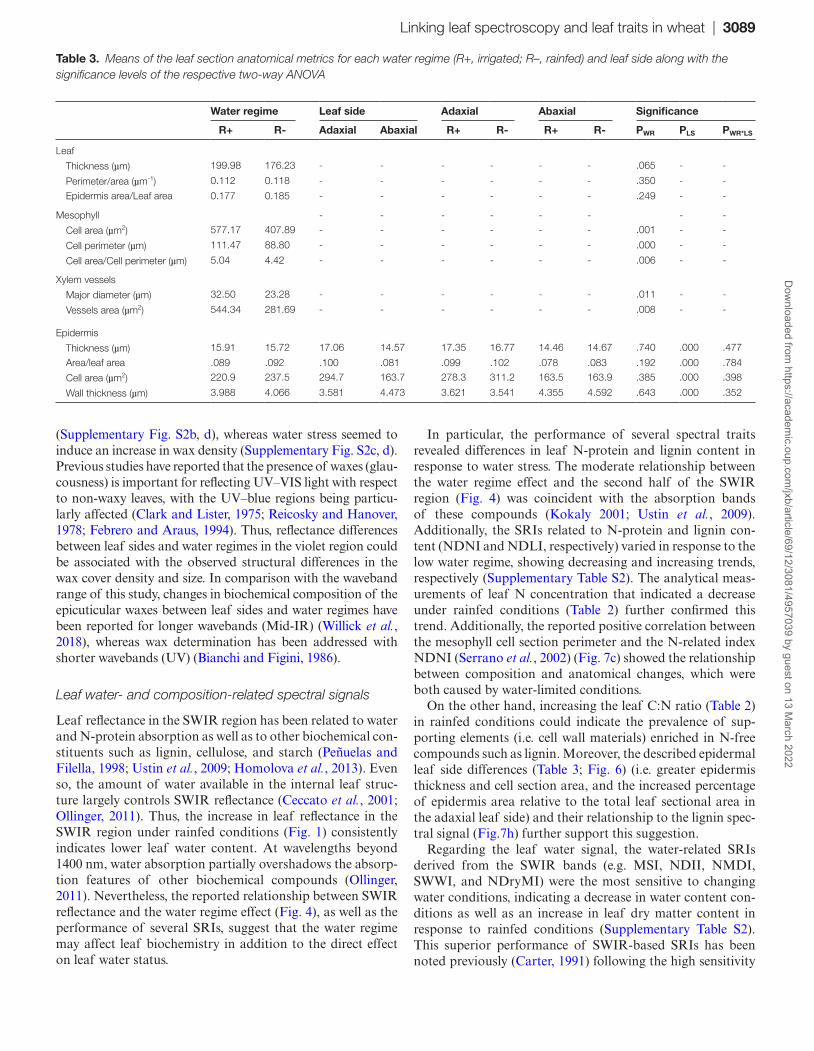
of the subset of samples used in the anatomical study was assessed by the respective performance of the SRIs. As in the main analysis presented here, water, nitrogen, and some pigment-related SRIs detected water regime differences for this subset of plots, while evidence for leaf side differences was mainly derived from pigment- and structure-related SRIs (Supplementary Table S3). Water stress induced significant decreases in xylem vessel cross-sectional area and diam-eter, and mesophyll cell cross-sectional area and perimeter, whereas the mesophyll cell cross-sectional area to perimeter ratio increased (Fig. 6; Table 3).
All the epidermal traits measured were significantly differ-ent between leaf sides, including the area of the epidermis cell section, the epidermis thickness, and the ratio of the epider-mis sectional area to the total leaf sectional area, which were higher in the adaxial epidermis, whereas the epidermis cell wall thickness was higher in the abaxial epidermis.
Additionally, a wide range of SRIs (water-, biochemical-, and structure-related indices) significantly correlated with several anatomical traits (Fig. 7). Mesophyll cell-sectional area and the mesophyll cell area to cell perimeter ratio cor-related positively with the water-related indices, NDWI and NDII, respectively (Fig. 7a, b). Meanwhile, the mesophyll cell sectional perimeter correlated positively with the N-related index, NDNI (Fig. 7c), and with the Chl-related index, RENDVI (Fig. 7d), whereas the ratio between the epidermis sectional area and the leaf sectional area correlated nega-tively with the Chl index, NPQI (Fig. 7e), and positively with the flavonol-related index, FRI, and with the lignin-related index, NDLI (Fig. 7f, h). Finally, the epidermis cell cross-sectional area correlated negatively with the Anth index, mARI (Fig. 6g).
Relationship between leaf and canopy spectra and their relationship to GY
The similarities between adaxial, abaxial, and canopy reflect-ance spectra were assessed with a PCA, setting the reflect-ance spectra as variables. The resulting two-component PCA (Supplementary Fig. S1) explained 94% of the variability (82.1% PC1 and 12.7% PC2). Measurements were distrib-uted in two parallel dot clouds, where the two leaf spectra were overlapping and parallel to that of the canopy. Leaf and canopy dot clouds were mainly separated by PC1, which was mostly dependent on R1900. In addition, from the collection of indices calculated, 74% of adaxial SRIs correlated signifi-cantly with the respective indices at the canopy level, whereas only 52% of abaxial SRIs correlated significantly with the respective canopy indices (data not shown).
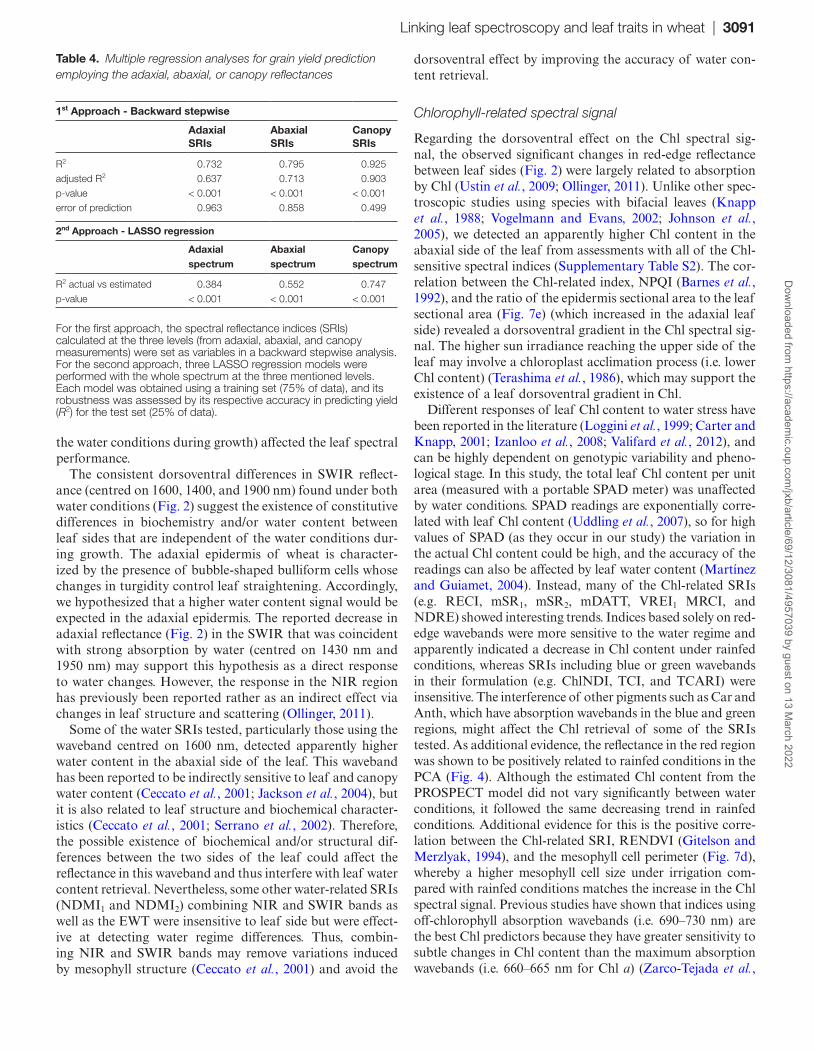
In order to test the leaf-side effect on the ability for yield prediction, two multiple regression models were performed: a LASSO analysis using the full-range reflectance spectrum and a backward multiple regression using the SRIs (Table 4). In both analyses, the explained variability was always higher when using canopy spectral data, followed by the abaxial models and lastly the adaxial models, all of them being sig-nificant (P<0.001).
Fig. 4. Principal component analysis of reflectances introduced as variables. Light green arrows correspond to wavebands belonging to the visible region, violet arrows correspond to wavebands in the NIR region, while dark green arrows correspond to wavebands in the SWIR region. Main levels of the factors (R+, irrigated; R–, rainfed; AD, adaxial side; AB, abaxial side) are represented as filled rhomboids, and interactions (Ad*R+; Ad*R–; Ab*R+; Ab*R–) are shown as empty triangles. The variables shown in the graph were those selected by fixing the fitness at 57%. Rλ corresponds to the reflectance at λ band.
Dow
nloaded from https://academ
ic.oup.com/jxb/article/69/12/3081/4957039 by guest on 13 M
arch 2022
Linking leaf spectroscopy and leaf traits in wheat | 3087
Discussion
In this study, the decrease in GY, CTD, and leaf elongation (i.e. flag leaf blade length and width) in rainfed conditions compared with the support irrigation trial was associated with water stress as shown by the increase in leaf δ13C and an even larger increase in grain δ13C (Table 2) from irrigated to rainfed conditions (Araus et al., 2003; Araus et al. 2013; Bort et al., 2014).
Leaf anatomy-related spectral signal
A wide range of spectral traits was affected substantially by the leaf-side factor. In particular, clustering analysis (Fig. 5)
revealed that the spectral parameters were more influenced by the side of the leaf measured than by the water regime.
Leaf reflectance was sensitive to leaf side in several wave-bands of the spectrum (Fig. 2) that were beyond the expected structurally related wavebands (i.e. not only in the NIR but also in the red-edge and SWIR regions). Even so, PCA (Fig. 4) revealed the leaf-side factor to be strongly associated with leaf reflectance spectrum variability in the NIR region, and was positively related to the abaxial side of the leaf. The magnitude of reflectance in the NIR region is largely governed by structural discontinuities in the leaf (i.e. cell layers and interfaces) and leaf dry matter content (Peñuelas and Filella, 1998; Ceccato et al., 2001; Homolova et al., 2013). In particu-lar, previous studies have reported that leaf NIR reflectance
Fig. 5. Clustered heatmap of the spectroradiometer parameters (on the right) grouped by its trait targeted as water-related SRIs (Water), anthocyanin-related SRIs (Anth), carotenoid-related SRIs (Car), chlorophyll-related SRIs (Chl), carotenoid to chlorophyll ratio-related SRIs (Car/Chl), narrowband greenness indices (NBG), broadband greenness indices (BBG); other SRIs including nitrogen- and structural-related indices and estimates from the PROSPECT model (PROSPECT). At the top, a dendrogram resulting from the clustering analysis, with labels in bold indicating the main levels of the factors (R+, irrigated; R–, rainfed; AD, adaxial side; AB, abaxial side) and the interactions (Ad*R+; Ad*R–; Ab*R+; Ab*R–). The red–blue colour scale was obtained by Z-score transformation of the actual values.
Dow
nloaded from https://academ
ic.oup.com/jxb/article/69/12/3081/4957039 by guest on 13 M
arch 2022
3088 | Vergara-Díaz et al.
is increased in flat and thick leaves possessing thin epidermal and epicuticular layers and long palisade cells (Knapp and Carter, 1998; Johnson et al., 2005; Ollinger, 2011; Kozhoridze et al., 2016). In concordance, the increased NIR reflectance in the abaxial compared with the adaxial leaf side (Fig. 2) can be consistently associated with a thinner and flatter epi-dermis in the abaxial surface (Table 3). Thus, the existence of anatomical differences between the adaxial and abaxial leaf sides, particularly in the epidermis, greatly impacts on leaf reflectance in the NIR region, even in an isobilateral leaf.
Similarly, the reported leaf anatomical differences between water regimes, such as the larger size of the mesophyll cell cross-sectional area and perimeter and a lower cell packing level (higher cell area to perimeter ratio) in the irrigated treat-ment (Table 3), led to an increase in NIR reflectance (Knapp and Carter, 1998; Johnson et al., 2005; Ollinger, 2011) in irri-gated compared with rainfed leaves (Fig. 1). The observed trends of increasing leaf thickness and decreasing epidermis sectional area relative to the total leaf sectional area in irri-gated compared with trials might also contribute to a higher NIR reflectance of the former.
PCA (Fig. 4) revealed that adaxial and abaxial reflect-ance properties were closely related in rainfed conditions but were markedly differentiated in irrigated conditions. In other words, water stress caused changes in the leaf that tended to reduce dorsoventral differences in the spectrum. For instance, overall reflectance differences between leaf sides were detected in the NIR region in the irrigated treatment but not in rainfed conditions (Fig. 2b, c). This trend is further supported by the contour maps of correlations between wave-band reflectance for the four main effects (rainfed and irri-gated conditions, adaxial and abaxial leaf sides) (Fig. 3). In these analyses, higher correlation coefficients for the adaxial side compared with the abaxial side (Fig. 3a) can be explained by lower variation (i.e. greater similarity) of the adaxial spec-tral traits between water regimes. Meanwhile, reflectance dif-ferences between leaf sides were lower in rainfed conditions, which explains the higher correlation coefficients in rainfed compared with irrigated conditions (Fig. 3b).
It must be noted that leaf anatomical and biochem-ical characteristics can be affected by the gradient of light exposure during growth. Thus, while more erect leaves are characterized by an isobilateral anatomy, more horizontal leaves may exhibit increased dorsoventrality. In the case of wheat, an insertion gradient exists, with the flag leaf exhibit-ing more isobilateral characteristics than the basal (tillering) leaves (Araus et al., 1986), which is probably associated with a progressive increase in verticality of the successive leaves. However, environmental conditions other than the light gra-dient cannot be discarded. Thus an increase in the level of atmospheric drought and the intensity of solar radiation during growth seems to affect the degree of isobilaterality of the flag wheat leaf laminas growing in the field (Araus et al., 1989).
In fact, as previously mentioned in this study, the leaf dorsoventral gradient was less pronounced in rainfed condi-tions. Nevertheless, despite there being no clear differences among the genotypes in the angle of the laminas for given growing conditions (i.e. site and water regime) (data not shown), it should be noted that during stem elongation the laminas usually extrude vertically and the final position of each lamina is only achieved when it is fully expanded.
In agreement with previous observations in cereals, the wax cover was uniform and denser on the adaxial leaf side (Supplementary Fig. S2a, c) (Araus et al., 1991). As described by Willick et al. (2018), the filament size of the epicuticu-lar waxes was larger and longer in the abaxial leaf side
Fig. 6. Flag leaf transverse section images of two durum wheat genotypes; (A, C) var. Tussur; (B, D) var. Avispa; grown under irrigated (A, B) and rainfed (C, D) conditions.
Dow
nloaded from https://academ
ic.oup.com/jxb/article/69/12/3081/4957039 by guest on 13 M
arch 2022
Linking leaf spectroscopy and leaf traits in wheat | 3089
(Supplementary Fig. S2b, d), whereas water stress seemed to induce an increase in wax density (Supplementary Fig. S2c, d). Previous studies have reported that the presence of waxes (glau-cousness) is important for reflecting UV–VIS light with respect to non-waxy leaves, with the UV–blue regions being particu-larly affected (Clark and Lister, 1975; Reicosky and Hanover, 1978; Febrero and Araus, 1994). Thus, reflectance differences between leaf sides and water regimes in the violet region could be associated with the observed structural differences in the wax cover density and size. In comparison with the waveband range of this study, changes in biochemical composition of the epicuticular waxes between leaf sides and water regimes have been reported for longer wavebands (Mid-IR) (Willick et al., 2018), whereas wax determination has been addressed with shorter wavebands (UV) (Bianchi and Figini, 1986).
Leaf water- and composition-related spectral signals
Leaf reflectance in the SWIR region has been related to water and N-protein absorption as well as to other biochemical con-stituents such as lignin, cellulose, and starch (Peñuelas and Filella, 1998; Ustin et al., 2009; Homolova et al., 2013). Even so, the amount of water available in the internal leaf struc-ture largely controls SWIR reflectance (Ceccato et al., 2001; Ollinger, 2011). Thus, the increase in leaf reflectance in the SWIR region under rainfed conditions (Fig. 1) consistently indicates lower leaf water content. At wavelengths beyond 1400 nm, water absorption partially overshadows the absorp-tion features of other biochemical compounds (Ollinger, 2011). Nevertheless, the reported relationship between SWIR reflectance and the water regime effect (Fig. 4), as well as the performance of several SRIs, suggest that the water regime may affect leaf biochemistry in addition to the direct effect on leaf water status.
In particular, the performance of several spectral traits revealed differences in leaf N-protein and lignin content in response to water stress. The moderate relationship between the water regime effect and the second half of the SWIR region (Fig. 4) was coincident with the absorption bands of these compounds (Kokaly 2001; Ustin et al., 2009). Additionally, the SRIs related to N-protein and lignin con-tent (NDNI and NDLI, respectively) varied in response to the low water regime, showing decreasing and increasing trends, respectively (Supplementary Table S2). The analytical meas-urements of leaf N concentration that indicated a decrease under rainfed conditions (Table 2) further confirmed this trend. Additionally, the reported positive correlation between the mesophyll cell section perimeter and the N-related index NDNI (Serrano et al., 2002) (Fig. 7c) showed the relationship between composition and anatomical changes, which were both caused by water-limited conditions.
On the other hand, increasing the leaf C:N ratio (Table 2) in rainfed conditions could indicate the prevalence of sup-porting elements (i.e. cell wall materials) enriched in N-free compounds such as lignin. Moreover, the described epidermal leaf side differences (Table 3; Fig. 6) (i.e. greater epidermis thickness and cell section area, and the increased percentage of epidermis area relative to the total leaf sectional area in the adaxial leaf side) and their relationship to the lignin spec-tral signal (Fig.7h) further support this suggestion.
Regarding the leaf water signal, the water-related SRIs derived from the SWIR bands (e.g. MSI, NDII, NMDI, SWWI, and NDryMI) were the most sensitive to changing water conditions, indicating a decrease in water content con-ditions as well as an increase in leaf dry matter content in response to rainfed conditions (Supplementary Table S2). This superior performance of SWIR-based SRIs has been noted previously (Carter, 1991) following the high sensitivity
Table 3. Means of the leaf section anatomical metrics for each water regime (R+, irrigated; R–, rainfed) and leaf side along with the significance levels of the respective two-way ANOVA
Water regime Leaf side Adaxial Abaxial Significance
R+ R- Adaxial Abaxial R+ R- R+ R- PWR PLS PWR*LS
Leaf
Thickness (µm) 199.98 176.23 - - - - - - .065 - -
Perimeter/area (µm-1) 0.112 0.118 - - - - - - .350 - -
Epidermis area/Leaf area 0.177 0.185 - - - - - - .249 - -
Mesophyll - - - - - - - -
Cell area (µm2) 577.17 407.89 - - - - - - .001 - -
Cell perimeter (µm) 111.47 88.80 - - - - - - .000 - -
Cell area/Cell perimeter (µm) 5.04 4.42 - - - - - - .006 - -
Xylem vessels
Major diameter (µm) 32.50 23.28 - - - - - - .011 - -
Vessels area (µm2) 544.34 281.69 - - - - - - .008 - -
Epidermis
Thickness (µm) 15.91 15.72 17.06 14.57 17.35 16.77 14.46 14.67 .740 .000 .477
Area/leaf area .089 .092 .100 .081 .099 .102 .078 .083 .192 .000 .784
Cell area (µm2) 220.9 237.5 294.7 163.7 278.3 311.2 163.5 163.9 .385 .000 .398
Wall thickness (µm) 3.988 4.066 3.581 4.473 3.621 3.541 4.355 4.592 .643 .000 .352
Dow
nloaded from https://academ
ic.oup.com/jxb/article/69/12/3081/4957039 by guest on 13 M
arch 2022

3090 | Vergara-Díaz et al.
of reflectance to leaf water content in the water-absorbing 1300–2500 nm range. In contrast, the use of the 970 nm sec-ondary water absorption band (which is included in indices such as WBI and NWI) was ineffective at the scale of the current work, although it has been reported as effective at the whole-plant and canopy scales (Peñuelas et al., 1997; Gutierrez et al., 2010). The PROSPECT EWT parameter proved to be robust, showing differences between water regimes.
In turn, for the subset of genotypes where leaf anatomy was studied, the observed variability in water-related indices, such as NDWI and NDII (Hardisky et al., 1983; Gao 1996), was strongly and positively correlated with the increase in the mesophyll cell size and the decrease in the mesophyll cell packing (i.e. mesophyll cell area to perimeter ratio) from the rainfed to the irrigated treatment (Fig. 7a, b). These results show that the variation in anatomical traits (in turn caused by
Fig. 7. Scatter plot graphs showing correlations between anatomical leaf section traits (EaLar, epidermis sectional area to leaf sectional area ratio; ECa, epidermis cell sectional area; MCa, mesophyll cell sectional area; MCp, mesophyll cell sectional perimeter; Mcapr, mesophyll cell sectional area to perimeter ratio) and spectral reflectance indices (the water-related indices NDWI and NDII; the nitrogen-related index NDNI; the chlorophyll-related indices RENDVI and NPQI; the flavonol-related index FRI; the anthocyanin-related index mARI, and the lignin-related index NDLI) for the subset of plots selected.
Dow
nloaded from https://academ
ic.oup.com/jxb/article/69/12/3081/4957039 by guest on 13 M
arch 2022
Linking leaf spectroscopy and leaf traits in wheat | 3091
the water conditions during growth) affected the leaf spectral performance.
The consistent dorsoventral differences in SWIR reflect-ance (centred on 1600, 1400, and 1900 nm) found under both water conditions (Fig. 2) suggest the existence of constitutive differences in biochemistry and/or water content between leaf sides that are independent of the water conditions dur-ing growth. The adaxial epidermis of wheat is character-ized by the presence of bubble-shaped bulliform cells whose changes in turgidity control leaf straightening. Accordingly, we hypothesized that a higher water content signal would be expected in the adaxial epidermis. The reported decrease in adaxial reflectance (Fig. 2) in the SWIR that was coincident with strong absorption by water (centred on 1430 nm and 1950 nm) may support this hypothesis as a direct response to water changes. However, the response in the NIR region has previously been reported rather as an indirect effect via changes in leaf structure and scattering (Ollinger, 2011).
Some of the water SRIs tested, particularly those using the waveband centred on 1600 nm, detected apparently higher water content in the abaxial side of the leaf. This waveband has been reported to be indirectly sensitive to leaf and canopy water content (Ceccato et al., 2001; Jackson et al., 2004), but it is also related to leaf structure and biochemical character-istics (Ceccato et al., 2001; Serrano et al., 2002). Therefore, the possible existence of biochemical and/or structural dif-ferences between the two sides of the leaf could affect the reflectance in this waveband and thus interfere with leaf water content retrieval. Nevertheless, some other water-related SRIs (NDMI1 and NDMI2) combining NIR and SWIR bands as well as the EWT were insensitive to leaf side but were effect-ive at detecting water regime differences. Thus, combin-ing NIR and SWIR bands may remove variations induced by mesophyll structure (Ceccato et al., 2001) and avoid the
dorsoventral effect by improving the accuracy of water con-tent retrieval.
Chlorophyll-related spectral signal
Regarding the dorsoventral effect on the Chl spectral sig-nal, the observed significant changes in red-edge reflectance between leaf sides (Fig. 2) were largely related to absorption by Chl (Ustin et al., 2009; Ollinger, 2011). Unlike other spec-troscopic studies using species with bifacial leaves (Knapp et al., 1988; Vogelmann and Evans, 2002; Johnson et al., 2005), we detected an apparently higher Chl content in the abaxial side of the leaf from assessments with all of the Chl-sensitive spectral indices (Supplementary Table S2). The cor-relation between the Chl-related index, NPQI (Barnes et al., 1992), and the ratio of the epidermis sectional area to the leaf sectional area (Fig. 7e) (which increased in the adaxial leaf side) revealed a dorsoventral gradient in the Chl spectral sig-nal. The higher sun irradiance reaching the upper side of the leaf may involve a chloroplast acclimation process (i.e. lower Chl content) (Terashima et al., 1986), which may support the existence of a leaf dorsoventral gradient in Chl.
Different responses of leaf Chl content to water stress have been reported in the literature (Loggini et al., 1999; Carter and Knapp, 2001; Izanloo et al., 2008; Valifard et al., 2012), and can be highly dependent on genotypic variability and pheno-logical stage. In this study, the total leaf Chl content per unit area (measured with a portable SPAD meter) was unaffected by water conditions. SPAD readings are exponentially corre-lated with leaf Chl content (Uddling et al., 2007), so for high values of SPAD (as they occur in our study) the variation in the actual Chl content could be high, and the accuracy of the readings can also be affected by leaf water content (Martínez and Guiamet, 2004). Instead, many of the Chl-related SRIs (e.g. RECI, mSR1, mSR2, mDATT, VREI1 MRCI, and NDRE) showed interesting trends. Indices based solely on red-edge wavebands were more sensitive to the water regime and apparently indicated a decrease in Chl content under rainfed conditions, whereas SRIs including blue or green wavebands in their formulation (e.g. ChlNDI, TCI, and TCARI) were insensitive. The interference of other pigments such as Car and Anth, which have absorption wavebands in the blue and green regions, might affect the Chl retrieval of some of the SRIs tested. As additional evidence, the reflectance in the red region was shown to be positively related to rainfed conditions in the PCA (Fig. 4). Although the estimated Chl content from the PROSPECT model did not vary significantly between water conditions, it followed the same decreasing trend in rainfed conditions. Additional evidence for this is the positive corre-lation between the Chl-related SRI, RENDVI (Gitelson and Merzlyak, 1994), and the mesophyll cell perimeter (Fig. 7d), whereby a higher mesophyll cell size under irrigation com-pared with rainfed conditions matches the increase in the Chl spectral signal. Previous studies have shown that indices using off-chlorophyll absorption wavebands (i.e. 690–730 nm) are the best Chl predictors because they have greater sensitivity to subtle changes in Chl content than the maximum absorption wavebands (i.e. 660–665 nm for Chl a) (Zarco-Tejada et al.,
Table 4. Multiple regression analyses for grain yield prediction employing the adaxial, abaxial, or canopy reflectances
1st Approach - Backward stepwise
AdaxialSRIs
AbaxialSRIs
CanopySRIs
R2 0.732 0.795 0.925adjusted R2 0.637 0.713 0.903p-value < 0.001 < 0.001 < 0.001error of prediction 0.963 0.858 0.499
2nd Approach - LASSO regression
Adaxialspectrum
Abaxialspectrum
Canopyspectrum
R2 actual vs estimated 0.384 0.552 0.747p-value < 0.001 < 0.001 < 0.001
For the first approach, the spectral reflectance indices (SRIs) calculated at the three levels (from adaxial, abaxial, and canopy measurements) were set as variables in a backward stepwise analysis. For the second approach, three LASSO regression models were performed with the whole spectrum at the three mentioned levels. Each model was obtained using a training set (75% of data), and its robustness was assessed by its respective accuracy in predicting yield (R2) for the test set (25% of data).
Dow
nloaded from https://academ
ic.oup.com/jxb/article/69/12/3081/4957039 by guest on 13 M
arch 2022
3092 | Vergara-Díaz et al.
2003; Main et al., 2011). Altogether these results suggest a decreasing trend in leaf Chl content under rainfed conditions, with its level of significance depending on the sensitivity of the detection of the spectral parameter (i.e. SPAD meter, SRIs, PROSPECT model).
Photoprotection-related spectral signal
Besides leaf Chl, the leaf Car and Anth contents are also usu-ally targeted because of their ecophysiological significance (Close and Beadle, 2003; Ustin et al., 2009). Under stress conditions, Cars function to prevent photooxidation of the reaction centres (Ustin et al., 2009), while Anths have an anti-oxidant and photoprotective role, besides acting as osmoreg-ulators in plant cells (Chalker-Scott, 1999; Steyn et al., 2002; Gould et al., 2002).
Regarding dorsoventrality effects, all Car- and Anth-related SRIs, as well as those related to the Car:Chl ratio, indicated a higher Car and Anth content and Car:Chl ratio in the abax-ial leaf side (Supplementary Table S2), suggesting a prevail-ing photoprotective role for the abaxial side of the leaf. The reported negative correlation between the Anth-related index, mARI (Gitelson et al., 2001), and the epidermis cell sectional area (Fig. 7g) suggests the existence of an anatomy-driven dorsoventral gradient in Anth content. In agreement with this, Cartelat et al. (2005) reported higher leaf phenolic con-tent, which includes Anth, in the abaxial side of wheat leaves measured with a portable device (Dualex meter). As reported by Shi et al. (2014), this might indicate that the upper part of wheat leaves exhibits greater light use efficiency via lower energy dissipation and photoinhibition. Although the Car estimation by PROSPECT performed similarly to the Car-related SRIs, the differences were not significant. This robust but conservative performance of the PROSPECT parameters may be explained by the large range of leaf pigment con-centrations (i.e. wide range of species and conditions) used for the development of the PROSPECT model (Feret et al., 2008). Finally, the results in the flavonol-related index (FRI) (Merzlyak et al., 2005) suggested a possible higher flavonol content in the adaxial leaf side (Supplementary Table S2). It is worth pointing out that this index was originally developed for apple fruit, where Car and Chl contents do not interfere as much as in leaves. Flavonols are considered to have a pho-toprotective role as UV-absorbing compounds (Mazza et al., 2000), so a possible higher concentration in the upper side of the leaf (i.e. the more exposed to sunlight) (Fig. 7f) may indi-cate an ecophysiological relevance for them as photoprotec-tors instead of Anth.
Regarding the water regime effect on photoprotective compounds, Car-related indices were unaffected, and Anth-related indices decreased under rainfed conditions, whereas the flavonol-related SRI increased (Supplementary Table S2). The performance of leaf Cars and Anths in response to water stress is quite variable according to the literature (Alexieva et al., 2001; Chakraborty and Pradhan, 2012; Valifard et al., 2012; Hammad and Ali, 2014). Accumulation of flavonols in the leaves has been reported in wheat in response to water stress and especially in drought-tolerant varieties (Ma et al.,
2014). In addition to the photoprotective function mentioned before, previous studies have suggested that flavonols act as antioxidants in plants (Hernández et al., 2009), accumulating in different compartments such as the leaf epidermis (Tevini et al., 1991). In this context, the increase in the ratio of the epidermis section area to the leaf section area (in the adax-ial compared with the abaxial leaf side and in rainfed com-pared with irrigation conditions), which correlated positively with FRI (Fig. 7f), suggested an anatomy-mediated increase in leaf flavonols in response to water stress and to high sun-light levels. These results support the implementation of SRIs related to drought tolerance metabolites for plant stress stud-ies and breeding purposes.
Main ideas and some insights into the scaling effect and yield prediction
Overall, the detailed study of leaf reflectance and several spectral-derived parameters revealed significant differences between the two sides of the leaf, which in turn are highly dependent on water regime, particularly under irrigated condi-tions. For instance, the significant interactions between dorso-ventral and water regime effects in some of the Car:Chl- and Anth-related indices (Fig. 5; Supplementary Table S2) sug-gest possible side-specific photochemical changes in response to water regime. Previous studies in monocots (Soares et al., 2008; Soares-Cordeiro et al., 2011) have reported that side-specific physiological responses are involved in leaf acclima-tion to environmental stresses. In our study, the following tentative trend is hypothesized: in well-watered conditions, the two sides of the leaf are more differentiated, with the adaxial part of the leaf being photosynthetically more effi-cient (having a lower Car:Chl and Anth), larger epidermal and mesophyll cells, and a thicker epidermis. However, water stress induces alterations in structural, pigment, and photo-protective compounds that tend to reduce dorsoventral dif-ferences (functioning) of both leaf sides and consequently the spectroradiometrical response of reflected light. To the best of our knowledge, this is the first study describing a leaf-side-specific response to water regime in wheat using a spectro-scopic approach.
The classical approaches for multispectral remote sensing evaluation of leaf and vegetation traits have usually been developed using the reflectance spectrum from the adaxial side of the leaves (Jacquemoud and Baret, 1990; Sims and Gamon, 2002; Lu and Lu, 2015). Although the adaxial leaf spectrum appeared to be more representative of the canopy-level data, the prediction of grain yield was clearly enhanced when abaxial rather than adaxial reflectance is employed, and this was irrespective of whether the full-range spectra or sin-gle SRIs were used (Table 4). Therefore, this study reveals that even for a species, such as wheat, with isobilateral leaves, spec-tra are different, and this may affect the assessment of yield.
Apart from constitutive differences, some anatomical traits of the abaxial leaf side (the epidermis thickness and the epidermis cell area) seemed to be less affected by changing water conditions than the adaxial side. This greater struc-tural homogeneity across the abaxial leaf blade surface may
Dow
nloaded from https://academ
ic.oup.com/jxb/article/69/12/3081/4957039 by guest on 13 M
arch 2022

Linking leaf spectroscopy and leaf traits in wheat | 3093
provide a less noisy spectral signal and better suitability for the prediction of yield from spectroscopy compared with the adaxial leaf side.
Supplementary data
Supplementary data are available at JXB online.Fig. S1. Principal component analysis of reflectances at the
leaf and canopy levels.Fig. S2. Scanning electron micrographs of the epicuticular
ultrastructure of flag leaves.Table S1. Information on the spectral parameters used in
this study.Table S2. Table of means and significance of the two-way
ANOVA for the spectral parameters.Table S3. Significance of the two-way ANOVA of spectral
indices for a subset of plots.
AcknowledgementsThis study was supported by the Spanish project AGL2016-76527-R, MINECO. We thank the Goetz Instrument Program from the ASD PANalytical Company for providing us with the FieldSpec4 spectrometer. SCK is a recipient of a post-doctoral research grant (Juan de la Cierva IJCI-2014-20595) sponsored by MINECO. OVD is a recipient of a doctoral research grant (APIF) sponsored by the University of Barcelona.
ReferencesAlexieva V, Sergiev I, Mapelli S, Karanov E. 2001. The effect of drought and ultraviolet radiation on growth and stress markers in pea and wheat. Plant, Cell and Environment 24, 1337–1344.
Araus JL, Alegre L, Tapia L, Calafell R. 1986. Relationship between leaf structure and gas exchange in wheat leaves at different insertion levels. Journal of Experimental Botany 37, 1323–1333.
Araus JL, Amaro T, Zuhair Y, Nachit MM. 1997. Effect of leaf structure and water status on carbon isotope discrimination in field-grown durum wheat. Plant, Cell and Environment 20, 1484–1494.
Araus JL, Cabrera-Bosquet L, Serret MD, Bort J, Nieto-Taladriz MT. 2013. Comparative performance of δ13C, δ18O and δ15N for phenotyping durum wheat adaptation to a dryland environment. Functional Plant Biology 40, 595–608.
Araus JL, Febrero A, Vendrell P. 1991. Epidermal conductance in different parts of durum wheat grown under Mediterranean conditions: the role of epicuticular waxes and stomata. Plant, Cell and Environment 14, 545–558.
Araus JL, Tapia L, Alegre L. 1989. The effect of changing sowing date on leaf structure and gas exchange characteristics of wheat flag leaves grown under Mediterranean climate conditions. Journal of Experimental Botany 40, 639–646.
Araus JL, Villegas D, Aparicio N, del Moral LFG, El Hani S, Rharrabti Y, Ferrio JP, Royo C. 2003. Environmental factors determining carbon isotope discrimination and yield in durum wheat under Mediterranean conditions. Crop Science 43, 170–180.
Barnes JD, Balaguer L, Manrique E, Elvira S, Davison AW. 1992. A reappraisal of the use of DMSO for the extraction and determination of chlorophylls a and b in lichens and higher plants. Environmental and Experimental Botany 32, 85–100.
Bianchi G, Figini ML. 1986. Epicuticular waxes of glaucous and nonglaucous durum wheat lines. Journal of Agricultural and Food Chemistry 34, 429–433.
Bort J, Belhaj M, Latiri K, Kehel Z, Araus JL. 2014. Comparative performance of the stable isotope signatures of carbon, nitrogen and
oxygen in assessing early vigour and grain yield in durum wheat. Journal of Agricultural Science 152, 408–426.
Broge NH, Leblanc E. 2001. Comparing prediction power and stability of broadband and hyperspectral vegetation indices for estimation of green leaf area index and canopy chlorophyll density. Remote Sensing of Environment 76, 156–172.
Cartelat A, Cerovic ZG, Goulas Y, et al. 2005. Optically assessed contents of leaf polyphenolics and chlorophyll as indicators of nitrogen deficiency in wheat (Triticum aestivum L.). Field Crops Research 91, 35–49.
Carter GA. 1991. Primary and secondary effects of water content on the spectral reflectance of leaves. American Journal of Botany 78, 916–924.
Carter GA, Knapp AK. 2001. Leaf optical properties in higher plants: linking spectral characteristics to stress and chlorophyll concentration. American Journal of Botany 88, 677–684.
Ceccato P, Flasse S, Tarantola S, Jacquemoud S, Grégoire JM. 2001. Detecting vegetation leaf water content using reflectance in the optical domain. Remote Sensing of Environment 77, 22–33.
Chakraborty U, Pradhan B. 2012. Oxidative stress in five wheat varieties (Triticum aestivum L.) exposed to water stress and study of their antioxidant enzyme defense system, water stress responsive metabolites and H2O2 accumulation. Brazilian Journal of Plant Physiology 24, 117–130.
Chalker-Scott L. 1999. Environmental significance of anthocyanins in plant stress responses. Photochemistry and Photobiology 70, 1–9.
Clark JB, Lister GR. 1975. Photosynthetic action spectra of trees: II. The relationship of cuticle structure to the visible and ultraviolet spectral properties of needles from four coniferous species. Plant Physiology 55, 407–413.
Close DC, Beadle CL. 2003. The ecophysiology of foliar anthocyanin. Botanical Review 69, 149–161.
Evans JR. 1999. Leaf anatomy enables more equal access to light and CO2 between chloroplasts. New Phytologist 143, 93–104.
Febrero A, Araus JL. 1994. Epicuticular wax load of near-isogenic barley lines differing in glaucousness. Scanning Microscopy 8, 735–748.
Feret JB, François C, Asner GP, Gitelson AA, Martin RE, Bidel LP, Ustil SL, le Marie G, Jacquemoud S. 2008. PROSPECT-4 and 5: advances in the leaf optical properties model separating photosynthetic pigments. Remote Sensing of Environment 112, 3030–3043.
Flexas J, Bota J, Galmes J, Medrano H, Ribas-Carbó M. 2006. Keeping a positive carbon balance under adverse conditions: responses of photosynthesis and respiration to water stress. Physiologia Plantarum 127, 343–352.
Friedman J, Hastie T, Tibshirani R. 2010. Regularization paths for generalized linear models via coordinate descent. Journal of Statistical Software 33, 1–22.
Gao BC. 1996. NDWI—a normalized difference water index for remote sensing of vegetation liquid water from space. Remote Sensing of Environment 58, 257–266.
Gitelson A, Merzlyak MN. 1994. Spectral reflectance changes associated with autumn senescence of Aesculus hippocastanum L. and Acer platanoides L. leaves. Spectral features and relation to chlorophyll estimation. Journal of Plant Physiology 143, 286–292.
Gitelson AA, Merzlyak MN, Chivkunova OB. 2001. Optical properties and nondestructive estimation of anthocyanin content in plant leaves. Photochemistry and Photobiology 74, 38–45.
Gould KS, Neill SO, Vogelmann TC. 2002. A unified explanation for anthocyanins in leaves? Advances in Botanical Research 37, 167–192.
Gutierrez M, Reynolds MP, Raun WR, Stone ML, Klatt AR. 2010. Spectral water indices for assessing yield in elite bread wheat genotypes under well-irrigated, water-stressed, and high-temperature conditions. Crop Science 50, 197–214.
Hammad SA, Ali OA. 2014. Physiological and biochemical studies on drought tolerance of wheat plants by application of amino acids and yeast extract. Annals of Agricultural Sciences 59, 133–145.
Hardisky MA, Smart RM, Klemas V. 1983. Growth response and spectral characteristics of a short Spartina alterniflora salt marsh irrigated with freshwater and sewage effluent. Remote Sensing of Environment 13, 57–67.
Dow
nloaded from https://academ
ic.oup.com/jxb/article/69/12/3081/4957039 by guest on 13 M
arch 2022

3094 | Vergara-Díaz et al.
Hernández I, Alegre L, Van Breusegem F, Munné-Bosch S. 2009. How relevant are flavonoids as antioxidants in plants? Trends in Plant Science 14, 125–132.
Homolova L, Malenovský Z, Clevers JG, García-Santos G, Schaepman ME. 2013. Review of optical-based remote sensing for plant trait mapping. Ecological Complexity 15, 1–16.
Izanloo A, Condon AG, Langridge P, Tester M, Schnurbusch T. 2008. Different mechanisms of adaptation to cyclic water stress in two South Australian bread wheat cultivars. Journal of Experimental Botany 59, 3327–3346.
Jackson TJ, Chen D, Cosh M, Li F, Anderson M, Walthall C, Doriaswamy P, Hunt ER. 2004. Vegetation water content mapping using Landsat data derived normalized difference water index for corn and soybeans. Remote Sensing of Environment 92, 475–482.
Jacquemoud S, Baret F. 1990. PROSPECT: a model of leaf optical properties spectra. Remote Sensing of Environment 34, 75–91.
Jafarian T, Maghsoudi Moud A, Saffari VR. 2012. Water stress effects on winter and spring leaves anatomy of different wheat (Triticum aestivum L.) genotypes. Journal of Plant Physiology and Breeding 2, 23–34.
Johnson DM, Smith WK, Vogelmann TC, Brodersen CR. 2005. Leaf architecture and direction of incident light influence mesophyll fluorescence profiles. American Journal of Botany 92, 1425–1431.
Knapp AK, Vogelmann TC, McClean TM, Smith WK. 1988. Light and chlorophyll gradients within Cucurbita cotyledons. Plant, Cell and Environment 11, 257–263.
Knapp A, Carter G. 1998. Variability in leaf optical properties among 26 species from a broad range of habitats. American Journal of Botany 85, 940.
Kokaly RF. 2001. Investigating a physical basis for spectroscopic estimates of leaf nitrogen concentration. Remote Sensing of Environment 75, 153–161.
Kozhoridze G, Orlovsky N, Orlovsky L, Blumberg DG, Golan-Goldhirsh A. 2016. Remote sensing models of structure-related biochemicals and pigments for classification of trees. Remote Sensing of Environment 186, 184–195.
Liu HQ, Huete A. 1995. A feedback based modification of the NDVI to minimize canopy background and atmospheric noise. IEEE Transactions on Geoscience and Remote Sensing 33, 457–465.
Loggini B, Scartazza A, Brugnoli E, Navari-Izzo F. 1999. Antioxidative defense system, pigment composition, and photosynthetic efficiency in two wheat cultivars subjected to drought. Plant Physiology 119, 1091–1100.
Lu X, Lu S. 2015. Effects of adaxial and abaxial surface on the estimation of leaf chlorophyll content using hyperspectral vegetation indices. International Journal of Remote Sensing 36, 1447–1469.
Lu S, Lu X, Zhao W, Liu Y, Wang Z, Omasa K. 2015. Comparing vegetation indices for remote chlorophyll measurement of white poplar and Chinese elm leaves with different adaxial and abaxial surfaces. Journal of Experimental Botany 66, 5625–5637.
Ma D, Sun D, Wang C, Li Y, Guo T. 2014. Expression of flavonoid biosynthesis genes and accumulation of flavonoid in wheat leaves in response to drought stress. Plant Physiology and Biochemistry 80, 60–66.
Main R, Cho MA, Mathieu R, O’Kennedy MM, Ramoelo A, Koch S. 2011. An investigation into robust spectral indices for leaf chlorophyll estimation. ISPRS Journal of Photogrammetry and Remote Sensing 66, 751–761.
Martínez D, Guiamet J. 2004. Distortion of the SPAD 502 chlorophyll meter readings by changes in irradiance and leaf water status. Agronomie 24, 41–46.
Mazza CA, Boccalandro HE, Giordano CV, Battista D, Scopel AL, Ballaré CL. 2000. Functional significance and induction by solar radiation of ultraviolet-absorbing sunscreens in field-grown soybean crops. Plant Physiology 122, 117–126.
Merzlyak MN, Solovchenko AE, Smagin AI, Gitelson AA. 2005. Apple flavonols during fruit adaptation to solar radiation: spectral features and technique for non-destructive assessment. Journal of Plant Physiology 162, 151–160.
Ollinger SV. 2011. Sources of variability in canopy reflectance and the convergent properties of plants. New Phytologist 189, 375–394.
Peñuelas J, Filella I. 1998. Visible and near-infrared reflectance techniques for diagnosing plant physiological status. Trends in Plant Science 3, 151–156.
Peñuelas J, Pinol J, Ogaya R, Filella I. 1997. Estimation of plant water concentration by the reflectance water index WI (R900/R970). International Journal of Remote Sensing 18, 2869–2875.
Reicosky DA, Hanover JW. 1978. Physiological effects of surface waxes: I. Light reflectance for glaucous and nonglaucous Picea pungens. Plant Physiology 62, 101–104.
Ripley B, Venables B, Bates DM, Hornik K, Gebhardt A, Firth D, Ripley MB. 2013. Package ‘MASS’. CRAN R..
Serrano L, Peñuelas J, Ustin SL. 2002. Remote sensing of nitrogen and lignin in Mediterranean vegetation from AVIRIS data: decomposing biochemical from structural signals. Remote Sensing of Environment 81, 355–364.
Shi SB, Chen WJ, Shi R, Li M, Zhang HG, Sun YN. 2014. PS II photochemical efficiency in flag leaf of wheat varieties and its adaptation to strong sun-light intensity on farmland of Xiangride in Qinghai Province, Northwest China. The Journal of Applied Ecology 25, 2613–2622.
Sims DA, Gamon JA. 2002. Relationships between leaf pigment content and spectral reflectance across a wide range of species, leaf structures and developmental stages. Remote Sensing of Environment 81, 337–354.
Soares AS, Driscoll SP, Olmos E, Harbinson J, Arrabaça MC, Foyer CH. 2008. Adaxial/abaxial specification in the regulation of photosynthesis and stomatal opening with respect to light orientation and growth with CO2 enrichment in the C4 species Paspalum dilatatum. New Phytologist 177, 186–198.
Soares-Cordeiro AS, Driscoll SP, Arrabaça MC, Foyer CH. 2011. Dorsoventral variations in dark chilling effects on photosynthesis and stomatal function in Paspalum dilatatum leaves. Journal of Experimental Botany 62, 687–699.
Steyn WJ, Wand SJE, Holcroft DM, Jacobs G. 2002. Anthocyanins in vegetative tissues: a proposed unified function in photoprotection. New Phytologist 155, 349–361.
Taylor BR, Parkinson D, Parsons WF. 1989. Nitrogen and lignin content as predictors of litter decay rates: a microcosm test. Ecology 70, 97–104.
Ter Braak CJ, Smilauer P. 2002. CANOCO reference manual and CanoDraw for Windows user’s guide: software for canonical community ordination (version 4.5). http://library.wur.nl/WebQuery/wurpubs/fulltext/405659. Accessed 17 March 2017.
Terashima I, Sakaguchi S, Hara N. 1986. Intra-leaf and intracellular gradients in chloroplast ultrastructure of dorsiventral leaves illuminated from the adaxial or abaxial side during their development. Plant and Cell Physiology 27, 1023–1031.
Tevini M, Braun J, Fieser G. 1991. The protective function of the epidermal layer of rye seedlings against ultraviolet-B radiation. Photochemistry and Photobiology 53, 329–333.
Uddling J, Gelang-Alfredsson J, Piikki K, Pleijel H. 2007. Evaluating the relationship between leaf chlorophyll concentration and SPAD-502 chlorophyll meter readings. Photosynthesis Research 91, 37–46.
Ustin SL, Gitelson AA, Jacquemoud S, Schaepman M, Asner GP, Gamon JA, Zarco-Tejada P. 2009. Retrieval of foliar information about plant pigment systems from high resolution spectroscopy. Remote Sensing of Environment 113, 67–77.
Valifard M, Moradshahi A, Kholdebarin B. 2012. Biochemical and physiological responses of two wheat (Triticum aestivum L.) cultivars to drought stress applied at seedling stage. Journal of Agricultural Science and Technology 14, 1567–1578.
Vogelmann TC, Evans JR. 2002. Profiles of light absorption and chlorophyll within spinach leaves from chlorophyll fluorescence. Plant, Cell and Environment 25, 1313–1323.
Wang XQ, Wu WH, Assmann SM. 1998. Differential responses of abaxial and adaxial guard cells of broad bean to abscisic acid and calcium. Plant Physiology 118, 1421–1429.
Warnes GR, Bolker B, Bonebakker L, et al. 2009. gplots: various R programming tools for plotting data. R package version, 2(4).
Willick IR, Lahlali R, Vijayan P, Muir D, Karunakaran C, Tanino KK. 2018. Wheat flag leaf epicuticular wax morphology and composition response to moderate drought stress is revealed by SEM, FTIR-ATR and synchrotron X-ray spectroscopy. Physiologia Plantarum 62, 316–332.
Xue J, Su B. 2017. Significant remote sensing vegetation indices: a review of developments and applications. Journal of Sensors 2017, 1353691.
Yousfi S, Serret MD, Márquez AJ, Voltas J, Araus JL. 2012. Combined use of δ¹³C, δ18O and δ15N tracks nitrogen metabolism and genotypic adaptation of durum wheat to salinity and water deficit. New Phytologist 194, 230–244.
Zarco-Tejada PJ, Pushnik JC, Dobrowski S, Ustin SL. 2003. Steady-state chlorophyll a fluorescence detection from canopy derivative reflectance and double-peak red-edge effects. Remote Sensing of Environment 84, 283–294.
Dow
nloaded from https://academ
ic.oup.com/jxb/article/69/12/3081/4957039 by guest on 13 M
arch 2022