dvab002.pdf - Oxford Academic
17
RESEARCH ARTICLE Differential DNA methylation in somatic and sperm cells of hatchery vs wild (natural-origin) steelhead trout populations Eric Nilsson, Ingrid Sadler-Riggleman, Daniel Beck and Michael K. Skinner * Center for Reproductive Biology, School of Biological Sciences, Washington State University, Pullman, WA 99164-4236, USA *Correspondence address. Center for Reproductive Biology, School of Biological Sciences, Washington State University, Pullman, WA 99164-4236, USA. Tel: þ1-509-335-1524; E-mail: [email protected] Managing Editor: Isabelle Mansuy Abstract Environmental factors such as nutrition, stress, and toxicants can influence epigenetic programming and phenotypes of a wide variety of species from plants to humans. The current study was designed to investigate the impacts of hatchery spawning and rearing on steelhead trout (Oncorhynchus mykiss) vs the wild fish on a molecular level. Additionally, epigenetic differences between feeding practices that allow slow growth (2 years) and fast growth (1 year) hatchery trout were investi- gated. The sperm and red blood cells (RBC) from adult male slow growth/maturation hatchery steelhead, fast growth/matu- ration hatchery steelhead, and wild (natural-origin) steelhead were collected for DNA preparation to investigate potential alterations in differential DNA methylation regions (DMRs) and genetic mutations, involving copy number variations (CNVs). The sperm and RBC DNA both had a large number of DMRs when comparing the hatchery vs wild steelhead trout populations. The DMRs were cell type specific with negligible overlap. Slow growth/maturation compared to fast growth/ maturation steelhead also had a larger number of DMRs in the RBC samples. A number of the DMRs had associated genes that were correlated to various biological processes and pathologies. Observations demonstrate a major epigenetic pro- gramming difference between the hatchery and wild natural-origin fish populations, but negligible genetic differences. Therefore, hatchery conditions and growth/maturation rate can alter the epigenetic developmental programming of the steelhead trout. Interestingly, epigenetic alterations in the sperm allow for potential epigenetic transgenerational inheri- tance of phenotypic variation to future generations. The impacts of hatchery exposures are not only important to consider on the fish exposed, but also on future generations and evolutionary trajectory of fish in the river populations. Key words: steelhead; hatchery; rearing conditions; epigenetic inheritance; fish; genomics; phenotypic variation; sperm; generational Received 3 November 2020; revised 9 March 2021; accepted 1 March 2021 V C The Author(s) 2021. Published by Oxford University Press. This is an Open Access article distributed under the terms of the Creative Commons Attribution Non-Commercial License (http://creativecommons.org/ licenses/by-nc/4.0/), which permits non-commercial re-use, distribution, and reproduction in any medium, provided the original work is properly cited. For commercial re-use, please contact [email protected] 1 Environmental Epigenetics, 2021, 1–17 doi: 10.1093/eep/dvab002 Research article Downloaded from https://academic.oup.com/eep/article/7/1/dvab002/6274935 by guest on 04 July 2022
-
Upload
khangminh22 -
Category
Documents
-
view
2 -
download
0
Transcript of dvab002.pdf - Oxford Academic

R E S E A R C H A R T I C L E
Differential DNA methylation in somatic and sperm
cells of hatchery vs wild (natural-origin) steelhead trout
populationsEric Nilsson, Ingrid Sadler-Riggleman, Daniel Beck and Michael K. Skinner *Center for Reproductive Biology, School of Biological Sciences, Washington State University, Pullman, WA99164-4236, USA
*Correspondence address. Center for Reproductive Biology, School of Biological Sciences, Washington State University, Pullman, WA 99164-4236, USA. Tel:þ1-509-335-1524; E-mail: [email protected]
Managing Editor: Isabelle Mansuy
Abstract
Environmental factors such as nutrition, stress, and toxicants can influence epigenetic programming and phenotypes of awide variety of species from plants to humans. The current study was designed to investigate the impacts of hatcheryspawning and rearing on steelhead trout (Oncorhynchus mykiss) vs the wild fish on a molecular level. Additionally, epigeneticdifferences between feeding practices that allow slow growth (2 years) and fast growth (1 year) hatchery trout were investi-gated. The sperm and red blood cells (RBC) from adult male slow growth/maturation hatchery steelhead, fast growth/matu-ration hatchery steelhead, and wild (natural-origin) steelhead were collected for DNA preparation to investigate potentialalterations in differential DNA methylation regions (DMRs) and genetic mutations, involving copy number variations(CNVs). The sperm and RBC DNA both had a large number of DMRs when comparing the hatchery vs wild steelhead troutpopulations. The DMRs were cell type specific with negligible overlap. Slow growth/maturation compared to fast growth/maturation steelhead also had a larger number of DMRs in the RBC samples. A number of the DMRs had associated genesthat were correlated to various biological processes and pathologies. Observations demonstrate a major epigenetic pro-gramming difference between the hatchery and wild natural-origin fish populations, but negligible genetic differences.Therefore, hatchery conditions and growth/maturation rate can alter the epigenetic developmental programming of thesteelhead trout. Interestingly, epigenetic alterations in the sperm allow for potential epigenetic transgenerational inheri-tance of phenotypic variation to future generations. The impacts of hatchery exposures are not only important to consideron the fish exposed, but also on future generations and evolutionary trajectory of fish in the river populations.
Key words: steelhead; hatchery; rearing conditions; epigenetic inheritance; fish; genomics; phenotypic variation; sperm;generational
Received 3 November 2020; revised 9 March 2021; accepted 1 March 2021
VC The Author(s) 2021. Published by Oxford University Press.This is an Open Access article distributed under the terms of the Creative Commons Attribution Non-Commercial License (http://creativecommons.org/licenses/by-nc/4.0/), which permits non-commercial re-use, distribution, and reproduction in any medium, provided the original work is properly cited.For commercial re-use, please contact [email protected]
1
Environmental Epigenetics, 2021, 1–17
doi: 10.1093/eep/dvab002Research article
Dow
nloaded from https://academ
ic.oup.com/eep/article/7/1/dvab002/6274935 by guest on 04 July 2022
Introduction
Epigenetics is a complementary mechanism with genetics forthe molecular control of biology [1, 2]. A range of environmentalfactors including toxicants, stress, and nutrition can develop-mentally alter a variety of phenotypes in species from plants tohumans through epigenetics [3]. Epigenetics is defined as“molecular factors and processes around DNA that regulate ge-nome activity independent of DNA sequence, and are stablemitotically” [3, 4]. The ability of environmental factors to alterepigenetic programming, while not changing DNA sequence,provides a molecular mechanism for the environment to di-rectly impact phenotypic variation and evolution [1, 3].Although direct exposures of somatic cells to environmentalfactors can influence the individual exposed, epigenetic changein the germline (sperm or egg) can be transmitted to the nextgeneration, and is termed “epigenetic inheritance” [2, 3]. In theevent, the germline epigenetic alterations are transmitted tosubsequent generations, in the absence of continued direct ex-posure, this is defined as “epigenetic transgenerationalinheritance” [3, 5]. Therefore, environmental factors have theability to developmentally impact epigenetic programming toinfluence the phenotype of the individual exposed. In addition,if the germline (e.g. sperm) is affected the potential for genera-tional effects on phenotypic variation develop. The currentstudy is designed to investigate the molecular effects of hatch-ery rearing on steelhead trout (Oncorhynchus mykiss).
Hatcheries involve both aquaculture facilities for food sup-ply, and operations for sustaining sufficient numbers of endan-gered fish such as the salmon populations in the PacificNorthwest, USA [6, 7]. Research shows that hatchery-reared fishdiffer from wild fish both in phenotype and in having reducedreproductive success in the wild [8–11]. In steelhead trout(Oncorhynchus mykiss), it has been shown that the offspring offish experiencing even a single generation of hatchery rearingshow marked phenotypic changes [8–22] (Table 1). This has alsobeen observed in a variety of different hatchery salmon andtrout species [12, 23–45] (Table 1). Pathologies observed includedecreased fitness of hatchery-reared fish and offspring in thewild, and changes in age at spawning, morphology, growth rate,brain morphology, anti-predator behavior, and migration [8–45].
A model anadromous migratory salmonid fish species se-lected for the current study is the steelhead trout. A brood-stockhatchery operation (Winthrop National Fish Hatchery, WNFH,US Fish and Wildlife Service) on the Methow River inWashington State, USA was selected to compare wild natural-origin populations and hatchery populations of steelhead trout(Fig. 1). This hatchery used hatchery-reared steelhead crossedwith natural-origin fish from the same river as broodstock toproduce offspring that were raised in hatcheries until the timeof release as smolts, at which point they can migrate down-stream to the ocean. Some steelhead were placed on a highlevel (plane) of nutrition and reached smolt stage within 1 year(fast growth/maturation), at which time they were released.Others were placed on a lower level (plane) of nutrition, andtook 2 years to reach smolt stage (slow growth/maturation)prior to release. Natural-origin steelhead trout generally take 2years to reach smolt stage in this river system. After returningfrom the ocean, fast growth/maturation (S1), slow growth/mat-uration (S2), and natural-origin (N) fish were collected andsampled.
The Methow River summer-run steelhead is part of an upperColumbia River evolutionary significant unit currently listed asthreatened under the Endangered Species Act. For the past
60 years, the large number of hatchery fish released that breedwith wild fish has had a significant influence on the wild steel-head population. Therefore, there is no distinct wild MethowRiver steelhead population without a molecular influence fromhatchery impacts. The term natural-origin is used to refer tofish spawned in the wild and live their entire lives in the wild.Hatchery fish refers to fish generated through artificial rebreed-ing and crosses in the juvenile stages in the hatchery before be-ing released into the wild with an adipose fin clip. In the currentstudy, the wild (natural-origin) and hatchery (slow 2 years andfast 1-year juvenile growth/maturation) are compared. Naturaland hatchery-origin adult steelhead returning in the Methowriver in 2013 and 2014 and captured in winter and spring of 2014and 2015 were used in this study (Supplementary Table S1).
The molecular effects of hatchery rearing and growth rateon somatic cells (red blood cells, RBC) and germline cells(sperm) were investigated. Genome-wide molecular analyses ofdifferential DNA methylation regions (DMR) and genetic muta-tions (copy number variation, CNV) were performed. The hy-pothesis tested was that the hatchery spawning and rearingconditions alter the epigenetic programming of the steelheadsomatic cells (RBC) and germline (sperm), such that later in lifefollowing return the adult steelhead will have altered epige-netics, with potential generational impacts through the sperm.This will result in an altered phenotypic variation, fitness, andevolutionary trajectory of the wild population.
Results
The steelhead trout was selected as a model salmonid fish spe-cies for the current study due to the migratory nature of the fishand availability of the trout genome sequence to facilitate mo-lecular studies. The adult phenotypes and color after migrationand return from the Pacific Ocean are generally similar betweenthe hatchery and wild steelhead populations, as shown for thehatchery fish in Fig. 1. The steelhead was collected on theMethow River near Winthrop Washington, USA, during springfollowing the previous summer migration (Fig. 1a). A steelheadhatchery is located in Winthrop Washington that uses a brood-stock population of adult river caught fish each year to spawnand rear the steelhead. An alternate fish hatchery also used wasat Wells Dam below the mouth of the Methow River on theColumbia River (Fig. 1 and Supplementary Table S1). During col-lection, both hatchery (determined by a fin clip) and wild (natu-ral-origin) steelhead were obtained. Since each cell type in thebody has a unique epigenome (e.g. DNA methylation patterns),purified cell types are required for epigenetic analysis to allowunambiguous data interpretation. For the current study, bothsperm and purified RBC (that contain nuclei in fish) sampleswere collected from the males. The DNA was isolated from thecell types obtained from adult male hatchery and wild steelhead(Fig. 1b). The isolated DNA from the RBC and sperm sampleswere then processed for the molecular studies.
The DMRs between the hatchery and wild male steelheadpopulations were identified in both the sperm and RBC sepa-rately. For each treatment group, equal amounts of DNA fromthree to five different males were pooled and three pools cre-ated for n¼ 9–15 animals per group. The treatment groups com-prised fish from the Winthrop National Hatchery-fast growth/maturation (WNFH-S1; i.e. S1), Winthrop National Hatchery-slow growth/maturation (WNFH-S2; i.e. S2), Winthrop NationalHatchery standard hatchery (WNFH-H; i.e. H), and non-hatcheryreared natural-origin wild fish (N). Information on the individ-ual fish collections, characteristics, and labeling are presented
2 | Environmental Epigenetics, 2021, Vol. 7, No. 1
Dow
nloaded from https://academ
ic.oup.com/eep/article/7/1/dvab002/6274935 by guest on 04 July 2022
in Supplementary Table S1. The information includes samplegroup, identification number, floy tag number, sex (males), datecollection, natural or hatchery type, hatchery location, approxi-mate age at collection, rearing (growth) strategy, and samplepool for each individual (Supplementary Table S1). Individualmales used for the study had no difference in the length or agebetween the groups (Supplementary Table S1). Equal amountsof DNA from each individual upon collection was used in thehatchery or wild population pools, and then the DNA was frag-mented through sonication and the methylated DNA immuno-precipitated (MeDIP) with an antibody to methylcytosine, asdescribed [46] in the Methods. The MeDIP DNA was used to pre-pare libraries for next-generation sequencing (Seq) for anMeDIP-Seq analysis to identify the DMRs, see Methods. This ge-nome-wide epigenetic analysis assesses >90% of the genomecompared to other procedures such as reduced representationbisulfite sequencing (RRBS) that assesses <10% of the genome[47]. The sperm and RBC DNA samples were analyzed separatelywith MeDIP-Seq.
A comparison of the standard hatchery WNFH-H (H), fast 1-year growth/maturation WNFH-S1 (S1), slow 2-year growth/maturation WNFH-S2 (S2), and wild (natural-origin) (N) popula-tions involved 2 years of collection with N1 in the first year col-lection for standard hatchery H vs N1 and a distinct collectionof N2 in the second year collection for the S1 vs N2 and the S2 vsN2 comparisons. Therefore, these analyses were done sepa-rately. Summary of the individual fish and characteristics ispresented in Supplementary Table S1. The MeDIP-Seq proce-dure was used to identify the DMRs between the group compari-sons (Table 2). The analyses at several different statistically
significant P values are shown for single sites (1000 bp window),and for multiple adjacent window sites (�2 1000 bp windows)with each being statistically significant with edgeR and falsediscovery rate (FDR), as described in the Methods. As the statis-tical threshold decreases (P-value) the number of identifiedDMRs decreases, as expected, and the edgeR P< 1e�05 signifi-cance level was selected for subsequent use and data presenta-tion. This generally correlated to an FDR of P< 0.05. Althoughthe data analysis focused on the most stringently selectedDMRs, the other DMRs at a lower statistical threshold are antici-pated to also be important, but more variable between individu-als. The DMR numbers for the sperm and RBC are presented inTable 2. For DMRs with multiple adjacent windows, the mostpredominant number of adjacent sites is 2 (1000 bp each) withthe highest number of adjacent sites being 8. Therefore, themore stringently identified DMRs (all sites at P< 1e�05) providea reasonable set of DMRs (i.e. signature) to be used for furtheranalysis. The lists of DMRs and genomic features comparinghatchery vs wild steelhead for the sperm are presented inSupplementary Table S2, and for the RBC in SupplementaryTable S3.
A major hatchery condition that can be altered is the nutri-tion and amount of food intake that can promote a fast growth1-year juvenile maturation or a more normal slow growth 2-year juvenile maturation. A group of WNFH fast (S1) and slow(S2) growth/maturation steelhead were compared with the wildnatural-origin (N) groups (i.e. N1 and N2). Both the N2 vs S1 orS2 comparisons are presented in Table 2 for the identification ofDMRs. Using a P< 1e�05 statistical threshold, similar numbersof DMRs were obtained for the wild natural-origin (N2),
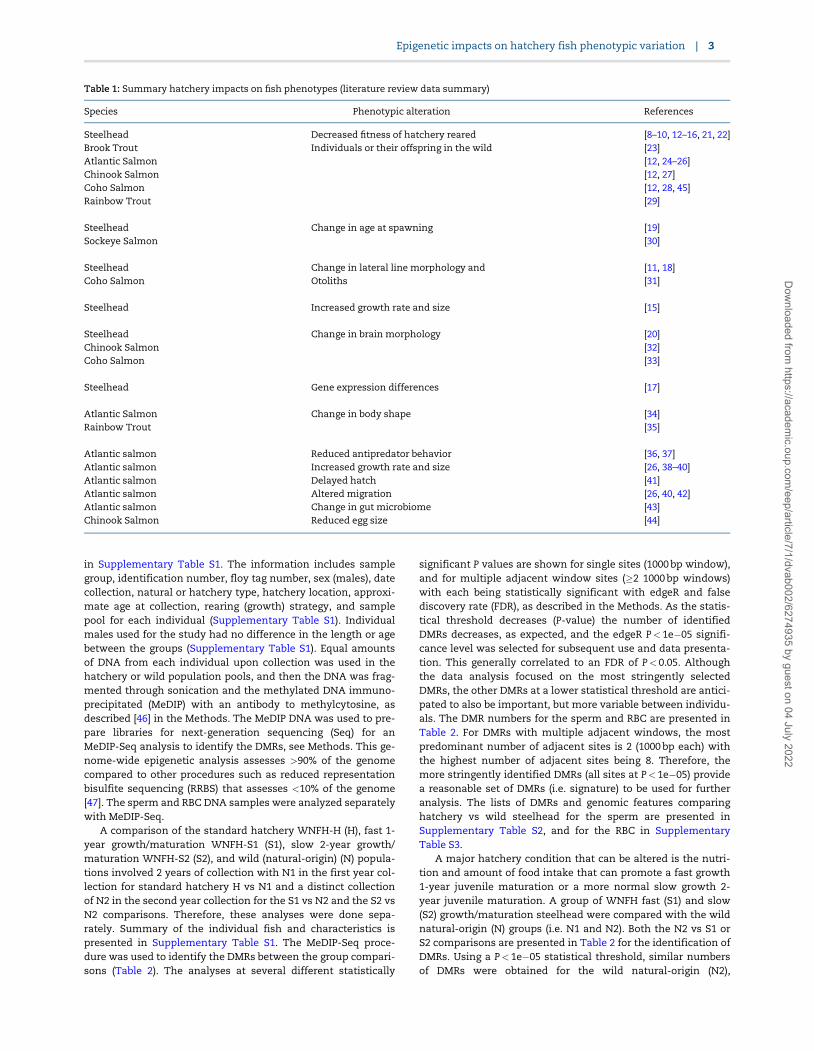
Table 1: Summary hatchery impacts on fish phenotypes (literature review data summary)
Species Phenotypic alteration References
Steelhead Decreased fitness of hatchery reared [8–10, 12–16, 21, 22]Brook Trout Individuals or their offspring in the wild [23]Atlantic Salmon [12, 24–26]Chinook Salmon [12, 27]Coho Salmon [12, 28, 45]Rainbow Trout [29]
Steelhead Change in age at spawning [19]Sockeye Salmon [30]
Steelhead Change in lateral line morphology and [11, 18]Coho Salmon Otoliths [31]
Steelhead Increased growth rate and size [15]
Steelhead Change in brain morphology [20]Chinook Salmon [32]Coho Salmon [33]
Steelhead Gene expression differences [17]
Atlantic Salmon Change in body shape [34]Rainbow Trout [35]
Atlantic salmon Reduced antipredator behavior [36, 37]Atlantic salmon Increased growth rate and size [26, 38–40]Atlantic salmon Delayed hatch [41]Atlantic salmon Altered migration [26, 40, 42]Atlantic salmon Change in gut microbiome [43]Chinook Salmon Reduced egg size [44]
Epigenetic impacts on hatchery fish phenotypic variation | 3
Dow
nloaded from https://academ
ic.oup.com/eep/article/7/1/dvab002/6274935 by guest on 04 July 2022

hatchery-S1, or hatchery-S2 comparisons. An overlap of theseDMR sets is shown in Fig. 2b for sperm and Fig. 3b for RBC. Acomparison of the hatchery S1 vs hatchery S2 is also providedwith a higher number of DMRs for RBC and lower number forsperm (Table 2). The Venn diagram overlaps of all the compari-sons (Figs 2b and 3b) suggests each group comparison was pri-marily distinct with the largest overlaps between the N2 vs S1and N2 vs S2, as well as the S1 vs S2 and N1 vs H. Therefore, atP< 1e�05, the DMRs are primarily distinct for each comparison.
The chromosomal locations of the DMRs for the sperm arepresented in Fig. 2a and for the RBC in Fig. 3a. The DMRs are pre-sent on all of the annotated steelhead trout genome chromo-somes for both sperm and RBC DMRs. The red arrowheadsindicate the locations of the DMRs. Previous studies have dem-onstrated that DMRs can cluster on the genome to give statisti-cally over-represented groups of DMRs [48]. These clusters ofDMRs are shown in Figs 2a and 3a as black boxes on the chro-mosomes, and may function as epigenetic control regions [49].Therefore, the DMRs are present throughout the genome and
not isolated to specific regions or chromosomes. The RefSeqversion of the Omyk 1.0 steelhead trout genome was used andobtained from NCBI. The read alignment rate was generally 76–83% for the steelhead sequencing with �55–100 million readsper pool for comparison. The steelhead trout genome is nownearly fully assembled, but some of the sequence is still in un-placed contigs not localized to a specific chromosome. In Figs 2and 3, chromosomes marked as #1–#29 and mitochondrial DNA(MT) all have DMRs mapped to chromosomes. The number ofDMRs associated with unplaced contigs is listed in the figurelegends. Therefore, the lack of a complete genome annotationprovides an underestimate of the genome map findings, but issufficient to allow interpretation of the majority of the data.The chromosomal locations of the wild (N2) vs hatchery S1 (i.e.1-year fast growth/maturation) or S2 (i.e. 2-year slow growth/maturation), and the hatchery S1 vs S2 are shown in Fig. 4a–dand in Supplementary Fig. S1. The lists of DMRs are presentedin Supplementary Tables S2–S9 with genome location, statisti-cal edgeR P values, log-fold change [(þ) indicating an increase in
Figure 1: Hatchery locations, rivers, adjacent dams, and steelhead trout. (a) Map of Methow River and Columbia River confluence, and Winthrop hatchery. (b) Steelhead
males (hatchery-origin)
4 | Environmental Epigenetics, 2021, Vol. 7, No. 1
Dow
nloaded from https://academ
ic.oup.com/eep/article/7/1/dvab002/6274935 by guest on 04 July 2022
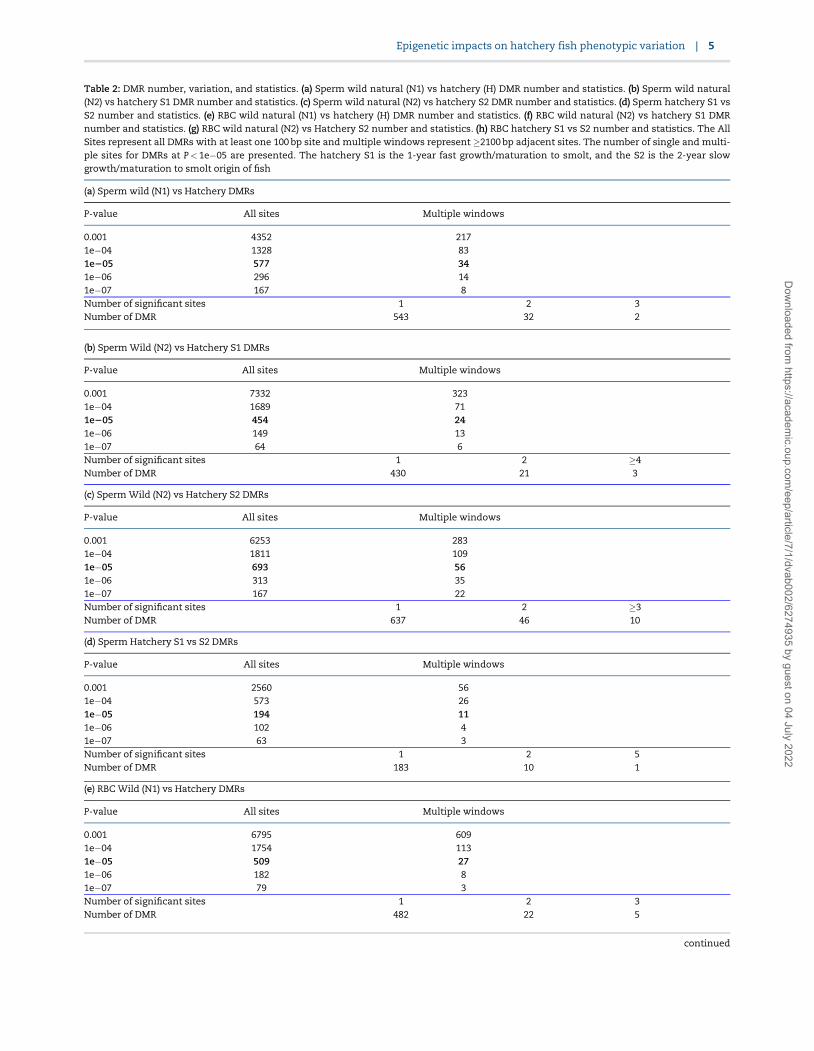
Table 2: DMR number, variation, and statistics. (a) Sperm wild natural (N1) vs hatchery (H) DMR number and statistics. (b) Sperm wild natural(N2) vs hatchery S1 DMR number and statistics. (c) Sperm wild natural (N2) vs hatchery S2 DMR number and statistics. (d) Sperm hatchery S1 vsS2 number and statistics. (e) RBC wild natural (N1) vs hatchery (H) DMR number and statistics. (f) RBC wild natural (N2) vs hatchery S1 DMRnumber and statistics. (g) RBC wild natural (N2) vs Hatchery S2 number and statistics. (h) RBC hatchery S1 vs S2 number and statistics. The AllSites represent all DMRs with at least one 100 bp site and multiple windows represent �2100 bp adjacent sites. The number of single and multi-ple sites for DMRs at P< 1e�05 are presented. The hatchery S1 is the 1-year fast growth/maturation to smolt, and the S2 is the 2-year slowgrowth/maturation to smolt origin of fish
(a) Sperm wild (N1) vs Hatchery DMRs
P-value All sites Multiple windows
0.001 4352 2171e�04 1328 831e205 577 341e�06 296 141e�07 167 8Number of significant sites 1 2 3Number of DMR 543 32 2
(b) Sperm Wild (N2) vs Hatchery S1 DMRs
P-value All sites Multiple windows
0.001 7332 3231e�04 1689 711e205 454 241e�06 149 131e�07 64 6Number of significant sites 1 2 �4Number of DMR 430 21 3
(c) Sperm Wild (N2) vs Hatchery S2 DMRs
P-value All sites Multiple windows
0.001 6253 2831e�04 1811 1091e�05 693 561e�06 313 351e�07 167 22Number of significant sites 1 2 �3Number of DMR 637 46 10
(d) Sperm Hatchery S1 vs S2 DMRs
P-value All sites Multiple windows
0.001 2560 561e�04 573 261e�05 194 111e�06 102 41e�07 63 3Number of significant sites 1 2 5Number of DMR 183 10 1
(e) RBC Wild (N1) vs Hatchery DMRs
P-value All sites Multiple windows
0.001 6795 6091e�04 1754 1131e�05 509 271e�06 182 81e�07 79 3Number of significant sites 1 2 3Number of DMR 482 22 5
continued
Epigenetic impacts on hatchery fish phenotypic variation | 5
Dow
nloaded from https://academ
ic.oup.com/eep/article/7/1/dvab002/6274935 by guest on 04 July 2022
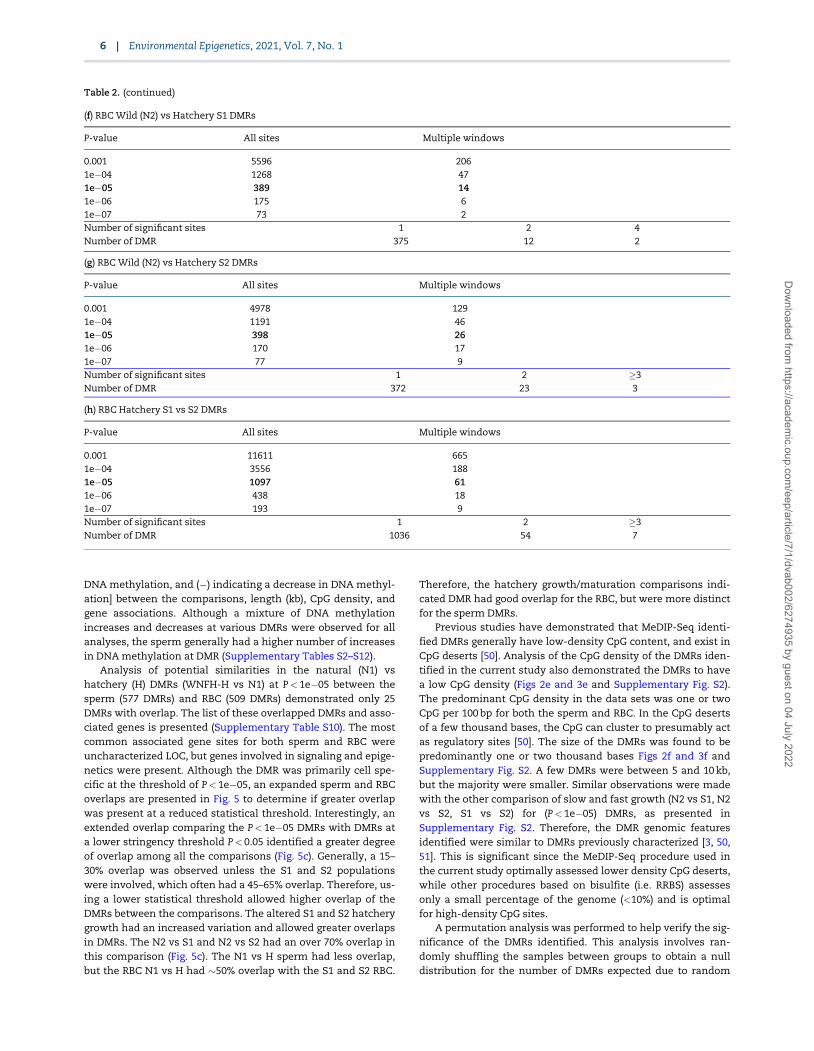
DNA methylation, and (�) indicating a decrease in DNA methyl-ation] between the comparisons, length (kb), CpG density, andgene associations. Although a mixture of DNA methylationincreases and decreases at various DMRs were observed for allanalyses, the sperm generally had a higher number of increasesin DNA methylation at DMR (Supplementary Tables S2–S12).
Analysis of potential similarities in the natural (N1) vshatchery (H) DMRs (WNFH-H vs N1) at P< 1e�05 between thesperm (577 DMRs) and RBC (509 DMRs) demonstrated only 25DMRs with overlap. The list of these overlapped DMRs and asso-ciated genes is presented (Supplementary Table S10). The mostcommon associated gene sites for both sperm and RBC wereuncharacterized LOC, but genes involved in signaling and epige-netics were present. Although the DMR was primarily cell spe-cific at the threshold of P< 1e�05, an expanded sperm and RBCoverlaps are presented in Fig. 5 to determine if greater overlapwas present at a reduced statistical threshold. Interestingly, anextended overlap comparing the P< 1e�05 DMRs with DMRs ata lower stringency threshold P< 0.05 identified a greater degreeof overlap among all the comparisons (Fig. 5c). Generally, a 15–30% overlap was observed unless the S1 and S2 populationswere involved, which often had a 45–65% overlap. Therefore, us-ing a lower statistical threshold allowed higher overlap of theDMRs between the comparisons. The altered S1 and S2 hatcherygrowth had an increased variation and allowed greater overlapsin DMRs. The N2 vs S1 and N2 vs S2 had an over 70% overlap inthis comparison (Fig. 5c). The N1 vs H sperm had less overlap,but the RBC N1 vs H had �50% overlap with the S1 and S2 RBC.
Therefore, the hatchery growth/maturation comparisons indi-cated DMR had good overlap for the RBC, but were more distinctfor the sperm DMRs.
Previous studies have demonstrated that MeDIP-Seq identi-fied DMRs generally have low-density CpG content, and exist inCpG deserts [50]. Analysis of the CpG density of the DMRs iden-tified in the current study also demonstrated the DMRs to havea low CpG density (Figs 2e and 3e and Supplementary Fig. S2).The predominant CpG density in the data sets was one or twoCpG per 100 bp for both the sperm and RBC. In the CpG desertsof a few thousand bases, the CpG can cluster to presumably actas regulatory sites [50]. The size of the DMRs was found to bepredominantly one or two thousand bases Figs 2f and 3f andSupplementary Fig. S2. A few DMRs were between 5 and 10 kb,but the majority were smaller. Similar observations were madewith the other comparison of slow and fast growth (N2 vs S1, N2vs S2, S1 vs S2) for (P< 1e�05) DMRs, as presented inSupplementary Fig. S2. Therefore, the DMR genomic featuresidentified were similar to DMRs previously characterized [3, 50,51]. This is significant since the MeDIP-Seq procedure used inthe current study optimally assessed lower density CpG deserts,while other procedures based on bisulfite (i.e. RRBS) assessesonly a small percentage of the genome (<10%) and is optimalfor high-density CpG sites.
A permutation analysis was performed to help verify the sig-nificance of the DMRs identified. This analysis involves ran-domly shuffling the samples between groups to obtain a nulldistribution for the number of DMRs expected due to random
(f) RBC Wild (N2) vs Hatchery S1 DMRs
P-value All sites Multiple windows
0.001 5596 2061e�04 1268 471e�05 389 141e�06 175 61e�07 73 2Number of significant sites 1 2 4Number of DMR 375 12 2
(g) RBC Wild (N2) vs Hatchery S2 DMRs
P-value All sites Multiple windows
0.001 4978 1291e�04 1191 461e�05 398 261e�06 170 171e�07 77 9Number of significant sites 1 2 �3Number of DMR 372 23 3
(h) RBC Hatchery S1 vs S2 DMRs
P-value All sites Multiple windows
0.001 11611 6651e�04 3556 1881e�05 1097 611e�06 438 181e�07 193 9Number of significant sites 1 2 �3Number of DMR 1036 54 7
Table 2. (continued)
6 | Environmental Epigenetics, 2021, Vol. 7, No. 1
Dow
nloaded from https://academ
ic.oup.com/eep/article/7/1/dvab002/6274935 by guest on 04 July 2022

chance. Internal population epigenetic variation is generally as-sociated with hypervariable or metastable DMRs, as previouslydescribed [52, 53]. There was generally a higher number ofDMRs in the full analysis when compared to the sperm and RBCDMRs from the permutation comparisons of the hatchery andwild populations (Figs 2d and 3d and Supplementary Fig. S3).Two of the comparisons, sperm N2 vs S1 and sperm S1 vs S2,did not show a higher number of DMRs with the full analysis(Supplementary Fig. S3C and G). Although only a six-pool sub-comparison is not ideal for a thorough permutation analysis,the sperm with the S1 and S2 populations do show a higher de-gree of variation. The DMR analysis was also supported with aprincipal component analysis (PCA) of the DMRs, which demon-strated good separation of the various groups for all compari-sons (Figs 2c, 3c, and 4e–h, and Supplementary Fig. S4. Sincepools of animals were used, it is difficult to determine if theFig. 1 parameters such as age, size, hatchery, or collection datacreate variability in the data, however, the PCA and permuta-tion analyses indicate the DMR identified for the group compar-isons is not a major factor. Within the specific groups, thevariation shown for each group in the PCA may be associatedwith the variables shown in Supplementary Table S1.
The potential genetic variation between the hatchery andwild steelhead populations was also investigated. A type of ge-netic mutation previously shown to be one of the most
common and stable is CNVs of repeat elements [51, 54, 55].Previously, we have shown the ability to use CNV as a mea-sure of genetic variation in wild populations [56]. Sequencingread depth data from the WNFH-H and N (i.e. N1) groups wasused for a CNV analysis (CNV-Seq). The CNV for the hatcheryand natural-origin wild populations for both the sperm andRBC are presented in Supplementary Fig. S5. CNV analysis didnot show either hatchery or natural-origin samples to havemore CNVs than the other. The sperm had higher numbers ofCNVs than the RBC. None of the CNVs were common betweenthe different animal pools. Therefore, in contrast to the epige-netic changes observed, negligible genetic changes betweenthe hatchery and wild populations were observed. A limitationin this analysis is the read depth only allowed the identifica-tion of large size CNV as presented. The negligible effect ofhatchery conditions on genetics has been previously reported[57, 58].
The potential gene associations with the DMRs were investi-gated using the steelhead trout genome annotations includedin the RefSeq genome. The DMR associated genes are presentedin Supplementary Tables S2–S9 for all the comparisons. Themajority of DMRs did not have known gene associations. Thecell-specific DMR associated gene functional categories are pre-sented in Fig. 6a for sperm and Fig. 6b for RBC. The most pre-dominant gene classification categories associated with all the
Figure 2: sperm DMR N1 vs H chromosomal locations and analysis. (a) DMR chromosomal locations on the individual chromosomes vs size of chromosomes. All DMRs
at a P-value threshold of P<1e�05 are shown with red arrowheads and clusters DMRs with black boxes. In addition, 212 DMRs were located on the unplaced
concatenated scaffolds not shown. (b) Sperm comparisons DMR overlaps, P<1e�05. (c) Principal component analysis (PCA) of sperm DMRs N1 vs H. (d) Permutation
analysis of sperm DMRs N1 vs H. (e) The number of sperm DMRs at different CpG densities. All DMRs at a P-value threshold of 1e�05 are shown. (f) The DMR lengths
(kb) for sperm DMRs. All DMRs at a P-value threshold of 1e�05 are shown
Epigenetic impacts on hatchery fish phenotypic variation | 7
Dow
nloaded from https://academ
ic.oup.com/eep/article/7/1/dvab002/6274935 by guest on 04 July 2022

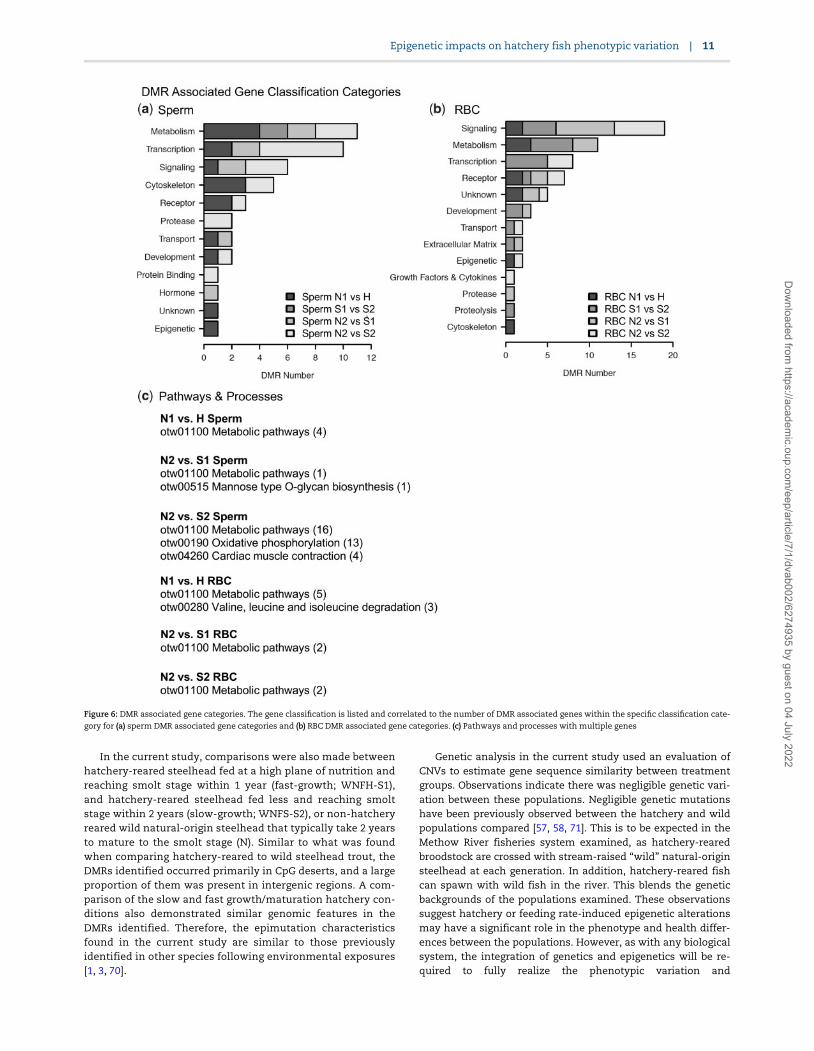
group comparisons are transcription, metabolism, signaling,transport, development, protease, and epigenetics (Fig. 6).These gene categories are anticipated as they are the mostabundant in most species and cell-type genomes. When thehatchery vs natural genes are put into a KEGG pathway analy-sis, the metabolic pathways (DCXR, ITPA, and PLCB3) and cyto-kine-cytokine receptor interactions (IL15, IL21) pathways wereidentified for the sperm, and proteasome (psme9a, psme1) forthe RBC DMR associated genes (Fig. 6b). Limited numbers ofDMR associated genes were present in the pathways, except forthe S1 vs S2 comparison. Therefore, further analyses used acombination of all the comparison DMR associated genes.
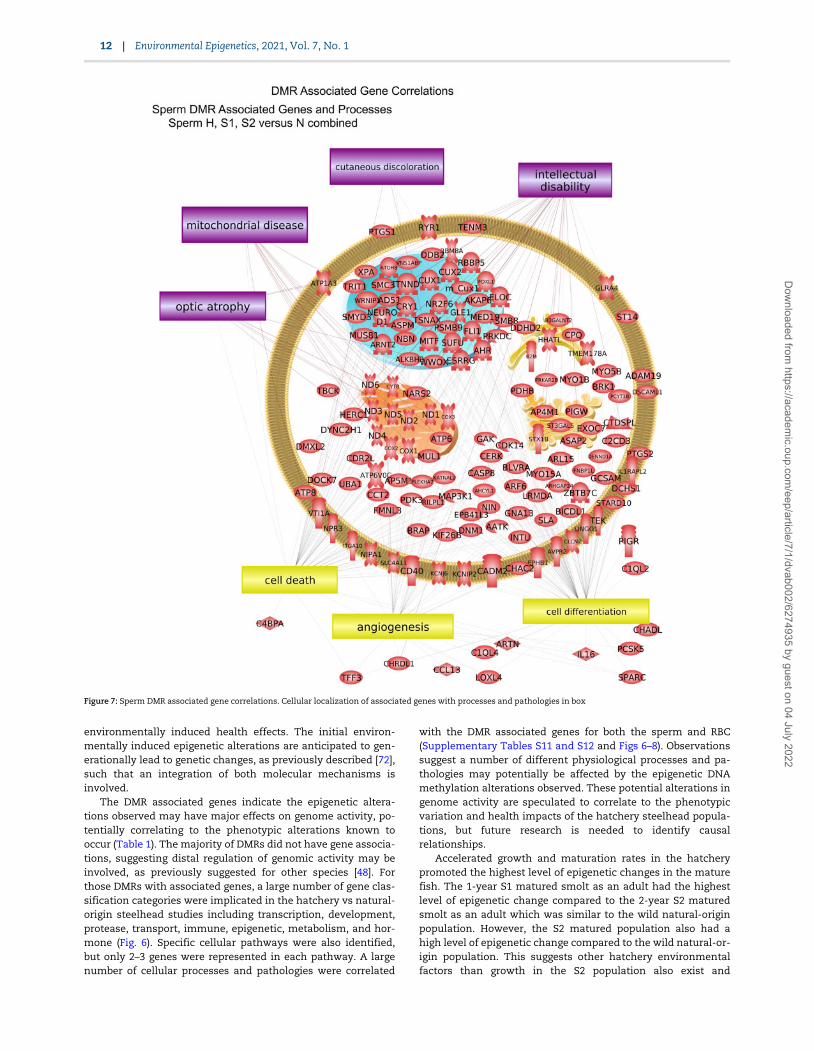
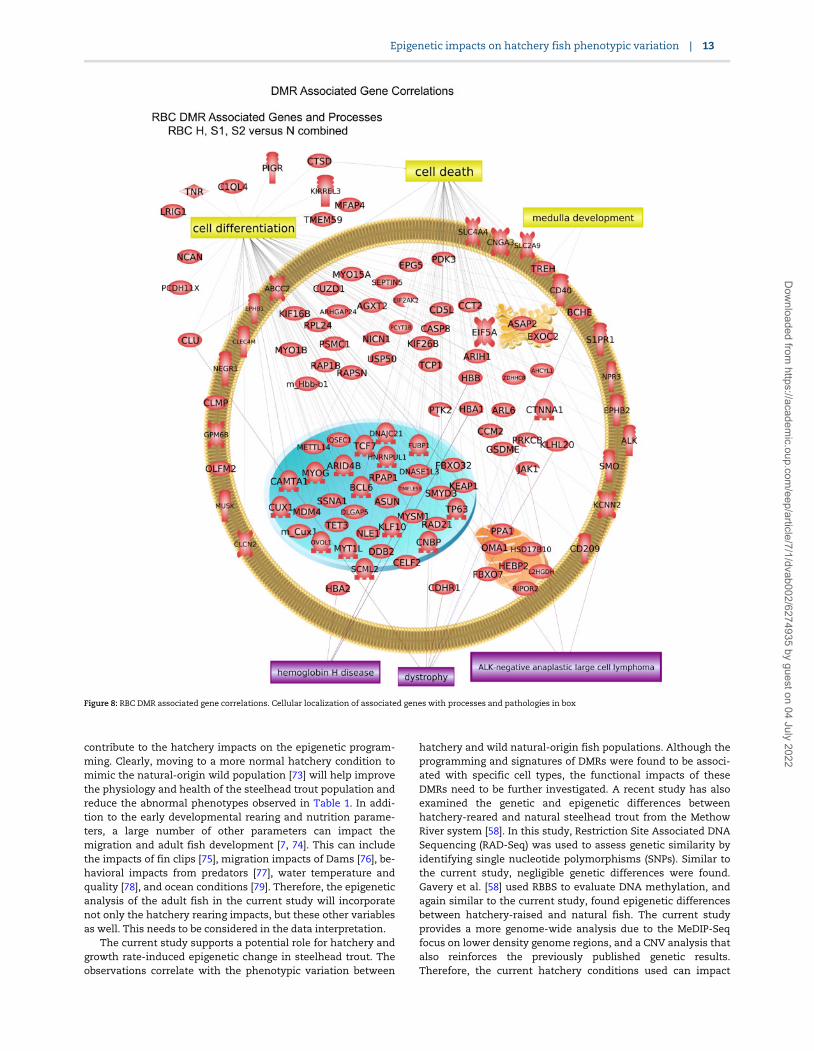
The DMR associated genes were analyzed for physiologicalprocesses and pathology correlations using the steelhead anno-tations provided by NCBI. The predominant physiological pro-cesses were cell death, angiogenesis, and cell differentiation forsperm DMR associated genes (Fig. 7). Cell differentiation, celldeath, and medulla development are predominant for RBC DMRassociated genes (Fig. 8). The predominant sperm DMR gene-as-sociated pathologies were intellectual disability, cutaneous dis-coloration, mitochondrial disease, and optic atrophy in spermDMR associated genes (Fig. 7). Pathologies of hemoglobin dis-ease, dystrophy, and anaplastic large cell lymphoma in RBCDMR associated genes were predominant (Fig. 8). Additional cel-lular processes and pathway correlations with statistical signifi-cance are presented in Supplementary Table S11 for the sperm
DMR associated genes and in Supplementary Table S12 for theRBC DMR associated genes. The processes or pathologies arelisted with the total number of genes, the overlap number ofgenes, and the P-value significance of the correlation is pre-sented. Each of the different comparisons’ DMR associatedgenes are combined to identify the potential associated pro-cesses and pathologies correlated with the hatchery and rearingconditions.
Discussion
Observations indicate hatchery spawning and rearing inducesepigenetic alterations when compared to a wild (natural-origin)populations of steelhead trout. In addition, feeding and growthrate (1-year fast growth S1 vs 2-year slow growth S2) of juvenilesresults in altered epigenetic programming in adulthood. Thehatchery conditions impose nutritional, behavioral, or othertypes of stressors on the fish that can developmentally promotealtered epigenetic programming and phenotypic variation. Theexposure of somatic cells leading to epigenetic (e.g. DNA meth-ylation) change may impact the exposed individuals’ healthand phenotypes. Therefore, the hatchery populations can havereduced fertility, abnormal health, and survival when comparedto the wild populations (Table 1). Since environmental expo-sures generally cannot directly alter genetic mutations, epige-netics provides a molecular mechanism for the physiological
Figure 3: RBC DMR N1 vs H chromosomal locations and analysis. (a) DMR chromosomal locations on the individual chromosomes vs size of chromosomes. All DMRs at
a P-value threshold of P<1e�05 are shown with red arrowheads and DMR clusters with black boxes. In addition, 175 DMRs were located on the unplaced concatenated
scaffolds not shown. (b) RBC comparisons DMR overlaps, P< 1e�05. (c) Principal component analysis (PCA) of RBC DMRs N1 vs H. (d) Permutation analysis of RBC DMRs
N1 vs H. (e) The number of RBC DMRs at different CpG densities. All DMRs at a P-value threshold of 1e�05 are shown. (f) The DMR lengths (kb) for RBC DMRs. All DMRs
at a P-value threshold of 1e�05 are shown
8 | Environmental Epigenetics, 2021, Vol. 7, No. 1
Dow
nloaded from https://academ
ic.oup.com/eep/article/7/1/dvab002/6274935 by guest on 04 July 2022

changes observed. In the event, the hatchery induced epigeneticalterations (i.e. epimutations) that appear in the germline (eggor sperm), then the impacts may persist across generations.Previously, the transmission of epigenetic information throughthe germline to alter a variety of phenotypes in a number of dif-ferent species, including fish, have been observed [3]. This epi-genetic inheritance can influence the next generation’sphenotypes and health. If the germline epigenetic changes per-sist between generations in the absence of environmental expo-sures, then this is termed epigenetic transgenerationalinheritance [3, 5]. Therefore, the hatchery impacts may not onlybe on the exposed individuals, but on subsequent generations.This has the potential to dramatically impact the wild natural-origin populations and their evolutionary trajectory. The cur-rent study demonstrates the ability of hatchery conditions topromote epigenetic alterations in both somatic cells (RBC) andgerm cells (sperm), so both directly exposed fish populationsand future generations need to be considered.
Previous studies have demonstrated hatchery impacts onfish phenotypic alterations and health (Table 1). Hatchery rear-ing has been shown to decrease reproductive success in steel-head trout by about 40% per captive-reared generation in thefirst two generations when fish are moved back to natural envi-ronments [8, 13]. Hatchery rearing of salmonids affects lateralline and auditory structures [11]. Phenotypic changes anddecreases in fitness can occur even when wild fish are incorpo-rated as broodstock in hatchery operations [9]. Although therelationships of the molecular epigenetic alterations and DMRsfound in the current study cannot currently be causally relateddirectly to the phenotypes, hatchery-induced epigenetic altera-tions (i.e. epimutations) provide a potential molecular
mechanism for the phenotypic variation and health effects pre-viously observed.
The hatchery fish are exposed to hatchery conditions andreared through development to the smolt stage, so all early de-velopment periods are impacted. Primordial germ cells (PGCs)in fish species, including salmonids, are specified by the locali-zation of germplasm components into certain cells early in em-bryonic development [59]. These germplasm componentsinclude the products of the vasa and nanos genes [59]. PGCs mi-grate to the gonadal anlagen, then undergo mitotic proliferationand differentiate to become either spermatogonia or oogonia[59]. The PGC is a critical stage for the male germline when dra-matic epigenetic reprogramming occurs. Puberty in male salmo-nids is associated with growth and size, photoperiod, andhormones including 11-ketotestosterone [60]. Once spermato-genesis is initiated, spermatogonia are surrounded by Sertolicells to form cyst-like structures (spermatocysts) inside whichthe germ cells undergo mitotic divisions, produce spermato-cytes that undergo miotic divisions to form spermatids, whichthen undergo spermiogenesis to produce spermatozoa. Thespermatozoa are released from the spermatocysts into the tes-tis tubules [61]. The earlier stages of spermatogenesis are regu-lated by follicle-stimulating hormone (FSH) from the pituitary,while the later stages are regulated by luteinizing hormone (LH)[62]. Any of these developmental stages may be impacted by en-vironmental factors that result in epigenetic changes to thegerm cells.
There is evidence that epigenetic shifts during early life playa significant role in directing the life history and phenotypes offish during adulthood. This is clearly demonstrated in cases oftemperature-dependent sex determination, as seen with sea
Figure 4: DMR chromosomal locations on the individual chromosomes with red arrowheads indicating DMR and black boxes clusters of DMRs. All DMRs at a P-value
threshold of P<1e�05 are shown. (a) Sperm N2 vs S1 DMRs: 174 DMRs were located on the unplaced concatenated scaffold. (b) Sperm N2 vs S2 DMRs: 300 DMRs were lo-
cated on the unplaced concatenated scaffold. (c) RBC N2 vs S1 DMRs: 110 DMRs were located on the unplaced concatenated scaffold. (d) RBC N2 vs S2 DMRs: 130 DMRs
were located on the unplaced concatenated scaffold. Principal component analysis (PCA) using only DMR sites. (e) Sperm DMRs N2 vs S1 (f) Sperm DMRs N2 vs S2. (g)
RBC DMRs N2 vs S1. (h) RBC DMRs N2 vs S2. Legend inserts with color N2 or S1 or S2
Epigenetic impacts on hatchery fish phenotypic variation | 9
Dow
nloaded from https://academ
ic.oup.com/eep/article/7/1/dvab002/6274935 by guest on 04 July 2022

bass [63]. In Atlantic salmon, the temperature of embryonic de-velopment affects growth rate of the smolt stage, and is associ-ated with larval myogenin expression and DNA methylationlevels [64]. Similarly, stressors during embryonic and larvalstages for salmon induce changes in the immune response at 4months of age that are associated with changes in DNA methyl-ation in gill tissue [65]. These early developmental impacts onlater-life health and disease involve the developmental origin ofhealth and disease (DOHAD) mechanisms observed in manyspecies, including humans. Epigenetics is one of the primarymolecular mechanisms involved in this phenomenon.
In the current study, the epigenetic alterations observedwere DMRs identified in the hatchery steelhead somatic andgermline cells, compared to natural-origin populations. Thepresence of a reproducible DMR is termed an epimutation [1, 3,4]. The molecular procedure used to identify the DMRs wasmethylated DNA immunoprecipitation (MeDIP) followed by Seqfor an MeDIP-Seq analysis [66]. The MeDIP procedure is biased tolow-density CpG analysis (<10% CpG) [67], which constitutes�95% of the genome [68]. In contrast, due to the informatics andalignment issues, a bisulfite procedure (RRBS) can be biased tohigher density CpG analysis (>10%), which constitutes �5% ofthe genome [47]. Therefore, the current study used MeDIP-Seq tocapture the majority of the genome, while previous studies have
used bisulfite (i.e. RRBS) procedures [58, 69]. The DMRs identifiedin the current study had low CpG content, and exist primarily inCpG deserts [50]. Evolutionarily, CpG methylation has beenshown to increase susceptibility for C to T conversions, andleads to regions of the genome with low CpG content. Smallclusters of CpG in these CpG deserts were likely conserved dueto regulatory roles for these CpG clusters [50]. The genomic loca-tions of the DMRs also demonstrate a genome-wide distributionon most chromosomes. Although the assembly of the steelheadtrout genome is not complete, it has been significantly improvedrecently and the most recent reference genome (Oncorhynchusmykiss, Omyk_1.0, accession GCF_002163495.1, https://www.ncbi.nlm.nih.gov/assembly/GCF_002163495.1), was used in the cur-rent study. The comparison of the hatchery and wild (natural-origin) steelhead populations identified a large number of sin-gle-site DMRs and a smaller set of DMRs using a more stringentselection of adjacent site DMRs. Therefore, the epimutationsidentified in this study appear to be due to alterations in epige-netic programming between the hatchery and wild natural-ori-gin steelhead populations. Although variables such as age, size,and hatchery conditions will impact an individual’s epigenome,these variables were controlled for in this study to the extentpossible. The permutation analyses and PCA plots did not iden-tify any obvious sources of unexplained variability.
Figure 5: DMR overlaps (a) DMR overlap between sperm and RBC DMR (N1 vs H and N2 vs S2). (b) Sperm and RBC overlap P<1e�05 N2 vs S1 and N2 vs S2. (c) Extended
DMR overlap P<1e�05 vs P<0.05. The horizontal line indicating the number of DMR overlap and percentage at P<0.05. Gray highlight is anticipated 100% overlap and
yellow highlight overlaps mentioned in the text
10 | Environmental Epigenetics, 2021, Vol. 7, No. 1
Dow
nloaded from https://academ
ic.oup.com/eep/article/7/1/dvab002/6274935 by guest on 04 July 2022
In the current study, comparisons were also made betweenhatchery-reared steelhead fed at a high plane of nutrition andreaching smolt stage within 1 year (fast-growth; WNFH-S1),and hatchery-reared steelhead fed less and reaching smoltstage within 2 years (slow-growth; WNFS-S2), or non-hatcheryreared wild natural-origin steelhead that typically take 2 yearsto mature to the smolt stage (N). Similar to what was foundwhen comparing hatchery-reared to wild steelhead trout, theDMRs identified occurred primarily in CpG deserts, and a largeproportion of them was present in intergenic regions. A com-parison of the slow and fast growth/maturation hatchery con-ditions also demonstrated similar genomic features in theDMRs identified. Therefore, the epimutation characteristicsfound in the current study are similar to those previouslyidentified in other species following environmental exposures[1, 3, 70].
Genetic analysis in the current study used an evaluation ofCNVs to estimate gene sequence similarity between treatmentgroups. Observations indicate there was negligible genetic vari-ation between these populations. Negligible genetic mutationshave been previously observed between the hatchery and wildpopulations compared [57, 58, 71]. This is to be expected in theMethow River fisheries system examined, as hatchery-rearedbroodstock are crossed with stream-raised “wild” natural-originsteelhead at each generation. In addition, hatchery-reared fishcan spawn with wild fish in the river. This blends the geneticbackgrounds of the populations examined. These observationssuggest hatchery or feeding rate-induced epigenetic alterationsmay have a significant role in the phenotype and health differ-ences between the populations. However, as with any biologicalsystem, the integration of genetics and epigenetics will be re-quired to fully realize the phenotypic variation and
Figure 6: DMR associated gene categories. The gene classification is listed and correlated to the number of DMR associated genes within the specific classification cate-
gory for (a) sperm DMR associated gene categories and (b) RBC DMR associated gene categories. (c) Pathways and processes with multiple genes
Epigenetic impacts on hatchery fish phenotypic variation | 11
Dow
nloaded from https://academ
ic.oup.com/eep/article/7/1/dvab002/6274935 by guest on 04 July 2022
environmentally induced health effects. The initial environ-mentally induced epigenetic alterations are anticipated to gen-erationally lead to genetic changes, as previously described [72],such that an integration of both molecular mechanisms isinvolved.
The DMR associated genes indicate the epigenetic altera-tions observed may have major effects on genome activity, po-tentially correlating to the phenotypic alterations known tooccur (Table 1). The majority of DMRs did not have gene associa-tions, suggesting distal regulation of genomic activity may beinvolved, as previously suggested for other species [48]. Forthose DMRs with associated genes, a large number of gene clas-sification categories were implicated in the hatchery vs natural-origin steelhead studies including transcription, development,protease, transport, immune, epigenetic, metabolism, and hor-mone (Fig. 6). Specific cellular pathways were also identified,but only 2–3 genes were represented in each pathway. A largenumber of cellular processes and pathologies were correlated
with the DMR associated genes for both the sperm and RBC(Supplementary Tables S11 and S12 and Figs 6–8). Observationssuggest a number of different physiological processes and pa-thologies may potentially be affected by the epigenetic DNAmethylation alterations observed. These potential alterations ingenome activity are speculated to correlate to the phenotypicvariation and health impacts of the hatchery steelhead popula-tions, but future research is needed to identify causalrelationships.
Accelerated growth and maturation rates in the hatcherypromoted the highest level of epigenetic changes in the maturefish. The 1-year S1 matured smolt as an adult had the highestlevel of epigenetic change compared to the 2-year S2 maturedsmolt as an adult which was similar to the wild natural-originpopulation. However, the S2 matured population also had ahigh level of epigenetic change compared to the wild natural-or-igin population. This suggests other hatchery environmentalfactors than growth in the S2 population also exist and
Figure 7: Sperm DMR associated gene correlations. Cellular localization of associated genes with processes and pathologies in box
12 | Environmental Epigenetics, 2021, Vol. 7, No. 1
Dow
nloaded from https://academ
ic.oup.com/eep/article/7/1/dvab002/6274935 by guest on 04 July 2022
contribute to the hatchery impacts on the epigenetic program-ming. Clearly, moving to a more normal hatchery condition tomimic the natural-origin wild population [73] will help improvethe physiology and health of the steelhead trout population andreduce the abnormal phenotypes observed in Table 1. In addi-tion to the early developmental rearing and nutrition parame-ters, a large number of other parameters can impact themigration and adult fish development [7, 74]. This can includethe impacts of fin clips [75], migration impacts of Dams [76], be-havioral impacts from predators [77], water temperature andquality [78], and ocean conditions [79]. Therefore, the epigeneticanalysis of the adult fish in the current study will incorporatenot only the hatchery rearing impacts, but these other variablesas well. This needs to be considered in the data interpretation.
The current study supports a potential role for hatchery andgrowth rate-induced epigenetic change in steelhead trout. Theobservations correlate with the phenotypic variation between
hatchery and wild natural-origin fish populations. Although theprogramming and signatures of DMRs were found to be associ-ated with specific cell types, the functional impacts of theseDMRs need to be further investigated. A recent study has alsoexamined the genetic and epigenetic differences betweenhatchery-reared and natural steelhead trout from the MethowRiver system [58]. In this study, Restriction Site Associated DNASequencing (RAD-Seq) was used to assess genetic similarity byidentifying single nucleotide polymorphisms (SNPs). Similar tothe current study, negligible genetic differences were found.Gavery et al. [58] used RBBS to evaluate DNA methylation, andagain similar to the current study, found epigenetic differencesbetween hatchery-raised and natural fish. The current studyprovides a more genome-wide analysis due to the MeDIP-Seqfocus on lower density genome regions, and a CNV analysis thatalso reinforces the previously published genetic results.Therefore, the current hatchery conditions used can impact
Figure 8: RBC DMR associated gene correlations. Cellular localization of associated genes with processes and pathologies in box
Epigenetic impacts on hatchery fish phenotypic variation | 13
Dow
nloaded from https://academ
ic.oup.com/eep/article/7/1/dvab002/6274935 by guest on 04 July 2022
phenotypic variation through environmentally induced epige-netic transgenerational inheritance.
Conclusions
Clearly, the current study supports a critical role for epigeneticswhen considering the molecular source for hatchery impacts,however, it will be an integration of epigenetics and geneticsthat will influence the molecular control of phenotypic varia-tion. Since the sperm were found to have epigenetic alterations,the generational impacts through epigenetic inheritance alsoneed to be considered. The potential that these epigeneticgermline effects can be transmitted in the absence of direct ex-posure through epigenetic transgenerational inheritance nowneeds to be assessed. In hatchery operations involving food pro-duction, such as aquaculture, or when the hatchery fish are notallowed to breed with the wild fish population, impacts on thewild population will be reduced. However, in the event a hatch-ery population can breed with a wild fish population, the long-term impacts on the wild population and the environmentcould be dramatic and alter the future trajectory of the wildpopulation. Further research into environmental epigeneticimpacts on hatchery and wild fish populations is now needed.Interestingly, the epigenetic alterations observed could be usedas biomarkers to further identify hatchery impacts on the fish,as well as correlate with phenotypic alterations observed in thefuture.
MethodsAnimal Studies
As described in the Supplementary Methods [58], adult steel-head trout, Oncorhynchus mykiss, were collected from theMethow River and Winthrop National Fish Hatchery inWinthrop, WA, USA. The purified sperm and RBCs were col-lected for DNA preparations and epigenetic analysis. The sam-ple collections were obtained by the WNFH staff and the staff ofDr Penny Swanson’s laboratory at the Northwest Fisheries
Science Center, and the National Marine Fisheries Service(NMFS, NOAA) in Seattle WA, who had the appropriate verte-brate animal approvals for the study. All fish were reared andsampled according to the WNFH and University of WashingtonInstitutional Animal Care and Use Committee (Dr PennySwanson, Protocol #2313-90). Samples were shipped on dry iceand stored at �80�C for analysis. The initial natural and hatch-ery origin adult steelhead returning to the Methow river in sum-mer 2013 and captured spring 2014 were used as designated N1and H. Subsequent years were collected in a similar manner forthe N2 and S1 or S2 populations (Supplementary Table S1).
Epigenetic Analysis, Statistics, and Bioinformatics
DNA was isolated from sperm and RBCs as described in theSupplementary Methods [66]. Methylated DNA immunoprecipi-tation (MeDIP), followed by Seq (MeDIP-Seq) was performed.MeDIP-Seq, sequencing libraries, Seq, and bioinformatics analy-sis were performed as described in the Supplementary Methods[66]. All molecular data has been deposited into the public data-base at NCBI (GEO # GSE145887), and R code computational toolsare available at GitHub (https://github.com/skinnerlab/MeDIP-seq) and www.skinner.wsu.edu.
Acknowledgements
We acknowledge the advice and critical technical assistanceof the staff with the USFWS, WNFH, and the Dr PennySwanson laboratory at NMFS, NOAA at NWFSC in Seattle,WA. We acknowledge the contributions of Dr PennySwanson who assisted in the experimental design, samplecollection, and facilitating funding from NOAA. We thankMs Jayleana Barton for technical assistance, Ms AmandaQuilty for editing, and Ms Heather Johnson for assistance inpreparation of the manuscript.
Data Availability
All sequence data have been deposited to NCBI, GEO #GSE145887.
Funding
The research was supported by the National Oceanic andAtmospheric Administration (NOAA; grant numbersRA133F15SE1307 and RA133F14SE3610) and NationalInstitutes of Health (NIH; grant number ES012974) grant toM.K.S.
Conflict of interest statement
The authors have declared that no competing interestsexist.
Supplementary data
Supplementary data are available at EnvEpig online.
References1. Jirtle RL, Skinner MK. Environmental epigenomics and dis-
ease susceptibility. Nat Rev Genet 2007;8:253–62.2. Bonasio R. The expanding epigenetic landscape of non-model
organisms. J Exp Biol 2015;218:114–22.3. Skinner MK. Endocrine disruptor induction of epigenetic
transgenerational inheritance of disease. Mol Cell Endocrinol2014;398:4–12.
4. Skinner MK. Environmental epigenetic transgenerational in-heritance and somatic epigenetic mitotic stability. Epigenetics2011;6:838–42.
5. Anway MD, Cupp AS, Uzumcu M, Skinner MK. Epigenetictransgenerational actions of endocrine disruptors and malefertility. Science 2005;308:1466–9.
6. McClure MM, Utter FM, Baldwin C, Carmichael RW, HassemerPF, Howell PJ, Spruell P, Cooney TD, Schaller HA, Petrosky CE.Evolutionary effects of alternative artificial propagation pro-grams: implications for viability of endangered anadromoussalmonids. Evol Appl 2008;1:356–75.
7. Naish KA, Taylor JE, 3rd, Levin PS, Quinn TP, Winton JR,Huppert D, Hilborn R. An evaluation of the effects of conser-vation and fishery enhancement hatcheries on wild popula-tions of salmon. Adv Mar Biol 2007;53:61–194.
8. Araki H, Cooper B, Blouin MS. Genetic effects of captive breed-ing cause a rapid, cumulative fitness decline in the wild.Science 2007;318:100–3.
9. Fraser DJ. How well can captive breeding programs conservebiodiversity? A review of salmonids. Evol Appl 2008;1:535–86.
14 | Environmental Epigenetics, 2021, Vol. 7, No. 1
Dow
nloaded from https://academ
ic.oup.com/eep/article/7/1/dvab002/6274935 by guest on 04 July 2022

10.Frankham R. Genetic adaptation to captivity in species con-servation programs. Mol Ecol 2008;17:325–33.
11.Brown AD, Sisneros JA, Jurasin T, Coffin AB. Effects of hatch-ery rearing on the structure and function of salmonid mecha-nosensory systems. Adv Exp Med Biol 2016;875:117–24.
12.Christie MR, Ford MJ, Blouin MS. On the reproductive successof early-generation hatchery fish in the wild. Evol Appl 2014;7:883–96.
13.Ford MJ, Murdoch AR, Hughes MS, Seamons TR, LaHood ES.Broodstock history strongly influences natural spawning suc-cess in hatchery steelhead (Oncorhynchus mykiss). PLoS One2016;11:e0164801.
14.Araki H, Ardren WR, Olsen E, Cooper B, Blouin MS.Reproductive success of captive-bred steelhead trout in thewild: evaluation of three hatchery programs in the Hoodriver. Conserv Biol 2007;21:181–90.
15.Reisenbichler R, Rubin S, Wetzel L, Phelps S. Natural selectionafter release from a hatchery leads to domestication in steel-head, Oncorhynchus mykiss, in Stock Enhancement and SeaRanching: Developments, Pitfalls and Opportunities, 2nd edn, KMLeber, S Kitada, HL Blankenship, T Svasand, eds. 2004,Blackwell Publishing Ltd., Hoboken, NJ, p. 371–84.
16.Christie MR, Marine ML, French RA, Blouin MS. Genetic adap-tation to captivity can occur in a single generation. Proc NatlAcad Sci U S A 2012;109:238–42.
17.Christie MR, Marine ML, Fox SE, French RA, Blouin MS. A sin-gle generation of domestication heritably alters the expres-sion of hundreds of genes. Nat Commun 2016;7:10676.
18.Brown AD, Sisneros JA, Jurasin T, Nguyen C, Coffin AB.Differences in lateral line morphology between hatchery-and wild-origin steelhead. PLoS One 2013;8: e59162.
19.Abadia-Cardoso A, Anderson EC, Pearse DE, Garza JC. Large-scale parentage analysis reveals reproductive patterns andheritability of spawn timing in a hatchery population of steel-head (Oncorhynchus mykiss). Mol Ecol 2013;22: 4733–46.
20.Kihslinger RL, Nevitt GA. Early rearing environment impactscerebellar growth in juvenile salmon. J Exp Biol 2006;209:504–9.
21.Araki H, Cooper B, Blouin MS. Carry-over effect of captivebreeding reduces reproductive fitness of wild-born descend-ants in the wild. Biol Lett 2009;5: 621–4.
22.Moore M, Berejikian BA, Tezak EP. Variation in the early ma-rine survival and behavior of natural and hatchery-rearedHood Canal steelhead. PLoS One 2012;7: e49645.
23.Fraser DJ, Walker L, Yates MC, Marin K, Wood JLA, Bernos TA,Zastavniouk C. Population correlates of rapid captive-in-duced maladaptation in a wild fish. Evol Appl 2019;12:1305–17.
24.Reed TE, Prodohl P, Hynes R, Cross T, Ferguson A, McGinnityP. Quantifying heritable variation in fitness-related traits ofwild, farmed and hybrid Atlantic salmon families in a wildriver environment. Heredity (Edinb)), 2015;115:173–84.
25.Milot E, Perrier C, Papillon L, Dodson JJ, Bernatchez L. Reducedfitness of Atlantic salmon released in the wild after one gen-eration of captive breeding. Evol Appl 2013;6:472–85.
26.Skaala O, Besnier F, Borgstrom R, Barlaup B, Sorvik AG,Normann E, Ostebo BI, Hansen MM, Glover KA. An extensivecommon-garden study with domesticated and wild Atlanticsalmon in the wild reveals impact on smolt production andshifts in fitness traits. Evol Appl 2019;12:1001–16.
27. Janowitz-Koch I, Rabe C, Kinzer R, Nelson D, Hess MA, NarumSR. Long-term evaluation of fitness and demographic effectsof a Chinook Salmon supplementation program. Evol Appl2019;12:456–69.
28.Theriault V, Moyer GR, Jackson LS, Blouin MS, Banks MA.Reduced reproductive success of hatchery coho salmon inthe wild: insights into most likely mechanisms. Mol Ecol 2011;20:1860–9.
29.Miller LM, Close T, Kapuscinski AR. Lower fitness of hatcheryand hybrid rainbow trout compared to naturalized popula-tions in Lake Superior tributaries. Mol Ecol 2004;13:3379–88.
30.Tillotson MD, Barnett HK, Bhuthimethee M, Koehler ME,Quinn TP. Artificial selection on reproductive timing inhatchery salmon drives a phenological shift and potentialmaladaptation to climate change. Evol Appl 2019;12:1344–59.
31.Sweeting RM, Beamish RJ, Neville CM. Crystalline otoliths inteleosts: comparisons between hatchery and wild coho sla-mon (Oncorrhynchus kisutch) in the Straight of Georgia. Rev FishBiol Fisheries 2004;14:361–9.
32.Kihslinger RL, Lema SC, Nevitt GA. Environmental rearingconditions produce forebrain differences in wild Chinooksalmon Oncorhynchus tshawytscha. Comp Biochem Physiol A MolIntegr Physiol 2006;145: 145–51.
33.Kotrschal A, Sundstrom LF, Brelin D, Devlin RH, Kolm N.Inside the heads of David and Goliath: environmental effectson brain morphology among wild and growth-enhancedcoho salmon Oncorhynchus kisutch. J Fish Biol 2012;81:987–1002.
34.Stringwell R, Lock A, Stutchbury CJ, Baggett E, Taylor J, GoughPJ, Garcia de Leaniz C. Maladaptation and phenotypic mis-match in hatchery-reared Atlantic salmon Salmo salar re-leased in the wild. J Fish Biol 2014;85: 1927–45.
35.Pulcini D, Wheeler PA, Cataudella S, Russo T, Thorgaard GH.Domestication shapes morphology in rainbow troutOncorhynchus mykiss. J Fish Biol 2013;82: 390–407.
36.de Mestral LG, Herbinger CM. Reduction in antipredator re-sponse detected between first and second generations of en-dangered juvenile Atlantic salmon Salmo salar in a captivebreeding and rearing programme. J Fish Biol 2013;83:1268–86.
37.Salvanes AGV. Are antipredator behaviours of hatchery Salmosalar juveniles similar to wild juveniles? J Fish Biol 2017;90:1785–96.
38.Harvey AC, Solberg MF, Troianou E, Carvalho GR, Taylor MI,Creer S, Dyrhovden L, Matre IH, Glover KA. Plasticity ingrowth of farmed and wild Atlantic salmon: is the increasedgrowth rate of farmed salmon caused by evolutionary adap-tations to the commercial diet? BMC Evol Biol 2016;16:264.
39.Vainikka A, Kallio-Nyberg I, Heino M, Koljonen ML. Divergenttrends in life-history traits between Atlantic salmon Salmosalar of wild and hatchery origin in the Baltic Sea. J Fish Biol2010;76: 622–40.
40.Horreo JL, Valiente AG, Ardura A, Blanco A, Garcia-GonzalezC, Garcia-Vazquez E. Nature versus nurture? Consequencesof short captivity in early stages. Ecol Evol 2018;8: 521–9.
41.De Paoli T, Fuller-Tyszkiewicz M, Krug I. Insecure attachmentand maladaptive schema in disordered eating: the mediatingrole of rejection sensitivity. Clin Psychol Psychother 2017;24:1273–84.
42.Barlaup BT, Rund H, Normann ES, Stranzl S, Mahlum S,Vollset KW. Out of sync: monitoring the time of sea entry ofwild and hatchery salmon Salmo salar smolt using floatingpassive-integrated transponder antennae. J Fish Biol 2018;93:455–64.
43.Lavoie C, Courcelle M, Redivo B, Derome N. Structural andcompositional mismatch between captive and wild Atlanticsalmon (Salmo salar) parrs’ gut microbiota highlights the rele-vance of integrating molecular ecology for management andconservation methods. Evol Appl 2018;11: 1671–85.
Epigenetic impacts on hatchery fish phenotypic variation | 15
Dow
nloaded from https://academ
ic.oup.com/eep/article/7/1/dvab002/6274935 by guest on 04 July 2022

44.Heath DD, Heath JW, Bryden CA, Johnson RM, Fox CW. Rapidevolution of egg size in captive salmon. Science 2003;299:1738–40.
45.Chittenden CM, Biagi CA, Davidsen JG, Davidsen AG, KondoH, McKnight A, Pedersen OP, Raven PA, Rikardsen AH,Shrimpton JM, Zuehlke B, McKinley RS, Devlin RH. Geneticversus rearing-environment effects on phenotype: hatcheryand natural rearing effects on hatchery- and wild-born cohosalmon. PLoS One 2010;5: e12261.
46.Guerrero-Bosagna C, Settles M, Lucker B, Skinner M.Epigenetic transgenerational actions of vinclozolin on pro-moter regions of the sperm epigenome. PLoS One 2010;5:e13100-17.
47.Harris RA, Wang T, Coarfa C, Nagarajan RP, Hong C, DowneySL, Johnson BE, Fouse SD, Delaney A, Zhao Y, Olshen A,Ballinger T, Zhou X, Forsberg KJ, Gu J, Echipare L, O’Geen H,Lister R, Pelizzola M, Xi Y, Epstein CB, Bernstein BE, HawkinsRD, Ren B, Chung WY, Gu H, Bock C, Gnirke A, Zhang MQ,Haussler D, Ecker JR, Li W, Farnham PJ, Waterland RA,Meissner A, Marra MA, Hirst M, Milosavljevic A, Costello JF.Comparison of sequencing-based methods to profile DNAmethylation and identification of monoallelic epigeneticmodifications. Nat Biotechnol 2010;28:1097–105.
48.Skinner MK, Manikkam M, Haque MM, Zhang B, SavenkovaM. Epigenetic transgenerational inheritance of somatic tran-scriptomes and epigenetic control regions. Genome Biol 2012;13:R91.
49.Haque MM, Nilsson EE, Holder LB, Skinner MK. Genomic clus-tering of differential DNA methylated regions (epimutations)associated with the epigenetic transgenerational inheritanceof disease and phenotypic variation. BMC Genomics 2016;17:418.1–13.
50.Skinner MK, Guerrero-Bosagna C. Role of CpG deserts in theepigenetic transgenerational inheritance of differential DNAmethylation regions. BMC Genomics 2014;15:692.
51.Nozawa M, Kawahara Y, Nei M. Genomic drift and copy num-ber variation of sensory receptor genes in humans. Proc NatlAcad Sci USA 2007;104:20421–6.
52.Rakyan VK, Blewitt ME, Druker R, Preis JI, Whitelaw E. Metastableepialleles in mammals. Trends Genet 2002;18: 348–51.
53.Dolinoy DC, Das R, Weidman JR, Jirtle RL. Metastable epial-leles, imprinting, and the fetal origins of adult diseases.Pediatr Res 2007;61:30R–7R.
54.Gazave E, Darre F, Morcillo-Suarez C, Petit-Marty N, Carre~no A,Marigorta UM, Ryder OA, Blancher A, Rocchi M, Bosch E, BakerC, Marques-Bonet T, Eichler EE, Navarro A. Copy number varia-tion analysis in the great apes reveals species-specific patternsof structural variation. Genome Res 2011;21:1626–39.
55.Poptsova M, Banerjee S, Gokcumen O, Rubin MA, DemichelisF. Impact of constitutional copy number variants on biologi-cal pathway evolution. BMC Evol Biol 2013;13:19.
56.Skinner MK, Gurerrero-Bosagna C, Haque MM, Nilsson EE,Koop JAH, Knutie SA, Clayton DH. Epigenetics and the evolu-tion of Darwin’s Finches. Genome Biol Evol 2014;6:1972–89.
57.Le Luyer J, Laporte M, Beacham TD, Kaukinen KH, Withler RE,Leong JS, Rondeau EB, Koop BF, Bernatchez L. Parallel epige-netic modifications induced by hatchery rearing in a Pacificsalmon. Proc Natl Acad Sci USA 2017;114:12964–9.
58.Gavery MR, Nichols KM, Goetz GW, Middleton MA, SwansonP. Characterization of genetic and epigenetic variation insperm and red blood cells from adult hatchery and natural-origin steelhead, Oncorhynchus mykiss. G3 (Bethesda) 2018;8:3723–36.
59.Yoshizaki G, Takeuchi Y, Kobayashi T, Ihara S, Takeuchi T.Primordial germ cells: the blueprint for a piscine life. FishPhysiol Biochem 2002;26:3–12.
60.Campbell B, Dickey JT, Swanson P. Endocrine changes duringonset of puberty in male spring Chinook salmon,Oncorhynchus tshawytscha. Biol Reprod 2003;69:2109–17.
61.Uribe MC, Grier HJ, Mejia-Roa V. Comparative testicular struc-ture and spermatogenesis in bony fishes. Spermatogenesis2014;4:e983400.
62.Knapp R, Carlisle SL. Testicular function and hormonal regu-lation in fishes, in Fishes, Hormones and Reproduction inVertebrates, DO Norris and KH Lopez, eds. 2011, AcademicPress, New York, NY. p. 43–63.
63.Navarro-Martin L, Vinas J, Ribas L, Diaz N, Gutierrez A, Di Croce L,Piferrer F. DNA methylation of the gonadal aromatase (cyp19a)promoter is involved in temperature-dependent sex ratio shiftsin the European sea bass. PLoS Genet 2011;7:e1002447.
64.Burgerhout E, Mommens M, Johnsen H, Aunsmo A, Santi N,Andersen O. Genetic background and embryonic temperatureaffect DNA methylation and expression of myogenin andmuscle development in Atlantic salmon (Salmo salar). PLoSOne 2017;12:e0179918.
65.Uren Webster TM, Rodriguez-Barreto D, Martin SAM, VanOosterhout C, Orozco-terWengel P, Cable J, Hamilton A, GarciaDe Leaniz C, Consuegra S. Contrasting effects of acute andchronic stress on the transcriptome, epigenome, and immuneresponse of Atlantic salmon. Epigenetics 2018;13:1191–207.
66.Ben Maamar M, Nilsson E, Sadler-Riggleman I, Beck D,McCarrey JR, Skinner MK. Developmental origins of transge-nerational sperm DNA methylation epimutations followingancestral DDT exposure. Dev Biol 2019;445:280–93.
67.Nair SS, Coolen MW, Stirzaker C, Song JZ, Statham AL,Strbenac D, Robinson MD, Clark SJ. Comparison of methyl-DNA immunoprecipitation (MeDIP) and methyl-CpG bindingdomain (MBD) protein capture for genome-wide DNA methyl-ation analysis reveal CpG sequence coverage bias. Epigenetics2011;6:34–44.
68.Ben Maamar M, Sadler-Riggleman I, Beck D, Skinner MK.Genome-wide mapping of DNA methylation 5mC byMethylated DNA immunoprecipitation (MeDIP)-sequencing.DNA Modif Methods Mol Biol 2021;2198:301–10.
69.Zhou L, Ng HK, Drautz-Moses DI, Schuster SC, Beck S, Kim C,Chambers JC, Loh M. Systematic evaluation of library prepa-ration methods and sequencing platforms for high-through-put whole genome bisulfite sequencing. Sci Rep 2019;9:10383.
70.Nilsson E, Sadler-Riggleman I, Skinner MK. Environmentallyinduced epigenetic transgenerational inheritance of disease.Environ Epigenet 2018;4:dvy016-13.
71.Blankenship SM, Campbell MR, Hess JE, Hess MA, Kassler TW,Kozfkay CC, Matala AP, Narum SR, Paquin MM, Small MP,Stephenson JJ, Warheit KI, Moran P. Major lineages and meta-populations in Columbia River Oncorhynchus mykiss are struc-tured by dynamic landscape features and environments.Trans Am Fish Soc 2011;140:665–84.
72.Skinner MK, Guerrero-Bosagna C, Haque MM.Environmentally induced epigenetic transgenerational in-heritance of sperm epimutations promote genetic mutations.Epigenetics 2015;10:762–71.
73.Gavery MR, Nichols KM, Berejikian BA, Tatara CP, Goetz GW,Dickey JT, Van Doornik DM, Swanson P. Temporal dynamicsof DNA methylation patterns in response to rearing juvenilesteelhead (Oncorhynchus mykiss) in a hatchery versus simu-lated stream environment. Genes (Basel) 2019;10:356.
16 | Environmental Epigenetics, 2021, Vol. 7, No. 1
Dow
nloaded from https://academ
ic.oup.com/eep/article/7/1/dvab002/6274935 by guest on 04 July 2022
74. Johnsson JI, Brockmark S, Naslund J. Environmental effectson behavioural development consequences for fitness of cap-tive-reared fishes in the wild. J Fish Biol 2014;85:1946–71.
75.Bert B, Chmielewska J, Bergmann S, Busch M, Driever W,Finger-Baier K, Hoßler J, Kohler A, Leich N, Misgeld T, NoldnerT, Reiher A, Schartl M, Seebach-Sproedt A, Thumberger T,Schonfelder G, Grune B. Considerations for a European ani-mal welfare standard to evaluate adverse phenotypes in tele-ost fish. EMBO J 2016;35:1151–4.
76.Arkoosh MR, Kagley AN, Anulacion BF, Boylen DA, SandfordBP, Loge FJ, Johnson LL, Collier TK. Disease susceptibility ofhatchery snake river spring-summer Chinook salmon withdifferent juvenile migration histories in the Columbia River. JAquat Anim Health 2006;18:223–31.
77.Furey NB, Armstrong JB, Beauchamp DA, Hinch SG. Migratorycoupling between predators and prey. Nat Ecol Evol 2018;2:1846–53.
78.Fullerton AH, Torgersen CE, Lawler JJ, Steel EA, Ebersole JL,Lee SY. Longitudinal thermal heterogeneity in rivers and re-fugia for coldwater species: effects of scale and climatechange. Aquat Sci 2018;80:1–15.
79.Hall ER, Wickes L, Burnett LE, Scott GI, Hernandez D, Yates KK,Barbero L, Reimer JJ, Baalousha M, Mintz J, Cai WJ, Craig JK,DeVoe MR, Fisher WS, Hathaway TK, Jewett EB, Johnson Z,Keener P, Mordecai RS, Noakes S, Phillips C, Sandifer PA,Schnetzer A, Styron J. Acidification in the U.S. Southeast: causes,Potential Consequences and the Role of the Southeast Oceanand Coastal Acidification Network. Front Mar Sci 2020;7:1–548.
Epigenetic impacts on hatchery fish phenotypic variation | 17
Dow
nloaded from https://academ
ic.oup.com/eep/article/7/1/dvab002/6274935 by guest on 04 July 2022