msw293.pdf - Oxford Academic
14
A Working Model of the Deep Relationships of Diverse Modern Human Genetic Lineages Outside of Africa Mark Lipson* ,1 and David Reich* ,1,2,3 1 Department of Genetics, Harvard Medical School, Boston, MA 2 Medical and Population Genetics Program, Broad Institute of MIT and Harvard, Cambridge, MA 3 Howard Hughes Medical Institute, Harvard Medical School, Boston, MA *Corresponding authors: E-mails: [email protected]; [email protected]. Associate editor: Jeffrey P. Townsend Abstract A major topic of interest in human prehistory is how the large-scale genetic structure of modern populations outside of Africa was established. Demographic models have been developed that capture the relationships among small numbers of populations or within particular geographical regions, but constructing a phylogenetic tree with gene flow events for a wide diversity of non-Africans remains a difficult problem. Here, we report a model that provides a good statistical fit to allele-frequency correlation patterns among East Asians, Australasians, Native Americans, and ancient western and northern Eurasians, together with archaic human groups. The model features a primary eastern/western bifurcation dating to at least 45,000 years ago, with Australasians nested inside the eastern clade, and a parsimonious set of admixture events. While our results still represent a simplified picture, they provide a useful summary of deep Eurasian population history that can serve as a null model for future studies and a baseline for further discoveries. Key words: population genetics, human history, admixture graph. Introduction Modern humans are widely believed to have evolved first in sub-Saharan Africa and then to have spread at least once, and possibly several times, into Asia and Europe (Groucutt et al. 2015). The earliest strong archaeological evidence of modern human occupation outside of Africa comes from the Levant, approximately 100 thousand years ago (kya), but these and other Middle Paleolithic remains from Southwest (Armitage et al. 2011) and South Asia (Blinkhorn et al. 2013) may or may not be from groups related to present-day Eurasians. By con- trast, the modern human remains that appear across most of the broad areas of Eurasia during the Late Paleolithic (40–50 kya) can plausibly be interpreted as continuous with present- day populations (Groucutt et al. 2015). Numerous studies have addressed the genetic history of the modern human expansion out of Africa. Many of the first insights were provided by single-locus systems, and while we generally adopt an autosomal perspective here, active re- search continues with mitochondrial DNA (Posth et al. 2016), Y chromosomes (Hallast et al. 2015; Karmin et al. 2015), and microbial pathogens (e.g., H. pylori; Montano et al. 2015). Multi-locus analyses have shown that, to a first approximation, modern humans in Eurasia can be divided into what we will refer to as eastern and western clades. The former includes present-day East Asians and had differ- entiated as early as the 40 kya Tianyuan individual (Fu et al. 2013), while early members of the latter include ancient European hunter-gatherers (Lazaridis et al. 2014; Seguin- Orlando et al. 2014; Fu et al. 2016) and the ancient northern Eurasian Mal’ta 1 (MA1, a 24 kya Upper Paleolithic individ- ual from south-central Siberia) (Raghavan et al. 2014). More recent (Neolithic and later) western Eurasians, such as Europeans, are mostly descended from the western clade but with an additional component of “Basal Eurasian” ances- try (via the Near East) splitting more deeply than any other known non-African lineage (Lazaridis et al. 2014, 2016). The timing of the eastern/western split is uncertain, but several papers (Gutenkunst et al. 2009; Laval et al. 2010; Gravel et al. 2011) have used present-day European and East Asian pop- ulations to infer dates of initial separation of 40–45 kya (ad- justed for a mutation rate of 0:5 10 9 per year; Scally 2016). Interestingly, two early modern Eurasians (Ust’-Ishim (Fu et al. 2014), from 45 kya in western Siberia, and Oase 1 (Fu et al. 2015), from 40 kya in Romania) have been found that share little or no ancestry with either clade, unlike any known present-day population. After the initial modern human col- onization of Eurasia, later migrations led to the formation of major populations with mixed ancestry from both clades, notably including South Asians (Reich et al. 2009) and Native Americans (Raghavan et al. 2014). It has also been proposed that ancestors of Europeans and East Asians expe- rienced continuing gene flow after the initial eastern/western separation (Gutenkunst et al. 2009; Laval et al. 2010; Gravel et al. 2011; Fu et al. 2016). It has been argued by some authors that this model of a primary split between eastern and western Eurasians is incor- rect for certain present-day populations from Oceania and Southeast Asia. Under the “southern route hypothesis,” Article ß The Author 2017. Published by Oxford University Press on behalf of the Society for Molecular Biology and Evolution. This is an Open Access article distributed under the terms of the Creative Commons Attribution Non-Commercial License (http://creativecommons.org/licenses/by-nc/4.0/), which permits non-commercial re-use, distribution, and reproduction in any medium, provided the original work is properly cited. For commercial re-use, please contact [email protected] Open Access Mol. Biol. Evol. 34(4):889–902 doi:10.1093/molbev/msw293 Advance Access publication January 12, 2017 889 Downloaded from https://academic.oup.com/mbe/article/34/4/889/2838774 by guest on 23 January 2022
-
Upload
khangminh22 -
Category
Documents
-
view
3 -
download
0
Transcript of msw293.pdf - Oxford Academic

A Working Model of the Deep Relationships of Diverse ModernHuman Genetic Lineages Outside of Africa
Mark Lipson*,1 and David Reich*,1,2,3
1Department of Genetics, Harvard Medical School, Boston, MA2Medical and Population Genetics Program, Broad Institute of MIT and Harvard, Cambridge, MA3Howard Hughes Medical Institute, Harvard Medical School, Boston, MA
*Corresponding authors: E-mails: [email protected]; [email protected].
Associate editor: Jeffrey P. Townsend
Abstract
A major topic of interest in human prehistory is how the large-scale genetic structure of modern populations outside ofAfrica was established. Demographic models have been developed that capture the relationships among small numbersof populations or within particular geographical regions, but constructing a phylogenetic tree with gene flow events for awide diversity of non-Africans remains a difficult problem. Here, we report a model that provides a good statistical fit toallele-frequency correlation patterns among East Asians, Australasians, Native Americans, and ancient western andnorthern Eurasians, together with archaic human groups. The model features a primary eastern/western bifurcationdating to at least 45,000 years ago, with Australasians nested inside the eastern clade, and a parsimonious set ofadmixture events. While our results still represent a simplified picture, they provide a useful summary of deepEurasian population history that can serve as a null model for future studies and a baseline for further discoveries.
Key words: population genetics, human history, admixture graph.
IntroductionModern humans are widely believed to have evolved first insub-Saharan Africa and then to have spread at least once, andpossibly several times, into Asia and Europe (Groucutt et al.2015). The earliest strong archaeological evidence of modernhuman occupation outside of Africa comes from the Levant,approximately 100 thousand years ago (kya), but these andother Middle Paleolithic remains from Southwest (Armitageet al. 2011) and South Asia (Blinkhorn et al. 2013) may or maynot be from groups related to present-day Eurasians. By con-trast, the modern human remains that appear across most ofthe broad areas of Eurasia during the Late Paleolithic (�40–50kya) can plausibly be interpreted as continuous with present-day populations (Groucutt et al. 2015).
Numerous studies have addressed the genetic history ofthe modern human expansion out of Africa. Many of the firstinsights were provided by single-locus systems, and while wegenerally adopt an autosomal perspective here, active re-search continues with mitochondrial DNA (Posth et al.2016), Y chromosomes (Hallast et al. 2015; Karmin et al.2015), and microbial pathogens (e.g., H. pylori; Montanoet al. 2015). Multi-locus analyses have shown that, to a firstapproximation, modern humans in Eurasia can be dividedinto what we will refer to as eastern and western clades.The former includes present-day East Asians and had differ-entiated as early as the�40 kya Tianyuan individual (Fu et al.2013), while early members of the latter include ancientEuropean hunter-gatherers (Lazaridis et al. 2014; Seguin-Orlando et al. 2014; Fu et al. 2016) and the ancient northern
Eurasian Mal’ta 1 (MA1, a�24 kya Upper Paleolithic individ-ual from south-central Siberia) (Raghavan et al. 2014). Morerecent (Neolithic and later) western Eurasians, such asEuropeans, are mostly descended from the western cladebut with an additional component of “Basal Eurasian” ances-try (via the Near East) splitting more deeply than any otherknown non-African lineage (Lazaridis et al. 2014, 2016). Thetiming of the eastern/western split is uncertain, but severalpapers (Gutenkunst et al. 2009; Laval et al. 2010; Gravel et al.2011) have used present-day European and East Asian pop-ulations to infer dates of initial separation of 40–45 kya (ad-justed for a mutation rate of 0:5� 10�9 per year; Scally 2016).Interestingly, two early modern Eurasians (Ust’-Ishim (Fu et al.2014), from�45 kya in western Siberia, and Oase 1 (Fu et al.2015), from�40 kya in Romania) have been found that sharelittle or no ancestry with either clade, unlike any knownpresent-day population. After the initial modern human col-onization of Eurasia, later migrations led to the formation ofmajor populations with mixed ancestry from both clades,notably including South Asians (Reich et al. 2009) andNative Americans (Raghavan et al. 2014). It has also beenproposed that ancestors of Europeans and East Asians expe-rienced continuing gene flow after the initial eastern/westernseparation (Gutenkunst et al. 2009; Laval et al. 2010; Gravelet al. 2011; Fu et al. 2016).
It has been argued by some authors that this model of aprimary split between eastern and western Eurasians is incor-rect for certain present-day populations from Oceania andSoutheast Asia. Under the “southern route hypothesis,”
Article
� The Author 2017. Published by Oxford University Press on behalf of the Society for Molecular Biology and Evolution.This is an Open Access article distributed under the terms of the Creative Commons Attribution Non-Commercial License(http://creativecommons.org/licenses/by-nc/4.0/), which permits non-commercial re-use, distribution, and reproduction in anymedium, provided the original work is properly cited. For commercial re-use, please contact [email protected] Open AccessMol. Biol. Evol. 34(4):889–902 doi:10.1093/molbev/msw293 Advance Access publication January 12, 2017 889
Dow
nloaded from https://academ
ic.oup.com/m
be/article/34/4/889/2838774 by guest on 23 January 2022

Australians, New Guineans, and perhaps Southeast Asian“Negrito” populations are descended in part from an earlyout-of-Africa dispersal through southern Asia, with this com-ponent of ancestry splitting prior to the common ancestor ofother Eurasians (Lahr and Foley 1994; Rasmussen et al. 2011;Reyes-Centeno et al. 2014). Recently, several studies based onwhole-genome sequence data have presented more refinedmodels of Australasian ancestry (Mondal et al. 2016; Mallicket al. 2016; Malaspinas et al. 2016; Pagani et al. 2016); in par-ticular, we proposed a historical model that fit better withoutany such deep-source ancestry than with it (Mallick et al.2016).
Here, we study the deep relationships of most non-Africancontinental groups by building a unified historical modelbased on patterns of allele frequency correlations due to ge-netic drift. Where available, we incorporate relevant ancientindividuals alongside present-day populations. We also ac-count for gene flow from archaic humans (Green et al.2010; Reich et al. 2010), preventing potential confoundingin the relationships among modern human lineages. Whilewe acknowledge that our final model will not represent thecomplete truth, it represents (to our knowledge) the largestand most detailed such effort to date and can provide abaseline for future work.
Results
Overview of Best-Fitting Admixture GraphAs a starting point for our model, we used the set of popu-lations (minus Dai) from an admixture graph formulated inMallick et al. (2016): Chimpanzee, Altai Neanderthal (Pruferet al. 2014), Denisova (Meyer et al. 2012), Dinka, Kostenki 14(K14, a �37 kya Upper Paleolithic individual from Russia be-longing to the western Eurasian clade) (Seguin-Orlando et al.2014), New Guinea, Australia, Onge (an indigenous popula-tion from the Andaman Islands), and Ami (aboriginalTaiwanese, representing East Asians). The elements of themodel in Mallick et al. (2016) were mostly relatively straight-forward, with no admixture events aside from those involvingarchaic humans. The primary finding of interest was that theAustralasians (plus Onge) fit best as a clade with East Asians;incorporating a deeper “southern route” ancestry componentdid not improve the fit.
Here, for our primary results, we used single nucleotidepolymorphisms (SNPs) genotyped on the AffymetrixHuman Origins array, which gave us access to larger samplesizes and additional populations beyond those that are cur-rently available with whole-genome sequencing data. Withthe nine populations listed above (here New GuineaHighlanders {Reich et al. 2011} rather than the SGDPPapuan {Mallick et al. 2016}), we replicated the earlier re-sults: The graph fit well with the same topology, correctlypredicting all f-statistic relationships to within jZj ¼ 2:14(standard errors estimated by block jackknife; seeMaterials and Methods).
To this preliminary model, we added four additional pop-ulations: MA1, Ust’-Ishim, Mamanwa (a “Negrito” populationfrom the Philippines), and Suru�ı (an indigenous population
from Brazil). Mamanwa (with one component related toAustralasians and the other to East Asians; Reich et al. 2011;Lipson et al. 2014) and Suru�ı (with one component related toMA1 and the other to East Asians; Raghavan et al. 2014)immediately had clear signatures of admixture, while Ust’-Ishim required excess Neanderthal ancestry (Fu et al. 2014,2016). After adding these admixtures and optimizing the to-pology, the resulting model had 42 statistics that differed byat least two standard errors from their fitted values (max Z ¼2.68). Many of these were highly correlated, for example withNew Guinea substituted for Australia or with either Dinka orChimp as an outgroup. We identified four residuals that wereindependent and reflected quartets of populations formingapproximately unadmixed subtrees in the fitted model (to aidin interpretation; absolute value < 0.1 in 1000 times driftunits): f4(MA1, Ami; Denisova, Dinka) (residual Z ¼ 2.03),f4(Suru�ı, Altai; New Guinea, Australia) (Z ¼ 2.07), f4(Ust’-Ishim, Onge; Australia, Ami) (Z ¼ 2.17), and f4(MA1, K14;Ami, Ust’-Ishim) (Z ¼ 2.31). The first and last of these mo-tivated us to add additional admixture events to the model(see “Archaic humans” and “Western and northernEurasians”); the third is related to a residual signal we discussin more detail below (“Replication with SGDP data”); and thesecond could be connected to deeply splitting ancestry inAmazonian populations (Skoglund et al. 2015) (see “NativeAmericans”) but was not addressed here.
The full best-fitting admixture graph is shown in figure 1. Itis based on a total of�123k SNPs and includes 13 leaf nodes(i.e., directly sampled groups): Seven present-day populations,three ancient modern humans, two archaic humans, andChimp. There are nine admixture events, of which six arefrom archaic humans (although these likely do not all repre-sent separate historical events, as discussed below). All f-sta-tistics fit to within jZj ¼ 2:31, including all pairwise f2-statistics to within jZj ¼ 1:36 (fig. 2); inferred mixture pro-portions are indicated in figure 1 and can also be found intable 1. In what follows, we describe the features of the graphin more detail.
Archaic HumansThe top portion of the graph contains Altai, Denisova, andtheir ancestors. We included one of two previously inferredadmixtures into Denisova (Prufer et al. 2014): “unknown ar-chaic” ancestry from a source splitting deeper than the com-mon ancestor of the Neanderthal/Denisova clade withmodern humans. We do not have enough constraint to solvefor the precise mixture proportion (Materials and Methods)and thus prespecified it at 3%, within the range of the initialestimate. Allowing this proportion to vary freely only slightlyimproved the log-likelihood score of the model, whereas re-moving the admixture decreased the log-likelihood by about5.9 (P < 0.005 by likelihood ratio test {LRT}; see Materialsand Methods). We also considered the previously reportedNeanderthal admixture into Denisova, but our model doesnot provide sufficient constraint to observe this signal, so forthe sake of parsimony we omitted it from the final graph.
Our model also includes several instances of gene flowfrom archaic to modern humans. All present-day non-
Lipson and Reich . doi:10.1093/molbev/msw293 MBE
890
Dow
nloaded from https://academ
ic.oup.com/m
be/article/34/4/889/2838774 by guest on 23 January 2022
African populations in the graph fit well with a single, sharedNeanderthal introgression event. Consistent with previousresults (Fu et al. 2014, 2016; Seguin-Orlando et al. 2014),Ust’-Ishim and K14 require extra Neanderthal ancestry, withinferred proportions of 1.5% each; we use the same mixingNeanderthal for all events. We note that while there is evi-dence that present-day Europeans and related groups haveless Neanderthal ancestry than East Asians (Wall et al. 2013;Sankararaman et al. 2014; Vernot and Akey 2014; Lazaridis
et al. 2016), no such populations are present in our model(although see “Western and northern Eurasians” below). Asan overall trend, we recapitulate the finding of increased ar-chaic ancestry in ancient individuals (Fu et al. 2016), whichcould be evidence of purifying selection against introgressedsegments over time (Harris and Nielsen 2016; Juric et al. 2016).Thus, while the graph contains separate Neanderthal geneflow events for Ust’-Ishim and K14, these do not necessarilyreflect additional historical episodes of admixture.
FIG. 1. Final best-fitting graph model. Colors of filled nodes (sampled populations and selected internal split points) and edge arrows correspond tosubsets of the graph: green, Chimp and archaic; yellow, African and basal non-African; dark blue, eastern clade; light blue, Australasian sub-clade;red, western clade; purple, northern sub-clade. Tree edges (solid lines) are labeled with branch lengths in 1000 times drift units (rounded to thenearest integer value), while admixtures (dotted lines) are shown with their inferred proportions. The three drift lengths surrounding an admixtureevent (immediately preceding each mixing population and immediately following the admixed population) cannot be solved for individually inour framework and instead form a single compound parameter (Lipson et al. 2013); we omit the first two and report the total drift on the edgefollowing the admixture. The terminal drifts leading to ancient individuals are inflated as a result of a combination of single-individual populations,lower coverage, and/or haploid genotype calls.
A Working Model of the Deep Relationships of Diverse Modern Human Genetic Lineages . doi:10.1093/molbev/msw293 MBE
891
Dow
nloaded from https://academ
ic.oup.com/m
be/article/34/4/889/2838774 by guest on 23 January 2022

In addition to the previously documented Denisova-related introgression into Australasians (here 3.5% into thecommon ancestor of New Guinea, Australia, and Mamanwa),we find suggestive new evidence for Denisova-related ances-try in MA1, which we believe may explain the preliminaryresidual statistic f4(MA1, Ami; Denisova, Dinka) mentionedabove. A consistent signal of excess allele sharing betweenMA1 and archaic humans can be observed when using any ofDenisova, Altai Neanderthal, or the Vindija and MezmaiskayaNeanderthals (Green et al. 2010) (table 2). We also used anancient ingroup in place of Ami to ensure that this patterndoes not reflect an ancient DNA artifact (table 2, bottomhalf). While the differences between the rows in table 2 arenot statistically significant, MA1 appears to share the mostdrift with Denisova; the excess shared drift with Neanderthalswould also be expected in a scenario of Denisova-relatedintrogression on the basis of the sister relationship betweenNeanderthals and Denisova.
Motivated by these results, we tested the effects of includ-ing extra archaic ancestry in MA1 in our full graph model.
Adding Denisova-related admixture resulted in a significantlog-likelihood score improvement of 6.3 (P < 0.002), whereasinstead allowing additional Neanderthal gene flow improvedthe score by 2.3 (P ¼ 0.10). (We note that while the inferredbest-fitting source for the Denisova-related introgression wascloser to the Denisova sample than for Australasians, thedifference in fit quality was negligible, so for the sake of par-simony we used the same source for both events.) Given theconsistent pattern of greater Neanderthal ancestry in ancientsamples, however, a model with excess Neanderthal ancestrywould perhaps be a more reasonable null hypothesis. Usingsuch a model as a starting point, adding Denisova-relatedadmixture improved the score by a marginally significant4.0 (P < 0.02; when including Denisova-related admixture,the graph fit best without any extra Neanderthal gene flow).In our final model, we therefore (tentatively) includedDenisova-related (but not excess Neanderthal) gene flowinto MA1, with an inferred mixture proportion of 1.2%, or1.0% Denisova-related ancestry (95% confidence interval 0.4–1.6%; see Materials and Methods) in MA1 after dilution by
FIG. 2. Pairwise f2 residuals in the final model, in units of Z-score (fitted minus observed divided by standard error).
Table 1. Inferred Mixture Proportions with Alternative Data Sets.
Admixture event HO (%) SGDP (%) SGDP (tv) (%)
Neanderthal to non-Africans 2.6 4.3 4.2Neanderthal to Ust’-Ishim 1.5 1.9 1.6Neanderthal to K14 1.5 1.2 0.9Denisova to Australasians 3.5 3.0 3.1Denisova to MA1 1.2 0.5 0.6Western Eurasian to Suru�ı 26.6 28.2 25.2East Asian to Mamanwa 68.5 – –Eastern Eurasian to MA1 17.4 10.8 16.2
NOTE.—Inferred mixture proportions in the admixture graph. Final ancestry pro-portions in leaf-node populations may be lower if diluted by a second admixtureevent. The three sets of values are for the primary (Human Origins) data, SGDP, andSGDP restricted to transversions. Exact archaic admixture parameters should betreated with a degree of caution (see Materials and Methods, "Possible methodo-logical caveats").
Table 2. Relationship between MA1 and Archaic Humans.
Pop X Pop Y f4(MA1, X; Y, Dinka) Z-score
Ami Denisova 1.15 2.19Ami Altai 0.84 1.48Ami Vindija 0.86 1.60Ami Mezmaiskaya 1.76 1.39WHG Denisova 1.52 2.60WHG Altai 0.85 1.42
NOTE.—Statistics of the form f4(MA1, X; Y, Dinka) for a comparison population Xand archaic humans Y, along with Z-scores for difference from zero, computed onall available SNPs from panels 4 and 5 of the Human Origins array. WHG is definedas a combined Mesolithic western hunter-gatherer population consisting of the�8kya Loschbour (Lazaridis et al. 2014) and La Bra~na 1 (Olalde et al. 2014) individuals.A larger positive value indicates that MA1 shares more alleles with population Ythan does X. Because Ami and WHG have very similar levels of archaic ancestry(f4(Ami, WHG; Altai, Dinka) �0; jZj ¼ 0:24), we would expect similar values withX ¼ Ami or WHG.
Lipson and Reich . doi:10.1093/molbev/msw293 MBE
892
Dow
nloaded from https://academ
ic.oup.com/m
be/article/34/4/889/2838774 by guest on 23 January 2022

eastern Eurasian gene flow (while we specified the Denisova-related admixture to be older, exchanging the order did notaffect the quality of fit). Placing the Denisova-related admix-ture in the deeper northern Eurasian lineage shared withNative Americans made the score slightly worse, so in theabsence of any evidence for shared Denisova-related ancestry,we retained the mixture only into MA1. We also experi-mented with allowing Denisova-related ancestry in EastAsians but did not find any improvement in the fit, althoughwe would not have power to detect a very small contributionas previously inferred (Prufer et al. 2014; Sankararaman et al.2016).
Asian and Australasian PopulationsConsistent with previous results obtained with a simpler ad-mixture graph in Mallick et al. (2016), New Guinea andAustralia fit well as sister groups, with their majority ancestrycomponent forming a clade with East Asians (with respect towestern Eurasians). Onge fit as a near-trifurcation with theAustralasian and East Asian lineages, while Mamanwa areinferred to have three ancestry components: One branchingdeeply (but unambiguously) from the Australasian lineage(prior to the split between New Guinea and Australia); oneEast Asian-related (interpreted as Austronesian admixture);and one from Denisova. The Denisova-related introgressionin Mamanwa is shared with New Guinea and Australia andthen diluted �3� by the Austronesian admixture (here68.5%, when compared with 73% in Reich et al. (2011) and50–60% in a simpler model in Lipson et al. (2014)). In a pre-vious study (Reich et al. 2011), Australia and New Guineawere modeled as having about half of their ancestry fromeach of two components: One forming a trifurcation withOnge and East Asians, and the other splitting more recentlyfrom the Onge lineage. Here, we obtain a satisfactory fit with-out this admixture, and while we cannot rule it out entirely,we do not have strong evidence for rejecting our simplermodel. We also note that the previous model, by virtue ofits different topology, included relatively more Denisova-related ancestry in Mamanwa (�50% as much as inAustralia), although both versions appear to fit the datasatisfactorily.
We also performed two additional analyses involving min-imal modeling assumptions to test for possible southernroute ancestry in Australasians. First, we used a methodthat leverages a large set of f4-statistics from different out-group populations in elucidating admixture in a populationof interest (Haak et al. 2015). Given a population Test, we plotf4-statistics f4(Test, Ref1; Oi, Oj) against f4(Test, Ref2; Oi, Oj) forreferences Ref1 and Ref2 and all pairs of outgroups from a setO1, O2,. . ., Ok. If Test is well modeled as a two-way admixtureof populations related to Ref1 and Ref2 in proportions a and1� a, then f4(Test, Ref1; Oi, Oj) ¼ ð1� aÞf4(Ref2, Ref1; Oi,Oj), and f4(Test, Ref2; Oi, Oj) ¼ af4(Ref1, Ref2; Oi, Oj) ¼�af4(Ref2, Ref1; Oi, Oj). Thus, the points should show a neg-ative correlation, where the slope is informative about themixture proportions (Haak et al. 2015).
We tested New Guinea as a two-way mixture between anEast Asian-related population (Ref1¼Ami) and Denisova
(Ref2), using outgroups Chimp, Altai, Dinka, Ust’-Ishim, andK14. The negative correlation is very strong (fig. 3), with nopoints in the plot indicating a significant violation of a NewGuinea/East Asian clade. We note that if a deep-lineage com-ponent were present in New Guinea, we would expect todetect it via this set of outgroups, as it would push the pointsdefined by (Oi, Oj) for Oi ¼ Dinka and Oj ¼ Ust’-Ishim or K14off the line.
We then applied qpWave (Reich et al. 2012) to a larger setof test populations simultaneously to test formally for evi-dence of multiple waves of admixture. Using the same out-groups plus Denisova (right pop list: Chimp, Altai, Denisova,Dinka, Ust’-Ishim, K14), we computed how many ancestrycomponents are necessary to relate the following set of(left) test populations: Ami, Dai, Kinh, Han, Bougainville,New Guinea Highlanders, HGDP Papuan, Australian, Onge,and Mamanwa. We find that this set is consistent with justtwo ancestral components (rank 1 tail P ¼ 0.27), where theloadings appear to be driven primarily by the gradient ofDenisova-related ancestry, as expected. As above, this testcan only distinguish components that differ relative to theoutgroups, but we would expect to see a signal of any sub-stantial ancestry from a source diverging prior to the eastern/western Eurasian split.
Western and Northern EurasiansWe used the K14 and MA1 individuals to capture the roots oftwo major western Eurasian lineages (a western clade and anorthern/eastern clade, respectively; Raghavan et al. 2014;Seguin-Orlando et al. 2014; Haak et al. 2015). Recent focusedstudies of later European prehistory have developed detailedmodels involving numerous admixture events (Lazaridis et al.2014; Seguin-Orlando et al. 2014; Haak et al. 2015; Fu et al.2016); as a result of this complexity, we deemed it beyond thescope of the present work to include present-day westernEurasians (although we address Europeans below).
In our model, K14 fits well as unadmixed (aside from ar-chaic introgression), but MA1 receives, in addition to its ar-chaic admixture, a component of eastern Eurasian ancestry.The latter gene flow explains the preliminary residual f4(MA1,K14; Ami, Ust’-Ishim), which is of a similar form to severalother relatively poorly fitting statistics from our initial graph,for example f4(MA1, K14; Ami, New Guinea) ¼ 2.00 (fitted0.08; Z ¼ 2.68) and f4(MA1, Ust’-Ishim; Ami, New Guinea) ¼1.73 (fitted 0.08; Z ¼ 2.49). We added this admixture intoour model with its best-fitting source position (near the rootof the East Asian lineage) and mixture proportion (17.4% EastAsian-related ancestry, 95% CI 7.7–27.4%). The graph scoreimproved by 7.0 (P< 0.001), indicating a significant improve-ment in the fit. We also attempted to fit the full graph withwest-to-east gene flow instead, and the overall score was sig-nificantly worse (log-likelihood difference of 4.6 with the samenumber of free parameters).
Similar statistics (D(MA1, K14; Han, Mbuti) with Z ¼ 5.4and D(Loschbour, K14; Han, Mbuti) with Z ¼ 5.3) were re-ported in the initial genetic analysis of K14 (Seguin-Orlandoet al. 2014) and were interpreted there as evidence that K14harbored Basal Eurasian ancestry. However, it has been shown
A Working Model of the Deep Relationships of Diverse Modern Human Genetic Lineages . doi:10.1093/molbev/msw293 MBE
893
Dow
nloaded from https://academ
ic.oup.com/m
be/article/34/4/889/2838774 by guest on 23 January 2022

in an analysis of a larger set of pre-Neolithic Europeans (Fuet al. 2016) that these signals in fact appear to reflect shareddrift between a subset of western Eurasian hunter-gatherers(including MA1 and Mesolithic Europeans such asLoschbour) and East Asians. This is particularly evidentfrom our primary statistic f4(MA1, K14; Ami, Ust’-Ishim):Even if K14 did have a component of deeply diverging ances-try, it would not share extra drift with Ust’-Ishim (likewise, thisstatistic is essentially unaffected by excess archaic ancestry inK14).
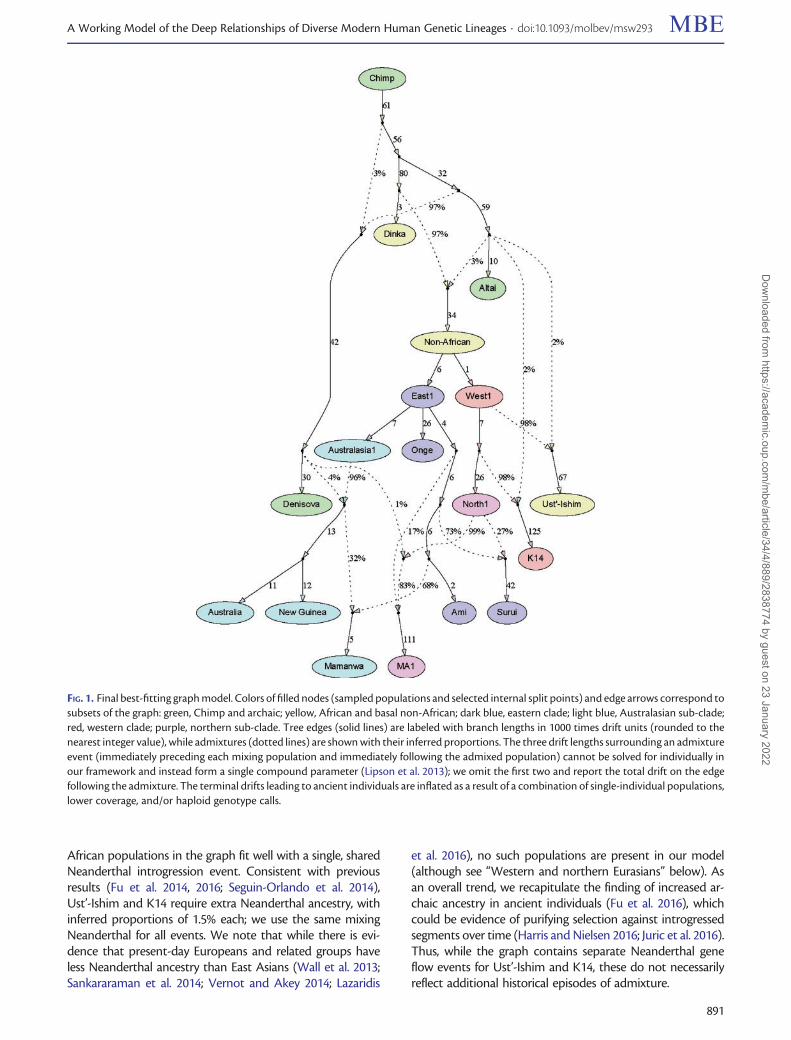
To support our inference of the directionality of gene flowbetween eastern Eurasians and MA1 (which was not ad-dressed in Fu et al. 2016), we compared the two statistics:(1) f4(MA1, K14; Ami, Ust’-Ishim) ¼ 1.89 (Z ¼ 2.76) and (2)f4(Ust’-Ishim, MA1; Onge, Ami) ¼ 0.23 (Z ¼ 0.52) (com-puted on all available Human Origins SNPs). In figure 4, weshow alternative models in which the flow is east to west,with MA1 admixed (A), or west to east, with Ami admixed(B). The statistics (1) and (2) have expected values equal to abranch length (red for (1) and black for (2)) times the mixtureproportion a. As can be seen, the models are distinguishableby which statistic has the greater magnitude (as observedindependently in more generality by Pease and Hahn(2015)). In truth, the admixture may have been complex
and bidirectional, but the fact that the observed value of(1) is significantly larger in magnitude than (2) (Z ¼ 2.29for the difference via block jackknife) argues for east-to-west (fig. 4A) as the primary direction, with MA1 admixed.The same pattern is observed with other outgroups in placeof Ust’-Ishim (Z ¼ 3:42, 2.74, 1.84, 2.90 for the analogousdifference using Dinka, Altai, Denisova, and Chimp, respec-tively). We also repeated the computation with other westernEurasian populations in place of MA1 and found the samesignal of eastern Eurasian relatedness, including the same pre-ferred directionality, in WHG (defined as in table 2; Z ¼ 2.04for the difference), Caucasus hunter-gatherers (CHG; Joneset al. 2015; Z ¼ 1.77), and Afontova Gora 3 (AG3, a �17kya individual from Siberia closely related to MA1; Fu et al.2016; Z ¼ 2.17). We note that a recent study (Lazaridis et al.2016) found a cline of MA1-relatedness among a large num-ber of present-day eastern Eurasian populations and arguedfor admixture from west to east instead; while the presentanalysis supports the other direction, an important subjectfor future work will be to reconcile these results.
While we did not carefully model present-day Europeansin our main admixture graph, we did build an extended graphwith French added (25 individuals). A good fit was obtainedwith four ancestry components, related to western (K14),
FIG. 3. Plot of f4-statistics f4(New Guinea, Ami; Oi, Oj) against f4(New Guinea, Denisova; Oi, Oj) for all pairs of outgroup populations O from the setconsisting of Chimp, Altai, Dinka, Ust’-Ishim, and K14. The R2 value for the best-fitting line through the origin is shown. The negative correlationimplies that New Guinea can be modeled as a mixture of populations related to Ami and Denisova, with the slope informative about the relativeproportions (as shown). Standard errors are approximately 0.0005 along the x-axis and 0.001 along the y-axis.
Lipson and Reich . doi:10.1093/molbev/msw293 MBE
894
Dow
nloaded from https://academ
ic.oup.com/m
be/article/34/4/889/2838774 by guest on 23 January 2022
northern (near the base of the MA1 lineage), and eastern(specified as the same source as for MA1) Eurasians, plusBasal Eurasian (specified without Neanderthal introgression;Lazaridis et al. 2016). The inferred proportions were 27.7%,34.9%, 23.2%, and 14.2%, respectively, with essentially nochange in the list of residuals. We note that these sourcesdo not represent the proximal ancestral populations ofpresent-day Europeans (Lazaridis et al. 2014; Haak et al.2015), and this fit also may not be the optimal one, but itdoes provide a sense of the relationships of Europeans to themajor lineages defined in our model.
Lastly, we also briefly studied two other ancient Europeanlineages. First, we built a version of our model with WHG inplace of MA1 and found that it fit in a similar fashion (ma-jority component of WHG’s ancestry as a sister group to K14,plus eastern Eurasian gene flow). Second, we fit an expandedgraph with MA1, K14, and the early modern human Oase 1(Fu et al. 2015). Because of possible contamination, we usedthe published damage-restricted data, which reduced the setof SNPs with coverage in all populations to �28k. The in-ferred graph was similar overall, with modest changes due tothe smaller set of SNPs. Oase 1 was inferred to diverge from
the western Eurasian (K14) lineage, slightly later than Ust’-Ishim (shared drift 1.6), but still close to the split of the easternand western clades. As shown in Fu et al. (2015), Oase 1 has asignificant excess of Neanderthal ancestry, which we inferredat 8.3% in the extended model.
Native AmericansWe included Suru�ı, from Brazil, a Native American populationwithout recent European admixture. As previously demon-strated for Native Americans generally (Raghavan et al. 2014),we found that they fit well in the model as a mixture ofcomponents related to East Asians (73%) and MA1 (27%).This proportion of western Eurasian ancestry is lower thanpreviously inferred (�40% in Raghavan et al. 2014), whichmay be because we are separately modeling East Asian-related gene flow into MA1. It has also been shown thatSuru�ı harbor a few percent ancestry from a “Population Y”related to Onge and Australasians (Skoglund et al. 2015). Inthe context of our model, with only one Native Americanpopulation present, this admixture should only have a minoreffect, although we do see hints of such a signal, as mentionedabove.
Early Out-of-Africa Split PointsAfter the divergence of Dinka from non-Africans, the nextsplit point on the modern human lineage in our model is thatbetween the major eastern and western clades (the nodelabeled “Non-African”—although we note that the split pointof Basal Eurasian would be deeper.) This split is soon followedon the western Eurasian branch by the split between K14 andUst’-Ishim (i.e., their respective modern-human ancestrycomponents). The original Ust’-Ishim analysis (Fu et al.2014) inferred a near-trifurcation at this point, and we wishedto test whether K14 (and other western Eurasians) and Ust’-Ishim form a statistically supported clade. In fact, while thebest-fitting position for Ust’-Ishim is on the western lineage(0.6 shared drift), the inferred 95% confidence interval for thispoint overlaps the eastern/western split (standard error 0.4for the Ust’-Ishim split position), so that we cannot confi-dently resolve the branching order. We therefore continue toregard this cluster as approximately a trifurcation; while weshow Ust’-Ishim at its best-fitting split point in figure 1, wecolor-code it as a basal non-African rather than a member ofthe western clade.
We also investigated another near-trifurcation, near thetop of the eastern Eurasian clade, where the East Asian,Onge, and Australasian lineages are inferred to diverge in ashort span. Here, the best-fitting arrangement features Ongeand East Asians as a weak clade (p � 0:02), but the modelreaches a second, only slightly inferior local optimum withOnge and Australasians as sister groups instead, possibly sug-gesting admixture between two of the three lineages. Anadmixture event in either Onge (between the Australasianand East Asian lineages) or Australasians (between the Ongeand deep eastern Eurasian lineages) is likewise weakly signif-icant (p � 0:02), but with no discriminatory power betweenthese two scenarios. Ultimately, we chose to present themodel with a trifurcation at this point because we felt it
FIG. 4. Admixture graph schematics representing alternative histor-ical scenarios to explain shared drift between MA1 and East Asians.(A) MA1 is admixed, with East Asian-related ancestry. (B) Ami isadmixed, with MA1-related ancestry. Other relationships are as-sumed as shown (the position of the root is arbitrary). The expectedvalues of the statistics (1) f4(MA1, K14; Ami, Ust’-Ishim) and (2)f4(Ust’-Ishim, MA1; Onge, Ami) are equal to a branch length timesa mixture proportion: red for (1) and black for (2) [times a1 in (A) anda2 in (B)].
A Working Model of the Deep Relationships of Diverse Modern Human Genetic Lineages . doi:10.1093/molbev/msw293 MBE
895
Dow
nloaded from https://academ
ic.oup.com/m
be/article/34/4/889/2838774 by guest on 23 January 2022

best conveyed our uncertainty: No pair of lineages clearlyshares more drift, and it is likely that some admixture tookplace, but we cannot accurately determine which lineage orlineages were involved or constrain the exact proportions orsources.
Power to Detect Admixture EventsThe set of admixture events we have included is limited byour power to detect statistically significant deviations fromthe proposed model. Suppose that we specify a quartet ofpopulations as unadmixed with the topology ((A, B),(C, D)). Ifpopulation A is in fact admixed with a component of ancestryrelated to C (in an unrooted sense), then we will observe aresidual statistic f4(A, B; C, D) with expected value cL, where cis the C-related mixture proportion and L is the branch lengthin the graph that is shared uniquely between this componentand population C (Reich et al. 2009; Patterson et al. 2012). Forour data set, in 1000 times drift units, standard errors onobserved f4-statistics are on the order of 0.5. Thus, in orderto observe a residual at Z ¼ 2 (for example), an admixtureevent would have to satisfy (approximately) cL > 1. We notethat while c is a fixed parameter, L depends on how close areference C is available (and one must also have access topopulations B and D with the proper topology).
We were particularly interested in the question of powerto detect possible southern route ancestry in Australasians. Inthis case, population A would be Australasians, population Bwould be an East or Southeast Asian group without a south-ern route component, population C would be an outgroup(African, archaic, or Chimp), and population D would be awestern Eurasian. The length L would measure the distancefrom the “Non-African” node up to the split point of thesouthern route source. A more thorough empirical analysisof this question in Mallick et al. (2016) concluded that anysouthern route component in Australasians is unlikely tocomprise more than several percent. If, for example, thedeeper ancestry were from a population that split halfwaybetween the “Non-African” node and the African/non-African ancestor (L � 17), then via the inequality above, wewould have power to find roughly 6% admixture or more,similar to the previous results. For a split closer to the “Non-African” node, our power would be reduced, while for adeeper split (e.g., the �120 kya proposed by Pagani et al.(2016)), it would be enhanced.
We also carried out two tests using our admixture graph toexamine our power empirically in cases of well-known admix-ture. First, we studied the �27% MA1-related ancestry inSuru�ı. In order to make our available constraints similar tothe hypothetical southern route case, we removed MA1, K14,and Ust’-Ishim from the model. With this reduced graph, if wemodel Suru�ı as unadmixed, we observe six residuals withZ> 3 (max 3.6), all of the form f4(Suru�ı, Asian; outgroup,Australasian). Thus, even without any western Eurasian refer-ences, we can easily locate the admixture signal (the relevantlength L is the branch between the “East1” and “Non-African”nodes, or approximately 6 units).
Second, we conducted a similar analysis for the Denisova-related ancestry in Australasians, having removed Onge,
Chimp, Altai, and Denisova from the model. In this case,we observe a residual f4(Australian, Suru�ı; Dinka, K14) atZ ¼ 2.01, roughly as expected given the known parametersof a few percent introgression and L � 34 (the full distancebetween the “Non-African” node and the African/non-African ancestor). This demonstrates our ability to detect avery small proportion of deep ancestry in Australasians with-out a close surrogate available, as would also be true forsouthern route admixture. While in this example the residualwas only weakly significant, it was obtained after relaxing anumber of key constraints from the full model, and even 1–2% more deep ancestry would have made for an unambigu-ous signal.
Replication with SGDP DataTo gain further perspective, we repeated our admixture graphanalysis with full sequence data from the SGDP (Mallick et al.2016). The set of populations we used was similar (althoughgenerally with smaller sample sizes; see Materials andMethods), with only two changes: We substituted HGDPPapuans instead of New Guinea Highlanders (which shouldnot be substantively different) and no longer had access todata for Mamanwa. We ascertained SNPs as polymorphicamong the four SGDP Mbuti individuals and merged withChimp, Altai, Denisova, Ust’-Ishim, K14, and MA1. The result-ing data set contained 1.99M SNPs overlapping allpopulations.
The best-fitting graph is shown in figure 5. Overall, it is verysimilar to our primary model, with only one change in topol-ogy (the eastern Eurasian admixture source for MA1 nowsplits closer to Ami) and small differences in inferred mixtureproportions (table 1). The SGDP model does have two resid-ual statistics falling more than 3 standard errors from theirfitted values: f4(Ust’-Ishim, Ami; Australia, Dinka) ¼ �4.34(fitted value �6.69; Z ¼ 3.52) and f4(Ust’-Ishim, Papuan;Australia, Dinka) ¼ �24.64 (fitted value �26.83; Z ¼3.02). A number of other residuals are also present withZ> 2 showing the same apparent signal of shared drift be-tween Ust’-Ishim and Australasians (for example, with Altai orDenisova in place of Dinka); these statistics are not indepen-dent, but the overlap argues that it is indeed this pair ofpopulations that drives the two most significant residuals.
While this signal is intriguing, we ultimately decided not toadd a new admixture event to the model to account for it.We considered the possibility either of gene flow from a pop-ulation related to Ust’-Ishim into the ancestors ofAustralasians or vice versa. Both would create a pattern ofshared drift as reflected in the residuals, but the two direc-tions would make distinct predictions in relation to otherpopulations. In the first scenario, we would expect the geneticaffinity to Ust’-Ishim to be unique to Australasians, and thisaffinity should be detectable in our previous analyses.However, neither the f4 correlation nor qpWave methodsshowed evidence of Ust’-Ishim-related admixture inAustralasians, and the signal of shared drift betweenAustralasians and Ust’-Ishim was only marginally significantin our main graph model; while based on fewer SNPs, thecorresponding statistics in fact had lower standard errors
Lipson and Reich . doi:10.1093/molbev/msw293 MBE
896
Dow
nloaded from https://academ
ic.oup.com/m
be/article/34/4/889/2838774 by guest on 23 January 2022

than those from the SGDP model, so the difference was notdue to a lack of power. In the second scenario, with Ust’-Ishimadmixed, we would expect a slightly different signature, sinceUst’-Ishim would then possess a component of ancestry that,in addition to being related to Australasians, also shares excessdrift with other eastern Eurasians. We do in fact observe twosuch (weaker) residual statistics: f4(Ust’-Ishim, K14; Onge,
Dinka) ¼ 1.37 (fitted value �0.21; Z ¼ 2.24) and f4(Ust’-Ishim, K14; Ami, Dinka) ¼ 1.30 (fitted value �0.21; Z ¼2.07). However, when we replicated these statistics withour main data set, using all available SNPs, they were onlyweakly positive (f4(Ust’-Ishim, K14; X, Dinka) ¼ 0.31, 0.62,0.72, 1.10 for X ¼ Onge, Ami, New Guinea, and Australia,respectively; Z ¼ 0:59, 1.18, 1.23, 1.18).
FIG. 5. Model fit with SGDP data. Notation is the same as in figure 1.
A Working Model of the Deep Relationships of Diverse Modern Human Genetic Lineages . doi:10.1093/molbev/msw293 MBE
897
Dow
nloaded from https://academ
ic.oup.com/m
be/article/34/4/889/2838774 by guest on 23 January 2022
We also compared the quality of fit of full graph models(using the SGDP data) in which we added an extra admixtureevent between Ust’-Ishim and Australasians in either direc-tion, with the hypothesis that if one of these models is correct,it should score better than the other. In both cases, the scoreimproved by more than 11, but the two models had similarresidual lists, and their log-likelihood scores only differed by�0.3. This would seem to indicate either that 1) the shareddrift signal does not reflect a true admixture, 2) there was veryevenly bidirectional gene flow, or 3) our model is not suffi-ciently powered to detect the true mixture source. Moreover,both graphs still had numerous other residuals involving Ust’-Ishim with Z-scores above 2 (up to Z ¼ 2.48 withAustralasians admixed and Z ¼ 2.89 with Ust’-Ishim ad-mixed). For the sake of comparison, using our main graphmodel, we applied a similar analysis to the inferred admixtureevent from eastern Eurasians into MA1. In that case, while thesignal was relatively weak, and there could be reason to be-lieve that the gene flow was not strictly east-to-west, we wereable to show that the admixture had a preferred directional-ity; as noted above, a model with gene flow in the reversedirection scored 4.6 worse. (For an example of a stronglyconstrained admixture event, if we fit a model with geneflow from Mamanwa to Ami rather than in reverse, the scoreis more than 400 worse.) To draw a more precise analogy, werepeated the model-fitting without K14 in the graph, so thatMA1 was the only western Eurasian population present (inthe same way that Ust’-Ishim is the only representative of itslineage). Not surprisingly, this caused the signal of direction-ality to be attenuated, but it was still present: A model witheast-to-west gene flow scored 1.2 better than the reverse.
Finally, we fit a version of our model on SGDP data butrestricted to transversion polymorphisms (a total of �622kSNPs) to test whether there could be any effects of ancientDNA damage patterns either on these residual signals or inthe model-fitting as a whole. The graph fit well overall, withthe same optimized topology as in our main results (restoringthe one difference present in the full-SGDP graph) and similarmixture proportions (table 1). The list of significant residualswas slightly shorter than with all SNPs, but the Ust’-Ishim-related signal was still present (although now stronger withPapuan than with Australia), with the most significant resid-ual, f4(Ust’-Ishim, Ami; Papuan, Dinka), now at Z ¼ 2.98. Thisleads us to conclude that neither this signal nor other resultsobtained in the full models are driven by ancient DNA dam-age. However, in light of our other analyses, we do not feelthat we have sufficient evidence at this time to assign theUst’-Ishim-related signal as a true admixture.
DiscussionOur proposed admixture graph provides both an integratedsummary of many population relationships among diversenon-African modern human groups and a framework fortesting additional hypothesis. As an example of the model’sutility, it can help to evaluate a signal previously used to arguefor deeply diverged ancestry in Aboriginal Australians(Rasmussen et al. 2011): f4(Australia, Han; Yoruba, French)
¼ 2.02 (Z ¼ 8.23), or with related populations in our ad-mixture graph, f4(Australia, Ami; Dinka, MA1) ¼ 1.43 (Z ¼3.01). While southern route ancestry would indeed causethese statistics to be positive, the admixture events specifiedin our model provide two (partial) alternative explanations,namely Denisova-related introgression into Australasians andgene flow between eastern and western Eurasians. In fact, thepredicted value of f4(Australia, Ami; Dinka, MA1) in our finalgraph is 1.72, slightly larger than the observed value, withoutany southern route ancestry in Australasians. Thus, this ex-ample illustrates how fitting a large number of groups simul-taneously can add context to the interpretation of observedpatterns in population genetic data.
In addition to providing a synthesis of previous results, wehave also proposed two new admixture events in MA1, bothof which seem plausible on geographical grounds but are notoverwhelmingly statistically significant and would be interest-ing topics for further study. One event, consisting of gene flowfrom an eastern Eurasian population, appears to be present aswell in other later western Eurasians, which makes it unlikelythat the signal could be due to contamination in MA1. Wenote though that this event could have involved one or more(unknown) intermediate populations rather than being di-rect, and we also cannot rule out a small amount of admix-ture in the reverse direction. The second, consisting ofDenisova-related gene flow, provides intriguing evidence ofa novel instance of archaic introgression, but it should besubject to additional scrutiny with more sensitive methodsto confirm whether the source has been accurately inferred(as opposed to excess introgression from Neanderthal or adifferent archaic group).
Furthermore, we show that we can obtain a good fit to thedata with no further admixture events beyond those specifiedin our model. In other words, even though our graph is insome ways relatively simple, with only three admixturesamong the 10 modern human populations, we do not findany large residuals (to the extent that we have statisticalpower). This does not mean that we have identified all ad-mixture events in the ancestry of these populations or thatour graph represents the exact historical truth; rather, wepropose that our model be viewed as a reasonable and rela-tively comprehensive starting point given currently availabledata, in the spirit of previous demographic null models(Schaffner et al. 2005; Gravel et al. 2011). We also have notincluded certain groups with known complicated histories,including present-day European and Indian populations. Weattempted to add Indians to the graph but failed to obtain asatisfactory fit, which we believe was primarily due to diffi-culty in modeling the western Eurasian (ANI) ancestry foundin all Indian groups today (in addition to eastern, “ASI” an-cestry) (Reich et al. 2009).
Overall, our model supports a rapid radiation of Eurasianpopulations following an out-of-Africa dispersal, in line withresults from uniparental markers (Karmin et al. 2015; Posthet al. 2016). Here, this pattern is reflected in the near-trifurcations among the main eastern and western Eurasianclades plus Ust’-Ishim (with Oase 1 splitting very close as well)and at the base of the eastern clade among Andamanese,
Lipson and Reich . doi:10.1093/molbev/msw293 MBE
898
Dow
nloaded from https://academ
ic.oup.com/m
be/article/34/4/889/2838774 by guest on 23 January 2022

Australasians, and East Asians. We note that archaeologicalevidence increasingly points to early eastward modern hu-man dispersals, with suggestive remains from East andSoutheast Asia (Mijares et al. 2010; Demeter et al. 2015; Liuet al. 2015) in addition to the relatively early sites confidentlyassigned to modern humans in Australasia (O’Connell andAllen 2015; Clarkson et al. 2015). If these finds do all representtrue modern human occupation, this would change our un-derstanding of the timing of out-of-Africa migrations, but itwould not necessarily be the case that present-day Asians andAustralasians are related to these first inhabitants. It is alsopossible that Australasians possess a few percent ancestryfrom an early-dispersal population which could be detectablewith more sensitive genetic analyses but not with our allele-frequency-based methods (Mallick et al. 2016; Pagani et al.2016). Finally, we caution that we are limited in our ability toinfer the geographical locations and calendar dates of eventsin the admixture graph; our most powerful temporal con-straint comes from Ust’-Ishim, whose date of�45 kya placesthe eastern/western Eurasian split no later than this time.Further analysis of ancient DNA in the context of present-day genetic variation promises to provide additional datapoints to refine and add detail to our understanding.
Materials and Methods
Admixture Graph Fitting MethodologyOur central approach is to summarize information aboutpopulation relationships (in the form of f-statistics) withinthe framework of an admixture graph, a phylogenetic treeaugmented with admixture events. A full description of themathematical underpinnings of our methods can be found inPatterson et al. (2012) and Lipson et al. (2013). Briefly, a pro-posed admixture graph implies f2, f3, and f4-statistic values forall pairs, triples, and quadruples of populations, where we usethe notation f4(A, B; C, D) interchangeably as E½ðpA � pBÞðpC � pDÞ� (the expected allele frequency correlation of pop-ulations A, B, C, and D) and as the estimator of this quantity(the empirical sum of the correlation over many loci). (Theother statistics can be written as f3(A; B, C) ¼ f4(A, B; A, C)and f2(A, B) ¼ f4(A, B; A, B).) The parameters in the graphconsist of mixture proportions and branch lengths, the latterin units of genetic drift (where populations that share descentfrom a common ancestor will covary in their allele frequen-cies, measured at SNPs polymorphic across populations, as aresult of shared drift). A graph model can be optimized bysolving a system of equations (which are linear in terms ofbranch lengths) for a linearly independent set of f-statistics(e.g., all pairwise f2 values).
The results presented here are obtained via theADMIXTUREGRAPH software (Patterson et al. 2012).ADMIXTUREGRAPH takes as input a user-defined admixturegraph topology and solves for the best-fitting branch lengthsand mixture proportions given the observed f-statistics. Ourusual strategy for building a model in ADMIXTUREGRAPH isto start with a small, well-understood subgraph and then addpopulations (either unadmixed or admixed) one at a time intheir best-fitting positions. This involves trying different
branch points for the new population and comparing theresults. If a population is unadmixed, then if it is placed inthe wrong position, the fit of the model will be poorer, andthe inferred split point will move as far as it can in the correctdirection, constrained only by the specified topology. Thus,searching over possible branching orders allows us to find a(locally) optimal topology. If no placement provides a good fit(in the sense that the residual errors are large), then we inferthe presence of an admixture event, in which case we test forthe best-fitting split points of the two ancestry components.After a new population is added, the topology relating theexisting populations can change, so we examine the fullmodel fit and any inferred zero-length internal branches forpossible local optimizations. When compared with an auto-mated method such as TreeMix (Pickrell and Pritchard 2012),this procedure is more laborious, but for this application wepreferred to build the graph in a more careful, supervised way.
We note that in order to constrain all the parameters of anadmixture event, it is necessary to have four reference pop-ulations in the graph splitting at different points along thepath connecting the mixing populations (for example, for theshared Neanderthal introgression into non-Africans, the ref-erences are Altai, Denisova, Chimp, and Dinka). With threedistinct references, it is possible to detect the presence of anadmixture, but the mixture proportion and one of the rele-vant branch lengths are confounded as a compound param-eter. Also, even with four available references, if two of themhave distinct but very close phylogenetic positions, or if oneor more are themselves admixed, then it may be possible toinfer the admixture proportions but only with relatively largeuncertainty.
Our ADMIXTUREGRAPH settings are slightly differentfrom the default. First, we use the option “outpop: NULL”rather than specifying an outgroup population in the graph inwhich SNPs must be polymorphic, and we also set“lambdascale: 1” in order to preserve the standard scalingof the f-statistics without an extra denominator. Second, weuse the full matrix form of the objective function (with dia-g ¼ 0.0001) to avoid the basis dependence of the least-squares version of the computation. There could be someconcern that the empirical covariance matrix Q is unstable,but we did not see any evidence of such behavior. We alsonote that while we show graphs with Chimp as the root, thefitting should not depend on the root position (includingwhether Chimp itself or a common ancestral node is used).We tested versions of the graph with Dinka as the root, andthe results were essentially identical.
Measures of Fit QualityWhen evaluating the quality of fit of a graph model, we usetwo metrics provided by the ADMIXTUREGRAPH program.First, the program returns a list of residuals above a specifiedZ-score threshold. These are f-statistics for which the fittedvalue in the model differs from the actual value measuredfrom the data by a significant amount (in terms of the Z-score, i.e., fitted minus observed divided by standard error)according to a block jackknife (block size 5 cM). It is difficultto assess the exact false-positive rate corresponding to a given
A Working Model of the Deep Relationships of Diverse Modern Human Genetic Lineages . doi:10.1093/molbev/msw293 MBE
899
Dow
nloaded from https://academ
ic.oup.com/m
be/article/34/4/889/2838774 by guest on 23 January 2022

threshold; the Z-score for an individual statistic is approxi-mately distributed as a standard normal under the null, butwe are testing many statistics simultaneously. Moreover,while the total number of linearly independent f-statisticsin the graph is known (nðn� 1Þ=2, where n is the numberof populations), as is the number of free parameters(2nþ 2a� 3, where a is the number of admixture events,assuming no parameters are locked), the residual errors in thestatistics are correlated because of shared history (for exam-ple, f4(A, B; C, Australia) and f4(A, B; C, New Guinea) arealways similar). Thus, rather than conducting hypothesis testswith the residuals, we use them as a heuristic: Better-fittingmodels should generally have fewer significant residuals andlower Z-scores, and the most significant residuals in a givenmodel generally point to the populations that are being themost poorly fit.
The second metric is an overall model fit score,SðGÞ ¼ �1=2ðg � fÞ0Q�1ðg � fÞ, where f is the vector ofobserved f-statistics (the full linearly independent set accord-ing to the chosen basis), g is the corresponding vector ofstatistics according to the model, and Q is an estimated co-variance matrix. Under an approximation that noise is mul-tivariate normal distributed under the null, this score is a log-likelihood for the model. We do not use the score directly togauge whether a given model is an adequate fit for the data,but we can compare alternative models on the basis of theirscores, favoring the one with the higher log-likelihood.Specifically, we believe the score is suitable to use for LRTs.In our context, we are typically interested in the question ofwhether adding a new admixture event provides a signifi-cantly better fit: The more complex model will always haveat least as good a score, but it will also contain two additionalfree parameters (the split point of the second mixing popu-lation and the mixture proportion). We perform LRTs bytaking the difference in scores; twice this difference is approx-imately chi-squared distributed with two degrees of freedomunder the null. Thus, the score must improve by �3 for anadmixture to be significant at P ¼ 0.05.
Lastly, we also use relative scores to generate confidenceintervals for parameters in the graph. To do so, we create aone-dimensional grid of values for a given parameter (either abranch length or mixture proportion) and run the programfor each value, where all parameters but that one are opti-mized. For example, to determine the confidence interval fora certain mixture proportion, we might compute the log-likelihood for the model where this proportion is fixed at1%, 2%, etc. Because of the multivariate normal score approx-imation and the linearity of f-statistics, this procedure in gen-eral produces a normal likelihood function for the parameterof interest, from which we compute confidence intervals.
Possible Methodological CaveatsOne potential weakness of our graph-fitting approach is thatwith such a large space of possible models, it is difficult to sayfor certain that our proposed graph is optimal. However,between previous knowledge, our careful stepwise construc-tion of the graph, and the (local) optimization of the finalmodel, we believe that our graph is a reasonable
representation. Also, while we have used a principled ap-proach to choosing the admixture events present in themodel, it is certain that we have missed some that truly oc-curred. Partly this is a matter of power, as some residualsresulting from incorrect model specification might be toosmall to separate from statistical noise (and because we areattempting to fit many relationships simultaneously, it wouldbe expected that we would find some modest residuals bychance). Finally, the results we obtain could also depend tosome extent on which reference populations are included inthe graph.
Another possible concern is ascertainment bias. Ideally,admixture graphs should be built with SNPs that are (a) poly-morphic at the root, and (b) not subject to any ascertainmentinvolving the populations in the graph. Since we includedarchaic humans, it was not strictly possible for us to satisfythese conditions. However, we used what should be almostbias-free ascertainment schemes, particularly with regard torelationships among modern humans, as all SNPs were ascer-tained in outgroup or near-outgroup African populations.The one set of parameters we would recommend treatingwith caution are the exact proportions of archaic admixture;for example, the inferred Neanderthal admixture proportionin non-Africans in the graph based on full sequence data islarge (4.3%), which we suspect could be caused by condensedbranch lengths in the archaic section of the tree (a combina-tion of ascertainment effects and large drifts).
DataFor the main admixture graph, as well as other analyses (un-less otherwise specified), we use autosomal data for present-day populations (Lazaridis et al. 2014) from panels 4 and 5 ofthe Human Origins array (SNPs ascertained as heterozygousin single San and Yoruba individuals), a total of approximately259k SNPs. The present-day human populations have samplesizes of 3 Australian, 7 Dinka, 8 Suru�ı, 11 Onge, 16 Mamanwa,19 Ami, and 19 New Guinea. For ancient individuals, we usediploid genotype calls from full genome sequences for thehigh-coverage samples (Altai, Denisova, and Ust’-Ishim, plusLoschbour) and majority-allele calls for most of the lower-coverage samples (K14 and MA1, plus Oase 1 and La Bra~na 1).The only exceptions (both of which are only used in follow-upanalyses and not in the admixture graph models) are theCaucasus hunter-gatherer individuals (Jones et al. 2015) andAfontova Gora 3 (Fu et al. 2016), which have random haploidallele calls. We only use SNPs for which no populations in thegraph have missing data, resulting in a total of approximately123k SNPs for the final model. For f-statistics presented aspart of additional analyses to support the admixture graphresults, we use all SNPs covered by the populations inquestion.
We also conduct analyses on full sequence data from theSGDP (Mallick et al. 2016), for which we ascertain SNPs aspolymorphic among the four Mbuti individuals. We thenmerge data from K14 and MA1, here utilizing single randomallele calls at each locus. This genotyping approach can reducesome biases but can also potentially be more susceptible todamage or contamination; empirically, we do not see any
Lipson and Reich . doi:10.1093/molbev/msw293 MBE
900
Dow
nloaded from https://academ
ic.oup.com/m
be/article/34/4/889/2838774 by guest on 23 January 2022

major differences in the inferred parameters for K14 and MA1in the two models. The final data set contains approximately1.99M SNPs. Present-day human populations are representedby 2 individuals for Onge, Ami, and Suru�ı; 3 for Dinka; 4 forAustralia; and 16 for Papuan.
AcknowledgmentsWe would like to thank Qiaomei Fu, Iosif Lazaridis, NickPatterson, and Pontus Skoglund for technical assistance andhelpful comments and suggestions. This work was supportedby the National Science Foundation (HOMINID grant BCS-1032255), National Institutes of Health (NIGMS grantGM100233), and the Howard Hughes Medical Institute.
ReferencesArmitage SJ, Jasim SA, Marks AE, Parker AG, Usik VI, Uerpmann HP.
2011. The southern route “out of Africa”: Evidence for an early ex-pansion of modern humans into Arabia. Science 331(6016): 453–456.
Blinkhorn J, Achyuthan H, Petraglia M, Ditchfield P. 2013. MiddlePalaeolithic occupation in the Thar Desert during the UpperPleistocene: The signature of a modern human exit out of Africa?Quaternary Sci Rev. 77:233–238.
Clarkson C, Smith M, Marwick B, Fullagar R, Wallis LA, Faulkner P,Manne T, Hayes E, Roberts RG, Jacobs Z, et al. 2015. The archaeology,chronology and stratigraphy of Madjedbebe (Malakunanja II): A sitein northern Australia with early occupation. J Hum Evol. 83:46–64.
Demeter F, Shackelford L, Westaway K, Duringer P, Bacon AM, PoncheJL, Wu X, Sayavongkhamdy T, Zhao JX, Barnes L, et al. 2015. Earlymodern humans and morphological variation in Southeast Asia:Fossil evidence from Tam Pa Ling, Laos. PLoS ONE 10(4): e0121193.
Fu Q, Meyer M, Gao X, Stenzel U, Burbano HA, Kelso J, P€a€abo S. 2013.DNA analysis of an early modern human from Tianyuan Cave,China. Proc Natl Acad Sci U S A. 110(6): 2223–2227.
Fu Q, Li H, Moorjani P, Jay F, Slepchenko SM, Bondarev AA, Johnson PL,Aximu-Petri A, Prufer K, de Filippo C, et al. 2014. Genome sequenceof a 45,000-year-old modern human from western Siberia. Nature514(7523): 445–449.
Fu Q, Hajdinjak M, Moldovan O, Constantin S, Mallick S, Skoglund P,Patterson N, Rohland N, Lazaridis I, Nickel B, et al. 2015. An earlymodern human from Romania with a recent Neanderthal ancestor.Nature 524:216–219.
Fu Q, Posth C, Hajdinjak M, Petr M, Mallick S, Fernandes D, Furtw€anglerA, Haak W, Meyer M, Mittnik A, et al. 2016. The genetic history of IceAge Europe. Nature 534:200–205.
Gravel S, Henn B, Gutenkunst R, Indap A, Marth G, Clark A, Yu F, GibbsR, Bustamante C, Altshuler D, et al. 2011. Demographic history andrare allele sharing among human populations. Proc Natl Acad Sci U SA. 108(29): 11983–11988.
Green R, Krause J, Briggs A, Maricic T, Stenzel U, Kircher M, Patterson N,Li H, Zhai W, Fritz M, et al. 2010. A draft sequence of the Neandertalgenome. Science 328(5979): 710–722.
Groucutt HS, Petraglia MD, Bailey G, Scerri EM, Parton A, Clark-Balzan L,Jennings RP, Lewis L, Blinkhorn J, Drake NA, et al. 2015. Rethinking thedispersal of Homo sapiens out of Africa. Evol Anthropol. 24(4): 149–164.
Gutenkunst RN, Hernandez RD, Williamson SH, Bustamante CD. 2009.Inferring the joint demographic history of multiple populations frommultidimensional SNP frequency data. PLoS Genet. 5(10): e1000695.
Haak W, Lazaridis I, Patterson N, Rohland N, Mallick S, Llamas B, BrandtG, Nordenfelt S, Harney E, Stewardson K, et al. 2015. Massive migra-tion from the steppe was a source for Indo-European languages inEurope. Nature 522:207–211.
Hallast P, Batini C, Zadik D, Delser PM, Wetton JH, Arroyo-Pardo E,Cavalleri GL, de Knijff P, Bisol GD, Dupuy BM, et al. 2015. The Y-chromosome tree bursts into leaf: 13,000 high-confidence SNPs cov-ering the majority of known clades. Mol Biol Evol. 32(3): 661–673.
Harris K, Nielsen R. 2016. The genetic cost of Neanderthal introgression.Genetics 203(2): 881–891.
Jones ER, Gonzalez-Fortes G, Connell S, Siska V, Eriksson A, Martiniano R,McLaughlin RL, Llorente MG, Cassidy LM, Gamba C, et al. 2015.Upper Palaeolithic genomes reveal deep roots of modernEurasians. Nat Commun. 6:8912.
Juric I, Aeschbacher S, Coop G. 2016. The strength of selection againstNeanderthal introgression. PLoS Genet. 12(11): e1006340.
Karmin M, Saag L, Vicente M, Sayres MAW, J€arve M, Talas UG, Rootsi S,Ilum€ae AM, M€agi R, Mitt M, et al. 2015. A recent bottleneck of Ychromosome diversity coincides with a global change in culture.Genome Res. 25(4): 459–466.
Lahr MM, Foley R. 1994. Multiple dispersals and modern human origins.Evol Anthropol. 3(2): 48–60.
Laval G, Patin E, Barreiro L, Quintana-Murci L. 2010. Formulating a his-torical and demographic model of recent human evolution based onresequencing data from noncoding regions. PLoS ONE 5(4): e10284.
Lazaridis I, Patterson N, Mittnik A, Renaud G, Mallick S, Sudmant PH,Schraiber JG, Castellano S, Kirsanow K, Economou C, et al. 2014.Ancient human genomes suggest three ancestral populations forpresent-day Europeans. Nature 513(7518): 409–413.
Lazaridis I, Nadel D, Rollefson G, Merrett DC, Rohland N, Mallick S,Fernandes D, Novak M, Gamarra B, Sirak K, et al. 2016. Genomicinsights into the origin of farming in the ancient Near East. Nature536(7617): 419–424.
Lipson M, Loh PR, Levin A, Reich D, Patterson N, Berger B. 2013. Efficientmoment-based inference of admixture parameters and sources ofgene flow. Mol Biol Evol. 30(8): 1788–1802.
Lipson M, Loh PR, Patterson N, Moorjani P, Ko YC, Stoneking M, BergerB, Reich D. 2014. Reconstructing Austronesian population history inIsland Southeast Asia. Nat Commun. 5:4689.
Liu W, Martin�on-Torres M, Cai Yj, Xing S, Tong Hw, Pei Sw, Sier MJ, WuXh, Edwards RL, Cheng H, et al. 2015. The earliest unequivocallymodern humans in southern China. Nature 334(6052): 94–98.
Malaspinas AS, Westaway MC, Muller C, Sousa VC, Lao O, Alves I,Bergstrom A, Athanasiadis G, Cheng JY, Crawford JE, et al. 2016. Agenomic history of Aboriginal Australia. Nature 538(7624): 207–214.
Mallick S, Li H, Lipson M, Mathieson I, Gymrek M, Racimo F, Zhao M,Chennagiri N, Nordenfelt S, Tandon A, et al. 2016. The SimonsGenome Diversity Project: 300 genomes from 142 diverse popula-tions. Nature 538(7624): 201–206.
Meyer M, Kircher M, Gansauge MT, Li H, Racimo F, Mallick S, SchraiberJG, Jay F, Prufer K, de Filippo C, et al. 2012. A high-coverage genomesequence from an archaic Denisovan individual. Science 338(6104):222–226.
Mijares AS, Detroit F, Piper P, Grun R, Bellwood P, Aubert M, ChampionG, Cuevas N, De Leon A, Dizon E. 2010. New evidence for a 67,000-year-old human presence at Callao Cave, Luzon, Philippines. J HumEvol. 59(1): 123–132.
Mondal M, Casals F, Xu T, Dall’Olio GM, Pybus M, Netea MG, Comas D,Laayouni H, Li Q, Majumder PP, et al. 2016. Genomic analysis ofAndamanese provides insights into ancient human migration intoAsia and adaptation. Nat Genet. 48(9): 1066–1070.
Montano V, Didelot X, Foll M, Linz B, Reinhardt R, Suerbaum S, MoodleyY, Jensen JD. 2015. Worldwide population structure, long term de-mography, and local adaptation of Helicobacter pylori. Genetics200:947–963.
O’Connell J, Allen J. 2015. The process, biotic impact, and global impli-cations of the human colonization of Sahul about 47,000 years ago. JArchaeol Sci. 56:73–84.
Olalde I, Allentoft ME, S�anchez-Quinto F, Santpere G, Chiang CW,DeGiorgio M, Prado-Martinez J, Rodr�ıguez JA, Rasmussen S,Quilez J, et al. 2014. Derived immune and ancestral pigmenta-tion alleles in a 7,000-year-old Mesolithic European. Nature507(7491): 225–228.
Pagani L, Lawson DJ, Jagoda E, Morseburg A, Eriksson A, Mitt M,Clemente F, Hudjashov G, DeGiorgio M, Saag L, et al. 2016.Genomic analyses inform on migration events during the peoplingof Eurasia. Nature 538(7624): 238–242.
A Working Model of the Deep Relationships of Diverse Modern Human Genetic Lineages . doi:10.1093/molbev/msw293 MBE
901
Dow
nloaded from https://academ
ic.oup.com/m
be/article/34/4/889/2838774 by guest on 23 January 2022
Patterson N, Moorjani P, Luo Y, Mallick S, Rohland N, Zhan Y,Genschoreck T, Webster T, Reich D. 2012. Ancient admixture inhuman history. Genetics 192(3): 1065–1093.
Pease JB, Hahn MW. 2015. Detection and polarization of introgression ina five-taxon phylogeny. Syst Biol. 64(4): 651–662.
Pickrell J, Pritchard J. 2012. Inference of population splits and mixturesfrom genome-wide allele frequency data. PLoS Genet. 8(11):e1002967.
Posth C, Renaud G, Mittnik A, Drucker DG, Rougier H, Cupillard C,Valentin F, Thevenet C, Furtw€angler A, Wißing C, et al. 2016.Pleistocene mitochondrial genomes suggest a single major dispersalof non-Africans and a Late Glacial population turnover in Europe.Curr Biol. 26(6): 827–833.
Prufer K, Racimo F, Patterson N, Jay F, Sankararaman S, Sawyer S, HeinzeA, Renaud G, Sudmant PH, de Filippo C, et al. 2014. The completegenome sequence of a Neanderthal from the Altai Mountains.Nature 505(7481): 43–49.
Raghavan M, Skoglund P, Graf KE, Metspalu M, Albrechtsen A, Moltke I,Rasmussen S, Stafford TW, Jr, Orlando L, Metspalu E, et al. 2014.Upper Palaeolithic Siberian genome reveals dual ancestry of NativeAmericans. Nature 505(7481): 87–91.
Rasmussen M, Guo X, Wang Y, Lohmueller KE, Rasmussen S,Albrechtsen A, Skotte L, Lindgreen S, Metspalu M, Jombart T,et al. 2011. An Aboriginal Australian genome reveals separate humandispersals into Asia. Science 334(6052): 94–98.
Reich D, Thangaraj K, Patterson N, Price A, Singh L. 2009. ReconstructingIndian population history. Nature 461(7263): 489–494.
Reich D, Green R, Kircher M, Krause J, Patterson N, Durand E, Viola B,Briggs A, Stenzel U, Johnson P, et al. 2010. Genetic history of anarchaic hominin group from Denisova Cave in Siberia. Nature468(7327): 1053–1060.
Reich D, Patterson N, Kircher M, Delfin F, Nandineni M, Pugach I, Ko A,Ko Y, Jinam T, Phipps M, et al. 2011. Denisova admixture and the first
modern human dispersals into Southeast Asia and Oceania. Am JHum Genet. 89(4): 516–528.
Reich D, Patterson N, Campbell D, Tandon A, Mazieres S, Ray N, ParraMV, Rojas W, Duque C, Mesa N, et al. 2012. Reconstructing NativeAmerican population history. Nature 488(7411): 370–374.
Reyes-Centeno H, Ghirotto S, Detroit F, Grimaud-Herve D, Barbujani G,Harvati K. 2014. Genomic and cranial phenotype data support mul-tiple modern human dispersals from Africa and a southern routeinto Asia. Proc Natl Acad Sci U S A. 111(20): 7248–7253.
Sankararaman S, Mallick S, Dannemann M, Prufer K, Kelso J, P€a€abo S,Patterson N, Reich D. 2014. The genomic landscape of Neanderthalancestry in present-day humans. Nature 507(7492): 354–357.
Sankararaman S, Mallick S, Patterson N, Reich D. 2016. The combinedlandscape of Denisovan and Neanderthal ancestry in present-dayhumans. Curr Biol. 26(9): 1241–1247.
Scally A. 2016. The mutation rate in human evolution and demographicinference. Curr Opin Gen Dev. 41:36–43.
Schaffner SF, Foo C, Gabriel S, Reich D, Daly MJ, Altshuler D. 2005.Calibrating a coalescent simulation of human genome sequencevariation. Genome Res. 15(11): 1576–1583.
Seguin-Orlando A, Korneliussen TS, Sikora M, Malaspinas AS, Manica A,Moltke I, Albrechtsen A, Ko A, Margaryan A, Moiseyev V, et al. 2014.Genomic structure in Europeans dating back at least 36,200 years.Science 346(6213): 1113–1118.
Skoglund P, Mallick S, Bortolini MC, Chennagiri N, Hunemeier T, Petzl-Erler ML, Salzano FM, Patterson N, Reich D. 2015. Genetic evidence fortwo founding populations of the Americas. Nature 525(7567): 104–108.
Vernot B, Akey JM. 2014. Resurrecting surviving Neandertal lineagesfrom modern human genomes. Science 343(6174): 1017–1021.
Wall JD, Yang MA, Jay F, Kim SK, Durand EY, Stevison LS, Gignoux C,Woerner A, Hammer MF, Slatkin M. 2013. Higher levels ofNeanderthal ancestry in East Asians than in Europeans. Genetics194(1): 199–209.
Lipson and Reich . doi:10.1093/molbev/msw293 MBE
902
Dow
nloaded from https://academ
ic.oup.com/m
be/article/34/4/889/2838774 by guest on 23 January 2022