Chapter 6 Petrologic Insights into Basaltic Volcanism at ...

International Journal of Geography and Geology, 2013, 2(2):14-23
14
A STUDY OF STREAM SEDIMENTS FROM SOLTAN MEYDAN BASALTIC
FORMATION AREA, NORTHERN IRAN
Mehdi Hashemi Gahruei
Department of Geology, Faculty of Sciences, Golestan University, Gorgan, Iran
Majid Gholami
Department of Geology, Faculty of Sciences, Golestan University, Gorgan, Iran
Teimoor Nazari Dehkordi*
Department of Earth Sciences, Faculty of Sciences, Shiraz University, Shiraz, Iran
ABSTRACT
Stream sediments of the Eastern Alborz Mountain located at Northern Iran, were studied at
Silurian-formed Soltan Meydan Basaltic Formation area. The area which is mainly consisted of
basalt, andesite and tuff represents a structurally active zone, with Mountain Front Sinuosity index
(Smf) of 1.2, caused development of numerous faults, prominently with NE-SW trend. Assessment of
potential for metallic mineral deposits in the area was carried out using stream sediment sampling
and remote sensing. Total metal concentration in the AAS-analyzed sediments varies in the range
of Cu: 33-106.54 ppm, Pb: 14.46-189.04 ppm, Zn: 40.88-376 ppm, Ni: 15.14-73.24 ppm, Co: 8.2-
88.64 ppm, Mn: 321.6-1326.4 ppm, and Fe: 2.28-5.39 wt%. Statistical processing of geochemical
data shows two concentrated areas as geochemical anomalies. These areas are matched with those
which are presented by Photo-lineament Factor (PF) indicating high density of regional structures
and tectonic features. Taking high-concentrated-fractured areas into account, it is suggested that
there is a close relationship between structural features and the possibility of mineralization which
explains that the stream sediments could have been enriched by streams flowing through well-
developed drainage system.
Keywords: Stream sediments, Photo-lineament Factor (PF), geochemical anomaly, Soltan
Meydan Basaltic Formation, Iran
INTRODUCTION
Mineral deposits represent anomalous concentrations of specific elements, of which usually include
a central zone, or core, often in percentage quantities, to a degree sufficient to permit economic
International Journal of Geography and Geology
journal homepage: http://aessweb.com/journal-detail.php?id=5011

International Journal of Geography and Geology, 2013, 2(2):14-23
15
exploitation. Although the elements surrounding this zone generally decrease in concentration until
they reach levels, which appreciably exceed the normal background level of the enclosing rocks, in
some cases mineral deposits either on or near the surface, are subject to both chemical and physical
factors of weathering. Many of the ore minerals undergo decomposition or disintegration and their
chemical constituents become dispersed into weathering debris, soils, ground water, and plant
tissue. Further dispersion, often over considerable distances, may ensue due to the agencies of
glaciers or stream systems (Dugmore et al., 1996; Le Couteur and Mcleod, 2006; Sarala and
Peuraniemi, 2007; Champan et al., 2009).
Geochemical surveys based on analyzing of stream sediments are a well studied technique to find
anomalous concentrations of specific elements that, over five decades, has been used worldwide
wherever stream drainage systems are well established. This usage is based on the cost-effective
ability of such surveys to identify anomalous watersheds as targets for further exploration and to
give economic guidelines that may help interpret the autogenic and non-autogenic geochemical
anomalies (Bull, 1997; Duk-Rodkin et al., 2003; Ohta et al., 2004; Atsuyuki et al., 2005). To
extract topographic information and modeling of surface processes a Digital Elevation Model
(DEM) has been offered. DEMs can be generated from contour lines, with radar-interferometry
data derived, most importantly, from Space Shuttle Radar Topography Mapping mission (SRTM)
(Duncan, 1998; Bishop, 2001; Paul et al., 2004; Seleem, 2013).
The purpose of this study is to investigate the stream sediments of Soltan Meydan Basaltic
Formation area by analyzing selected samples to indicate anomalous concentrations of copper,
lead, zinc, iron, nickel, cobalt and manganese, which has been followed by applying SRTM DEM
satellite images to evaluate the relationship between the remote sensing-derived aligned features,
Photo-lineament Factor (PF), and the possibility of finding mineral potential areas.
Geological Setting
Paleozoic-Mesozoic rocks crop out extensively and with great thickness in the Eastern Alborz
Mountain of Northern Iran consist of, in ascending stratigraphic order, the Abarsaj (arkosic
sandstone with muscovite, Ordovician), Soltan Meydan (basalt-andesite-tuff, Silurian), Padeha
(quartz-arenite sandstone, Upper Devonian), Khosh-Yeylagh (dolomite-limestone-sandstone and
conglomerate, Upper Devonian), Mobarak (limestone and shale, Lower Carboniferous), Dorud
(sandstone and shale, Permian), Elika (dolomite and sandstone, Triassic) and Shemshak (sandstone
and shale, Jurassic) Formations (Ghavidel-Syooki, 2000; Ghavidel-Syooki and Vecoli, 2007).
Soltan Meydan Basaltic Formation is situated at the southern edge of Eastern Alborz Mountains,
Semnan Province, in Northern Iran and includes sporadic magmatic body exposure. The main fault
zone with NE-SW trend which reaches to Shahrud City represents a structurally active zone caused
development of numerous faults and conforms to the regional fault zone, named Northern Shahrud
Fault Zone (Fig. 1). This area was formed in an extensional intra-continental setting and signifies
International Journal of Geography and Geology, 2013, 2(2):14-23
16
the early stages of opening and formation of Paleo-Tethys in Silurian. The Ordovician period was
coincided with the beginning of extension, Alborz separation and Paleo-Tethys formation which
was accompanied by emplacement of magmatic bodies until Devonian. The evidence suggests that
Iranian platform was subjected to uplift, continental crust extension and rifting during Ordovician
to Devonian (Berberian, 1983; Alavi, 1996). Prior to the Ordovician time, the extension was
accompanied by formation of normal faults showing turbiditic facies in a shallow sea environment.
The thick mass of extrusive and intrusive igneous rocks (with an approximate thickness of 1000
meters) with an age of Middle Ordovician to Devonian described in Alborz Mountains indicates an
obviously mafic composition. The volcanic rocks of the complex include pyroclastic and volcano
clastic rocks with interpretations of andesitic and basaltic lava flows consist Soltan Meydan
Basaltic Formation exposing at Abr, Abarsaj and Mighan villages at the NE of Shahrud City and is
emplaced at the basal part of Khosh-Yeylagh Formation (Mehdizadeh, 2008) (Fig. 1).
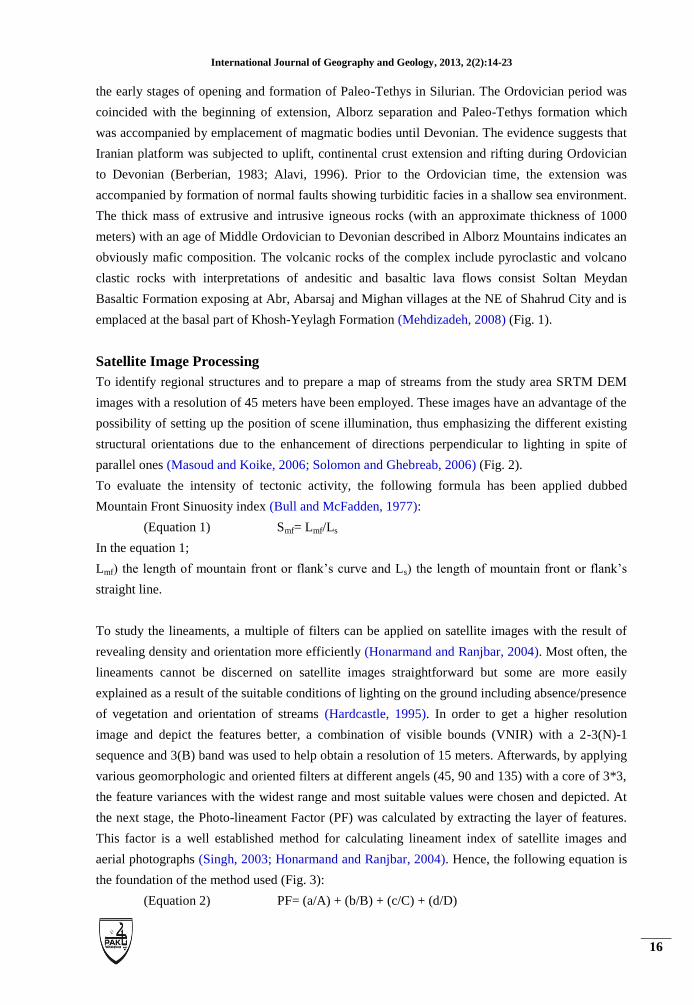
Satellite Image Processing
To identify regional structures and to prepare a map of streams from the study area SRTM DEM
images with a resolution of 45 meters have been employed. These images have an advantage of the
possibility of setting up the position of scene illumination, thus emphasizing the different existing
structural orientations due to the enhancement of directions perpendicular to lighting in spite of
parallel ones (Masoud and Koike, 2006; Solomon and Ghebreab, 2006) (Fig. 2).
To evaluate the intensity of tectonic activity, the following formula has been applied dubbed
Mountain Front Sinuosity index (Bull and McFadden, 1977):
(Equation 1) Smf= Lmf/Ls
In the equation 1;
Lmf) the length of mountain front or flank’s curve and Ls) the length of mountain front or flank’s
straight line.
To study the lineaments, a multiple of filters can be applied on satellite images with the result of
revealing density and orientation more efficiently (Honarmand and Ranjbar, 2004). Most often, the
lineaments cannot be discerned on satellite images straightforward but some are more easily
explained as a result of the suitable conditions of lighting on the ground including absence/presence
of vegetation and orientation of streams (Hardcastle, 1995). In order to get a higher resolution
image and depict the features better, a combination of visible bounds (VNIR) with a 2-3(N)-1
sequence and 3(B) band was used to help obtain a resolution of 15 meters. Afterwards, by applying
various geomorphologic and oriented filters at different angels (45, 90 and 135) with a core of 3*3,
the feature variances with the widest range and most suitable values were chosen and depicted. At
the next stage, the Photo-lineament Factor (PF) was calculated by extracting the layer of features.
This factor is a well established method for calculating lineament index of satellite images and
aerial photographs (Singh, 2003; Honarmand and Ranjbar, 2004). Hence, the following equation is
the foundation of the method used (Fig. 3):
(Equation 2) PF= (a/A) + (b/B) + (c/C) + (d/D)

International Journal of Geography and Geology, 2013, 2(2):14-23
17
In the equation 2;
a) the number of lineaments available in each cell, A) their average on the map, b) the length of
lineaments in each cell, B) their average on the map, c) the number of intersections of lineament
per cell, C) their average on the map, d) the number of lineament groups in each cell, and D) their
average on the map. Based on these parameters a grid whit appropriate cell dimension of 1*1
kilometers for the study area has been designed and deployed on the map of lineaments calculated
each parameter, in turn, for each cell in order to analyzing the lineaments.
Sampling and Analyzing Process
The geochemical samples, 62 in number, were collected with a frequency of one sample per square
kilometer from designated points on the maps of Abarsaj and Qaleh-Nowkhareqan villages of a
scale of 1:50000, showing on the figure 4, from a depth of 20 to 30 centimeters at the middle or
near the edge of active streams. It is noteworthy that all sample locations were far from
contaminant sources such as rural and industrial areas and were mainly fresh and representative.
The samples were placed in safe bags and transported to the laboratory. The hand trowel was
washed with a detergent, rinsed and dried before each use so as to minimize contamination.
Sediment samples were air dried and 300 g were transferred into a set of standard sieves (0.063
mm, 0.125 mm, 0.25 mm, 0.5 mm, 1.0 mm and 2.0 mm) with the largest mesh size on top and the
smallest at the bottom. The sieving was carried out using a vibrating machine.
The total content of copper, lead, zinc, cobalt, manganese, iron and nickel in sediment fractions
was determined using the method as described by Sekabira et al. (2010). Ideally, 1.25 g of each
sample was digested with 20 mL aqua regia (HCl/HNO3; 3:1) in a beaker (open-beaker digestion)
on a thermostatically controlled hot plate. The digest was heated to near dryness and cooled to
ambient temperature. Then 5.0 mL of hydrogen peroxide was added in parts to complete the
digestion and the resulting mixture heated again to near dryness in a fume cupboard. The beaker
wall was washed with 10 ml of de-ionized water and 5.0 ml HCl were added, mixed and heated
again. The resulting digest was allowed to cool and transferred into a 50 mL standard flask and
made up to the mark with de-ionized water. Copper, lead, zinc, cobalt, manganese, iron and nickel
were then analyzed by direct aspiration of the sample solution into a Perkin-Elmer model 2380
Flame Atomic Absorption Spectrophotometer (AAS). All metals were analyzed using lean-blue
acetylene flame at wavelength 324.8 nm, slit width 0.2 mm and sensitivity check of 5.0 mg/L Cu;
wavelength 228.8 nm, slit width 0.7 and sensitivity check of 2.0 mg/L Cd; wavelength 213.9 nm,
slit size 0.7 nm and sensitivity check 9.0 mg/L Pb and wavelength 279.5 nm, slit size 0.2 nm and
sensitivity check of 2.5 mg/L Mn. Accuracy of the analytical method was evaluated by comparing
the expected metal concentrations in certified reference materials with the measured values.
Simultaneous performance of analytical blanks, standard reference (JG-3) (Imai et al., 1995) and
calculation of the average recoveries of heavy metals confirmed that the accuracy of the method
was within acceptable limits (Table 1).

International Journal of Geography and Geology, 2013, 2(2):14-23
18
DISCUSSION
The Soltan Meydan Basaltic Formation area is located at front of structural regime, Eastern Alborz
Mountains, and represents a great deal of thrusts, strike-slip faults and distinct topographic changes
particularly along the borderline between the mountain and the plain. The amount of Smf index (Eq.
1) which indicates the intensity of tectonic activity, along a section with 12 Km in length (L-L´)
was calculated to be 1.2 represents a region with high structural activity (Wells et al., 1998; Malik
and Mohanty, 2007). Generally, the mountain front curving pattern, formed fractures and faults,
and geologic features such as triangular facets, V-shaped valleys, alluvial canals and stream
systems all confirm that the area is tectonically intensely active. According to the Photo-lineament
Factor (PF) value of the study area which demonstrates high-fractured areas (Fig. 3), it can be
understood that there is a connection between fractures and development of the stream-drainage
system. On the other hand, a high frequency of fractures on the mountain front provides favorable
conditions in terms of developing the drainage system. Most of the streams follow a general
structural trend which indicates that these drainages may be structurally controlled. Less-developed
branches of streams could be regarded as an indicator of crushed zones at which sediments are
accumulated in the bigger branches (Duk-Rodkin et al., 2003). In the study area streams show a
complex pattern depending on the fractures, additionally, in many cases the relationship with
different classes of faults whether they are major or minor is observable.
As a result of weathering, streams disperse elements through water and finally, deposit them as
sediments, so high-concentrated stream sediment samples may reveal potentially mineralized areas.
The chemical composition of 7 target elements of stream sediments from different parts of the
study area has been shown in table 1. The result of the geochemical analysis shows that the average
values of Cu (33-106.54 ppm) and Zn (40.88-376 ppm) in the area are 69.29 and 165.61 ppm
respectively, but In the A1 area samples (including S4 through S11) it is 88.2 ppm for Cu and
291.62 ppm for Zn. In the A2 area samples (including S56 through S61) the average value is 91.52
ppm for Cu and 204.76 ppm for Zn. The average value of Pb (14.46-189.04 ppm) and Co (8.2-
88.64 ppm) among all the samples is indicated 62.42 ppm and 36.51 ppm respectively, which
changes to 136.41 and 75.18 ppm in the A1 area samples. The average concentration for Ni (15.14-
73.24 ppm), Mn (321.6-1326.4 ppm) and Fe (2.28-5.39 wt%) is 50.66 ppm, 713.08 ppm and 3.72
wt% respectively, which increases to 61.81 ppm, 1073.61 ppm and 5.07 wt% as the average values
of Ni, Mn and Fe in the A2. Briefly, the A1 and A2 areas show, in turn, high quantity of Cu-Zn-Pb-
Co and Cu-Zn-Ni-Mn-Fe elements. As it is shown on figure 3, these areas follow the high-fractured
areas which are explained with high-PF values and may be related to the possible mineralization.
CONCLUSION
(1) In this study, it has been suggested that by using stream sediment exploration technique, it is
possible to identify regional anomalies, which are useful in defining areas for exploration.

International Journal of Geography and Geology, 2013, 2(2):14-23
19
(2) Distribution pattern of Cu, Pb, Zn, Ni, Co, Mn and Fe in sediments of the study area is useful to
indicate those mineral potential areas where new mineral deposits may exist.
(3) It is suggested that there is a close relationship between Photo-lineament Factor (PF) value,
showing high-fractured areas, and enrichments of Cu, Pb, Zn, Ni, Co, Mn and Fe elements,
which can be regarded as an exploratory tool. It is suggested that bedrock chemistry,
mobility of elements, dispersion mechanism, climate, nature of weathering, pH of the
dispersing water and distance from the mineralized bedrock might has played an important
role in the distribution of these elements in the stream sediments.
ACKNOWLEDGMENT
B. Shafiei (Golestan University) and M. A. Rajabzadeh (Shiraz University) are gratefully
acknowledged who kindly provided helpful comments and suggestions during this study. The
authors would like also to thank the Editor-in-Chief, Editorial Board and reviewers of the journal
for editorial handling.
REFERENCES
Alavi, M., 1996. Tectonostratigraphic synthesis and structural style of alborz mountain
system in northern iran. Journal of Geodynamics 21: 1-33.
Atsuyuki, O., I. Noboru, T. Shigeru and T. Yoshiko, 2005. Influence of surface geology
and mineral deposits on the spatial distributions of element concentrations in the
stream sediments of hokkaido japan. Journal of Geochemical Exploration 86: 86-
103.
Berberian, M., 1983. The southern caspian: A compressional depression floored by a
trapped, modified oceanic crust. Canadian Journal of Earth Sciences 20: 163-183.
Bishop, M.P., 2001. Topographic analysis and modeling for alpine glacier mapping. Polar
Geography 25: 182-201.
Bull, W.B. and L.D. McFadden, 1977. Tectonic geomorphology north and south of the
garlock fault. California: Proceedings of the Eighth Annual Geomorphology
Symposium.
Bull, W.L., 1997. Discontinuous ephemeral streams. Geomorphology 19: 227-276.
Champan, R.G., R.C. Leake, D.P.G. Bond, V. Stedra and B. Fairgrieve, 2009. Chemical
and mineralogical signatures of gold formed in oxidizing chloride hydrothermal
systems and their significance within populations of placer gold grains collected
during reconnaissance. Economic Geology 104: 563-585.
Dugmore, M.A., L.P. W. and R. Philip, 1996. Discovery of the mt. Bini porphyry copper-
gold-molybdenum deposit in the owen stanley ranges, papua new guinea-a
geochemical case history. Journal of Geochemical Exploration 57: 89-100.

International Journal of Geography and Geology, 2013, 2(2):14-23
20
Duk-Rodkin, A., R.A. Chan and K.G. McQueen, 2003. Drainage evolution and
implications for neotectonics and mineral exploration in the cobar uplands, nsw.
CRC LEME Regional Regolith Symposia 104-109.
Duncan, C.C., 1998. Comparison of late pleistocene and modern glacier extents in central
nepal based on digital elevation data and satellite imagery. Quaternary Research
49(241-254).
Ghavidel-Syooki, M., 2000. Biostratigraphy and palaeogeography of late ordovician and
early silurian chitinozoans from the zagros basin, southern iran. Historical
Biology 15: 29-39.
Ghavidel-Syooki, M. and M. Vecoli, 2007. Latest ordovician-early silurian chitinozoans
from the eastern alborz mountain range, kopet-dagh region, northeastern iran:
Biostratigraphy and palaeobiogeography. Review of Palaeobotany and Palynology
145: 173-192.
Hardcastle, K.C., 1995. Photo-lineament factor: A new computer-aided method for
remotely sensing the degree to which bedrock is fractured. Photogrammetric
Engineering and Remote Sensing 61: 739-747.
Honarmand, M. and M. Ranjbar, 2004. Application of different image processing
techniques on etm+ images for exploration of porphyry and vein type copper
mineralizations in kuh-e-mamzar and kuh-e-panj areas, kerman province.
Geosciences 57: 110-127.
Imai, N., S. Terashina, S. Itoh and A. Ando, 1995. Compilation of analytical data for
minor and trace elements in seventeen gsj geochemical reference samples,
igneous rock series. Geostandard Newsletter 19: 135-213.
Le Couteur, P.C. and J.A. Mcleod, 2006. Heavy mineral processing at vancouver indicator
processors inc./teck cominco global discovery lab. Newsletter of the Association
of Applied Geochemists 133: 15-18.
Malik, J.N. and C. Mohanty, 2007. Active tectonic influence on the evolution of drainage
and iandscape: Geomorphic signatures from frontal and hinterland areas along the
northwestern himalaya, india. Journal of Earth Sciences 29: 604-618.
Masoud, A. and K. Koike, 2006. Tectonic architecture through landsat-7 etm+/ srtm dem-
derived lineaments and relationship to the hydrogeologic setting in siwa region,
nw egypt. Journal of African Earth Sciences 45: 467-477.
Mehdizadeh, S., H., 2008. Pre-rifting evidence of paleotethys in the southwest of
shahrood, northeastern iran. World Applied Sciences Journal 3: 54-161.
Ohta, A., N. Imai, S. Terashima and Y. Tachibana, 2004. Investigation of elemental
behaviors in chugoku region of japan based on geochemical map utilizing stream
sediments. Geochemistry 38: 203-222.
Paul, F., C. Huggel and A. Kääb, 2004. Combining satellite multispectral image data and a
digital elevation model for mapping debris-covered glaciers. Remote Sensing of
Environment 89(4): 510-518.

International Journal of Geography and Geology, 2013, 2(2):14-23
21
Sarala, P. and V. Peuraniemi, 2007. Exploration using till geochemistry and heavy
minerals in the ribbed moraine area of southern finnish lapland. Geochemistry:
Exploration, Environment, Analysis 7: 195-205.
Sekabira, K., H. Oryem-Origa, T.A. Basamba, G. Mutumba and E. Kakudidi, 2010.
Assessment of heavy metal pollution in the urban stream sediments and its
tributaries. International Journal of Environment, Sciences and Technology 7(3):
435-446.
Seleem, T.M., 2013. Analysis and tectonic implication of dem-derived structural
lineaments, sinai peninsula, egypt. International Journal of Geosciences 4: 183-
201.
Singh, M., 2003. Geogenic distribution and baseline concentration of heavy minerals in
sediments of the ganges river, india. Journal of Geochemical Exploration 80: 1-
17.
Solomon, S. and Gh. Ghebreab, 2006. Lineament characterization and their tectonic
significance using landsat tm data and field studies in the central highlands of eri-
trea. Journal of African Earth Sciences 46: 371-378.
Wells, S.G., T.F. Bullard, C.M. Menges, P.G. Drake, P.A. Karas, K.I. Kelson, J.B. Ritter
and J.R. Wesling, 1998. Regional variations in tectonic geomorphology along a
segmented convergent plate boundary, pacific coast of costa rica. Geomorphology
1: 239-266.
Figure 1: A) Location of the Soltan Meydan Basaltic Formation area in Northern Iran, B) Satellite
image of the area, C) Simplified geological map of the area.

International Journal of Geography and Geology, 2013, 2(2):14-23
22
Figure 2: A 3D map of the Soltan Meydan Basaltic Formation area; A) A view of Abr village
along with mechanism of Northern Shahrud fault, B) Location of 50-meter shift in Quaternary
alluviums.
Figure 3: Distribution contour map of Photo-lineament Factor (PF) index value.

International Journal of Geography and Geology, 2013, 2(2):14-23
23
Figure 4: Location of sampling points and streams in the Soltan Meydan Basaltic Formation area.
Table 1: Chemical composition of 7 target elements from AAS-analyzed stream sediments (in ppm
except Fe in wt%).
Copyright © 2022 FDOKUMEN