A Study of Energy Efficiency in the Indian Cement Industry
184
-
Upload
khangminh22 -
Category
Documents
-
view
1 -
download
0
Transcript of A Study of Energy Efficiency in the Indian Cement Industry
S. S. KrishnanVenkatesh VunnamP. Shyam SunderA. Murali RamakrishnanG. Ramakrishna
March 2012Center for Study of Science, Technology and PolicyBengaluru
A Study of Energy Efficiency in theIndian Cement Industry
Design and editing by: CSTEPRights for the images used for the cover and separators were purchased fromwww.istockphoto.com and www.shutterstock.com.Center for Study of Science, Technology and Policy (CSTEP) is a not for profit researchorganisation incorporated in 2005 u/s 25 of The Companies Act, 1956. Its vision is to enrich thenation with technology-enabled policy options for equitable growth. The mission is to impactpolicy by assessing and designing science and technology options with informed and systematicanalysis for equitable and inclusive human development and economic growth.DisclaimerThe views expressed in this document do not necessarily reflect the view of Shakti SustainableEnergy Foundation. The organisation also does not guarantee the accuracy of any data includedin this publication nor does it accept any responsibility for the consequences of its use.© Copyright 2012 CSTEPNo part of this report may be disseminated or reproduced in any form (electronic ormechanical) without permission from CSTEP.Printed in India at Madhura Enterprises., BangaloreISBN 978-81-903613-3-0CSTEP/E/01/2012Center for Study of Science, Technology and PolicyDr.Raja Ramanna Complex, Raj Bhavan Circle,High Grounds, Bangalore – 560001.Tel.: +91 (80) 4249-0000Fax: +91 (80) 2237-2619Email: [email protected]: www.cstep.in

Acknowledgements Page v
AcknowledgementsThe authors express their gratitude to the Director General, Secretary and Energy Economists ofthe Bureau of Energy Efficiency (BEE), Ministry of Power, Government of India for theirencouragement of this work. CSTEP is grateful to several cement industry colleagues and plantpersonnel, industry associations and other stakeholders for their contributions to the study.The support and encouragement of Dr. V.S. Arunachalam, Chairman and Dr. Anshu Bharadwaj,Executive Director of CSTEP is deeply appreciated. We are especially grateful to Dr. R. Krishnanand Dr. N. Balasubramanian for their diligent review and invaluable feedback.The financial support of Shakti Sustainable Energy Foundation during the course of this study isgratefully acknowledged.Special thanks to Dr. Sharath Chandra Rao and Dr. K.C. Bellarmine for their help in economicanalysis and assistance in the preparation of this report.Sincere thanks are due to Saptak Ghosh, Tejas Pande, Bhargavi Kerur, Smita K. Dolly and NiketNarang for their efforts and contributions in bringing out this report.


Executive Summary Page vii
Executive SummaryThe National Action Plan on Climate Change (NAPCC) released by the Honorable Prime Ministerseeks to promote sustainable development through increased use of clean technologies. NAPCChas a mission specifically dedicated to energy efficiency – National Mission on Enhanced EnergyEfficiency (NMEEE).Under NMEEE, Perform, Achieve and Trade (PAT) is one of the flagship programs launched byBureau of Energy Efficiency (BEE), Ministry of Power and Government of India to enhance thecost effectiveness of improvements in energy efficiency in energy intensive large industries(known as Designated Consumers or DCs). BEE is implementing the PAT mechanism and hasdeveloped various elements of the methodology through a consultative process which hasresulted in the PAT consultation document.Specific Energy Consumption (SEC) norms are in the process of being established for DCsidentified under the purview of PAT through a process of data collection and baselining. TheDCs which reduce their SECs beyond their targets will be awarded Energy Saving Certificateswhich can be traded with DCs unable to comply with their specific targets.The identified cement DCs have a minimum annual energy consumption equivalent to 30,000tonnes oil equivalent (toe) or above. These DCs together consumed about 14.47 Mtoe in 2007and have been apportioned energy reduction targets equivalent to 0.6 Mtoe which will have tobe achieved in a three year timeframe.The objective of this study has been to model the Energy Efficiency (EE) of the Indian cementindustry, in the context of the diversity and the challenges in operating conditions, in order toprovide analysis and insights for the successful implementation of PAT.The primary motivation of this report is to present the current status of the cement industry,different sub processes in cement manufacturing and energy efficiency measures which couldbe adopted by the industry. It then explains the PAT methodology and provides several casestudies based on measurements at sample cement plants. Financial analysis of several EEmeasures has been included. A PAT calculator for EE planning by DCs and an initial design of anagent based tool for policy implementation has been developed. In conclusion, the reportdiscusses various technical, economic and policy related challenges faced by the cementindustry in the context of improved energy efficiency as required by PAT.Linkage to GHG emissionsGlobal Green House Gas emissions due to human activities have grown since pre-industrialtimes, with an increase of 70% between 1970 and 2004. The impact of emissions fromanthropogenic sources on the global climate and the environment is of grave concern.India along with China has been subjected to increasing international pressure to undertakebinding emission targets to limit its aggregate level of emissions. In this context, Indiaannounced a voluntary 20-25 per cent carbon emission intensity reduction by 2020 on the 2005levels, ahead of the UNFCCC’s COP15 summit held in Copenhagen.The effect of climate change on the Indian industrial sector is well documented. Competitivenessconcerns arise when the costs of climate change policies - which are well pronounced for carbonintensive industries such as cement, iron and steel, and aluminium - lead to a loss of marketshare to imports from countries not facing similar carbon costs.Globally, trade measures have been proposed under cap and trade systems as a means ofaddressing the competitiveness concerns that arise when one country prices carbon and othersdo not. For example, the proposed US cap and trade legislation required importers of goods

Executive Summary Page viii
from countries taking different climate change approaches, to purchase allowances whichreflect the costs to domestic producers of the cap and trade system. The EU has periodicallyconsidered similar trade barriers to ameliorate some of the costs of its cap and trade system.The PAT mechanism focuses on continuous improvement of EE across energy intensiveindustrial units. However, implementation of PAT would lead to corresponding emissionintensity reduction benefits for Indian industry and contribute to a low carbon roadmap for theIndian economy.Cement IndustryThe Indian cement industry is the second largest producer of cement in the world after China. In2011, the installed capacity of Indian cement Industry was 244.4 Million Tonnes (Mt), whilecement production was 174.29 Mt. The final energy consumed by the Indian cement industrywas 607 Peta Joules (PJ) in 2007. This accounted for 9% of the total energy consumed by theindustrial sector.In 2005, the average thermal Specific Energy Consumption (SEC) of a cement plant was 734kCal/kg clinker, while the average electrical SEC was 89 kWh/t cement. However, the thermalSEC of the best plant in India was 663 kCal/kg clinker, while the best electrical SEC of an Indiancement plant was 63 kWh/t cement which are comparable to the best figures of 650 kCal/kgclinker and 65 kWh/t cement in a developed country like Japan.Energy use – and in particular fuel use – is a major price factor in the production of cement.Energy accounts for almost 40% of the total manufacturing cost in some of the cement plantswhereas coal accounts for 15%-20% of the total cost. This has motivated companies to invest inenergy efficiency measures, such as converting wet kilns to dry kilns, or adding precalciners andmulti stage suspension preheaters or cyclones to their cement production process making itmore efficient in terms of fuel use.Energy Efficiency in Cement IndustryCement manufacturing comprises of various subprocesses - Raw meal grinding, Preheating,Precalcining, Clinkerization and Grinding. Energy is consumed in each of the sub processes.Major portion of the energy consumed is thermal energy (80-90%) and the rest is electrical. Theclinkerization subprocess consumes the largest share of thermal energy whereas cementgrinding mills consume the highest electrical energy.High preheater exit gas volume and temperature, high pressure drop across preheater, highmoisture content in fine coal, incomplete combustion of coal, low heat recuperation efficiency ofgrate cooler, high cooler air exhaust temperature, high clinker temperature, low efficiency ofmajor process and cooler fans and under loading of motors resulting in low operating efficiency,are some of the major factors that result in higher energy consumption within the major subprocesses.Several energy audit studies have estimated 5% to 10% energy savings in thermal and electricalenergy consumption by adopting different energy conservation measures. It is estimated thatthe saving of 5 kCal/kg of thermal energy and 1 kWh/t cement of electrical energy will result intotal savings of about Rs 6 Million per annum in a typical 1 Million tonne plant.PAT - Methodology and Gate to Gate (G2G) SECPAT follows Gate to Gate (G2G) approach for establishing baseline SEC. G2G refers to thephysical boundary of a cement plant and the processes within it. A DC’s baseline energy couldbe calculated taking into consideration the average thermal and electrical energy of three years.The ratio of total energy consumption to cement production gives a measure of the SEC.
Executive Summary Page ix
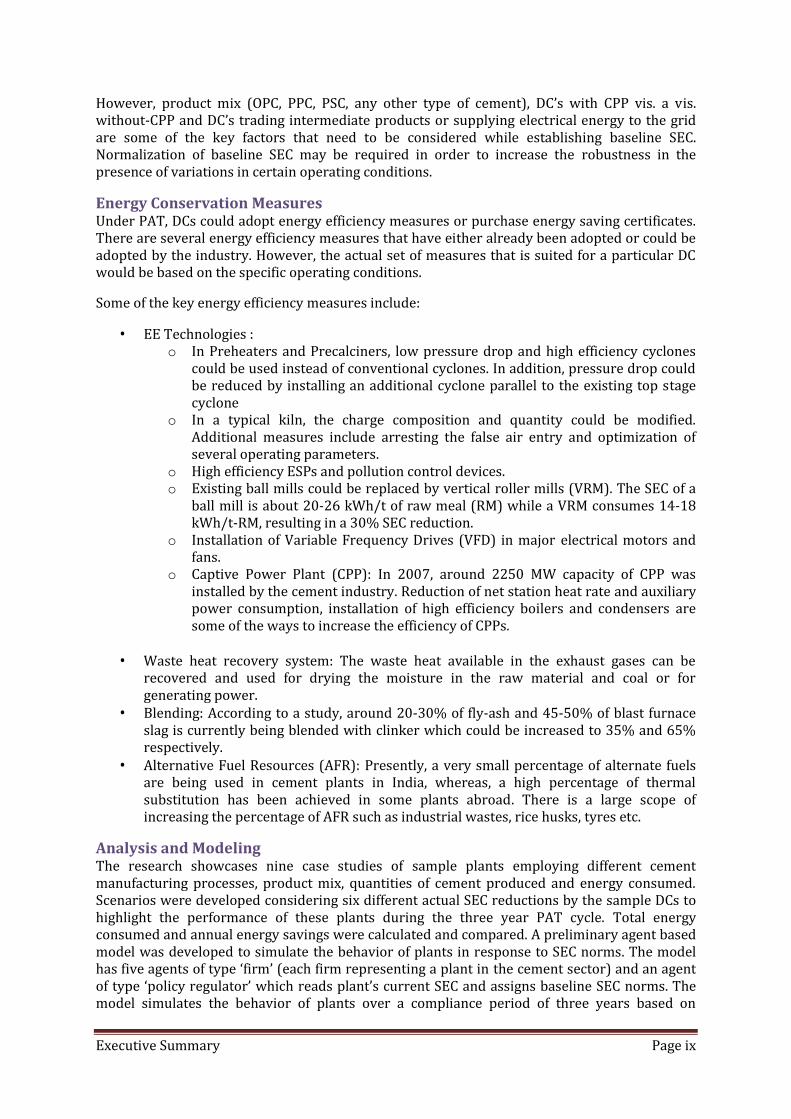
However, product mix (OPC, PPC, PSC, any other type of cement), DC’s with CPP vis. a vis.without-CPP and DC’s trading intermediate products or supplying electrical energy to the gridare some of the key factors that need to be considered while establishing baseline SEC.Normalization of baseline SEC may be required in order to increase the robustness in thepresence of variations in certain operating conditions.Energy Conservation MeasuresUnder PAT, DCs could adopt energy efficiency measures or purchase energy saving certificates.There are several energy efficiency measures that have either already been adopted or could beadopted by the industry. However, the actual set of measures that is suited for a particular DCwould be based on the specific operating conditions.Some of the key energy efficiency measures include:
EE Technologies :o In Preheaters and Precalciners, low pressure drop and high efficiency cyclonescould be used instead of conventional cyclones. In addition, pressure drop couldbe reduced by installing an additional cyclone parallel to the existing top stagecycloneo In a typical kiln, the charge composition and quantity could be modified.Additional measures include arresting the false air entry and optimization ofseveral operating parameters.o High efficiency ESPs and pollution control devices.o Existing ball mills could be replaced by vertical roller mills (VRM). The SEC of aball mill is about 20-26 kWh/t of raw meal (RM) while a VRM consumes 14-18kWh/t-RM, resulting in a 30% SEC reduction.o Installation of Variable Frequency Drives (VFD) in major electrical motors andfans.o Captive Power Plant (CPP): In 2007, around 2250 MW capacity of CPP wasinstalled by the cement industry. Reduction of net station heat rate and auxiliarypower consumption, installation of high efficiency boilers and condensers aresome of the ways to increase the efficiency of CPPs.
Waste heat recovery system: The waste heat available in the exhaust gases can berecovered and used for drying the moisture in the raw material and coal or forgenerating power. Blending: According to a study, around 20-30% of fly-ash and 45-50% of blast furnaceslag is currently being blended with clinker which could be increased to 35% and 65%respectively. Alternative Fuel Resources (AFR): Presently, a very small percentage of alternate fuelsare being used in cement plants in India, whereas, a high percentage of thermalsubstitution has been achieved in some plants abroad. There is a large scope ofincreasing the percentage of AFR such as industrial wastes, rice husks, tyres etc.
Analysis and ModelingThe research showcases nine case studies of sample plants employing different cementmanufacturing processes, product mix, quantities of cement produced and energy consumed.Scenarios were developed considering six different actual SEC reductions by the sample DCs tohighlight the performance of these plants during the three year PAT cycle. Total energyconsumed and annual energy savings were calculated and compared. A preliminary agent basedmodel was developed to simulate the behavior of plants in response to SEC norms. The modelhas five agents of type ‘firm’ (each firm representing a plant in the cement sector) and an agentof type ‘policy regulator’ which reads plant’s current SEC and assigns baseline SEC norms. Themodel simulates the behavior of plants over a compliance period of three years based on

Executive Summary Page x
parameters such as cost and time of technology up gradation, current capital, firm's investmentbehavior and target SEC.Economic analysis of energy efficiency interventions was performed. Investments for differenttypes of energy efficient interventions along with the corresponding annual savings were usedto calculate the payback, net present value and internal rate of return.The calcinations process was modeled using the ASPEN system. This tool models thethermodynamic reactions taking place and provides a mass and energy balance estimate for theprocess. Coal stream, primary air and limestone are the primary inputs using which materialand energy balance were performed for the gas and solid streams. The results from thecomputation modeling tools are preliminary; however they provide a basis for furthermodeling.Eco-Friendly CementIn 2007, the total emissions from the industry were 130 MtCO2 eq. which is equivalent to 6.8%of the total emissions across all the sectors. The emission intensity of the industry was 0.84tCO2/t cement. Within the cases considered in this study, the specific emission was between0.046 and 1.155 tCO2/t cement.As technology continues to progress and institutional pressures to reduce GHG emissions andenergy intensities start to mount, the cement industry is resorting to cleaner and moresustainable methods of producing cement. Alinite cement, carbon absorbing cement, sea waterresistant cement, and portland limestone and magnesium (Novacem) based cements are thedifferent types of alternate low carbon cements. In a similar manner, conversion of CO2 tocarbonates by CALERA technology and formation of semidolime by Calix technology are twoinnovative technologies that have been examined in this study.Policy SuggestionsIndian cement industry is probably one of the most energy efficient in the world today. Some ofthe plants have thermal and electrical SECs comparable to the best in the world resulting in lowemission intensities as well. Although there is room for improvement, certain factors inhibit theindustry from attaining higher efficiencies. Increasing the percentage of fly-ash and blastfurnace slag in blended cement up to the standards recommended by the Bureau of IndianStandards is one of the options to reduce consumption of raw material as well as energy.However, the price for BF slag and fly-ash that could be blended with clinker has beenincreasing over the years and this has negatively impacted the blending potential of certainplants.However, there are other options that the industry could adopt to conserve natural resources.Alternate Resources and Materials (ARM) such as coating residue, industrial lime and limesludge, gypsum from gas desulphurization are promising options. Rigorous research andexperimentation needs to be pursued to establish the standards and rates at which ARMs couldbe blended.Bureau of Indian Standards has prescribed standards for different grades of cement. Thestandards prescribe the compressive strength of cement for a given fineness at particular curingintervals and the allowable blending ratios. The National Council for Cement and BuildingMaterials could play an active role in conducting further research in this direction in order toincrease the production of blended and composite cements. The use of blended cements in thepublic and private sectors needs to be encouraged.AFRs such as refuse derived fuel, rice husk, wood chips, tyre waste etc. could redress theshortage of coal being experienced in the country. In 2008-09, against a coal consumption of

Executive Summary Page xi
29.58 Mt by the industry, 14.29 Mt was domestically supplied, meeting only 48% of the totalrequirement.The Central Pollution Control Board has notified the norms for managing hazardous waste andtheir usage in cement kilns through incineration. The safe alternative to consider is incineratingthe high calorific value hazardous wastes in cement kiln as compared to conventionalincineration. The field trials by CPCB suggest that monitoring hazardous air pollutants followedby a compliance notification of emission norms needs to be promoted. In addition, the variousCPCB and state PCB guidelines on this subject need to be rationalized in order to encouragesubstantially increased thermal substitution rates in cement kilns in the country.The competitiveness of the Indian cement industry is of foremost concern, considering that thecement industry is a core sector of the Indian economy. The current financial downturn, coupledwith fuel shortage, which has led to an increase in coal price, has affected the growth andperformance targets of the industry. Additionally, fluctuating demand profiles of specificproduct types, high transportation costs and variations in freight charges impact the cementsector as a whole.Cement DCs will need to invest in EE measures which will result in a decrease in energyconsumption. This report studies the potential of PAT to improve the energy efficiency of thecement sector and showcases the environmental and economic benefits of implementingvarious measures. This study can be used as a guidance tool for the industry to betterunderstand the PAT mechanism, study the impact of specific options available in theirrespective plants and incorporate viable measures to reduce their SEC.Outline of the reportA brief overview of the cement industry, which justifies its selection for further comprehensiveanalysis, is provided in the first chapter. Subsequently, current scenario of the Indian cementindustry and its estimated growth rate is discussed. It also provides a brief background on thelegislative framework addressing energy efficiency - Energy Conservation Act, 2001 and theroles played by policy regulators such as BEE. This chapter also expands the missions institutedunder the National Action Plan on Climate Change (NAPCC), and introduction of mechanismssuch as PAT undertaken to achieve specific objectives.Cement manufacturing involves many subprocesses. These are described in the second chapter.Energy and heat flow of the different subprocesses of a sample plant is described in the thirdchapter to understand the energy consumption at various stages of cement manufacturing. Thechapter examines electrical and thermal SEC of the subprocesses. The variation in operatingparameters at major equipments across the different subprocesses of the sample plant over asample time period is also examined. The ASPEN modeling tool has been utilized to simulate thecalcination process and provide a material balance.The major factors that affect the energy consumption of various equipments used in thedifferent subprocesses along with the associated technical details are mentioned in chapterfour. The critical operational parameters impacting the efficiency of the equipment are alsohighlighted.The fifth chapter describes how the PAT methodology applies to the cement sector followed bythe formulae used to calculate the G2G SEC. This includes the calculation of various sources ofenergy inputs and the methodology for calculation of baseline SEC. A discussion of the need fornormalization of baseline SEC is provided along with sample results.The PAT methodology is applied to several sample plants in chapter six. Plant-specificvariations are described. Both simple and normalized baseline G2G SECs are estimated and asummary table comparing the two indicators is provided.
Executive Summary Page xii
Levers to improve Energy Efficiency (EE) across the different sub processes, with respectivetechnology upgradation options, are illustrated in the seventh chapter. Several energy efficiencymeasures were evaluated based on financial criteria viz. Payback period, Net Present Value(NPV) and Internal Rate of Return (IRR). Other EE options like Blending, Waste Heat Recovery(WHR), and Alternative Fuel Resources (AFR) are also discussed. The technology databank is aninitiative to develop a database on available technologies from equipment manufacturers andhas been included in this chapter.The eighth chapter – PAT Focussed Scenario Analysis - analyses and showcases the potentialperformance of DCs under different SEC reduction scenarios. The plant specific economicimpact and the energy savings for different scenarios have been estimated. Simulationsvisualizing the behavior of sample plants in the first cycle of PAT have been conducted using apreliminary agent based model.Sustainable forms of cement are discussed in the ninth chapter. Here, standards recommendedby Bureau of Indian Standards are discussed. The emission intensity of sample plants is alsocalculated in this chapter.Lastly, challenges and policies associated with the cement industry in the context of PAT arediscussed along with standards and guidelines to manage hazardous waste in cement kilns.Environmental pollution norms, financing to meet EE goals, guidelines for Monitoring andValidation, and ISO 50001 (Energy Management Standard) have also been discussed. Theconclusions of the report are presented in the final chapter.
Contents Page xiii
Contents
Acknowledgements ......................................................................................................................................................... vExecutive Summary.......................................................................................................................................................viiList of Tables....................................................................................................................................................................xviList of Figures............................................................................................................................................................... xviii1. Introduction .............................................................................................................................................................. 11.1 India’s Energy Consumption and GHG Emissions ........................................................................... 11.2 Indian Cement Industry.............................................................................................................................. 11.3 Energy Efficiency Legislative Framework .......................................................................................... 51.3.1 National Mission on Enhanced Energy Efficiency (NMEEE).............................................. 61.3.2 Energy Conservation Act .................................................................................................................. 61.3.3 Bureau of Energy Efficiency (BEE)............................................................................................... 61.3.4 PAT Mechanism.................................................................................................................................... 61.3.5 Designated Consumers (DCs)......................................................................................................... 71.4 Technology Trends in the Cement Industry....................................................................................... 72. Cement Manufacturing Process ........................................................................................................................ 92.1 Detailed Description of Subprocesses .................................................................................................. 92.1.1 Raw Mill ................................................................................................................................................... 92.1.2 Preheater.............................................................................................................................................. 102.1.3 Precalciner........................................................................................................................................... 102.1.4 Rotary Kiln........................................................................................................................................... 112.1.5 Clinker Cooler..................................................................................................................................... 112.1.6 Cement Mill ......................................................................................................................................... 113. Material and Energy Flow in a Cement Plant ........................................................................................... 133.1 Electrical SEC within Subprocesses.................................................................................................... 143.2 Thermal SEC within Pyroprocessing.................................................................................................. 173.3 Composition of SEC at each subprocess............................................................................................ 193.4 Heat balance analysis ............................................................................................................................... 233.5 Equipment Level Performance Analysis........................................................................................... 283.6 Process Modeling ....................................................................................................................................... 414. Analysis of Energy Efficiency of a Cement Plant ..................................................................................... 474.1 Subprocess equipment performance................................................................................................. 474.1.1 Raw Mill ................................................................................................................................................ 474.1.2 Coal Mill ................................................................................................................................................ 484.1.3 Preheaters ........................................................................................................................................... 484.1.4 Precalciner........................................................................................................................................... 494.1.5 Kiln.......................................................................................................................................................... 49
Contents Page xiv
4.1.6 Clinker cooler ..................................................................................................................................... 514.1.7 Cement Mill ......................................................................................................................................... 525. Elements of the PAT Methodology................................................................................................................ 535.1 Data Collection ............................................................................................................................................ 535.1.1 Production and capacity utilization.......................................................................................... 535.1.2 Electricity consumption and costs............................................................................................. 535.1.3 Solid fuels............................................................................................................................................. 555.1.4 Liquid fuels.......................................................................................................................................... 565.1.5 Gaseous fuels ...................................................................................................................................... 585.1.6 Wastes recovered and used as fuels ......................................................................................... 585.1.7 Other Fuel Types............................................................................................................................... 595.1.8 Energy used in process heating .................................................................................................. 605.2 Data Validation............................................................................................................................................ 605.3 Baseline SEC Computation ..................................................................................................................... 605.4 Variations in Plant Operating Conditions ........................................................................................ 605.5 Normalized Baseline SEC ........................................................................................................................ 616. Baseline Methodology – Application in Sample Plants ........................................................................ 636.1 Industrial Case Studies............................................................................................................................. 636.2 Parametric Comparison of Plants........................................................................................................ 646.3 Baseline SEC Analysis............................................................................................................................... 697. Levers to Improve EE in a Cement Plant.................................................................................................... 737.1 Technology Options and EE Measures .............................................................................................. 737.1.1 Ball Mill Replacement by Vertical Roller Mill ....................................................................... 747.1.2 Pre-grinding Equipment for Raw Material Grinding ......................................................... 747.1.3 Intermittent Charging of Electric Dust Collector................................................................. 757.1.4 Clinker Grinding................................................................................................................................ 757.1.5 Motors ................................................................................................................................................... 767.1.6 Blending of Raw Materials ............................................................................................................ 777.1.7 Pyro-processing ................................................................................................................................ 787.1.8 Cost of a Typical Cement Plant.................................................................................................... 797.2 Waste Heat Recovery System (WHR) ................................................................................................ 807.3 Blending ......................................................................................................................................................... 837.4 Alternative Fuel Resources (AFR)....................................................................................................... 917.5 Captive Power Plant (CPP)..................................................................................................................... 957.6 Financial Analysis of EE Options........................................................................................................1057.7 Technology Databank.............................................................................................................................1118. PAT Focussed Scenario Analysis .................................................................................................................1138.1 Scenario Description...............................................................................................................................1138.2 Results of Scenario Analysis ................................................................................................................114
Contents Page xv
8.3 Agent Based Model for PAT .................................................................................................................1178.3.1 Introduction to agent based model .........................................................................................1188.3.2 Agent Based Model for PAT........................................................................................................1198.3.3 Preliminary Design ........................................................................................................................1198.3.4 Case studies.......................................................................................................................................1219. Eco-Friendly Cements......................................................................................................................................1259.1 Green cement .............................................................................................................................................1259.2 Standards in Cement Industry ............................................................................................................1299.2.1 BIS Standards for Cements .........................................................................................................1299.3 Emissions Intensity .................................................................................................................................1309.3.1 CO2 Emission from Sample Plants ...........................................................................................13310. Challenges and Policies for Cement Industry....................................................................................13510.1 Fly Ash Consumption..............................................................................................................................13510.2 Slag Consumption ....................................................................................................................................13510.3 Industrial Waste Usage ..........................................................................................................................13610.4 Corporate Responsibility for Environmental Protection.........................................................13710.5 Other Major Policies................................................................................................................................13710.5.1 Interstate Transportation of Hazardous Waste.................................................................13810.5.2 Use of Cement Kilns for Hazardous Waste Incineration ................................................13810.6 Shortage of Raw Material and Substitutes.....................................................................................13810.7 Availability of Coal ...................................................................................................................................13810.8 Factors Attributed to High Retail Cost of Indian Cement ........................................................13910.9 Environmental Pollution Norms........................................................................................................13910.10 Financing to Meet the EE Goals ..........................................................................................................14010.11 Monitoring and Validation ...................................................................................................................14010.12 ISO 50001 initiative.................................................................................................................................14011. Conclusions......................................................................................................................................................143References ......................................................................................................................................................................145Appendix I.......................................................................................................................................................................149Appendix II .....................................................................................................................................................................157Appendix III ...................................................................................................................................................................161
List of Tables Page xvi
List of Tables
Table 1: Cement production in India (1981 – 2011) (5).................................................................................. 2Table 2: Minimum annual energy consumption and estimated number of DCs(7).............................. 7Table 3: Summary of Energy Consumption........................................................................................................ 28Table 4: Composition of coal..................................................................................................................................... 45Table 5: Input Parameters ......................................................................................................................................... 45Table 6: Composition of clinker............................................................................................................................... 45Table 7: Output Parameters Computed by Aspen Model.............................................................................. 46Table 8: Preheater exhaust gas composition ..................................................................................................... 46Table 9: Typical values of Work Index for different materials (15) ......................................................... 47Table 10: Pressure drop and exit gas temperature of pre heater (11) ................................................... 48Table 11: Thermal energy consumption in kiln and cooler system (4).................................................. 50Table 12: Typical performance data on dry process kilns with preheaters, calciners, grate andplanetary coolers (11) ................................................................................................................................................. 50Table 13: Calculations of the cooler performance ........................................................................................... 51Table 14: Input parameters of the cooler performance ................................................................................ 52Table 15: Conversion factors .................................................................................................................................... 68Table 16: Comparison of simple and normalized SEC ................................................................................... 71Table 17: Key improvement areas across processes ...................................................................................... 73Table 18: Effect of implementing raw material pre-grinder (18) ............................................................. 74Table 19: Effectiveness of electric dust collector ............................................................................................. 75Table 20: Comparison between motors of different efficiencies (19)..................................................... 76Table 21: Measures to improve motor efficiency (19)................................................................................... 77Table 22: Cost of a 3,175 TPD production capacity cement plant............................................................. 79Table 23: Details of WHR in three plants (23) .................................................................................................. 81Table 24: Basic data for WHR calculations ......................................................................................................... 82Table 25: Calculation for power generated from the WHR model plant ................................................ 83Table 26: Data of a model cement plant............................................................................................................... 85Table 27: Energy Savings and CO2 reduction by increasing the portion of blended cement(40%PPC, 30%PSC & 30%OPC) .............................................................................................................................. 86Table 28: Energy savings by increasing the Portion of blended cement (70%PPC) ......................... 86Table 29: Energy savings by increasing the portion of blended cement (70%PSC).......................... 86Table 30: Variation of GHG and reduction in energy consumption with increasing fly-ashpercentage........................................................................................................................................................................ 88Table 31: Variation of GHG and reduction in energy consumption with increasing slagpercentage........................................................................................................................................................................ 89Table 32: Energy savings by increasing portion of limestone in OPC ..................................................... 91Table 33: Group classification of alternative raw materials with examples for individualmaterials(29) .................................................................................................................................................................. 93Table 34: Composition of red mud from MALCO and its properties........................................................ 93Table 35: Comparison of constituents of red mud and low grade bauxite............................................ 93Table 36: Properties of cement produced without red mud and with red mud ................................. 94Table 37: Effect of EE measures in BFP................................................................................................................ 99Table 38: Effect of EE measures in CEP..............................................................................................................100Table 39: Effect of EE measures in ACC..............................................................................................................100Table 40: Effect of EE measures in primary air fan.......................................................................................101Table 41: Effect of EE measures in auxiliary cooling water pump..........................................................102Table 42: Effect of EE measures in cooling tower fan ..................................................................................102Table 43: Effect of EE measures in hot well pump ........................................................................................103Table 44: Effect of EE measures in air compressor.......................................................................................103

List of Tables Page xvii
Table 45: Energy and rupees savings after implementing EE measures in CPP’s auxiliary systems.............................................................................................................................................................................................104Table 46: Consolidated list of EE measures......................................................................................................109Table 47: Baseline data, SEC reduction target and estimated cost .........................................................113Table 48: Comparison of OPC with alinite cement (43) ..............................................................................126Table 49: Comparison between OPC and Novacem cement ......................................................................127Table 50: BIS standards for OPC 53 (9)..............................................................................................................130Table 51: BIS standards for PPC 33 (9) ..............................................................................................................130Table 52: BIS standards for PSC 33 (9) ..............................................................................................................130Table 53: Price of Blast Furnace Slag (58) ........................................................................................................136Table 54: Group classification of ARM................................................................................................................137
List of Figures Page xviii
List of Figures
Figure 1. Sector-wise final energy consumption in 2009 ................................................................................ 1Figure 2. Sector-wise GHG emissions in 2007...................................................................................................... 2Figure 3. Historical cement production and capacity........................................................................................ 2Figure 4. Projected cement production capacity................................................................................................. 3Figure 5. Sector-wise industrial final energy consumption in the world in 2007................................. 3Figure 6. Sector-wise industrial final energy consumption in India in 2007 .......................................... 4Figure 7. Projected electrical energy consumption (cement)........................................................................ 4Figure 8. Projected thermal energy consumption (clinker) ........................................................................... 5Figure 9. Projected final energy consumption...................................................................................................... 5Figure 10. Historical thermal SEC over the last six decades (5) ................................................................... 8Figure 11. Historical electrical SEC for the last six decades (5) .................................................................... 8Figure 12. Flow diagram of cement manufacturing process ....................................................................... 10Figure 13. Energy flow in a cement plant(13)................................................................................................... 13Figure 14. Mass balance for1kg of cement(14)................................................................................................. 14Figure 15. Electrical energy intensity flow diagram (kWh/t Eq.cement) .............................................. 14Figure 16: Material flow diagram (tph)................................................................................................................ 15Figure 17. Crusher electrical SEC............................................................................................................................ 15Figure 18. Raw mill electrical SEC .......................................................................................................................... 16Figure 19. Coal mill electrical SEC .......................................................................................................................... 16Figure 20. Cement mill 1 electrical SEC................................................................................................................ 17Figure 21. Cement mill 2 electrical SEC................................................................................................................ 17Figure 22. Kiln – material flow (kg/kg clinker) ................................................................................................ 18Figure 23. Kiln - heat flow (kCal/kg clinker)...................................................................................................... 18Figure 24. Clinker cooler material flow................................................................................................................ 19Figure 25. Electrical SEC at major subprocesses.............................................................................................. 19Figure 26. Electrical SEC share (%) across subprocesses ............................................................................ 20Figure 27. Electrical SEC and share of crusher components ....................................................................... 20Figure 28. Electrical SEC and share of raw mill components...................................................................... 21Figure 29. Electrical SEC and share of kiln and coal mill components .................................................... 21Figure 30. Electrical SEC and share of cement mill components............................................................... 22Figure 31. Running hours of subprocess ............................................................................................................. 22Figure 32. Temperature of different inputs to the kiln.................................................................................. 23Figure 33. Temperature of different outputs from the kiln ......................................................................... 23Figure 34. Kiln heat balance – heat input ............................................................................................................ 24Figure 35. Kiln heat balance - heat output .......................................................................................................... 25Figure 36. Temperature of inputs to the clinker cooler ................................................................................ 26Figure 37. Temperature of outputs from the clinker cooler........................................................................ 26Figure 38. Heat input to the clinker cooler ......................................................................................................... 27Figure 39. Heat output from the clinker cooler ................................................................................................ 27Figure 40. Specific volume of air blown in cooler ............................................................................................ 27Figure 41. Damper position in raw mill ............................................................................................................... 28Figure 42. Motor load in raw mill ........................................................................................................................... 29Figure 43. Feed rate in raw mill .............................................................................................................................. 29Figure 44. Draught in raw mill ................................................................................................................................. 30Figure 45. Temperature in raw mill....................................................................................................................... 30Figure 46. Draft pressure in raw mill .................................................................................................................... 31Figure 47. Throughput at coal mill ......................................................................................................................... 31Figure 48. Residue (%) in a coal mill..................................................................................................................... 32Figure 49. Motor load at coal mill ........................................................................................................................... 32Figure 50. Mill inlet and outlet draught of a coal mill .................................................................................... 33
List of Figures Page xix
Figure 51. Feed rate at kiln and precalciner....................................................................................................... 33Figure 52. Preheater gas temperature.................................................................................................................. 34Figure 53. Preheater material temperature ....................................................................................................... 34Figure 54. Airflow rate at cooler ............................................................................................................................. 35Figure 55. Kiln temperature...................................................................................................................................... 35Figure 56. Radiation losses in cyclone 1A ........................................................................................................... 36Figure 57. RPM (%) of DC drive in cement mills .............................................................................................. 36Figure 58. ESP/BH fan damper position in cement mills.............................................................................. 37Figure 59. Blaine of cement in cement mills ...................................................................................................... 37Figure 60. Mill filling (%) in cement mills ........................................................................................................... 38Figure 61. Motor load of cement mill CM1 and CM2....................................................................................... 38Figure 62. Mill inlet and out draught for CM1 and CM2 ................................................................................ 39Figure 63. Temperature of materials in CM1 and CM2.................................................................................. 39Figure 64. Feed rate of materials in CM1 and CM2.......................................................................................... 40Figure 65. Clinker and total feed rate in CM1 and CM2................................................................................. 40Figure 66. Blending percentage of fly-ash in CM 1 and CM 2...................................................................... 41Figure 67. Preheater model....................................................................................................................................... 42Figure 68. Calciner process model ......................................................................................................................... 43Figure 69. Kiln model................................................................................................................................................... 44Figure 70. Relation between power drawn (kW/m) and the inside diameter of the shell (m) (11)............................................................................................................................................................................................... 48Figure 71. Effect of no. of preheaters with energy consumption and solids temperature enteringcalciner (11)..................................................................................................................................................................... 49Figure 72. Effect of kiln tilt on energy consumption and residence time of solids(11) ................... 51Figure 73. Production and Capacity Utilization across Plants .................................................................... 64Figure 74. Electricity Generation and Consumption for Illustrative Plants .......................................... 65Figure 75. Indian coal and Imported Coal Consumption .............................................................................. 65Figure 76. Gross Calorific Value of Indian and Imported Coal.................................................................... 66Figure 77. Gross Calorific Value of the Liquid Fuel Types ............................................................................ 66Figure 78. Total Energy from Liquid Fuel Types.............................................................................................. 67Figure 79. Energy Used as Process Heating across Plants............................................................................ 67Figure 80. Product variants in Plants.................................................................................................................... 68Figure 81. Comparison of Performance Indicators ......................................................................................... 69Figure 82. Total energy consumption across sample plants ....................................................................... 69Figure 83. Baseline SEC for sample plants .......................................................................................................... 70Figure 84. Difference in Equivalent Major Grade Cement Production .................................................... 70Figure 85. Normalized baseline SEC across plants.......................................................................................... 71Figure 86. Cost per tonne for different plant capacities................................................................................ 80Figure 87. Various Types of Cement Products in India in 2009................................................................. 84Figure 88. Energy savings from different types of blended materials .................................................... 87Figure 89. CO2 reduction from different types of blended materials....................................................... 87Figure 90. Energy savings from different composition of fly ash in PPC ............................................... 88Figure 91. CO2 reduction potential from different composition of fly-ash in PPC.............................. 89Figure 92. Energy savings from different composition of slag in PSC ..................................................... 90Figure 93. CO2 reduction potential from different composition of slag in PSC.................................... 91Figure 94. Captive capacity, generation and efficiency in 2008................................................................. 95Figure 95. Sector wise installed capacity and PLF of CPP ............................................................................ 95Figure 96. General process flow diagram of CPP.............................................................................................. 96Figure 97. Auto logic for VFD controlled condensate extraction pump (36)........................................ 99Figure 98. Auto logic for VFD controlled air-cooled condenser fan (36) .............................................100Figure 99. Auto logic for VFD controlled primary air fan (36) .................................................................101Figure 100. Control system of the auxiliary cooler water Pump (36) ...................................................101Figure 101. Control system of the cooling tower fan (36)..........................................................................102Figure 102. Control system of the hotwell pump (36).................................................................................103
List of Figures Page xx
Figure 103. Annual energy savings for the installation of high efficiency PH fan ............................106Figure 104. Present value of annual energy savings.....................................................................................107Figure 105. Present value of annual energy savings.....................................................................................107Figure 106. Annual energy savings for the installation of automatic star delta star starter for beltconveyors........................................................................................................................................................................108Figure 107. Payback period of different EE measures ................................................................................110Figure 108. NPV of EE measures...........................................................................................................................110Figure 109. IRR of EE measures ...........................................................................................................................111Figure 110. Scenarios based on estimated low cost......................................................................................115Figure 111. Scenarios based on estimated high cost ....................................................................................115Figure 112: Savings beyond target under low cost scenario.....................................................................116Figure 113: Savings beyond target under high cost scenario ...................................................................116Figure 114: Energy Saved at BL production for various scenarios ........................................................117Figure 115: Energy saved beyond target for different Scenarios............................................................117Figure 116. Canonical view of an agent-based system (41) ......................................................................118Figure 117. Agent based model architecture diagram.................................................................................120Figure 118. Behavior of agents during a three year period .......................................................................123Figure 119. Schematic diagram of CALERA process .....................................................................................128Figure 120. Calciner System for Semidolime Production ...........................................................................129Figure 121. Specific emission intensity of cement sector...........................................................................131Figure 122. Process flow diagram of cement manufacturing showing emission points ...............132Figure 123. Emission intensity across selected plants ................................................................................134Figure 124. Emission intensity vs. SEC trend for nine plants ...................................................................134Figure 125. Essential Components of the PDCA Process (66) ..................................................................141
Introduction Page 1
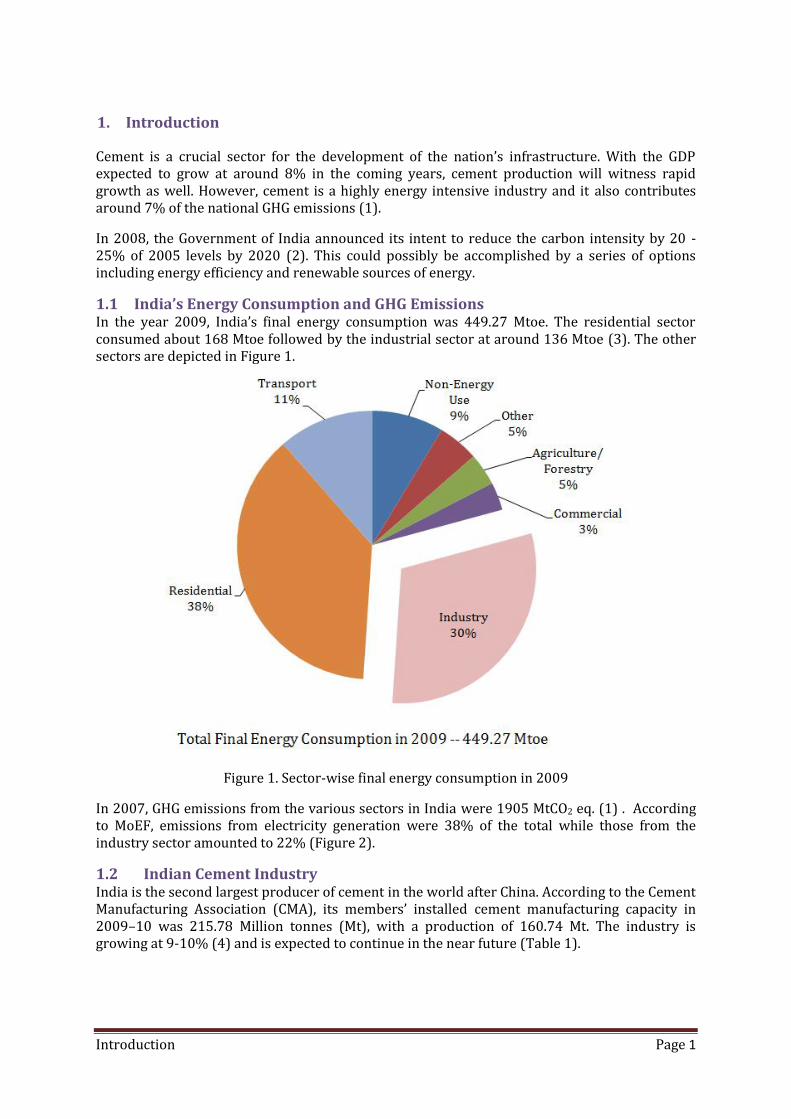
1. IntroductionCement is a crucial sector for the development of the nation’s infrastructure. With the GDPexpected to grow at around 8% in the coming years, cement production will witness rapidgrowth as well. However, cement is a highly energy intensive industry and it also contributesaround 7% of the national GHG emissions (1).In 2008, the Government of India announced its intent to reduce the carbon intensity by 20 -25% of 2005 levels by 2020 (2). This could possibly be accomplished by a series of optionsincluding energy efficiency and renewable sources of energy.1.1 India’s Energy Consumption and GHG EmissionsIn the year 2009, India’s final energy consumption was 449.27 Mtoe. The residential sectorconsumed about 168 Mtoe followed by the industrial sector at around 136 Mtoe (3). The othersectors are depicted in Figure 1.
Figure 1. Sector-wise final energy consumption in 2009In 2007, GHG emissions from the various sectors in India were 1905 MtCO2 eq. (1) . Accordingto MoEF, emissions from electricity generation were 38% of the total while those from theindustry sector amounted to 22% (Figure 2).1.2 Indian Cement IndustryIndia is the second largest producer of cement in the world after China. According to the CementManufacturing Association (CMA), its members’ installed cement manufacturing capacity in2009–10 was 215.78 Million tonnes (Mt), with a production of 160.74 Mt. The industry isgrowing at 9-10% (4) and is expected to continue in the near future (Table 1).

Introduction Page 2
Figure 2. Sector-wise GHG emissions in 2007Table 1: Cement production in India (1981 – 2011) (5)Year Cement Production Capacity (Mt)1981 291991 612001 1332010 2342011 313
Figure 3 shows the growth in cement production capacity and actual cement production for1955 - 2010. It is interesting to note that the cement production capacity almost doubled every10 years till 2005. Further, the installed capacity in 2011 was double that of 2005(5). At thisrate, the production capacity is expected to grow up to 572 Mt by 2017 (Figure 4).
Figure 3. Historical cement production and capacity

Introduction Page 3
Figure 4. Projected cement production capacityIn 2007, cement was the third highest energy consumer amongst all the industries in the world(Figure 5) - the leaders being, chemical and iron and steel (6). India’s cement sector consumedaround 9% of the total energy amongst the various industries in the same year (Figure 6).The rapid growth in cement production will lead to an increase in energy demand as well. Thecement working group in the Planning Commission estimates the industry to grow at 11.5% perannum for a GDP growth rate of 9%.
Figure 5. Sector-wise industrial final energy consumption in the world in 2007

Introduction Page 4
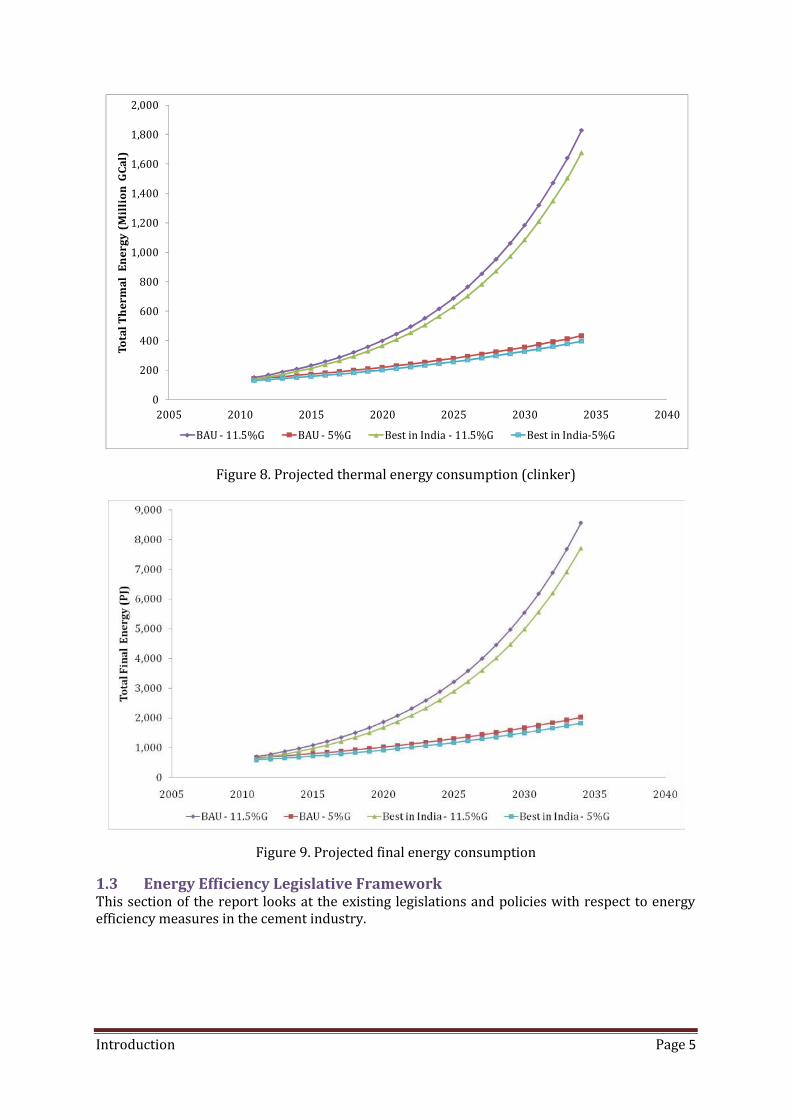
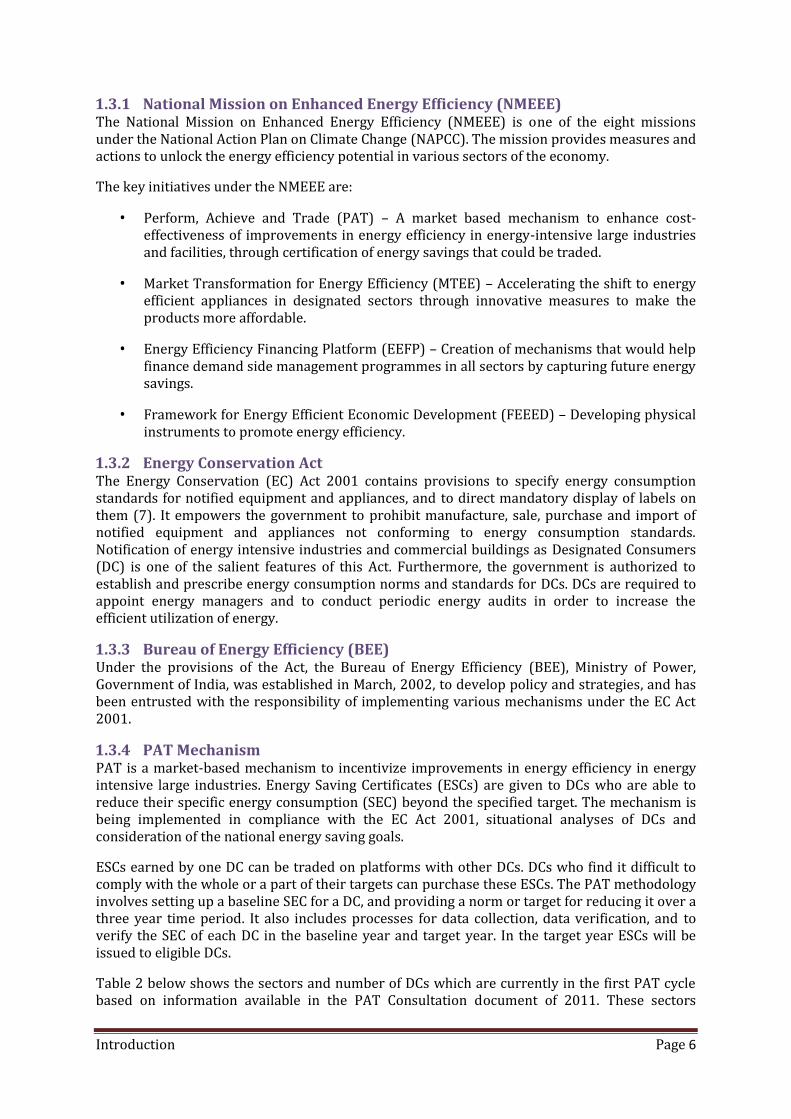
Figure 6. Sector-wise industrial final energy consumption in India in 2007Projections for the increase in energy consumption in the cement industry in India arepresented in Figure 7- Figure 9. Two scenarios have been considered - Business As Usual (BAU)and Best in India. Cement consumption growth rates of 11.5% and a more conservative 5% arethe two cases analyzed for these two scenarios.In both the scenarios, the total final energy consumption increases several fold from the presentvalue. In the BAU scenario, the energy efficiency of new cement plants is the average of theexisting units. In the second scenario (Best in India), we assume that all new plants are builtwith the best available technology.The results show that there is a large potential for accomplishing savings in electrical andthermal energy using energy efficiency measures. The potential electrical energy savings fromBAU (11.5%) is 59 Billion kWh, the potential thermal energy savings is 150 Million GCal and thecombined final energy savings is estimated to be 850 PJ in 2035.
Figure 7. Projected electrical energy consumption (cement)
Introduction Page 5
Figure 8. Projected thermal energy consumption (clinker)
Figure 9. Projected final energy consumption1.3 Energy Efficiency Legislative FrameworkThis section of the report looks at the existing legislations and policies with respect to energyefficiency measures in the cement industry.
02004006008001,0001,2001,4001,6001,8002,000
2005 2010 2015 2020 2025 2030 2035 2040
Tota
l The
rmal
Ene
rgy
(Mil
lion
GCa
l)
BAU - 11.5%G BAU - 5%G Best in India - 11.5%G Best in India-5%G
Introduction Page 6
1.3.1 National Mission on Enhanced Energy Efficiency (NMEEE)The National Mission on Enhanced Energy Efficiency (NMEEE) is one of the eight missionsunder the National Action Plan on Climate Change (NAPCC). The mission provides measures andactions to unlock the energy efficiency potential in various sectors of the economy.The key initiatives under the NMEEE are: Perform, Achieve and Trade (PAT) – A market based mechanism to enhance cost-effectiveness of improvements in energy efficiency in energy-intensive large industriesand facilities, through certification of energy savings that could be traded. Market Transformation for Energy Efficiency (MTEE) – Accelerating the shift to energyefficient appliances in designated sectors through innovative measures to make theproducts more affordable. Energy Efficiency Financing Platform (EEFP) – Creation of mechanisms that would helpfinance demand side management programmes in all sectors by capturing future energysavings. Framework for Energy Efficient Economic Development (FEEED) – Developing physicalinstruments to promote energy efficiency.
1.3.2 Energy Conservation ActThe Energy Conservation (EC) Act 2001 contains provisions to specify energy consumptionstandards for notified equipment and appliances, and to direct mandatory display of labels onthem (7). It empowers the government to prohibit manufacture, sale, purchase and import ofnotified equipment and appliances not conforming to energy consumption standards.Notification of energy intensive industries and commercial buildings as Designated Consumers(DC) is one of the salient features of this Act. Furthermore, the government is authorized toestablish and prescribe energy consumption norms and standards for DCs. DCs are required toappoint energy managers and to conduct periodic energy audits in order to increase theefficient utilization of energy.1.3.3 Bureau of Energy Efficiency (BEE)Under the provisions of the Act, the Bureau of Energy Efficiency (BEE), Ministry of Power,Government of India, was established in March, 2002, to develop policy and strategies, and hasbeen entrusted with the responsibility of implementing various mechanisms under the EC Act2001.1.3.4 PAT MechanismPAT is a market-based mechanism to incentivize improvements in energy efficiency in energyintensive large industries. Energy Saving Certificates (ESCs) are given to DCs who are able toreduce their specific energy consumption (SEC) beyond the specified target. The mechanism isbeing implemented in compliance with the EC Act 2001, situational analyses of DCs andconsideration of the national energy saving goals.ESCs earned by one DC can be traded on platforms with other DCs. DCs who find it difficult tocomply with the whole or a part of their targets can purchase these ESCs. The PAT methodologyinvolves setting up a baseline SEC for a DC, and providing a norm or target for reducing it over athree year time period. It also includes processes for data collection, data verification, and toverify the SEC of each DC in the baseline year and target year. In the target year ESCs will beissued to eligible DCs.Table 2 below shows the sectors and number of DCs which are currently in the first PAT cyclebased on information available in the PAT Consultation document of 2011. These sectors
Introduction Page 7
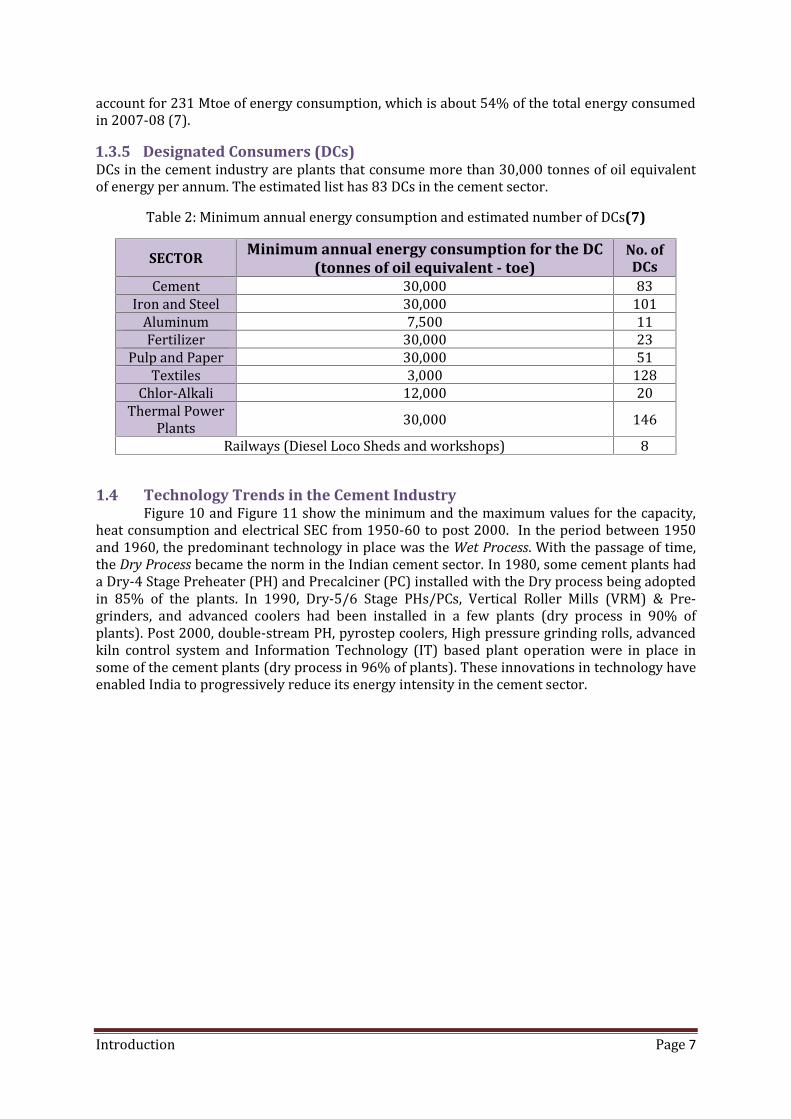
account for 231 Mtoe of energy consumption, which is about 54% of the total energy consumedin 2007-08 (7).1.3.5 Designated Consumers (DCs)DCs in the cement industry are plants that consume more than 30,000 tonnes of oil equivalentof energy per annum. The estimated list has 83 DCs in the cement sector.Table 2: Minimum annual energy consumption and estimated number of DCs(7)
SECTOR Minimum annual energy consumption for the DC(tonnes of oil equivalent - toe)
No. ofDCsCement 30,000 83Iron and Steel 30,000 101Aluminum 7,500 11Fertilizer 30,000 23Pulp and Paper 30,000 51Textiles 3,000 128Chlor-Alkali 12,000 20Thermal PowerPlants 30,000 146Railways (Diesel Loco Sheds and workshops) 8
1.4 Technology Trends in the Cement IndustryFigure 10 and Figure 11 show the minimum and the maximum values for the capacity,heat consumption and electrical SEC from 1950-60 to post 2000. In the period between 1950and 1960, the predominant technology in place was the Wet Process. With the passage of time,the Dry Process became the norm in the Indian cement sector. In 1980, some cement plants hada Dry-4 Stage Preheater (PH) and Precalciner (PC) installed with the Dry process being adoptedin 85% of the plants. In 1990, Dry-5/6 Stage PHs/PCs, Vertical Roller Mills (VRM) & Pre-grinders, and advanced coolers had been installed in a few plants (dry process in 90% ofplants). Post 2000, double-stream PH, pyrostep coolers, High pressure grinding rolls, advancedkiln control system and Information Technology (IT) based plant operation were in place insome of the cement plants (dry process in 96% of plants). These innovations in technology haveenabled India to progressively reduce its energy intensity in the cement sector.

Introduction Page 8
Figure 10. Historical thermal SEC over the last six decades (5)Figure 10 and Figure 11 show reductions in the thermal (kCal/kg clinker) and electrical(kWh/t cement) energy intensity in the cement industry over the last six decades.
Figure 11. Historical electrical SEC for the last six decades (5)
Cement Manufacturing Process Page 9
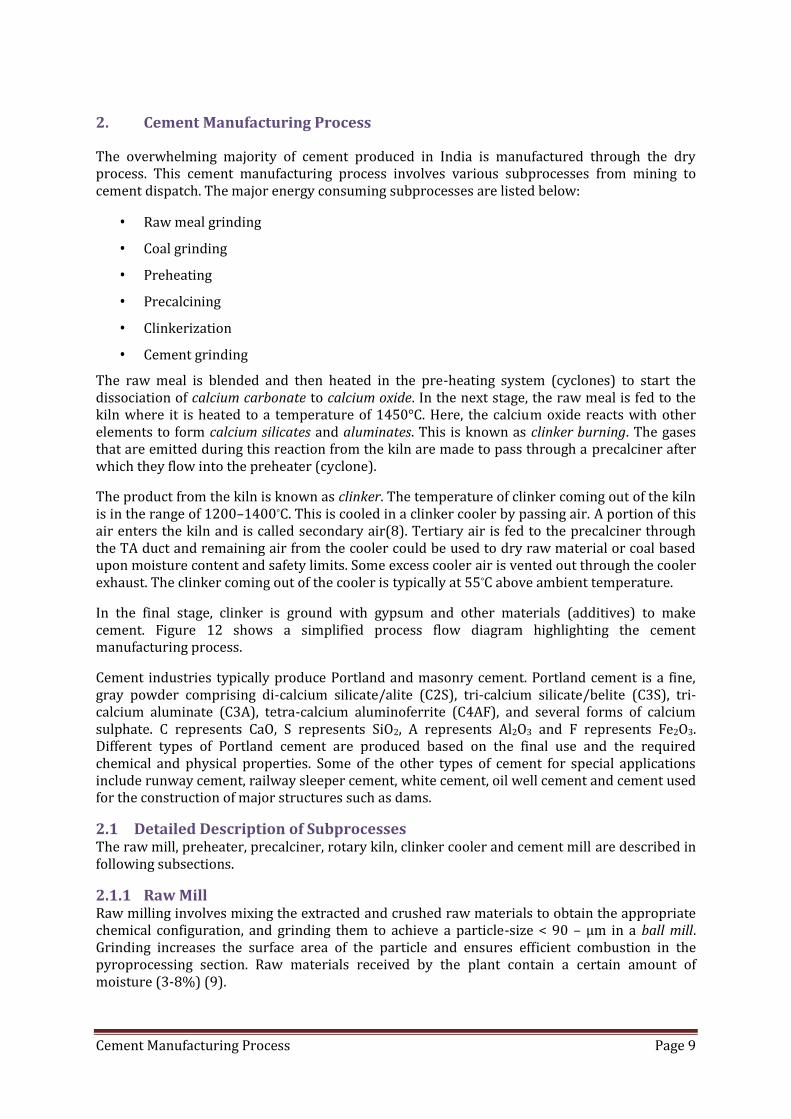
2. Cement Manufacturing ProcessThe overwhelming majority of cement produced in India is manufactured through the dryprocess. This cement manufacturing process involves various subprocesses from mining tocement dispatch. The major energy consuming subprocesses are listed below: Raw meal grinding Coal grinding Preheating Precalcining Clinkerization Cement grindingThe raw meal is blended and then heated in the pre-heating system (cyclones) to start thedissociation of calcium carbonate to calcium oxide. In the next stage, the raw meal is fed to thekiln where it is heated to a temperature of 1450°C. Here, the calcium oxide reacts with otherelements to form calcium silicates and aluminates. This is known as clinker burning. The gasesthat are emitted during this reaction from the kiln are made to pass through a precalciner afterwhich they flow into the preheater (cyclone).The product from the kiln is known as clinker. The temperature of clinker coming out of the kilnis in the range of 1200–1400°C. This is cooled in a clinker cooler by passing air. A portion of thisair enters the kiln and is called secondary air(8). Tertiary air is fed to the precalciner throughthe TA duct and remaining air from the cooler could be used to dry raw material or coal basedupon moisture content and safety limits. Some excess cooler air is vented out through the coolerexhaust. The clinker coming out of the cooler is typically at 55°C above ambient temperature.In the final stage, clinker is ground with gypsum and other materials (additives) to makecement. Figure 12 shows a simplified process flow diagram highlighting the cementmanufacturing process.Cement industries typically produce Portland and masonry cement. Portland cement is a fine,gray powder comprising di-calcium silicate/alite (C2S), tri-calcium silicate/belite (C3S), tri-calcium aluminate (C3A), tetra-calcium aluminoferrite (C4AF), and several forms of calciumsulphate. C represents CaO, S represents SiO2, A represents Al2O3 and F represents Fe2O3.Different types of Portland cement are produced based on the final use and the requiredchemical and physical properties. Some of the other types of cement for special applicationsinclude runway cement, railway sleeper cement, white cement, oil well cement and cement usedfor the construction of major structures such as dams.
2.1 Detailed Description of SubprocessesThe raw mill, preheater, precalciner, rotary kiln, clinker cooler and cement mill are described infollowing subsections.2.1.1 Raw MillRaw milling involves mixing the extracted and crushed raw materials to obtain the appropriatechemical configuration, and grinding them to achieve a particle-size < 90 – μm in a ball mill.Grinding increases the surface area of the particle and ensures efficient combustion in thepyroprocessing section. Raw materials received by the plant contain a certain amount ofmoisture (3-8%) (9).

Cement Manufacturing Process Page 10
Figure 12. Flow diagram of cement manufacturing process2.1.2 PreheaterIt is essential to remove the moisture content from the raw material before it is fed to the kilnfor combustion. The preheater transfer the heat of the flue gases generated in the process cycleto the raw meal which is introduced at the inlet duct (10).The flue gases are oriented in acounter current gas flow pattern and the raw meal is continuously collected and passedthrough different stages of cyclones from the preheater to the precalciner.2.1.3 PrecalcinerIn the precalciner, raw meal is taken from the penultimate stage of the preheater to a vesselwhere heat for calcination is generated by firing fuel in it(11). Preheated air for combustion cancome from the kiln or grate cooler. The preheater fan draws products of combustion anddissociated CO2 through the calciner. Degree of calcination achieved is directly related to theamount of fuel fired in the calciner. When 60% of the fuel is fired in a calciner, degree ofcalcination achieved is 90-95 %. The temperature of raw mix begins to rise when calcination iscomplete, changing the flow characteristics. Therefore, in precalciner stage, calcination islimited to 90%. The following reactions take place inside the precalciner (8):CaCO3→CaO+CO2MgCO3→MgO+CO290-95% of the raw meal is calcined as per the above reactions and the remaining amount of rawmeal is calcined in the kiln.

Cement Manufacturing Process Page 11
2.1.4 Rotary KilnThe pyro-processing/clinkerization takes place in the rotary kiln. The calcined raw mix alongwith unconverted raw meal from precalciner is passed through the kiln system. The kiln isdesigned to maximize the efficiency of heat transfer from fuel to the raw material and also toensure uniform mixing. In a dry rotary kiln, feed material with much lower moisture content(0.5%) is used when compared to the wet or semi-wet process, thereby reducing the need forevaporation and reducing kiln length. Recent developments have added multi-stage suspensionpreheaters (i.e. a cyclone) or shaft preheater. Precalciner, the latest technology, adds a secondcombustion chamber between the kiln and a conventional preheater, allowing for furtherreduction in specific fuel consumption.The kiln contains four sections namely preheating zone, calcination zone, burning zone andcooling zone. In the preheater tower, the raw materials are heated rapidly to a temperature ofabout 1000°C, where the limestone forms burnt lime. In the rotating kiln, the temperaturereaches 1450°C. At this high temperature, minerals fuse together to predominantly formcalcium silicate crystals - cement clinker. The latest cement plants, which are mostly dry processbased, have preheating zones and precalcination zones that are external to the kiln.The unconverted raw meal undergoes complete calcination in the kiln by the reactions given inthe section 2.1.3 and the following additional reactions takes place at around 1200 - 1300°C(8):2CaO+SiO2→2CaO.SiO23CaO+SiO2→3CaO.SiO23CaO+Al2O3→3CaO.Al2O34CaO+Al2O3+Fe2O3→4CaO.Al2O3.Fe2O3The first reaction among the above reactions is the formation of C2S, second one is theformation of C3S, third reaction is the formation of C3A and the last reaction is the formation ofC4AF. The molten phase of clinker contains all these compounds.2.1.5 Clinker CoolerThe molten clinker is cooled as rapidly as possible to prevent damage to the clinker handlingmaterial. This is done to recover heat from the hot clinker and to enhance silicate reactivity,preventing alite transformation into belite and blocking the β form of C2S (12). The ambient airused to cool the clinker is then supplied to the precalciner as combustion air.2.1.6 Cement MillCement mill is used for grinding clinker along with approximately 5% of natural or syntheticgypsum for producing Ordinary Portland Cement (OPC). Fly-ash is blended with clinker toproduce Portland Pozzolana Cement (PPC) and blast furnace slag is blended with clinker toproduce Portland Slag Cement (PSC). The granules of clinker, gypsum and either slag or fly-ashare added in proportions as per the Bureau of Indian Standards specifications and then groundtogether either in a ball mill or a vertical roller mill. In some cases a roller press is used toreduce the particle size followed by final grinding in a ball mill. This usually increases theproductivity and decreases the electrical SEC.

Page 12
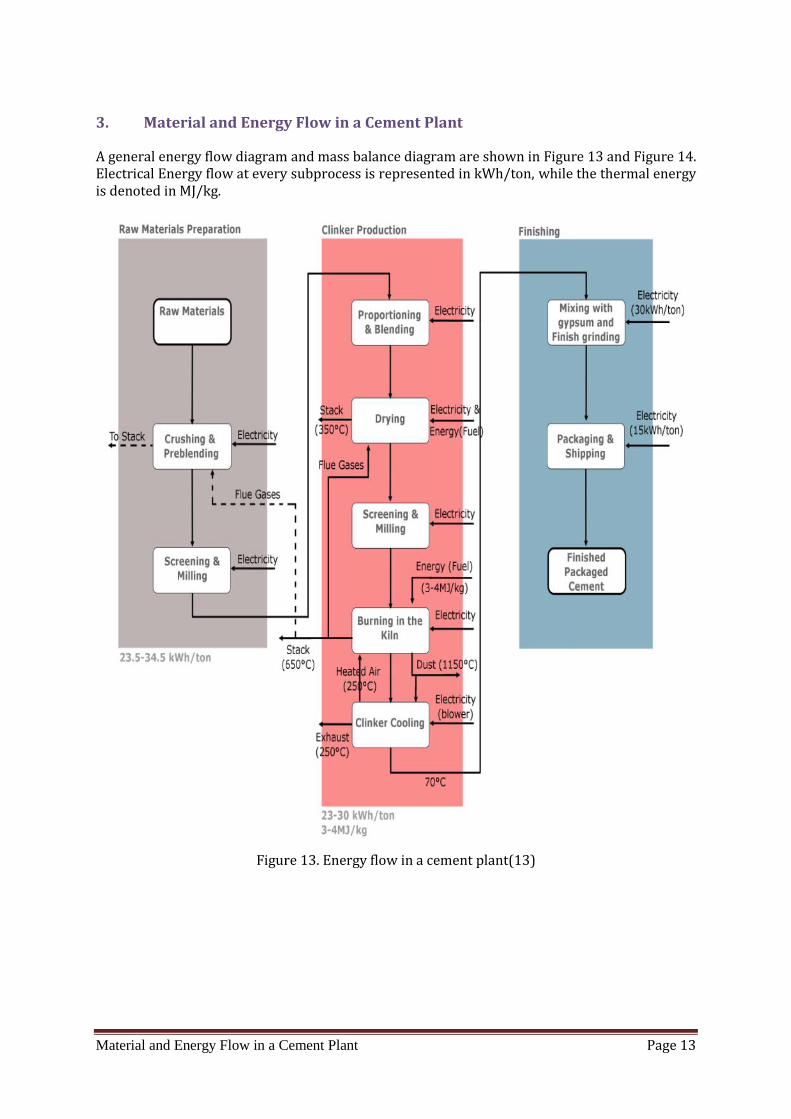
Material and Energy Flow in a Cement Plant Page 13
3. Material and Energy Flow in a Cement PlantA general energy flow diagram and mass balance diagram are shown in Figure 13 and Figure 14.Electrical Energy flow at every subprocess is represented in kWh/ton, while the thermal energyis denoted in MJ/kg.
Figure 13. Energy flow in a cement plant(13)

Material and Energy Flow in a Cement Plant Page 14
Figure 14. Mass balance for1kg of cement(14)3.1 Electrical SEC within SubprocessesIn this chapter, we have studied the material flow and the energy flow of a sample cement plant.Figure 15 shows the electrical energy intensity flow of the sample cement plant. The electricalenergy intensity is denoted in terms of kWh/t Eq.cement. Figure 16 shows the material flowdiagram (tph) at major subprocesses.
Figure 15. Electrical energy intensity flow diagram (kWh/t Eq.cement)
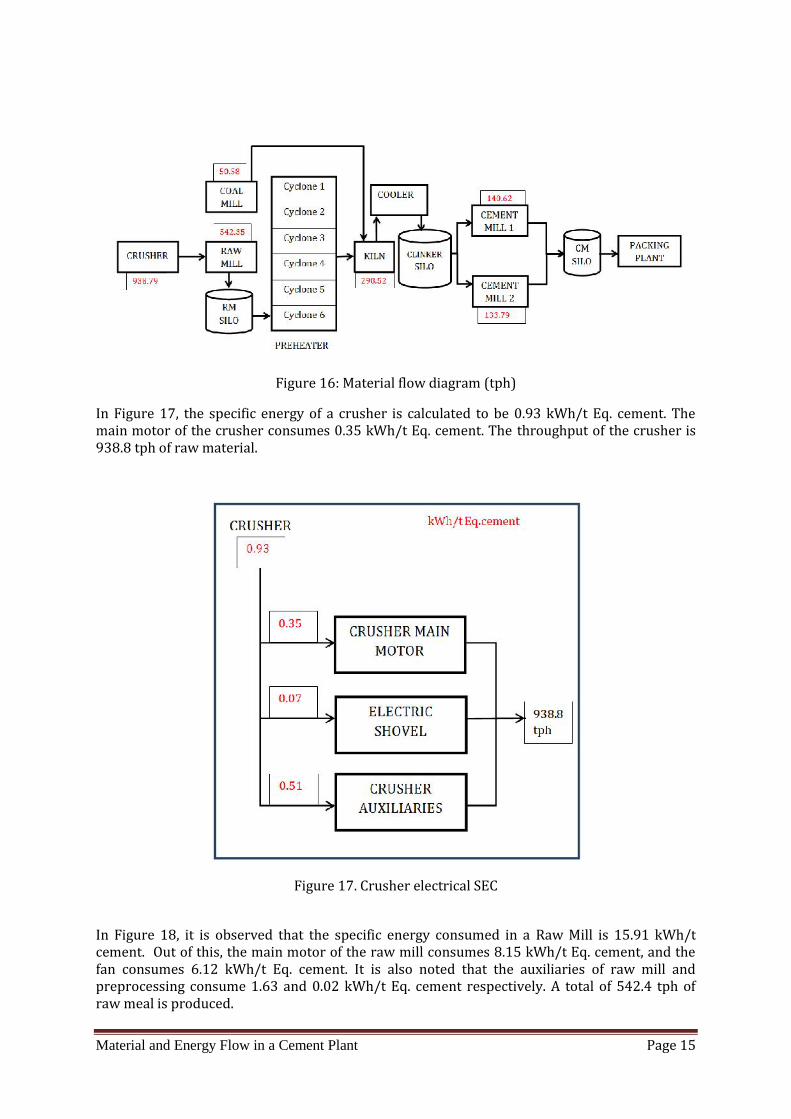
Material and Energy Flow in a Cement Plant Page 15
Figure 16: Material flow diagram (tph)In Figure 17, the specific energy of a crusher is calculated to be 0.93 kWh/t Eq. cement. Themain motor of the crusher consumes 0.35 kWh/t Eq. cement. The throughput of the crusher is938.8 tph of raw material.
Figure 17. Crusher electrical SECIn Figure 18, it is observed that the specific energy consumed in a Raw Mill is 15.91 kWh/tcement. Out of this, the main motor of the raw mill consumes 8.15 kWh/t Eq. cement, and thefan consumes 6.12 kWh/t Eq. cement. It is also noted that the auxiliaries of raw mill andpreprocessing consume 1.63 and 0.02 kWh/t Eq. cement respectively. A total of 542.4 tph ofraw meal is produced.
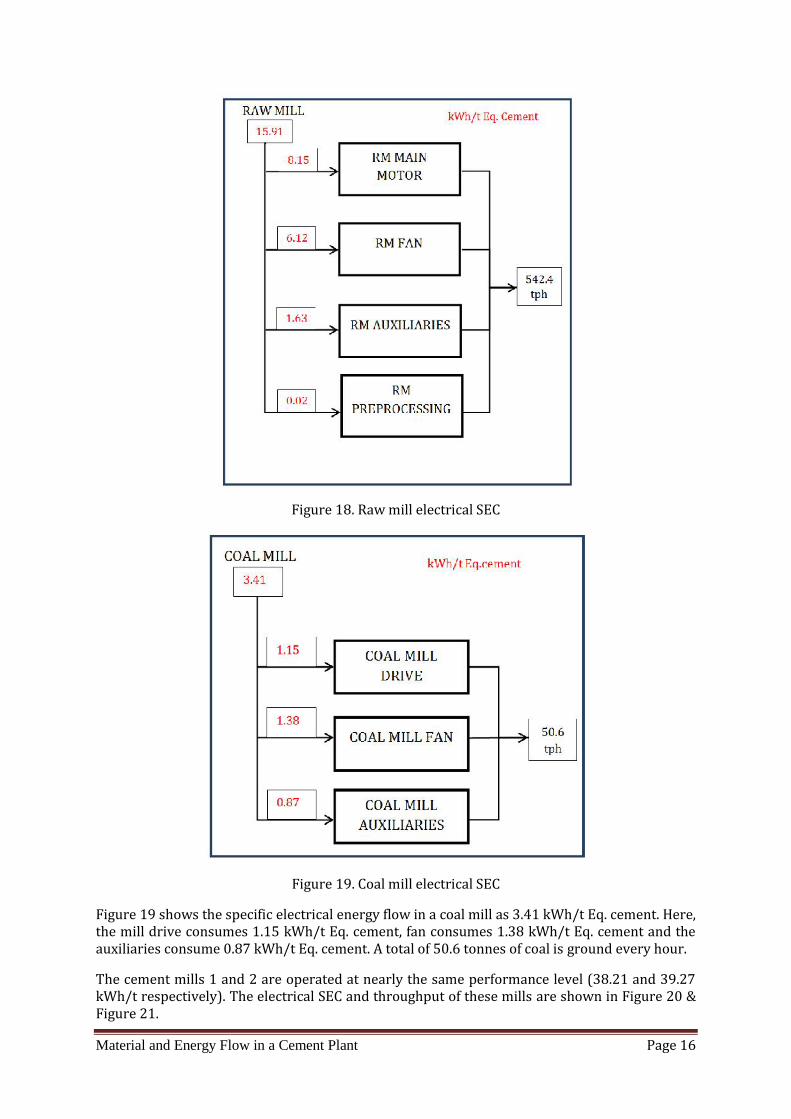
Material and Energy Flow in a Cement Plant Page 16
Figure 18. Raw mill electrical SEC
Figure 19. Coal mill electrical SECFigure 19 shows the specific electrical energy flow in a coal mill as 3.41 kWh/t Eq. cement. Here,the mill drive consumes 1.15 kWh/t Eq. cement, fan consumes 1.38 kWh/t Eq. cement and theauxiliaries consume 0.87 kWh/t Eq. cement. A total of 50.6 tonnes of coal is ground every hour.The cement mills 1 and 2 are operated at nearly the same performance level (38.21 and 39.27kWh/t respectively). The electrical SEC and throughput of these mills are shown in Figure 20 &Figure 21.
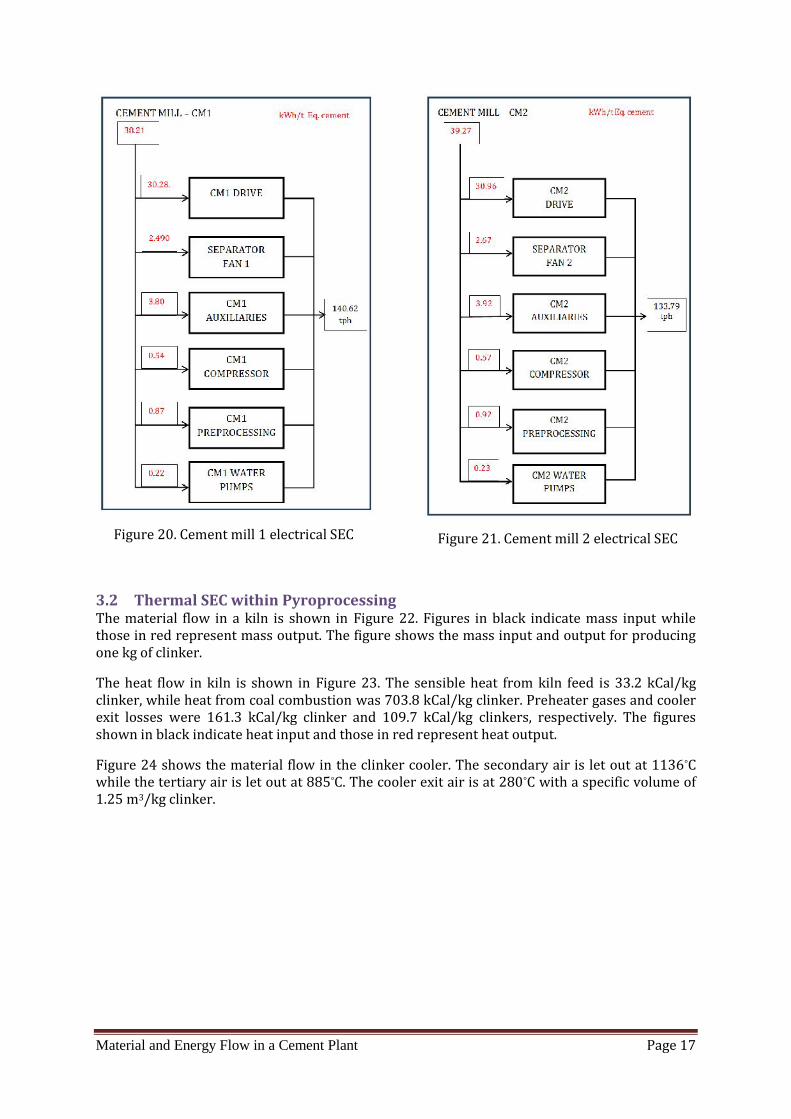
Material and Energy Flow in a Cement Plant Page 17
Figure 20. Cement mill 1 electrical SEC Figure 21. Cement mill 2 electrical SEC3.2 Thermal SEC within PyroprocessingThe material flow in a kiln is shown in Figure 22. Figures in black indicate mass input whilethose in red represent mass output. The figure shows the mass input and output for producingone kg of clinker.The heat flow in kiln is shown in Figure 23. The sensible heat from kiln feed is 33.2 kCal/kgclinker, while heat from coal combustion was 703.8 kCal/kg clinker. Preheater gases and coolerexit losses were 161.3 kCal/kg clinker and 109.7 kCal/kg clinkers, respectively. The figuresshown in black indicate heat input and those in red represent heat output.Figure 24 shows the material flow in the clinker cooler. The secondary air is let out at 1136°Cwhile the tertiary air is let out at 885°C. The cooler exit air is at 280°C with a specific volume of1.25 m3/kg clinker.
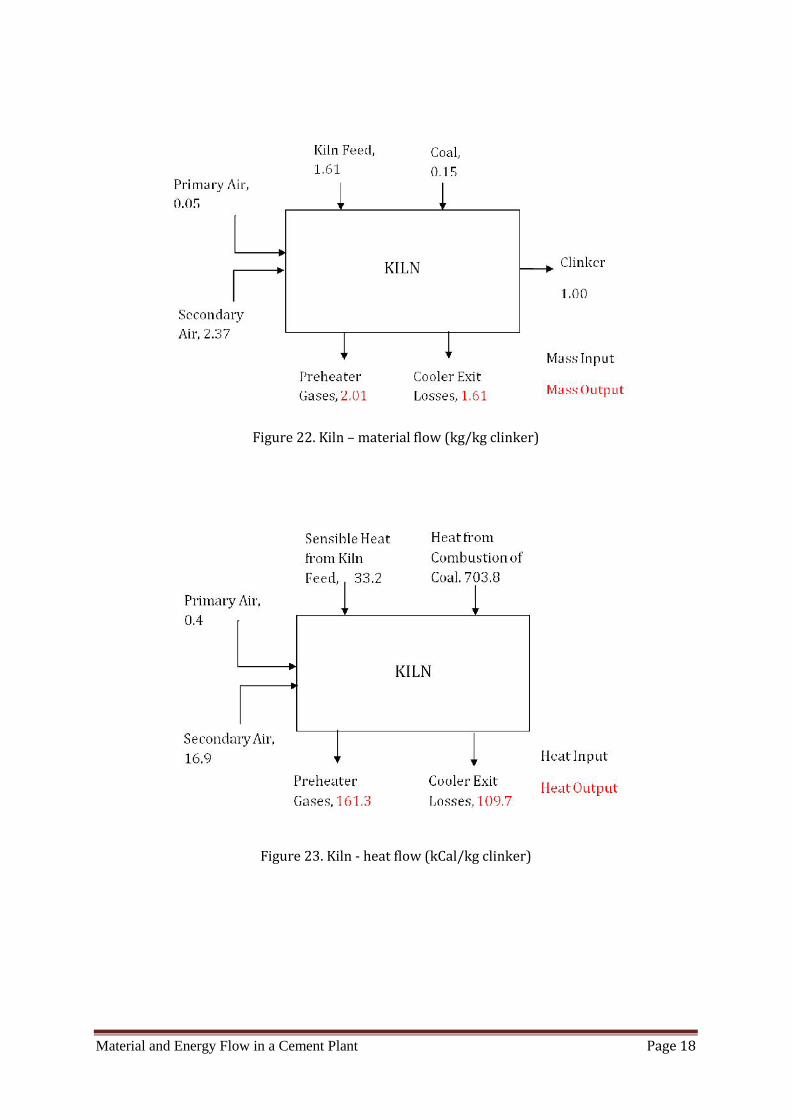
Material and Energy Flow in a Cement Plant Page 18
Figure 22. Kiln – material flow (kg/kg clinker)
Figure 23. Kiln - heat flow (kCal/kg clinker)

Material and Energy Flow in a Cement Plant Page 19
Figure 24. Clinker cooler material flow3.3 Composition of SEC at each subprocessThe electrical and thermal energy consumption of a sample cement plant is discussed in thissection. Figure 25 highlights the electrical SEC of a typical cement plant with subprocesses likecrusher, raw mill, kiln and cement mill. The total electrical SEC of the cement plant is 83.71kWh/t Eq. cement. Since the plant operates two cement mills, the weighted average (38.74kWh/t Eq. cement) is used to compute the total SEC.
Figure 25. Electrical SEC at major subprocesses
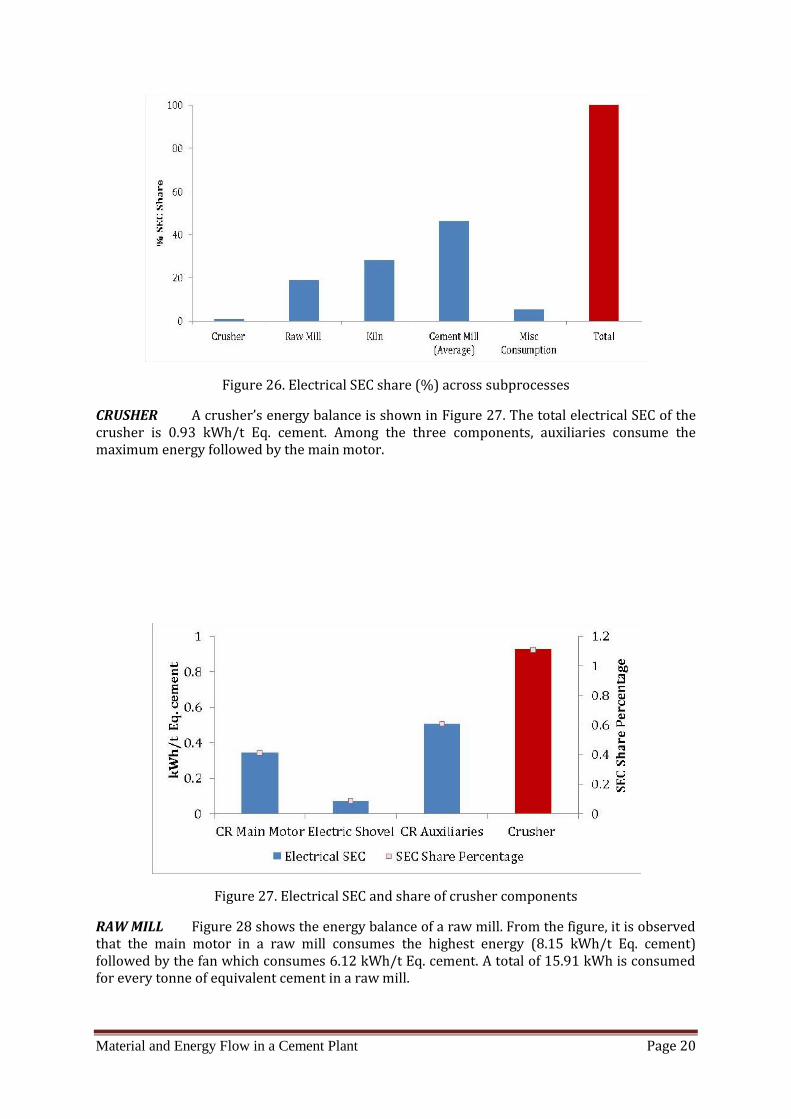
Material and Energy Flow in a Cement Plant Page 20
Figure 26. Electrical SEC share (%) across subprocessesCRUSHER A crusher’s energy balance is shown in Figure 27. The total electrical SEC of thecrusher is 0.93 kWh/t Eq. cement. Among the three components, auxiliaries consume themaximum energy followed by the main motor.
Figure 27. Electrical SEC and share of crusher componentsRAW MILL Figure 28 shows the energy balance of a raw mill. From the figure, it is observedthat the main motor in a raw mill consumes the highest energy (8.15 kWh/t Eq. cement)followed by the fan which consumes 6.12 kWh/t Eq. cement. A total of 15.91 kWh is consumedfor every tonne of equivalent cement in a raw mill.

Material and Energy Flow in a Cement Plant Page 21
Figure 28. Electrical SEC and share of raw mill componentsPYROPROCESSING The electrical SEC of the components of the pyroprocessing section isshown in Figure 29. The kiln auxiliaries consume 5.96 kWh/t Eq. cement, which is the highestamong the components. The next highest is the preheater fan with 5.28 kWh/t Eq. cement.
Figure 29. Electrical SEC and share of kiln and coal mill componentsCEMENT MILL The electrical SEC of cement mill components is shown in Figure 30. The majorportion of the energy is consumed by the mill drives.

Material and Energy Flow in a Cement Plant Page 22
Figure 30. Electrical SEC and share of cement mill components
Figure 31 shows a sample of the running hours of each subprocess in a cement plant. Thecement mills 1 and 2 recorded the maximum number of running hours for a month, followed bykiln, raw mill and crusher sections.
Figure 31. Running hours of subprocess

Material and Energy Flow in a Cement Plant Page 23
3.4 Heat balance analysisThe thermal energy balance shown in this section includes the heat input and heat output at thekiln and clinker cooler.KILN HEAT BALANCEThe temperature of different inputs at the kiln is shown in Figure 32. The inputs considered areprimary air, cooling air, conveying air from kiln feed, conveying air from coal, sensible heat fromkiln feed, sensible heat from coal, sensible heat from cooler water spray and sensible heat fromingress air (including fresh air at cooler exit).
Figure 32. Temperature of different inputs to the kilnThe temperature of different outputs from the kiln is shown in Figure 33. The preheater exitdust losses and exit gases have the highest temperature among all the other outputs of the kiln.
Figure 33. Temperature of different outputs from the kilnThe kiln heat balance is shown in Figure 34 and Figure 35. The heat inputs are shown in Figure34. It is observed that the heat content from the coal combustion is 703.8 kCal/kg clinker. Theheat outputs are shown in Figure 35. The theoretical heat of reaction accounts for 414.8 kCal/kgclinker, while the preheater exit gases and cooler exit losses account for161.3 kCal/kg clinkerand 109.7 kCal/kg clinker respectively. It is also noted that the radiation losses are about 37.8kCal/kg clinker.

Material and Energy Flow in a Cement Plant Page 24
Figure 34. Kiln heat balance – heat input
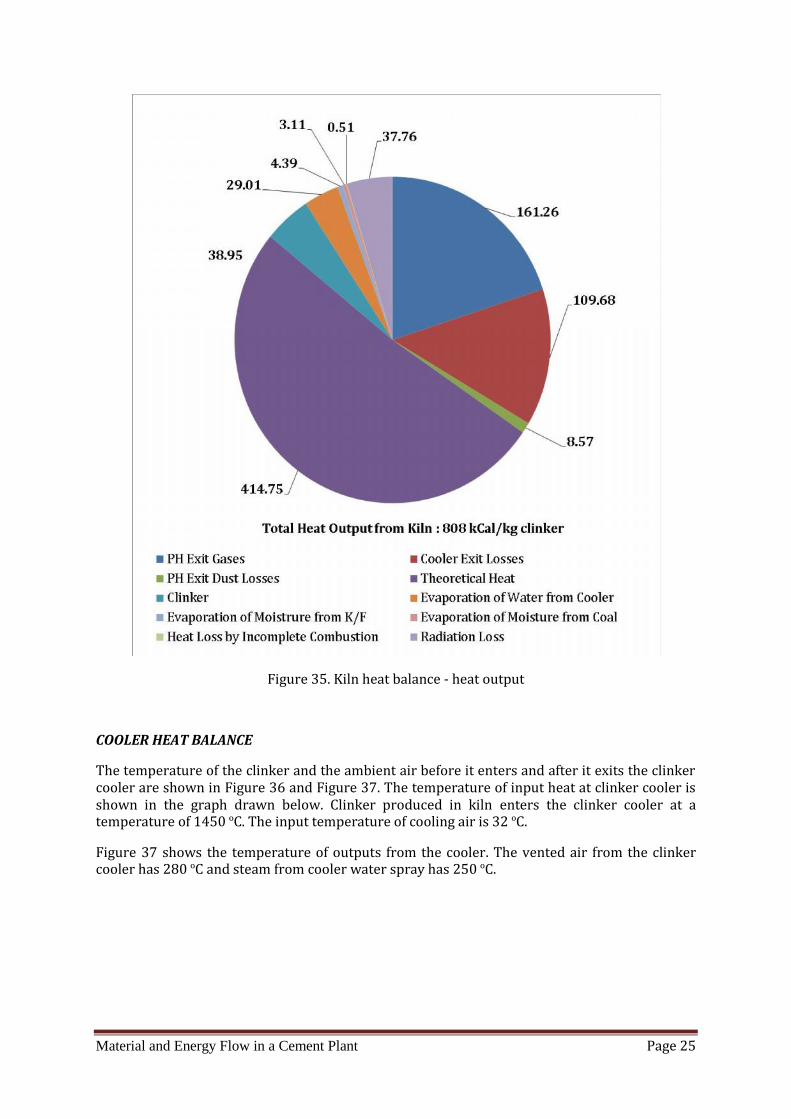
Material and Energy Flow in a Cement Plant Page 25
Figure 35. Kiln heat balance - heat outputCOOLER HEAT BALANCEThe temperature of the clinker and the ambient air before it enters and after it exits the clinkercooler are shown in Figure 36 and Figure 37. The temperature of input heat at clinker cooler isshown in the graph drawn below. Clinker produced in kiln enters the clinker cooler at atemperature of 1450 ºC. The input temperature of cooling air is 32 ºC.Figure 37 shows the temperature of outputs from the cooler. The vented air from the clinkercooler has 280 ºC and steam from cooler water spray has 250 ºC.

Material and Energy Flow in a Cement Plant Page 26
Figure 36. Temperature of inputs to the clinker cooler
Figure 37. Temperature of outputs from the clinker coolerThe clinker cooler heat balance is shown in Figure 38 and Figure 39. The total heat input to thecooler is 401.3 kCal/kg clinker where 383.24 kCal/kg clinker is the heat content of the clinkerand 18.06 kCal/kg clinker is the heat content of the cooling air.The total heat output of the clinker cooler is 401.30 kCal/kg clinker. The vented air from thecooler contains 109.92 kCal/kg clinker while the steam from cooler water spray contains 32.07kCal/kg clinker. The clinker that is cooled contains 38.95 kCal/kg clinker and the radiation lossis 0.56 kCal/kg clinker. The difference between the total heat content and the heat utilized in thesystem is 181 kCal/kg clinker, and this is the total heat loss.
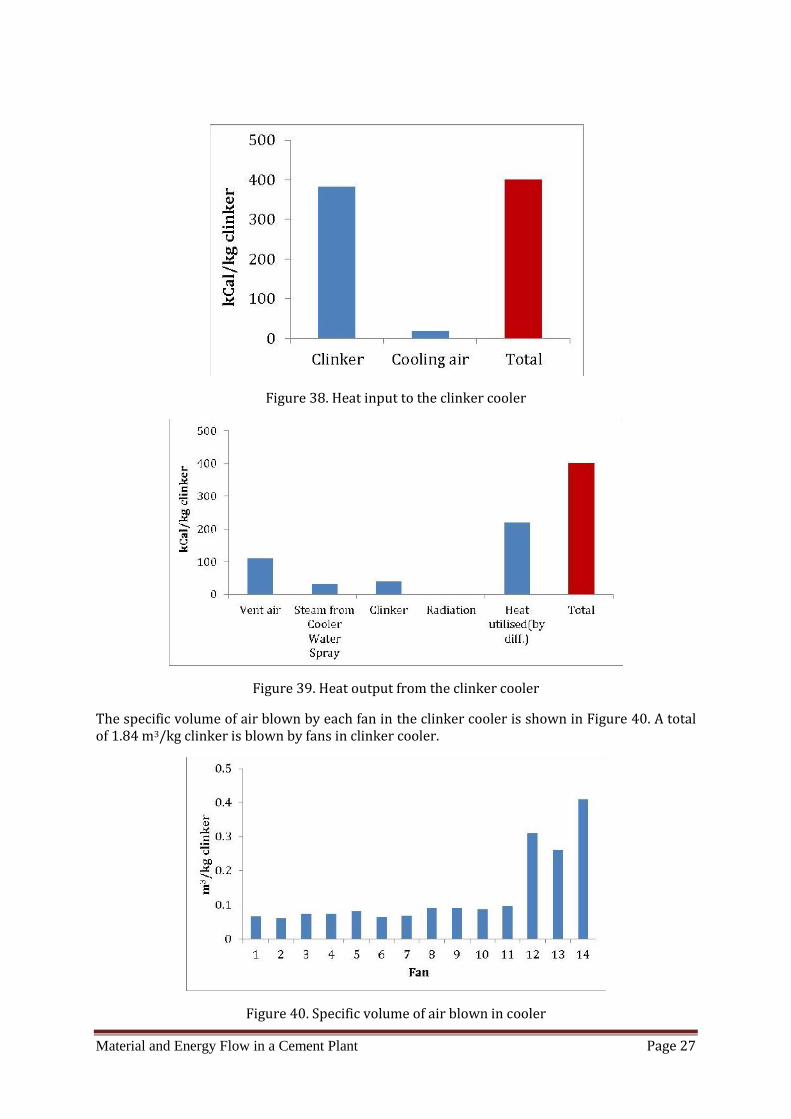
Material and Energy Flow in a Cement Plant Page 27
Figure 38. Heat input to the clinker cooler
Figure 39. Heat output from the clinker coolerThe specific volume of air blown by each fan in the clinker cooler is shown in Figure 40. A totalof 1.84 m3/kg clinker is blown by fans in clinker cooler.
Figure 40. Specific volume of air blown in cooler

Material and Energy Flow in a Cement Plant Page 28
SummaryTable 3 summarizes the energy flow and heat flow for various subprocesses. The cement millhas the highest electrical SEC (46%) followed by kiln (28%) and raw mill (19%).Table 3: Summary of Energy ConsumptionSubprocess Electrical Energy Consumption
(kWh/t cement)Thermal Energy Consumption
(kCal/kg clinker)Crusher 0.93Raw Mill 15.91Kiln & Cooler 20.12 808Coal Mill 3.41Cement Mill 38.74Packaging Plant 1.59Lighting & Misc. load 3.00Total 83.71 808
3.5 Equipment Level Performance AnalysisThis section demonstrates the sub-processes behavior over a period of 21 days of operation.These analyses show how critical parameters vary or are controlled in day to day operations.Raw MillThe damper position at mill fan, glass bag house fan etc. is shown in Figure 41. The y axisdenotes the % opening of damper at various stages of the mill.
Figure 41. Damper position in raw millThe motor load (kW) is shown in Figure 42. The kW drawn at various equipment of a raw mill isplotted in this graph. The raw mill fan draws more power than other components such asclassifier, bag house fan, bucket elevators connected to silo. It is observed that the power drawnby raw mill fan is varying over the time period of 21 days.
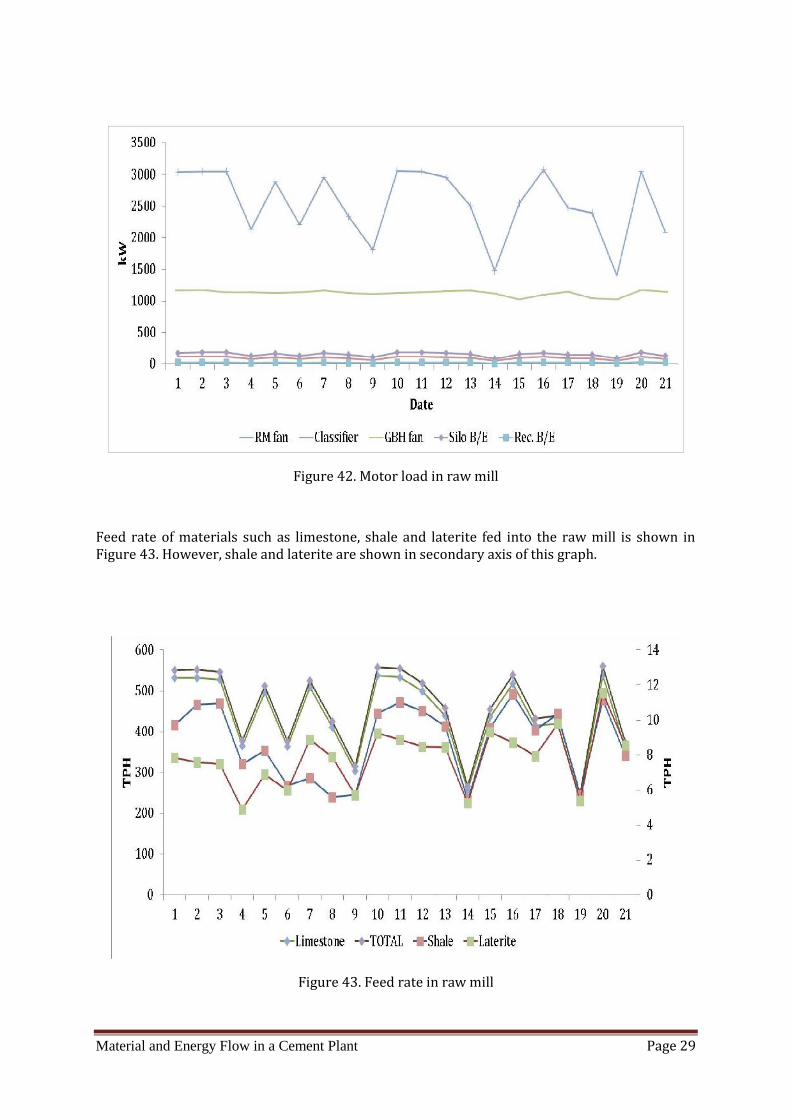
Material and Energy Flow in a Cement Plant Page 29
Figure 42. Motor load in raw millFeed rate of materials such as limestone, shale and laterite fed into the raw mill is shown inFigure 43. However, shale and laterite are shown in secondary axis of this graph.
Figure 43. Feed rate in raw mill

Material and Energy Flow in a Cement Plant Page 30
The draught pressures after preheater fan, mill inlet and bag house inlet are shown in Figure 44
Figure 44. Draught in raw millThe temperatures at raw mill are shown in Figure 45. Temperature at mill inlet, mill outlet andglass bag house inlet are plotted.
Figure 45. Temperature in raw mill

Material and Energy Flow in a Cement Plant Page 31
The draft pressure at auxiliary mill and glass bag house is plotted in Figure 46.
Figure 46. Draft pressure in raw millCoal MillFigure 47 shows the throughput across components of a coal mill. Throughput at mill inlet, milloutlet and PC silo are shown in the primary axis of the graph. The input and output of bag filterare plotted in the secondary axis.The residue percentage of coal mill is shown in Figure 48. The coal ash level is the highest of allthe residues, while the residue +212 (mesh size) is the least, less than 5%, throughout themonth. Motor load (kW) at coal mill is shown in Figure 49. The load of mill, fan and separatorare plotted.Draught pressure at mill inlet, outlet, bag filter and mill is shown in Figure 50.
Figure 47. Throughput at coal mill

Material and Energy Flow in a Cement Plant Page 32
Figure 48. Residue (%) in a coal mill
Figure 49. Motor load at coal mill
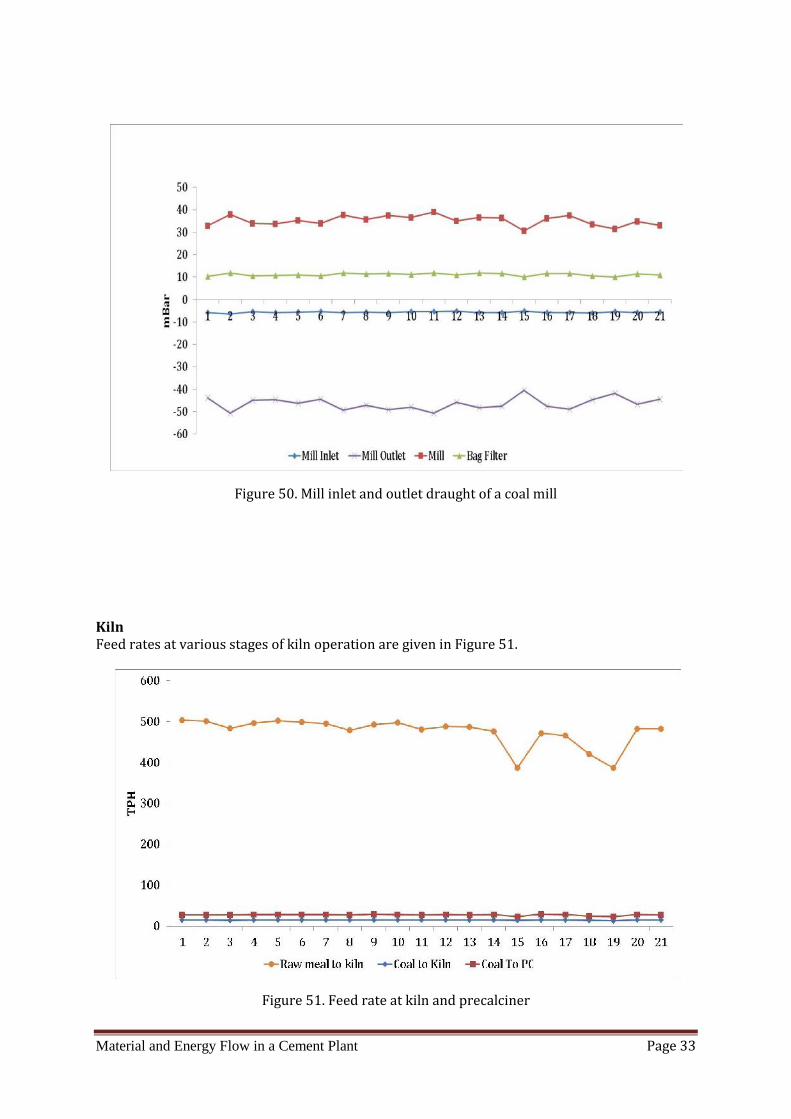
Material and Energy Flow in a Cement Plant Page 33
Figure 50. Mill inlet and outlet draught of a coal mill
KilnFeed rates at various stages of kiln operation are given in Figure 51.
Figure 51. Feed rate at kiln and precalciner
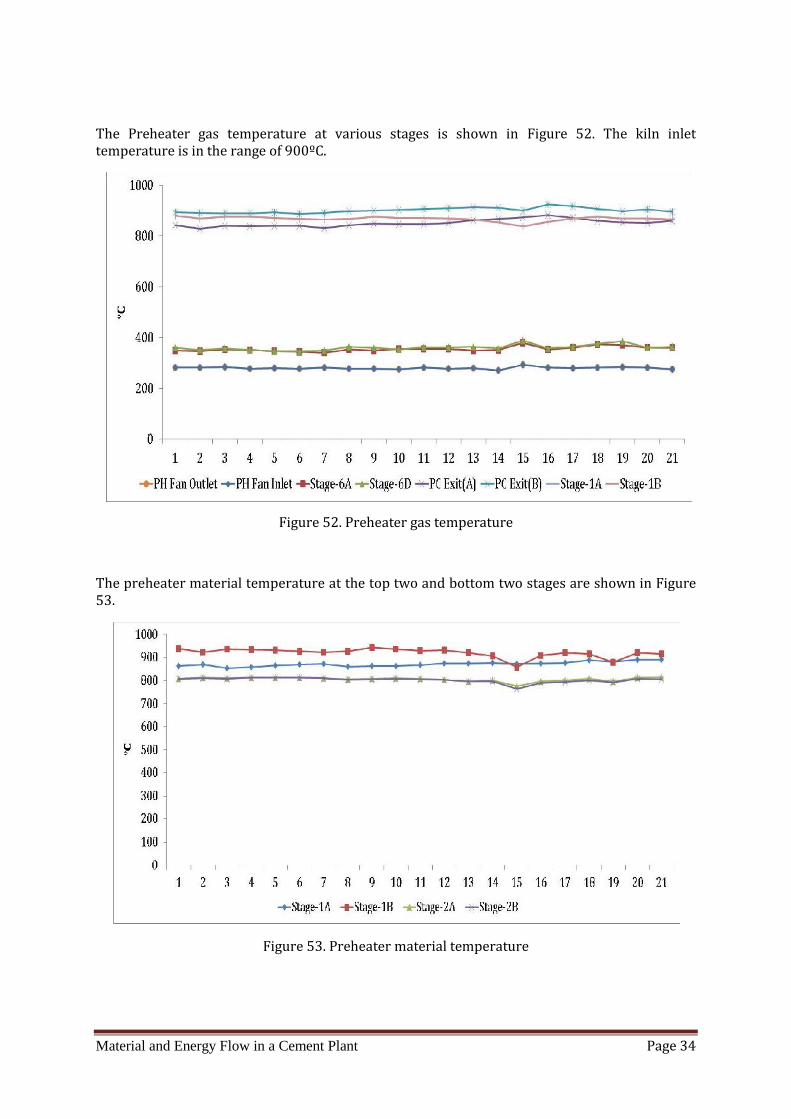
Material and Energy Flow in a Cement Plant Page 34
The Preheater gas temperature at various stages is shown in Figure 52. The kiln inlettemperature is in the range of 900ºC.
Figure 52. Preheater gas temperatureThe preheater material temperature at the top two and bottom two stages are shown in Figure53.
Figure 53. Preheater material temperature

Material and Energy Flow in a Cement Plant Page 35
The total air flow at grate 1 and grate 2 of the cooler is plotted in Figure 54 given below.
Figure 54. Airflow rate at coolerThe temperature of kiln at various stages is shown in Figure 55 .
Figure 55. Kiln temperature

Material and Energy Flow in a Cement Plant Page 36
Radiation LossesRadiation losses at various stages of the preheater cyclone 1A are shown in Figure 56. The lineplot indicates the surface area (m2).The radiation loss; convection loss and the sum of the twolosses (kCal/kg clinker) are also shown here.
Figure 56. Radiation losses in cyclone 1ACement MillThe DC Drive RPM (%) is shown in Figure 57 for both the cement mills. It can be inferred fromthe graph that RPM varied from 27% to 77% in cement mill 1 and 33% to 77% in cement mill 2.
Figure 57. RPM (%) of DC drive in cement mills
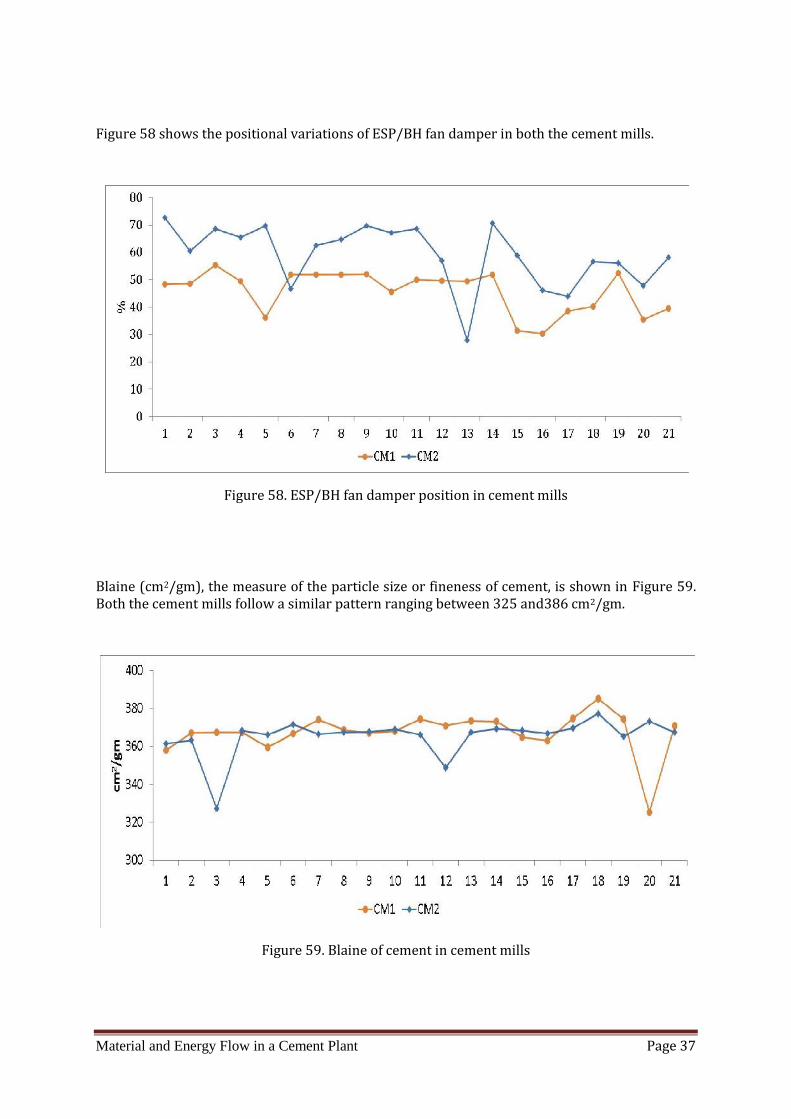
Material and Energy Flow in a Cement Plant Page 37
Figure 58 shows the positional variations of ESP/BH fan damper in both the cement mills.
Figure 58. ESP/BH fan damper position in cement millsBlaine (cm2/gm), the measure of the particle size or fineness of cement, is shown in Figure 59.Both the cement mills follow a similar pattern ranging between 325 and386 cm2/gm.
Figure 59. Blaine of cement in cement mills

Material and Energy Flow in a Cement Plant Page 38
Figure 60 shows the mill filling (%) for the cement mill 1 and 2.
Figure 60. Mill filling (%) in cement millsThe motor load (kW) of both the cement mills is shown in Figure 61. The load of separator fanand separator DC Drive is plotted for 21 days.
Figure 61. Motor load of cement mill CM1 and CM2

Material and Energy Flow in a Cement Plant Page 39
The draught pressure at mill inlet and outlet of cement mills are shown in Figure 62. Thedraught pressure is indicated in mBar.
Figure 62. Mill inlet and out draught for CM1 and CM2The temperature of material at different places of both the cement mills is shown in Figure 63.The material at cement mill 2 has the highest temperature of 120ºC.
Figure 63. Temperature of materials in CM1 and CM2
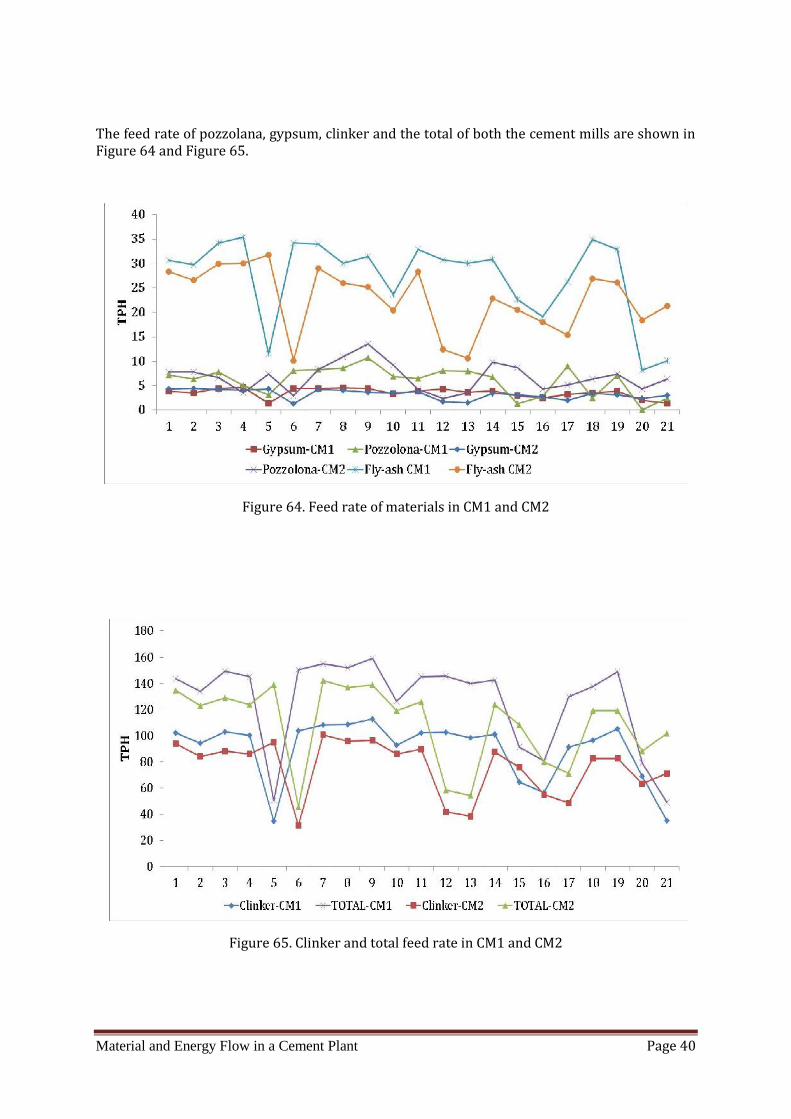
Material and Energy Flow in a Cement Plant Page 40
The feed rate of pozzolana, gypsum, clinker and the total of both the cement mills are shown inFigure 64 and Figure 65.
Figure 64. Feed rate of materials in CM1 and CM2
Figure 65. Clinker and total feed rate in CM1 and CM2
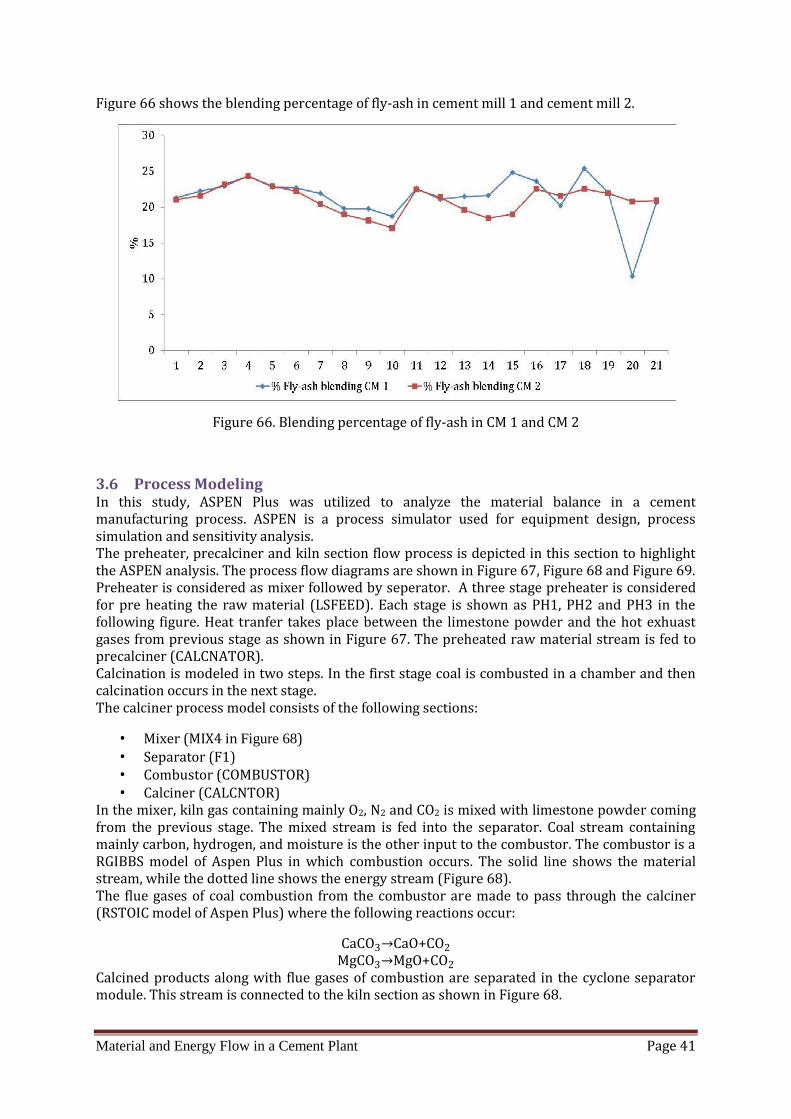
Material and Energy Flow in a Cement Plant Page 41
Figure 66 shows the blending percentage of fly-ash in cement mill 1 and cement mill 2.
Figure 66. Blending percentage of fly-ash in CM 1 and CM 23.6 Process ModelingIn this study, ASPEN Plus was utilized to analyze the material balance in a cementmanufacturing process. ASPEN is a process simulator used for equipment design, processsimulation and sensitivity analysis.The preheater, precalciner and kiln section flow process is depicted in this section to highlightthe ASPEN analysis. The process flow diagrams are shown in Figure 67, Figure 68 and Figure 69.Preheater is considered as mixer followed by seperator. A three stage preheater is consideredfor pre heating the raw material (LSFEED). Each stage is shown as PH1, PH2 and PH3 in thefollowing figure. Heat tranfer takes place between the limestone powder and the hot exhuastgases from previous stage as shown in Figure 67. The preheated raw material stream is fed toprecalciner (CALCNATOR).Calcination is modeled in two steps. In the first stage coal is combusted in a chamber and thencalcination occurs in the next stage.The calciner process model consists of the following sections:
Mixer (MIX4 in Figure 68) Separator (F1) Combustor (COMBUSTOR) Calciner (CALCNTOR)In the mixer, kiln gas containing mainly O2, N2 and CO2 is mixed with limestone powder comingfrom the previous stage. The mixed stream is fed into the separator. Coal stream containingmainly carbon, hydrogen, and moisture is the other input to the combustor. The combustor is aRGIBBS model of Aspen Plus in which combustion occurs. The solid line shows the materialstream, while the dotted line shows the energy stream (Figure 68).The flue gases of coal combustion from the combustor are made to pass through the calciner(RSTOIC model of Aspen Plus) where the following reactions occur:CaCO3→CaO+CO2MgCO3→MgO+CO2Calcined products along with flue gases of combustion are separated in the cyclone separatormodule. This stream is connected to the kiln section as shown in Figure 68.

Material and Energy Flow in a Cement Plant Page 42
The kiln section is considered in 3 stage operation, i.e., Kiln3, Kiln5 and Kiln7 as shown in Figure 69. Each stage in the kiln comprises of Mixer(K3IN), Reaction chamber (KILN3) and followed by separator (F3OUT).
Figure 67. Preheater model

Material and Energy Flow in a Cement Plant Page 43Figure 68. Calciner process model

Material and Energy Flow in a Cement Plant Page 44Figure 69. Kiln model
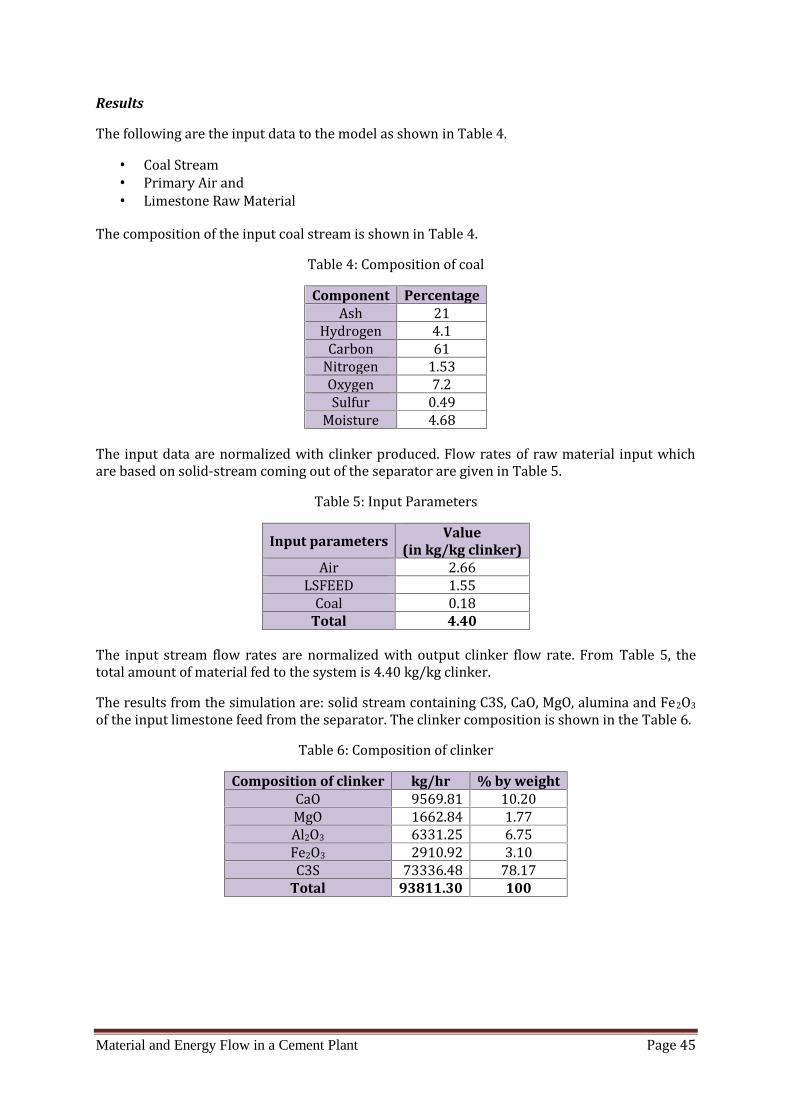
Material and Energy Flow in a Cement Plant Page 45
ResultsThe following are the input data to the model as shown in Table 4. Coal Stream Primary Air and Limestone Raw MaterialThe composition of the input coal stream is shown in Table 4.Table 4: Composition of coal
Component PercentageAsh 21Hydrogen 4.1Carbon 61Nitrogen 1.53Oxygen 7.2Sulfur 0.49Moisture 4.68The input data are normalized with clinker produced. Flow rates of raw material input whichare based on solid-stream coming out of the separator are given in Table 5.Table 5: Input ParametersInput parameters Value
(in kg/kg clinker)Air 2.66LSFEED 1.55Coal 0.18Total 4.40The input stream flow rates are normalized with output clinker flow rate. From Table 5, thetotal amount of material fed to the system is 4.40 kg/kg clinker.The results from the simulation are: solid stream containing C3S, CaO, MgO, alumina and Fe2O3of the input limestone feed from the separator. The clinker composition is shown in the Table 6.Table 6: Composition of clinker
Composition of clinker kg/hr % by weightCaO 9569.81 10.20MgO 1662.84 1.77Al2O3 6331.25 6.75Fe2O3 2910.92 3.10C3S 73336.48 78.17Total 93811.30 100

Material and Energy Flow in a Cement Plant Page 46
Table 7: Output Parameters Computed by Aspen ModelOutput parameters Value
(kg/kg clinker)Kiln exhaust gas 2.82Cooler exhaust gas 0.58Clinker 1.00Total 4.40
From the above Table 7, it is observed that the total amount of material coming out is 4.40kg/kg clinker which is equal to the total input material.Exhaust gas stream from the separator contains CO2, N2 and excess O2 which are shown in Table8. The percentages of N2 and CO2 are 57.1% and 37.9% respectively. The flue gases from cementplant have to follow pollution control board norms. This analysis could be helpful for followingthese norms. Table 8: Preheater exhaust gas compositionComposition of exhaust gas Flow rate, kg/hr % by weightN2 151,196 57.1CO2 100,319 37.9O2 10,092 3.8H2O 2,367 0.89H2 740 0.28SO2 25 0.01
A sensitivity analysis can be performed with the model by varying the amount of coal,composition of the exhaust gas, pre heater gas temperature etc.The model can be operated with different types of coal/fuel. Although the energy consumptionof a plant is independent of the type of coal, the amount of coal varies based on its calorific value- more the calorific value of the fuel, lesser the amount of coal required for the manufacturingprocess. Also, the composition of exhaust gas depends on the type of coal used in the cementmanufacturing process. Similarly, the pre heater exhaust gas temperature varies depending onthe number of stages. Hence waste heat recovery feasibility can be performed based on theexhaust gas conditions.
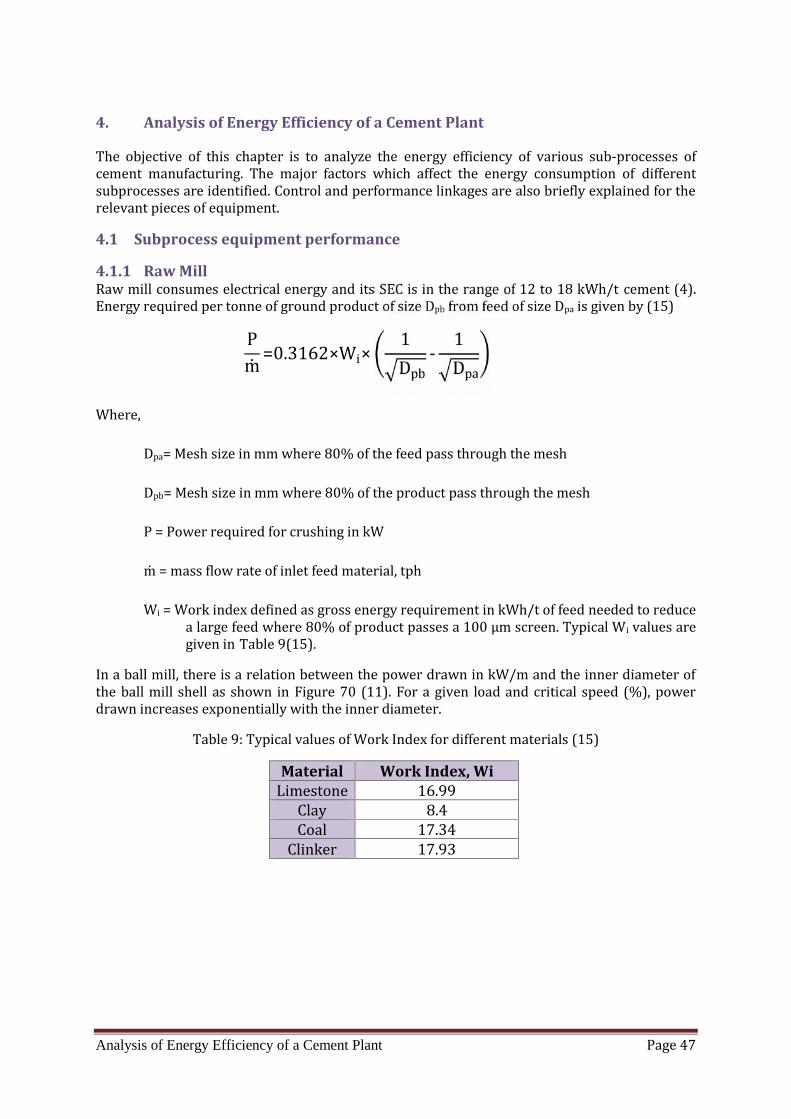
Analysis of Energy Efficiency of a Cement Plant Page 47
4. Analysis of Energy Efficiency of a Cement PlantThe objective of this chapter is to analyze the energy efficiency of various sub-processes ofcement manufacturing. The major factors which affect the energy consumption of differentsubprocesses are identified. Control and performance linkages are also briefly explained for therelevant pieces of equipment.4.1 Subprocess equipment performance
4.1.1 Raw MillRaw mill consumes electrical energy and its SEC is in the range of 12 to 18 kWh/t cement (4).Energy required per tonne of ground product of size Dpb from feed of size Dpa is given by (15)Pm =0.3162×Wi× 1Dpb - 1DpaWhere, Dpa= Mesh size in mm where 80% of the feed pass through the meshDpb= Mesh size in mm where 80% of the product pass through the meshP = Power required for crushing in kWm = mass flow rate of inlet feed material, tphWi = Work index defined as gross energy requirement in kWh/t of feed needed to reducea large feed where 80% of product passes a 100 μm screen. Typical Wi values aregiven in Table 9(15).In a ball mill, there is a relation between the power drawn in kW/m and the inner diameter ofthe ball mill shell as shown in Figure 70 (11). For a given load and critical speed (%), powerdrawn increases exponentially with the inner diameter.Table 9: Typical values of Work Index for different materials (15)
Material Work Index, WiLimestone 16.99Clay 8.4Coal 17.34Clinker 17.93
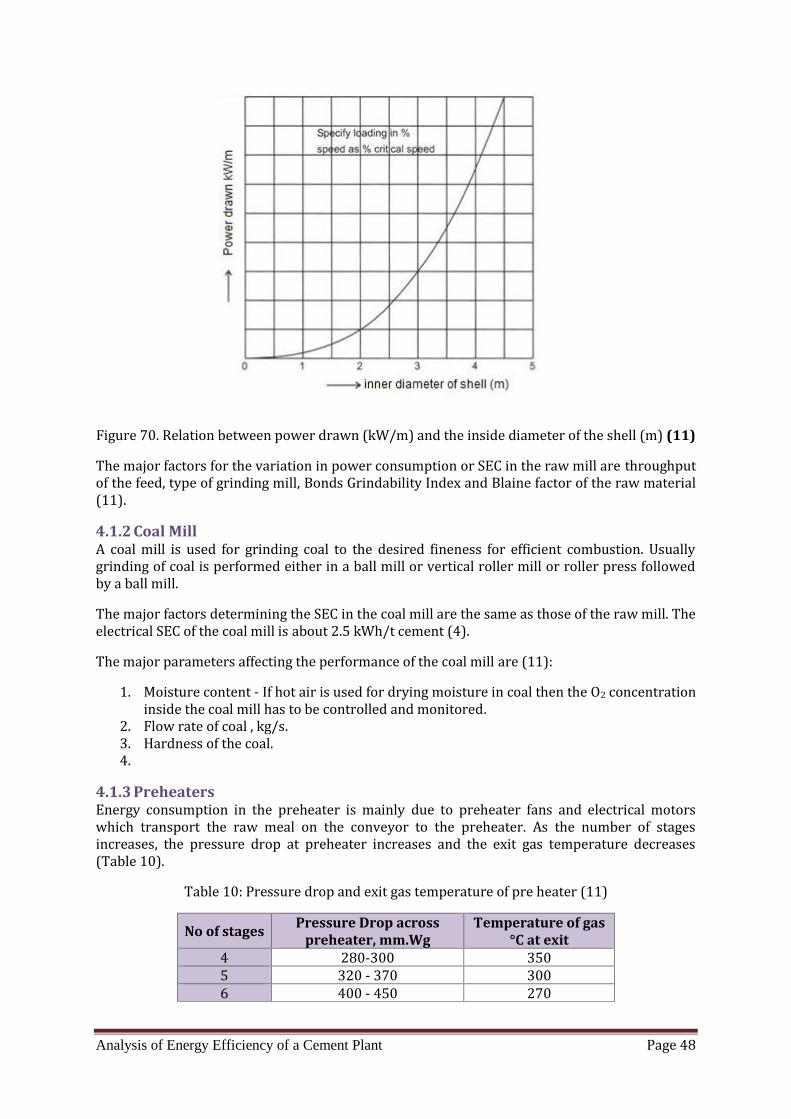
Analysis of Energy Efficiency of a Cement Plant Page 48
Figure 70. Relation between power drawn (kW/m) and the inside diameter of the shell (m) (11)The major factors for the variation in power consumption or SEC in the raw mill are throughputof the feed, type of grinding mill, Bonds Grindability Index and Blaine factor of the raw material(11).4.1.2 Coal MillA coal mill is used for grinding coal to the desired fineness for efficient combustion. Usuallygrinding of coal is performed either in a ball mill or vertical roller mill or roller press followedby a ball mill.The major factors determining the SEC in the coal mill are the same as those of the raw mill. Theelectrical SEC of the coal mill is about 2.5 kWh/t cement (4).The major parameters affecting the performance of the coal mill are (11):1. Moisture content - If hot air is used for drying moisture in coal then the O2 concentrationinside the coal mill has to be controlled and monitored.2. Flow rate of coal , kg/s.3. Hardness of the coal.4.4.1.3 PreheatersEnergy consumption in the preheater is mainly due to preheater fans and electrical motorswhich transport the raw meal on the conveyor to the preheater. As the number of stagesincreases, the pressure drop at preheater increases and the exit gas temperature decreases(Table 10). Table 10: Pressure drop and exit gas temperature of pre heater (11)
No of stages Pressure Drop acrosspreheater, mm.Wg
Temperature of gas°C at exit4 280-300 3505 320 - 370 3006 400 - 450 270
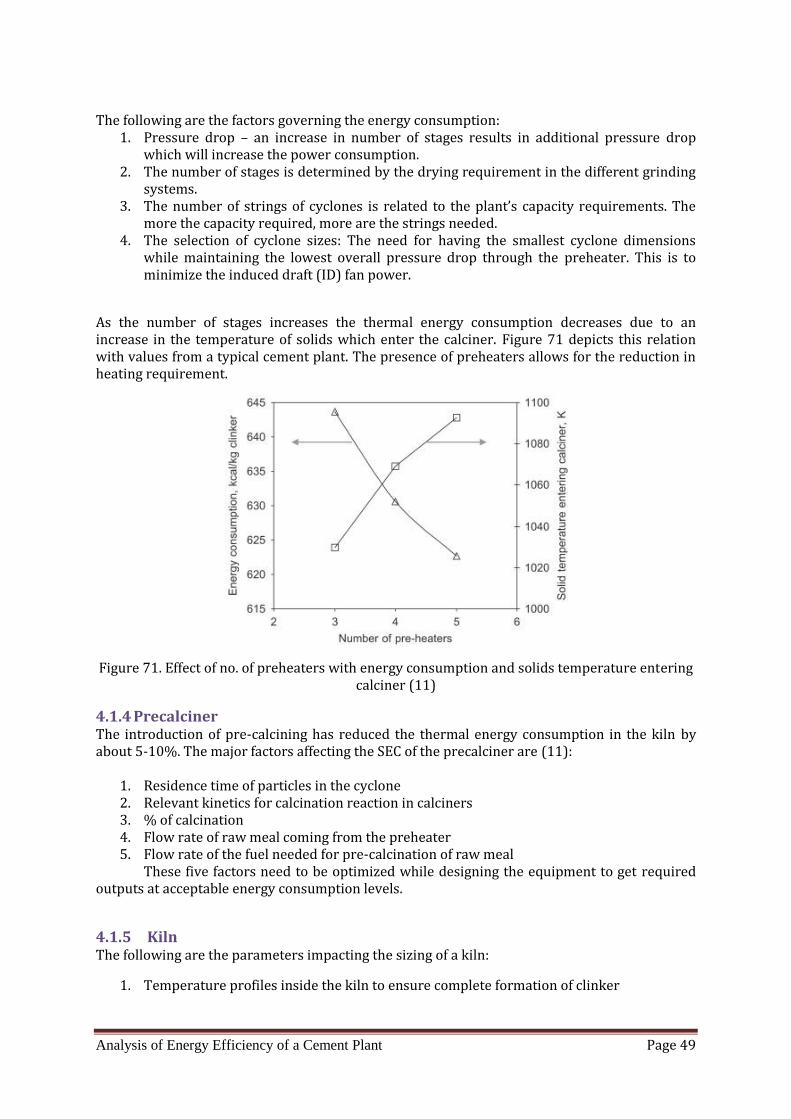
Analysis of Energy Efficiency of a Cement Plant Page 49
The following are the factors governing the energy consumption:1. Pressure drop – an increase in number of stages results in additional pressure dropwhich will increase the power consumption.2. The number of stages is determined by the drying requirement in the different grindingsystems.3. The number of strings of cyclones is related to the plant’s capacity requirements. Themore the capacity required, more are the strings needed.4. The selection of cyclone sizes: The need for having the smallest cyclone dimensionswhile maintaining the lowest overall pressure drop through the preheater. This is tominimize the induced draft (ID) fan power.As the number of stages increases the thermal energy consumption decreases due to anincrease in the temperature of solids which enter the calciner. Figure 71 depicts this relationwith values from a typical cement plant. The presence of preheaters allows for the reduction inheating requirement.
Figure 71. Effect of no. of preheaters with energy consumption and solids temperature enteringcalciner (11)4.1.4 PrecalcinerThe introduction of pre-calcining has reduced the thermal energy consumption in the kiln byabout 5-10%. The major factors affecting the SEC of the precalciner are (11):1. Residence time of particles in the cyclone2. Relevant kinetics for calcination reaction in calciners3. % of calcination4. Flow rate of raw meal coming from the preheater5. Flow rate of the fuel needed for pre-calcination of raw mealThese five factors need to be optimized while designing the equipment to get requiredoutputs at acceptable energy consumption levels.4.1.5 KilnThe following are the parameters impacting the sizing of a kiln:1. Temperature profiles inside the kiln to ensure complete formation of clinker

Analysis of Energy Efficiency of a Cement Plant Page 50
2. Retention time: It is a function of various operations that take place inside the kiln. It isthe shortest for the preheater and precalciner kilns.3. Degree of filling: Degree of filling of the charge inside the kiln is important from theconcept of proper heat transfer to the material4. Thermal loading in the burning zone: heat released per hour per clear cross- sectionalarea of the kiln (kCal/h/m2).Thermal SEC of a cement kiln is given in Table 11. It is observed that only 66% of the totalthermal energy is utilized in clinker formation; rest 34% is observed to be losses due toradiation, cooler losses, and losses in the preheater section.Table 11: Thermal energy consumption in kiln and cooler system (4)Parameter SEC
(kCal/kg clinker)Theoretical heat consumption 410Preheater loss 105Cooler loss (Clinker & Cooler vent) gases) 90Radiation loss 75Heat Input -30Total 650
Table 12 shows the heat balance in different zones of a kiln. It can be seen that in a 6 stagesection with a minimal increase in electrical energy consumption as compared to a 5 stagesection, the thermal energy consumption decreases by a considerable extent (0.3 kWh/t cementincrease in electrical SEC decreases the thermal SEC by around 13 kCal/kg clinker).Table 12: Typical performance data on dry process kilns with preheaters, calciners, grate andplanetary coolers (11)S. No. Item Preheater zone Calciner zone
Planetary cooler Grate coolerPreheater 5 stage 6 stage 5 stage 6 stage1 Heat balance. kCal/kg clinkerHeat in exhaust gas 157 144 160 145Radiation loss from kiln and preheater 65 67 54 56Heat of reaction 385 385 385 385Cooler loss 141 143 116 116Heat in clinker at ambient temperature 3 3 3 3Heat in raw meal, fuel, air 34 34 33 33Net specific heat consumption 717 708 685 6722 Exhaust gas temperature °C 295 272 311 2833 Pressure loss in preheater mm.Wg 280 328 279 325Pressure loss in rest of system mm.Wg 71 71 140 140Total pressure loss 351 399 419 4654 Power consumption kWh/t clinkerPreheater fan 4.6 4.9 5.6 5.9Cooler drive and fans - - 5.1 5.1Kiln 3.1 3.1 1.7 1.7Primary air fan 1.5 1.5 1 1Dust transport 1 1 1 1Total specific power consumption 10.2 10.5 14.4 14.7
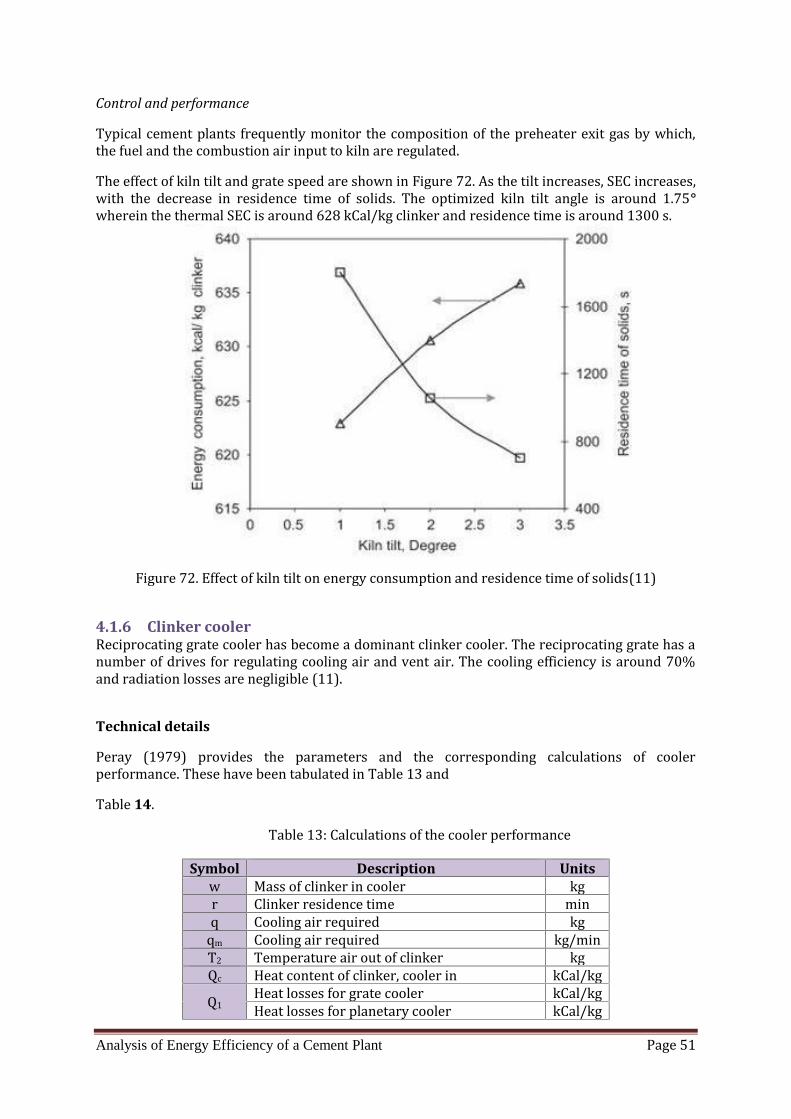
Analysis of Energy Efficiency of a Cement Plant Page 51
Control and performanceTypical cement plants frequently monitor the composition of the preheater exit gas by which,the fuel and the combustion air input to kiln are regulated.The effect of kiln tilt and grate speed are shown in Figure 72. As the tilt increases, SEC increases,with the decrease in residence time of solids. The optimized kiln tilt angle is around 1.75°wherein the thermal SEC is around 628 kCal/kg clinker and residence time is around 1300 s.
Figure 72. Effect of kiln tilt on energy consumption and residence time of solids(11)4.1.6 Clinker coolerReciprocating grate cooler has become a dominant clinker cooler. The reciprocating grate has anumber of drives for regulating cooling air and vent air. The cooling efficiency is around 70%and radiation losses are negligible (11).Technical detailsPeray (1979) provides the parameters and the corresponding calculations of coolerperformance. These have been tabulated in Table 13 andTable 14. Table 13: Calculations of the cooler performance
Symbol Description Unitsw Mass of clinker in cooler kgr Clinker residence time minq Cooling air required kgqm Cooling air required kg/minT2 Temperature air out of clinker kgQc Heat content of clinker, cooler in kCal/kgQ1 Heat losses for grate cooler kCal/kgHeat losses for planetary cooler kCal/kg
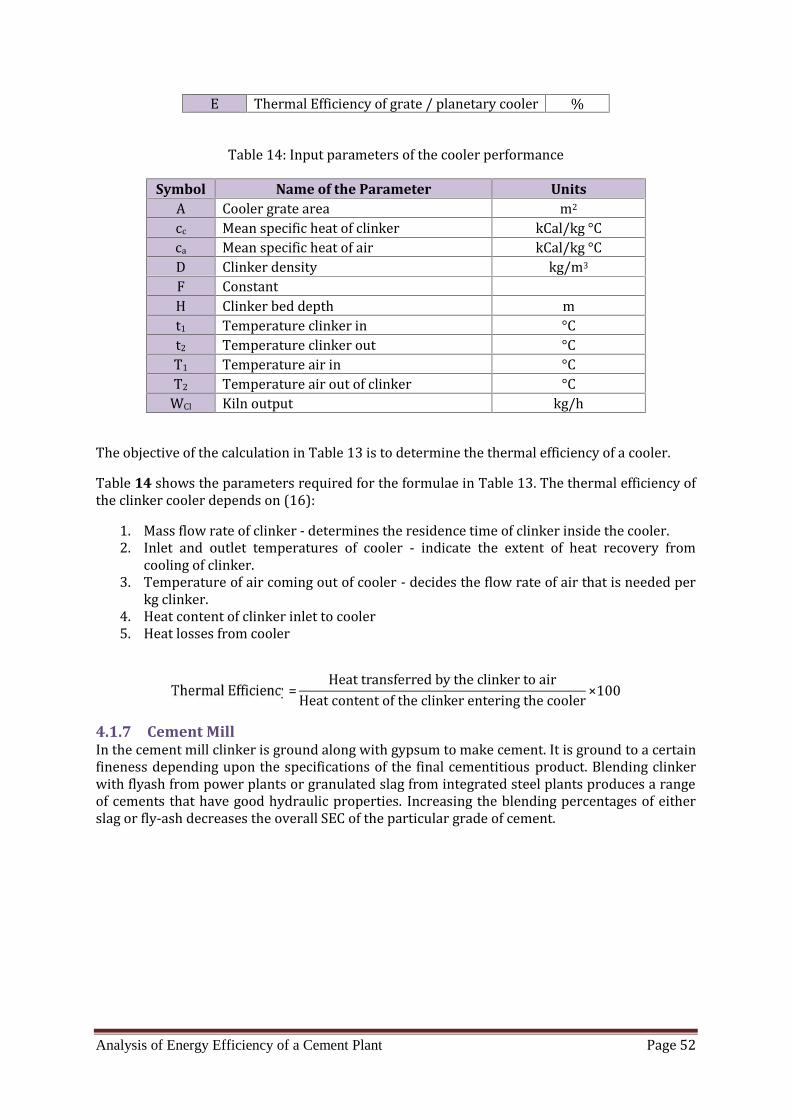
Analysis of Energy Efficiency of a Cement Plant Page 52
E Thermal Efficiency of grate / planetary cooler %Table 14: Input parameters of the cooler performance
Symbol Name of the Parameter UnitsA Cooler grate area m2cc Mean specific heat of clinker kCal/kg °Cca Mean specific heat of air kCal/kg °CD Clinker density kg/m3F ConstantH Clinker bed depth mt1 Temperature clinker in °Ct2 Temperature clinker out °CT1 Temperature air in °CT2 Temperature air out of clinker °CWCl Kiln output kg/hThe objective of the calculation in Table 13 is to determine the thermal efficiency of a cooler.Table 14 shows the parameters required for the formulae in Table 13. The thermal efficiency ofthe clinker cooler depends on (16):1. Mass flow rate of clinker - determines the residence time of clinker inside the cooler.2. Inlet and outlet temperatures of cooler - indicate the extent of heat recovery fromcooling of clinker.3. Temperature of air coming out of cooler - decides the flow rate of air that is needed perkg clinker.4. Heat content of clinker inlet to cooler5. Heat losses from cooler
= HeattransferredbytheclinkertoairHeatcontentoftheclinkerenteringthecooler ×1004.1.7 Cement MillIn the cement mill clinker is ground along with gypsum to make cement. It is ground to a certainfineness depending upon the specifications of the final cementitious product. Blending clinkerwith flyash from power plants or granulated slag from integrated steel plants produces a rangeof cements that have good hydraulic properties. Increasing the blending percentages of eitherslag or fly-ash decreases the overall SEC of the particular grade of cement.
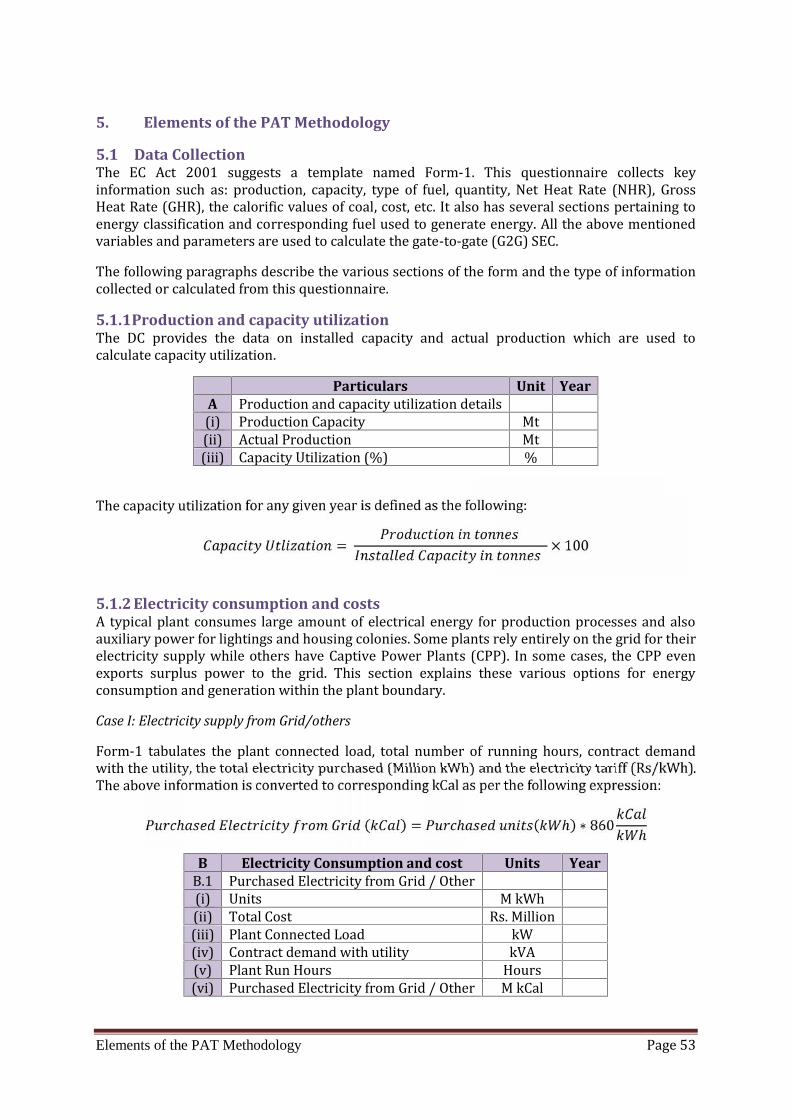
Elements of the PAT Methodology Page 53
5. Elements of the PAT Methodology
5.1 Data CollectionThe EC Act 2001 suggests a template named Form-1. This questionnaire collects keyinformation such as: production, capacity, type of fuel, quantity, Net Heat Rate (NHR), GrossHeat Rate (GHR), the calorific values of coal, cost, etc. It also has several sections pertaining toenergy classification and corresponding fuel used to generate energy. All the above mentionedvariables and parameters are used to calculate the gate-to-gate (G2G) SEC.The following paragraphs describe the various sections of the form and the type of informationcollected or calculated from this questionnaire.5.1.1Production and capacity utilizationThe DC provides the data on installed capacity and actual production which are used tocalculate capacity utilization.
Particulars Unit YearA Production and capacity utilization details(i) Production Capacity Mt(ii) Actual Production Mt(iii) Capacity Utilization (%) %
The capacity utilization for any given year is defined as the following:= × 1005.1.2 Electricity consumption and costsA typical plant consumes large amount of electrical energy for production processes and alsoauxiliary power for lightings and housing colonies. Some plants rely entirely on the grid for theirelectricity supply while others have Captive Power Plants (CPP). In some cases, the CPP evenexports surplus power to the grid. This section explains these various options for energyconsumption and generation within the plant boundary.Case I: Electricity supply from Grid/othersForm-1 tabulates the plant connected load, total number of running hours, contract demandwith the utility, the total electricity purchased (Million kWh) and the electricity tariff (Rs/kWh).The above information is converted to corresponding kCal as per the following expression:ℎ ( ) = ℎ ( ℎ) ∗ 860 ℎ
B Electricity Consumption and cost Units YearB.1 Purchased Electricity from Grid / Other(i) Units M kWh(ii) Total Cost Rs. Million(iii) Plant Connected Load kW(iv) Contract demand with utility kVA(v) Plant Run Hours Hours(vi) Purchased Electricity from Grid / Other M kCal
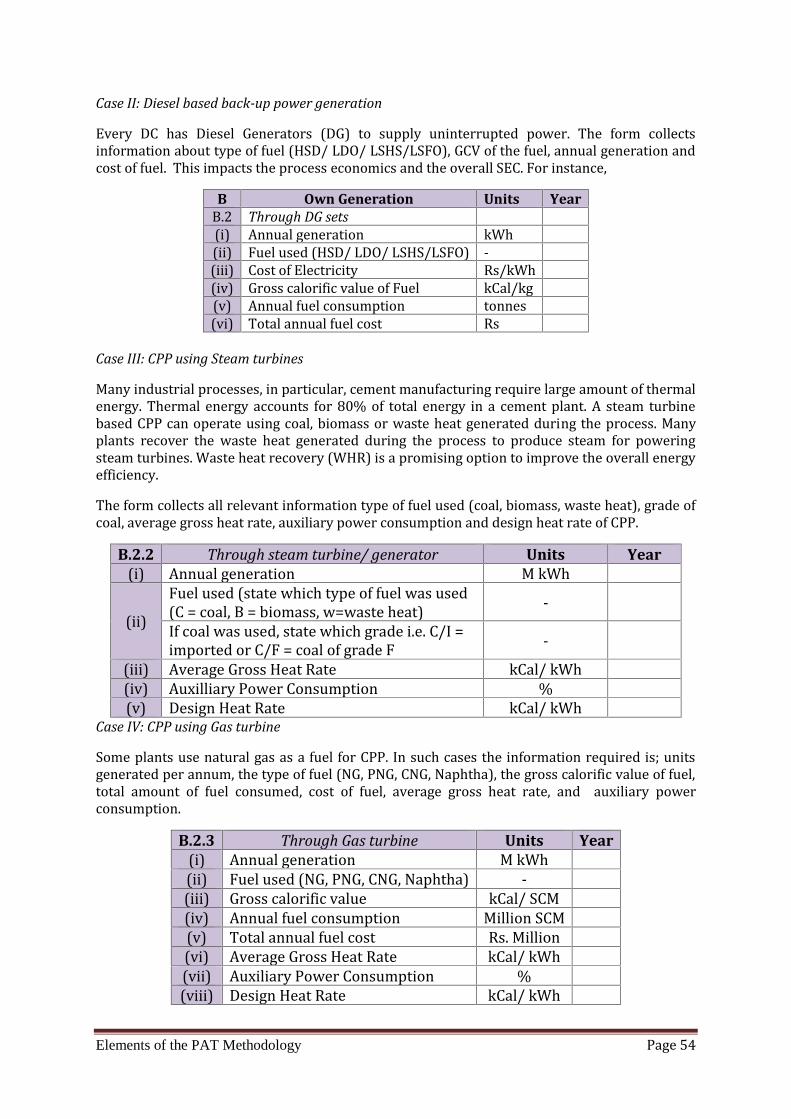
Elements of the PAT Methodology Page 54
Case II: Diesel based back-up power generationEvery DC has Diesel Generators (DG) to supply uninterrupted power. The form collectsinformation about type of fuel (HSD/ LDO/ LSHS/LSFO), GCV of the fuel, annual generation andcost of fuel. This impacts the process economics and the overall SEC. For instance,B Own Generation Units YearB.2 Through DG sets(i) Annual generation kWh(ii) Fuel used (HSD/ LDO/ LSHS/LSFO) -(iii) Cost of Electricity Rs/kWh(iv) Gross calorific value of Fuel kCal/kg(v) Annual fuel consumption tonnes(vi) Total annual fuel cost Rs
Case III: CPP using Steam turbinesMany industrial processes, in particular, cement manufacturing require large amount of thermalenergy. Thermal energy accounts for 80% of total energy in a cement plant. A steam turbinebased CPP can operate using coal, biomass or waste heat generated during the process. Manyplants recover the waste heat generated during the process to produce steam for poweringsteam turbines. Waste heat recovery (WHR) is a promising option to improve the overall energyefficiency.The form collects all relevant information type of fuel used (coal, biomass, waste heat), grade ofcoal, average gross heat rate, auxiliary power consumption and design heat rate of CPP.B.2.2 Through steam turbine/ generator Units Year(i) Annual generation M kWh
(ii) Fuel used (state which type of fuel was used(C = coal, B = biomass, w=waste heat) -If coal was used, state which grade i.e. C/I =imported or C/F = coal of grade F -(iii) Average Gross Heat Rate kCal/ kWh(iv) Auxilliary Power Consumption %(v) Design Heat Rate kCal/ kWhCase IV: CPP using Gas turbineSome plants use natural gas as a fuel for CPP. In such cases the information required is; unitsgenerated per annum, the type of fuel (NG, PNG, CNG, Naphtha), the gross calorific value of fuel,total amount of fuel consumed, cost of fuel, average gross heat rate, and auxiliary powerconsumption.
B.2.3 Through Gas turbine Units Year(i) Annual generation M kWh(ii) Fuel used (NG, PNG, CNG, Naphtha) -(iii) Gross calorific value kCal/ SCM(iv) Annual fuel consumption Million SCM(v) Total annual fuel cost Rs. Million(vi) Average Gross Heat Rate kCal/ kWh(vii) Auxiliary Power Consumption %(viii) Design Heat Rate kCal/ kWh
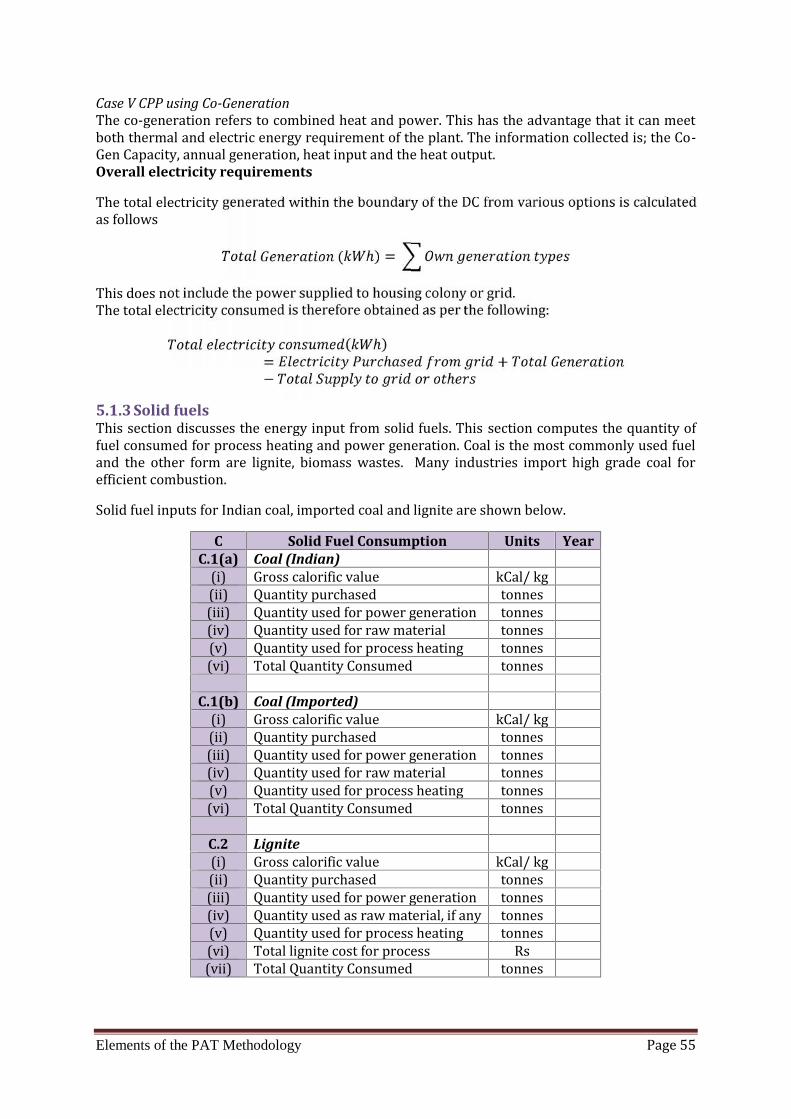
Elements of the PAT Methodology Page 55
Case V CPP using Co-GenerationThe co-generation refers to combined heat and power. This has the advantage that it can meetboth thermal and electric energy requirement of the plant. The information collected is; the Co-Gen Capacity, annual generation, heat input and the heat output.Overall electricity requirementsThe total electricity generated within the boundary of the DC from various options is calculatedas follows ( ℎ) =This does not include the power supplied to housing colony or grid.The total electricity consumed is therefore obtained as per the following:( ℎ)= ℎ +− ℎ5.1.3 Solid fuelsThis section discusses the energy input from solid fuels. This section computes the quantity offuel consumed for process heating and power generation. Coal is the most commonly used fueland the other form are lignite, biomass wastes. Many industries import high grade coal forefficient combustion.Solid fuel inputs for Indian coal, imported coal and lignite are shown below.
C Solid Fuel Consumption Units YearC.1(a) Coal (Indian)(i) Gross calorific value kCal/ kg(ii) Quantity purchased tonnes(iii) Quantity used for power generation tonnes(iv) Quantity used for raw material tonnes(v) Quantity used for process heating tonnes(vi) Total Quantity Consumed tonnesC.1(b) Coal (Imported)(i) Gross calorific value kCal/ kg(ii) Quantity purchased tonnes(iii) Quantity used for power generation tonnes(iv) Quantity used for raw material tonnes(v) Quantity used for process heating tonnes(vi) Total Quantity Consumed tonnes
C.2 Lignite(i) Gross calorific value kCal/ kg(ii) Quantity purchased tonnes(iii) Quantity used for power generation tonnes(iv) Quantity used as raw material, if any tonnes(v) Quantity used for process heating tonnes(vi) Total lignite cost for process Rs(vii) Total Quantity Consumed tonnes

Elements of the PAT Methodology Page 56
Biomass or other purchased solid fuels e.g. baggase, rice husk, etc.Details of biomass and other solid fuel types including factors such as moisture content and GCVare shown below.C.3 Bio mass or Other purchased solid fuels
(pl. specify) baggase, rice husk, etc.Units Year(i) Average moisture content as fired %(ii) Average Gross calorific value as fired kCal/ kg(iii) Quantity purchased tonnes(iv) Quantity used power generation tonnes(v) Quantity used for process heating tonnes(vi) Total biomass cost for process Rs(vii) Total Quantity Consumed tonnes
Section C OutputThe Total energy consumed from all solid fuels is obtained as follows.(′000 ) = ( ( ) × )n = type of fuel, = ℎ ( ⁄ )5.1.4 Liquid fuelsSection D and E estimate the energy consumed from different type of liquid fuels used forprocess heat and electricity generation. The information consists of: GCV, quantity purchasedand quantity used to generate power, used as raw material, used for process heating, and thecosts.Furnace Oil ( ) = ( + ) ×
D Liquid Fuel Consumption Units YearD.1 Furnace Oil(i) Gross calorific value kCal/ kg(ii) Quantity purchased kl(iii) Average Density kg/l(iv) Quantity used for power generation kl(v) Quantity used as raw material, if any kl(vi) Quantity used for process heating kl(vii) Total F. Oil Cost for process heating Rs(viii) Total F. Oil Consumption as fuel tonnes
Low Sulphur Heavy Stock (LSHS) ( ) = ( + )D.2 Low Sulphur Heavy Stock (LSHS) Units Year(i) Gross calorific value kCal/ kg(ii) Quantity purchased tonnes(iii) Quantity used for power generation tonnes(iv) Quantity used as raw material, if any tonnes(v) Quantity used for process heating tonnes(vi) Total LSHS Cost for process heating Rs(vii) Total LSHS Consumption as Fuel tonnes

Elements of the PAT Methodology Page 57
High Sulphur Heavy Stock (HSHS) ( ) = ( + )D.3 High Sulphur Heavy Stock (HSHS) Units Year(i) Gross calorific value kCal/ kg(ii) Quantity purchased tonnes(iii) Quantity used for power generation tonnes(iv) Quantity used as raw material, if any tonnes(v) Quantity used for process heating tonnes(vi) Total HSHS Cost for process heating Rs(vii) Total HSHS Consumption as fuel tonnes
Diesel oilHigh Speed Diesel (HSD) ( ) = ( + ) ×E Diesel oil Units Year
E.1 High Speed Diesel (HSD)(i) Gross calorific value kCal/ kg(ii) Quantity purchased kl(iii) Average Density kg/l(iv) Quantity used for power generation kl(v) Quantity used as raw material, if any kl(vi) Quantity used for process heating kl(vii) Total HSD Cost for process heating Rs(viii) Total HSD Consumption as fuel tonnesLight Diesel Oil (LDO) ( ) = ( + ) ×E.2 Light Diesel Oil (LDO) Units Year(i) Gross calorific value kCal/ kg(ii) Quantity purchased kl(iii) Average Density kg/l(iv) Quantity used for power generation kl(v) Quantity used as raw material, if any kl(vi) Quantity used for process heating kl(vii) Total LDO Cost for process heating Rs(viii) Total LDO Consumption as fuel tonnes
Section D, E OutputTotal energy of Liquid fuels is computed as follows:(′000 ) = ( ) ×

Elements of the PAT Methodology Page 58
5.1.5 Gaseous fuelsThis section evaluates the energy contained in gaseous fuels used in cement manufacturing. Thecommonly used gaseous fuels are Compressed Natural Gas (CNG) and Liquid Petroleum Gas(LPG). The gaseous fuel consumption varies depending on the application – Power generation,process heating or transportation.Compressed Natural Gas (CNG)*SCM – Standard Cubic MetersF Gaseous Fuel Units Year
F.1 Compressed Natural Gas (CNG)(i) Gross calorific value kCal/SCM*(ii) Quantity purchased SCM(iii) Quantity used for power generation SCM(iv) Quantity used as raw material, if any SCM(v) Quantity used for transportation, if any SCM(vi) Quantity used for process heating SCM(vii) Total cost of natural gas for process heating Rs(viii) Total CNG Consumption as fuel SCMLiquefied Petroleum Gas (LPG)
F.2 Liquefied Petroleum Gas (LPG) Units Year(i) Gross calorific value (kCal/SCM) kCal/SCM(ii) Quantity purchased SCM(iii) Quantity used for power generation SCM(iv) Quantity used as raw material, if any SCM(v) Quantity used for process heating SCM(vi) Total cost of LPG for process heating Rs(vii) Total LPG Consumption as fuel SCMSection F OutputTotal energy of Gaseous fuels is computed as following.( ) = ×5.1.6 Wastes recovered and used as fuelsByproducts such as inflammable gases and solid wastes can be utilized in the cement plant as asource of energy.
G Gas generated as by-product in the plant and used as fuel H Solid Waste - Solid waste generated in the plant and used as fuel I Liquid Waste - Liquid effluent or waste generated in the plant and used as fuel J Gaseous Waste - Gas waste generated in the plant and used as fuel

Elements of the PAT Methodology Page 59
G Gas generated as by-product in the plant andused as fuel
Units Year
G.1 Name of the Gas(i) Gross calorific value kCal/SCM(ii) Quantity Generated SCM(iii) Quantity used as fuel SCMH Solid Waste - Solid waste generated in the plant andused as fuel
H.1 Name of Solid Waste(i) Gross calorific value kCal/ kg(ii) Quantity Generated tonnes(iii) Quantity used as fuel tonnesI Liquid Waste - Liquid effluent/ waste generated inthe plant and used as fuelI.1 Name of Liquid Waste(i) Gross calorific value kCal/ kg(ii) Average Density kg/l(iii) Quantity Generated kl(iv) Quantity used as fuel klJ Gaseous Waste - Gas waste generated in the plantand used as fuel
J.1 Name of Gas Waste(i) Gross calorific value kCal/SCM(ii) Quantity Generated SCM(iii) Quantity used as fuel SCMTOTAL ENERGY_WASTE HEAT kCal
Section G, H, I and J outputThe total energy from wastes (Solid, Liquid and Gas) is computed as following:(′000 )= ( × ) + ( × × ) + ( × )= ℎ ⁄= ℎ ( ′000 )= ℎ ( /⁄ )5.1.7 Other Fuel TypesOther fuels not listed above are taken into account as shown below.
K Others Units YearK.1 Name of the Fuel(i) Average gross calorific value kCal/ kg(ii) Quantity Generated tonnes(iii) Quantity used for power generation tonnes(iv) Quantity used for process heat tonnes(v) Quantity used as fuel tonnes
TOTAL ENERGY_OTHER WASTE kCal
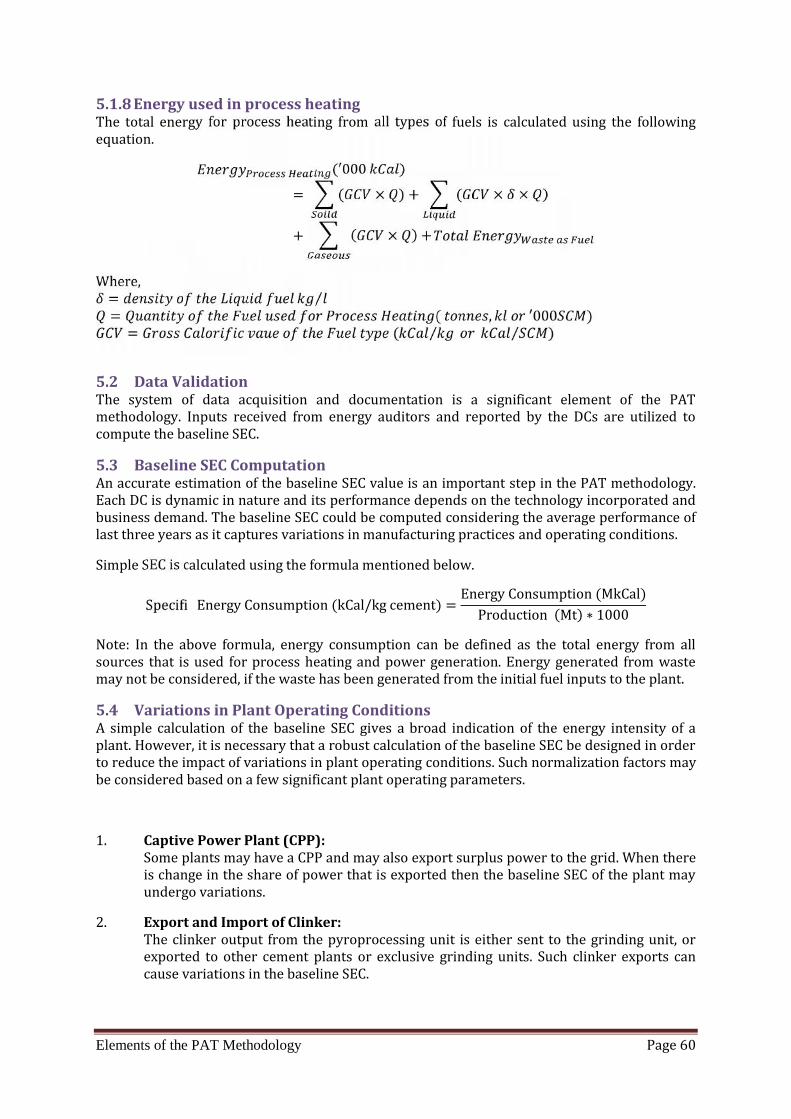
Elements of the PAT Methodology Page 60
5.1.8 Energy used in process heatingThe total energy for process heating from all types of fuels is calculated using the followingequation. (′000 )= ( × ) + ( × × )+ ( × ) +
Where,= ℎ ⁄= ℎ ( , ′000 )= ℎ ( ⁄ ⁄ )5.2 Data ValidationThe system of data acquisition and documentation is a significant element of the PATmethodology. Inputs received from energy auditors and reported by the DCs are utilized tocompute the baseline SEC.5.3 Baseline SEC ComputationAn accurate estimation of the baseline SEC value is an important step in the PAT methodology.Each DC is dynamic in nature and its performance depends on the technology incorporated andbusiness demand. The baseline SEC could be computed considering the average performance oflast three years as it captures variations in manufacturing practices and operating conditions.Simple SEC is calculated using the formula mentioned below.Energy Consumption (kCal/kg cement) = Energy Consumption (MkCal)Production (Mt) ∗ 1000Note: In the above formula, energy consumption can be defined as the total energy from allsources that is used for process heating and power generation. Energy generated from wastemay not be considered, if the waste has been generated from the initial fuel inputs to the plant.5.4 Variations in Plant Operating ConditionsA simple calculation of the baseline SEC gives a broad indication of the energy intensity of aplant. However, it is necessary that a robust calculation of the baseline SEC be designed in orderto reduce the impact of variations in plant operating conditions. Such normalization factors maybe considered based on a few significant plant operating parameters.1. Captive Power Plant (CPP):Some plants may have a CPP and may also export surplus power to the grid. When thereis change in the share of power that is exported then the baseline SEC of the plant mayundergo variations.2. Export and Import of Clinker:The clinker output from the pyroprocessing unit is either sent to the grinding unit, orexported to other cement plants or exclusive grinding units. Such clinker exports cancause variations in the baseline SEC.
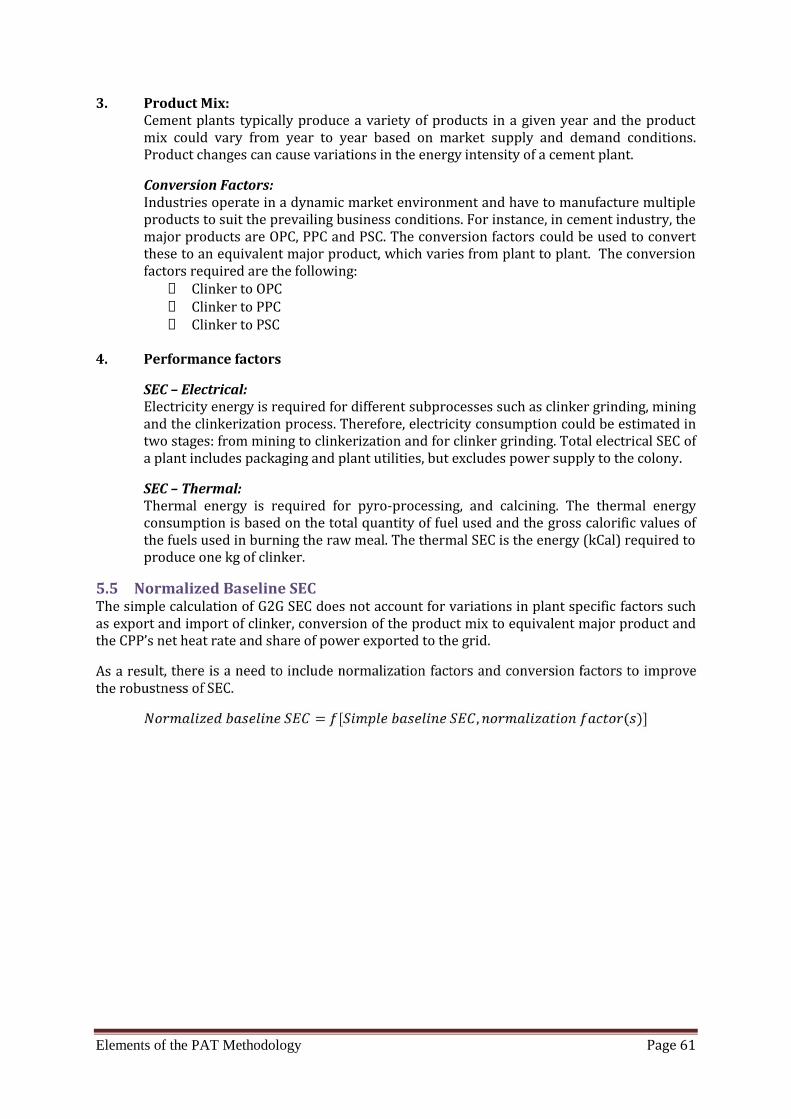
Elements of the PAT Methodology Page 61
3. Product Mix:Cement plants typically produce a variety of products in a given year and the productmix could vary from year to year based on market supply and demand conditions.Product changes can cause variations in the energy intensity of a cement plant.Conversion Factors:Industries operate in a dynamic market environment and have to manufacture multipleproducts to suit the prevailing business conditions. For instance, in cement industry, themajor products are OPC, PPC and PSC. The conversion factors could be used to convertthese to an equivalent major product, which varies from plant to plant. The conversionfactors required are the following:
Clinker to OPC Clinker to PPC Clinker to PSC
4. Performance factors
SEC – Electrical:Electricity energy is required for different subprocesses such as clinker grinding, miningand the clinkerization process. Therefore, electricity consumption could be estimated intwo stages: from mining to clinkerization and for clinker grinding. Total electrical SEC ofa plant includes packaging and plant utilities, but excludes power supply to the colony.SEC – Thermal:Thermal energy is required for pyro-processing, and calcining. The thermal energyconsumption is based on the total quantity of fuel used and the gross calorific values ofthe fuels used in burning the raw meal. The thermal SEC is the energy (kCal) required toproduce one kg of clinker.
5.5 Normalized Baseline SECThe simple calculation of G2G SEC does not account for variations in plant specific factors suchas export and import of clinker, conversion of the product mix to equivalent major product andthe CPP’s net heat rate and share of power exported to the grid.As a result, there is a need to include normalization factors and conversion factors to improvethe robustness of SEC. = [ , ( )]

Page 62

Baseline Methodology – Application in Sample Plants Page 63
6. Baseline Methodology – Application in Sample Plants
In this chapter, the application of the baseline methodology for sample cement plants isillustrated. The results are based on a study of nine sample plants. The study highlights thediversity among the sample plants. The diversity exists in a number of performance factors,operating conditions and parameters such as capacity, product mix, CPP efficiency, conversionfactors, energy input mix and import or export of clinker. The simple baseline SEC and thenormalized baseline SEC for the sample plants are also compared.6.1 Industrial Case StudiesA comparative parametric study of nine sample plants is shown in this section. These plantsdiffer from each other across several parameters. A brief description of the sample plants isprovided below:Plant P1Plant P1 employs a dry process with an annual cement production of 3.383 Mt. The total energyconsumption is 2.479 x 10⁶ MkCal. About 98% of the final product is PPC, while the rest 2%accounts for OPC. It imported 0.15 Mt clinker and also exported 0.0104 Mt clinker in the sameyear.Plant P2About 1.04 Mt of cement is produced in plant P2 by the dry process. The product profileconstitutes 75% PPC, 20% OPC and 5% PSC. The unit also supplies clinker to other cementplants. The total electricity consumed within plant is estimated to be 80.13 Million kWh, whilethe total energy, electrical and thermal together, is calculated to be 992.44 Billion kCal.Plant P3This unit with dry processing technology has produced 2.96 Mt of cement. The total energyconsumption is 4.92x10⁶ MkCal. The cement variants produced are OPC (30%), PPC (11%) andPSC (24%). One of the key aspects of this unit is the amount of exported clinker (1.107 Mt).Plant P4This plant also follows dry processing technology and has produced 0.99 Mt of combinedcement variety with an estimated total energy consumption of 1.01x10⁶ Million kCal. 86% PPCand 13% OPC are produced. This plant imports clinker (0.059 Mt).Plant P5With 77.30% capacity utilization, this unit has produced 4.2 Mt of OPC and PPC varieties. About20% of the total Clinker produced is exported. A total of 1.10 Mt of clinker is exported and 0.02Mt is imported. The total energy consumption of this unit is estimated to 6.04x10⁶ Million kCal.About 82.309 Million kWh of electricity is exported (highest among 9 plants).Plant P6:The cement production is 2.74 Mt. This grinding unit produced only PPC cement with a capacityutilization of 112.96%. Electricity consumption is estimated to be 108.87 Million kWh.Plant P7:Combined cement production is 1.36 Mt with 86.33% capacity utilization. The main productionis PPC cement (94%). A significant amount of electricity is supplied to the grid. The total energyconsumption is 0.989x10⁶ MkCal.
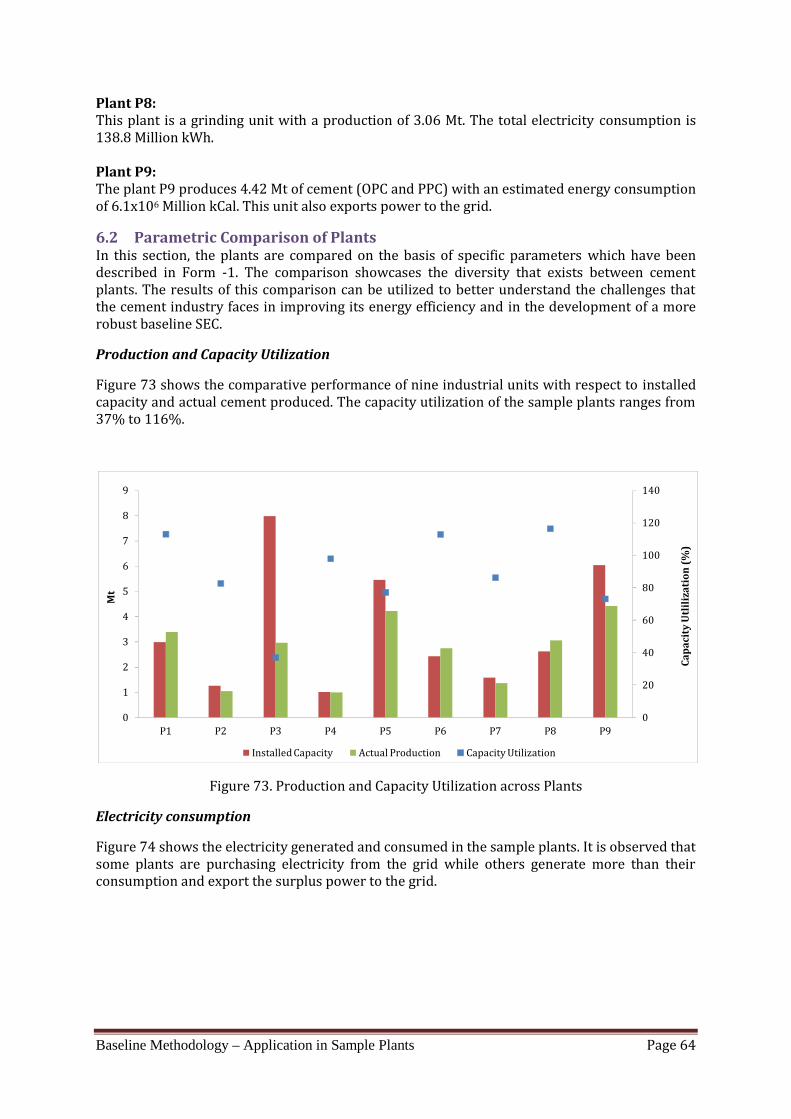
Baseline Methodology – Application in Sample Plants Page 64
Plant P8:This plant is a grinding unit with a production of 3.06 Mt. The total electricity consumption is138.8 Million kWh.Plant P9:The plant P9 produces 4.42 Mt of cement (OPC and PPC) with an estimated energy consumptionof 6.1x10⁶ Million kCal. This unit also exports power to the grid.6.2 Parametric Comparison of PlantsIn this section, the plants are compared on the basis of specific parameters which have beendescribed in Form -1. The comparison showcases the diversity that exists between cementplants. The results of this comparison can be utilized to better understand the challenges thatthe cement industry faces in improving its energy efficiency and in the development of a morerobust baseline SEC.Production and Capacity UtilizationFigure 73 shows the comparative performance of nine industrial units with respect to installedcapacity and actual cement produced. The capacity utilization of the sample plants ranges from37% to 116%.
Figure 73. Production and Capacity Utilization across PlantsElectricity consumptionFigure 74 shows the electricity generated and consumed in the sample plants. It is observed thatsome plants are purchasing electricity from the grid while others generate more than theirconsumption and export the surplus power to the grid.
020406080100120140
0123456789
P1 P2 P3 P4 P5 P6 P7 P8 P9Ca
paci
ty U
tlili
zati
on (%
)
Mt
Installed Capacity Actual Production Capacity Utilization
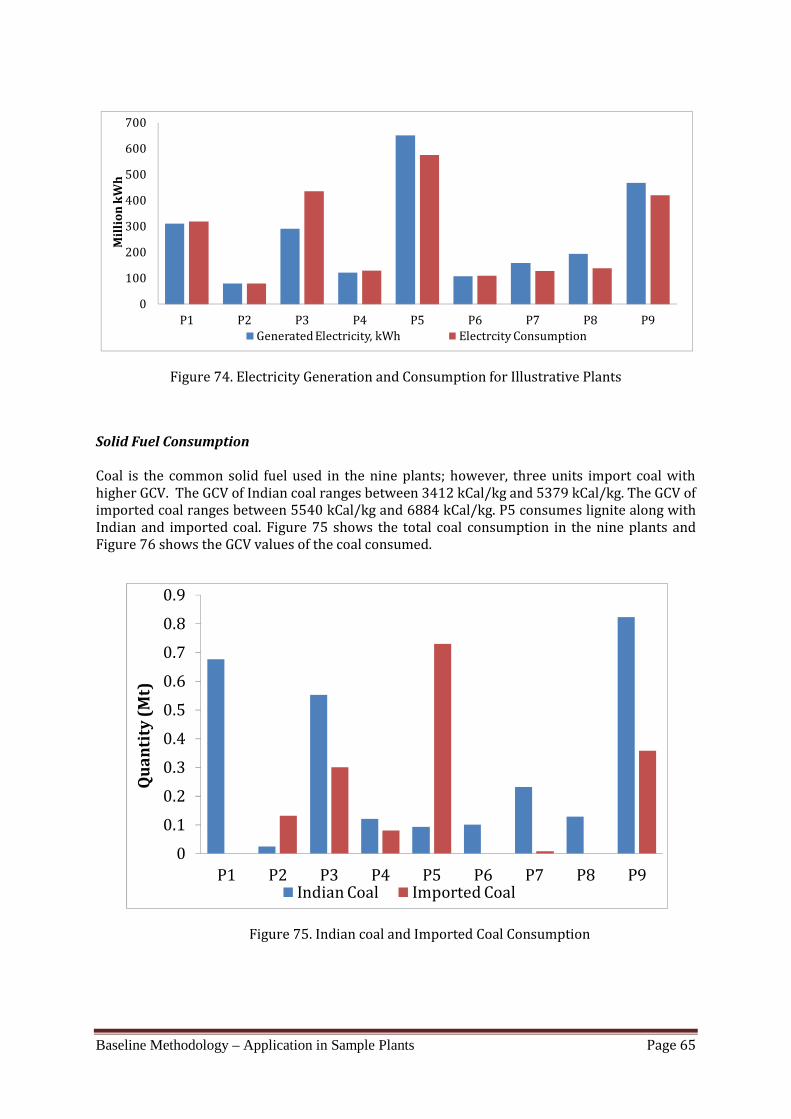
Baseline Methodology – Application in Sample Plants Page 65
Figure 74. Electricity Generation and Consumption for Illustrative PlantsSolid Fuel ConsumptionCoal is the common solid fuel used in the nine plants; however, three units import coal withhigher GCV. The GCV of Indian coal ranges between 3412 kCal/kg and 5379 kCal/kg. The GCV ofimported coal ranges between 5540 kCal/kg and 6884 kCal/kg. P5 consumes lignite along withIndian and imported coal. Figure 75 shows the total coal consumption in the nine plants andFigure 76 shows the GCV values of the coal consumed.
Figure 75. Indian coal and Imported Coal Consumption
0100200300400500600700
P1 P2 P3 P4 P5 P6 P7 P8 P9
Mill
ion
kWh
Generated Electricity, kWh Electrcity Consumption
00.10.20.30.40.50.60.70.80.9
P1 P2 P3 P4 P5 P6 P7 P8 P9
Qua
ntit
y (M
t)
Indian Coal Imported Coal
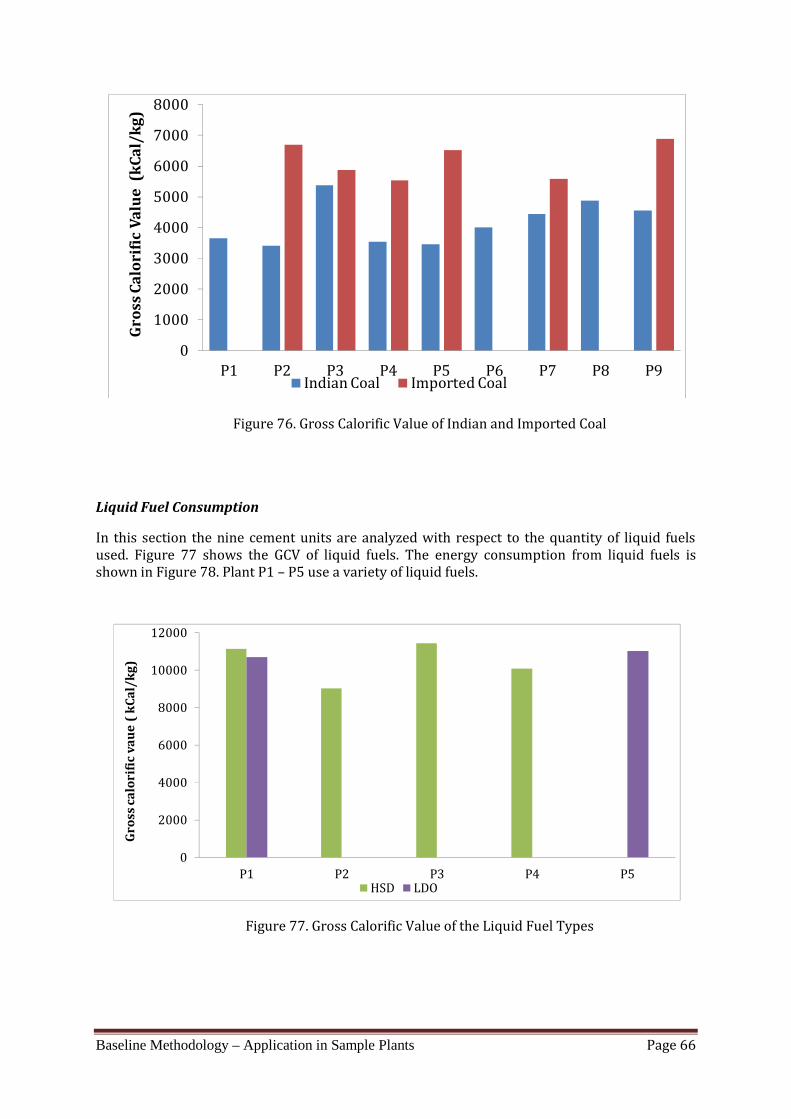
Baseline Methodology – Application in Sample Plants Page 66
Figure 76. Gross Calorific Value of Indian and Imported CoalLiquid Fuel ConsumptionIn this section the nine cement units are analyzed with respect to the quantity of liquid fuelsused. Figure 77 shows the GCV of liquid fuels. The energy consumption from liquid fuels isshown in Figure 78. Plant P1 – P5 use a variety of liquid fuels.
Figure 77. Gross Calorific Value of the Liquid Fuel Types
010002000300040005000600070008000
P1 P2 P3 P4 P5 P6 P7 P8 P9Gros
s Cal
orifi
c Va
lue
(kCa
l/kg
)
Indian Coal Imported Coal
02000400060008000
1000012000
P1 P2 P3 P4 P5Gros
s cal
orifi
c va
ue (
kCal
/kg)
HSD LDO
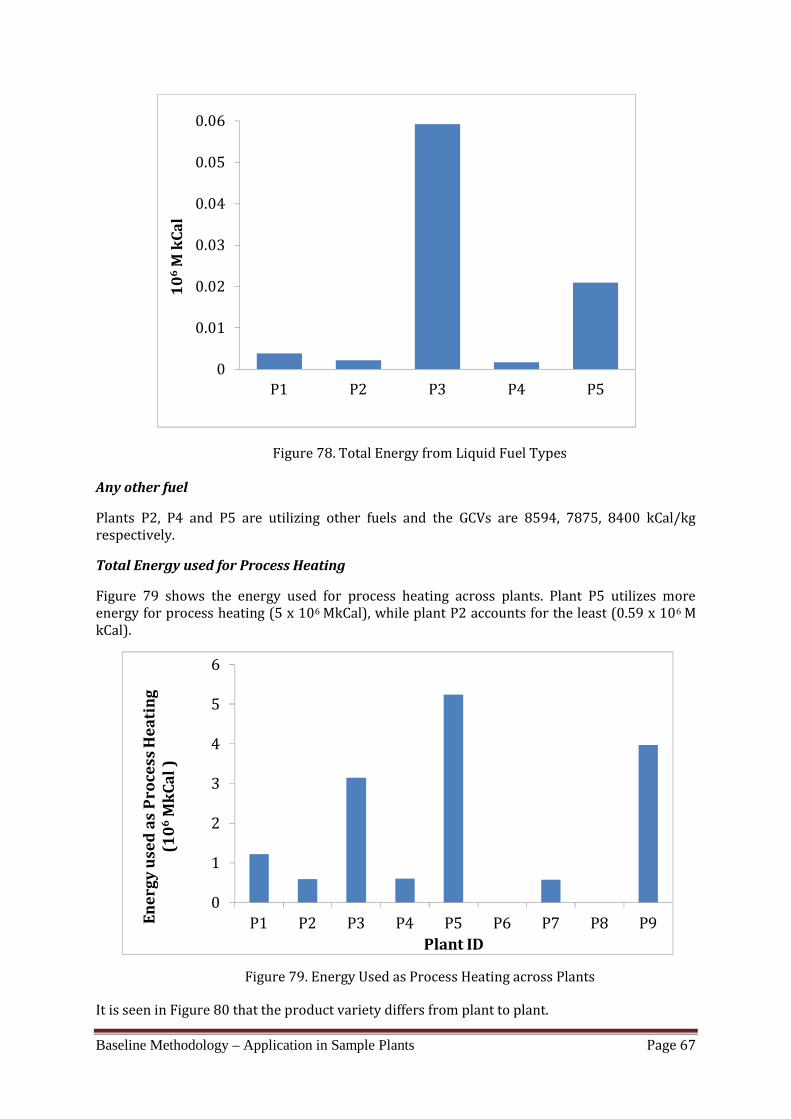
Baseline Methodology – Application in Sample Plants Page 67
Figure 78. Total Energy from Liquid Fuel TypesAny other fuelPlants P2, P4 and P5 are utilizing other fuels and the GCVs are 8594, 7875, 8400 kCal/kgrespectively.Total Energy used for Process HeatingFigure 79 shows the energy used for process heating across plants. Plant P5 utilizes moreenergy for process heating (5 x 10⁶ MkCal), while plant P2 accounts for the least (0.59 x 10⁶ MkCal).
Figure 79. Energy Used as Process Heating across PlantsIt is seen in Figure 80 that the product variety differs from plant to plant.
00.010.020.030.040.050.06
P1 P2 P3 P4 P5
106
M k
Cal
0123456
P1 P2 P3 P4 P5 P6 P7 P8 P9Ener
gy u
sed
as P
roce
ss H
eati
ng(1
06M
kCal
)
Plant ID

Baseline Methodology – Application in Sample Plants Page 68
Figure 80. Product variants in PlantsConversion FactorsThe conversion factors used for clinker to final grade of cement is shown inTable 15.
Table 15: Conversion factors
Performance IndicatorsFigure 81 shows the comparison of performance indicators across the nine plants. The thermalSEC ranges from 702 – 1045 kCal/kg clinker. The electrical SEC up to clinkerization ranges from55.5 to 82.1 kWh/t clinker. The electrical SEC for cement grinding ranges from 27.6 – 45.7kWh/t cement.
P1 P2 P3 P4 P5 P6 P7 P8 P9PPC 3.373 0.783 0.695 0.873 1.314 2.740 1.289 3.059 1.736OPC 0.010 0.172 1.260 0.089 2.912 0.069 2.681PSC 0.088 1.009 0.0250.00.51.01.52.02.53.03.54.0
Mt
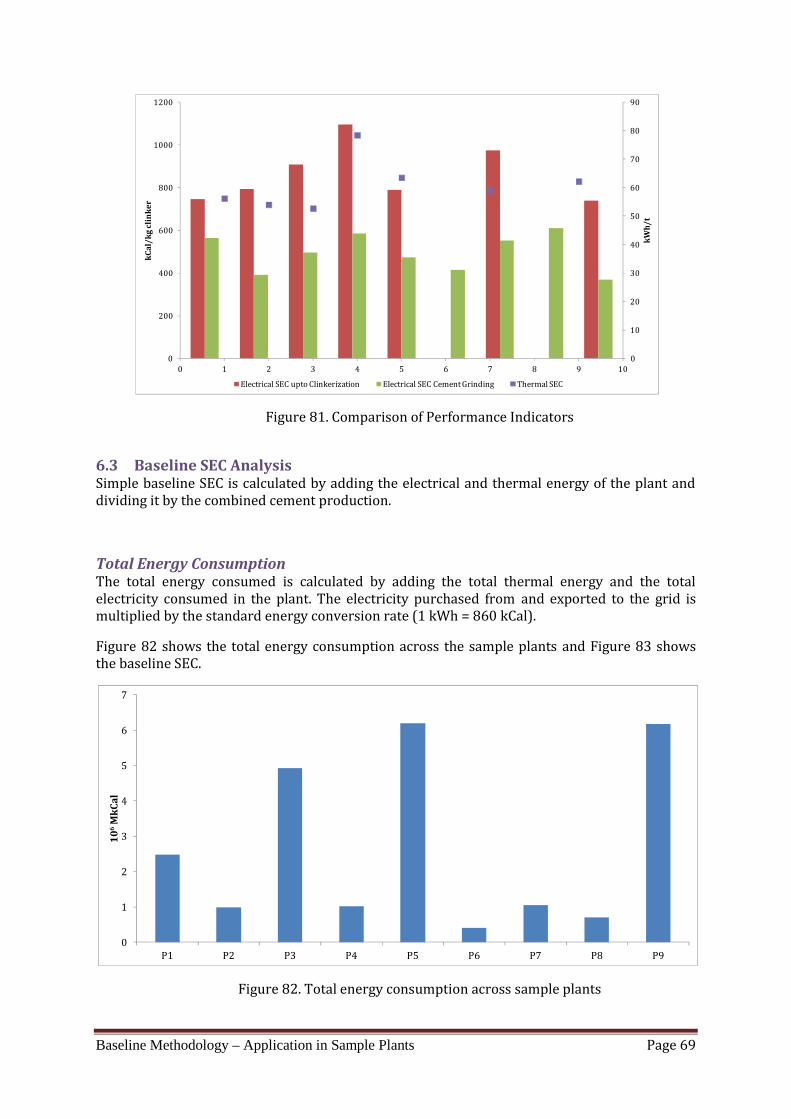
Baseline Methodology – Application in Sample Plants Page 69
Figure 81. Comparison of Performance Indicators6.3 Baseline SEC AnalysisSimple baseline SEC is calculated by adding the electrical and thermal energy of the plant anddividing it by the combined cement production.Total Energy ConsumptionThe total energy consumed is calculated by adding the total thermal energy and the totalelectricity consumed in the plant. The electricity purchased from and exported to the grid ismultiplied by the standard energy conversion rate (1 kWh = 860 kCal).Figure 82 shows the total energy consumption across the sample plants and Figure 83 showsthe baseline SEC.
Figure 82. Total energy consumption across sample plants
0102030405060708090
0200400600800
10001200
0 1 2 3 4 5 6 7 8 9 10
kWh/
t
kCal
/kg
clin
ker
Electrical SEC upto Clinkerization Electrical SEC Cement Grinding Thermal SEC
01234567
P1 P2 P3 P4 P5 P6 P7 P8 P9
106
MkC
al

Baseline Methodology – Application in Sample Plants Page 70
Figure 83. Baseline SEC for sample plantsEquivalent Major Grade CementEquivalent major grade cement can be estimated using the cement conversion factors. Theamount of OPC, PPC and PSC can be converted to an equivalent major grade cement (among thedifferent grades) using the different conversion factors. The total clinker exported and importedcan also be converted to equivalent major grade cement. The total equivalent major gradecement is calculated by adding the above two equivalent grade cements. Figure 84 shows theequivalent major grade cement across the different plants along with the actual combinedcement production.
Figure 84. Difference in Equivalent Major Grade Cement Production
020040060080010001200140016001800
P1 P2 P3 P4 P5 P6 P7 P8 P9
Base
line
SEC
(kCa
l/kg
cem
ent)
Plant ID
0123456
P1 P2 P3 P4 P5 P6 P7 P8 P9
Mt
Combined Cement Production Equivalent Major Grade Cement Production
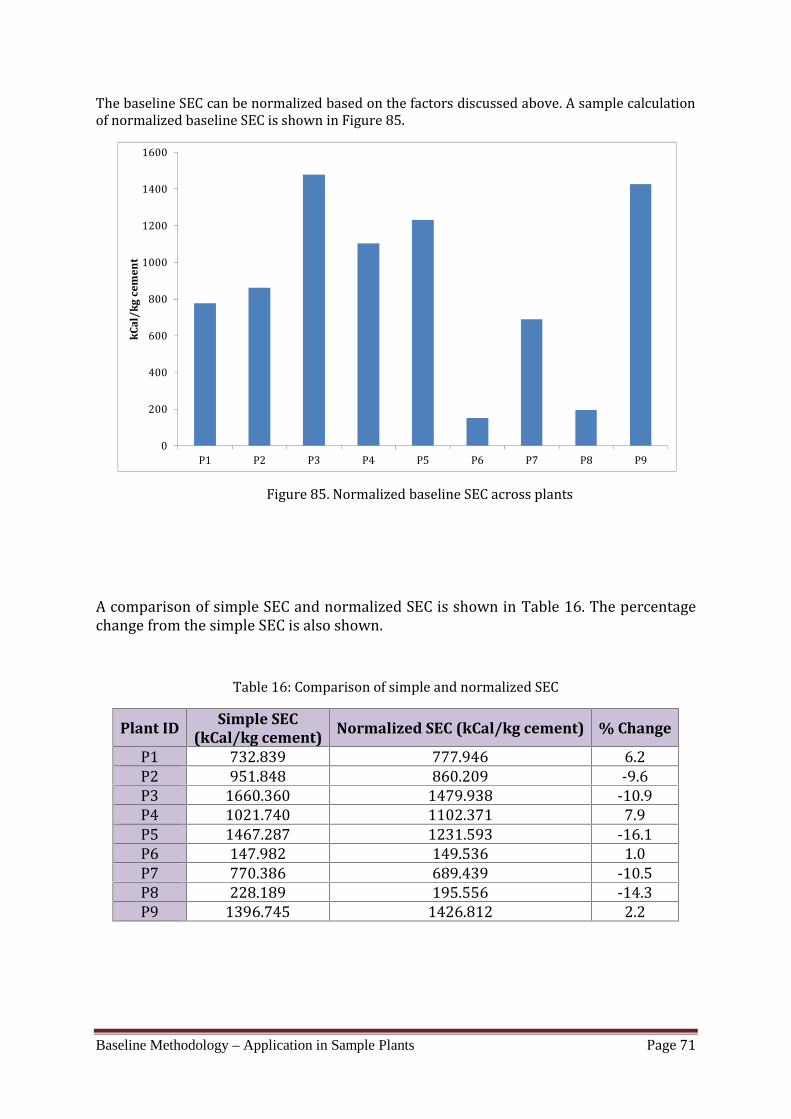
Baseline Methodology – Application in Sample Plants Page 71
The baseline SEC can be normalized based on the factors discussed above. A sample calculationof normalized baseline SEC is shown in Figure 85.
Figure 85. Normalized baseline SEC across plants
A comparison of simple SEC and normalized SEC is shown in Table 16. The percentagechange from the simple SEC is also shown.Table 16: Comparison of simple and normalized SEC
Plant ID Simple SEC(kCal/kg cement) Normalized SEC (kCal/kg cement) % ChangeP1 732.839 777.946 6.2P2 951.848 860.209 -9.6P3 1660.360 1479.938 -10.9P4 1021.740 1102.371 7.9P5 1467.287 1231.593 -16.1P6 147.982 149.536 1.0P7 770.386 689.439 -10.5P8 228.189 195.556 -14.3P9 1396.745 1426.812 2.2
0200400600800
1000120014001600
P1 P2 P3 P4 P5 P6 P7 P8 P9
kCal
/kg
cem
ent

Page 72
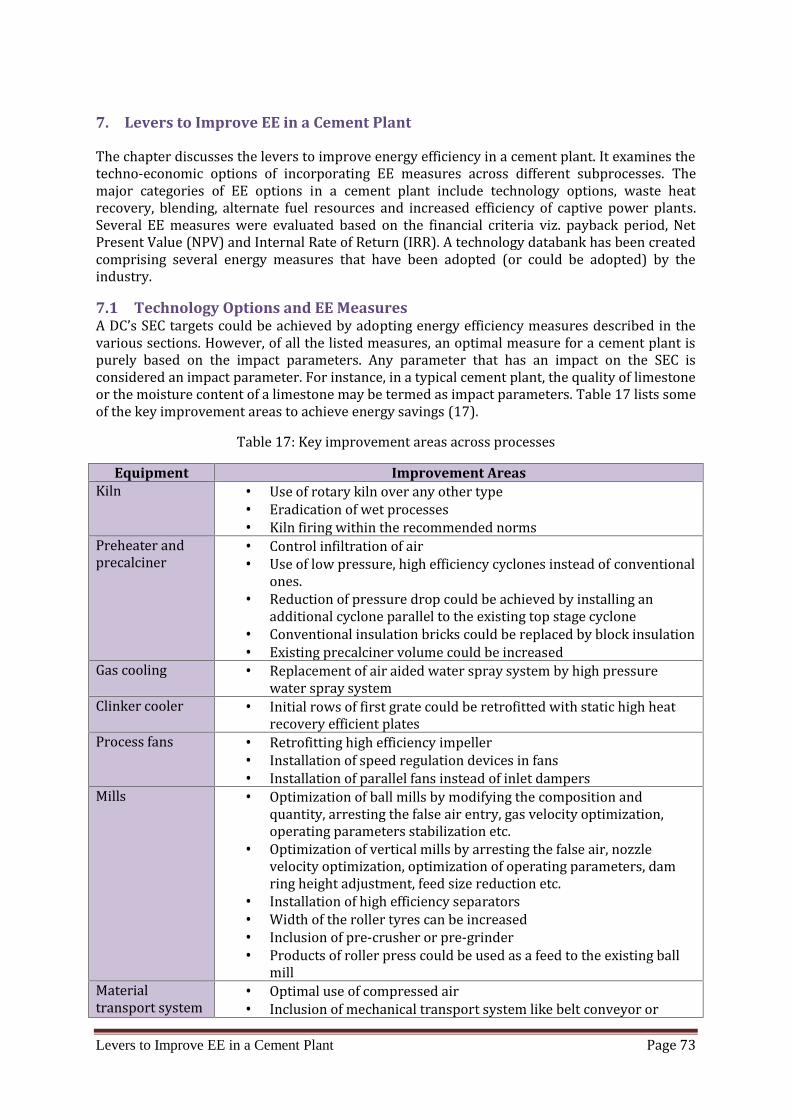
Levers to Improve EE in a Cement Plant Page 73
7. Levers to Improve EE in a Cement PlantThe chapter discusses the levers to improve energy efficiency in a cement plant. It examines thetechno-economic options of incorporating EE measures across different subprocesses. Themajor categories of EE options in a cement plant include technology options, waste heatrecovery, blending, alternate fuel resources and increased efficiency of captive power plants.Several EE measures were evaluated based on the financial criteria viz. payback period, NetPresent Value (NPV) and Internal Rate of Return (IRR). A technology databank has been createdcomprising several energy measures that have been adopted (or could be adopted) by theindustry.7.1 Technology Options and EE MeasuresA DC’s SEC targets could be achieved by adopting energy efficiency measures described in thevarious sections. However, of all the listed measures, an optimal measure for a cement plant ispurely based on the impact parameters. Any parameter that has an impact on the SEC isconsidered an impact parameter. For instance, in a typical cement plant, the quality of limestoneor the moisture content of a limestone may be termed as impact parameters. Table 17 lists someof the key improvement areas to achieve energy savings (17).Table 17: Key improvement areas across processes
Equipment Improvement AreasKiln Use of rotary kiln over any other type Eradication of wet processes Kiln firing within the recommended normsPreheater andprecalciner Control infiltration of air Use of low pressure, high efficiency cyclones instead of conventionalones. Reduction of pressure drop could be achieved by installing anadditional cyclone parallel to the existing top stage cyclone Conventional insulation bricks could be replaced by block insulation Existing precalciner volume could be increasedGas cooling Replacement of air aided water spray system by high pressurewater spray systemClinker cooler Initial rows of first grate could be retrofitted with static high heatrecovery efficient platesProcess fans Retrofitting high efficiency impeller Installation of speed regulation devices in fans Installation of parallel fans instead of inlet dampersMills Optimization of ball mills by modifying the composition andquantity, arresting the false air entry, gas velocity optimization,operating parameters stabilization etc. Optimization of vertical mills by arresting the false air, nozzlevelocity optimization, optimization of operating parameters, damring height adjustment, feed size reduction etc. Installation of high efficiency separators Width of the roller tyres can be increased Inclusion of pre-crusher or pre-grinder Products of roller press could be used as a feed to the existing ballmillMaterialtransport system Optimal use of compressed air Inclusion of mechanical transport system like belt conveyor or
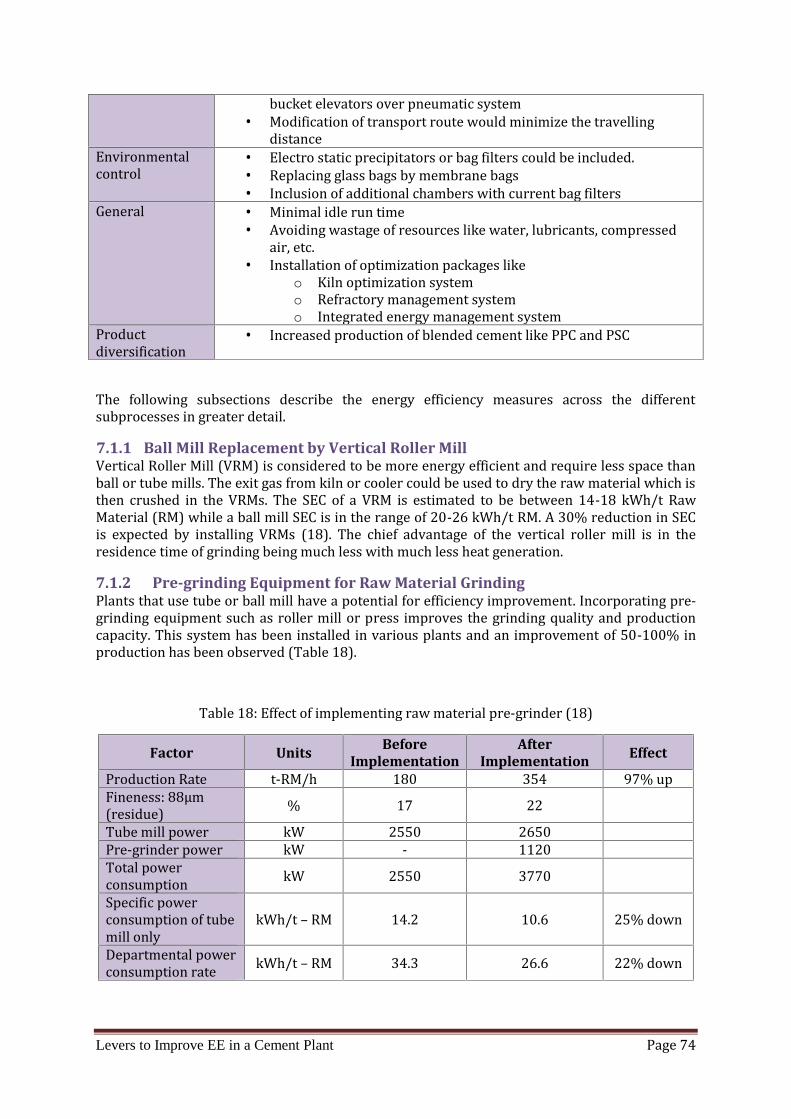
Levers to Improve EE in a Cement Plant Page 74
bucket elevators over pneumatic system Modification of transport route would minimize the travellingdistanceEnvironmentalcontrol Electro static precipitators or bag filters could be included. Replacing glass bags by membrane bags Inclusion of additional chambers with current bag filtersGeneral Minimal idle run time Avoiding wastage of resources like water, lubricants, compressedair, etc. Installation of optimization packages like
o Kiln optimization systemo Refractory management systemo Integrated energy management systemProductdiversification Increased production of blended cement like PPC and PSC
The following subsections describe the energy efficiency measures across the differentsubprocesses in greater detail.7.1.1 Ball Mill Replacement by Vertical Roller MillVertical Roller Mill (VRM) is considered to be more energy efficient and require less space thanball or tube mills. The exit gas from kiln or cooler could be used to dry the raw material which isthen crushed in the VRMs. The SEC of a VRM is estimated to be between 14-18 kWh/t RawMaterial (RM) while a ball mill SEC is in the range of 20-26 kWh/t RM. A 30% reduction in SECis expected by installing VRMs (18). The chief advantage of the vertical roller mill is in theresidence time of grinding being much less with much less heat generation.7.1.2 Pre-grinding Equipment for Raw Material GrindingPlants that use tube or ball mill have a potential for efficiency improvement. Incorporating pre-grinding equipment such as roller mill or press improves the grinding quality and productioncapacity. This system has been installed in various plants and an improvement of 50-100% inproduction has been observed (Table 18).
Table 18: Effect of implementing raw material pre-grinder (18)Factor Units Before
ImplementationAfter
Implementation EffectProduction Rate t-RM/h 180 354 97% upFineness: 88µm(residue) % 17 22Tube mill power kW 2550 2650Pre-grinder power kW - 1120Total powerconsumption kW 2550 3770Specific powerconsumption of tubemill only kWh/t – RM 14.2 10.6 25% downDepartmental powerconsumption rate kWh/t – RM 34.3 26.6 22% down
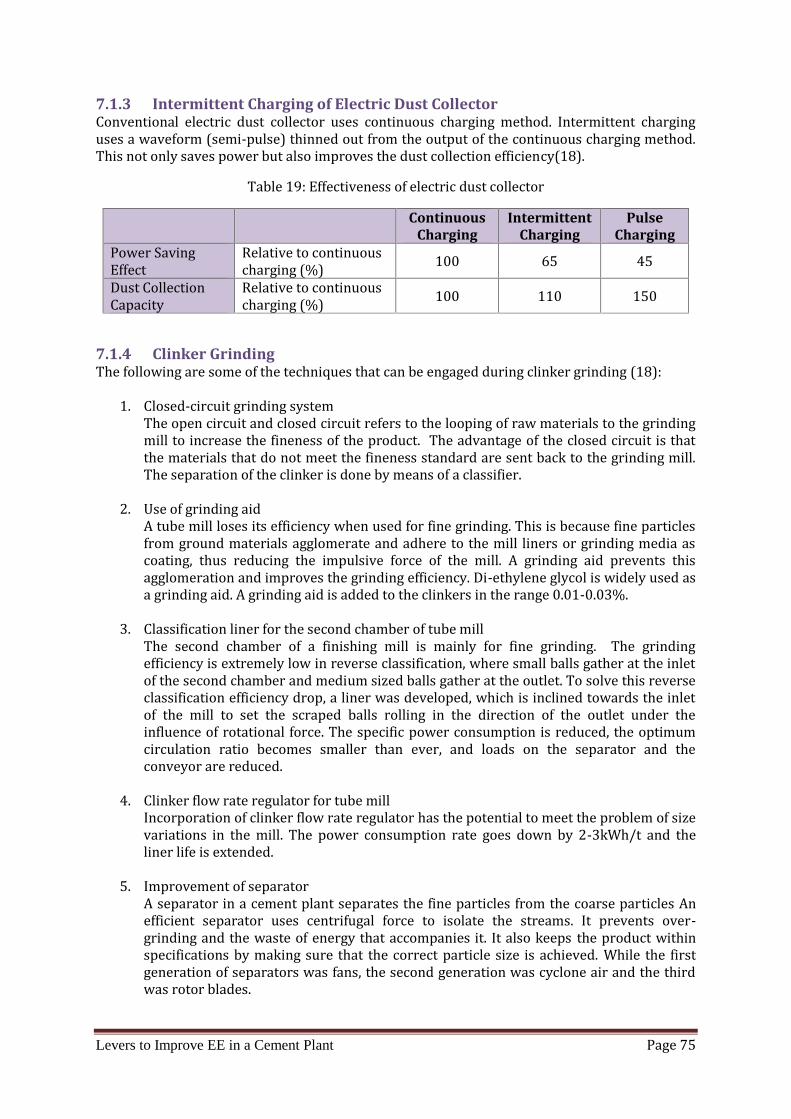
Levers to Improve EE in a Cement Plant Page 75
7.1.3 Intermittent Charging of Electric Dust CollectorConventional electric dust collector uses continuous charging method. Intermittent charginguses a waveform (semi-pulse) thinned out from the output of the continuous charging method.This not only saves power but also improves the dust collection efficiency(18).Table 19: Effectiveness of electric dust collectorContinuous
ChargingIntermittent
ChargingPulse
ChargingPower SavingEffect Relative to continuouscharging (%) 100 65 45Dust CollectionCapacity Relative to continuouscharging (%) 100 110 1507.1.4 Clinker GrindingThe following are some of the techniques that can be engaged during clinker grinding (18):1. Closed-circuit grinding systemThe open circuit and closed circuit refers to the looping of raw materials to the grindingmill to increase the fineness of the product. The advantage of the closed circuit is thatthe materials that do not meet the fineness standard are sent back to the grinding mill.The separation of the clinker is done by means of a classifier.2. Use of grinding aidA tube mill loses its efficiency when used for fine grinding. This is because fine particlesfrom ground materials agglomerate and adhere to the mill liners or grinding media ascoating, thus reducing the impulsive force of the mill. A grinding aid prevents thisagglomeration and improves the grinding efficiency. Di-ethylene glycol is widely used asa grinding aid. A grinding aid is added to the clinkers in the range 0.01-0.03%.3. Classification liner for the second chamber of tube millThe second chamber of a finishing mill is mainly for fine grinding. The grindingefficiency is extremely low in reverse classification, where small balls gather at the inletof the second chamber and medium sized balls gather at the outlet. To solve this reverseclassification efficiency drop, a liner was developed, which is inclined towards the inletof the mill to set the scraped balls rolling in the direction of the outlet under theinfluence of rotational force. The specific power consumption is reduced, the optimumcirculation ratio becomes smaller than ever, and loads on the separator and theconveyor are reduced.4. Clinker flow rate regulator for tube millIncorporation of clinker flow rate regulator has the potential to meet the problem of sizevariations in the mill. The power consumption rate goes down by 2-3kWh/t and theliner life is extended.5. Improvement of separatorA separator in a cement plant separates the fine particles from the coarse particles Anefficient separator uses centrifugal force to isolate the streams. It prevents over-grinding and the waste of energy that accompanies it. It also keeps the product withinspecifications by making sure that the correct particle size is achieved. While the firstgeneration of separators was fans, the second generation was cyclone air and the thirdwas rotor blades.
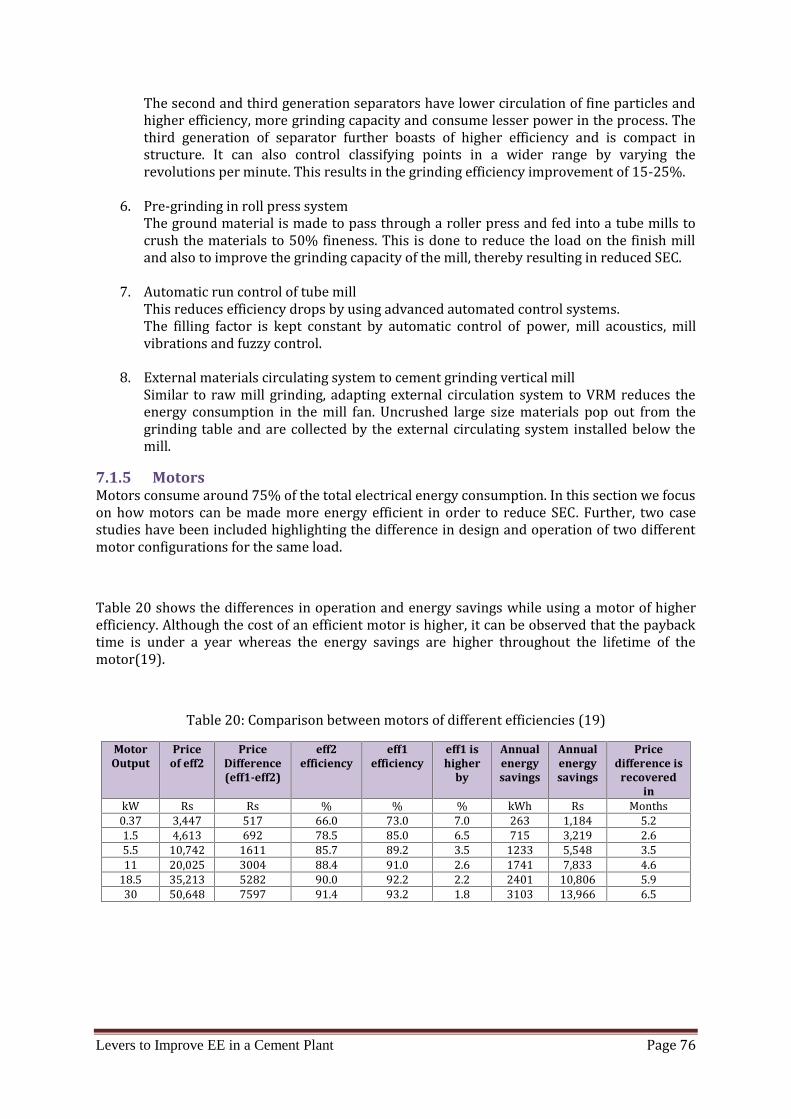
Levers to Improve EE in a Cement Plant Page 76
The second and third generation separators have lower circulation of fine particles andhigher efficiency, more grinding capacity and consume lesser power in the process. Thethird generation of separator further boasts of higher efficiency and is compact instructure. It can also control classifying points in a wider range by varying therevolutions per minute. This results in the grinding efficiency improvement of 15-25%.6. Pre-grinding in roll press systemThe ground material is made to pass through a roller press and fed into a tube mills tocrush the materials to 50% fineness. This is done to reduce the load on the finish milland also to improve the grinding capacity of the mill, thereby resulting in reduced SEC.7. Automatic run control of tube millThis reduces efficiency drops by using advanced automated control systems.The filling factor is kept constant by automatic control of power, mill acoustics, millvibrations and fuzzy control.8. External materials circulating system to cement grinding vertical millSimilar to raw mill grinding, adapting external circulation system to VRM reduces theenergy consumption in the mill fan. Uncrushed large size materials pop out from thegrinding table and are collected by the external circulating system installed below themill.7.1.5 MotorsMotors consume around 75% of the total electrical energy consumption. In this section we focuson how motors can be made more energy efficient in order to reduce SEC. Further, two casestudies have been included highlighting the difference in design and operation of two differentmotor configurations for the same load.Table 20 shows the differences in operation and energy savings while using a motor of higherefficiency. Although the cost of an efficient motor is higher, it can be observed that the paybacktime is under a year whereas the energy savings are higher throughout the lifetime of themotor(19).
Table 20: Comparison between motors of different efficiencies (19)MotorOutput
Priceof eff2
PriceDifference(eff1-eff2)
eff2efficiency
eff1efficiency
eff1 ishigher
by
Annualenergysavings
Annualenergysavings
Pricedifference is
recoveredinkW Rs Rs % % % kWh Rs Months0.37 3,447 517 66.0 73.0 7.0 263 1,184 5.21.5 4,613 692 78.5 85.0 6.5 715 3,219 2.65.5 10,742 1611 85.7 89.2 3.5 1233 5,548 3.511 20,025 3004 88.4 91.0 2.6 1741 7,833 4.618.5 35,213 5282 90.0 92.2 2.2 2401 10,806 5.930 50,648 7597 91.4 93.2 1.8 3103 13,966 6.5

Levers to Improve EE in a Cement Plant Page 77
Some of the measures that could be incorporated to reduce the losses and improve theefficiency of the motor have been presented in Table 21.Table 21: Measures to improve motor efficiency (19)Losses MeasuresCopper losses I2R 55-60% Proper selection of copper conductorsStator WsRotor Wr Copper cage rotors or specially designed ;Al die-cast rotorsCore loss Wc 20-25% Low Watt Loss MaterialThinner LaminationsEnsuring reduced Burr HeightMechanical losses 8-14% Properly selected bearingsFriction WfrWindage Wwind Optimally designed fans orUnidirectional fans for very large machines.Stray load loss WI 4-5% Optimum slot geometryMinimum Overhang length
7.1.6 Blending of Raw MaterialsThree types of blending of raw materials are practiced in the industry. These are as follows(18):Mechanical SystemIt consists of multiple storage silos, each of which is provided with regulated withdrawalfacilities. Blending is achieved by an orderly withdrawal of materials at variable rates from allsilos. While this type of mixing consumes less power, the system requires a great deal ofmaterial handling which increases power consumption. In addition, the required number ofsilos is more than in other systems. As a result, this type of system is not widely in use in thecement industry.Pneumatic fluidization,A fluid like behavior is created by the air passed from the bottom of the silo. The agitationmethod is known to provide high blending efficiency for dry materials. But at the same time,plants using this method consume excess power.Gravity approachGravity approach to homogenize has been conceived only with the compulsion of achievingreduced power consumption. This system is quite similar to the mechanical system. However,multiple silos are not used here.Energy Efficiency Measures in Blending systemsThe primary issues that surface during the blending of raw materials are high powerconsumption, regular maintenance, difficulty in supplying clean air and high cost of installing oilfree air compressors. The energy efficiency of the process could be achieved by the following:Blending and coal firing system optimization
Optimizing the blending systems by improving the blending efficiency in silos wouldresult in 2.5kCal/kg clinker reduction in thermal energy consumption Installation of solid flow meter based coal firing system would result in a reduction of5kCal/kg clinker in thermal energy consumption
Levers to Improve EE in a Cement Plant Page 78
7.1.7 Pyro-processingPyro-processing section in a cement plant comprises of pre-heater, rotary kiln and clinkercooler. Pyro-processing section is considered to be the heart of a cement plant since the clinkerformation happens in the kiln. With the introduction of pre-calciners in 1980's, the size ofcement plants has increased considerably. The size of the plant in 1980s was 3300 tpd(increased to about 12000 tpd currently) (20).PreheaterA variety of preheaters with different design of precalciners have come into existence.Preheaters can be classified into the following five categories: (20)a) Preheater without calcinerb) Inline calciner with air passing through the kilnc) Inline calciner with external tertiary air ductd) Separate line calcinere) Separate line calciner with inline calcinerCyclonesCyclones are basic units in a pre-heater system. Pressure drop and change of temperature of gasacross each stage determines the efficiency of cyclones. Introduction of Low Pressure drop (LP)cyclones has brought the pressure drop across each stage to around 50 mm water gauge (WG)from around 150 mm WG in conventional cyclones. This has resulted in more and more plantsadopting 5 or 6 stages of pre-heater. A typical 6-stage pre-heater with LP cyclones will have apre-heater exhaust gas temperature of around 250oC and draught of around 500 mm WG. Thisin turn led to reduction in pre-heater fan power consumption. The reduced temperatures at thepre-heater exhaust contribute to environmental performance (20).The burners also play an important role in determining the thermal efficiency of the pyro-processing system. (There has been a continuous effort on operating the burners with the leastpossible primary air.). Multi-channel burners (taking only 5% primary air) are being installed inmany plants giving a direct thermal energy saving of 15 kCal/kg clinker. Apart from savingthermal energy, the modern burners also enable easy flame control.CoolerClinker cooler is a critical component and the size of clinker cooler sometimes becomes a bottle-neck for increasing production from the rotary kiln. The clinker cooler has more than twofunctions in a cement plant. It reduces the temperature of the clinker to a level that is acceptablefor further transport and recovers energy from the hot clinker. Thus, thermal efficiency ofclinker cooler is very important in deciding the type of the cooler. Two types of clinker coolersare used at present in the cement industry. They are
Grate cooler Planetary coolerConvention grate coolers are widely in use in the existing plants. These coolers have lowerrecuperation efficiency, occupy more space and need more cooling air. In spite of these drawbacks, grate coolers are more widely used than planetary coolers primarily due to relativehigher thermal efficiency. There have been a number of design improvements in grate coolers inrecent times, mainly on grate plate to improve the efficiencies simultaneously reducing thecooling air intake. The specific load of clinker on grate plate can be as high as 50 tpd/m2. Thesemodern coolers are compact in size. High efficiency coolers operate on the principle of
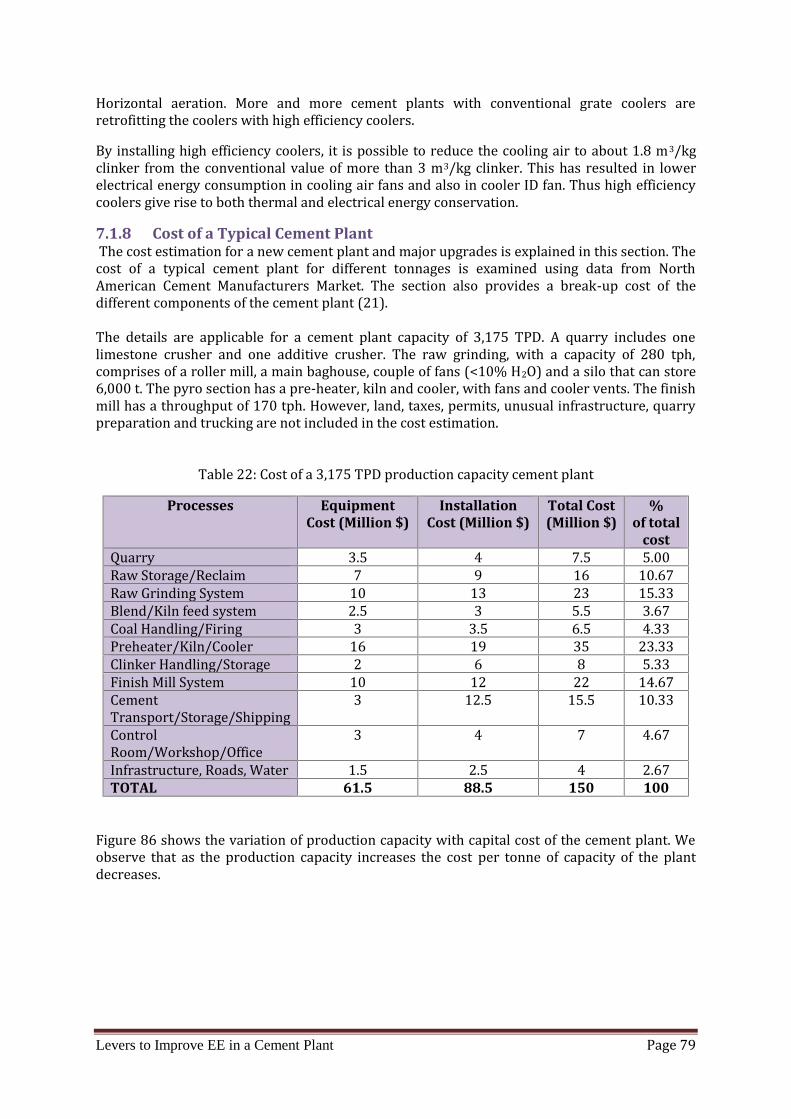
Levers to Improve EE in a Cement Plant Page 79
Horizontal aeration. More and more cement plants with conventional grate coolers areretrofitting the coolers with high efficiency coolers.By installing high efficiency coolers, it is possible to reduce the cooling air to about 1.8 m3/kgclinker from the conventional value of more than 3 m3/kg clinker. This has resulted in lowerelectrical energy consumption in cooling air fans and also in cooler ID fan. Thus high efficiencycoolers give rise to both thermal and electrical energy conservation.7.1.8 Cost of a Typical Cement PlantThe cost estimation for a new cement plant and major upgrades is explained in this section. Thecost of a typical cement plant for different tonnages is examined using data from NorthAmerican Cement Manufacturers Market. The section also provides a break-up cost of thedifferent components of the cement plant (21).The details are applicable for a cement plant capacity of 3,175 TPD. A quarry includes onelimestone crusher and one additive crusher. The raw grinding, with a capacity of 280 tph,comprises of a roller mill, a main baghouse, couple of fans (<10% H2O) and a silo that can store6,000 t. The pyro section has a pre-heater, kiln and cooler, with fans and cooler vents. The finishmill has a throughput of 170 tph. However, land, taxes, permits, unusual infrastructure, quarrypreparation and trucking are not included in the cost estimation.
Table 22: Cost of a 3,175 TPD production capacity cement plantProcesses Equipment
Cost (Million $)Installation
Cost (Million $)Total Cost(Million $)
%of total
costQuarry 3.5 4 7.5 5.00Raw Storage/Reclaim 7 9 16 10.67Raw Grinding System 10 13 23 15.33Blend/Kiln feed system 2.5 3 5.5 3.67Coal Handling/Firing 3 3.5 6.5 4.33Preheater/Kiln/Cooler 16 19 35 23.33Clinker Handling/Storage 2 6 8 5.33Finish Mill System 10 12 22 14.67CementTransport/Storage/Shipping 3 12.5 15.5 10.33ControlRoom/Workshop/Office 3 4 7 4.67Infrastructure, Roads, Water 1.5 2.5 4 2.67TOTAL 61.5 88.5 150 100
Figure 86 shows the variation of production capacity with capital cost of the cement plant. Weobserve that as the production capacity increases the cost per tonne of capacity of the plantdecreases.
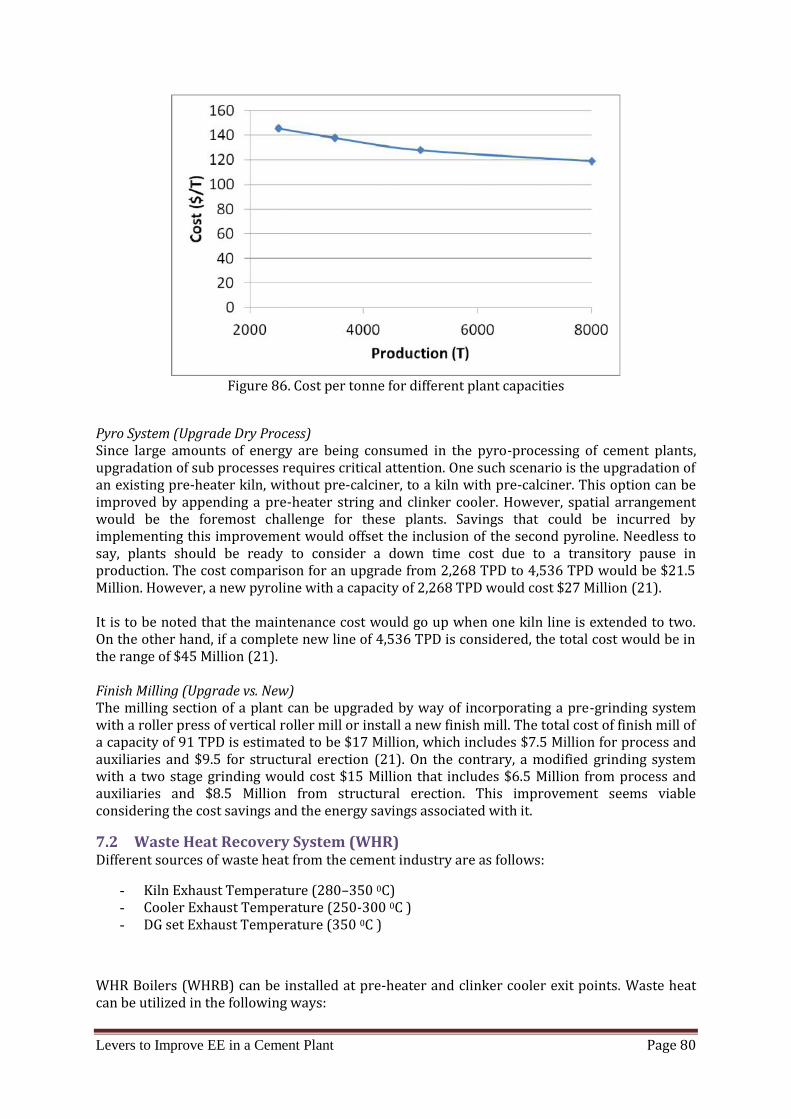
Levers to Improve EE in a Cement Plant Page 80
Figure 86. Cost per tonne for different plant capacitiesPyro System (Upgrade Dry Process)Since large amounts of energy are being consumed in the pyro-processing of cement plants,upgradation of sub processes requires critical attention. One such scenario is the upgradation ofan existing pre-heater kiln, without pre-calciner, to a kiln with pre-calciner. This option can beimproved by appending a pre-heater string and clinker cooler. However, spatial arrangementwould be the foremost challenge for these plants. Savings that could be incurred byimplementing this improvement would offset the inclusion of the second pyroline. Needless tosay, plants should be ready to consider a down time cost due to a transitory pause inproduction. The cost comparison for an upgrade from 2,268 TPD to 4,536 TPD would be $21.5Million. However, a new pyroline with a capacity of 2,268 TPD would cost $27 Million (21).It is to be noted that the maintenance cost would go up when one kiln line is extended to two.On the other hand, if a complete new line of 4,536 TPD is considered, the total cost would be inthe range of $45 Million (21).Finish Milling (Upgrade vs. New)The milling section of a plant can be upgraded by way of incorporating a pre-grinding systemwith a roller press of vertical roller mill or install a new finish mill. The total cost of finish mill ofa capacity of 91 TPD is estimated to be $17 Million, which includes $7.5 Million for process andauxiliaries and $9.5 for structural erection (21). On the contrary, a modified grinding systemwith a two stage grinding would cost $15 Million that includes $6.5 Million from process andauxiliaries and $8.5 Million from structural erection. This improvement seems viableconsidering the cost savings and the energy savings associated with it.7.2 Waste Heat Recovery System (WHR)Different sources of waste heat from the cement industry are as follows:
- Kiln Exhaust Temperature (280–350 0C)- Cooler Exhaust Temperature (250-300 0C )- DG set Exhaust Temperature (350 0C )
WHR Boilers (WHRB) can be installed at pre-heater and clinker cooler exit points. Waste heatcan be utilized in the following ways:Levers to Improve EE in a Cement Plant Page 80
Figure 86. Cost per tonne for different plant capacitiesPyro System (Upgrade Dry Process)Since large amounts of energy are being consumed in the pyro-processing of cement plants,upgradation of sub processes requires critical attention. One such scenario is the upgradation ofan existing pre-heater kiln, without pre-calciner, to a kiln with pre-calciner. This option can beimproved by appending a pre-heater string and clinker cooler. However, spatial arrangementwould be the foremost challenge for these plants. Savings that could be incurred byimplementing this improvement would offset the inclusion of the second pyroline. Needless tosay, plants should be ready to consider a down time cost due to a transitory pause inproduction. The cost comparison for an upgrade from 2,268 TPD to 4,536 TPD would be $21.5Million. However, a new pyroline with a capacity of 2,268 TPD would cost $27 Million (21).It is to be noted that the maintenance cost would go up when one kiln line is extended to two.On the other hand, if a complete new line of 4,536 TPD is considered, the total cost would be inthe range of $45 Million (21).Finish Milling (Upgrade vs. New)The milling section of a plant can be upgraded by way of incorporating a pre-grinding systemwith a roller press of vertical roller mill or install a new finish mill. The total cost of finish mill ofa capacity of 91 TPD is estimated to be $17 Million, which includes $7.5 Million for process andauxiliaries and $9.5 for structural erection (21). On the contrary, a modified grinding systemwith a two stage grinding would cost $15 Million that includes $6.5 Million from process andauxiliaries and $8.5 Million from structural erection. This improvement seems viableconsidering the cost savings and the energy savings associated with it.7.2 Waste Heat Recovery System (WHR)Different sources of waste heat from the cement industry are as follows:
- Kiln Exhaust Temperature (280–350 0C)- Cooler Exhaust Temperature (250-300 0C )- DG set Exhaust Temperature (350 0C )
WHR Boilers (WHRB) can be installed at pre-heater and clinker cooler exit points. Waste heatcan be utilized in the following ways:

Levers to Improve EE in a Cement Plant Page 81
1. Power – Steam Rankine Cycle2. Power – Organic Rankine Cycle3. Integration with Captive Power Plant4. Fly ash dryingCurrently pre-heater exhaust gas is partly utilized for raw meal/coal drying. Cooler exhaust isgenerally not utilized in the Indian cement sector. In recent times, a few plants have startedusing the latter for slag drying.Waste heat could also be recovered by extracting heat from the surface of kilns. Here, asecondary shell is fitted around the rotating hot kiln and air is passed through the annulus. Theair carries heat along with it and can be used at different sections of the plant (22).Working Principle of WHRBThe exhaust gases emanating from the pre-heater cyclone tower and clinker cooler are at a hightemperature. The enthalpy of the exhaust gases can be utilized to meet the heat requirements ofthe cement plant.The pre-heater and clinker cooler exhausts are made to pass through heat exchangers togenerate steam. The steam generated from each section is collected and used to run a turbine togenerate electricity.The following are the technologies available for producing power from exhaust gases of cementplant.
Rankine Cycle Organic Rankine Cycle Kalina CycleThe potential for WHR from both PH & cooler exhaust is 1.5-4 MW depending on capacity of theplant.
Case StudiesA study has examined three plants and has identified the source of WHR and the technologyused to utilize it. The details are given in Table 23.Table 23: Details of WHR in three plants (23)Plant/Parameter Plant 1 Plant 2 Plant 3Power Cycle Organic RankineCycle Steam Rankine Cycle Waste Heat RecoveryBoilerClinker Production 2.5 Million TPA 0.5 Million TPA 1 Million TPASource Clinker coolerlosses Pre-heater and clinkercooler Pre-heaterGross PowerGeneration 4 MW 2.3 MW 5 MW
WHR Potential of a Model PlantA cement plant of kiln capacity of 2400 tpd with five stage preheater has been considered in thisstudy. The cement plant operates for 330 days. The temperature of the gas exiting the preheaterand cooler is approximately 300 °C and 290 °C respectively. The basic data and assumptions forestimating the WHR potential are shown in the table below (23).
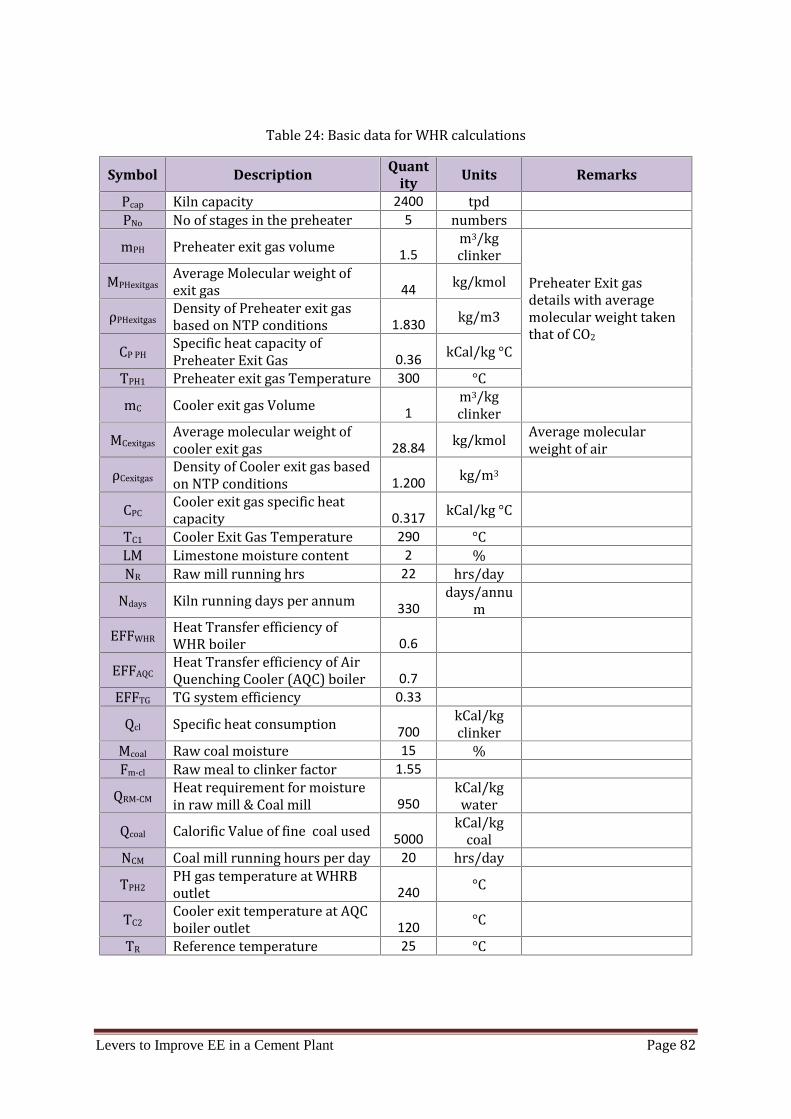
Levers to Improve EE in a Cement Plant Page 82
Table 24: Basic data for WHR calculationsSymbol Description Quant
ity Units RemarksPcap Kiln capacity 2400 tpdPNo No of stages in the preheater 5 numbersmPH Preheater exit gas volume 1.5m3/kgclinker Preheater Exit gasdetails with averagemolecular weight takenthat of CO2
MPHexitgas Average Molecular weight ofexit gas 44 kg/kmolρPHexitgas Density of Preheater exit gasbased on NTP conditions 1.830 kg/m3CP PH Specific heat capacity ofPreheater Exit Gas 0.36 kCal/kg °CTPH1 Preheater exit gas Temperature 300 °CmC Cooler exit gas Volume 1m3/kgclinkerMCexitgas Average molecular weight ofcooler exit gas 28.84 kg/kmol Average molecularweight of airρCexitgas Density of Cooler exit gas basedon NTP conditions 1.200 kg/m3CPC Cooler exit gas specific heatcapacity 0.317 kCal/kg °CTC1 Cooler Exit Gas Temperature 290 °CLM Limestone moisture content 2 %NR Raw mill running hrs 22 hrs/dayNdays Kiln running days per annum 330
days/annumEFFWHR Heat Transfer efficiency ofWHR boiler 0.6EFFAQC Heat Transfer efficiency of AirQuenching Cooler (AQC) boiler 0.7EFFTG TG system efficiency 0.33Qcl Specific heat consumption 700kCal/kgclinkerMcoal Raw coal moisture 15 %Fm-cl Raw meal to clinker factor 1.55QRM-CM Heat requirement for moisturein raw mill & Coal mill 950kCal/kgwaterQcoal Calorific Value of fine coal used 5000kCal/kgcoalNCM Coal mill running hours per day 20 hrs/dayTPH2 PH gas temperature at WHRBoutlet 240 °CTC2 Cooler exit temperature at AQCboiler outlet 120 °CTR Reference temperature 25 °C

Levers to Improve EE in a Cement Plant Page 83
Heat available from the preheater exhaust is given by mCpΔT where m represents mass of theexhaust gas, Cp is the heat capacity of the gas and ΔT represents temperature differencebetween the gas entering and leaving the WHR boiler. Similarly, heat available from the coolerexhaust is calculated. Total recoverable heat is calculated by multiplying the heat available fromWHR and Air Quenching Cooler (AQC) by their respective efficiencies and adding them. Thetotal recoverable heat multiplied by the corresponding kWh conversion factor and theefficiencies of the turbine and generator yields the power which could be recovered from thewaste heat and the cooler exhaust gases. The analysis finds that the estimated power generationfrom WHR plant is 3.1 MW. The following table describes parameters that are used inestimating WHR based power generation from PH and cooler exhaust gases.Table 25: Calculation for power generated from the WHR model plantSymbol Description Quantity UnitsQPH Heat available in the preheater gas 296.5 kCal/kg clinkerRMcap Raw mill capacity 1.69 kg/kg clinkerMRMflow Moisture flow rate in raw mill 3.45 Tonnes/hrMRMratio Moisture in raw mill per kg clinker 0.035 kg moisture/kg clinkerQRM Heat requirement for raw mill 32.78 kCal/kg clinkerSCC Specific Coal Consumption 0.14 kg coal/kg clinkerCMcap Coal Mill capacity 16.8 TPHMevap-CM Moisture evaporation in coal mill 2.97 TPHQCM Heat requirement for coal mill 28.17 kCal/kg clinkerQPHexcess Excess heat available for Preheater 235.54 kCal/kg clinkerQC Heat available in the cooler exit gas 110.28 kCal/kg clinkerQtotexcess Total excess or waste heat available 345.82 kCal/kg clinkerQWHRB Heat available from PH-WHR boiler 59.29 kCal/kg clinkerQAQC Heat available from the Air QuenchingCooler 64.65 kCal/kg clinkerQpower Recoverable heat in steam for powergeneration 80.83 kCal/kg clinkerQgeneration Power generation possible 3101.65 kW
ChallengesThere are several technical challenges in establishing WHR systems. Exhaust gas comprises ofdust which is abrasive and sticks to the PH boiler. The dust needs to be separated and collectedbefore sending it to WHR system. The 5-6 stage PH is located at high elevation and the WHRsystem is installed along with it. Thus the placement poses its own challenge both technical aswell as in its maintenance. Exhaust gas temperature not being high enough to producesuperheated steam, wide variation in temperature of the cooler gas and high installation costare some of the prominent barriers faced by plants in adopting WHR technology (24).7.3 BlendingClinker when mixed with fly ash/slag is called blended cement. Fly ash or blast furnace slagreplaces the amount of clinker that would be added to OPC grade cement. Blending leads to bothdecrease in the electrical and thermal energy consumption. It also helps in conserving limestoneand reduces release of greenhouse gas (GHG) emissions. Increasing the blending percentagedecreases the SEC of a plant. The following sections discuss the blending material in greaterdetail.
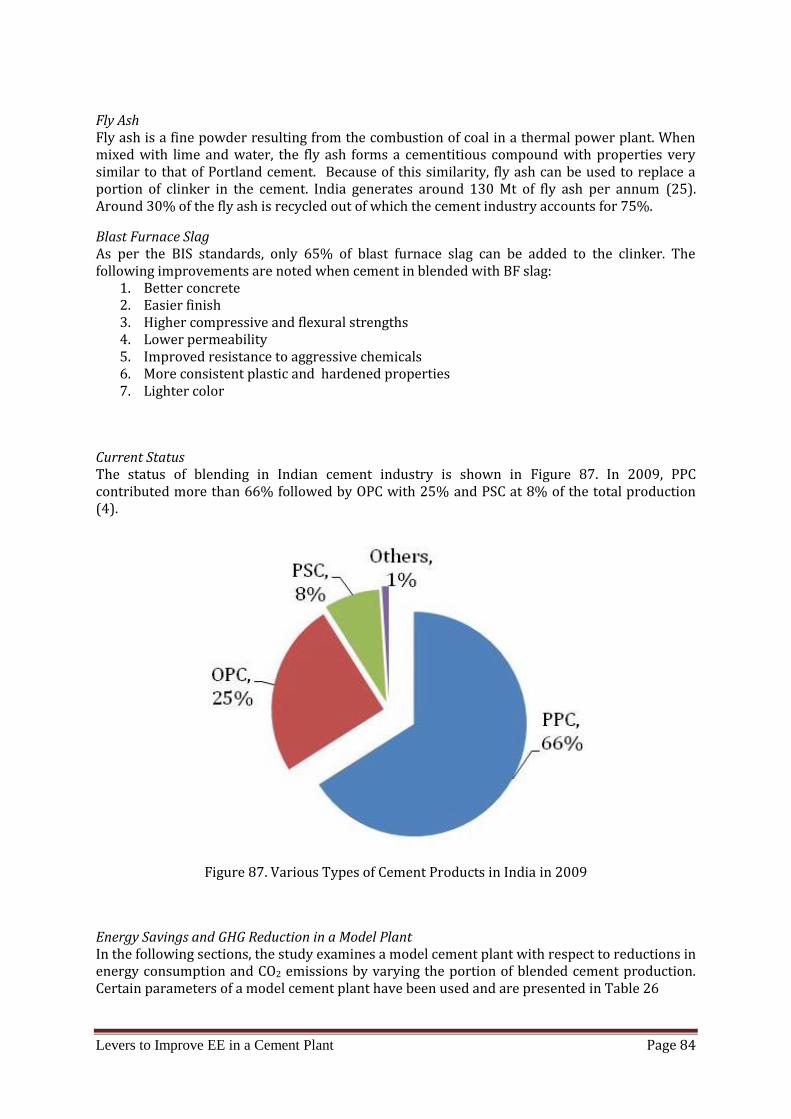
Levers to Improve EE in a Cement Plant Page 84
Fly AshFly ash is a fine powder resulting from the combustion of coal in a thermal power plant. Whenmixed with lime and water, the fly ash forms a cementitious compound with properties verysimilar to that of Portland cement. Because of this similarity, fly ash can be used to replace aportion of clinker in the cement. India generates around 130 Mt of fly ash per annum (25).Around 30% of the fly ash is recycled out of which the cement industry accounts for 75%.Blast Furnace SlagAs per the BIS standards, only 65% of blast furnace slag can be added to the clinker. Thefollowing improvements are noted when cement in blended with BF slag:1. Better concrete2. Easier finish3. Higher compressive and flexural strengths4. Lower permeability5. Improved resistance to aggressive chemicals6. More consistent plastic and hardened properties7. Lighter colorCurrent StatusThe status of blending in Indian cement industry is shown in Figure 87. In 2009, PPCcontributed more than 66% followed by OPC with 25% and PSC at 8% of the total production(4).
Figure 87. Various Types of Cement Products in India in 2009Energy Savings and GHG Reduction in a Model PlantIn the following sections, the study examines a model cement plant with respect to reductions inenergy consumption and CO2 emissions by varying the portion of blended cement production.Certain parameters of a model cement plant have been used and are presented in Table 26
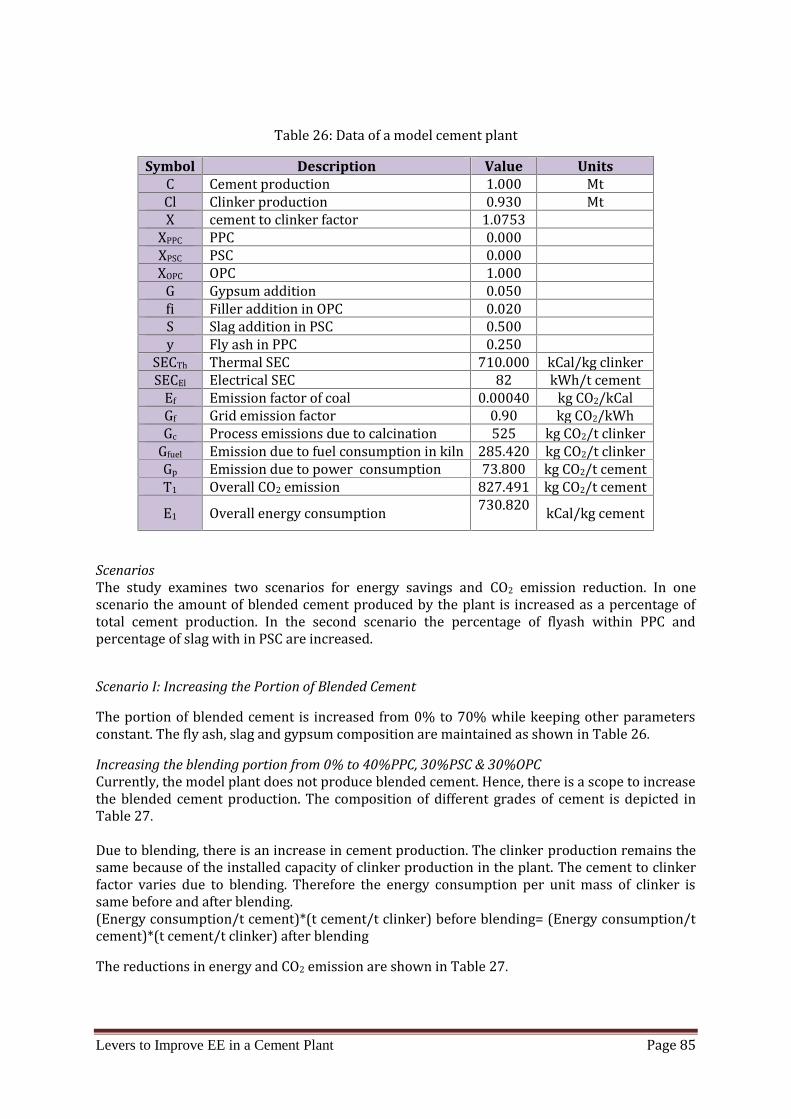
Levers to Improve EE in a Cement Plant Page 85
Table 26: Data of a model cement plantSymbol Description Value UnitsC Cement production 1.000 MtCl Clinker production 0.930 MtX cement to clinker factor 1.0753XPPC PPC 0.000XPSC PSC 0.000XOPC OPC 1.000G Gypsum addition 0.050fi Filler addition in OPC 0.020S Slag addition in PSC 0.500y Fly ash in PPC 0.250SECTh Thermal SEC 710.000 kCal/kg clinkerSECEl Electrical SEC 82 kWh/t cementEf Emission factor of coal 0.00040 kg CO2/kCalGf Grid emission factor 0.90 kg CO2/kWhGc Process emissions due to calcination 525 kg CO2/t clinkerGfuel Emission due to fuel consumption in kiln 285.420 kg CO2/t clinkerGp Emission due to power consumption 73.800 kg CO2/t cementT1 Overall CO2 emission 827.491 kg CO2/t cementE1 Overall energy consumption 730.820 kCal/kg cement
ScenariosThe study examines two scenarios for energy savings and CO2 emission reduction. In onescenario the amount of blended cement produced by the plant is increased as a percentage oftotal cement production. In the second scenario the percentage of flyash within PPC andpercentage of slag with in PSC are increased.Scenario I: Increasing the Portion of Blended CementThe portion of blended cement is increased from 0% to 70% while keeping other parametersconstant. The fly ash, slag and gypsum composition are maintained as shown in Table 26.Increasing the blending portion from 0% to 40%PPC, 30%PSC & 30%OPCCurrently, the model plant does not produce blended cement. Hence, there is a scope to increasethe blended cement production. The composition of different grades of cement is depicted inTable 27.Due to blending, there is an increase in cement production. The clinker production remains thesame because of the installed capacity of clinker production in the plant. The cement to clinkerfactor varies due to blending. Therefore the energy consumption per unit mass of clinker issame before and after blending.(Energy consumption/t cement)*(t cement/t clinker) before blending= (Energy consumption/tcement)*(t cement/t clinker) after blendingThe reductions in energy and CO2 emission are shown in Table 27.
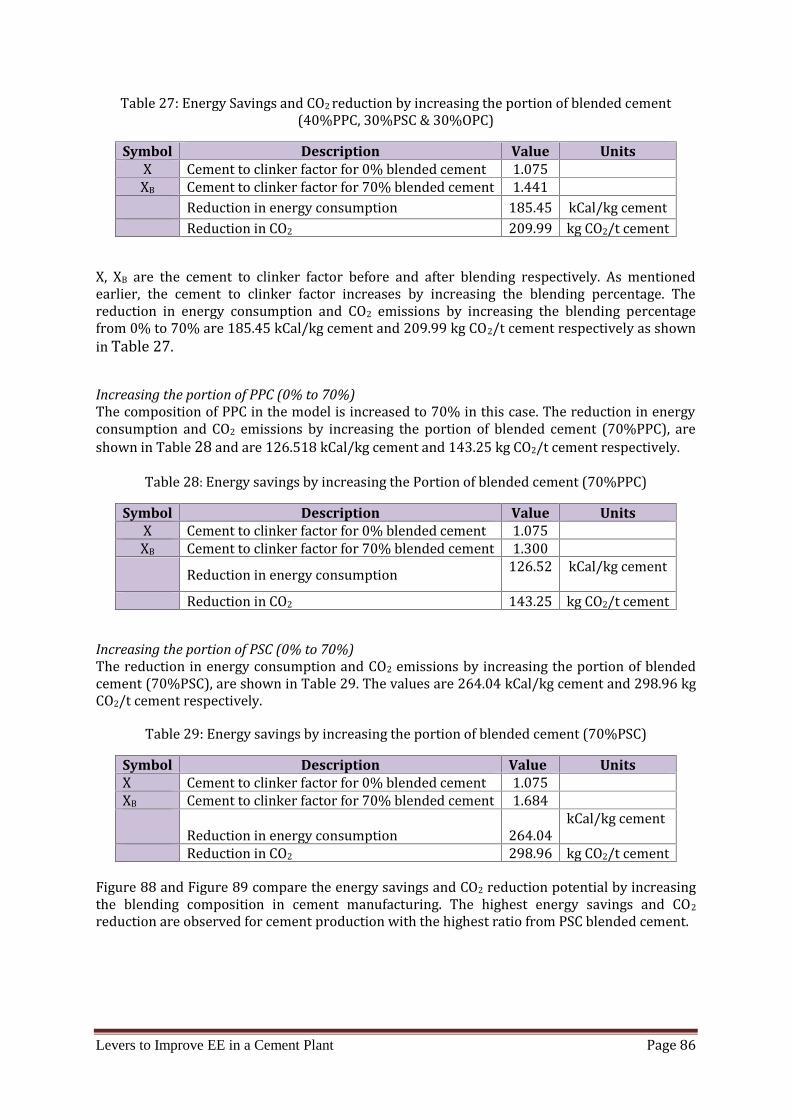
Levers to Improve EE in a Cement Plant Page 86
Table 27: Energy Savings and CO2 reduction by increasing the portion of blended cement(40%PPC, 30%PSC & 30%OPC)Symbol Description Value UnitsX Cement to clinker factor for 0% blended cement 1.075XB Cement to clinker factor for 70% blended cement 1.441Reduction in energy consumption 185.45 kCal/kg cementReduction in CO2 209.99 kg CO2/t cement
X, XB are the cement to clinker factor before and after blending respectively. As mentionedearlier, the cement to clinker factor increases by increasing the blending percentage. Thereduction in energy consumption and CO2 emissions by increasing the blending percentagefrom 0% to 70% are 185.45 kCal/kg cement and 209.99 kg CO2/t cement respectively as shownin Table 27.Increasing the portion of PPC (0% to 70%)The composition of PPC in the model is increased to 70% in this case. The reduction in energyconsumption and CO2 emissions by increasing the portion of blended cement (70%PPC), areshown in Table 28 and are 126.518 kCal/kg cement and 143.25 kg CO2/t cement respectively.Table 28: Energy savings by increasing the Portion of blended cement (70%PPC)
Symbol Description Value UnitsX Cement to clinker factor for 0% blended cement 1.075XB Cement to clinker factor for 70% blended cement 1.300Reduction in energy consumption 126.52 kCal/kg cementReduction in CO2 143.25 kg CO2/t cementIncreasing the portion of PSC (0% to 70%)The reduction in energy consumption and CO2 emissions by increasing the portion of blendedcement (70%PSC), are shown in Table 29. The values are 264.04 kCal/kg cement and 298.96 kgCO2/t cement respectively.Table 29: Energy savings by increasing the portion of blended cement (70%PSC)
Symbol Description Value UnitsX Cement to clinker factor for 0% blended cement 1.075XB Cement to clinker factor for 70% blended cement 1.684Reduction in energy consumption 264.04 kCal/kg cementReduction in CO2 298.96 kg CO2/t cementFigure 88 and Figure 89 compare the energy savings and CO2 reduction potential by increasingthe blending composition in cement manufacturing. The highest energy savings and CO2reduction are observed for cement production with the highest ratio from PSC blended cement.

Levers to Improve EE in a Cement Plant Page 87
Figure 88. Energy savings from different types of blended materials
Figure 89. CO2 reduction from different types of blended materialsScenario II: Increasing the Composition of Fly Ash and Slag in Cement
Increasing the composition of fly ash in PPC from 7% to 35%The portion of blended cement is 40% PPC, 30% PSC and 30% OPC. According to BIS, themaximum permissible fly ash percentage in PPC is 35(26). We have considered differentcompositions of fly ash in PPC and studied the variation of energy consumption and CO2reduction potential. Table 30 shows the variations in cement to clinker factor with respect to flyash composition in PPC. The cement to clinker factor increases with increase in fly ashcomposition.Levers to Improve EE in a Cement Plant Page 87
Figure 88. Energy savings from different types of blended materials
Figure 89. CO2 reduction from different types of blended materialsScenario II: Increasing the Composition of Fly Ash and Slag in Cement
Increasing the composition of fly ash in PPC from 7% to 35%The portion of blended cement is 40% PPC, 30% PSC and 30% OPC. According to BIS, themaximum permissible fly ash percentage in PPC is 35(26). We have considered differentcompositions of fly ash in PPC and studied the variation of energy consumption and CO2reduction potential. Table 30 shows the variations in cement to clinker factor with respect to flyash composition in PPC. The cement to clinker factor increases with increase in fly ashcomposition.
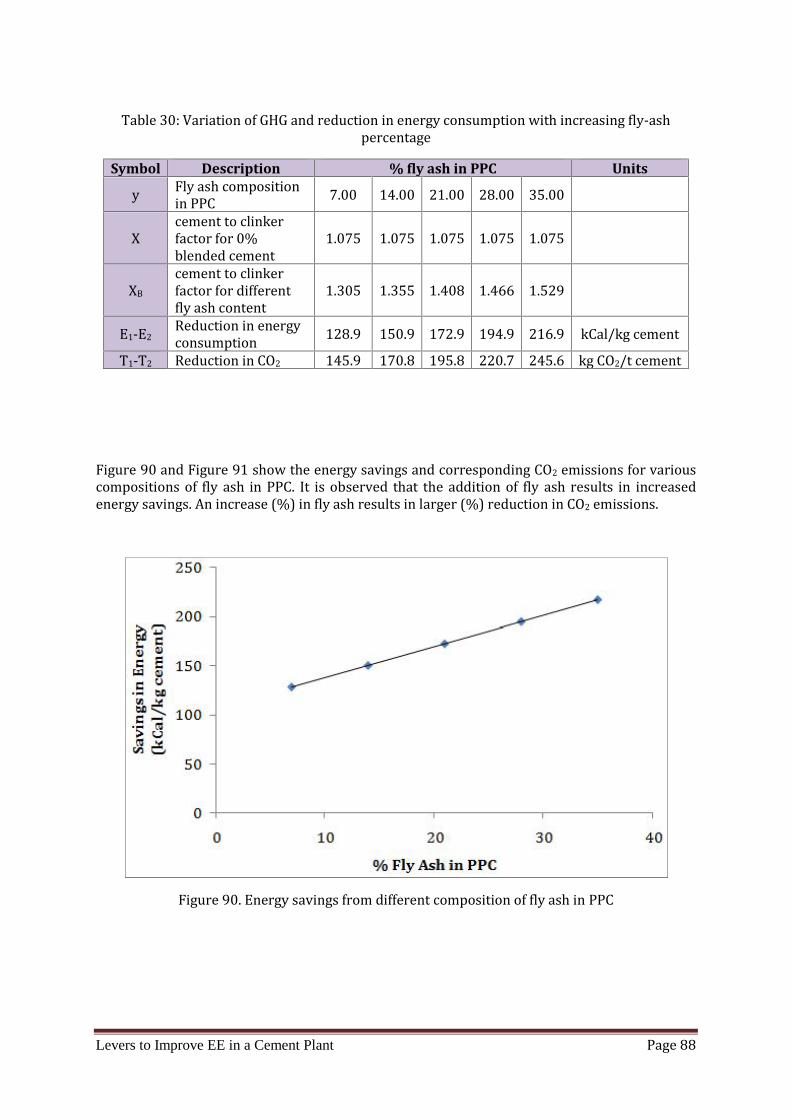
Levers to Improve EE in a Cement Plant Page 88
Table 30: Variation of GHG and reduction in energy consumption with increasing fly-ashpercentageSymbol Description % fly ash in PPC Unitsy Fly ash compositionin PPC 7.00 14.00 21.00 28.00 35.00
X cement to clinkerfactor for 0%blended cement 1.075 1.075 1.075 1.075 1.075XB cement to clinkerfactor for differentfly ash content 1.305 1.355 1.408 1.466 1.529
E1-E2 Reduction in energyconsumption 128.9 150.9 172.9 194.9 216.9 kCal/kg cementT1-T2 Reduction in CO2 145.9 170.8 195.8 220.7 245.6 kg CO2/t cement
Figure 90 and Figure 91 show the energy savings and corresponding CO2 emissions for variouscompositions of fly ash in PPC. It is observed that the addition of fly ash results in increasedenergy savings. An increase (%) in fly ash results in larger (%) reduction in CO2 emissions.
Figure 90. Energy savings from different composition of fly ash in PPC

Levers to Improve EE in a Cement Plant Page 89
Figure 91. CO2 reduction potential from different composition of fly-ash in PPCIncreasing the composition of slag in PSC from 10% to 50%According to a CII-GBC report, the slag percentage in PSC is in the range 25%-65% (20). Wehave considered different composition of slag in PSC and studied the variation of energyconsumption and CO2 reduction potential.Table 31 shows the variation in cement to clinker factor with respect to slag composition in PSC.The cement to clinker factor increases with increasing amounts of slag in PSC.
Table 31: Variation of GHG and reduction in energy consumption with increasing slagpercentageSymbol Description % Slag in PSC UnitsS Slag composition in PSC 10.00 20.00 30.00 40.00 50.00X Cement to clinker factor for0% blended cement 1.075 1.075 1.075 1.075 1.075XB Cement to clinker factor for70% blended cement 1.229 1.276 1.326 1.381 1.441E1-E2 Reduction in energyconsumption 91.16 114.73 138.31 161.88 185.46 kCal/kg cementT1-T2 Reduction in CO2 103.21 129.91 156.60 183.29 209.99 kg CO2/t cement
Figure 92 and Figure 93 show the energy savings and corresponding CO2 emissions for variouscompositions of slag in PSC. It is observed that the addition of slag results in energy savings andcorresponding emissions reduction.Levers to Improve EE in a Cement Plant Page 89
Figure 91. CO2 reduction potential from different composition of fly-ash in PPCIncreasing the composition of slag in PSC from 10% to 50%According to a CII-GBC report, the slag percentage in PSC is in the range 25%-65% (20). Wehave considered different composition of slag in PSC and studied the variation of energyconsumption and CO2 reduction potential.Table 31 shows the variation in cement to clinker factor with respect to slag composition in PSC.The cement to clinker factor increases with increasing amounts of slag in PSC.
Table 31: Variation of GHG and reduction in energy consumption with increasing slagpercentageSymbol Description % Slag in PSC UnitsS Slag composition in PSC 10.00 20.00 30.00 40.00 50.00X Cement to clinker factor for0% blended cement 1.075 1.075 1.075 1.075 1.075XB Cement to clinker factor for70% blended cement 1.229 1.276 1.326 1.381 1.441E1-E2 Reduction in energyconsumption 91.16 114.73 138.31 161.88 185.46 kCal/kg cementT1-T2 Reduction in CO2 103.21 129.91 156.60 183.29 209.99 kg CO2/t cement
Figure 92 and Figure 93 show the energy savings and corresponding CO2 emissions for variouscompositions of slag in PSC. It is observed that the addition of slag results in energy savings andcorresponding emissions reduction.
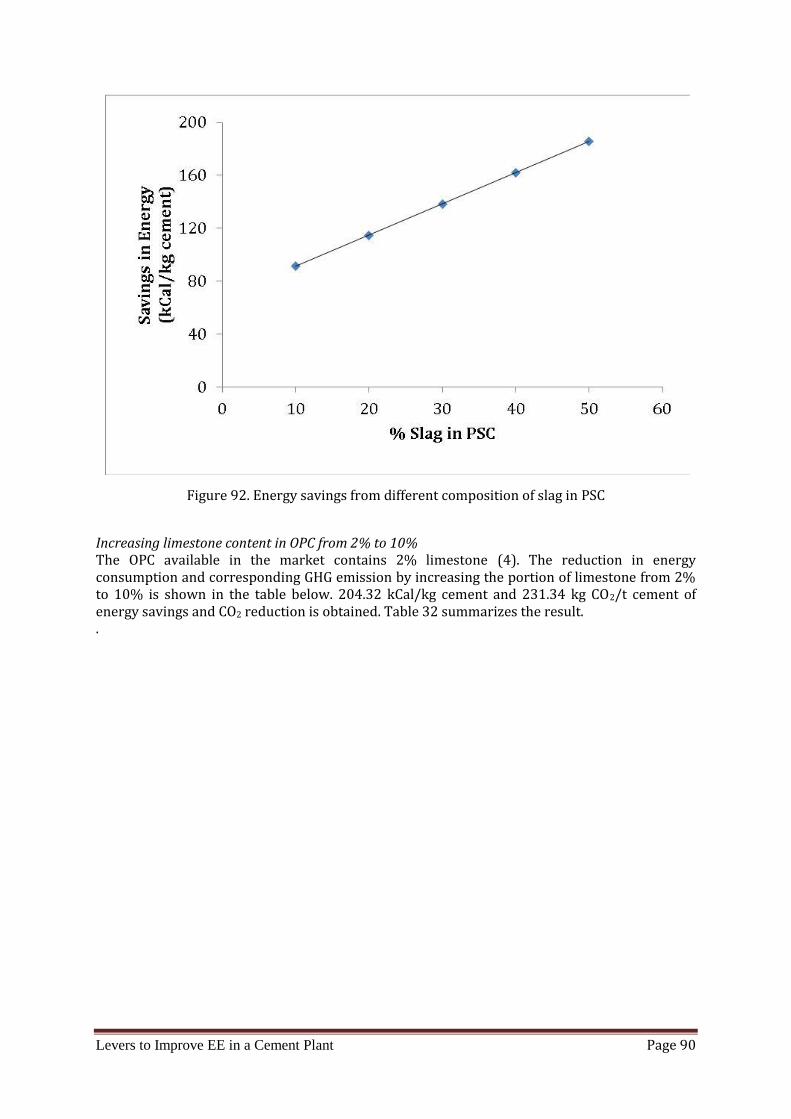
Levers to Improve EE in a Cement Plant Page 90
Figure 92. Energy savings from different composition of slag in PSCIncreasing limestone content in OPC from 2% to 10%The OPC available in the market contains 2% limestone (4). The reduction in energyconsumption and corresponding GHG emission by increasing the portion of limestone from 2%to 10% is shown in the table below. 204.32 kCal/kg cement and 231.34 kg CO2/t cement ofenergy savings and CO2 reduction is obtained. Table 32 summarizes the result..
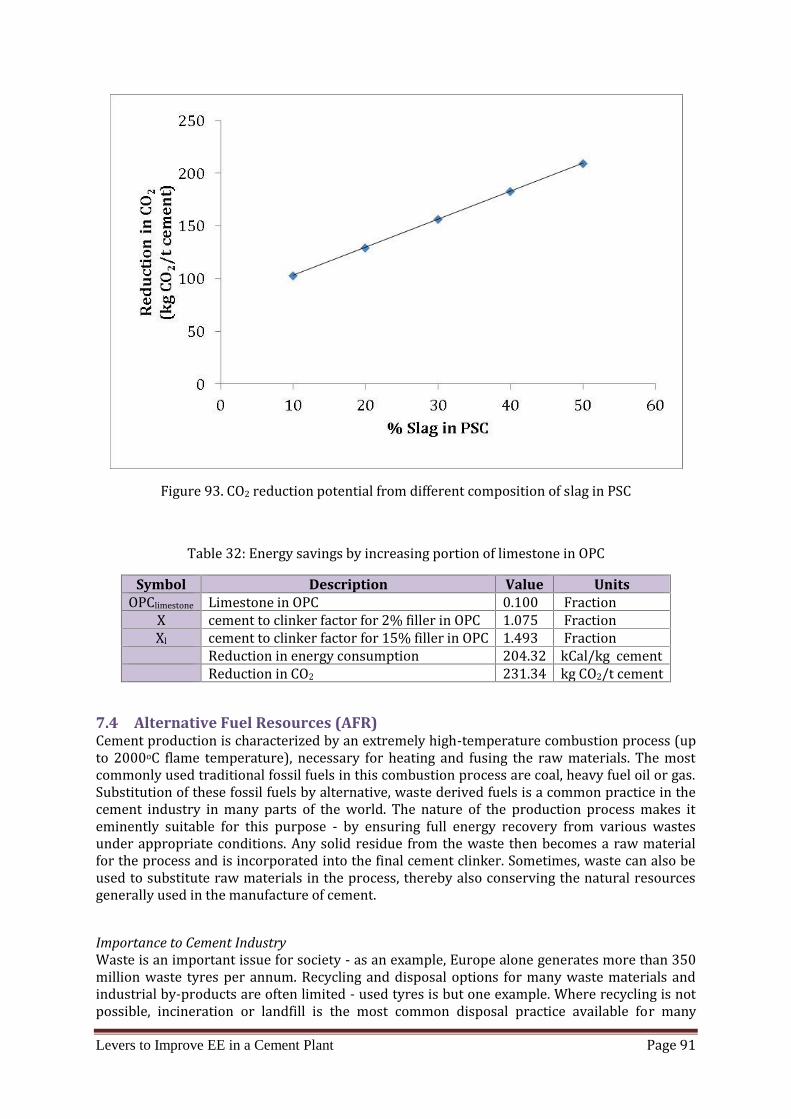
Levers to Improve EE in a Cement Plant Page 91
Figure 93. CO2 reduction potential from different composition of slag in PSCTable 32: Energy savings by increasing portion of limestone in OPC
Symbol Description Value UnitsOPClimestone Limestone in OPC 0.100 FractionX cement to clinker factor for 2% filler in OPC 1.075 FractionXl cement to clinker factor for 15% filler in OPC 1.493 FractionReduction in energy consumption 204.32 kCal/kg cementReduction in CO2 231.34 kg CO2/t cement7.4 Alternative Fuel Resources (AFR)Cement production is characterized by an extremely high-temperature combustion process (upto 2000oC flame temperature), necessary for heating and fusing the raw materials. The mostcommonly used traditional fossil fuels in this combustion process are coal, heavy fuel oil or gas.Substitution of these fossil fuels by alternative, waste derived fuels is a common practice in thecement industry in many parts of the world. The nature of the production process makes iteminently suitable for this purpose - by ensuring full energy recovery from various wastesunder appropriate conditions. Any solid residue from the waste then becomes a raw materialfor the process and is incorporated into the final cement clinker. Sometimes, waste can also beused to substitute raw materials in the process, thereby also conserving the natural resourcesgenerally used in the manufacture of cement.Importance to Cement IndustryWaste is an important issue for society - as an example, Europe alone generates more than 350million waste tyres per annum. Recycling and disposal options for many waste materials andindustrial by-products are often limited - used tyres is but one example. Where recycling is notpossible, incineration or landfill is the most common disposal practice available for many

Levers to Improve EE in a Cement Plant Page 92
wastes. However, by using waste as an alternative fuel or raw material in the cement-makingprocess, there are benefits for society as well as the cement maker. For any cement industry itrepresents an attractive business opportunity because it reduces fuel costs and CO2 emissions.By dealing safely with wastes that are often difficult to dispose of in any other way, we aretrying to provide an important service to society.Key Challenges and MotivationThe key challenge facing the cement-making industry is the efficient use of natural resources.Cement industry should therefore be committed to using secondary materials (waste andindustrial by-products) in place of natural resources wherever possible. However, this strategyis not without its challenges. Not every waste is suitable. In addition, one should ensure thatusing a particular waste does not increase the atmospheric emissions, nor impact productquality. At the same time, a key objective of AFR use is to achieve reductions in CO2 emissions.Meanwhile, stakeholder debate continues over the use of AFR in cement kilns. Somestakeholders are concerned about potential health or environmental impacts from the handlingand combustion of alternative fuels. Others are concerned that product quality could becompromised. It has also been claimed that the use of waste and by-products as fuels actuallyperpetuates the production of these wastes, by offering a legal, cost-efficient solution todisposal. However, other stakeholders are pleased by the dual possibilities of cutting GHGemissions and disposing of wastes by using AFR. It is therefore a challenge for regulatoryauthorities to manage stakeholder expectations and provide assurances to demonstrate the useof waste materials (27).Alternate Raw Materials (ARM)The waste materials which are used in cement manufacturing or as a substitute for clinker areoften referred as Alternate Raw Materials (ARM). This practice benefits both cement industryand society, since it reduces operating costs as well as CO2 emissions. In some cases, cementcompanies can earn revenues through waste recovery services.ARM can be used to replace the traditional raw materials extracted from quarries, such as clay,shale and limestone. Examples of ARMs include contaminated soils, wastes from cleaning roads,wastes from iron, aluminum production, coal ash, blast furnace slag and sewage sludge. Thechemical suitability of ARM is important to ensure that they provide the necessary constituentsin the formation of clinker (28).Such a practice provides numerous benefits including a receded need for quarrying and animproved environmental footprint of such activities. Substitution for clinker in cement will bean example of the positive contribution to Indian cement industry both in terms of resourcemanagement and environmental impact (28).Classification and ConstituentsRaw materials applicable in cement manufacture are mainly substances found in nature, such aslimestone, lime marl, clay, sand, or calcium sulfate. Alternative raw materials having SiO2, Al2O3,Fe2O3, and/or CaO as their main constituents can be combined with natural raw materials insuch a way that they comply with the requirements, both for clinker quality and environmentalprotection, and operational reliability, if their distribution is homogeneous. The demand foralternative materials primarily depends on the prevalence of raw material. The decisive factor isthe quality of the extractable deposits of limestone and lime marl, respectively. The materialsused include several substances of the calcium group and corrective materials, such as ironoxide agents or substances providing sulfur and fluorine, respectively. Table 33 shows thepossible alternative raw materials according to their constituents.

Levers to Improve EE in a Cement Plant Page 93
Table 33: Group classification of alternative raw materials with examples for individualmaterials(29)Ca-Group Industrial limeLime sludgeSi-Group Used foundry sandFe-Group Roaster pyriteSynthetic haematiteRed mudSi-Al-Ca-Group Fly ashSlagCrushed sandS-Group Gypsum from flue gas desulfurizationChemical gypsumF-Group CaF2 filter mudCase StudyMadras Aluminum Company (MALCO) has identified a breakthrough technology of using redmud as one of the raw materials in the cement manufacturing. Red mud as by product isgenerated out of Bayer’s process for alumina production from bauxite ore. The solid waste iscurrently dumped as in the back yard of alumina refinery. Presence of alumina and iron oxide inred mud compensates for the deficiency of the same components in limestone. One of thequalities that makes red mud special is the presence of soda in which when used in clinkerproduction neutralizes the sulfur content in pet coke which is used for burning clinker and addsto the cement’s setting characteristics(30).The following is the composition of the Dry Red Mud used in cement manufacturing.Table 34: Composition of red mud from MALCO and its properties
Component Weight(%) In Limestone (%) In Gypsum (%) In Fly Ash (%)Al2O3 20-22 13.5 2 60Fe2O3 40-45 1.5 27SiO2 12-15 1.0 8TiO2 1.8-2.0 47.0 2 2.5CaO 1.0-2.0 0.5 0.5Na2O 4-5 36.5 2.5CaSO4.2H2O 96
A comparison of composition of the MALCO Red Mud and the Low Grade Bauxite (LGB) from itsmines are shown in Table 35. From this, it is evident that red mud can be used as a substitute forLGB Bauxite in Cement production, but in varying ratios.Table 35: Comparison of constituents of red mud and low grade bauxiteComponent Red Mud % In LGB %Al2O3 20-22 <30Fe2O3 40-45 >35SiO2 10-12 10-25The cement industry uses pet coke for burning clinker in the rotary kilns. Pet coke containssulfur of about 3% found to react with the residual soda (contained in Red Mud). The reaction

Levers to Improve EE in a Cement Plant Page 94
leads to the formation of sodium sulfide which enables the setting characteristics of cement. Theproperty of cement comprising red mud and without red mud is shown in Table 36.Table 36: Properties of cement produced without red mud and with red mudParameters of
Cement
Specification asper BIS
43 GradeOPC
CementProduced
without RedMud
CementProduced with
Red MudCompressivestrength at 28 days Min: 43 MPa 59.8 MPa 59.9 MPaFineness Min: 225 m2/kg 310 m2/kg 310 m2/kgSetting Time Min: 30 minsMax: 600 mins 120 mins190 mins 110 mins180 MinsInitialFinalIt can be seen from the table that the Red Mud does not affect the cement properties; itimproves the cement quality by reducing the setting time (15). Some other benefits of using redmud are as follows: Raw mix cost is reduced by Rs 10/t, since the cost of red mud is half of bauxite Red mud could increase the alkali content by 0.28% in the raw mix Titania contained in the bauxite is supposed to produce clinker with less hydraulicproperties resulting in long setting cement. By eliminating the usage of bauxite, theTitania intake to the clinker is reduced yielding high hydraulic clinker.
Limitations of Alternate fuels and Raw MaterialsAlthough, technically cement kilns could use up to 100% of alternative fuels or use greateramount alternate raw materials to increase productivity, there are some practical limitations.The physical and chemical properties of most alternative fuels and raw materials differsignificantly from those of conventional fuels and materials. These are related to low calorificvalue, high moisture content, or high concentration of chlorine or other trace substances. Forexample, volatile metals (e.g., mercury, cadmium, and thallium) must be managed carefully, andproper removal of cement kiln dust from the system is necessary. This means pre-treatment isoften needed to ensure more uniform composition and optimum combustion. However, theachievement of higher substitution rates has stronger political and legal barriers than technicalones: Waste management legislation significantly impacts availability. Higher fuel substitutiononly takes place if local or regional waste legislation restricts land-filling or dedicatedincineration, and allows controlled waste collection and treatment of alternative fuels. Local waste collection networks must be adequate. Alternative fuel costs are likely to increase with high CO2 costs. It may then becomeincreasingly difficult for the cement industry to source significant quantities of biomassat acceptable prices. Level of social acceptance of co-processing waste fuels in cement plants can stronglyaffect local uptake. People are often concerned about harmful emissions from co-processing, even though emissions levels from well-managed cement plants are thesame with or without alternative fuel use. In addition, alternative fuel use has thepotential to increase thermal energy consumption, for example when pre-treatment isrequired as outlined above(29).
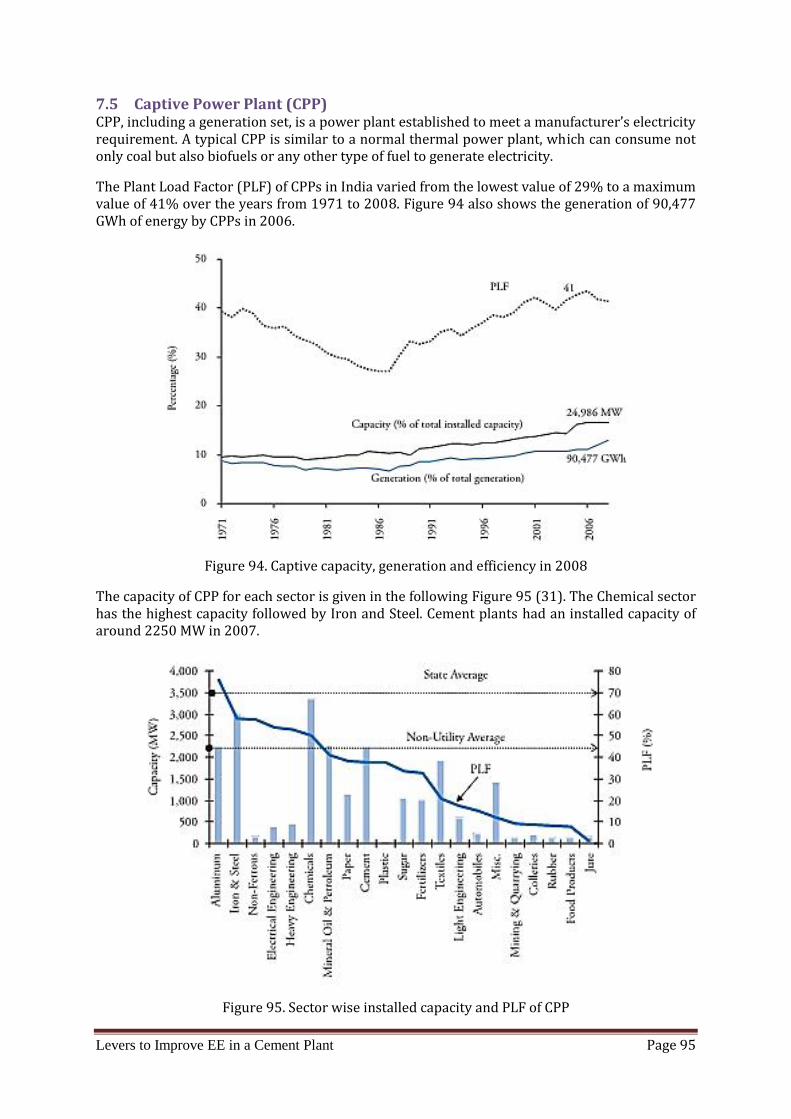
Levers to Improve EE in a Cement Plant Page 95
7.5 Captive Power Plant (CPP)CPP, including a generation set, is a power plant established to meet a manufacturer’s electricityrequirement. A typical CPP is similar to a normal thermal power plant, which can consume notonly coal but also biofuels or any other type of fuel to generate electricity.The Plant Load Factor (PLF) of CPPs in India varied from the lowest value of 29% to a maximumvalue of 41% over the years from 1971 to 2008. Figure 94 also shows the generation of 90,477GWh of energy by CPPs in 2006.
Figure 94. Captive capacity, generation and efficiency in 2008The capacity of CPP for each sector is given in the following Figure 95 (31). The Chemical sectorhas the highest capacity followed by Iron and Steel. Cement plants had an installed capacity ofaround 2250 MW in 2007.
Figure 95. Sector wise installed capacity and PLF of CPP
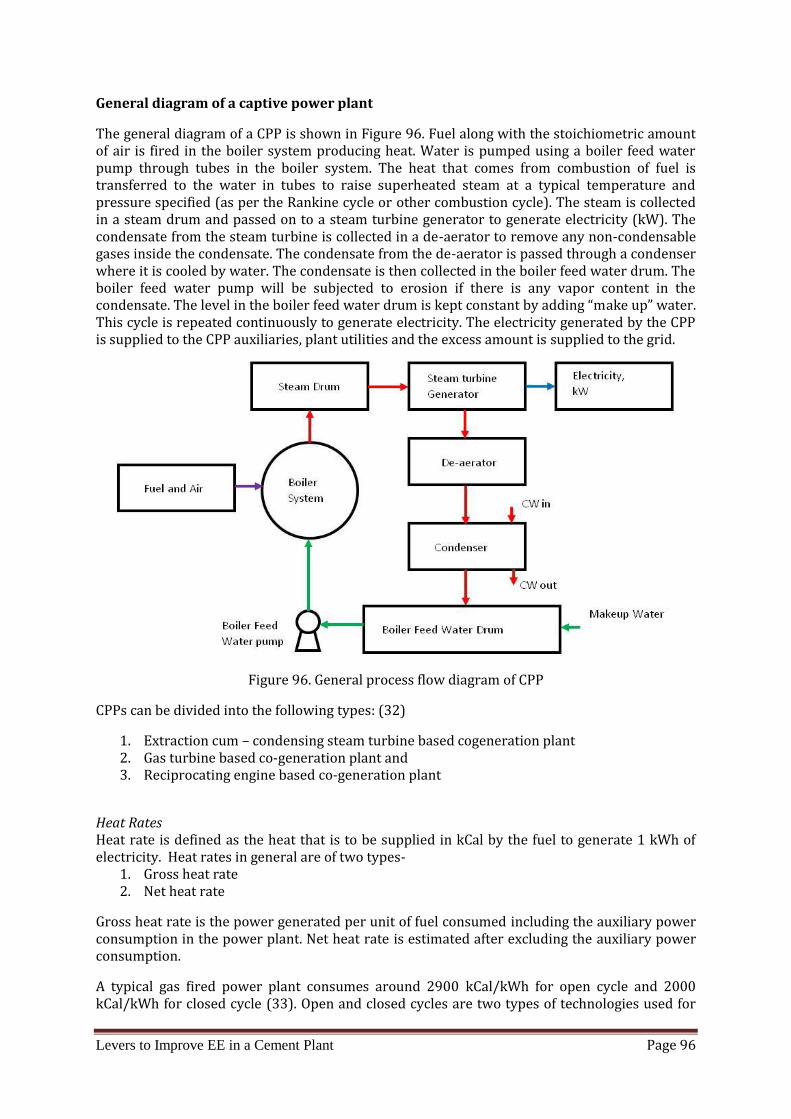
Levers to Improve EE in a Cement Plant Page 96
General diagram of a captive power plantThe general diagram of a CPP is shown in Figure 96. Fuel along with the stoichiometric amountof air is fired in the boiler system producing heat. Water is pumped using a boiler feed waterpump through tubes in the boiler system. The heat that comes from combustion of fuel istransferred to the water in tubes to raise superheated steam at a typical temperature andpressure specified (as per the Rankine cycle or other combustion cycle). The steam is collectedin a steam drum and passed on to a steam turbine generator to generate electricity (kW). Thecondensate from the steam turbine is collected in a de-aerator to remove any non-condensablegases inside the condensate. The condensate from the de-aerator is passed through a condenserwhere it is cooled by water. The condensate is then collected in the boiler feed water drum. Theboiler feed water pump will be subjected to erosion if there is any vapor content in thecondensate. The level in the boiler feed water drum is kept constant by adding “make up” water.This cycle is repeated continuously to generate electricity. The electricity generated by the CPPis supplied to the CPP auxiliaries, plant utilities and the excess amount is supplied to the grid.
Figure 96. General process flow diagram of CPPCPPs can be divided into the following types: (32)1. Extraction cum – condensing steam turbine based cogeneration plant2. Gas turbine based co-generation plant and3. Reciprocating engine based co-generation plantHeat RatesHeat rate is defined as the heat that is to be supplied in kCal by the fuel to generate 1 kWh ofelectricity. Heat rates in general are of two types-1. Gross heat rate2. Net heat rateGross heat rate is the power generated per unit of fuel consumed including the auxiliary powerconsumption in the power plant. Net heat rate is estimated after excluding the auxiliary powerconsumption.A typical gas fired power plant consumes around 2900 kCal/kWh for open cycle and 2000kCal/kWh for closed cycle (33). Open and closed cycles are two types of technologies used for
Levers to Improve EE in a Cement Plant Page 97
power generation. A typical coal or lignite based thermal power plant has an operating stationheat rate of 2861 kCal/kWh (33).The primary factors affecting heat rate are as follows:1. Depending upon the quality of fuel used, deposits are formed on the external surface ofthe tubes inside the boiler. The deposits lead to the increase of resistance to heattransfer between the products of combustion and water flowing inside the tubes. Thisleads to a decrease in boiler efficiency.2. The quality of water used is very critical. If the water quality varies from thespecifications, it will result in the formation of scales on the inner surface of the tubes.These scales result in the increase of resistance to heat transfer, which ultimatelyreduces boiler efficiency.The heat rate of thermal power plant is also defined as follows: (34)Gross heat rate = Gross Turbine heat rateBoilerThe following explanation is applicable for a power plant with a rated capacity of 250 MW. Forevery 1°C temperature drop in steam from the designed value of 537°C, the increase in the heatrate will be 0.67 kCal/kWh. Every 1 kg/cm2 drop in steam pressure (design pressure150kg/cm2) at the turbine inlet results in a loss of 1.31 kCal/kWh.The following are the few measures for heat rate reduction (35)1. Modification in steam turbines such as replacement of rotors, blades, nozzles, seals andinner and outer casings.2. Modification in boilers3. Control systems (digital, online performance monitoring, etc.)4. Variable Frequency Drive (VFD) motors on all major rotating equipment (usuallyimproves efficiencies at partial load).Heat Rate Reduction – Case Studies
Case 1The heat rate reduction was studied for the case of a 250 MW Pulverized Coal plant. Thefollowing are the measures taken for the improvement in the heat rate (35)1. A decrease in the excess O2 concentration involving neural network system withcombustion control module led to a heat rate reduction of 6.3 kCal/kWh.2. Reducing the flue gas temperature to the design value by installing new air heater withadditional surface area reduced the heat rate by 23.18 kCal/kWh.3. Changes in the steam turbine with a new rotor and stationary blades will result in anincrease of 2-3 MW power by High Pressure (HP) cylinder, 2–3 MW for the Intermediatepressure (IP) cylinder and 1–2 MW for the Low Pressure cylinder. The reduction in heatrate is expected to be around 64.26 kCal/kWh.4. Reducing steam leakage between shaft and casing results in a heat rate reduction of 3.78kCal/kWh.5. Improvement in steam condenser by installing new stainless steel tubing heatexchanger with an online cleaning system, to reduce degradation on the surface of thesteam condenser.6. Changing the boiler feed water pump to steam driven results in the reduction of heatrate by 9.32 kCal/kWh.

Levers to Improve EE in a Cement Plant Page 98
Case 2In this case, the reduction in heat rate is studied for a CPP with a rated capacity of 850 MW (35).The following improvements are observed:1. Overhaul of the steam turbine to reduce leakage and solid particle erosion resulted in aheat rate reduction of 9.57 kCal/kWh.2. Air leakage at the primary air heater was arrested resulting in a heat rate reduction of5.29 kCal/kWh.3. Optimization of combustion by reducing excess O2 by 2.3% resulted in a heat ratereduction of 16.32 kCal/kWh.Energy savings in auxiliary power consumptionThe following are the measures for optimization of auxiliary power consumption (36):
ID Fans can be provided with VFD and speed can be varied according to the furnacedraft auto logic. The suction & delivery damper need to be kept in open condition. Chimney height optimized to reduce the load on Induced Draft (ID) fan Forced draft fan can be provided with VFD and speed can be varied according to thewind box pressure and oxygen level in flue gas auto combustion logic. The suctionand delivery damper needs to be kept in open condition Primary Air (PA) fan can be provided with VFD and operated manually Air Cooled Condenser (ACC) fan can be provided with VFD and operated manuallyThe following are the key areas for the reduction of power consumption (36)1. Boiler feed water pump2. Condensate extraction pump3. Air cooled condenser fan4. Boiler primary air fan5. Auxiliary cooling water pump6. Cooling tower fan7. Hot well pump and8. Air compressorIn the following sections initial conditions of the components are mentioned and then thechanges in performance after implementing an energy efficiency measure have been described.
Boiler Feed Water PumpInitially, the operating conditions of the boiler feed water pump (BFP) (36) were as follows:1. BFP was running at 100% capacity and the control station maintained the water flow tothe drum level.2. Pressure drop across the control valve was 40 kg/cm² and valve was kept opened 25%to 30%.The modifications that were done for BFP to reduce the energy consumption are: Speed was reduced using VFD to auto mode with closed loop control Pressure drop across the valve was reduced to 10 kg/cm2 and the valve opening wasmaintained at 50 – 55% The BFP discharge pressure is to be kept 9.75 kg/cm2 more than the drum pressure
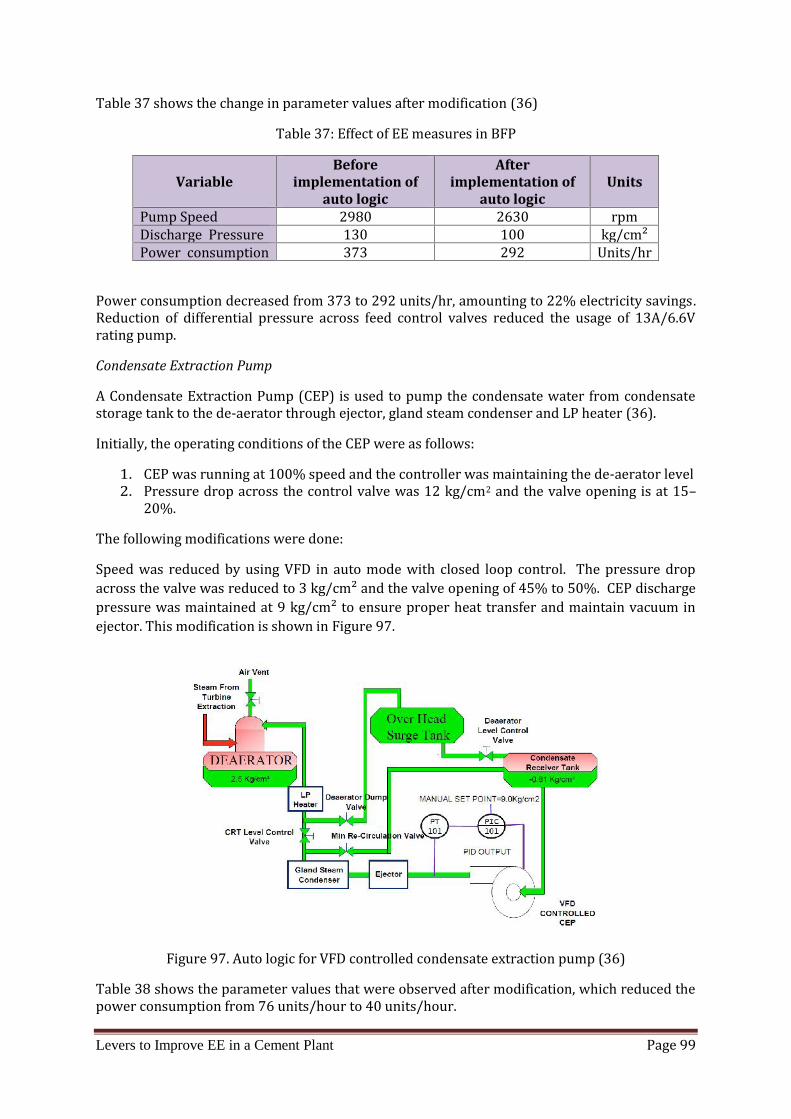
Levers to Improve EE in a Cement Plant Page 99
Table 37 shows the change in parameter values after modification (36)Table 37: Effect of EE measures in BFPVariable
Beforeimplementation of
auto logic
Afterimplementation of
auto logicUnitsPump Speed 2980 2630 rpmDischarge Pressure 130 100 kg/cm²Power consumption 373 292 Units/hr
Power consumption decreased from 373 to 292 units/hr, amounting to 22% electricity savings.Reduction of differential pressure across feed control valves reduced the usage of 13A/6.6Vrating pump.Condensate Extraction PumpA Condensate Extraction Pump (CEP) is used to pump the condensate water from condensatestorage tank to the de-aerator through ejector, gland steam condenser and LP heater (36).Initially, the operating conditions of the CEP were as follows:1. CEP was running at 100% speed and the controller was maintaining the de-aerator level2. Pressure drop across the control valve was 12 kg/cm2 and the valve opening is at 15–20%.The following modifications were done:Speed was reduced by using VFD in auto mode with closed loop control. The pressure dropacross the valve was reduced to 3 kg/cm² and the valve opening of 45% to 50%. CEP dischargepressure was maintained at 9 kg/cm² to ensure proper heat transfer and maintain vacuum inejector. This modification is shown in Figure 97.
Figure 97. Auto logic for VFD controlled condensate extraction pump (36)Table 38 shows the parameter values that were observed after modification, which reduced thepower consumption from 76 units/hour to 40 units/hour.
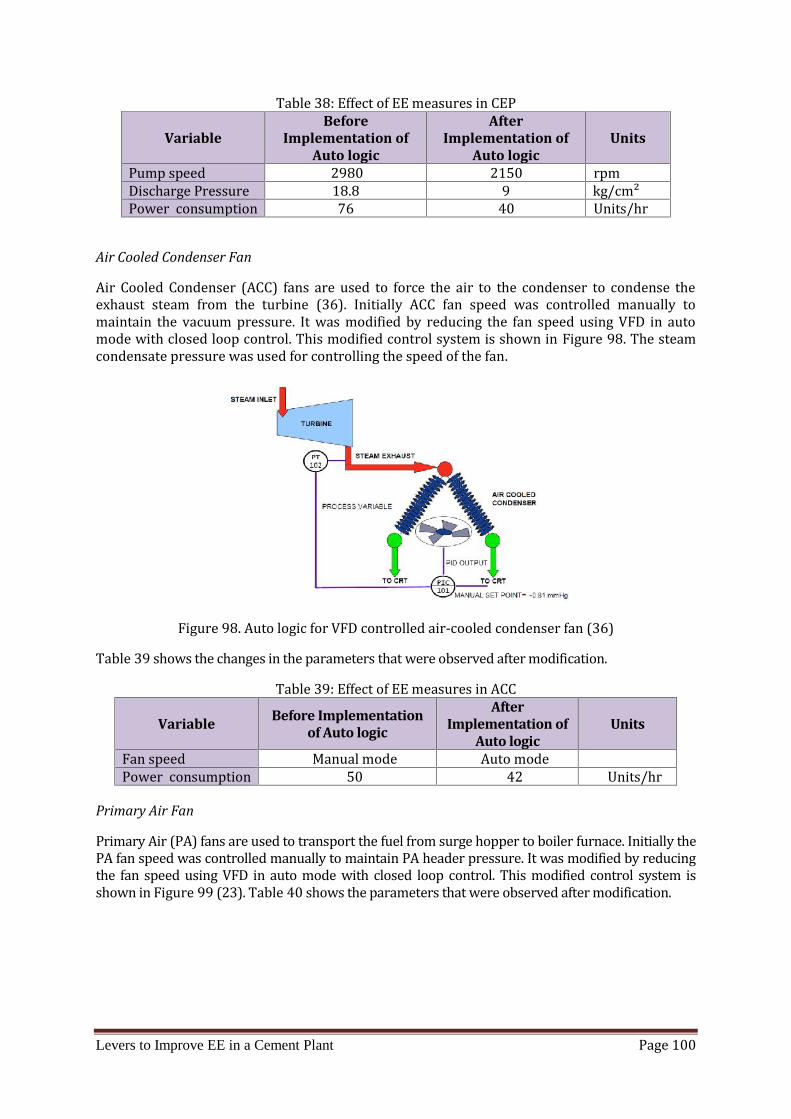
Levers to Improve EE in a Cement Plant Page 100
Table 38: Effect of EE measures in CEPVariable
BeforeImplementation of
Auto logic
AfterImplementation of
Auto logicUnitsPump speed 2980 2150 rpmDischarge Pressure 18.8 9 kg/cm²Power consumption 76 40 Units/hr
Air Cooled Condenser FanAir Cooled Condenser (ACC) fans are used to force the air to the condenser to condense theexhaust steam from the turbine (36). Initially ACC fan speed was controlled manually tomaintain the vacuum pressure. It was modified by reducing the fan speed using VFD in automode with closed loop control. This modified control system is shown in Figure 98. The steamcondensate pressure was used for controlling the speed of the fan.
Figure 98. Auto logic for VFD controlled air-cooled condenser fan (36)Table 39 shows the changes in the parameters that were observed after modification.Table 39: Effect of EE measures in ACCVariable Before Implementation
of Auto logic
AfterImplementation of
Auto logicUnitsFan speed Manual mode Auto modePower consumption 50 42 Units/hr
Primary Air FanPrimary Air (PA) fans are used to transport the fuel from surge hopper to boiler furnace. Initially thePA fan speed was controlled manually to maintain PA header pressure. It was modified by reducingthe fan speed using VFD in auto mode with closed loop control. This modified control system isshown in Figure 99 (23). Table 40 shows the parameters that were observed after modification.

Levers to Improve EE in a Cement Plant Page 101
Figure 99. Auto logic for VFD controlled primary air fan (36)Table 40: Effect of EE measures in primary air fanVariable
BeforeImplementation of
Auto logic
AfterImplementation of
Auto logic UnitsFan speed Manual mode Auto modePower consumption 55 51 Units/hrAuxiliary Cooling Water PumpAuxiliary cooling water (ACW) pump is used to pump the cooling water to turbine oil cooler,generator air cooler and BFP pump-bearing cooler (36). Initially the pump was operated at 100%capacity and header pressure was maintained by regulating the discharge manual control valve. Itwas modified by reducing the pump speed using VFD. This modified control system is shown inFigure 100. The header pressure of the cooling water pipes of generator and lube oil cooler is usedto control the speed of the VFD in Figure 100.
Figure 100. Control system of the auxiliary cooler water Pump (36)Table 41 shows the parameters that were observed after modification. From this table, it isobserved that almost 50% of the energy consumption is saved after implementing the controlsystem of auto logic.

Levers to Improve EE in a Cement Plant Page 102
Table 41: Effect of EE measures in auxiliary cooling water pumpVariable
Before Implementation ofAuto logic
After Implementation ofAuto logic UnitsPump speed 1480 1180 rpmDischarge Pressure 5 3 kg/cm²Power consumption 48 24 Units/hr
Cooling Tower FanCooling tower fan is used to extract vapor from the cooling water (36). Initially there is nolinkage between the return header water temperature and the cooling tower fan. This wasmodified by starting and stopping of cooling tower fan depending upon the header watertemperature. This control system is indicated in Figure 101. The control system works bysensing the return water header temperature and then comparing with higher and lowertemperature values. If the temperature is within the range, the fan will be in operating mode.The higher and lower temperatures are indicated as HH and LL in Figure 101. If thetemperature is more than HH, then the fan starts and stops if the temperature is lower than LLas there is no need to further decrease the temperature of water coming from the return header.
Figure 101. Control system of the cooling tower fan (36)Table 42 shows the effect of the modification.Table 42: Effect of EE measures in cooling tower fanVariable Before Implementation
of Auto logicAfter Implementationof Auto logic UnitsPower consumption 5 5 Units/hrRunning hours 24 14 hrs/dayTotal power consumption 120 70 Units/day
Hot Well PumpA hot well pump is used to pump the low pressure (LP) heater condensate and turbine drains tocondensate storage tank (36). The hot well pump runs continuously and the hot well level iscontrolled by the valve. It was modified by opening the control valve completely and then the pump
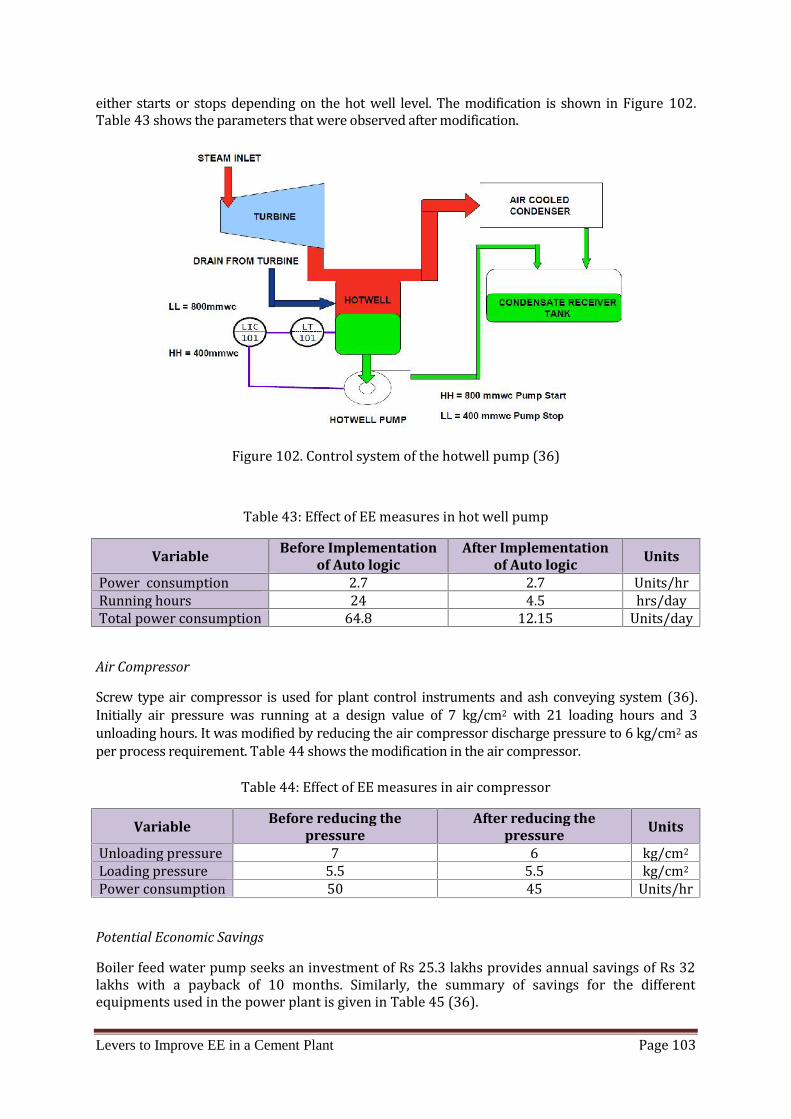
Levers to Improve EE in a Cement Plant Page 103
either starts or stops depending on the hot well level. The modification is shown in Figure 102.Table 43 shows the parameters that were observed after modification.
Figure 102. Control system of the hotwell pump (36)Table 43: Effect of EE measures in hot well pump
Variable Before Implementationof Auto logic
After Implementationof Auto logic UnitsPower consumption 2.7 2.7 Units/hrRunning hours 24 4.5 hrs/dayTotal power consumption 64.8 12.15 Units/day
Air CompressorScrew type air compressor is used for plant control instruments and ash conveying system (36).Initially air pressure was running at a design value of 7 kg/cm2 with 21 loading hours and 3unloading hours. It was modified by reducing the air compressor discharge pressure to 6 kg/cm2 asper process requirement. Table 44 shows the modification in the air compressor.Table 44: Effect of EE measures in air compressorVariable Before reducing the
pressureAfter reducing the
pressure UnitsUnloading pressure 7 6 kg/cm2Loading pressure 5.5 5.5 kg/cm2Power consumption 50 45 Units/hrPotential Economic SavingsBoiler feed water pump seeks an investment of Rs 25.3 lakhs provides annual savings of Rs 32lakhs with a payback of 10 months. Similarly, the summary of savings for the differentequipments used in the power plant is given in Table 45 (36).

Levers to Improve EE in a Cement Plant Page 104
Table 45: Energy and rupees savings after implementing EE measures in CPP’s auxiliarysystemsEquipment
Modified
PowerSavings,
Units perhour
PowerSavings,
Unitsper day
PowerSavings,
Units peryear
Savings (atRs.
4.5/unit),Rs. Lakhs
CapitalCost,Rs.
Lakhs
PaybackPeriod,MonthsBoiler FeedWater Pump 81 1944 7,09,560 31.9 25.3 10CondensateExtractionPump (CEP) 36 864 3,15,360 14.2 5.9 3Air CooledCondenserFan (ACC) 8 192 70,080 12.6/fanPrimary AirFan 4 96 35,040 1.5AuxiliaryCoolingWater Pump 24 576 2,10,240 9.5 2.7 4CoolingTower Fan 50 18,250 0.8Hot WellPump 52 18,980 0.85AirCompressor 5 120 43,800 1.95
The following list provides a summary of the scope for energy reduction in different equipmentsengaged in auxiliary power consumption in CPP (37).1. Air & Flue Gas Cycle Power consumption in ID and FD fans can be reduced by optimizing excess air VFD for ID and FD fans2. Steam, Feed water and Condensate cycle Optimizing level set points of LP and HP heaters. Installation of VFD for various pumps helps in reducing the power consumption3. Fuel and Ash Cycle Using washed coal as fuel compared to high ash coal Optimizing idle running of crushers and conveyors in the system Using dry ash evacuation system compared to wet system4. Electrical and Lighting system Using CFL, replacement of mercury vapor lamp with metal halide lamp, autotimer for switching on and off of lights etc.5. Compressed air system Optimizing discharge air pressure Use of screw compressor instead of reciprocating compressor6. Improving cooling water tower performance
Levers to Improve EE in a Cement Plant Page 105
7.6 Financial Analysis of EE OptionsThe study examined several energy efficiency measures for which the Net Present Value (NPV)and Internal Rate of Return (IRR) were calculated. The following were assumed for theanalysis:1) Discount rate of 10%2) Corporate tax rate of 30% with a surcharge of 3%3) End of Life (EoL) of 10 years4) Minimum Alternate Tax (MAT) of 18% and carry forward of MAT credits as applicableu/s 115JAA of the IT Act, 19615) Carry forward of operating losses as applicable under the provisions of IT Act, 19616) Book depreciation by engaging straight line method7) Income tax depreciation at 80% and 20% for the first and second years, respectively.Energy savings, payback period and investment levels of each energy efficiency measure wereobtained from CII (38).The Present Value (PV) of each year’s net profit is calculated using the following formula:( ) = (1 + )Where,i = year at which the net profit was achievedr = discount raten = Number of years to the EoLHigh efficiency preheater fans and Star delta star starters are two case studies reported in thisstudy.Case Study 1 – High Efficiency Preheater FanHigh efficiency preheater fans blow the kiln exit gases into the preheating chamber and enhancesystem thermal efficiency by increasing the heat exchange rates(38). The savings, NPV and IRRare depicted in Figure 103.
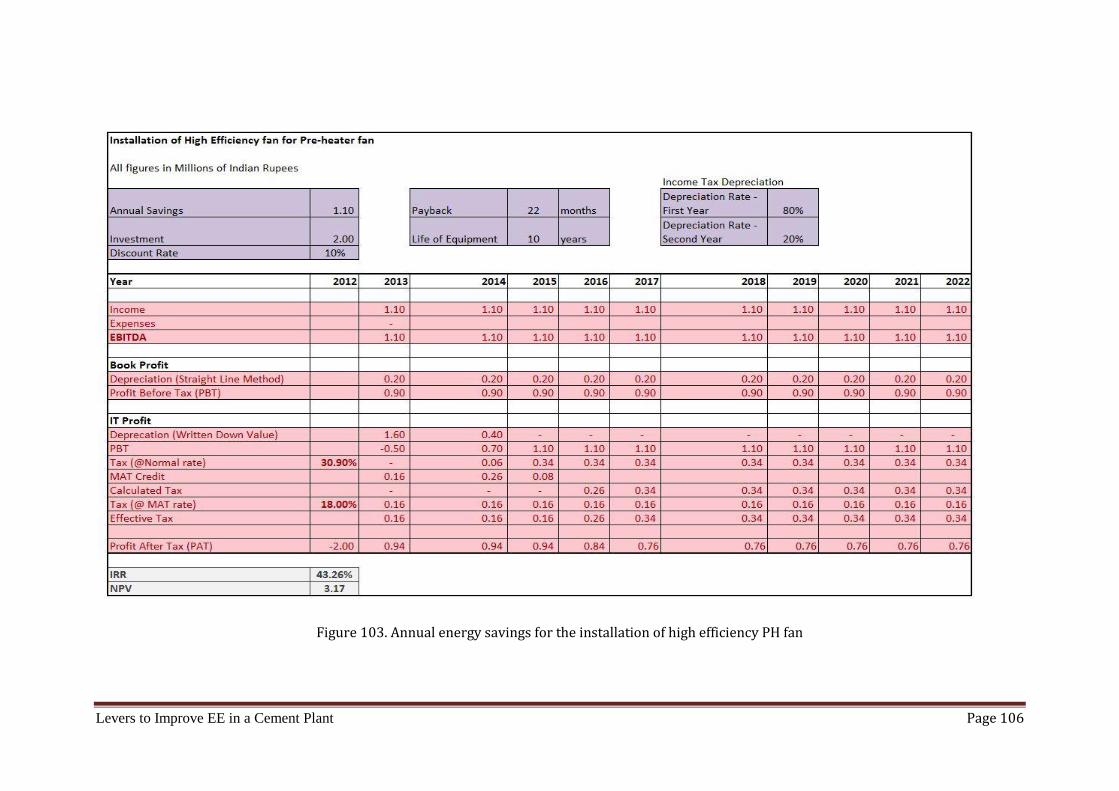
Levers to Improve EE in a Cement Plant Page 106Figure 103. Annual energy savings for the installation of high efficiency PH fan
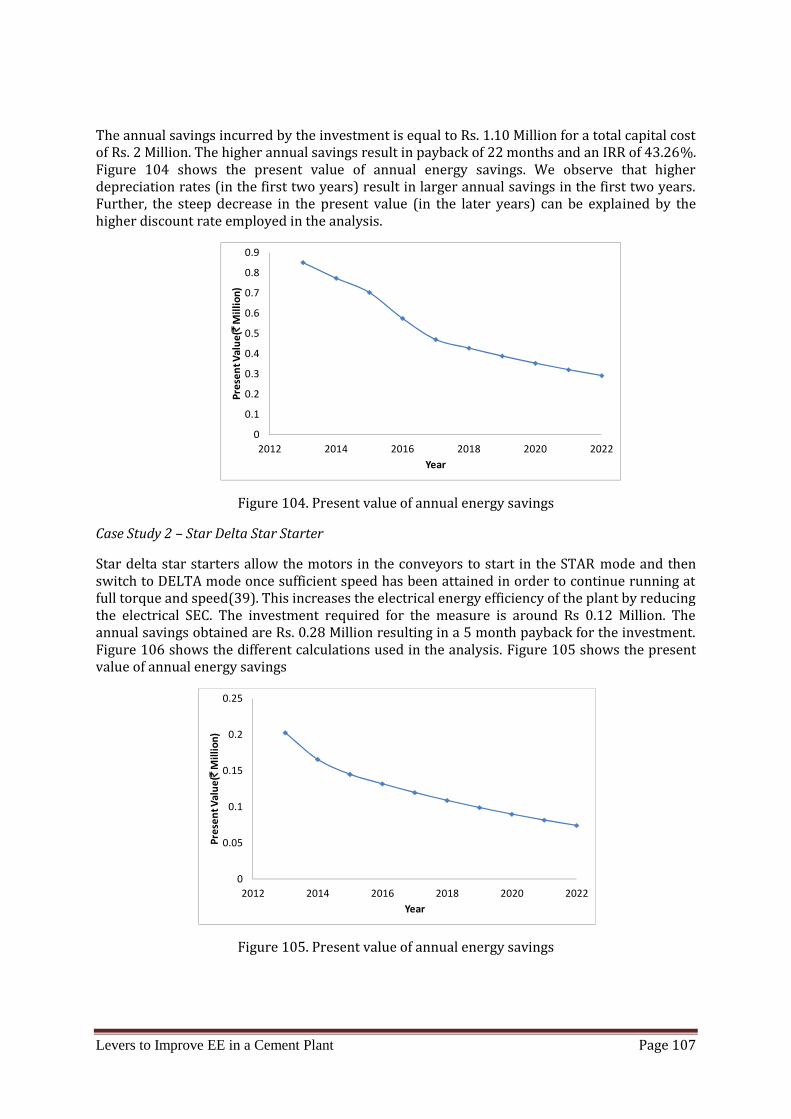
Levers to Improve EE in a Cement Plant Page 107
The annual savings incurred by the investment is equal to Rs. 1.10 Million for a total capital costof Rs. 2 Million. The higher annual savings result in payback of 22 months and an IRR of 43.26%.Figure 104 shows the present value of annual energy savings. We observe that higherdepreciation rates (in the first two years) result in larger annual savings in the first two years.Further, the steep decrease in the present value (in the later years) can be explained by thehigher discount rate employed in the analysis.
Figure 104. Present value of annual energy savingsCase Study 2 – Star Delta Star StarterStar delta star starters allow the motors in the conveyors to start in the STAR mode and thenswitch to DELTA mode once sufficient speed has been attained in order to continue running atfull torque and speed(39). This increases the electrical energy efficiency of the plant by reducingthe electrical SEC. The investment required for the measure is around Rs 0.12 Million. Theannual savings obtained are Rs. 0.28 Million resulting in a 5 month payback for the investment.Figure 106 shows the different calculations used in the analysis. Figure 105 shows the presentvalue of annual energy savings
Figure 105. Present value of annual energy savings
0
0.1
0.2
0.3
0.4
0.5
0.6
0.7
0.8
0.9
2012 2014 2016 2018 2020 2022
Pres
ent V
alue
(`M
illio
n)
Year
0
0.05
0.1
0.15
0.2
0.25
2012 2014 2016 2018 2020 2022
Pres
ent V
alue
(`M
illio
n)
Year
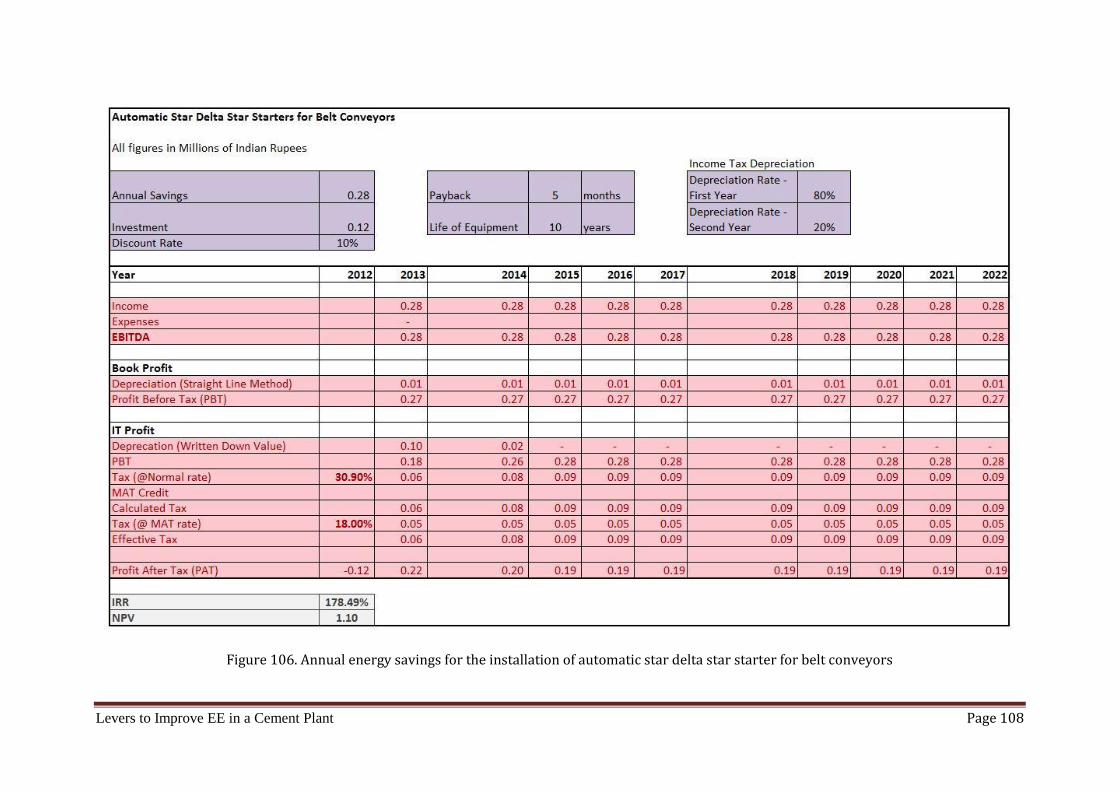
Levers to Improve EE in a Cement Plant Page 108Figure 106. Annual energy savings for the installation of automatic star delta star starter for belt conveyors
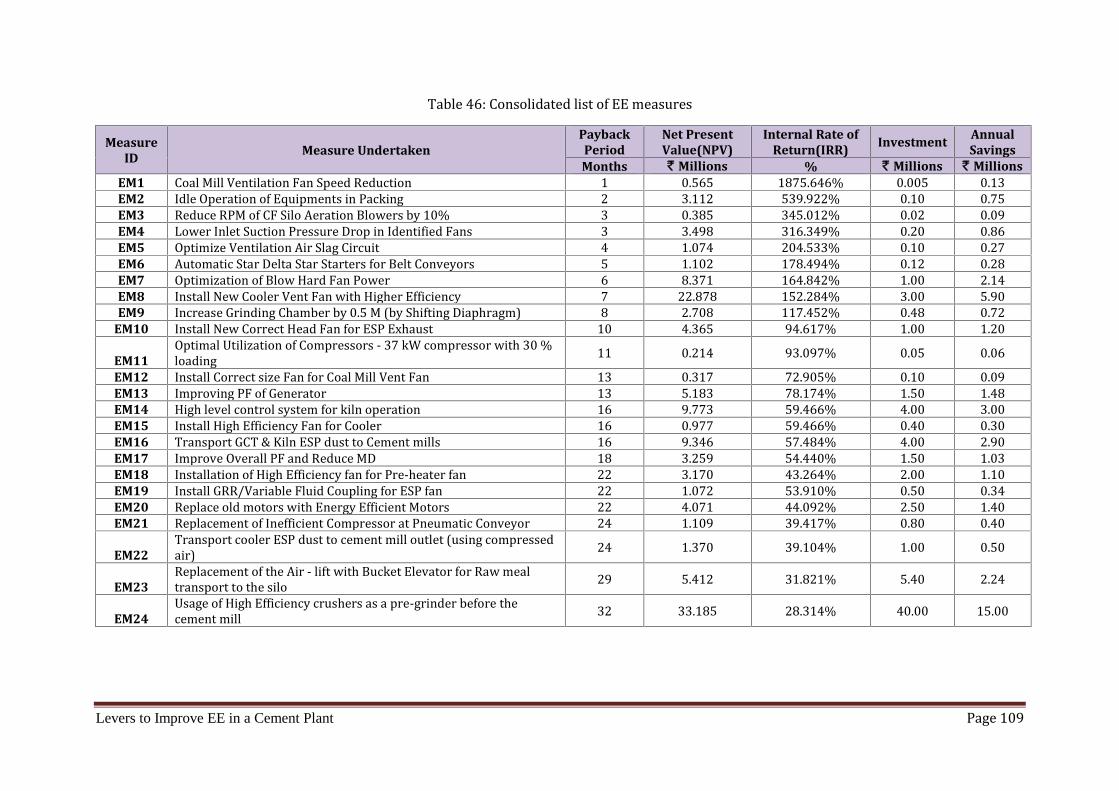
Levers to Improve EE in a Cement Plant Page 109
Table 46: Consolidated list of EE measuresMeasure
ID Measure UndertakenPaybackPeriod
Net PresentValue(NPV)
Internal Rate ofReturn(IRR) Investment Annual
SavingsMonths ` Millions % ` Millions ` Millions
EM1 Coal Mill Ventilation Fan Speed Reduction 1 0.565 1875.646% 0.005 0.13EM2 Idle Operation of Equipments in Packing 2 3.112 539.922% 0.10 0.75EM3 Reduce RPM of CF Silo Aeration Blowers by 10% 3 0.385 345.012% 0.02 0.09EM4 Lower Inlet Suction Pressure Drop in Identified Fans 3 3.498 316.349% 0.20 0.86EM5 Optimize Ventilation Air Slag Circuit 4 1.074 204.533% 0.10 0.27EM6 Automatic Star Delta Star Starters for Belt Conveyors 5 1.102 178.494% 0.12 0.28EM7 Optimization of Blow Hard Fan Power 6 8.371 164.842% 1.00 2.14EM8 Install New Cooler Vent Fan with Higher Efficiency 7 22.878 152.284% 3.00 5.90EM9 Increase Grinding Chamber by 0.5 M (by Shifting Diaphragm) 8 2.708 117.452% 0.48 0.72
EM10 Install New Correct Head Fan for ESP Exhaust 10 4.365 94.617% 1.00 1.20EM11
Optimal Utilization of Compressors - 37 kW compressor with 30 %loading 11 0.214 93.097% 0.05 0.06EM12 Install Correct size Fan for Coal Mill Vent Fan 13 0.317 72.905% 0.10 0.09EM13 Improving PF of Generator 13 5.183 78.174% 1.50 1.48EM14 High level control system for kiln operation 16 9.773 59.466% 4.00 3.00EM15 Install High Efficiency Fan for Cooler 16 0.977 59.466% 0.40 0.30EM16 Transport GCT & Kiln ESP dust to Cement mills 16 9.346 57.484% 4.00 2.90EM17 Improve Overall PF and Reduce MD 18 3.259 54.440% 1.50 1.03EM18 Installation of High Efficiency fan for Pre-heater fan 22 3.170 43.264% 2.00 1.10EM19 Install GRR/Variable Fluid Coupling for ESP fan 22 1.072 53.910% 0.50 0.34EM20 Replace old motors with Energy Efficient Motors 22 4.071 44.092% 2.50 1.40EM21 Replacement of Inefficient Compressor at Pneumatic Conveyor 24 1.109 39.417% 0.80 0.40EM22
Transport cooler ESP dust to cement mill outlet (using compressedair) 24 1.370 39.104% 1.00 0.50EM23
Replacement of the Air - lift with Bucket Elevator for Raw mealtransport to the silo 29 5.412 31.821% 5.40 2.24EM24
Usage of High Efficiency crushers as a pre-grinder before thecement mill 32 33.185 28.314% 40.00 15.00
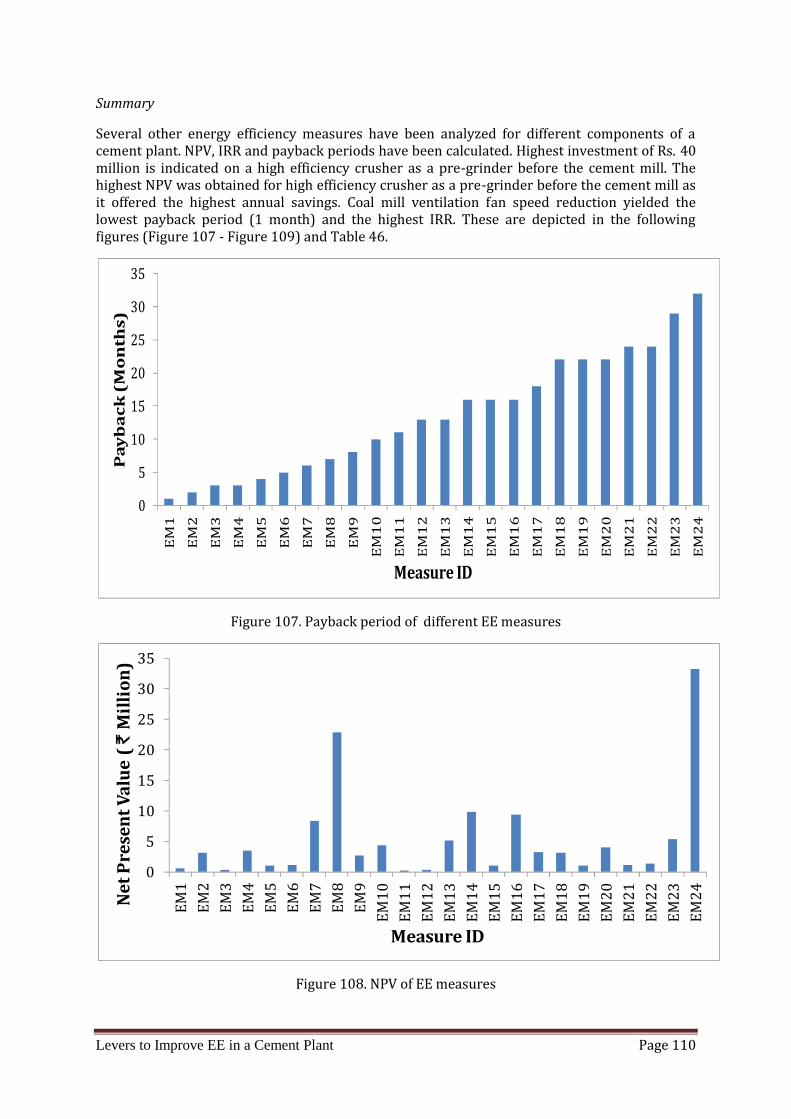
Levers to Improve EE in a Cement Plant Page 110
SummarySeveral other energy efficiency measures have been analyzed for different components of acement plant. NPV, IRR and payback periods have been calculated. Highest investment of Rs. 40million is indicated on a high efficiency crusher as a pre-grinder before the cement mill. Thehighest NPV was obtained for high efficiency crusher as a pre-grinder before the cement mill asit offered the highest annual savings. Coal mill ventilation fan speed reduction yielded thelowest payback period (1 month) and the highest IRR. These are depicted in the followingfigures (Figure 107 - Figure 109) and Table 46.
Figure 107. Payback period of different EE measures
Figure 108. NPV of EE measures
05101520253035
EM1 EM2 EM3 EM4 EM5 EM6 EM7 EM8 EM9 EM10 EM11 EM12 EM13 EM14 EM15 EM16 EM17 EM18 EM19 EM20 EM21 EM22 EM23 EM24
Pay
bac
k (
Mo
nth
s)
Measure ID
05101520253035
EM1 EM2 EM3 EM4 EM5 EM6 EM7 EM8 EM9 EM10 EM11 EM12 EM13 EM14 EM15 EM16 EM17 EM18 EM19 EM20 EM21 EM22 EM23 EM24Net P
rese
nt V
alue
(`
Mill
ion)
Measure ID

Levers to Improve EE in a Cement Plant Page 111
Figure 109. IRR of EE measuresVarious case studies involving different EE measures for the different subprocesses areconsidered here. The executable measures are considered, with their correspondinginvestment, payback and annual savings. The Internal Rate of Return (IRR) and Net Profit Value(NPV) are calculated.The financial analysis performed for each measure along with the expected payback offers anapproximate validation on possible return. These together with the energy savings (in J or kWh)or SEC reduction potential of each measure offers policy makers a valuable tool to makedecisions.7.7 Technology DatabankThe concluding section collates the different EE technologies manufactured by various productor equipment manufacturers. The table below shows the names of the equipment, advantages ofthe equipment and the corresponding energy rating for one major subprocess. Similarly, severaltechnologies for other subprocesses have been tabulated in Appendix I.Cement Grinding, Silo and Gears(40)
Name of the equipment Advantages
Startup Aeration System forpowder coolersReduces the problem associated with crash stopsand pluggingMinimizes the downtime and avoids costly cleanoutdelaysEasy retrofit to existing coolersBall Mill UMS, TMS and TUMS 120 mill sizes with capacity ranging from 1000 to10000 kWBarring Device Allows stopping the mill at any positionFacilitates Mill Servicing, turns the mill at about 2%of normal speedControlled Flow Inteverted Silo SPC is kept low by aerating only two sections at thesame time
0%200%400%600%800%1000%1200%1400%1600%1800%2000%EM1 EM2 EM3 EM4 EM5 EM6 EM7 EM8 EM9 EM10 EM11 EM12 EM13 EM14 EM15 EM16 EM17 EM18 EM19 EM20 EM21 EM22 EM23 EM24In
tern
al R
ate
of R
etu
rn (
%)
Measure ID
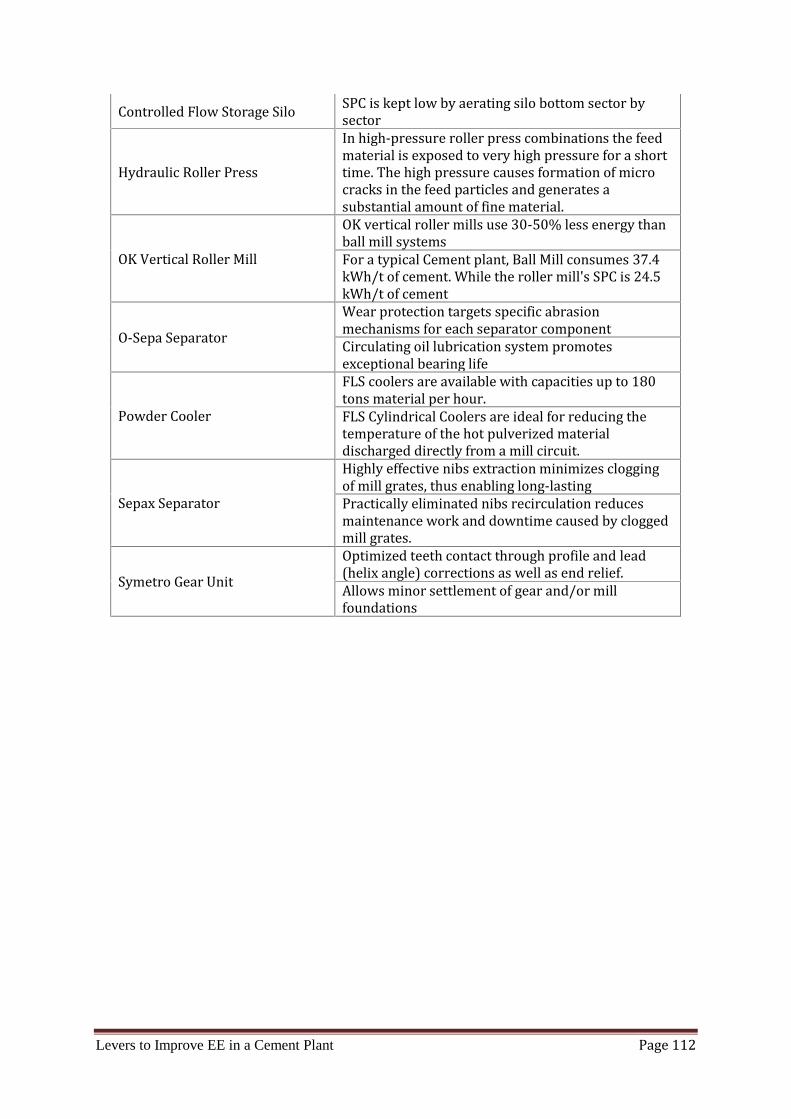
Levers to Improve EE in a Cement Plant Page 112
Controlled Flow Storage Silo SPC is kept low by aerating silo bottom sector bysectorHydraulic Roller Press In high-pressure roller press combinations the feedmaterial is exposed to very high pressure for a shorttime. The high pressure causes formation of microcracks in the feed particles and generates asubstantial amount of fine material.OK Vertical Roller Mill OK vertical roller mills use 30-50% less energy thanball mill systemsFor a typical Cement plant, Ball Mill consumes 37.4kWh/t of cement. While the roller mill's SPC is 24.5kWh/t of cementO-Sepa Separator Wear protection targets specific abrasionmechanisms for each separator componentCirculating oil lubrication system promotesexceptional bearing lifePowder Cooler FLS coolers are available with capacities up to 180tons material per hour.FLS Cylindrical Coolers are ideal for reducing thetemperature of the hot pulverized materialdischarged directly from a mill circuit.Sepax Separator Highly effective nibs extraction minimizes cloggingof mill grates, thus enabling long-lastingPractically eliminated nibs recirculation reducesmaintenance work and downtime caused by cloggedmill grates.Symetro Gear Unit Optimized teeth contact through profile and lead(helix angle) corrections as well as end relief.Allows minor settlement of gear and/or millfoundations

PAT-Focussed Scenario Analysis Page 113
8. PAT Focussed Scenario AnalysisThe likely scenarios for sample cement plants are studied in this chapter. It is assumed that eachplant has a certain baseline SEC and is required to reduce its SEC by a specific percentage. Itwould be useful for the energy managers, operation personnel and the senior management tohave a detailed analysis of the possible scenarios that are likely to occur. These scenarios can beused to better understand the impact of the required SEC reduction in the context of the variouschoices that are available to a plant. The calculations include an estimation of the amount ofenergy that a plant is required to have saved in a given period of about three years. It isassumed that a plant may be able to reduce its SEC beyond the given norm or may not be able toreduce its SEC sufficiently in order to achieve the norm. In case a plant exceeds the given normsit would have saved energy beyond what is required while there would be an energy savingsshortfall otherwise. In both cases the likely cost of the energy savings or shortfall is estimatedbased on low-cost and high-cost scenarios.8.1 Scenario DescriptionScenario analyses for selected plants (P1-P9) based on the reduction target percentage areshown. Savings are calculated based on the Baseline (BL) SEC and target SEC. Theircorresponding energy savings or shortfalls are computed for two cost scenarios.Table 47: Baseline data, SEC reduction target and estimated cost
PERFORMANCE ASSESSMENT P1 P2 P3 P4 P5 P6 P7 P8 P9Baseline Production- BL Prod Mt 3.40 1.17 3.66 1.00 5.05 2.74 1.47 3.06 4.28Baseline Energy- BL Energy 106 MkCal 2.65 1.00 5.41 1.11 6.22 0.41 1.01 0.60 6.11Baseline SEC- BL SEC kCal/kgeq cement 777.9 860.2 1479.9 1102.3 1231.5 149.5 689.4 195.56 1426.8SEC Reduction Target % -5Target SEC kCal/kgeq cement 739.0 817.2 1405.9 1047.2 1170.0 142.0 654.9 185.78 1355.4Each scenario is synthesized with the following structure:
BL Energy: The energy consumed by the plant during the baseline year. Actual SEC Reduction Percentage: A set of actual reduction percentage is assumed forevery plant: -7,-5,-3, 0, 3 and 5. Actual SEC: The actual SEC is computed based on the baseline SEC and the set of actualSEC reduction percentage. Actual Energy at BL Production: Actual Energy at BL Production is calculated bymultiplying the above calculated Actual SEC and Baseline Production.= × Target Energy at BL Production: Target Energy at BL Production is calculated bymultiplying the target SEC and Baseline Production.= × Energy saved at BL Production: Energy saved at BL Production is the differencebetween Actual Energy at BL Production and Baseline Energy= − Energy saved beyond target: The difference between actual energy at BL productionand target energy at BL production is calculated as energy saved beyond target.
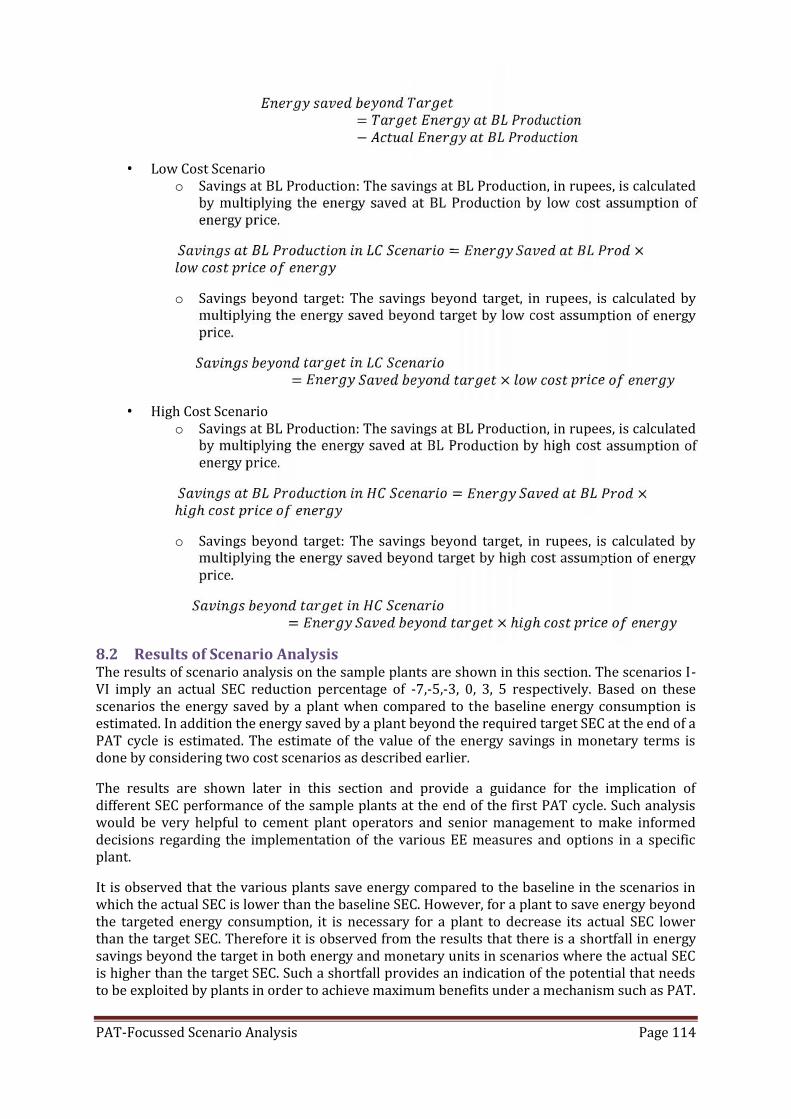
PAT-Focussed Scenario Analysis Page 114
=− Low Cost Scenario
o Savings at BL Production: The savings at BL Production, in rupees, is calculatedby multiplying the energy saved at BL Production by low cost assumption ofenergy price. = ×o Savings beyond target: The savings beyond target, in rupees, is calculated bymultiplying the energy saved beyond target by low cost assumption of energyprice.
= × High Cost Scenario
o Savings at BL Production: The savings at BL Production, in rupees, is calculatedby multiplying the energy saved at BL Production by high cost assumption ofenergy price. = ×ℎ ℎo Savings beyond target: The savings beyond target, in rupees, is calculated bymultiplying the energy saved beyond target by high cost assumption of energyprice.
= × ℎ ℎ8.2 Results of Scenario AnalysisThe results of scenario analysis on the sample plants are shown in this section. The scenarios I-VI imply an actual SEC reduction percentage of -7,-5,-3, 0, 3, 5 respectively. Based on thesescenarios the energy saved by a plant when compared to the baseline energy consumption isestimated. In addition the energy saved by a plant beyond the required target SEC at the end of aPAT cycle is estimated. The estimate of the value of the energy savings in monetary terms isdone by considering two cost scenarios as described earlier.The results are shown later in this section and provide a guidance for the implication ofdifferent SEC performance of the sample plants at the end of the first PAT cycle. Such analysiswould be very helpful to cement plant operators and senior management to make informeddecisions regarding the implementation of the various EE measures and options in a specificplant.It is observed that the various plants save energy compared to the baseline in the scenarios inwhich the actual SEC is lower than the baseline SEC. However, for a plant to save energy beyondthe targeted energy consumption, it is necessary for a plant to decrease its actual SEC lowerthan the target SEC. Therefore it is observed from the results that there is a shortfall in energysavings beyond the target in both energy and monetary units in scenarios where the actual SECis higher than the target SEC. Such a shortfall provides an indication of the potential that needsto be exploited by plants in order to achieve maximum benefits under a mechanism such as PAT.
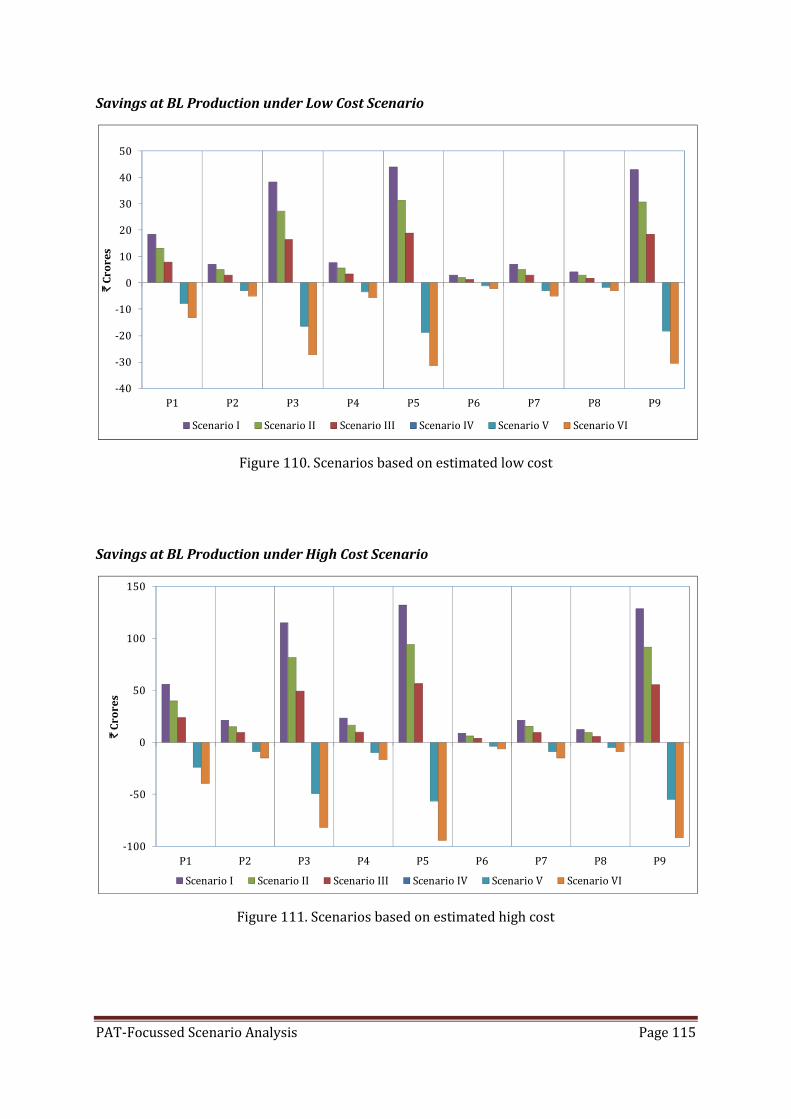
PAT-Focussed Scenario Analysis Page 115
Savings at BL Production under Low Cost Scenario
Figure 110. Scenarios based on estimated low costSavings at BL Production under High Cost Scenario
Figure 111. Scenarios based on estimated high cost
-40-30-20-1001020304050
P1 P2 P3 P4 P5 P6 P7 P8 P9
`Cr
ores
Scenario I Scenario II Scenario III Scenario IV Scenario V Scenario VI
-100-50
050
100150
P1 P2 P3 P4 P5 P6 P7 P8 P9
`Cr
ores
Scenario I Scenario II Scenario III Scenario IV Scenario V Scenario VI
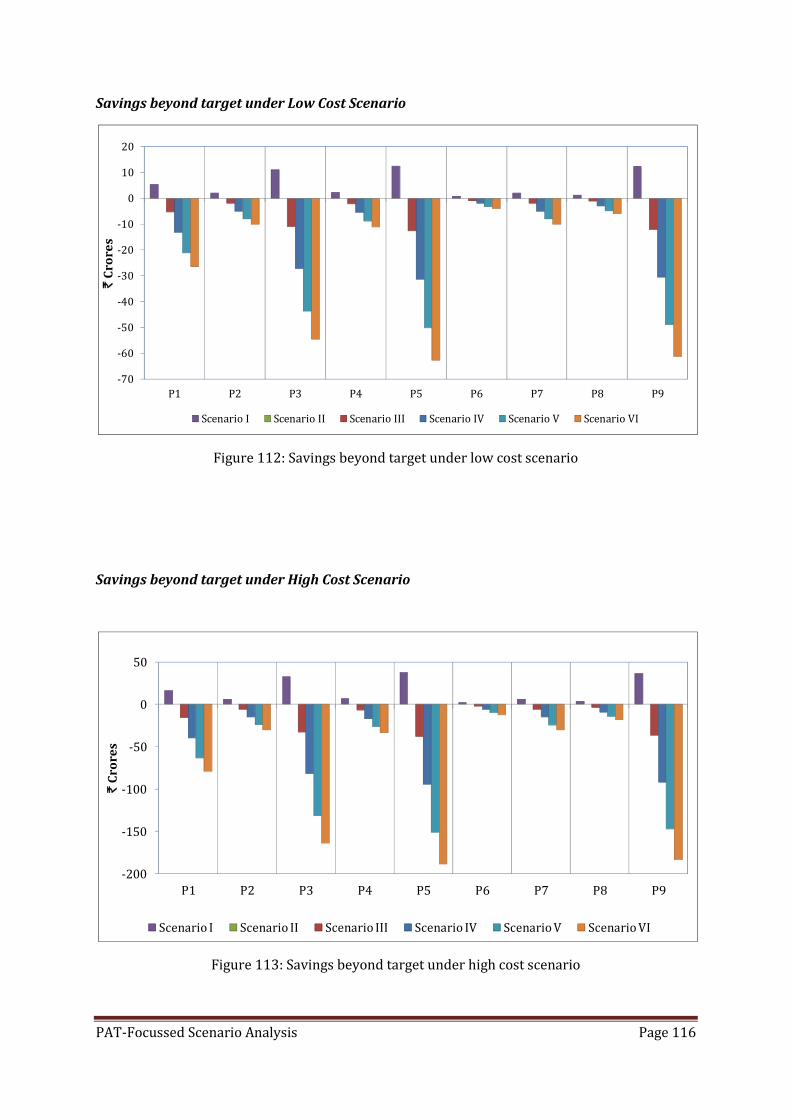
PAT-Focussed Scenario Analysis Page 116
Savings beyond target under Low Cost Scenario
Figure 112: Savings beyond target under low cost scenario
Savings beyond target under High Cost Scenario
Figure 113: Savings beyond target under high cost scenario
-70-60-50-40-30-20-1001020
P1 P2 P3 P4 P5 P6 P7 P8 P9
`Cr
ores
Scenario I Scenario II Scenario III Scenario IV Scenario V Scenario VI
-200-150-100
-500
50
P1 P2 P3 P4 P5 P6 P7 P8 P9
`Cr
ores
Scenario I Scenario II Scenario III Scenario IV Scenario V Scenario VI

PAT-Focussed Scenario Analysis Page 117
Energy saved at BL Production for different Scenarios
Figure 114: Energy Saved at BL production for various scenariosEnergy saved beyond target for different Scenarios
Figure 115: Energy saved beyond target for different Scenarios8.3 Agent Based Model for PATIn this section, a preliminary simulation to visualize the behavior of DCs using agent basedmodeling has been performed. Agents are used to represent plants (DC) and the regulatoryauthority that sets norms for DCs. Given the technology to upgrade and SEC Reduction (%), theperformance of the plant is visualized. The figures used and generated here are illustrative.
-0.4-0.3-0.2-0.100.10.20.30.40.5
P1 P2 P3 P4 P5 P6 P7 P8 P9Ener
gy Sa
ving
s (10
6M
kCal
)
Scenario I Scenario II Scenario III Scenario IV Scenario V Scenario VI
-0.7-0.6-0.5-0.4-0.3-0.2-0.100.10.2
P1 P2 P3 P4 P5 P6 P7 P8 P9
Ener
gy Sa
ving
s (10
6M
kCal
)
Scenario I Scenario II Scenario III Scenario IV Scenario V Scenario VI
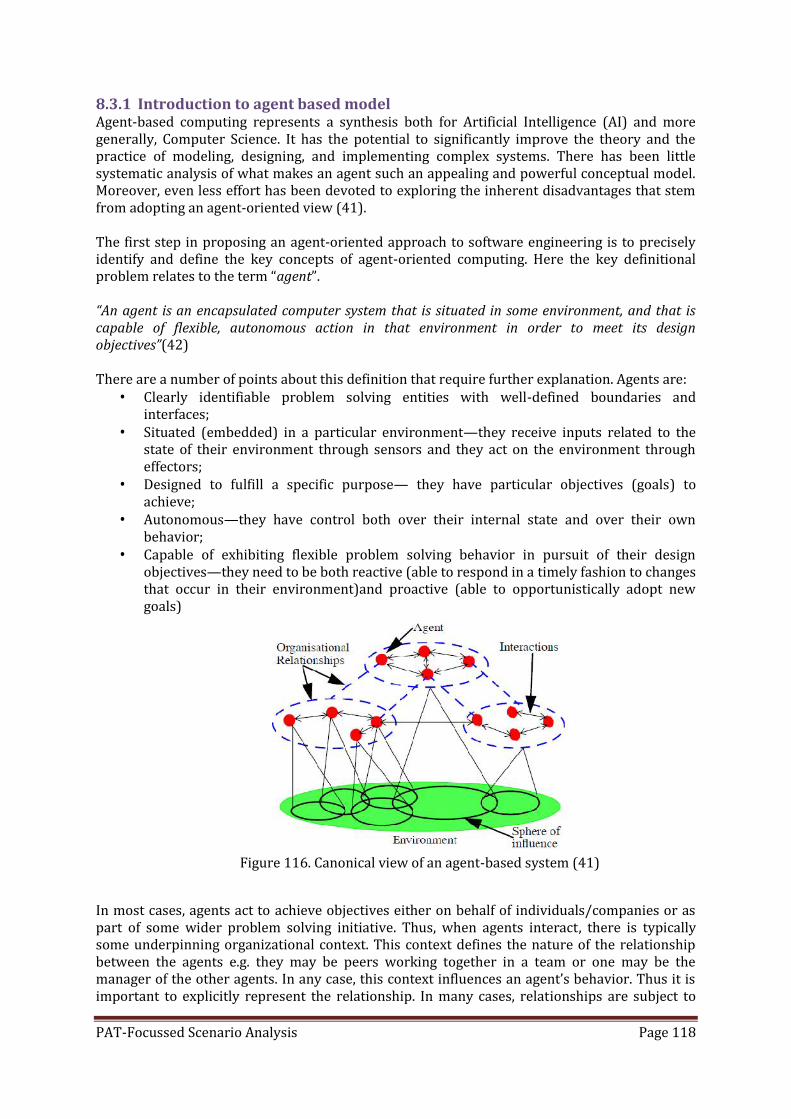
PAT-Focussed Scenario Analysis Page 118
8.3.1 Introduction to agent based modelAgent-based computing represents a synthesis both for Artificial Intelligence (AI) and moregenerally, Computer Science. It has the potential to significantly improve the theory and thepractice of modeling, designing, and implementing complex systems. There has been littlesystematic analysis of what makes an agent such an appealing and powerful conceptual model.Moreover, even less effort has been devoted to exploring the inherent disadvantages that stemfrom adopting an agent-oriented view (41).The first step in proposing an agent-oriented approach to software engineering is to preciselyidentify and define the key concepts of agent-oriented computing. Here the key definitionalproblem relates to the term “agent”.“An agent is an encapsulated computer system that is situated in some environment, and that iscapable of flexible, autonomous action in that environment in order to meet its designobjectives”(42)There are a number of points about this definition that require further explanation. Agents are:
Clearly identifiable problem solving entities with well-defined boundaries andinterfaces; Situated (embedded) in a particular environment—they receive inputs related to thestate of their environment through sensors and they act on the environment througheffectors; Designed to fulfill a specific purpose— they have particular objectives (goals) toachieve; Autonomous—they have control both over their internal state and over their ownbehavior; Capable of exhibiting flexible problem solving behavior in pursuit of their designobjectives—they need to be both reactive (able to respond in a timely fashion to changesthat occur in their environment)and proactive (able to opportunistically adopt newgoals)
Figure 116. Canonical view of an agent-based system (41)In most cases, agents act to achieve objectives either on behalf of individuals/companies or aspart of some wider problem solving initiative. Thus, when agents interact, there is typicallysome underpinning organizational context. This context defines the nature of the relationshipbetween the agents e.g. they may be peers working together in a team or one may be themanager of the other agents. In any case, this context influences an agent’s behavior. Thus it isimportant to explicitly represent the relationship. In many cases, relationships are subject to
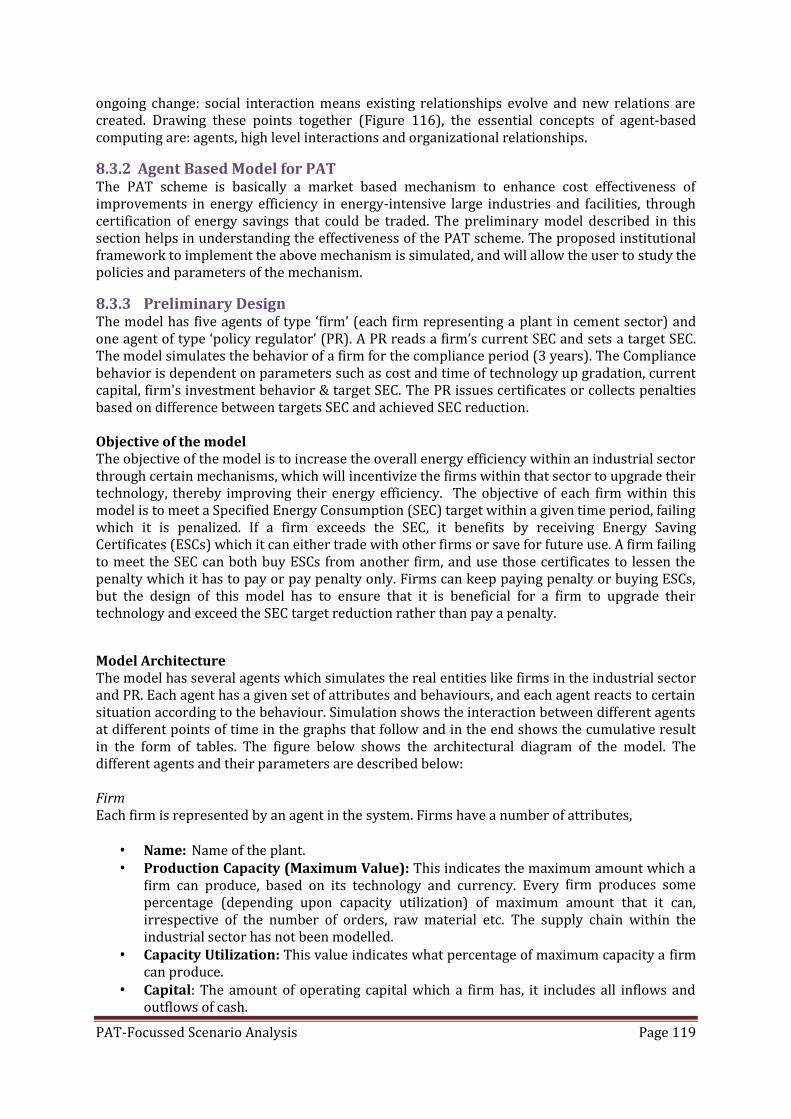
PAT-Focussed Scenario Analysis Page 119
ongoing change: social interaction means existing relationships evolve and new relations arecreated. Drawing these points together (Figure 116), the essential concepts of agent-basedcomputing are: agents, high level interactions and organizational relationships.8.3.2 Agent Based Model for PATThe PAT scheme is basically a market based mechanism to enhance cost effectiveness ofimprovements in energy efficiency in energy-intensive large industries and facilities, throughcertification of energy savings that could be traded. The preliminary model described in thissection helps in understanding the effectiveness of the PAT scheme. The proposed institutionalframework to implement the above mechanism is simulated, and will allow the user to study thepolicies and parameters of the mechanism.8.3.3 Preliminary DesignThe model has five agents of type ‘firm’ (each firm representing a plant in cement sector) andone agent of type ‘policy regulator’ (PR). A PR reads a firm’s current SEC and sets a target SEC.The model simulates the behavior of a firm for the compliance period (3 years). The Compliancebehavior is dependent on parameters such as cost and time of technology up gradation, currentcapital, firm's investment behavior & target SEC. The PR issues certificates or collects penaltiesbased on difference between targets SEC and achieved SEC reduction.Objective of the modelThe objective of the model is to increase the overall energy efficiency within an industrial sectorthrough certain mechanisms, which will incentivize the firms within that sector to upgrade theirtechnology, thereby improving their energy efficiency. The objective of each firm within thismodel is to meet a Specified Energy Consumption (SEC) target within a given time period, failingwhich it is penalized. If a firm exceeds the SEC, it benefits by receiving Energy SavingCertificates (ESCs) which it can either trade with other firms or save for future use. A firm failingto meet the SEC can both buy ESCs from another firm, and use those certificates to lessen thepenalty which it has to pay or pay penalty only. Firms can keep paying penalty or buying ESCs,but the design of this model has to ensure that it is beneficial for a firm to upgrade theirtechnology and exceed the SEC target reduction rather than pay a penalty.Model ArchitectureThe model has several agents which simulates the real entities like firms in the industrial sectorand PR. Each agent has a given set of attributes and behaviours, and each agent reacts to certainsituation according to the behaviour. Simulation shows the interaction between different agentsat different points of time in the graphs that follow and in the end shows the cumulative resultin the form of tables. The figure below shows the architectural diagram of the model. Thedifferent agents and their parameters are described below:FirmEach firm is represented by an agent in the system. Firms have a number of attributes,
Name: Name of the plant. Production Capacity (Maximum Value): This indicates the maximum amount which afirm can produce, based on its technology and currency. Every firm produces somepercentage (depending upon capacity utilization) of maximum amount that it can,irrespective of the number of orders, raw material etc. The supply chain within theindustrial sector has not been modelled. Capacity Utilization: This value indicates what percentage of maximum capacity a firmcan produce. Capital: The amount of operating capital which a firm has, it includes all inflows andoutflows of cash.

PAT-Focussed Scenario Analysis Page 120
Current SEC: Current specific energy consumption of the firm. Target SEC: Firm specific targets set by the monitoring agency (PR). ESCerts: Number of energy savings certificates held by firm at any given time. Possible Technology Up gradations: List of technology options available with a firmfor reducing SEC. It includes other details such as cost of technology, time to upgrade,amount of reduction in energy achieved etc.
Policy Regulator (PR)PR is represented by an agent in the system. PR has mainly two behaviours: Calculate target SEC: This behaviour is to set target SECs for individual firms based ontheir current SECs. Calculate penalty: This behaviour is to calculate penalty at the end of the complianceperiod, based on the amount of energy savings shortfall.
Goal PlanningAgent PR reads the current SEC of each firm and based on its saving potential it sets a targetSEC. At present the target is set as a percentage (3% to 5%) of the initial SEC.
Figure 117. Agent based model architecture diagramCompliance BehaviourEach firm agent behaves differently during the compliance period. Based on certain criteria suchas current capital, cost of up gradation to new technology, time required upgrading to newtechnology; a firm plans its strategy. Based on the strategy decided by any firm, compliancebehaviour is bound to fall into one of the following categories:
A firm decides to upgrade to a new technology in the first year of compliance period. A firm decides to upgrade to a new technology in the second year of compliance period. A firm decides to upgrade to a new technology in the third year of compliance period. A firm takes no energy efficiency measures and decides to pay penalty.
RESULTS IN TERMS OF GRAPHS AND TABLES
OBSERVER
DC 1
DC N
MARKET
DC 2
Target 1 Target 2
Target N
POLI
CY R
EGU
LATO
R
Agent EE Achieved EE Needed EE Excess
Firms
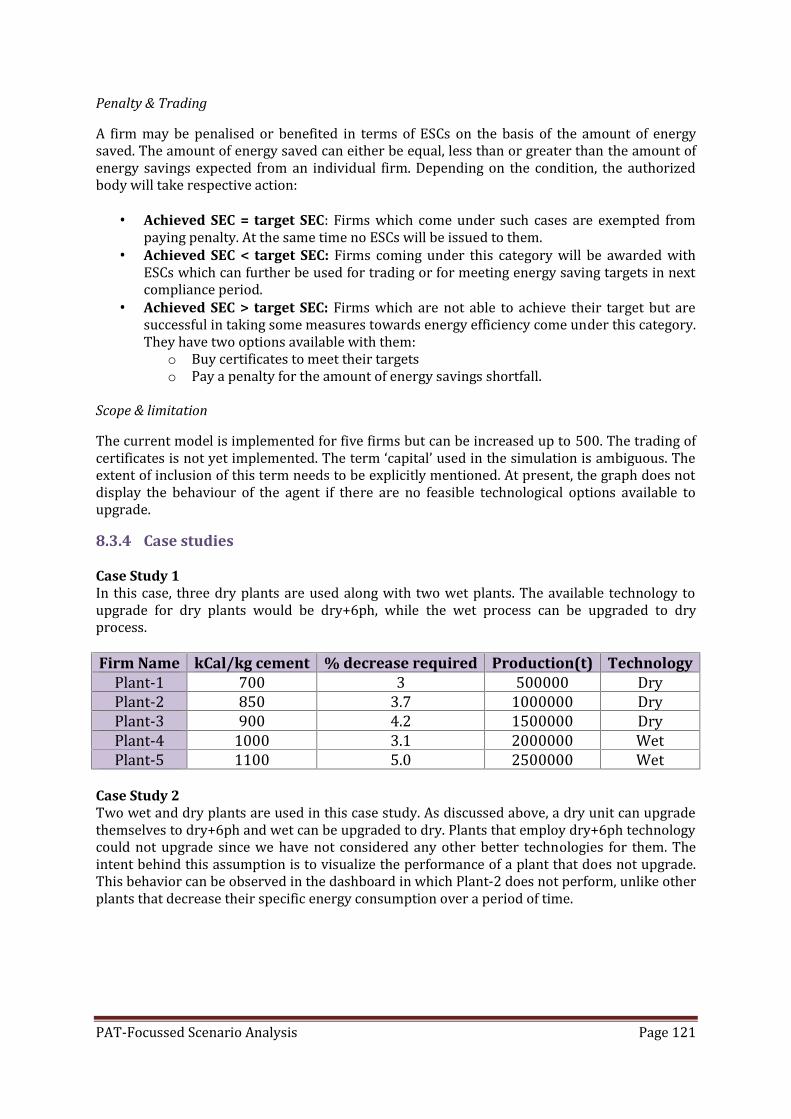
PAT-Focussed Scenario Analysis Page 121
Penalty & TradingA firm may be penalised or benefited in terms of ESCs on the basis of the amount of energysaved. The amount of energy saved can either be equal, less than or greater than the amount ofenergy savings expected from an individual firm. Depending on the condition, the authorizedbody will take respective action: Achieved SEC = target SEC: Firms which come under such cases are exempted frompaying penalty. At the same time no ESCs will be issued to them. Achieved SEC < target SEC: Firms coming under this category will be awarded withESCs which can further be used for trading or for meeting energy saving targets in nextcompliance period. Achieved SEC > target SEC: Firms which are not able to achieve their target but aresuccessful in taking some measures towards energy efficiency come under this category.They have two options available with them:
o Buy certificates to meet their targetso Pay a penalty for the amount of energy savings shortfall.
Scope & limitationThe current model is implemented for five firms but can be increased up to 500. The trading ofcertificates is not yet implemented. The term ‘capital’ used in the simulation is ambiguous. Theextent of inclusion of this term needs to be explicitly mentioned. At present, the graph does notdisplay the behaviour of the agent if there are no feasible technological options available toupgrade.8.3.4 Case studies
Case Study 1In this case, three dry plants are used along with two wet plants. The available technology toupgrade for dry plants would be dry+6ph, while the wet process can be upgraded to dryprocess.Firm Name kCal/kg cement % decrease required Production(t) TechnologyPlant-1 700 3 500000 DryPlant-2 850 3.7 1000000 DryPlant-3 900 4.2 1500000 DryPlant-4 1000 3.1 2000000 WetPlant-5 1100 5.0 2500000 WetCase Study 2Two wet and dry plants are used in this case study. As discussed above, a dry unit can upgradethemselves to dry+6ph and wet can be upgraded to dry. Plants that employ dry+6ph technologycould not upgrade since we have not considered any other better technologies for them. Theintent behind this assumption is to visualize the performance of a plant that does not upgrade.This behavior can be observed in the dashboard in which Plant-2 does not perform, unlike otherplants that decrease their specific energy consumption over a period of time.
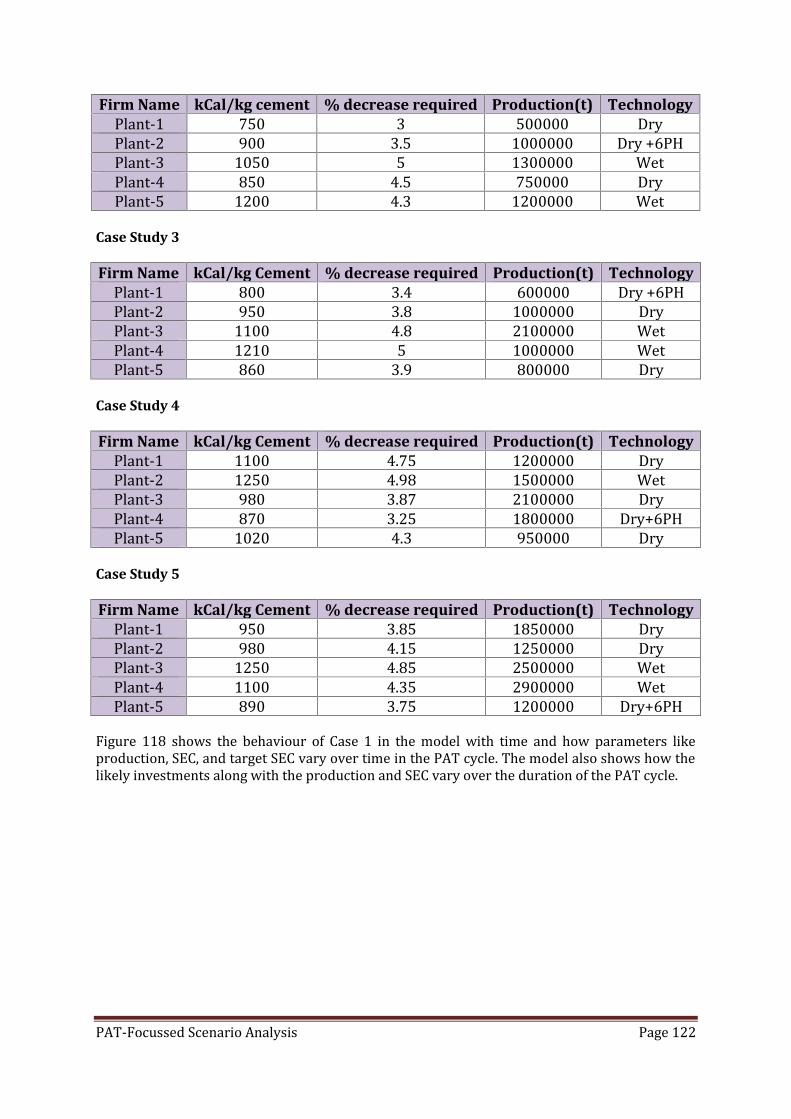
PAT-Focussed Scenario Analysis Page 122
Firm Name kCal/kg cement % decrease required Production(t) TechnologyPlant-1 750 3 500000 DryPlant-2 900 3.5 1000000 Dry +6PHPlant-3 1050 5 1300000 WetPlant-4 850 4.5 750000 DryPlant-5 1200 4.3 1200000 WetCase Study 3
Firm Name kCal/kg Cement % decrease required Production(t) TechnologyPlant-1 800 3.4 600000 Dry +6PHPlant-2 950 3.8 1000000 DryPlant-3 1100 4.8 2100000 WetPlant-4 1210 5 1000000 WetPlant-5 860 3.9 800000 DryCase Study 4
Firm Name kCal/kg Cement % decrease required Production(t) TechnologyPlant-1 1100 4.75 1200000 DryPlant-2 1250 4.98 1500000 WetPlant-3 980 3.87 2100000 DryPlant-4 870 3.25 1800000 Dry+6PHPlant-5 1020 4.3 950000 DryCase Study 5
Firm Name kCal/kg Cement % decrease required Production(t) TechnologyPlant-1 950 3.85 1850000 DryPlant-2 980 4.15 1250000 DryPlant-3 1250 4.85 2500000 WetPlant-4 1100 4.35 2900000 WetPlant-5 890 3.75 1200000 Dry+6PHFigure 118 shows the behaviour of Case 1 in the model with time and how parameters likeproduction, SEC, and target SEC vary over time in the PAT cycle. The model also shows how thelikely investments along with the production and SEC vary over the duration of the PAT cycle.
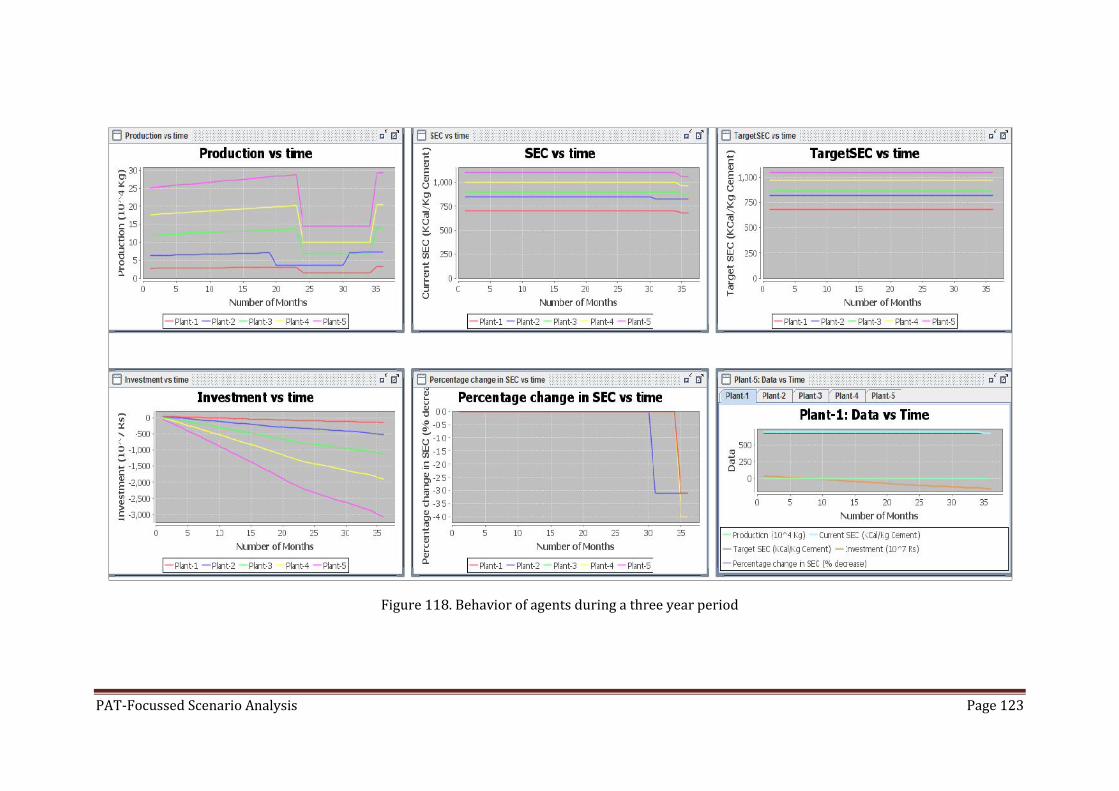
PAT-Focussed Scenario Analysis Page 123Figure 118. Behavior of agents during a three year period

Page 124
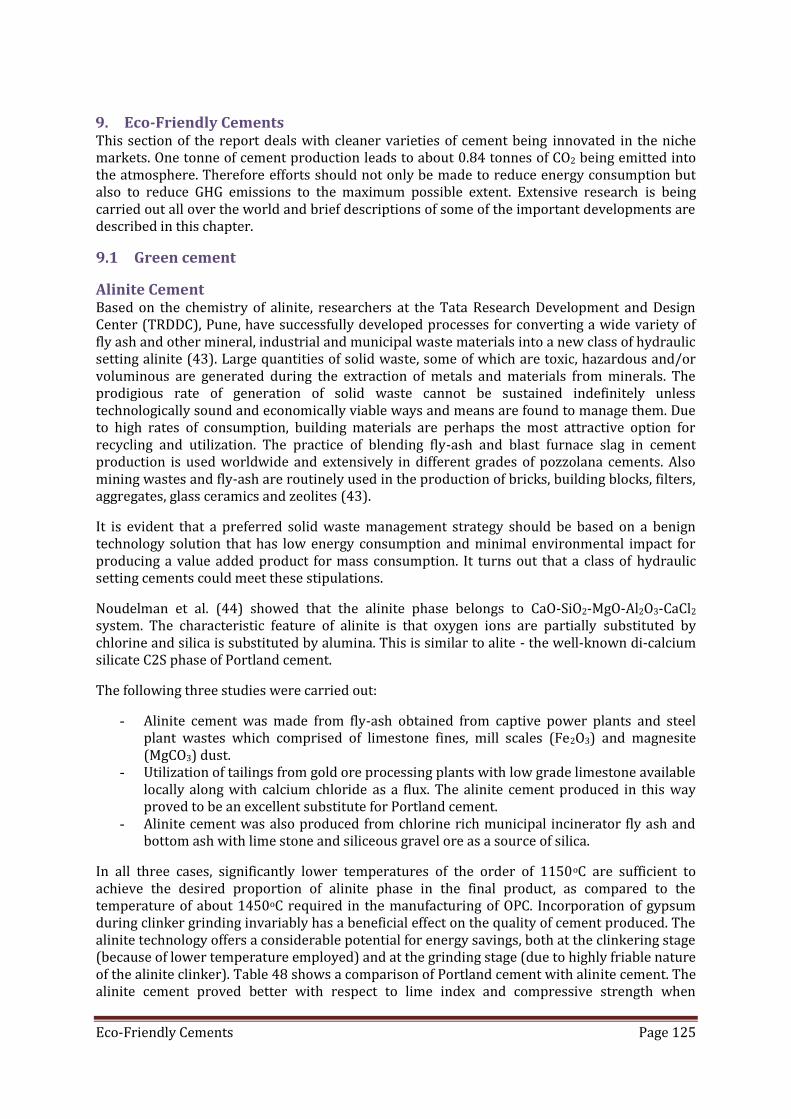
Eco-Friendly Cements Page 125
9. Eco-Friendly CementsThis section of the report deals with cleaner varieties of cement being innovated in the nichemarkets. One tonne of cement production leads to about 0.84 tonnes of CO2 being emitted intothe atmosphere. Therefore efforts should not only be made to reduce energy consumption butalso to reduce GHG emissions to the maximum possible extent. Extensive research is beingcarried out all over the world and brief descriptions of some of the important developments aredescribed in this chapter.9.1 Green cement
Alinite CementBased on the chemistry of alinite, researchers at the Tata Research Development and DesignCenter (TRDDC), Pune, have successfully developed processes for converting a wide variety offly ash and other mineral, industrial and municipal waste materials into a new class of hydraulicsetting alinite (43). Large quantities of solid waste, some of which are toxic, hazardous and/orvoluminous are generated during the extraction of metals and materials from minerals. Theprodigious rate of generation of solid waste cannot be sustained indefinitely unlesstechnologically sound and economically viable ways and means are found to manage them. Dueto high rates of consumption, building materials are perhaps the most attractive option forrecycling and utilization. The practice of blending fly-ash and blast furnace slag in cementproduction is used worldwide and extensively in different grades of pozzolana cements. Alsomining wastes and fly-ash are routinely used in the production of bricks, building blocks, filters,aggregates, glass ceramics and zeolites (43).It is evident that a preferred solid waste management strategy should be based on a benigntechnology solution that has low energy consumption and minimal environmental impact forproducing a value added product for mass consumption. It turns out that a class of hydraulicsetting cements could meet these stipulations.Noudelman et al. (44) showed that the alinite phase belongs to CaO-SiO2-MgO-Al2O3-CaCl2system. The characteristic feature of alinite is that oxygen ions are partially substituted bychlorine and silica is substituted by alumina. This is similar to alite - the well-known di-calciumsilicate C2S phase of Portland cement.The following three studies were carried out:- Alinite cement was made from fly-ash obtained from captive power plants and steelplant wastes which comprised of limestone fines, mill scales (Fe2O3) and magnesite(MgCO3) dust.- Utilization of tailings from gold ore processing plants with low grade limestone availablelocally along with calcium chloride as a flux. The alinite cement produced in this wayproved to be an excellent substitute for Portland cement.- Alinite cement was also produced from chlorine rich municipal incinerator fly ash andbottom ash with lime stone and siliceous gravel ore as a source of silica.In all three cases, significantly lower temperatures of the order of 1150oC are sufficient toachieve the desired proportion of alinite phase in the final product, as compared to thetemperature of about 1450oC required in the manufacturing of OPC. Incorporation of gypsumduring clinker grinding invariably has a beneficial effect on the quality of cement produced. Thealinite technology offers a considerable potential for energy savings, both at the clinkering stage(because of lower temperature employed) and at the grinding stage (due to highly friable natureof the alinite clinker). Table 48 shows a comparison of Portland cement with alinite cement. Thealinite cement proved better with respect to lime index and compressive strength when
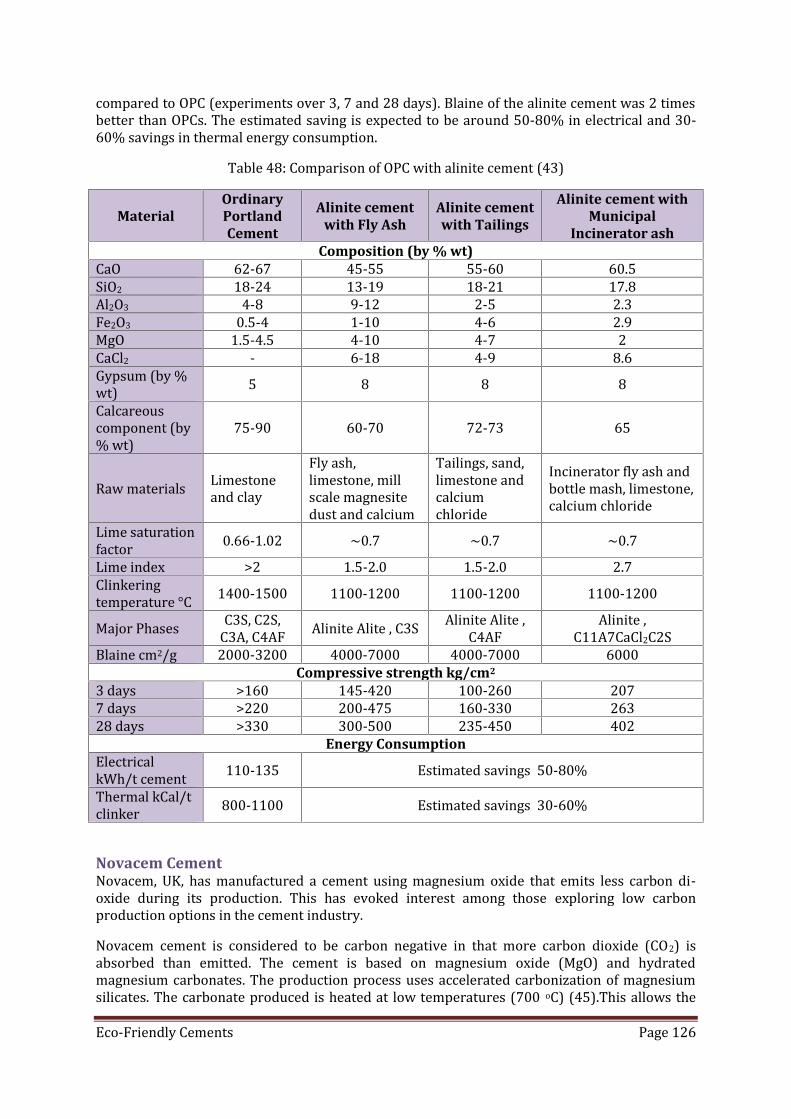
Eco-Friendly Cements Page 126
compared to OPC (experiments over 3, 7 and 28 days). Blaine of the alinite cement was 2 timesbetter than OPCs. The estimated saving is expected to be around 50-80% in electrical and 30-60% savings in thermal energy consumption.Table 48: Comparison of OPC with alinite cement (43)Material
OrdinaryPortlandCement
Alinite cementwith Fly Ash
Alinite cementwith Tailings
Alinite cement withMunicipal
Incinerator ashComposition (by % wt)CaO 62-67 45-55 55-60 60.5SiO2 18-24 13-19 18-21 17.8Al2O3 4-8 9-12 2-5 2.3Fe2O3 0.5-4 1-10 4-6 2.9MgO 1.5-4.5 4-10 4-7 2CaCl2 - 6-18 4-9 8.6Gypsum (by %wt) 5 8 8 8Calcareouscomponent (by% wt) 75-90 60-70 72-73 65
Raw materials Limestoneand clay Fly ash,limestone, millscale magnesitedust and calciumTailings, sand,limestone andcalciumchloride
Incinerator fly ash andbottle mash, limestone,calcium chlorideLime saturationfactor 0.66-1.02 ~0.7 ~0.7 ~0.7Lime index >2 1.5-2.0 1.5-2.0 2.7Clinkeringtemperature °C 1400-1500 1100-1200 1100-1200 1100-1200Major Phases C3S, C2S,C3A, C4AF Alinite Alite , C3S Alinite Alite ,C4AF Alinite ,C11A7CaCl2C2SBlaine cm2/g 2000-3200 4000-7000 4000-7000 6000Compressive strength kg/cm23 days >160 145-420 100-260 2077 days >220 200-475 160-330 26328 days >330 300-500 235-450 402
Energy ConsumptionElectricalkWh/t cement 110-135 Estimated savings 50-80%Thermal kCal/tclinker 800-1100 Estimated savings 30-60%Novacem CementNovacem, UK, has manufactured a cement using magnesium oxide that emits less carbon di-oxide during its production. This has evoked interest among those exploring low carbonproduction options in the cement industry.Novacem cement is considered to be carbon negative in that more carbon dioxide (CO2) isabsorbed than emitted. The cement is based on magnesium oxide (MgO) and hydratedmagnesium carbonates. The production process uses accelerated carbonization of magnesiumsilicates. The carbonate produced is heated at low temperatures (700 oC) (45).This allows the

Eco-Friendly Cements Page 127
use of fuels with low energy content or carbon intensity (i.e. biomass), thus further reducingcarbon emissions. The production of 1 tonne of Novacem cement absorbs up to 100 kg more CO2than it emits, making it a carbon negative product. Table 49 highlights the difference betweenOPC and Novacem cements.Table 49: Comparison between OPC and Novacem cementOrdinary Portland Cement NovacemCarbonate feedstock (Mining andProcessing Limestone. (400kg of CO2released from limestone per tonne ofcement
Non-Carbonate feedstockHigh temperature process (1450oC)requires fossil fuels. Lower temperature process (700oC), can betterutilise biomass fuel. 0-420kg CO2 /t cement isreleased depending on fuel mix used and choiceof feedstock.No absorption of CO2. Cement composition includes a carbonatecreated during production process byabsorbing CO2. 30-100 kg CO2 absorbed pertonne of cement.Total emissions: +800kg CO2/tcement
Total emissions: -100kg to +320kg CO2/tcement
Magnesium Based CementMagnesium based cement requires less energy for production and does not emit as much CO2 ascompared to Portland cement manufacturing. The phosphates typically used to combine withthe magnesium can be sourced from animal wastes or fermented plants. These cements developconsiderably greater compressive and tensile strengths as compared to Portland cement.Another advantage of magnesium-based cements is that they have a natural affinity forcellulosic materials, such as plant fibers or wood chips. Portland cement repels cellulose.Therefore, utilization of wood chips serves to achieve lighter weight and better insulativeproperties.MgO when combined with clay and cellulose creates cements that breathe water vapor. Hencethe product never rots, as it can expel moisture. MgO cements do not conduct electricity, norabsorb or emit heat/coldness, and hence are used as tiles of radar stations and hospitaloperating rooms.‘AirKrete’ is a natural MgO mineral-based blown-in insulation that combines the advantages ofMgO cement with aeration and spray in place. It is non-toxic, resists mold growth even in highhumidity, fire proof and sound proof, re-absorbs CO2 as it cures, has an R-value of 3.9 per inchand does not shrink as it dries.Magnesium oxide is also available from several other sources. These recipes require eitherliquid fertilizer or special brine “reactors” to harden into concrete and are especially useful forbinding, non-load-bearing straw/clay and woodchip/clay mixes for building construction (46).CALERA CementOcean chemistry involves the gradual absorption and mineralization of carbon. Over time, vastamounts of CO2 are naturally absorbed into the oceans and converted into stable minerals, suchas limestone. Calera’s technology is based on these processes. Both the conversion of CO2 intobicarbonate and the subsequent conversion of bicarbonate to carbonate occur more rapidly in

Eco-Friendly Cements Page 128
solutions with high pH. Hence maintenance of a high pH environment is important to Calera’sprocessThe technology focuses increasing the speed and scale of gas absorption in the solution and thenincreasing the speed and scale of conversion into minerals so that large volumes of gas can becontinuously captured.ProcessCALERA process uses technology associated with carbon capture and its conversion to stablesolid minerals. The process known as Mineralization via Aqueous Precipitation (MAP) involvescontacting gas from the power plant with water. A process diagram highlighting the workingprinciple of CALERA is shown in Figure 119. The water chemistry is controlled such that thecarbon dioxide in the power plant gas is absorbed in water and reacts to form solid mineralcarbonates and bicarbonates. This is the key step in the MAP process i.e. the conversion ofcarbon dioxide (CO2) to carbonate (CO3) and binding it to minerals such as calcium andmagnesium. The water contains carbon dioxide that would have been emitted into the air. Thesematerials produced us removed from the water and processed to produce high reactive cement(47).The outputs of the process are clean air, fresh water and solid materials that can be sold as anaggregate or Supplementary Cementitious Material (SCM) like fly-ash or blast furnace slag. Theprocess also captures other emissions, including sulfur dioxide, particulate matter, mercury andother metals. The schematic diagram Figure 119 shows the CALERA process to convert CO2 tocarbonates (48).
Figure 119. Schematic diagram of CALERA processCalix TechnologyCalix technology uses Catalytic Flash Calcination (CFC) reactor to heat a mineral within secondsand change its chemical properties. The calcined minerals may include dolomite, magnetite,kaolin, bauxite or limestone. The process is illustrated in Figure 120. The ground dolomitefeedstock is injected into the calciner tube (in blue) by a stream of superheated steam. Thedolomite solids are centrifuged onto the hot walls of the heat chamber (orange).

Eco-Friendly Cements Page 129
Figure 120. Calciner System for Semidolime ProductionThe steam breaks-up the particles and leads to the calcination reaction. The thermal energyused in the process is extracted from the walls of the calciner tube, heated by an external heatsource. The process solids are separated with the aid of an industrial cyclone separator. Theresidue primarily comprises of semidolime (which can replace cement using calcined dolomite)which is directed onto the cyclone wall by the centrifugal action. The final product is thencollected from the base of the reactor. The gas, comprising of CO2 and steam, is ejected from thecyclone by forming a counter-circulating vortex which rises upwards through the exhaust tubeand can be captured for sequestration or re-utilization. The process produces less CO2 emissionsand semidolime can be used as a good binding agent (49).
9.2 Standards in Cement Industry
9.2.1 BIS Standards for CementsBIS standards for the OPC 53, PPC 33 and PSC 33 grade cements are given in Table 50-90,respectively. OPC 53 grade cement has the highest compressive strength of 53 MPa after 28days of curing time.

Eco-Friendly Cements Page 130
Table 50: BIS standards for OPC 53 (9)Particulars BIS specificationFineness (m2/kg) Minimum 225SoundnessLe Chatelier expansion (mm) Max. 10Auto-clave expansion (%) Max. 0.8Setting Time (Mins)Initial Minimum 30Final Max. 600Compressive Strength (MPa)3 days Min.27.07 days Min.37.028 days Min. 53.0
Table 51: BIS standards for PPC 33 (9)Particulars BIS specificationFineness (m2/kg) Minimum 300% Fly ash in PPC 15-35SoundnessLe Chatelier expansion (mm) Max. 10Auto-clave expansion (%) Max. 0.8Setting Time (Mins)Initial Minimum 30Final Max. 600Compressive Strength (MPa)3 days Min.16.07 days Min.22.028 days Min. 33.0
Table 52: BIS standards for PSC 33 (9)Particulars BIS specificationFineness (m2/kg) Minimum 300% Slag in PSC 25-65SoundnessLe Chatelier expansion (mm) Max. 10Auto-clave expansion (%) Max. 0.8Setting Time (Mins)Initial Minimum 30Final Max. 600Compressive Strength (MPa)3 days Min.16.07 days Min.22.028 days Min. 33.0
9.3 Emissions IntensityThe emissions during cement manufacturing can be classified into fugitive emissions and stackemissions. According to United States’ Environmental Protection Agency (US-EPA), fugitiveemissions are any solid particulate matter that becomes airborne by natural or man-madeactivities, excluding particulate matter emitted from an exhaust stack (which is referred as stack

Eco-Friendly Cements Page 131
emission) (50). The fugitive emissions are further sub-divided into primary, secondary andtertiary emissions based on generation.The different points of emission in cement manufacturing are shown in Figure 122 (51). Thenumbers highlighted in red are fugitive emissions. Stack emissions are marked by numbers inviolet color. The figure also shows the processes along with the types of emissions.According to CMA, the industry emitted 152 Mt of CO2 eq. in 2007. This corresponded to 6.8% ofthe total emissions in India and 32% of all the industrial sectors’ emissions.In 2000, approximately 99 Mt of CO2 eq. was emitted by the industry. The Compound AnnualGrowth Rate (CAGR) of CO2 eq. emissions was 6.4%. Figure 121 describes the trend. Thespecific emission of the industry has been decreasing from 0.96 to 0.89 t CO2 eq./t cementresulting in a CAGR of -1.2%.
Figure 121. Specific emission intensity of cement sector
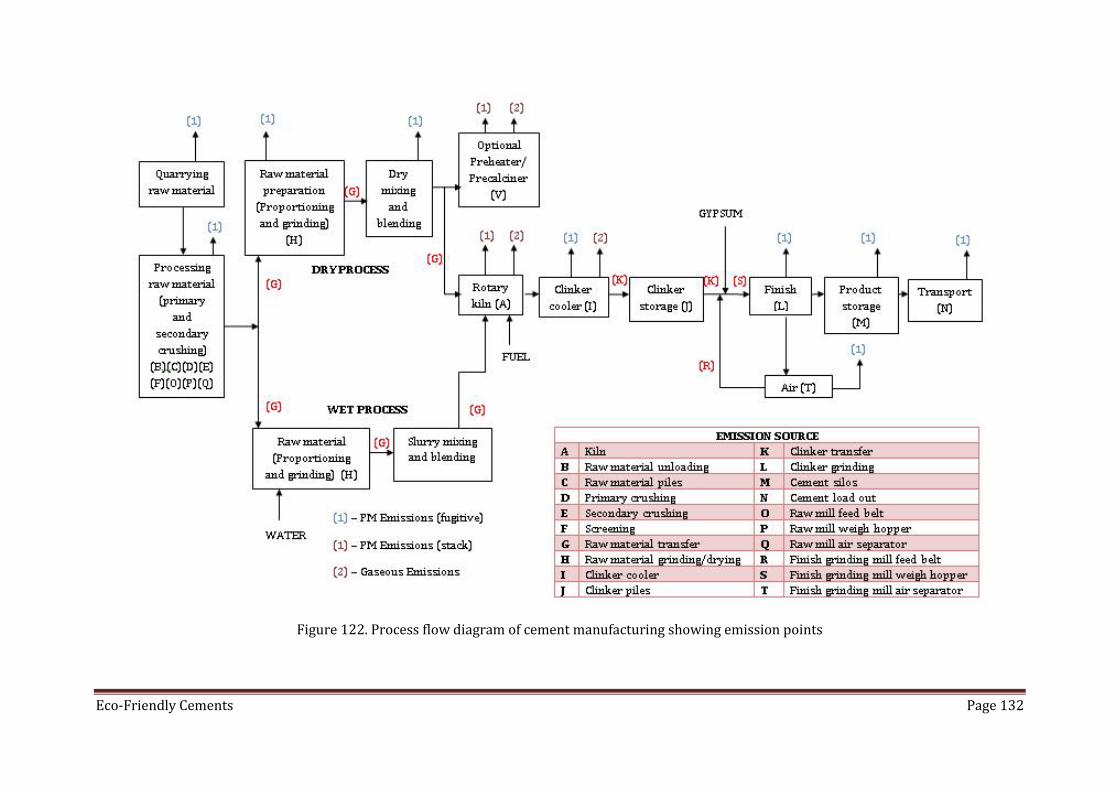
Eco-Friendly Cements Page 132Figure 122. Process flow diagram of cement manufacturing showing emission points
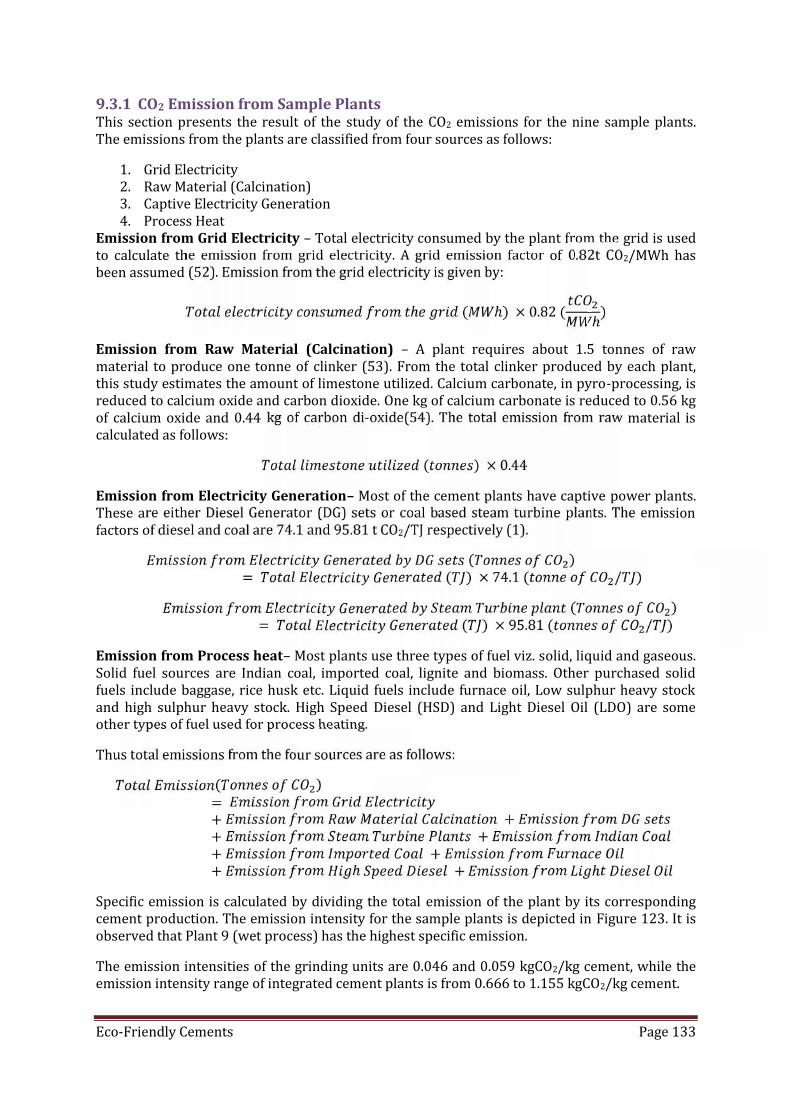
Eco-Friendly Cements Page 133
9.3.1 CO2 Emission from Sample PlantsThis section presents the result of the study of the CO2 emissions for the nine sample plants.The emissions from the plants are classified from four sources as follows:1. Grid Electricity2. Raw Material (Calcination)3. Captive Electricity Generation4. Process HeatEmission from Grid Electricity – Total electricity consumed by the plant from the grid is usedto calculate the emission from grid electricity. A grid emission factor of 0.82t CO2/MWh hasbeen assumed (52). Emission from the grid electricity is given by:ℎ ( ℎ) × 0.82 ( ℎ)Emission from Raw Material (Calcination) – A plant requires about 1.5 tonnes of rawmaterial to produce one tonne of clinker (53). From the total clinker produced by each plant,this study estimates the amount of limestone utilized. Calcium carbonate, in pyro-processing, isreduced to calcium oxide and carbon dioxide. One kg of calcium carbonate is reduced to 0.56 kgof calcium oxide and 0.44 kg of carbon di-oxide(54). The total emission from raw material iscalculated as follows: ( ) × 0.44Emission from Electricity Generation– Most of the cement plants have captive power plants.These are either Diesel Generator (DG) sets or coal based steam turbine plants. The emissionfactors of diesel and coal are 74.1 and 95.81 t CO2/TJ respectively (1).( )= ( ) × 74.1 ( / )( )= ( ) × 95.81 ( / )Emission from Process heat– Most plants use three types of fuel viz. solid, liquid and gaseous.Solid fuel sources are Indian coal, imported coal, lignite and biomass. Other purchased solidfuels include baggase, rice husk etc. Liquid fuels include furnace oil, Low sulphur heavy stockand high sulphur heavy stock. High Speed Diesel (HSD) and Light Diesel Oil (LDO) are someother types of fuel used for process heating.Thus total emissions from the four sources are as follows:( )=+ ++ ++ ++ ℎ + ℎSpecific emission is calculated by dividing the total emission of the plant by its correspondingcement production. The emission intensity for the sample plants is depicted in Figure 123. It isobserved that Plant 9 (wet process) has the highest specific emission.The emission intensities of the grinding units are 0.046 and 0.059 kgCO2/kg cement, while theemission intensity range of integrated cement plants is from 0.666 to 1.155 kgCO2/kg cement.
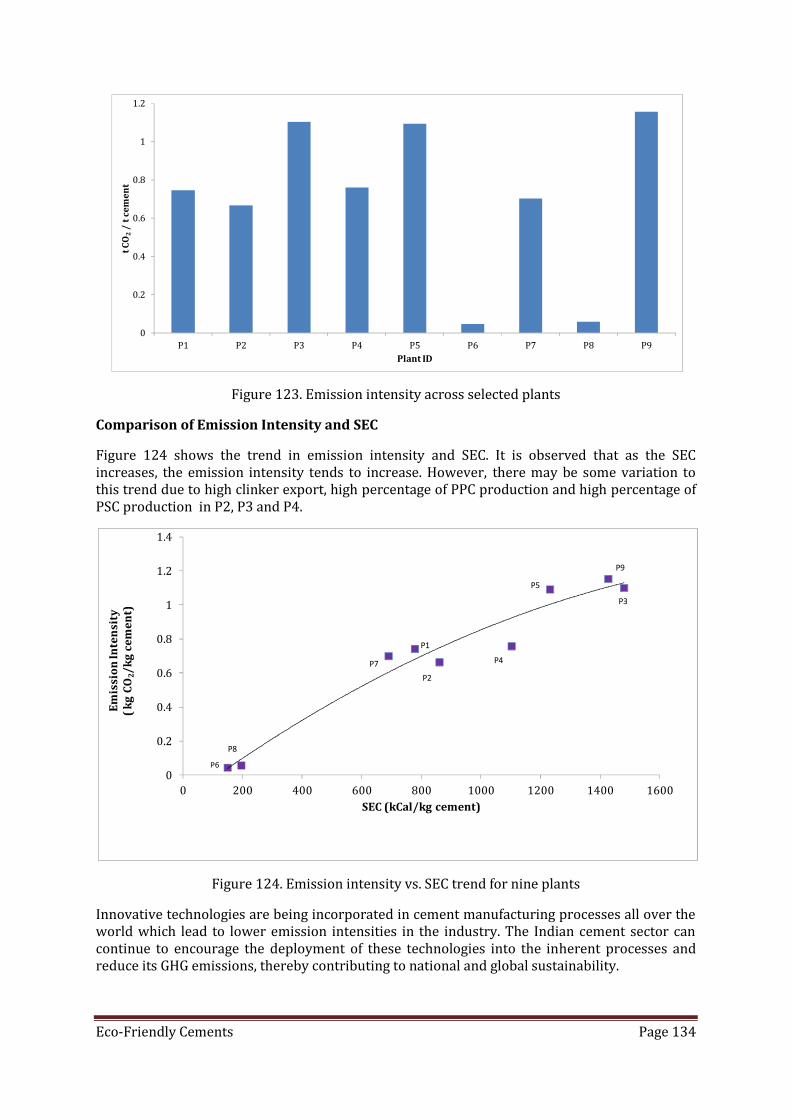
Eco-Friendly Cements Page 134
Figure 123. Emission intensity across selected plantsComparison of Emission Intensity and SECFigure 124 shows the trend in emission intensity and SEC. It is observed that as the SECincreases, the emission intensity tends to increase. However, there may be some variation tothis trend due to high clinker export, high percentage of PPC production and high percentage ofPSC production in P2, P3 and P4.
Figure 124. Emission intensity vs. SEC trend for nine plantsInnovative technologies are being incorporated in cement manufacturing processes all over theworld which lead to lower emission intensities in the industry. The Indian cement sector cancontinue to encourage the deployment of these technologies into the inherent processes andreduce its GHG emissions, thereby contributing to national and global sustainability.
00.20.40.60.8
11.2
P1 P2 P3 P4 P5 P6 P7 P8 P9
t CO
2/
t cem
ent
Plant ID
00.20.40.60.8
11.21.4
0 200 400 600 800 1000 1200 1400 1600
Emis
sion
Inte
nsit
y( k
g CO
2/kg
cem
ent)
SEC (kCal/kg cement)
P6
P8
P7
P1
P2
P4
P5
P9
P3
Challenges and Policies for Cement Industry Page 135
10. Challenges and Policies for Cement IndustryPAT is an innovative market based mechanism that aims to reduce the energy consumption ofDCs in India. Since it is in a nascent stage with the first cycle coming into effect shortly, adequatemanagement and policy measures need to be undertaken for it to be implemented acrossindustries. This chapter of the report looks at the challenges faced by the cement industryrelating to the improvement of energy efficiency of cement DCs and how policy regulations canplay a part in addressing them. It also describes certain policy measures to facilitate thefinancing of different EE measures.10.1 Fly Ash ConsumptionAccording to the Ministry of Commerce, the Indian cement industry consumed 35 Mt of fly- ashduring 2008-09(55). However, the total fly-ash generation was 130 Mt (56). This shows that thepotential of fly-ash utilization is yet to be completely exploited.Problems associated with fly-ash include (57):(a) Requirement of large area of land for disposal and(b) Toxicity associated with metals percolated to groundwaterFly-ash is considered a major waste and a source of air and water pollution. The quality of fly-ash is determined by the quality of coal used. Indian coal possesses high ash content (in therange of 35%-45%), with a low calorific value of 3500 kCal/kg to 4000 kCal/kg. Withincreasing power demand, coal shall continue to play a major role in the power generation andfuel mix. As a result of high coal utilization, the fly-ash expected to be generated is also high. By2012, the fly-ash generation is anticipated to increase to about 200 Mt.(57). Applications of fly-ash include:a) Cement and Concrete industry – accounts for 28% of fly-ash utilizationb) Low Lying Area Fill (17%)c) Roads and Embankments (15%)d) Dyke Raising (4%)e) Brick Manufacturing (2%)f) Safe disposal in paint industry, agriculture etc.Fly-ash is broadly classified into two major categories: Class F and Class C fly-ash. Class F fly-ashis produced by old anthracite and bituminous coal, and contains less than 10% of lime i.e., CaO.Class C fly-ash is produced from the combustion of lignite and sub bituminous coal. This fly-ashpossesses more than 20% of lime.The problem that could be faced by the cement industry is that fly-ash can follow a transitionalpath to becoming a commodity in the future. As the demand for fly-ash increases, it might not beseen as a mere waste product of industries. Instead it might be treated as a resource whoseprice will be determined by market conditions. Policies may be considered to regulate the priceof fly-ash in the future so that it continues to be a useful waste product.10.2 Slag ConsumptionSlag is a by-product generated during the manufacturing of pig iron and steel. The slag iscrushed, pulverized and screened for use in various applications, particularly in cementproduction because of its pozzolanic characteristics. Different types of slags find different usesin the industry. Granulated BF slag is used as a pozzolanic material for producing Portland slagcement. The component materials, viz. clinker, granulated slag and gypsum, are ground togetherin specified proportions for obtaining BF slag cement.
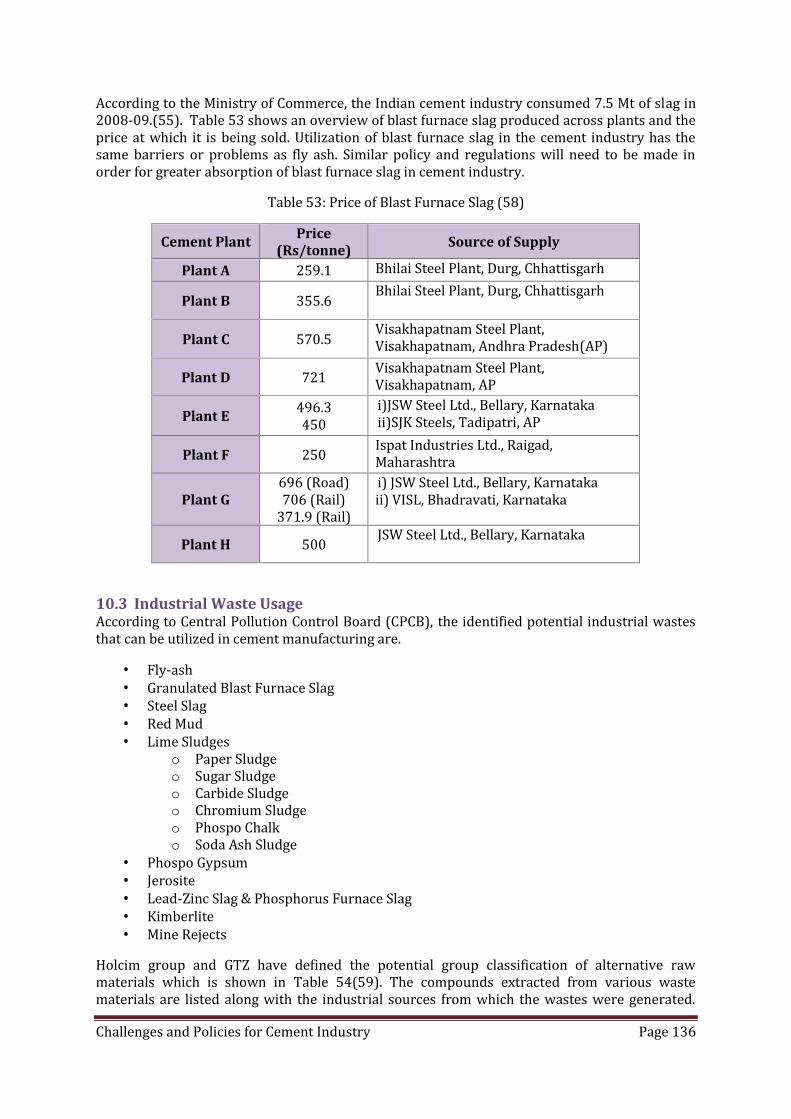
Challenges and Policies for Cement Industry Page 136
According to the Ministry of Commerce, the Indian cement industry consumed 7.5 Mt of slag in2008-09.(55). Table 53 shows an overview of blast furnace slag produced across plants and theprice at which it is being sold. Utilization of blast furnace slag in the cement industry has thesame barriers or problems as fly ash. Similar policy and regulations will need to be made inorder for greater absorption of blast furnace slag in cement industry.Table 53: Price of Blast Furnace Slag (58)Cement Plant Price
(Rs/tonne) Source of Supply
Plant A 259.1 Bhilai Steel Plant, Durg, ChhattisgarhPlant B 355.6 Bhilai Steel Plant, Durg, ChhattisgarhPlant C 570.5 Visakhapatnam Steel Plant,Visakhapatnam, Andhra Pradesh(AP)Plant D 721 Visakhapatnam Steel Plant,Visakhapatnam, APPlant E 496.3450 i)JSW Steel Ltd., Bellary, Karnatakaii)SJK Steels, Tadipatri, APPlant F 250 Ispat Industries Ltd., Raigad,MaharashtraPlant G
696 (Road)706 (Rail)371.9 (Rail) i) JSW Steel Ltd., Bellary, Karnatakaii) VISL, Bhadravati, KarnatakaPlant H 500 JSW Steel Ltd., Bellary, Karnataka
10.3 Industrial Waste UsageAccording to Central Pollution Control Board (CPCB), the identified potential industrial wastesthat can be utilized in cement manufacturing are. Fly-ash Granulated Blast Furnace Slag Steel Slag Red Mud Lime Sludges
o Paper Sludgeo Sugar Sludgeo Carbide Sludgeo Chromium Sludgeo Phospo Chalko Soda Ash Sludge
Phospo Gypsum Jerosite Lead-Zinc Slag & Phosphorus Furnace Slag Kimberlite Mine RejectsHolcim group and GTZ have defined the potential group classification of alternative rawmaterials which is shown in Table 54(59). The compounds extracted from various wastematerials are listed along with the industrial sources from which the wastes were generated.
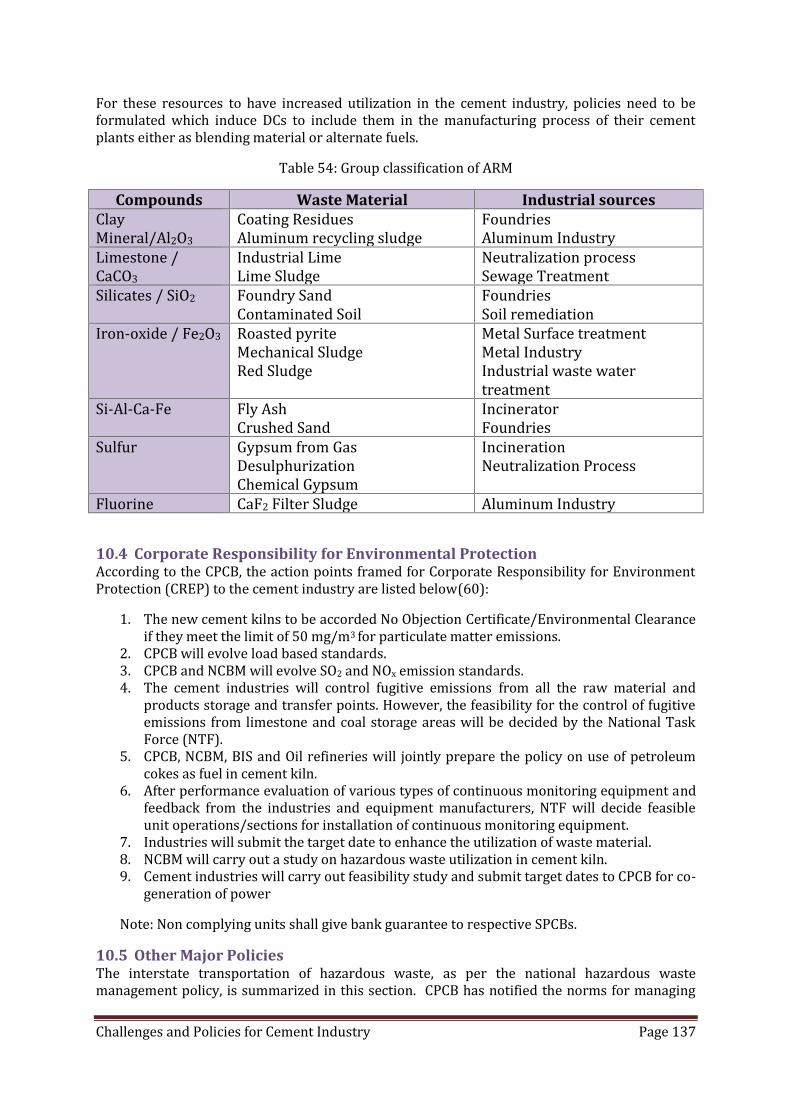
Challenges and Policies for Cement Industry Page 137
For these resources to have increased utilization in the cement industry, policies need to beformulated which induce DCs to include them in the manufacturing process of their cementplants either as blending material or alternate fuels.Table 54: Group classification of ARMCompounds Waste Material Industrial sourcesClayMineral/Al2O3 Coating ResiduesAluminum recycling sludge FoundriesAluminum IndustryLimestone /CaCO3 Industrial LimeLime Sludge Neutralization processSewage TreatmentSilicates / SiO2 Foundry SandContaminated Soil FoundriesSoil remediationIron-oxide / Fe2O3 Roasted pyriteMechanical SludgeRed Sludge Metal Surface treatmentMetal IndustryIndustrial waste watertreatmentSi-Al-Ca-Fe Fly AshCrushed Sand IncineratorFoundriesSulfur Gypsum from GasDesulphurizationChemical Gypsum IncinerationNeutralization ProcessFluorine CaF2 Filter Sludge Aluminum Industry
10.4 Corporate Responsibility for Environmental ProtectionAccording to the CPCB, the action points framed for Corporate Responsibility for EnvironmentProtection (CREP) to the cement industry are listed below(60):1. The new cement kilns to be accorded No Objection Certificate/Environmental Clearanceif they meet the limit of 50 mg/m3 for particulate matter emissions.2. CPCB will evolve load based standards.3. CPCB and NCBM will evolve SO2 and NOx emission standards.4. The cement industries will control fugitive emissions from all the raw material andproducts storage and transfer points. However, the feasibility for the control of fugitiveemissions from limestone and coal storage areas will be decided by the National TaskForce (NTF).5. CPCB, NCBM, BIS and Oil refineries will jointly prepare the policy on use of petroleumcokes as fuel in cement kiln.6. After performance evaluation of various types of continuous monitoring equipment andfeedback from the industries and equipment manufacturers, NTF will decide feasibleunit operations/sections for installation of continuous monitoring equipment.7. Industries will submit the target date to enhance the utilization of waste material.8. NCBM will carry out a study on hazardous waste utilization in cement kiln.9. Cement industries will carry out feasibility study and submit target dates to CPCB for co-generation of powerNote: Non complying units shall give bank guarantee to respective SPCBs.10.5 Other Major PoliciesThe interstate transportation of hazardous waste, as per the national hazardous wastemanagement policy, is summarized in this section. CPCB has notified the norms for managing
Challenges and Policies for Cement Industry Page 138
hazardous waste and their use in cement kilns through incineration. The potential use ofhazardous waste is discussed in this section.10.5.1 Interstate Transportation of Hazardous WasteBased on mutual consultation and agreement between the state governments, interstatemovement of hazardous waste could be permitted, in particular, to take care of difficulties facedby some states in development of Treatment, Storage and Disposal Facilities - such as not havingviable quantities of hazardous waste.The Pollution Control Boards or Pollution Control Committees could introduce on-line trackingsystem for movement of hazardous waste from generation to the disposal, recovery or recyclestage(61).10.5.2 Use of Cement Kilns for Hazardous Waste IncinerationField trials conducted by CPCB indicate that use of hazardous waste (such as effluent treatmentplant sludge from textile units, tire pieces, paint sludge, tar residue and refinery sludge) asalternative fuels in cement kilns, could be promoted. The use could be in compliance withnotified emission norms for hazardous waste incinerators, Reuse of hazardous waste, however,for instance paint sludge after reconditioning as primer/ coating, is a preferable option overincineration. Such alternative options to reuse the wastes and sludge could be explored andencouraged.The safer alternative to consider is incinerating the high calorific value hazardous waste incement kiln as compared to conventional incineration. Prior to the incineration, the wastesmust be subjected to suitable processing. Given the vast spread of cement plants across thecountry, the aforementioned option seems attractive. Sludge from petrochemical industry, oilrefinery and paint industry as well as residues from pesticide and drug industries areparticularly suitable for this purpose as they possess high calorific value. In the cement kilns,the high flame temperature of around 2000°C, high material temperature of around 1400°C andlarge residence time of around 4-5 seconds ensures that the material incinerates completely.The non-combustible residue including heavy metals gets mixed into the clinker. To avoid suchoccurrence, it is advisable to blend and process the metallic waste before introducing them intothe cement kiln. It is indicated from the field trials, conducted by CPCB that monitoringhazardous air pollutants followed by a compliance notification of emission norms for hazardouswaste use, needs to be promoted.10.6 Shortage of Raw Material and SubstitutesThe primary raw materials used to produce cement are limestone, gypsum and silica. During thevisit of committee of Ministry of Commerce to the cement plants, many companies shared theirconcerns about the diminishing lime stone reserves in India. They also mentioned that at thisrate, the current reserves may last only for 15-20 years. Further, gypsum an important additiveis being imported from other countries. On the other hand, natural sand, which is also known assilica is obtained from mining which leads to soil erosion and degradation.It is clear that research on materials that could replace limestone (if not fully but partially)needs to be undertaken in order to sustain the industry (62).10.7 Availability of CoalCoal acts as a major source of fuel for manufacturing cement. Therefore, it is of paramountimportance that the availability of proper quality of coal exists for a longer period of time.According to the 95th performance of Cement Industry report, Coal India Limited (CIL) andSingerani Colleries Co. Ltd (SCCL) are the major suppliers of indigenous coal for the cementindustry. It is learnt that in 2008-09, against a consumption of 29.58 Mt, CIL and SCCL supplied14.29 Mt, meeting only 48% of the total requirement. Around 15.28 Mt was procured from
Challenges and Policies for Cement Industry Page 139
other sources like open market purchases, import, use of pet coke, etc., at a higher cost, to meetthe requirements. Other reasons for this deficit is delay in signing the Fuel Supply Agreements(FSAs) by the cement and coal companies (62).The report also mentioned that as per the notification issued by the New Coal DistributionPolicy (NCDP) in 2007, the FSAs would be signed only for the 75% of the requirement based onthe norms, resulting in an initial shortage in the allocation of coal.Some of the suggestions provided by the Ministry of Commerce committee are as follows. Government should intervene to ensure the supply of coal at regular basis. FSAs should be signed without further delay. It is important that 80% or more coal of total requirement should be provided throughlinkages. This would restore the confidence of the investors.
10.8 Factors Attributed to High Retail Cost of Indian CementSome of the factors that are attributed to the high retail cost of Indian cement include: High cost of Raw Material High Power Cost High Transportation Cost Dependence on Road Transport for moving Clinker Variation in Freight ChargesThe associated economics need to be analyzed and avenues for alleviation of finances should beexplored by concerned authorities. Systemic evaluation of the components and their linkageswill address the shortcomings and identify the areas of improvement.
10.9 Environmental Pollution NormsWith any industrial activity, generation of waste and by-products is expected. In the case ofcement manufacturing, the associated process lead to pollution in the following ways (62) : Dust generation in specific sections of cement plants (crushers, raw mill, coal mill, kiln,clinker cooler, cement mill) Sulphur dioxide (SO2) emissions arising from oxidation of sulphur containingcompounds present in raw materials and fuel Nitrogen oxide (NOX) emissions from the plants (in the range of 400-1300 mg/m3) Carbon dioxide (CO2) emissions arising from calcination of limestone (50-55%),combustion of fossil fuels (40-50%) and electricity consumption (0-10%) CO2 intensity of the cement sector is 0.85kg CO2/kg cement produced. For the quantityof cement produced, 0.234 g of particulate matter, 1.5 g of SO2 and 3 g of NOX aregenerated as by-products or pollutants
The cement industry has taken the following steps to curb environmental pollution: Fly ash and BF slag have substituted clinker to a certain extent and this has led toreduced emissions of pollutants per tonne of cement produced Out of 130 Mt of fly ash generated in power plants per year, 34 Mt are utilized in thecement sector Out of the 13 Mt of BF slag generated by steel plants per year, 8 Mt are utilized in cementplants
Challenges and Policies for Cement Industry Page 140
10.10 Financing to Meet the EE GoalsPAT has set realistic goals and strives to drive the nation’s industrial economy towards a moreenergy efficient one. Some of the measures that can be taken to ensure sound financing of EEmeasures in the cement industry are listed below: Soft loans to the industry for specific energy efficiency improvement measures. Interest subsidies can be provided in case of standard loans availed by DCs fromfinancial institutions Partial Risk Guarantee funds such as those designed under the NMEEE.
10.11 Monitoring and ValidationMonitoring and Validation (M&V) is one of the most important aspects of a program and is a keyindicator to measure the success or failure of a program. Any M&V schema requires a clearelucidation of goals which should then be periodically measured. Ideally, the program(s) shouldbe flexible enough to allow mid-course corrections.The M&V protocols comprise of determining baseline, verifying energy conservation savingsand M&V implementation procedures and protocols.A project specific M&V plan could address the following (63): Describe the project site and the project; include information on how the project savesenergy and what key variables affect the realization of savings. Describe the M&V method to be used. Indicate who will conduct the M&V activities and prepare the M&V analyses anddocumentation. Define the details of how calculations will be made. Specify what metering equipment will be used, who will provide the equipment, itsaccuracy and calibration procedures. Include a metering schedule describing meteringduration and when it will occur, and how data from the metering will be validated andreported. Include data formats. Electronic, formatted data read directly from a meter ordata logger are recommended for any short- or long-term metering. Define what key assumptions are made about significant variables or unknowns. Definehow any baseline adjustments will be made. Describe any sampling that will be used, why it is included, sample sizes, documentationon how sample sizes were selected, and information on how random sample points willbe selected. Indicate how quality assurance will be maintained and replication confirmed.
10.12 ISO 50001 initiativeInternational Organization for Standardization (ISO) 50001: 2011 also known as EnergyManagement Standards (EMS) is a voluntary international standard developed by ISO(64). Itenables organizations to establish the systems and processes necessary to improve energyperformance. The incorporation of these standards should yield reductions in energyconsumption, energy costs and greenhouse gas emissions (65). It is designed to integrate withother management standards, especially ISO 14001 on environmental management and ISO9001 on quality management.ISO 50001 specifies requirements for factors affecting (66): Energy supply, use and consumption Measurement, documentation and reporting Design and procurement practices for energy using equipment, processes, system andpersonnel

Challenges and Policies for Cement Industry Page 141
ISO 50001 is based on the ISO management system. The system is recognized worldwide withstandards such as ISO 9001 (quality management), ISO 14001 (environmental management)and ISO 22000 (food safety). ISO 50001 follows the Plan-Do-Check-Act (PDCA) process forimprovement of the energy management system over time based on the best available data tothe organization.The planning process involves conducting the energy use assessment, establishing the baseline,energy performance indicators (EPIs), objectives, targets and action plans necessary to deliverresults that will improve energy performance (measurable results related to energy efficiency,use and consumption) in line with the organization's energy policy. Implementation of energymanagement action plans is a critical component of the doing process. Monitoring andmeasurement of the results and the key characteristics of operations that determine energyperformance against the energy policy and objectives, and reporting the results is the checkingprocess. The acting aspect involves steps to continually improve energy performance and theenergy management system (66). The salient components of the PDCA process are depictedinFigure 125. The integration of standards such as ISO 50001 in a suitable form with anappropriate M&V procedure could enable the increased realization of benefits under anindustrial EE program for industrial stakeholders.Management Technical
Plan Policy/goals/targets Resources
Plan Energy review Energybaseline EnergyPerformanceIndicators
Do Training Communication Documentation OperationalControl
Do Design Energypurchasing
Check Internal audit Corrective/Preventiveaction
Check Monitoring Measurement Verifyingaction plansresults
Act Managementreview Act
Energyperformanceand EnergyperformanceindicatorsreviewFigure 125. Essential Components of the PDCA Process (66)
ACT PLANCHECK DO

Page 142
Conclusions Page 143
11. ConclusionsThis report has examined the status of energy efficiency in the Indian cement industry. Acomprehensive study of the cement manufacturing process, the material and energy flows,process modeling and financial analysis of several measures in a range of cement plants hasbeen carried out. A study of the diversity of plant operating conditions and performanceparameters for several sample plants has been presented. This study will be useful in examiningthe significance of various factors in order to normalize the baseline SEC of a cement plant. Apreliminary agent based model was utilized to simulate the response of various industrial unitsto a specific SEC norm. Emission intensities and a scenario analysis of the impact of SEC normson a range of sample plants have been provided.Energy audit studies have estimated 5-10% energy savings in thermal and electrical energyconsumption in cement plants by adopting different energy conservation measures. It isestimated that saving of 5 kCal/kg clinker of thermal energy and 1 kWh/t cement of electricalenergy will result in total savings of about Rs 6 Million per annum in a typical 1 Mt capacityplant.The key levers for improving EE in a typical cement plant are:EE Technologies: A variety of efficient technologies can be utilized in order to contribute toenergy savings in the thermal energy and electrical energy consuming equipment.Using waste heat recovery (WHR) systems: The waste heat available in the exhaust gases can berecovered and converted into useful form as required by the cement plant.Blending: Approximately 20-30% of fly-ash and 45-50% of blast furnace slag is added to theclinker which could be increased further.Alternative Fuel Resources (AFR): Currently only a small percentage of the industry uses AFR.There is a large scope of increasing the percentage of alternative resources such as industrialwastes, bio waste, rice husk etc.Captive Power Plant (CPP): The station heat rate reduction, energy savings from auxiliarypower consumption and using recovered waste heat in CPP are some of the ways to reduceenergy consumption.The cement industry in India is second largest in the world and has plants which are among themost efficient globally. The cement industry has been playing a vital role in the development ofthe Indian economy and has been overcoming various challenges while doing so. Various policyissues related to ameliorating these challenges have been discussed in this report.It is observed that focused effective mechanisms such as PAT can contribute to an acceleratedmitigation of the energy intensity of the Indian cement sector when accompanied by aframework to support the financing of EE projects. Such mechanisms can contribute to reducingthe projected energy consumption of the cement industry and of the country while loweringGHG emissions, thereby mitigating global warming and climate change.Energy efficiency in India is a national priority given that large sections of rural households donot have access to energy. The Indian cement industry and energy policy implementing agenciessuch as the BEE are vital enablers on the country’s roadmap for low-carbon inclusive growth.

Page 144
References Page 145
References1. MoEF. India: Greenhouse Gas Emissions 2007. 2010.
2. Planning Commission. Low Carbon Growth - Interim report. 2011.
3. IEA. International Energy Agency. [Online] 2010.http://www.iea.org/stats/balancetable.asp?COUNTRY_CODE=IN.
4. CII. Low Carbon Roadmap for Indian Cement Industry. Hyderabad : CII - Green Business Centre,2010.
5. Dr.S.K.Handoo. CII-GBC. [Online] 2011.http://www.greenbusinesscentre.com/site/ciigbc/viewprest.jsp?eventid=272083&event=272083&event=dd&dated=218662.
6. IEA. Energy Transition For Industry India And The Global Context. 2011.
7. BEE. PAT Consultation Document. s.l. : BEE, 2011.
8. Taylor, Harold F.W. Cement Chemistry. London : Academic Press, 1990. ISBN 0 - 12 - 683900 -X.
9. CII-GBC. Cement formulae handbook. s.l. : CII, 2010.
10. FLSmidth. Preheater brochure. [Online] July 27, 2011.http://www.flsmidth.com/~/media/Brochures/Brochures%20for%20kilns%20and%20firing/preheater_lores.ashx. C 03-11 400-12 -ENG.
11. Deolalkar, S P. Handbook for Designing Cement Plants. Hyderabad : s.n., 2008. 978-81-7800-145-4.
12. Chemistry and Engineering of The Production Process: State of The Art. Francois, Sorrentino.616, s.l. : Elsevier Limited, 2011, Vol. 41.
13. Mohanty, Brahmanand. Technology, Energy Efficiency and Environmental Externaities in theCement Industry. s.l. : Asian Institute of Technology, 1997.
14. Energy Efficiency Asia. IndustrySectorsCement Draft Report. [Online] 2005.http://www.energyefficiencyasia.org/docs/IndustrySectorsCement_draftMay05.pdf.
15. McCabe, Smith and Harriott. Unit Operations of Chemical Engineering. Singapore : Mc GrawHill, 1993. ISBN 0-07-112738-0.
16. Peray, Kurt E. The Cement Manufacturer's Handbook. New York : Chemical Publishing Co.,Inc., 1979.
17. V.K.Batra, P.N.Chhangani, Dinesh Satija and R.B.Garg. Capacity Enhancement and EnergyConservation in Cement Plant. s.l. : Holtec Consulting Private Ltd, Gurgaon, 2004.
18. Cement Task Force. Asia-Pacific Partnership. 2006.
19. High Efficiency Motors. Haridkar, Prasad. Pune : AEEE, 2011. Workshop on Energy Efficiencyin Rotating Equipment.
20. BEE. Energy Managagement Training. [Online] 2009.http://www.energymanagertraining.com/Journal/Technological%20Trends%20in%20Cement%20Industry.pdf.

References Page 146
21. H.Conroy, Geoffrey. Cement Plant Expansion Cost Evaluation for New and UpgradedInstallations. s.l. : KHD. Georgia, 1998.
22. Energy Auditing and Recovery for Dry Type Cement Rotary Kiln Systems. al, Tahsin Engin et.s.l. : Elsevier, 2004, Vol. 46.
23. CII-GBC. Manual on Waste Heat Recovery in Indian Cement Industry. s.l. : CII, 2009.
24. Banthia, S. Waste Heat Recovery System. Green Cementech 2011. Hyderabad : s.n., 2011.
25. Cement Manufacturers Association. Annual Report 2009 - 10. s.l. : Cement ManufacturersAssociation, 2010.
26. UNFCCC. UNFCC-CDM. [Online] 2011. http://cdm.unfccc.int/Projects/DB/DNV-CUK1149496574.99/ReviewInitialComments/EJ4AQTXS14IOL5Q6Z6DWI74PDR22AV.
27. Holcim. Fact Sheets. [Online] 2008.http://www.hcb.ch/holcimcms/uploads/CORP/Holcim_FactSheet_AFR_2008.pdf.
28. CEMBUREAU. [Online]http://www.cembureau.be/sites/default/files/Sustainable%20cement%20production%20Brochure.pdf.
29. WBSCD. Environmental Compatability of Cement and Concrete – Manufacture, Application andUse of Alternative Materials. s.l. : wbcsd, 2011.
30. S.Balasubramaniam, R.Vasantha Kumar. Waste into Wealth. s.l. : The Minerals, Metals andMaterials Society, 2008. p. 4.
31. Tirthankar. Captive generation in India. [Online] 2011. www.idfc.com/pdf/report/Chapter-12.pdf.
32. DECPL. BEE Code Cogeneration. Vadodara : s.n., 2006.
33. CEA. Annual Report. 2009 - 10.
34. Singh, Braj Nandan. Energy Efficiency in Thermal Power Plants.
35. Sargent, Lundy. Coal Fired Power Plant Heat Rate Reductions. Chicago : s.n., 2009.
36. Ganeshan, V. CII - GBC.http://www.greenbusinesscentre.com/site/ciigbc/viewprest.jsp?eventid=272083&event=272083&event=dd&dated=218662. [Online] May 6, 2011. [Cited: August 10, 2011.]
37. Taneja, Vivek. CII - GBC. [Online] May 6, 2011. [Cited: August 10, 2011.]
38. Investors Manual for Energy Efficiency in Small and Medium Scale Enterprises. s.l. :Confederation of Indian Industry, 2006.
39. Advanced training programme on energy management. Confederation of Indian Industry -Green Business Center. Vijayawada : CII, 2010.
40. FL Smidth. [Online] www.flsmidth.com.
41. Agent-Based Computing: Promise and Perils. Jennings, Nicholas R. s.l. : University of London,1999.
42. Wooldridge. Agent-based software. IEE Proc Software Engineering. 1997, Vols. 144:26-37.

References Page 147
43. Manufacture of Eco friendly and Energy Efficient Alinite Cements from Flyash and other BulkWastes. Pradip and Kapur, P.C. 1, Pune : Tata Research Development and Design Center, 2004,Resources Processing, Vol. 51.
44. Structure and Properties of a Finite and Alinite Cements. B Noudelman, M Bikbaou, ASventsitski, V Ilukhine. s.l. : 7th International Congress on the Chemistry of Cement, 1980, Vols.Vol 3 V169-174.
45. Novacem. The Novacem solution. Novacem - Carbon Negative Cement. [Online] 2012.http://novacem.com/technology/novacem-technology/.
46. Hart, Kelly. Magnesium Based Cement. Green home Building. [Online] 2010.http://www.greenhomebuilding.com/articles/ceramicrete.htm.
47. CALERA. Our Process. CALERA. [Online] 2012. http://calera.com/index.php/technology/.
48. ARB. Air Resources Board, California Environmental Protection Agency. [Online] 2009.http://www.arb.ca.gov/cc/etaac/meetings/102909pubmeet/mtgmaterials102909/basicsofcaleraprocess.pdf.
49. Calix. Proven Flash Calcination Technology. Calix. [Online] 2011.http://www.calix.com.au/technology.html.
50. EPA. Fugitive and Stack emissions. Environmental Protection Agency. [Online] 1998.http://www.epa.gov/osw/nonhaz/industrial/special/ckd/ckd/ckdp0101.pdf.
51. PCB. Assessment of Fugitive Emissions & Developement of Environmental Guidelines for controlof Fugitive Emissions in Cement Manufacturing Industries. s.l. : Central Pollution Control Board,MoEF, 2007.
52. CEA. CO2 Baseline Database For the Indian Power Sector - User Guide. New Delhi : CentralElectricity Authority, 2011.
53. Galitsky, Ernst Worrell and Christina. Energy Efficiency Improvement and Cost SavingOpportunities for Cement Making. s.l. : Environmental Energy Technologies Division LBNL, 2008.
54. Emission Reduction of Greenhouse Gases from the Cement Industry. C.A.Hendriks,E.Worrell,D.de.Jager,K.Blok and P.Riemer. s.l. : GHG Control Technologies Conference, 2004.
55. Commerce, Ministry of. Ninety Fifth Report on Performance of Cement Industry. New Delhi :Rajya Sabha Secretariat, 2011.
56. Pankaj Dewangan, Manoj Pradhan, Naval Kishore. Utilization of Fly Ash as a Structural FillMaterial for Safe and Sustainable Development: Need of the Hour. The IME Journal. [Online] 2008.[Cited: January 19, 2012.] theimejournal.com/aug/134_139.pdf.
57. Fly Ash Utilization in Different Sectors in Indian Scenario. Alam, J and Akhtar, M. N. s.l. :International Journal of Emerging trends in engineering and development, 2011, International Journalof Emerging trends in Engineering and Development.
58. Indian Bureau of Mines. Slag-Iron and Steel. [book auth.] Indian Bureau of Mines. IndianMinerals Yearbook 2009. Nagpur : s.n., 2011.
59. GTZ-Holcim Public Private Partnership. Guidelines on Co-processing Waste Materials inCement Production. s.l. : Holcim Group Support Ltd and GTZ, 2006.
60. Central Pollution Control Board. Corporate Responsibility for Environment Protection. s.l. :Central Pollution Control Board, 2003. Chapter on CREP.

References Page 148
61. MoEF. Hazardous Substances Management Division. Ministry of Environment and Forest.[Online] 2012. [Cited: January 20, 2012.] moef.gov.in/divisions/hsmd/NationalHazardous.pdf.
62. Rajya Sabha Secretariat. Ninety Fifty Report on Performance of Cement Industry. New Delhi :s.n., 2011.
63. AEP Efficiency. Measurement and Verification (M&V) Guidelines: Retrofit, CommercialProgram Manual. 2011.
64. ISO. ISO 50001 and its benefits. 2011.
65. Huang, E.G.T. Understanding the requirements of the energy management system certification.SGS. [Online] 2011. http://www.sgs.com/sgs-energy-management-white-paper-en-11.pdf.pdf.
66. ISO 50001: Energy Management Systems Standard. Chakaravarti, K.K. New Delhi : DRDO,2011.
67. KHD. [Online] www.khd.com.
68. ThyssenKrupp Polysius. [Online] www.polysius.com.
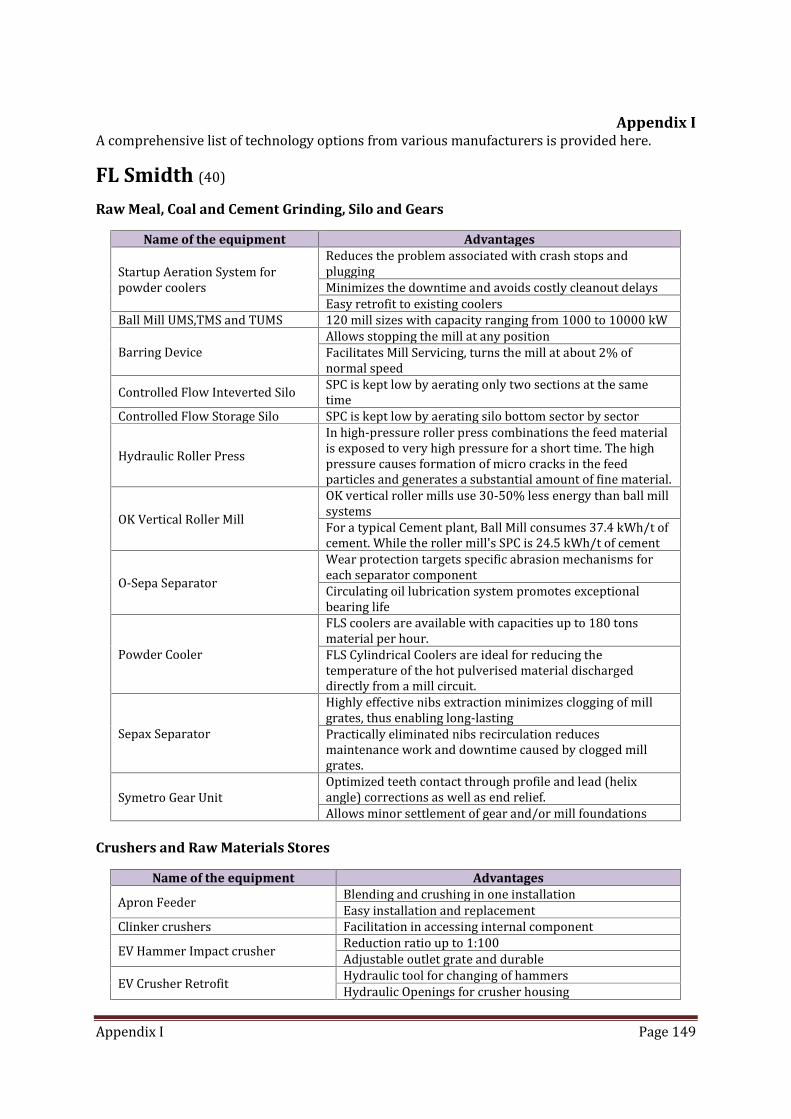
Appendix I Page 149
Appendix IA comprehensive list of technology options from various manufacturers is provided here.FL Smidth (40)Raw Meal, Coal and Cement Grinding, Silo and Gears
Name of the equipment AdvantagesStartup Aeration System forpowder coolers Reduces the problem associated with crash stops andpluggingMinimizes the downtime and avoids costly cleanout delaysEasy retrofit to existing coolersBall Mill UMS,TMS and TUMS 120 mill sizes with capacity ranging from 1000 to 10000 kWBarring Device Allows stopping the mill at any positionFacilitates Mill Servicing, turns the mill at about 2% ofnormal speedControlled Flow Inteverted Silo SPC is kept low by aerating only two sections at the sametimeControlled Flow Storage Silo SPC is kept low by aerating silo bottom sector by sectorHydraulic Roller Press In high-pressure roller press combinations the feed materialis exposed to very high pressure for a short time. The highpressure causes formation of micro cracks in the feedparticles and generates a substantial amount of fine material.OK Vertical Roller Mill OK vertical roller mills use 30-50% less energy than ball millsystemsFor a typical Cement plant, Ball Mill consumes 37.4 kWh/t ofcement. While the roller mill's SPC is 24.5 kWh/t of cementO-Sepa Separator Wear protection targets specific abrasion mechanisms foreach separator componentCirculating oil lubrication system promotes exceptionalbearing lifePowder Cooler FLS coolers are available with capacities up to 180 tonsmaterial per hour.FLS Cylindrical Coolers are ideal for reducing thetemperature of the hot pulverised material dischargeddirectly from a mill circuit.Sepax Separator Highly effective nibs extraction minimizes clogging of millgrates, thus enabling long-lastingPractically eliminated nibs recirculation reducesmaintenance work and downtime caused by clogged millgrates.Symetro Gear Unit Optimized teeth contact through profile and lead (helixangle) corrections as well as end relief.Allows minor settlement of gear and/or mill foundations
Crushers and Raw Materials Stores
Name of the equipment AdvantagesApron Feeder Blending and crushing in one installationEasy installation and replacementClinker crushers Facilitation in accessing internal componentEV Hammer Impact crusher Reduction ratio up to 1:100Adjustable outlet grate and durableEV Crusher Retrofit Hydraulic tool for changing of hammersHydraulic Openings for crusher housing

Appendix I Page 150
Hammer crushers without inlet grate Adjustable crushing platesHammer Mill Driers Moisture content of the raw materials is reduced to 1-3%At the same time gas stream is cooled down to atemperature between 100-150oCMaintenance cost is lowMCH Twin Shaft Breaker Crushes soft and sticky materialsLow power consumptionStable and trouble free operationEasy Install, Adjust and maintenanceRoller Crushers Designed for Soft chalk and clayStacker and Recalimer
Suitable for Raw materials in the cement, coal, pulp andpaper, mining and othersAlso used in the Power plantAvailable methods are chevron, windraw, Windraw openpile, Continuous chevronCone shell. Touch view graphical Flatplate in operatorcabinHomogenous storageKilns and Firing
Name of the equipment Advantages
ABC Air Blast Controlledcooler inletPrevents dead zonesEnsures uniform clinker distributionIntroduces flexible control of air blastingBased on well-proven Mechanical Flow Regulator (MFR) systemSuitable for both new coolers and for retrofitting
Air-to-Air Heat Exchanger Stabilized kiln operationImproved cooler vent system controlReduced power consumptionReduced filter maintenanceUtilise the power ofalternative fuels Market-leading products, solutions and services that help youreduce fuel costs and cut CO2 emissionsATOX Coal Mill
High-efficiency mill grinding coal, lignite pet coke, anthracite, etc.Dynamic rotary separator ensures high-grade end product.Compact design minimizes space requirement.Segmented roller and table wear parts prolong service life andfacilitate installation.Large rollers permit coarser feed and ensure a thick grinding bed.No auxiliary drive needed.High flexibility ensures stable operation, even during lowproduction load.Optimized air distribution reduces pressure loss.Kiln Gas Bypass Systems
Dual layer dip tubeQuench air inlet flap valveControl scheme for maximum stabilitySpecial lining design in transition pipe sectionConstant force support systemMultiple layout possibilitiesCast central pipe for cyclones Improves cyclone efficiencyMinimizes clogging tendencyEasy to install and maintainReadily available from stockCIS/MFR fixed inlet coolerretrofit Customized Mechanical Flow Regulator (MFR) patternConstant and self-regulated air-flow to each grate plateAir-blaster channels maintain constant clinker flowCONDITIONING TOWERS,LYR Conditioning towers in the cement industry are used for coolingexhaust gases from the kiln before they are conveyed to the

Appendix I Page 151
electrostatic precipitators
Coolax Grate Cooler
Fuel savings of 30-40 kcal/kg clinker30% less cooling air and 40% less air to be dedustedLow overall power consumptionEffective and consistent cooling of clinkerMore stable high capacity kiln and cooler performance due to Lessdust circulation and no blowing through of cooling airLow maintenance costs due to minimum wear on grate plates andmovable partsLess red river tendency due to the Controlled Flow Grate systemLess snowman tendencyLess falling through of clinkerSmall overall dimensions due to high specific grate load (up to 60t/m2 per 24 hours).Co-processing ofwaste Reduction of fuel costsEnvironmental benefitsSaving of fossil fuel resourcesDry process kilnsystems Highly reliableLow emission levelsEfficient energy utilizationDUOFLEX Improved heat economyWidely adjustable flame shapeEasy change-over between fuelsSuitable for alternative fuels
Grate Cooler CFG-Retrofit
Upgrading existing grate coolers with theCFG system offers:Fuel savings of 25-40 kcal/kg clinkerLess cooling air consumption and reduction of air to be deductedReduced overall power consumptionEffective and even cooling of clinkerMore stable high capacity kiln and cooler performance due to less dustcirculation and no blowing through of cooling airLow maintenance costs due to minimum wear on CFG grate plates andmovable partsLess red river tendency due to the Controlled Flow Grate systemLess snowman tendencyLess falling through of clinkerShort payback period.GUNNAX co-processing of waste To reduce the generation of waste at source.To increase recovery of waste.To dispose of the waste in a satisfactory way.HOTDISC technology Simple to operateLumpy waste derived fuelEfficient combustionReduced operational costHRB · Heavy-dutyRoll Breaker Maximum availabilityUnique position of shafts allows adjustment of gapsLarge coatings easily broken downHRB MF Heavy-dutyRoll Breaker ModularFrame
Maximum reliabilityLow maintenanceUnique shaft arrangementsModular designKiln Inlet LamellaSeal Some of the advantages ofExtremely flexible Sealing between kiln and preheaterindependent of kiln rotationInsulation incorporated to protect the lamella spring effect
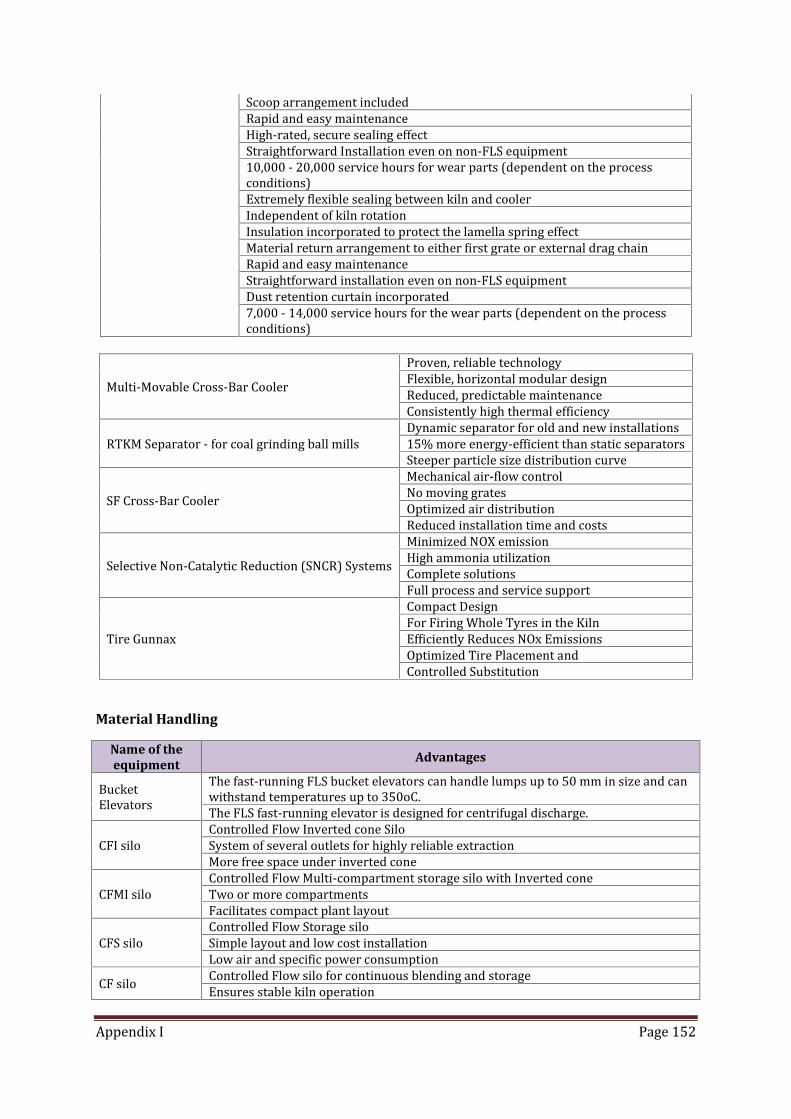
Appendix I Page 152
Scoop arrangement includedRapid and easy maintenanceHigh-rated, secure sealing effectStraightforward Installation even on non-FLS equipment10,000 - 20,000 service hours for wear parts (dependent on the processconditions)Extremely flexible sealing between kiln and coolerIndependent of kiln rotationInsulation incorporated to protect the lamella spring effectMaterial return arrangement to either first grate or external drag chainRapid and easy maintenanceStraightforward installation even on non-FLS equipmentDust retention curtain incorporated7,000 - 14,000 service hours for the wear parts (dependent on the processconditions)Multi-Movable Cross-Bar Cooler Proven, reliable technologyFlexible, horizontal modular designReduced, predictable maintenanceConsistently high thermal efficiencyRTKM Separator - for coal grinding ball mills Dynamic separator for old and new installations15% more energy-efficient than static separatorsSteeper particle size distribution curveSF Cross-Bar Cooler Mechanical air-flow controlNo moving gratesOptimized air distributionReduced installation time and costsSelective Non-Catalytic Reduction (SNCR) Systems Minimized NOX emissionHigh ammonia utilizationComplete solutionsFull process and service supportTire Gunnax Compact DesignFor Firing Whole Tyres in the KilnEfficiently Reduces NOx EmissionsOptimized Tire Placement andControlled Substitution
Material Handling
Name of theequipment AdvantagesBucketElevators The fast-running FLS bucket elevators can handle lumps up to 50 mm in size and canwithstand temperatures up to 350oC.The FLS fast-running elevator is designed for centrifugal discharge.CFI silo Controlled Flow Inverted cone SiloSystem of several outlets for highly reliable extractionMore free space under inverted coneCFMI silo Controlled Flow Multi-compartment storage silo with Inverted coneTwo or more compartmentsFacilitates compact plant layoutCFS silo Controlled Flow Storage siloSimple layout and low cost installationLow air and specific power consumptionCF silo Controlled Flow silo for continuous blending and storageEnsures stable kiln operation

Appendix I Page 153
High blending efficiencyChange-overvalve For conveying of raw meal, cement, precipitator dust, coal mealReliable and efficient in pneumatic systemsDesigned for easy maintenanceDosimat Feeder
Cost Effective systemExtraction/proportioning of sticy/abrasive and coarse materials in one unitOnline calibrationLess than +/- 0.5 deviation from normal feed rateAutomatic adjustment for variations in bulk densityFrequency regulated AC or Hydraulic drive.Drag chainConveyors Can withstand temperatures up to 350oC, and up to 400oC if fitted with specialchains. 400- 500oC is allowed for a short periodFluxo fillingdevice Movable bulk loader for trucks or wagons makes filling easy and swiftHighly flexible conveying system from silo outlet to loading pointFluxo Pumpretrofit Higher conveying capacityMore stable operationLess maintenance and greater availabilityLower power consumptionLarge pneumaticship unloaders
Ship sizes from 9,000 to 40,000 DWTUnloading capacity up to 600 tphPneumatic unloading direct to storageStationary or mobile unitsDiesel or electrically drivenRubber BeltconveyorsScrewConveyors FLS Serew Conveyors are designed for inclined transport (up to 8o') of material withtemperatures below 300oC. They have a conveying capacity up to 550 m3/h and aremanufactured up to 60 m length.Largemechanicalship-unloaders Efficient and dust-reducingShip sizes up to 70,000 dwtStandard unloading capacity from 200 tph to 2000 tphFLSmidthTerminalSolutionsComplete project capabilityMechanical and pneumatic shipunloadersStorage silos and domesFloating terminals
Name of theequipment Advantages
Pneumatic transportfor the fly ashManagement Industry3-in-1: blender, storage, efficient dischargeNo moving parts, low maintenanceNo mechanical wearing parts, low noiseGentle blending actionStorage and blending combined into one vesselCan be effectively used to overcome bridging or funnel flow when dischargingsilosRapid and total discharge capabilityBucket ElevatorsCentral pulse filterChange over ValveDrag chainFiltax jet pulse filterFluxo Pump retrofitFluxo SlidesGas control valveHaf Fans
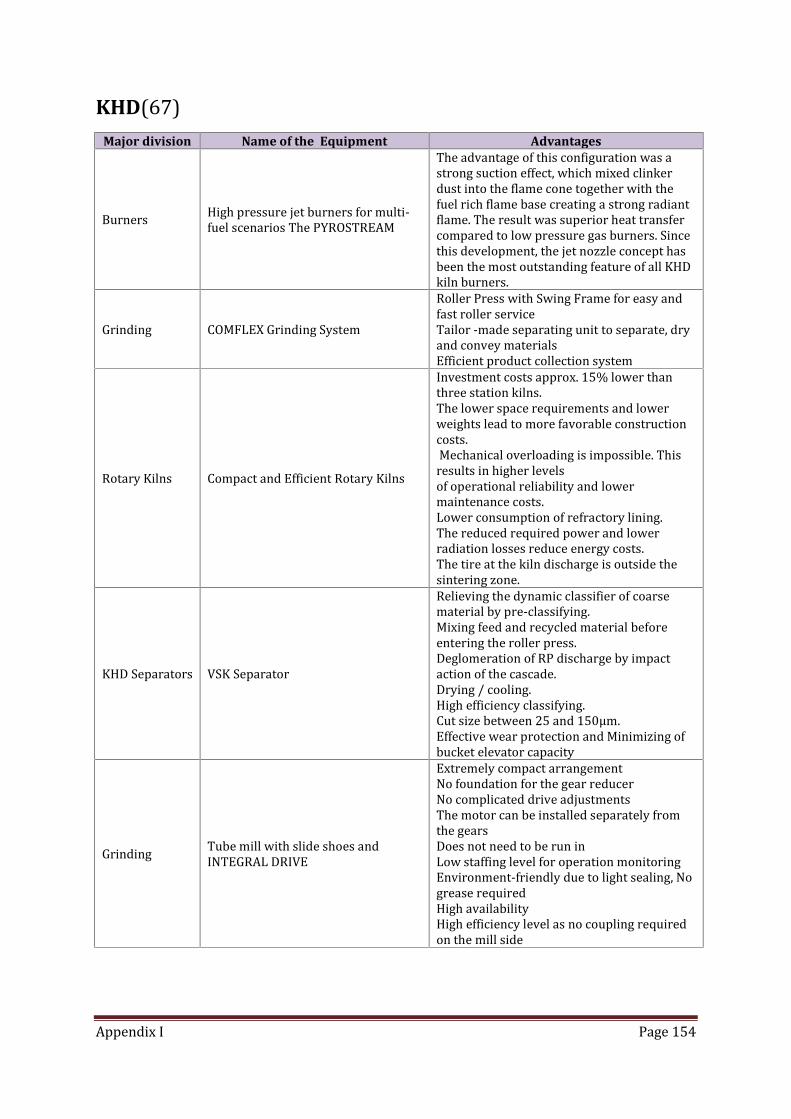
Appendix I Page 154
KHD(67)Major division Name of the Equipment Advantages
Burners High pressure jet burners for multi-fuel scenarios The PYROSTREAMThe advantage of this configuration was astrong suction effect, which mixed clinkerdust into the flame cone together with thefuel rich flame base creating a strong radiantflame. The result was superior heat transfercompared to low pressure gas burners. Sincethis development, the jet nozzle concept hasbeen the most outstanding feature of all KHDkiln burners.
Grinding COMFLEX Grinding System Roller Press with Swing Frame for easy andfast roller serviceTailor -made separating unit to separate, dryand convey materialsEfficient product collection system
Rotary Kilns Compact and Efficient Rotary Kilns
Investment costs approx. 15% lower thanthree station kilns.The lower space requirements and lowerweights lead to more favorable constructioncosts.Mechanical overloading is impossible. Thisresults in higher levelsof operational reliability and lowermaintenance costs.Lower consumption of refractory lining.The reduced required power and lowerradiation losses reduce energy costs.The tire at the kiln discharge is outside thesintering zone.
KHD Separators VSK SeparatorRelieving the dynamic classifier of coarsematerial by pre-classifying.Mixing feed and recycled material beforeentering the roller press.Deglomeration of RP discharge by impactaction of the cascade.Drying / cooling.High efficiency classifying.Cut size between 25 and 150μm.Effective wear protection and Minimizing ofbucket elevator capacity
Grinding Tube mill with slide shoes andINTEGRAL DRIVE
Extremely compact arrangementNo foundation for the gear reducerNo complicated drive adjustmentsThe motor can be installed separately fromthe gearsDoes not need to be run inLow staffing level for operation monitoringEnvironment-friendly due to light sealing, Nogrease requiredHigh availabilityHigh efficiency level as no coupling requiredon the mill side
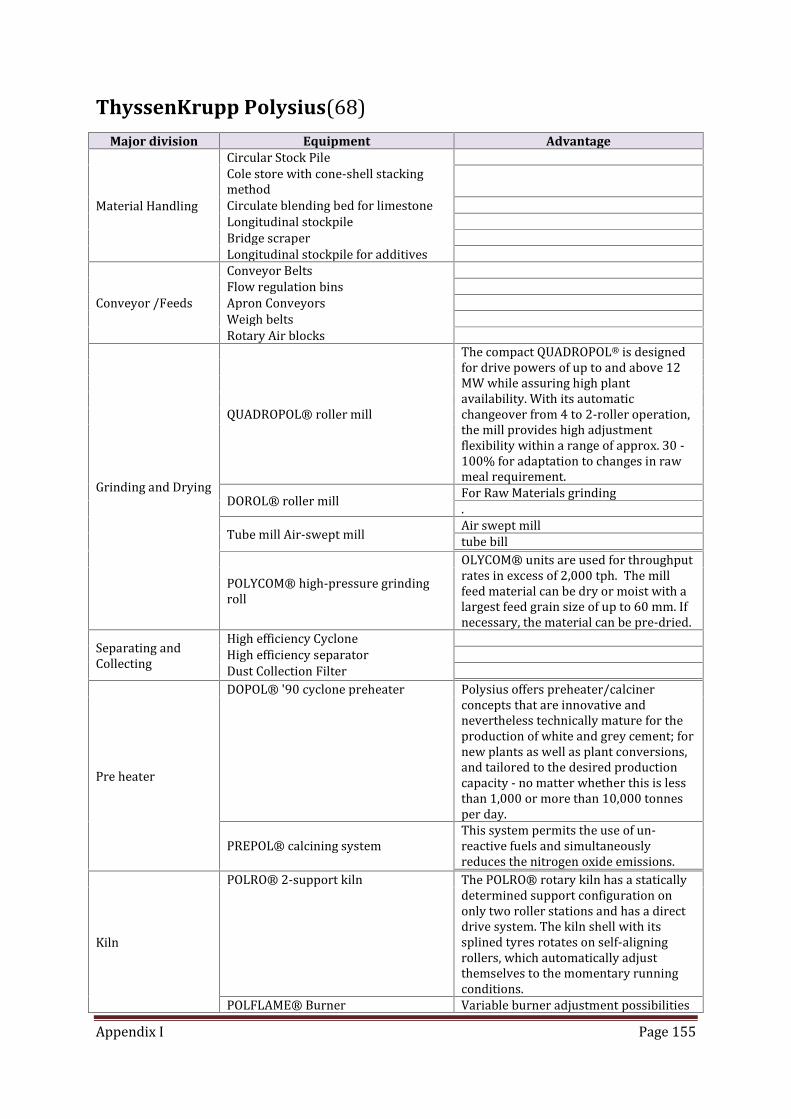
Appendix I Page 155
ThyssenKrupp Polysius(68)Major division Equipment Advantage
Material HandlingCircular Stock PileCole store with cone-shell stackingmethodCirculate blending bed for limestoneLongitudinal stockpileBridge scraperLongitudinal stockpile for additives
Conveyor /Feeds Conveyor BeltsFlow regulation binsApron ConveyorsWeigh beltsRotary Air blocks
Grinding and DryingQUADROPOL® roller mill
The compact QUADROPOL® is designedfor drive powers of up to and above 12MW while assuring high plantavailability. With its automaticchangeover from 4 to 2-roller operation,the mill provides high adjustmentflexibility within a range of approx. 30 -100% for adaptation to changes in rawmeal requirement.DOROL® roller mill For Raw Materials grinding.Tube mill Air-swept mill Air swept milltube billPOLYCOM® high-pressure grindingroll
OLYCOM® units are used for throughputrates in excess of 2,000 tph. The millfeed material can be dry or moist with alargest feed grain size of up to 60 mm. Ifnecessary, the material can be pre-dried.Separating andCollecting High efficiency CycloneHigh efficiency separatorDust Collection Filter
Pre heaterDOPOL® '90 cyclone preheater Polysius offers preheater/calcinerconcepts that are innovative andnevertheless technically mature for theproduction of white and grey cement; fornew plants as well as plant conversions,and tailored to the desired productioncapacity - no matter whether this is lessthan 1,000 or more than 10,000 tonnesper day.PREPOL® calcining system This system permits the use of un-reactive fuels and simultaneouslyreduces the nitrogen oxide emissions.
KilnPOLRO® 2-support kiln The POLRO® rotary kiln has a staticallydetermined support configuration ononly two roller stations and has a directdrive system. The kiln shell with itssplined tyres rotates on self-aligningrollers, which automatically adjustthemselves to the momentary runningconditions.POLFLAME® Burner Variable burner adjustment possibilities
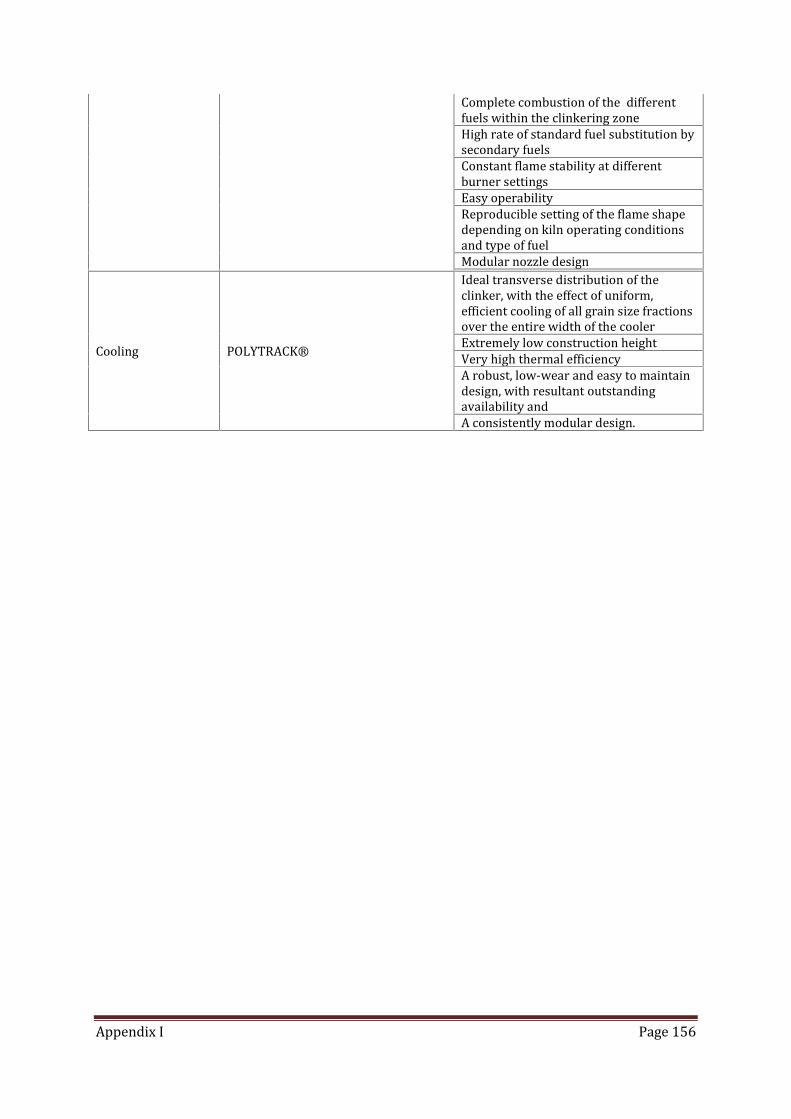
Appendix I Page 156
Complete combustion of the differentfuels within the clinkering zoneHigh rate of standard fuel substitution bysecondary fuelsConstant flame stability at differentburner settingsEasy operabilityReproducible setting of the flame shapedepending on kiln operating conditionsand type of fuelModular nozzle designCooling POLYTRACK®
Ideal transverse distribution of theclinker, with the effect of uniform,efficient cooling of all grain size fractionsover the entire width of the coolerExtremely low construction heightVery high thermal efficiencyA robust, low-wear and easy to maintaindesign, with resultant outstandingavailability andA consistently modular design.
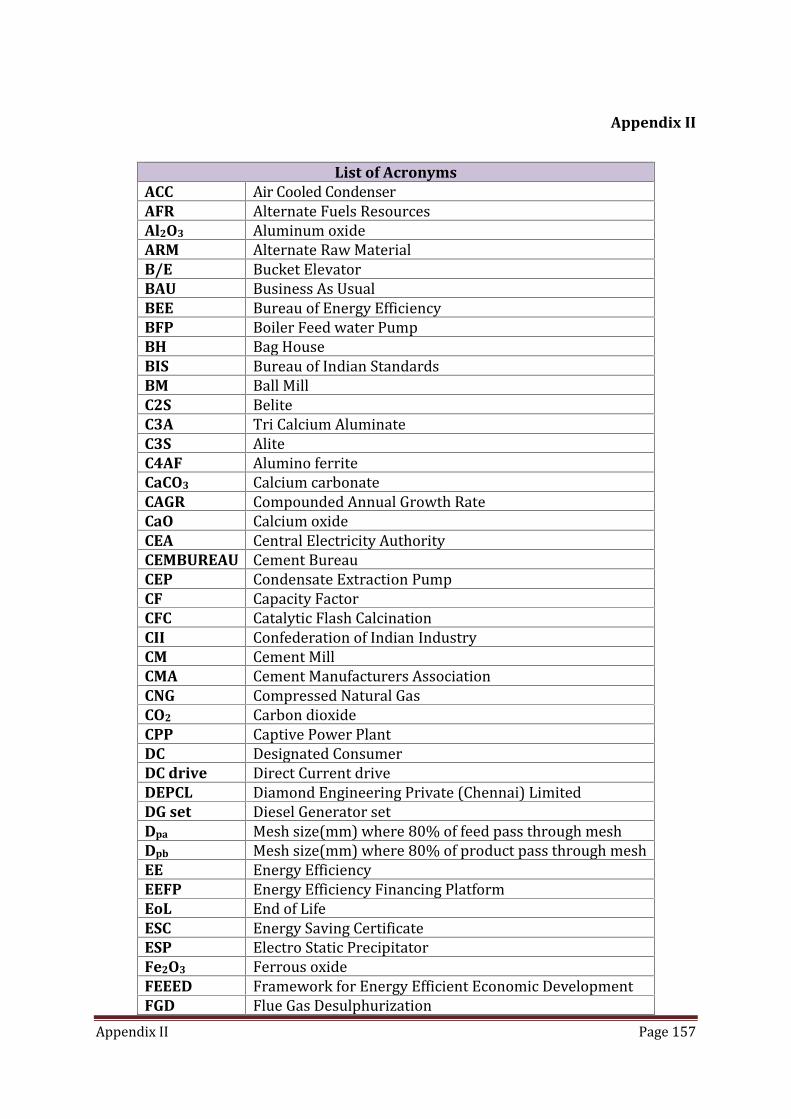
Appendix II Page 157
Appendix II
List of AcronymsACC Air Cooled CondenserAFR Alternate Fuels ResourcesAl2O3 Aluminum oxideARM Alternate Raw MaterialB/E Bucket ElevatorBAU Business As UsualBEE Bureau of Energy EfficiencyBFP Boiler Feed water PumpBH Bag HouseBIS Bureau of Indian StandardsBM Ball MillC2S BeliteC3A Tri Calcium AluminateC3S AliteC4AF Alumino ferriteCaCO3 Calcium carbonateCAGR Compounded Annual Growth RateCaO Calcium oxideCEA Central Electricity AuthorityCEMBUREAU Cement BureauCEP Condensate Extraction PumpCF Capacity FactorCFC Catalytic Flash CalcinationCII Confederation of Indian IndustryCM Cement MillCMA Cement Manufacturers AssociationCNG Compressed Natural GasCO2 Carbon dioxideCPP Captive Power PlantDC Designated ConsumerDC drive Direct Current driveDEPCL Diamond Engineering Private (Chennai) LimitedDG set Diesel Generator setDpa Mesh size(mm) where 80% of feed pass through meshDpb Mesh size(mm) where 80% of product pass through meshEE Energy EfficiencyEEFP Energy Efficiency Financing PlatformEoL End of LifeESC Energy Saving CertificateESP Electro Static PrecipitatorFe2O3 Ferrous oxideFEEED Framework for Energy Efficient Economic DevelopmentFGD Flue Gas Desulphurization

Appendix II Page 158
G2G Gate to GateGBC Green Business CenterGBH Glass Bag HouseGCV Gross Calorific ValueGDP Gross Domestic ProductGHG Green House GasGHR Gross Heat RateHP Horse PowerHSD oil High Speed Diesel oilHSHS High Sulfur Heavy StockI2R Copper lossesID fan Induced Draft fanIEA International Energy AgencyIRR Internal Rate of ReturnK/F Kiln feedLBNL Lawrence Berkeley National LaboratoryLDO Light diesel oilLP Low pressureLPG Liquefied Petroleum GasLSFO Low Sulfur Furnace OilLSHS Low Sulphur Heavy StockMAP Mineralization via Aqueous PrecipitationMgCO3 Magnesium carbonateMgO Magnesium oxideMoEF Ministry of Environment and ForestsMTEE Market Transformation for Energy EfficiencyNG Natural GasNHR Net Heat RateNMEEE National Mission on Enhanced Energy EfficiencyNPV Net Present ValueOPC Ordinary Portland CementPAT Perform, Achieve and TradePC PrecalcinerPCB Pollution Control BoardPH PreheaterPLF Plant Load FactorPM Particulate MatterPNG Pipeline Natural GasPPC Portland Pozzolana CementPPM Parts Per MillionPSC Portland Slag CementPV Present ValueRDF Refuse Derived FuelRM Raw MaterialRP Roller PressSCM Supplementary Cementitious MaterialSCR Selective Catalytic Reduction

Appendix II Page 159
SEC Specific Energy ConsumptionSiO2 Silicon dioxideSTP Standard Temperature and PressureTDF Tire Derived FuelTRDDC Tata Research Design and Development CenterUHR Unit Heat RateUS-EPA United States Environmental Protection AgencyVFD Variable Frequency DriveVRM Vertical Roller MillWBCSD World Business Council for Sustainable DevelopmentWc Core LossWfr Frictional lossWfr Frictional lossWHR Waste Heat RecoveryWHRB Waste Heat Recovery BoilerWi Work IndexWI Stray Load LossWr Rotor lossesWs Stator lossesWwind Windage loss

Page 160

Appendix III Page 161
Appendix III
List of UnitsA AmperesV VoltagepH negative logarithm of hydrogen ion concentrationSCM Standard Cubic MeterRPM Rotation Per MinuteTJ Tera JouleskWh kilo watt hourm3/kg cubic meters per kilogramkW kilo watt0C Degree Celsiushr HourkCal/h/m2 kilocalorie per hour per square meterK Kelvin (Temperature scale)kCal kilocaloriekCal/kg kilocalorie per kilogramkg kilogramkJ kilo joulekPa kilo PascalkWh/t kilo watt hour per tonnem MeterMin Minutekg/s kilogram per second0 degreekg/min kilogram per minuteMW Mega wattmBar millibar (Pressure)m3/s cubic meters per secondm2 square meterskCal/kWh kilocalories per kilo watt hourRs. Rupeescm centimetercm2 square centimetercm2/gm square centimeter per gramkW/m kilo watt per metermm.Wg millimeter water gaugeMt Million tonnestpd/m2 tonnes per day per square meterGCal Giga CaloriePJ Peta Jouletoe metric tonne of oil equivalentMtoe Million tonne of oil equivalentµm micro metertpa/TPA Tonnes Per Annum
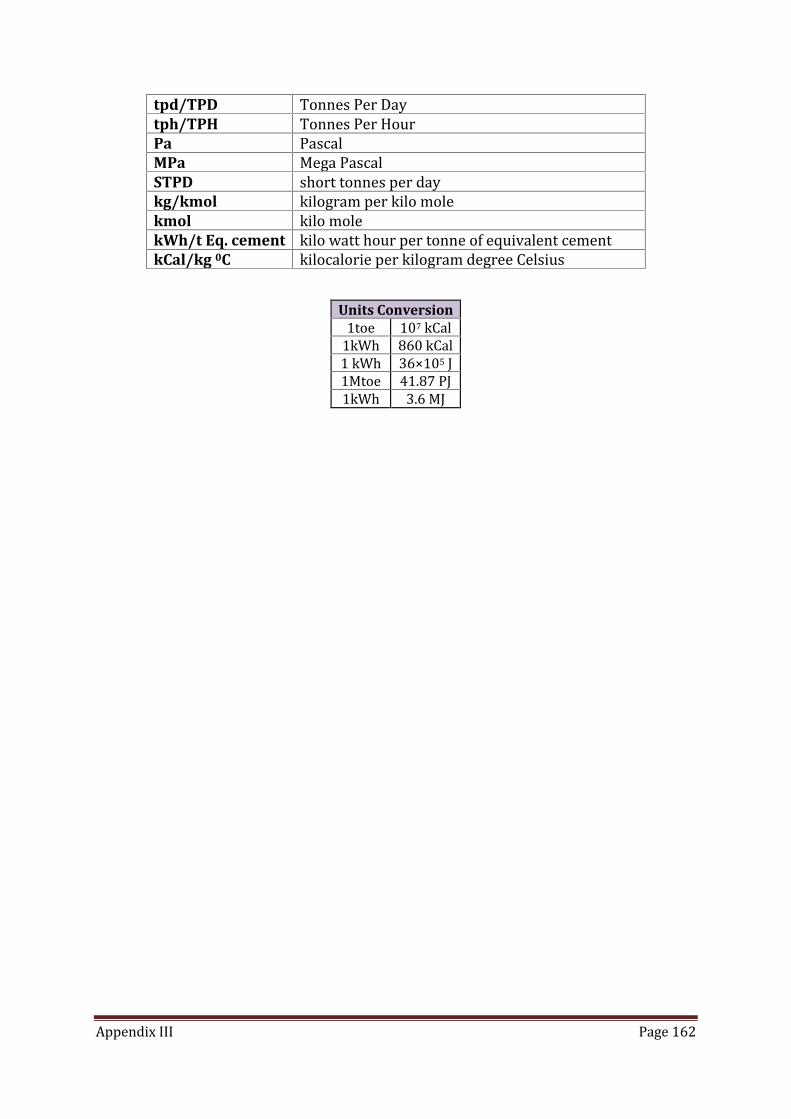
Appendix III Page 162
tpd/TPD Tonnes Per Daytph/TPH Tonnes Per HourPa PascalMPa Mega PascalSTPD short tonnes per daykg/kmol kilogram per kilo molekmol kilo molekWh/t Eq. cement kilo watt hour per tonne of equivalent cementkCal/kg 0C kilocalorie per kilogram degree Celsius
Units Conversion1toe 107 kCal1kWh 860 kCal1 kWh 36×105 J1Mtoe 41.87 PJ1kWh 3.6 MJ