How Deregulation Shapes Market Structure and Industry Efficiency: The Case of the Italian Motor...
17
How Deregulation Shapes Market Structure and Industry Efficiency: The Case of the Italian Motor Insurance Industry by Giuseppe Turchetti and Cinzia Daraio* 1. The evolution of re- and de-regulation in the Italian insurance industry Motor insurance is the most important insurance line in Italy, accounting for about 60.4 per cent of direct non-life insurance business and for 22.3 per cent of total insurance premiums in 2002. Its nature as compulsory insurance, its influence on the inflation rate, together with the growing role played by biological damage reimbursements and by fraud, have opened a deep and sometimes harsh debate, both in the political and technical arenas, on the measures to be adopted in order to get tariff levels under control, to increase efficiency and to promote competition. A fundamental year for the Italian insurance sector was 1912 when the Istituto Nazionale delle Assicurazioni was created and the affirmation of the principles of ‘‘authorization of admission’’ and of ‘‘control on tariffs’’ were ratified. With the transfer of control of the insurance sector to the Ministry of Industry in 1923, began a long period in which insurance companies experienced a kind of a subjection to public administration. Only from the 1970s onwards did we observe a deep process of legislation, mainly driven by the European Community directives (first, second and third generation). The legislator’s intervention introduced incentives for a shift from a strong pro- tectionist context to a wider and free market context for insurance. In particular, 1 July 1994 was a milestone for the insurance sector. With the coming into force of the third life and non-life directives, public authorities could no longer control tariffs and insurance policy conditions. The Italian motor insurance business, traditionally strongly regulated by the government, was deeply affected. Companies started to be free to fix prices according to customers’ risk attitudes, and the new tariffs system based on the bonus/malus mechanism was introduced. Seven direct selling companies were set up and services began to be improved with the opening of call centres working 24 hours a day. Two main events occurred in 2000: the government, due to the impact of motor insurance prices on inflation, froze tariffs (Law 26/05/2000, no. 137), a decision which was censured because of its incompatibility with European laws; and the Italian Antitrust Authority sanctioned (in measure no. 8546 – I377 Bulletin no. 30, 14 August 2000) quite a * Giuseppe Turchetti is Professor of Economics and Management, Scuola Superiore Sant’Anna, Pisa; Cinzia Daraio is post-doctoral fellow, Scuola Superiore Sant’Anna, Pisa. This article is a revised version of a paper presented to the Tenth Joint Seminar of The Geneva Association and the European Association of Law and Economics, Rotterdam, 14–15 April 2003. We would like to thank the participants of the conference for helpful discussions and suggestions. The financial and informational support of Scuola Superiore Sant’Anna and IRSA is gratefully acknowledged. The Geneva Papers on Risk and Insurance Vol. 29 No. 2 (April 2004) 202–218 # 2004 The International Association for the Study of Insurance Economics. Published by Blackwell Publishing Ltd, 9600 Garsington Road, Oxford OX4 2DQ, UK.
Transcript of How Deregulation Shapes Market Structure and Industry Efficiency: The Case of the Italian Motor...
How Deregulation Shapes Market Structure and IndustryEfficiency: The Case of the Italian Motor Insurance
Industry
by Giuseppe Turchetti and Cinzia Daraio*
1. The evolution of re- and de-regulation in the Italian insurance industry
Motor insurance is the most important insurance line in Italy, accounting for about 60.4per cent of direct non-life insurance business and for 22.3 per cent of total insurancepremiums in 2002. Its nature as compulsory insurance, its influence on the inflation rate,together with the growing role played by biological damage reimbursements and by fraud,have opened a deep and sometimes harsh debate, both in the political and technical arenas,on the measures to be adopted in order to get tariff levels under control, to increaseefficiency and to promote competition.
A fundamental year for the Italian insurance sector was 1912 when the IstitutoNazionale delle Assicurazioni was created and the affirmation of the principles of‘‘authorization of admission’’ and of ‘‘control on tariffs’’ were ratified. With the transfer ofcontrol of the insurance sector to the Ministry of Industry in 1923, began a long period inwhich insurance companies experienced a kind of a subjection to public administration.Only from the 1970s onwards did we observe a deep process of legislation, mainly driven bythe European Community directives (first, second and third generation).
The legislator’s intervention introduced incentives for a shift from a strong pro-tectionist context to a wider and free market context for insurance. In particular, 1 July 1994was a milestone for the insurance sector. With the coming into force of the third life andnon-life directives, public authorities could no longer control tariffs and insurance policyconditions. The Italian motor insurance business, traditionally strongly regulated by thegovernment, was deeply affected. Companies started to be free to fix prices according tocustomers’ risk attitudes, and the new tariffs system based on the bonus/malus mechanismwas introduced. Seven direct selling companies were set up and services began to beimproved with the opening of call centres working 24 hours a day.
Two main events occurred in 2000: the government, due to the impact of motorinsurance prices on inflation, froze tariffs (Law 26/05/2000, no. 137), a decision which wascensured because of its incompatibility with European laws; and the Italian AntitrustAuthority sanctioned (in measure no. 8546 – I377 Bulletin no. 30, 14 August 2000) quite a
* Giuseppe Turchetti is Professor of Economics and Management, Scuola Superiore Sant’Anna, Pisa; CinziaDaraio is post-doctoral fellow, Scuola Superiore Sant’Anna, Pisa. This article is a revised version of a paperpresented to the Tenth Joint Seminar of The Geneva Association and the European Association of Law andEconomics, Rotterdam, 14–15 April 2003. We would like to thank the participants of the conference for helpfuldiscussions and suggestions. The financial and informational support of Scuola Superiore Sant’Anna and IRSA isgratefully acknowledged.
The Geneva Papers on Risk and Insurance Vol. 29 No. 2 (April 2004) 202–218
# 2004 The International Association for the Study of Insurance Economics.
Published by Blackwell Publishing Ltd, 9600 Garsington Road, Oxford OX4 2DQ, UK.

large number of companies for violation of the competition discipline (amounting to fines ofA 361.5 million).
The main question addressed by our paper is if and how, over the period 1982–2000,deregulation measures influenced the structure of the supply side of the market and theefficiency and productivity of the companies operating in the Italian motor business.
In particular, we focus our attention on three main aspects:
– the effects of deregulation on the dynamics of insurers (at an aggregate level, i.e. thetotal number of insurers in the motor insurance market from 1982 to 2000 and the entry-exit process);
– the effects of deregulation on the rate of growth of insurance activity (as measured bypremiums by line of business, in particular the motor insurance business compared withnon-life and life business);
– the effects of deregulation on the efficiency and productivity of a sample of Italian motorinsurers.
Techniques used include Loess, to show the existence of trends in time series, andefficiency analysis methods, in particular Data Envelopment Analysis (DEA) andMalmquist analysis. DEA has been widely used in recent years to estimate efficiency in avariety of industries and national markets.1
To the best of our knowledge, this paper is the second work that applies efficiencymethods to data on Italian insurers. It follows the previous work by Cummins et al. (1996) inthe definition of inputs and outputs, and it gives an enriched analysis based on new data.
The paper is organized as follows. The next section describes the evolution of thenumber of companies, the entry-exit dynamics, the concentration ratios, the trend ofpremiums in the Italian insurance industry, with particular attention to the motor liabilityline, over the period 1982–2000. Section 3 introduces efficiency analysis by describing thesample, defining the inputs and outputs considered in the analysis, and briefly introducingthe main concepts of efficiency methodology. In section 4 main results of the efficiencyanalysis are reported, while section 5 concludes the paper indicating future developments ofresearch in these areas.
2. The dynamics of the Italian insurance market structure
Motor insurance is the most important line of business in the Italian insurance market.The fact that it is compulsory is certainly the main reason explaining both this phenomenonand the number of companies operating in the motor line. Over the period 1982–2000,always more than six out of ten insurers working in the non-life business were present in themotor line.2 The peak was reached in 1991, with 77.40 per cent of non-life companiesworking in the motor business (Table 1).
The period 1982–2000 can be divided in two sub-periods, 1982–1991 and 1991–2000.While in the first period the absolute number of insurance companies operating in the motorbusiness grew from 97 to 113 (from 69.78 per cent to 77.40 per cent, in respect of total non-
1 For a survey of 130 studies that apply frontier efficiency analysis to financial institutions in 21 countries,see Berger and Humphrey (1997).
2 Almost all companies present in the motor insurance business operate also in other non-life lines, so theyare not motor specialists.
# 2004 The International Association for the Study of Insurance Economics.
HOW DEREGULATION SHAPES MARKET STRUCTURE AND INDUSTRY EFFICIENCY 203

life companies), in the second period a strong reduction both of the absolute number, from113 to 80, and of their weight in respect to total non-life companies, from 77.40 per cent to63.49 per cent, was registered. In particular, the greater decrease is observable in the periodafter 1994, when the number declined from 105 to 80. Also the percentage of companiesoperating in the motor line over the total number of insurers present in the insurance sectordeclined significantly, from 62.18 per cent to 41.67 per cent, but this is explained more bythe strong growth of the number of life companies (entrance of financial consultants andbanks in the insurance business) than by the decline of the number of motor companies(Table 1).
The analysis of the dynamics of entries and exits from the motor business in the period1982–2000 presents interesting results. Entries experienced an upward trend in the secondhalf of the 1980s, but along the whole 1990s the curve was characterized by a downwardslope, moderately slowed down in the years around 1994 because of the entrance of some
Table 1:Changes in the number of Italian insurers (direct business) by line of business
(1982–2000)3
Year RCAT RCA_NL RCA_TOT TOTNL TOTL TOTLNL TOTG
1982 97 69.78 62.18 139 44 27 1561983 95 69.34 60.51 137 47 27 1571984 97 71.32 61.78 136 48 27 1571985 95 71.43 61.29 133 49 27 1551986 97 73.48 62.58 132 51 28 1551987 98 73.68 60.49 133 57 28 1621988 103 72.54 57.54 142 65 28 1791989 109 75.69 58.60 144 70 28 1861990 111 76.03 57.51 146 74 27 1931991 113 77.40 55.94 146 83 27 2021992 108 74.48 51.43 145 91 26 2101993 106 71.14 49.07 149 92 25 2161994 105 71.92 48.61 146 94 24 2161995 99 68.75 46.05 144 93 22 2151996 98 68.06 44.95 144 96 22 2181997 94 71.21 44.98 132 98 21 2091998 92 75.41 46.23 122 98 21 1991999 87 66.41 44.39 131 96 31 1962000 80 63.49 41.67 126 97 31 192
Source: Based on ANIA data.
3 Key: RCAT (motor business); RCA_NL (no. of motor insurers over total number of insurers operating innon-life business, in percentage value); RCA_TOT (no. of motor insurers over total number of insurers, inpercentage value); TOTNL (total number of insurers operating in non-life business); TOTL (total number ofinsurers operating in life business); TOTLNL (total number of insurers operating in life and non-life business);TOTG (total number of insurers). Note: TOTG is computed as follows: TOTNL+TOTL-TOTLNL.
# 2004 The International Association for the Study of Insurance Economics.
204 TURCHETTI AND DARAIO

companies using the telephone as the distribution channel. Exits experienced the opposite:at the beginning of the period we observe a downward slope of the curve, but from the late1980s the trend started to rise and it increased for the whole 1990s. Certainly the number ofexits began to grow much earlier than 1994, but around that year the slope of the curve wasparticularly significant.
Table 2 presents concentration ratios of Italian motor insurance business, of total non-life business and of life business in the period 1982–2000. Data of motor and of non-lifemarkets do not show significant variation of concentration of the first four, eight and 20companies during the last 20 years, especially after 1994. Also the Herfindahl Index doesnot evidence variations of the concentration of the two mentioned markets during the periodanalysed. The life market instead presents a relevant reduction of the concentration, due tothe important role conquered by new entrants using financial consultants and bank branches.
Regarding the real rates of growth of gross premiums (direct business) in the period1992–2001, it is interesting to note that the motor business has experienced a series of upsand downs until the first half of 1990s, with a downward convergence in the 1992–1994period, and that after the deregulation period, the premiums rate of growth started to increaseagain (halting in 2000 and 2001, when the government imposed a price freeze on motorthird-party liability) (Figure 2). This is particularly significant because the real rate ofgrowth of premiums of other non-life lines continued to decline also after 1994. On the other
1980 1983 1985 1988 1990 1993 1995 1998 2000
year
0
2
4
6
8 inout
1994
Figure 1: Trend of entries (in)-exits (out) from the motor insurance market (1982–2000)4
4 Figures 1 and 2 were designed using a locally weighted least-squares (Loess) technique (see Cleveland,1993, 1994).
# 2004 The International Association for the Study of Insurance Economics.
HOW DEREGULATION SHAPES MARKET STRUCTURE AND INDUSTRY EFFICIENCY 205

Table 2:Concentration ratios for the Italian motor insurance industry and for total non-life business (1982–2000)
C4, C8, C20 are in percentage values
Non-life premiums Motor premiums Life premiums
Year C4 C8 C20 Herf C4 C8 C20 Herf C4 C8 C20 Herf
1982 30.438 43.193 63.626 0.033 27.256 41.724 67.124 0.033 71.032 83.609 93.952 0.1461983 29.770 42.814 63.257 0.033 26.877 41.511 66.612 0.032 70.951 83.026 93.829 0.1461984 29.586 42.757 63.308 0.033 26.820 41.855 66.302 0.032 69.722 81.815 93.260 0.1451985 28.989 42.416 62.868 0.032 26.225 41.180 64.884 0.031 66.821 78.731 92.483 0.1371986 29.028 42.523 62.643 0.032 25.967 40.872 63.900 0.031 64.720 77.320 91.687 0.1331987 29.261 42.834 62.873 0.032 25.774 40.941 63.478 0.030 60.456 73.682 89.583 0.1171988 29.569 43.073 63.020 0.032 25.596 40.871 62.825 0.030 58.324 71.889 88.249 0.1111989 30.183 44.325 68.596 0.035 26.020 42.835 69.082 0.033 56.193 70.383 87.836 0.1011990 30.118 44.360 67.384 0.035 25.976 42.557 67.596 0.032 54.651 68.728 86.503 0.0951991 29.755 45.593 67.926 0.035 26.107 43.350 68.343 0.033 52.486 66.879 85.759 0.0881992 29.595 45.492 67.712 0.035 25.816 43.592 68.565 0.033 49.299 63.516 83.028 0.0771993 29.792 45.776 67.676 0.035 26.064 43.859 69.152 0.034 45.391 59.399 78.856 0.0661994 29.669 49.304 73.617 0.039 28.557 48.767 75.873 0.039 41.590 55.848 75.664 0.0581995 29.888 49.286 73.510 0.040 27.877 48.833 75.829 0.039 40.054 53.577 74.958 0.0541996 29.486 48.567 73.017 0.039 27.580 48.087 75.349 0.039 38.135 50.715 72.266 0.0501997 29.358 47.711 72.599 0.038 26.249 46.655 74.280 0.037 32.136 46.830 69.737 0.0391998 30.958 48.862 78.022 0.042 27.758 47.248 80.118 0.040 28.024 44.331 71.279 0.0361999 30.752 47.543 77.175 0.040 27.900 46.149 78.851 0.039 24.823 39.705 66.089 0.0302000 30.254 47.181 76.870 0.040 27.690 46.187 78.875 0.039 23.368 38.234 66.319 0.029
Source: Based on ANIA data.
#2004TheIntern
ational
Asso
ciationfortheStudyofInsuran
ceEconomics.
206
TURCHETTIAND
DARAIO
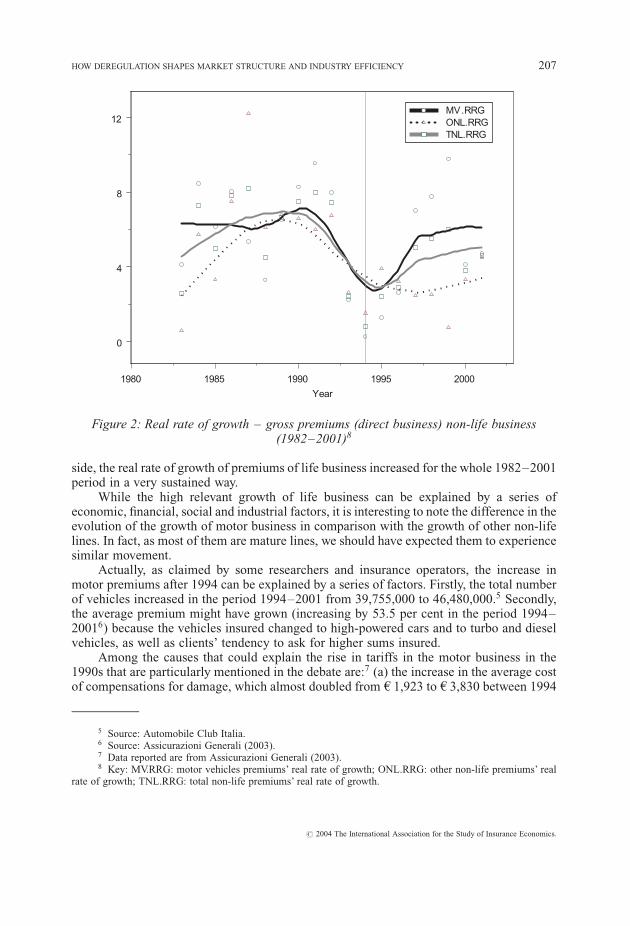
side, the real rate of growth of premiums of life business increased for the whole 1982–2001period in a very sustained way.
While the high relevant growth of life business can be explained by a series ofeconomic, financial, social and industrial factors, it is interesting to note the difference in theevolution of the growth of motor business in comparison with the growth of other non-lifelines. In fact, as most of them are mature lines, we should have expected them to experiencesimilar movement.
Actually, as claimed by some researchers and insurance operators, the increase inmotor premiums after 1994 can be explained by a series of factors. Firstly, the total numberof vehicles increased in the period 1994–2001 from 39,755,000 to 46,480,000.5 Secondly,the average premium might have grown (increasing by 53.5 per cent in the period 1994–20016) because the vehicles insured changed to high-powered cars and to turbo and dieselvehicles, as well as clients’ tendency to ask for higher sums insured.
Among the causes that could explain the rise in tariffs in the motor business in the1990s that are particularly mentioned in the debate are:7 (a) the increase in the average costof compensations for damage, which almost doubled from A 1,923 to A 3,830 between 1994
1980 1985 1990 1995 2000
Year
0
4
8
12MV.RRGONL.RRGTNL.RRG
Figure 2: Real rate of growth – gross premiums (direct business) non-life business(1982–2001)8
5 Source: Automobile Club Italia.6 Source: Assicurazioni Generali (2003).7 Data reported are from Assicurazioni Generali (2003).8 Key: MV.RRG: motor vehicles premiums’ real rate of growth; ONL.RRG: other non-life premiums’ real
rate of growth; TNL.RRG: total non-life premiums’ real rate of growth.
# 2004 The International Association for the Study of Insurance Economics.
HOW DEREGULATION SHAPES MARKET STRUCTURE AND INDUSTRY EFFICIENCY 207

and 2001; (b) the rapid rise in the cost of repairs; (c) the outstanding frequency of cervicalspine lesions, that are typical of the Italian system (in Italy 66 per cent of reported claimsrelate to such lesions as against 40 per cent in Germany, 15 per cent in Spain, and 6 per centin France); (d) the frequency of fraud.
3. The dynamics of productivity and efficiency in the Italian motor insuranceindustry (1982–2000)
3.1 Sample description
Our database consists of financial statements for almost all insurers operating in Italyover the period 1982–2000 and it is based on official data from the Italian Association ofInsurance Companies.
In our empirical analysis we selected insurers operating in Italy, active and working inthe motor liability sector during the whole period 1982–2000. The number of retainedcompanies was 53 from which we excluded several companies for some negative values inoutputs, obtaining a final sample useful for the analysis of 45 insurers. The 66.7 per cent ofour sample (30 insurers) are made of generalist insurers, the remaining 33.3 per cent (15firms) are active only in the non-life business.
Premiums collected by the companies in our sample over total premiums (directbusiness) in the motor business for the whole period under consideration (1982–2000)range from a minimum of 59.45 per cent in 1986 to a maximum of 77.89 per cent in 1999.On average (1982–2000), our sample represents 64.52 per cent of the Italian motorinsurance market.
As already mentioned, in 2000 the Italian Antitrust Authority sanctioned quite a largenumber of companies for information exchange. Twenty-seven companies out of the 45 thatmake up our sample have been hit by this antitrust measure. Among these, 12 are active onlyin non-life business (specialists) and 15 are active both in life and non-life business(generalists).
Using this dataset, we analysed the dynamics of productivity and efficiency of the mostrepresentative Italian insurers active in the motor business over the period 1982–2000.
3.2 Definition of outputs and inputs
As they produce services, insurers are analogous to other financial firms. Consistentwith most of the recent literature on financial institutions, for the measurement of output weadopt a modified version of the value-added approach, which counts as important outputsthose that have significant value added, as judged using operating cost allocations (Bergerand Humphrey, 1992; Cummins et al., 1996; Cummins and Rubio-Misas, 2001). Insurersprovide three principal services:
1. Risk-pooling and risk-bearing. Insurance provides a mechanism through whichconsumers and businesses exposed to losses can engage in risk reduction throughpooling. The actuarial, underwriting, and related expenses incurred in risk pooling areimportant components of value added in the industry. Insurers also add value by holdingequity capital to bear the residual risk of the pool.
2. ‘‘Real’’ financial services relating to insured losses. Insurers provide a variety of realservices for policyholders including financial planning, risk management, and thesupply of legal defence in liability disputes. By contracting with insurers to provide
# 2004 The International Association for the Study of Insurance Economics.
208 TURCHETTI AND DARAIO
these services, policyholders take advantage of insurers’ specialized expertise to reducethe costs associated with managing risks.
3. Intermediation. For life insurers, financial intermediation is a principal function,accomplished through the sale of asset accumulation products such as annuities. Fornon-life insurers, intermediation is an important but incidental function, resulting fromthe collection of premiums in advance of claim payments. Insurers’ value added fromintermediation is reflected in the net interest margin between the rate of return earned oninvested assets and the rate credited to policyholders.
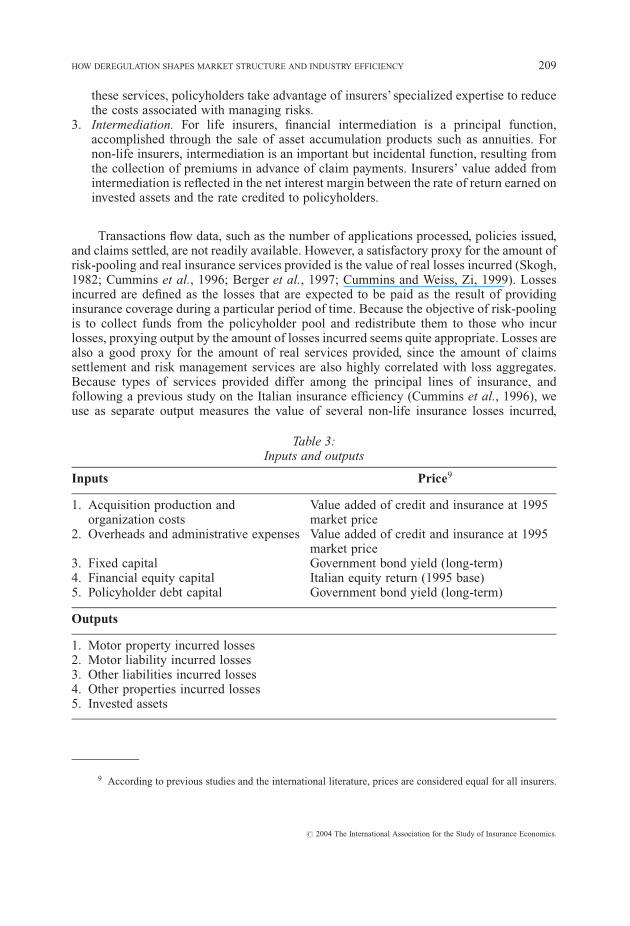
Transactions flow data, such as the number of applications processed, policies issued,and claims settled, are not readily available. However, a satisfactory proxy for the amount ofrisk-pooling and real insurance services provided is the value of real losses incurred (Skogh,1982; Cummins et al., 1996; Berger et al., 1997; Cummins and Weiss, Zi, 1999). Lossesincurred are defined as the losses that are expected to be paid as the result of providinginsurance coverage during a particular period of time. Because the objective of risk-poolingis to collect funds from the policyholder pool and redistribute them to those who incurlosses, proxying output by the amount of losses incurred seems quite appropriate. Losses arealso a good proxy for the amount of real services provided, since the amount of claimssettlement and risk management services are also highly correlated with loss aggregates.Because types of services provided differ among the principal lines of insurance, andfollowing a previous study on the Italian insurance efficiency (Cummins et al., 1996), weuse as separate output measures the value of several non-life insurance losses incurred,
Table 3:Inputs and outputs
Inputs Price9
1. Acquisition production andorganization costs
Value added of credit and insurance at 1995market price
2. Overheads and administrative expenses Value added of credit and insurance at 1995market price
3. Fixed capital Government bond yield (long-term)4. Financial equity capital Italian equity return (1995 base)5. Policyholder debt capital Government bond yield (long-term)
Outputs
1. Motor property incurred losses2. Motor liability incurred losses3. Other liabilities incurred losses4. Other properties incurred losses5. Invested assets
9 According to previous studies and the international literature, prices are considered equal for all insurers.
# 2004 The International Association for the Study of Insurance Economics.
HOW DEREGULATION SHAPES MARKET STRUCTURE AND INDUSTRY EFFICIENCY 209
distinguishing between motor property, motor liability, other liabilities, and other proper-ties.
Losses incurred and all other monetary values used in our analysis are expressed in1982 monetary units by deflating the Italian Consumer Price Index (source: Bank of Italy).Losses incurred are a satisfactory measure of output for coverage provided during any givenyear. However, insurers also perform services in connection with claims occurring inprevious years that have not yet been settled or claims resulting from contingent events. As aproxy for these services, in the definition of each output we consider, for each year, the sumof the paid claims (for the line of business considered) and the claims reserves of the year,minus the claims reserves of the previous year. By doing so, in the definition of the outputs,we consider as proxy of financial services the sum of paid claims and changes in reserves.Our final output variable, which represents a proxy for the intermediation function, is thereal value of invested assets.
In defining inputs of insurance activity, we follow Cummins et al. (1996) and the recentinsurance efficiency literature. We identify five inputs:
— agents labour and distribution expense (acquisition, production and organization costs);— overheads and administrative expenses;— fixed capital (physical capital and other business expenses);— financial equity capital;— policyholder debt capital (reserves, all kinds).
3.3 Methodology
To measure efficiency in the Italian motor insurance industry, we utilize modernfrontier efficiency analysis, in particular DEA and Malmquist analysis.10 DEA is a non-parametric technique that does not require the specification of a production or cost functionbut rather computes efficient ‘‘best practice’’ production and cost frontiers based on linearcombinations of firms in the industry. DEA involves the measurement of the performance ofeach firm in the industry compared to ‘‘best practice’’ efficient frontiers. The comparison isbased on relevant inputs and outputs of the financial service provided by the companies.
Efficiency scores vary between zero and one (in the input-oriented framework appliedin this study), with fully efficient firms having efficiencies equal to one and inefficient firmshaving efficiencies between zero and one. This section provides a brief overview of the basicconcept of frontier efficiency methodology.
We estimate efficient production and cost frontiers providing measures of cost,technical, allocative and scale efficiency for each firm in our sample.
Cost efficiency for a given firm is defined as the ratio of the costs of a fully efficientfirm (a firm operating on the efficient cost frontier) with the same output quantities and inputprices to the given firm’s actual costs. One minus the firm efficiency ratio provides a measureof the proportion by which costs could be reduced if the firm operated on the cost frontier.Firms achieve cost efficiency by adopting the best practice technology (becoming
10 Starting from the first empirical application by Farrell (1957), a huge amount of literature on efficiencyanalysis has been developed. For more technical details on DEA see the ‘‘classical’’ works by Lovell (1993);Charnes et al. (1994). For an updated survey on DEA models see Cooper et al. (1999). For an introduction toMalmquist Analysis see Grosskopf (1993).
# 2004 The International Association for the Study of Insurance Economics.
210 TURCHETTI AND DARAIO

technically efficient) and choosing the optimal mix of inputs (becoming allocativelyefficient), conditional on outputs and input prices.
Technical efficiency for a given firm is defined as the ratio of the inputs use of a fullyefficient firm producing the same outputs vector to the inputs use of the firm underconsideration. Technical efficiency can be decomposed into pure technical efficiency andscale efficiency. Pure technical efficiency is measured relative to variable returns to scale(VRS) production frontier, i.e. a frontier characterized by increasing, constant, and/ordecreasing returns to scale. Firms operating on the VRS frontier are considered fullyefficient in the pure technical sense. If the firm is operating with increasing or decreasingreturns to scale, it can improve its efficiency by moving to a constant returns to scalefrontier, i.e. by becoming scale efficient. Technical efficiency is equal to the product of puretechnical and scale efficiency.
Allocative efficiency measures firm success in choosing the cost-minimizingcombination of inputs. Cost efficiency can be shown to equal the product of technicaland allocative efficiency. Therefore, to be fully cost efficient, a firm must be both technicallyand allocatively efficient.
The Malmquist approach measures both improvements in technology and changes inefficiency relative to the frontiers for different time periods. Malmquist analysis allows us toseparate shifts in the frontier (technical change) from improvements in efficiency relative tothe frontier (technical efficiency change). The product of technical change and technicalefficiency change, the total factor productivity change (TFP), is measured by the MalmquistIndex (Grosskopf, 1993).
If a Malmquist Index computed over two years is over 1, it indicates an increase in totalfactor productivity from year t to year (t + 1); if it is under 1 then it indicates a decrease intotal factor productivity. The same interpretation applies for technical change (technicalefficiency change): if the value of the index is higher than 1, there has been an improvementin technology (technical efficiency) from year t to year (t + 1); on the other hand, if its valueis lower than 1, that means that a deterioration in technology is in place from year t to year(t + 1).
4. Results of efficiency and productivity analysis
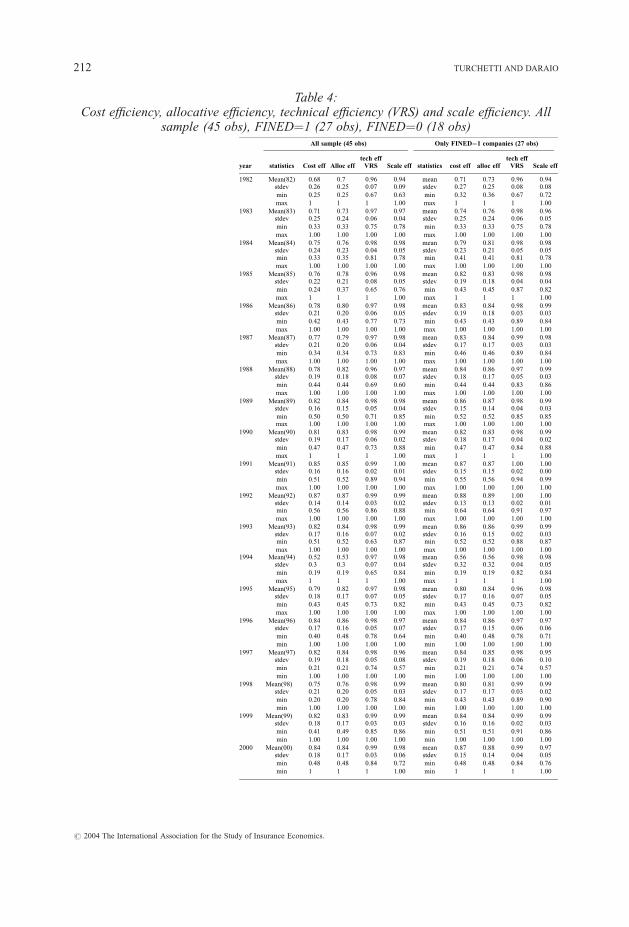
Efficiency results presented in Table 4 show average efficiencies for the entire sampleas well as distinguishing between companies hit by the antitrust measure (FINED¼1) andcompanies not hit by the Antitrust measure (FINED¼0). Averages are shown for costefficiency and its components (allocative efficiency and pure technical efficiency, computedunder the hypothesis of VRS).
Cost efficiency of the 45 companies active for the whole period experienced a fall in1994 (and we had also the highest value of standard deviation), but after that year itincreased again, reaching almost the same level of cost efficiency observed in 1990. On theone hand, the confusion and the reorganization processes that occurred around 1994produced a considerable loss of cost efficiency. In 1995, for example, costs could have beenreduced on average by 21 per cent if companies had operated on the cost frontier. On theother hand, we observe a level of technical efficiency (under VRS) that was extremely highon average over the whole period 1982–2000.
Another interesting observation is that fined firms present higher levels of costefficiency, allocative efficiency, pure technical and scale efficiency in respect to non-finedcompanies during almost the whole period. Moreover, among the companies fined (27
# 2004 The International Association for the Study of Insurance Economics.
HOW DEREGULATION SHAPES MARKET STRUCTURE AND INDUSTRY EFFICIENCY 211
All sample (45 obs) Only FINED¼1 companies (27 obs)
year statistics Cost eff Alloc efftech effVRS Scale eff statistics cost eff alloc eff
tech effVRS Scale eff
1982 Mean(82) 0.68 0.7 0.96 0.94 mean 0.71 0.73 0.96 0.94stdev 0.26 0.25 0.07 0.09 stdev 0.27 0.25 0.08 0.08
min 0.25 0.25 0.67 0.63 min 0.32 0.36 0.67 0.72
max 1 1 1 1.00 max 1 1 1 1.00
1983 Mean(83) 0.71 0.73 0.97 0.97 mean 0.74 0.76 0.98 0.96stdev 0.25 0.24 0.06 0.04 stdev 0.25 0.24 0.06 0.05
min 0.33 0.33 0.75 0.78 min 0.33 0.33 0.75 0.78
max 1.00 1.00 1.00 1.00 max 1.00 1.00 1.00 1.00
1984 Mean(84) 0.75 0.76 0.98 0.98 mean 0.79 0.81 0.98 0.98stdev 0.24 0.23 0.04 0.05 stdev 0.23 0.21 0.05 0.05min 0.33 0.35 0.81 0.78 min 0.41 0.41 0.81 0.78
max 1.00 1.00 1.00 1.00 max 1.00 1.00 1.00 1.00
1985 Mean(85) 0.76 0.78 0.96 0.98 mean 0.82 0.83 0.98 0.98stdev 0.22 0.21 0.08 0.05 stdev 0.19 0.18 0.04 0.04
min 0.24 0.37 0.65 0.76 min 0.43 0.45 0.87 0.82
max 1 1 1 1.00 max 1 1 1 1.00
1986 Mean(86) 0.78 0.80 0.97 0.98 mean 0.83 0.84 0.98 0.99stdev 0.21 0.20 0.06 0.05 stdev 0.19 0.18 0.03 0.03
min 0.42 0.43 0.77 0.73 min 0.43 0.43 0.89 0.84
max 1.00 1.00 1.00 1.00 max 1.00 1.00 1.00 1.00
1987 Mean(87) 0.77 0.79 0.97 0.98 mean 0.83 0.84 0.99 0.98stdev 0.21 0.20 0.06 0.04 stdev 0.17 0.17 0.03 0.03
min 0.34 0.34 0.73 0.83 min 0.46 0.46 0.89 0.84
max 1.00 1.00 1.00 1.00 max 1.00 1.00 1.00 1.00
1988 Mean(88) 0.78 0.82 0.96 0.97 mean 0.84 0.86 0.97 0.99stdev 0.19 0.18 0.08 0.07 stdev 0.18 0.17 0.05 0.03
min 0.44 0.44 0.69 0.60 min 0.44 0.44 0.83 0.86
max 1.00 1.00 1.00 1.00 max 1.00 1.00 1.00 1.00
1989 Mean(89) 0.82 0.84 0.98 0.98 mean 0.86 0.87 0.98 0.99stdev 0.16 0.15 0.05 0.04 stdev 0.15 0.14 0.04 0.03
min 0.50 0.50 0.71 0.85 min 0.52 0.52 0.85 0.85max 1.00 1.00 1.00 1.00 max 1.00 1.00 1.00 1.00
1990 Mean(90) 0.81 0.83 0.98 0.99 mean 0.82 0.83 0.98 0.99stdev 0.19 0.17 0.06 0.02 stdev 0.18 0.17 0.04 0.02
min 0.47 0.47 0.73 0.88 min 0.47 0.47 0.84 0.88
max 1 1 1 1.00 max 1 1 1 1.00
1991 Mean(91) 0.85 0.85 0.99 1.00 mean 0.87 0.87 1.00 1.00stdev 0.16 0.16 0.02 0.01 stdev 0.15 0.15 0.02 0.00
min 0.51 0.52 0.89 0.94 min 0.55 0.56 0.94 0.99
max 1.00 1.00 1.00 1.00 max 1.00 1.00 1.00 1.00
1992 Mean(92) 0.87 0.87 0.99 0.99 mean 0.88 0.89 1.00 1.00stdev 0.14 0.14 0.03 0.02 stdev 0.13 0.13 0.02 0.01min 0.56 0.56 0.86 0.88 min 0.64 0.64 0.91 0.97
max 1.00 1.00 1.00 1.00 max 1.00 1.00 1.00 1.00
1993 Mean(93) 0.82 0.84 0.98 0.99 mean 0.86 0.86 0.99 0.99stdev 0.17 0.16 0.07 0.02 stdev 0.16 0.15 0.02 0.03min 0.51 0.52 0.63 0.87 min 0.52 0.52 0.88 0.87
max 1.00 1.00 1.00 1.00 max 1.00 1.00 1.00 1.001994 Mean(94) 0.52 0.53 0.97 0.98 mean 0.56 0.56 0.98 0.98
stdev 0.3 0.3 0.07 0.04 stdev 0.32 0.32 0.04 0.05
min 0.19 0.19 0.65 0.84 min 0.19 0.19 0.82 0.84
max 1 1 1 1.00 max 1 1 1 1.00
1995 Mean(95) 0.79 0.82 0.97 0.98 mean 0.80 0.84 0.96 0.98stdev 0.18 0.17 0.07 0.05 stdev 0.17 0.16 0.07 0.05
min 0.43 0.45 0.73 0.82 min 0.43 0.45 0.73 0.82
max 1.00 1.00 1.00 1.00 max 1.00 1.00 1.00 1.00
1996 Mean(96) 0.84 0.86 0.98 0.97 mean 0.84 0.86 0.97 0.97stdev 0.17 0.16 0.05 0.07 stdev 0.17 0.15 0.06 0.06
min 0.40 0.48 0.78 0.64 min 0.40 0.48 0.78 0.71
min 1.00 1.00 1.00 1.00 min 1.00 1.00 1.00 1.00
1997 Mean(97) 0.82 0.84 0.98 0.96 mean 0.84 0.85 0.98 0.95stdev 0.19 0.18 0.05 0.08 stdev 0.19 0.18 0.06 0.10
min 0.21 0.21 0.74 0.57 min 0.21 0.21 0.74 0.57
min 1.00 1.00 1.00 1.00 min 1.00 1.00 1.00 1.00
1998 Mean(98) 0.75 0.76 0.98 0.99 mean 0.80 0.81 0.99 0.99stdev 0.21 0.20 0.05 0.03 stdev 0.17 0.17 0.03 0.02
min 0.20 0.20 0.78 0.84 min 0.43 0.43 0.89 0.90
min 1.00 1.00 1.00 1.00 min 1.00 1.00 1.00 1.00
1999 Mean(99) 0.82 0.83 0.99 0.99 mean 0.84 0.84 0.99 0.99stdev 0.18 0.17 0.03 0.03 stdev 0.16 0.16 0.02 0.03
min 0.41 0.49 0.85 0.86 min 0.51 0.51 0.91 0.86
min 1.00 1.00 1.00 1.00 min 1.00 1.00 1.00 1.00
2000 Mean(00) 0.84 0.84 0.99 0.98 mean 0.87 0.88 0.99 0.97stdev 0.18 0.17 0.03 0.06 stdev 0.15 0.14 0.04 0.05
min 0.48 0.48 0.84 0.72 min 0.48 0.48 0.84 0.76
min 1 1 1 1.00 min 1 1 1 1.00
Table 4:Cost efficiency, allocative efficiency, technical efficiency (VRS) and scale efficiency. All
sample (45 obs), FINED¼1 (27 obs), FINED¼0 (18 obs)
# 2004 The International Association for the Study of Insurance Economics.
212 TURCHETTI AND DARAIO
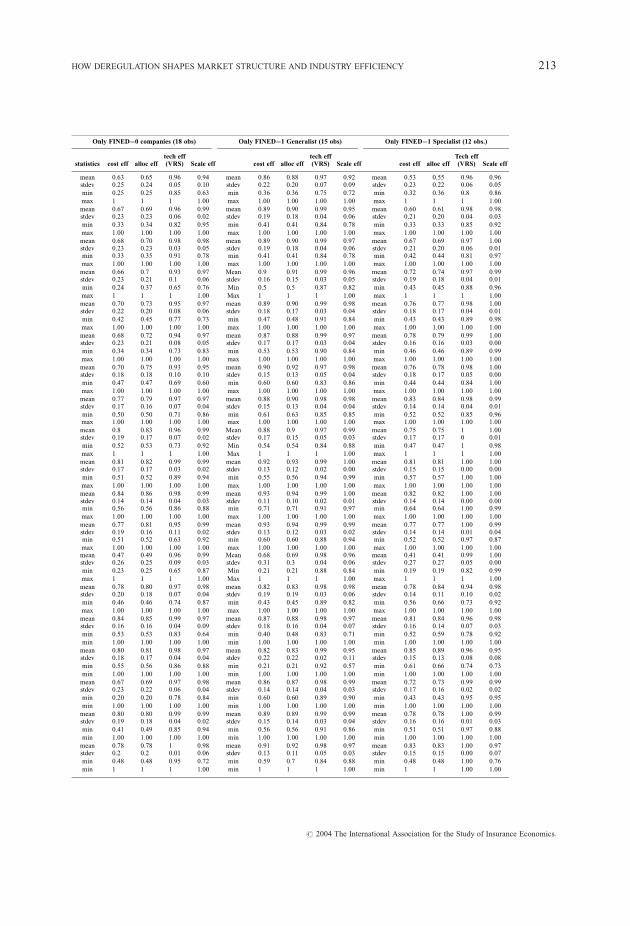
Only FINED¼0 companies (18 obs) Only FINED¼1 Generalist (15 obs) Only FINED¼1 Specialist (12 obs.)
statistics cost eff alloc efftech eff(VRS) Scale eff cost eff alloc eff
tech eff(VRS) Scale eff cost eff alloc eff
Tech eff(VRS) Scale eff
mean 0.63 0.65 0.96 0.94 mean 0.86 0.88 0.97 0.92 mean 0.53 0.55 0.96 0.96stdev 0.25 0.24 0.05 0.10 stdev 0.22 0.20 0.07 0.09 stdev 0.23 0.22 0.06 0.05
min 0.25 0.25 0.85 0.63 min 0.36 0.36 0.75 0.72 min 0.32 0.36 0.8 0.86
max 1 1 1 1.00 max 1.00 1.00 1.00 1.00 max 1 1 1 1.00
mean 0.67 0.69 0.96 0.99 mean 0.89 0.90 0.99 0.95 mean 0.60 0.61 0.98 0.98stdev 0.23 0.23 0.06 0.02 stdev 0.19 0.18 0.04 0.06 stdev 0.21 0.20 0.04 0.03
min 0.33 0.34 0.82 0.95 min 0.41 0.41 0.84 0.78 min 0.33 0.33 0.85 0.92
max 1.00 1.00 1.00 1.00 max 1.00 1.00 1.00 1.00 max 1.00 1.00 1.00 1.00
mean 0.68 0.70 0.98 0.98 mean 0.89 0.90 0.99 0.97 mean 0.67 0.69 0.97 1.00stdev 0.23 0.23 0.03 0.05 stdev 0.19 0.18 0.04 0.06 stdev 0.21 0.20 0.06 0.01min 0.33 0.35 0.91 0.78 min 0.41 0.41 0.84 0.78 min 0.42 0.44 0.81 0.97
max 1.00 1.00 1.00 1.00 max 1.00 1.00 1.00 1.00 max 1.00 1.00 1.00 1.00
mean 0.66 0.7 0.93 0.97 Mean 0.9 0.91 0.99 0.96 mean 0.72 0.74 0.97 0.99stdev 0.23 0.21 0.1 0.06 stdev 0.16 0.15 0.03 0.05 stdev 0.19 0.18 0.04 0.01
min 0.24 0.37 0.65 0.76 Min 0.5 0.5 0.87 0.82 min 0.43 0.45 0.88 0.96
max 1 1 1 1.00 Max 1 1 1 1.00 max 1 1 1 1.00
mean 0.70 0.73 0.95 0.97 mean 0.89 0.90 0.99 0.98 mean 0.76 0.77 0.98 1.00stdev 0.22 0.20 0.08 0.06 stdev 0.18 0.17 0.03 0.04 stdev 0.18 0.17 0.04 0.01
min 0.42 0.45 0.77 0.73 min 0.47 0.48 0.91 0.84 min 0.43 0.43 0.89 0.98
max 1.00 1.00 1.00 1.00 max 1.00 1.00 1.00 1.00 max 1.00 1.00 1.00 1.00
mean 0.68 0.72 0.94 0.97 mean 0.87 0.88 0.99 0.97 mean 0.78 0.79 0.99 1.00stdev 0.23 0.21 0.08 0.05 stdev 0.17 0.17 0.03 0.04 stdev 0.16 0.16 0.03 0.00
min 0.34 0.34 0.73 0.83 min 0.53 0.53 0.90 0.84 min 0.46 0.46 0.89 0.99
max 1.00 1.00 1.00 1.00 max 1.00 1.00 1.00 1.00 max 1.00 1.00 1.00 1.00
mean 0.70 0.75 0.93 0.95 mean 0.90 0.92 0.97 0.98 mean 0.76 0.78 0.98 1.00stdev 0.18 0.18 0.10 0.10 stdev 0.15 0.13 0.05 0.04 stdev 0.18 0.17 0.05 0.00
min 0.47 0.47 0.69 0.60 min 0.60 0.60 0.83 0.86 min 0.44 0.44 0.84 1.00
max 1.00 1.00 1.00 1.00 max 1.00 1.00 1.00 1.00 max 1.00 1.00 1.00 1.00
mean 0.77 0.79 0.97 0.97 mean 0.88 0.90 0.98 0.98 mean 0.83 0.84 0.98 0.99stdev 0.17 0.16 0.07 0.04 stdev 0.15 0.13 0.04 0.04 stdev 0.14 0.14 0.04 0.01
min 0.50 0.50 0.71 0.86 min 0.61 0.63 0.85 0.85 min 0.52 0.52 0.85 0.96max 1.00 1.00 1.00 1.00 max 1.00 1.00 1.00 1.00 max 1.00 1.00 1.00 1.00
mean 0.8 0.83 0.96 0.99 Mean 0.88 0.9 0.97 0.99 mean 0.75 0.75 1 1.00stdev 0.19 0.17 0.07 0.02 stdev 0.17 0.15 0.05 0.03 stdev 0.17 0.17 0 0.01
min 0.52 0.53 0.73 0.92 Min 0.54 0.54 0.84 0.88 min 0.47 0.47 1 0.98
max 1 1 1 1.00 Max 1 1 1 1.00 max 1 1 1 1.00
mean 0.81 0.82 0.99 0.99 mean 0.92 0.93 0.99 1.00 mean 0.81 0.81 1.00 1.00stdev 0.17 0.17 0.03 0.02 stdev 0.13 0.12 0.02 0.00 stdev 0.15 0.15 0.00 0.00
min 0.51 0.52 0.89 0.94 min 0.55 0.56 0.94 0.99 min 0.57 0.57 1.00 1.00
max 1.00 1.00 1.00 1.00 max 1.00 1.00 1.00 1.00 max 1.00 1.00 1.00 1.00
mean 0.84 0.86 0.98 0.99 mean 0.93 0.94 0.99 1.00 mean 0.82 0.82 1.00 1.00stdev 0.14 0.14 0.04 0.03 stdev 0.11 0.10 0.02 0.01 stdev 0.14 0.14 0.00 0.00min 0.56 0.56 0.86 0.88 min 0.71 0.71 0.91 0.97 min 0.64 0.64 1.00 0.99
max 1.00 1.00 1.00 1.00 max 1.00 1.00 1.00 1.00 max 1.00 1.00 1.00 1.00
mean 0.77 0.81 0.95 0.99 mean 0.93 0.94 0.99 0.99 mean 0.77 0.77 1.00 0.99stdev 0.19 0.16 0.11 0.02 stdev 0.13 0.12 0.03 0.02 stdev 0.14 0.14 0.01 0.04min 0.51 0.52 0.63 0.92 min 0.60 0.60 0.88 0.94 min 0.52 0.52 0.97 0.87
max 1.00 1.00 1.00 1.00 max 1.00 1.00 1.00 1.00 max 1.00 1.00 1.00 1.00mean 0.47 0.49 0.96 0.99 Mean 0.68 0.69 0.98 0.96 mean 0.41 0.41 0.99 1.00stdev 0.26 0.25 0.09 0.03 stdev 0.31 0.3 0.04 0.06 stdev 0.27 0.27 0.05 0.00
min 0.23 0.25 0.65 0.87 Min 0.21 0.21 0.88 0.84 min 0.19 0.19 0.82 0.99
max 1 1 1 1.00 Max 1 1 1 1.00 max 1 1 1 1.00
mean 0.78 0.80 0.97 0.98 mean 0.82 0.83 0.98 0.98 mean 0.78 0.84 0.94 0.98stdev 0.20 0.18 0.07 0.04 stdev 0.19 0.19 0.03 0.06 stdev 0.14 0.11 0.10 0.02
min 0.46 0.46 0.74 0.87 min 0.43 0.45 0.89 0.82 min 0.56 0.66 0.73 0.92
max 1.00 1.00 1.00 1.00 max 1.00 1.00 1.00 1.00 max 1.00 1.00 1.00 1.00
mean 0.84 0.85 0.99 0.97 mean 0.87 0.88 0.98 0.97 mean 0.81 0.84 0.96 0.98stdev 0.16 0.16 0.04 0.09 stdev 0.18 0.16 0.04 0.07 stdev 0.16 0.14 0.07 0.03
min 0.53 0.53 0.83 0.64 min 0.40 0.48 0.83 0.71 min 0.52 0.59 0.78 0.92
min 1.00 1.00 1.00 1.00 min 1.00 1.00 1.00 1.00 min 1.00 1.00 1.00 1.00
mean 0.80 0.81 0.98 0.97 mean 0.82 0.83 0.99 0.95 mean 0.85 0.89 0.96 0.95stdev 0.18 0.17 0.04 0.04 stdev 0.22 0.22 0.02 0.11 stdev 0.15 0.13 0.08 0.08
min 0.55 0.56 0.86 0.88 min 0.21 0.21 0.92 0.57 min 0.61 0.66 0.74 0.73
min 1.00 1.00 1.00 1.00 min 1.00 1.00 1.00 1.00 min 1.00 1.00 1.00 1.00
mean 0.67 0.69 0.97 0.98 mean 0.86 0.87 0.98 0.99 mean 0.72 0.73 0.99 0.99stdev 0.23 0.22 0.06 0.04 stdev 0.14 0.14 0.04 0.03 stdev 0.17 0.16 0.02 0.02
min 0.20 0.20 0.78 0.84 min 0.60 0.60 0.89 0.90 min 0.43 0.43 0.95 0.95
min 1.00 1.00 1.00 1.00 min 1.00 1.00 1.00 1.00 min 1.00 1.00 1.00 1.00
mean 0.80 0.80 0.99 0.99 mean 0.89 0.89 0.99 0.99 mean 0.78 0.78 1.00 0.99stdev 0.19 0.18 0.04 0.02 stdev 0.15 0.14 0.03 0.04 stdev 0.16 0.16 0.01 0.03
min 0.41 0.49 0.85 0.94 min 0.56 0.56 0.91 0.86 min 0.51 0.51 0.97 0.88
min 1.00 1.00 1.00 1.00 min 1.00 1.00 1.00 1.00 min 1.00 1.00 1.00 1.00
mean 0.78 0.78 1 0.98 mean 0.91 0.92 0.98 0.97 mean 0.83 0.83 1.00 0.97stdev 0.2 0.2 0.01 0.06 stdev 0.13 0.11 0.05 0.03 stdev 0.15 0.15 0.00 0.07
min 0.48 0.48 0.95 0.72 min 0.59 0.7 0.84 0.88 min 0.48 0.48 1.00 0.76
min 1 1 1 1.00 min 1 1 1 1.00 min 1 1 1.00 1.00
# 2004 The International Association for the Study of Insurance Economics.
HOW DEREGULATION SHAPES MARKET STRUCTURE AND INDUSTRY EFFICIENCY 213
All sample(45 obs)
TFP EC TC
1982\1983 mean 1.00 1.04 0.95 meanstdev 0.21 0.08 0.17 stdevmin 0.11 0.81 0.11 minmin 1.69 1.26 1.24 min
1983\1984 mean 1.02 1.02 1.00 meanstdev 0.15 0.07 0.12 stdevmin 0.61 0.88 0.61 minmin 1.33 1.24 1.28 min
1984\1985 mean 0.99 0.98 1.01 meanstdev 0.14 0.09 0.09 stdevmin 0.57 0.65 0.76 minmin 1.44 1.13 1.34 min
1985\1986 mean 1.02 1.02 1.00 meanstdev 0.25 0.08 0.16 stdevmin 0.58 0.90 0.61 minmin 2.42 1.37 1.83 min
1986\1987 mean 0.99 1.00 0.99 meanstdev 0.14 0.06 0.13 stdevmin 0.62 0.82 0.62 minmin 1.42 1.21 1.42 min
1987\1988 mean 1.01 0.98 1.03 meanstdev 0.15 0.11 0.10 stdevmin 0.54 0.50 0.82 minmin 1.42 1.21 1.35 min
1988\1989 mean 1.07 1.04 1.02 meanstdev 0.19 0.14 0.10 stdevmin 0.80 0.86 0.82 minmin 1.88 1.73 1.34 min
1989\1990 mean 1.04 1.01 1.02 meanstdev 0.14 0.06 0.09 stdevmin 0.75 0.88 0.77 minmin 1.54 1.19 1.21 min
1991\1990 mean 1.04 0.98 1.06 meanstdev 0.11 0.05 0.09 stdevmin 0.82 0.82 0.90 minmin 1.33 1.03 1.33 min
1991\1992 mean 0.97 1.00 0.97 meanstdev 0.13 0.04 0.12 stdevmin 0.67 0.85 0.76 minmin 1.47 1.10 1.47 min
1992\1993 mean 1.09 0.98 1.11 meanstdev 0.16 0.07 0.13 stdevmin 0.65 0.69 0.87 minmin 1.40 1.05 1.40 min
1993\1994 mean 1.09 0.99 1.11 meanstdev 0.27 0.07 0.26 stdevmin 0.81 0.81 0.81 minmin 2.16 1.19 2.16 min
1994\1995 mean 1.20 1.00 1.20 meanstdev 0.41 0.13 0.33 stdevmin 0.40 0.77 0.44 minmin 2.24 1.54 2.02 min
1995\1996 mean 1.03 1.01 1.02 meanstdev 0.17 0.12 0.14 stdevmin 0.58 0.64 0.75 minmin 1.44 1.43 1.38 min
1996\1997 mean 1.21 0.99 1.23 meanstdev 0.36 0.09 0.33 stdevmin 0.52 0.73 0.52 minmin 2.32 1.26 2.32 min
1997\1998 mean 1.20 1.20 1.15 meanstdev 0.69 0.55 0.70 stdevmin 0.38 0.78 0.38 minmin 3.92 3.50 3.92 min
1998\1999 mean 1.05 1.00 1.05 meanstdev 0.28 0.05 0.28 stdevmin 0.72 0.86 0.72 minmin 2.28 1.18 2.28 min
1999\2000 mean 1.02 0.99 1.03 meanstdev 0.17 0.08 0.15 stdevmin 0.74 0.72 0.81 minmin 1.73 1.16 1.73 min
All sample(45 obs)
Fined(27 obs)
TFP EC TC TFP EC TC
1982\1983 mean 1.00 1.04 0.95 mean 0.99 1.05 0.95stdev 0.21 0.08 0.17 stdev 0.14 0.06 0.12min 0.11 0.81 0.11 min 0.60 0.95 0.60min 1.69 1.26 1.24 min 1.30 1.15 1.18
1983\1984 mean 1.02 1.02 1.00 mean 1.02 1.02 1.00stdev 0.15 0.07 0.12 stdev 0.12 0.06 0.10min 0.61 0.88 0.61 min 0.73 0.88 0.73min 1.33 1.24 1.28 min 1.28 1.18 1.28
1984\1985 mean 0.99 0.98 1.01 mean 1.02 1.00 1.02stdev 0.14 0.09 0.09 stdev 0.06 0.05 0.03min 0.57 0.65 0.76 min 0.88 0.87 0.92min 1.44 1.13 1.34 min 1.18 1.13 1.07
1985\1986 mean 1.02 1.02 1.00 mean 1.00 1.01 0.99stdev 0.25 0.08 0.16 stdev 0.08 0.04 0.07min 0.58 0.90 0.61 min 0.78 0.94 0.78min 2.42 1.37 1.83 min 1.19 1.13 1.08
1986\1987 mean 0.99 1.00 0.99 mean 0.98 1.00 0.98stdev 0.14 0.06 0.13 stdev 0.12 0.04 0.09min 0.62 0.82 0.62 min 0.72 0.88 0.72min 1.42 1.21 1.42 min 1.37 1.13 1.20
1987\1988 mean 1.01 0.98 1.03 mean 1.00 0.99 1.01stdev 0.15 0.11 0.10 stdev 0.08 0.04 0.07min 0.54 0.50 0.82 min 0.87 0.84 0.88min 1.42 1.21 1.35 min 1.15 1.04 1.15
1988\1989 mean 1.07 1.04 1.02 mean 1.04 1.01 1.02stdev 0.19 0.14 0.10 stdev 0.08 0.04 0.07min 0.80 0.86 0.82 min 0.88 0.95 0.92min 1.88 1.73 1.34 min 1.20 1.15 1.20
1989\1990 mean 1.04 1.01 1.02 mean 1.03 1.01 1.02stdev 0.14 0.06 0.09 stdev 0.09 0.05 0.07min 0.75 0.88 0.77 min 0.84 0.88 0.84min 1.54 1.19 1.21 min 1.24 1.19 1.15
1991\1990 mean 1.04 0.98 1.06 mean 1.01 0.98 1.03stdev 0.11 0.05 0.09 stdev 0.08 0.04 0.08min 0.82 0.82 0.90 min 0.88 0.88 0.90min 1.33 1.03 1.33 min 1.19 1.00 1.19
1991\1992 mean 0.97 1.00 0.97 mean 0.95 1.00 0.95stdev 0.13 0.04 0.12 stdev 0.08 0.01 0.08min 0.67 0.85 0.76 min 0.81 0.97 0.81min 1.47 1.10 1.47 min 1.13 1.03 1.13
1992\1993 mean 1.09 0.98 1.11 mean 1.13 0.99 1.14stdev 0.16 0.07 0.13 stdev 0.13 0.03 0.12min 0.65 0.69 0.87 min 0.84 0.86 0.90min 1.40 1.05 1.40 min 1.40 1.03 1.40
1993\1994 mean 1.09 0.99 1.11 mean 1.14 0.98 1.16stdev 0.27 0.07 0.26 stdev 0.32 0.05 0.31min 0.81 0.81 0.81 min 0.82 0.81 0.82min 2.16 1.19 2.16 min 2.16 1.06 2.16
1994\1995 mean 1.20 1.00 1.20 mean 1.23 0.98 1.24stdev 0.41 0.13 0.33 stdev 0.44 0.12 0.36min 0.40 0.77 0.44 min 0.40 0.77 0.44min 2.24 1.54 2.02 min 2.05 1.23 2.02
1995\1996 mean 1.03 1.01 1.02 mean 1.05 1.01 1.04stdev 0.17 0.12 0.14 stdev 0.15 0.11 0.13min 0.58 0.64 0.75 min 0.75 0.71 0.75min 1.44 1.43 1.38 min 1.37 1.43 1.37
1996\1997 mean 1.21 0.99 1.23 mean 1.16 0.98 1.18stdev 0.36 0.09 0.33 stdev 0.33 0.09 0.29min 0.52 0.73 0.52 min 0.52 0.73 0.52min 2.32 1.26 2.32 min 2.32 1.26 2.32
1997\1998 mean 1.20 1.20 1.15 mean 1.17 1.20 1.09stdev 0.69 0.55 0.70 stdev 0.65 0.50 0.64min 0.38 0.78 0.38 min 0.38 0.90 0.38min 3.92 3.50 3.92 min 3.92 3.50 3.92
1998\1999 mean 1.05 1.00 1.05 mean 0.97 0.99 0.97stdev 0.28 0.05 0.28 stdev 0.11 0.03 0.10min 0.72 0.86 0.72 min 0.72 0.88 0.72min 2.28 1.18 2.28 min 1.24 1.05 1.17
1999\2000 mean 1.02 0.99 1.03 mean 0.96 0.98 0.97stdev 0.17 0.08 0.15 stdev 0.10 0.07 0.07min 0.74 0.72 0.81 min 0.74 0.76 0.81min 1.73 1.16 1.73 min 1.09 1.09 1.07
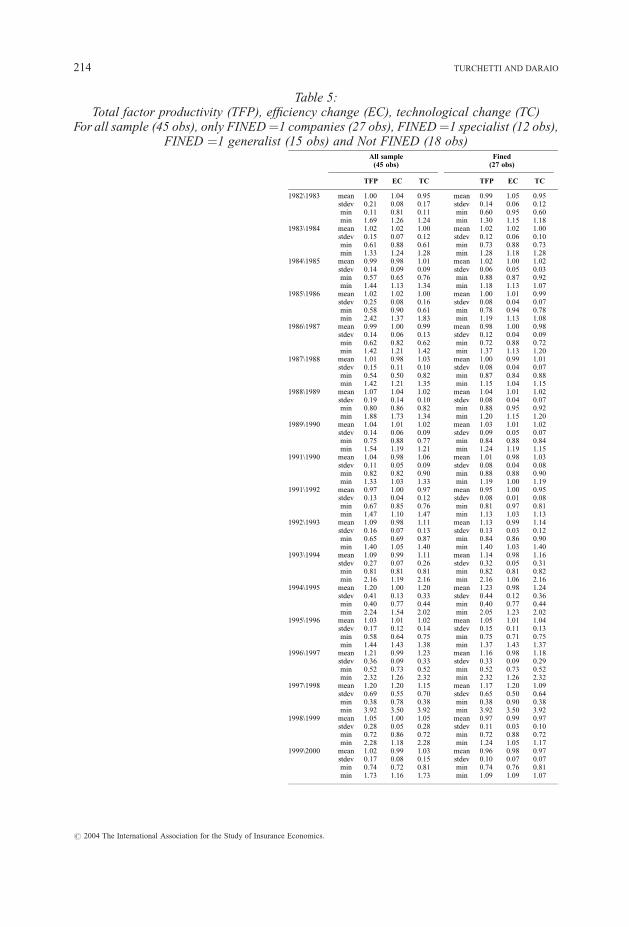
Table 5:Total factor productivity (TFP), efficiency change (EC), technological change (TC)
For all sample (45 obs), only FINED ¼1 companies (27 obs), FINED ¼1 specialist (12 obs),FINED ¼1 generalist (15 obs) and Not FINED (18 obs)
# 2004 The International Association for the Study of Insurance Economics.
214 TURCHETTI AND DARAIO

Fined(27 obs)
TFP EC TC
0.99 1.05 0.950.14 0.06 0.120.60 0.95 0.601.30 1.15 1.181.02 1.02 1.000.12 0.06 0.100.73 0.88 0.731.28 1.18 1.281.02 1.00 1.020.06 0.05 0.030.88 0.87 0.921.18 1.13 1.071.00 1.01 0.990.08 0.04 0.070.78 0.94 0.781.19 1.13 1.080.98 1.00 0.980.12 0.04 0.090.72 0.88 0.721.37 1.13 1.201.00 0.99 1.010.08 0.04 0.070.87 0.84 0.881.15 1.04 1.151.04 1.01 1.020.08 0.04 0.070.88 0.95 0.921.20 1.15 1.201.03 1.01 1.020.09 0.05 0.070.84 0.88 0.841.24 1.19 1.151.01 0.98 1.030.08 0.04 0.080.88 0.88 0.901.19 1.00 1.190.95 1.00 0.950.08 0.01 0.080.81 0.97 0.811.13 1.03 1.131.13 0.99 1.140.13 0.03 0.120.84 0.86 0.901.40 1.03 1.401.14 0.98 1.160.32 0.05 0.310.82 0.81 0.822.16 1.06 2.161.23 0.98 1.240.44 0.12 0.360.40 0.77 0.442.05 1.23 2.021.05 1.01 1.040.15 0.11 0.130.75 0.71 0.751.37 1.43 1.371.16 0.98 1.180.33 0.09 0.290.52 0.73 0.522.32 1.26 2.321.17 1.20 1.090.65 0.50 0.640.38 0.90 0.383.92 3.50 3.920.97 0.99 0.970.11 0.03 0.100.72 0.88 0.721.24 1.05 1.170.96 0.98 0.970.10 0.07 0.070.74 0.76 0.811.09 1.09 1.07
Fined – generalist(15 obs)
Fined – specialist(12 obs)
Not fined(18 obs)
TFP EC TC TFP EC TC TFP EC TC
mean 0.98 1.04 0.93 mean 1.00 1.04 0.96 mean 1.02 1.03 0.95stdev 0.12 0.06 0.10 stdev 0.15 0.05 0.13 stdev 0.29 0.10 0.23min 0.60 0.95 0.60 min 0.60 0.97 0.60 min 0.11 0.81 0.11min 1.13 1.15 1.02 min 1.30 1.13 1.18 min 1.69 1.26 1.24mean 1.04 1.04 1.00 mean 1.01 1.00 1.01 mean 1.00 1.02 1.00stdev 0.11 0.07 0.10 stdev 0.13 0.05 0.11 stdev 0.18 0.08 0.14min 0.73 0.88 0.73 min 0.74 0.89 0.84 min 0.61 0.91 0.61min 1.22 1.18 1.11 min 1.28 1.09 1.28 min 1.33 1.24 1.23mean 1.02 1.00 1.02 mean 1.03 1.01 1.02 mean 0.95 0.94 0.99stdev 0.04 0.03 0.03 stdev 0.08 0.06 0.04 stdev 0.21 0.12 0.14min 0.97 0.96 0.97 min 0.88 0.87 0.92 min 0.57 0.65 0.76min 1.13 1.05 1.07 min 1.18 1.13 1.06 min 1.44 1.07 1.34mean 1.02 1.01 1.01 mean 1.00 1.02 0.98 mean 1.05 1.04 1.00stdev 0.08 0.03 0.05 stdev 0.05 0.04 0.06 stdev 0.37 0.12 0.24min 0.87 0.94 0.88 min 0.93 0.94 0.88 min 0.58 0.90 0.61min 1.19 1.10 1.08 min 1.10 1.13 1.08 min 2.42 1.37 1.83mean 0.97 1.00 0.97 mean 0.96 1.00 0.95 mean 1.02 1.00 1.02stdev 0.08 0.04 0.07 stdev 0.15 0.04 0.12 stdev 0.18 0.09 0.16min 0.72 0.88 0.72 min 0.72 0.93 0.72 min 0.62 0.82 0.62min 1.05 1.08 1.06 min 1.37 1.13 1.20 min 1.42 1.21 1.42mean 1.01 0.99 1.02 mean 0.99 0.99 1.00 mean 1.04 0.98 1.06stdev 0.08 0.04 0.07 stdev 0.06 0.03 0.05 stdev 0.22 0.17 0.12min 0.87 0.84 0.88 min 0.88 0.89 0.88 min 0.54 0.50 0.82min 1.15 1.04 1.15 min 1.09 1.04 1.09 min 1.42 1.21 1.35mean 1.04 1.02 1.02 mean 1.04 1.01 1.03 mean 1.12 1.09 1.01stdev 0.07 0.04 0.05 stdev 0.08 0.01 0.08 stdev 0.28 0.22 0.14min 0.92 0.95 0.92 min 0.93 1.00 0.93 min 0.80 0.86 0.82min 1.18 1.15 1.11 min 1.20 1.04 1.20 min 1.88 1.73 1.34mean 1.04 0.99 1.04 mean 1.01 1.02 1.00 mean 1.06 1.01 1.02stdev 0.07 0.04 0.06 stdev 0.10 0.06 0.08 stdev 0.19 0.07 0.12min 0.94 0.88 0.94 min 0.84 0.95 0.84 min 0.75 0.88 0.77min 1.15 1.06 1.15 min 1.24 1.19 1.14 min 1.54 1.15 1.21mean 1.01 0.97 1.04 mean 1.04 0.99 1.05 mean 1.07 0.97 1.09stdev 0.08 0.04 0.07 stdev 0.08 0.02 0.09 stdev 0.13 0.06 0.10min 0.88 0.88 0.90 min 0.94 0.92 0.94 min 0.82 0.82 0.97min 1.18 1.00 1.18 min 1.19 1.00 1.19 min 1.33 1.03 1.33mean 0.92 1.00 0.92 mean 0.97 1.00 0.97 mean 0.99 0.99 1.00stdev 0.06 0.01 0.06 stdev 0.07 0.01 0.07 stdev 0.19 0.06 0.17min 0.81 0.97 0.81 min 0.87 0.97 0.87 min 0.67 0.85 0.76min 1.04 1.03 1.04 min 1.11 1.01 1.11 min 1.47 1.10 1.47mean 1.18 1.00 1.19 mean 1.08 0.99 1.09 mean 1.01 0.97 1.05stdev 0.12 0.02 0.11 stdev 0.12 0.04 0.10 stdev 0.18 0.10 0.12min 1.05 0.94 1.05 min 0.84 0.86 0.90 min 0.65 0.69 0.87min 1.40 1.03 1.40 min 1.27 1.03 1.27 min 1.27 1.05 1.27mean 1.17 0.96 1.21 mean 1.13 0.99 1.14 mean 1.03 1.01 1.03stdev 0.31 0.06 0.28 stdev 0.35 0.04 0.34 stdev 0.14 0.08 0.13min 0.92 0.81 0.99 min 0.82 0.90 0.82 min 0.81 0.87 0.81min 1.83 1.03 1.83 min 2.16 1.06 2.16 min 1.36 1.19 1.36mean 1.47 1.02 1.43 mean 0.98 0.93 1.06 mean 1.15 1.02 1.13stdev 0.43 0.13 0.35 stdev 0.23 0.10 0.23 stdev 0.36 0.15 0.24min 0.64 0.78 0.64 min 0.40 0.77 0.44 min 0.73 0.84 0.73min 2.05 1.23 2.02 min 1.46 1.11 1.34 min 2.24 1.54 1.74mean 1.09 0.99 1.10 mean 1.03 1.04 0.99 mean 1.00 1.01 1.00stdev 0.14 0.09 0.11 stdev 0.13 0.12 0.10 stdev 0.20 0.14 0.14min 0.80 0.71 0.98 min 0.77 0.91 0.77 min 0.58 0.64 0.75min 1.37 1.15 1.37 min 1.35 1.43 1.22 min 1.44 1.39 1.38mean 1.21 0.99 1.21 mean 1.15 0.99 1.16 mean 1.28 1.00 1.32stdev 0.43 0.09 0.37 stdev 0.27 0.11 0.15 stdev 0.38 0.08 0.36min 0.52 0.81 0.52 min 0.92 0.73 0.98 min 0.89 0.85 0.89min 2.32 1.26 2.32 min 2.03 1.26 1.62 min 2.32 1.26 2.32mean 0.99 1.06 0.92 mean 1.37 1.34 1.28 mean 1.26 1.18 1.26stdev 0.40 0.19 0.32 stdev 0.79 0.66 0.81 stdev 0.75 0.63 0.78min 0.38 0.90 0.38 min 0.84 1.00 0.84 min 0.41 0.78 0.52min 1.90 1.75 1.73 min 3.92 3.50 3.92 min 3.92 3.50 3.92mean 0.98 0.99 0.99 mean 0.96 0.99 0.96 mean 1.18 1.02 1.18stdev 0.08 0.02 0.09 stdev 0.12 0.05 0.08 stdev 0.38 0.07 0.40min 0.82 0.95 0.82 min 0.79 0.88 0.87 min 0.86 0.86 0.86min 1.12 1.03 1.12 min 1.24 1.05 1.17 min 2.28 1.18 2.28mean 0.96 0.98 0.98 mean 0.96 0.99 0.98 mean 1.13 1.00 1.12stdev 0.10 0.06 0.06 stdev 0.10 0.08 0.09 stdev 0.21 0.09 0.20min 0.74 0.81 0.85 min 0.80 0.76 0.81 min 0.81 0.72 0.90min 1.09 1.06 1.06 min 1.06 1.09 1.07 min 1.73 1.16 1.73
# 2004 The International Association for the Study of Insurance Economics.
HOW DEREGULATION SHAPES MARKET STRUCTURE AND INDUSTRY EFFICIENCY 215
companies), specialist insurers (12 companies) present in several years higher pure technicalefficiency, but for the whole period they show lower cost and allocative efficiencies inrespect to generalist insurers (15 companies). The possibility of overcoming difficulties inthe motor line and in the other non-life lines with a higher efficiency in the life line probablyexplains these differences.
Several interesting results emerge from the Malmquist total factor productivityanalysis. First of all, we observe that the companies in the sample did not experience strongvariations either in the efficiency change dimension or in the technological changedimension during the period 1982–1993. After 1993, we observe an increase in total factorproductivity at significant rates 9 per cent (1993/94), 20 per cent (1994/95), 21 per cent(1996/97), and 20 per cent (1997/98). These increments are mainly due to technologicalchanges (shift in the curve) rather than to efficiency changes. This is consistent with thedeep process of reorganization of companies at the administrative and distribution levels,and the re-structuring of operative activities, also promoted by the more diffuse introductionof modern information and communication technologies. The reduction in incrementsobserved in 1998/1999 and 1999/2000 could be connected to changes in the accountabilitysystem introduced in 1998.11
Secondly, the comparison between fined and non-fined companies shows that thevariations in total factor productivity are quite similar up to the early 1990s. Then, in thesecond half of the 1990s, non-fined companies present better results, especially with regardto the technological change dimension. It could be argued that higher competitive pressuresin the motor business after 1994 produced a stronger incentive to pursue the introduction ofreal innovations in companies not participating in the information network establishedamong fined insurers.
Among fined companies, generalist ones present better results than specialist ones interms of total factor productivity, especially because of a higher increase in thetechnological change dimension. We could hypothesize that the technological innovationsintroduced by companies operating also in the life business (probably because of theinnovation required by the strong dynamics observed in the life business) also benefited thenon-life activities.
5. Main conclusions
In this paper we have tried to provide empirical evidence on how deregulation canshape market structure and industry performance. In order to do that, we analysed theevolution of the number of motor insurers, their entry-exit dynamics, the concentrationratios, the trend of premiums, and their relation to legislative events over the period 1982–2000. From this analysis we could conclude that the deregulation process activated in theinsurance business in 1994 affected the Italian motor insurance industry. After 1994 thedynamics of entry-exit were particularly active and the number of authorized insurersclearly fell (from 97 in 1982, it went up to 113 in 1991, it went down to 105 in 1994 and itreached its minimum in 2000 with 80 companies, representing a fall of 23.8 per cent in onlysix years).
This downward trend in the number of competitors in the motor business observed in
11 We are investigating in more detail the possible effects of this accounting innovation.
# 2004 The International Association for the Study of Insurance Economics.
216 TURCHETTI AND DARAIO

the second half of the 1990s is particularly significant, as it comes after a period of almost 15years of constant growth.
Moreover, from the efficiency analysis carried out on a sample of 45 Italian insurersactive in the motor insurance business, it seems that cost efficiency and in particular totalfactor productivity increased in the period considered (1982–2000), especially in the secondhalf of the 1990s.
However, in order to derive definitive policy implications from the analysis suggestedin this paper, it is still necessary to run further elaborations and data processing and toprovide extra empirical evidence. Nevertheless, we think that to measure the extent,dispersion and interaction among deregulation measures and the dynamics of efficiency andproductivity of insurers over time could give the regulators very helpful information.Several directions for future research are possible. Whether and to what extent the newstructure of the market and the improvement of efficiency and productivity benefited andwill benefit customers, are probably the most important questions to address.
REFERENCES
ASSICURAZIONI GENERALI, 2003, ‘‘Italian Market Trends: 2002’’, Research Department.BERGER, A.N. and HUMPHREY, D.B., 1992, ‘‘Measurement and Efficiency Issues in Commercial Banking’’, in
Griliches, Z. (ed.), Output Measurement in the Service Sectors. Chicago: University of Chicago Press.BERGER, A.N. and HUMPHREY, D.B., 1997, ‘‘Efficiency of Financial Institutions: International Survey and
Directions for Future Research’’, European Journal of Operational Research, 98, pp. 175–213.BERGER, A.N., CUMMINS, J.D. andWEISS, M.A., 1997, ‘‘The Coexistence of Multiple Distribution Systems for
Financial Services: The Case of Property-Liability Insurance’’, Journal of Business, 70, pp. 515–546.BORGHESI, A., 1991, ‘‘Some Considerations on Productivity and Performance in Insurance’’, The Geneva Papers
on Risk and Insurance, 16(60), July, pp. 293–301.CHARNES, A., COOPER, W., LEWIN, A.Y. and SEIFORD, L.M., 1994, Data Envelopment Analysis: Theory,
Methodology, and Applications. Norwell, MA: Kluwer Academic.CLEVELAND, W.S., 1993, Visualizing Data. Summit, NJ: Hobart Press.CLEVELAND, W.S., 1994, The Elements of Graphing Data. Summit, NJ: Hobart Press.COOPER, W.W., SEIFORD, L.M. and TONE, K., 1999, Data Envelopment Analysis: A Comprehensive Text with
Models, Applications, References and DEA-Solver Software. Boston: Kluwer Academic.CUMMINS, J.D. and RUBIO-MISAS, M., 2001, ‘‘Deregulation, Consolidation and Efficiency: Evidence from the
Spanish Insurance Industry’’, Working Paper 02-01, Financial Institutions Center, The Wharton School,University of Pennsylvania.
CUMMINS, J.D., TURCHETTI, G. and WEISS, M.A., 1996, ‘‘Productivity and Technical Efficiency in the ItalianInsurance Industry’’, Working Paper 96-10, Financial Institutions Center, The Wharton School, University ofPennsylvania.
CUMMINS, J.D., WEISS, M.A. and ZI, H., 1999, ‘‘Organizational Form and Efficiency: An Analysis of Stock andMutual Property-Liability Insurers’’, Management Science, 45, pp. 1254–1269.
FARE, R., GROSSKOPF, S., NORRIS, M. and ZHANG, Z., 1994, ‘‘Productivity Growth, Technical Progress, andEfficiency Change in Industrialized Countries’’, American Economic Review, 84, pp. 66–83.
FARRELL, M.J., 1957, ‘‘The Measurement of the Productive Efficiency’’, Journal of the Royal Statistical Society,Series A, CXX, Part 3, pp. 253–290.
GROSSKOPF, S., 1993, ‘‘Efficiency and Productivity’’, in Fried, H.O., Lovell, C.A.K. and Schmidt, S.S. (eds), TheMeasurement of Productive Efficiency. New York: Oxford University Press.
ISVAP, 2000, ‘‘Motor Insurance in Italy: Analysis and Suggestions’’ (in Italian).LOVELL, C.A.K., 1993, ‘‘Production Frontiers and Productive Efficiency,’’ in Fried, H.O., Lovell, C.A.K. and
Schmidt, S.S. (eds), The Measurement of Productive Efficiency. New York: Oxford University Press.PONTREMOLI, R., 2002, ‘‘Evolution and Innovation in Insurance Management: the Italian Case’’, The Geneva
Papers on Risk and Insurance, 27(4), pp. 669–687.PROSPERETTI, L., 1991, ‘‘Economies of Scale in Italian non-Life Insurance’’, The Geneva Papers on Risk and
Insurance, 16(60), pp. 282–292.SKOGH, G., 1982, ‘‘Return to Scale in the Swedish Property-Liability Insurance Industry’’, The Journal of Risk and
Insurance.
# 2004 The International Association for the Study of Insurance Economics.
HOW DEREGULATION SHAPES MARKET STRUCTURE AND INDUSTRY EFFICIENCY 217

SWISS RE, 1996, ‘‘Deregulation and Liberalisation of Market Access: the European Insurance Industry on theThreshold of a New Era in Competition’’, Sigma, 7.
TURCHETTI, G., 2000, Innovation and Distribution Channels in the Insurance Sector. Theoretical Analysis andStrategic Behaviour (in Italian). Milan: FrancoAngeli.
VARALDO, R. and TURCHETTI, G. (eds), 2000, Evolution Profiles of Marketing and Distribution of Insurance (inItalian). Milan: FrancoAngeli.
# 2004 The International Association for the Study of Insurance Economics.
218 TURCHETTI AND DARAIO