Managerial efficiency and hospitality industry: the Portuguese case
26
For Peer Review Managerial Efficiency and Hospitality Industry: the Portuguese Case Journal: Applied Economics Manuscript ID: APE-07-0422.R1 Journal Selection: Applied Economics Date Submitted by the Author: 31-Oct-2008 Complete List of Authors: Barros, Carlos; Technical University of Lisbon, ISEG Botti, Laurent; University of Perpignan, IAE-GEREM Peypoch, Nicolas; University of Perpignan, IAE-GEREM Solonandrasana, Bernardin; University of Perpignan, IAE-GEREM JEL Code: C44 - Statistical Decision Theory|Operations Research < C4 - Econometric and Statistical Methods: Special Topics < C - Mathematical and Quantitative Methods, C10 - General < C1 - Econometric and Statistical Methods: General < C - Mathematical and Quantitative Methods, C61 - Optimization Techniques|Programming Models|Dynamic Analysis < C6 - Mathematical Methods and Programming < C - Mathematical and Quantitative Methods, D21 - Firm Behavior < D2 - Production and Organizations < D - Microeconomics, D24 - Production|Capital and Total Factor Productivity|Capacity < D2 - Production and Organizations < D - Microeconomics Keywords: Efficiency, Data envelopment analysis, Bootstrap, Hospitality industry Editorial Office, Dept of Economics, Warwick University, Coventry CV4 7AL, UK Submitted Manuscript peer-00582251, version 1 - 1 Apr 2011 Author manuscript, published in "Applied Economics (2009) 1" DOI : 10.1080/00036840802600145
Transcript of Managerial efficiency and hospitality industry: the Portuguese case
For Peer Review
Managerial Efficiency and Hospitality Industry: the Portuguese Case
Journal: Applied Economics
Manuscript ID: APE-07-0422.R1
Journal Selection: Applied Economics
Date Submitted by the Author:
31-Oct-2008
Complete List of Authors: Barros, Carlos; Technical University of Lisbon, ISEG Botti, Laurent; University of Perpignan, IAE-GEREM
Peypoch, Nicolas; University of Perpignan, IAE-GEREM Solonandrasana, Bernardin; University of Perpignan, IAE-GEREM
JEL Code:
C44 - Statistical Decision Theory|Operations Research < C4 - Econometric and Statistical Methods: Special Topics < C - Mathematical and Quantitative Methods, C10 - General < C1 - Econometric and Statistical Methods: General < C - Mathematical and Quantitative Methods, C61 - Optimization Techniques|Programming Models|Dynamic Analysis < C6 - Mathematical Methods and Programming < C - Mathematical and Quantitative Methods, D21 - Firm Behavior < D2 - Production and Organizations < D - Microeconomics, D24 - Production|Capital and Total Factor Productivity|Capacity < D2 - Production and
Organizations < D - Microeconomics
Keywords: Efficiency, Data envelopment analysis, Bootstrap, Hospitality industry
Editorial Office, Dept of Economics, Warwick University, Coventry CV4 7AL, UK
Submitted Manuscriptpe
er-0
0582
251,
ver
sion
1 -
1 Ap
r 201
1Author manuscript, published in "Applied Economics (2009) 1"
DOI : 10.1080/00036840802600145
For Peer Review
Page 1 of 24
Editorial Office, Dept of Economics, Warwick University, Coventry CV4 7AL, UK
Submitted Manuscript
123456789101112131415161718192021222324252627282930313233343536373839404142434445464748495051525354555657585960
peer
-005
8225
1, v
ersi
on 1
- 1
Apr 2
011

For Peer Review
- 1 -
Managerial Efficiency and Hospitality Industry: the Portuguese
Case*
Carlos Pestana Barros1, Laurent Botti
2 3, Nicolas Peypoch
3 4 and Bernardin
Solonandrasana3
1 ISEG, Instituto Superior de Economia e Gestao, Technical University of Lisbon, Rua
Miguel Lupi, 20, 1249-078 Lisbon, Portugal.
2 ERFI, Institut des Sciences de l’Entreprise de Montpellier – Université Montpellier
I, Espace Richter, Bâtiment B, CS 19519, F – 34 960 Montpellier Cedex 2, France.
3 GEREM, Institut d’Administration des Entreprises, Université de Perpignan Via
Domitia, 52 Avenue Paul Alduy, F – 66 860 Perpignan Cedex, France.
4 LAMPS, Faculté des Sciences Exactes et Expérimentales, Université de Perpignan
Via Domitia, 52 avenue Paul Alduy, F – 66 860 Perpignan Cedex, France.
E-mail :
Barros Carlos P ([email protected])
Botti Laurent ([email protected]).
Peypoch Nicolas ([email protected])
Solonandrasana Bernardin ([email protected])
* Comments by Editor Mark P. Taylor and one anonymous referee of Applied Economics are gratefully
acknowledged.
Page 2 of 24
Editorial Office, Dept of Economics, Warwick University, Coventry CV4 7AL, UK
Submitted Manuscript
123456789101112131415161718192021222324252627282930313233343536373839404142434445464748495051525354555657585960
peer
-005
8225
1, v
ersi
on 1
- 1
Apr 2
011
For Peer Review
- 2 -
Managerial Efficiency and Hospitality Industry: the Portuguese Case
Abstract:
In this paper, the innovative two-stage procedure of Simar and Wilson (2007) is used
to estimate the efficiency determinants of Portuguese hotel groups from 1998 to 2005.
In the first stage, the hotels’ technical efficiency is estimated with DEA in order to
establish which hotels have the most efficient performance. These could serve as
peers to help improve performance of the least efficient hotels. In the second stage,
the Simar and Wilson model is used to bootstrap the DEA scores with a truncated
regression.
The paper contributes to the hotel industry literature by adopting a somewhat novel
approach that has never been applied to this industry despite its managerial
implications. The motivation for the analysis lies in the fact that during the period
under analysis Portuguese hotels faced a number of threats. Knowing what the best
practices are is then good news for managers and institutions.
Keywords: Efficiency, Data envelopment analysis, Bootstrap, Hospitality industry.
Page 3 of 24
Editorial Office, Dept of Economics, Warwick University, Coventry CV4 7AL, UK
Submitted Manuscript
123456789101112131415161718192021222324252627282930313233343536373839404142434445464748495051525354555657585960
peer
-005
8225
1, v
ersi
on 1
- 1
Apr 2
011

For Peer Review
- 3 -
1. Introduction
Performance analysis is a central issue of corporate governance because in a
competitive environment, a company less efficient than its competitors fails generally
to maintain a sufficient market share to survive on the market. The tourism industry is
not immune to this performance need. Therefore, developing tools enabling to
evaluate the performance of tourism activities is of critical importance. In particular,
in order to provide policy makers guidelines, to correct inefficient management
directions and to promote positive effects from competition, it proves fundamental to
use performance indicators as regard hotels.
Two scientific methods to quantitatively analyse performance are econometric
frontier (Kumbhakar and Lovell, 2000) and data envelopment analysis (Cooper,
Seiford and Tone, 2000; Thanasoulis, 2001). Both methods have advantages and
drawbacks. Unlike the econometric frontier approach, the DEA allows for the use of
multiple inputs and outputs, not imposes any functional form on the data, and doesn’t
make distributional assumptions for the inefficiency term. With DEA, the frontier
relates to the sample considered in the analysis i.e. the efficient isoquant is estimated
from the data.
This paper analyses the Portuguese hotel industry from 1998 to 2005 with a two-stage
DEA procedure to estimate and explain technical efficiency. This technique,
developed by Simar and Wilson (2007) overcomes severe limitations inherent in
using the two-stage DEA approach commonly employed in the efficiency literature
(Balcombe et al., 2008). Following this technique, the efficient DEA scores are
calculated in the first stage, and a bootstrap procedure is adopted in the second stage
to identify the sources of efficiency. The paper contributes to the hotel industry
literature by adopting a quite new model that, despite its managerial implications, has
never been applied to this industry.
The motivation for the present research relates to the fact that in spite of the
expansion experienced during the period under analysis, Portuguese hotels face a
number of threats. Firstly, several financial groups have entered the market. For
example, the Portuguese financial institution, Banco Espírito Santo, has recently
acquired the Tivoli hotels and expanded it amounting now to fourteen hotels.
Secondly, foreign hotel chains have established a market presence, such as Holiday-
Inn and Marriott, taking advantage of the benefits arising from the EU Single Market,
which was established in 1992 with the aim of facilitating the free movement of goods
Page 4 of 24
Editorial Office, Dept of Economics, Warwick University, Coventry CV4 7AL, UK
Submitted Manuscript
123456789101112131415161718192021222324252627282930313233343536373839404142434445464748495051525354555657585960
peer
-005
8225
1, v
ersi
on 1
- 1
Apr 2
011
For Peer Review
- 4 -
and services throughout the member-states. Third, much hotel constructions have
taken place on the basis of EU funding, which has resulted in the rapid expansion of
hotels throughout the country. The combination of all these factors gives to the
Portuguese hotel sector an extremely competitive character which points to the need
for an improvement in efficiency (Santos, 2004).
This paper is organized as follows: after this now ending introduction, section 2
presents the institutional settings, describing the Portuguese hotel sector and its
characteristics; Section 3 reviews the existing literature on the topic; Section 4
explains the theoretical framework; Section 5 exposes the first stage results; Section 6
offers the second stage results; Section 7 discusses the results and considers the
limitations of the paper, in addition to possible future research tracks; and Section 8
presents the conclusions.
2. Institutional Settings
As a tourist destination, Portugal continues to explore alternatives that would allow
for the repositioning of its brand image from a low-cost “sun-and-sand” destination to
an international cultural and heritage tourist attraction (Santos, 2004). In response to
the efforts of the Portuguese institutional tourist authorities to achieve this
repositioning, many new hotels have been built to provide accommodations in “news”
regions i.e. not traditionally promoted “sun-and-sand” destinations.
Considering the increased competitiveness in tourism, hotels economic efficiency
takes a central importance in the nationwide performance. According to the World
Tourism Organisation statistics (1999), Portugal was ranked at the 19th place as a
tourist destination in 1990 and at the 24th place in 1998 with 1.1% of the total
amounts of tourists in the world (see the Financial Times Survey on Portugal, 21
October, 2002). This value represents a small value at the international level,
especially when it is compared with the value of Portugal neighbour, Spain, 6.7%. But
inbound tourism represents about 5% of Portuguese national GDP, revealing a
significant economic impact of tourism activities which are directly related to the
hotel sector.
Similarly to many other countries, the Portuguese hotel sector is comprised of both
large and small units that compete in the market. However, a distinct characteristic of
the Portuguese hotel sector is that it is dominated by national groups. Specifically,
when compared with Spain, which relies extensively on foreign capital, the
Page 5 of 24
Editorial Office, Dept of Economics, Warwick University, Coventry CV4 7AL, UK
Submitted Manuscript
123456789101112131415161718192021222324252627282930313233343536373839404142434445464748495051525354555657585960
peer
-005
8225
1, v
ersi
on 1
- 1
Apr 2
011
For Peer Review
- 5 -
Portuguese hotel sector relies heavily on national capital. For this reason, the
country’s largest hotel chains mostly comprise national groups. But things are
changing with the European common market and we include in our study recognised
international names such as Sheraton, Ritz and Savoy.
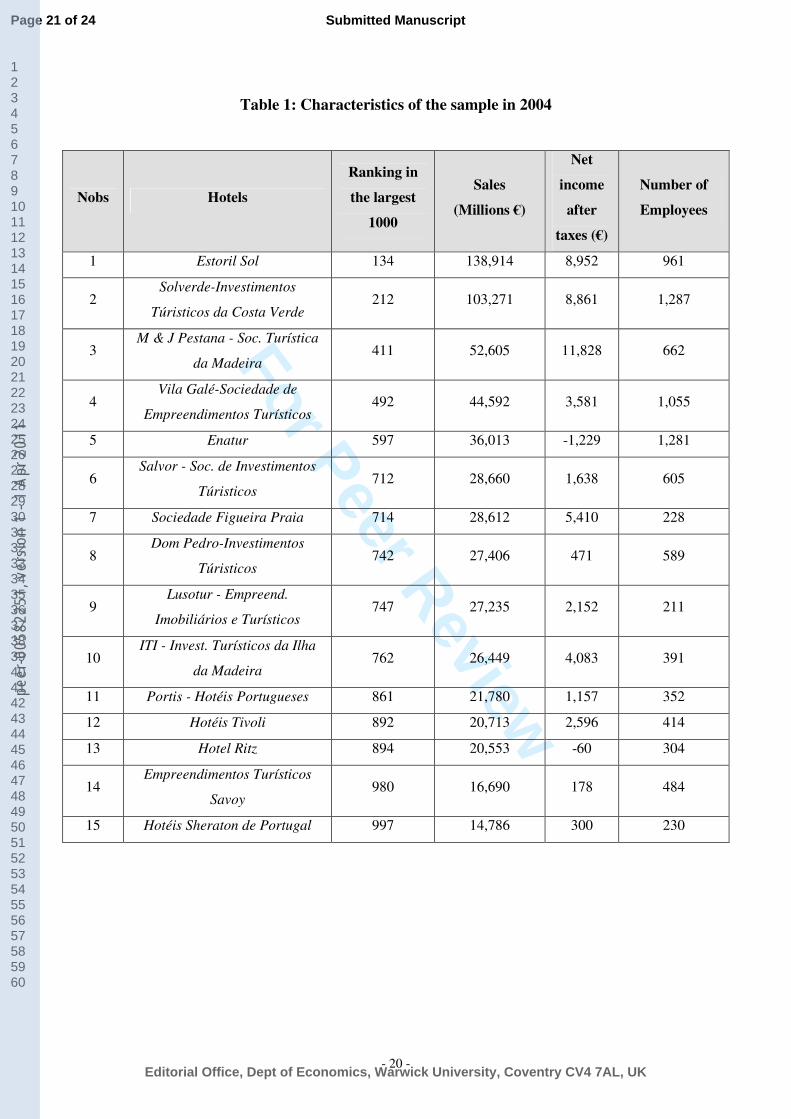
In Table 1 below, we present several characteristics of the hotels analysed. These
hotels outline a representative sample of the most important hotel groups in Portugal.
Data, which spans the period from 1998 to 2005, were obtained from the list of the
1000 largest (in terms of sales) enterprises in Portugal which is published annually by
a major Portuguese daily newspaper, Diário de Notícias. This publication was
supplemented by additional informations obtained from the Portuguese Hotels
Association and in the Commercial Company Registry.
We can see that in comparison with other economic entities, the 15 hotels in the
sample are small units in economic terms. In the ranking of the largest 1000
Portuguese enterprises, only 5 hotels are present in the top 500. However, Diário de
Notícias publishes also the ranking of the largest 1500 enterprises in Portugal and
therefore, while some small hotels are not ranked in the 1000 ranking, informations
about them can be obtained from the list of the largest 1500. These informations are
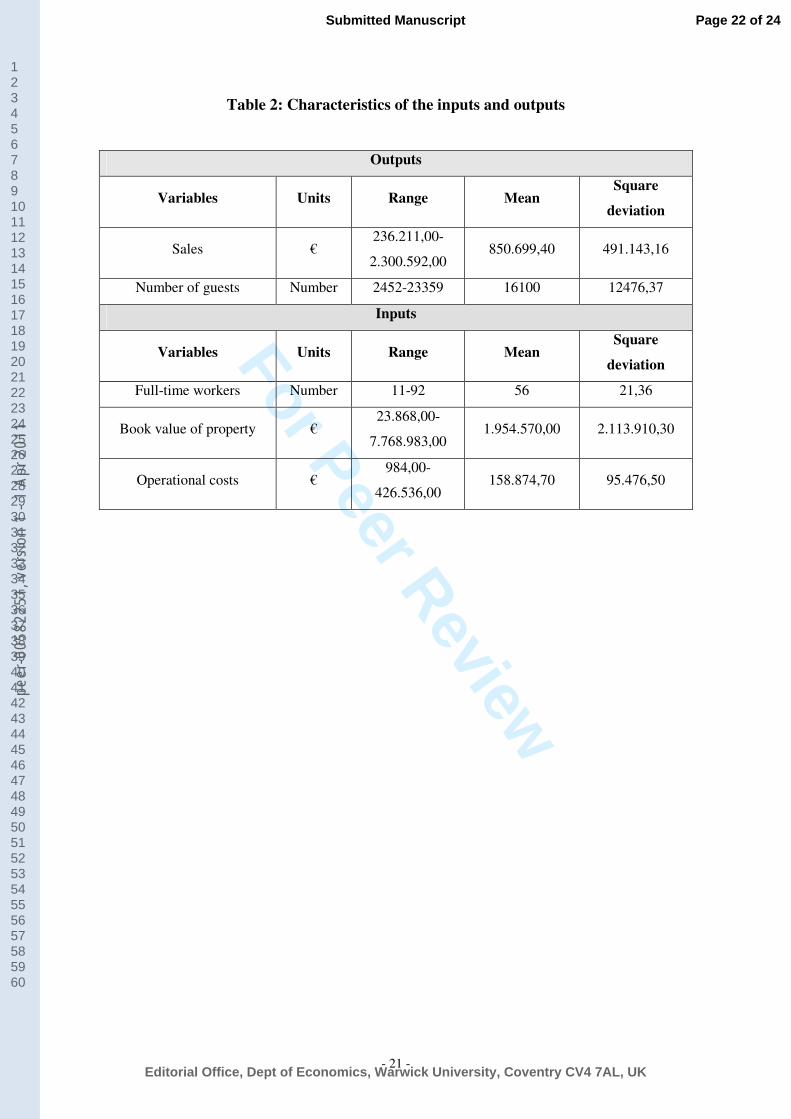
resumed in the table 2 which presents the institutional settings. Five variables are
shown: sales, number of guests, full-time workers, book value of property and
operational cost. These variables will serve as outputs and inputs in our study.
- Insert table 1 here -
- Insert table 2 here -
3. Literature Review
In this section, we show that this paper makes a fresh contribution to the literature on
tourism industry and more precisely to the literature on the hotel sector which is an
important and extremely competitive sector in most tourism countries.
First, regarding our subject i.e. hotels performance, previous analysis are restricted to
a small number of studies. Among the earliest studies, we cite Brotherton and
Mooney (1992), Wejeysinghe (1993), Baker and Riley (1994) and Donaghy (1995)
who suggest different methodology but no frontier models to examine the
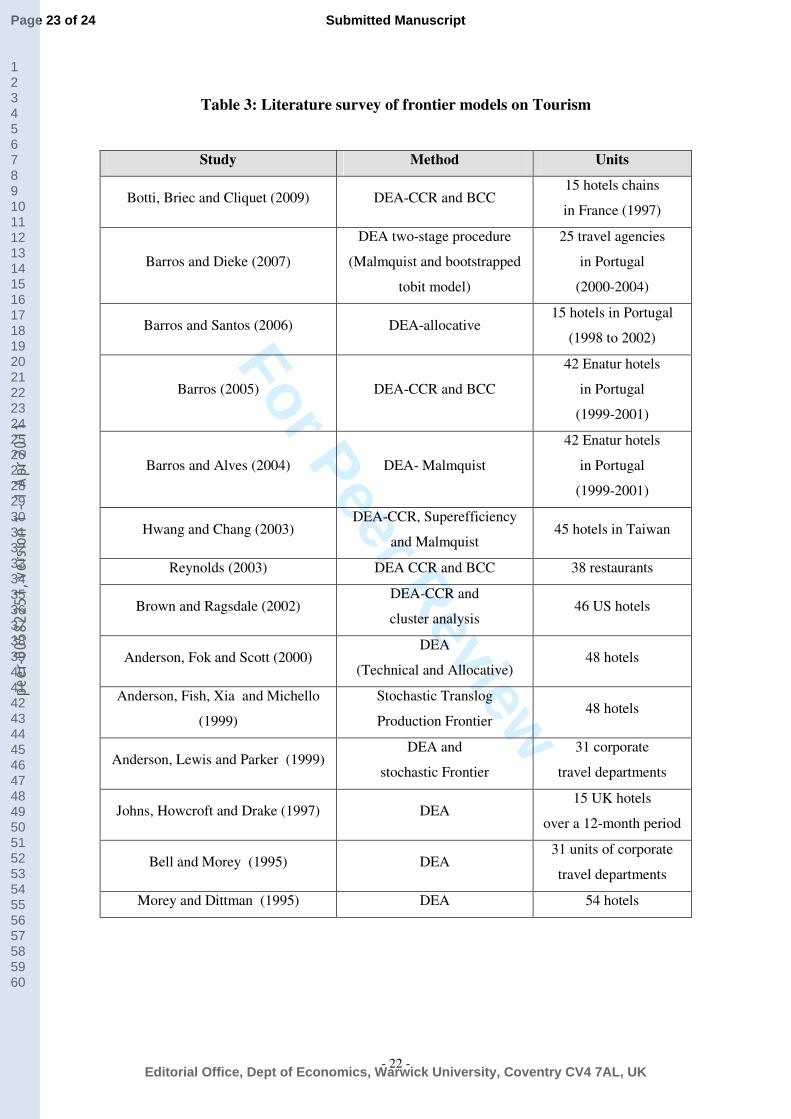
performance of hotels. In Table 3, the latest studies using frontier models to scan the
efficiency of tourism organisations are presented.
- Insert table 3 here -
Page 6 of 24
Editorial Office, Dept of Economics, Warwick University, Coventry CV4 7AL, UK
Submitted Manuscript
123456789101112131415161718192021222324252627282930313233343536373839404142434445464748495051525354555657585960
peer
-005
8225
1, v
ersi
on 1
- 1
Apr 2
011
For Peer Review
- 6 -
From a policy perspective, these papers generally propose guidelines to overcome the
identified inefficiency. Sometimes, papers discuss hypothesis which say that there is a
relation between an organizational or managerial aspect of the enterprise and its
efficiency (for example Botti et al., 2009).
When compared with other research fields, this bibliography is, as far as we are
concerned, clearly brief for such an important aspect of the tourism industry. Indeed,
tourism is vital for many countries such as Thailand, Morocco or Fiji (Narayan,
2005). This is due to the large intake of money for domestic businesses and to the
opportunity for employment in the service industries associated with tourism, i.e.
transportation services such as taxis, accommodation such as hotels, and other
hospitality industry services such as resorts. With the present paper, we seek to call
the attention of management researchers to this neglected aspect of one of the fastest
growing industries in the world (Bhattacharya and Narayan, 2005).
Moreover, we can see that there is only one study that use a two stage procedure; and
that the paper of Barros and Dieke (2007) use the Malmquist nonparametric
technique, which is calculated from DEA linear programming approach and which
enables separation of the catching-up effect, i.e. changes over time in technical
efficiency, from technological change, i.e. the shift, due to technological progress, of
the best practice frontier over time. Then our paper is innovative from this
methodological perspective as it employs the DEA Simar and Wilson (2007)
technique to estimate and explain technical efficiency of hotels.
4. Theoretical Framework
Our framework is based on two literature streams: models of industry efficiency and
data envelopment analysis.
4.1 Models of Industry Efficiency
Most studies on tourism efficiency are empirically driven, with no clear theoretical
framework. On the contrary, in this paper, two economic efficiency models are
adopted as theoretical reference. Firstly, the strategic-group theory (Caves and Porter,
1977) which justifies differences in efficiency scores as being due to differences in
the structural characteristics of units within an industry, which in turn lead to
differences in performance. Units with similar asset configurations pursue similar
strategies with similar results in terms of performance (Porter, 1979). While there are
Page 7 of 24
Editorial Office, Dept of Economics, Warwick University, Coventry CV4 7AL, UK
Submitted Manuscript
123456789101112131415161718192021222324252627282930313233343536373839404142434445464748495051525354555657585960
peer
-005
8225
1, v
ersi
on 1
- 1
Apr 2
011
For Peer Review
- 7 -
different strategic options to be found in an industry, due to mobility impediments,
not all options are available to each organization in the industry, causing a spread in
their efficiency score. Secondly, the resource-based theory (Barney, 1986, 1991;
Rumelt, 1991; Wernerfelt, 1984) that justifies different efficiency scores by the fact
that organizations base their strategy on resources and competences that don’t have
the same quality and that are not perfectly mobile across the industry.
Purchasable assets cannot be considered to represent sources of sustainable profits.
Indeed, critical resources are not available in the market. Rather, they are built up and
accumulated by the organisation, their non-imitability and non-substitutability being
dependent on the specific traits of their accumulation process. Differences in
resources thus result in barriers to imitation (Rumelt, 1991) and in managers’ ability
to preserve accumulated critical resources over time. In this context, assets exhibit
inherently differentiated levels of efficiency and sustainable profits are ultimately a
return on the unique assets controlled by the organisation (Teece et al., 1997).
4.2. Methodology
Following Farrell (1957), Charnes et al. (1978) first introduced the term, data
envelopment analysis to describe a mathematical programming approach to the
construction of production frontiers and the measurement of efficiency in relation to
the constructed frontiers. At this time, a large number of articles on theoretical
extensions and empirical applications of DEA have been published. Surveys of these
papers can be found in Lovell and Schmidt (1988), Lovell (1993) and Tavares (2002).
Estimation of Efficiency Scores
To estimate efficiency scores for each observation, we use a DEA estimator. The
DEA approach usually (but not always) assumes that all firms, or more broadly,
decision-making units (DMUs) within a sample have access to the same technology
for transforming a vector of N inputs, denoted with x, into a vector of M outputs,
denoted with y. We assume that technology can be characterised by the technology
set, T, defined as†:
}:),{( MNMN yproducecanxyxT ++++ ℜ∈ℜ∈ℜ×ℜ∈= . (1)
† We assume that standard regularity conditions of the neo-classical production theory hold (for details,
see Färe and Primont (1995)).
Page 8 of 24
Editorial Office, Dept of Economics, Warwick University, Coventry CV4 7AL, UK
Submitted Manuscript
123456789101112131415161718192021222324252627282930313233343536373839404142434445464748495051525354555657585960
peer
-005
8225
1, v
ersi
on 1
- 1
Apr 2
011
For Peer Review
- 8 -
Having access to the same technology, any of the DMUs may or may not be on the
frontier of this technology; the distance of a particular DMU from the frontier may
depend on various factors which may be endogenous to the DMU, such as the
organisational form and/or exogenous, such as the competitive rivalry or government
policies. The distance from the actual allocation of each DMU in technology set T to
the frontier of T is believed to represent the inefficiency of each DMU and is caused
by the DMU’s specific endogenous or exogenous factors and some unexplained
statistical noise. Our goal is to measure such inefficiency and investigate its
dependency on drivers of efficiency.
Our analysis will follow a two-stage approach and in this sub-section, we focus on the
first stage, where we estimate efficiency scores for each DMU j (j=1,…, n), using the
Farrell/Debreu-type output-oriented technical efficiency measure:
}),(:{max),( TyxyxTE jjjj ∈= θθθ
. (2)
In practice, T is unobserved and so we replace it with its DEA-estimate, T̂ :
:),{(ˆ MNyxT ++ ℜ×ℜ∈= m
n
k
k
mk yyz ≥∑=1
, m = 1, ..., M, i
n
k
k
ik xxz ≤∑=1
,
i = 1, ..., N, 0≥kz , k = 1, ... , n }. (3)
where 0≥kz (k = 1, ... , n ) are the intensity variables over which optimisation (2) is
made. Geometrically, T̂ is the smallest convex free disposal cone (in ),( yx -space)
that contains (or ‘envelopes’) the input-output data‡. It is a consistent estimator of the
unobserved true technology set T, under the assumption of constant returns to scale
(CRS)§,**
.
‡ For more details on DEA, see Fare, Grosskopf and Lovel (1994), Charnes et al. (1995), Briec (1997),
Coelli, Prasada and Battese (1998), Copper et al. (2000) and Thanassoulis (2001).
§ Alternatively, the non-increasing returns to scale (NIRS) or variable returns to scale (VRS) would be
modelled if the constraint 11
≤∑ =
n
k kz or 11
=∑ =
n
k kz , respectively, is added to (3). In this paper
we assume CRS to gain more discriminatory power in comparison between DMUs and then analyse the
returns-to-scale component in the second stage.
** The proof of consistency also requires certain regularity conditions (see Kneip et al. (1998, 2003) for
these conditions, the resulting rates of convergence, the limiting distribution of DEA estimators, etc.)
Page 9 of 24
Editorial Office, Dept of Economics, Warwick University, Coventry CV4 7AL, UK
Submitted Manuscript
123456789101112131415161718192021222324252627282930313233343536373839404142434445464748495051525354555657585960
peer
-005
8225
1, v
ersi
on 1
- 1
Apr 2
011
For Peer Review
- 9 -
The estimates of the efficiency scores, jETˆ (j=1,…,n), obtained by replacing T with
T̂ in (2) are consistent estimates of the corresponding true efficiency scores,
jTE (j=1,…,n) given by (2). They are bounded between unity and infinity, with unity
representing an estimated perfect (technical or technological) efficiency score of
100%. On the other hand, )ˆ/1( jET would represent the estimated relative %-level of
the efficiency of the jth
DMU (j= 1,…, n), relative to the estimated best-practice
technology frontier, T̂ .
In our study, we measure outputs by
(i) sales,
(ii) number of guests,
and inputs by
(iii) full-time workers,
(iv) book value of property,
(v) operational costs.
Regression Analysis of Determinants of Efficiency
Next, we briefly outline an application of regression analysis for studying dependency
between the efficiency scores and hypothesised explanatory variables, following the
approach of Simar and Wilson (2007). Here, we assume and test the following
specification:
jjj ZaTE εδ ++= , j = 1, …, n (4)
which can be understood as the first-order approximation of the unknown true
relationship. In equation (4), a is the constant term, jε is statistical noise, and Zj is a
(row) vector of observation-specific variables for DMU j that we expect is related to
the DMU’s efficiency score, jTE , through the vector of parameters δ (common for
all j) that we need to estimate. **
These properties include various forms of continuity, (weak) monotonicity, commensurability,
homogeneity and (weak) indication for all technologies satisfying certain regularity conditions (see
Russell (1990, 1997) for details).
Page 10 of 24
Editorial Office, Dept of Economics, Warwick University, Coventry CV4 7AL, UK
Submitted Manuscript
123456789101112131415161718192021222324252627282930313233343536373839404142434445464748495051525354555657585960
peer
-005
8225
1, v
ersi
on 1
- 1
Apr 2
011
For Peer Review
- 10 -
A common practice in the DEA literature for estimating model (4) had previously
been to employ the Tobit-estimator, until Simar and Wilson (2007) demonstrated that
such an approach is inappropriate. Instead, they justify an approach based on a
truncated-regression with a bootstrap, and illustrate (in Monte Carlo experiments) its
satisfactory performance. Here, we will employ their approach. Specifically, noting
that the distribution of jε is restricted by the condition 1j j
a Zε δ≥ − − (since both
sides of (4) are bounded by unity), we follow Simar and Wilson (2007) and assume
that this distribution is truncated normal with zero mean (before truncation), unknown
variance, and (left) truncation point determined by this very condition. Furthermore,
we replace the true but unobserved regressand in (4), jTE , by its DEA estimate ˆjTE .
Formally, our econometric model is given by:
ˆj j jTE a Z δ ε≈ + + , j = 1, …, n, (5)
where
),0(~ 2
εσε Nj , such that 1j ja Zε δ≥ − − , j = 1, …, n, (6)
which we estimate by maximising the corresponding likelihood function, with respect
to ),( 2
εσδ , given our data. Relying on asymptotic theory, normal tables can be used to
construct confidence intervals but more precision can be gained by using the
bootstrap, particularly because our regressand are not true variables, but their
estimates that are likely to be dependent (see Simar and Wilson (2007) for details). To
construct the bootstrap confidence intervals for the estimates of parameters ),( 2
εσδ ,
we use the parametric bootstrap for regression, which incorporates information on the
parametric structure and distributional assumption. For the sake of brevity, we refer
the reader to Simar and Wilson (2007) for the details of the estimation algorithm.
5. DEA Results
When one talks about the efficiency of a firm, one usually means its success in
producing as large as possible an output from a given set of inputs. Our paper adopts
this direction and will therefore estmates an output-oriented technically efficient (TE)
DEA index, assuming that hotels aim to maximize the profits resulting from their
activity.
As far as models are concerned, the CCR (or Charnes, Cooper and Rhodes) efficient
score model (1978) is probably the most widely used and best known DEA model. It
Page 11 of 24
Editorial Office, Dept of Economics, Warwick University, Coventry CV4 7AL, UK
Submitted Manuscript
123456789101112131415161718192021222324252627282930313233343536373839404142434445464748495051525354555657585960
peer
-005
8225
1, v
ersi
on 1
- 1
Apr 2
011

For Peer Review
- 11 -
is the DEA model that assumes constant returns to scale relationship between inputs
and outputs. CCR measures the overall efficiency for each unit, namely in aggregating
pure technical efficiency and scale efficiency into one value (Gollani and Roll, 1989).
The BCC (or Banker, Charnes and Cooper) efficient score model (1984) is a DEA
model that assumes variable returns to scale between inputs and outputs. It measures
pure technical efficiency alone (Gollani and Roll, 1989). The efficiency score
obtained with the BCC model gives a score which is at least equal to the score
obtained using the CCR. Scale efficiency score is obtained by dividing the aggregated
CCR score by the technical efficient BCC score (Färe et al, 1994). A unit is scale
efficient when its size of operation is optimal. If its size is either reduced or increased,
its efficiency will drop.
The choice of an assumption about returns-to-scale (constant versus variable) is not
neutral because it conditions the representation of the possibility set. The assumption
of constant returns to scale implies a long term vision where units’ size can be
modified. With the variable returns-to-scale assumption, the reasoning takes place in
the short run and units’ size is fixed. In our case, since hotel chains have different size
(according to their total number of hotels) and their scale size is controllable by their
central management, the variable return-to-scale hypothesis was chosen. Moreover,
the VRS score measures pure technical efficiency only; then, when assuming that
pure technical efficiency is attributed to managerial skills, the BCC scores are
interpreted as managerial skills.
However, for comparative purposes, we also present the constant returns-to-scale
index which is composed of a non-additive combination of pure technical and scale
efficiencies. A ratio of the overall efficiency score (the CRS score) to pure technical
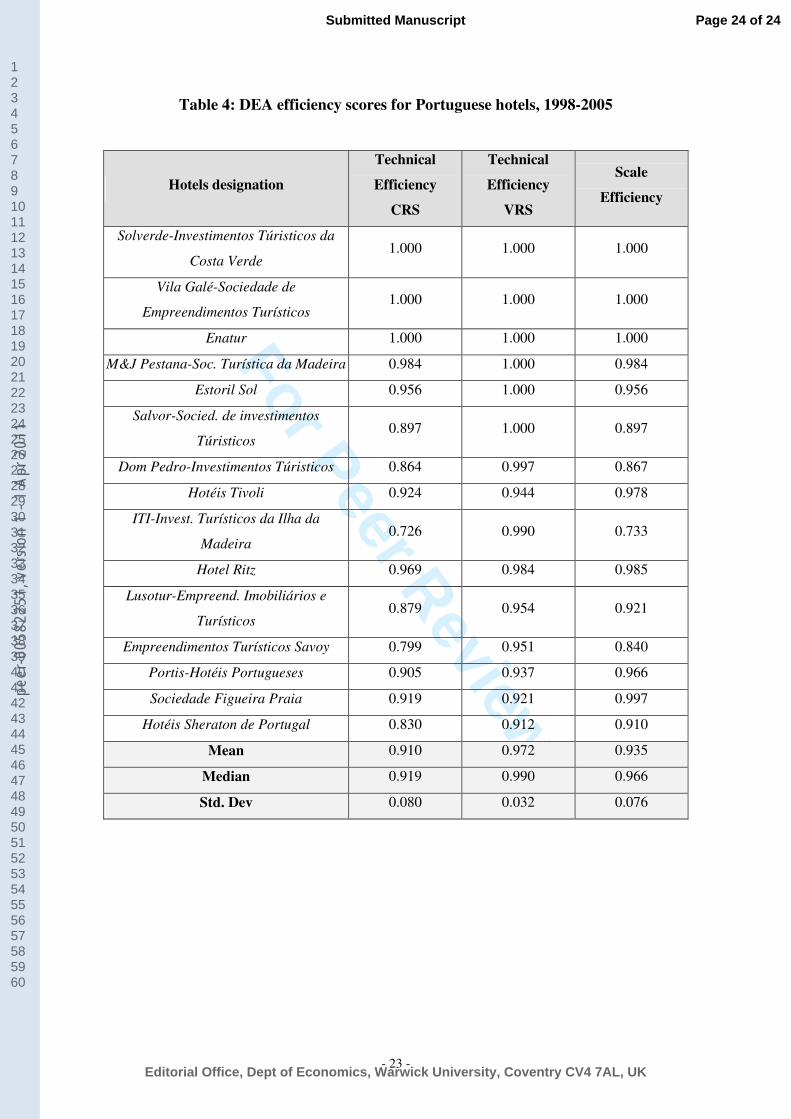
efficiency score (the VRS score) provides a scale efficiency measurement. The CRS,
VRS and scale efficiency scores of the analysed hotels are presented in Table 4. The
ranking in Table 4 is in hierarchical order of VRS technical efficiency scores, starting
from the most efficient to the least efficient.
- Insert table 4 here -
A number of points emerge from the present study. Firstly, similar to previous
research on hotels (Reynolds, 2003), significant differences in efficiency are prevalent
among Portuguese hotels. The DEA score is between zero (0%) and 1 (100%). Units
with DEA scores equal to 1 (100%) are efficient. A unit with a score of less than
100% is relatively inefficient, e.g. a unit with a score of 95% is only 95% as efficient
Page 12 of 24
Editorial Office, Dept of Economics, Warwick University, Coventry CV4 7AL, UK
Submitted Manuscript
123456789101112131415161718192021222324252627282930313233343536373839404142434445464748495051525354555657585960
peer
-005
8225
1, v
ersi
on 1
- 1
Apr 2
011
For Peer Review
- 12 -
as the best performing hotels. Secondly, best-practice calculations indicate that almost
all Portuguese hotels operate at a high level of technical efficiency during the period.
Thirdly, all technically efficient CRS hotels are also technically efficient in VRS,
signifying that the dominant source of efficiency is scale. Fourthly, the efficiency
scores presented in Table 4 are average values for the period, but when the hotels are
analyzed across all years, the result is the same: most Portuguese hotels display
technical efficiency, but some of them do not display scale efficiency. Therefore, the
overall conclusion is that Portuguese hotels are well managed as far as technical
efficiency is concerned. However, dimension makes a difference and therefore, some
hotels have decreasing returns to scale (DRS), while others have increasing returns to
scale (IRS). Hotels with DRS are too large in dimension and should be decreased.
Hotels with IRS are too small in dimension and should be increased.
6. Determinants of Efficiency
In order to examine the hypothesis that the efficiency of the Portuguese hotel
companies is determined by different contextual variables, we followed the two-step
approach, as suggested by Coelli et al. (1998), estimating the regression shown below.
It is recognised in the DEA literature that the efficiency scores obtained in the first
stage are correlated with the explanatory variables used in the second term, and that
the second stage estimates will then be inconsistent and biased (Simar and Wilson,
2000). A bootstrap procedure is needed to overcome this problem (Efron, 1979; Efron
and Tibshirani, 1993). To this end, as explained earlier, we adopt the approach of
Simar and Wilson (2007).
The estimated specification is the following:
titinalInternatiotiGroup
tiAMtiQuotedtiTrendtiTrendti
,,6,5
,&4,.32,.2,.10,
εββ
βββββθ
++
+++++= (9)
where θ represents the CCR efficient score. Trend is a yearly trend. Square trend is
the square value of the trend. Quoted is a dummy variable which is one for quoted
hotel groups and zero otherwise. This aims to capture the efficiency related to the
scrutiny inherent in being quoted on the stock market. M&A is a dummy variable
which is one for companies involved in mergers and acquisitions and zero otherwise.
This aims to capture growth orientation strategies inherent in some hotel groups.
Group is a dummy variable which is one for hotels belonging to an economic group,
Page 13 of 24
Editorial Office, Dept of Economics, Warwick University, Coventry CV4 7AL, UK
Submitted Manuscript
123456789101112131415161718192021222324252627282930313233343536373839404142434445464748495051525354555657585960
peer
-005
8225
1, v
ersi
on 1
- 1
Apr 2
011
For Peer Review
- 13 -
and zero otherwise. It aims to capture economies of scope in the activity. Finally,
International is a dummy which is one for hotel groups with an international
expansion strategy. It aims to capture international growth orientation strategies.
For comparative purpose the traditional Tobit model has been estimated with
bootstrap and results revealed that while the signs of the parameters are maintained,
their values changed a lot, namely the value of the variance, meaning that the Simar
and Wilson (2007) procedure is more efficient.
- Insert table 5 here -
The truncated regression with a bootstrap model appears to fit the data well, with
positive t-statistics, which are statistically significant for all parameters, with the
exception of the international dummy variable.
It is observed that the efficiency increases over the observation period, according to
the trend, but at decreasing rates, according to the square term. A rationale for this is
based on the growth limits of internal markets. Quotation contributes to the
efficiency. This means that the discipline of the stock exchange and the public
scrutiny inherent to it contribute to the efficiency of the hotels. To be involved in
mergers and acquisitions contributes to efficiency. This is an expected result, since
companies involved in M&As are more aware of their market environment. They must
also be aware of their efficiency. To be a member of a hotel group also contributes
positively to the efficiency, since it induces internal benchmarking which contributes
to efficiency improvements. Finally, to be involved in an international expansion
strategy increases the efficiency. A rationale for this is based on the awareness that
must accompany such a strategy and which naturally translates into efficiency
increases.
7. Discussion, Limitations and Extensions
What is the explanation for such dispersion of the efficiency scores among Portuguese
hotels? The first reason is the economics of scope, related to activities such as casinos
in some hotels, as for example in the Estoril Sol and the Solverde. The second reason
is dimension due to scale economies, present in Vila Galé and M.&J. Pestana. The
third possible reason is bad management, since it is recognised that the Portuguese
management continues to suffer from various weaknesses. Evidence of managerial
inefficiency was identified in an exhaustive survey on Portuguese management jointly
conducted by AdCapita and Cranfield University (available in www.adcapita.com).
Page 14 of 24
Editorial Office, Dept of Economics, Warwick University, Coventry CV4 7AL, UK
Submitted Manuscript
123456789101112131415161718192021222324252627282930313233343536373839404142434445464748495051525354555657585960
peer
-005
8225
1, v
ersi
on 1
- 1
Apr 2
011
For Peer Review
- 14 -
The fourth reason is derived from the complacency of the Portuguese tourist
enterprises relative to foreign capital. This closeness is a distinctive characteristic of
the Portuguese tourism industry, when compared with its Spanish counterpart, and
was recently supported by European funding of Portuguese hotel constructions. The
closeness appears to induce indolence in the managerial behaviour. Fifth and finally,
these enterprises usually nurture close links with the government, which is beneficial
for gaining access to European subsidies and manifested in the fact that it is not
unusual to find former senior civil servants occupying directorial positions on the
boards of the hotel enterprises. Associated to other reasons, such cronyism results in
bad management. Reasons related to the economic environment, such as the VAT
rate, are not taken into account in this paper.
The findings of the empirical study show that there are several drivers of efficiency
in Portuguese hotels. These drivers comprise the facts of being quoted on the stock
market, adopting M&A strategies and being part of a group. It is important to take
these elements into consideration when crafting a new strategy in order to improve
corporate efficiency.
What is the innovation in the present research? First, the true efficiency score θ
estimated in first stage is not observed directly but is empirically estimated. Thus, the
usual estimation procedures that assumes independently distribute error terms are not
valid. Second, the empirical estimates of frontier efficiency are calculated based on
the sample of hotels used, which excludes some efficiency production possibilities
that are feasible but not observed in the sample. This implies that the empirical
estimates of efficiency are upwardly biased (Simar and Wilson, 2007). Thirdly, the
two stage procedure also depends upon other explanatory variables, which are not
taken into account in the first stage efficiency estimation. This implies that the error
term must be correlated with the second stage explanatory variables. Fourthly, the
domain of the efficient score θ is restricted to the interval zero and one, which should
be taken into account in the second-stage estimation (Simar and Wilson, 2007).
Overall, Simar and Wilson (2007) propose a procedure to deal with these challenges,
based on a double bootstrap that enables consistent inference within models
explaining efficiency scores while simultaneously producing standard errors and
confident intervals for these efficiency scores. For example, an alternative bootstrap
procedure adopted by Xue and Harker (1999) has been shown to be inconsistent by
Page 15 of 24
Editorial Office, Dept of Economics, Warwick University, Coventry CV4 7AL, UK
Submitted Manuscript
123456789101112131415161718192021222324252627282930313233343536373839404142434445464748495051525354555657585960
peer
-005
8225
1, v
ersi
on 1
- 1
Apr 2
011
For Peer Review
- 15 -
Simar and Wilson (1999). Related to the functional specification, it is recognized that
the Tobit does not describe adequately the efficient scores. The truncated
bootstrapped second-stage regression proposed by Simar and Wilson (2007) better
describes the efficient scores.
Thus, the contribution of this paper to the literature with respect to technique is
threefold:
(i) it improves the existing methods using DEA, by comparing and
contrasting relative approaches and variations;
(ii) it combines DEA technique with a recently developed method; in using
this method to bootstrap the DEA scores with a truncated regression, it
better (from an econometric viewpoint) explains DEA efficiency levels;
(iii) it presents the broader relevance of this new procedure which offers some
improvements in both estimation quality and inference in the second stage.
Indeed, by adopting the functional form (or truncated functional form) in
the second stage, it has enabled consistent inference to explain efficiency
scores while simultaneously producing standard errors and confidence
intervals for these efficiency scores.
Furthermore, the paper has also provided benchmarks for improving operations of
hotels that perform poorly, arguing that quoted and M&A parameters increase
efficiency. However, more research is needed to confirm these results. Indeed, the
principal limitation of the paper is related to the data used. The homogeneity of the
sample is questionable, since we compare companies with different dimensions and
production characteristics. They may face different restrictions and therefore, might
not be considered to be directly comparable. However, we can always claim that the
units are not comparable and then a ratio analysis could not equally be carried out.
Moreover, the data set is short, thus the conclusions are limited. In order to generalise
them, we would need to have a larger data set. Indeed, reducing the number of
observations in a DEA procedure increases the likelihood that a given observation is
judged relatively efficient (Banker, 1993).
Several research tracks can be proposed. First, in this analysis, the DEA model
allowed for complete weight flexibility. In situations in which some of the measures
are likely to be more important than others, DEA allows for restricting factor weights
through linear constraints. These linear constraints represent ranges for relative
preferences among factors based on managerial input. Such analysis enables effective
Page 16 of 24
Editorial Office, Dept of Economics, Warwick University, Coventry CV4 7AL, UK
Submitted Manuscript
123456789101112131415161718192021222324252627282930313233343536373839404142434445464748495051525354555657585960
peer
-005
8225
1, v
ersi
on 1
- 1
Apr 2
011
For Peer Review
- 16 -
incorporation of managerial input into the DEA evaluations. Second, the input and
output dimensions considered are context-specific. More comprehensive input and
output measurements, namely, allowing for non-discretionary factors, such as
environmental, socio-economic or quality inputs and outputs, need to be taken into
consideration. The influence of non-discretionary variables, excluded from our
analysis, amounts to an assumption that these factors are constant across the sample.
Third, non-parametric, or alternatively, parametric free-disposal hull analysis can be
used to assess the efficiency scores. However, previous research has shown that
although the DEA scores are inferior in value to econometric scores, the ranking is
preserved (Bauer et al., 1998).
8. Conclusion
This article proposed a simple framework for the evaluation of Portuguese hotels and
the rationalisation of their operational activities. The analysis was based on a DEA
model that allowed for the incorporation of multiple inputs and outputs in determining
the relative efficiencies. Benchmarks were provided in order to improve the
operations of the less performing companies. In the second stage, the determinants of
the economic efficiency were investigated. Several interesting and useful managerial
insights and implications from the study were discussed.
The general conclusion is that the hotel companies should adopt procedures that
induce greater efficiency, in following the example of efficient peers identified in the
benchmarking exercise. However, more investigations are needed to confirm these
first results and clarify unresolved questions.
Page 17 of 24
Editorial Office, Dept of Economics, Warwick University, Coventry CV4 7AL, UK
Submitted Manuscript
123456789101112131415161718192021222324252627282930313233343536373839404142434445464748495051525354555657585960
peer
-005
8225
1, v
ersi
on 1
- 1
Apr 2
011
For Peer Review
- 17 -
References
Anderson, R.I., Lewis, D. and Parker, M.E. (1999), Another Look at the Efficiency of
Corporate Travel Management Departments, Journal of Travel Research,
37(3): 267-272.
Anderson, R.I., Fish, M., Xia, Y. and Michello, F. (1999), Measuring Efficiency in
the Hotel Industry: A Stochastic Frontier Approach, International Journal
of Hospitality Management, 18(1): 45-57.
Anderson, R.I., Fok, R. and Scott, J. (2000), Hotel Industry Efficiency: An Advanced
Linear Programming Examination, American Business Review, 18(1): 40-
48.
Balcombre, K., Fraser, I., Latruffe, L., Rahman, M. and Smith, L. (2008), An
Application of the DEA Double Bootstrap to Examine Sources of
Efficiency in Bangladesh Rice Farming, Applied Economics, 40(15): 1919-
1925.
Banker, R.D. (1993), Maximum Likelihood, Consistency and Data Envelopment
Analysis, Management Science, 39(10): 1265-1273.
Baker, M. and Riley, M. (1994), New Perspectives on Productivity in Hotels: Some
Advances and New Directions, International Journal of Hospitality
Management, 13(4): 297-311.
Barney, J. (1986), Strategic Factor Markets: Expectations, Luck and Business
Strategy, Management Science, 32: 1231-1241.
Barney, J. (1991), Firm Resources and Sustained Competitive Advantage, Journal of
Management, 17: 99-120.
Barros, C.P. (2005), Evaluating the Efficiency of a Small Hotel Chain with a
Malmquist Produtivity Index, International Journal of Tourism Research,
7: 173-184.
Barros, C.P., and Alves, P. (2004), Productivity in Tourism Industry, International
Advances in Economic Research, 10(3): 215- 225.
Barros, C.P. and Dieke, P.U.C. (2007), Analyzing the Total Productivity Change in
Travel Agencies, Tourism Analysis, 12(3/4).
Barros, C.P. and Santos, C. (2006), The Measurement of Efficiency in Portuguese
Hotels using Data Envelopment Analysis, Journal of Hospitality and
Tourism Research, 30(3): 378-400.
Bauer, P.W. Berger, A.N., Ferrier, G. and Humphrey, D.B. (1998), Consistency
Conditions for Regulatory Analysis of Financial Institutions: A
Comparison of Frontier Methods, Journal of Economics and Business, 50:
85-114.
Bell, R.A. and Morey, R.C. (1995), Increasing the Efficiency of Corporate Travel
Management through Macro-Benchmarking, Journal of Travel Research,
33(3): 11-20.
Bhattacharya, M. and Narayan, P.K. (2005), Testing for the random Walk Hypothesis
in the Case of Visitor Arrivals: Evidence from Indian Tourism, Applied
Economics, 37: 1485-1490.
Botti., L., Briec, W. and Cliquet, G. (2009), Plural Forms versus Franchise and
Company-Owned Systems: A DEA approach of Hotel Chain Perforamnce,
Omega, 37: 566-578.
Briec, W. (1997), A Graph-type Extension of Farrell Technical Efficiency Measure,
Journal of Productivity Analysis, 8(1):95-110.
Page 18 of 24
Editorial Office, Dept of Economics, Warwick University, Coventry CV4 7AL, UK
Submitted Manuscript
123456789101112131415161718192021222324252627282930313233343536373839404142434445464748495051525354555657585960
peer
-005
8225
1, v
ersi
on 1
- 1
Apr 2
011
For Peer Review
- 18 -
Brown, J.R. and Ragsdale, C.T. (2002), The Competitive Market Efficiency of Hotel
Brands: An application of Data Envelopment Analysis, Journal of
Hospitality & Tourism Research, 26(4): 332-260.
Brotherton, B. and Mooney, S. (1992), Yield Management Progress and Prospects,
International Journal of Hospitality Management, 11(1): 23-32.
Caves, R. and Porter, M.E. (1977), From Entry Barriers to Mobility Barriers:
Conjectural Decisions and Contrived Deterrence to New Competition,
Quarterly Journal of Economics, 91: 241-261.
Charnes, A., Cooper, W.W., Lewin, A.Y. and Seiford, L.M. (1995), Data
Envelopment Analysis: Theory, Methodology and Applications, Boston:
Kluwer.
Charnes, A., Cooper, W.W. and Rhodes, E. (1978), Measuring the Efficiency of
Decision Making Units, European Journal of Operations Research, 2(4):
429-444.
Coelli, T.J., Prasada, R. and Battese, G.E. (1998), An Introduction to Efficiency and
Productivity Analysis, Boston: Kluwer.
Cooper, W.W., Seiford, L.M. and Tone, K. (2000), Data Envelopment Analysis,
Boston: Kluwer.
Donaghy, K., McMahon, U. and McDowell, D. (1995), Yield Management: An
Overview, International Journal of Hospitality Management, 14(2): 1339-
1350.
Efron, B. (1979), Bootstrap Methods: Another Look at the Jackknife, Annals of
Statistics, 7, 1-26.
Efron, B., Tibshirani, R.J. (1993), An Introduction to the Bootstrap, Chapman & Hall
Ed.
Färe, R.S. and Primont, D. (1995), Multi-Output Production and Duality: Theory and
Applications, Boston, Kluwer Academic Publishers.
Färe, R.S., Grosskopf, S. and Lovell, C.A. (1994), Production Frontiers, Cambridge:
Cambridge University Press.
Farrell, M.J. (1957), The Measurement of Productive Efficiency, Journal of the Royal
Statistical Society, Series A, 120(3): 253-290.
Hwang, S.N. and Chang, T.Y. (2003), Using Data Envelopment Analysis to Measure
Hotel Managerial Efficiency Change in Taiwan, Tourism Management,
24(2): 4.
Johns, N., Howcroft, B. and Drake, L. (1997), The Use of Data Envelopment
Analysis to Monitor Hotel Productivity, Progress in Tourism and
Hospitality Research, 3: 119-127.
Kneip, A., Park, B. and Simar, L. (1998), A Note on the Convergence of
Nonparametric DEA Estimators for Production Efficiency Scores,
Economic Theory, 14, 783-793.
Kneip, A., Simar, L. and Wilson, P.W. (2003), Asympotics for DEA Estimation in
Non-Parametric Frontier Models, Discussion Paper, Institut de Statistique,
Université Catolique de Louvain, Belgium.
Lovell, C.A.K. and Schmidt., P. (1988), A Comparison of Alternative Approaches to
the Measurement of Productive Efficiency. In: Dogramaci, A., Färe, R.
editors. Applications of Modern Production Theory: Efficiency and
Productivity. Kluwer: 3-32.
Lovell, C.A.K. (1993), Production Frontiers and Productive Efficiency. In: Fried, H.,
Lovell, C.A.K. and Schmidt, S. editors. The Measurement of Productive
Efficiency: Techniques and Applications. Oxford University Press: 3-67.
Page 19 of 24
Editorial Office, Dept of Economics, Warwick University, Coventry CV4 7AL, UK
Submitted Manuscript
123456789101112131415161718192021222324252627282930313233343536373839404142434445464748495051525354555657585960
peer
-005
8225
1, v
ersi
on 1
- 1
Apr 2
011
For Peer Review
- 19 -
Morey, R.C. and Dittman, D.A. (1995), Evaluating a Hotel GM’s Performance: A
Case Study in Benchmarking, Cornell Hotel Restaurant & Administration
Quarterly, 36(5): 30-35.
Narayan, P.K. (2005), The Structure of Tourist Expenditure in Fiji: Evidence from
Unit Root Structural Break Tests, Applied Economics, 37: 1157-1161.
Porter, M.E. (1979), The Structure within Industries and Companies’ Performance,
The Review of Economics and Statistics, 61: 214-227.
Reynolds, D. (2003), Hospitality-Productivity Assessment using Data Envelopment
Analysis, Cornell Hotel and Restaurant Administration Quarterly, 44(2):
130-137.
Rumelt, R. (1991), How Much Does Industry Matter? Strategic Management Journal,
12(2): 167-185.
Russell, R.R. (1990), Continuity of Measures of Technical Efficiency, Journal of
Economic Theory, 51: 255-267.
Russell, R.R. (1997), Distance Functions in Consumer and Producer Theory. In: Index
Number Theory: Essays in Honor of Sten Malmquist, Kluwer Academic
Publishers: 7-90.
Santos, C. (2004), Framing Portugal: Representational Dynamics, Annals of Tourism
Research, 31(1): 122-138.
Seiford, L. and Thrall, R. (1990), Recent Developments in DEA: The Mathematical
Programming Approach to Frontier Analysis, Journal of Econometrics, 46:
7-38.
Simar, L. and Wilson, P.W. (2007), Estimation and Inference in Two-stage, Semi-
parametric Models of Production Processes, Journal of Econometrics, 136:
31-64.
Simar, L. and Wilson, P.W. (2000), Statistical Inference in Nonparametric Frontier
Models: The State of the Art, Journal of Productivity Analysis, 13: 49-78.
Tavares, G. (2002), A Bibliography of Data Envelopment Analysis (1978-2001),
RUTCOR Research Report, 1.
Teece, D., G. Pisano. and Shuen. A. (1997), Dynamic Capabilities and Strategic
Management, Strategic Management Journal, 18(7): 509-533.
Thanassoulis, E. (2001), Introduction to the Theory and Application of Data
Envelopment Analysis: A Foundation Text with Integrated Software,
Dordrecht: Kluwer.
Wernerfelt, B. (1984), A Resource-Based View of the Firm, Strategic Management
Journal, 5(2):171-180.
Wijeysinghe, B.S. (1993), Breakeven Occupancy for Hotel Operations, Management
Accounting, 71 (2): 23-33.
Page 20 of 24
Editorial Office, Dept of Economics, Warwick University, Coventry CV4 7AL, UK
Submitted Manuscript
123456789101112131415161718192021222324252627282930313233343536373839404142434445464748495051525354555657585960
peer
-005
8225
1, v
ersi
on 1
- 1
Apr 2
011
For Peer Review
- 20 -
Table 1: Characteristics of the sample in 2004
Nobs Hotels
Ranking in
the largest
1000
Sales
(Millions €)
Net
income
after
taxes (€)
Number of
Employees
1 Estoril Sol 134 138,914 8,952 961
2 Solverde-Investimentos
Túristicos da Costa Verde 212 103,271 8,861 1,287
3 M & J Pestana - Soc. Turística
da Madeira 411 52,605 11,828 662
4 Vila Galé-Sociedade de
Empreendimentos Turísticos 492 44,592 3,581 1,055
5 Enatur 597 36,013 -1,229 1,281
6 Salvor - Soc. de Investimentos
Túristicos 712 28,660 1,638 605
7 Sociedade Figueira Praia 714 28,612 5,410 228
8 Dom Pedro-Investimentos
Túristicos 742 27,406 471 589
9 Lusotur - Empreend.
Imobiliários e Turísticos 747 27,235 2,152 211
10 ITI - Invest. Turísticos da Ilha
da Madeira 762 26,449 4,083 391
11 Portis - Hotéis Portugueses 861 21,780 1,157 352
12 Hotéis Tivoli 892 20,713 2,596 414
13 Hotel Ritz 894 20,553 -60 304
14 Empreendimentos Turísticos
Savoy 980 16,690 178 484
15 Hotéis Sheraton de Portugal 997 14,786 300 230
Page 21 of 24
Editorial Office, Dept of Economics, Warwick University, Coventry CV4 7AL, UK
Submitted Manuscript
123456789101112131415161718192021222324252627282930313233343536373839404142434445464748495051525354555657585960
peer
-005
8225
1, v
ersi
on 1
- 1
Apr 2
011
For Peer Review
- 21 -
Table 2: Characteristics of the inputs and outputs
Outputs
Variables Units Range Mean Square
deviation
Sales € 236.211,00-
2.300.592,00 850.699,40 491.143,16
Number of guests Number 2452-23359 16100 12476,37
Inputs
Variables Units Range Mean Square
deviation
Full-time workers Number 11-92 56 21,36
Book value of property € 23.868,00-
7.768.983,00 1.954.570,00 2.113.910,30
Operational costs € 984,00-
426.536,00 158.874,70 95.476,50
Page 22 of 24
Editorial Office, Dept of Economics, Warwick University, Coventry CV4 7AL, UK
Submitted Manuscript
123456789101112131415161718192021222324252627282930313233343536373839404142434445464748495051525354555657585960
peer
-005
8225
1, v
ersi
on 1
- 1
Apr 2
011
For Peer Review
- 22 -
Table 3: Literature survey of frontier models on Tourism
Study Method Units
Botti, Briec and Cliquet (2009) DEA-CCR and BCC 15 hotels chains
in France (1997)
Barros and Dieke (2007)
DEA two-stage procedure
(Malmquist and bootstrapped
tobit model)
25 travel agencies
in Portugal
(2000-2004)
Barros and Santos (2006) DEA-allocative 15 hotels in Portugal
(1998 to 2002)
Barros (2005) DEA-CCR and BCC
42 Enatur hotels
in Portugal
(1999-2001)
Barros and Alves (2004) DEA- Malmquist
42 Enatur hotels
in Portugal
(1999-2001)
Hwang and Chang (2003) DEA-CCR, Superefficiency
and Malmquist 45 hotels in Taiwan
Reynolds (2003) DEA CCR and BCC 38 restaurants
Brown and Ragsdale (2002) DEA-CCR and
cluster analysis 46 US hotels
Anderson, Fok and Scott (2000) DEA
(Technical and Allocative) 48 hotels
Anderson, Fish, Xia and Michello
(1999)
Stochastic Translog
Production Frontier 48 hotels
Anderson, Lewis and Parker (1999) DEA and
stochastic Frontier
31 corporate
travel departments
Johns, Howcroft and Drake (1997) DEA 15 UK hotels
over a 12-month period
Bell and Morey (1995) DEA 31 units of corporate
travel departments
Morey and Dittman (1995) DEA 54 hotels
Page 23 of 24
Editorial Office, Dept of Economics, Warwick University, Coventry CV4 7AL, UK
Submitted Manuscript
123456789101112131415161718192021222324252627282930313233343536373839404142434445464748495051525354555657585960
peer
-005
8225
1, v
ersi
on 1
- 1
Apr 2
011
For Peer Review
- 23 -
Table 4: DEA efficiency scores for Portuguese hotels, 1998-2005
Hotels designation
Technical
Efficiency
CRS
Technical
Efficiency
VRS
Scale
Efficiency
Solverde-Investimentos Túristicos da
Costa Verde 1.000 1.000 1.000
Vila Galé-Sociedade de
Empreendimentos Turísticos 1.000 1.000 1.000
Enatur 1.000 1.000 1.000
M&J Pestana-Soc. Turística da Madeira 0.984 1.000 0.984
Estoril Sol 0.956 1.000 0.956
Salvor-Socied. de investimentos
Túristicos 0.897 1.000 0.897
Dom Pedro-Investimentos Túristicos 0.864 0.997 0.867
Hotéis Tivoli 0.924 0.944 0.978
ITI-Invest. Turísticos da Ilha da
Madeira 0.726 0.990 0.733
Hotel Ritz 0.969 0.984 0.985
Lusotur-Empreend. Imobiliários e
Turísticos 0.879 0.954 0.921
Empreendimentos Turísticos Savoy 0.799 0.951 0.840
Portis-Hotéis Portugueses 0.905 0.937 0.966
Sociedade Figueira Praia 0.919 0.921 0.997
Hotéis Sheraton de Portugal 0.830 0.912 0.910
Mean 0.910 0.972 0.935
Median 0.919 0.990 0.966
Std. Dev 0.080 0.032 0.076
Page 24 of 24
Editorial Office, Dept of Economics, Warwick University, Coventry CV4 7AL, UK
Submitted Manuscript
123456789101112131415161718192021222324252627282930313233343536373839404142434445464748495051525354555657585960
peer
-005
8225
1, v
ersi
on 1
- 1
Apr 2
011

For Peer Review
- 24 -
Table 5: Truncated bootstrapped second-stage regression
(dependent variable: CCR index)
Variable Model 1 Model 2 Model 3
Constant -1.16* -1.10* -1.16*
Trend 0.11* 0.09* 0.192*
Square trend -0.03* -0.07* -0.071
Quoted 0.03* 0.02 0.042*
M&A 0.03* 0.05* 0.025*
Group 0.16*** 0.13* 0.15*
International 0.01 - -
Variance 0.06*** 0.07* 0.06***
Total number of
observations 1000 1000 1000
Page 25 of 24
Editorial Office, Dept of Economics, Warwick University, Coventry CV4 7AL, UK
Submitted Manuscript
123456789101112131415161718192021222324252627282930313233343536373839404142434445464748495051525354555657585960
peer
-005
8225
1, v
ersi
on 1
- 1
Apr 2
011