Comparative analysis of the efficiency indicators in sugar industry ...
25
Comparative analysis of the efficiency indicators in sugar industry: evidence from Serbia Radošević, M.; Carić, M.; Bejatović, M.; Marković, M. Matijašević, J.; Jovanović, V. Custos e @gronegócio on line - v. 9, n. 4 – Oct/Dec. - 2013. ISSN 1808-2882 www.custoseagronegocioonline.com.br 104 Comparative analysis of the efficiency indicators in sugar industry: evidence from Serbia Reception of originals: 09/04/2013 Release for publication: 11/25/2013 Milan Radošević PhD in Industrial Engineering and Management Instituição: University Business Academy in Novi Sad. Endereço: Novi Sad, Republic of Serbia E-mail: [email protected] Marko Carić PhD in Engineering Management Instituição: University Business Academy in Novi Sad. Endereço: Novi Sad, Republic of Serbia E-mail: [email protected] Milorad Bejatović PhD in Laws Instituição: University Business Academy in Novi Sad. Endereço: Novi Sad, Republic of Serbia E-mail: [email protected] Miloš Marković PhD in Laws Instituição: University Business Academy in Novi Sad. Endereço: Novi Sad, Republic of Serbia E-mail: [email protected] Jelena Matijašević Master in Laws Instituição: University Business Academy in Novi Sad. Endereço: Novi Sad, Republic of Serbia E-mail: [email protected] Vladimir Jovanović PhD in Law Instituição: University Business Academy in Novi Sad. Faculty of Law for Business and Justice. Endereço: Novi Sad, Republic of Serbia E-mail: [email protected] Abstract Rapid changes on the market accompanied with the rising of the prices of energy and raw materials, the emergence of new competitors, the impossibility of the collection of receivables, the impossibility of settling the obligations to suppliers and business partners are significant difficulties that companies must solve in order of further survival, growth and
-
Upload
khangminh22 -
Category
Documents
-
view
0 -
download
0
Transcript of Comparative analysis of the efficiency indicators in sugar industry ...
Comparative analysis of the efficiency indicators in sugar industry: evidence from Serbia Radošević, M.; Carić, M.; Bejatović, M.; Marković, M. Matijašević, J.; Jovanović, V.
Custos e @gronegócio on line - v. 9, n. 4 – Oct/Dec. - 2013. ISSN 1808-2882 www.custoseagronegocioonline.com.br
104
Comparative analysis of the efficiency indicators in sugar industry:
evidence from Serbia
Reception of originals: 09/04/2013 Release for publication: 11/25/2013
Milan Radošević PhD in Industrial Engineering and Management
Instituição: University Business Academy in Novi Sad. Endereço: Novi Sad, Republic of Serbia
E-mail: [email protected]
Marko Carić PhD in Engineering Management
Instituição: University Business Academy in Novi Sad. Endereço: Novi Sad, Republic of Serbia
E-mail: [email protected]
Milorad Bejatović PhD in Laws
Instituição: University Business Academy in Novi Sad. Endereço: Novi Sad, Republic of Serbia E-mail: [email protected]
Miloš Marković
PhD in Laws Instituição: University Business Academy in Novi Sad.
Endereço: Novi Sad, Republic of Serbia E-mail: [email protected]
Jelena Matijašević
Master in Laws Instituição: University Business Academy in Novi Sad.
Endereço: Novi Sad, Republic of Serbia E-mail: [email protected]
Vladimir Jovanović
PhD in Law Instituição: University Business Academy in Novi Sad.
Faculty of Law for Business and Justice. Endereço: Novi Sad, Republic of Serbia
E-mail: [email protected] Abstract Rapid changes on the market accompanied with the rising of the prices of energy and raw materials, the emergence of new competitors, the impossibility of the collection of receivables, the impossibility of settling the obligations to suppliers and business partners are significant difficulties that companies must solve in order of further survival, growth and
Comparative analysis of the efficiency indicators in sugar industry: evidence from Serbia Radošević, M.; Carić, M.; Bejatović, M.; Marković, M. Matijašević, J.; Jovanović, V.
Custos e @gronegócio on line - v. 9, n. 4 – Oct/Dec. - 2013. ISSN 1808-2882 www.custoseagronegocioonline.com.br
105
development. For production companies it is very important to analyze the changes that occur in the field of income and costs. Adequate analysis can determine the change of the position of economic success of the enterprise in observed period and show the elements on which management should focus its efforts. The aim of this paper was to present financial performances of 4 top companies in Serbian sugar industry, in terms of profitability measured by indicators such BEP, ROA, ROE, efficiency, productivity, solvency and liquidity, where costs are seen as one of the most influencing source. Methodology used in this paper included Du Pont method, financial analysis of the official financial documentation from the factories and correlation using SPSS program, version 21.0. Findings are that efficiency was dropped during economic crisis and that there is positive correlation between certain indicators in sugar production in Serbia. Keywords: Profitability. Efficiency indicators. Sugar production.
1. Introduction
The focus in achieving economic success in a market economy is on the rational use of
production factors, capital use and speed of the flow of capital in the reproduction. Tendency
is directed to accumulation for extended reproduction, constant investing and rational use of
invested capital. Control of economic success is complete only if it is subjected to all kinds
and forms of investment in reproduction (Jakovčević, 2007). Costs are one of the most
important and influential elements of investment in modern business. As a value expression of
spending of factors of production in the reproductive cycle, costs affect the most important
economic indicators in the enterprise.
The success of the company can be analyzed through business reports, internal and
external. External analysis of the report, particularly the balance sheet and income statement,
a very important indicators can be determined, such as indebtedness, liquidity, utilization of
the equipment, technical equipment, productivity, profitability, risk profile, etc. During
analysis of the internal documents researcher can determine more detailed information about
the company, such as capacity utilization, establishing the necessary structures of
employment, cost impact, selling price, the impact of income and expenses on the profit, etc.
Economic score of the company business is expressed through profit or loss. Profit or
loss, is determined as the difference between the income of the company and the costs that are
incurred in the process of reproduction. From the expression for the calculation of profit it is
obvious that the direct impact on business results have revenues and costs. Operating income,
as the difference in operating income and expenses, a gain that was realized on regulated
business funds used for activities. In this sense, the amount of the gain or loss is not as
Comparative analysis of the efficiency indicators in sugar industry: evidence from Serbia Radošević, M.; Carić, M.; Bejatović, M.; Marković, M. Matijašević, J.; Jovanović, V.
Custos e @gronegócio on line - v. 9, n. 4 – Oct/Dec. - 2013. ISSN 1808-2882 www.custoseagronegocioonline.com.br
106
significant for the analysis (used in horizontal analysis), while the far more important to put
those gains in relation to the funds that are involved in its creation. Indicators of relative
profitability are found trough relations between the two positions where the gain is in the
numerator and in the denominator of some form of company’s assets.
The aim of this paper was to present financial performances of 4 top companies in
Serbian sugar industry, in terms of profitability measured by indicators such BEP, profit,
ROA, ROE, efficiency, productivity, solvency and liquidity, where costs are seen as one of
the most influencing source. Methodology used in this paper included Du Pont method,
financial analysis of the official financial documentation from the factories and correlation
using SPSS program, version 21.0.
2. Theoretical Background
Sugar beet production in Serbia has a long tradition. In addition to a long tradition,
features of production of this crop had large variations in both, planted area and in yield. For
example, in the last two and half decades, areas with sugar beet ranged between 40,000 and
94,000 acres. Sugar yield per hectare is also has a significant variation. In recent years, the
yield is improved, reaching values of about 6 tons per hectare (Berber, 2011). Production of
sugar beet in Serbia takes place on family farms, as well as in companies and cooperatives.
Total area under sugar beet in Serbia, in the analyzed period, mostly increased to reach the
maximum of almost 80 000 ha in 2007. In the last year of analysis, the harvested areas under
this industrial culture were significantly reduced (to about 43 000 ha), due to deteriorated
economic position of the farmers. The largest part of the total area is concentrated in the AP
of Vojvodina, north part of the Republic of Serbia (reaching 96% in some years). Production
of sugar beet was more than tripled, from about 1 to about 3 million tons, which was
significantly contributed by the measures of agricultural policy – premiums for sugar beet
production, subsidizing inputs, incentives to purchasing of machinery, etc (Božic, Munćan,
Bogdanov, 2010, p. 446).
Although there are natural conditions for the production of this crop, the sugar
production has not reached its maximum efficiency. One of the important factors of the non-
competitiveness of sugar production in Serbia is a transport. Areas with the highest
production of sugar are often away from the seat sugar, so the sugar beet is transported across
88 kilometers (on average). This points to the need for better organization of transport
Comparative analysis of the efficiency indicators in sugar industry: evidence from Serbia Radošević, M.; Carić, M.; Bejatović, M.; Marković, M. Matijašević, J.; Jovanović, V.
Custos e @gronegócio on line - v. 9, n. 4 – Oct/Dec. - 2013. ISSN 1808-2882 www.custoseagronegocioonline.com.br
107
because the costs involved are often over 8% of total costs (cost price). Also, some sugar
factories in Vojvodina in the past (for example factory in city of Bač) stopped with the
processing of sugar beet because, as a second problem, occurs uncertainty of the placement of
this culture. Manufacturers imply an active role of the state policy in order to solve this
problem (Roljević, Hamović & Sarić, 2009). As a possible solution there are introduced the
quotas for export (preferential export) in the EU.
Also, it is important to emphasize that sugar refineries in Serbia are of medium size,
and their daily capacity is about 5,000 tons, but the daily sugar beet supplies are small. With
relatively short season/campaign of sugar beet processing (80-90 days), high costs of sugar
beet transport and insufficient amounts for daily processing the utilization level of sugar
refinery capacities is lower. Therefore, the fixed costs per unit of final product, or tons of
sugar, are relatively high significantly increasing the cost of sugar produced in Serbia, or
reducing its competitiveness in the international market. The sugar price level is additionally
influenced by quality of sugar beet supplied, primarily, the percentage of dirt and contents of
sucrose-digestion, the cost of transport of sugar beet to the processing capacity, other costs,
e.g. fuel, lime stone, work, etc (Božic, Munćan, Bogdanov, 2010, p. 449).
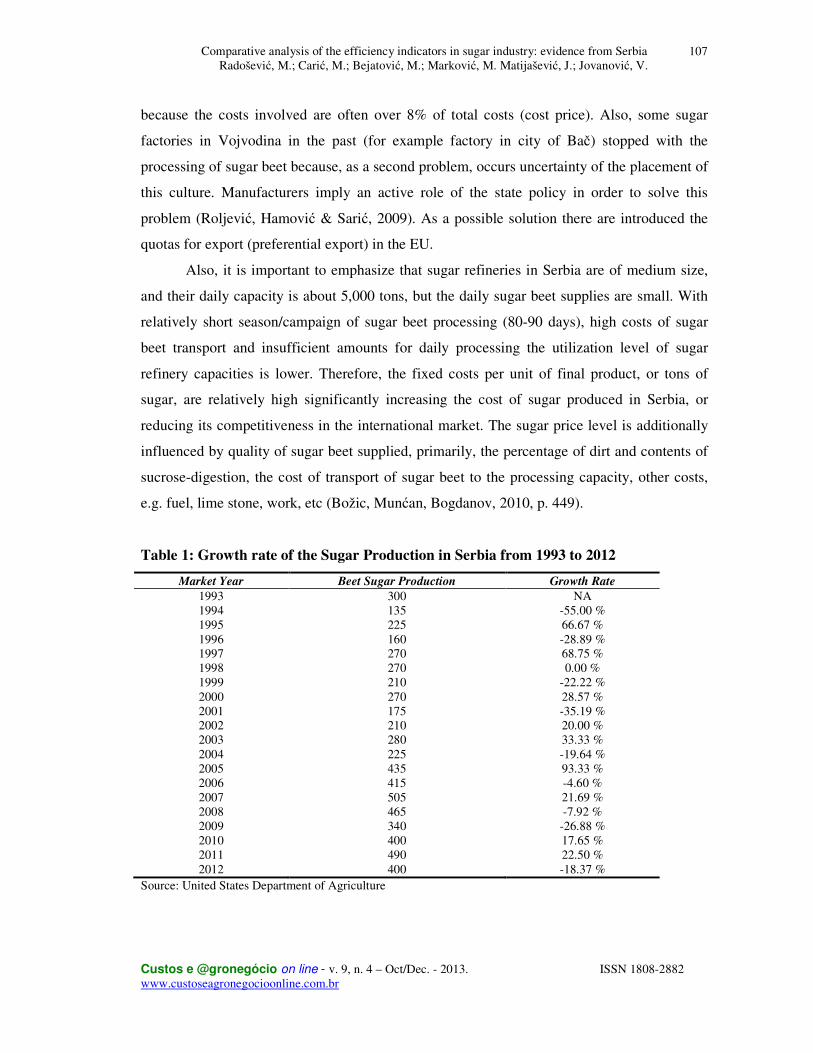
Table 1: Growth rate of the Sugar Production in Serbia from 1993 to 2012
Market Year Beet Sugar Production Growth Rate
1993 300 NA 1994 135 -55.00 % 1995 225 66.67 % 1996 160 -28.89 % 1997 270 68.75 % 1998 270 0.00 % 1999 210 -22.22 % 2000 270 28.57 % 2001 175 -35.19 % 2002 210 20.00 % 2003 280 33.33 % 2004 225 -19.64 % 2005 435 93.33 % 2006 415 -4.60 % 2007 505 21.69 % 2008 465 -7.92 % 2009 340 -26.88 % 2010 400 17.65 % 2011 490 22.50 % 2012 400 -18.37 %
Source: United States Department of Agriculture
Comparative analysis of the efficiency indicators in sugar industry: evidence from Serbia Radošević, M.; Carić, M.; Bejatović, M.; Marković, M. Matijašević, J.; Jovanović, V.
Custos e @gronegócio on line - v. 9, n. 4 – Oct/Dec. - 2013. ISSN 1808-2882 www.custoseagronegocioonline.com.br
108
There is not undoubtedly a leader in the market, nor a sugar that stands out for its
quality and profitability. Until now, all companies operating in Serbia primarily invested in
sugar, not only reap profits. It is necessary to continue with the process of investing. Sugar
industry of Serbia can produce almost 500,000 tons of sugar and most of it can be exported to
the EU.
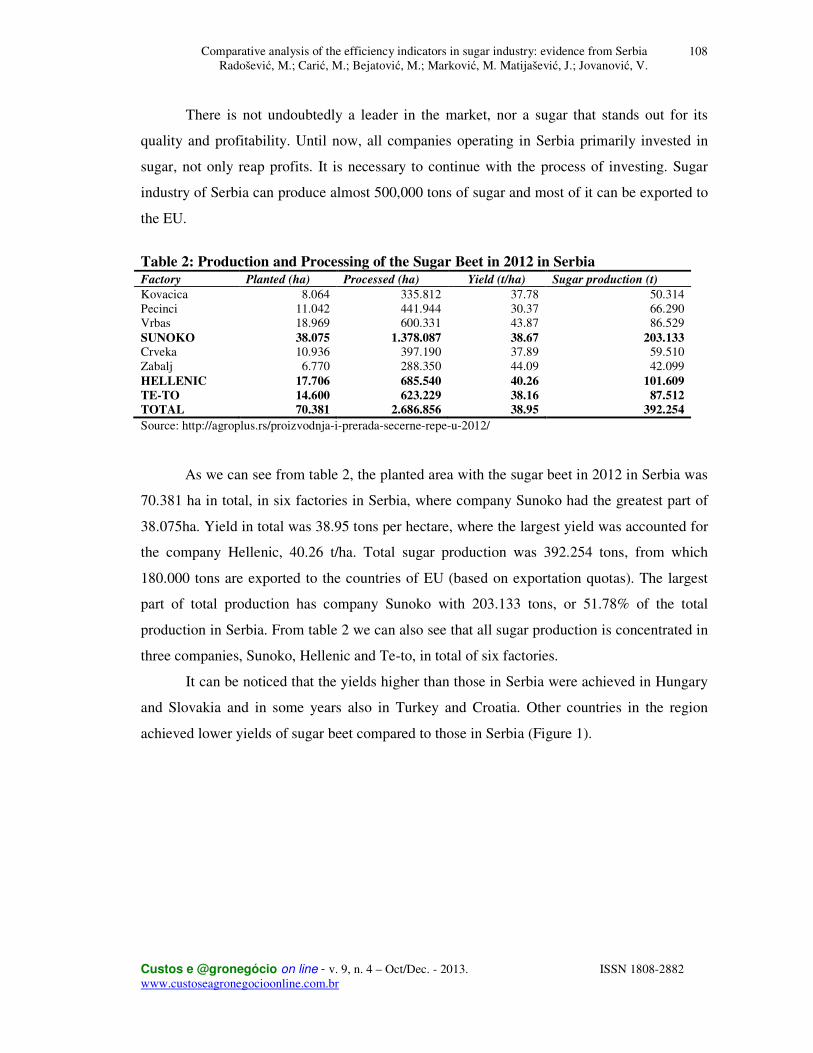
Table 2: Production and Processing of the Sugar Beet in 2012 in Serbia Factory Planted (ha) Processed (ha) Yield (t/ha) Sugar production (t)
Kovacica 8.064 335.812 37.78 50.314 Pecinci 11.042 441.944 30.37 66.290 Vrbas 18.969 600.331 43.87 86.529 SUNOKO 38.075 1.378.087 38.67 203.133 Crveka 10.936 397.190 37.89 59.510 Zabalj 6.770 288.350 44.09 42.099 HELLENIC 17.706 685.540 40.26 101.609
TE-TO 14.600 623.229 38.16 87.512
TOTAL 70.381 2.686.856 38.95 392.254
Source: http://agroplus.rs/proizvodnja-i-prerada-secerne-repe-u-2012/
As we can see from table 2, the planted area with the sugar beet in 2012 in Serbia was
70.381 ha in total, in six factories in Serbia, where company Sunoko had the greatest part of
38.075ha. Yield in total was 38.95 tons per hectare, where the largest yield was accounted for
the company Hellenic, 40.26 t/ha. Total sugar production was 392.254 tons, from which
180.000 tons are exported to the countries of EU (based on exportation quotas). The largest
part of total production has company Sunoko with 203.133 tons, or 51.78% of the total
production in Serbia. From table 2 we can also see that all sugar production is concentrated in
three companies, Sunoko, Hellenic and Te-to, in total of six factories.
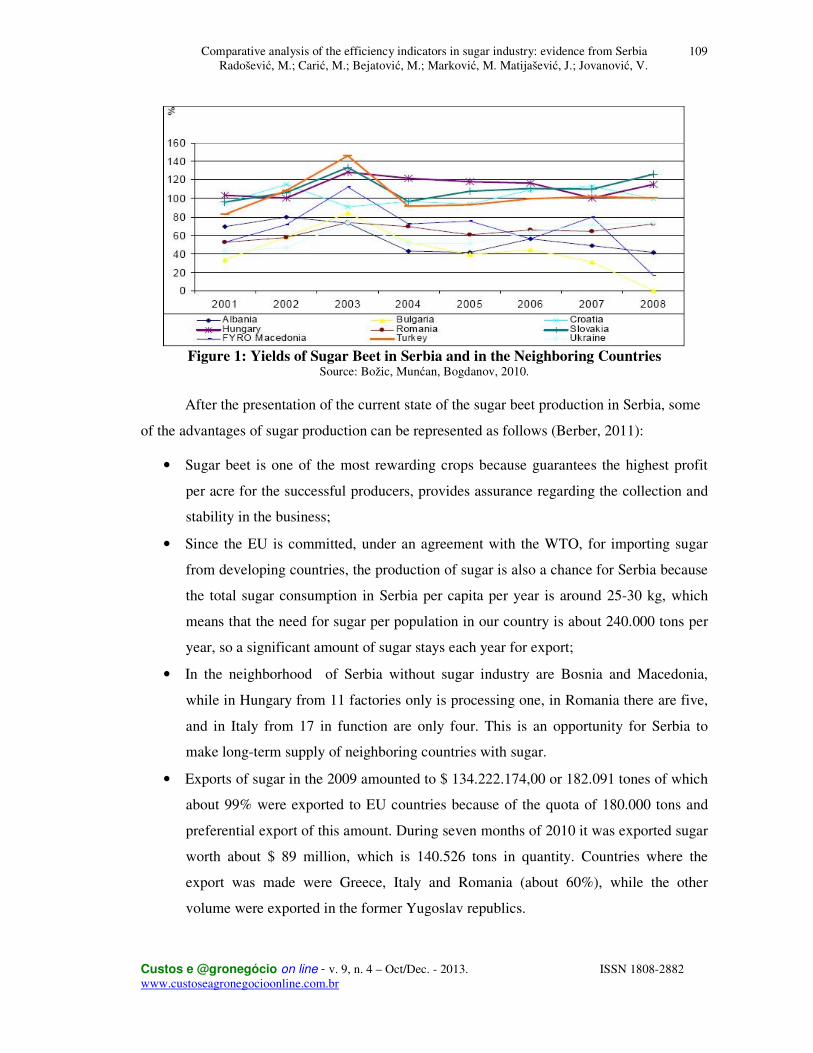
It can be noticed that the yields higher than those in Serbia were achieved in Hungary
and Slovakia and in some years also in Turkey and Croatia. Other countries in the region
achieved lower yields of sugar beet compared to those in Serbia (Figure 1).
Comparative analysis of the efficiency indicators in sugar industry: evidence from Serbia Radošević, M.; Carić, M.; Bejatović, M.; Marković, M. Matijašević, J.; Jovanović, V.
Custos e @gronegócio on line - v. 9, n. 4 – Oct/Dec. - 2013. ISSN 1808-2882 www.custoseagronegocioonline.com.br
109
Figure 1: Yields of Sugar Beet in Serbia and in the Neighboring Countries
Source: Božic, Munćan, Bogdanov, 2010. After the presentation of the current state of the sugar beet production in Serbia, some
of the advantages of sugar production can be represented as follows (Berber, 2011):
• Sugar beet is one of the most rewarding crops because guarantees the highest profit
per acre for the successful producers, provides assurance regarding the collection and
stability in the business;
• Since the EU is committed, under an agreement with the WTO, for importing sugar
from developing countries, the production of sugar is also a chance for Serbia because
the total sugar consumption in Serbia per capita per year is around 25-30 kg, which
means that the need for sugar per population in our country is about 240.000 tons per
year, so a significant amount of sugar stays each year for export;
• In the neighborhood of Serbia without sugar industry are Bosnia and Macedonia,
while in Hungary from 11 factories only is processing one, in Romania there are five,
and in Italy from 17 in function are only four. This is an opportunity for Serbia to
make long-term supply of neighboring countries with sugar.
• Exports of sugar in the 2009 amounted to $ 134.222.174,00 or 182.091 tones of which
about 99% were exported to EU countries because of the quota of 180.000 tons and
preferential export of this amount. During seven months of 2010 it was exported sugar
worth about $ 89 million, which is 140.526 tons in quantity. Countries where the
export was made were Greece, Italy and Romania (about 60%), while the other
volume were exported in the former Yugoslav republics.
Comparative analysis of the efficiency indicators in sugar industry: evidence from Serbia Radošević, M.; Carić, M.; Bejatović, M.; Marković, M. Matijašević, J.; Jovanović, V.
Custos e @gronegócio on line - v. 9, n. 4 – Oct/Dec. - 2013. ISSN 1808-2882 www.custoseagronegocioonline.com.br
110
Based on the advantages and opportunities in the production and export of sugar, it is
necessary to determine the quality indicators of the economy. These indicators are in function
of determining of those elements which have not been satisfactory and where it is needed to
make changes and adjustments to make production process more efficient.
3. Methodology
Basic accounting measures of profitability are ROE (return on equity) and ROA
(return on asset). Although at first appear to be very similar in terms of indicators, they do not
represent entirely the same thing. Therefore it is necessary to study together, because it is the
only way to obtain a complete picture of the profitability of the company (Bodie, Kane,
Marcus, 2009). One of the most important indicators of profitability of the company's ROE
(return on equity). It is a basic test of how effectively a company's management uses
investors’ money – ROE shows whether management is growing the company's value at an
acceptable rate (Herciu, Ogrean, Belascu, 2011). Also, it measures the rate of return that the
firm earns on stockholder’s equity. Because only the stockholder’s equity appears in the
denominator, the ratio is influenced directly by the amount of debt a firm is using to finance
assets reflecting the profitability of the firm by measuring the investors` return (Griffin,
Mahon, 1997). ROE is calculated by taking the profit after tax and preference dividends of a
given year and dividing it by the book value of equity (ordinary shares) at the beginning of the
year. Average equity can also be used. Equity would consist of issued ordinary share capital
plus the share premium and reserves (De Wet, Du Toit, 2007). Many professional investors
look for a ROE of at least 15% (Griffin, Mahon, 1997). ROE measures the overall
profitability of a firm, being a function of profit margin, asset turnover, and leverage. The first
two components of equation 1 equal the return on assets or ROA (i.e., net income divided by
total assets) (Zhao, Trejo-Pech, Weldon, 2012).
Another very important indicator of the profitability of company, which shows the
different type of effectiveness of managers, is called ROA (return on assets). It is quotient of
EBIT (earnings before interest and tax) to total assets of the company. Similarly to previous
indicator, it should be at the highest possible level, because each company tends to drop as
higher net profit from using its assets (Račić, Barjaktarović, Zeremski, 2011). ROA is
performed by focusing on the return on net operating assets - measured as net operating
income divided by net operating assets or total assets minus current liabilities (Zhao, Trejo-
Comparative analysis of the efficiency indicators in sugar industry: evidence from Serbia Radošević, M.; Carić, M.; Bejatović, M.; Marković, M. Matijašević, J.; Jovanović, V.
Custos e @gronegócio on line - v. 9, n. 4 – Oct/Dec. - 2013. ISSN 1808-2882 www.custoseagronegocioonline.com.br
111
Pech, Weldon, 2012). Only a few professional money managers will consider stocks with a
ROA of less than 5% (Herciu, Ogrean, Belascu, 2011).
ROE and ROA as indicators of profitability have been analyzed in several researches
during past period (Alarcón, Sánchez, 2013; Alavinasab, Davoudi, 2013; Heyder, Makus,
Theuvsen, 2011; Erasmus, 2010; Brown, Caylor, 2009) which is also one of the reasons to
perform this kind of analysis in our paper.
Next important indicator of the profitability is BEP or breakeven point, accounted
trough Cost volume profit analysis. Cost-volume-profit (CVP) analysis is a technique that
examines changes in profits in response to the changes in sales volumes, costs, and prices.
Accountants often perform CVP analysis to plan future levels of operating activity and
provide information about
• which products or services to emphasize;
• the volume of sales needed to achieve a targeted level of profit;
• the amount of revenue required to avoid losses;
• whether to increase fixed costs;
• how much to budget for discretionary expenditures; and
• whether fixed costs expose the organization to an unacceptable level of risk (Berber,
Golić, 2011).
Efficiency is a partial indicator of quality of an economy, and it is determined by a
relationship between produced and spent values. Quality of an economy increases when spent
values decrease per unit of produced value. Increase of spent values per unit of produced
value means decrease in quality of an economy. ‘With the help of efficiency, one of economic
goals of reproduction is quantified, which is demand for maximizing results with minimal
investments. Other form of application of basic economic principle of reproduction is in
achieving maximum profit rate (profit/engaged capital) (Jakovčević, 2006, p. 63). Based on
information on achieved efficiency in a succession of periods, economic success rate in
principle of efficiency can be followed. High level of achieved efficiency means high level of
investment success in production processes in a company, i.e. income that is a condition for
growth and development of a company. And vice versa, low level of efficiency causes low or
negative economic success that can be seen in production, income and profit decrease, which
later affects other elements of business, such is market position and the like. Economic sense
of efficiency principle is in the tendency to achieve certain value with minimal spending of all

Comparative analysis of the efficiency indicators in sugar industry: evidence from Serbia Radošević, M.; Carić, M.; Bejatović, M.; Marković, M. Matijašević, J.; Jovanović, V.
Custos e @gronegócio on line - v. 9, n. 4 – Oct/Dec. - 2013. ISSN 1808-2882 www.custoseagronegocioonline.com.br
112
factors in reproduction. Depending on the size of coefficients that are calculated, business can
be efficient, non-efficient or on the border of efficiency and that (Vujević, Balen, 2006):
• If income is greater than expenditure, then coefficient is bigger than 1 (E > 1 =
business efficient).
• If expenditure is greater than income, then coefficient is less than 1 (E < 1 = business
non-efficient).
• If income is equal to expenditure, then coefficient is (E = 1 = business efficient).
Table 3: Indicators of the Efficiency
INDICATORS FORMULA UNIT
BEP (Breakeven point)
RSD
ROE (Return on equity) NetIncome Sales TotalAssetsROE
Sales TotalAssets TotalEquity= × ×
TotalAssets
EquityMultiplierTotalEquity
=
(1 / )ROE ROA EquityMultiplier ROA debt equity= × = × −
%
ROA (Return on assets) NetIncome SalesROA
Sales TotalAssets= ×
%
L (Liquidity)
ratio
S (Solvency)
ratio
E (Efficiency)
ratio
P (Productivity)
RSD/worker
Source: Extension and adjustment of the methodology of Berber, Đuričić, Arsić, 2012 and Radošević, Pasula, Berber, Nešković, Nerandžić, 2013. TF – total fixed costs; TV – total variable costs; R – revenue; C – capital engaged; TC – total costs; %Mp – % of marginal profit;
Comparative analysis of the efficiency indicators in sugar industry: evidence from Serbia Radošević, M.; Carić, M.; Bejatović, M.; Marković, M. Matijašević, J.; Jovanović, V.
Custos e @gronegócio on line - v. 9, n. 4 – Oct/Dec. - 2013. ISSN 1808-2882 www.custoseagronegocioonline.com.br
113
Bp – business profit, without financial incomes and expenditures; L – liquidity; WA – working assets; STL – short term liabilities; S – solvency; BA – business assets; TD – total short term and long term debt; Lf – labor force
Productivity is defined as the ratio of the amount and effects of any element which is
involved in the production process. However, in practice it is usually only applied to the
measurement of the labor force. Labor productivity is an indicator of business performance,
which shows the effectiveness of the relationship between the amounts expressed in the
amount of effects of the amount of the used human activity for its achievement. Labor
productivity is actually measure of the efficient use of human labor (Vujević, Balen, 2006).
Corporate liquidity is a short-term characteristic that measures the ability of a firm to
pay its obligations on time. Corporate solvency is the ability to cover debt obligations in the
long run. Liquidity and solvency risks are closely related to cash flow uncertainty. Short-term
shocks to cash flows, together with the availability of cash reserves, affect corporate liquidity.
Uncertainty about average future profitability, together with financial leverage, generates
solvency concerns. These relations indicate that firms enter financial distress in two ways: a
firm can become illiquid after a negative short-term cash flow or it can become insolvent if
the expected rate of cash flows decreases sufficiently (Gryglewicz, 2011). Liquidity is
calculated as a relation between working assets and short time liabilities. On the other hand,
solvency is calculated as business assets from financial documentation and total short term
and long term debt. Those two indicators show the possibility of the firm to pay its debts in
short and long term.
At the end, authors in this paper decided to present total operational costs related to
the sugar production in mentioned factories. “Costs present a value expressed by expenditure
on working instruments and labor which are the constituents of the cost price of output, and it
is important to connect costs to calculations; i.e., the cost price of the output and the
expenditures which are not part of cost price should not be considered as costs” (Jakovčević,
1995). Total costs are consisted from cost of material and raw material, costs of labor-work
force, costs of depreciation of machines and equipment and costs of capital, which are
considered as very important in agribusiness (Rodrigues, 2012). Also, the production costs
management of any product should be designed to ensure that all items that comprise it are
Comparative analysis of the efficiency indicators in sugar industry: evidence from Serbia Radošević, M.; Carić, M.; Bejatović, M.; Marković, M. Matijašević, J.; Jovanović, V.
Custos e @gronegócio on line - v. 9, n. 4 – Oct/Dec. - 2013. ISSN 1808-2882 www.custoseagronegocioonline.com.br
114
contemplated. Sometimes it can be observed that over-order items can lead to financial
spreadsheet to produce biased budget results that create myopia in relation to the actual
product cost (De Oliveira, De Carvalho Almeida, De Souza, Da Silva Macedo, 2012).
To identify the relationship between efficiency indicators the correlation coefficient
has been calculated. As the value approaches 1 the connection is very strong; as the value
approaches 0 it is the weakest link. This kind of analysis has been made for 20 most profitable
companies in the world in 2010 (Herciu, Ogrean, Belascu, 2011).
(1)
Where:
n – number of the elements/index/variable
x, y – elements/indexes/variables to be considered (in our case indicators of efficiency)
Authors made analysis of efficiency indicators on the basis of financial statements of 4
biggest factories in sugar industry in Serbia for two years (from 2011 to 2012) using Excel
program and SPSS Version 21.0.
4. Results and Discussions
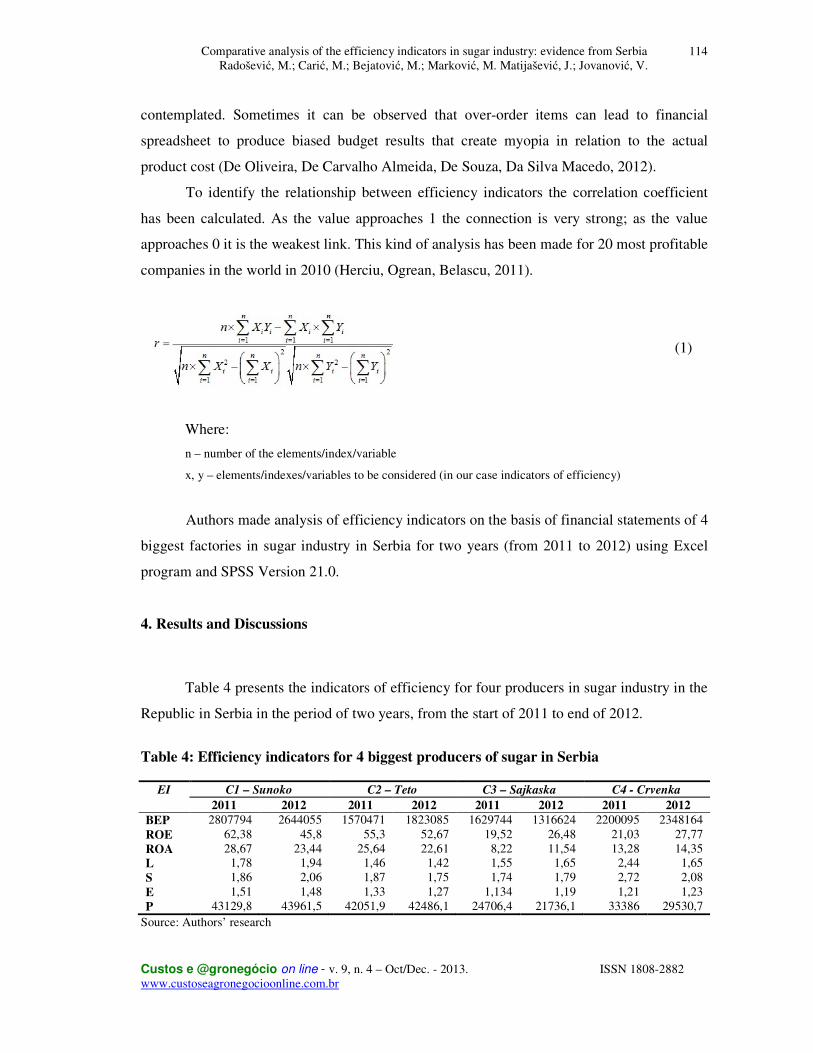
Table 4 presents the indicators of efficiency for four producers in sugar industry in the
Republic in Serbia in the period of two years, from the start of 2011 to end of 2012.
Table 4: Efficiency indicators for 4 biggest producers of sugar in Serbia
Source: Authors’ research
EI C1 – Sunoko C2 – Teto C3 – Sajkaska C4 - Crvenka
2011 2012 2011 2012 2011 2012 2011 2012
BEP 2807794 2644055 1570471 1823085 1629744 1316624 2200095 2348164 ROE 62,38 45,8 55,3 52,67 19,52 26,48 21,03 27,77 ROA 28,67 23,44 25,64 22,61 8,22 11,54 13,28 14,35 L 1,78 1,94 1,46 1,42 1,55 1,65 2,44 1,65 S 1,86 2,06 1,87 1,75 1,74 1,79 2,72 2,08 E 1,51 1,48 1,33 1,27 1,134 1,19 1,21 1,23 P 43129,8 43961,5 42051,9 42486,1 24706,4 21736,1 33386 29530,7
Comparative analysis of the efficiency indicators in sugar industry: evidence from Serbia Radošević, M.; Carić, M.; Bejatović, M.; Marković, M. Matijašević, J.; Jovanović, V.
Custos e @gronegócio on line - v. 9, n. 4 – Oct/Dec. - 2013. ISSN 1808-2882 www.custoseagronegocioonline.com.br
115
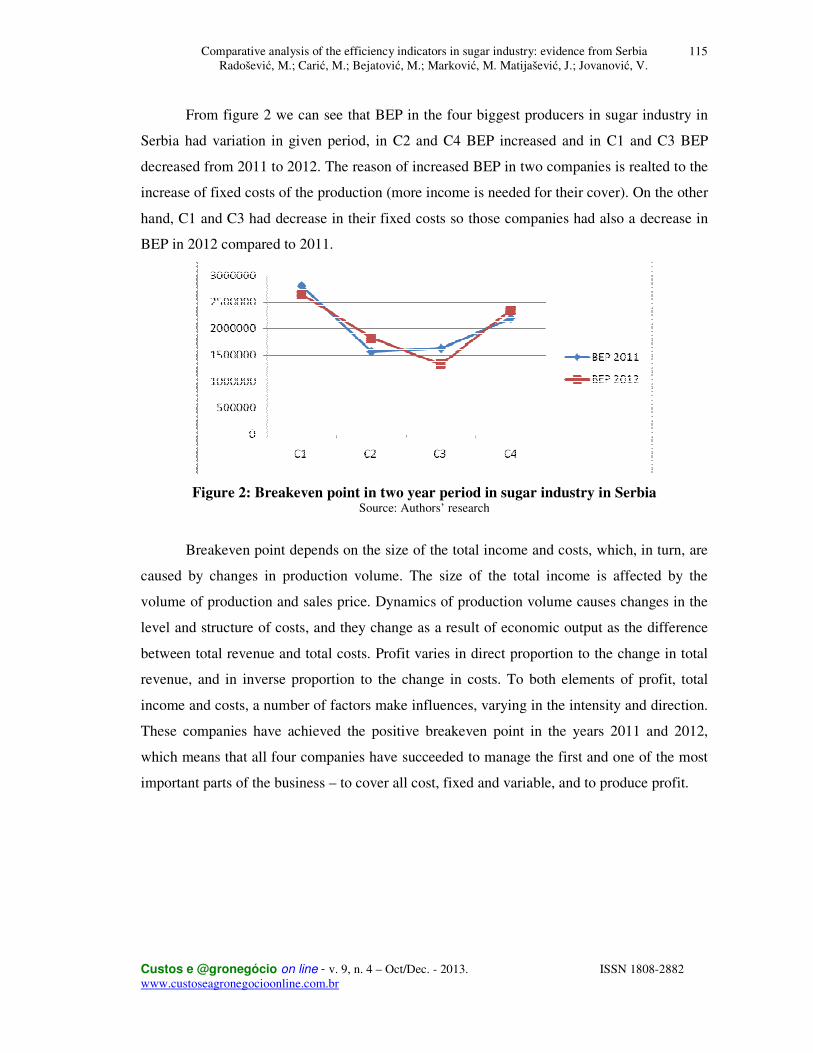
From figure 2 we can see that BEP in the four biggest producers in sugar industry in
Serbia had variation in given period, in C2 and C4 BEP increased and in C1 and C3 BEP
decreased from 2011 to 2012. The reason of increased BEP in two companies is realted to the
increase of fixed costs of the production (more income is needed for their cover). On the other
hand, C1 and C3 had decrease in their fixed costs so those companies had also a decrease in
BEP in 2012 compared to 2011.
Figure 2: Breakeven point in two year period in sugar industry in Serbia Source: Authors’ research
Breakeven point depends on the size of the total income and costs, which, in turn, are
caused by changes in production volume. The size of the total income is affected by the
volume of production and sales price. Dynamics of production volume causes changes in the
level and structure of costs, and they change as a result of economic output as the difference
between total revenue and total costs. Profit varies in direct proportion to the change in total
revenue, and in inverse proportion to the change in costs. To both elements of profit, total
income and costs, a number of factors make influences, varying in the intensity and direction.
These companies have achieved the positive breakeven point in the years 2011 and 2012,
which means that all four companies have succeeded to manage the first and one of the most
important parts of the business – to cover all cost, fixed and variable, and to produce profit.
Comparative analysis of the efficiency indicators in sugar industry: evidence from Serbia Radošević, M.; Carić, M.; Bejatović, M.; Marković, M. Matijašević, J.; Jovanović, V.
Custos e @gronegócio on line - v. 9, n. 4 – Oct/Dec. - 2013. ISSN 1808-2882 www.custoseagronegocioonline.com.br
116
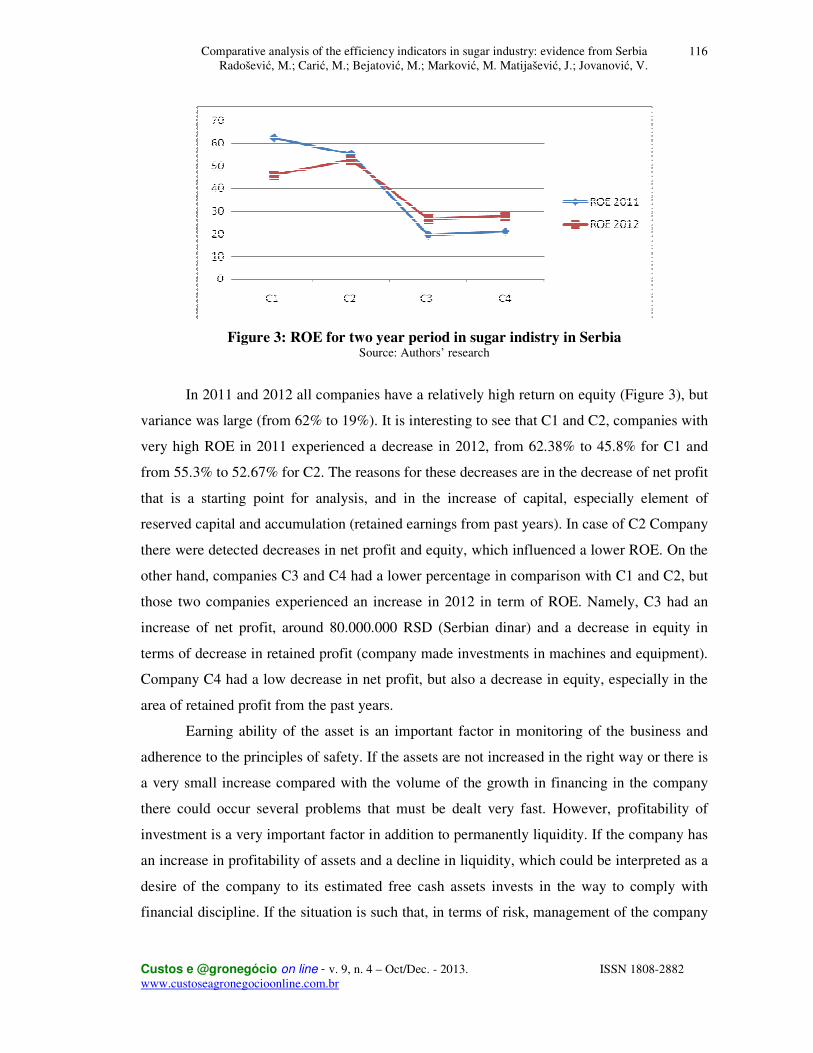
Figure 3: ROE for two year period in sugar indistry in Serbia Source: Authors’ research
In 2011 and 2012 all companies have a relatively high return on equity (Figure 3), but
variance was large (from 62% to 19%). It is interesting to see that C1 and C2, companies with
very high ROE in 2011 experienced a decrease in 2012, from 62.38% to 45.8% for C1 and
from 55.3% to 52.67% for C2. The reasons for these decreases are in the decrease of net profit
that is a starting point for analysis, and in the increase of capital, especially element of
reserved capital and accumulation (retained earnings from past years). In case of C2 Company
there were detected decreases in net profit and equity, which influenced a lower ROE. On the
other hand, companies C3 and C4 had a lower percentage in comparison with C1 and C2, but
those two companies experienced an increase in 2012 in term of ROE. Namely, C3 had an
increase of net profit, around 80.000.000 RSD (Serbian dinar) and a decrease in equity in
terms of decrease in retained profit (company made investments in machines and equipment).
Company C4 had a low decrease in net profit, but also a decrease in equity, especially in the
area of retained profit from the past years.
Earning ability of the asset is an important factor in monitoring of the business and
adherence to the principles of safety. If the assets are not increased in the right way or there is
a very small increase compared with the volume of the growth in financing in the company
there could occur several problems that must be dealt very fast. However, profitability of
investment is a very important factor in addition to permanently liquidity. If the company has
an increase in profitability of assets and a decline in liquidity, which could be interpreted as a
desire of the company to its estimated free cash assets invests in the way to comply with
financial discipline. If the situation is such that, in terms of risk, management of the company

Comparative analysis of the efficiency indicators in sugar industry: evidence from Serbia Radošević, M.; Carić, M.; Bejatović, M.; Marković, M. Matijašević, J.; Jovanović, V.
Custos e @gronegócio on line - v. 9, n. 4 – Oct/Dec. - 2013. ISSN 1808-2882 www.custoseagronegocioonline.com.br
117
uses financial resources inappropriately then increase of profitability is irrelevant because a
balance of funding is disrupted and liquid assets are brought into the hands of creditors.
Figure 4: ROA for two year period in sugar indistry in Serbia Source: Authors’ research
From figure 4 we can see the similar data as for ROE. C1 and C2, companies with
very high ROA in 2011 experienced a decrease in 2012, from 28.67% to 23.44% for C1 and
from 25.64% to 22.61% for C2. The reasons for these decreases in C1 company are in the
decrease of net profit and in the increase of business assets, especially element of receivables
and stocks (in the area of working assets) and fixed assets in terms of property, plant and
equipment and long term financial placement (participation in the capital). In case of C2
company there were detected decreases in net profit and increase in business assets, especially
element of receivables and cash (in the area of working assets) and fixed assets in terms of
property, plant and equipment, which influenced a lower ROA. On the other hand, companies
C3 and C4 had a lower percentage in comparison with C1 and C2, but those two companies
experienced an increase in 2012 in term of ROA. Namely, C3 had an increase of net profit,
around 80.000.000 RSD (Serbian dinar) and a decrease in business assets in terms of decrease
in working assets (company made decrease in receivables, which is very important since
receivables from customers are one of the leading problems in contemporary business).
Company C4 had a low decrease in net profit, but also a decrease in business assets in terms
of decrease in working assets (company made decrease in receivables, like C3, and this
Comparative analysis of the efficiency indicators in sugar industry: evidence from Serbia Radošević, M.; Carić, M.; Bejatović, M.; Marković, M. Matijašević, J.; Jovanović, V.
Custos e @gronegócio on line - v. 9, n. 4 – Oct/Dec. - 2013. ISSN 1808-2882 www.custoseagronegocioonline.com.br
118
decrease was for 41% which is a very good indicator that show that 41% of receivables
related to the customers were collected).
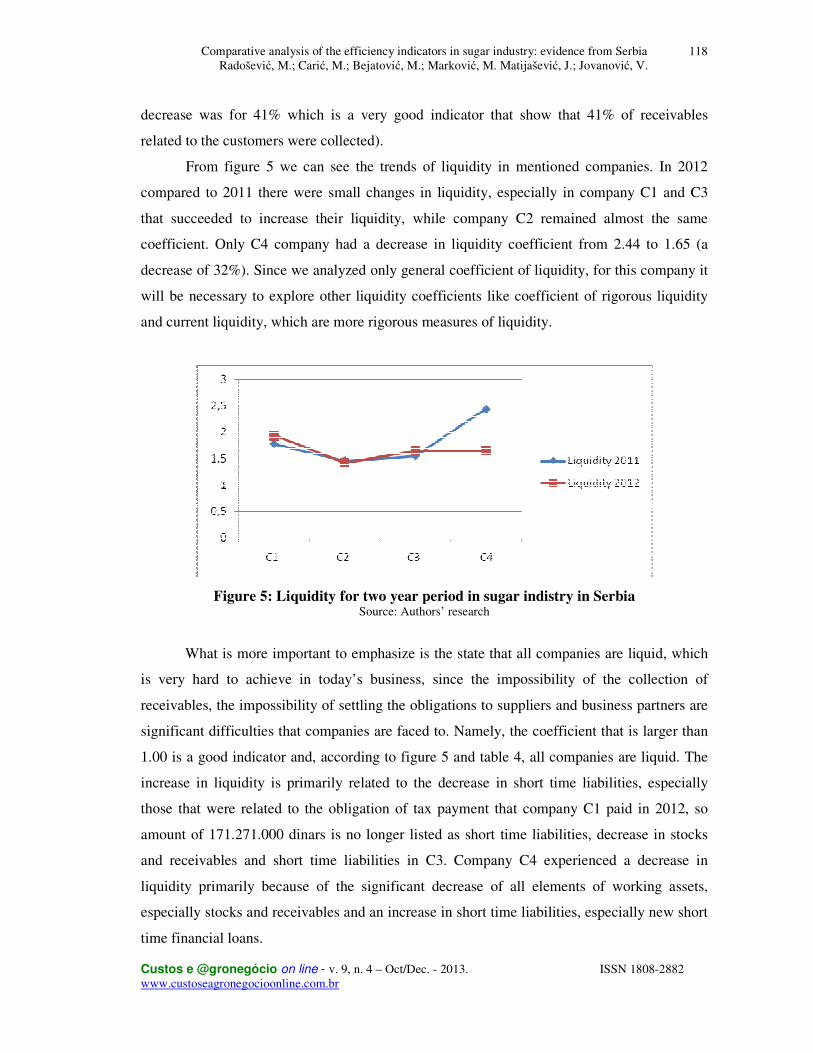
From figure 5 we can see the trends of liquidity in mentioned companies. In 2012
compared to 2011 there were small changes in liquidity, especially in company C1 and C3
that succeeded to increase their liquidity, while company C2 remained almost the same
coefficient. Only C4 company had a decrease in liquidity coefficient from 2.44 to 1.65 (a
decrease of 32%). Since we analyzed only general coefficient of liquidity, for this company it
will be necessary to explore other liquidity coefficients like coefficient of rigorous liquidity
and current liquidity, which are more rigorous measures of liquidity.
Figure 5: Liquidity for two year period in sugar indistry in Serbia Source: Authors’ research
What is more important to emphasize is the state that all companies are liquid, which
is very hard to achieve in today’s business, since the impossibility of the collection of
receivables, the impossibility of settling the obligations to suppliers and business partners are
significant difficulties that companies are faced to. Namely, the coefficient that is larger than
1.00 is a good indicator and, according to figure 5 and table 4, all companies are liquid. The
increase in liquidity is primarily related to the decrease in short time liabilities, especially
those that were related to the obligation of tax payment that company C1 paid in 2012, so
amount of 171.271.000 dinars is no longer listed as short time liabilities, decrease in stocks
and receivables and short time liabilities in C3. Company C4 experienced a decrease in
liquidity primarily because of the significant decrease of all elements of working assets,
especially stocks and receivables and an increase in short time liabilities, especially new short
time financial loans.
Comparative analysis of the efficiency indicators in sugar industry: evidence from Serbia Radošević, M.; Carić, M.; Bejatović, M.; Marković, M. Matijašević, J.; Jovanović, V.
Custos e @gronegócio on line - v. 9, n. 4 – Oct/Dec. - 2013. ISSN 1808-2882 www.custoseagronegocioonline.com.br
119
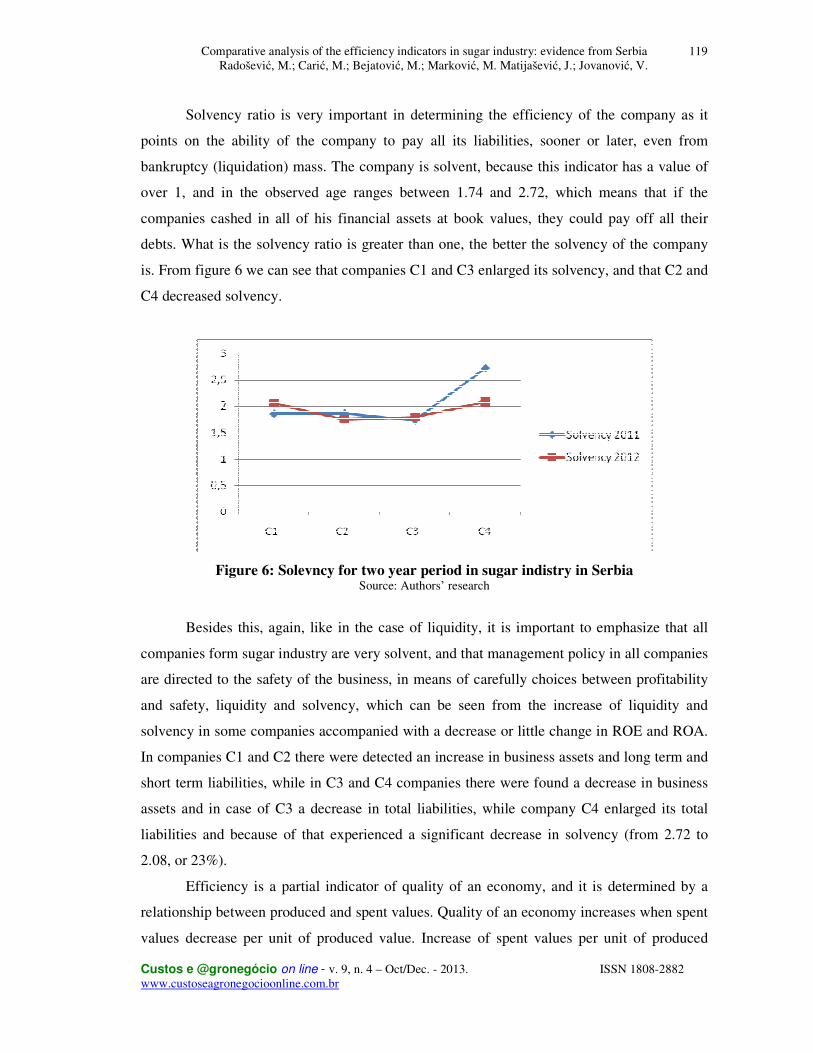
Solvency ratio is very important in determining the efficiency of the company as it
points on the ability of the company to pay all its liabilities, sooner or later, even from
bankruptcy (liquidation) mass. The company is solvent, because this indicator has a value of
over 1, and in the observed age ranges between 1.74 and 2.72, which means that if the
companies cashed in all of his financial assets at book values, they could pay off all their
debts. What is the solvency ratio is greater than one, the better the solvency of the company
is. From figure 6 we can see that companies C1 and C3 enlarged its solvency, and that C2 and
C4 decreased solvency.
Figure 6: Solevncy for two year period in sugar indistry in Serbia Source: Authors’ research
Besides this, again, like in the case of liquidity, it is important to emphasize that all
companies form sugar industry are very solvent, and that management policy in all companies
are directed to the safety of the business, in means of carefully choices between profitability
and safety, liquidity and solvency, which can be seen from the increase of liquidity and
solvency in some companies accompanied with a decrease or little change in ROE and ROA.
In companies C1 and C2 there were detected an increase in business assets and long term and
short term liabilities, while in C3 and C4 companies there were found a decrease in business
assets and in case of C3 a decrease in total liabilities, while company C4 enlarged its total
liabilities and because of that experienced a significant decrease in solvency (from 2.72 to
2.08, or 23%).
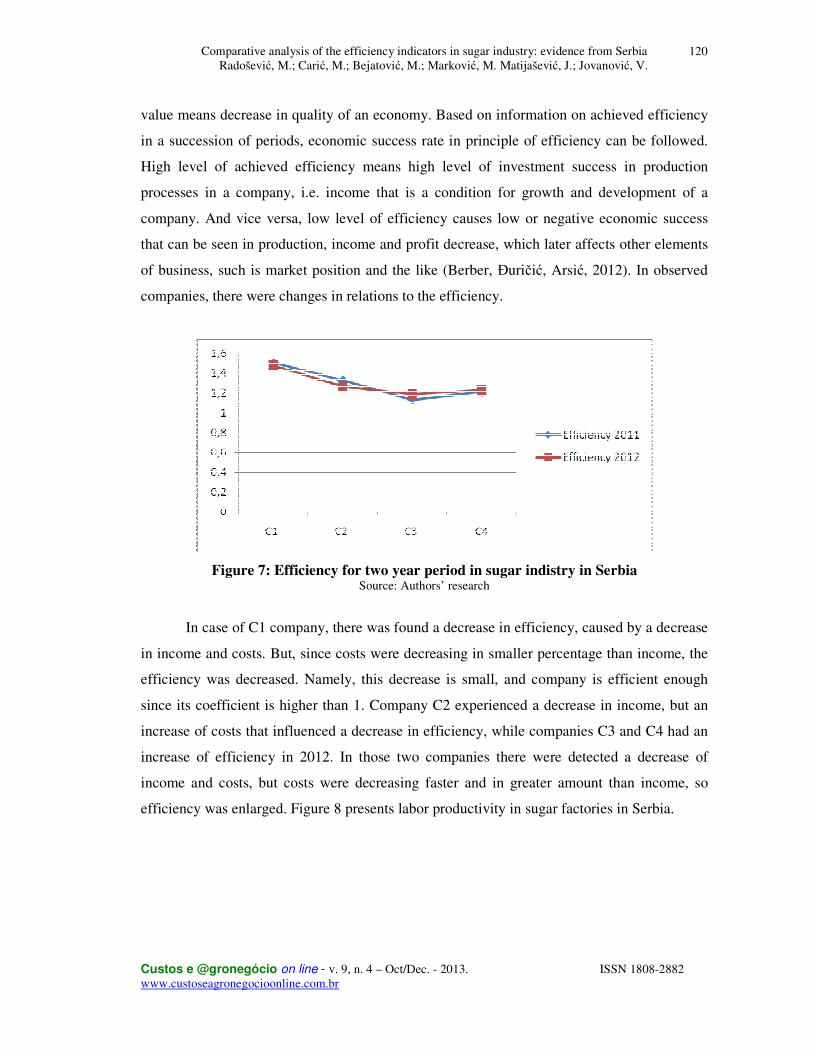
Efficiency is a partial indicator of quality of an economy, and it is determined by a
relationship between produced and spent values. Quality of an economy increases when spent
values decrease per unit of produced value. Increase of spent values per unit of produced
Comparative analysis of the efficiency indicators in sugar industry: evidence from Serbia Radošević, M.; Carić, M.; Bejatović, M.; Marković, M. Matijašević, J.; Jovanović, V.
Custos e @gronegócio on line - v. 9, n. 4 – Oct/Dec. - 2013. ISSN 1808-2882 www.custoseagronegocioonline.com.br
120
value means decrease in quality of an economy. Based on information on achieved efficiency
in a succession of periods, economic success rate in principle of efficiency can be followed.
High level of achieved efficiency means high level of investment success in production
processes in a company, i.e. income that is a condition for growth and development of a
company. And vice versa, low level of efficiency causes low or negative economic success
that can be seen in production, income and profit decrease, which later affects other elements
of business, such is market position and the like (Berber, Đuričić, Arsić, 2012). In observed
companies, there were changes in relations to the efficiency.
Figure 7: Efficiency for two year period in sugar indistry in Serbia Source: Authors’ research
In case of C1 company, there was found a decrease in efficiency, caused by a decrease
in income and costs. But, since costs were decreasing in smaller percentage than income, the
efficiency was decreased. Namely, this decrease is small, and company is efficient enough
since its coefficient is higher than 1. Company C2 experienced a decrease in income, but an
increase of costs that influenced a decrease in efficiency, while companies C3 and C4 had an
increase of efficiency in 2012. In those two companies there were detected a decrease of
income and costs, but costs were decreasing faster and in greater amount than income, so
efficiency was enlarged. Figure 8 presents labor productivity in sugar factories in Serbia.

Comparative analysis of the efficiency indicators in sugar industry: evidence from Serbia Radošević, M.; Carić, M.; Bejatović, M.; Marković, M. Matijašević, J.; Jovanović, V.
Custos e @gronegócio on line - v. 9, n. 4 – Oct/Dec. - 2013. ISSN 1808-2882 www.custoseagronegocioonline.com.br
121
Figure 8: Productivity for two year period in sugar industry in Serbia Source: Authors’ research
According figure 8 we can conclude that all companies almost remained its
productivity measured as relation between gathered income and number of employees.
Productivity as partial indicator of efficiency of an economy is very significant, but in this
paper only the basic calculation has been done, as a ratio between total income and number of
workers. Companies that enlarged its labor productivity made that trough better organization
of human resources and efficient use of them. In companies that had a lower level of
productivity in 2012 there was a decrease in income (business revenue) so with almost the
same organization and number of workers those companies experienced a lower level of
productivity calculated as RSD of revenue per worker.
At the end of the analysis, to identify the relationship between ROA and ROE the
correlation coefficient has been calculated since those indicators are two the most mentioned
in contemporary researches related to the efficiency of business systems, even in agriculture
(Mishra, Harris, Erickson, Hallahan & Detre, 2012; Thim, Choong & Asri, 2012; Zhao, Trejo-
Pech, & Weldon, 2012; Katchova & Enlow, 2013; Golas, Bieniasz & Czerwinska-Kayzer,
2013).
Table 5: Correlation between efficiency indicators in sugar industry in Serbia
Spearman's rho Correlations ROE ROA ROE Correlation Coefficient 1,000 ,952**
Sig. (2-tailed) . ,000 ROA Correlation Coefficient ,952
** 1,000
Sig. (2-tailed) ,000 . Source: Authors’ research **. Correlation is significant at the 0.01 level (2-tailed).
Comparative analysis of the efficiency indicators in sugar industry: evidence from Serbia Radošević, M.; Carić, M.; Bejatović, M.; Marković, M. Matijašević, J.; Jovanović, V.
Custos e @gronegócio on line - v. 9, n. 4 – Oct/Dec. - 2013. ISSN 1808-2882 www.custoseagronegocioonline.com.br
122
From table 5 and we can see that between ROA and ROS there is strong correlation
(R=0.952; p<0.000), which was expected taking into consideration equation where ROE is
influenced by the changes on ROA indicator, on one hand, and equity multiplier on the other
hand. This correlation is calculated based on ROE and ROA for years, 2011 and 2012, in four
companies (total of 6 factories) of sugar industry in Serbia.
5. Conclusions
Sugar beet production in Serbia has a long tradition. In addition to a long tradition,
features of production of this crop had large variations in both, planted area and in yield.
Production of sugar beet in Serbia takes place on family farms, as well as in companies and
cooperatives. Total area under sugar beet in Serbia, in the analyzed period, mostly increased
to reach the maximum of almost 80 000 ha in 2007. The largest part of the total area is
concentrated in the AP of Vojvodina, north part of the Republic of Serbia. Production of
sugar beet was more than tripled, from about 1 to about 3 million tons. With relatively short
season/campaign of sugar beet processing, high costs of sugar beet transport and insufficient
amounts for daily processing the utilization level of sugar refinery capacities is lower. The
fixed costs per unit of final product, or tons of sugar, are relatively high significantly
increasing the cost of sugar. Also, sugar industry of Serbia can produce almost 500,000 tons
of sugar and most of it can be exported to the EU because of the existence of the quota of
180.000 tons and preferential export of this amount in EU. Sugar industry is definitely a
development possibility of the Republic of Serbia.
This paper presented the methodology and the analysis by which it can be determined
how much the company manufacturing in sugar industry effectively use its limited resources,
and whether the management of the company has been successful when it comes to profit,
return on equity and return to assets – the indicators which are very interesting in the first
place for the owners of the capital. The companies’ analysis of the spectrum of the most
important indicators of successful business in the last 2 years was made. Based on the results
of analysis and correlations coefficient calculated for the ROE and ROA, we can conclude:
• Companies in sugar industry of Serbia are successful in their goal of reaching profit,
since all companies cover its fixed and variable costs of the production, and gain
profit. Business revenue is enough for covering all costs. BEP analysis showed that in
some companies there were changes from 2011 to 2012, but beside decrease of
Comparative analysis of the efficiency indicators in sugar industry: evidence from Serbia Radošević, M.; Carić, M.; Bejatović, M.; Marković, M. Matijašević, J.; Jovanović, V.
Custos e @gronegócio on line - v. 9, n. 4 – Oct/Dec. - 2013. ISSN 1808-2882 www.custoseagronegocioonline.com.br
123
revenue and increase of costs in some companies, all have reached BEP and by that,
made possibilities for profit gaining.
• In case of ROE and ROA indicators, all companies had very satisfactory results, since
all of them are in the line with theoretical background, were it has been stated that
ROE and ROA should not be lower than 15%. Also, some changes have occurred in
transition between 2011 and 2012, but generally speaking, sugar industry has
satisfactory ROE and ROA indicators. Also, there was found very strong significant
correlation between ROE and ROA in 2011 and 2012.
• All companies in sugar industry in Serbia are liquid, which is very hard to achieve in
today’s business, since the impossibility of the collection of receivables, the
impossibility of settling the obligations to suppliers and business partners are
significant difficulties that companies are faced to. Namely, the coefficient that is
larger than 1.00 is a good indicator. The increase in liquidity is primarily related to the
decrease in short time liabilities, especially those that were related to the obligation of
tax payment, decrease in stocks and receivables and short time liabilities.
• Also, all companies form sugar industry are very solvent, which means that
management policy in all companies is directed to the safety of the business, in means
of carefully choices between profitability and safety, liquidity and solvency, which can
be seen from the increase of liquidity and solvency in some companies accompanied
with a decrease or little change in ROE and ROA. In companies there were detected
an increase in business assets and long term and short term liabilities, while in others
there were found a decrease in business assets.
• In case of efficiency, all companies are efficient in the use of their resources, and
although there were some changes, positive and negative, we can state that sugar
industry is efficient, but that continuing organizational and management efforts must
be directed to the increase of the efficiency in next period. Also, it is important to
emphasize that companies had very small changes in efficiency and that most of them
almost retained the efficiency index from past year.
• At the end, we analyzed productivity but only as a relation between revenue and
number of workers, since we could not reach the information about working hours
(which is very complex since there are typical seasons for sugar processing during the
year). We can conclude that all companies almost remained its productivity from 2011
to 2012. Companies that enlarged its labor productivity made that trough better

Comparative analysis of the efficiency indicators in sugar industry: evidence from Serbia Radošević, M.; Carić, M.; Bejatović, M.; Marković, M. Matijašević, J.; Jovanović, V.
Custos e @gronegócio on line - v. 9, n. 4 – Oct/Dec. - 2013. ISSN 1808-2882 www.custoseagronegocioonline.com.br
124
organization of human resources and efficient use of them. In companies that had a
lower level of productivity in 2012 there was a decrease in income (business revenue)
so with almost the same organization and number of workers those companies
experienced a lower level of productivity calculated as RSD of revenue per worker.
6. References
ALARCÓN, S.; SÁNCHEZ, M. Business strategies, profitability and efficiency of
production. Spanish Journal of Agricultural Research, v. 11, n. 1, p. 19-31, 2013.
ALAVINASAB, S. M.; DAVOUDI, E. Studying the relationship between working capital
management and profitability of listed companies in Tehran stock exchange. Blood, v. 2, n. 7,
p. 01-08, 2013.
BERBER, N. Economic efficiency of the sugar production. Ekonomika, v.57, n.2, p. 227-238,
2011.
BERBER, N.; Golić, B. The role of cost-volume-profit analysis and breakeven graphic in
crisis business conditions: A case study. Anali Ekonomskog fakulteta u Subotici, n.25, p. 73-
84, 2011.
BERBER, N.; ĐURIČIĆ, J.; ARSIĆ, N. Economic and regulatory evaluation of the organic
agricultural production in Serbia: a case study of the production of wheat. Custos e
Agronegocio, v.8, n.1, p. 96-118, 2012.
Comparative analysis of the efficiency indicators in sugar industry: evidence from Serbia Radošević, M.; Carić, M.; Bejatović, M.; Marković, M. Matijašević, J.; Jovanović, V.
Custos e @gronegócio on line - v. 9, n. 4 – Oct/Dec. - 2013. ISSN 1808-2882 www.custoseagronegocioonline.com.br
125
BIENIASZ, A.; GOŁAŚ, Z. The influence of working capital management on the food
industry enterprises profitability. Contemporary Economics, v.5, n.4, p. 68-81, 2011.
BODIE, Z.; KANE, A.; MARCUS, A. J. Investments. 8th red. Singapore: McGraw, 2009.
BOŽIĆ, D.; MUNĆAN, P.; BOGDANOV, N. Economic Characteristcis of Sugar Sector in
Serbia. Research Journal of Agricultural Science, v.42, n.3, p. 445-452, 2010.
BROWN, L. D.; CAYLOR, M. L. Corporate governance and firm operating performance.
Review of Quantitative Finance and Accounting, v.32, n.2, p. 129-144, 2009.
DE OLIVEIRA, C. A.; DE CARVALHO ALMEIDA, J. C.; DE SOUZA, M. A. F.; DA
SILVA MACEDO, M. A. Production cost on beef cattle in the dynamic cost vision: the case
of Fazenda Arural. Custos e agronegocio, v.8, n.3, p. 133-153, 2012.
ERASMUS, P. D. Working capital management and profitability: The relationship between
the net trade cycle and return on assets. Management Dynamics, v.19, n.1, p. 2-10, 2010.
GOLAS, Z.; BIENIASZ, A.;CZERWINSKA-KAYZER, D. The relationship between
working capital and profitability in food industry firms in Poland. Journal of Central
European Agriculture, v.14, n.1, p. 52-63, 2013.
GRIFFIN, J. J.; MAHON, J.F. The Corporate Social Performance and Corporate Financial
Performance Debate: Twenty-Five Years of Incomparable Research. Business and Society,
v.36, n.1, p. 5-31, 1997.
Comparative analysis of the efficiency indicators in sugar industry: evidence from Serbia Radošević, M.; Carić, M.; Bejatović, M.; Marković, M. Matijašević, J.; Jovanović, V.
Custos e @gronegócio on line - v. 9, n. 4 – Oct/Dec. - 2013. ISSN 1808-2882 www.custoseagronegocioonline.com.br
126
GRYGLEWICZ, S. A theory of corporate financial decisions with liquidity and solvency
concerns. Journal of Financial Economics, v.99, n.2, p. 365-384, 2011.
HERCIU, M.; OGREAN, C.; BELASCU, L. A. Du Pont Analysis of the 20 Most Profitable
Companies in the World. 2010 International Conference on Business and Economics
Research, Vol. 1, IACSIT Press, Kuala Lumpur, Malaysia, p. 45-48, 2011
HEYDER, M.; MAKUS, C.; THEUVSEN, L. Internationalization and Firm Performance in
Agribusiness: Empirical Evidence from European Cooperatives. International Journal on
Food System Dynamics, v.2, n.1, p. 77-93, 2011.
J.H.V.H. DE WET.; E. DU TOIT. Return on equity: A popular, but flawed measure of
corporate financial performance. South African Journal of Business Management, v.38, n.1, p.
59-69, 2007.
JAKOVČEVIĆ, K. Economy of primary agricultural production. Traktori i pogonske
mašine, v.11, n.3-4, p. 63-67, 2006.
JAKOVČEVIĆ, K. Economic efficiency of agricultural production. Traktori i pogonske
mašine, v.12, n.2, p. 13-18, 2007.
JAKOVČEVIĆ, K. Troškovi u menadžmentu. Subotica: Ekonomski fakultet, 1995.
Comparative analysis of the efficiency indicators in sugar industry: evidence from Serbia Radošević, M.; Carić, M.; Bejatović, M.; Marković, M. Matijašević, J.; Jovanović, V.
Custos e @gronegócio on line - v. 9, n. 4 – Oct/Dec. - 2013. ISSN 1808-2882 www.custoseagronegocioonline.com.br
127
KATCHOVA, A. L.; ENLOW, S. J. Financial performance of publicly-traded
agribusinesses. Agricultural Finance Review, v.73, n.1, p. 58-73, 2013.
MISHRA, A. K.; HARRIS, J. M.; ERICKSON, K. W.; HALLAHAN, C.; DETRE, J. D.
Drivers of agricultural profitability in the USA: An application of the Du Pont expansion
method. Agricultural Finance Review, v.72, n.3, p. 325-340, 2012.
Official Financial Statements of four biggest producers in sugar industry of Serbia for 2011
and 2012 year.
RAČIĆ, Ž.; BARJAKTAROVIĆ, L.; ZEREMSKI, A. Analysis of indebtedness impact on the
profitability of successful domestic companies in the financial crisis. Industrija, v.39, n.3, p.
45-60, 2011.
RADOŠEVIĆ, M.; PASULA, M.; BERBER, N.; NEŠKOVIĆ, N.; NERANDŽIĆ, B.
Reengineering of Supply Chain Process in Production Systems – A Case Study.
Inžinerinė ekonomika – Engineering Economics, v.24, n.1, p. 71-80, 2013.
RODRIGUES, L. F. Cost of capital and value creation: a study among companies from the
agribusiness sector listed on Bovespa. Custos e agronegocio, v.8, n. special number, p. 22-41,
2012.
ROLJEVIĆ, S.; HAMOVIĆ, V.; SARIĆ, R. Analysis of crop production condition in South-
Bačka district in time period 2000 – 2007 example: Bač municipality. Ekonomika, v.55, n.6,
p. 255-265, 2009.
Comparative analysis of the efficiency indicators in sugar industry: evidence from Serbia Radošević, M.; Carić, M.; Bejatović, M.; Marković, M. Matijašević, J.; Jovanović, V.
Custos e @gronegócio on line - v. 9, n. 4 – Oct/Dec. - 2013. ISSN 1808-2882 www.custoseagronegocioonline.com.br
128
THIM, C. K.; CHOONG, Y. V.; ASRI, N. Q. B. Stock Performance of the Property Sector in
Malaysia. Journal of Modern Accounting and Auditing, v.8, n.2, p. 241-246, 2012.
VUJEVIĆ, K.; BALEN, M. Pokazatelji uspješnosti poslovanja poduzeća pomorskoga
prometa. Pomorstvo: Scientific Journal of Maritime Research, v.20, n.2, p. 33-45, 2006.
ZHAO, Y.; TREJO-PECH, C. O.; WELDON, R. N. The Profitability of the US Food Supply
Chain: Financial Indicators, Cross-Section and Time-Series Effects. Journal of Applied
Business Research, v.29, n.1, p. 23-34, 2012.