A study in Ho Chi Minh City
19
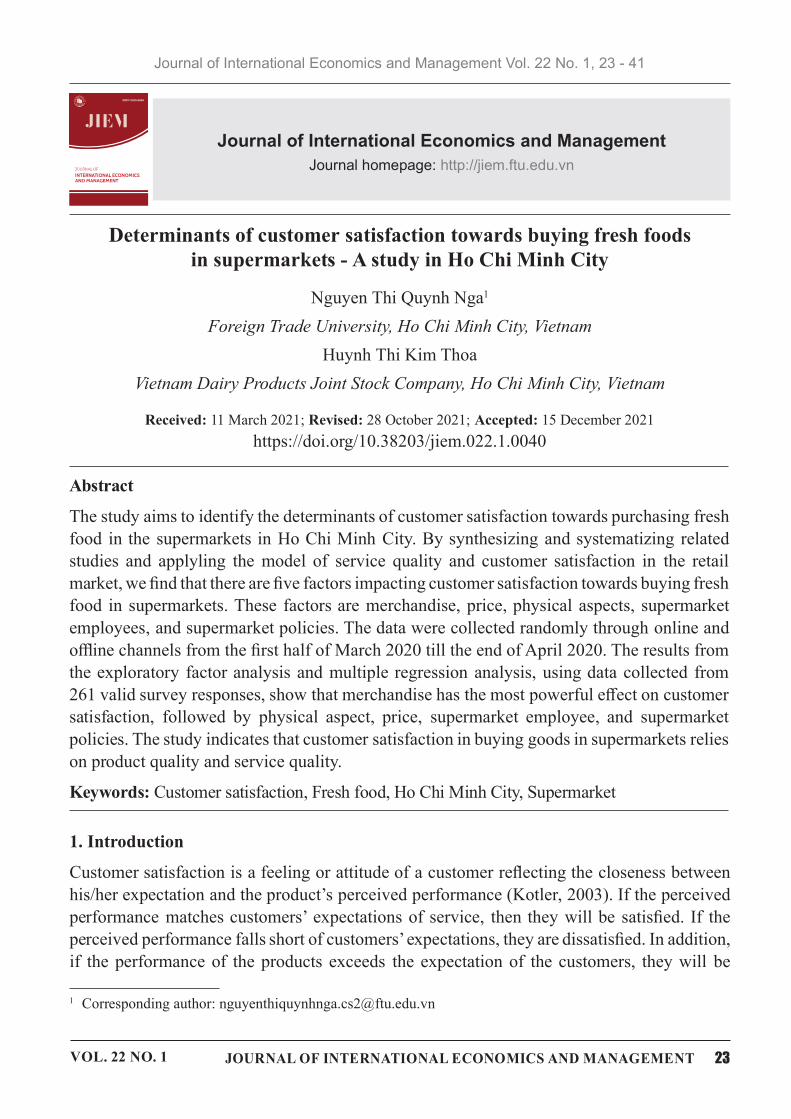
21 2 1121 212 1 11 2 12 Corresponding author: [email protected] Determinants of customer satisfaction towards buying fresh foods in supermarkets - A study in Ho Chi Minh City Nguyen Thi Quynh Nga Foreign Trade University, Ho Chi Minh City, Vietnam Huynh Thi Kim Thoa Vietnam Dairy Products Joint Stock Company, Ho Chi Minh City, Vietnam Received: 0D Revised: 28 October 2021; Accepted: 15 December 2021 SVJMHP Abstract The study aims to identify the determinants of customer satisfaction towards purchasing fresh food in the supermarkets in Ho Chi Minh City. By synthesizing and systematizing related studies and applyling the model of service quality and customer satisfaction in the retail market, we nd that there are ve factors impacting customer satisfaction towards buying fresh food in supermarkets. These factors are merchandise, price, physical aspects, supermarket employees, and supermarket policies. The data were collected randomly through online and oine channels from the rst half of March 2020 till the end of April 2020. The results from the exploratory factor analysis and multiple regression analysis, using data collected from 261 valid survey responses, show that merchandise has the most powerful eect on customer satisfaction, followed by physical aspect, price, supermarket employee, and supermarket policies. The study indicates that customer satisfaction in buying goods in supermarkets relies on product quality and service quality. Keywords: Customer satisfaction, Fresh food, Ho Chi Minh City, Supermarket 661 I J - J MI - I , V 0J 9 1 Introduction Customer satisfaction is a feeling or attitude of a customer reecting the closeness between his/her expectation and the product’s perceived performance (Kotler, 2003). If the perceived performance matches customers’ expectations of service, then they will be satised. If the perceived performance falls short of customers’ expectations, they are dissatised. In addition, if the performance of the products exceeds the expectation of the customers, they will be
-
Upload
khangminh22 -
Category
Documents
-
view
4 -
download
0
Transcript of A study in Ho Chi Minh City
�2��1���2���1���1���21�����212������1����1�����1��2������12��� ��
�� Corresponding�author:�[email protected]
Determinants�of�customer�satisfaction�towards�buying�fresh�foods�in�supermarkets�-�A�study�in�Ho�Chi�Minh�City
Nguyen�Thi�Quynh�Nga�
Foreign�Trade�University,�Ho�Chi�Minh�City,�Vietnam
Huynh�Thi�Kim�Thoa
Vietnam�Dairy�Products�Joint�Stock�Company,�Ho�Chi�Minh�City,�Vietnam
Received:����0D����������Revised:�28�October�2021;�Accepted:�15�December�2021
���SV���������J����������M�HP�����������
Abstract
The�study�aims�to�identify�the�determinants�of�customer�satisfaction�towards�purchasing�fresh�
food� in�the� supermarkets�in�Ho�Chi�Minh�City.�By�synthesizing�and�systematizing� related�studies� and� applyling� the�model� of� service� quality� and� customer� satisfaction� in� the� retail�
market,�we��nd�that�there�are��ve�factors�impacting�customer�satisfaction�towards�buying�fresh�food� in� supermarkets.�These� factors�are�merchandise,�price,�physical�aspects,� supermarket�
employees,�and�supermarket�policies.�The�data�were�collected�randomly�through�online�and�
o�ine�channels�from�the��rst�half�of�March�2020�till�the�end�of�April�2020.�The�results�from�the�exploratory� factor�analysis�and�multiple�regression�analysis,� using�data� collected� from�
261�valid�survey�responses,�show�that�merchandise�has�the�most�powerful�e�ect�on�customer�satisfaction,� followed� by� physical� aspect,� price,� supermarket� employee,� and� supermarket�
policies.�The�study�indicates�that�customer�satisfaction�in�buying�goods�in�supermarkets�relies�
on�product�quality�and�service�quality.
Keywords:�Customer�satisfaction,�Fresh�food,�Ho�Chi�Minh�City,�Supermarket
�661����������
���������I���������������������������������J�����
-�������������J����������M����I���������
-��������I�,���������������������V�����0���J������9�������1�������������
���Introduction
Customer�satisfaction�is�a�feeling�or�attitude�of�a�customer�re�ecting�the�closeness�between�
his/her�expectation�and�the�product’s�perceived�performance�(Kotler,�2003).�If�the�perceived�
performance�matches�customers’�expectations�of�service,� then�they�will�be� satis�ed.�If� the�perceived�performance�falls�short�of�customers’�expectations,�they�are�dissatis�ed.�In�addition,�
if� the�performance�of� the�products� exceeds� the�expectation�of� the�customers,� they�will� be�
�2��1���2���1���1���21�����212������1����1�����1� �2������12�����
highly� satis�ed�or�delighted� (Rana�HW� D��,�2014).� In�business� terms,�gaining�high� levels�of�
customer�satisfaction�is�important�to�a�business�because�satis�ed�customers�are�most�likely�to�
be�loyal,�tend�to�make�repeat�orders�and�use�a�wide�range�of�services�o�ered�by�the�business�
(Jeevananda,�2011).�A�satis�ed�customer�is�a�key�precursor�of�a�business’s�loyalty�(Huyen,�
2020).�In�conclusion,�customer�satisfaction�can�be�de�ned�as�the�feeling�of�customer�toward�a�
product/service�after�it�has�been�consumed.�Customer�satisfaction�is�the�key�to�the�success�of�
a�business.�In�recent�years,�thanks�to�an�increase�in�disposable�income,�higher�education,�and�
living�standards,�customers�tend�to�care�more�for�the�nutrient�and�safety�of�fresh�foods.�This�
phenomenon�leads�to�a�change�in�customer�behavior�and�a�shift�from�the�traditional�markets�
to�modern� trade�channels.�The� growth� rate�of� traditional� channels�was� just�around� 5%� in�
two�years�from�2017.�The��gure�of�modern�trade�doubled�to�16%�in�2019�(Deloitte�Vietnam�
Company�Limited,�2020).�Aggressive�M&A�from�giant�groups�create�the�motivation�for�the�
development�of�supermarkets�and�enhance�the�competing�capability�of�domestic�enterprises.�
One�of�the�typical�instances�is�that�of�Saigon�Co.op,�which�took�over�18�stores�and�the�entire�
e-commerce�retail�system�of�France�Auchan�Retail�in�Vietnam�in�2019�(Tuoi�Tre�Newspaper,�
2019).�Along�with�the�above�positive�aspects,� the�Vietnam�retail� (supermarket)�industry� is�
known�as�one�of�the�most�challenging�ones.�Like�most�countries�in�Southeast�Asia,�Vietnam’s�
retail� landscape�is�heavily�dominated�by�its�traditional�wet�markets�and�small� independent�
stores� catering� small� quantities� of� goods� and� products� for� day-to-day� consumption� (Euro�
Asian�research�experts,�2018).�The�COVID-19�outbreak�leads�to� the�reduction�in�customer�
demands�and�physical�interactions,�which�creates�an�accelerated�shift�towards�omnichannel�
purchasing� behaviors.� For� instance,� the� e-commerce� channels� are� increasingly� used� as� a�
substitute�for�physical�shopping�activities.�As�a�result�of�the�pandemic,�more� than�50%�of�
Vietnamese�consumers�have�reduced�their�frequency�of�visits�to�supermarkets,�grocery�stores,�
wet� markets,�while� 25%� of� them�have� increased� their� online� shopping� (Deloitte�Vietnam�
Company�Limited,�2020).�In�the�present�context,� to�meet�the�rapid�changes�of�the�market’s�
demand,�it�is�no�doubt�that�analyzing�the�factors�a�ecting�customer�satisfaction�to�reconsider�
marketing�strategies�demand�is�listed�among�the�top�priorities�of�companies.
After� the� process�of� analyzing� and�evaluating� the� related�previous� studies,�we� identify�
three�research�gaps.�First,�most�Vietnamese�researchers�have�just�analyzed�elements�a�ecting�
the�customer�intention�or�customer�decision,�but�not�customer�satisfaction�(Chu�and�Pham,�
������ 9�� HW� D��,� 2018;� Do� and� Nguyen,� 2015;� Nguyen� and� Nguyen,� 2015).� Second,� the�
supermarket�is�the�mixed�business�between�the�supply�of�goods�and�service.�However,�most�
previous�studies�focus�on�highlighting�the�impact�of�service�quality,�ignoring�the�contribution�
of�merchandise�quality�and�lacking�a�deep�analysis�for�particular�categories�(Nguyen,�2016;�
Dang,�2019;�Dabholkar�HW�D��,�1996;�Weerasiri,�2015).�Lastly,�only�a�few�studies�investigate�
the�customer�satisfaction�in�the�supermarkets�in�Ho�Chi�Minh�City,�which�is�the�largest�city�in�
Vietnam,�with�about�8.6�million�people�compared�to�the�national�population�of��94.7�million�
people�(General�Statistics�O�ce�of�Vietnam,�2018).
�2��1���2���1���1���21�����212������1����1�����1��2������12��� ��
In� this� research,� we� decide� to� focus� on� evaluating� the� determinants� of� customer�
satisfaction�towards�buying�fresh�foods,�which�is�always�known�as�one�of�the�main�products�
for�daily�consumption�with�many�strict�requirements�related�to�food�quality�and�safety.�We�
will�evaluate�the�customer�satisfaction�incorporating�both�service�and�product�quality.�The�
product�quality�includes�two�aspects:�the�physical�distinctive�characteristics�and�the�price�of�
fresh�food.�This�paper�focuses�on�the�customers�who�bought�and/or�having�been�bought�fresh�
foods�in�the�supermarkets�in�Ho�Chi�Minh�City�to�deliver�the�speci�ed�recommendations�
D���V�JJHV����V�
There�are�four�contributions�of�this�study.�First,�the�study�analyzes�customer�satisfaction�
for�a�speci�c�product�and�concentrates�on�both�service�and�product�quality�impact.�Second,�
this�paper� proposes�and� tests� two�new� factors,� namely�merchandise�and� price.�Third,� this�
research�suggests� strategies� to� the�Vietnamese�businesses� in� the��ercely�competitive� retail�
market.�Finally,�this�study�provides�a�foundation�framework�for�further�research�for�fresh�food�
or�the�rest�of�the�category�in�the�supermarkets.
The� rest� of� the� paper� is�organized�as� follows.�While� Section�2� illustrates� the� literature�
review�and�theoretical�framework,�research�hypotheses�are�described�in�Section�3.�Research�
methodologies� are� presented� in� Section� 4.� In� Section� 5,� research� results� are� presented.�
Suggestions�and�recommendations�are�discussed�and�concluded�in�Section�6.�Finally,�Section�
���������HV���H�SDSH��
2.�Literature�review�and�theoretical�framework
According�to�Hansemark�and�Albinsson�(2004),�“satisfaction�is�an�overall�attitude�towards�a�
product�provider�or�an�emotional�reaction�to�the�di�erence�between�what�customers�expect�
and�what� they�actually� receive� regarding� the� ful�llment�of�a�need.”�Customer�satisfaction�
refers�to�the�outcome�felt�by�those�that�have�experienced�a�company’s�performance�which�has�
ful�lled�customer�expectations�(Angelova�and�Zekiri,�2011).�Tse�and�Wilton�(1988)�suggest�
that�satisfaction�is�a�general�psychological�phenomenon,�describing�the�emotional�state�as�a�
result�of�an�evaluation�of�the�perceived�discrepancy�between�prior�expectations�and�actual�
performance� of� the� product�or� service.�Kotler� (2003)� claims� that� “the� buyer’s� satisfaction�
with� a� purchase� is� a� function� of� the� closeness� between� the� buyer’s� expectations� and� the�
product’s�perceived�performance.�If�performance�falls�short�of�expectations,�the�customer�is�
disappointed;�if�it�meets�expectations,�the�customer�is�satis�ed;�if�it�exceeds�expectations,�the�
customer�is�delighted.�These�feelings�of�satisfaction�in�uence�whether�the�customer�buys�the�
product�again�and�talks�favorably�or�unfavorably�about�the�product�to�others.”�Based�on�these�
de�nitions,�customer�satisfaction�is�de�ned�as�a�comparison�between�consumer�expectation�
and�perceived�value.
Most�researchers,�investigating�the�factors�a�ecting�customer�satisfaction�in�supermarkets,�
focus� on� in� evaluating� the� relationship� between� customer� satisfaction� and� service� quality.�
Weerasiri�(2015)�reveals�that�there�is�a�strong�positive�relationship�between�service�quality�
and�customer�satisfaction.�This�output�is�consistent�with�the�study�conducted�by�Beneke�HW�D���
�2��1���2���1���1���21�����212������1����1�����1� �2������12�����
(2012),�Nguyen�HW�D���(2014),�and�Dabholkar�HW�D���(1996).�Five�dimensions�of�service�quality�
are:�(i)�physical�aspects,�(ii)�reliability,�(iii)�personal�interaction,�(iv)�problem�solving,�and�(v)�
policy.�Among�them,�physical�aspect�is�the�most�powerful�factors.
Several� studies� in�Vietnam�recently�demonstrate� that� service�quality� in� supermarkets� is�
the� incorporation�between�merchandise�and� service�quality.�Dang� (2019),�Nguyen� (2005),�
Le�(2019),�and�Nguyen�(2016)�show�that�product�quality�is�one�of�the�most�important�and�
decisive�factors�a�ecting�on�the�satisfaction�of�shoppers.�However,�when�they�describe�the�
observation�variables�of�product�quality,�due�to�lacking�analysis�of�a�speci�c�product,� they�
just�mention�diversity�and�the�availability�of�the�product.�Hence,�it�is�the�absence�of�typical�
characteristics�of�the�product�such�as�the�freshness�of�fresh�food.
To�the�best�of�our�knowledge,�most�Vietnamese�researchers�attend�to�the�factors�leading�
to�the�customer�decision�or�customer�intention�to�purchasing�fresh�food.�The�results�of�Chu�
and�Pham�(2013),�Nguyen�and�Nguyen�(2015)�show�that� the�factors�related�to�the�product�
quality,�which�are�freshness,�reliable�origin,�package,�price,�and�location,�are�the�most�crucial�
elements� a�ecting� consumer� buying� patterns.�Although� the� above� results� about� customer�
decision�do�not�directly�connect� to� the�factors�a�ecting�customer�satisfaction,�they�help�us�
understand�more�about�the�customer�insights,�consumer�motivations,�and�demands�for�fresh�
food�selling�in�the�supermarket.
Several�theories�are�taken�into�consideration�to�understand�customer�satisfaction�and�its�
relationship�with�(i)�service�quality;�(ii)�product�quality�and�customer�relationship.
First,�the�European�Customer�Satisfaction�Index� (ECSI)�model� is�often�applied�to� the�
measurement� of� products� or� industries� having� a� mixed� supply� of� both� service� product.�
The�ECSI�model�indicates� that�customer�satisfaction�is� the�total�in�uence�of� three�e�ect�
variables� consisting� of� corporate� image,� perceived� value,� and� perceived� product/service�
quality.�Perceived�quality�is�a�measure�of�the�customer’s�evaluation�via�recent�consumption�
experience� of� the� quality� of� a� company’s� products� or� services.� Perceived� value� is� the�
perceived�level�of�product�quality�relative�to�the�price�paid�or�the�“value�for�money”�aspect�
of� the� customer� experience� (Coenders� and�O’Loughlin,� 2002).�Customer� expectation� is�
de�ned�as�the�level�of�values�and�bene�ts�that�a�customer�wants�to�receive�from�the�goods�
and�services.�Therefore,�this�study�focuses�on�the�ECSI�model�and�analyses�the�e�ect�of�
perceived� service/product� quality� and� perceived� value� on� customer� satisfaction� towards�
buying�fresh�food�in�supermarkets.
Second,�the�RSQL�model�is�known�as�the�typical�model�to�measure�service�quality�in�the�
supermarket�(Dabholkar�HW�D��,�1996).�Based�on�the�model�of�SERVQUAL,�Dabholkar�HW�D���
(1996)�propose�a�research�model�with�28�items,�17�of�which�are�from�the�existing�SERVQUAL�
scale� and� the� remaining� 11� items� are� from� the� researchers’� review� of� the� literature� and�
qualitative�research.�Five�items�from�SERVQUAL�were�deemed�inappropriate�and�dropped.�
After�testing�the�RSQL�model�with�the�U.S.�department�store,�the�model�shows�strong�validity�
and�reliability.�This�model�has�been�applied�for�many�studies�(Mehta�HW�D����������1J��H���
�2��1���2���1���1���21�����212������1����1�����1��2������12��� ��
2005;�Le,�2019;�Nguyen�HW�D��,�2014).�Because�of�the�di�erences�in�culture,�social�context,�
economy,�and�policy�between�Vietnam�and�USA,�we�will�conduct�some�necessary�adjustments�
before�applying�the�RSQL�model�in�this�study.
Third,�the�theory�of�retail�service�quality�of�supermarket�in�Hanoi�of�Le�(2019)�is�taken�
into� consideration.� Le� (2019)� presents� that� there� are� �ve� elements� leading� to� customer�
satisfaction�consisting�of�supermarket�employees�(0.383),�which�is�followed�by�merchandise�
(0.26),�reliability�(0.131),�physical�aspects�(0.094),�and�supermarket�policies�(0.059).�The�
scope�of�this�paper�is�limited�to�consumers�in�Hanoi,�which�provides�more�similarities�in�
the�economy,�policies,�customer�behavior,�and�customer�insights�to�our�study�than�foreign�
studies.�Besides,�Le�(2019)�demonstrates�that�product�quality�makes�a�huge�contribution�to�
satisfaction�of�the�customer.
Finally,�we�also�base�on�the�customer� satisfaction� theory�of�Azhar�HW�D��� (2013),�which�
focuses�on�analyzing�the�impact�of�fresh�food�attributes�in�the�hypermarkets�in�Malaysia.�The�
results�reveal�that�consumers�are�more�attentive�to�the�quality�and�price�of�fresh�food�compared�
to�the�availability�and� reliability�of� service.�The�majority�of�customers�were�satis�ed�with�
fresh�food�quality�especially�in�the�aspect�of�freshness,�physical�appearance,�cleanliness�of�
fresh�food.�Our�study�applies�Azhar’s�results�to�build�the�proposed�observation�items�for�two�
measurement�scales:�product�quality�and�price.
3.�Research�hypotheses
Combining�the�theoretical�frameworks�from�previous�studies�(Dalholkar�HW�D��,�1996;�Azhar�
HW�D��,�2013;�Le,�2019)�with�the�results�of�qualitative�research�and�typical�features�of�Ho�Chi�
Minh�shoppers,�we�build�a�proposed� theoretical�model�with��ve�dimensions�consisting�of�
PH���D���VH��S���H��S��V��D��DVSH��V��V�SH�PD�NH��HPS���HHV��D���S�����HV�
In�this�study,�merchandise�is�measured�in�the�aspects�of�availability,�variety,�and�quality�
of�the�product,�which�includes�freshness,�reliable�label�and�origin,�food�safety,�and�package.�
Merchandise�is�known�as�one�of�the�pivotal�elements�to�obtain�customer�satisfaction.�Customers�
tend�to�show�a�high�level�of�satisfaction�with�the�supermarkets�that�always�provide�fresh�and�
reliable�fresh�foods�(Chu�and�Pham,�2013).�The�main�determinants�of�customer�satisfaction�
and� loyalty�are�product�quality�(Gonzalez-Benito�HW�D��,�2010.�Therefore,� the�hypothesis� is�
proposed�as�follows:
H1:�The�factor�“Merchandise”�positively�in�uences�and�has�a�positive�impact�on�customer�
VDWLVIDFWLRQ�
Price�is�evaluated�on�aspects�of� the�appropriateness�of�product�quality,�competitiveness,�
and�stability.�Price�has�the�highest�impact�on�the�supermarket,�which�is�followed�by�product�
(Nguyen,�2016).�Gonzalez-Benito�HW�D���(2010)�reveal�that�price�is�an�important�consideration�
when� buying� consumable� goods� for� customers�with� low-income,� as� compared� to�wealthy�
customers.� Customers� have� a� certain� amount� of� money� for� purchasing� fresh� foods.�They�
tend�to�compare�prices�to�other�supermarkets�and�traditional�markets.�They�will�satisfy�and�
�2��1���2���1���1���21�����212������1����1�����1� �2������12�����
purchase�fresh�foods�in�places�that�o�er�reasonable�prices�relative�to�bene�ts�received�before,�
during,�and�after�shopping.�Forasmuch�as�the�submitted�hypothesis�is:
H2:� The� factor� “Price”� positively� in�uences� and� has� a� positive� impact� on� customer�
VDWLVIDFWLRQ�
Physical�aspects� refer� to� the�physical� appearance,� location,� and�layout�of�supermarkets,�
which� create� convenience� for� customers� during� shopping.� Nguyen� HW� D��� (2014)� indicate�
that�the�appearance�and�the�convenience�of�the�supermarket�such�as�decoration,�advertising�
materials,� and� goods� layout� play� a� vital� role� in� a�ecting� customer� satisfaction.� The� store�
environment,�facilities,�and�even�imagery�thereof�have�become�factors�that�retailers�can�use�to�
gain�a�competitive�edge�and�in�uence�customer�satisfaction�(Dabholkar�HW�D��,�1996).�Having�
a�qualitative�research�with�more�than�30�respondents�in�Ho�Chi�Minh�supermarkets,�it�is�found�
that�the�majority�of�respondents�chose�to�buy�fresh�foods�in�supermarkets�in�their�residential�
zone,�due�to�the�quality�and�the�price�of�fresh�foods�do�not�express�the�big�di�erence�among�
supermarkets�in�Ho�Chi�Minh�City.�Supermarkets�located�in�citizen�zones�or�main�roads�are�
appealed�to�customers�to�purchase�fresh�food�(Chu�and�Pham,�2013).�Hence,�the�following�
��S���HV�V��V�V�JJHV�H��
H3:� The� factor� “Physical� aspects”� positively� in�uences� and� has� a� positive� impact� on�
FXVWRPHU�VDWLVIDFWLRQ�
Supermarket�employees�are�evaluated�on�aspects�of�responsiveness�and�problem-solving.�
Supermarket� employees� having� direct� and� indirect� contact� with� customers� will� lead� to� a�
signi�cant� impact� on� customer� satisfaction.� When� sta�� members� are� more� responsive,�
which�means�attending�to�clients’�needs�quickly�and�with�care�and�courtesy,�it�should�result�
in�improved�customer�satisfaction�(Rana�HW�D��,�2014).�A�good�problem-solving�system�will�
detect�and�solve�problems,�prevent�dissatisfaction,�and�even�encourage�complaints� (Lewis�
and�Spyrakopoulos,�2001).�The�hypothesis�is�developed�as�follows:
H4:�The�factor�“Supermarket�employees”�positively�in�uences�and�has�a�positive�impact�
RQ�FXVWRPHU�VDWLVIDFWLRQ�
Supermarket�policies�are�additional�services�for�customers.�These�policies�refer�to�operating�
hours,�payment�policy,�loyalty�programs,�and�privacy�policy.�Customers�expect�retailers�to�
be�supportive.�Thus,�any� service�mechanism�that�suggests�empathy�and�understanding�is�
likely�to�impact�favorably�on�perceived�service�quality�and�satisfaction�(Dabholkar�HW�D����
1996).� Furthermore,� customers� are� often� highly� pleasant� to� sale� promotions,� gifts� from�
membership� programs,� convenient� operating� hours.� Thus,� the� following� hypothesis� is�
developed:
H5:�The�factor�“Supermarket�policies”�positively�in�uences�and�has�a�positive�impact�on�
FXVWRPHU�VDWLVIDFWLRQ�
�2��1���2���1���1���21�����212������1����1�����1��2������12��� ��
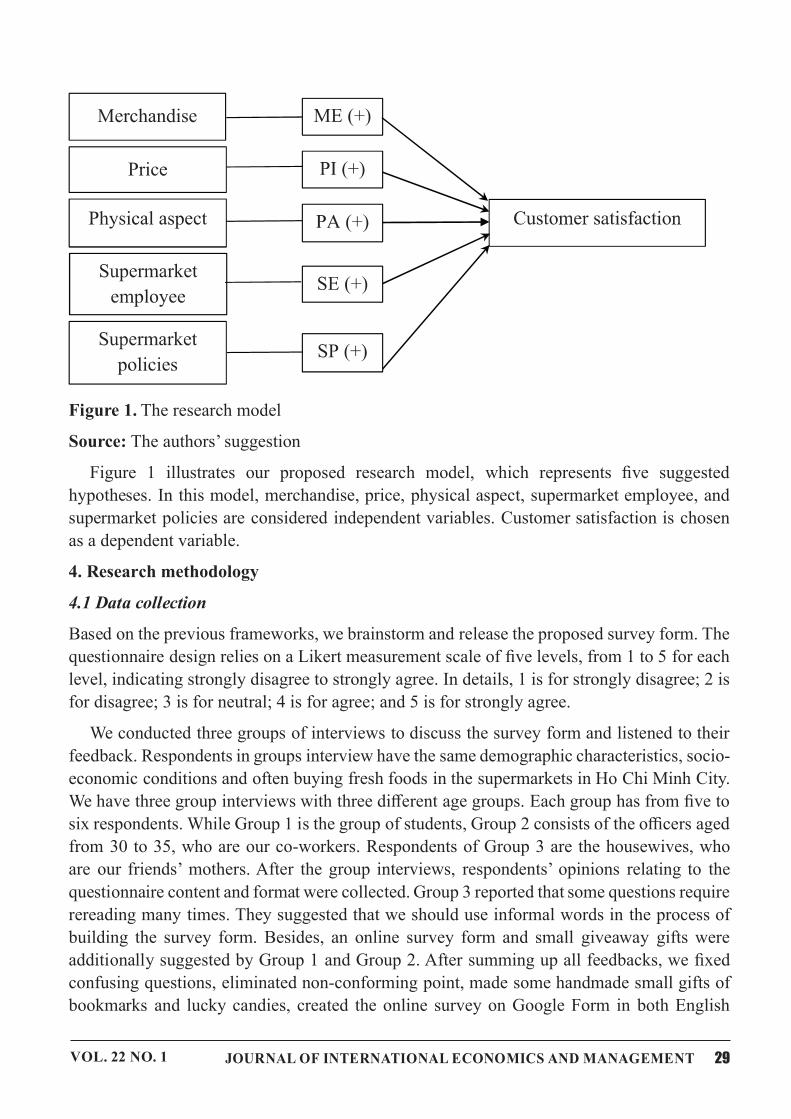
Figure�1.�7�H��HVHD����P��H�
Source:�The�authors’�suggestion
Figure� 1� illustrates� our� proposed� research� model,� which� represents� �ve� suggested�
hypotheses.�In�this�model,�merchandise,�price,�physical�aspect,�supermarket�employee,�and�
supermarket�policies�are�considered�independent�variables.�Customer�satisfaction�is�chosen�
as�a�dependent�variable.
4.�Research�methodology
4.1�Data�collection
Based�on�the�previous�frameworks,�we�brainstorm�and�release�the�proposed�survey�form.�The�
questionnaire�design�relies�on�a�Likert�measurement�scale�of��ve�levels,�from�1�to�5�for�each�
level,�indicating�strongly�disagree�to�strongly�agree.�In�details,�1�is�for�strongly�disagree;�2�is�
for�disagree;�3�is�for�neutral;�4�is�for�agree;�and�5�is�for�strongly�agree.
We�conducted�three�groups�of�interviews�to�discuss�the�survey�form�and�listened�to�their�
feedback.�Respondents�in�groups�interview�have�the�same�demographic�characteristics,�socio-
economic�conditions�and�often�buying�fresh�foods�in�the�supermarkets�in�Ho�Chi�Minh�City.�
We�have�three�group�interviews�with�three�di�erent�age�groups.�Each�group�has�from��ve�to�
six�respondents.�While�Group�1�is�the�group�of�students,�Group�2�consists�of�the�o�cers�aged�
from�30�to�35,�who�are�our�co-workers.�Respondents�of�Group�3�are�the�housewives,�who�
are� our� friends’�mothers.�After� the�group� interviews,� respondents’�opinions� relating� to� the�
questionnaire�content�and�format�were�collected.�Group�3�reported�that�some�questions�require�
rereading�many�times.�They�suggested�that�we�should�use�informal�words�in�the�process�of�
building� the� survey� form.�Besides,� an� online� survey� form� and� small� giveaway� gifts�were�
additionally�suggested�by�Group�1�and�Group�2.�After�summing�up�all�feedbacks,�we��xed�
confusing�questions,�eliminated�non-conforming�point,�made�some�handmade�small�gifts�of�
bookmarks� and� lucky�candies,� created� the�online�survey�on�Google�Form� in� both�English�
�2��1���2���1���1���21�����212������1����1�����1� �2������12�����
and�Vietnamese.�These� changes�do�not�only� help� respondents�avoid�misunderstanding� the�
meaning�of�questions,�but�also�increase�the�convenience�and�motivation�of�the�respondents.�
Finally,�we�conducted�an�o�ine�trial�test�on�a�small�group�of�20�customers�in�Ho�Chi�Minh�
City� in�mid-February�2020� in�di�erent� supermarkets� in�Binh�Thanh�and�Go�Vap�districts.�
There�was�no�comment�leading�to�eliminating�or�supplementing�variables�or�factors�for�the�
questionnaire.�Hence,� the�o�cial� survey�consists�of�41�questions�with� seven�demographic�
questions,�three�questions�to�evaluate�customer�satisfaction,�and�thirty-one�questions�belonging�
to��ve�components,�which�are�merchandise�(seven�questions),�price�(four�questions),�physical�
aspects�(seven�questions),�supermarket�employees�(six�questions),�and�supermarket�policies�
(seven�questions).
According�to�Tabachnick�and�Fidell�(2001),�the�sample�size�calculated�for�the�survey�in�
regression�analysis�must�be�based�on�the�formula�that�n�≥�8m�+�50,�of�which�n�is�the�sample�
size�and�m�is�the�number�of�independent�variables.�With�m=5,�the�minimum�sample�size�is�
90.�To�ensure�the�representation�and�reliability�for�sample�size�and�exploratory�factor�analysis�
(EFA),� each�observed�variable�needs�at� least��ve� samples� (Bollen,�1989).�Therefore,�with�
31�independent�variables,� the� research�needs�at� least�31�x�5�=�155�samples.�Based�on� two�
theories,�we�conducted�the�survey�and�collected�a�minimum�of�245�samples�for�the�next�step�
of�research.
Our�respondents�are�the�ones�who�have�recently�purchased�fresh�food�in�supermarkets.�On�
the��rst�page�of�the�questionnaire,�we�create�a�note�for�clari�cation�“If�you�have�never�bought�
fresh�foods�in�supermarkets�in�Ho�Chi�Minh�City,�please�stop�the�survey�here”.�In�the�pre-data�
process,�we�eliminate�the�data�with�non-conforming�points,�such�as��lling�in�fake�email�or�
choose�one�answer�for�all�questions,�for�example,�always�marking�3.
The�survey�was�conducted�both�online�and�o�ine.�Due�to�the�outbreak�of�the�COVID-19�
pandemic,� the�process�of�data� collection�was�much�more� restricted.�The� survey� form�was�
posted�on�customer� insight�groups�via�a�Facebook�channel.�We�also�used�SendGrid�email�
marketing�to�spread�our�survey�to�suitable�respondents.�For�our�online�respondents,�we�send�
back�them�the�IELTS�book,�lifestyle�book,�activation�codes�for�some�nutrient�online�course�
by�email�as�small�gifts.
A�total�of�279�responses�were�collected�from�the��rst�half�of�March�2020�to�the�end�of�April�
2020.�There�were�261�samples�meeting� the� research� requirements.�There�were� 161�online�
samples�through�Google�Form�and�100�paper�ones�gained�in�several�supermarkets�in�Ho�Chi�
Minh�City.�The�e�ective�rate�of�questionnaires�was�93.54%.
4.2�Data�analysis
The�data�were�processed�by�SPSS�20.0.�The�Cronbach’s�Alpha�test�was�applied�to�analyze�
and�evaluate�the�reliability�of�measurement�scales�and��nd�out�whether�observed�variables�
measure�the�same�concept�or�not�as�well�as�eliminate�unsuitable�variables�because�these�can�
generate� fake� elements� (Nguyen� and�Nguyen,�2009).�We�apply� the�EFA� test� to� prove� the�
validity�of�measurement� scale.� The�EFA� is� a� statistical� technique� that� is� used� to� evaluate�
�2��1���2���1���1���21�����212������1����1�����1��2������12��� ��
two�fundamental�values�of�measurement�scale,�consisting�of�the�convergence�value�and�the�
discriminant�value�(Nguyen,�2011).�The�main�purpose�of�this�test�is�to�evaluate�correctly�the�
adhesion�between�components�and�dependents�variables�as�well�as�shorten�a�set�of�observed�
variables�k�into�a�small�set�of�more�signi�cant�factors�F�(F<k).�Variables�that�do�not�meet�
these�above�standards�were�eliminated� to� readjust� the� research�model.�The�multiple� linear�
regression� analysis� was� used� to� test� the� relationship� between� explanatory� variables� and�
dependent�variables�and�determine�the�importance�of�factors.
5.�Research�results
5.1�Demographic�characteristics�of�the�respondents
To�analyze�the�customer’s�demographic�characteristics,�six�criteria�including�gender,�age,�
main�job,�average�income,�frequency,�and�expenditure�per�order�were�applied.�According�to�
the�SPSS�outcome,�the�number�of�female�respondents�accounts�for�69.3%,�which�doubles�
the��gure� for�male� respondents� (about�30.7%).�The� respondents�whose�age� ranges� from�
25�to�40�years�old�and�below�25�years�old�comprise�the�highest�percentages,�with�44.8%�
and� 36.8%,� respectively,� which� are� followed� by� the� age� from� 40-55� years� old� (10.7%)�
and� above� 55� years� old� (7.7%).� Most� housewives� were� familiar� with� purchasing� fresh�
foods�in�the�traditional�markets�around�the�citizen�zones,�which�conforms�to�the�statistical�
result� when� only� 5.7%�of� respondents� work� as� housewives.� In� contrast,� the� number� of�
respondents�working�as�students�is�the�highest,�which�is�about�42.9�%�or�half�of�the��gure�
for�the�managerial�sector.�The�executive�sector�ranks�at�the�second�level�with�35.6%.�The�
respondents�with� the�monthly� average� salary�of� less� than�5�million�VND� and� from�5� to�
10�million�VND�constitute�the�highest�proportions,�with�41.4%�and�28.7%,� respectively.�
The�percentage�of�respondents�with�income�ranging�from�10�to�20�million�VND�is�21.8%,�
which�is�half�of�the��gure�of�the��rst�group.�In�terms�of�frequency,�more�than�60%�of�the�
respondents�often�purchase�fresh�foods�in�the�supermarkets�more�than�once�a�week.�There�
are�33.7%�of� respondents,�who� just�buy� fresh� food�twice�a�month.�They�are�often�o�ce�
workers�with�limited�time.�Concerning�the�average�spending�per�time,�less� than�200,000�
VND�is�the�most�popular�payment�for�buying�fresh�foods�in�the�supermarkets�by�the�survey�
respondents� (43.7%),�which� is� followed� by� the� amount� range� from� 200,000� to� 500,000�
VND�(42,1%).
5.2�Factors�a�ecting�consumer�satisfaction
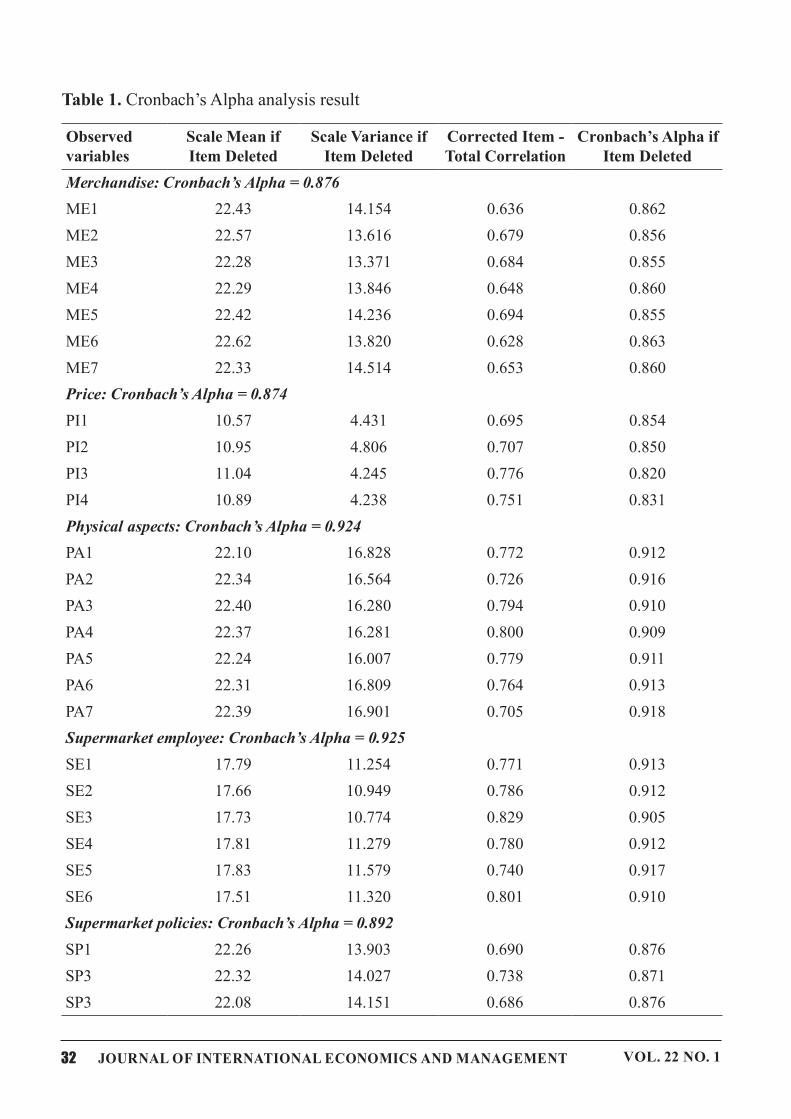
To� ensure� that� all� variables� are� reliable,� Cronbach’s� Alpha� test� is� implemented.� The�
Cronbach’s�Alpha� of� �ve� independent� variables,�which� are�ME,� PI,� PA,� SE,� and� SP,� and�
customer�satisfaction�are�0.876,�0.874,�0.924,�0.925,�0.892,� and�0.863,� respectively.�There�
are�no�observed�variables�with�the�correlation�coe�cient�corrected�item�–�total�correlation�of�
below�0.3.�All�Cronbach’s�Alpha�if�item�deleted�values�of�observed�variables�are�not�greater�
than�the��gure�of�Cronbach’s�Alpha.�It�means�that�all�observed�variables�and�measurement�
scales�in�the�research�model�are�accepted�and�suitable.
�2��1���2���1���1���21�����212������1����1�����1� �2������12�����
7��O�����Cronbach’s�Alpha�analysis�result
Observed�variables
Scale�Mean�if�Item�Deleted
Scale�Variance�if�Item�Deleted
Corrected�Item�-�7RW�O��R���O�W�R�
Cronbach’s�Alpha�if�Item�Deleted
0H�F��QGL�H����RQ��F������S��� ������
ME1 ����� ������ 0.636 0.862
ME2 ����� 13.616 0.679 0.856
ME3 ����� ������ 0.684 �����
ME4 ����� 13.846 0.648 0.860
ME5 ����� 14.236 0.694 �����
ME6 22.62 ������ 0.628 0.863
ME7 ����� ������ 0.653 0.860
3�LFH����RQ��F������S��� ������
PI1 ����� ����� 0.695 �����
PI2 ����� 4.806 ����� �����
PI3 ����� ����� 0.776 �����
PI4 ����� ����� ����� �����
Physical�aspects:�Cronbach’s�Alpha�=�0.924
3�� ����� 16.828 ����� �����
3�� ����� 16.564 0.726 0.916
3�� ����� 16.280 ����� �����
3�� ����� 16.281 ����� �����
3�� ����� 16.007 ����� �����
PA6 ����� 16.809 0.764 �����
3�� ����� 16.901 ����� �����
Supermarket�employee:�Cronbach’s�Alpha�=�0.925
SE1 ����� ������ ����� �����
SE2 17.66 ������ 0.786 �����
SE3 ����� ������ ����� �����
SE4 ����� ������ ����� �����
SE5 ����� ������ ����� �����
SE6 ����� ������ ����� �����
Supermarket�policies:�Cronbach’s�Alpha�=�0.892
�3� 22.26 ������ 0.690 0.876
�3� ����� ������ ����� �����
�3� ����� ������ 0.686 0.876
�2��1���2���1���1���21�����212������1����1�����1��2������12��� ��
Observed�variables
Scale�Mean�if�Item�Deleted
Scale�Variance�if�Item�Deleted
Corrected�Item�-�7RW�O��R���O�W�R�
Cronbach’s�Alpha�if�Item�Deleted
�3� ����� 13.556 0.762 0.867
�3� ����� 13.625 0.650 �����
SP6 ����� ������ 0.644 �����
�3� 22.46 ������ 0.671 �����
���WRPH����WL���FWLRQ����RQ��F������S��� ������
��� 7.69 ����� ����� �����
��� ���� ����� ����� �����
��� ���� ����� ����� �����
Source:�The�authors’�calculation
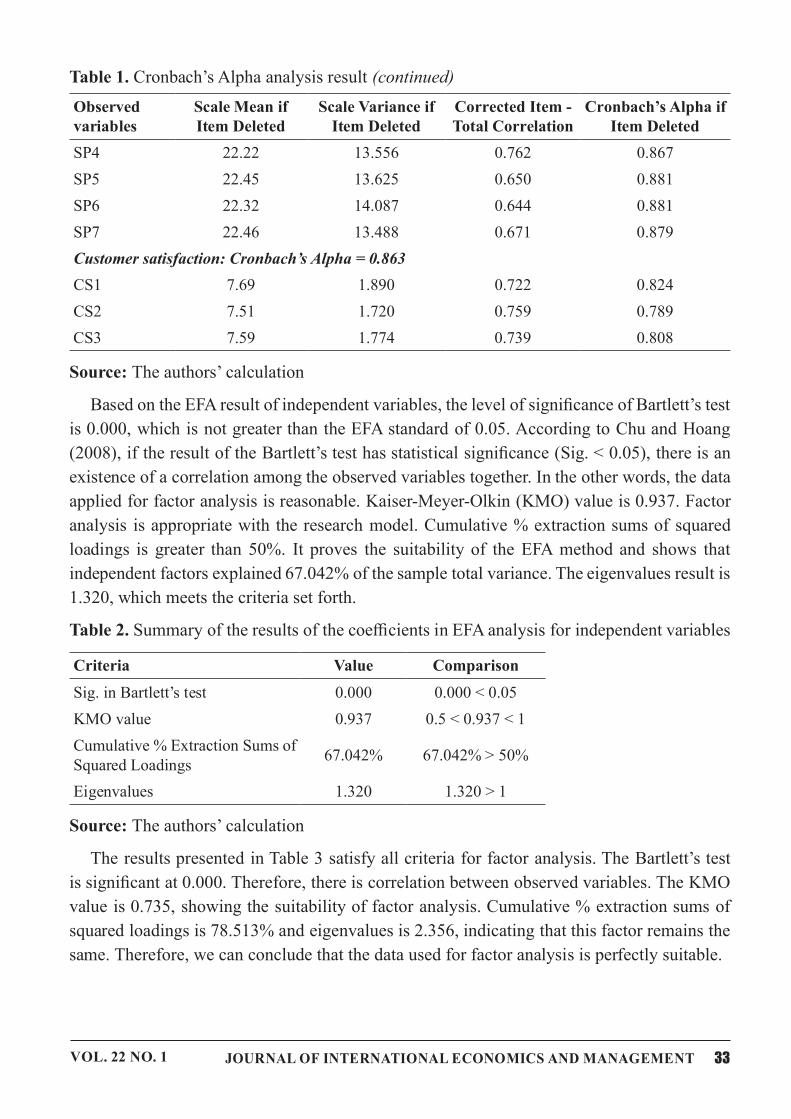
Based�on�the�EFA�result�of�independent�variables,�the�level�of�signi�cance�of�Bartlett’s�test�
is�0.000,�which�is�not�greater�than�the�EFA�standard�of�0.05.�According�to�Chu�and�Hoang�
(2008),�if�the�result�of�the�Bartlett’s�test�has�statistical�signi�cance�(Sig.�<�0.05),�there�is�an�
existence�of�a�correlation�among�the�observed�variables�together.�In�the�other�words,�the�data�
applied�for�factor�analysis�is�reasonable.�Kaiser-Meyer-Olkin�(KMO)�value�is�0.937.�Factor�
analysis� is�appropriate�with�the�research�model.�Cumulative�%�extraction�sums�of� squared�
loadings� is� greater� than� 50%.� It�proves� the� suitability�of� the�EFA�method�and� shows� that�
independent�factors�explained�67.042%�of�the�sample�total�variance.�The�eigenvalues�result�is�
1.320,�which�meets�the�criteria�set�forth.
Table�2.�Summary�of�the�results�of�the�coe�cients�in�EFA�analysis�for�independent�variables
���W���� Value Comparison
Sig.�in�Bartlett’s�test ����� 0.000�<�0.05
KMO�value ����� 0.5�<�0.937�<�1
Cumulative�%�Extraction�Sums�of�Squared�Loadings
67.042% 67.042%�>�50%
Eigenvalues ����� 1.320�>�1
Source:�The�authors’�calculation
The�results�presented�in�Table�3�satisfy�all�criteria�for�factor�analysis.�The�Bartlett’s�test�
is�signi�cant�at�0.000.�Therefore,�there�is�correlation�between�observed�variables.�The�KMO�
value�is�0.735,�showing�the�suitability�of�factor�analysis.�Cumulative�%�extraction�sums�of�
squared�loadings�is�78.513%�and�eigenvalues�is�2.356,�indicating�that�this�factor�remains�the�
same.�Therefore,�we�can�conclude�that�the�data�used�for�factor�analysis�is�perfectly�suitable.
7��O�����Cronbach’s�Alpha�analysis�result��FRQWLQXHG�

�2��1���2���1���1���21�����212������1����1�����1� �2������12�����
Table�3.�Summary�of�the�results�of�the�coe�cients�in�EFA�analysis�for�dependent�variable
���W���� Value Comparison
Sig.�in�Bartlett’s�test ����� 0.000�<�0.05
KMO�value ����� 0.5�<�0.735�<�1
Cumulative�%�Extraction�Sums�of�Squared�Loadings
78.513% 78.513%>�50%
Eigenvalues 2.356 2.356>�1
Source:�The�authors’�calculation
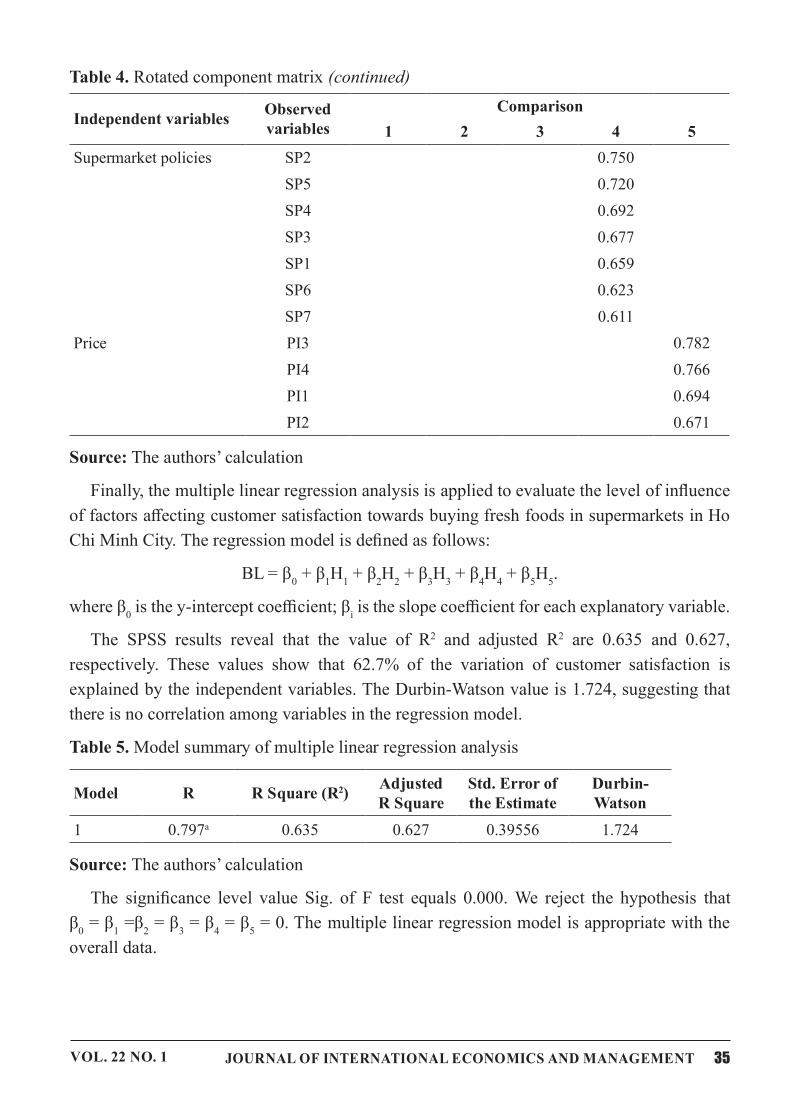
All� observed� variables� of� independent� variables� satisfy� the� requirements� that� factor�
loading�must�be�greater�than�or�equal�to�0.5�and�are�divided�into��ve�groups�as�the�initial�basis�
consisting�of�merchandise,�price,�physical�aspects,�supermarket�employee,�and�supermarket�
policies.�The�outcomes�of�EFA�for�the�dependent�variable�also�present�the�same�conclusion.
Table�4.�Rotated�component�matrix
Independent�variablesObserved�variables
Comparison
� 2 3 4 �
3��V��D��DVSH��V PA6 �����
3�� �����
3�� �����
3�� 0.765
3�� �����
3�� �����
3�� 0.644
��SH�PD�NH��HPS���HH SE4 �����
SE5 �����
SE3 0.765
SE6 �����
SE1 �����
SE2 �����
0H���D���VH ME7 �����
ME1 �����
ME2 �����
ME3 �����
ME4 0.695
ME6 0.693
ME5 0.621
�2��1���2���1���1���21�����212������1����1�����1��2������12��� ��
Independent�variablesObserved�variables
Comparison
� 2 3 4 �
��SH�PD�NH��S�����HV �3� �����
�3� �����
�3� 0.692
�3� 0.677
�3� 0.659
SP6 0.623
�3� 0.611
3���H PI3 �����
PI4 0.766
PI1 0.694
PI2 0.671
Source:�The�authors’�calculation
Finally,�the�multiple�linear�regression�analysis�is�applied�to�evaluate�the�level�of�in�uence�
of�factors�a�ecting�customer�satisfaction�towards�buying�fresh�foods�in�supermarkets�in�Ho�
Chi�Minh�City.�The�regression�model�is�de�ned�as�follows:
BL�=�β��+�β
��
��+�β
��
��+�β
��
��+�β
��
��+�β
��
��
where�β��is�the�y-intercept�coe�cient;�β
��is�the�slope�coe�cient�for�each�explanatory�variable.
The� SPSS� results� reveal� that� the� value� of� R�� and� adjusted� R�� are� 0.635� and� 0.627,�
respectively.� These� values� show� that� 62.7%� of� the� variation� of� customer� satisfaction� is�
explained�by�the�independent�variables.�The�Durbin-Watson�value�is�1.724,�suggesting�that�
there�is�no�correlation�among�variables�in�the�regression�model.
7��O�����Model�summary�of�multiple�linear�regression�analysis
Model 5 R�Square�(R2�Adjusted��R�Square
Std.�Error�of�the�Estimate
Durbin-��W�R�
� �����D 0.635 0.627 0.39556 �����
Source:�The�authors’�calculation
The� signi�cance� level� value� Sig.� of� F� test� equals� 0.000.�We� reject� the� hypothesis� that��
β��=�β
��=β
��=�β
��=�β
��=�β
��=�0.�The�multiple�linear�regression�model�is�appropriate�with�the�
overall�data.
Table�4.�Rotated�component�matrix��FRQWLQXHG�
�2��1���2���1���1���21�����212������1����1�����1� �2������12�����
7��O�����0����S�H����HD���HJ�HVV����D�D��V�V��HV���V
Model
Unstandardized�Coe�cients
Standardized�Coe�cients W 6���
�ROO������W��Statistics
� Std.�Error ��W� Tolerance VIF
� (Constant) ����� 0.176 0.968 �����
ME� ����� ����� ����� ����� ����� 0.561 �����
PI� ����� ����� 0.196 ����� ����� 0.516 �����
3�� ����� ����� 0.206 ����� ����� ����� �����
SE� ����� ����� ����� ����� ����� 0.506 �����
�3� ����� ����� ����� ����� ����� ����� �����
a.�Dependent�variable:�CS
Source:�The�authors’�calculation
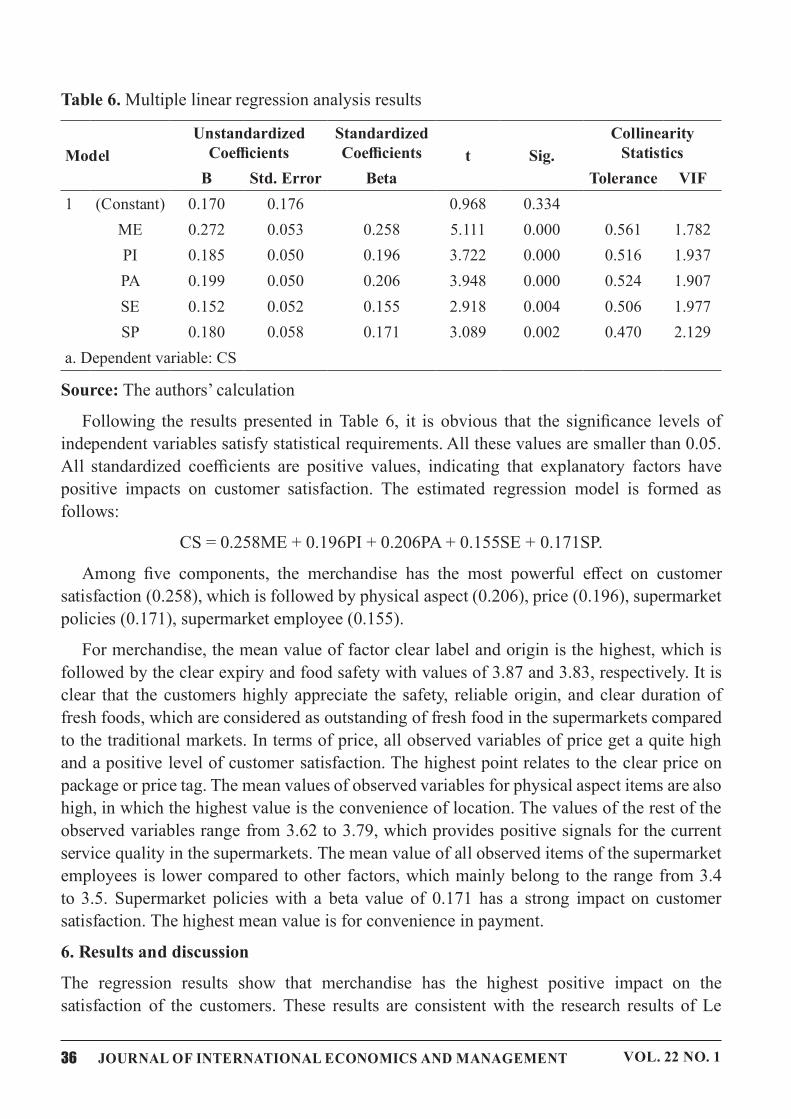
Following� the� results� presented� in�Table� 6,� it� is� obvious� that� the�signi�cance� levels� of�
independent�variables�satisfy�statistical�requirements.�All�these�values�are�smaller�than�0.05.�
All� standardized� coe�cients� are� positive� values,� indicating� that� explanatory� factors� have�
positive� impacts� on� customer� satisfaction.� The� estimated� regression� model� is� formed� as�
follows:
CS�=�0.258ME�+�0.196PI�+�0.206PA�+�0.155SE�+�0.171SP.
Among� �ve� components,� the� merchandise� has� the� most� powerful� e�ect� on� customer�
satisfaction�(0.258),�which�is�followed�by�physical�aspect�(0.206),�price�(0.196),�supermarket�
policies�(0.171),�supermarket�employee�(0.155).
For�merchandise,�the�mean�value�of�factor�clear�label�and�origin�is�the�highest,�which�is�
followed�by�the�clear�expiry�and�food�safety�with�values�of�3.87�and�3.83,�respectively.�It�is�
clear� that� the� customers�highly�appreciate� the� safety,� reliable�origin,�and�clear�duration�of�
fresh�foods,�which�are�considered�as�outstanding�of�fresh�food�in�the�supermarkets�compared�
to�the�traditional�markets.�In�terms�of�price,�all�observed�variables�of�price�get�a�quite�high�
and�a�positive�level�of�customer�satisfaction.�The�highest�point�relates� to�the�clear�price�on�
package�or�price�tag.�The�mean�values�of�observed�variables�for�physical�aspect�items�are�also�
high,�in�which�the�highest�value�is�the�convenience�of�location.�The�values�of�the�rest�of�the�
observed�variables�range�from�3.62�to�3.79,�which�provides�positive�signals�for�the�current�
service�quality�in�the�supermarkets.�The�mean�value�of�all�observed�items�of�the�supermarket�
employees� is�lower�compared�to�other� factors,�which�mainly�belong�to� the�range�from�3.4�
to�3.5.� Supermarket� policies�with� a� beta�value� of� 0.171� has� a� strong� impact�on� customer�
satisfaction.�The�highest�mean�value�is�for�convenience�in�payment.
6.�Results�and�discussion
The� regression� results� show� that� merchandise� has� the� highest� positive� impact� on� the�
satisfaction� of� the� customers.� These� results� are� consistent�with� the� research� results� of� Le�

�2��1���2���1���1���21�����212������1����1�����1��2������12��� ��
(2019).�However,�unlike�Le�(2019),�this�study�shows�that�merchandise,�especially�clear�label�
and�origin�of�the�product,�plays�a�pivotal�role�in�customer�satisfaction.�There�are�two�reasons�
for�this�di�erence.�Firstly,�this�study�focuses�on�fresh�food.�The�questionnaire�was�designed�
with�many�questions�related�to�the�typical�feature�of�fresh�food.�The�merchandise�quality�is�
highlighted�as� important�as� service� quality.� Secondly,� the� reliable� label�and�origin� are� the�
main�di�erence�between�supermarkets�and�traditional�markets,�which�are�the�key�motivation�
for� customer� choosing� to� purchase� fresh� food� in� the� supermarkets� (Nguyen� and�Nguyen,�
2015).�Such�the�results�completely�satisfy�with�the�current�market�context,�where�clear�food�
origin�and�food�safety�are�the�new�social�trend,�especially�among�younger�customers�in�big�
cities�like�Ho�Chi�Minh�City�(Deloitte�Vietnam�Company�Limited,�2020).
Physical� aspects� is� one� of� the� most� essential� factors� leading� to� the� satisfaction� of�
purchasers.�However,�the�di�erence�between�our�study�and�the�studies�conducted�by�Beneke�
HW�D���(2012),�Nguyen�HW�D���(2014),�and�Dabholkar�HW�D���(1996)�is�that�the�physical�aspects�is�
only�ranked�second.�If�the�study�focuses�on�evaluating�the�impact�of�both�product�quality�and�
service�quality,�customer�satisfaction�will�tend�to�be�a�ected�more�by�the�quality�of�goods�
because�supermarkets�are�for�goods�transaction,�not�for�services.�The�results�also�show�that�
the�convenience�of�supermarket�location�plays�a�pivotal�role�on�customer�satisfaction.�The�
supermarkets�in�Ho�Chi�Minh�City�are�often�located�in�key�positions�of�the�city�where�tra�c�is�
high�and�they�are�closed�to�residential�zones�and�o�ce�areas.�Price�factor�is�among�the�third-
highest�rank.�All�observed�variables�get�a�high�and�positive�level�of�customer�satisfaction.�
The�highest�point�is�for�the�clear�price�on�package�or�price�tag,�which�helps�customers�control�
their�budget�during�shopping.�However,�the�price�of�fresh�food�in�the�supermarkets�is��xed�
and�there�is�no�chance�for�barging,�which�is�known�as�one�of�the�most�noticeable�reasons�for�
purchasing�fresh�food�in�the�wet�markets�where�customers�get�a�better�deal�thanks�to�the�ease�
of�barging.�In�conformity�with�the� reality�of�the�market,�the�competing�capability�of�fresh�
food’s� price� compared� to� the� traditional�markets� and� other� supermarkets� also� express� the�
second�lowest�in�all�observed�variables�of�the�model.�Correspondingly,�supermarkets�should�
put�more�e�ort�to�build�better�price�strategies�to�attract�more�customers.
One� of� the� most� highlighted� results� relating� to� supermarket� policies� is� the� impact� of�
convenience� of� payment� trend� on� customer� satisfaction.�The� appearance� of� new� payment�
methods,�especially�non-cash�payments�such�as�smart�wallets,�credit�cards,�mobile�banking,�
creates�a�joyful�mood�for�shopping�time.�It�means�that�supermarkets�should�update�and�accept�
new�non-cash�payment�methods�to�meet�the�customer�requirements.
Based�on�the�regression�outputs,�we�have�several�suggestions.�First,� in�conformity�with�
the�research�results,�young�customers�account�for�a�large�part.�They�are�potential�customers.�
Supermarkets�need�to�provide�more�strategic�plans�to�grab�this�customer�group’s�attraction�
and�boost�customer�satisfaction.
Second,�supermarkets�should�pay�more�attention�to�enhance�the�fresh�food�supply�chain�
system�to�ensure�fresh�food�safety,�availability�and�reduce�transportation�costs,�which�leads�
to�a�more�competitive�price.�Customer�satisfaction�is�one�of�the�most�essential�competitive�
�2��1���2���1���1���21�����212������1����1�����1� �2������12�����
advantages.� It� is� of� a� high� demand� for� understanding� customer’s� needs� through� frequent�
customer� surveys� for� adjusting� price� strategy.� Supermarkets� need� to� focus� on� the� storage�
of� fresh� food� process,� which� have� to�meet� the� ISO� 22000� or� FSSC� 22000� (food� safety�
management�system).�This�will�help�supermarkets�reduce�the�spoilage�rate�of�fresh�food�and�
enhance�food�safety.
Third,�supermarkets�should�focus�on�the�gap�between�fresh�food�quality�and�price.�Customers�
will�be�more�satis�ed�if�the�bene�ts�they�gain�are�higher�than�the�costs�they�pay.�Supermarkets�
should�conduct�more�customer�surveys�about�fresh�food�quality�in�the�supermarket�to�gain�
customer�insights�and�the�current�customer’s�needs�for�the�purpose�of�adjusting�price�strategy�
as�well�as�solutions�to�enhance�product�quality.�Furthermore,�supermarkets�need�to�create�new�
methods�to�deliver�fresh�food�information�to�customers.�Sometimes,�although�new�kinds�of�
fresh�food�with�expensive�price�contain�a�high�level�of�nutrients�and�are�good�for�health,�their�
names�may�not�be�popular�for�Vietnamese�customers.�Customers�may�not�know�about�their�
special�attributes.�Therefore,�in�the�case�of�new�products,�supermarkets�need�to��nd�smarter�
methods�to�tell�customers�more�about�the�products.
Four,�supermarkets�should�concentrate�on�recruitment�and�sta��training�programs�under�
a� “customer-oriented”� mindset.� In� the� recruitment� stage,� supermarkets� should� prioritize�
the� selection� of� young� employees� with� good-looking� appearance,� good� communication�
skills�to�satisfy�the�main�groups�of�the�supermarket�customers.�In�the�interview�section,�the�
interviewers� should� focus� on� testing� the� candidate’s� attitudes�with� some�mini-tests� about�
problem-solving�skills,�communication�skills.�In�the�training�programs,�employees�should�be�
explained�about�company�culture,�detailed�product�information,�and�basic�knowledge�about�
supermarket�arrangement,�employee�duties�and�missions,�because�with�clear�and�abundant�
information,� employees�will� show�self-con�dent� rely�upon�customer�problems,�and�create�
trust�from�customers.�Every�month�or�quarter,�it�is�necessary�to�organize�training�courses�to�
enhance�employee�skills�in�problem-solving,�handling�unexpected�situations.�People-oriented�
strategy,�in�which�company�cares�and�invests�in�the�employee�growth,�should�be�considered�
as�the�key�element�for�the�sustainable�development�of�supermarkets.
With�the�development�of�advanced�technology,�supermarkets�need�to�focus�on�developing�
e-commerce�applications�to�encourage�customers�to�buy�fresh�food�from�distance.�Supermarkets�
can�increase�brand�awareness�and�attract�new�customers�through�promotion�programs�on�TV,�
Youtube,�and�KOLs.
State� agencies� should� impose� policies� to� encourage� cooperation� between� vendors� and�
supermarkets,�which�will�help�to�ensure�the�supply�chain�system.�Thanks�to�these�connections,�
supermarkets� will� take� advantage� of� local� products� with� cheaper� transaction� costs� which�
directly� a�ect� fresh�food�prices�and�create� an�advantage�competitive� for� the�modern�trade�
channel�such�as�stable�and�competitive�price,�the�reduction�time�of�delivery.�Preferential�tax�
and�interest�policies�also�lead�to�the�convenience�for�the�business�to�invest�more�in�operation.
�2��1���2���1���1���21�����212������1����1�����1��2������12��� ��
7.�Conclusion�and�limitation
In� this� study,� a� research� model� is� built� with� �ve� factors� a�ecting� customer� satisfaction,�
��������J� PH���D���VH�� S���H�� S��V��D�� DVSH��V�� V�SH�PD�NH�� HPS���HH�� D��� V�SH�PD�NH��
policies.�The�results�show�that�merchandise�is�a�profound�element.�Two�new�factors�are�built�
and�tested,�which�are�merchandise�and�price.�Both�new�elements�show�positive�results.
This� study� contributes� to� the� literature� of� consumer� satisfaction.�The� results� show� the�
profound�impact�of�merchandise�quality,�which�are�clear�label,�freshness,�availability,�and�food�
safety.�Both�high�quality�product�and�service�is�the�main�key�to�gain�customer’s�love.�The�study�
also�examines�customer�satisfaction�and�discovers�its�determinants�in�the�context�of�an�urban�
area� in� a�developing�economy.�The��ndings�are� signi�cant� from�a� theoretical�perspective.�
The� research� suggests� managerial� implications� regarding� four� factors� a�ecting� consumer�
satisfaction,�which�are�merchandise,�price,�supermarket�employee,�and�supermarket�policies.�
Recommendations�are�proposed�for�state�agencies�to�enhance�retail�business�environments�
and�supermarket�competitive�advantages.
Limitations�are�inevitable�in�this�study.�The�duration�of�the�study�is�short�and�the�sample�
size�collected�by�the�survey�method�is�small.�Therefore,� to�increase�the�e�ect�for�analysis,�
further� studies� should� try� to� obtain�a� larger� sample�size�and�carry�out� surveys� in�a� longer�
period� of� time.� In� addition,� the� research� model� includes� only� �ve� independent� variables�
consisting�of�merchandise,�price,�physical�aspect,� supermarket�employee,�and� supermarket�
policies.�Future�studies�should�analyze�other�factors�and�build�up�a�research�model�to�analyze�
unsatis�ed�characteristics�of�supermarkets.�Moreover,�this�study�uses�Cronbach’s�Alpha,�EFA�
and�multiple�linear�regression�method�to�test�these�hypotheses�related�to�the�reliability�and�
validity�of�the�model,�multicollinearity�phenomenon.�More�applicable�and�practical�analysis�
methods�such�as�structural�equation�modeling�(SEM)�should�be�applied.
References
Angelova,� B.� and� Zekiri,� J.� (2011),� “Measuring� customer� satisfaction� with� service� quality� using�
american� customer� satisfaction�model� (ACSI�Model)”,� ,QWHUQDWLRQD�� -RXUQD�� RI� �FDGHPLF�
Research�in�Business�and�Social�Sciences��9������1������SS������������
Azhar,�A.R.,� Salehuddin,�M.Z,� Saiful,� B.,� Faeez,�M.,� Syaquif,�M.� and� Kamaruddin,�Y.B.� (2013),�
“Customer� satisfaction�with� hypermarket� fresh� food’s� characteristics”,�-RXUQD�� RI��RXULVP��
Hospitality,�and�Culinary�Arts��9������1������SS����������
Beneke,� J.,�Hayworth,�C.,�Hobson,�R.�and�Mia,�Z.� (2012),� “Examining� the�e�ect�of� retail� service�
quality�dimensions�on�customer�satisfaction�and�loyalty:�the�case�of�the�supermarket�shopper”,�
�FWD�&RPPHUFLL��9�������1������SS����������
Bollen,�K.A.�(1989),�Structural�equations�with�latent�variables,�John�Wiley�and�Sons,�Inc.,�New�York.
Chu,�N.M.N.�and�Hoang,�T.�(2008),�Phan�tich�du�lieu�nghien�cuu�voi�SPSS�Tap�1�va�2�����J�����
Publisher,�Ha�Noi.

�2��1���2���1���1���21�����212������1����1�����1� �2������12�����
Chu,�N.M.N.�and�Phạm,�T.N.�(2013),�“Phan�tich�cac�nhan�to�tac�dong�toi�quyet�dinh�cho�kenh�sieu�thi�
mua�thuc�pham�tuoi�song�cua�nguoi�tieu�dung�Tp.�HCM”,�Tap�chi�Phat�trien�va�Hoi�nhap,�7DS�
10,�So�20,�tr.�46�-�51.
Coenders,�G.�and�O’Loughlin,�C.�(2002),�“Application�of�the�European�Customer�Satisfaction�Index�
to�postal�services.�Structural�equation�models�versus�partial�least�squares”,�Available�at�http://
www.udg.es/fcee/economia/n4.pdf�(Accessed�20�March,�2020).
Dabholkar,�P.A.,�Thorpe,�D.I.�and�Rentz,�J.O.�(1996),�“A�measure�of�service�quality�for�retail�stores:�
scale� development�and� validation”,� Journal� of� the�Academy�of�Marketing�Science��9��������
No.�3,�pp.�3�-�16.
Dang,�V.M.�(2019),�“A�study�of�determinants�of�supermarket�service�quality�-�The�case�of�Coopmart�
supermarket� in�Vietnam”,� -RXUQD�� RI��GYDQFHV� LQ�(FRQRPLFV� DQG��XVLQHVV��9���� �� 1��� ����
SS������������
Deloitte�Vietnam�Company�Limited.�(2020),�“Retail�in�Vietnam�report”,�Deloitte�Vietnam�Company�
�LPLWHG�� 9LHWQDP,� Available� at� https://www2.deloitte.com� /content/dam/Deloitte/vn/
Documents/consumer-business/vn-cb-vietnam-consumer-retail-2020-updated.pdf� (Accessed�
30�July,�2020).
Do,�K.C.�and�Nguyen,�L.T.�(2015),�“Su�lua�chon�cua�nguoi�mua�rau�tai�cho�và�sieu�thi�tren�dia�ban�
thanh�pho�Ha�Noi”,�Tap�chi�Khoa�hoc�và�Phat�trien��7DS�������������������������
Euro�Asian�research�experts.�(2018),�“Vietnam�retail�report”,�Available�at�https://www.slideshare.net/
hoangduy203/vietnam-retail-report�(Accessed�30�March,�2020).
General�Statistics�O�ce�of�Vietnam.�(2018),�“Dien�tich,�dan�so�va�mat�do�dan�so�phan�theo�dia�phuong�
2018”,�Available�at�gso.gov.vn�(Accessed�27�March,�2020).
Gonzalez-Benito,�O.,�Martinez-Ruiz,�M.P.�and�Molla-Descals,�A.� (2010),� “Retail�pricing�decisions�
and� product� category� competitive� structure”,�Decision� Support� Systems� Journal�� 9���� ����
1������SS������������
Hansemark,�O.C.�and�Albinsson,�M.�(2004),�“Customer�satisfaction�and�retention:�the�experiences�of�
individual�employees”,��DQDJLQJ��HUYLFH�4XD�LW���DQ�,QWHUQDWLRQD��-RXUQD���9�������1������
SS����������
Huyen,�N.T.T.�(2020),�“The�e�ect�of�brand�image,�perceived�quality�and�brand�experience�on�customer�
loyalty:�an�empirical�investigation�in�the�telecommunication�industry�in�Vietnam”,�-RXUQD��RI�
,QWHUQDWLRQD��(FRQRPLFV�DQG��DQDJHPHQW,�Vol.�20�No.�3,�pp.�60�-�74.
Jeevananda,�D.S.� (2011),� “A� study� on�customer� satisfaction� level�at� hypermarkets� in� Indian� retail�
industry”,�Research�Journal�of�Social�Science�and�Management��9������1������SS��������
Kotler,�P.�(2003),��DU�HWLQJ�PDQDJHPHQW,�Prentice-Hall�Publisher,�New�Jersey.
Le,�H.T.�(2019),�Chat�luong�dich�vu�ban�le�cua�mot�so�sieu�thi�kinh�doanh�tong�hop�tai�Ha�Noi,�Luan�
an�Tien�si�chuyen�nganh�Quan�tri�Kinh�doanh,�Hoc�vien�Khoa�hoc�Xa�hoi,�Vien�Han�lam�Khoa�
hoc�Xa�hoi�Viet�Nam.
Lewis,�B.� and�Spyrakopoulos,� S.� (2001),� “Banking;� consumer�attitudes;� customer� service;� service�
quality;�customer�satisfaction”,�,QWHUQDWLRQD��-RXUQD��RI��DQ���DU�HWLQJ��9��������SS����������
Mehta,� S.C.,�Lalwani,�A.K.� and�Han,�S.L.� (2000),� “Service�quality� in� retailing:� relative� e�ciency�
of�alternative�measurement�scales�for�di�erent�product‐service�environments”,�,QWHUQDWLRQD��
Journal�of�Retail�&�Distribution�Management,�Vol.�28�No.�2,�pp.�62�-�72.
�2��1���2���1���1���21�����212������1����1�����1��2������12��� ��
Nguyen,�D.T.�(2011),�Phuong�phap�nghien�cuu�khoa�hoc�trong�kinh�doanh,�Nha�xuat�ban�Lao�dong�–�
Xa�hoi,�Thanh�pho�Ha�Noi.
Nguyen,�D.T.� and�Nguyen,�T.M.T� (2009),�Nghien�cuu� thi�truong,�Nha�xuat�ban�Dai�hoc�Quoc�gia�
7�D���S����������0�����7�D���S����������0����
Nguyen,�T.H.,�Nguyen,�H.M.,�Phan,�C.A.�and�Matsui,�Y.�(2014),�“The�relationship�between�service�
quality� and� customer� loyalty� in� specialty� supermarket� -� Empirical� evidence� in� Vietnam”,�
International�Journal�of�Business�and�Economics�Research,�Vol.�3�No.�5,�pp.�178�-�186.
Nguyen,� T.M.H.� and�Nguyen,� P.T.� (2015),� “Factors� a�ecting� the� consumer� decision� on� choosing�
a� supermarket� for�purchasing� fresh� food� in�Hue� city”,�+XH��QLYHUVLW�� -RXUQD��RI� �FLHQFH���
9��������1�������SS����������
Nguyen,�T.M.T.�(2005),�“Chat�luong�dich�vu,�su�thoa�man,�va�long�trung�thanh�cua�khach�hang�sieu�thi�
tai�Tp.�HCM”,�Tap�chi�Phat�trien�Khoa�hoc�và�Cong�nghe��7DS������������������������
Nguyen,� T.T.T� (2016),� “Factors� in�uencing� customer� satisfaction� towards� supermarkets� in� Thai�
Nguyen�City,�Viet�Nam”,�,QWHUQDWLRQD��-RXUQD��RI�(FRQRPLFV��&RPPHUFH�DQG��DQDJHPHQW��
Vol.�2�No.�4,�pp.�464�-�474.
Rana,� S.M.S.,� Osman,�A.� and� Islam,� M.A.� (2014),� “Customer� satisfaction� of� retail� chain� stores:�
evidence�from�Bangladesh”,�Journal�of�Asian�Scienti�c�Research,�9������1�������SS������������
Tabachnick,�B.G.�and�Fidell,�L.S.�(2001),��VLQJ�PX�WLYDULDWH�VWDWLVWLFV,�Harper�Collins,�New�York.
Tse,�D.K.�and�Wilton,�P.C.�(1988),�“Models�of�consumer�satisfaction�formation:�an�extension”,�-RXUQD��
of�Marketing�Research,�9�������1������SS������������
Tuoi�Tre�Newspaper.� (2019),�“Auchan�chinh� thuc� roi�VN,�Saigon�Co.op� tiep�quan�18�sieu� thi�cua�
nha�ban�le�Phap”,�Available�at�https://tuoitre.vn/auchan-chinh-thuc-roi-vn-saigon-co-op-tiep-
quan-18-sieu-thi-cua-nha-ban-le-phap-20190627221442647.htm�(Accessed�29�March,�2020).
Vu,�T.H.,�Pham,�T.T.�and�Nguyen,�T.H.P.�(2018),�“Cac�nha�to�tac�dong�den�quyet�dinh�chon�kenh�sieu�
thi�khi�mua�rau�qua�cua�khach�hang�tai�Thanh�pho�Nha�Trang”,�Tap�chi�Phat�trien�Khoa�hoc�va�
Cong�nghe,�Chuyen�san�Kinh�te�–�Luat�va�Quan�ly��7DS����������������������
Weerasiri,�R.A.S.�(2015),�“A�study�on�service�quality�and�customer�satisfaction�of�supermarkets�in�Sri�
Lanka,�Sri�Lanka”,�-RXUQD��RI��DU�HWLQJ,�Vol.�1�No.�2,�pp.�36�-�46.