Achieving a Sustainable Water Future for Ho Chi Minh ... - CORE
154
Achieving a Sustainable Water Future for Ho Chi Minh City, Vietnam A thesis submitted in fulfillment of the requirements for the degree of Master of Engineering Xuyen H. Ho B.Eng. School of Civil, Environmental and Chemical Engineering Science, Engineering and Technology Portfolio RMIT University March 2006 brought to you by CORE View metadata, citation and similar papers at core.ac.uk provided by RMIT Research Repository
-
Upload
khangminh22 -
Category
Documents
-
view
1 -
download
0
Transcript of Achieving a Sustainable Water Future for Ho Chi Minh ... - CORE

Achieving a Sustainable Water Future for Ho Chi Minh City, Vietnam
A thesis submitted in fulfillment of the requirements for the degree of Master of Engineering
Xuyen H. Ho B.Eng.
School of Civil, Environmental and Chemical Engineering Science, Engineering and Technology Portfolio
RMIT University March 2006
brought to you by COREView metadata, citation and similar papers at core.ac.uk
provided by RMIT Research Repository
Declaration I certify that except where due acknowledgement has been made, the work is that of the author alone; the work has not been submitted previously, in whole or in part, to qualify for any other academic award; the content of the thesis is the result of work which has been carried out since the official commencement date of the approved research program; and, any editorial work, paid or unpaid, carried out by a third party is acknowledged.
Xuyen H. Ho 30 March 2006
i
Abstract
Ho Chi Minh City (HCMC), the largest city in Vietnam, there has more than 7 million
inhabitants. The water supply system for HCMC originated during the time Vietnam was still
a French colony. The economy has grown dramatically in HCMC since Vietnam initiated
economic reform in 1986. Recent rapid urban and industrial growth in HCMC is characterized
by an increase in investment, production, employment, migrant population and income.
However rapid economic growth has given rise to a mounting water problem with increased
demand for reticulated water supply. Water shortages have been seriously exacerbated by
population increases and the degradation of water supply infrastructure.
Due to pressures of increasing population and the developing economy, the future security of
water supply situation is far from satisfactory. There is pressure to provide secure water
supply now and in the future at minimum cost to the consumers. There is also pressure to
connect a large number of customers currently not connected to the HCMC water supply
reticulation grid. Current water resources management tends to be fragmented and focused
purely on the supply side management. It is not economically and environmentally sustainable
to focus purely on increasing supply to meet increasing demand. It is important to strike a
balance between demand side management and supply augmentation as water availability is
finite in quantity and vulnerable to climate variability (drought) and climate change.
Sustainable water resources management requires a broader, more systematic and holistic
approach. Therefore a comprehensive forward looking water supply management strategy is
required for the City to ensure adequate and safe water supply to residents, industry and other
consumers in the urban area of HCMC.
The main objective of the research is to conduct an in-depth study of the barriers to
sustainable resource utilisation together with relevant mitigation measures to ensure
sustainable use of water supply infrastructure. The study will also investigate the current
water demand and supply balance for residential, commercial and industrial; and propose a
balanced strategy to meet the HCMC’s demand until year 2020.
The current water supply situation in HCMC is reviewed, in particular the water supply
situation and the demand. The demand from industries, businesses and households surpass as
the current supply distribution capacity with the problem going to be exacerbated in the future
with ever increasing demand for water. Furthermore, currently there are a significant number
of potential consumers within Districts remaining unconnected to the HCMC water
ii
distribution networks. Currently the HCMC water supply network covers only 67% of the
population and the HCMC Government plans to increase the coverage to 80% by year 2020.
The unaccounted water from the ageing infrastructure is a major concern with plans proposed
to reduce losses from the current 33% to 20 % by year 2020.
Government’s plans to improve current and future water management issues are examined in
the context of two case studies, one from Australia (a developed country) and one from the
Philippines (developing country). The sustainable water management approaches adopted by
these two case studies sit at either end of the spectrum of options. One is closer to a
centralized government planning model and the other is a more radical privatisation flavoured
model.
Two contrasting strategies have been adopted by Government in Victoria, Australia and in the
Philippines to ensure efficient and sustainable water resources provision for Melbourne and
Manila respectively. The Water Resources Strategy developed for Melbourne relied
principally on community education, financial incentives to adopt water efficient appliances,
tariff reform, promoting the use of alternative resources such as storm-water and recycled
water and traditional augmentations such as extracting more water from streams where there
is surplus to environmental requirements to deliver a sustainable water future. The Manila
experience was significantly different. The Philippine Government decided to follow a
privatisation model for water that had been successfully adopted for the power sector. In a
country where there is high competition for capital money sometimes there is every incentive
to privatise utilities to ensure adequate customer service. The Manila experience falls in to
this category. The Manila model has had limited success in delivering the Government’s
expectations. Based on experiences from the two case studies, it is planned to propose a
blended (or a highbred) approach be adopted for HCMC where water conservation plays a
pivotal part in securing a sustainable water future.
Similar to the Melbourne study water conservation was introduced as demand side
management. Demand side management initiatives include reducing water consumption by
introducing pay for use, introducing tariff reform, providing incentives, implementing water
conservation programs underpinned by regulation and educating the community in proper
water management and the value of conserving water. The amount of water savings are
calculated by implementing a suite of water conservation initiatives prioritised using a triple
bottom line (environmental, social and economical) model.
It is proposed introduce water saving fixtures in houses, commercial buildings and industries
to reduce water demand substantially by year 2020. By Government regulating for
iii
compulsory fitting of AAA rated shower heads, front loading or other water efficient washing
machines and dual flush toilets, it is anticipated to save 9%, 4% and 9% respectively of the
total residential water use by year 2020. Based on the literature it is also assumed 20% of the
water use could be saved from commercial buildings such as hotels, schools, hospitals and
office buildings. Industrial water use also could be reduced by 20% if proper incentives for
water recycling are introduced and conservation methods promoted.
Based on the trend in current population increase and continued water use practices (with no
demand management), the water demand in HCMC in year 2020 was estimated to be 3300
ML/day. However, if proper water conservation strategies are implemented, the water demand
could be reduced to 2637 ML/day, a 20% reduction. Based on the Government’s water supply
expansion plans, a supply of 2990 ML/day is planned for year 2020. The initiatives proposed
in the thesis will substantially narrow the gap between the planned supply and actual demand,
thus providing a reasonable supply securing for the community.
There is still a small shortfall between supply and demand. Given uncertainty in forecasting
population and industrial demand, this shortfall is considered acceptable. If the water supply
and water conservation targets are met, the HCMC Water Supply Company will be able to
provide a sustainable water future for the customers of HCMC. This is to be complemented
by independent regulation and where suitable, local water authorities contracting out works to
the private sector where they can provide superior services. However, once the operating rules
and governance arrangements have been established, there should be minimum political
interference so that the model could operate efficiently and deliver expected performance (and
service) goals at a minimum or affordable cost to the community.
iv
Acknowledgements
I would like to express my appreciation to everyone who has helped me during the different
stages of this Master Thesis. Many people have contributed, however certain individuals
deserve special recognition.
Dr. Nira Jayasuriya, my supervisor, who has provided me with great deal of valuable input
and insight throughout my research. I appreciate her encouragement, thought-provoking
conversations and guidance.
Michael Waters, who was my supervisor from August 2003 to July 2004, has helped me to
shape the ideas of my research. Unfortunately he was not able to guide me throughout since
he resigned from RMIT University.
Atlantic Philosophies Foundation for financing the study.
In Vietnam I am in great debt to my Vietnamese local supervisor Prof. Lam Minh Triet,
Director of CEFINA. Despite his busy schedule he had time to meet with me and give
important comments on my work.
Great thanks to Mr. Vy, HCMC Water Supply Company, who provided me with valuable
information and help during my data collection stage.
Finally I would like to thank my parents and my girlfriend for the continuing support they
provided throughout the study. Though they may never be able read what I have produced,
this thesis remains a testament for all what we have gone through together during the past few
years and many sacrifices made by all for the sake of advancing knowledge.

v
TABLE OF CONTENTS 1. INTRODUCTION ................................................................................................................1
1.1. BACKGROUND TO THE STUDY ............................................................................1
1.2. PROJECT OBJECTIVES.............................................................................................3
1.3. THESIS OUTLINE ......................................................................................................3
2. OVERVIEW OF WATER SUPPLY IN HO CHI MINH CITY ..........................................4
2.1 BRIEF INTRODUCTION TO VIETNAM AND HO CHI MINH CITY ...................4
2.1.1. Country Description .........................................................................................4
2.1.2. Brief Description about Ho Chi Minh City ......................................................4
2.2 WATER RESOURCES IN VIETNAM .......................................................................8
2.2.1. Surface Water ...................................................................................................8
2.2.2. Groundwater .....................................................................................................9
2.3 WATER SOURCES IN HO CHI MINH CITY .........................................................12
2.3.1. Surface Water .................................................................................................13
2.3.2. Groundwater ...................................................................................................13
2.3.3. Western Canal Water......................................................................................14
2.4 WATER SUPPLY SITUATION IN HO CHI MINH CITY......................................15
2.4.1. The Thu Duc Waterworks ..............................................................................16
2.4.2. Binh An BOT Waterworks .............................................................................16
2.4.3. The Saigon River Water Supply – Phase 1.....................................................17
2.4.4. Groundwater ...................................................................................................17
2.4.5. Water Quality Issues in HCMC......................................................................18
2.5 MANAGEMENT STRUCTURE...............................................................................20
2.5.1. Market Structure .............................................................................................20
2.5.2. HCMC WSC Structure ...................................................................................20
2.5.3. Governmental Restructuring ..........................................................................20
2.6 WATER STAKEHOLDERS AND CONSUMERS ..................................................22
2.7 QUANTITATIVE WATER SUPPLY SUSTAINABILITY ISSUES .......................23
2.8 SUMMARY FINDINGS............................................................................................27
3. PRIVATE SECTOR PARTICIPATION IN SUPPLYING WATER TO HCMC .............28
3.1. INTRODUCTION TO PRIVATE SECTOR PARTICIPATION ..............................28
3.1.1. Should HCMC be interested in Private Participation in Water ......................30
3.1.2 The Advantages of Private Water Providers ..................................................30
3.1.3 The Disadvantages of Private Water Providers..............................................32
vi
3.1.4 Difficulties Facing by the Private Water Providers........................................33
3.2 EXAMPLES OF PRIVATE WATER PROVIDER PARTICIPATION IN HCMC..34
3.2.1 Barriers in Private Investment in Vietnam .....................................................38
3.2.2 Issues Facing BOT Schemes ..........................................................................38
3.3 DELIVERING WATER SERVICE AT LOCAL LEVEL: PHUONG MODEL.......39
3.3.1 Responsibilities of a Phuong ..........................................................................40
3.3.2 Advantages of a Phuong Model .....................................................................40
3.3.3 A case study of the Phuong Model.................................................................41
3.4 POLICY RECOMMENDATIONS ............................................................................43
3.4.1 Market Reform ...............................................................................................43
3.4.2 Financial Discipline........................................................................................44
3.4.3 Regulatory Reform .........................................................................................45
3.4.4. Ownership Reform .........................................................................................46
3.5 DISCUSSION AND RECOMMENDATIONS .........................................................47
4. INTERNATIONAL EXPERIENCE...................................................................................51
4.1. WATER RESOURCES STRATEGY FOR MELBOURNE AUSTRALIA..............51
4.1.1 Melbourne’s Current Water Use.....................................................................52
4.1.2 Residential Use ...............................................................................................52
4.1.3 Industrial and Commercial Water Use ...........................................................53
4.1.4 Non-Revenue Water (NRW) ..........................................................................54
4.1.5 Future options for Melbourne’s Water Use....................................................55
4.2. PHILIPPINES WATER PRIVATISATION..............................................................63
4.2.1 Introduction ....................................................................................................63
4.2.2 Privatisation Model ........................................................................................65
4.2.3 Concession Agreement and Regulatory Structure..........................................65
4.2.4 Performance of Concessionaire after Privatisation ........................................66
4.2.5 Philippine Water Privatisation........................................................................70
4.3. SUMMARY ...............................................................................................................72
5. WATER SUSTAINABILITY ............................................................................................75
5.1 WATER DEMAND IN HO CHI MINH CITY..........................................................75
5.1.1. Residential People ..........................................................................................75
5.1.2. Water Demand for Commercial Users ...........................................................80
5.1.3. Industrial Water Demand................................................................................83
5.1.4. Non Revenue Water........................................................................................84
vii
5.1.5. Total Water Demand ......................................................................................88
5.2. WATER SUPPLY CAPACITY IN HO CHI MINH CITY .......................................91
5.3. DEMAND MANAGEMENT APPROACH ..............................................................94
5.3.1. Concept...........................................................................................................94
5.3.2. Advantages of Demand Management Approach............................................95
5.3.3. Disadvantages of Supply Side Management Approach .................................96
5.3.4. Discussion on Supply and Demand Management ..........................................97
5.4. DEMAND MANAGEMENT APPROACH IN HCMC ............................................98
6. DEMAND MANAGEMENT OPTIONS OF WATER IN HCMC....................................99
6.1. WATER SAVING MEASURES IN RESIDENTIAL AND NON RESIDENT
PEOPLE..............................................................................................................................99
6.1.1. Education......................................................................................................100
6.1.2. Reducing Demand through Pricing Changes................................................101
6.1.3. Water Tariff in Ho Chi Minh City................................................................102
6.1.4. Reducing Demand through Incentives .........................................................105
6.1.5. Reducing Demand through Regulations.......................................................106
6.2. WATER SAVING IN COMMERCIAL AREAS ....................................................111
6.2.1. Water Saving in Hotel Industry ....................................................................113
6.2.2. Water Saving in Hospital..............................................................................115
6.2.3. Water Saving in Schools ..............................................................................117
6.2.4. Water Savings from Commercial Buildings by Non residents of HCMC ...117
6.2.5. Water Savings from Commercial Buildings by residents of HCMC ...........117
6.3. WATER SAVING MEASURES IN INDUSTRIAL ZONES .................................118
6.4. RAIN WATER HARVESTING IN HO CHI MINH CITY.....................................119
6.4.1. Rain Water Harvesting .................................................................................119
6.4.2. Is There a Need for Rain Water Harvesting (RWH) ....................................120
6.4.3. Economic of RWH .......................................................................................121
6.4.4. Social Issues of RWH...................................................................................122
6.4.5. Technical Factors..........................................................................................122
6.4.6. Health Risks..................................................................................................123
6.4.7. Volume of Rainwater Collected ...................................................................123
6.5. TOTAL WATER SAVING IN HO CHI MINH CITY............................................125
6.6. CONCLUSIONS ......................................................................................................128
viii
7. CONCLUSIONS AND RECOMMENDATIONS ...........................................................130
7.1. CONCLUSIONS ......................................................................................................130
7.1.1. Water Resources - Current ...........................................................................130
7.1.2. Water Resources - Future .............................................................................130
7.1.3. Water Tariff ..................................................................................................131
7.1.4. Water Stakeholders in HCMC......................................................................131
7.1.5. Private Water Providers................................................................................131
7.1.6. Case Studies from Melbourne and Manila for Sustainable Water Future....131
7.1.7. Demand in HCMC........................................................................................132
7.1.8. Water Conservation Measures......................................................................133
7.2. RECOMMENDATIONS .........................................................................................133
BIBLIOGRAPHY ..................................................................................................................136
ix
List of Tables
Table 2-1: Description of HCMC and water supply districts.....................................................7
Table 2-2: Major rives in Vietnam .............................................................................................9
Table 2-3: Water sources and peak capacities in HCMC.........................................................12
Table 2-4: Water supply in HCMC ..........................................................................................16
Table 2-5: Groundwater in HCMC...........................................................................................17
Table 2-6: Water stakeholders in HCMC.................................................................................25
Table 2-7: Water supply sustainability issues in HCM ............................................................26
Table 3-1: Main options for private sector participation..........................................................30
Table 4-1: Water Price Scheme in Melbourne .........................................................................59
Table 4-2: Winner consortia for the privatisation ....................................................................64
Table 4-3: Water service obligations........................................................................................66
Table 4-4: Manila water rates through different periods..........................................................67
Table 4-5: Maynilad water rates through different periods......................................................67
Table 5-1: Forecasted residential population in HCMC until year 2020 .................................79
Table 5-2: Water supply goals set out by HCMC government in year 2020 ...........................81
Table 5-3: Demand calculation for residential people..............................................................81
Table 5-4: Prediction of water demand for commercial users by HCMC residents.................82
Table 5-5: Prediction of water demand for commercial users by non-resident people............82
Table 5-6: Prediction of water demand for commercial users..................................................83
Table 5-7: Water demand for industry use ...............................................................................83
Table 5-8: Non revenue water targets in HCMC in 2020.........................................................88
Table 5-9: Prediction of water demand in HCMC to 2020 ......................................................89
Table 5-10: Expected water supply capacity in HCMC until 2020..........................................92
Table 5-11: Comparison between DMA and traditional approaches .......................................96
Table 6-1: Current water tariff in HCMC...............................................................................103
Table 6-2: Water and energy consumption of top and front load washer ..............................108
Table 6-3: Typical water distribution in hotels ......................................................................114
Table 6-4: Summary of water usage per person per day ........................................................114
Table 6-5: Water savings by harvesting water from a roof size of 54.1 m2 ...........................124
Table 6-6: Water demand in HCMC after water saving measures implemented in 2020......126
x
List of Figures
Figure 2-1: Map of Vietnam and neighbouring countries ..........................................................5
Figure 2-2: Map of Ho Chi Minh City and water supply districts .............................................6
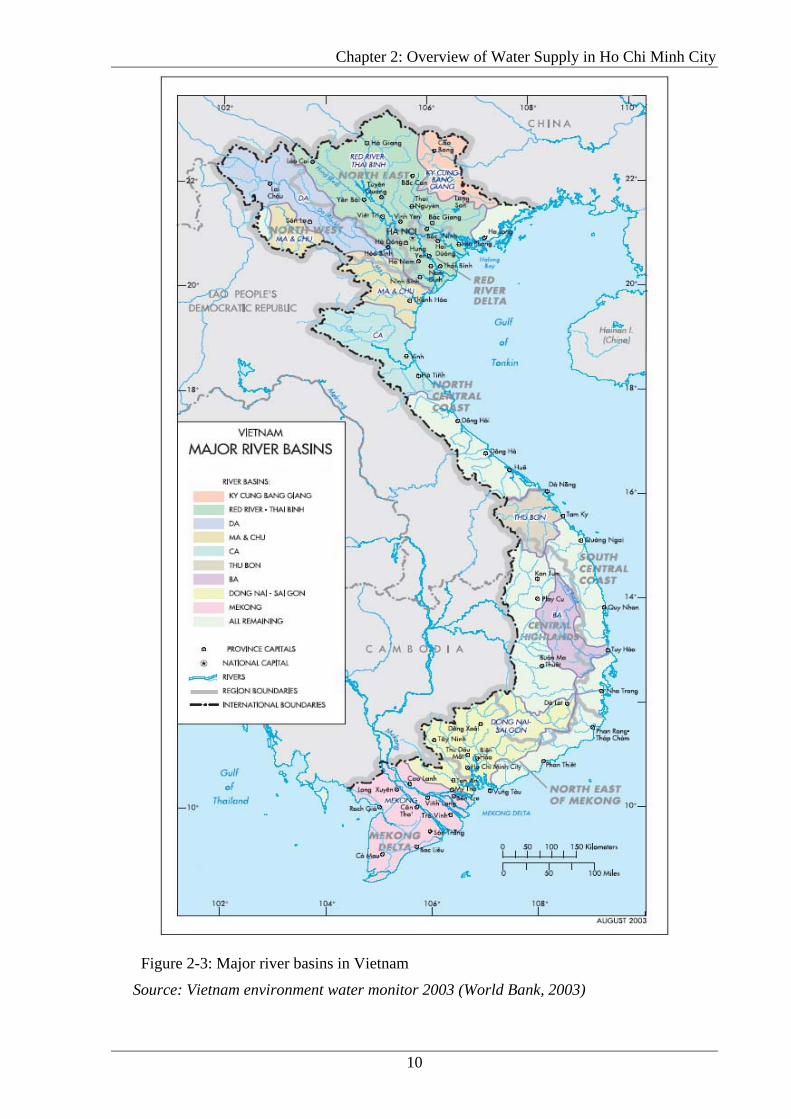
Figure 2-3: Major river basins in Vietnam ...............................................................................10
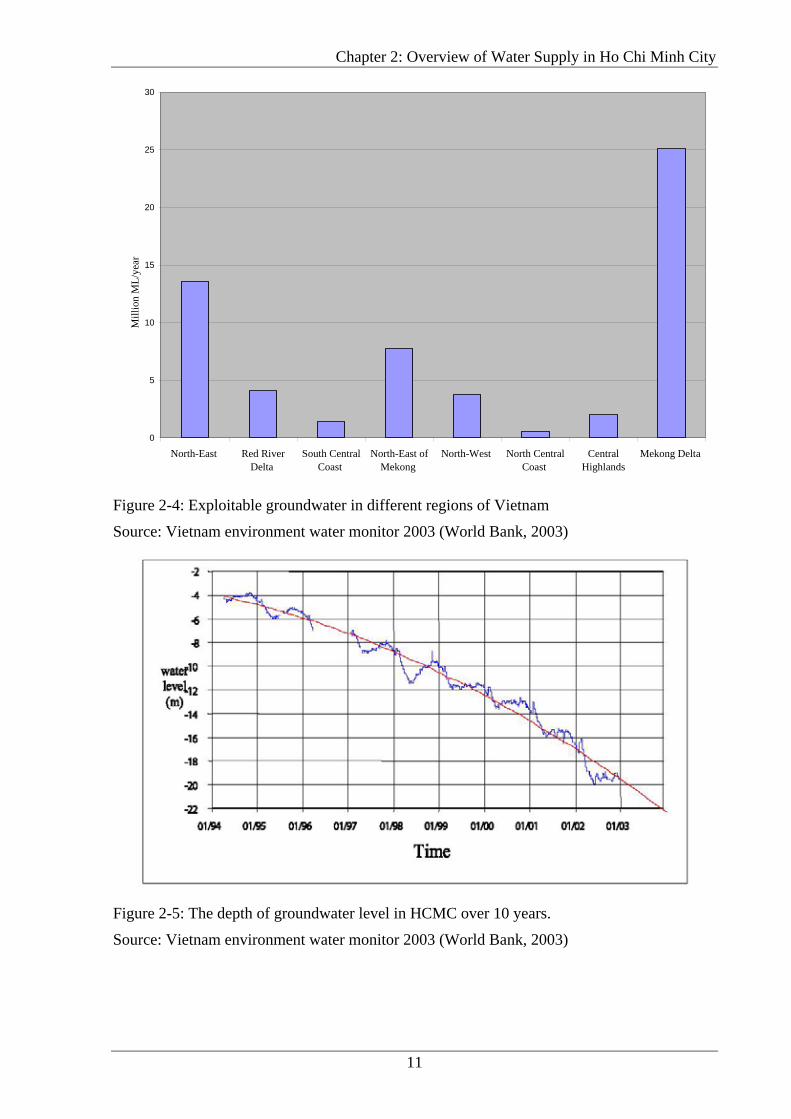
Figure 2-4: Exploitable groundwater in different regions of Vietnam.....................................11
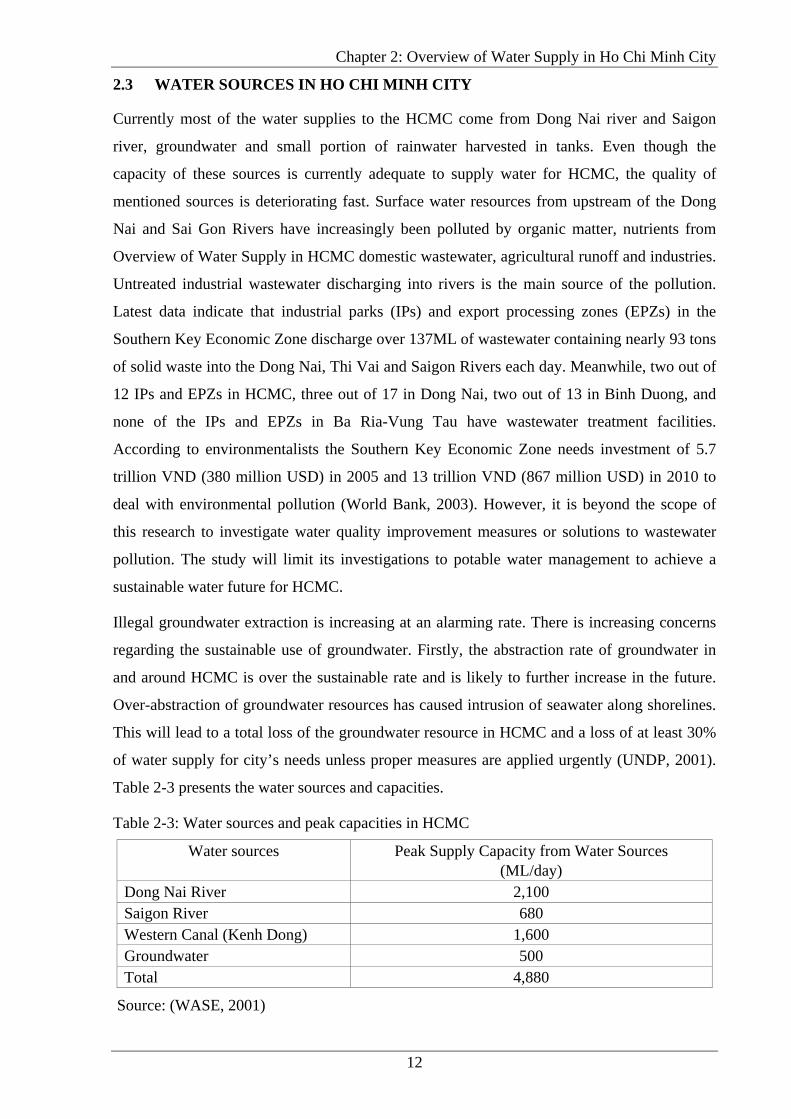
Figure 2-5: The depth of groundwater level in HCMC over 10 years. ....................................11
Figure 2-6: Major water sources and treatment plants in HCMC ............................................14
Figure 4-1: Percentage of portal water use in Melbourne ........................................................52
Figure 4-2: Average residential water use................................................................................53
Figure 4-3: Commercial and industrial use of water in Melbourne .........................................54
Figure 4-4: Water reduction options.........................................................................................56
Figure 5-1: Map of different areas served by HCMC WSC.....................................................78
Figure 5-2: Trend of population growth in HCMC ..................................................................79
Figure 5-3: Percentage of different water uses in HCMC........................................................89
Figure 5-4: Total water demand prediction in HCMC until 2020............................................90
Figure 5-5: Water supply and demand in 2020 (Projected)......................................................93
Figure 5-6: Deferment of augment works due to DMA ...........................................................96
Figure 6-1: Residential water uses patterns in Melbourne .......................................................99
Figure 6-2: Sydney water: water distribution in hotel guest rooms .......................................115
Figure 6-3: Hotel guest room water usage data calculated from residential figures ..............115
Figure 6-4: Breakdown of the water usage in a hospital (ICI program).................................116

xi
Abbreviations
ADB Asia Development Bank
BOT Build, Operate, Transfer
BOD Biological Oxygen Demand
DTPW Department of Transportation and Public Works
EPZs Export Processing Zones
GDP Gross Domestic Product
GSO General Statistical Office
HCMC Ho Chi Minh City
IFC International Finance Corporation
IPs Industrial Parks
MARD Ministry of Agriculture and Rural Development (Bo NN&PT NN)
MOSTE Ministry of Science, Technology and Environment
MPI Ministry of Planning and Investment
NRW Non Revenue Water
ODA Official Development Assistance
PC People’s Committee
PPI Potential Private Investor
TCVN Vietnamese Standards
UNDP United Nations Development Programme
USAID United States Agency for International Development
VND Vietnamese Dong, 1USD = 15700 VND
WB World Bank
WHO World Health Organization
WSC Water Supply Company
$A Australian Dollar

Chapter 1: Introduction
1
1. INTRODUCTION
1.1. BACKGROUND TO THE STUDY
Water is the most common substance on earth, but 97% of it is unfit for human use. Of the
remaining 3% two thirds are locked up in glaciers and snow. That would leave 1% available
for human consumption (Serageldin, 1995). This residual amount should be enough to satisfy
the needs of all water consumers in the world, but it is not. Two big hindrances are that the
water is often not found in the right location and its non-availability when its most required
due to seasonality. Our mismanagement and waste of the available water resources has
complicated matters further. Humanbeings could hardly do anything to overcome the first
hindrance. However, with suitable and sensible water management we can rectify the second.
Vietnam adopted economic reforms and open-door policies in 1986 and since then it has
made considerable development progress. Statistics indicate that there is an annual growth of
Vietnam’s Gross Domestic Product (GDP) by 7.2% growth over the past two decades (GSO,
2006). Ho Chi Minh City (HCMC), the largest city in Vietnam is not exempted from this
rapid development. To the contrary as the commercial capital, it has been the engine of
growth in Vietnam. However, HCMC is currently suffering from severe water supply
shortage and water pollution. It is hampering not only its future growth but also affecting
Vietnam’s commercial growth.
With rapid economic growth, the increase in urban population and the improvement of living
standards, there has been an ever-increasing demand for water in the HCMC. The population
of HCMC is now predominantly urban. It is not surprising to find that this rate of rapid
growth in the urban population is having serious negative consequences for the environment,
in general, and in particular for water resources. With the development of HCMC as the
commercial capital, the population has grown rapidly. With affluence, more people are
expecting higher levels of services from water authorities. This growth in the urban
population has made HCMC increasingly important as users and consumers of water. Despite
the increase in the importance of urban water uses, the ways that institutional structures
manage water resources and water authorities provide efficient services have not been
accordingly improved to solve the current water management issues. To the contrary, the
existing institutional systems due to over-centralization, bureaucratic inefficiencies and lack
of financial capital tend to act as obstacles to effective urban water management. Many
institutions, in fact, passively allow the problems to accumulate and fail to create
opportunities to develop solutions. The imbalance between water supply and demand has
Chapter 1: Introduction
2
become increasingly pronounced, and the estimated water shortage will reach embarrassing
proportions in the near future. Rapid economic growth in HCMC brought immeasurable
benefits for citizens not only in and around the HCMC but to Vietnam. On the other hand, it
has also caused significant environmental damage. HCMC is currently facing serious
degradation of surface and groundwater resources threatening public health and hampering
socio-economic development. HCMC is struggling to protect the surface water of Saigon and
Dong Nai river systems from being severely polluted. In addition, groundwater is seriously
polluted in the region from industrial wastewater, unsupervised well abstractions and septic
tank construction and seepage from leaking sewage pipelines.
To solve these water problems, HCMC has embarked on many water projects. In the last
decade, HCMC has undertaken numerous efforts to supply more water by commissioning
projects such as the Binh An Build-Operate-Transfer (BOT) project and Saigon River Water
Supply Phase 1. It is expected that such efforts will alleviate water shortages and abate water
pollution in the short term. However, there is a concern that if the management approach is
not changed, and current institutional and policy frameworks not revised, the benefits
recouped from the projects and the investments might not be sustainable. Problems associated
with effective water resources management such as efficient water use, guidance for pollution
prevention, water infrastructure funding and pricing policies, and coordination among all
parties involved in water management are significant. There have been attempts to change the
approach to water management through incorporating more participants (stakeholder
engagement) into the management decision-making process with limited success. This thesis
will critically review the state of urban water management in HCMC, discuss the process of
institutional reforms currently underway and propose a sustainable water resources
management framework to achieve better outcomes.
Current water resources management in HCMC tends to be fragmented and focused purely on
supply side management. It is not economically and environmentally sustainable to focus
purely on increase supply to meet increasing demand. It is important to strike a balance
between demand side management and supply augmentation as water availability is finite in
quantity and vulnerable to climate change. Therefore a comprehensive forward looking water
supply management strategy which incorporates demand side management is also required for
the City to ensure adequate and safe water supply to residents, industry and other consumers
in the urban area of HCMC.

Chapter 1: Introduction
3
1.2. PROJECT OBJECTIVES
The main objective of the research is to analyze the current performance of the urban water
sector in HCMC and to develop a robust water resources planning framework to achieve a
financially, socially and environmentally sustainable water future. This will be carried out by:
• Reviewing the current and future water supply situation in HCMC in particularly the
supply limits and demand for water;
• Examining two contrasting models adopted for managing urban water resources in
Melbourne Australia and Manila, Philippines;
• Investigating Government’s current policy on water supply and its improvement plans;
• Recommending water conservation measures to reduce demand for water by year 2020
and analyzing to examined the achieved targets of water saving; and
• Proposing a comprehensive water resources management framework for HCMC.
1.3. THESIS OUTLINE
The thesis starts with an overview of water resources and management in the HCMC. Chapter
2 describes the status of water supply and water demand in HCMC and discusses the
problems with water resources management and policies. Current plans to improve water
resources in HCMC are mentioned and Chapter 4 presents two case studies relevant to future
water resources management in Melbourne and Manila. Chapters 5 and 6 discuss possible
options to secure water supply for HCMC to year 2020. Conclusions and recommendations
including approaches other than traditional supply augmentation drawn from the study will be
presented in Chapter 7.
Chapter 2: Overview of Water Supply in Ho Chi Minh City
4
2. OVERVIEW OF WATER SUPPLY IN HO CHI MINH CITY
2.1 BRIEF INTRODUCTION TO VIETNAM AND HO CHI MINH CITY
2.1.1. Country Description
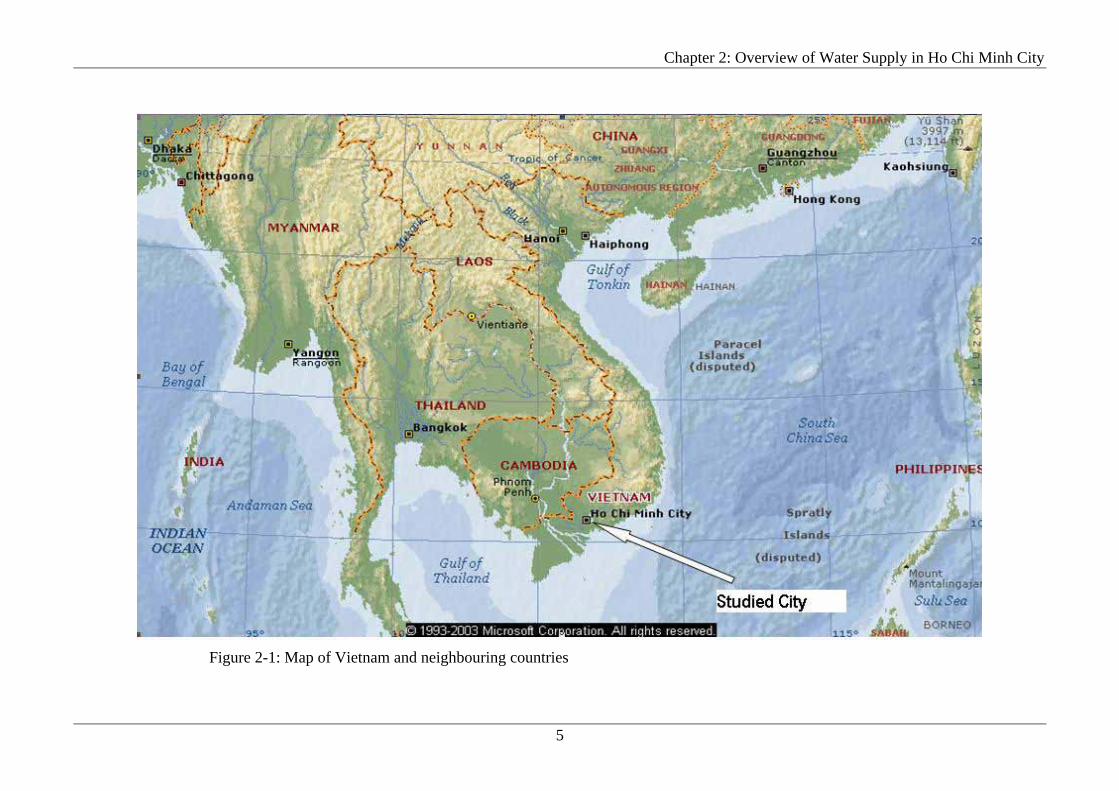
Vietnam is located in the heart of South East Asia. The country is among the most populous
nations in South East Asia. The population in 2005 was estimated to be 81 millions (GSO,
2006). The Socialist Republic of Vietnam is located on the eastern coast of the Indochinese
Peninsula. It is bordered on the north by China, on the west by Laos and Cambodia, and on
the south and east by the South China Sea (Figure 2-1). Hanoi is the capital and Ho Chi Minh
City (formerly Saigon) is the largest city and the commercial capital.
2.1.2. Brief Description about Ho Chi Minh City
The Ho Chi Minh City (HCMC) metropolitan area covers 2,356 km2 (Encarta, 2004) and is
the largest city in Vietnam with very rapid economic growth. HCMC takes pride in being an
industrial, commercial, scientific and services center of the Southern region, contributing up
to 37% of the national GDP yearly (GSO, 2006).
The rural districts make up more than 90% of the total land area and extend from the
Cambodian border in the west to the East Sea at the mouth of the Saigon River in the east.
There are 22 Districts in HCMC. Out of these, 4 are surrounding districts, and 5 are suburban
districts with predominant rural characteristics such as farming, fishing and cultivating land.
There are approximately 1.7 million people living in these districts, accounting to 32% of the
HCMC population (GSO, 2006).
The suburban farm land is planned to provide living places for the rapid urban redevelopment,
where inner citizens will gradually move out together with the relocation of industries to the
City periphery. This helps to ease the congested city centre area and reduce pollution caused
by shanty towns. In practice, uncontrolled growth has taken place as the attraction of
urbanization has drawn rural people from neighbouring and other provinces to HCMC for
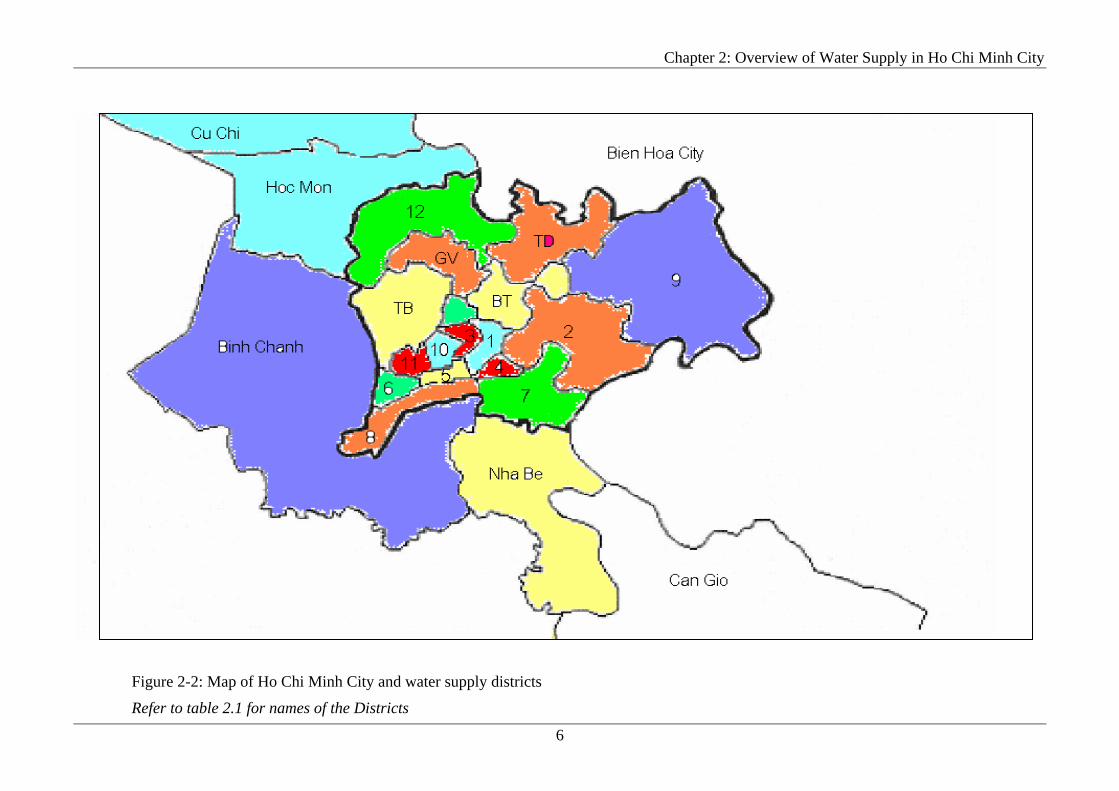
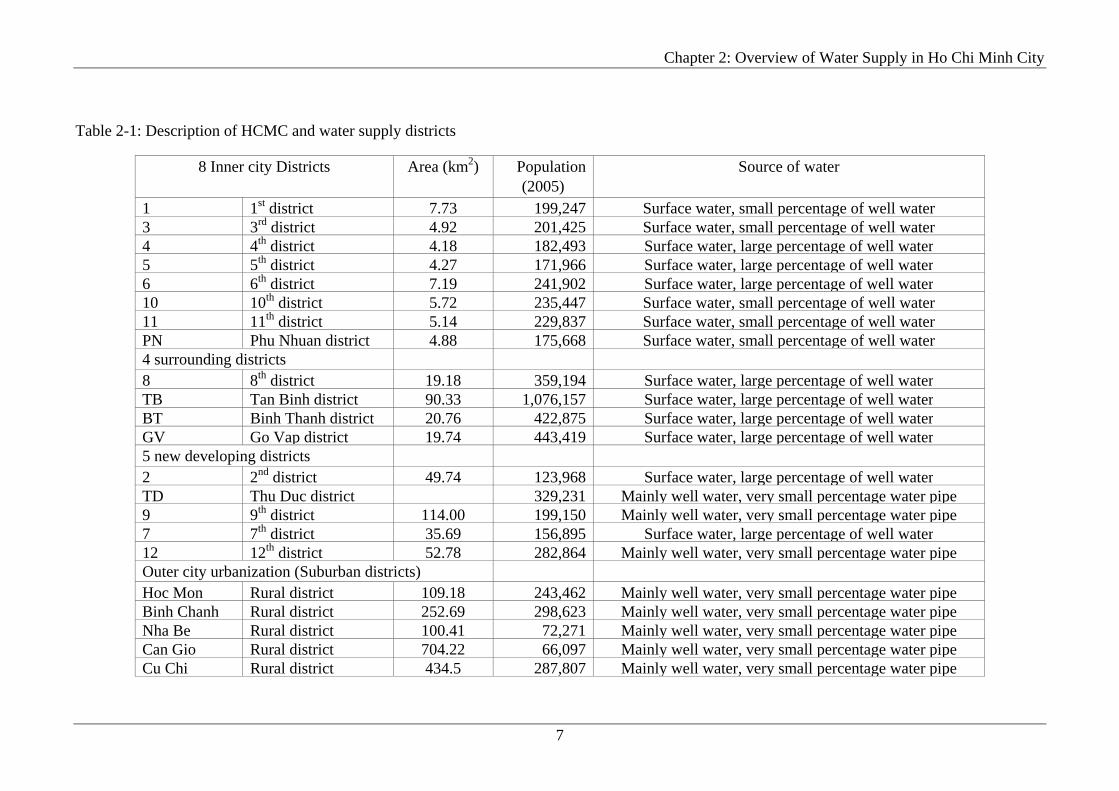
employment. The map of HCMC and Districts are presented in Figure 2-2 and Table 2-1
respectively.
Chapter 2: Overview of Water Supply in Ho Chi Minh City
5
Figure 2-1: Map of Vietnam and neighbouring countries
Chapter 2: Overview of Water Supply in Ho Chi Minh City
6
Figure 2-2: Map of Ho Chi Minh City and water supply districts
Refer to table 2.1 for names of the Districts
Chapter 2: Overview of Water Supply in Ho Chi Minh City
7
Table 2-1: Description of HCMC and water supply districts
8 Inner city Districts Area (km2) Population(2005)
Source of water
1 1st district 7.73 199,247 Surface water, small percentage of well water3 3rd district 4.92 201,425 Surface water, small percentage of well water4 4th district 4.18 182,493 Surface water, large percentage of well water5 5th district 4.27 171,966 Surface water, large percentage of well water6 6th district 7.19 241,902 Surface water, large percentage of well water10 10th district 5.72 235,447 Surface water, small percentage of well water11 11th district 5.14 229,837 Surface water, small percentage of well waterPN Phu Nhuan district 4.88 175,668 Surface water, small percentage of well water4 surrounding districts 8 8th district 19.18 359,194 Surface water, large percentage of well waterTB Tan Binh district 90.33 1,076,157 Surface water, large percentage of well waterBT Binh Thanh district 20.76 422,875 Surface water, large percentage of well waterGV Go Vap district 19.74 443,419 Surface water, large percentage of well water5 new developing districts 2 2nd district 49.74 123,968 Surface water, large percentage of well waterTD Thu Duc district 329,231 Mainly well water, very small percentage water pipe9 9th district 114.00 199,150 Mainly well water, very small percentage water pipe7 7th district 35.69 156,895 Surface water, large percentage of well water12 12th district 52.78 282,864 Mainly well water, very small percentage water pipeOuter city urbanization (Suburban districts) Hoc Mon Rural district 109.18 243,462 Mainly well water, very small percentage water pipeBinh Chanh Rural district 252.69 298,623 Mainly well water, very small percentage water pipeNha Be Rural district 100.41 72,271 Mainly well water, very small percentage water pipeCan Gio Rural district 704.22 66,097 Mainly well water, very small percentage water pipeCu Chi Rural district 434.5 287,807 Mainly well water, very small percentage water pipe
Chapter 2: Overview of Water Supply in Ho Chi Minh City
8
2.2 WATER RESOURCES IN VIETNAM
Networks of rivers, favorable topography and advantageous rainfall patterns support the thesis
that Vietnam has plenty of water available for consumptive use. Having a total surface water
capacity of over 2360 rivers and lakes estimated at 8.5x10⁵ GL and a population of 81
million, there are 11 ML per capita available per year. According to world standards, Vietnam
ranks in the middle in terms of water resources available with the world average of 10 ML per
capita per year (UNESCO, 2005). However, as the estimated population in Vietnam reaches
90 million by year 2020, Vietnam will be at the threshold of nations with a shortage of water.
Another factor affecting Vietnam’s water resource is that it comes from neighbouring
countries. Vietnam is located downstream of nine international rivers and has to share water
with surrounding nations such as the China, Myanmar, Thailand, Lao and Cambodia
(Microsoft Encarta, 2004). Accordingly, water resource is materially affected by the water use
of upstream nations. About two thirds of Vietnam’s water resources originate from
catchments in surrounding countries therefore Vietnam is susceptible to water resource
decisions made in upstream countries. This susceptibility is exacerbated by the highly
variable seasonal weather (droughts in the dry season and flooding in the monsoons) and
geographical distribution of water.
2.2.1. Surface Water
Vietnam has a dense river network with 2360 rivers having a length of more than 10 km each.
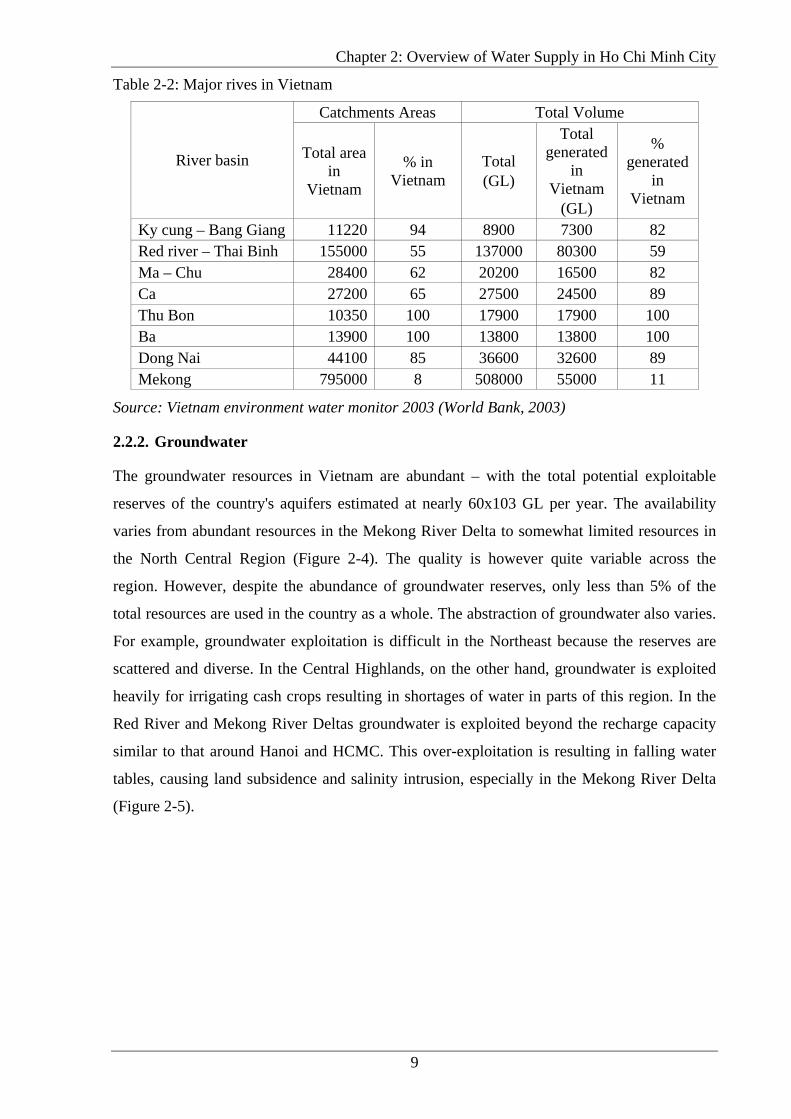
Eight out of these are large basins with a catchments area of 10,000 km2 or more (Table 2-2).
The rivers flowing through Vietnam include many international rivers. The total area in and
outside Vietnam of all international catchments is close to 1.2 million km2, which is
approximately 3 times the size of Vietnam itself. The total annual runoff is 835 billion m3 but
the shortage of water is aggravated in the 6-7 month dry season, when the runoff is only 15%
to 30% of this total (World Bank, 2002). Surface water can be classified into three categories:
i) runoff, ii) usable resources, iii) actual withdrawals. In terms of runoff, Vietnam has
abundant water resources. However, because of spatial variability, inadequate infrastructure
and financial limitations only a small portion can be utilized. Some studies suggest that only
one third of the total discharge is usable water (World Bank, 1999). Currently the withdrawal
is about 6% of the total runoff.
Chapter 2: Overview of Water Supply in Ho Chi Minh City
9
Table 2-2: Major rives in Vietnam
Catchments Areas Total Volume
River basin Total area in
Vietnam
% in Vietnam
Total (GL)
Total generated
in Vietnam
(GL)
% generated
in Vietnam
Ky cung – Bang Giang 11220 94 8900 7300 82 Red river – Thai Binh 155000 55 137000 80300 59 Ma – Chu 28400 62 20200 16500 82 Ca 27200 65 27500 24500 89 Thu Bon 10350 100 17900 17900 100 Ba 13900 100 13800 13800 100 Dong Nai 44100 85 36600 32600 89 Mekong 795000 8 508000 55000 11
Source: Vietnam environment water monitor 2003 (World Bank, 2003)
2.2.2. Groundwater
The groundwater resources in Vietnam are abundant – with the total potential exploitable
reserves of the country's aquifers estimated at nearly 60x103 GL per year. The availability
varies from abundant resources in the Mekong River Delta to somewhat limited resources in
the North Central Region (Figure 2-4). The quality is however quite variable across the
region. However, despite the abundance of groundwater reserves, only less than 5% of the
total resources are used in the country as a whole. The abstraction of groundwater also varies.
For example, groundwater exploitation is difficult in the Northeast because the reserves are
scattered and diverse. In the Central Highlands, on the other hand, groundwater is exploited
heavily for irrigating cash crops resulting in shortages of water in parts of this region. In the
Red River and Mekong River Deltas groundwater is exploited beyond the recharge capacity
similar to that around Hanoi and HCMC. This over-exploitation is resulting in falling water
tables, causing land subsidence and salinity intrusion, especially in the Mekong River Delta
(Figure 2-5).
Chapter 2: Overview of Water Supply in Ho Chi Minh City
10
Figure 2-3: Major river basins in Vietnam
Source: Vietnam environment water monitor 2003 (World Bank, 2003)
Chapter 2: Overview of Water Supply in Ho Chi Minh City
11
0
5
10
15
20
25
30
North-East Red RiverDelta
South CentralCoast
North-East ofMekong
North-West North CentralCoast
CentralHighlands
Mekong Delta
Mill
ion
ML/
year
Figure 2-4: Exploitable groundwater in different regions of Vietnam
Source: Vietnam environment water monitor 2003 (World Bank, 2003)
Figure 2-5: The depth of groundwater level in HCMC over 10 years.
Source: Vietnam environment water monitor 2003 (World Bank, 2003)
Chapter 2: Overview of Water Supply in Ho Chi Minh City
12
2.3 WATER SOURCES IN HO CHI MINH CITY
Currently most of the water supplies to the HCMC come from Dong Nai river and Saigon
river, groundwater and small portion of rainwater harvested in tanks. Even though the
capacity of these sources is currently adequate to supply water for HCMC, the quality of
mentioned sources is deteriorating fast. Surface water resources from upstream of the Dong
Nai and Sai Gon Rivers have increasingly been polluted by organic matter, nutrients from
Overview of Water Supply in HCMC domestic wastewater, agricultural runoff and industries.
Untreated industrial wastewater discharging into rivers is the main source of the pollution.
Latest data indicate that industrial parks (IPs) and export processing zones (EPZs) in the
Southern Key Economic Zone discharge over 137ML of wastewater containing nearly 93 tons
of solid waste into the Dong Nai, Thi Vai and Saigon Rivers each day. Meanwhile, two out of
12 IPs and EPZs in HCMC, three out of 17 in Dong Nai, two out of 13 in Binh Duong, and
none of the IPs and EPZs in Ba Ria-Vung Tau have wastewater treatment facilities.
According to environmentalists the Southern Key Economic Zone needs investment of 5.7
trillion VND (380 million USD) in 2005 and 13 trillion VND (867 million USD) in 2010 to
deal with environmental pollution (World Bank, 2003). However, it is beyond the scope of
this research to investigate water quality improvement measures or solutions to wastewater
pollution. The study will limit its investigations to potable water management to achieve a
sustainable water future for HCMC.
Illegal groundwater extraction is increasing at an alarming rate. There is increasing concerns
regarding the sustainable use of groundwater. Firstly, the abstraction rate of groundwater in
and around HCMC is over the sustainable rate and is likely to further increase in the future.
Over-abstraction of groundwater resources has caused intrusion of seawater along shorelines.
This will lead to a total loss of the groundwater resource in HCMC and a loss of at least 30%
of water supply for city’s needs unless proper measures are applied urgently (UNDP, 2001).
Table 2-3 presents the water sources and capacities.
Table 2-3: Water sources and peak capacities in HCMC
Water sources Peak Supply Capacity from Water Sources (ML/day)
Dong Nai River 2,100 Saigon River 680 Western Canal (Kenh Dong) 1,600 Groundwater 500 Total 4,880
Source: (WASE, 2001)
Chapter 2: Overview of Water Supply in Ho Chi Minh City
13
2.3.1. Surface Water
Surface water sources supply for HCMC come from two major rivers in the southern
Vietnam: The Dong Nai and Sai Gon Rivers as shown in Figure 2-6.
Dong Nai River rises from the Lang Biang Highland at height 1,700m and runs via Lam
Dong, Dong Nai, Binh Duong, HCMC. Dong Nai River is a 653 km long large river. The
Dong Nai River basin has an area of 40,683 km2 and total flow volume of 30.6x10³ GL/year
which comprises several river basins namely La Nga, Be, Saigon, Vam Co Dong and Vam Co
Tay (Talaue-McManus, 2000). The Dong Nai River has a minimum flow of approximately
105 L/s. It originates from the central highlands of Vietnam and flows through Dong Nai and
HCMC with tributaries from other provinces. Forests cover approximately 30% of the basin.
The upstream area in the lowland part of the river is the present Cat Tien National Park. The
Tri An reservoir and hydropower plant is located downstream nearby. Further downstream of
the river it is joined at the Nha Be area of HCMC by the Saigon River. Inside the city a
hydrological network of five canals acts as the natural water drainage: Nhieu Loc – Thi Nghe
(9 km), Tau Hu – Kinh Doi – Kinh Te (19.5 km), Ben Nghe (5.9 km), Tan Hoa – Ong Buong
– Lo Gom (7.2 km), and Tham Luong – Ben Cat – Vam Thuat (14 km). Before finally
reaching the sea, the Dong Nai river passes through a coastal mangrove forested delta area
with many interconnecting riverlets. This Can Gio area is the “green lungs” of HCMC.
The Saigon River rises from Cambodia and runs via northwest mountains of Loc Ninh
District (Binh Phuoc Province) at 200-250m. Sai Gon River has a length of 256km and a
basin area of 5,560 km2. The section running via provincial territory from Dau Tieng to Lai
Thieu is 143km. The upstream is narrow, but at Dau Tieng section, the riverbed extends 100m
and at Thu Dau Mot Township it reaches 200m. Average water-current is 85m/s, the slope is
small - 0.7%, consequently the Sai Gon River is valuable for transportation, agriculture, aqua
products and ecological tourism.
2.3.2. Groundwater
Until the year 2000, HCMC Water Supply Company (HCMC WSC) did not carry out
investigations about groundwater abstractions. There are several aquifers in the HCMC where
groundwater is being extracted. The first aquifer, with its depth ranges from 2m – 20m has
poor water quality. There has been no data about the aquifer’s yield. However, people living
in the Can Gio suburban district are using private tube wells predominantly pumping
groundwater from this aquifer for drinking purposes. The HCMC WSC has estimated the
capacity to be 0.116 ML/day exploited from 61 shallow wells. The second aquifer (depth
ranging from 3m-72m) is distributed all over the city but the water quality is still poor at
Chapter 2: Overview of Water Supply in Ho Chi Minh City
14
Districts 6, 7, 8 and 2. Due to its quality, there has been no investigation on it in terms of
withdrawal rate and capacity. Water from this aquifer is mainly exploited by poor people
living in areas where water pipe connections are limited. The third aquifer (depth ranges from
20m – 138m) has a capacity of 0.691 to 3.024ML/day. However, this aquifer has problems
with salinity in the Can Gio area. The fourth aquifer (depth ranges from 8-142 meters) is
widely spread distributed out the city (WASE, 2001).
The total capacity of second, third and fourth aquifers is 2.5x10³ ML/day. Department of
Natural and Resources has estimated the number of wells to be nearly 96,000 mainly
exploiting water from the 2nd aquifer (78,752 wells) and 3rd aquifer (17,010 wells) (WASE,
2001). However the real number could be up to 200,000 wells (personal communication with
WSC personnel). The rural district people have moved away from using surface water or
water from shallow dug wells as sources for drinking water in favor of groundwater pumped
from individual private (family based) tube wells since the water network coverage is not
sufficient. Even worse, many factories also use large quantities of groundwater. To be precise,
the groundwater level has been lowered from 1.35 meters at District 12 in 1994 to 2.9 meters
in 1999 due to excessive pumping (WASE, 2001).
2.3.3. Western Canal Water
Water from the Western Canal (Kenh Dong), traditionally, has been used to irrigate 15,000 ha
of agricultural land in Cu Chi, but farming land there is dwindling as 4,000 ha of agricultural
land has now become industrial land. Kenh Dong Canal can supply 1,600 ML/day. This is
500 ML/day more than what is required for the irrigation of the surrounding agricultural land,
and the government officials believe it could be fully utilized by the city by sending an
additional 300 to 350 ML/day during the dry season.
Authorities in Vietnam's HCMC have agreed to allow the Kenh Dong Water Supply
Company to carry out the construction of the Kenh Dong water treatment plant that will
supply outlying area of the city after 2007. The project aims to serve as a backup supply
source to increase the clean water supply to 900 ML per day.
Chapter 2: Overview of Water Supply in Ho Chi Minh City
14
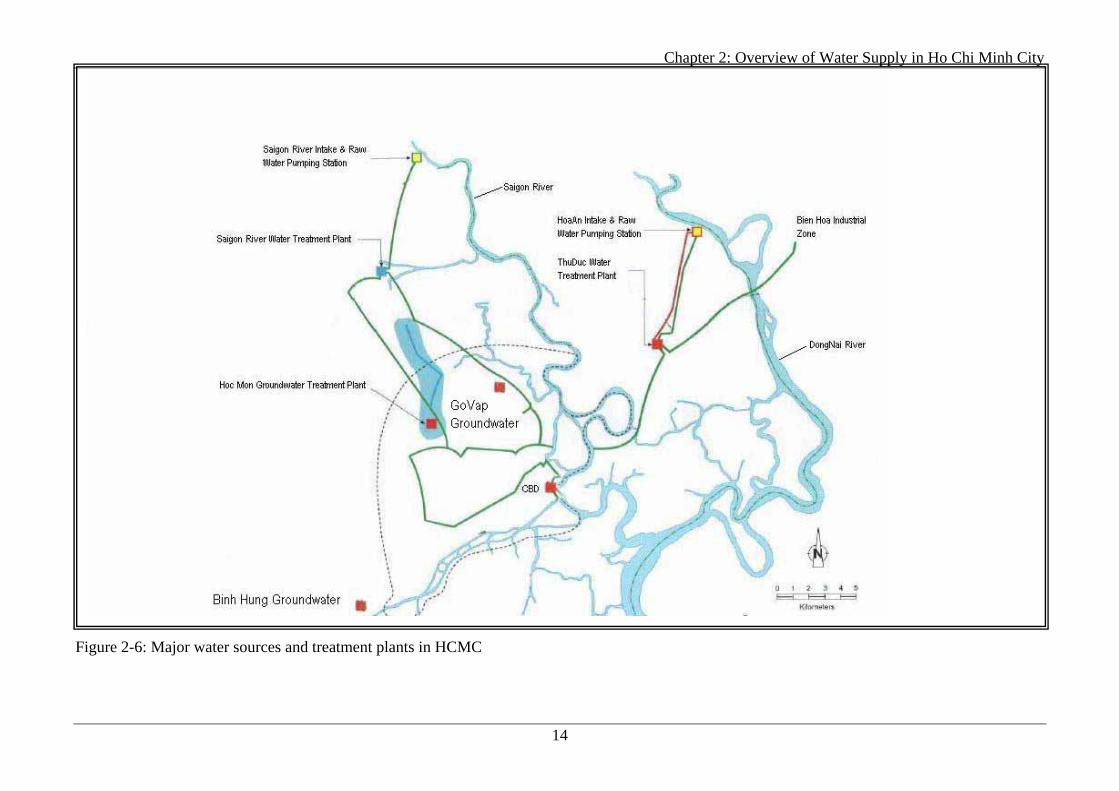
Figure 2-6: Major water sources and treatment plants in HCMC
Chapter 2: Overview of Water Supply in Ho Chi Minh City
15
2.4 WATER SUPPLY SITUATION IN HO CHI MINH CITY
In HCMC, the water infrastructure was built by the French dated back in 1879. The source of
water supply for the HCMC at that time was pumped from “the old well system” at the
current Tan Son Nhat International Airport. The first distribution network serviced mainly
District 1 and some parts of Districts 3 and 5. In 1962, these old wells produced as much as
160 ML/day (WASE, 2001). As groundwater pumping had to be increased to meet water
supply demands, salt water began to intrude into the upper aquifer of the city’s water wells.
As a result, the groundwater source as “the old wells system” serving HCMC was no longer
adequate due to a decline in the water level from overexploitation. Consequently, an
alternative source of water had to be used and the proposal of using water from Dong Nai
River which is about 20 km North of HCMC was studied. With the assistance of United
States Agency for International Development (USAID) the Saigon Water Supply Plant was
Overview of Water Supply in HCMC constructed at Thu Duc district, a district 8 km North of
HCMC, with the capacity of 480 ML/day and subsequently modified to increase the capacity
to 650 ML/day. The Thu Duc waterworks used sand-filtration to treat the surface water, as
such, it was expensive to build and maintain. Further expansions of the surface -water
treatment plant after 1975 have been limited due to the large capital expense required. After
several upgrading, the Thu Duc waterworks now has a capacity of 750 ML/day. A feasibility
study has recommended increasing the capacity of the Thu Duc Water Works to 1,000
ML/day (WASE, 2001).
To improve the water supply for South-Western districts of HCMC, such as Districts 6, 11
and Tan Binh, the uncontaminated groundwater wells were used as they offered more
economical sources of water supply. Hoc Mon groundwater works have been put into
operation with the capacity of 41 ML/day. “The existing old well system” is still in use as
backup supply in cases of emergency, drought or when the surface water treatment was
interrupted. Current water supply plants in HCMC and their capacities are given in Table 2.4.
HCMC needs about 1600 ML of water per day (personal communication with HCMC WSC
officials).
Chapter 2: Overview of Water Supply in Ho Chi Minh City
16
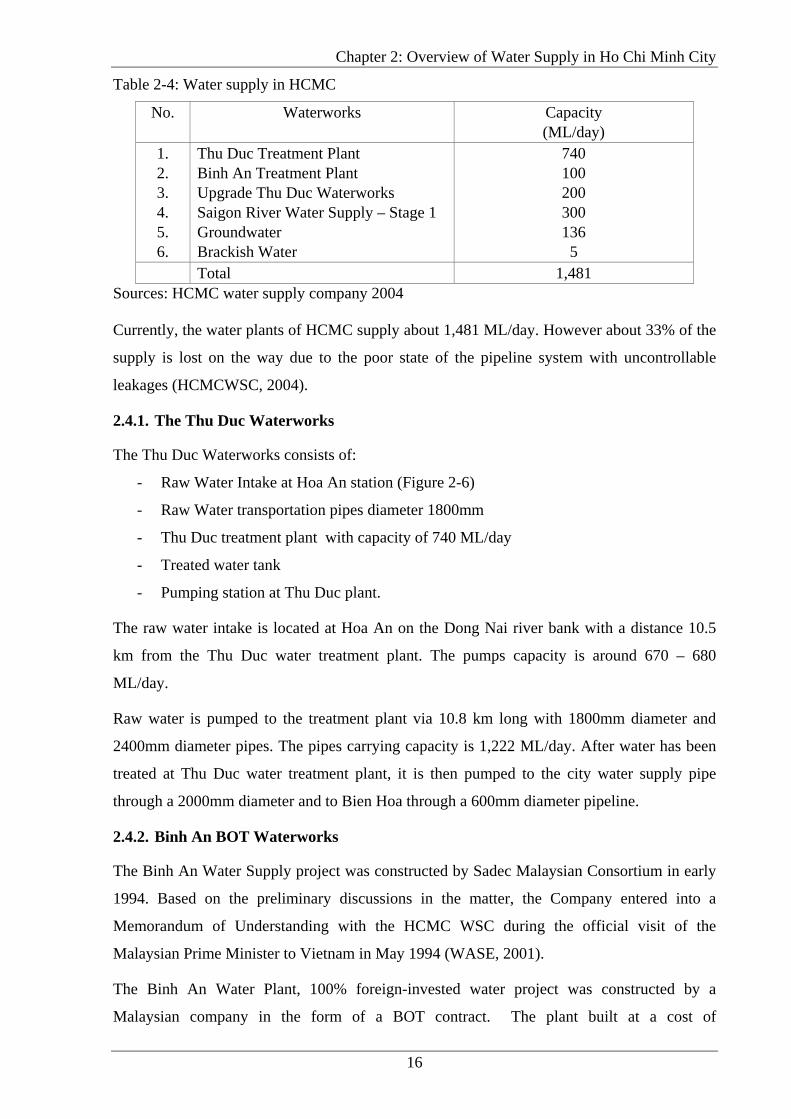
Table 2-4: Water supply in HCMC
No. Waterworks Capacity (ML/day)
1. 2. 3. 4. 5. 6.
Thu Duc Treatment Plant Binh An Treatment Plant Upgrade Thu Duc Waterworks Saigon River Water Supply – Stage 1 Groundwater Brackish Water
740 100 200 300 136 5
Total 1,481 Sources: HCMC water supply company 2004 Currently, the water plants of HCMC supply about 1,481 ML/day. However about 33% of the
supply is lost on the way due to the poor state of the pipeline system with uncontrollable
leakages (HCMCWSC, 2004).
2.4.1. The Thu Duc Waterworks
The Thu Duc Waterworks consists of:
- Raw Water Intake at Hoa An station (Figure 2-6)
- Raw Water transportation pipes diameter 1800mm
- Thu Duc treatment plant with capacity of 740 ML/day
- Treated water tank
- Pumping station at Thu Duc plant.
The raw water intake is located at Hoa An on the Dong Nai river bank with a distance 10.5
km from the Thu Duc water treatment plant. The pumps capacity is around 670 – 680
ML/day.
Raw water is pumped to the treatment plant via 10.8 km long with 1800mm diameter and
2400mm diameter pipes. The pipes carrying capacity is 1,222 ML/day. After water has been
treated at Thu Duc water treatment plant, it is then pumped to the city water supply pipe
through a 2000mm diameter and to Bien Hoa through a 600mm diameter pipeline.
2.4.2. Binh An BOT Waterworks
The Binh An Water Supply project was constructed by Sadec Malaysian Consortium in early
1994. Based on the preliminary discussions in the matter, the Company entered into a
Memorandum of Understanding with the HCMC WSC during the official visit of the
Malaysian Prime Minister to Vietnam in May 1994 (WASE, 2001).
The Binh An Water Plant, 100% foreign-invested water project was constructed by a
Malaysian company in the form of a BOT contract. The plant built at a cost of
Chapter 2: Overview of Water Supply in Ho Chi Minh City
17
US$35.8 million has a designed capacity of 100 ML/day of water per day. The Binh An water
treatment plant began supplying treated water to HCMC in August 1999. Vietnam’s first BOT
project supplied 85% of its 100 ML/day capacity to the State-owned Thu Duc Water Supply
Plan during its first year of operation. The project will contribute to reducing the shortage of
water. The private investor is expected to recover its capital investment within 12 years.
2.4.3. The Saigon River Water Supply – Phase 1
The Saigon River Water Supply, Stage 1 is a project for a new 300 ML/day water supply and
treatment system for HCMC, Vietnam. Water will be drawn from the Saigon River
approximately 23km north of HCMC, pumped approximately 9.2km via a 1500mm diameter
raw water pipeline to the Water Treatment Plant, and then pumped 11km via a 1500mm
diameter treated water main into the existing HCMC water distribution system. The raw water
pump station also comprises a small water treatment plant to supply water to the site and for
local use and a 21m tall water surge tower.
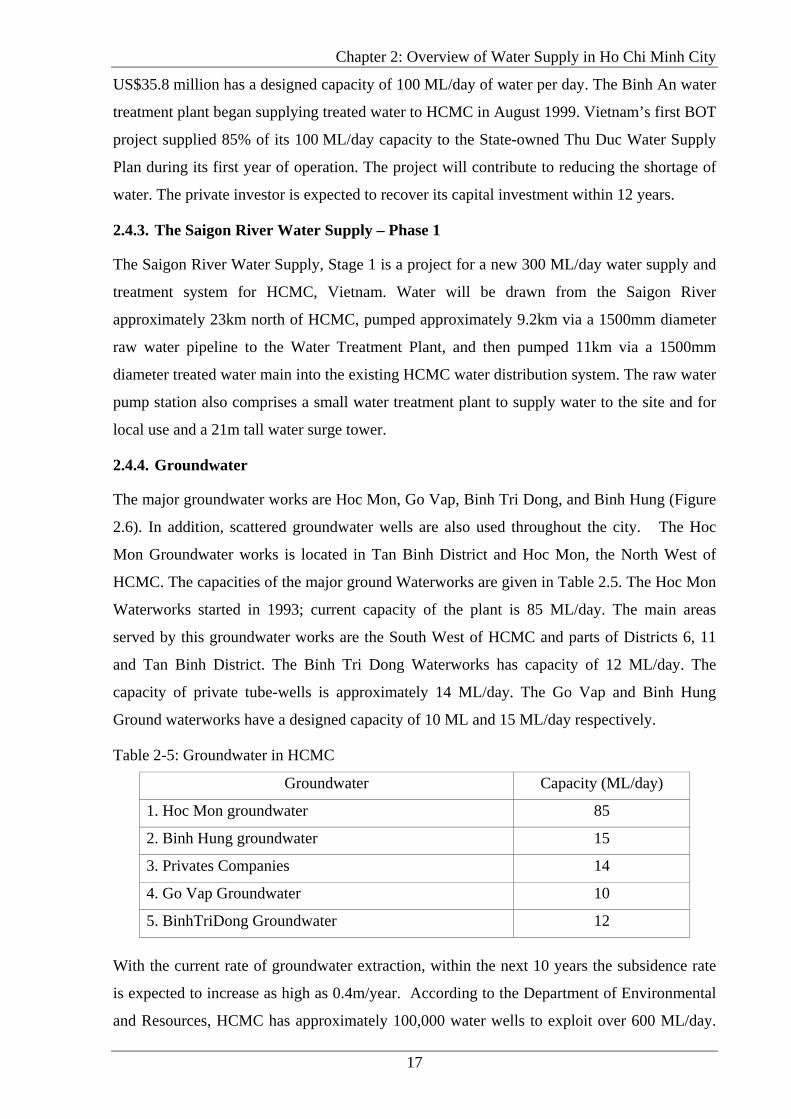
2.4.4. Groundwater
The major groundwater works are Hoc Mon, Go Vap, Binh Tri Dong, and Binh Hung (Figure
2.6). In addition, scattered groundwater wells are also used throughout the city. The Hoc
Mon Groundwater works is located in Tan Binh District and Hoc Mon, the North West of
HCMC. The capacities of the major ground Waterworks are given in Table 2.5. The Hoc Mon
Waterworks started in 1993; current capacity of the plant is 85 ML/day. The main areas
served by this groundwater works are the South West of HCMC and parts of Districts 6, 11
and Tan Binh District. The Binh Tri Dong Waterworks has capacity of 12 ML/day. The
capacity of private tube-wells is approximately 14 ML/day. The Go Vap and Binh Hung
Ground waterworks have a designed capacity of 10 ML and 15 ML/day respectively.
Table 2-5: Groundwater in HCMC
Groundwater Capacity (ML/day)
1. Hoc Mon groundwater 85
2. Binh Hung groundwater 15
3. Privates Companies 14
4. Go Vap Groundwater 10
5. BinhTriDong Groundwater 12
With the current rate of groundwater extraction, within the next 10 years the subsidence rate
is expected to increase as high as 0.4m/year. According to the Department of Environmental
and Resources, HCMC has approximately 100,000 water wells to exploit over 600 ML/day.
Chapter 2: Overview of Water Supply in Ho Chi Minh City
18
The over exploitation has resulted in the decrease of groundwater level from 0.2 to 4 meters
over the years. There has been evidence from households where people have to drill the wells
deeper to extract water. Moreover, house ground slabs subsidence is detected at many
households which are a sign of ground subsidence due to over exploitation of groundwater.
2.4.5. Water Quality Issues in HCMC
The increase in population, and rapid economic growth in recent years, after Doi Moi
(Renovation) Policy, have put a large and increasing stress on the water resources in HCMC.
The water quality in rivers and underground sources is highly degraded due to many sources
of pollution. The consequence of the lack of sewerage, the absence of sewage treatment and
uncontrolled storm water drainage is the primary cause polluting water bodies, including
surface water and groundwater aquifers. In spite of the quality of water generally in HCMC
about 5 ML/day of untreated water is consumed.
Ground water contamination
HCMC is located 45 km from the East Sea (Figure 2.1), superficial aquifers along the coastal
area are contaminated by the seepage of seawater and by the inland incursion of salty tidal
water, especially during the dry season from November to April every year. Contamination is
also originated from the leaching of saline sediments deposited during different Tertiary and
Quaternary transgressions. Some deep aquifers as well as some superficial ones have brackish
or salty water with variable Total Dissolved Solids (TDS) contents (Pham et al., 2002).
The issue of groundwater quality arises because the level of contamination recorded exceeds
generally accepted drinking water standards, and constitutes a risk for human health. A report
released by the department on 26 December 2003 announcing the results of analysis of
groundwater from 11 drilled wells in the city, shows that the water from 10 wells does not
meet requirements for portability standards because of microbial infestation (Tran, 2003). The
high level of arsenic concentrations found in the tube wells (48 and above 50µg/L and 20%
above 150µg/L) indicate that several million people consuming untreated groundwater might
be at a considerable risk of chronic arsenic poisoning (Berg et al., 2001). Agency has
proposed lowering the maximum contaminant level for arsenic in drinking water from 50µg/L
to 10µg/L but the feasibility of the proposed standard is currently being evaluated. The
European maximum admissible concentration and the World Health guideline for arsenic in
drinking water are both set at 10µg/L.
Chapter 2: Overview of Water Supply in Ho Chi Minh City
19
Surface water contamination
The main cause of the surface water pollution is a large number of industries located in
industrial zones around HCMC discharging uncontrolled industrial wastes into the rivers. In
addition to old industrial zones such as Bien Hoa, a large number of new industrial zones
were set up recently in the neighbouring provinces of Dong Nai and Binh Duong upstream of
the water treatment plant. These industrial zones were established to attract foreign
investment to set up factories to produce goods for domestic and export markets and to
generate employment.
The Bien Hoa industrial zone in Dong Nai province is located upstream of the HCMC. The
most concern is that the wastewater discharged from this zone to the Dong Nai River is near
the Hoa An pumping station (Thu Duc Waterworks) which supplies water to the residents of
HCMC. According to the data at HCMC official website (http://www.hochiminhcity.gov.vn),
HCMC currently has 25 industrial zones with a total of 611 factories on the area of 2298 ha
and 195 private factories. Altogether, it was estimated that about 550 ML/d of wastewater is
discharged into the Dong Nai-Saigon River from the industrial zones. Another source of
pollution in the Dong Nai-Saigon catchments and watershed is agricultural run-off from the
high usage of chemical and organic fertilizers and widespread use of pesticides.
While the sources of the industrial discharges are located mostly in the Thu Duc and Bien
Hoa areas, their discharges are eventually found scattered along the many canals in and
around HCMC. There are five main canal systems that receive direct wastes from various
sources. The total length of these canal systems is about 56 km with about 100 km from
smaller tributaries. Wastewater from private factories is discharged into the canal systems
daily and nearly all of these wastewater sources are not equipped with any wastewater
treatment facilities. Wastewater samples collected from about 100 food-processing plants
situated in and around the city area were analyzed by the Geographic and Geological Society
of HCMC, and the results showed that the biological oxygen demand (BOD) levels ranged
from 300 to 2800 mg/l which is 3 to 28 times above the Vietnamese standard (Vietnamese
code: TCVN 5945) (Nguyen et al., 2003). This is the standard for class C wastewater which
would be allowed to be discharged into the environment.
Health issues
It is obvious that an absence of adequate water in urban areas to maintain general hygiene
levels may lead to disease on a massive scale. Although the water sources in HCMC are
getting polluted, the people who are using water from WSC (tap water) are free from health
hazard because water has been treated to meet the health safety requirements. However, with
Chapter 2: Overview of Water Supply in Ho Chi Minh City
20
increased pollution of source water the treatment costs are raising daily. Concerns are for
those who do not have access to tap water or low-pressure areas and have to use water from
shallow wells and water taken directly from rivers. The problem flows largely from tube
wells which extract water from depths of between approximately 10 meters to 40 meters. Two
common diseases associated with deficient water are Faeco-oral and diarrhoeal diseases.
2.5 MANAGEMENT STRUCTURE
2.5.1. Market Structure
The water structure in Vietnam is highly decentralized. National ministries retain authority
over sector policy and approval of major projects, while the provincial People’s Committees
are responsible for water supply service in their respective jurisdictions. In the urban area
Water Supply Companies are established to operate and maintain piped water systems. Water
Supply Companies (WSC) is established as separate legal entities as per directives from
People’s Committees. However, most major decisions related to investments and tariff setting
are largely influenced by the People’s Committees. WSC’s company functions and
responsibilities are poorly defined and they do not enter into contracts with their customers.
There are two main sources of water providing raw water for the water supply system: surface
water (rivers, lakes and reservoirs) controlled by the Ministry of Agriculture and Rural
Development (MARD) and underground water again controlled by the MARD (except for
mineral water controlled by Ministry of Industry). All the water exploitation projects need
MARD approval. However, the Ministry of Planning and Investment (MPI) has overall
responsibility in approving water projects involving foreign and domestic investment and
submits projects to donors for funding and the Ministry of Construction (MOC) assumes a
primary role in the issue of construction approvals and management and implementation of
water projects. Water projects must also satisfy Vietnam’s environmental laws, standards and
regulations relating to construction and tendering.
2.5.2. HCMC WSC Structure
The main function of WSC is to manage all activities related to water provision, such as
operating and maintaining piped water systems and billing and collection. However, company
can carry out additional activities to either respond to a need or/and to undertake works
supplement the company’s revenue.
2.5.3. Governmental Restructuring
There is also a growing recognition that an efficient water infrastructure system is
fundamental to the future economic prosperity of HCMC. HCMC is seen as a regional
Chapter 2: Overview of Water Supply in Ho Chi Minh City
21
economic zone, it is therefore, in the process of planning for future private investment. Urban
development policies tend to encourage development around the periphery of the city. As a
consequence, sustainable water development becomes compromised instead focusing on
maintenance, repair and rehabilitation of existing infrastructure and providing with an
acceptable level of service to customers. There is an overemphasis in attracting new private
investors generating increased demands for water to meet predicted demands.
The government has been working on clear long term plan of supplying water to the
population. However, the WSC can not meet these policy objectives due to a lot of reasons
such as lack of financing and political will. The dysfunction in the present water policies can
be further seen from the subsidy policy for drinking water as it distributes water at lower
prices than the cost of production. This policy was intended to assist those who were
economically disadvantaged, but at present the policy mainly benefits individuals and
institutions, and industry officially connected to the water distribution system. The remaining
population depends on vended (or carted) water from neighbouring areas (or from private
sellers). These people pay much more than those connected to the WSC network for poor,
unreliable quality water.
The implication of policies and laws to address local water resource management issues in
HCMC has produced new tensions between different institutions as they adjust to change
regulations. Tensions are apparent between different ministries such as MARD and MOSTE,
and between national and local organizations such as the Central Government and the HCMC
WSC. Foreign investors and the Central Government are now forming unusual new alliances,
which exclude local institutions and sidestep the local role of the HCMC People Committee
(PC). This rescaling of state relations sees a reworking of governmental roles and increasing
jurisdictional tensions. These tensions cloud accountability and promote inefficiency.
The restrictive bureaucracy surrounding the HCMC WSC has also prevented effective project
implementation. This is partially a result of the rigid organizational structure in which the
HCMC WSC is embedded. The Project Management Unit (PMU) of the WSC is responsible
for the project management of all Official Development Assistance projects. The PMU
resides within the HCMC WSC which in turn is under the direction of the Department of
Transport and Urban Public Works (DTUPW) and the HCMC PC. Also governing the PMU
is the Project Implementation Coordination Committee (PICC) which consists of
representatives from HCMC PC, the DTUPW Deputy Director, Ministry of Construction, and
Ministry of Finance. Thus project proposals must go through several channels and hierarchal
layers in order to attain final approval from the Central Government and its Ministries in
Chapter 2: Overview of Water Supply in Ho Chi Minh City
22
Hanoi. Normally there are delays in the contracting process, construction work, and
disbursement due to conflicting understanding by the project of the valid period of the
effective loan, delays in designing or procedures related to surveys, appraisal and approval of
designs and biddings. A considerable amount of time was lost due to settlement of occasional
differences in government agencies’ opinions. The consulting team is limited on flexibility in
implementation, coordination and updating the data, causing delays due to designs irrelevant
to the real situation.
2.6 WATER STAKEHOLDERS AND CONSUMERS
A large number of organisations play important roles in determining the way HCMC’s water
supply system is managed. However, the roles these organisations play and the activities they
undertake are not well reported in the literature. Significant stakeholders include the HCMC
Water Supply Company, Asian Development Bank (ADB), World Bank, United Nations
Development Programme (UNDP), various government departments at city and national
level, water users (domestic and industrial), aid agencies of foreign governments and Non
Government Organisations (NGOs) as shown in Table 2.6 below. This creates a complex
situation, in which it is difficult to delineate responsibilities and where decision making may
be cumbersome or piecemeal as the interests of stakeholders are often in conflict. As outlined
below, these stakeholder organisations play roles as fund providers, governance/regulators,
implementation, customers/consumers and consumer advocates.
Foreign aid is often provided for the construction of water supply plants but aid agencies
generally seek to limit their involvement in development projects to a very limited degree and
periods of time. This causes conflicting interests between constructing and operating
stakeholders. When handed over for operation, there may be difficulties with financial
closure, both because of difficulties in maintenance and management and as the cost of
supplying the water is greater than the government’s pricing policy (Dry et al., 2000). These
maintenance and management issues apparently arise due to a lack of understanding by
foreign organisations of maintenance issues faced by water supply operators. It is not always
feasible to have foreign involvement in all water supply system projects. This means there is
often a need for local organisations to perform maintenance or expansion projects. At times
these projects are undertaken using a variety of equipment and tools available from local
sources due to a lack of availability of appropriate maintenance equipment from overseas.
The number of projects with private involvement is in decline and investment flows have
been slowing. The causes for this appear to be: the complex stakeholder situation a lack of
political support for private sector participation, a need for long-term debt financing, low
Chapter 2: Overview of Water Supply in Ho Chi Minh City
23
returns on investment, fragmented deal size and poor contract structuring (Borkey, 2003).
Currently the customers either serviced by the water company or the community yet to be
serviced by the industry seems to be alienated from the decision making bodies planning the
HCMC’s water future. The lack of integration will make future decision making complex and
difficult, especially implementing emotional issues such as price increases and tariff reform.
2.7 QUANTITATIVE WATER SUPPLY SUSTAINABILITY ISSUES
The HCMC Water Supply Company (HCMC WSC) sources most of its 1,481 ML/day water
from bulk surface water suppliers that extract from river off-takes in the Saigon-Dong Nai
river basin. The two present river off-takes are the Thu Duc Water works, located on the
Dong Nai river and the Ben Than Water works located on the Saigon river both upstream of
HCMC. The Thu Duc Water Works has a capacity of 740 ML/day. Raw water is obtained
from two sources, the Hoa An and the Binh An intake points, which both withdraw water
from the Dong Nai River. The Saigon River Waterworks has a capacity of 300 ML/day.
Water is drawn from the Dong canal system through the An Ha canal, which ultimately draws
water from the Saigon River.
Rarely does either the Thu Duc or Saigon River Waterworks operate at full capacity, because
as noted above, the HCMC WSC supply network is unable to supply more than 950 ML/day.
Although HCMC WSC is extracting approximately 1,481 ML/day (Table 2-4) but 33% of this
is lost due to leakage. This increase in water supply also requires upgrading and expansion of
the ageing distribution network.
Although HCMC is 50 km from the South China Sea, uncontaminated fresh water can be in
short supply in the final months of the dry season between February and April as surface
water systems can experience saline intrusions from the sea. Consequently, the “Old Tube
Well System” is still in use as a backup supply in times of emergency, drought, or when the
regular surface water treatment operations are interrupted. Care is required in sourcing water
from the old well system since some of the aquifers are saline due to both saline intrusions
from the river and as a result of natural leaching of saline sediments deposited during the
Tertiary and Quaternary periods (Pham et al., 2002).
Of the 5 aquifers in proximity to HCMC, 3 play important roles in supplying water for
HCMC, the Pleistocene aquifer located 20 to 50 m below the surface, the upper–Pliocene
aquifer located at 50 to 100 m depth and the lower and the Pliocene aquifer located at depths
of 100 to 140 m. The sustainable limit of 3 aquifers is about 500 ML/day (WASE, 2001).
Groundwater wells which are under WSC control is extracting 136 ML/day (Table 2-5),
Chapter 2: Overview of Water Supply in Ho Chi Minh City
24
however the amount including private household water wells estimated by WSC is over 600
ML/day.
There are a number of ways in which the sustainability of the water supply in HCMC is under
threat. While accepting maintaining the quality of supply is clearly a critical issue, the
research focuses only on aspects of quantitative supply in terms of source availability and the
capability of the water supply infrastructure to adequately provide a suitable quantity of water
to domestic , industrial consumers and institutional. Water quality issues are not considered
within the scope of this study. Within this framework, the most significant issues arising are:
- Illegal groundwater extraction
- Limited water network coverage
- Degraded water supply infrastructure
- Water pricing
- Non revenue water and disruption to water supply.
The way these issues impact on economic, social and environmental are shown in Table 2-7.
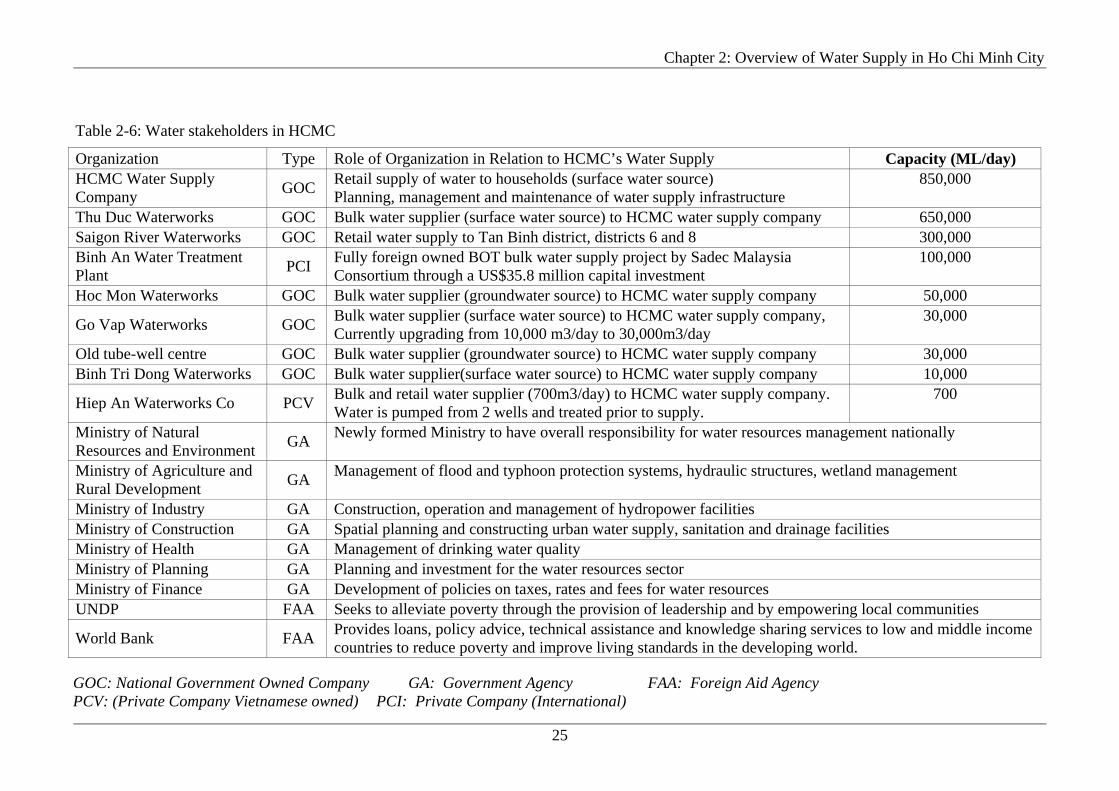
Chapter 2: Overview of Water Supply in Ho Chi Minh City
25
Table 2-6: Water stakeholders in HCMC
Organization Type Role of Organization in Relation to HCMC’s Water Supply Capacity (ML/day) HCMC Water Supply Company GOC Retail supply of water to households (surface water source)
Planning, management and maintenance of water supply infrastructure 850,000
Thu Duc Waterworks GOC Bulk water supplier (surface water source) to HCMC water supply company 650,000 Saigon River Waterworks GOC Retail water supply to Tan Binh district, districts 6 and 8 300,000 Binh An Water Treatment Plant PCI Fully foreign owned BOT bulk water supply project by Sadec Malaysia
Consortium through a US$35.8 million capital investment 100,000
Hoc Mon Waterworks GOC Bulk water supplier (groundwater source) to HCMC water supply company 50,000
Go Vap Waterworks GOC Bulk water supplier (surface water source) to HCMC water supply company, Currently upgrading from 10,000 m3/day to 30,000m3/day
30,000
Old tube-well centre GOC Bulk water supplier (groundwater source) to HCMC water supply company 30,000 Binh Tri Dong Waterworks GOC Bulk water supplier(surface water source) to HCMC water supply company 10,000
Hiep An Waterworks Co PCV Bulk and retail water supplier (700m3/day) to HCMC water supply company. Water is pumped from 2 wells and treated prior to supply.
700
Ministry of Natural Resources and Environment GA Newly formed Ministry to have overall responsibility for water resources management nationally
Ministry of Agriculture and Rural Development GA Management of flood and typhoon protection systems, hydraulic structures, wetland management
Ministry of Industry GA Construction, operation and management of hydropower facilities Ministry of Construction GA Spatial planning and constructing urban water supply, sanitation and drainage facilities Ministry of Health GA Management of drinking water quality Ministry of Planning GA Planning and investment for the water resources sector Ministry of Finance GA Development of policies on taxes, rates and fees for water resources UNDP FAA Seeks to alleviate poverty through the provision of leadership and by empowering local communities
World Bank FAA Provides loans, policy advice, technical assistance and knowledge sharing services to low and middle income countries to reduce poverty and improve living standards in the developing world.
GOC: National Government Owned Company GA: Government Agency FAA: Foreign Aid Agency PCV: (Private Company Vietnamese owned) PCI: Private Company (International)
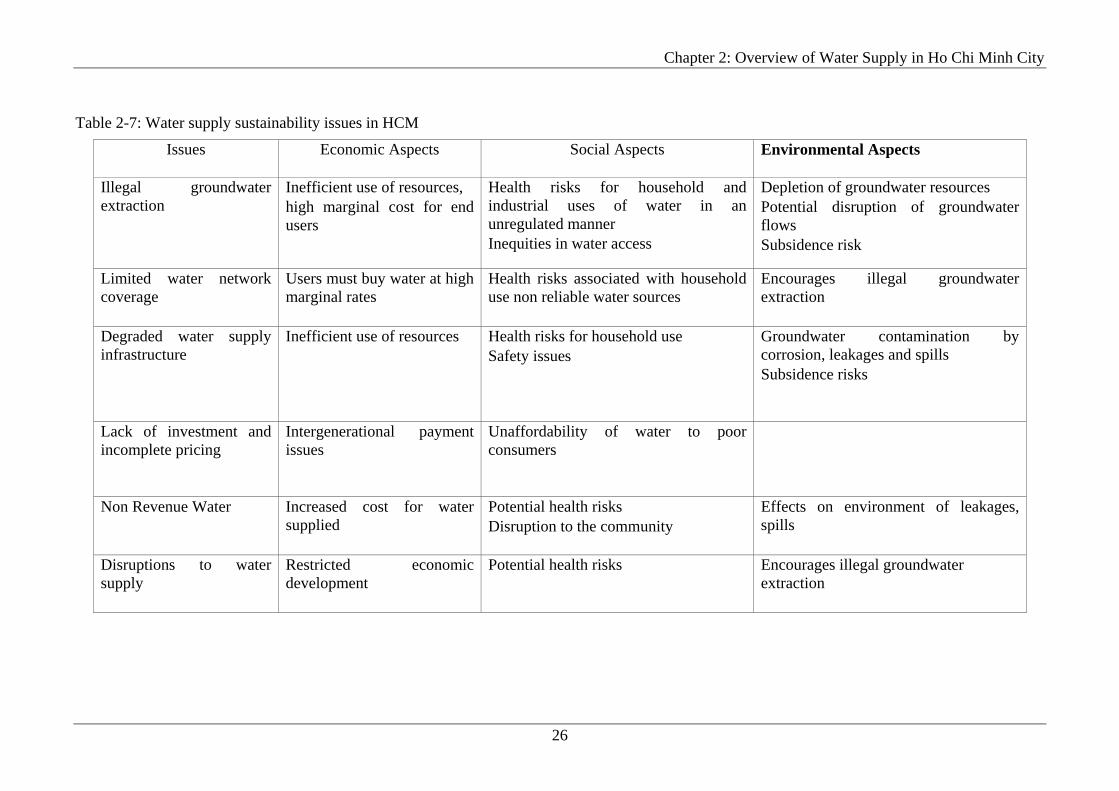
Chapter 2: Overview of Water Supply in Ho Chi Minh City
26
Table 2-7: Water supply sustainability issues in HCM
Issues Economic Aspects Social Aspects Environmental Aspects
Illegal groundwater extraction
Inefficient use of resources, high marginal cost for end users
Health risks for household and industrial uses of water in an unregulated manner Inequities in water access
Depletion of groundwater resources Potential disruption of groundwater flows Subsidence risk
Limited water network coverage
Users must buy water at high marginal rates
Health risks associated with household use non reliable water sources
Encourages illegal groundwater extraction
Degraded water supply infrastructure
Inefficient use of resources Health risks for household use Safety issues
Groundwater contamination by corrosion, leakages and spills Subsidence risks
Lack of investment and incomplete pricing
Intergenerational payment issues
Unaffordability of water to poor consumers
Non Revenue Water Increased cost for water supplied
Potential health risks Disruption to the community
Effects on environment of leakages, spills
Disruptions to water supply
Restricted economic development
Potential health risks Encourages illegal groundwater extraction
Chapter 2: Overview of Water Supply in Ho Chi Minh City
27
2.8 SUMMARY FINDINGS
The increase in population, and rapid economic growth in recent years, after Doi Moi
(Renovation) Policy, have put a large and increasing stress on the water resources in HCMC,
Vietnam. The demand from industries, businesses, and households surpasses the current
supply distribution capacities with the problem going to be exacerbated in the future with ever
increasing demand for water. Furthermore, currently there are a significant number of
potential consumers within Districts remaining unconnected to the water distribution
networks. Whilst the current peak-day capacity is 1481 ML/day the demand is 1880 ML/day
signifying a shortfall of 400 ML/day. The Non revenue water from the aging infrastructure is
also of major concern. The water quality in rivers and underground sources is also highly
degraded due to many sources of pollution. The authorities have initiated some joint venture
works with foreign water companies to invest in the commercial development of water supply
infrastructure. Various environment organizations have responded to the problems of water
pollution. Of interest are the emerging roles of non-government organizations (NGO) and of
public participation in environment issues, especially in a traditionally government-controlled
society.
Given the above background Chapter 3 will examine some key elements related to
Government’s planned approach to addressing current and future water management issues.
Measures used to tackle the problems in HCMC are studied and conclusions drawn regarding
a fresh approach to meet future demands.

Chapter 3: Private Sector Participation in Supplying Water to the HCMC
28
3. PRIVATE SECTOR PARTICIPATION IN SUPPLYING WATER TO HCMC
Provision of water infrastructure and services has normally been the domain of national or
local governments. Governments have a responsibility toward the public to supply basic needs
with regard to water infrastructure. However, State budgets are, as they have often been,
limited and the financial capacities of public agencies are insufficient to meet demand. There
is significant competition for capital from other essential services infrastructure such as public
health, roads and power. Water utilities have been unable to cover the whole population with
the existing price strategies and management. The achievement of significant improvements
in water services in many developing countries will, in most cases, require more efficient
operation of water utilities and investments in rehabilitating and extending supply systems.
Research in Africa, Latin America and Asia shows that the population without access to a
connection relate to low -income areas and that a large number of them rely on alternative
forms of services delivered by Private Water Providers (Conan et al., 2002).
There has been a dramatic increase in the provision of water infrastructure services in HCMC
since the late 1990s (World Bank, 1999). However, the performance is still short of the
Government’s targets set from levels of service point of view. Even with some improvements
in recent years, the water infrastructures suffer from a number of inadequacies which the
Government recognize.
In addition, HCMC WSC is characterized by poor financial performance and rely heavily on
the State budget to fund both maintenance and capital development. These poor financial
performance results are a consequence of inter-related factors including tariffs level which are
too low to cover all the costs of operation and provide a fair return on the local investment
capital and weak management. So far in Vietnam the private sector has had a limited role in
providing water infrastructure.
3.1. INTRODUCTION TO PRIVATE SECTOR PARTICIPATION
Over the past decades, in HCMC governments and development agencies have relied on the
HCMC water supply Company to provide water to all urban areas. Unfortunately, although
access to water has improved, large percentage (55%) of the total population doesn’t have
access to pipe borne water (Conan and Paniagua, 2002). According to the local daily Saigon
Giai Phong Newspaper dated April 6, 2002, top-ranking officials of the HCMC Department of
Transportation and Public Works (DTPW) met on April 5, 2002 to discuss ways to introduce
privatisation of several of the City's services pursuant to Decree No. 93/2001/ND-CP, a
Chapter 3: Private Sector Participation in Supplying Water to the HCMC
29
Central Government's decision on decentralization of authority. The meeting was the first step
in a process to develop a proposed regulatory framework to encourage the private sector at
different economic levels to participate in providing certain public services. Officials
reportedly unanimously agreed to start the privatisation process in 3 areas: public transport,
water supply, and waste collection and transfer. It was believed that public works privatisation
will provide better quality service at a lower cost than those of the present State-run
operations. As a consequence, the participation of the private sector in development and
delivery of water infrastructure was to be encouraged.
Although there was no proposed regulatory framework for private sector participation, the
policy of promoting private participation in infrastructure was started as early as in 1990’s in
Vietnam. The Government amended the Law on Foreign Investment to make way for BOT
projects on December 23, 1992. A year later, the BOT Regulations were enacted by
Government Decree. BOT schemes were officially sanctioned by the State in 1993. Under
BOT financing terms, the foreign investor agrees to build the water infrastructure and operate
it for a specific period. When the contract is terminated, the operations are transferred to the
Vietnamese Government with no further considerations. In return for the investment, the
foreign investor receives tax incentives and preferential treatment such as land use, road
access, and utilities infrastructure during the period of the contract. World Bank (1999)
reported even six years later in 1999 there was little evidence of private participation in the
water infrastructure sectors in Vietnam.
The most common forms of private participation in water management infrastructure projects
are set out in Table 3-1 (World Bank, 1999). The main differences are in the allocation of risk
and responsibilities, duration of the arrangement and assigning of asset ownership. In practice
hybrids of these options may be used. For example, management contracts in which the
private sector takes on some commercial risks, or leases in which the private sector
undertakes some investments. Some governments start with simpler options such as service
contracts and progress to more complex ones involving more risks and responsibilities taken
up by the private sector.
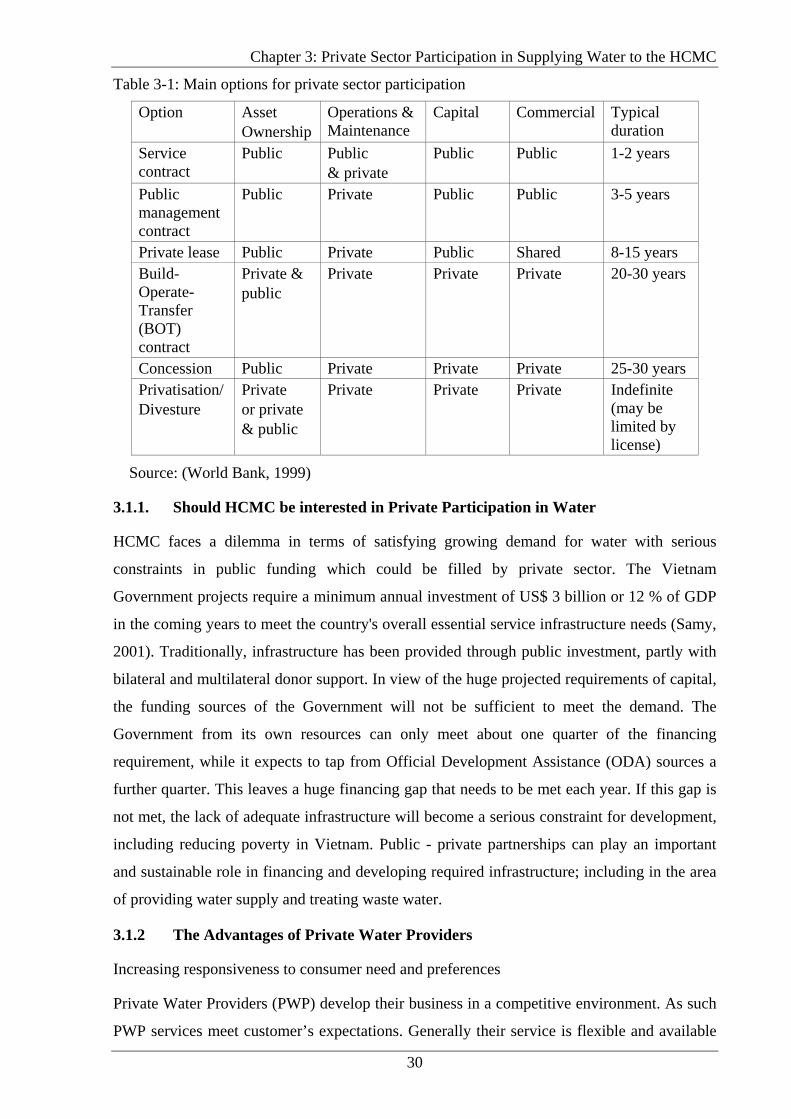
Chapter 3: Private Sector Participation in Supplying Water to the HCMC
30
Table 3-1: Main options for private sector participation
Option Asset Ownership
Operations & Maintenance
Capital Commercial Typical duration
Service contract
Public Public & private
Public Public 1-2 years
Public management contract
Public Private Public Public 3-5 years
Private lease Public Private Public Shared 8-15 years Build-Operate-Transfer (BOT) contract
Private & public
Private Private Private 20-30 years
Concession Public Private Private Private 25-30 years Privatisation/ Divesture
Private or private & public
Private Private Private Indefinite (may be limited by license)
Source: (World Bank, 1999)
3.1.1. Should HCMC be interested in Private Participation in Water
HCMC faces a dilemma in terms of satisfying growing demand for water with serious
constraints in public funding which could be filled by private sector. The Vietnam
Government projects require a minimum annual investment of US$ 3 billion or 12 % of GDP
in the coming years to meet the country's overall essential service infrastructure needs (Samy,
2001). Traditionally, infrastructure has been provided through public investment, partly with
bilateral and multilateral donor support. In view of the huge projected requirements of capital,
the funding sources of the Government will not be sufficient to meet the demand. The
Government from its own resources can only meet about one quarter of the financing
requirement, while it expects to tap from Official Development Assistance (ODA) sources a
further quarter. This leaves a huge financing gap that needs to be met each year. If this gap is
not met, the lack of adequate infrastructure will become a serious constraint for development,
including reducing poverty in Vietnam. Public - private partnerships can play an important
and sustainable role in financing and developing required infrastructure; including in the area
of providing water supply and treating waste water.
3.1.2 The Advantages of Private Water Providers
Increasing responsiveness to consumer need and preferences
Private Water Providers (PWP) develop their business in a competitive environment. As such
PWP services meet customer’s expectations. Generally their service is flexible and available
Chapter 3: Private Sector Participation in Supplying Water to the HCMC
31
immediately, their management style adapts to their customer's profile especially in Private
Sector Participation in Supplying Water to the HCMC periodicity of billing, and they tend to
use local materials and technology to reduce costs. They overcome legal and physical barriers
by working according to the regulatory requirement set by Government for characteristics the
areas they serve. They have no interference from Government.
Improving operating efficiency
Private participation can substantially improve WSC performance as private operators are
driven by strong incentives to reduce costs and increase productivity in order to maximize
returns to their investments.
New technical and managerial expertise
Private investors access to modern technologies and processes in constructing and managing
water infrastructure to minimize costs and wastage of water. They are better placed to
introducing innovation as they are more exposed to international development. The
technology to manage ageing infrastructure is also important for sustainability especially in
Vietnam where skilled resources are extremely limited.
Increase employment and economic growth
PWP helps to reduce pressure on government budgets, including at state and municipal level.
The availability of water management systems attracts foreign and local investment to the
community, bringing more jobs, stable economic growth and an increased local tax base. It
creates skilled and unskilled jobs for local workers, in design, construction and long-term
operation of the facilities outside the inefficient state structure. Local private sector partners
can extend their experience in big and very specialized projects which can be exported to
other areas within Vietnam or to countries with similar needs and operating conditions.
Greater efficiency in infrastructure can improve the effectiveness and ultimately leading to
further growth in direct foreign investment. Experiences of reforming in East Asia (e.g.
Thailand, Philippines and China) confirm large inflows of direct foreign investment (World
Bank, 1999).
There are indications that the investments by pioneers although relatively recent, are growing
rapidly due to the increasing demand and willingness to pay for their service but also due to
the slow rate of expansion into these communities by the Government owned water utilities.
The better the legal environment, there is the higher the level of service and the level of
investment per household served (US$47 per connection in Dehli, where PWP are illegal,
versus US$80 in HCMC and US$100 in Cebu, where PWP have received authorization from
Chapter 3: Private Sector Participation in Supplying Water to the HCMC
32
local authorities). Therefore it is expected that pioneers will continue to expand and invest in
the sector, as long as utilities continue to lag behind the growing demand for a water
connection.
3.1.3 The Disadvantages of Private Water Providers
Privatisation leads to rate increases, raising questions about affordability
If there are no proper regulatory systems in place the private water providers can increase the
water prices to earn return on investment and to increase profit margins. The companies are
under no obligation to provide water or services when water is defined as a marketable
commodity rather than as a human right. Thus, when consumers can no longer afford the price
increases, water delivery is simply shut-off. Some of the examples are as follows:
a. Pekin Ilinois rates increased by 204% (Lobina, 2001)
b. In England and Wales’ water system was privatized in 1989. In the decade after
privatisation the consumers noted that the rates have gone up by 102%. Further
investment in infrastructure was minimised to increase profits (Lobina, 2001).
c. Due to privatisation in Nelspruit, South Africa, water rates were increased by more than
400% between 1995 and 2000, resulting in a cholera epidemic as people were forced to
drink water from the river (Weeks, 2001).
Privatisation can lead to taking increased risk (e.g. Water quality undermining)
Environmental standards may be compromised because the profit motive drives the corporate
agenda rather than serving the public interest. As an example a small town of Walkerton in
Ontario, Canada, where seven people died and 2,300 others became ill as a result of Ecoli
contamination in the drinking water (Gillis, 2001). A&L Laboratories, the private company
contracted to test the water, knew that the water was contaminated. But under light handed
regulations designed to encourage privatisation, the company was not required to alert
government officials about a public health crisis in the making (Gillis, 2001).
Privatisation may foster corruption
In many cases, the deals that water companies make with government agencies include
exclusive access to distribution for 25 or 30 years, effectively sanctioning a monopoly. These
private monopolies tend to undermine accountability and result in poor customer service. This
is especially prevalent in developing countries where regulations are ineffective and poorly
paid Government officers are corruptible.
Chapter 3: Private Sector Participation in Supplying Water to the HCMC
33
The structure of privatisation could encourage corruption. Checks and balances that could
prevent corruption, such as accountability and transparency, are conspicuously missing from
the process. With water contracts being worked out behind closed doors, executives and
government officials are free to make deals on their own, rather than in public interest.
Executives of Vivendi, Suez Lyonnaise de Eaux, and other water companies, for instance,
have been convicted for bribing government officials to obtain contracts (Hall, 1999).
Bribery is a common issue during the bidding process, which is generally closed to the public.
Despite calls for transparent bidding process water companies claim that doing so would
damage their commercial interests. For the same reason, the water contracts themselves are
not made available to the public even though the public is subject to the terms of these
contracts. Moreover, financial information is rarely disclosed, even when the company is
obliged to do so.
Private financing may lead to job losses
Privatisation often leads to massive layoffs, at times placing services and water quality at risk
due to understaffing. Layoffs are commonly used to reduce costs. Such layoffs are not only
devastating to workers, but also to consumers. Following privatisation in the England, for
instance, the number of employees in the 10 major water and wastewater companies was
reduced by almost 10,000 over a 10-year period (Lobina, 2001). In the Philippines, (will be
discussed later) thousands of workers which are nearly half the original workforce were laid
off following the privatisation of the Metropolitan Waterworks and Sewerage Company.
Some of these workers had put in more than 20 years of service with the company, and their
families and retirement were put at risk by these cost-cutting measures.
3.1.4 Difficulties Facing by the Private Water Providers
Private sector involvement typically leads to the introduction of fees-for-service where there
previously had been none or significant increases in existing nominal fees for services
previously supplied by the government. Fees are a key part of the trade-off involved in a
government decision to itself reduce or cease its direct role as the services provider. Private
operators need to charge for the services provided both to cover investment and operating
costs and generate profits. Pricing of water, and of waste management, is also critical to the
introduction of conservation principles and mindsets in user-households and commercial
enterprises.
Although PWPs actions are recognized by local authorities they rarely have formal
authorization from the water utility, which increases the risk of PWP’s investments. In
Chapter 3: Private Sector Participation in Supplying Water to the HCMC
34
addition their business is seen by commercial banks as risky and non-profitable and their
assets are rarely recognized. Consequently they have limited access to long term credit and
borrow at high interest rates. The cost of doing business under these conditions is passed on to
the consumer limiting the capacity to expand their services. However, effective regulation for
setting and monitoring levels of service to consumers and regulators setting prices (such as
the essential services Commission in Victoria, Australia) can rectify the situation.
3.2 EXAMPLES OF PRIVATE WATER PROVIDER PARTICIPATION IN HCMC
The HCMC government is encouraging privatisation and public private investment schemes
in water supply infrastructure. To foster better work, the government has given priority to
private water supply projects by private investors and, international aid agencies. Both
domestic and foreign private companies have been encouraged to invest in upgrading and
replacing ageing water supply systems. Following are some examples of water supply projects
carried out by private water providers.
Thien An company The Thien An Company signed a contract to supply 0.7 ML/day to Water Supply Company.
However, the agreed price of 14 cents per cubic meter was too low for Thien An to make a
profit. The WSC could not do anything as the price of running water is set by the HCMC
People Committee (Tran, 2003).
Hiep An company
In 2002, a project has been set-up with Hiep An Company, a private company based in
District 8, signed a contract with the HCMC WSC to sell safe water with a capacity of 1.3
ML/day with 0.35 ML/day and 0. 95 ML/day are supplied directly to households and HCMC
WSC respectively. Water is pumped from 2 wells and treated in a water unit. In addition, the
Hiep An Company supplies safe water to approximately another 100 households in the
neighborhood. Hiep An Company has invested around US$100,000 in this area (District 8)
and is currently studying a new investment (for around another US$100,000) in another
District including a commercial center and around 200 households to be served.
Phuoc Doan model
In efforts to provide more incentives to encourage domestic investors to help to solve the
severe water shortage of HCMC, the Central Government has started granting licenses to
companies to extract large quantities of groundwater. The first domestically-owned water
supply company in HCMC is Phuoc Doan. The Company privately established and operated
Chapter 3: Private Sector Participation in Supplying Water to the HCMC
35
in District 12 with a capital investment of VND 1.1 billion and it is capable of supplying
0.720 ML/day to a maximum capacity of 2000 households (Vietnam News, Oct. 31, 2000).
To encourage consumers to sign up for the water service, a flat fee of VND 3,500/m3 is
charged to residences and businesses alike. Consumers are allowed to use as much water as
they choose and pay only the monthly fee along with an initial gauge installation fee of VND
400,000 (Saigon Times Weekly, Oct. 21, 2000). Flat fee, however, will inevitably encourage
excessive and wasteful water use. As more consumers sign to Phuoc Doan water, the demand
increases and the lowering of groundwater level around this area is imminent.
Binh An water treatment plant
Kumpulan Emas Berhad, a diversified corporation, had successfully completed the Binh An
Water Treatment Plant in HCMC, Vietnam. The plant was part of the US$38 million Binh An
project which was the first BOT water supply project in Vietnam. Its success plays a leading
role in this important water privatisation project in Vietnam and to have successfully
completed the project on schedule despite the financial crisis is a credit to all parties involved.
The project was undertaken by Binh An Water Corporation Ltd (BAWC), 90- % owned
company of Emas Utilities Corporation Sdn Bhd, in which Salcon Engineering Sdn Bhd
(SESB), a subsidiary of Kumpulan Emas, is a key shareholder. SESB also participated
actively in the project management and implementation.
The project is a crucial component in HCMC Water Supply Master Plan to overcome the
existing acute shortage of treated water in the city. Its plant has a capacity of supplying 100
ML/day of treated water per day to the city and its surrounding industrial estate charging 20
cents per liter. BAWC has a 20-year BOT contract with the People's Committee of HCMC to
supply treated water to augment the existing supply to the city.
Saigon river water treatment plant (Unsuccessful project)
The Asian Development Bank praised itself for playing a "catalytic role" in Vietnam's BOT
water project, hailed as a model of public-private partnership. A consortium of investors led
by French utility Suez was contracted in 1997 to complete a US$154-million water-treatment
plant by 2004 that would help satisfy the swelling demand in HCMC (Duong, 2003).
HCMC authorities announced in 2001 that Suez had dropped the project and the water-
treatment plant would be re-tendered-solely to Vietnamese companies. Negotiations over
water tariffs, investment-license changes and environmental requirements were some of the
reasons for the withdrawal of the project. Some difficulties in negotiation can be traced to the
inexperience of the HCMC People Committee negotiators with the BOT model. They, in turn,
Chapter 3: Private Sector Participation in Supplying Water to the HCMC
36
had to wait endlessly for crucial approvals from Hanoi. But other delays stemmed from the
mountain of paperwork and the currency-conversion guarantees required by the international
lenders. Legal fees mounted. Geological surveys were redone. However, construction never
got off the ground. Finally, after Suez facing huge losses and with emerging markets
elsewhere (particularly in Argentina), the company told the city that it would withdraw
because of a global financial pinch.
Later the project was contracted to Lyonaise Vietnam Water Company (LVWC) a foreign
invested enterprise. LVWC wanted to charge 40 cents/L of water, compared to the current
price of 11 cents. With the supplying capacity stipulated in the contract of 300 ML/day, the
above proposed price means the HCMC has to give a daily subvention of US$87,000. The
LVWC withdrew from the project as the government did not agree to the price of 40 cents/L.
The Government considered this price to be excessive and not affordable to citizens living in
HCMC. The withdrawal of LVWC has put completion of the project one year behind
schedule, increasing the already severe water shortages faced by the southern hub (Duong,
2003).
This highlights the dangers of embracing BOT as a one-size-fits-all solution for infrastructure
needs. When negotiations got protected and foreign lenders' conditions proved onerous, it's
tempting for countries such as Vietnam and neighbouring China to look for a quicker, easier
solution.
Viet Trung company Ltd
On 12 May 2004 a contract was signed between HCMC Water Supply Company and Viet
Trung Company Ltd to construct a groundwater plant with a 1 ML/day capacity at Tan Hung
Ward, District 7 (Figure 2-2) to supply water for several residential areas. Nha Be Water
Branch which is directly under the control of HCMC WSC is responsible for the distribution
of water to the area. The Water Branch did not wish to receive the groundwater from the
groundwater plant due to following reasons:
• The pressure in the designated area was sufficient;
• The quality of the extracted ground water did not meet the water quality standards.
As such the project had to be terminated. However, according to Mr. Vo Van Chinh Director,
Viet Trung Company, many houses in the area have no water connection and in some areas
the pressure is below 0.2 kg/cm2. The Nha Be Branch point of view has hindered the
development of water supply in Tan Hung Ward, District 7.
Chapter 3: Private Sector Participation in Supplying Water to the HCMC
37
Hoang Lien Son company Ltd
Hoang Lien Son water supply plant has a capacity of 1 ML/day, and is capable of supplying
water to some areas in District 12 and the Go Vap District (Figure 2-2). According to an
agreement between Hoang Lien Company and HCMC Water Supply Company, a 2.3-km-pipe
network was planned by Hoang Lien Company to sell water to HCMC Water Supply
Company at a price of 2,500 VND/m3. The construction was delayed because Hoang Lien
Company had to wait for the HCMC Water Supply Company to carry out a study to prevent
the incompatibility of pipes in the future. This resulted in a 3 month delay.
Hiep An company Ltd
As proposed by Government of District 8 (See Figure 2-2 in Chapter 2), Hiep An Company
had been invited to develop a water treatment plant in a newly developed residential area in
District 8. The plant capacity is 1ML/day with total investment of 2 billion VND. After two
years in operation, only 15% of total capacity was used due to the slow development of
housing in the area. Therefore, Hiep An Company had to sell water to the HCMC Water
Supply Company at a price of 2,200 VND/m3 instead of selling to people at the price of 3,000
VND/m3. However, Hiep An was still considered lucky in the business as compared to other
private water providers.
PD company
PD Company has been licensed to supply water in District 12. However, soon after PD
Company in District 12 started operating another water project funded by Ministry of
Agriculture and Rural Development also commenced supplying water in the same area. This
results in only a quarter of the capacity of PD Company was consumed and the Company had
to pay 5-7 millions VND in compensation for losses.
AH company
District 9 is located near the HCMC’s major water treatment plant (Thu Duc Waterworks).
However, since it is a new developed district, the water pipe network is insufficient in this
area. In mid 2002, AH Company invested on a water treatment plant that draws water 8x10⁵
L/day from Dong Nai River. The proposed water price was fixed at 2800 VND/m3. Problems
aroused when many households switch to use AH water instead of government one. In fact,
local people committee did not allow households to change their water provider. Therefore,
AH Company in District 9 had to put the water plant on sale due to losses as a result of lack of
customers (www.vietnamnet.vn assessed 10 Nov. 05).
Chapter 3: Private Sector Participation in Supplying Water to the HCMC
38
In the beginning of 2004, there has been more than 30 water related projects on improving
water infrastructure in HCMC where tenders were called by the HCMC Water Supply
Company with very little attention from the private sector. According to the HCMC WSC, for
each project, there were only 2-3 contractors willing to tender the complication of renovation
of HCMC’s water pipe network. Furthermore, contractors have to carry out the work in the
city centers that would add extra complexity to the project.
3.2.1 Barriers in Private Investment in Vietnam
The number of projects with private involvement is in decline and investment flows have
been slowing. The causes of this appear to be systematic. Business and many government
officials agree that weak regulatory set-up is mostly to blame, together with a lack of political
support for private sector participation. Other barriers include a need for long-term debt
finance, low returns on investment, fragmented deal size and poor contract structuring. There
may also be an inappropriate allocation of risks between government and business, or
problems caused by the creditworthiness of government hosts (Borkey, 2003).
Despite the Government’s continuing effort to encourage private water participation, a
number of obstacles remain in the way of private participation. Some of the residual legal
restrictions on PWP remain from the investors’ perspectives. The five main areas of concern
are foreign exchange, state guarantee, loan security, lenders-step in rights and dispute
resolution. In addition, excessive bureaucracy is also a commonly cited source of concern.
Vietnam currently lacks of a well-developed regulatory framework that will enable the
country to pursue a path of increased PWP. Private companies will not show a great deal of
interest without having the ability to recover costs and return a dividend to the shareholder.
Hence setting-up of a regulatory framework that determines the water price suitable for
human consumption and industry’s use is an important step in attracting the private sector
back to investigate infrastructure.
3.2.2 Issues Facing BOT Schemes
The general business environment, while slowly improving, still makes investments in long-
term, capital investment highly risky for both private sponsors and lenders. For example,
water tariffs are currently set at levels below full-cost recovery. The BOT form has proven
unattractive as potential investors worry that they cannot recoup investment capital within a
certain period, normally set at 20 years for projects of scale.
The infrastructure distribution network is so old that the delivery of water suffers from
massive leakage. This issue is quite complex, as overall responsibility and coordination for
Chapter 3: Private Sector Participation in Supplying Water to the HCMC
39
repair work remains unclear. The BOT schemes have yet to effectively address how to finance
the rehabilitation of the water supply distribution. Due to the water purchasing arrangements,
the HCMC Peoples’ Committee sets water tariffs, and purchases its water directly from the
BOT WTP. The distribution arrangement of the HCMC Peoples’ Committee ensures that it
absorbs the financial cost of water loss due to leakage. In fact, the HCMC WSC has
experienced increased water losses since the BOT Binh An WTP began as both water volume
and pressure increased because more water entered the leaky system due to increased
production capacity.
Several recurring problems plague BOT financed water treatment plants. The problems
include: a weak legal framework; unclear land use rights laws, and resettlement policies; and
high uncertainties of profit repatriation. Many have cited the non-convertibility of Vietnamese
currencies on the international market as a major investment obstacle. Investors resort to
demand water payments is made in US currency in order to prevent deflation of profit
margins.
HCMC’s water treatment and distribution system is desperately in need of investment. The
city’s cast iron pipes, laid over a century ago, have become heavily corroded, blocked, and
encrusted. To expedite water infrastructure investment, the Central Government has created
incentives to raise foreign investments by sanctioning BOT concessions to private interests.
If governments ignored private sector involvement completely, they would probably forgo
technical and managerial expertise, capital injections and greater efficiency. Consequently,
many central and local governments in developing countries are turning to the private sector
to help finance and implement these needs.
The projects completed have been undertaken on an ad hoc basis, without any clear evidence
of a policy designed to promote private participation in infrastructure. The economics of scale
is also a concern as the private companies currently operating varies in size and competency.
3.3 DELIVERING WATER SERVICE AT LOCAL LEVEL: PHUONG MODEL
There are examples of managing water services efficiently by devolving responsibilities to
local level smaller administration units. This unit is called a Phuong. A Phuong is the smallest
administrative unit in the Vietnamese administrative system. It usually covers an area of about
1.0 km2 with 10,000 to 16,000 inhabitants (GSO, 2006). A Phuong is a self financing body. A
Phuong People’s Committee executes power in a Phuong. WSC will initially plan the
operations, optimize water production, install water meters, develop billing and revenue
collection systems, apply new accounting practices and adopt maintenance and repair
Chapter 3: Private Sector Participation in Supplying Water to the HCMC
40
programs. In addition, Water Supply Company will implement a customer services plan as an
integral part of overall operations. Water Supply Company is not responsible for the financial
resources of the Phuong.
3.3.1 Responsibilities of a Phuong
The Bureau of Phuong People’s Committee has the authority to keep record of the residents
and to issue residence certificates and permits, birth certificate, and marriage certificates.
Phuong authorities are also responsible for military service recruitment and arranging small
scale infrastructure improvement projects in a Phuong. A Phuong has a police bureau of its
own.
To implement a “Phuong model” a small office with minimum facilities such as a desk, a
couple of chairs, benches, a bookcase and a telephone line is needed. In a customer service
group there are 4 – 17 members, with one of them being a group leader.
The tasks of other officers in a customer service group include:
- receiving applications for water use contracts (connections)
- meter reading and monitoring of meter conditions
- revenue collection
- leakage detection and minor repairs (Pipe diameter less than 50 mm)
- handling of complaints and requests
- minor repairs of meters
- customer information
The tasks of the individual team members are shared among the team. All members take part
in meter reading and revenue collection as the salaries of the group depend on the revenue
collected. Revenue is collected by physically travelling from door to door.
3.3.2 Advantages of a Phuong Model
- The operational costs in the Phuong model are low. The Phuong model provides
opportunities to be responsible, a good team worker and for self development.
- Office accommodation in the Water Supply Company is considered unnecessary as
their work is mainly out-doors. Working hours of revenue collectors and meter readers
go to work when they wish. However, all officers are compelled to go to work
everyday to maximise on revenue collection.
- Customer Service Officers in a Phuong have designated responsibilities and know
their customers well. This develops good relationships between the two parties
avoiding fraud.
Chapter 3: Private Sector Participation in Supplying Water to the HCMC
41
- The office is located within the Phuong premises. Complaints and requests can be
attended with minimum time delay. If preferred customers can pay their bills
personally at the office instead of paying the home collectors.
3.3.3 A case study of the Phuong Model
Haiphong water supply company
Haiphong is located in northern Vietnam, on the delta of the Red River, near the Gulf of
Tonkin. Haiphong is linked to Hanoi by rail and to other inland points by roads and
waterways. The chief industrial enterprises in and near the city include zinc and coal mines.
Certain industrial and transportation facilities in and near the city were damaged during the
Vietnam War.
Water supply in Haiphong, especially during summer was a major concern. People had to
queue all night for water at public taps or they had to watch until water is supplied through in-
house taps. On the other hand if the network pressure was good, people are not concern of the
water use. 70% of the water produced is unaccounted. People also made illegal connections
and drilled wells to secure water supply. Water was also vended by private providers at a
price 25 times the price of piped water. Furthermore, the Haiphong Water Supply Company
could collect revenue of only 20% of billed water (Tran et al., 1998).
Later in 1995 Haiphong Water Supply Company separated the city of Haiphong into number
of Phuong’s and adopted the Phuong model successfully to each Phuong. The model did not
change the water use habits of the consumers. However, after implementing the Phuong
model the water supply service levels increased in Haiphong. Since the completion of the first
Phuong the rehabilitated area has been continuously enlarged providing a reliable water
supply with pressure of 2 bar (1bar = 10 m) from 4 a.m. to 11 p.m. The proportion of
nonrevenue water has been reduced to 20% on average. Revenue collection rate has also been
high with practically no bad debts. The number of customers has more than doubled since
introduction of the Phuong model. The customers were satisfied with the service level and
with the staff than before. Relationships to the local authorities and the media have also
improved. The Haiphong Water Supply Company has been making a profit since 1995 (Tran
et al., 1998). The Phuong model is also an example of turning the characteristics of the local
culture and administrative structure from a bureaucratic liability to customer responsive asset.
A Phuong model in Haiphong city
A unbundled water supply network was also developed in the city of Haiphong, that could
help to reduce the Non Revenue Water (NRW) and assist in the rehabilitation of distribution
Chapter 3: Private Sector Participation in Supplying Water to the HCMC
42
networks system (Do et al., 1998). The water supply network was reconstructed and
unbundled to control the water losses. Unbundling is carried out for both technical and
institutional aspects. The network is separated according to the administrative areas of
different Phuong’s in the city of Haiphong. In each Phuong, a working group of 5-8 people
has been established. This group has an office in the local authority premise (phuong’s people
committee office) and they have full responsibilities of operation and maintenance of Phuong
water supply network, including making connection/disconnection and meter reading. As a
result of these arrangements, the relationship between the Water Supply Company and
consumers has radically improved. Through the model, the problems in administrative
management have also been solved.
Achievements of the “Phuong” model:
• The unaccounted water in the rehabilitated phuong’s is down 20% to 30% and revenue
collection up by nearly 100 %.
• The wastage in the areas near to water sources has been reduced so the Haiphong
Water Supply Company could supply adequate water for remote areas in the network
without increasing production of water.
• The operation of the network is in good condition with minimal maintenance. The
water pressure is been controlled in main network at 1.5 bar (15 m of water) and in
distribution network at 1.0 bar (10 m of water).
• Through the “phuong” model, WSC and customers have a good relationship.
• The customers have had opportunities to raise their opinions and thus influence the
implementation.
• The total revenues in 1997 are estimated to be VND 29.7 billion (approximate USD
2.3 million) and the profit after the operational cost and depreciation VND 3.7 billion
(approximate USD 0.3 million).
Limitations of the “Phuong” model:
The “Phuong” model has worked well in HPWSC so far as the number of phuongs has been
limited. However, some problems occurred in the process of development. There are too
many phuongs (38) in urban Haiphong city and more in Kienan and in the future supply areas.
When all phuongs are rehabilitated, the personnel in “phuong” offices of the company would
increase to 200-250 people. Too many phuong offices to be managed means that company
need a lot of qualified managers and also it may be too difficult for the head of the company
Chapter 3: Private Sector Participation in Supplying Water to the HCMC
43
to manage the system. The tasks set as the responsibilities of the phuong offices are not
simple, but the phuong does not have adequate personnel and other resources given to it to
fulfill all these responsibilities. Therefore, the management model in the Haiphong should be
subject to change. Several phuongs rehabilitated several years ago are now unified as bigger
administrative units.
3.4 POLICY RECOMMENDATIONS
The main policy recommendations for promoting private sector participation in HCMC are:
market reform, financial discipline, regulation reform, and ownership reform.
3.4.1 Market Reform
With the proposed development of few private BOT bulk water projects, HCMC Water
Supply Company seems to be moving toward vertically unbundling its bulk water supply.
Simply this means separating treated bulk water supply from the distribution system. Rather
than allowing ad hoc projects to re-define the structure of the sector, the government is
encouraged to establish a clear policy toward market reform. Although vertical unbundling
offers benefits such as more transparent costs in each segment of the industry and possibilities
for increased benchmark competition, it also has some significant drawbacks. These include
higher contracting and coordinating costs between independent buyers and sellers and the loss
of economies of scope in operations. Most importantly, a move toward vertically unbundled
market will fail to address the main problem currently facing the water sector in HCMC, i.e.
inefficiencies in the distribution system. Private sector participation confined to bulk supply
alone may in fact exacerbate system inefficiencies by raising unrealistic prospects of new
BOT "solving" the water supply shortage problems. This is particularly important since
Government's medium-term policy focus should be on improving management systems and
commercial pricing in the distribution system down to the service level. Without improving
distribution operations, maintenance, metering, re-investments for replacing pipes human
resources and institutional strengthening, more than 33% of new production (NRW) will be
lost - it will literally disappear "down the drain".
In addition, given Vietnam's limited track record with Potential Private Investors, potential
private investors in BOT bulk water supply are likely to require the Government to bear
significant risks through the provision of guarantees to the private sector for demand and
foreign exchange risk through take-or-pay contracts linked to hard currencies. In the absence
of a careful policy which identifies, prices and charges for these guarantees, there is the risk
that the Government may be assuming unnecessarily large contingent liabilities.
Chapter 3: Private Sector Participation in Supplying Water to the HCMC
44
There is evidence based on international experience that governments can adopt strategies to
maximize the benefits from PWP. For example, governments can pursue more market reforms
which allow Government to get rid of market risks through, for example, a long-term
concession contract for an urban area. In fact, many project sponsors and lenders are dubious
about the real value of guarantees associated with financed projects. Indeed, some investors
have indicated that they would prefer to enter into long term franchises or concessions where
there is some control by the private operators over the customer base at the service level than
relying on guarantees from government utilities under BOT contracts. Under franchise or
concessions structures, the private operator is more concerned about Government support for
the enforcement of customer obligations to pay for services rather than direct guarantees of
demand. The Government should therefore carefully consider promoting PWP in an
integrated system, which involves the treated bulk water supply and distribution to domestic
and industrial consumers.
3.4.2 Financial Discipline
It is recommended that the Government of HCMC adopts a clear policy which would lead to
the application of full-cost recovery tariffs in the water sector. This policy is important for a
number of reasons. First, the present situation where water is sold at levels well below full
cost leaves the Water Supply Company in a financially weak position wit h unclear incentives
for the management responsible for day-to-day operations. The high levels of non revenue
water in the systems that there are insufficient funds from retained earnings for the WSC to
finance the maintenance of the current distribution system let alone allow for much needed
capital investment in new capacity. As such, Water Supply Company must rely on
increasingly constrained Government budgets or Official Development Assistance (ODA)
sources to fund much needed expansion. Second, most investors will not be willing to make
large investments in infrastructure unless governments commit to charging tariffs for services
which allow the full recovery of costs. Finally, heavily subsidised tariffs can encourage over
consumption of scarce resources and send misleading signal to infrastructure providers.
However, tariff reforms and re-balancing may give rise to charges that, in low income
districts, many users might not have the financial capacity to pay the full cost for services.
Nonetheless, that cost recovery tariffs would deprive the poor is a misled conviction, and the
governments must face the reality that there is no way out of this financing dilemma. Either
cost must be recovered from consumers who make use of the service through cost-covering
charges, or from the population in general through taxation. The alternative is widespread
inadequacies in infrastructure which leave many who are willing to pay for services without
Chapter 3: Private Sector Participation in Supplying Water to the HCMC
45
access to these services. Equally, there is growing international evidence to support the claim
that subsidizing utility services such as water for broad consumers groups is a crude and
inefficient way of attacking poverty reduction for the poorest groups in society. Issues to be
examined might include: the identification of the poorest target groups and how the subsidy
might be implemented. One of the other options could be to get a tariff path for full cost
recover. This way the shock to consumers would be gradual. Sustainable action by the
Government to address losses in the water sector also requires a hard look at institutional
structures and incentives. Even under the present public ownership arrangements, the
corporate and management structures of water supply institutions should be reformed to
provide incentives for minimizing costs and streamlined decision making. Haiphong WSC,
for example, operates on an incentive management system with competent management team
and the percentage of water loss is relatively low ranging from 15 to 20%. Similarly, good
accounting systems are essential for the tariff guidelines to be meaningful. New accounting
standards were introduced recently with international assistance and these programs are now
focusing on training of accountants in the sector. Finally, a related element of financial
discipline in the sector will be the need for a clear and consistent policy towards Government
guarantees for BOT projects. In the short-term, it may not be possible to eliminate the need
for sovereign guarantees in all cases. Where guarantees may be required, the Government
should recognize value and price them and manage these commitments on a commercial
basis.
3.4.3 Regulatory Reform
Although there is little private participation in the water sector to date, it is recommended that
the Government uses the coming time to address some of the fundamental issues associated
with the regulation of the sector drawing, as appropriate, on best international practices.
Private investors in the water sector will need to be sure not only that current tariffs are
sufficient to cover the costs of an efficiently run firm but that tariffs will be allowed to
increase if costs increase because of factors outside their control. As in other sectors, the
Government should develop a regulatory framework that facilitates tariff adjustments that are
fair to investors, as well as to customers. For example, in the case of the Manila water
concessions awarded to two private sector consortia of local and international companies, the
private companies are anticipated to make up to US$7 billion investment over the life of
concession (Esguerra, 2003). In this case, responsibilities of the Regulatory Office include
enforcing the concession agreements, reviewing tariff rates, monitoring water quality and
other performance obligation, and conducting public hearings with customers. The regulatory
Chapter 3: Private Sector Participation in Supplying Water to the HCMC
46
issues are particularly acute in the water sector because of the critical nature of pipe d water to
the social and economic well being of customers, which naturally increases the pressure on
political authorities to keep tariffs low. Investors have legitimate concerns about regulation
since they are often required to make investments that are both long-term - often with asset
lives of over 50 years - and irreversible. Once pipes are laid in the ground, investors cannot
respond to tariff cuts by digging the pipes up and starting business somewhere else. In
addition, it is important to clarify which projects need approval, by what agencies, and who
has legal right to sign the contract. In Vietnam these matters have been very complex and
often difficult to resolve. However regulators must also focus on the private sector delivery
agreed levels of service. Prices have to be reviewed periodically in an open and transparent
manner involving the public, consumers and Central Government. An efficient and effective
economic regulator has been overseeing the water sector in Victoria Australia for the last 10
years.
3.4.4. Ownership Reform
Vietnam has yet to consider any model in transferring ownership and therefore risk from the
public to the private sector. With the Government's target of increasing the access to safe
water, there is clearly a large role for the PWP in the sector. In theory, there are many private
scheme options that the Government can consider including: service contracts; management
contracts; leasing contracts; BOT, concessions; and full divestiture. In practice, a concession
or full divestiture may offer the best choice overall. While all forms of PWP promise some
benefits, the more ambitious options such as concessions or divestiture present the widest
range of advantages since most risk is transferred to the private sector and the operators have
strong financial incentives to maximize efficiency. It is recommended that the Government
adopt a twin-track strategy for ownership reforms in the sector involving limited BOT
projects in the short term and more fundamental reforms in the medium term. However, with
future BOT the Government should be careful to accept as little of the business risks as
possible bearing in mind the recommendations on contingent liabilities.
It is recommended that serious consideration be given to more far-reaching changes in the
sector by pursuing options that tackle the service level problems of operations to improve
efficiency. Ideally, this should be undertaken through a concession or divestiture. However, if
the private sector is not yet ready to invest its own capital in the sector except for bulk BOT, a
pilot lease agreement may be more feasible in the short term. This approach, which falls short
of full divestiture, gives the private partner increased responsibility for the operation of the
utility. In HCMC’s situation, it may well be that private sponsors and financiers may view the
Chapter 3: Private Sector Participation in Supplying Water to the HCMC
47
investment and financial risks to be extraordinarily high and as such, there may be little
inclination on their part to commit investment and finance capital without substantive political
and risk coverage from the Government. In such circumstances, the Government may wish to
explore leases in parallel with public financing and rehabilitation of the system as it is being
presently done in the Philippines in rural towns. Under such an arrangement the system is
rehabilitated with public financing and then is turned over for commercial operation to private
operators who assume the market and commercial risks associated with the business. The
Government on the other hand must ensure the de-politicization of tariff and allow the private
operators to run the business within specified and agreed rules of providing service. This
model, if successful, could then be graduated to a full concession, whereby investors would
commit their own financing to the operation as greater confidence on the regulatory
framework is developed. Bulk water BOT should not be pursued further unless there is a
commensurate strengthening of the service level, particularly in setting tariffs that fully cover
costs and in the reduction of unaccounted for water by investing in rehabilitating aging
infrastructure. In the case of the Buenos Aires water concession, the private operators have a
firm commitment to invest US$4 billion over the life of the 30-year contract. Average tariffs
have been reduced by 17% while the Government received US$8.3 million in tax revenues in
the first year of operation. After 18 months of operation, water production capacity increased
by 22%, water losses had fallen by 37% and the population served under the concession had
risen from 6 million to 6.6 million customers - an increase of 10% (World Bank, 1999).
3.5 DISCUSSION AND RECOMMENDATIONS
Given that 100 % service coverage by water utilities will not happen due to financial
constraints within the next decade, we must recognize the role that PWP have and will keep
having as a major provider of water to poor urban areas. The following recommendations are
aimed at improving the quality of service and coverage provided by PWP to the poor urban
and increasing the total investment in the water sector.
First, it requires a change in behaviour of the Government. Government needs to stop being
the day-to-day manager and becomes the policy maker and the regulator of the services
provided. Making this shift is not easy for many governments. Also, investors scrutinize the
government’s regulatory capacity and behaviour. If this capacity is weak and creates
uncertainty, private capital will not flow in, particularly if the investment looks less attractive
than investments competing elsewhere. In other words, governments must remain involved
but do so differently from day-to-day manager to policy maker.
Chapter 3: Private Sector Participation in Supplying Water to the HCMC
48
A second issue concerns water charges. These are often too low to support major private
investments. Many governments sell drinking water well below the cost of providing the
Private Sector Participation in Supplying Water to the HCMC service. In some cases, this is to
ensure that the basic needs of all citizens are met; in others it is to avoid unpopularity, even
civil unrest. But the truth is, the price rarely reflects economic realities. For sanitation services
and raw water abstraction the prices are usually even lower. For potential private investors,
the conclusion is simple-depending on how low revenue streams are they will either not
engage in the project or adjust the level of investment, thereby reducing the attractiveness of
any partnership. Yet water users are often able to pay more for services than their
governments actually realize. Drinking water is a basic need and most ordinary people in
cities already pay something to get it; even slum-dwellers are known to buy clean water from
vendors. In fact, poorer, non-networked urban neighborhoods often pay more for their
drinking water than wealthier areas do. Government charges mostly do not reflect demand
and governments do not realize that the potential revenue streams are sufficient to attract
private investors in drinking water services over the long term.
Water availability and infrastructure are related to poverty and inequality in a complex
feedback relationship. According to surveys undertaken in countries characterized by severe
income inequality, households without piped connections tend to spend more time and
frequently higher financial resources (in per-unit price of water from private vendors) to
obtain water from alternative sources. These typically include tanker trucks, water vendors,
cisterns in neighbouring communities, and standpipes, but also from rivers and streams
(Mainardi, 2003).
Ensuring that all citizens have access to clean water, regardless of their ability to pay, is a key
goal for most governments and an important prerequisite for the success of private sector
participation. Business ventures can help to achieve that goal, but in many cases, insufficient
measures to accommodate the poor have undermined social acceptance of private
participation, contributing to the collapse of the underlying projects.
Also, governments that feel they must subsidise the costs of water for the poor have to do so
in a way that bolsters income flows. Simply applying universally lower fees for water use
would not work. If water rates need to rise as part of water service performs, public funds can
help ease the transition. And governments can also provide retirement, relocation or retraining
support for employees that might be affected by any shift to private investment. If properly
handled, investors can be persuaded to carry some of the temporary costs of transition if they
feel confident about the long-term returns.
Chapter 3: Private Sector Participation in Supplying Water to the HCMC
49
But in most cases, business costs and risks are often simply too high. Apart from the high
capital costs and the prospect of modest revenue streams, there are high upfront transaction
costs, as well as issues like sovereign and financial market risks. Hence, the attraction from
private businesses to engage in lower-risk forms of participation, such as management or
Private Sector Participation in Supplying Water to the HCMC leasing. These options leave
most of the responsibility for the heaviest financing with public sector.
Government and users often find it hard to minimize risks to attract investor interest. Clearly,
private investors have to meet those costs they are best suited to manage, such as construction
costs, treatment plant performance and billing. However, other risks, like foreign exchange
and political or regulatory risks are more properly assigned to governments.
One point about private water operating companies is that they are limited in number. Nor
will they have an unlimited capacity for investments. Most governments understandably aim
to attract large water companies in the hope that these one-stop shops can meet all investment
needs. But these firms want to concentrate on the largest, most potentially profitable
opportunities. Governments should spend more time studying the role that the local private
sector could play in providing water services.
Once a business partnership is in place, the job is far from over. All good partnerships require
work and governments have to constantly attend to them. Their municipalities have to set
infrastructure performance standards to reflect local needs and demand. Customers,
environmental advocates and raw water users will continue to look to governments to set and
enforce standards for pollutant discharges to surface and groundwater. Neglecting their
demands would not just hurt social objectives, but undermine the business project, too.
The level at which standards are serving will naturally have cost implications. So, a realistic
balance has to be struck between customer and environment protection and the need to
maintain affordable water services. But health must be a priority. And honesty and
transparency between partners and with the public will help to maintain confidence. Public
vigilance and scrutiny of private partners must be embedded in any contract; setting targets
and imposing strict reporting mechanisms are vital to maintaining good governance and
commitment on all sides.
Realistically, governments must shop for the form of private involvement that best fits local
needs. Many models are possible and there is no universal solution. Some may decide that
public-only is best; others might be attracted by independent oversight. Some private partners
will be eager to take on more risks, others may prefer to start with less.

Chapter 3: Private Sector Participation in Supplying Water to the HCMC
50
Knowing where the real limits lie comes with negotiation and experience. But the ultimate
test is public response. The public’s awareness and involvement can help foster understanding
and patience, as well as infuse the project with the discipline of public demand. Users will pay
Private Sector Participation in Supplying Water to the HCMC more water services only if
they feel it is worth it. Information and community participation are the social rocks on which
all good partnerships can be built (Borkey, 2003).
When the government hands over the responsibility of the water sector to the private sector it
could potentially cause equity problems (Moriarty et al., 2002). Even with increased PWP,
public authorities will still have to ensure that the services providers do not use their market
power to exploit customers. Since public utilities are usually not subject to the disciplines of
the market they have fewer incentives to minimize costs and maximize tariff collection rates
and provide services in the manner which customers demand. They are also constrained by
bureaucratic requirements which do not affect private firms.
The most effective private sector participation happens when the governments establish
independent price and service regulators. The best example of this is the Essential Service
Regulator operating in Melbourne, Australia.
One city in a developing country and one city in a developed country are scrutinized to see
how water supply could be best provided to consumers in HCMC. Manila in the Philippines
and Melbourne in Australia are the two cities picked for closer scrutiny.
Manila is a city with many similarities to HCMC. Both cities have gone through the same
economic development. HCMC is in the same period that Manila was in 1990s. Water supply
issues facing in Manila are also found in HCMC. Therefore, management strategies which
were successfully implemented in Manila could be possibly migrated to HCMC together with
other initiatives adopted from the two cities. Through the development of Manila, the city has
also failed in implementing some measures. The drawbacks are valuable lessons for HCMC to
stay one step ahead of Manila by avoiding mistakes Manila has gone through.
Melbourne water is considered to be one of the best water supplies in the world even though
Australia is one of the driest continents. In the long-term, HCMC target should also be to
achieve the world standards in water supply. It is therefore, an advanced management strategy
in Melbourne and Melbourne’s achievements are HCMC’s prime objectives. It is necessary to
study achievements of Melbourne Water and blend in to it the positive aspects of the Manila
system to set the unique water resource management for HCMC.
Chapter 4: International Experience
51
4. INTERNATIONAL EXPERIENCE
One city in a developing country and another city in a developed country are examined to
assess whether water resources strategies adopted are applicable to the water supply situation
in HCMC. Manila in the Philippines and Melbourne in Australia were chosen as the
representative cities. This chapter summarizes the Water Resources Strategies in Manila and
Melbourne and discusses the adoptability to HCMC.
Manila is a city with many similarities to HCMC which many water supply issues facing in
Manila are also found in HCMC. Management strategies which were successfully
implemented in Manila could be possibly migrated to HCMC and drawbacks should be
avoided.
Melbourne’s water supplied by Melbourne Water Corporation is considered one of the best
water supplies in the world. In the long-term, HCMC’s target is also to achieve a world
standard in the water supply industry. It is therefore, prudent that HCMC carefully study
management strategies adopted for Melbourne to ensure a sustainable water future.
4.1. WATER RESOURCES STRATEGY FOR MELBOURNE AUSTRALIA
Melbourne city is supplied with the world’s best quality water taken mainly from largely
uninhabited and forested catchments. This provides substantial advantages for Melbournians.
Nevertheless, all over the world water is a limited and considered as a precious resource and
there is an ever increase in demand due to population and industrial growth. There is also a
growing awareness of the environmental issues and impacts of building new dams or
diverting water from streams. Melbourne has experienced below average rainfall for the last 8
years. This has significantly reduced water storages which have forewarned Melbourne’s
water authority about the vulnerability and possible threats to supply security of water
resources in Melbourne (Melbourne Water, 2004). Melbourne needs to ensure that effective
and efficient planning is carried out to ensure water supply for future generations. Melbourne
does not face an immediate water crisis; however the combined effects of growth in
population and increase in rates of water consumption ultimately mean that available supplies
of potable water will be inadequate at some point in the future. The State Government of
Victoria together with Melbourne’s water authorities has developed a water resources strategy
to ensure a sustainable water future. The following section will summarise the current water
use pattern in Melbourne and the strategy adopted to ensure a sustainable water future.
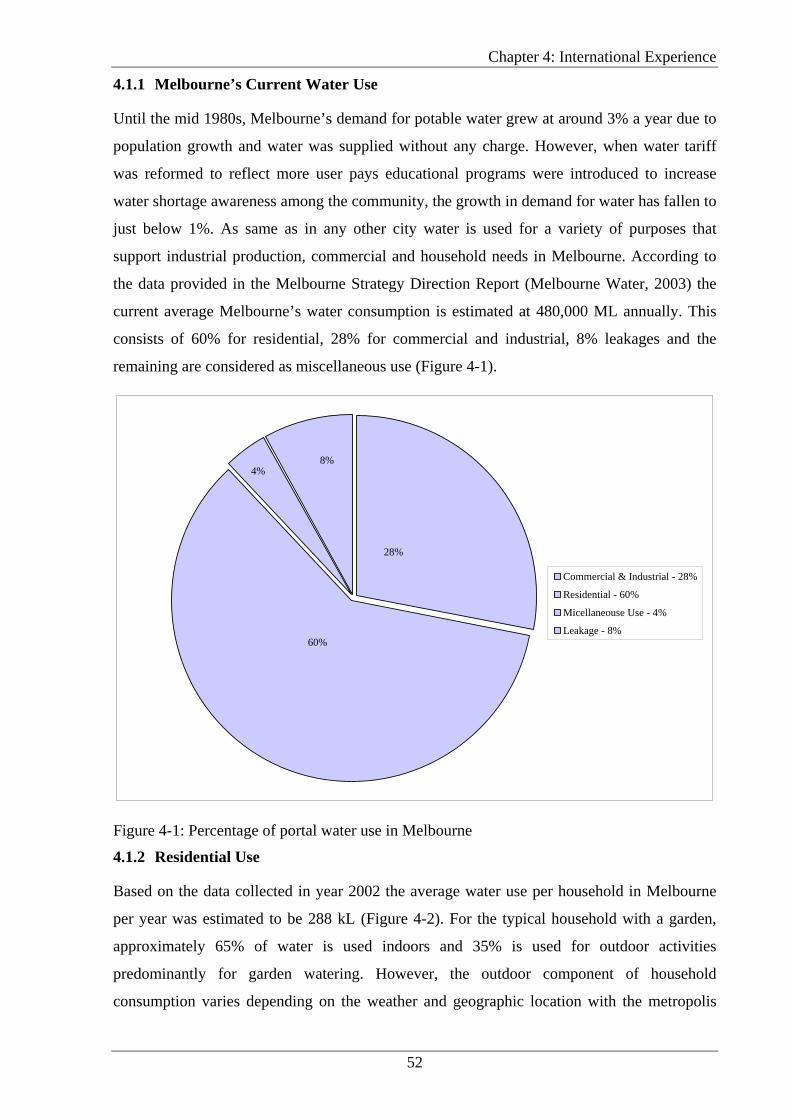
Chapter 4: International Experience
52
4.1.1 Melbourne’s Current Water Use
Until the mid 1980s, Melbourne’s demand for potable water grew at around 3% a year due to
population growth and water was supplied without any charge. However, when water tariff
was reformed to reflect more user pays educational programs were introduced to increase
water shortage awareness among the community, the growth in demand for water has fallen to
just below 1%. As same as in any other city water is used for a variety of purposes that
support industrial production, commercial and household needs in Melbourne. According to
the data provided in the Melbourne Strategy Direction Report (Melbourne Water, 2003) the
current average Melbourne’s water consumption is estimated at 480,000 ML annually. This
consists of 60% for residential, 28% for commercial and industrial, 8% leakages and the
remaining are considered as miscellaneous use (Figure 4-1).
4%8%
60%
28%
Commercial & Industrial - 28%
Residential - 60%
Micellaneouse Use - 4%
Leakage - 8%
Figure 4-1: Percentage of portal water use in Melbourne
4.1.2 Residential Use
Based on the data collected in year 2002 the average water use per household in Melbourne
per year was estimated to be 288 kL (Figure 4-2). For the typical household with a garden,
approximately 65% of water is used indoors and 35% is used for outdoor activities
predominantly for garden watering. However, the outdoor component of household
consumption varies depending on the weather and geographic location with the metropolis
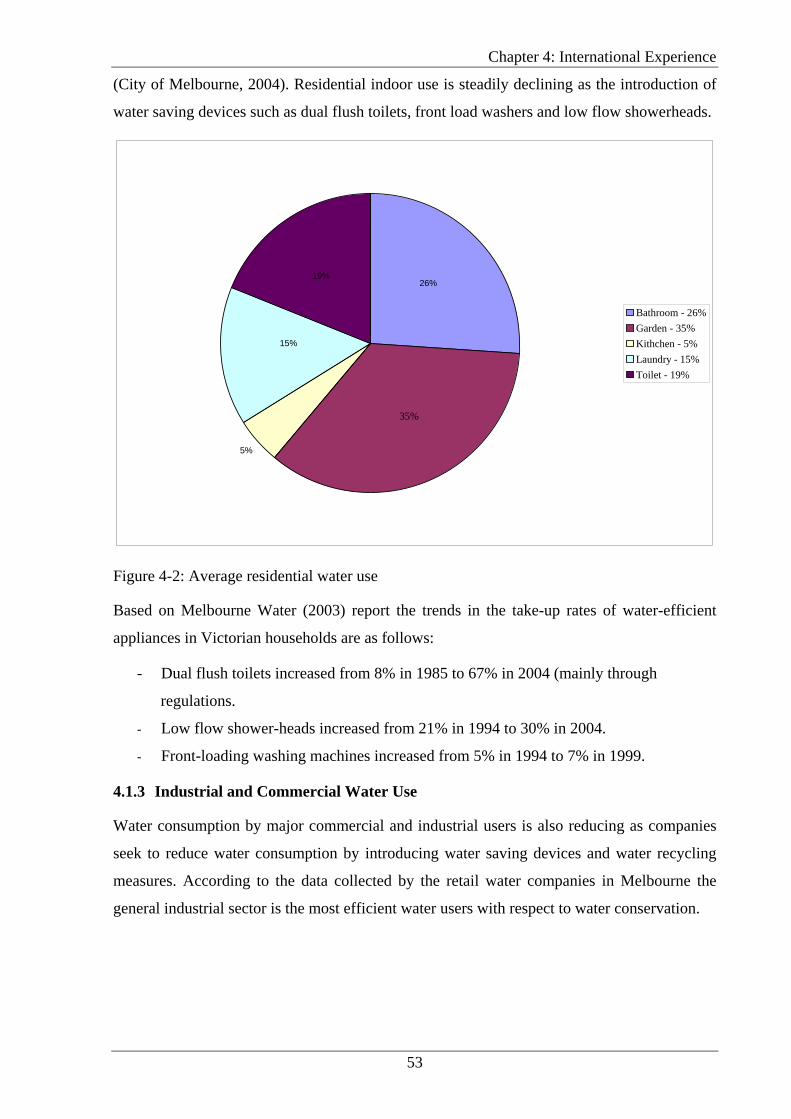
Chapter 4: International Experience
53
(City of Melbourne, 2004). Residential indoor use is steadily declining as the introduction of
water saving devices such as dual flush toilets, front load washers and low flow showerheads.
5%
26%19%
15%
35%
Bathroom - 26%Garden - 35%Kithchen - 5%Laundry - 15%Toilet - 19%
Figure 4-2: Average residential water use
Based on Melbourne Water (2003) report the trends in the take-up rates of water-efficient
appliances in Victorian households are as follows:
- Dual flush toilets increased from 8% in 1985 to 67% in 2004 (mainly through
regulations.
- Low flow shower-heads increased from 21% in 1994 to 30% in 2004.
- Front-loading washing machines increased from 5% in 1994 to 7% in 1999.
4.1.3 Industrial and Commercial Water Use
Water consumption by major commercial and industrial users is also reducing as companies
seek to reduce water consumption by introducing water saving devices and water recycling
measures. According to the data collected by the retail water companies in Melbourne the
general industrial sector is the most efficient water users with respect to water conservation.
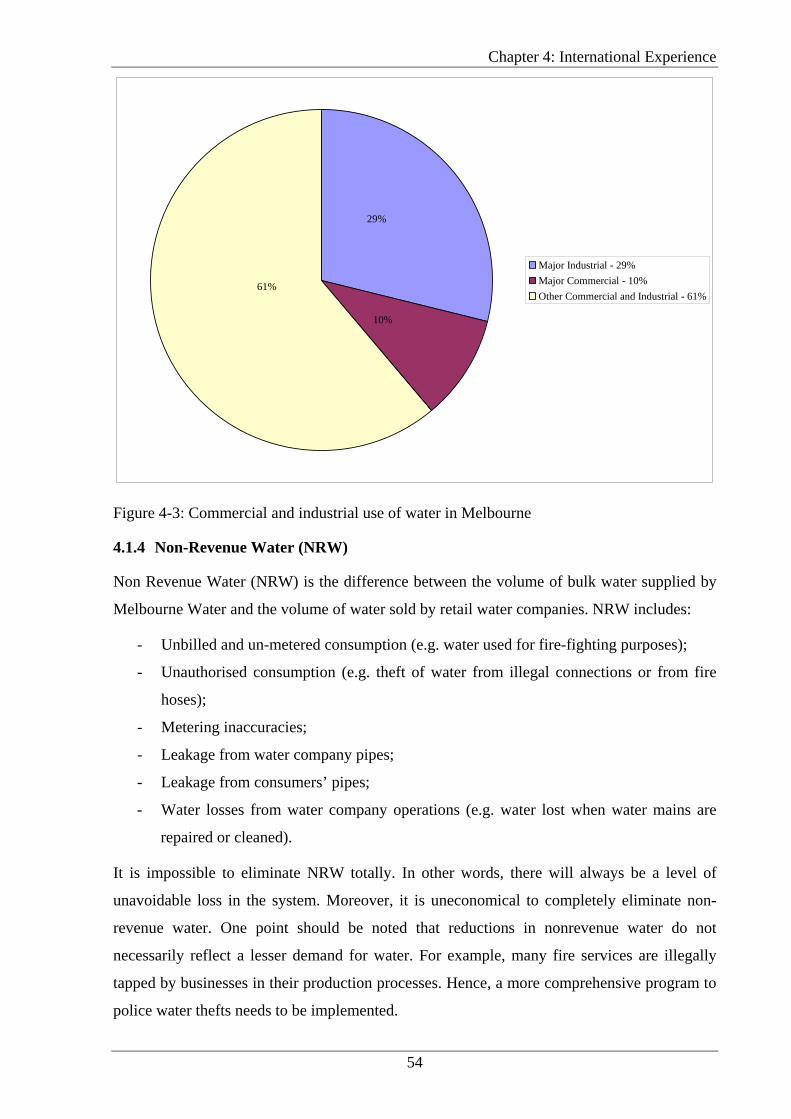
Chapter 4: International Experience
54
29%
61%
10%
Major Industrial - 29%Major Commercial - 10%Other Commercial and Industrial - 61%
Figure 4-3: Commercial and industrial use of water in Melbourne
4.1.4 Non-Revenue Water (NRW)
Non Revenue Water (NRW) is the difference between the volume of bulk water supplied by
Melbourne Water and the volume of water sold by retail water companies. NRW includes:
- Unbilled and un-metered consumption (e.g. water used for fire-fighting purposes);
- Unauthorised consumption (e.g. theft of water from illegal connections or from fire
hoses);
- Metering inaccuracies;
- Leakage from water company pipes;
- Leakage from consumers’ pipes;
- Water losses from water company operations (e.g. water lost when water mains are
repaired or cleaned).
It is impossible to eliminate NRW totally. In other words, there will always be a level of
unavoidable loss in the system. Moreover, it is uneconomical to completely eliminate non-
revenue water. One point should be noted that reductions in nonrevenue water do not
necessarily reflect a lesser demand for water. For example, many fire services are illegally
tapped by businesses in their production processes. Hence, a more comprehensive program to
police water thefts needs to be implemented.
Chapter 4: International Experience
55
The level of non-revenue water in Melbourne is around 12% (Melbourne Water, 2003), which
is low by international standards. According to the above report this figure has been
considerably reduced over recent years as a result of a number of measures which include the
installation of more accurate meters and sophisticated leak detections. In addition, programs
aimed at reducing the theft of water, quicker response times to repair bursts and leaks and
better system monitoring techniques that use the latest electronic telemetry have been
introduced. Collectively these initiatives have reduced water losses.
4.1.5 Future options for Melbourne’s Water Use
Melbourne Water has carried out projections of population growth until year 2050 and
implemented a suit of initiatives including water conservation practices and developed a
comprehensive Water Conservation Strategy to ensure a sustainable water future (Melbourne
Water, 2003).
These strategies were developed based on the following four options:
- Squeeze more water from the existing supply system by promoting conservation
(government incentives);
- Change the behaviour of water users to reduce demand and provide capacity for
population growth (community education);
- Reduce demand for potable water from the current supply system by substituting
recycled water (use of fit for purpose alternative supply such as recycling);
- Further develop the water supply system where possible to increase water harvest
(traditional augmentation option).
The planned actions to implement the above options and the outcomes that will be achieved
are depicted diagrammatically in Figure 4-4.

Chapter 4: International Experience
56
Figure 4-4: Water reduction options
Squeezing more from the current supply system
With the supply capacity remains unchanged, in order to increase the amount of water
available, following potential actions were planned to be carried out:
Water restrictions
Water restrictions will be applied in Melbourne during dry period when there is not enough
water to meet normal or expected unrestricted needs. Water restrictions will be introduced
when there is lower than expected water storage volumes and flows to reservoirs (restriction
triggers are related to total storage level) or higher than expected demand for water caused by
hot weather. Water restrictions are typically common during drought periods. Droughts may
last a few months or many years. Its impact depends on the amount of water in storage (from
rainfall in previous years). For example, the dry conditions of 1997 in and around Melbourne
had little immediate impact because water storages were full after a wet 1996. In August
2003, after six years of below average stream flow, storage levels fell to about 40% of
Source: Water Strategy Direction Report 2003
Improve system efficiency and review level of
services
Squeeze more from Current
system
Reduce demand to
within the limits
Substitute with recycled water
Seek new water sources
Reduce demand to
within the limits
Reduce demand to
within the limits
Reduce demand to
within the limits
Reduce demand to
within the limits
Change water uses behaviour
to reduce demand
Blend of system,
recycling of water
Obtain additional sources
Action Outcome Aim
Chapter 4: International Experience
57
capacity. In 2005 Melbourne was in its eighth consecutive year of drought and has regarded
drought as a normal part that must be managed. Water restrictions were introduced in
Melbourne. A ban on the use of sprinklers during certain parts of the day, a ban on the hosing
of pavements or a ban on the use of hoses for washing cars were some of the permanent water
saving measures implemented by Government.
Melbourne Water supply system was designed to have restrictions during severe drought
periods. The frequency, severity and duration of restriction periods are determined using
complex computer models of the particular water supply system. There are four stages of
restrictions triggered by total storage volume, each of increasing severity. The factors used to
determine when restrictions are required include the expected flows into Melbourne’s
reservoirs during a drought, the operating constraints of each reservoir, the expected level of
water consumption under staged water restrictions and the anticipated recovery of reservoir
levels following the drought (Melbourne Water, 2001).
If the water restrictions are implemented, then less water could be drawn from the storages
under average conditions. A preliminary estimate by Melbourne Water is that a 8000 ML per
year could be saved if water restrictions are introduced once every 10 years for up to 18
months period (Melbourne Water, 2001).
Saving in non revenue water
Non Revenue water in Melbourne is approximately 12% which is considered low by
international standards (Melbourne Water, 2003). Due to the physical nature, the extent of the
water supply pipe network and low percentage of NRW in Melbourne, the cost of additional
works to further reduce leakage can eventually become uneconomical. However, non-revenue
water minimisation programs have been one of the water saving measures. The aim is to reach
an economic level of leakage beyond which it becomes uneconomical to continue identifying
and rectifying leaks. This level which is defined by International Water Association is
estimated to be met in Melbourne in around 10 years. The programs include the replacement
of bulk billing and customer meters with more accurate meters, improved response times to
burst water mains, identifying unauthorised usage and leaks and overall system improved
management. Savings through non revenue program was expected to be 2,200 ML per year.
Pressure management
In some areas of Melbourne, due to the high elevation of storage reservoirs and service
reservoirs the water pressure in the distribution pipes is high. This means that water
consumption in these areas could be higher than places with low pressures. Furthermore, high
Chapter 4: International Experience
58
pressure leads to more water leakage and likely to burst pipes. These issues can be avoided if
the pressure is properly managed and people still being served with adequate water. The
reduction of water pressure often involves the construction of expensive pressure-reducing
valves. Previous studies in Melbourne have been inconclusive in determining the actual
savings in water due to managing the pressure (Melbourne Water, 2003). However, it can be
expected that many households may use less water overall, contributing to a reduction in total
consumption. Another study (Liemberger et al., 2002) claimed that one of the simplest, yet
most effective means of reducing water losses is the use of pressure management. Further
studies about the actual savings are planned for Melbourne.
Reducing demand
There is a range of options that could be used to reduce per capita consumption of water.
Melbourne Water Resources Strategy report (Melbourne Water, 2003) planned to reduce the
demand for water by introducing the following options:
- Education and promotion;
- Reforming pricing;
- Providing incentives;
- Introducing regulation.
Reducing demand through education and promotion
There have been extensive education and promotion programs undertaken over the past 20
years in Melbourne (Melbourne Water, 2003). The programs targeted the whole range of
consumers in an attempt to change people’s attitudes and awareness about the precious and
scarce water resources. This has helped to save considerable amounts of water. The level of
knowledge and awareness correlated closely with the amount of water savings made.
Melbourne Water and metropolitan retail water companies have published many water
conservation literatures, such as tips on how to save water, and these materials were made
widely available to the public. These include regular newspaper advertisements on feature
water saving suggestions as well as current water storage levels. Water audit kits were
prepared to assist customers in identifying the areas for potential savings around the house.
The Strategy was aimed at the sustainability of water supply in the future. Therefore, the
programs also focused on children who will be the water users in the future. Habits, attitudes
are often take shape in early childhood. This can help to encourage water saving habits and
influence attitudes in the long term. In addition, such programs may also have an effect on the
whole household, where children normally take the message home to their parents. Other
educational material has also been provided to an extensive number of schools throughout
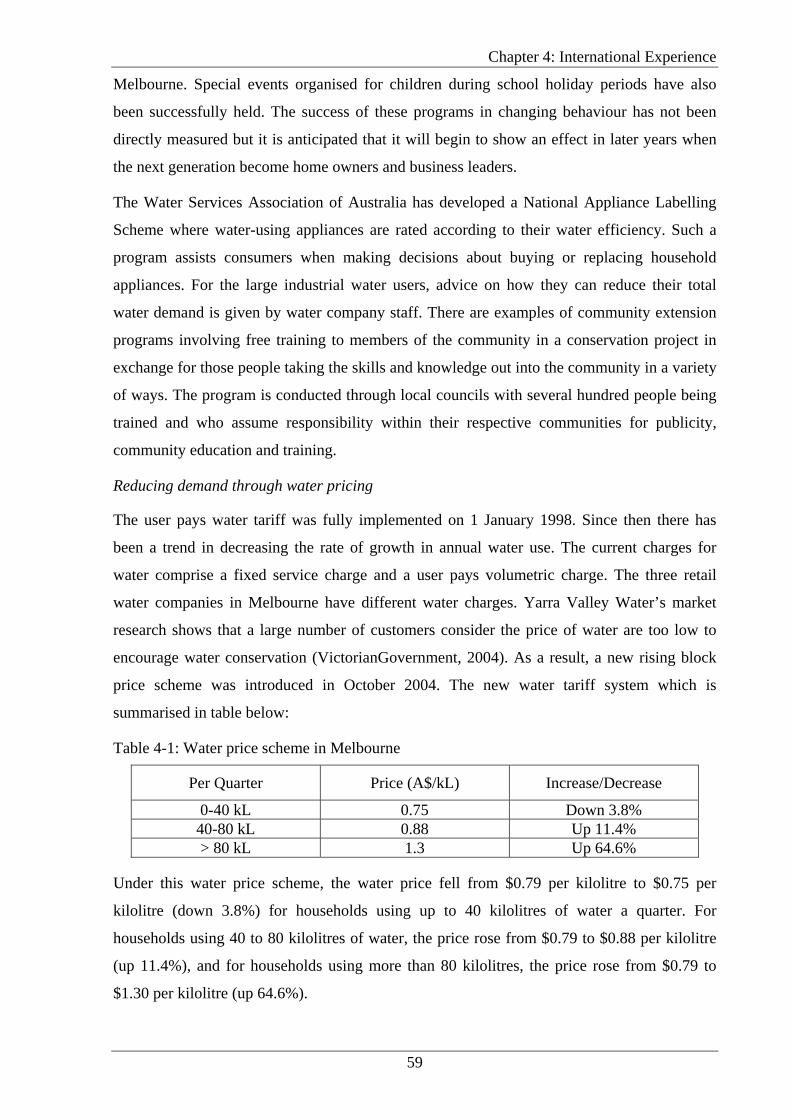
Chapter 4: International Experience
59
Melbourne. Special events organised for children during school holiday periods have also
been successfully held. The success of these programs in changing behaviour has not been
directly measured but it is anticipated that it will begin to show an effect in later years when
the next generation become home owners and business leaders.
The Water Services Association of Australia has developed a National Appliance Labelling
Scheme where water-using appliances are rated according to their water efficiency. Such a
program assists consumers when making decisions about buying or replacing household
appliances. For the large industrial water users, advice on how they can reduce their total
water demand is given by water company staff. There are examples of community extension
programs involving free training to members of the community in a conservation project in
exchange for those people taking the skills and knowledge out into the community in a variety
of ways. The program is conducted through local councils with several hundred people being
trained and who assume responsibility within their respective communities for publicity,
community education and training.
Reducing demand through water pricing
The user pays water tariff was fully implemented on 1 January 1998. Since then there has
been a trend in decreasing the rate of growth in annual water use. The current charges for
water comprise a fixed service charge and a user pays volumetric charge. The three retail
water companies in Melbourne have different water charges. Yarra Valley Water’s market
research shows that a large number of customers consider the price of water are too low to
encourage water conservation (VictorianGovernment, 2004). As a result, a new rising block
price scheme was introduced in October 2004. The new water tariff system which is
summarised in table below:
Table 4-1: Water price scheme in Melbourne
Per Quarter Price (A$/kL) Increase/Decrease
0-40 kL 0.75 Down 3.8% 40-80 kL 0.88 Up 11.4% > 80 kL 1.3 Up 64.6%
Under this water price scheme, the water price fell from $0.79 per kilolitre to $0.75 per
kilolitre (down 3.8%) for households using up to 40 kilolitres of water a quarter. For
households using 40 to 80 kilolitres of water, the price rose from $0.79 to $0.88 per kilolitre
(up 11.4%), and for households using more than 80 kilolitres, the price rose from $0.79 to
$1.30 per kilolitre (up 64.6%).
Chapter 4: International Experience
60
Reducing demand through incentives
Closely linked with education and promotion of water conservation is the idea of providing
incentive programs to consumers. Incentives programs involve some form of financial
incentive in which consumers take up an offer to have water saving devices fitted. Examples
of incentives are the subsidization of purchase and operation of water saving appliances. It
will create the stimulus for the change to adopt ideas on water saving. There are already a
number of successful examples of such incentive programs both in Australia and
internationally. In one example, consumers were asked to pay only 20% of the cost of
purchasing low -flow shower roses, taps flow restrictors and toilet cistern weights. The results
of this program showed that there was an average of 35 kL saved in annual water
consumption per participating household, as well as an estimated 524 kWh per annum saving
in energy arising from reduced hot water use. The annual combined savings in water and
energy costs to consumers was approximately $A68 per household with approximately $A30
relating to water savings.
Kalgoorlie in Western Australia also trialled a number of incentives (Institution of Engineers,
1999) including:
- A $4 per square metre incentive for replacing lawn with pavers;
- Free mulch to the value of A$200;
- Water-efficient plants up to A$80.
These measures helped the water authority avoid the cost of upgrading a 500 km pipeline.
Another incentive program could be the offer of discounts or rebates when water-efficient
appliances are purchased (Melbourne Water, 2001).
Reducing demand through regulation
Market research in Melbourne suggests that some people see regulation as a fairer way of
achieving water savings because everyone has to contribute, not only community-minded
citizens. Regulations have been introduced since it is a more certain way of achieving water
savings. However, regulation does not allow consumers any flexibility. The two regulations
commonly applied in Melbourne are water restriction and retrofitting programs.
In October 2002 level 1 water restriction was introduced. Main level 1 restrictions are bans on
washing paths and patios, bans on the use of regular hoses to wash cars and restriction on
hours garden sprinkler can operate. Level 2 restrictions was a prohibition on watering lawns.
In Mildura and Perth, permanent low level water restrictions have been used during all
summer. This form of regulation could be used in Melbourne; for example, a ban on the use

Chapter 4: International Experience
61
of sprinklers during certain parts of the day or a ban on the hosing of pavements. At the
moment, such activities are only prohibited when water restrictions are in force. The
Government is in the process of introducing these initiatives as permanent water saving
measures with new legislation.
In addition to Melbourne’s water restrictions, there are other regulations that are intended to
save water. These include mandated dual-flush toilets and water-efficient shower-heads. From
July 2005 new houses in Melbourne must include either a water tank or a solar energy unit. In
Melbourne in the mid 1980s, dual flush toilets were made compulsory in all new homes and
whenever old toilets were replaced. Retro-fitting was not made compulsory at the time
because the water savings would not justify the costs. One consequence of this is that it took
about 10 years to increase the proportion of dual flush toilets from 10% to 60%.
Substitution water sources
Instead of reducing the demand for water, one option is to tap into other sources within water
cycle. Possible sources include capturing rainwater in tanks, using stormwater, reusing treated
effluent or reusing some household wastewater. These water sources would need to be treated
before being used for productive purposes. Widespread negative human perception about
waste water, make any further consideration of treating sewage water for human
consumption. However, people are willing to use lesser quality water (when compared to
potable) for other purposes such as garden watering, toilet flushing and car washing. The
water saved would then be deferring the need for new potable sources. Regulation must be
enforced during the planning stage for the development of new residential places (green field
sites) since it will be more economical at the planning stage to introduce third pipe recycling,
compared with the costs of retrofitting after a place has been built.
There have been some notable examples of water sensitive urban design in Australia. Some
towns with much lower volumes of sewage than Melbourne have high rates of water
recycling. For example, all of the water from some treatment plants in the Gippsland and
Grampians region is recycled for local agriculture (Melbourne Water, 2003).
Melbourne Water’s Eastern Treatment Plant treats about 40% of Melbourne’s sewage.
Recycled water from the plant is used in operations both onsite and offsite. In 2004/05 15,034
million litres of water was recycled from Eastern Treatment Plant, 13,408 million litres of this
was used onsite. The Western Treatment Plant treats about 52% of Melbourne’s sewage. Low
rainfall and numerous potential customers close to the plant present opportunities for
significant water recycling schemes to Melbourne’s west. The plant has the potential to
produce enough recycled water to replace about one-quarter of Melbourne’s drinking water

Chapter 4: International Experience
62
that is used for non-drinking purposes. Melbourne Water has completed a major $160 million
upgrade of the plant which has increased the availability of recycled water (Melbourne Water,
2006).
Melbourne Water has trialled onsite water recycling plants in parks around Melbourne,
demonstrating that water from sewers can be successfully recycled and used to keep parks and
gardens green. This technology could eventually be used to irrigate significant parkland and
community recreation areas.
Recycled water can be used to replenish overdrawn aquifers, and improve groundwater
availability and water quality. Recharging aquifers is also an alternative when surface storage
is impractical because of limited space, high evaporation rates or the presence of algae.
Melbourne Water is investigating opportunities for aquifer storage and recovery and, if
appropriate, will use the findings to develop strategies to store recycled water underground to
benefit the environment and/or for future use.
The Rouse Hill development in Sydney trialled the use of recycled treated sewage effluent
throughout the development through a ‘third pipe’ for non potable use. Recycled water is
used in the Rouse Hill Development Area in Sydney's north-west. The area includes parts of
Rouse Hill, Parklea, Stanhope Gardens, Glenwood, Acacia Gardens, Kellyville, Kellyville
Ridge and a small part of Castle Hill and Quakers Hill. More than 15,000 properties in the
Rouse Hill Recycled Water Area are currently connected to recycled water. Recycled water
has been available since August 2001. On average the scheme is reducing demand for
drinking water by 35 per cent, for every household
(http://www.sydneywater.com.au/SavingWater/Recycling/RouseHill.cfm accessed on 12th
June 2005). These homes have two water pipes: recycled water and drinking water. The
recycled taps, pipe-work and plumbing fittings are colored lilac to ensure that the recycled
water is not confused with drinking water. The homes will use recycled water for gardening,
washing cars, toilet flushing, park and golf course irrigation and industry in the area.
Figtree Place Project in Newcastle incorporates water conservation and stormwater retention
features in site redevelopment and construction of housing units. This water recycling project
is designed to store and hold as much rainwater as possible on-site so eliminating storm water
discharge from the site. By focusing on storm water source control, the quantity of the
stormwater overflowing downstream to the harbour will be reduced. The water reuse element
of the project incorporates underground water tanks. These collect roof rainwater for
distribution to domestic hot water and toilet flushing systems in the dwellings. The water
reuse element also includes a landscaped aquifer recharge basin designed to provide
Chapter 4: International Experience
63
groundwater for garden irrigation on the site and for industrial use at the adjacent Hamilton
Bus Depot. An overall savings in the main water demand of up to 60% is expected
(http://www.communityhousing.org.au accessed 12th June 2005).
New water sources
In the case water demand is not met after implementing all the alternative measures to reduce
potable water use then additional new sources of supply for Melbourne will be required. In
Melbourne there are no current plans for seeking new water resources from rivers for the
potable supply system. Given the importance of maintaining environmental flows in rivers
and the potential impact on other water users, any decision to secure additional sources will
only be made after thorough environmental impact processes, extensive community
consultation and detailed planning. The Melbourne Water Tarago reservoir is not currently
used to supply water to Melbourne. Its catchment is partly inhabited leading to poorer water
quality. Full filtration is required before water could be supplied to consumers. One possible
solution is reconnecting the Tarago Reservoir and by construction a new pipeline from the
O’Shannassy Reservoir. It is anticipated that it will increase the water supply to 21,000
ML/year (Melbourne Water, 2001).
4.2. PHILIPPINES WATER PRIVATISATION
4.2.1 Introduction
During the middle of 1990s, the reliability of water supply to Manila was a major concern.
There were only 2ML per capita freshwater available – the second lowest in the world and
only a couple of hundred cubic meters away from being considered a water-stressed situation.
Only 23% of the population had water supply available in their houses; 77% had none, relying
directly on source points (such as springs) or depended on community faucets (Nacpil, 2004).
In early 1990s a major power crisis in the Philippines was successfully dealt by initially
privatising the power sector. Then President Fidel Ramos wanted the same model adopted to
resolve Manila’s growing water crisis. Metropolitan Manila Waterworks and Sewerage
System (MWSS) were established in 1878. Until it was privatized in July 1997, MWSS was
the government-owned water supply, treatment and distribution utility serving over 11 million
people in 37 cities and municipalities in the Metro Manila area and some parts of the
provinces of Cavite and Rizal. Using the proportion of unpaid water, hours of water
availability and the ratio of people having water supply connections as indicators of
efficiency, the performance record of MWSS was lagging behind other water systems in most
capital cities in South East Asia. Its operations steadily deteriorated due to years of

Chapter 4: International Experience
64
underinvestment in facilities and failure to address non revenue water (NRW) which stood at
over 60% in the mid-1990s (Esguerra, 2003).
In 1997 the privatisation of the MWSS, dubbed as the largest water privatisation project in the
world was completed. MWSS awarded 25-years period concessions to two consortia to
assume full operational and investment responsibilities for the city’s water and sewerage
system. The two consortia, the Manila Water Company Inc. (MWC), became responsible for
the management and development of the water system in the eastern part of the city and
Maynilad Water Services Inc. (MWS) was given the same responsibilities in the western part.
Under this concession agreement, the water concessionaires are expected to bring NRW down
to 25% in 10 years. Also, the concessionaires will pay the foreign debt obligation and other
outstanding loans of the MWSS. MWS will shoulder 90% of the total debt servicing, while
MWC will shoulder 10%. Through private sector participation, the MWSS privatisation was
expected to result in the expansion of service coverage, improvement in the levels of service
delivery and increased operating efficiency, particularly in the reduction of NRW.
Details of the winning rate bids are presented in Table 4-2. The MWSS deal was not a full
privatisation arrangement. The Philippine government retained ownership of MWSS assets.
What the Concession Agreement provided was to give the private sector the right to use these
assets. It also imposed an obligation on the private company to maintain and expand these
assets at the companies’ own expense.
Table 4-2: Winner consortia for the privatisation
Consortia Rate Bid
Coefficient (a)
MWWS Tariff Peso/m3
(b)
New Tariff Peso/m3 (a) x (b)
WEST ZONE Operator: Maynilad Water Services, Inc.Local Sponsor: Benpres Holding Corporation International Operator: Lyonnaise des Eaux (France)
0.566
8.78 4.97
EAST ZONE Operator: Manila Water Company, Inc. Local Sponsor: Ayala Corporation International Operator: North West Water (UK)
0.264 8.78 2.32
Source: (Rivera, 2003)

Chapter 4: International Experience
65
4.2.2 Privatisation Model
In consultation with International Finance Corporation (IFC), MWSS decided to adopt a
concession model as the model of entry of the private sector. As mentioned earlier, in the
concession model, the Philippine government retained ownership of MWSS assets.
Concession Agreement gave the private sector the right to use these assets. It also imposed an
obligation on the concessionaire to maintain and expand these assets at the companies' own
expense. At the end of 25 years, everything including all the improvements paid for by the
company reverts back to the government. In return for all these, the private companies were
given the right to collect a fee from users, which is to be regulated by an MWSS Regulatory
Office. Furthermore, to ensure competitive benchmarking, MWSS divided its networks area
into two zones: East Zone and West Zone. This model is a measure intended to break up the
monopoly powers that a concessionaire would otherwise have after winning the bid. The
regulators can check the performance of one concessionaire against that of the other. It also
provides leverage with which to judge petitions for possible price increases. This entailed
auctioning two 25-year concessions through competitive bidding and giving the winning
bidders the responsibility to handle water treatment, distribution, tariff collection, facility
improvement and overall management. The contractual arrangements between MWSS and its
concessionaires were formalized under two Concession Agreements. After a 25-year
concession period, the private sector or concessionaires are expected to have earned a
guaranteed and appropriate return on their investments, cleaned up the system, put all the
MWSS’ financial obligations in order and laid an efficient water supply system for the
metropolis.
4.2.3 Concession Agreement and Regulatory Structure
The concession agreement between MWWS and private company that are Maynilad Water
Services, Inc. and Manila Water Company, Inc. had the following key provisions:
- Creation of the regulatory office
- Key service obligations
- Other obligations of the private sector
- Rate setting procedures; and
- Dispute resolution.
Service Obligations
The private participants are expected to achieve following targets:
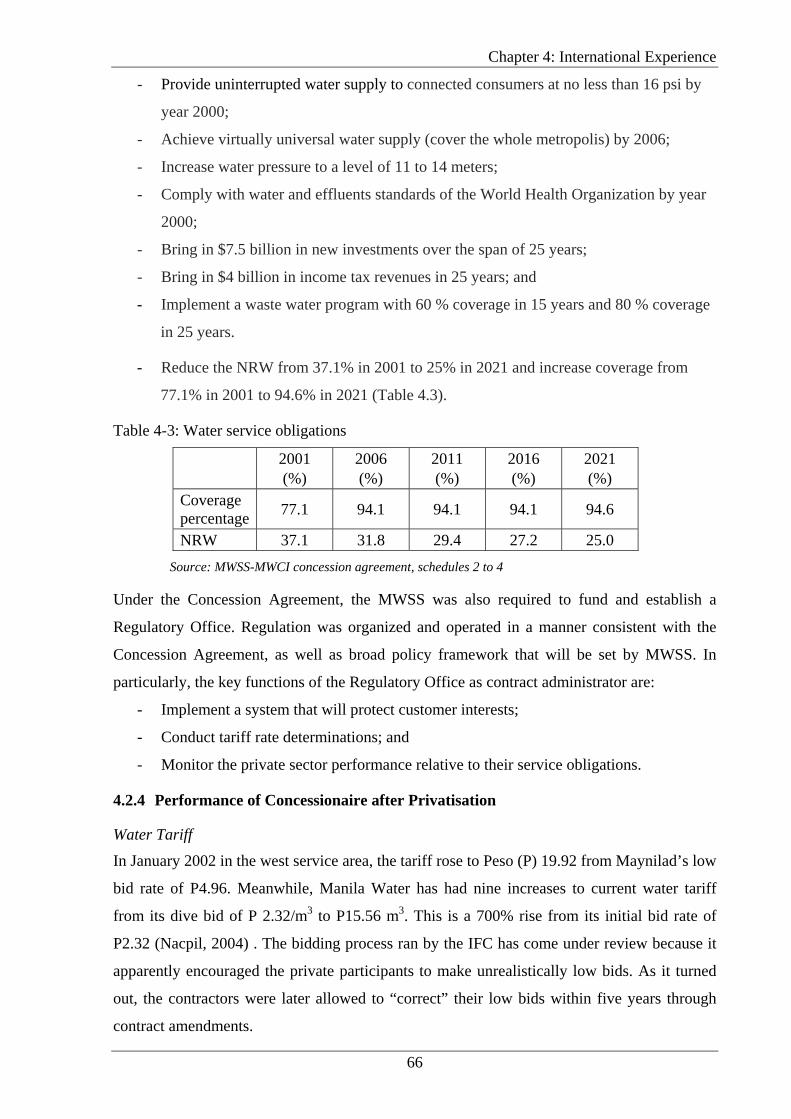
Chapter 4: International Experience
66
- Provide uninterrupted water supply to connected consumers at no less than 16 psi by
year 2000;
- Achieve virtually universal water supply (cover the whole metropolis) by 2006;
- Increase water pressure to a level of 11 to 14 meters;
- Comply with water and effluents standards of the World Health Organization by year
2000;
- Bring in $7.5 billion in new investments over the span of 25 years;
- Bring in $4 billion in income tax revenues in 25 years; and
- Implement a waste water program with 60 % coverage in 15 years and 80 % coverage
in 25 years.
- Reduce the NRW from 37.1% in 2001 to 25% in 2021 and increase coverage from
77.1% in 2001 to 94.6% in 2021 (Table 4.3).
Table 4-3: Water service obligations
2001 (%)
2006 (%)
2011 (%)
2016 (%)
2021 (%)
Coverage percentage 77.1 94.1 94.1 94.1 94.6
NRW 37.1 31.8 29.4 27.2 25.0 Source: MWSS-MWCI concession agreement, schedules 2 to 4
Under the Concession Agreement, the MWSS was also required to fund and establish a
Regulatory Office. Regulation was organized and operated in a manner consistent with the
Concession Agreement, as well as broad policy framework that will be set by MWSS. In
particularly, the key functions of the Regulatory Office as contract administrator are:
- Implement a system that will protect customer interests;
- Conduct tariff rate determinations; and
- Monitor the private sector performance relative to their service obligations.
4.2.4 Performance of Concessionaire after Privatisation
Water Tariff
In January 2002 in the west service area, the tariff rose to Peso (P) 19.92 from Maynilad’s low
bid rate of P4.96. Meanwhile, Manila Water has had nine increases to current water tariff
from its dive bid of P 2.32/m3 to P15.56 m3. This is a 700% rise from its initial bid rate of
P2.32 (Nacpil, 2004) . The bidding process ran by the IFC has come under review because it
apparently encouraged the private participants to make unrealistically low bids. As it turned
out, the contractors were later allowed to “correct” their low bids within five years through
contract amendments.

Chapter 4: International Experience
67
Table 4-4: Manila water rates through different periods
Period Rates (Peso)/m3
Pre-privatisation 8.78 1997-1998 (bid rate) 2.32 1999 (increase) 2.61 2000 (increase) 2.76 Jan – Mar 2001 (increase) 2.95 Apr – Nov 2001 (ADR adjustment) increase 3.22 Nov 2001 Contract Amendment (increase) 4.22 2002 (with FCDA) (increase) 6.75 Rate Rebasing (increase) 14.22
Table 4-5: Maynilad water rates through different periods
Period Rates (Peso)/m3
Pre-privatisation 8.78 1997-1998 (bid rate) 4.96 1999 (first increase) 5.80 2000 (increase) 6.13 Jan-Oct 2001 (increase) 6.58 Oct 2001 Contract Amendment (4th increase) 10.79
Rate Rebasing (increase) 26.00 The difference in the water tariff charged by the Manila Water and Maynilad can be explained
by each company’s debt burden. When the Metro Manila area was split into two zones,
MWSS’s debt was also divided according to where the investment proceeds from the loans
went. Ninety percents were directed to the Western Zone, and only ten percents went to the
Eastern Zone. Thus, Maynilad which won the West Zone had to shoulder 90% of MWSS’
debt. This higher share of the debt burden was reflected in their 4.54 Pesos/m3 winning bid in
1997 as against to Manila Water’s 2.32 P/m3 bid offer for the eastern side which assumed only
10% of the former MWSS debts (Esguerra, 2003).
In 2000, Maynilad had demanded the government of then President Joseph Ejercito Estrada to
institute a mechanism called the Automatic Currency Exchange Rate Adjustment (Auto-
CERA), which has no basis at all in the concession agreement. The Auto-CERA would have
enabled the private concessionaires to pass on foreign exchange losses to consumers each
time the peso-dollar exchange rates fluctuated, without having to seek approval from the
MWSS (Nacpil, 2004).
When Estrada government was replaced by Gloria Macapagal Arroyo, Maynilad continued to
lobby hard for the Auto-CERA. Arroyo, who perhaps had no choice but to reject the
barefaced attempts of Maynilad to twist the contract to its liking, did so in February 2001. In
Chapter 4: International Experience
68
response, Maynilad unilaterally stopped paying concession fees, a decision it defiantly
follows to this day. Concession fees are comprised of payments for old MWSS loans and
funding for the operations of the MWSS Corporate Office and the Regulatory Office; as of
end-March 2003, Maynilad owed the government around US$91 million. Maynilad later
decided to try another route, this time assuring government that it would move within the
bounds of the contract. And so it petitioned the MWSS for an "accelerated" Extraordinary
Price Adjustment (AEPA) that would allow recovery of 1997-2000 foreign exchange losses in
only 18 months instead of 22 years (or the remaining life of the contract at the time). Despite
strong objections from consumers and civil society groups, the Arroyo government, in the
end, bailed out the Lopezes by allowing amendments to the concession agreement, which
consequently enabled Maynilad to seize both the Auto-CERA and the accelerated EPA. Water
rates quickly shot up to 15.46/cu.m. The Auto-CERA, later renamed as the Foreign Currency
Differential Adjustment (FCDA), ensured that consumers would be charged P4.07/m3 to
support the recovery of Maynilad's current forex losses arising from its payment of dollar-
denominated MWSS’s loans as well as its own loans (Nacpil, 2004).
Manila Water on the other hand, continued to work, albeit quietly, for its own rate increase,
by having its ADR or Appropriate Discount Rate (the real weighted average cost of capital
after taxes) amended to 18%. The Regulatory Office opposed this initially since the financial
model submitted by Manila Water during the bidding indicated only a 5.2% ADR (Esguerra,
2003). Costly arbitration procedures had to ensue to settle the matter, after which Manila
Water was deemed entitled to a 9.3% ADR. The decision was appealed by the Regulation
Office to the Courts and a Temporary Restraining Order was obtained.
Non revenue water
One of the major commitments of the private sector was to bring down NRW levels which
were more than 60% at the time of privatisation. Maynilad aimed to bring down the NRW to
30% by 2001 from 58% in 1997. To the contrary this has ballooned to almost 66% in 2004.
As for Manila Water, it managed to bring its NRW down to 48.28% by 2001 but this is still a
long way from the 16% target promised to consumers in the east (Fjeldsenden et al., 2005).
These failed commitments on NRW do not just show that the private water companies
dishonoured their agreements. These companies were also awarded lucrative contracts based
on promised NRW targets in the east and west zones.
Part of the inefficiency the two concessionaires inherited from MWSS was an incredibly high
NRW-figure. Reducing this profit -reducing/ devastating figure were made one of the main
targets of Manila Water. The company engaged in a highly aggressive campaign and was
Chapter 4: International Experience
69
successful in reducing NRW from 67% in August 1997 to a low of 47% by the end of October
2000. In contrast, we can see that the efforts of Maynilad have been far from successful. The
company is still fighting with NRW figures of around 65%. Another puzzling feature with this
discrepancy between Manila Water and Maynilad is that the area under Maynilad’s control,
the Western side, had a high number of new pipelines which logically would contribute to
reduction in NRW caused by leakage. However this is not the case. In contrast, Manila Water
with few new pipelines in the takeover period has managed to reduce the NRW figure
drastically. This calls for an explanation how Manila Water successfully reduced NRW.
(Dumol, 2001)
Supply and connection
Water Companies claim they have met their obligations in terms of area of coverage, but
based on performance, they clearly fell short of their service targets. Water supply is still
intermittent. MWSS regulators dispute both water companies’ claims of improved coverage,
citing exaggerated figures because of how the companies define a ‘water connection’ and how
they calculate number of persons in an average household. Moreover, a survey in year 2000
by MWSS, residents of 100 communities in Metro Manila, 55% thought there had been no
change in the water service while 12% claimed the service was worse; only 33% noticed an
improvement. Meanwhile, the high connection costs further marginalizes many poor
households and communities; consequently, they depend on small water vendors who sell
more expensive water that supplied through the piped grid system.
The service provided by Maynilad was unreliable. Water pressure was weak and supplies only
for few hours a day. Similar to some areas in Vietnam families have to wake up at midnight or
at dawn to store water because the supply is not continuous especially in populous and
elevated areas. In addition, the expansion of water service network is slow with 577,492
individuals in Maynilad areas not having water connections because expansion targets were
deferred for 3-5 more years. Many of these households are located in urban poor areas. They
are forced to buy water from water vendors who sell water 300 % - 500 % higher than
Maynilad prices. Or else, they pump water manually from communal/private pumps that are
usually located some distance from their houses. Furthermore 314,550 individuals in the
Manila Water-Bechtel areas, means nearly 1 million individuals in Metro Manila still have no
water connection. Again, this is not counting those who have water connections, but only get
3-5 hours of water flow in a day. This is a substantial part of the population but no exact
documentation exists (Montemayor, 2003).
Chapter 4: International Experience
70
Quality of water supply
The poor quality of water is especially galling given the tariff increases, and this poor quality
was dramatically brought to public attention with outbreaks of cholera, dysentery, etc.
resulting in at least seven deaths and more than 700 hospital cases. An independent probe
conducted by the Freedom from Debt Coalition also showed the presence of the coliform
bacteria (16 per 100 ml of water) at more than seven times the national standard of 2.2.
(Nacpil, 2004).
4.2.5 Philippine Water Privatisation
Concessionaires
Manila Water underbid all competitors in both zones by a 50% or more. However, the
government refused to give both zones and grant the concession in the West to Maynilad even
though its price of P4.97 per cubic metre was twice as high as Manila’s price of P2.51. As a
result, Manila Water got only the East zone at a price of P2.32. Since the price in the East of
the city is only 47% of the price in the West, it has created two concerns, one over economics
and another over social justice. Firstly, since Maynilad Water could save costs by buying its
water from Manila Water and would simply do that and neglect the infrastructure in its own
zone. Secondly, since the East contains the Manila business districts and other affluent zones,
it is unfair that it should pay so much less than the poorer neighbourhoods of the West. It
should be also noted that the bids made by the two winning companies were unsustainable.
They were dive bids, where the companies went in with extremely low bids just to win the
contract. Even though dive bids are not unusual, and nor is it unusual for companies to
operate at significant loss for the first few years, as long as they forecast higher returns later.
But in this case it seems the companies submitted dive bids with the assumption they could
later change the terms of the contract in their favour and actually they did so. Nevertheless, to
reject Manila Water’s lower bid would have been controversial, delaying and unacceptable
politically. The bid was accepted, despite some reservations by experts about its financial
viability. One of the contributing problems was that the Philippine government had no sound
studies on which to measure water demand for Metro Manila. They had no basis on which to
judge the feasibility of non-revenue water reduction, such as repairing the network. Thus the
financial models submitted in the bids made by the companies could be nothing more than a
corporate muddle, with unreliable figures and unsound business propositions.
The government also stipulated that 60 per cent of the winning company had to be Filipino
owned. As could be expected, the main beneficiaries of this policy were huge conglomerates,
Benpres and Ayala, owned by two of the richest families in the country with extensive
Chapter 4: International Experience
71
interests in telecommunications, broadcasting, mass transport, real estate, banking and power
distribution. Some feel that ensuring such large companies a majority stake in the lucrative
Manila contract is a gift to a powerful lobby that will increase the already high concentration
of economic power in the country (Esguerra, 2003).
Finally, some have questioned the method of the privatisation. The president called a state of
emergency, with the intention of making very rapid changes. Therefore some have said the
decision was made with minimal public discussion to keep the situation from becoming too
politicized. However, the implementation was subjected to a court challenge, and the court
ruled in the President's favour to continue with status quo.
Government
It is however very unfair to lay the blame of this on the private sector. The real situation is
that Maynilad and its sponsors have been ‘bled’ excessively for reasons that are totally
beyond their control. They have negotiated in good faith, and proposed many solutions. They
have not been able to secure any workable solutions from the client or the Philippine
government. Having faced this situation for a long period, they have been left with no realistic
alternative to giving notice to terminate the contract. This is certainly a failure. There are
obviously problems with a bidding process that relies on incomplete information and the
selection of an operator on the basis of the lowest price alone. These problems have been
recognised for many years, yet persist. Many of these problems can, and in the case of
Manila, could have been overcome.
Lessons learnt
Some of the lessons to be learnt from Manila’s experience are:
- It is necessary to be rigorous in doing careful investigation before privatisation. For
instance, water demand projections are useful in eliminating bids that have overly
optimistic projections of sales. It can also warn regulators about the extent to which
sales could decline as a result of a jump in tariff levels.
- Rate re-basing on set timeframes is the principal mechanism to install discipline in the
companies. But the threat of delayed rate re-basing may not always be deemed to be
credible by bidders, especially in a situation like the Philippines where the state has
historically been permeable to private interests. It is therefore crucial not to mess
around with these central mechanisms. The regulatory office should be under no
obligation whether real or imagined to bail out companies if they suffer the financial
consequences of unsustainable bids they have intentionally made.
Chapter 4: International Experience
72
- Regulatory arrangements applicable in one country will not automatically be
applicable in another. If the threat of delaying rate rebasing was successful in
forestalling dive bids in France, it does not mean that the mechanism will work
similarly in the Philippines (Esguerra, 2003).
- It makes a lot of sense for concession agreements to insist that the corporate sponsors
should put their own corporate balance sheets on the line, at least during the first
couple of years. That is, if companies are going to borrow loans for the investments
that their contracts require, they should put their own equity as collateral, and not
immediately resort to limited recourse financing. Higher investments from sponsors
can be reduced as the regulatory set-up improves
- It is important for the government itself to clarify right at the very beginning that it
will not tolerate dive bidding, and should inform the prospective bidders about some
of the key assumptions that they must make. Meticulous safeguards that force the
bidders to use reasonable assumptions may be the more effective means of preventing
adventurous bids from being made in the first place. There may be no easy way to cure
a problem when it already exists. Regulators and other public officials may choose to
exercise forbearance if they believe that there is a real danger that service delivery
could be jeopardized by the financial difficulties, whatever the nature, of a
concessionaire.
- The private sector should not be expected to take responsibility for risks that it has no
means to manage. It is also important for the public sector client to maintain an
equitable and constructive attitude to problem solving.
4.3. SUMMARY
Two contrasting strategies have been adopted by Government in Victoria, Australia and in the
Philippines to ensure efficient and sustainable water resources provision for Melbourne and
Manila respectively. The Water Resources Strategy developed for Melbourne relied
principally on five different initiatives to deliver a sustainable water future:
- Community education to appreciate scarcity and promote water conservation;
- Financial incentives to adopt water efficient appliances (eg. low flow shower-heads)
or water tanks;
- Tariff reform, especially introducing a two part tariff witch focuses on higher
volumetric users paying more;
- Promoting the use of alternative resources such as storm water and recycled water
provided it is treated to a fit for purpose quality; and
Chapter 4: International Experience
73
- Traditional augmentations such as extracting more water from streams where there is
surplus to environmental requirements.
The Essential Services Commission played an important balancing role in protecting in the
Victorian environment. Their charter ensured that they protected consumer interest by
ensuring that the water authorities delivered the levels of services promised to consumers and
at the same time ensured that the water companies were adequately financed to provide the
services in an economically efficient manner. The availability of high quality information and
the consumer’s willingness to pay for services (without political interference) assisted good
governance.
The Manila experience was significantly different. The Philippine Government decided to
follow a privatisation model for water that had been successfully adopted for the power
sector. The Metropolitan Manila Waterworks and Sewerage was established and two
consortia Manila Water Company and Maynilad Water Services Inc. given contracts to
service the City. One of the key focus areas were the targets set for reducing non-revenue
water which stood at a high 60%’s in the mid 1990’s.
The Manila model has had limited success in delivering the Government’s expectations. A
number of issues contributed to this partial success. These include:
- The excitement of privatisation and possible future leveraging opportunities reduced
the private companies to pay extra ordinary high prices for securing the contracts to
supply Manila and this made making profits for the shareholder a tough task
- Underestimating the cost requirements to deliver remedial measures to reduce non-
revenue water. This has forced the companies to plead with the regulator for a higher
cost pass through with limited success.
- The changes to the Presidency in the Philippines and their differing political visions
have made the operating environment volatile for the private companies as the
philosophies of the current President is significantly different to President Ramos who
introduced privatisation.
- The political influencing of the regulator continues to be a problem especially when
setting prices.
In a country where there is high competition for capital money sometimes there is every
incentive to privatise utilities to ensure adequate customer service. The Manila experience
falls in to this category.

Chapter 4: International Experience
74
On performance, the Melbourne experience is far more superior to that delivered in Manila.
However, one must remember whilst the Victorian Government was in a strong financial
status, the Philippine Government is struggling to secure capital for investment. Based on
these experiences, it is concluded that a blended (or a highbred) approach be adopted for
HCMC where water conservation plays a pivotal part in securing a sustainable water future.
This is to be complemented by independent regulation and where suitable, local water
authorities contracting out works to the private sector where they can provide superior
service. However, once the operating rules and governance arrangements have been
established, there should be minimum political interference so that the model could operate
efficiently and deliver expected performance (and service) goals.
Chapter 5: Water Sustainability
75
5. WATER SUSTAINABILITY
5.1 WATER DEMAND IN HO CHI MINH CITY
One of the main objectives of the research is to study the sustainability of water supply in
HCMC. The current issues of water supply in HCMC, the institutional structure and
Government’s plan to develop a sustainable water supply system was discussed in preceding
Chapters. Strategies developed to ensure to develop a sustainable water supply plan from
Melbourne Australia, Philippines and measures taken to reduce non-revenue water in
Malaysia were also discussed.
This Chapter will investigate the potable water supply and demand in HCMC until year 2020.
Currently only 51.5% of the population has access to water through the central water utility
(HCMCWSC, 2004) although nowhere in the city is the water safe to drink straight from the
tap. Another 45% of the population is serviced by local water service providers via water
haulage (water carters) and similar services providers. Clean water supply to the outlying
districts is very limited so that approximately 3.5% of the populations have no regular,
reliable access to water. Water has been always a critical issue for HCMC, especially in the
dry season when people cannot rely on rainwater.
HCMC is continuing to grow and its increased population will place increasing pressure on
existing water supplies. The increasing number of people living in HCMC will generate
additional need for water. The majority of future households are forecasted to be located in
the surrounding and new developing districts. Government is also planning to relocate people
in the congested inner city area to the new developing districts. Based on the GSO (2005) the
current population in HCMC is 5.7 million. It is predicted to increase to 9-10 million by the
year 2020 and this shows an increase of 58-75% of the current population.
5.1.1. Residential People
HCMC Government has invested lot of funds to expand the distribution of water supply area
as well as to increase the water supplied per capita. The organizations such as Water and
Sanitary Engineering Consultant (WASE) and United Nations Development Programme
(UNDP) have been employed to develop the best strategy for HCMC.
To ensure our basic needs, we all need 20 to 50 litres of water per person free from harmful
contaminants each and every day (http://www.thewaterpage.com/basic_needs.htm accessed
on 20 April 2005). The amount of water used per capita varies significantly around the world.
For example, a person living in sub-Saharan Africa uses between 10 and 20 litres of water a
Chapter 5: Water Sustainability
76
day compared to Canada, where the average person may use as much as 326 litres of water
every day (UNESCO, 2005). HCMC is a very fast growing city in Vietnam with the current
population growth and water infrastructure, it is not sustainable for HCMC Water Supply
Company to provide or even target the quantity of water for domestic use as in developed
countries. As a result, it is important to develop a feasibility plan taking into account the
social needs unique to the Vietnamese people, current capacity of water infrastructure, water
supply sources and other factors such as capacity to pay. HCMC is rich in water resource.
However, it is also important to consider the capacity of the water treatment plants. The
HCMC WSC has been separated into following four areas to develop a comprehensive
sustainable water use strategy:
• Eight city centre districts;
• Four surrounding districts;
• Five new developed districts; and
• Outer urbanization.
Eight city centre districts include District 1, Districts 3, 4, 5, 6, 10, 11 and Phu Nhuan District
(Figure 2-2). These districts are the face of the city with main business activities. Standard of
living in these districts is quite high and therefore the demand for water is both high in terms
of quality and quantity. The network coverage in these areas is also the highest in HCMC
which was approximately 89% in year 2000. It is targeted to increase this figure to 97.5% by
year 2020. The target water supply for these districts is set to be put in as first priority
(National Governmental Office, 2001).
Four surrounding districts include the districts that are adjacent to city centre districts.
Although the network has been continuously extended, the coverage is still moderate (75%).
Connecting water to neighbours and water wells are the common ways of acquiring water for
households who do not have water meters connected.
Five new developing districts include Districts 2, 7, 9, 12 and Thu Duc district. These districts
are newly developed to fulfill the need for expansion of HCMC. Government is planning to
redistribute people especially in shanty houses to ease the congested city centre. Water
infrastructure in these districts are recently built and are in good condition, however the
coverage is quite low (63%).
Outer city urbanisation includes semi-rural areas that were previously mainly used for
agricultural activities. Today, these areas are the homes of several industrial zones such as
Tan Tao Industrial Park generating employment. Economic growth has also brought about
increasing in population and attracting more people from other not so well developed areas in
Chapter 5: Water Sustainability
77
Vietnam. The map of the areas served by HCMC Water Supply Company is given in Figure
5-1.
Forecast population growth HCMC is continuing to grow and its increasing population will place additional pressure on
current water supply. The increasing number of people living in HCMC will generate
additional need for water. The majority of future households are forecasted to be located in
the surrounding and new developing districts. Government is also planning to relocate people
in the congested inner city area to the new developing districts. Population in HCMC
comprises of registered people and people from other provinces moving to HCMC to work.
These people are classified as un-registered people as they do not hold a registered residence
book. The total number of these people including migrant workers includes seasonal labourers
and university students totaled to be is 1.84 million in 2004. This number accounts for
approximately 24% of total population and continues increasing at 2.33% per year (GSO,
2005). According to the data from General Statistics Office (http://www.gso.gov.vn) the
registered population in HCMC from 1995 to 2003 is depicted in the Table 5-1. Figure 5-2
gives the trend in population increase with time. The population in HCMC until year 2020
(Table 5-1) is calculated assuming the same future trend as the one that was observed to 2004
using a simple regression model.
The forecasted population in HCMC until year 2020 given in Figure 5.2 is the residents living
in HCMC. HCMC is the fastest growing city in Vietnam. There are more working
opportunities in HCMC that attract large amount of unregistered people. Unregistered people
are people from other provinces who come to work in HCMC. The same trend as registered
people was assumed when forecasting the population growth of unregistered people in
HCMC. The number of unregistered people until 2020 is estimated based on the past data and
the trend given in Figure 5-2. Total residential population in HCMC to year 2020 are
estimated and presented in Table 5-1
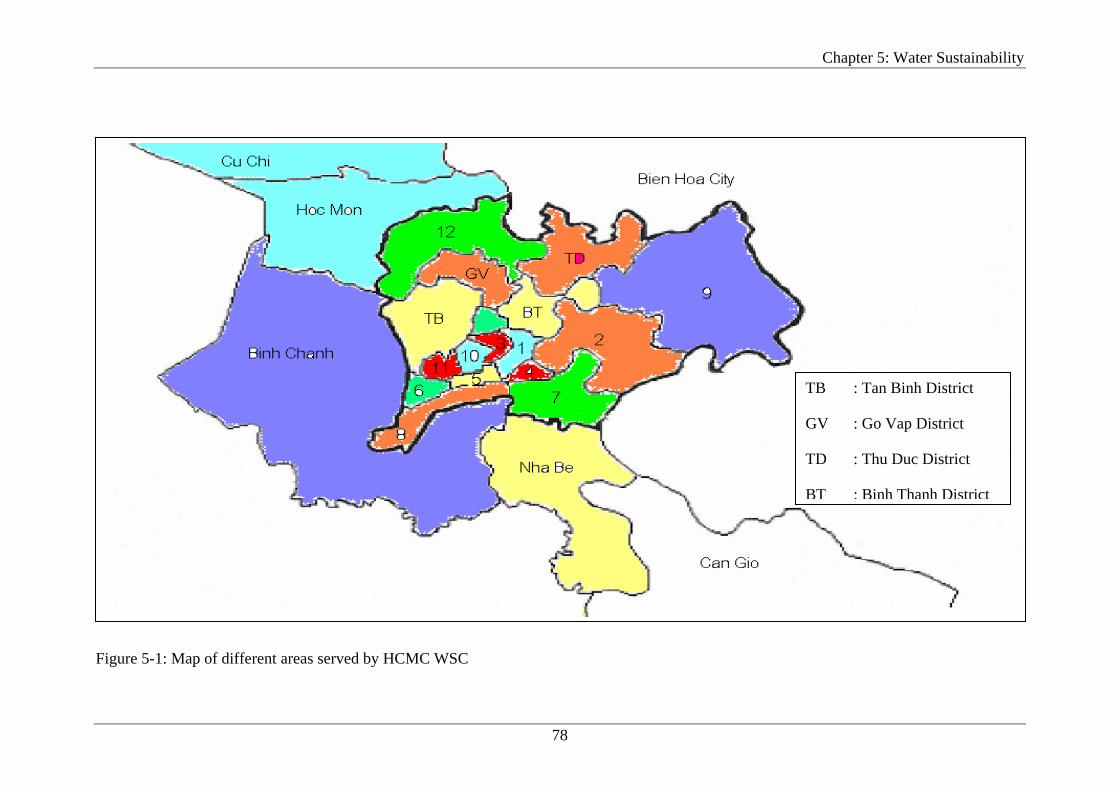
Chapter 5: Water Sustainability
78
Figure 5-1: Map of different areas served by HCMC WSC
TB : Tan Binh District
GV : Go Vap District
TD : Thu Duc District
BT : Binh Thanh District
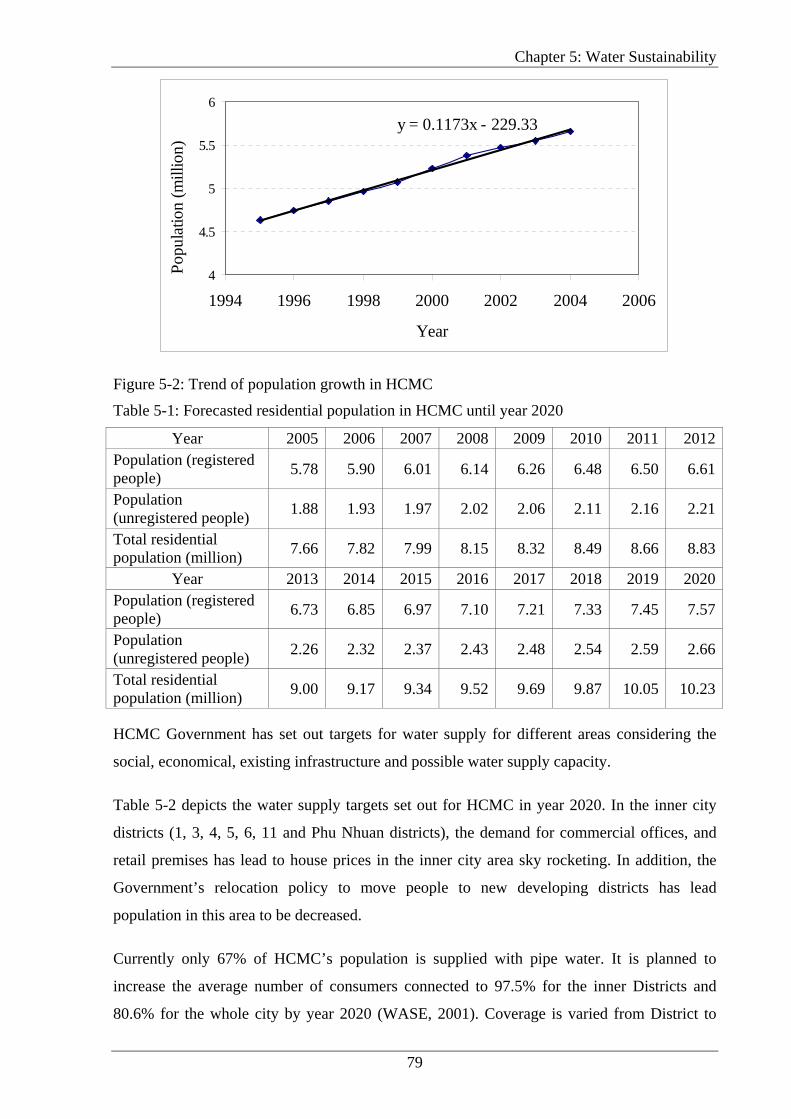
Chapter 5: Water Sustainability
79
y = 0.1173x - 229.33
4
4.5
5
5.5
6
1994 1996 1998 2000 2002 2004 2006
Year
Popu
latio
n (m
illio
n)
Figure 5-2: Trend of population growth in HCMC
Table 5-1: Forecasted residential population in HCMC until year 2020
Year 2005 2006 2007 2008 2009 2010 2011 2012Population (registered people) 5.78 5.90 6.01 6.14 6.26 6.48 6.50 6.61
Population (unregistered people) 1.88 1.93 1.97 2.02 2.06 2.11 2.16 2.21
Total residential population (million) 7.66 7.82 7.99 8.15 8.32 8.49 8.66 8.83
Year 2013 2014 2015 2016 2017 2018 2019 2020Population (registered people) 6.73 6.85 6.97 7.10 7.21 7.33 7.45 7.57
Population (unregistered people) 2.26 2.32 2.37 2.43 2.48 2.54 2.59 2.66
Total residential population (million) 9.00 9.17 9.34 9.52 9.69 9.87 10.05 10.23
HCMC Government has set out targets for water supply for different areas considering the
social, economical, existing infrastructure and possible water supply capacity.
Table 5-2 depicts the water supply targets set out for HCMC in year 2020. In the inner city
districts (1, 3, 4, 5, 6, 11 and Phu Nhuan districts), the demand for commercial offices, and
retail premises has lead to house prices in the inner city area sky rocketing. In addition, the
Government’s relocation policy to move people to new developing districts has lead
population in this area to be decreased.
Currently only 67% of HCMC’s population is supplied with pipe water. It is planned to
increase the average number of consumers connected to 97.5% for the inner Districts and
80.6% for the whole city by year 2020 (WASE, 2001). Coverage is varied from District to
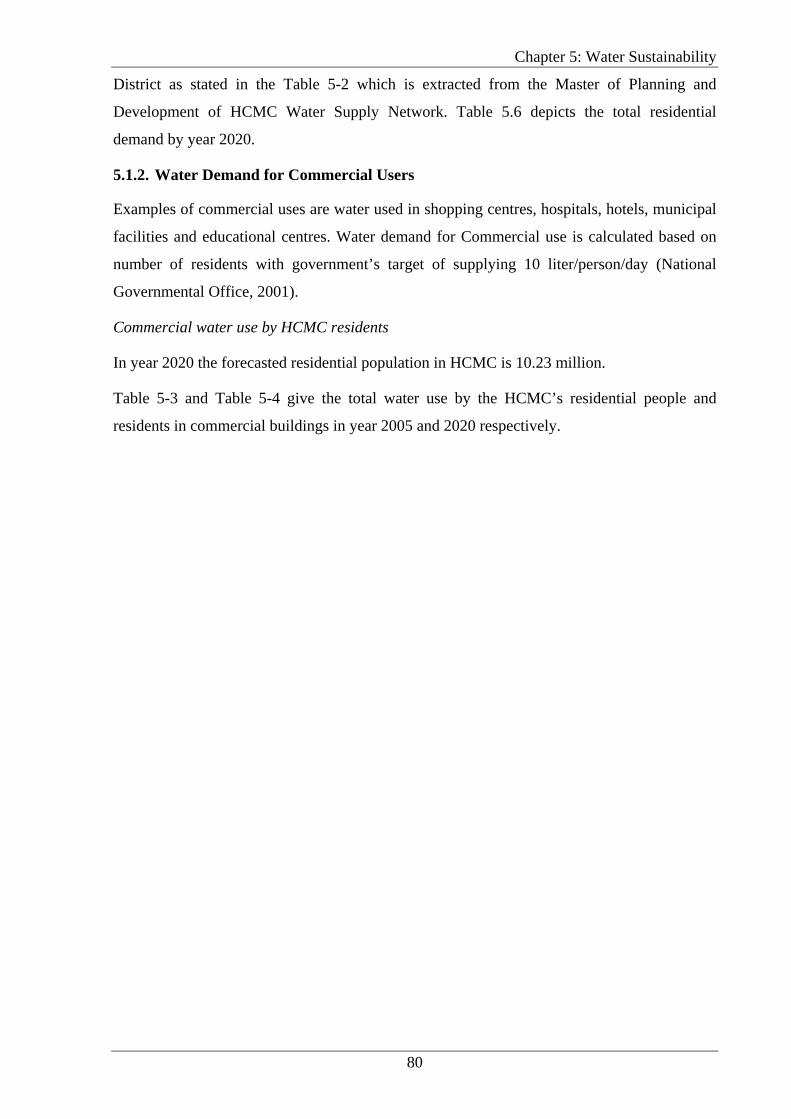
Chapter 5: Water Sustainability
80
District as stated in the Table 5-2 which is extracted from the Master of Planning and
Development of HCMC Water Supply Network. Table 5.6 depicts the total residential
demand by year 2020.
5.1.2. Water Demand for Commercial Users
Examples of commercial uses are water used in shopping centres, hospitals, hotels, municipal
facilities and educational centres. Water demand for Commercial use is calculated based on
number of residents with government’s target of supplying 10 liter/person/day (National
Governmental Office, 2001).
Commercial water use by HCMC residents
In year 2020 the forecasted residential population in HCMC is 10.23 million.
Table 5-3 and Table 5-4 give the total water use by the HCMC’s residential people and
residents in commercial buildings in year 2005 and 2020 respectively.
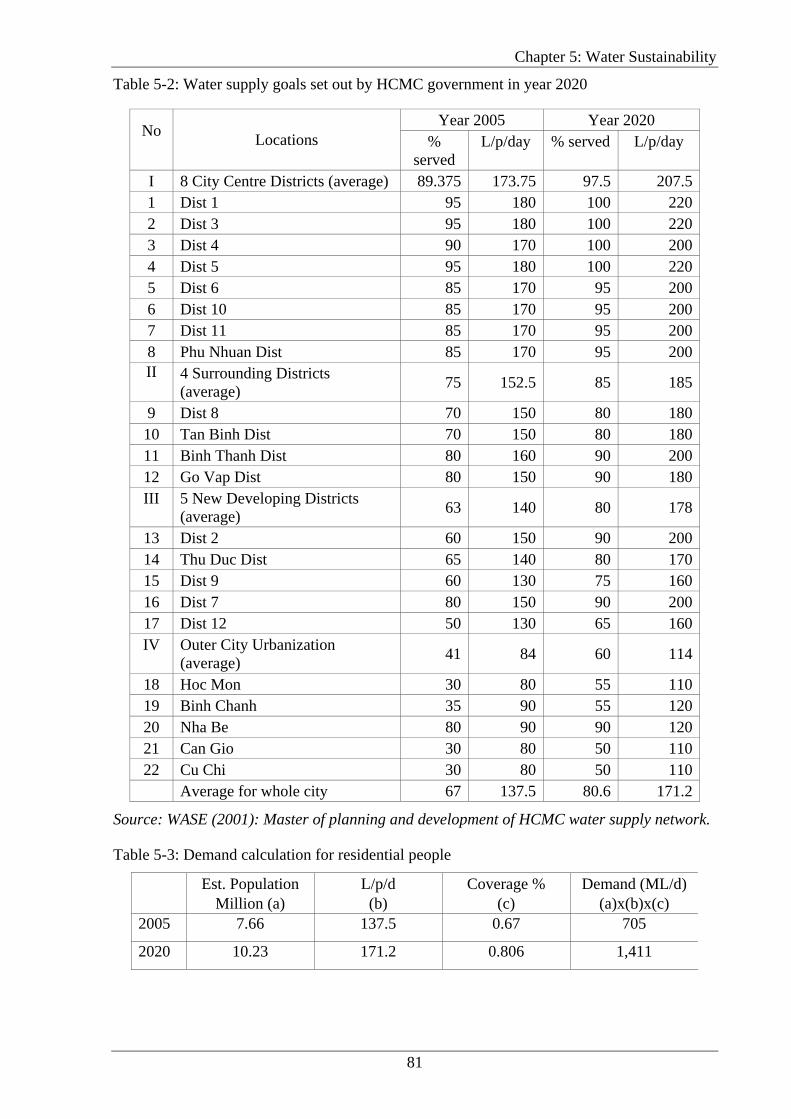
Chapter 5: Water Sustainability
81
Table 5-2: Water supply goals set out by HCMC government in year 2020
Year 2005 Year 2020 No
Locations % served
L/p/day % served L/p/day
I 8 City Centre Districts (average) 89.375 173.75 97.5 207.51 Dist 1 95 180 100 2202 Dist 3 95 180 100 2203 Dist 4 90 170 100 2004 Dist 5 95 180 100 2205 Dist 6 85 170 95 2006 Dist 10 85 170 95 2007 Dist 11 85 170 95 2008 Phu Nhuan Dist 85 170 95 200II 4 Surrounding Districts
(average) 75 152.5 85 185
9 Dist 8 70 150 80 18010 Tan Binh Dist 70 150 80 18011 Binh Thanh Dist 80 160 90 20012 Go Vap Dist 80 150 90 180III 5 New Developing Districts
(average) 63 140 80 178
13 Dist 2 60 150 90 20014 Thu Duc Dist 65 140 80 17015 Dist 9 60 130 75 16016 Dist 7 80 150 90 20017 Dist 12 50 130 65 160IV Outer City Urbanization
(average) 41 84 60 114
18 Hoc Mon 30 80 55 11019 Binh Chanh 35 90 55 12020 Nha Be 80 90 90 12021 Can Gio 30 80 50 11022 Cu Chi 30 80 50 110
Average for whole city 67 137.5 80.6 171.2
Source: WASE (2001): Master of planning and development of HCMC water supply network.
Table 5-3: Demand calculation for residential people Est. Population
Million (a) L/p/d (b)
Coverage % (c)
Demand (ML/d) (a)x(b)x(c)
2005 7.66 137.5 0.67 705
2020 10.23 171.2 0.806 1,411
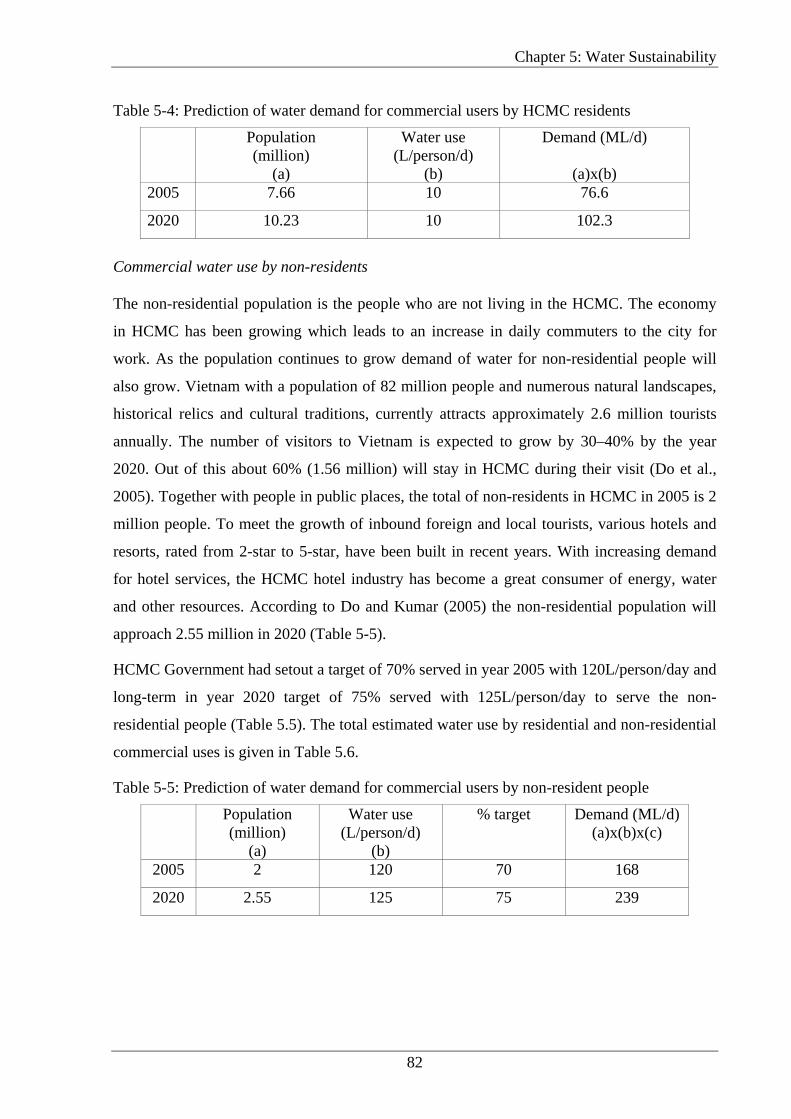
Chapter 5: Water Sustainability
82
Table 5-4: Prediction of water demand for commercial users by HCMC residents Population
(million) (a)
Water use (L/person/d)
(b)
Demand (ML/d)
(a)x(b) 2005 7.66 10 76.6
2020 10.23 10 102.3
Commercial water use by non-residents
The non-residential population is the people who are not living in the HCMC. The economy
in HCMC has been growing which leads to an increase in daily commuters to the city for
work. As the population continues to grow demand of water for non-residential people will
also grow. Vietnam with a population of 82 million people and numerous natural landscapes,
historical relics and cultural traditions, currently attracts approximately 2.6 million tourists
annually. The number of visitors to Vietnam is expected to grow by 30–40% by the year
2020. Out of this about 60% (1.56 million) will stay in HCMC during their visit (Do et al.,
2005). Together with people in public places, the total of non-residents in HCMC in 2005 is 2
million people. To meet the growth of inbound foreign and local tourists, various hotels and
resorts, rated from 2-star to 5-star, have been built in recent years. With increasing demand
for hotel services, the HCMC hotel industry has become a great consumer of energy, water
and other resources. According to Do and Kumar (2005) the non-residential population will
approach 2.55 million in 2020 (Table 5-5).
HCMC Government had setout a target of 70% served in year 2005 with 120L/person/day and
long-term in year 2020 target of 75% served with 125L/person/day to serve the non-
residential people (Table 5.5). The total estimated water use by residential and non-residential
commercial uses is given in Table 5.6.
Table 5-5: Prediction of water demand for commercial users by non-resident people Population
(million) (a)
Water use (L/person/d)
(b)
% target Demand (ML/d) (a)x(b)x(c)
2005 2 120 70 168
2020 2.55 125 75 239
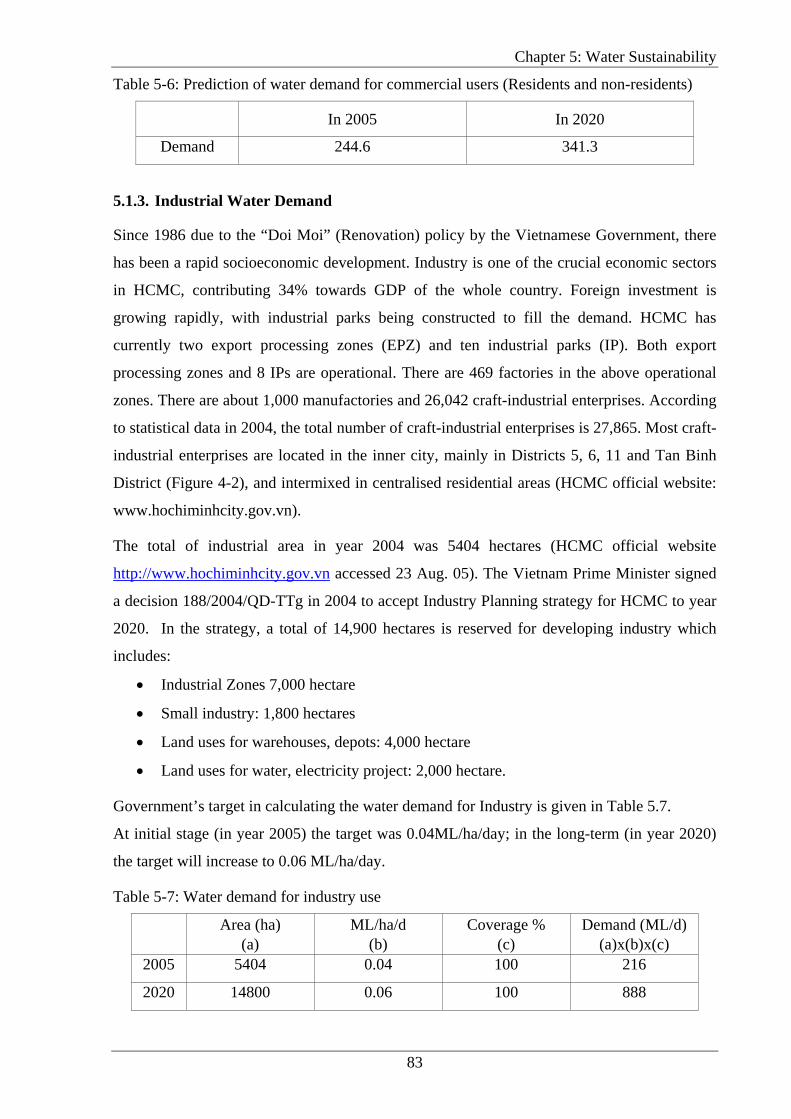
Chapter 5: Water Sustainability
83
Table 5-6: Prediction of water demand for commercial users (Residents and non-residents)
In 2005 In 2020
Demand 244.6 341.3
5.1.3. Industrial Water Demand
Since 1986 due to the “Doi Moi” (Renovation) policy by the Vietnamese Government, there
has been a rapid socioeconomic development. Industry is one of the crucial economic sectors
in HCMC, contributing 34% towards GDP of the whole country. Foreign investment is
growing rapidly, with industrial parks being constructed to fill the demand. HCMC has
currently two export processing zones (EPZ) and ten industrial parks (IP). Both export
processing zones and 8 IPs are operational. There are 469 factories in the above operational
zones. There are about 1,000 manufactories and 26,042 craft-industrial enterprises. According
to statistical data in 2004, the total number of craft-industrial enterprises is 27,865. Most craft-
industrial enterprises are located in the inner city, mainly in Districts 5, 6, 11 and Tan Binh
District (Figure 4-2), and intermixed in centralised residential areas (HCMC official website:
www.hochiminhcity.gov.vn).
The total of industrial area in year 2004 was 5404 hectares (HCMC official website
http://www.hochiminhcity.gov.vn accessed 23 Aug. 05). The Vietnam Prime Minister signed
a decision 188/2004/QD-TTg in 2004 to accept Industry Planning strategy for HCMC to year
2020. In the strategy, a total of 14,900 hectares is reserved for developing industry which
includes:
• Industrial Zones 7,000 hectare
• Small industry: 1,800 hectares
• Land uses for warehouses, depots: 4,000 hectare
• Land uses for water, electricity project: 2,000 hectare.
Government’s target in calculating the water demand for Industry is given in Table 5.7.
At initial stage (in year 2005) the target was 0.04ML/ha/day; in the long-term (in year 2020)
the target will increase to 0.06 ML/ha/day.
Table 5-7: Water demand for industry use Area (ha)
(a) ML/ha/d
(b) Coverage %
(c) Demand (ML/d)
(a)x(b)x(c) 2005 5404 0.04 100 216
2020 14800 0.06 100 888
Chapter 5: Water Sustainability
84
5.1.4. Non Revenue Water
Non revenue water (NRW) is the difference between the volumes of raw water produced and
the volume of water sold. NRW includes water lost through leakages, un-metered water
supplied to government institutes, water used for cleaning pipes, theft and fire fighting. The
average level of NRW in HCMC is approximately 33% of the total supply (HCMCWSC,
2004).
Water loss occurs in all distribution systems with varying quantities. This depends on the age
of the pipe network and other local factors (e.g. ground conditions), the water company’s
operational practice, and the level of technology and expertise applied to control it. The
volume lost varies widely from country to country, and between regions of each country. The
components of water loss, and their relative significance, also vary between countries. One of
the cornerstones of a water loss strategy is therefore to understand the relative significance of
each of the components, ensuring that each is measured or estimated as accurately as possible,
so that priorities can be set to minimize loss via a series of action plans.
Throughout the world, many public water utilities suffer from high levels of NRW loss. In
cases where the utility has surplus water resources, the high levels of NRW only have a
negative impact on the utility’s finances by increasing operating costs and reducing revenues.
However, in cases where the utility has no surplus water resources, high levels of NRW can
also result in water shortages during peak demand periods, reducing the level of service
provided to customers. Reduced service to customers reduces customer’s willingness to pay
their bills, increases customer complaints further reducing the utility’s revenues.
NRW comprises two main components, physical losses, i.e. leakage from the water supply
system and apparent losses, which include those due to meter inaccuracy, mains flushing, fire
fighting and illegal use.
REAL LOSSES: This consists of all physical losses up to the customer’s meter due to leaks,
bursts, and storage overflows. Key local factors influencing real losses are as follows:
- Number and average length of service connections;
- Length of mains, materials, and condition of infrastructure;
- Soil/ground conditions;
- Age of infrastructure.
Five components must be addressed for a successful reduction of real losses:
- Pressure in the pipe;
Chapter 5: Water Sustainability
85
- Speed and quality of repairs;
- Management of pipe material;
- Active leakage control;
- Well considered maintenance and pipe replacement programs.
APPARENT LOSSES: This is due to meter inaccuracies (customer and bulk production
meters) and unauthorized consumption (theft or illegal use). These losses are predominantly
related to meter inaccuracies and are therefore affected by the following:
- Proper sizing
- Calibration and frequent testing
- Repair/replacement practices
The illegal use has to be minimized by taking necessary punitive action.
Methods of reducing the NRW
The measures implemented by the WSC to reduce NRW in HCMC for a Sustainable Water
Future are given below.
Manpower
It is most important to have well trained and motivated staff responding to leakage activities
and a dedicated leakage control team is needed to tackle this vitally important work.
Previously, the task formed part of the duties of multi-disciplined inspectorate teams. These
manpower levels have been monitored against leakage levels and performance over the years
to ensure staff levels have been both adequate and appropriate to fulfill the leakage reduction
targets set.
Flow monitoring
To be able to work with confidence using the raw data provided from a system, it is very
important for meter accuracy to be reliable from the waterworks source works through to
individual customers. Efforts have to be expended in ensuring the reliability of this
information, including meter replacement programmes and periodic calibration exercises.
Information on night-flow in particular is useful to the leakage practitioners who use the
details to prioritise their leak location and management.
Pressure management
High pressures within distribution systems are one of the primary causes of leaks and bursts,
therefore managing the pressures on the system are a vitally important activity. Using various
types of pressure reducing valves on the inlets to distribution systems, pressures can be
Chapter 5: Water Sustainability
86
managed to minimise the damage that might be caused. The investment on this activity
always has a very significant effect on the reduction of the overall level of leakage.
Liemberger and Fanner (2002) claimed that one of the simplest, yet most effective means of
reducing water losses is the use of pressure management. The concepts used for modeling the
impacts of pressure reduction and management on leakage levels were substantially enhanced
in the UK in the mid 1990’s, enabling accurate assessment of the impact of any pressure
management scheme on leakage levels. Even small levels of pressure reduction, particularly
at night when pressures are highest, can significantly reduce water losses, particularly from
low-level ongoing undetected leaks. Pressure management is also important when new water
loss reduction programmes are implemented. This is because as leaks are repaired,
distribution pressures will rise unless they are controlled, causing new bursts to occur
undermining the efforts made in the water loss reduction programme. For these reasons,
pressure management should be an integral part of a water loss reduction programme.
A study in Malaysia has shown that the replacement of mains only reduces leakage by a small
amount, as most undetected leaks are found on small diameter pipes (service connections) and
related joints and fittings.
Leak location
Having prioritised areas for leak location from night flow data, the leakage teams then need to
precisely locate the leak positions, which in the past has been undertaken by staff using
various equipment including the basic "listening stick". However, advanced technology is
now available to assist with this activity such as the use of acoustic loggers and specialist leak
correlation equipment. Using this equipment, operatives can pinpoint leak positions very
accurately and usually to within 0.5m (Liemberger and Fanner, 2002). Following this activity,
the leak repair teams can then be called and a repair effected. Steadily increasing in
investments in modern technology and equipment is urgently needed.
Speed of repairs
The primary aspect of a leak repair is that it should be carried out as quickly and safely as
possible to maximise the savings and reduce the inconvenience to customers and sometimes
traffic.
Current Status of Non Revenue Water in Ho Chi Minh City
HCMC water system is old and is in poor conditions. Due to leaks in distribution systems,
wastage and illegal connections approximately 33% of the water is estimated to be
unaccounted. Furthermore, the service systems are unreliable. As a result, many households
Chapter 5: Water Sustainability
87
do not have access to them. They rely on shallow wells (many of which are contaminated by
poorly functioning septic systems) or on rainwater which is scarce during dry periods
(HCMCWSC, 2004).
Mounting water demand, combined with high leakage rates in the ageing and poorly-
maintained network, plus a poorly operated system mean that only few areas in HCMC
receive 24-hour reliable service. In fact, many areas only have water for a few hours a day, or
even every other day. The utility needs to focus on leak detection and repair programs, better
billing and revenue collection methods, funds for system rehabilitation and clear incentive to
reduce leakage and improve service.
The WSC has estimated that, with the current percentage of water loss, a 1% reduction will
save the amount of water that is enough to supply one ward (or Phuong). In a capital
investment context, there could be significant savings by delaying the investment in a new
water treatment plant with capacity of 50-70 ML/day at a cost of nearly 30 million USD if the
water loss percentage is reduced by 3-4%. Water loss reduction thus is an urgent and critical
issue (HCMCWSC, 2004).
According to the HCMC WSC, the major reason for the increased gap between supply and
sales is the rise in water leakage during transmission. At present, water leakage amounts to a
massive 33% of the total supply (HCMCWSC, 2004). This compares with less than 10%
servicing 4.5M people in Melbourne (Melbourne Water, 2004). In 1995/96, there were more
than 1300 reported incidents of water pipe bursts. Many of these incidents were caused by
workers inadvertently breaking water pipes during road works. The water supply to some
areas has also been disrupted for weeks because of flooding in pumping stations after
rainstorms. The WSC needs a quick response plan to rehabilitate breakage in order to increase
reliability of water supply.
Although not achieved an effort to reduce losses to 33% by the end of 2005, water officials
have installed 180 water meters to help determine the water flow through each sub-branch,
repaired 12,000 leaking pipelines, and improved water management and usage by renewing
40,000 water contracts (Tuoitre Online, 2005). Furthermore, the World Bank has agreed to
provide $38 million to implement a water loss recovery programme. The programme is
expected to be implemented by 2006. Various businesses and economic sectors will manage
50% of the programme, while the city’s water supply subsidiary companies will manage the
remaining half of the project.
The city authorities are encouraging foreign investors and domestic private companies to
jointly develop water loss reduction programme in order to overcome the water shortage. The

Chapter 5: Water Sustainability
88
first contract was signed between HCMC WSC and New Tech Company (T&S) on 7th July
2004. By applying new advanced technology in water loss reduction, the T&S Company is
primarily responsible for reducing the water losses in Binh Thanh Phu Nhuan and Go Vap
Districts to 29, and 25% respectively at the end of 2005 and 2010. T&S Company will receive
profits which is calculated equivalent to the value of money generated from the water loss
reduction. If T&S can not fulfill the requirements, the same amount of fines will be imposed
(HCMCWSC, 2004).
The average level of NRW in HCMC is approximately 33% of total supply (HCMCWSC,
2004). This amounts to 703 ML/day. It is expected to reduce this to 20% of the total supply in
2020 which will be equivalent to 660 ML/day. This level has been relatively static over the
past few years indicating that the efforts of city in the NRW reduction has not well developed
and implemented. An achievable level for NRW in utilities in developing countries is 23%
(World Bank, 2002). The HCMC Government therefore has recognized the potential water
saving to be reduced in order to increase the amount of water available to satisfy currently
unmet demand. To achieve this objective, an effective strategy based on standard cost-benefit
analysis must be developed and implemented. The set out targets for NRW in HCMC are
described in Table 5-8 (WASE, 2001):
Table 5-8: Non revenue water targets in HCMC in 2020
Zone NRW in Year 2005 (%) NRW in Year 2020 (%)
- Five New Developed Districts 25 20 - Four Surrounding Districts 25 20 - Outer City Urbanization 15 20 - Industrial Zones - Existing 15 15 - Newly Developed 5 10
Source: Master of planning and development of HCMC water supply network
5.1.5. Total Water Demand
As reported in National Strategy for HCMC in year 2020 and based on values given in
preceding sections (Sections 5.1.1 to 5.1.5) the water use in different zones under residential,
commercial and industrial are given in Table 5-9. Assuming increase in demand is linear
between 2005 and 2020 the water demand with time is shown graphically in Figure 5-4.
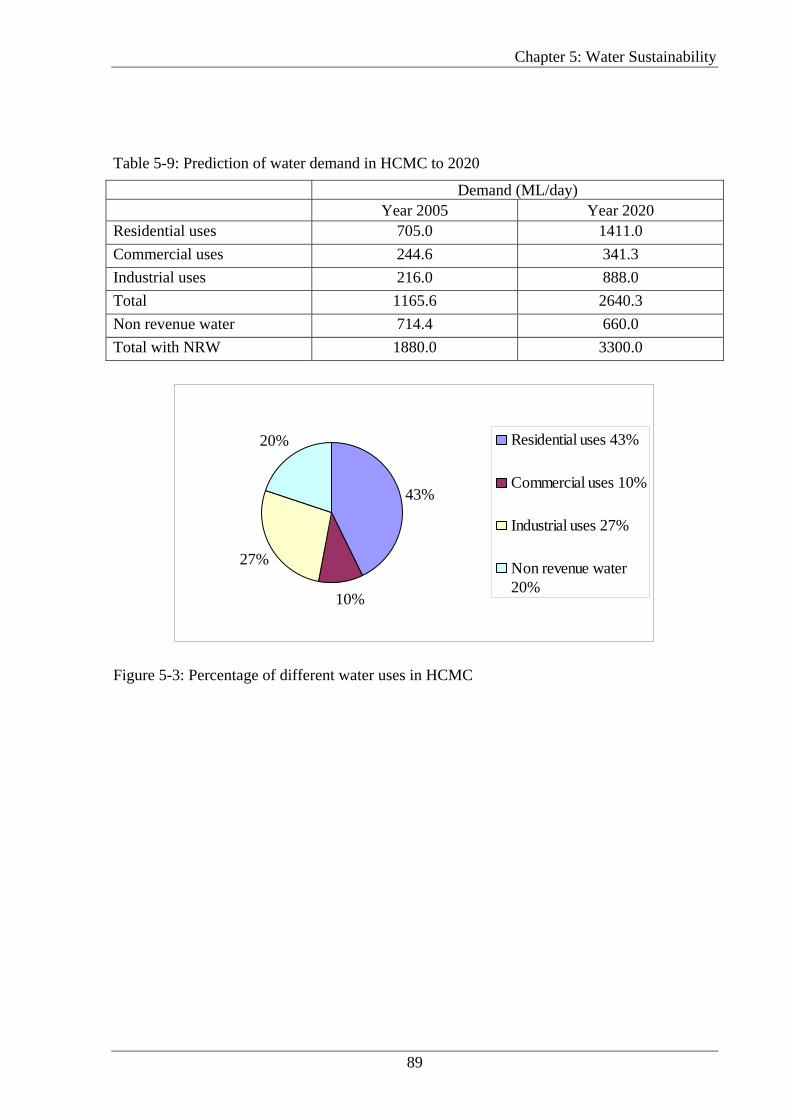
Chapter 5: Water Sustainability
89
Table 5-9: Prediction of water demand in HCMC to 2020
Demand (ML/day) Year 2005 Year 2020 Residential uses 705.0 1411.0 Commercial uses 244.6 341.3 Industrial uses 216.0 888.0 Total 1165.6 2640.3 Non revenue water 714.4 660.0 Total with NRW 1880.0 3300.0
43%
10%
27%
20% Residential uses 43%
Commercial uses 10%
Industrial uses 27%
Non revenue water20%
Figure 5-3: Percentage of different water uses in HCMC
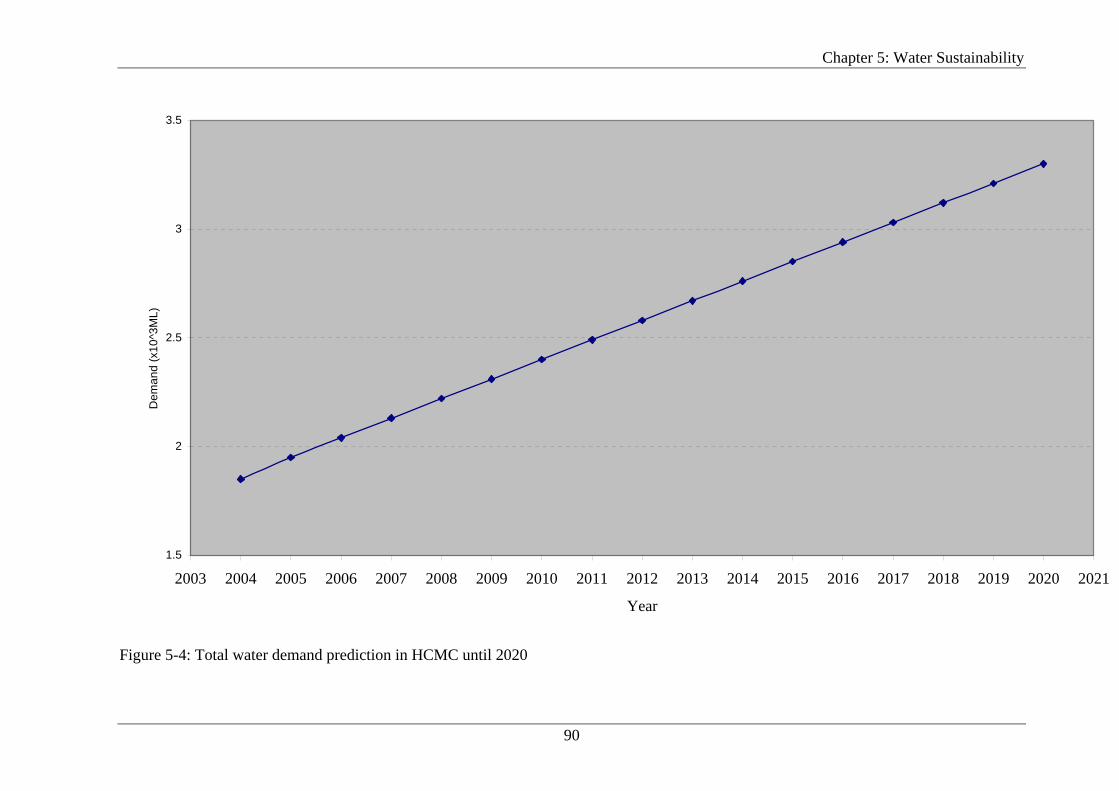
Chapter 5: Water Sustainability
90
1.5
2
2.5
3
3.5
2003 2004 2005 2006 2007 2008 2009 2010 2011 2012 2013 2014 2015 2016 2017 2018 2019 2020 2021
Year
Dem
and
(x10
^3M
L)
Figure 5-4: Total water demand prediction in HCMC until 2020
Chapter 5: Water Sustainability
91
5.2. WATER SUPPLY CAPACITY IN HO CHI MINH CITY
As discuss in Chapter II, the main water supply source for HCMC are from Dong Nai River,
Saigon River and Groundwater. Dong Nai River is the main source with a current capacity of
2100 ML/day. The Government is investigating in upgrading existing treatment plants as well
as building new plants to meet the increase in demand. There are plans for major upgrade for
Thu Duc Waterworks, AnBinh Waterworks and new Thu Duc Boo Waterworks which extract
water from Dong Nai river. As mentioned in Section 2.4 and indicated in Table 5-10 it is
anticipated to increase the capacity of Thu Duc Waterworks to 1000 ML/day in 2008 (WASE,
2001). According to Water Supply Strategy report for HCMC (2001), it is planned to upgrade
Thu Duc & Binh An treatment plants to augment the system by another 300 ML/day in 2015
and 2020 respectively. Saigon River is also put into use with two major water treatment
plants. Another source of water that is put into use is the Western Canal Waterworks. Besides,
upgrading the capacity of groundwater treatment plants is about to be carried out.
Figure 5.5 depicts the water supply capacities and demand predictions for HCMC until year
2020. As depicted in the above figure supply is sufficient (less by 400ML/day) to meet the
demand for water due to increase in population. However, due to high percentage of non
revenue water in the system the Water Supply Company will not be able to supply water to all
the households in HCMC.
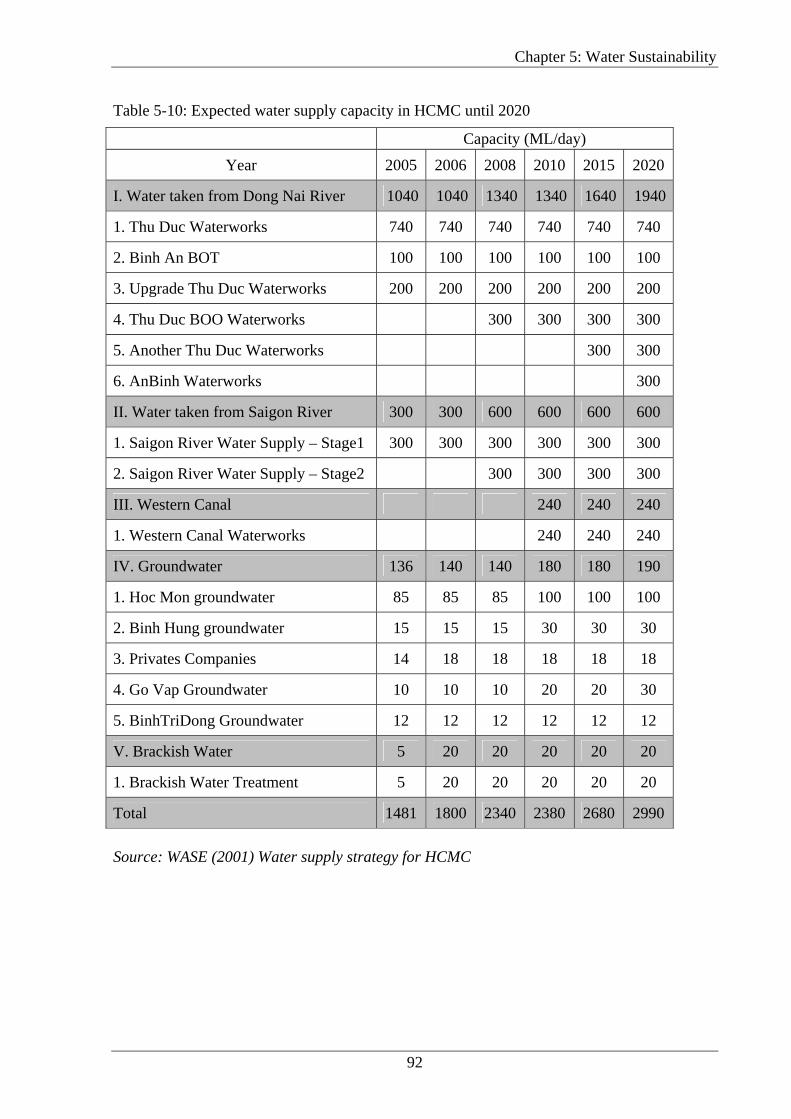
Chapter 5: Water Sustainability
92
Table 5-10: Expected water supply capacity in HCMC until 2020 Capacity (ML/day)
Year 2005 2006 2008 2010 2015 2020
I. Water taken from Dong Nai River 1040 1040 1340 1340 1640 1940
1. Thu Duc Waterworks 740 740 740 740 740 740
2. Binh An BOT 100 100 100 100 100 100
3. Upgrade Thu Duc Waterworks 200 200 200 200 200 200
4. Thu Duc BOO Waterworks 300 300 300 300
5. Another Thu Duc Waterworks 300 300
6. AnBinh Waterworks 300
II. Water taken from Saigon River 300 300 600 600 600 600
1. Saigon River Water Supply – Stage1 300 300 300 300 300 300
2. Saigon River Water Supply – Stage2 300 300 300 300
III. Western Canal 240 240 240
1. Western Canal Waterworks 240 240 240
IV. Groundwater 136 140 140 180 180 190
1. Hoc Mon groundwater 85 85 85 100 100 100
2. Binh Hung groundwater 15 15 15 30 30 30
3. Privates Companies 14 18 18 18 18 18
4. Go Vap Groundwater 10 10 10 20 20 30
5. BinhTriDong Groundwater 12 12 12 12 12 12
V. Brackish Water 5 20 20 20 20 20
1. Brackish Water Treatment 5 20 20 20 20 20
Total 1481 1800 2340 2380 2680 2990
Source: WASE (2001) Water supply strategy for HCMC

Chapter 5: Water Sustainability
93
0.5
1
1.5
2
2.5
3
3.5
2003 2004 2005 2006 2007 2008 2009 2010 2011 2012 2013 2014 2015 2016 2017 2018 2019 2020 2021
Source: Environmental Management Strategy for HCMC City
Water Demand
Water Supply
Water Supply - NRW
Dem
and
(x10
^3M
L/da
y)
Water Demand with Water Saving Measures
Figure 5-5: Water supply and demand in 2020 (Projected)
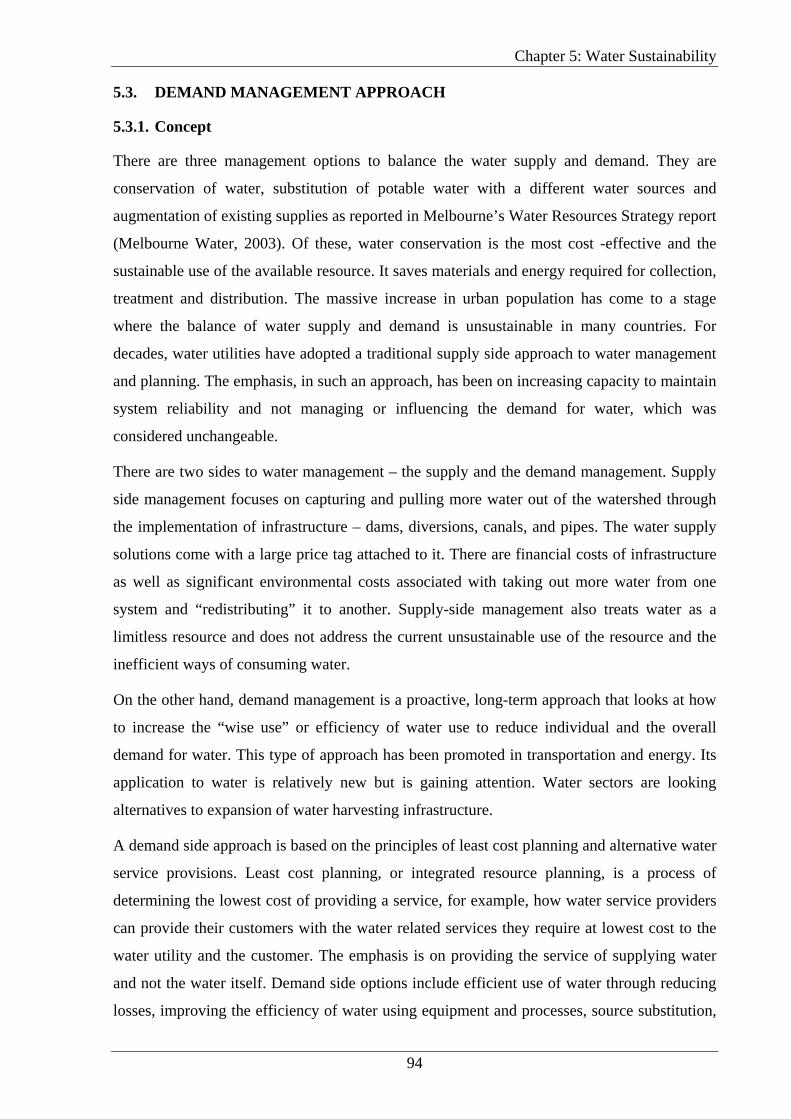
Chapter 5: Water Sustainability
94
5.3. DEMAND MANAGEMENT APPROACH
5.3.1. Concept
There are three management options to balance the water supply and demand. They are
conservation of water, substitution of potable water with a different water sources and
augmentation of existing supplies as reported in Melbourne’s Water Resources Strategy report
(Melbourne Water, 2003). Of these, water conservation is the most cost -effective and the
sustainable use of the available resource. It saves materials and energy required for collection,
treatment and distribution. The massive increase in urban population has come to a stage
where the balance of water supply and demand is unsustainable in many countries. For
decades, water utilities have adopted a traditional supply side approach to water management
and planning. The emphasis, in such an approach, has been on increasing capacity to maintain
system reliability and not managing or influencing the demand for water, which was
considered unchangeable.
There are two sides to water management – the supply and the demand management. Supply
side management focuses on capturing and pulling more water out of the watershed through
the implementation of infrastructure – dams, diversions, canals, and pipes. The water supply
solutions come with a large price tag attached to it. There are financial costs of infrastructure
as well as significant environmental costs associated with taking out more water from one
system and “redistributing” it to another. Supply-side management also treats water as a
limitless resource and does not address the current unsustainable use of the resource and the
inefficient ways of consuming water.
On the other hand, demand management is a proactive, long-term approach that looks at how
to increase the “wise use” or efficiency of water use to reduce individual and the overall
demand for water. This type of approach has been promoted in transportation and energy. Its
application to water is relatively new but is gaining attention. Water sectors are looking
alternatives to expansion of water harvesting infrastructure.
A demand side approach is based on the principles of least cost planning and alternative water
service provisions. Least cost planning, or integrated resource planning, is a process of
determining the lowest cost of providing a service, for example, how water service providers
can provide their customers with the water related services they require at lowest cost to the
water utility and the customer. The emphasis is on providing the service of supplying water
and not the water itself. Demand side options include efficient use of water through reducing
losses, improving the efficiency of water using equipment and processes, source substitution,
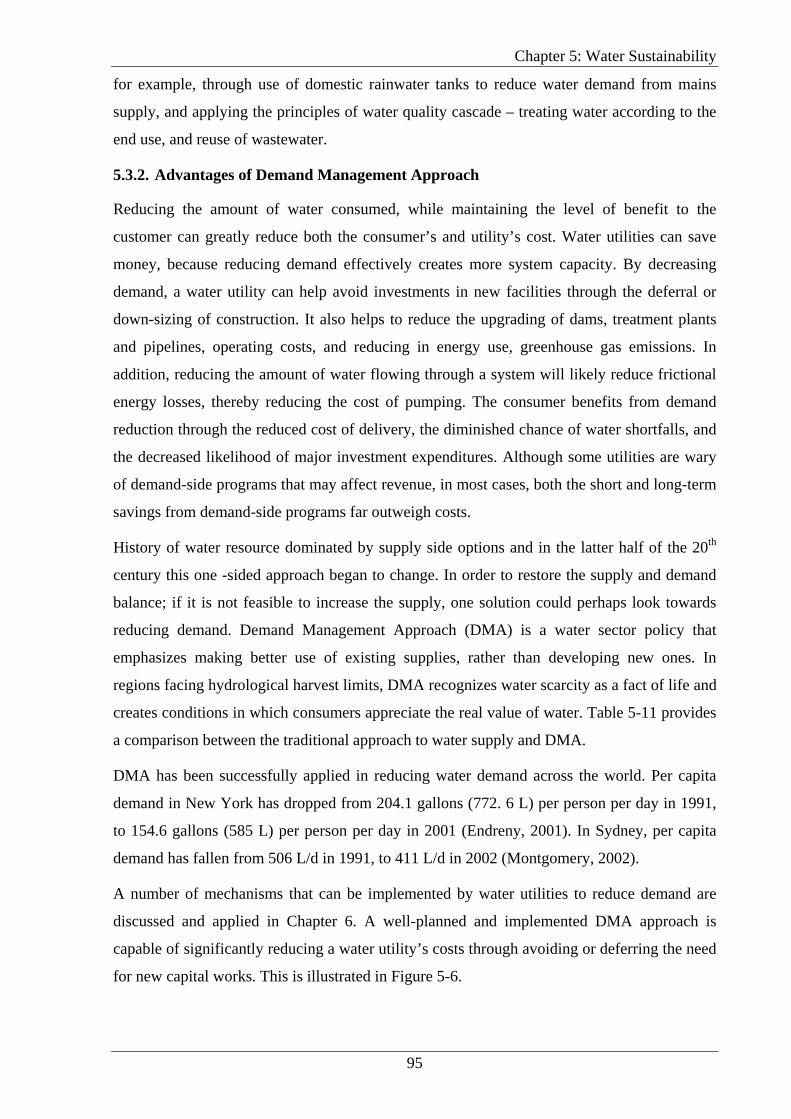
Chapter 5: Water Sustainability
95
for example, through use of domestic rainwater tanks to reduce water demand from mains
supply, and applying the principles of water quality cascade – treating water according to the
end use, and reuse of wastewater.
5.3.2. Advantages of Demand Management Approach
Reducing the amount of water consumed, while maintaining the level of benefit to the
customer can greatly reduce both the consumer’s and utility’s cost. Water utilities can save
money, because reducing demand effectively creates more system capacity. By decreasing
demand, a water utility can help avoid investments in new facilities through the deferral or
down-sizing of construction. It also helps to reduce the upgrading of dams, treatment plants
and pipelines, operating costs, and reducing in energy use, greenhouse gas emissions. In
addition, reducing the amount of water flowing through a system will likely reduce frictional
energy losses, thereby reducing the cost of pumping. The consumer benefits from demand
reduction through the reduced cost of delivery, the diminished chance of water shortfalls, and
the decreased likelihood of major investment expenditures. Although some utilities are wary
of demand-side programs that may affect revenue, in most cases, both the short and long-term
savings from demand-side programs far outweigh costs.
History of water resource dominated by supply side options and in the latter half of the 20th
century this one -sided approach began to change. In order to restore the supply and demand
balance; if it is not feasible to increase the supply, one solution could perhaps look towards
reducing demand. Demand Management Approach (DMA) is a water sector policy that
emphasizes making better use of existing supplies, rather than developing new ones. In
regions facing hydrological harvest limits, DMA recognizes water scarcity as a fact of life and
creates conditions in which consumers appreciate the real value of water. Table 5-11 provides
a comparison between the traditional approach to water supply and DMA.
DMA has been successfully applied in reducing water demand across the world. Per capita
demand in New York has dropped from 204.1 gallons (772. 6 L) per person per day in 1991,
to 154.6 gallons (585 L) per person per day in 2001 (Endreny, 2001). In Sydney, per capita
demand has fallen from 506 L/d in 1991, to 411 L/d in 2002 (Montgomery, 2002).
A number of mechanisms that can be implemented by water utilities to reduce demand are
discussed and applied in Chapter 6. A well-planned and implemented DMA approach is
capable of significantly reducing a water utility’s costs through avoiding or deferring the need
for new capital works. This is illustrated in Figure 5-6.
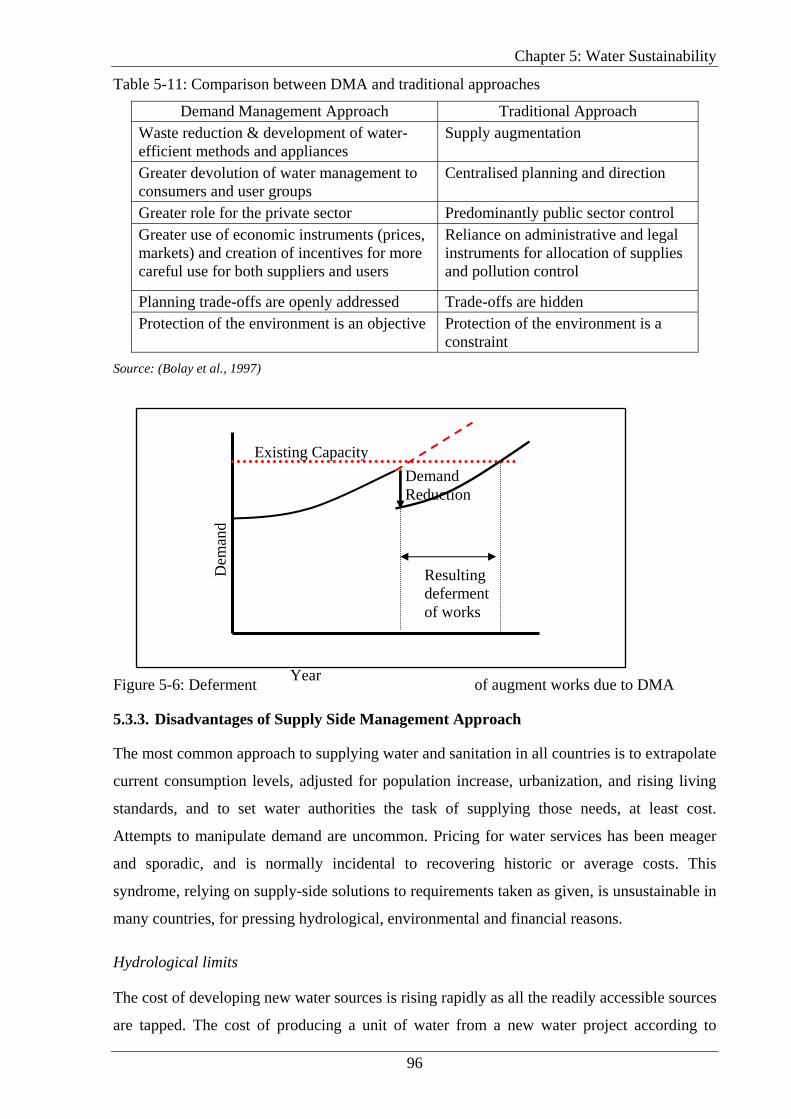
Chapter 5: Water Sustainability
96
Demand Reduction
Resulting deferment of works
Year
Dem
and
Table 5-11: Comparison between DMA and traditional approaches
Demand Management Approach Traditional Approach Waste reduction & development of water-efficient methods and appliances
Supply augmentation
Greater devolution of water management to consumers and user groups
Centralised planning and direction
Greater role for the private sector Predominantly public sector control Greater use of economic instruments (prices, markets) and creation of incentives for more careful use for both suppliers and users
Reliance on administrative and legal instruments for allocation of supplies and pollution control
Planning trade-offs are openly addressed Trade-offs are hidden Protection of the environment is an objective Protection of the environment is a
constraint Source: (Bolay et al., 1997)
Figure 5-6: Deferment of augment works due to DMA
5.3.3. Disadvantages of Supply Side Management Approach
The most common approach to supplying water and sanitation in all countries is to extrapolate
current consumption levels, adjusted for population increase, urbanization, and rising living
standards, and to set water authorities the task of supplying those needs, at least cost.
Attempts to manipulate demand are uncommon. Pricing for water services has been meager
and sporadic, and is normally incidental to recovering historic or average costs. This
syndrome, relying on supply-side solutions to requirements taken as given, is unsustainable in
many countries, for pressing hydrological, environmental and financial reasons.
Hydrological limits
The cost of developing new water sources is rising rapidly as all the readily accessible sources
are tapped. The cost of producing a unit of water from a new water project according to
Existing Capacity
Chapter 5: Water Sustainability
97
World Bank schemes is often two to three times that from the current project. Moreover,
conflicts between different classes of users such as farmers, urban and industrial consumers
are becoming more common (Darmody et al., 1998). Rivers, lakes and bays are often shared
by several countries, and the increased scarcity of water will aggravate international tensions
in some very sensitive regions. The typical example for this is the share of the water resource
from Mekong river that runs through Vietnam, Thailand, Laos, and Cambodia.
Environmental legislation has also introduced significant barriers to the continued expansion
of off stream uses of water for agricultural and urban purposes. Other factors such as the
physical scarcity of high quality sources, the depletion and contamination of groundwater
sources, difficulties in financing major facilities for transmission, treatment and distribution
of water, especially the increasing costs of treatment for regulated contaminants, have also
made supply-side options less viable.
Funding constraints
Water utilities, and governmental sponsors, are in no position to bear the increasing capital,
operating and maintenance costs of catering for the projected growth of water requirements.
Their poor financial position is partly due to failures of pricing and cost recovery. In an
internal review of World Bank-supported projects the effective price per unit of water was
only one-third its average incremental cost (itself below the marginal economic cost of
supply) (Darmody et al., 1998). Other factors leading to poor financial performance are the
high proportion of leaks and wastage, weak billing and collection systems, and erratic
payments by large consumers.
5.3.4. Discussion on Supply and Demand Management
Developed countries have traditionally been applying the supply side approach and investing
in capital expenditure for water resource management. Utilities and governments are now
realizing that such an approach, while solving the problems associated with water and
sewerage services in the short term are not economical and sustainable in the longer run.
Consequently, they are investigating the demand side approach to water service provision,
which is not only economically viable and beneficial, but also requires lesser capital costs
than supply side options. The demand side approach is of particular relevance and usefulness
in consideration of the needs of developing countries such as Vietnam. These countries are in
the process of investing significantly in new infrastructure to provide water and sanitation
services to its population and to meet the growth driven by rapid urbanization. This is a major
global issue not only in economic terms, but also in social and developmental terms. The
Chapter 5: Water Sustainability
98
current strategies being implemented for provision of water and sewerage services in
developing countries predominantly mirror the supply side approach, that is now being
actively questioned, and which has resulted in a considerable over-investment in
infrastructure, environmental impact and resource use. There are enormous opportunities for
developing countries, created by growth in demand for water supply services and new
developments. The requirements for new services to meet standards of public health and
developmental goals creates major opportunities to incorporate more efficient resource use up
front, and to apply alternative servicing arrangements, such as distributed water supply and
effluent treatment systems and best practice water efficiency. Many cities of the developing
world have a per capita demand for water that exceeds that of some cities of the developed
world. A demand side approach would provide significant benefits in terms of resource use,
avoiding expensive capital and operating costs and reduced environmental impact. For
example, a preliminary survey on water use in Bangkok indicated that savings of over US$
800 million could be achieved through implementation of demand management measures
(Darmody et al., 1998). The reduction in capital and operating costs enables more appropriate
allocation of investment into improved sanitation and health education in rural communities.
5.4. DEMAND MANAGEMENT APPROACH IN HCMC
The ultimate water management solution for HCMC will likely contain aspects of supply-side
and demand-side management. As outlined by HCMC water resources strategy there are plans
to upgrade existing water treatment plants to increase supply to balance the demand.
However, the demand-side remains in the shadows and hasn’t yet become a policy priority.
Managing water demand to reduce the pressures on water systems are important options that
need to be considered and promoted to all water users. The current levels of water use are
unsustainable, but the issue cannot be solved solely by investing in supply-side solutions.
Demand-side management must be an integral part in the water policy debate as HCMC
strives for continued economic growth, healthy watersheds, and enhancing our quality of life.
It is clear that even with the augmentation of the current water supply system the demand
cannot be met especially because of the high NRW values. The following chapter will look
into the amount of water savings that could be achieved by adopting water conservation
measures, and potable water substitution measures into the current water use practices in
HCMC.
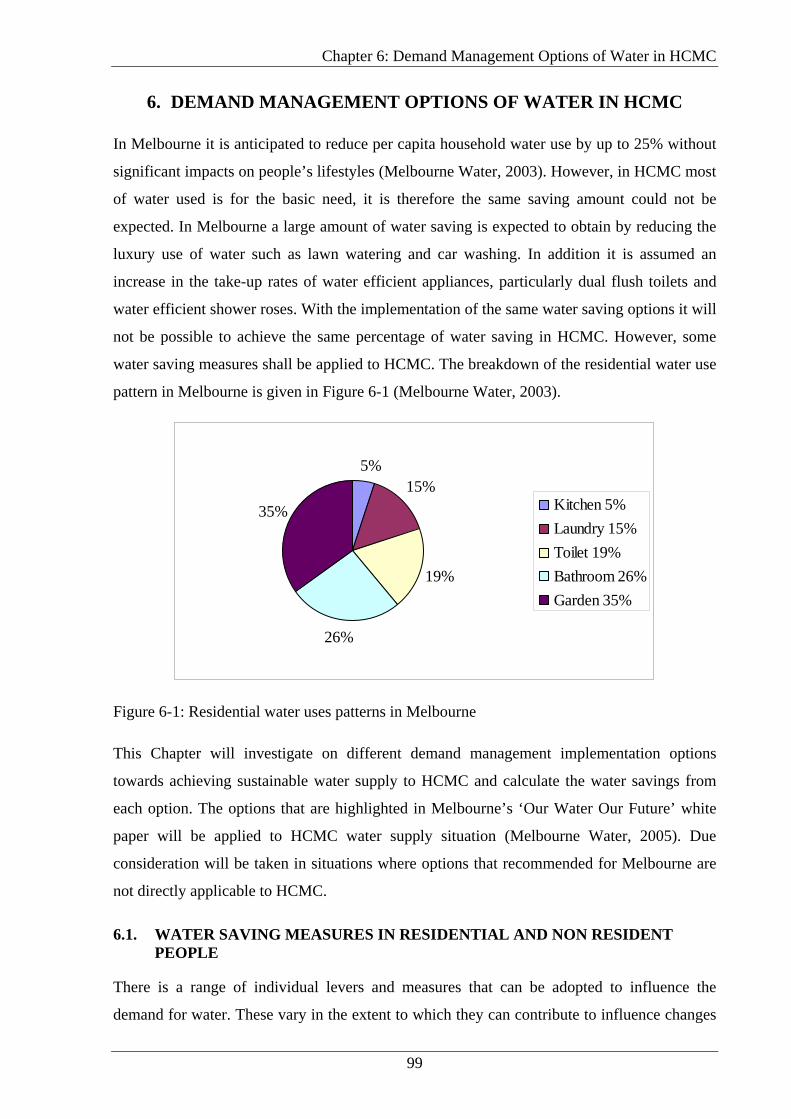
Chapter 6: Demand Management Options of Water in HCMC
99
6. DEMAND MANAGEMENT OPTIONS OF WATER IN HCMC In Melbourne it is anticipated to reduce per capita household water use by up to 25% without
significant impacts on people’s lifestyles (Melbourne Water, 2003). However, in HCMC most
of water used is for the basic need, it is therefore the same saving amount could not be
expected. In Melbourne a large amount of water saving is expected to obtain by reducing the
luxury use of water such as lawn watering and car washing. In addition it is assumed an
increase in the take-up rates of water efficient appliances, particularly dual flush toilets and
water efficient shower roses. With the implementation of the same water saving options it will
not be possible to achieve the same percentage of water saving in HCMC. However, some
water saving measures shall be applied to HCMC. The breakdown of the residential water use
pattern in Melbourne is given in Figure 6-1 (Melbourne Water, 2003).
5%15%
19%
26%
35% Kitchen 5%Laundry 15%Toilet 19%Bathroom 26%Garden 35%
Figure 6-1: Residential water uses patterns in Melbourne This Chapter will investigate on different demand management implementation options
towards achieving sustainable water supply to HCMC and calculate the water savings from
each option. The options that are highlighted in Melbourne’s ‘Our Water Our Future’ white
paper will be applied to HCMC water supply situation (Melbourne Water, 2005). Due
consideration will be taken in situations where options that recommended for Melbourne are
not directly applicable to HCMC.
6.1. WATER SAVING MEASURES IN RESIDENTIAL AND NON RESIDENT PEOPLE
There is a range of individual levers and measures that can be adopted to influence the
demand for water. These vary in the extent to which they can contribute to influence changes
Chapter 6: Demand Management Options of Water in HCMC
100
in water consumption and supply. Some of these are potentially able to be incorporated into a
Water Resources Strategy for HCMC. The mechanisms available include community
education in water conservation, Government’s regulatory approaches, pricing of water and
rebates or incentives for implementing water saving options.
6.1.1. Education
Dripping faucets, letting the water run while brushing teeth, or running a half-filled
dishwasher is a common practice of wasting water. Practicing this wise water use methods in
homes can benefit the community. In addition to using less ground and surface water,
lowering the need for wastewater disposal and help improve water quality in the environment.
Despite the effectiveness of simple behavioural changes in saving water, it is often difficult in
convincing many people to make permanent changes solely on the basis of providing them
once off information. In HCMC, there has been a lack of works carried out to make the
community more aware of water related issues. It is a dire need that people in HCMC
understand water saving practices which will help the environment and save them money. So
far, HCMC WSC has not done any interaction programs such as use of conventional media of
brochures, posters, pamphlets, or online publications.
In Australia, there have been extensive education and promotion programs undertaken over
the past 15 years that target the whole range of consumers in an attempt to change attitudes.
According to Melbourne’s Water Resources Strategy report a study carried out by the
CSIRO’s Urban Water Program reports up to 25% water savings could be achieved in the
short-term or during a drought by effective water conservation campaigns (Melbourne Water,
2003).
The educational campaigns can be carried out in number of ways.
• Publication of water conservation literature on how to save water.
• Regular newspaper advertisements on future water saving suggestions, current water
supply volumes and groundwater levels.
• Preparing and distributing of water audit kits to assist customers in identifying the
areas for potential savings around the house.
• Introduce in the curriculum for school children the water users of the future. This may
have an effect on the whole household, where children take the message home to their
parents.

Chapter 6: Demand Management Options of Water in HCMC
101
• Promotion of good garden practices to use water wisely. For example the use of mulch
and efficient watering techniques.
• Advice to large industrial water users on how they can reduce their total water
demand.
The campaign necessitates interaction between local councils and other local Water Supply
Districts. Despite a high level of community support for water conservation in developed
countries, many people still believe there is a level of indifference about water conservation
within parts of the community. It is therefore, changing attitudes and awareness are the long
term goal, especially for a developing city like HCMC where the campaigns have not been
carried out at all.
6.1.2. Reducing Demand through Pricing Changes
The implementation of user pays pricing in Melbourne has assisted in slowing the rate of
growth in annual water use as well as reducing the amount of water used on hot days. The
current user pays method in Melbourne charges for both water and sewerage comprise two
parts:
• A fixed service charge, and
• A user pays volumetric charge.
This system reflects the true cost of water and gives customers an incentive to use water
efficiently. According to Melbourne water (2003), the transition to user pay option involves
followings:
• Replacing the ‘free allowance’ determined by property value with a uniform
allowance of 150 kL per billing period (quarter of a year),
• Removing the uniform allowance and charging for all water used,
• Increasing the user pays volumetric charge and decreasing the service charge,
• Introducing a fixed service charge to replace the service charge based on property
value.
Based on Water Resources Strategy report the average household bill was reduced by 18%
when user pays charges were fully implemented. Concessions were given to eligible persons
on their water and sewerage charges to ensure that essential water and sewerage services are
affordable to all customers. In addition to these rebates, the water companies have hardship
schemes that assist customers in making their repayments. In addition to user-pay system,
Chapter 6: Demand Management Options of Water in HCMC
102
there are number of tariff options that the above user-pay systems can be implemented to
HCMC (Melbourne Water, 2001).
Step tariffs: Under this tariff option, successive blocks of water consumption could be
charged at a higher price. For example, the first 300 kL of household consumption could be
charged at 70 cents per kL (Australian dollar), with consumption above this amount at say 90
cents per kL. Under this tariff structure, those who use large amounts of water would pay
more. However, this could have an adverse impact on large families, who have bigger, non-
discretionary components to their water use.
Seasonal water charges: Water use during dry season can be higher than average daily use.
The commitment to meet peak day demand drives significant capital expenditure. The
additional charges in dry season will reflect the additional capital expenditure incurred.
Higher dry season prices could be offset by lower prices during the rest of the year. Under this
tariff structure, high dry season water users would pay more.
6.1.3. Water Tariff in Ho Chi Minh City
The water tariff over the last few years in HCMC has been well below the production cost.
Moreover, the amortization is not sufficient to make new investment. The government has
been subsidizing for water and people in HCMC have been paying very low prices for water.
This has created a bad habit of the community expectation. Therefore, when a new water
treatment plant is invested with high amortization that leads to high water price, people find it
hard to accept the new water tariff.
HCMC Water Supply Company (WSC) is responsible for provision of water and collection of
user fees. The main responsibility of WSC is to cover costs of operation and maintenance.
The Central Government has stated that WSC should subsidise the water prices with revenues
generated from following activities (World Bank, 1999)
• Revenues from sale of water.
• Installation of consumer connections.
• Subsidies from the Government.
The WSC is not authorized to raise service fees or retain surplus funds except to maintain
minimal repairs. The People’s Committees determine water tariffs and approve major
investments. The WSC prepare a proposal concerning new tariffs, which is reviewed by
several committees before the People’s Committee makes a final decision (World Bank,
1999).
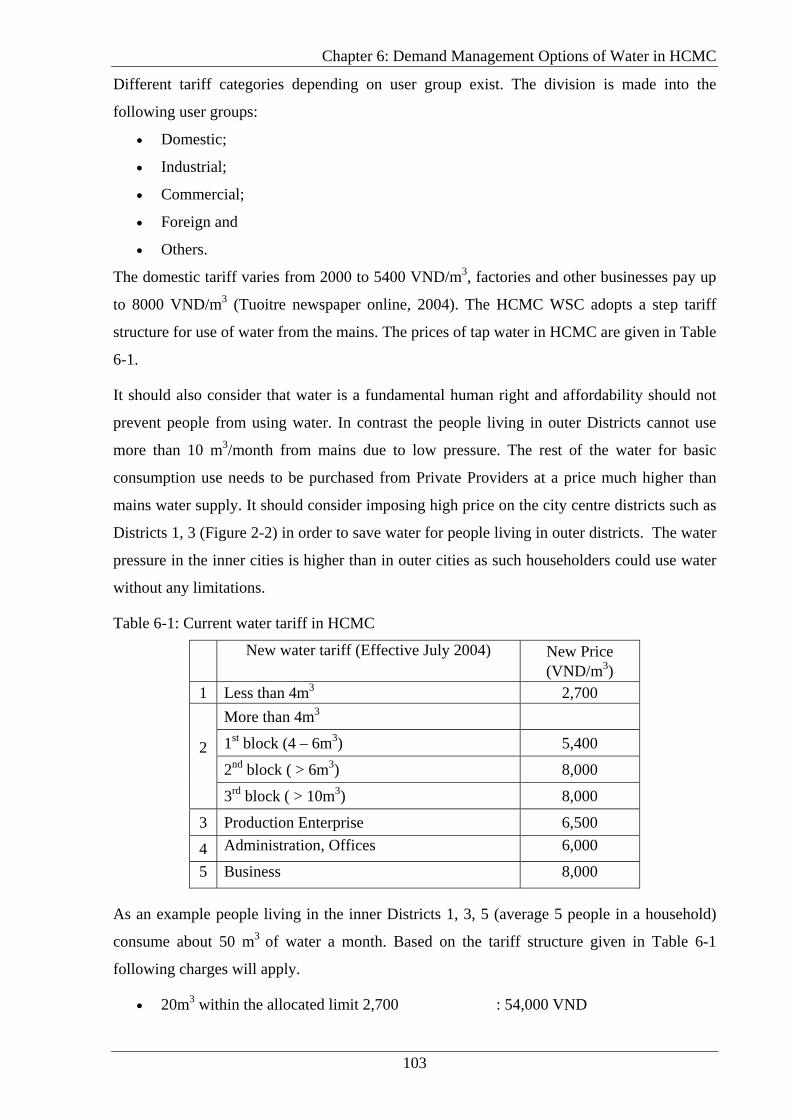
Chapter 6: Demand Management Options of Water in HCMC
103
Different tariff categories depending on user group exist. The division is made into the
following user groups:
• Domestic;
• Industrial;
• Commercial;
• Foreign and
• Others.
The domestic tariff varies from 2000 to 5400 VND/m3, factories and other businesses pay up
to 8000 VND/m3 (Tuoitre newspaper online, 2004). The HCMC WSC adopts a step tariff
structure for use of water from the mains. The prices of tap water in HCMC are given in Table
6-1.
It should also consider that water is a fundamental human right and affordability should not
prevent people from using water. In contrast the people living in outer Districts cannot use
more than 10 m3/month from mains due to low pressure. The rest of the water for basic
consumption use needs to be purchased from Private Providers at a price much higher than
mains water supply. It should consider imposing high price on the city centre districts such as
Districts 1, 3 (Figure 2-2) in order to save water for people living in outer districts. The water
pressure in the inner cities is higher than in outer cities as such householders could use water
without any limitations.
Table 6-1: Current water tariff in HCMC
New water tariff (Effective July 2004) New Price (VND/m3)
1 Less than 4m3 2,700 More than 4m3
1st block (4 – 6m3) 5,400
2nd block ( > 6m3) 8,000 2
3rd block ( > 10m3) 8,000
3 Production Enterprise 6,500
4 Administration, Offices 6,000
5 Business 8,000
As an example people living in the inner Districts 1, 3, 5 (average 5 people in a household)
consume about 50 m3 of water a month. Based on the tariff structure given in Table 6-1
following charges will apply.
• 20m3 within the allocated limit 2,700 : 54,000 VND
Chapter 6: Demand Management Options of Water in HCMC
104
• 10m3 over the 1st allocated limit 5,400 : 54,000 VND
• 20m3 over the 2nd allocated limit 8,000 : 160,000 VND
TOTAL : 268,000 VND
The average income of people living in the inner Districts is ranging from 6-8 million VND
per month. Therefore, on average a person will pay about 3.3-4.4% of their income for water
consumption.
For people living in outer Districts, due to low water pressure, people have to collect water at
night. However, they still can not get enough water for their needs. On average, each
household in outer Districts consume approximately 20m3 per month. In addition, they can
access only about 10m3 of water per month from the mains. The households have to purchase
the rest to the water from private vendors at a price of 15,000 VND/m3. The amount of money
they have to pay:
• 10m3 within price 2,700/m3 : 27,000 VND
• Extra 10m3 with price 15,000/m3 : 150,000 VND
TOTAL : 177,000 VND
The average income of people living in the outer Districts is approximate 2 million VND per
month. In spite of these residents using less water than people living inner cities, they pay 8%
of their income.
Putting a price on water is dependent on a number of factors. According to Merrett (2002)
main objectives of water tariffs are:
• Affordability;
• Cover cost of production and distribution;
• Encourage water sustainability (conservation) and
• Discourage pollution.
It is important to set the price affordable to all consumers. The easiest way for tariff setting is
to give each volumetric quantity of water the same price. Considering the range and variety of
consumer groups, setting the same price for all would favor high-income groups and burden
low-income households. As a result, price progression and identification of users is the way to
deal with such a problem. The concept behind price progression is that each volumetric
quantity of water has a different price. In Australia this is termed inclined block tariff. This
implies that the more water a consumer uses, the more they pay. An alternative to pricing is
Chapter 6: Demand Management Options of Water in HCMC
105
that low-income households receive a basic amount of water, free of charge, or at a very low
cost necessary for cooking and cleaning. Volumes above the basic level are however priced.
Water tariff issues affecting the sustainability in HCMC
• Every month HCMC WSC has to compensate for the loss due to the water price it is
well below the production cost. The current water tariff can not help to accumulate, re-
invest or pay for loans for water investment projects. In addition, this water rate is a
serious impediment to the participation of private investors.
• Low water tariff does not encourage people to save water. People in high water
pressure areas are wasting a lot of water, whereas people are struggling with water in
low pressure areas.
• Water tariff for production and business enterprise creates unfairness among
enterprises. High water tariff (6500 VND) is applied for all business enterprises. It
means that for business enterprises that do not use water as their materials also have to
pay high price. This leads to higher price for finished products.
6.1.4. Reducing Demand through Incentives
To conserve water consumption, incentives can be introduced by subsidizing the purchase and
operation of water saving appliances. It is essential, however, that any incentives offered are
effective and sustainable. Incentives can encourage changing the behaviour. Governments
need to offer a wide range of incentives to help promote better water management practices.
This will help to raise awareness and stimulate demand for water management products. For
example Government incentives could be as follows:
• Offering the discounted service of a green plumber to install water and energy
efficient appliances in residential households;
• The customers can purchase and install water efficient equipment themselves or opt
for their water retailer to bear the up-front costs. In this case the customer pays back
these costs through the savings on their water bills. This service will also be extended
to residents;
• Water companies to give a rebate when purchased water efficient appliances. For
examples retail companies give a rebate if people put a rainwater tank, top loading
washing machine, etc.
Chapter 6: Demand Management Options of Water in HCMC
106
6.1.5. Reducing Demand through Regulations
Water saving could be achieved by passing Government regulations on sold products,
building standards etc. According to the Melbourne study the bathroom, toilet and laundry in
a domestic house currently use 26%, 19% and 15% of the total water use. Government plans
to reduce the water consumption by regulating household appliances with water efficient
ones. In Melbourne in the mid 1980’s, dual flush toilets were made compulsory in all new
homes and whenever old toilets were replaced. Following are some examples of indoor water
efficient devices that could be regulated to save water (Melbourne Water, 2003).
• Dual flush toilets
• Low pressure shower-heads
• Top loading washing machines
Dual flush toilets have been introduced to Vietnam market. It should be noted that currently
for most of the Vietnamese people the above features are considered as luxury items. Most of
dual flush toilets are produced by big brand companies such as TOTO, American home and
they are still considered relatively expensive for most Vietnamese people. Recently high
standard houses were built and only rich people are capable of purchasing these. Similar
situation has happened with showers and washing machines. In addition, it is important to
note that a large percentage of population wash clothes by hands. Showerheads can not be
used for those who live in low water pressure zones. They use water ladle instead of shower-
heads.
Shower-head
Based on a study carried out in Melbourne (Melbourne Water, 2003) showers use 20% of the
water used in a single dwelling house. The shower-heads are rated as ‘A’, ‘AA’ and ‘AAA’
based on the flow rate. Shower-heads rated AAA has a maximum flow rate of 9 L/min and
AA has a maximum flow rate of 12 L/min. Large water saving is possible by converting
standard A and AA roses to AAA roses. According to Melbourne Water Resources Strategy
Report if 50% of houses were fitted with AAA rated shower roses by 2021, then it could be
expected that 12,000 ML of water saving per year could be achieved. Another study was
carried out in Melbourne by surveying the water appliances and the water use pattern of 96
households. Based on the study if all 96 house holds (HH) install AAA rated shower roses on
average there will be water savings of 30 KL/HH/year (Personal communication with Shirley
Gato, postgraduate student, School of Civil and Chemical Engineering, RMIT). Changing
behaviour by reducing the average shower time of seven minutes to five minutes also has a
significant impact.
Chapter 6: Demand Management Options of Water in HCMC
107
Unlike in Melbourne, except in the inner city area the overall water pressure is low in most of
the areas in HCMC. As a result a large amount of water would not be wasted due to high flow
rates in outer districts. In addition, a large percentage of houses does not have showers
installed, instead use buckets and ladles for body washing and bathing. As a result by
introducing AAA rated shower-heads the water savings will be relatively small in the near
future in HCMC. However, as the growth of economy is fast in HCMC, living conditions
would improve and many households would install showers. Shower-heads are categorised as
A, AA and AAA. These shower-heads have a flow rate of 12-15 L/min; 9-12 L/min and 7.5-9
L/min respectively. Based on Table 5-3 currently only 67% has water supply coverage. It is
assumed that 50% of households who has water supply coverage are currently fitted with
shower-heads in their houses. It is also assumed 90% of these houses will have A or AA rated
shower-heads. The water supply coverage in 2020 will increase to 80.6% (Table 5-5).
Following assumptions were used when calculating the percentage (%) water saved if AAA
rated shower-heads are being used:
Assumptions:
In year 2020 it is assumed that 80% of households who has water supply would install
showerheads. 90% of the households who have showerheads would install AAA rated
showerheads instead of A and AA rated showerheads in 2020.
• Duration of a shower on average is 7 minutes
• The flow in A and AA rated showerhead is 12 L/min
• The flow in AAA rated showerhead is 7.5 L/min
The total amount of water saved per day with introducing AA, AAA showerheads is given by
following calculations. The residential population in year 2020 is 10.23 million (Table 5-9)
In 2020: 90% of showerheads are AAA rated and 10% are A or AA rated
12 (L/min) x 7 (min/shower) x 10.23x10⁶ (people) x 0.8 x 0.9 x 0.806 = 498 ML/day
7.5 (L/min) x 7 (min/shower) x 10.23x10⁶ (people) x 0.8 x 0.9 x 0.806 = 311 ML/day
12L (L/min) x 7 (min/shower) x 10.23x10⁶ (people) x 0.8 x 0.1 x 0.806 = 55 ML/day
If all households that have shower-head install AAA shower-heads
498 – 311 - 55 = 115 ML/day saved = 132/1411 = 9% saving in residential uses.
AAA rated shower -heads should be made widely available by instigating regulations. In
order to succeed the program, government necessitates working with several departments
agencies such as import and export department to make sure that imported goods are
Chapter 6: Demand Management Options of Water in HCMC
108
complied with regulations. This is rather difficult since there are a lot of smuggled goods in
Vietnam market with cheap prices. If difference in price between AAA rated shower-heads
and other less efficient shower-heads are small, the AAA rated shower-heads will be widely
accepted. It can be done through government subsidization.
Government is urged to implement the retrofit program with ‘A’ rated shower-heads through
regulation. It is for these reasons that the People’s Committee advocates the use of low
volume showerheads for water conservation programs in HCMC.
Washing machine
Front load washing machines rated AAA use a maximum of 95 litres per load on their
‘normal’ cycle compared to 190 litres per load for an A rated top loading machine (Melbourne
Water, 2003). The top loading machine is more in use than front loading machines largely due
to the high cost of the front washing machines and to a lesser extent due to characteristics of
the machine. The front load washer costs on average VND 4millions (AUD$320) more per
machine than the top-loaders, which is with the biggest drawback for most people in Vietnam.
This cost could be recovered over time with savings from water and energy costs. The clothes
will also last longer, because front-load washers gently tumble clothes instead of jerking them
around with an agitator. In addition, front-load washers squeeze more of the water out from
clothes, spending less on energy bills to dry clothes. Front-load washers usually have a higher
capacity, making it easier to wash large items like bedspreads and rugs.
Following examples compare the cost of purchasing and running a front load washer versus
top load washer. Following assumptions are made in calculating the cost:
− Number of load per year: 04 loads per week and 52 weeks per year. i.e. 200 loads per
year
− Cost of water 6000 VND/m3
− Cost of electricity 1000 VND/kWh
− Type of machine: LG model 2005 model: Top load model is VND 4.1 millions
WFT1111D. Front load model is VND 8.3 millions WD-1485FD (Prices are set at LG
dealers in HCMC in May 2005)
Table 6-2 gives the amount of water and energy consumption from top and front load
machines.
Table 6-2: Water and energy consumption of top and front load washer
Per load Per year Saving
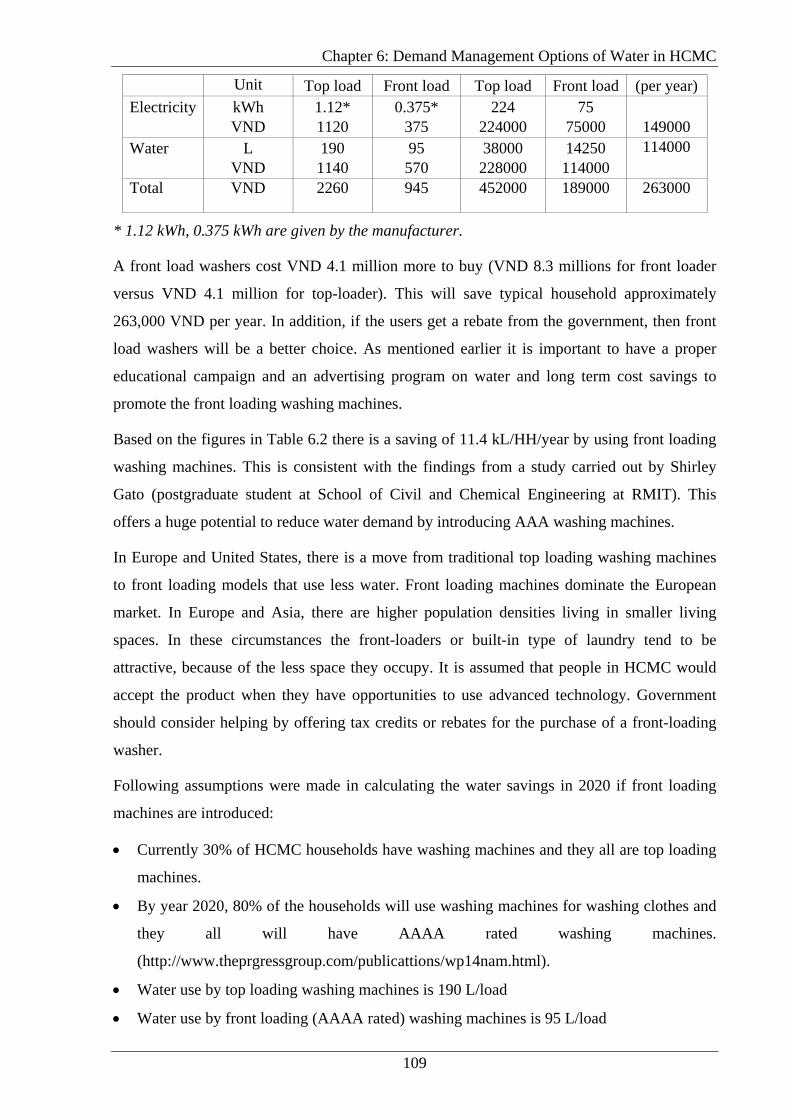
Chapter 6: Demand Management Options of Water in HCMC
109
Unit Top load Front load Top load Front load (per year) Electricity kWh
VND 1.12* 1120
0.375* 375
224 224000
75 75000
149000
Water L VND
190 1140
95 570
38000 228000
14250 114000
114000
Total VND 2260 945 452000 189000 263000
* 1.12 kWh, 0.375 kWh are given by the manufacturer.
A front load washers cost VND 4.1 million more to buy (VND 8.3 millions for front loader
versus VND 4.1 million for top-loader). This will save typical household approximately
263,000 VND per year. In addition, if the users get a rebate from the government, then front
load washers will be a better choice. As mentioned earlier it is important to have a proper
educational campaign and an advertising program on water and long term cost savings to
promote the front loading washing machines.
Based on the figures in Table 6.2 there is a saving of 11.4 kL/HH/year by using front loading
washing machines. This is consistent with the findings from a study carried out by Shirley
Gato (postgraduate student at School of Civil and Chemical Engineering at RMIT). This
offers a huge potential to reduce water demand by introducing AAA washing machines.
In Europe and United States, there is a move from traditional top loading washing machines
to front loading models that use less water. Front loading machines dominate the European
market. In Europe and Asia, there are higher population densities living in smaller living
spaces. In these circumstances the front-loaders or built-in type of laundry tend to be
attractive, because of the less space they occupy. It is assumed that people in HCMC would
accept the product when they have opportunities to use advanced technology. Government
should consider helping by offering tax credits or rebates for the purchase of a front-loading
washer.
Following assumptions were made in calculating the water savings in 2020 if front loading
machines are introduced:
• Currently 30% of HCMC households have washing machines and they all are top loading
machines.
• By year 2020, 80% of the households will use washing machines for washing clothes and
they all will have AAAA rated washing machines.
(http://www.theprgressgroup.com/publicattions/wp14nam.html).
• Water use by top loading washing machines is 190 L/load
• Water use by front loading (AAAA rated) washing machines is 95 L/load
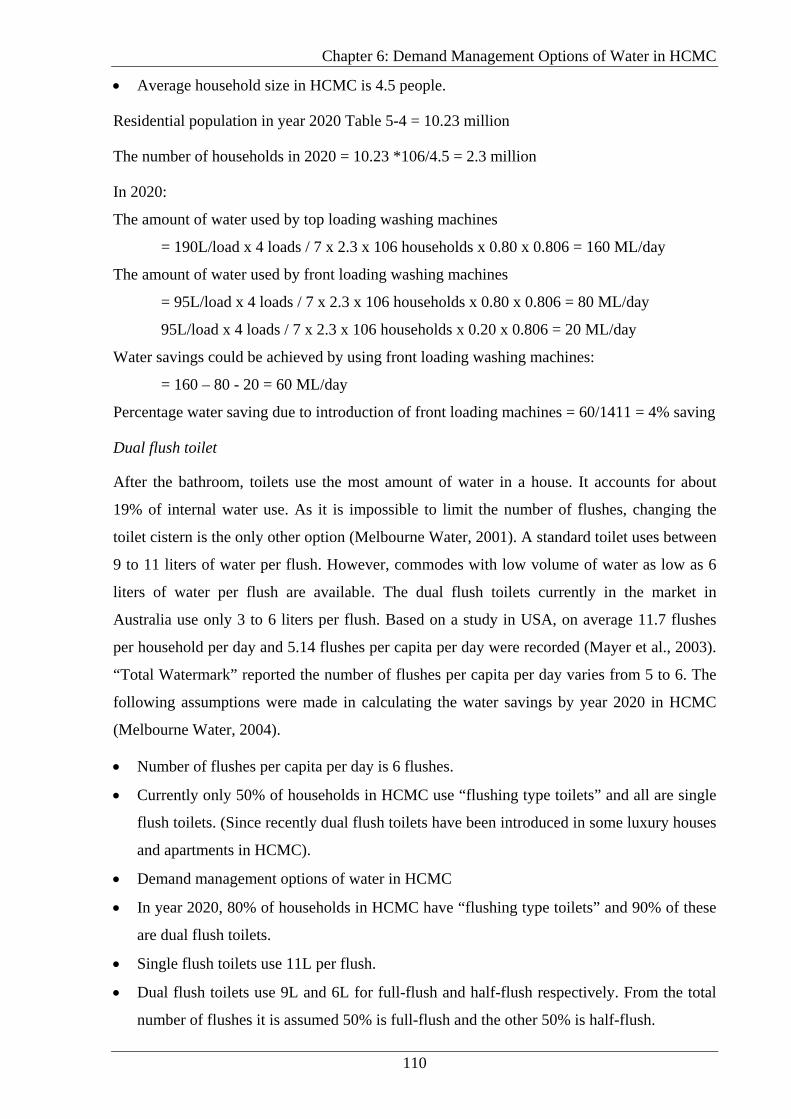
Chapter 6: Demand Management Options of Water in HCMC
110
• Average household size in HCMC is 4.5 people.
Residential population in year 2020 Table 5-4 = 10.23 million
The number of households in 2020 = 10.23 *106/4.5 = 2.3 million
In 2020:
The amount of water used by top loading washing machines
= 190L/load x 4 loads / 7 x 2.3 x 106 households x 0.80 x 0.806 = 160 ML/day
The amount of water used by front loading washing machines
= 95L/load x 4 loads / 7 x 2.3 x 106 households x 0.80 x 0.806 = 80 ML/day
95L/load x 4 loads / 7 x 2.3 x 106 households x 0.20 x 0.806 = 20 ML/day
Water savings could be achieved by using front loading washing machines:
= 160 – 80 - 20 = 60 ML/day
Percentage water saving due to introduction of front loading machines = 60/1411 = 4% saving
Dual flush toilet
After the bathroom, toilets use the most amount of water in a house. It accounts for about
19% of internal water use. As it is impossible to limit the number of flushes, changing the
toilet cistern is the only other option (Melbourne Water, 2001). A standard toilet uses between
9 to 11 liters of water per flush. However, commodes with low volume of water as low as 6
liters of water per flush are available. The dual flush toilets currently in the market in
Australia use only 3 to 6 liters per flush. Based on a study in USA, on average 11.7 flushes
per household per day and 5.14 flushes per capita per day were recorded (Mayer et al., 2003).
“Total Watermark” reported the number of flushes per capita per day varies from 5 to 6. The
following assumptions were made in calculating the water savings by year 2020 in HCMC
(Melbourne Water, 2004).
• Number of flushes per capita per day is 6 flushes.
• Currently only 50% of households in HCMC use “flushing type toilets” and all are single
flush toilets. (Since recently dual flush toilets have been introduced in some luxury houses
and apartments in HCMC).
• Demand management options of water in HCMC
• In year 2020, 80% of households in HCMC have “flushing type toilets” and 90% of these
are dual flush toilets.
• Single flush toilets use 11L per flush.
• Dual flush toilets use 9L and 6L for full-flush and half-flush respectively. From the total
number of flushes it is assumed 50% is full-flush and the other 50% is half-flush.

Chapter 6: Demand Management Options of Water in HCMC
111
The calculations below give the water savings that could be achieved due to use of dual flush
toilets:
In 2020:
Predicted water use in year 2020 if no dual flush toilets (only single flush toilets) are installed
= 11 x 6 x 10.23 x 10^6 x 80% x 0.806 = 435 ML/day
Predicted water use in year 2020 with the introduction of dual flush toilets:
Full flush: 9 x 6 x 10.23 x 10^6 x 80% x 90% x 0.806 x 50% = 160 ML/day
Half flush: 6 x 6 x 10.23 x 10^6 x 80% x 90% x 0.806 x 50% = 106 ML/day
Single flush: 11 x 6 x 10.23 x 10^6 x 80% x 10% x 0.806 = 43 ML/day
Anticipated total water usage for in year 2020: 160 + 106 + 43 = 309 ML/day
Total water saved by introducing dual flush toilets: 435 – 309 = 126 ML/day
The percentage water saving: 126/1411 = 9% saving in residential water use.
Total water saving by introducing efficient shower-heads, front loading washing machines
and dual flush toilets in residential areas: 9% + 4% + 9% = 22%
6.2. WATER SAVING IN COMMERCIAL AREAS
Commercial and industry is responsible for 37% of water uses in HCMC (Figure 5-3) and
have a significant effect on local water demands. Rising water costs, limited water supplies,
and issues such as waste minimisation and pollution control are making commercial and
industrial sector and the utilities that serve them take a new look at the role for increased
water-use efficiency, water reuse and other technologies in all over the world. Commercial
and industrial water conservation will be motivated by economic and regulatory incentives.
Although water conservation and waste discharge minimisation has not been currently
enforced in HCMC, industries will soon have to pay for quantity of wastewater discharge and
for treatment. The new plants that are being built incorporate internal recycling technologies
to avoid the high cost of environmental compliance and retrofitting later on.
It is important not to use higher quality water for a purpose that can tolerate a lower quality.
(Chanan et al., 2003) reported that the major determinant in sustainable water management is
that of matching water sources with end uses in terms of the required water quality.
A number of studies have been carried out and reported on residential water saving options.
However, there is not much reported information on water savings from commercial buildings

Chapter 6: Demand Management Options of Water in HCMC
112
and industries. Two studies have been carried out by (Chanan et al., 2003) to study the
sustainable water management in commercial office buildings in Australia. Study one
highlight the different aspects of water management in a Green building in Melbourne. This
building has been in operation since 2002 and illustrates that small commercial buildings can
achieve potable water reductions up to 90%. This building is a refurbished 4-storey
commercial building with construction completed in September 2002. The second study
describes the research undertaken by the Institute for Sustainable Futures in New South Wales
Australia, for Sydney Water Corporation to determine the potential water savings from
various water management options in a typical commercial high-rise building. The two
studies have shown a reduction of 80% in water demand in a typical size commercial
building. In Melbourne the commercial sector typically comprises 28% (Melbourne Water,
2001) of total water demand in an urban water supply system and provides ample
opportunities for sustainable water management and potential savings in water. This sector,
unlike the industrial sector, is easy to target for water conservation measures, as a significant
proportion of its indoor water use is similar to residential water use. Hence, commercial office
buildings can make use of the technological advances made in the improved water efficiency
of fixtures like toilets, urinals, taps and shower-heads; other systems such as cooling towers,
reuse systems and rainwater capture and treatment systems. How ever, it needs to be noted
that both these buildings are new and built with water conservation techniques in mind. A pre-
existing building would be limited to the water savings it could achieve without major
renovation. Chanan et al. (2003) also reported that 90% reduction of sewage discharge can be
achieved by integration of innovative use of water efficient fixtures, capturing of rain water
and reuse of treated effluent. In Melbourne a 10 storey, 6 stars Building under construction
will be able to reduce mains water use by 72% (City of Melbourne, 2004) showing that even
in large high rise buildings water conservation techniques can play a large role in reducing
potable water demand.
Similar to a residential toilet, 6/3 L dual flush toilets will save water consumption in
commercial buildings. In addition water efficient urinals (2.8 L/flush), waterless urinals, low
flow taps and vacuum toilets used in aircrafts are also gradually increasing its demand in
commercial and public buildings.
HCMC is a fast growing city in Vietnam. There will be many new office buildings and
shopping centers. With new water saving devices such as shower-heads, dual flush toilet
systems and proper water management, 20% saving in water demand in Commercial areas is
highly achievable. Following calculations will give the total water saving in HCMC in year

Chapter 6: Demand Management Options of Water in HCMC
113
2020 due to implementation of Government regulations to reduce water consumption in
commercial areas.
6.2.1. Water Saving in Hotel Industry
Vietnam has a significant potential for tourism development with about 2000 national historic
sites, 125 beaches and parks featuring precious fauna and flora. The tourist arrivals have
increased from 250,000 in 1990 to 1.4 million in 1994, and to 2.5 million in 2001. The
number of visitors is expected to grow by 30–40% up to the year 2010. To meet the growth of
inbound foreign and local tourists, various hotels and resorts, rated from 2-star to 5-star, have
been built in recent years with a total of about 63,500 rooms in 1999 (Do and Kumar, 2005).
Though the occupancy rate has not shown much increase during 1996–1999, the number of
rooms during this period increased by about 15%. With increasing demands for hotel services,
the Vietnamese hotel industry has become a great consumer of water. However, at present,
there are no existing guidelines for the efficient use and management of water resources. The
water consumption in Vietnamese hotels is much higher than hotels in Europe (Do and
Kumar, 2005).
With the support of the European Commission’s Asia-Invest Program, The School of Hotel
and Tourism of HCMC in partnership with the French Agency for the Environment and
Energy Management and with the co-operation of the local authorities of HCMC completed
an 18-month long environmental management project. Started in 2002, the main aim of the
project was to help the local hospitality industry adapt to international environmental
standards by benefiting from the European experience and best practice. A combination of on-
site and on-line support and international and local expertise enhanced the effectiveness of the
project’s performance.
In every room of the 15 three and four-star hotels, there is a notice in Vietnamese, English,
French, Italian and German stating, “Let’s protect the green environment”. These hotels were
the main beneficiaries from the Asia-Invest project ‘Introducing environmental management
planning and practices for hotels and resorts in Vietnam’. The study has stated that water
consumption has been reduced by 21% (http://europa.edu.int accessed 16/03/05).
Another study about water consumption in the hotel industry has been conducted by Sydney
Water in Australia. The results have shown that average water savings of around 20% are
possible without compromising guest comfort levels
(http://www.sydneywater.com.au/SavingWater/InYourBusiness/Hotels.cfm). According to
Philip (2005) the Hotel Inter-Continental Sydney has saved over 30% from its original water
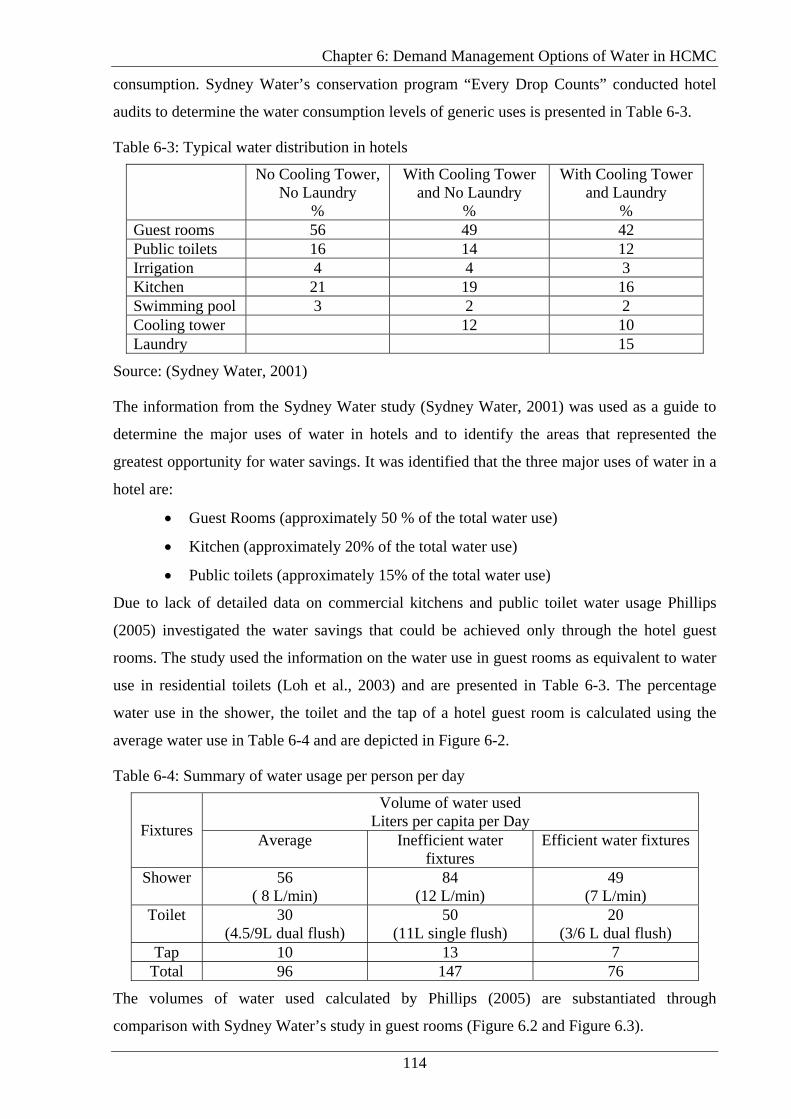
Chapter 6: Demand Management Options of Water in HCMC
114
consumption. Sydney Water’s conservation program “Every Drop Counts” conducted hotel
audits to determine the water consumption levels of generic uses is presented in Table 6-3.
Table 6-3: Typical water distribution in hotels
No Cooling Tower, No Laundry
%
With Cooling Tower and No Laundry
%
With Cooling Tower and Laundry
% Guest rooms 56 49 42 Public toilets 16 14 12 Irrigation 4 4 3 Kitchen 21 19 16 Swimming pool 3 2 2 Cooling tower 12 10 Laundry 15
Source: (Sydney Water, 2001)
The information from the Sydney Water study (Sydney Water, 2001) was used as a guide to
determine the major uses of water in hotels and to identify the areas that represented the
greatest opportunity for water savings. It was identified that the three major uses of water in a
hotel are:
• Guest Rooms (approximately 50 % of the total water use)
• Kitchen (approximately 20% of the total water use)
• Public toilets (approximately 15% of the total water use)
Due to lack of detailed data on commercial kitchens and public toilet water usage Phillips
(2005) investigated the water savings that could be achieved only through the hotel guest
rooms. The study used the information on the water use in guest rooms as equivalent to water
use in residential toilets (Loh et al., 2003) and are presented in Table 6-3. The percentage
water use in the shower, the toilet and the tap of a hotel guest room is calculated using the
average water use in Table 6-4 and are depicted in Figure 6-2.
Table 6-4: Summary of water usage per person per day
Volume of water used Liters per capita per Day Fixtures Average Inefficient water
fixtures Efficient water fixtures
Shower
56 ( 8 L/min)
84 (12 L/min)
49 (7 L/min)
Toilet 30 (4.5/9L dual flush)
50 (11L single flush)
20 (3/6 L dual flush)
Tap 10 13 7 Total 96 147 76
The volumes of water used calculated by Phillips (2005) are substantiated through
comparison with Sydney Water’s study in guest rooms (Figure 6.2 and Figure 6.3).
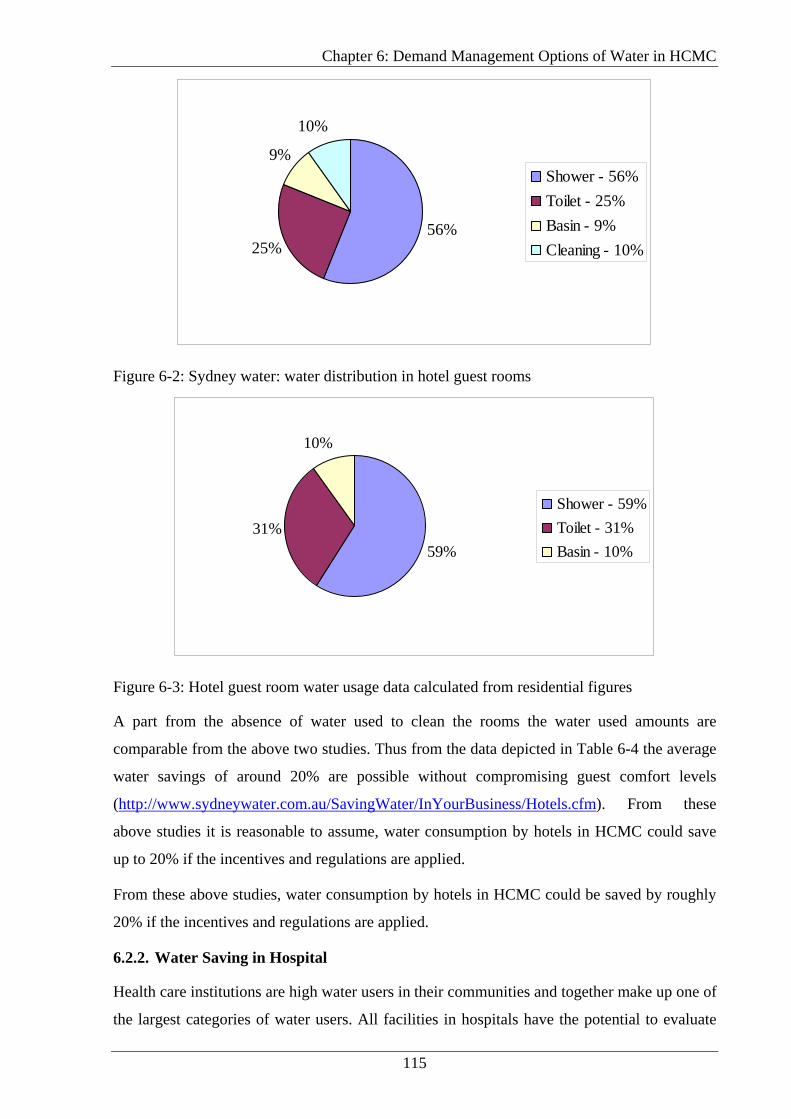
Chapter 6: Demand Management Options of Water in HCMC
115
56%25%
9%
10%
Shower - 56%Toilet - 25%Basin - 9%Cleaning - 10%
Figure 6-2: Sydney water: water distribution in hotel guest rooms
59%31%
10%
Shower - 59%Toilet - 31%Basin - 10%
Figure 6-3: Hotel guest room water usage data calculated from residential figures
A part from the absence of water used to clean the rooms the water used amounts are
comparable from the above two studies. Thus from the data depicted in Table 6-4 the average
water savings of around 20% are possible without compromising guest comfort levels
(http://www.sydneywater.com.au/SavingWater/InYourBusiness/Hotels.cfm). From these
above studies it is reasonable to assume, water consumption by hotels in HCMC could save
up to 20% if the incentives and regulations are applied.
From these above studies, water consumption by hotels in HCMC could be saved by roughly
20% if the incentives and regulations are applied.
6.2.2. Water Saving in Hospital
Health care institutions are high water users in their communities and together make up one of
the largest categories of water users. All facilities in hospitals have the potential to evaluate
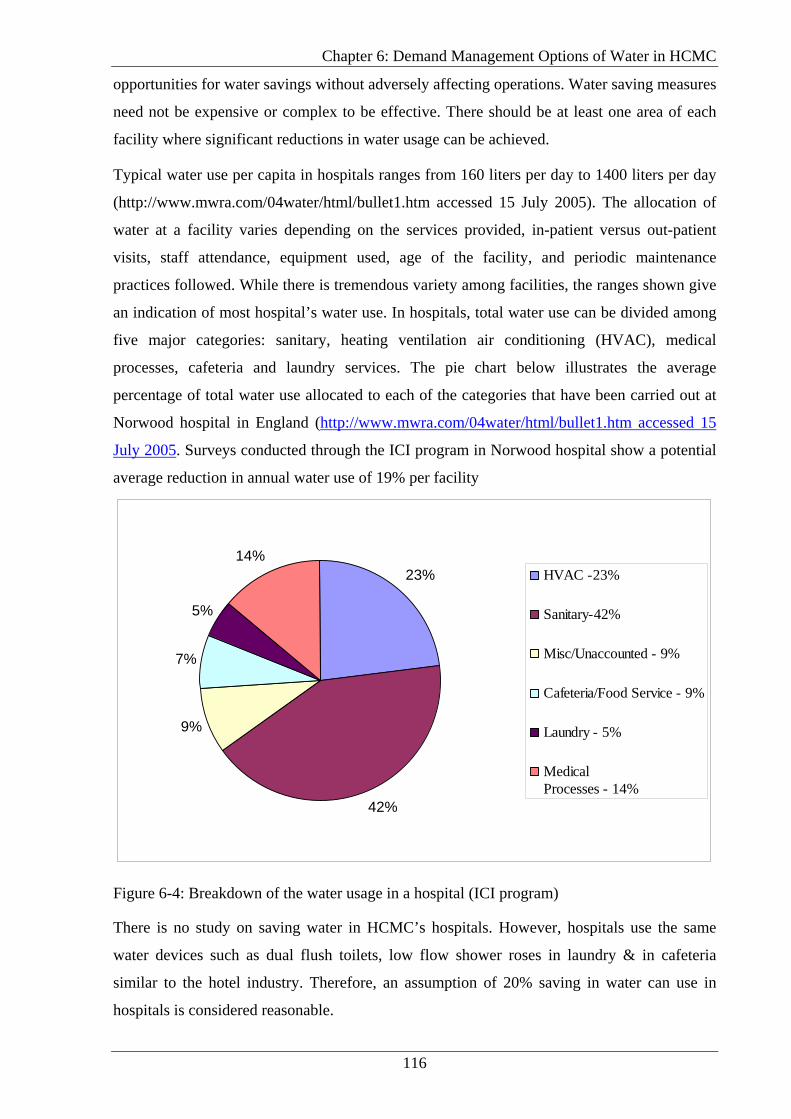
Chapter 6: Demand Management Options of Water in HCMC
116
opportunities for water savings without adversely affecting operations. Water saving measures
need not be expensive or complex to be effective. There should be at least one area of each
facility where significant reductions in water usage can be achieved.
Typical water use per capita in hospitals ranges from 160 liters per day to 1400 liters per day
(http://www.mwra.com/04water/html/bullet1.htm accessed 15 July 2005). The allocation of
water at a facility varies depending on the services provided, in-patient versus out-patient
visits, staff attendance, equipment used, age of the facility, and periodic maintenance
practices followed. While there is tremendous variety among facilities, the ranges shown give
an indication of most hospital’s water use. In hospitals, total water use can be divided among
five major categories: sanitary, heating ventilation air conditioning (HVAC), medical
processes, cafeteria and laundry services. The pie chart below illustrates the average
percentage of total water use allocated to each of the categories that have been carried out at
Norwood hospital in England (http://www.mwra.com/04water/html/bullet1.htm accessed 15
July 2005. Surveys conducted through the ICI program in Norwood hospital show a potential
average reduction in annual water use of 19% per facility
23%
42%
9%
7%
5%
14%HVAC -23%
Sanitary-42%
Misc/Unaccounted - 9%
Cafeteria/Food Service - 9%
Laundry - 5%
MedicalProcesses - 14%
Figure 6-4: Breakdown of the water usage in a hospital (ICI program)
There is no study on saving water in HCMC’s hospitals. However, hospitals use the same
water devices such as dual flush toilets, low flow shower roses in laundry & in cafeteria
similar to the hotel industry. Therefore, an assumption of 20% saving in water can use in
hospitals is considered reasonable.

Chapter 6: Demand Management Options of Water in HCMC
117
6.2.3. Water Saving in Schools
Promoting the efficient use of water is a long-term activity, as it involves encouraging
consumers to use water sensibly, both today and in the future. Changes in attitude to water use
are unlikely to happen overnight. There need to be long-term strategies in order to have an
impact on overall water saving. Schools are encouraging children to take home advice taught
to them in schools. A broad-ranging education programmes should be developed by water
authorities.
Based on a study carried out by Sydney Water up to 50% of the water that schools use can be
saved by reducing wastage and installing water efficient fixtures
(http://www.sydneywater.com.au accessed 26April 2005). 20% of water saving in schools in
HCMC is highly achievable.
6.2.4. Water Savings from Commercial Buildings by Non residents of HCMC
As stated in Section 5.1.2, non-residents consist of population outside HCMC and travel to
HCMC on daily basis for business, commercial work, tourism etc. Based on the discussion
and examples given above it is assumed 20% of the water could be saved from commercial
buildings if water efficient fixtures are used. Table 5-8 gives the expected water demand of
239 ML/day by non-residents in HCMC. With the water saving devices in place, by year 2020
the nonresidents of HCMC using water in commercial buildings could save following amount
of water:
The total water saving in Commercial Buildings by non-residents of HCMC = 239 *20% = 48
ML/day.
6.2.5. Water Savings from Commercial Buildings by residents of HCMC
Table 5-4 gives total water demand in year 2020 (102 ML/day) from commercial buildings by
the residents in HCMC. Similar to the use of water by nonresidents, if proper water saving
measures is implemented in commercial buildings 20% of water could be saved. The expected
water use by year 2020 from commercial use by residents in HCMC is 102 ML/day (Table 5-
4). If 20% of water is being saved, 20.4 ML/day (102 x 20%) of water could be saved by year
2020.
The total water demand in Commercial areas per day in year 2020 = 102 ML/day
The total water saving = 102 * 20% = 20.4 ML/day
Total water saving in Commercial areas: 341.3 x 20% = 68.2%
Chapter 6: Demand Management Options of Water in HCMC
118
6.3. WATER SAVING MEASURES IN INDUSTRIAL ZONES
The potential for recycling and reuse in the food industry has been shown in several studies.
For example, a study carried out in the Netherlands concluded that a definitive potential for
recycling and water cycle closure exists in the food industry, and depending on the food
sector, it seemed possible to reduce the use of water by 20–50% (Casani et al., 2005).
Seafood processing is a key industrial sector in HCMC. In year 2000, more than fifty
enterprises were involved in the export of processed fish and other seafood. Seafood
processing industry is characterized by its use of large quantities of water. Most of the water
is used for washing and cleaning the raw materials and products, and for flushing the work
floor and the tables. Significant savings in the water consumption can be obtained in all these
areas by adopting cleaner production techniques. Most seafood processing factories supply
water through an un-pressurized hose for cleaning. The use of un-pressurized hose requires:
• Large amounts of washing water;
• Large quantities of detergents;
• Increased time for washing;
• Bigger wastewater treatment plant and
• More manual labour (brushing and sweeping).
Supplying water at high pressure (greater than 10 bars) will reduce its consumption for
cleaning and related costs.
According to CEFINEA (2002) normal cleaning (using un-pressurized hose and basin
flushing) of each table which used for fish processing and 4-5 m2 of floor in a factory
consume about 2-3 m3/h of fresh water. Use of high pressure washing for the same factory
used only 0.25 m3/h. The water used for cleaning was thus reduced by about 80%, and the
total water consumption reduced by about 6% (CEFINEA, 2002).
Uttamangkabovorn et al., (2005) studied water consumption in canned tuna (pet food) plant in
Thailand and found that the net water consumption was reduced by 32% of overall water
consumption. The water conservation measures were attempted at three processing steps. This
included the installation of pressure spraying nozzles for cooling; the use of hot water at 600C
instead of cold water and to open the valve only 45 degrees for can washing after seaming;
educating the plant personnel on water conservation for equipment and floor washing. By
installing pressure spraying nozzles water consumption was reduced by 66% of the original.
Use of hot water, reduced the water consumption by 45% and opening the valve 45 degrees
Chapter 6: Demand Management Options of Water in HCMC
119
only reduced water consumption by 14%. From this example, a great amount of water can be
saved in industries if several methods are applied concurrently.
An extended and combined systematic approach for water minimisation in process industries
was studied by Zver and Glavic (Zver et al., 2005). The systematic approach was developed
and tested with the water minimisation project in a sugar plant. The implementation of water
minimisation options could lower the fresh water consumption by 54.23 m3/hr which reduced
the total volume of water used by 69%.
Puplampu and Siebel (Puplampu et al., 2004) reported a case study on the effects of personnel
practices in water use in a brewery. A training program on water minimisation was conducted
to employees of a brewery. Personnel input and options identified during the training sessions
were then applied to the operations of the brewery over a 12-week period. It was able to save
55,340 m3 of water per annual from the brewery. This is equivalent to 18% of the total use.
The key factors contributing to the success of the water use minimisation programme include
employee awareness of the importance of water conservation and a commitment of employees
to saving water.
The water consumption by the industry sector is 27% of the total water use in HCMC (Figure
5-3). With proper management, water usage by the industry could be reduced considerably.
In Melbourne industrial water consumption was reduced by 12% from 1999/2000 to
2002/2003. Industrial water consumption has fallen by 12% (Melbourne Water, 2004). Based
on above figures it is assumed that at least 15% of water could be saved if proper management
practices are adopted in HCMC.
The total water demand in industrial sectors per day in year 2020 (Table 5.7)
= 888 ML/day
The total water saving = 888 x 15% = 130 ML/day.
6.4. RAIN WATER HARVESTING IN HO CHI MINH CITY
6.4.1. Rain Water Harvesting
Rainwater harvesting is the method of freshwater collection which intercepts rainfall before it
can encounter hazards associated with subterranean travels to a spring or well. Although
rainwater harvesting has been practiced for as long as the history of settlement of the city
which dated back several centuries ago, people increasingly overlook the values of rainwater
harvesting by focusing on using surface water and groundwater.
HCMC has high rainfall levels, however, HCMC has often suffered from floods resulting
from heavy rainfall, but, paradoxically, adequate water supply remains a problem. These
Chapter 6: Demand Management Options of Water in HCMC
120
related problems stem from current water management policies and technologies. Rainwater
is directed to the sewage system and released into rivers. Following episodes of excessive
rainfall, the flow exceeds the capacity of the drainage system, resulting in floods in the city. In
addition, due to urbanization, the large areas of impermeable pavement disrupt groundwater
recharge and direct more water to the sewerage system.
To address this contradiction, possible solution is creating a rainwater utilisation system, in
which "mini dams" are built within the city to store rainwater or rainwater could be harvested
in each household. In this scheme, rainwater that falls on roofs is collected and stored. The
stored water can then be used for multiple uses including flushing toilets, irrigation water, and
fire-fighting. A related initiative involves replacing impermeable pavements with semi-
permeable surfacing to allow groundwater recharge. By altering rainwater management,
HCMC will alleviate water shortages and flooding, and will help restore the natural water
cycle thus contributing to more sustainable urban water services.
6.4.2. Is There a Need for Rain Water Harvesting (RWH)
Is there a need for urban RWH? There is no argument that RWH can augment water supply
even in urban areas. It has been reported that rainwater usage can promote significant potable
water savings in residences in different countries. In Germany, a study performed by
Herrmann and Schmida (2000) showed that the potential for potable water savings in a house
might vary from 30% to 60%, depending on demand and roof area. In Australia, analysed 27
houses in Newcastle and concluded that rainwater usage would promote potable water savings
of 60% (Coombes et al., 1999). In the UK, Fewkes (Fewkes, 1999) monitored the
performance of a rainwater collector installed in a house in Nottingham and concluded that an
average water saving efficiency of about 57% would be obtained. Other studies on rainwater
have also been performed in Singapore (Appan, 2000), Zambia (Handia et al., 2003), and
China (Li et al., 2003) to quote just a few. It was also found that easy access and availability
of RWH led to better hygiene within these households.
It is the fact that RWH has been practiced by societies for millennia and the arrival of piped
water supply system has been instrumental in the decline of RWH. However, the consequent
failure to provide piped water for all has led to renewed interest in RWH albeit government
and NGO driven as opposed to before when it was a common practice. RWH is surprisingly;
relatively new to HCMC despite the fact that water is in short supply. There is apparently the
need for rainwater harvesting policies. Even where policy is in place, social, cultural and
economic factors need to be taken into account if RWH is to take hold. In HCMC, RWH is
seen as a predominantly rural activity with no place in urban settings. And even in rural areas,
Chapter 6: Demand Management Options of Water in HCMC
121
it is practiced mainly in the areas where people do not have access to water supply and
groundwater is salty. Question needs to be considered is the incentive to people in urban areas
to engage in RWH as it is principally a rural activity and predicted that it would remain
largely a rural activity.
6.4.3. Economic of RWH
There are two groups of people with different social backgrounds in HCMC where the
economic factors impinged on them in term of RWH. They are the poor urban and the middle
class people. These two groups are faced with different economic considerations when
assessing for RWH practice.
The issue of the cost of piped water in poorer, high density urban areas were raised as one
which should in theory encourage the practice of RWH amongst this group. In HCMC, the
poor are paying 7-8 times the piped water tariff (WASE, 2001), a situation which obtains in
most poor urban communities in the developing world. However, the urban poor in HCMC
are not practicing RWH because they do not have the financial resources to purchase
equipment for RWH. They may not be able to afford to purchase water jars for example, and
even where they can, they often do not have adequate space for storage as most live in
relatively confined accommodation. It was suggested that containers from industry could be
bought cheaply by the poor and re-used for RWH. Whereas this is a potential solution, care
would need to be taken to ensure that containers are sourced from industries where the risk of
contamination would be negligible. Any RWH in poor urban communities is therefore going
to be on a very limited scale. There is also the concern of the return on investment. Rainfall is
low in HCMC from December to April. This will discourage the poor from investing in RWH
as the water collected will be very small.
There are some benefits of RWH described as follows:
• RWH would provide more water for domestic purposes with the surplus being used to
improve household hygiene and sanitation.
• RWH would cause some minimal reduction of runoff (which is responsible for
carrying pathogens on open grounds, compost pits, waste dumping sites and pit
latrines into shallow wells) which should lead to a reduction in flooding and water
stagnation thereby reducing the incidence of water related diseases prevalent in the
rainy season.
Chapter 6: Demand Management Options of Water in HCMC
122
Besides, there are benefits in the use of RWH in more affluent parts of urban areas. In terms
of supply factors, it was claimed that there are economic gains to be made by water suppliers
where RWH is taken up on a large scale. These include:
• Deferred construction of water supply dams;
• Reduced demand on treated water and associated energy costs;
• Less storm water run off in the city; and
• Improving the quality of local waterways.
• It can be adopted modularly (with pipe-borne water coming later);
• Partial use of RWH for flushing and cleaning mitigates infrastructural investment; and
that there are environmental as well as drainage benefits.
On the demand side, it should be noted that in urban areas, the facilities for RWH are often
already in place in the form of drainage gutters and down pipes especially in the more affluent
urban suburbs. Therefore at household level, any additional investment in order to harvest
roof water would be minimal. What required is greater awareness and policies to encourage
the adoption of RWH. For instance promoting RWH by educating households about some of
the uses to which rainwater could be put such as toilet flushing, and outdoor use; for example,
in the garden.
6.4.4. Social Issues of RWH
A number of cultural reasons as either encouraging or discouraging RWH are necessitated to
put forward into consideration when introducing RWH. One of these is taste. It is a common
belief that residents of the Mekong Delta in Vietnam for example who use rainwater for
drinking even if they have piped water supply. This is because they find rainwater “sweeter”
than piped water. On the other hand, in other countries, drinking roof water in urban areas
would only happen if there was a complete breakdown of the piped water system. The
attractiveness of private RWH investment by poorer households would be much improved by
their belief the RW was potable. Given the foregoing, it is clear that any promotion of RWH
should take into account cultural factors and present advantages in such a way that they far
out weigh and/or counter cultural beliefs.
6.4.5. Technical Factors
The technology for rainwater harvesting is relatively simple and inexpensive and is, therefore,
highly transferable. These technologies are especially appropriate for municipalities located in
regions which have alternating rainy and dry seasons, and which suffer from flooding, water
shortages, land subsidence, and/or restricted local water supplies.

Chapter 6: Demand Management Options of Water in HCMC
123
There are a number of technical factors which influence RWH. The urban RWH will only
succeed if it is supplied as a complement to mainstream water supply systems and not as an
alternative. For example, supply to areas where there is no water network coverage or
groundwater is salty or depleted groundwater conditions. For these areas the only one
alternative is to buy water from trucks with a relatively high price. As a result, people would
see RWH as a valuable source of water supply.
6.4.6. Health Risks
One of the main hindrances to RWH is the lack of belief in its potable. It is believed that there
are risks to health posed by the uptake of RWH. In addition, the risk of microbial and
chemical contamination arising from the roof itself during collection is obvious. As long as
roofs are protected from animals, the risk of human pathogens in roof catchments water is low
because sources of human diseases (faeces from human or large animals) are not likely to
contaminate roofs. However, the transport and storage systems would also need to be
protected in order to ensure lack of contamination. Residents will need some form of
protection against contaminated water. Based on experience, simple filtering of drinking
water using cloth from old clothes would diminish the incidence of cholera. The health risks
posed by RWH are normally far less than that posed by polluted sources such as wells, rivers
and canals which are often the only alternative sources for the urban poor.
HCMC is in the tropics, and very close to the sea, so its climate is steadily warm to hot all
year round. Temperatures are slightly cooler between December and March, which is also the
dry season. Rainy season begins in May and become heavy from June to August, but the
storms are sudden and short, with the sun reappearing fairly quickly. Even though, the annual
rainfall averages 1919 mm (http://www.teflcourse.net/hochiminh-location.htm), rainwater
harvesting has not been recognized as an option for improving access to clean water, and thus
health and sanitation. Its value is not reflected in development policies. HCMC government
has not invested resources on rainwater harvesting. Nonetheless, people living in Can Gio
area collect rainwater in their homes as there is no pipe water and groundwater is salty. Thus
it is important to evaluate the potential saving of potable water by harvesting rainwater in the
residential area in HCMC.
6.4.7. Volume of Rainwater Collected
Monthly rainfall data was obtained from the GSO and are given in Table 6-5
(http://www.gso.com.vn ). On average 95% of the dwellings located in HCMC are houses and
5% are flats located in multi-storey residential buildings where the specific roof area per
person is low. As there is no standard size for roof area, an area of 54.10 m2 was assumed for
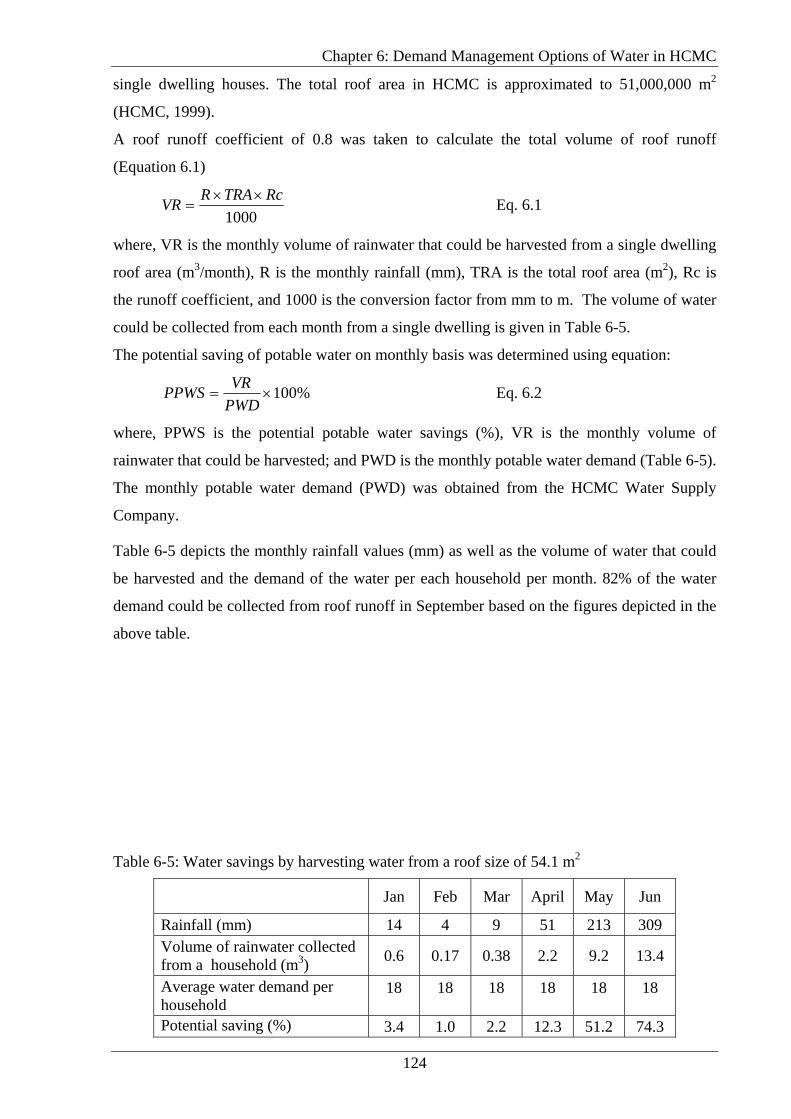
Chapter 6: Demand Management Options of Water in HCMC
124
single dwelling houses. The total roof area in HCMC is approximated to 51,000,000 m2
(HCMC, 1999).
A roof runoff coefficient of 0.8 was taken to calculate the total volume of roof runoff
(Equation 6.1)
1000RcTRARVR ××
= Eq. 6.1
where, VR is the monthly volume of rainwater that could be harvested from a single dwelling
roof area (m3/month), R is the monthly rainfall (mm), TRA is the total roof area (m2), Rc is
the runoff coefficient, and 1000 is the conversion factor from mm to m. The volume of water
could be collected from each month from a single dwelling is given in Table 6-5.
The potential saving of potable water on monthly basis was determined using equation:
%100×=PWDVRPPWS Eq. 6.2
where, PPWS is the potential potable water savings (%), VR is the monthly volume of
rainwater that could be harvested; and PWD is the monthly potable water demand (Table 6-5).
The monthly potable water demand (PWD) was obtained from the HCMC Water Supply
Company.
Table 6-5 depicts the monthly rainfall values (mm) as well as the volume of water that could
be harvested and the demand of the water per each household per month. 82% of the water
demand could be collected from roof runoff in September based on the figures depicted in the
above table.
Table 6-5: Water savings by harvesting water from a roof size of 54.1 m2
Jan Feb Mar April May Jun
Rainfall (mm) 14 4 9 51 213 309 Volume of rainwater collected from a household (m3) 0.6 0.17 0.38 2.2 9.2 13.4
Average water demand per household
18 18 18 18 18 18
Potential saving (%) 3.4 1.0 2.2 12.3 51.2 74.3
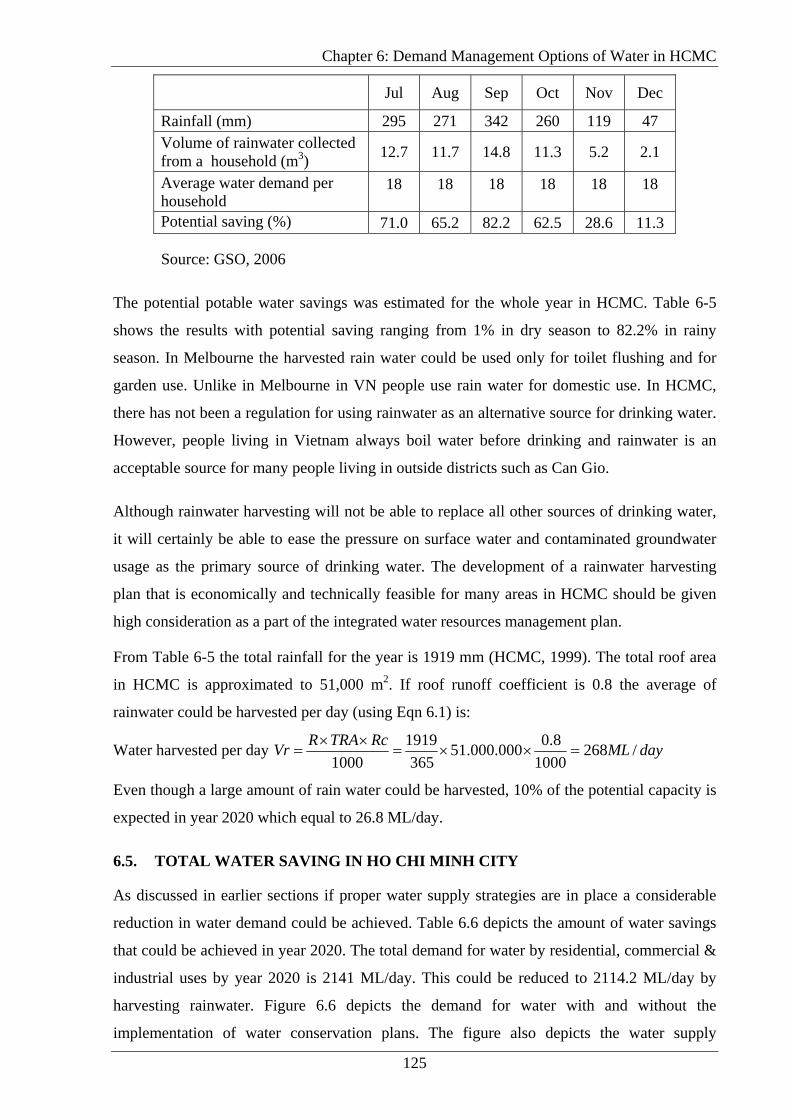
Chapter 6: Demand Management Options of Water in HCMC
125
Jul Aug Sep Oct Nov Dec
Rainfall (mm) 295 271 342 260 119 47 Volume of rainwater collected from a household (m3) 12.7 11.7 14.8 11.3 5.2 2.1
Average water demand per household
18 18 18 18 18 18
Potential saving (%) 71.0 65.2 82.2 62.5 28.6 11.3
Source: GSO, 2006
The potential potable water savings was estimated for the whole year in HCMC. Table 6-5
shows the results with potential saving ranging from 1% in dry season to 82.2% in rainy
season. In Melbourne the harvested rain water could be used only for toilet flushing and for
garden use. Unlike in Melbourne in VN people use rain water for domestic use. In HCMC,
there has not been a regulation for using rainwater as an alternative source for drinking water.
However, people living in Vietnam always boil water before drinking and rainwater is an
acceptable source for many people living in outside districts such as Can Gio.
Although rainwater harvesting will not be able to replace all other sources of drinking water,
it will certainly be able to ease the pressure on surface water and contaminated groundwater
usage as the primary source of drinking water. The development of a rainwater harvesting
plan that is economically and technically feasible for many areas in HCMC should be given
high consideration as a part of the integrated water resources management plan.
From Table 6-5 the total rainfall for the year is 1919 mm (HCMC, 1999). The total roof area
in HCMC is approximated to 51,000 m2. If roof runoff coefficient is 0.8 the average of
rainwater could be harvested per day (using Eqn 6.1) is:
Water harvested per day 1919 0.851.000.000 268 /1000 365 1000
R TRA RcVr ML day× ×= = × × =
Even though a large amount of rain water could be harvested, 10% of the potential capacity is
expected in year 2020 which equal to 26.8 ML/day.
6.5. TOTAL WATER SAVING IN HO CHI MINH CITY
As discussed in earlier sections if proper water supply strategies are in place a considerable
reduction in water demand could be achieved. Table 6.6 depicts the amount of water savings
that could be achieved in year 2020. The total demand for water by residential, commercial &
industrial uses by year 2020 is 2141 ML/day. This could be reduced to 2114.2 ML/day by
harvesting rainwater. Figure 6.6 depicts the demand for water with and without the
implementation of water conservation plans. The figure also depicts the water supply
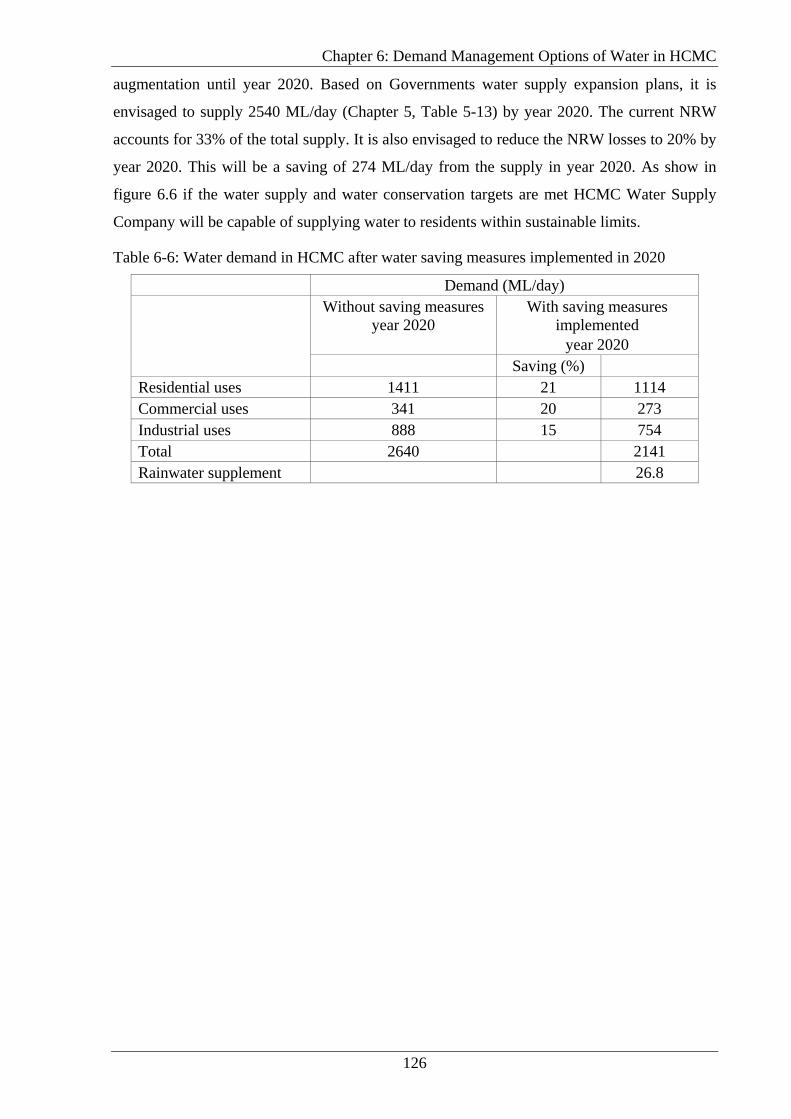
Chapter 6: Demand Management Options of Water in HCMC
126
augmentation until year 2020. Based on Governments water supply expansion plans, it is
envisaged to supply 2540 ML/day (Chapter 5, Table 5-13) by year 2020. The current NRW
accounts for 33% of the total supply. It is also envisaged to reduce the NRW losses to 20% by
year 2020. This will be a saving of 274 ML/day from the supply in year 2020. As show in
figure 6.6 if the water supply and water conservation targets are met HCMC Water Supply
Company will be capable of supplying water to residents within sustainable limits.
Table 6-6: Water demand in HCMC after water saving measures implemented in 2020
Demand (ML/day) Without saving measures
year 2020 With saving measures
implemented year 2020
Saving (%) Residential uses 1411 21 1114 Commercial uses 341 20 273 Industrial uses 888 15 754 Total 2640 2141 Rainwater supplement 26.8

Chapter 6: Demand Management Options of Water in HCMC
127
0.5
1
1.5
2
2.5
3
3.5
2003 2004 2005 2006 2007 2008 2009 2010 2011 2012 2013 2014 2015 2016 2017 2018 2019 2020 2021
Source: Environmental Management Strategy for HCMC City
Water Demand
Water Supply
Water Supply - NRW
Dem
and
(x10
^3M
L/da
y)
Water Demand with Water Saving Measures
Figure 6-5: Water supply and demand in HCMC with water saving
Chapter 6: Demand Management Options of Water in HCMC
128
6.6. CONCLUSIONS
Some of the water saving measures implemented in the Melbourne’s ‘Our Water Our Future’
White Paper was applied to HCMC to investigate the capacity of conservation initiatives to
reduce demand on the water supply system. The effect of community education on water
conservation, the Victorian Government’s regulatory approaches, pricing of water and the
tariff structure were investigated.
Community education programs and government incentives for purchasing and operation of
water saving appliances are seen as the initiatives that would most succeed. The Ho Chi Ming
City Water Supply Company has adopted a step tariff structure to recover costs for use of
water from the mains. This arrangement favours the high-income people living in the inner
city and disadvantages the low-income people living in outer cities. As a result, it is suggested
to implement a tariff structure with price progression and different prices applied for different
user groups (i.e. different charges for industry and domestic) based on levels of service.
It is also suggested to introduce water saving fixtures in houses, commercial buildings and
industries to reduce water demand substantially by year 2020. By Government regulating for
compulsory fitting of AAA rated shower-heads, front loading or other water efficient washing
machines and dual flush toilets, it is anticipated to save 9%, 4% and 9% respectively of the
total residential water use by year 2020. Based on the literature it is also assumed 20% of the
water use could be saved from commercial buildings such as hotels, schools, hospitals and
office buildings. Industrial water use also could be reduced by 15% if proper water recycling
and conservation methods are introduced.
Based on the trend in current population increase and continued water use practices (with no
demand management), the water demand in HCMC in year 2020 was estimated to be 2640
ML/day. However, if proper water conservation strategies are implemented, the water demand
could be reduced to 2114.2 ML/day, a 20% reduction. Based on the Government’s water
supply expansion plans, a supply of 2540 ML/day is planned for year 2020. However,
currently a 33% is NRW. As planned by the WSC if this is reduced to 20% the supply to
consumers could be 2540 ML/day.
There is still a small shortfall between supply and demand. Given uncertainty in forecasting
population and industrial demand, this shortfall is considered acceptable. An adoptive
management strategy is proposed where the growth in demand will be closely monitored and
extra initiatives taken to mange growth if it deviates from the planned growth trajectory.
Chapter 6: Demand Management Options of Water in HCMC
129
If the water supply and water conservation targets are met, the HCMC Water Supply
Company will be able to provide a sustainable water future for the customers of HCMC.
Chapter 7: Conclusions
130
7. CONCLUSIONS AND RECOMMENDATIONS
7.1. CONCLUSIONS
Rapid urban and industrial growth in HCMC is characterised by rapidly increasing economic
investment, productivity, employment and income. This is causing a rapid increase in
population in the city, as people relocate to the city from rural areas to take advantage of the
employment and income prospects on offer. However, there is a danger that the current rapid
rate of economic growth and associated rapid population increase will create new social risks.
Supply of potable water has always been a critical issue for HCMC with large areas remaining
unconnected to the HCMC water supply grid. These citizens rely on water carters for their
supply. Additional pressures have made the reliable situation very serious indeed.
7.1.1. Water Resources - Current
• Currently only 51.5% of the population have access to water through the central water
utility. Another 45% of the population is serviced by local water service providers via
water haulage and similar services. Clean water supply to the outlying districts is very
limited so that approximately 3.5% of the population has no regular, reliable access to
water.
• Illegal groundwater extraction occurs in areas where water from the supply network is
inadequate or unavailable or where pressure is low. Currently the groundwater abstraction
rate in the greater HCMC is above the sustainable rate. It is projected that this will lead to
a total loss of the groundwater resource of HCMC unless proper regulatory measures are
applied urgently.
• Non-revenue water is a significant problem as there is a 33% discrepancy between what
the HCMC Water Supply Company (WSC) supplies and what is allocated to customers.
7.1.2. Water Resources - Future
• Increase in demand in HCMC is occurring because of a combination of population
growth, economic growth and industrialisation of the city. The demand for water is
expected to reach 3300 ML/day by 2020.
• Spatial expansion of the metropolis has occurred so rapidly, that the water supply
company has not been able to expand the system to cope with the development of new
areas.
Chapter 7: Conclusions
131
• As these urban residents in new developed areas get little or no access to the piped water
supply, untreated water from shallow wells, rainwater collection, streams, canals or ponds
must be relied on as sources of supply . These sources are potentially subject to serious
pollution and therefore present a major health risk to the urban populations.
• If demand remains unmet, then illegal groundwater extraction is likely to increase further.
7.1.3. Water Tariff
• Based on year 2002 data, the urban population in Vietnam has a monthly income of about
$US 85, meanwhile the average water tariff is $US 0.13/m3. Domestic water therefore
accounts for only 0.65% the average income per capita so water charges are quite
affordable in HCMC. There is room to move to a user pays model for service provision
and increase tariffs to offset, some of the costs incurred in upgrading and maintaining
infrastructure.
7.1.4. Water Stakeholders in HCMC
• A large number of organisations play important roles in determining the way HCMC’s
water supply system is managed. However, the roles these organisations play and the
activities they undertake are not well reported in the literature. Significant stakeholders
include the HCMC Water Supply Company, ADB, World Bank, UNDP, various
government departments at City and National level, water users (domestic and industrial),
aid agencies of foreign governments and NGOs. These creates a complex situation, in
which it is difficult to delineate responsibilities and where decision making may be
cumbersome or piecemeal as the interests of stakeholders are often in conflicts.
7.1.5. Private Water Providers
• HCMC’s rate of supply of water by private water providers is high compared to a number
of other major cities in the region with similar economic status.
• Currently the number of projects with private involvement is in decline and investment
flows have been slowing due to the complex stakeholder situation, the lack of political
support for private sector participation, a need for long-term debt financing, low returns
on investment, fragmented deal size, poor contract structuring and demand for capital
from other more progressive countries such as China.
7.1.6. Case Studies from Melbourne and Manila for Sustainable Water Future
• The Water Resources Strategy developed for Melbourne relied principally on community
education, financial incentives to adopt water efficient appliances, tariff reform,

Chapter 7: Conclusions
132
promoting the use of alternative resources such as recycled water and minor traditional
augmentations such as extracting more water from streams where there is surplus to
environmental requirements.
• The Essential Services Commission plays an important balancing role in protecting the
interest of the consumers, as well as the Victorian environment. Their charter ensured that
they protected consumer interest by ensuring that the water authorities delivered the levels
of services promised to consumers and at the same time ensured that the water companies
were adequately financed to provide the services in an economically efficient manner. The
availability of high quality information and the consumers’ willingness to pay for services
(without political interference) assisted good governance.
• The Manila model has had limited success in delivering the Government’s expectations
due to privatisation. Some of the reasons being the extra ordinary high prices paid for
securing the contract to supply Manila made making profits for the shareholder a tough
task. Underestimating the cost required delivering remedial measures to reduce non
revenue water and the changes to the presidency in the Philippines and their differing
political visions have made the operating environment volatile for the private companies.
The philosophies of the current President are significantly different to President Ramos
who introduced privatisation. The private companies have thus not been able to secure the
high prices required to generate profits.
7.1.7. Demand in HCMC
• Currently only 67% of HCMC’s population is supplied with pipe water. It is planned to
increase the average number of consumers connected to 80.6% for the whole city by year
2020. It is estimated that the population in HCMC will increase to 10.23 million by year
2020.
• The breakdown of the demand for water by different user groups and the total demand is
depicted in Table 5-9. The percentage use of water by each user group is given in Figure
5.3.
• The current demand for water is 1165.6 ML/day and expected to increase to 2640.3
ML/day by year 2020.
• The current NRW account for 33% of the supply and it is planned to reduce to 20%.
• Government has water supply augmentation plans to upgrade water treatment plants by
year 2020.
Chapter 7: Conclusions
133
• The anticipated total supply capacity by year 2020 is 2990 ML/day. However, the demand
for water is 3300 ML/day which is 310ML/day higher than the supply.
7.1.8. Water Conservation Measures
• Community education programs, incentive programs to introduce water saving fixtures
such as dual flush toilets or water efficient shower-heads and water tariff structure needs
to be introduced for a successful water conservation management.
• By Government regulating for compulsory fitting of AAA rated shower heads, front
loading or other water efficient washing machines and dual flush toilets, it is anticipated to
save 9%, 4% and 9% respectively of the total residential water use by year 2020. Based on
the literature it is also assumed 20% of the water use could be saved from commercial
buildings such as hotels, schools, hospitals and office buildings. Industrial water use also
could be reduced by 20% if proper water recycling and conservation methods are
introduced.
• Based on the trend in current population increase and continued water use practices (with
no demand management), the water demand in HCMC in year 2020 was estimated to be
3300 ML/day. However, if proper water conservation strategies are implemented, the
water demand could be reduced to 2620 ML/day, a 20% reduction. Based on the
Government’s water supply expansion plans, a supply of 2990 ML/day is planned for year
2020.
• There is still a small shortfall between supply and demand. Given uncertainty in
forecasting population and industrial demand, this shortfall is considered acceptable. An
adoptive management strategy is proposed where the growth in demand will be closely
monitored and extra initiatives taken to mange growth if it deviates from the planned
growth trajectory.
• If the water supply and water conservation targets are met, the HCMC Water Supply
Company will be able to provide a sustainable water future for the customers of HCMC to
year 2020 at an affordable cost.
7.2. RECOMMENDATIONS
• The Vietnamese Government is responsible for the whole water supply industry.
Therefore every new institutional, financial or legislative change must begin at the central
Government level. The main objective of the Government should therefore be to
strengthen the institutional capacity of it ministries an environmental agencies. Effective
water resources management strategies require issues of national vision and policy,
Chapter 7: Conclusions
134
implementation, institutions, and organizations to be addressed alongside the physically
oriented management measures. Clearly, there is a need to streamline the institutional
framework for water supply, improving the complex and fragmented stakeholder situation
currently in place.
• Integrated water management with a holistic approach considering every element of the
hydrologic cycle is needed. Continuous investment in the supply sector as well as proper
management, control and monitoring of already existing facilities is vital.
• Urban water policy solutions should seek to alleviate disparities under increasing tariffs
that continue to favour the water-connected wealthy whilst disadvantaging the majority of
the urban poor. There is a need to counteract regressive pricing policies that arise through
different levels of access to the water supply system. This favours those with piped access,
and limits water access to those without supply. Priorities should be placed on those who
desperately need water, particularly households who spend large amount of their income
on water alone in low income districts.
• Due to the fact that Vietnam is a developing country, the country lacks material resources
to implement a sustainable development agenda. Foreign and domestic investments
concentrate on direct profit rather than resources regeneration and environmental
protection or water supply longevity. Care must be paid on investment projects not just on
profit but also of environmental protection especially on water resources. Protection of
water resources should be strictly implemented in developing new projects. There is a
need of a strong institutional structure to promote sustainable development. The
incompetent authorities, ineffective coordination between national and local agencies and
lack of mechanisms for monitoring and management and holding people accountable need
immediate attention.
• Community education programs and government incentives for purchasing and operation
of water saving appliances should be encouraged.
• The Ho Chi Minh City Water Supply Company has adopted a step tariff structure to
recover costs for use of water from the mains. This arrangement favours the high-income
people living in the inner city and disadvantages the low-income people living in outer
cities. As a result, it is recommended to implement a tariff structure with price progression
and different prices for different user groups (i.e. different charges for industry and
domestic) based on levels of service.
Chapter 7: Conclusions
135
• It is also recommended to introduce water saving fixtures in houses, commercial buildings
and industries to reduce water demand substantially by year 2020. It is important for the
Government to regulate compulsory fitting of AAA rated shower heads, front loading or
other water efficient washing machines and dual flush toilets for residential water use.
• It is also important for the Government encourage the use of water efficient fixtures in
commercial buildings such as hotels, schools, hospitals and office buildings. Further
more, industries also should look at water reuse options to reduce water consumption.
• Minor supply augmentation plans are also to be encouraged.
• An adoptive management strategy is proposed where the growth in demand will be closely
monitored and extra initiatives taken to influence growth if it deviates from the planned
growth trajectory.
Based on these experiences in water supply management in HCMC, it is important that a
blended (or a hybrid) approach be adopted for the HCMC where water conservation plays a
pivotal part in securing a sustainable water future. This is to be complemented by independent
regulation and where suitable, local water authorities contracting out works to the private
sector where they can provide superior service. However, once the operating rules and
governance arrangements have been established, there should be minimum political
interference so that the model could operate efficiently and deliver expected performance (and
service) goals at an affordable cost to community.
Bibliography
136
BIBLIOGRAPHY Appan, A., "A Dual-mode System for Harnessing Roofwater for non-potable Uses," Urban
Water, Vol. 1, pp. 317-321, 2000.
Berg, M., Tran, H. C., Nguyen, T. C., Pham, H. V., Chertenleib, R., and Giger, W. a.,
"Arsenic Contamination of Groundwater and Drinking Water in Vietnam: A Human Health
Threat," Environmental Science & Technology, Vol. 35, pp. 2621-2626, 2001.
Bolay, J.-C., Cartoux, S., Cunha, A., Thai, T. N. D., and Bassand, M., "Sustainable
development and urban growth: Precarious habitat and water management in Ho Chi Minh
City, Vietnam," Habitat International, Vol. 21, pp. 185-187, 1997.
Borkey, P., "Water Partnerships Striking a Balance," Organisation for Economic Cooperation
and Development. The OECD Observer, Vol. 236, pp. 13, 2003.
Casani, S., Rouhany, M., and Knøchel, S., "A Discussion Paper on Challenges and
Limitations to Water Reuse and Hygiene in the Food Industry," Water Research, Vol. 39, pp.
1134-1146, 2005.
CEFINEA, "Pressurized Water Use Reduces Cleaning Water Consumption in the Seafood
Processing Industry," Ho Chi Minh City 2002.
Chanan, V. V., White, B. S., and Berry, T. T., "Sustainable Water Management in
Commercial Buildings," OzWater, Perth Australia, 2003.
City of Melbourne 2004, Triple Bottom Line Toolkit, Online resource kit at
www.melbourne.vic.gov.au
Conan, H. and Paniagua, M., "The Role of Small Scale Private Water Providers in Serving the
Poor," ADB, 2002.
Coombes, P. J., Argue, J. R., and Kuczera, G., "Figtree Place: A Case Study in Water
Sensitive Urban Development," Urban Water, Vol. 1, pp. 335-343, 1999.
Darmody, J., Maddeus, W., and Beatty, R., "Water Use Surveys Improve the Effectiveness of
Demand Management," 11th IWSA-ASPAC Regional Conference, Sydney Australia, 1998.
Do, N. T. and Kumar, S., "Resource Use and Waste Management in Vietnam Hotel Industry,"
Journal of Cleaner Production, Vol. 13, pp. 19-116, 2005.
Do, T. Q., Snow, R., and Doukas, L., "Water-loss Reduction Program in Vietnam," Sanitation
and Water for all, 1998.

Bibliography
137
Dry, E. K. and Vecchi, S. E., "Bringing a BOT project to closure in Vietnam: Problems and
prospects," Journal of Project Finance, Vol. 6, pp. 71, 2000.
Dumol, M., "The Manila Water Concession: A Key Government Official's Diary of the
World's Largest Water Privatization," Worldbank, Washington DC 2001.
Duong, L., "The State pulls the plug on foreign role in water plant," The Vietnam Investment
Review, 2003.
Microsoft Encarta Computer Programme, 2004.
Endreny, A. T., "Sustainability for New York’s Drinking Water: Source expansion, user
conservation, and climate prediction," Cleanwaters, Vol. 31, pp. 36-40, 2001.
Esguerra, J., "The Corporate Muddle of Manila's Water Concessions," WaterAid and
Tearfund, 2003.
Fewkes, A., "The use of rainwater for WC flushing: the field testing of a collection system,"
Building and Environment, Vol. 34, pp. 765-772, 1999.
Fjeldsenden, M. I., Wijayanti, A., Ermawati, D. W. and Kimura, H., ""An Inquiry of the
Water Supply Situation in the Philippines", Graduate School of International Development,
Nagoya University," 2005.
Gillis, C., "Cabinet New About Health Risks," in National Post, Vol. 4, p.5, 2001.
GSO, "General Statistical Office," Vietnam, 2005.
Hall, D., "Privatization, Multinationals and Corruption," Public Services International, 1999.
Handia, L., Tembo, M. J., and Mwiindwa, C., "Potential of rainwater harvesting in urban
Zambia," Physics and Chemistry of the Earth, Vol. 28, pp. 893-896, 2003.
HCMC, "Population Investigation http://pso.hcmc.gov.vn," 1999.
HCMCWSC, "Personal Communications with Water Supply Company Personnel," 2004.
Herrmann, T. and Schmida, U., "Rainwater Utilisation in Germany: Efficiency,
Dimensioning, Hydraulic and Environmental Aspects," Urban Water, Vol. 1, pp. 307-316,
2000.
ICI Program, Hospital Cost Reduction Case Study: Norwood Hospital
http://www.mwra.com/04water/html/bullet1.htm accessed 15 July 2005
Institution of Engineers, "Water and the Australian Economy," 1999.
Bibliography
138
Li, X.-Y. and Gong, J.-D., "Compacted microcatchments with local earth materials for
rainwater harvesting in the semiarid region of China," Journal of Hydrology, Vol. 257, pp.
134-144, 2003.
Liemberger, R. and Fanner, P., "Outsourcing of Water Loss Reduction Activities – the
Malaysia Experience," AWWA ACE, New Orleans, 2002.
Lobina, E., "UK Water Privatization: a Briefing," Public Services International, 2001.
Loh, M. and Coghlan, P., "Domestic Water Use Study: In Perth, Western Australia 1998-
2001," Water Corporation of Western Australia, Perth 2003.
Mainardi, S., "Water availability and infrastructure development: cross-country econometric
and neural network estimates," Desalination, pp. 241-254, 2003.
Mayer, W. P., DeOreo, B. W., Towler, E., and Lewis, M. D., "Residential Indoor Water
Conservation Study," The U.S. Environmental Protection Agency, 2003.
Melbourne Water, "Annual Report 2003/2004," Melbourne 2005.
Melbourne Water, "Discussion Starter: Stage 1 in developing a Water Resources Strategy for
the Greater Melbourne area," Melbourne 2001.
Melbourne Water, "Recycling Water for a Greener Future," Melbourne 2006.
Melbourne Water, "Strategy Direction Reports: 21st Century Melbourne, a Water Smart
City," Melbourne 2003.
Melbourne Water, "Total Watermark," Melbourne 2004.
Montemayor, C. A., "The Manila Water Privatization Fiasco and the Role of Suez
Lyonnaise/Ondeo," The Philippine Water Vigilance Network, 2003.
Montgomery, W. H., "Mid-Term Review of Sydney Water's Demand Management Strategy,
Independent Pricing and Regulatory Tribunal," 2002.
Moriarty, P. B., G. Patricot, T. Bastemeijer, J. Smet, C. van der Voorden, "Between Rural and
Urban: Towards Sustainable Management of Water Supply Systems In Small Towns," In
Africa, IRC International Water and Sanitation Center Working Paper, January, 2002.
Nacpil, L., "Overview of Privatization in Philippines," National Conference on Fresh Water,
Quezon City, Philippines, 2004.
National Governmental Office, "Master of Planning and Development of HCMC Water
Supply Network," 2001.
Bibliography
139
Nguyen, D. H. and Truong, T. P., "Water resources and environment in and around Ho Chi
Minh City, Vietnam," Electronic Green Journal, 2003.
Pham, V. N., Boyera, D., Mouëla, J.-L. L., and Nguyen, T. K. T., "Hydrogeological
investigation in the Mekong Delta around Ho Chi Minh City by electric tomography,"
Geoscience, pp. 733-740, 2002.
Puplampu, E. and Siebel, M., "Minimisation of water use in a Ghanaian brewery: effects of
personnel practices," Journal of Cleaner Production, pp. 35-38, 2004.
Rivera, C. V., "The Experience of Manila Water Company under the MWSS Privatization,"
Regional Conference on Universality of Infrastructure Services: Financing, Delivery, Legal
and Regulatory Issues, New Delhi, India, 2003.
Samy, J., "Financing and Developing Environmental Infrastructure in Vietnam: The Case of
Water Supply and Wastewater Treatment," Kenan Institute/US-AEF/CSG Practitioners'
Workshop, Hanoi, 2001.
Serageldin, I., "Toward Sustainable Management of Water Resources," The World Bank,
Washington DC 1995.
Sydney Water, "Save Water, Money and the Environment," Sydney 2001.
Talaue-McManus, L., "Transboundary diagnostic analysis for the South China Sea," United
Nations Environment Programme, Bangkok 2000.
Tran, D. T. L., "Environment-Vietnam: Polluted River Blights Communities," Global
Information Network, pp. 1, 2003.
Tran, M. A. and Dam, X. L., "Delivery Water Services at the Local LeveL in Vietnam," 24th
WEDC Conference Sanitation and Water for All, Islamabad, Pakistan, pp. 302-308, 1998.
Tuoitre Newspaper Online,
http://www.tuoitre.com.vn/Tianyon/Index.aspx?ArticleID=34207&ChannelID=2," 2005.
UNDP, "Technical Reports for the HCMC Environmental Quality Management Strategy
(EQMS)," 2001.
UNESCO, "http://www.unesco.org/water/wwap/facts_figures/basic_needs.shtml," 2005.
Uttamangkabovorn, M., Prasertsan, P., and Kittikun, H. A., "Water Conservation in Canned
Tuna (pet food) Plant in Thailand," Journal of Cleaner Production, Vol. 13, pp. 547-555,
2005.
Victorian Government, "Securing Our Water Future Together," Melbourne 2004.
Bibliography
140
WASE, "Master of Planning and Development of the HCMC Water Supply Network," Water
and Sanitary Engineering Consultants, Ho Chi Minh City 2001.
Weeks, A., "World Water Privatization’s Grim Toll," The Herald (Glasgow), 2001.
World Bank, "Vietnam Country Framework Report on Private Participation in Infrastructure,"
Ha Noi 1999.
World Bank, "Benchmarking the Urban Water Sector Vietnam," Ha noi 2002.
World Bank, "Vietnam Environment Water Report," 2003.
Zver, L. b. and Glavi¡c, P., "Water minimization in process industries: case study in beet
sugar plant," Resources, Conservation and Recycling, Vol. 43, pp. 133-145, 2005.