Pham Minh Thu-BABAIU10022
81
VIETNAM NATIONAL UNIVERSITY – HO CHI MINH CITY INTERNATIONAL UNIVERSITY SCHOOL OF BUSINESS MEASURING THE AFTER-SALE SERVICE QUALITY AND EXAMING ITS EFFECTS ON THE OVERALL CUSTOMER SATISFACTION AT HONDA AUTO DEALERS In Partial Fulfillment of the Requirements of the Degree of BACHELOR OF ARTS in BUSINESS ADMINISTRATION Student’s name: PHAM MINH THU (BABAIU10022) Advisor: NGUYEN THI HUONG GIANG, MBA Ho Chi Minh City, Vietnam 2014
Transcript of Pham Minh Thu-BABAIU10022

VIETNAM NATIONAL UNIVERSITY – HO CHI MINH CITY
INTERNATIONAL UNIVERSITY
SCHOOL OF BUSINESS
MEASURING THE AFTER-SALE SERVICE
QUALITY AND EXAMING ITS EFFECTS ON
THE OVERALL CUSTOMER SATISFACTION
AT HONDA AUTO DEALERS
In Partial Fulfillment of the Requirements of the Degree of
BACHELOR OF ARTS in BUSINESS ADMINISTRATION
Student’s name: PHAM MINH THU (BABAIU10022)
Advisor: NGUYEN THI HUONG GIANG, MBA
Ho Chi Minh City, Vietnam
2014

MEASURING THE AFTER-SALE SERVICE
QUALITY AND EXAMING ITS EFFECTS ON
THE OVERALL CUSTOMER SATISFACTION
AT HONDA AUTO DEALERS
APPROVED BY: Advisor APPROVED BY: Committee,
________________________ ___________________________________
Nguyen Thi Huong Giang, MBA
__________________________________
__________________________________
__________________________________
THESIS COMMITTEE

ACKNOWLEDGEMENT
To be able to complete this final dissertation as expected, I had invaluable
backup from everyone around me. So, this is time for me to express my sincere gratitude
to those who helped me to overcome the last challenge in the senior year.
First and foremost, I would like to give special thanks to my supervisor,
Ms.Nguyen Thi Huong Giang for guiding me to work in a right way and for her
enthusiasm to assist me at the right time so that I could meet my thesis schedule.
I am grateful to dealers for their support during my fieldwork period. In
specific, I really appreciate the CR employees there for giving me feedback about my
questionnaire to make it more closely relevant to the car service context. Without their
efforts, it would have been very difficult for me to make respondents understand the
questionnaire clearly.
Finally, special thanks go to my family that significantly took care of me and
motivated me to overcome some hard times that I faced within the thesis period.

iv
TABLE OF CONTENTS
LIST OF TABLES .........................................................................................................v
LIST OF FIGURES .................................................................................................... vii
ABSTRACT ............................................................................................................... viii
CHAPTER I INTRODUCTION ..................................................................................1
1.1. Background .......................................................................................................... 1 1.2. Problem statement ................................................................................................ 3 1.3. Research objectives .............................................................................................. 5
1.4. Methodology ........................................................................................................ 5 1.5. Study scope .......................................................................................................... 6
1.6. Research significances ......................................................................................... 6 1.7. Organization of the research ................................................................................ 7
CHAPTER II LITERATURE REVIEW ....................................................................8
2.1. Customer satisfaction ........................................................................................... 8 2.2. After-sale service ................................................................................................. 9
2.3. Characteristics of the car after-sale service ....................................................... 10
2.5. The importance of the after-sale service quality ................................................ 13 2.6. Conceptual framework ....................................................................................... 15 2.7. Importance - Performance analysis (IPA) .......................................................... 16
CHAPTER III RESEARCH METHODOLOGY ....................................................19
3.1. Quantitative approach ........................................................................................ 19
3.2. Questionnaire design .......................................................................................... 19 3.3. Sampling method ............................................................................................... 22 3.4. Pilot testing ........................................................................................................ 23
3.5. Data analysis ...................................................................................................... 23
CHAPTER IV DATA ANALYSIS ............................................................................25
4.1. Demographics .................................................................................................... 25
4.2. Summary of the general information ................................................................. 26 4.3. Descriptive Statistics:......................................................................................... 28
4.3.1. Tangibles ..........................................................................................................28
4.3.2. Reliability ..........................................................................................................29
4.3.3. Responsiveness .................................................................................................31

v
4.3.4. Assurance ..........................................................................................................32
4.3.5. Empathy .............................................................................................................33
4.3.6. Satisfaction ........................................................................................................35
4.4. Reliability analysis ............................................................................................. 37 4.5. Factor analysis ................................................................................................... 38
4.6. Revised conceptual framework: ......................................................................... 45 4.7. Correlation testing .............................................................................................. 45 4.8. Regression analysis ............................................................................................ 46 4.9. IPA results .......................................................................................................... 49
CHAPTER V ................................................................................................................52
CONCLUSION AND RECOMMENDATION.........................................................52
5.1. Conclusion ..............................................................................................................52
5.2. Strategic recommendation ......................................................................................53
5.3. Limitation ...............................................................................................................57
REFERENCES ............................................................................................................58
APPENDICES .............................................................................................................63
LIST OF TABLES
Table 1: Summary of original items ................................................................................. 20
Table 2: Dealer comparison of information sources ......................................................... 27
Table 3: Tangibles ............................................................................................................ 28
Table 4: Reliability .......................................................................................................... 29
Table 5: Responsiveness .................................................................................................. 31
Table 6: Assurance ........................................................................................................... 32
Table 7: Empathy ............................................................................................................. 33
Table 8: Satisfaction ........................................................................................................ 35
Table 9: Case processing summary................................................................................... 37

vi
Table 10: Reliability analysis summary ........................................................................... 37
Table 11: KMO ................................................................................................................ 38
Table 12: Component correlation Matrix ....................................................................... 39
Table 13: Total variance explained .................................................................................. 39
Table 14: The first rotation .............................................................................................. 40
Table 15: Total variance explained ................................................................................... 41
Table 16: The second rotation........................................................................................... 41
Table 17: Total variance explained .................................................................................. 42
Table 18: The last rotation ............................................................................................... 42
Table 19: New factors ...................................................................................................... 43
Table 20: Total variance explained .................................................................................. 44
Table 21: Rotation for the dependent variable ................................................................. 44
Table 22: Correlation matrix ............................................................................................ 45
Table 23: Model Summary .............................................................................................. 46
Table 24: ANOVAb
.......................................................................................................... 46
Table 25: Coefficientsa ...................................................................................................... 47
Table 26: Importance mean value .................................................................................... 49
Table 27: Reliability result _ Tangibles factor ................................................................. 69
Table 28: Reliability result _ Reliability factor ............................................................... 70
Table 29: Reliability result _ Responsiveness factor ........................................................ 71
Table 30: Reliability result _ Assurance factor ................................................................ 71
Table 31: Reliability result _ Empathy factor ................................................................... 72
Table 32: Reliability result _ Satisfaction factor ............................................................. 73

vii
LIST OF FIGURES
Figure 1: Customer satisfaction index ................................................................................ 4
Figure 2 After-sale service process ................................................................................... 11
Figure 3: Customer perceptions of quality and customer satisfaction .............................. 15
Figure 4: Theoretical framework ...................................................................................... 15
Figure 5: Importance-performance matrix ........................................................................ 17
Figure 6: Demographics .................................................................................................... 25
Figure 7: Currently used cars ............................................................................................ 26
Figure 8: Types of information sources ............................................................................ 27
Figure 9: Tangibles ........................................................................................................... 29
Figure 10: Reliability ........................................................................................................ 30
Figure 11: Responsiveness ................................................................................................ 31
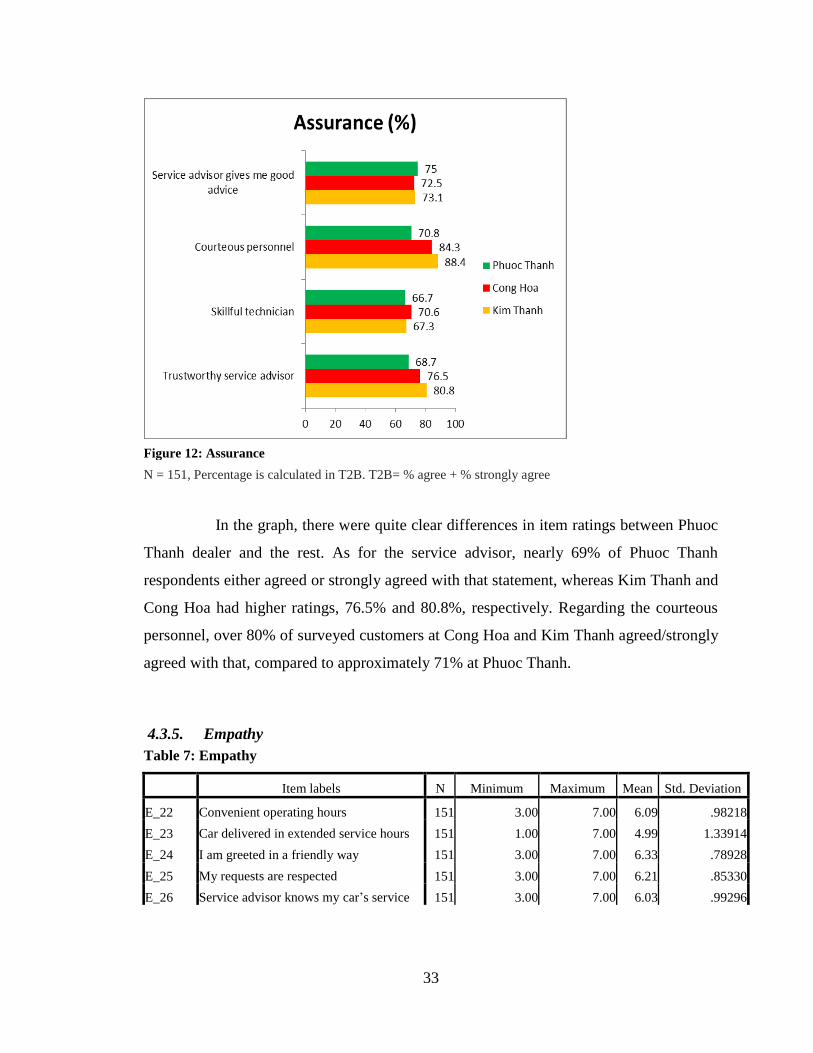
Figure 12: Assurance ........................................................................................................ 33
Figure 13: Empathy........................................................................................................... 34
Figure 14: Satisfaction ...................................................................................................... 36
Figure 15: Revised theoretical model ............................................................................... 45
Figure 16: Importance-performance graph ....................................................................... 50

viii
ABSTRACT
In the current situation of strong competition in the automobile after-sale
service in Vietnam, the study was conducted to measure the service satisfaction level at
Honda authorized dealers, whereby the research findings could help the dealers to
improve their service quality. The research was developed on the three key theoretical
foundations; they were the five service factors adapted from the Parasuraman‘s
SERVQUAL model, the ―customer satisfaction‖ framework by Wilson (2008) and the
Importance-Performance analysis (IPA) method. The quantitative method was employed
and the questionnaire distribution was limited in Ho Chi Minh City. The sample size had
been estimated to be 150; afterwards, 151 qualified questionnaires were collected.
The data were analyzed through the use of descriptive statistics, factor
analysis, multiple regression and the IPA. As a result, the first five service factors were
narrowed down into the four groups that were subsequently labeled as personnel’s
serving skills and attitudes, first sight of tangibility, service reliability and other service
elements. Then, the regression analysis showed that the ―personnel’s skills and attitudes”
factor haD the most important influence on the overall customer satisfaction. Meanwhile,
there was not enough evidence to conclude that the ―first sight of tangibility” factor
significantly impacts the satisfaction. Later, the IPA helped pick out key specific
attributes that Honda dealers should stress.
In conclusion, all of the three tested dealers have faced similar obstacles
regarding the technician‘s skills, service speed, ability to give advice and records of car
service profiles which are perceived to be highly important to customers. Therefore, some
strategic suggestions were made, which might be useful to boost the satisfaction to a
higher level at the Honda dealers.

1
CHAPTER I
INTRODUCTION
This chapter reviews the background and the problem statement which drive objectives
to conduct the study. Afterwards, the research method and the study's significance are
discussed. Eventually, the research structure is presented to make the research easier to
follow.
1.1. Background
Unlike many other countries where automobile production has become one of
the key economic sectors, the Vietnamese industry has flourished very late and just been
through the two decades of development. Before 1992, the diversity of cars was limited;
at the time, vehicles were in control of the Vietnamese government, many of which were
imported from the Union Soviet only. Then, as a part of "Reform" policies to boost the
growth of the national economy, the government granted assembly licenses to over 30
regional assemblers including local producers, joint venture and foreign owned
companies ("Vietnam's automotive component," 2007). As a result, the following years
witnessed the new factories constructed by Toyota, Mitsubishi, Mercedes-Benz, etc.
Furthermore, the young market with wide range of product segments has attracted many
domestic and foreign car importers, increasing competition and variety of choices for
customers as well.
The battle of market share is forecast to be more difficult in coming years due
to import duty reductions. Specifically, under the pressure of AFTA agreement, tariff that
is applicable to car imported from Asian nations will fall from 72 - 83% to 50% in 2014
and then to 0% in 2018. Similarly, within seven years of accession to WTO, Vietnam
government has to carry out the tax cut from 70% in 2014 to 47% in 2017 and to continue
the progress by 2019. According to the Ministry of Industry and Trade, the effect would

2
be the annual increase of 20% in customer purchasing power, since people are able to buy
cheaper imported cars than those being produced domestically.
For any companies, especially domestic producers that aim to strengthen its
position in this increasingly competitive market, strategic emphasis on differentiation of
product offerings is not enough; alternatively, the improvement in authorized dealer's
service quality is necessary, especially its after-sale service.
After-sale service is a post-purchase stage whose purpose is to ensure that
customers feel satisfied with their product or service experiences. Unlike non-durable
goods, the car buying decision is associated with different types of risk such as physical
and functional risks; therefore, customers have high demand in special care for their cars
from the manufacturers so that they can feel more secured about their choice during the
ownership.
After-sale service has become a critical tool for any automobile producers
(Flees & Senturia, 2008), because with good management it can be a great source of
benefits. For example, after-sale service is acknowledged as relational competitive
advantages, which helps to increase customer satisfaction and loyalty to the companies.
In other words, this facilitates the development of customer relationship that plays
important role in making customer be more confident in the brand choice, creating
growth opportunities in the long term. This relationship is not easily achieved and
maintained nowadays, because of mass product alternatives or substitutes and decreasing
customer trust in conventional advertisements.
Another outcome of excellent after-sale service is profit or revenue
generation. According to Pamsari and Elham (2013), as the service market is larger than
the product's, it possibly generates higher profits than the product sales. Additionally, due

3
to low dependence on economic situation, revenue obtained from after-sale service tends
to be more stable. In fact, in the recent economic downturn, where car consumption in
2013 is approximately 110,000 units which are nearly equal the 2008 figure, the dealers'
earning from providing after-sale service has partly made up for the loss in passenger car
sales.
In short, compared to the past few years, the role of after-sale service is more
fundamental for the sustainable automobile business by being a profit source and a
differentiator from competitors. Furthermore, the popularity of after sale service has
moved the industry from the totally product-centric view to customer- centric view
(Gaiardelli et al, 2007).
1.2. Problem statement
Honda Motor Vietnam was founded in 1996, in the form of joint venture from
the cooperation among three companies; they are Japan Honda Motor (42%), Asian
Honda Motor (28%), Vietnam Engine and Agricultural Machinery Corporation (VEAM).
Honda has been penetrating the Vietnam market successfully in terms of huge revenue
gained from the sales of some famous motorbikes and the credible image perceived by
local people. In a decade, Honda Vietnam only focused on the motorbike production until
2006 when it started the first business in the passenger car market.
Similarly to other automobile competitors, Honda has put considerable efforts
in the introduction of products matching local preferences and development of a qualified
after-sales service system, so as to attract new buyers and retain existing customers.

4
The figures below describe annual syndicated researches of J.D Power on customer
satisfaction towards after-sales service quality among different car brands in the Vietnam
market between 2009 and 2013.
Publisher: J.D. Power Asia Pacific
Source: J.D. Power Asia Pacific 2009, 2010, 2011, 2012, 2013 Vietnam Customer Service Index (CSI)
StudySM
According to the survey, the after-sale service of Honda was at the top of the
automaker list from 2009 to 2011, with the CSI of 836, 840 and 848, respectively. During
that period, Honda was in the leading position twice in 2009 and 2011, which proved
Figure 1: Customer satisfaction index

5
Honda's strong attempts in perfecting the service quality. However, in 2012, Honda fell
out of the top three of the best service providers with the score of 828, even below Kia
which had not been Honda's competitor in this area before. The dramatically declining
CSI score was not reasonable for Honda that had maintained the high positions for three
years; this could be an alert message. In 2013, due to the insufficient sample size, it is
hard to say if there was any change in Honda ratings.
Therefore, there is in need of an investigation to quickly update the current
service condition and to find out which points that Honda Company and its authorized
dealers need to improve.
1.3. Research objectives
The research purpose is to measuring the after-sale service quality and
examining its effect on the overall customer satisfaction at Honda auto dealers. To fulfill
the goal, four main objectives are developed as followed.
1. Measure the current satisfaction with after-sale service at Honda authorized
dealers
2. Examine the effects of service determinants on the overall customer satisfaction
3. Set priorities of specific service attributes through IPA analysis
4. Strategic suggestion and recommendations to improve the after-sale service
quality
1.4. Methodology
The author relied on a quantitative method with a questionnaire instrument in
order to accomplish this research. At first, questionnaire was self-administered to
customers at Honda's dealers, which focused on asking them to rate the after-sale service

6
quality and their overall satisfaction level. Then, the stage of data analysis was carried out
with the support of Excel and SPSS.
1.5. Study scope
As the study expected to discover the current performance of the after-sale
service at Honda dealers, the target sample included car owners who experienced/ have
been experiencing the after-sale service at the Honda authorized dealers within Ho Chi
Minh City. The numbers of qualified questionnaires were 151.
1.6. Research significances
The present research is of significance to entrepreneurs, because the findings
are helpful for service and customer relationship management. For Honda Vietnam in
general, the company can utilize them to build a more consistent and credible image of
the service offerings across its dealers. As they are considered as Honda's representatives,
any complaints about their quality may be linked directly with the corporate image by car
users. Thus, the relative consistency in dealers' quality may highly change customer
attitude towards Honda brand as a whole, raising likelihood of improvement in Honda's
CSI ratings being measured by JD Power.
As for the Honda authorized dealers in particular, the intra-brand competition
is inevitable, so the research can help each dealer recognize their strengths and
weaknesses, whereby they are able to think of their own strategies to upgrade their
service to foster relationships with existing customers, and to attract more new users than
distributors of the same brand.
Finally, this study hopefully encourages more independent researches to be
conducted in the automobile market. Although the car industry in Vietnam has developed

7
for 20 years, the numbers of auto-related researches are limited; meanwhile, the recently
complicated market situation requires such kinds of works to make car businesses better
with respect to brand images and sales revenue growth. As this study only reflects a small
automobile aspect that is after-sale service, future researches should be extended to other
issues and problems of the local automobile industry.
1.7. Organization of the research
This proposal is divided into three chapters:
Chapter 1 Introduction presented the research background, problem statement,
objectives, study significance, scope and limitation, and the organization of this study.
Chapter 2 Literature review explained theories regarding after-sale service
and customer satisfaction, conceptual framework capturing their positive relationship and
IPA analysis.
Chapter 3 Research methodology included sample, sampling procedure,
questionnaire structure and analysis of the data
Chapter 4 Data analysis summarized key results of the statistic tests
performed in the research
Chapter 5 Conclusion and recommendation referred to the summary of the
research‘s findings and some strategic service advices to the Honda dealers

8
CHATPER II
LITERATURE REVIEW
The chapter provides academic literatures relevant to this research in term of definitions
of customer satisfaction, after-sale service, the SERVQUAL dimensions and the
theoretical framework. Finally, the importance-performance analysis that is used to
identify service strengths and weaknesses will be reviewed.
2.1. Customer satisfaction
Satisfaction is a very familiar term and has been a discussion topic by
practitioners and researchers for years. In 1981, Oliver defined it as an overall affective
response influenced by product use or service experience. Then, Kotler and Clarke (1987)
believed that satisfaction is "a state of expectation fulfillment when a customer
experiences a performance". The two researchers ‗view point was clarified by Oliver
(1997) who stated it as a judgment that is considered as the pleasurable level of
consumption attributed to the use of a product or service and is related to fulfillment
including levels of under- or over-fulfillment. In other words, to a certain extent, this
explanation implies that a customer is frustrated when the consumed product did not meet
his or her expectation; conversely, that person feels delighted when it met or exceeded
the established expectation. Likewise, Kotler and Keller (2009, p.789) supported Oliver's
view point with a statement that satisfaction/ dissatisfaction is the pleasure feeling or
disappointment coming from the comparison of a product's perceived performance with
the expectation.
There are two opposite thoughts about the formation of customer satisfaction,
transaction- specific satisfaction and cumulative satisfaction. The former is formed
through the evaluation of one's single experience of a particular service or product
(Boshoff and Gray, 2004), which reflects the current performance of a company. On the

9
other hand, the overall evaluation of consumption experience that is aggregated over time
will shape the cumulative satisfaction (Johnson, Anderson & Fornell, 1995). Although
the customers' post-choice evaluation of an event is initially thought as the transaction-
specific satisfaction (Oliver, 1977; 1980), to a certain extent, it may be influenced by
their purchase histories or their accumulated consumption experiences. Additionally,
change in customer attitude towards a company is less likely to be affected by one service
encounter than the cumulative consumption. Therefore, due to the broader influence of
the cumulative satisfaction, it is the focus of measurement in the study instead of the
transaction-specific.
Despite the familiarity of customer satisfaction in business circumstance,
understanding it is still critical and useful for any companies to maintain high level of
satisfaction towards products or services through immediate improvement in quality of
inferior product or service offerings (Anderson & Srinivasan, 2003).
2.2. After-sale service
Similarly to customer satisfaction, the term" after-sale service" has been
studied in many recent researches. The concept is commonly defined as service activities
provided to customers after delivery of the products (Vitasek, 2005) and has been called
by different names by previous studies, such as technical support, product support or
customer support activities (Pamsari & Elham, 2013). However, in the contemporary
context ,where there has been the growth of the customer-centered approach, the
"customer support" which is composed of all activities to ensure that a product is
available to customers over its useful lifespan for "trouble-free use" (Loomba, 1998;
Goffin & New, 2001) is believed to closely explain key aspects of the after-sale service.
10
Goffin (1999) proposed seven types of after-sale service activities, including
installation, user training, documentation, maintenance and repair, online support,
warranties and upgrades. The importance of their contribution into the after-sale service
strategies varies across companies and industries. In the automobiles case, the core after-
sale service format is the routine maintenance/ repair supplemented with warranty policy
offered by the manufacturer. Besides, other service-related programs are sale of spare
parts, service discount, mobile car care, etc. Some of these programs are launched by
Honda Company like warranty, whereas others are solely implemented by each
authorized dealer as a sensible way of differentiating from other intra brand sellers.
After-sale service has the primary roles perceived by customers and service
providers (Patelli, Pelizzari, Pistoni & Saccani, 2004):
Ensure goods to be available continuously, re-establishing their functions as a
consequences of technical faults
Solve problems arising during the use of goods
Support them in managing and controlling issues and processes involving the
product use
Support them at the end of product life (reverse logistics)
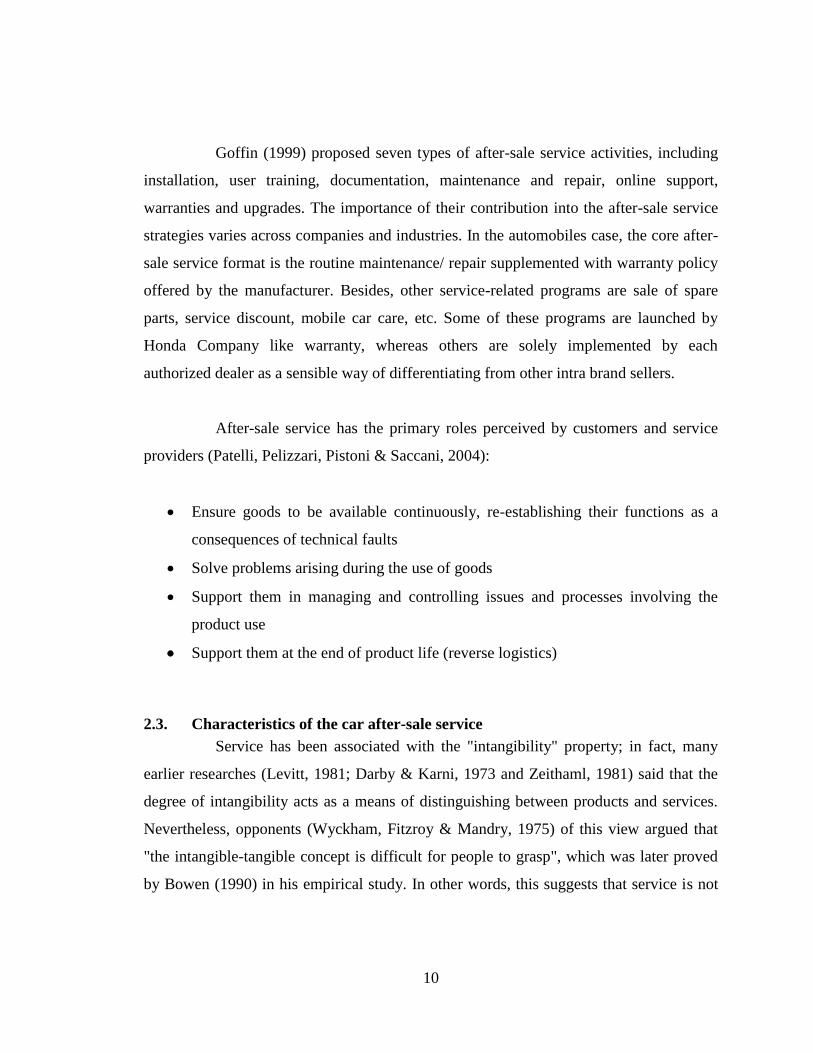
2.3. Characteristics of the car after-sale service
Service has been associated with the "intangibility" property; in fact, many
earlier researches (Levitt, 1981; Darby & Karni, 1973 and Zeithaml, 1981) said that the
degree of intangibility acts as a means of distinguishing between products and services.
Nevertheless, opponents (Wyckham, Fitzroy & Mandry, 1975) of this view argued that
"the intangible-tangible concept is difficult for people to grasp", which was later proved
by Bowen (1990) in his empirical study. In other words, this suggests that service is not

11
always purely intangible, which is thought to be true in the case of the car after-sale
service.
Bitner and Zeithaml (2000, 3-6) considered auto after-sale service as a
combination of tangibility and intangibility. Spare parts and the quality of the repaired car
are tangible goods, while the intangible service is initiated from the time when a
customer brings his car to a service center to the time when a service advisor receives it
to start diagnosing problems, repairing it and then sends it back to the owner (Juhola,
2011). The specific service process is illustrated below.
2.4. Dimensions of the after-sale service
The complexity of service has encouraged various service models (Buttle,
1996; Johnson et al., 1995) to be developed, of which SEVQUAL proposed by
Parasuraman, Zeithaml, and Berry (1988) is widely applied to date by many researchers.
Initially SERVQUAL model had been suggested to have 10 service dimensions, but was
collapsed to five factors (Parasuraman et al., 1988) that are described below
Reliability refers to the ability of the service provider to deliver the promised
service accurately and dependably.
Figure 2 After-sale service process (Katarne, Sharma & Negi, 2010)

12
Assurance refers to the degree of customer's confidence and trust in the service
provider, which is influenced a lot by courtesy, right manner and knowledge of
service advisors. In other words, dealership personnel can be seen as a key source
of the "assurance" attribute.
Tangibles consist of physical cues of the service delivery process that are
conveyed to customers about the expected service (Berndt, 2009) such as
appearance of dealership facilities and staff, communication materials.
Responsiveness refers to the willingness to assist customers in solving problems
or complaints promptly related to service experience or the purchased product and
to deliver prompt services.
Empathy is how customers feel they are either treated as important users or
receive individual attention from the company.
According to Parasuraman (1988), SERVQUAL can be applied across
industries, particularly banking, hospital, hotel, repair/ maintenance service. Since then,
various versions of SERVQUAL have been proposed by different authors. In the vehicle
service sector, especially the after-sale service in particular, this has been tested and
modified by Bouman and Wiele (1992), Berndt and Herbst (2006) and Berndt (2009) in
attempt to build new service dimensions that are more practical in reality. However, their
new factors may not completely be suitable in this study, since there is still inconsistency
in these researchers' findings.
In a study about car service industry, Bouman and Wiele (1992) extended 22
items of SERVQUAL and proposed three new dimensions that were originated from the

13
five factors of the model, namely "customer kindness", "tangibles" and "faith". Later, to
investigate service quality in South Africa motor service, Berndt and Herbst (2006) also
utilized the original SERVQUAL with the service items employed from the research of
Bouman and Wiele (1992), presenting four factors that differed from the former findings;
they are "employees", "tangibles quality", "delivery quality" and "communication
quality". However, the results of her most recent study (2009) showed the new five
factors being identified as "customer-focused quality", "tangibles", "delivery",
"communication" and "customer care" quality.
From the brief review, their different conclusions can be explained by
differences in their research environments. That is, the study authorized by Bouman and
Wiede was done in the Netherlands, whereas Berndt carried out hers in Africa. In
addition, Berndt (2009) also admitted that result of her studies cannot be applied across
all manufacturers and reflect the whole market, while the three dimensions of Bouman
(1992) are not linked to the original SERVQUAL dimensions (Bouman & Wiele, 1992,
cited in Berndt, 2009).
Therefore, the five factors of the original SERVQUAL will be kept in this
research to test and to redefine again through factor analysis method.
2.5. The importance of the after-sale service quality
Quality can be defined as the capabilities of features of a product or service to
satisfy stated or implied needs (Kotler et al., 2002, p. 831). In business context, service
quality in general or after-sale service quality in particular is the extent to which
perception of service meets or exceeds the expectation that is built before customer
experience the service (Zeithaml et al., 1990). Both of definitions of service quality and

14
customer satisfaction look similar; however, the key difference between them is that the
former only focuses on service dimensions, whereas the latter is defined more broadly.
For any companies, delivery of the excellent after-sale service will definitely
results in following benefits:
Source of revenue: after-sale market is believed to larger than the sales and is
able to generate higher turnover rate of purchase in a given product life cycle
(Cohen & Whang, 1997; Bundschuh & Dezvane, 2003). Thus, the revenue is
more likely to rise.
Source of competitive advantages (Kandampully, 1998): after-sale service is
considered as an augmented aspect of the physical product, focusing on delighting
customers with special added value along its core benefits or formal features. As
the augmented offerings are not easy to copy, the after-sale service can help the
firm stand out of the crowd.
Increase in the success rate of new products released: this likelihood results
from data retrieval and feedback collected from customers during their product
usage (Cooper & Kleinschmidt 1993).
Leverage the overall satisfaction (Athaide et al. 1996; Lele, 1997); that is, the
after-sale service quality has positive effect on customer satisfaction. Many
researchers (Saravana & Rao, 2007, p. 436; Lee et al., 2000, p. 226) supported
that the overall satisfaction is predicted by the level of service quality offered by
the service providers. The finding is important for the firms, because the high
degree of satisfaction can result in subsequent positive effects such as building
15
customer intimacy, reducing advertising cost, raising the profit margin. Moreover,
according to Porter (1985) and Kotler (1997), the influence of after-sale service
on the satisfaction can generate customer loyalty, intention of revisiting the
dealers and positive word of mouth in the long run.
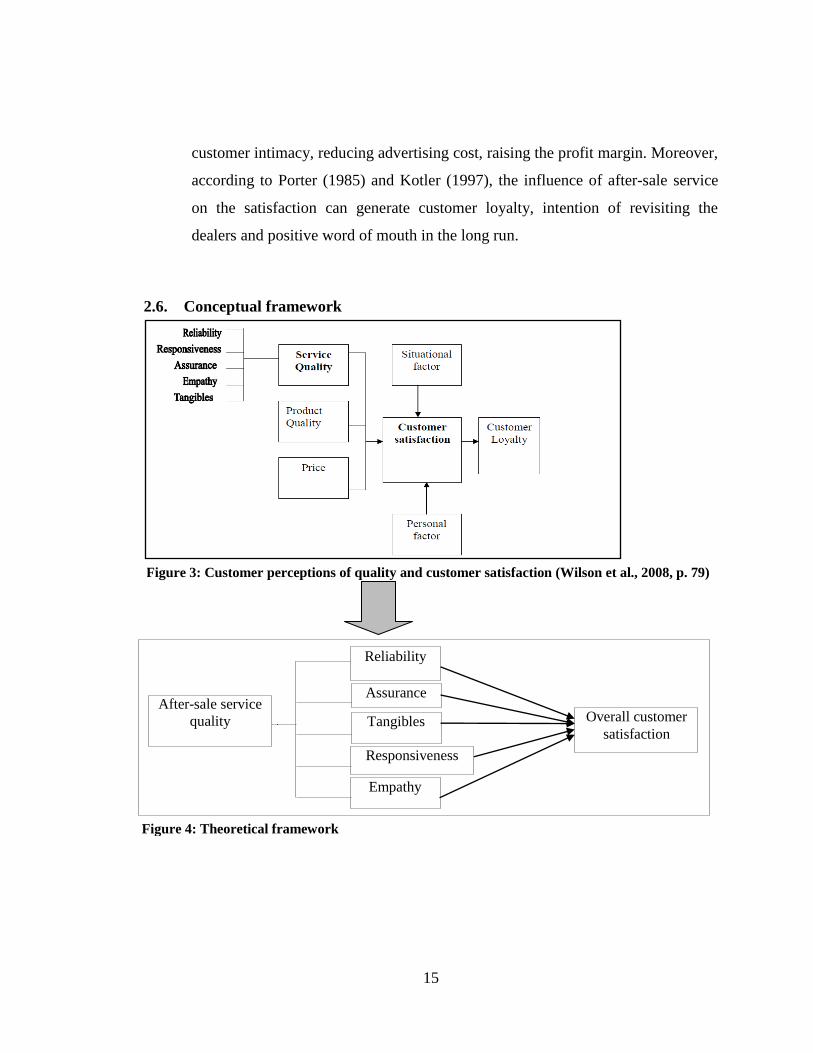
2.6. Conceptual framework
Figure 3: Customer perceptions of quality and customer satisfaction (Wilson et al., 2008, p. 79)
Figure 4: Theoretical framework
Assurance
Reliability
Responsiveness
Tangibles
Empathy
After-sale service
quality Overall customer
satisfaction

16
Within this study scope, the framework in the figure 4 is modified from the
SERVQUAL of Parasuraman et al. (1988) and the model on customer perception and
customer satisfaction of Wilson et al. (2008). Originally, according to the figure 3,
Wilson et al. (2008) treated service quality as one of the five components affecting the
dependent variable- the overall satisfaction, along with product quality, price, situational
and personal factors. Based on their works, the study wants to test the effect of after-sale
service dimensions on the customer satisfaction.
2.7. Importance - Performance analysis (IPA)
To accomplish the third objective - priorities of specific attributes for
improvement, the importance - performance analysis is preferable. The concept was first
proposed by Martilla and James (1977) to evaluate performance of the automobile
industry in their research. Since then, this method has popularly been applied across
different industries, typically in healthcare or hospital service sector (Hemmasi, Strong &
Taylor, 1994), tourism (Hsu, Byun & Yang, 1997), restaurant and hotel (Lewis &
Chambers, 1989). In an increasing competitive environment, IPA has become an
important managerial tool to assess strengths and weaknesses of a brand, product or
service.
As the name stated, the IPA includes two components, perceived importance
and performance. The concept of "importance" is referred to the customer's perception of
product or service's attributes that play significant role in influencing his or her product
or service choice (MacKenzie, 1986). According to Lilien, Kotler and Moorthy (1993),
the important attributes that are considered as important by customers vary in products or
brands within that product category. Meanwhile, performance is found in customer
perception of attribute's performance. That is, the more the perceived performance is

17
favorable, the more possibly the product or service choice stands out of similar
alternatives (Chu & Choi, 2000).
Below is the graphical interpretation of IPA results. Basically, the IPA is
expressed in a matrix, where the vertical axis represents importance ratings and the x-axis
describes the performance/ satisfaction ratings. After mean values are calculated,
attributes' scores in form of coordinates (x, y) are plotted on that matrix. Depending on
their positions on the map's quadrants, strategic decision will be made. The four
identifiable quadrants are "concentrate here", "keep up the good word", "low priority"
and "possible overkill".
Quadrant A. Concentrate here
Attributes with high perceived importance and low performance are major
weaknesses that require immediate attention for improvement.
Quadrant B. Keep up with the good work
Figure 5: Importance-performance matrix

18
Attributes with high importance and high performance indicate that they are
major strengths, so managers need to maintain these competitive advantages.
Quadrant C. Low priority
Attributes here are rated in low importance and low performance. Since they are
perceived as minor weaknesses, limited resources should be allocated in this cell.
Quadrant D. Possible overkill
Attributes are rated with high performance. However, as they are considered low
important, managers should not make too much effort on them.

19
CHAPTER III
RESEARCH METHODOLOGY
The chapter discusses the quantitative method to do the study, which includes a brief
review of the questionnaire design and the sample and sampling method. Then, the way
of analyzing data is mentioned.
3.1. Quantitative approach
Quantitative approach was employed to collect data for this study because it
was helpful to classify data, to test statistical models and to generalize findings in the
broad population. Specifically, the study applied the survey method, whereby
questionnaire was distributed to target respondents to ask them to evaluate their
experience towards the after-sale services at the selected authorized dealers.
3.2. Questionnaire design
Questionnaire is a fundamental element in most of quantitative researches. In
this study, the questionnaire embraced three sections.
Section A: the first part asked the respondents for general information about
their car usage, such as the car model that is currently used; sources of media from which
customers learn about warranties, promotions.
Section B: this consisted of rating questions on service quality and customer
satisfaction. The service construct was developed based on SERVQUAL dimensions
(Parasuraman, 1988) with items modified from those in the vehicle researches of Bouman
and Wiele (1992), and Bernt (2009). These items were adjusted to be more appropriate in
the car service context in Vietnam. Respondents were required to rate each of these
attributes on two aspects regarding its importance to the after-sale service quality and its

20
currently perceived performance. The 7-point Likert scale was used, ranging from 1- not
at all important to 7- extremely important in the importance part, and from 1- strongly
disagree to 7- strongly agree in the agreement rating part. As for the measurement of
satisfaction, three items were adopted from the secure customer index model which was
built by Randall Brandt in 1996. These were also rated on the 7- point scale from strongly
disagree to strongly agree.
Section C: the final part was demographics, grasping customer profile though
questions like gender, age, employment status.
Table 1: Summary of original items
Tangibles
1. The infrastructure is neat
(Bouman &
Wiele, 1992;
Bernt, 2009)
2. There is clear signage at the dealership
3. There are enough parking places
4. Employees are well groomed
5. There is sufficient space to sit in the
waiting area
6. The dealership‘s grounds are neat
7. Promotional material is attractive
8. Car is clean after maintenance
9. Go through the warranty
10. A checklists of repairs is provided
11. Neat invoice
12. A replacement vehicle is available
Reliability
13. Appointments are kept
14. The vehicle is ready at the promised time
15. Repairs are error free

21
16. The invoice is explained to customers
17. The dealerships focus on solving
customer complaints
18. No unnecessary work
19. The dealerships control appointments well
Responsiveness
20. The telephone is answered promptly
21. Complaints are dealt with quickly
22. The service advisor delivers the car
23. The customer receive prompt attention
upon arrival
24. The service advisor explains why repairs
are carried out
25. Maintenance on short term
Assurance
26. Customers are contacted when the repairs
become more expensive
27. I know which mechanic repaired on my
car
28. Skillful employees
29. Courteous employees
30. The customer is informed what service
level can be expected
31. The dealerships give customer good
advice regarding maintenance
Empathy
32. The interest of the customers is
considered
33. The customer is informed what service
level can be expected

22
34. Personnel provides personal attention
35. Car delivery outside normal operating
hours
36. Customer are known by name
37. Personnel provides personal attention
38. Agreement is reached before hand on the
payment method
39. Customer are attended in a friendly way
Customer
satisfaction
40. I am very satisfied with the service
experience at this dealer Brandt
(1996) 41. I will revisit the same dealer in the future
42. I will recommend the dealer to others
3.3. Sampling method
Due to the lack of sampling frame, convenient sampling was applied to collect
information. According to Donald and Pamela (2006), convenient sampling is considered
as a non-probability sampling, whereby available respondents are invited to be involved
in a study. In this research, the target groups were approached at three auto Honda's
dealers in Ho Chi Minh City, namely Honda Phước Thành, Cộng Hòa and Kim Thanh;
then, questionnaires were dropped off to them.
To ensure the high response rate, assistance from the dealers‘ managers is
needed. For this reason, the whole research‘s purpose and methodology were explained
so that they could recognize how beneficial it was to their business improvement. As a
result, with their cooperation, dealer's customers were more willing to answer the
questionnaires.

23
Target respondents were those at the age of 18 and above that
experienced/have been experiencing the maintenance/repair service at Honda auto
dealers. The estimated number of qualified respondents had been 150; then, the
questionnaires were equally administered at each dealer.
3.4. Pilot testing
Before the actual fieldwork occurs, the questionnaire needed pretesting with
reasonable sample coming from the target population (Cavana et al., 2001). Hence, five
target respondents that were randomly chosen at one of the Honda's dealers were
suggested to fill in the questionnaire. Afterwards, they were briefly interviewed about its
structure and the degree of comprehensiveness with three below questions advised by
Asker, Kumar and Day (2002, p.319)
What were you thinking when answering each answer?
Were there any problems of understanding?
Are there any things that are not covered in this subject?
Their feedbacks helped revise the questionnaire, making it easy to understand
regardless of different education backgrounds.
3.5. Data analysis
The collected data was processed by Excel and SPSS. The analysis procedure
was described as followed:
Descriptive analysis was performed to provide a brief summary about the
service dimensions and demographics which were calculated as mean and percentage. By
doing so, unusual cases and outliners were identified and eliminated to improve quality of
statistical results in the next analysis steps.

24
Reliability analysis helped test the consistency of items designed within a
factor construct. The indicator of the test result is Cronbach's alpha; the higher the value
is, the more reliable the designed scale is.
Exploratory factor analysis (EFA) aimed at explaining the observed variance
in service attributes and classifying them into new underlying factors that were different
from the original dimensions.
Multiple regression analysis was employed to examine the influence of the
newly found service dimensions on the overall customer satisfaction. This test could
determine which factors significantly affect the level of satisfaction and how strongly
they predict changes in the dependent variable's variance.
Finally, IPA was employed to display mean value of service attributes on a
grid, finding out the pros and cons of the after-sale service offerings.

25
CHAPTER IV
DATA ANALYSIS
This chapter summarizes and discusses key findings to answer the research objectives
4.1. Demographics
After the fieldwork period finished, 151 qualified questionnaires were
collected in total. They are firstly summarized in term of demographic information.
According to the Gender chart, the majority of 148 qualified respondents were males
(83.8%), whereas females only accounted for 16.2%. Over 90% of 145 qualified
surveyed people were working, of which approximately 54% are self-employed while the
others were employed for wages.
As for the age group, car users who were 36-45 years old made up the highest
percentage of respondents (41%), followed by 31% people at the age of 24 - 35. The two
age groups of 46 -55 and 56-73 accounted for the lowest portions, approximately 17%
and 10%, respectively.
N= 145
N= 148 N=145
N=145 Figure 6: Demographics

26
4.2. Summary of the general information
This section provides a brief summary about respondents‘ car models and
sources of information that they have used to get updated warranty programs.
In the chart below, 40% were Civic, partly because it is the earliest model that
has been produced in Vietnam market since 2006. The Honda CR-V model was ranked
second at 23%, in term of the number of ownerships; this was followed by City that was
the latest model (17%). One noticeable point was that there were 11% non-Honda cars
that were driven to dealers‘ workshop, most of which were found at Phuoc Thanh dealer.
The graph 8 below illustrates the percentages of car buyers using information
sources. Overall, contacts from the dealers were the most popular source that respondents
rely on to get new Honda's warranty information at 51% approximately. Honda website
and dealership ones were ranked second and third in popularity at 27% and 25%.
Presumably, waiting for either phone call or reminders from the dealers' staff was a
commonly passive way for customers to get new information.
%
N= 151
Figure 7: Currently used cars

27
Kim
Thanh
(n=50)
Cong
Hoa
(n=46)
Phuoc
Thanh
(n=37)
Facebook 2.0% 0.0% 16.2%
Online newspaper 8.0% 8.7% 8.1%
In-store ad materials 20.0% 4.3% 0.0%
Dealer website 28.0% 15.2% 32.4%
Honda website 12.0% 28.3% 45.9%
Contact from dealers 48.0% 76.1% 24.3%
The right table shows the details in the use of information sources at the three
dealers. At Kim Thanh dealer, 48% of 50 Honda car respondents have been contacted by
staffs about warranty information. Meanwhile, 28% tended to get the updated news on
the dealer website, followed by 20% reviewing in-store ad materials. By comparison,
contact from the dealer was also preferred the most at 76% at Cong Hoa, followed by the
Honda website (28%).
On the other hand, Honda car users going to Phuoc Thanh generally counted
on online sources; specifically, 45% of them have used the Honda website and 32% have
accessed dealership website. Only 9 out of 37 Honda car buyers said they were contacted
by the dealer's employees.
The opposite results between the group of Kim Thanh, Cong Hoa and Phuoc
Thanh may be due to the fact that Phuoc Thanh has been operating for 2 years only, while
the two others opened in 2006; additionally, its location is not as convenient as the latter.
Table 2: Dealer comparison of information sources
N= 133
Figure 8: Types of information sources

28
Consequently, the number of service customers that the dealer staffs contact is definitely
limited.
4.3. Descriptive Statistics:
This section summarizes findings on the six factors as well as compares
percentage differences in service attributes among the three dealers.
4.3.1. Tangibles
Table 3: Tangibles
Item labels N Minimum Maximum Mean Std. Deviation
T_1 Clean facility 151 4.00 7.00 6.26 .90527
T_2 New infrastructure 151 2.00 7.00 5.94 1.02132
T_3 Spacious workshop 151 3.00 7.00 5.97 .95511
T_4 Modern repairing equipment 151 4.00 7.00 5.89 .91319
T_5 Well-groomed personnel 151 4.00 7.00 6.21 .83521
T_6 Comfortable waiting area 151 4.00 7.00 6.23 .83621
T_7 Modern entertainment devices 151 2.00 7.00 5.95 .95769
T_8 Attractive in-store ad materials 151 1.00 7.00 5.33 1.14730
Valid N (listwise) 151
Average 5.97
Generally, the average value of the tangibles factor was nearly 6.0, which is
quite good. Among the eight tangible aspects, clean facility, comfortable waiting area and
well-groomed personnel were rated above the average. Meanwhile, a noticeable point
was that the ―attractive in-store ad materials‖ item scored the lowest at 5.33; in fact, its
ratings ranged more widely than the other items, from 1 to 7.

29
N = 151, Percentage is calculated in T2B. T2B= % agree + % strongly agree
The figure above describes the percentage differences in each item among the
three Honda dealers. Clearly, for the spacious workshop, new infrastructure and clean
facility, Phuoc Thanh was ranked highest at 87.5%, 91.7% and 91.6%, respectively in
comparison with Kim Thanh and Cong Hoa. Likewise, the same pattern was repeated for
the attractiveness of in-store advertising materials with 56.2% of Phuoc Thanh customers
saying ―agree/strongly agree‖. Regarding to the ―repairing equipment‖, with the T2B
value of 59.6% only, that in Kim Thanh was not perceived as modern as the two other
dealers‘.
4.3.2. Reliability
Table 4: Reliability
Item labels N Minimum Maximum Mean Std. Deviation
R_9 Appointments are kept 151 4.00 7.00 6.25 .88669
R_10 Request is completely fulfilled 151 3.00 7.00 6.15 .86716
Figure 9: Tangibles

30
N = 151, Percentage is calculated in T2B. T2B= % agree + % strongly agree
R_11 Car ready at the promised time 151 3.00 7.00 6.06 .98137
R_12 Error-free repaired car 151 2.00 7.00 5.81 1.09181
R_13 Clear explanation of charges 151 4.00 7.00 6.25 .96068
Valid N (listwise) 151
Average 6.10
In the table, the average score of the reliability factor was 6.1, which was not
much different from that of the tangibles. Specifically, the two items that had the highest
mean values were "appointments are kept" and "clear explanation of charges" at 6.25. In
contrast, the "error-free repaired car" attribute scored the lowest and had the larger
standard deviation in the rating as well.
In the graph about the reliability of the service quality, there were some
differences among these dealers. First, 88.5% of respondents at Kim Thanh dealer
believed that their appointments were well recorded, whereas the figures were
Figure 10: Reliability

31
N = 151, Percentage is calculated in T2B. T2B= % agree + % strongly agree
approximately 82% and 71% at Cong Hoa and Phuoc Thanh. Second, as for the ―repaired
car to be ready at the promised time‖ attribute, Cong Hoa was in the leading position
(84.3%) as opposed to approximately 70% at both Kim Thanh and Phuoc Thanh. Another
difference referred to the ―errors of the repaired cars‖. As for this aspect, Phuoc Thanh
was ranked first at 75%, while the lowest figure of 57.7% belonged to Kim Thanh.
4.3.3. Responsiveness
Table 5: Responsiveness
Item labels N Minimum Maximum Mean Std. Deviation
Rs_14 Prompt attention on arrival 151 4.00 7.00 6.34 .84764
Rs_15 Quick service process 151 4.00 7.00 6.01 .92366
Rs_16 Detailed explanation of work 151 3.00 7.00 6.17 .92686
Rs_17 I get updated on my repaired car's status 151 4.00 7.00 6.17 .89763
Valid N (listwise) 151
Average 6.17
Figure 11: Responsiveness

32
In the table 5, as for the ―responsiveness‖ factor, its average point was 6.17.
Of the four statements, the "prompt attention on arrival" was scored the highest at Honda
dealerships. On the other hand, the "quick service" aspect was rated the lowest at 6
approximately.
According to the graph, it seems that the differences in ratings of the service
items between these dealers were not large, except the "prompt attention upon arrival".
The proportions of respondents at Kim Thanh and Cong Hoa that agreed/ strongly agreed
with that statement were approximately 86%, whereas the figure was only 77.1% at
Phuoc Thanh.
4.3.4. Assurance
Table 6: Assurance
Item labels N Minimum Maximum Mean Std. Deviation
As_18 Trust-worthy service advisor 151 3.00 7.00 6.08 .95585
As_19 Skillful technician 151 3.00 7.00 5.86 .99358
As_20 Courteous personnel 151 4.00 7.00 6.26 .83637
As_21 Service advisor gives me good advice 151 3.00 7.00 6.05 .98209
Valid N (listwise) 151
Average 6.06
On average, the service assurance scored 6.06. Among the four service items
in the construct, the rating of the "courteous personnel" was the highest at 6.26, followed
by that of the "trustworthy service advisor" with 6.08. Meanwhile, the "skillful
technician" statement was rated below average, 5.86.
33
N = 151, Percentage is calculated in T2B. T2B= % agree + % strongly agree
In the graph, there were quite clear differences in item ratings between Phuoc
Thanh dealer and the rest. As for the service advisor, nearly 69% of Phuoc Thanh
respondents either agreed or strongly agreed with that statement, whereas Kim Thanh and
Cong Hoa had higher ratings, 76.5% and 80.8%, respectively. Regarding the courteous
personnel, over 80% of surveyed customers at Cong Hoa and Kim Thanh agreed/strongly
agreed with that, compared to approximately 71% at Phuoc Thanh.
4.3.5. Empathy
Table 7: Empathy
Item labels N Minimum Maximum Mean Std. Deviation
E_22 Convenient operating hours 151 3.00 7.00 6.09 .98218
E_23 Car delivered in extended service hours 151 1.00 7.00 4.99 1.33914
E_24 I am greeted in a friendly way 151 3.00 7.00 6.33 .78928
E_25 My requests are respected 151 3.00 7.00 6.21 .85330
E_26 Service advisor knows my car‘s service 151 3.00 7.00 6.03 .99296
Figure 12: Assurance

34
N = 151, Percentage is calculated in T2B. T2B= % agree + % strongly agree
history
E_27 Personnel contacts me to know my
satisfaction 151 3.00 7.00 6.18 .91714
Valid N
(listwise)
151
Average 5.97
According to the descriptive table, the average score of the "Empathy
"construct was 5.97. The Honda dealers did well in greeting customers with the mean
score of 6.33 and respecting customers' requests with the mean of 6.21. On the other
hand, the "car delivered in extended opening hours" statement scored below the average
level.
Figure 13: Empathy
According to the chart, there were two noticeable T2B differences in the
service offerings among the three Honda dealers. First, 58.3% of Phuoc Thanh customers

35
agreed/strongly agreed that they could bring their cars to the dealer outside its usual
opening hours, whereas The T2B figures were 34.6% and 15.7% at Kim Thanh and Cong
Hoa, respectively. Another difference referred to respecting customers' requests.
Specifically, the number of surveyed customers at Kim Thanh and Cong Hoa that
agreed/strongly agreed with the statement approximately made up 87% and 80%,
respectively; meanwhile, Phuoc Thanh's figure was lower at nearly 67%.
4.3.6. Satisfaction
Table 8: Satisfaction
Item labels N Minimum Maximum Mean Std. Deviation
S1 Feel pleasant with the service quality 151 4.00 7.00 6.15 .82783
S2 My service expectations are met 151 3.00 7.00 5.97 .95880
S3 Satisfied with the service experience 151 1.00 7.00 5.96 1.01246
S4 Revisit the dealer in the future 151 1.00 7.00 6.03 1.02253
S5 Recommend the dealer 151 1.00 7.00 5.95 1.10958
Valid N (listwise) 151
Average 6.01
The findings show that the average score of the overall satisfaction factor was
6.01 and that the ratings of the five items were not much different from each other. Of the
five questions, the ―feeling pleasant with the service quality‖ item had the highest score
of 6.15.

36
N = 151, Percentage is calculated in T2B. T2B= % agree + % strongly agree
According to the graph, it seems that the number of customers that
agreed/strongly agreed with the five items of the satisfaction construct accounted for at
least 70% of respondents at all the surveyed Honda dealers. Regarding the service in
specific, T2B values on "feeling pleasant with the service quality" and "satisfied with the
service experience" were not much different among the three dealers. However, Phuoc
Thanh was rated the highest at 84% in term of meeting customer's expectations. In
contrast, the figure was approximately 69% at Kim Thanh and Cong Hoa.
Another clear result in the bar chart refers to the customer intention to revisit
in the future and recommend to other people. Specifically at Phuoc Thanh, despite the
high T2B values that were all above 77% on the service satisfaction, only 73% of
surveyed customers would intend to go back to the dealer, compared to approximately
79% and 81% at Kim Thanh and Cong Hoa, respectively. A similar pattern was repeated
Figure 14: Satisfaction

37
Table 9: Case processing summary
for the "recommend the dealers to others" item. A possible explanation may be that
Phuoc Thanh's location is far away from the central city, thereby discouraging people to
drive there, except car users coming from the western Vietnam.
4.4. Reliability analysis
Reliability test was employed to examine consistency in the questionnaire
design. The test shows that all of the 151 cases were valid for the test.
The table 10 summarizes the internal correlation within each factor in term of
Cronbach's Alpha. According to the rules of thumb (George & Mallery, 2003),
Cronbach's Alpha should be at least 0.7. Thus, as the alpha values of the six factors are
above 0.7, the internal consistency between items within a construct is good.
Table 10: Reliability analysis summary
Factors Cronbach's Alpha N of Items
Tangibles 0.823 8
Reliability 0.852 5
Responsiveness 0.808 4
Assurance 0.854 4
Empathy 0.742 6
Satisfaction 0.893 5
Case Processing Summary
N %
Cases Valid 151 100.0
Excludeda 0 .0
Total 151 100.0
a. Listwise deletion based on all variables in the
procedure.

38
According the table 31 ―Reliability result _ Empathy factor‖ in the Appendix,
"Empathy" is the only factor that has improvement in the value of Cronbach's alpha if the
item" extended opening hours" is removed. As the Cronbach value increased from 0.742
to 0.797, this item was eliminated from the "Empathy" factor (for more details, refer to
the appendix).
4.5. Factor analysis
Exploratory factor analysis was performed with 27 items from the five
original factors, namely tangibles, reliability, responsiveness, assurance and empathy.
Based on the rules of thumb, the valid EFA result must satisfy the following criteria.
KMO must be at least 50%
The cumulative variances explained must be at least 50%
Item with the factor loading must be greater than or equal to 0.4
The discrepancy between the maximum and minimum loading must be greater
than or equal 0.3 (Jabnoun & Al-Tamimi, 2003)
In the first table, the KMO value for the test fell within the range of 0.8-0.9, so
the sampling adequacy was supposed to be great and the test continued.
Table 11: KMO
To rearrange the items, the "Promax" rotation was applied instead of the
"Varimax" as usual. The orthogonal varimax method theoretically classifies items into
totally unrelated factors, whereas the oblique promax assumes that there are still
KMO and Bartlett's Test
Kaiser-Meyer-Olkin Measure of Sampling Adequacy. .888
Bartlett's Test of Sphericity Approx. Chi-Square 2.181E3
df 351
Sig. .000

39
Table 13: Total variance explained
correlations between the rotated components. According to Matsunaga (2010), findings
based on the former method may not be reasonable, since to some degrees, factors are
related to each other in the area of social science. In fact, it can be implied that there is a
threshold of correlation indicating when either Promax or Varimax is used.
Tabachnick and Fidell (2007, p. 646) proposed that if the component
correlations exceed the cutoff of 0.32 at which there is at least 10% overlap in factor
variances, the oblique rotation is used. According to the table 12 that describes the
correlation degrees among rotated components, as most of the values were above 0.32,
the oblique Promax was necessary in this research.
Table 12: Component correlation Matrix
Component Correlation Matrix
Compo
nent 1 2 3 4 5 6
1 1.000 .572 .423 .530 .419 -.064
2 .572 1.000 .470 .527 .375 .203
3 .423 .470 1.000 .333 .383 .074
4 .530 .527 .333 1.000 .345 .150
5 .419 .375 .383 .345 1.000 .042
6 -.064 .203 .074 .150 .042 1.000
Extraction Method: Principal Component Analysis.
Rotation Method: Promax with Kaiser Normalization.
Total Variance Explained
Compon
ent
Initial Eigenvalues Extraction Sums of Squared Loadings
Rotation Sums of
Squared
Loadingsa
Total % of Variance Cumulative % Total % of Variance Cumulative % Total
1 10.518 38.957 38.957 10.518 38.957 38.957 8.156
2 2.094 7.755 46.712 2.094 7.755 46.712 7.601
3 1.477 5.470 52.183 1.477 5.470 52.183 5.525
4 1.192 4.413 56.596 1.192 4.413 56.596 6.340
5 1.137 4.213 60.808 1.137 4.213 60.808 4.205
6 1.035 3.834 64.643 1.035 3.834 64.643 1.563
Extraction Method: Principal Component Analysis.
a. When components are correlated, sums of squared loadings cannot be added to obtain a total variance.

40
Table 14: The first rotation
After the first rotation, the cumulative variance value was 64.643%. Deleted
items included the following: Rs_17, E_24, R_11, E_25 and R_12.
Pattern Matrixa
Component
1 2 3 4 5 6
E_26 .781
E_27 .701
As_20 .668
As_18 .632
E_22 .625
Rs_17 .600 .366
As_21 .574
As_19 .563
Rs_15 .726
Rs_14 .710
T_4 .648
E_24 .441 .591
Rs_16 .564
R_11 .534 .477
E_25 .469 .491
T_1 .887
T_2 .823
T_3 .734
T_5 .551
R_10 .890
R_9 .774
R_13 .662
R_12 .408 .535
T_7 .801
T_8 .783
T_6 .520
E_23 .795
Extraction Method: Principal Component Analysis.
Rotation Method: Promax with Kaiser Normalization.

41
Table 15: Total variance explained
Table 16: The second rotation
Table 16: The second rotation
Pattern Matrixa
Component
1 2 3 4 5
As_19 .832
As_20 .823
Rs_14 .778
Rs_16 .737
Rs_15 .684
As_21 .683
As_18 .653
E_26 .530
T_4 .500 .344
E_27 .496 .310
E_22 .314
T_1 .818
T_3 .802
T_2 .795
T_5 .349 .516
R_10 .919
R_9 .798
R_13 .677
T_8 .835
T_7 .765
T_6 .547 -.322
E_23 .838
Extraction Method: Principal Component Analysis.
Rotation Method: Promax with Kaiser Normalization.
a. Rotation converged in 8 iterations.
Total Variance Explained
Compon
ent
Initial Eigenvalues Extraction Sums of Squared Loadings
Rotation Sums of
Squared
Loadingsa
Total % of Variance Cumulative % Total % of Variance Cumulative % Total
1 8.383 38.105 38.105 8.383 38.105 38.105 7.489
2 1.996 9.074 47.179 1.996 9.074 47.179 4.539
3 1.282 5.829 53.008 1.282 5.829 53.008 5.141
4 1.133 5.149 58.157 1.133 5.149 58.157 4.043
5 1.077 4.897 63.055 1.077 4.897 63.055 1.418
Extraction Method: Principal Component Analysis.
a. When components are correlated, sums of squared loadings cannot be added to obtain a total variance.

42
Table 18: The last rotation
Table 17: Total variance explained
In the second rotation, the total explained variance was 63,055%. Deleted
items were T_4, E_27, E_22, T_5, and T_6.
Total Variance Explained
Compon
ent
Initial Eigenvalues Extraction Sums of Squared Loadings
Rotation Sums of
Squared
Loadingsa
Total % of Variance Cumulative % Total % of Variance Cumulative % Total
1 6.543 38.491 38.491 6.543 38.491 38.491 5.883
2 1.831 10.768 49.259 1.831 10.768 49.259 3.239
3 1.250 7.353 56.612 1.250 7.353 56.612 3.935
4 1.074 6.320 62.932 1.074 6.320 62.932 2.589
Extraction Method: Principal Component Analysis.
a. When components are correlated, sums of squared loadings cannot be added to obtain a total variance.
Pattern Matrixa
Component
1 2 3 4
As_20 .871
As_19 .784
Rs_14 .745
Rs_16 .700
As_18 .698
As_21 .654
Rs_15 .637
E_26 .597
T_1 .811
T_3 .803
T_2 .792
R_10 .896
R_9 .784
R_13 .651
T_8 .748
E_23 .662
T_7 .448
Extraction Method: Principal Component Analysis.
Rotation Method: Promax with Kaiser Normalization.
a. Rotation converged in 6 iterations.

43
Table 19: New factors
The third rotation shows that the cumulative variance value was 62.932% and
that all of the remaining items completely loaded in separate factors.
Based on the meanings of items within each construct, the four underlying
groups were generally summarized and labeled in the table below. Similar to the original
factors, they were perceived as independent variables and their prediction of the overall
satisfaction was tested by the multiple regression analysis.
Group 1: Personnel's serving skills and attitudes
As_20 Courteous personnel
As_19 Skillful technician
Rs_14 Prompt attention on arrival
Rs_16 Detailed explanation of work
As_18 Trustworthy service advisor
As_21 Good advice on service given to me
Rs_15 Quick service process
E_26 Service advisor knows my car‘s service
Group 2: First sight of tangibility
T_1 Clean facility
T_3 Spacious workshop
T_2 New infrastructure
Group 3: Service reliability
R_10 My requests are fulfilled thoroughly
R_9 Appointments kept
R_13 Clear explanation of charges
Group 4: Other service elements
T_8 Attractive in-store ad materials
E_23 Car delivered in extended opening hours
T_7 Modern entertainment devices

44
Table 20: Total variance explained
The tables above describe the EFA‘s results of the satisfaction factor. Only
one component was extracted with the cumulative explained variances of 70, 298%; thus,
all of the five items remained in the "Satisfaction" dimension.
Total Variance Explained
Compo
nent
Initial Eigenvalues Extraction Sums of Squared Loadings
Total % of Variance Cumulative % Total % of Variance Cumulative %
1 3.515 70.298 70.298 3.515 70.298 70.298
2 .673 13.450 83.749
3 .380 7.592 91.341
4 .263 5.256 96.597
5 .170 3.403 100.000
Extraction Method: Principal Component Analysis.
Component Matrixa
Component
1
S1 .784
S2 .771
S3 .896
S4 .862
S5 .872
Extraction Method:
Principal Component
Analysis.
Table 21: Rotation for the dependent variable

45
Table 22: Correlation matrix
4.6. Revised conceptual framework:
Due to some changes in the factors‘ components, the proposed model is
revised
x
The hypotheses for testing were developed as followed:
H1: Personnel's serving skills and attitudes significantly affect the overall satisfaction
H2: First sight of tangibility significantly affects the overall satisfaction
H3: Service reliability significantly affects the overall satisfaction
H4: Other service elements significantly affect the overall satisfaction
4.7. Correlation testing
Figure 15: Revised theoretical model
Personnel's skills and
attitudes
Reliability
Other service elements
First sight of tangibility
After-sale service
quality Overall customer
satisfaction

46
Correlation is the pre-stage of the regression analysis to examine whether
there are linear relationships among factors, especially between the independent variables
and the dependent variable - the overall satisfaction. In the last column, it shows that the
findings were significant (α = .000 < .05); thus, the research concluded that each of the
four factors were correlated with the satisfaction component.
4.8. Regression analysis
Table 23: Model Summary
Model R R Square
Adjusted R
Square
Std. Error of the
Estimate
1 .739a .546 .533 .56639
a. Predictors: (Constant), Group4_mean, Group3_mean,
Group2_mean, Group1_mean
Table 24: ANOVAb
Model Sum of Squares df Mean Square F Sig.
1 Regression 56.257 4 14.064 43.841 .000a
Residual 46.837 146 .321
Total 103.094 150
a. Predictors: (Constant), Group4_mean, Group3_mean, Group2_mean,
Group1_mean
b. Dependent Variable: Satisfaction_mean

47
The summary table shows the model explains 54.6% of the variation in the
overall customer satisfaction at Honda dealers and that result is significant (α = 0.000 <
0.05, in the ANOVA table).
In the coefficients table, the collinearity represents the degree of correlation
among the independent variables. According to many researches (Ethington, "Multiple
regression,"), a variable is considered problematic in a regression equation, if its VIF is
greater than or equal to 5. Since the four VIF values above were below 2, they were kept
in the model.
As the significance values were less than 0.05, "Personnel's skills and
attitudes", and "Reliability" and "Other service elements‖ significantly influenced the
overall satisfaction. On the other hand, there was not sufficient evidence to conclude that
the "First sight of tangibility" variable had influence on the dependent variable.
The B value expresses the units of the satisfaction change equivalent to one
unit change in an independent variable. The higher it is, the more powerful the factor's
Table 25: Coefficientsa
Model
Unstandardized Coefficients
Standardized
Coefficients
t Sig.
Collinearity Statistics
B Std. Error Beta Tolerance VIF
1 (Constant) -.155 .483 -.321 .749
Personnel .574 .092 .480 6.241 .000 .526 1.902
First sight .126 .065 .123 1.943 .054 .772 1.295
Reliability .181 .078 .167 2.314 .022 .598 1.673
Other service elements .145 .064 .145 2.252 .026 .748 1.337
a. Dependent Variable: Satisfaction_mean
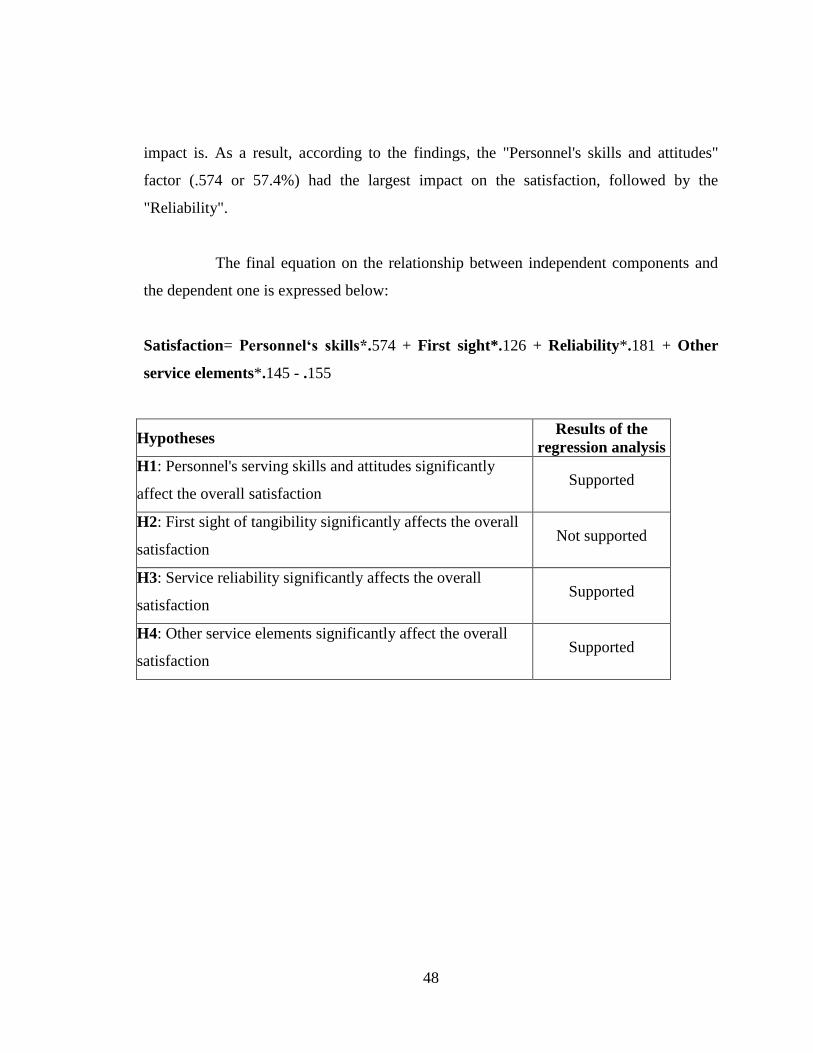
48
impact is. As a result, according to the findings, the "Personnel's skills and attitudes"
factor (.574 or 57.4%) had the largest impact on the satisfaction, followed by the
"Reliability".
The final equation on the relationship between independent components and
the dependent one is expressed below:
Satisfaction= Personnel‘s skills*.574 + First sight*.126 + Reliability*.181 + Other
service elements*.145 - .155
Hypotheses Results of the
regression analysis
H1: Personnel's serving skills and attitudes significantly
affect the overall satisfaction Supported
H2: First sight of tangibility significantly affects the overall
satisfaction Not supported
H3: Service reliability significantly affects the overall
satisfaction Supported
H4: Other service elements significantly affect the overall
satisfaction Supported

49
4.9. IPA results
In this section, service items of the four factors above are prioritized for
improvement based on the customer's perceived importance degree.
Table 26: Importance mean value
Mean value
Factor 1: Personnel's serving skills and attitudes Importance Performance
As_20 Courteous personnel 6.34 6.26
As_19 Skillful technician 6.48 5.86
Rs_14 Prompt attention on arrival 6.26 6.34
Rs_16 Detailed explanation of work 6.6 6.17
As_18 Trustworthy service advisor 6.49 6.08
As_21 Good advice on service given to me 6.61 6.05
Rs_15 Quick service process 6.47 6.01
E_26 Service advisor knows my car‘s service
history 6.46 6.03
Group 2: First sight of tangibility
T_1 Clean facility 6.3 6.26
T_3 Spacious workshop 6.09 5.97
T_2 New infrastructure 5.84 5.94
Group 3: Service reliability
R_10 My requests are fulfilled thoroughly 6.5 6.15
R_9 Appointments are kept 6.56 6.25
R_13 Clear explanation of charges 6.66 6.25
Group 4: Other service elements
T_8 Attractive in-store ad materials 5.4 5.33
E_23 Car delivered in extended opening hours 5.66 4.99
T_7 Modern entertainment devices 5.88 5.95
Average 6.27 5.994

50
According to the graph‘s results, "skillful technician" was the only item in the
concentrate here quadrant; therefore, the study implies that Honda dealers should
significantly allocate more resources to improve this aspect.
In the keep up the work quadrant, most of the attributes of the "reliability" and
―personnel serving skills and attitudes‖ factors are located here, which meant that the
factors' performances considerably met customer's needs and the dealers should maintain
them or achieve a higher level. Of these service offerings in the quadrant, the "prompt
attention upon arrival" attribute had performance that exceeded the perceived importance
rating of 6.26. The ―detailed explanation of work", "good service advice", "appointment
are kept" and "clear explanation of charges" items were perceived as top criteria to
determine dealer's service quality, with the mean ratings being all above 6.5.
T_1
T_2
T_3
T_7
T_8
R_9
R_10
R_13
Rs_14
Rs_15
Rs_16
As_18As_19
As_20
As_21
E_26
E_23
5
5.1
5.2
5.3
5.4
5.5
5.6
5.7
5.8
5.9
6
6.1
6.2
6.3
6.4
6.5
6.6
6.7
6.8
4.5 4.6 4.7 4.8 4.9 5 5.1 5.2 5.3 5.4 5.5 5.6 5.7 5.8 5.9 6 6.1 6.2 6.3 6.4 6.5
Importance-performanceKeep up
Low priority
Concentrate here
Overkill
Figure 16: Importance-performance graph
Importance
Performance

51
Nevertheless, despite being located in the keep up the work quadrant, "quick
service process" and "service advisor knows my car‘s service history" ratings of 6.01 and
6.03 were slightly higher than the average performance ratings, but service customers
perceived their importance at 6.47 and 6.46. The "good advice on service given to me"
attribute also faced a similar pattern, as its performance rating was 6.05 relatively to 6.61
for the importance level. As a result, among items in the quadrant, dealers need to pay
more attention to the three mentioned attributes.
The low priority quadrant identifies items that dealers perform adequately, but
they were considered less important than other attributes. The result shows that three
attributes of the factor ―other service elements‖ fell in the quadrant, which implies that
dealers should make less effort in them. On the contrary, the regression findings indicate
the factor's impact on the overall satisfaction level. A possible reason was that "modern
entertainment devices" and "in-store ad materials" were basic facilities to service
customers, because they are offered at the dealers. Thus, without them, customers would
feel dissatisfied.
However, for the "car delivered in extended opening hours" item in particular,
it is believed to be a value-added element. Its low rating may be due to the fact many
surveyed customers have not driven their cars to workshop outside the opening hours, or
have not expected of the dealer to offer this. In fact, when being asked about this
question, many of them said they should follow the usual working hours at the dealer. For
this reason, due to the lack of past experiences, it is hard for customers to determine if
that attribute is beneficial to them or not. Nevertheless, letting customers know about that
offering can make a dealer stand out from the others.
In the overkill quadrant, there were not any service items that the dealers
allocate unnecessary resources on.
52
CHAPTER V
CONCLUSION AND RECOMENDATION
The section is summarizing primary points of the data findings and suggesting strategic
ideas to improve the after-sale service at Honda dealers
5.1. Conclusion
The study was conducted to understand the after-sale service impacts on the
overall customer satisfaction at Honda dealers. Questionnaires were administered at the
three main dealers in Ho Chi Minh, namely Kim Thanh, Cong Hoa and Phuoc Thanh.
The fieldwork finished with 151 qualified questionnaires returned, compared to the target
of 150.
To achieve the research purpose, descriptive statistics, reliability test, EFA,
regression IPA were performed. The descriptive results showed that over half of the
respondents are self-employed and they are 30-40s years old. The data summary also
showed that high portions of car users tend to wait for reminders about warranty service
from dealers' staff. Besides, the findings told that the overall satisfaction was
approximately rated at 6 out of 7, indicating that the Honda's auto after-sale service have
currently satisfied car users and the ratings are alike among the three dealers.
The findings of the reliability analysis showed the high internal consistency of
items in all the six factors, namely "tangibles", "reliability", "responsiveness",
"assurance", "empathy" and "satisfaction". In the "empathy" construct, the "car delivered
in extended opening hours" item was deleted, since the removal raised The Cronbach's
alpha by 0.05. Afterwards, the exploratory factor analysis reduced 27 original items to 17
in the four new groups. They are "Personnel's serving skills and attitudes", "First sight of
tangibility", "Service reliability" and "Other service elements".

53
The regression implied that "Personnel's serving skills and attitudes", "Service
reliability" and "Other service elements" are predictors of the overall satisfaction at
Honda dealers, of which the most impactful factor is the personnel‘s skills and attitudes.
Then, the importance-performance analysis showed that the majority of items in the
personnel and service reliability groups are considered as top criteria to assess the
maintenance service quality. In the personnel group, the dealers should put more efforts
and resources into four important service attributes " skillful technician", "quick service"
and "car service history", "good service advice" subsequently. On the other hand, for
service reliability, the dealers all perform the three attributes well.
5.2. Strategic recommendation
Based on the data findings, the research is giving suggestions to raise the
dealership service quality. In the ―personnel's serving skills and attitudes" factor which
plays the most fundamental role in satisfying customers, there are four primary
concerning issues in the order of importance.
First, the perceived skills of technicians must be improved. Since service
customers have limited technical knowledge, they are prone to evaluate that aspect of
dealers' technicians in two ways, communication (1) and the quality of their repaired car
(2).
1) Communication. Although customers directly talk with a service advisor rather than a
technician, sometimes they visit the workshop in order to ask the latter for their car
status. Thus, the way for that technician to answer customer's questions will affect
what customers think about his skills. The study suggests Honda Company as well as
the dealers to carry out more communication training courses that strongly focus on
practical cases or real-life situations so that technicians can practice easily, getting

54
high confidence when handling customer‘s questions. Those courses should also
teach them how to illustrate technical responses in a more understandable way.
Besides trainings, another recommendation is to pair an entry-level staff with an
experienced mentor in a team; therefore, the experienced employee can assist him to
answer difficult questions accurately.
2) Quality of the repaired car. Checking errors of the car that was fixed is the second
way to assess the skill level of technicians. Customers will feel unhappy or annoyed if
they find that errors that need fixing still exist, because they have to spend more time
driving their car back to the dealer. The remaining glitches might be due to either the
lack of ability to diagnose right technical glitches (1), or the tehnician‘s insufficient
care (2). As for the technician's ability (1), Honda Motors and the dealers might
minimize that problem in the following ways.
- Training courses and technician contests should be held more regularly not only to
help staff update knowledge about new car technologies, but also give them
opportunities to exchange skills and experiences to each other.
- Honda dealers should create profiles of technical errors that either car users
commonly complain about, or technicians have failed to fix completely.
Specifically, such computerized profiles should consist of information about
common errors of which car models, which methods have been applied to solve
them, etc. The accumulated information can be used as sources of references to fix
similar car errors, or used by the engineering team to discuss to find better solutions
for future cases.
To improve the technician's engagement (2), dealers not only need to monitor and
evaluate effectiveness of their performances periodically, but also provide incentives

55
for their equivalent efforts. Awards should be in both extrinsic forms like cash, gifts,
and intrinsic values like compliments. Moreover, the importance of serving customers
with high work accuracy or low rate of technical mistakes should be conveyed widely
to the engineering team.
The second concerning thing is the efficiency of the service process regarding
the maintenance/repair service. To many customers, quick service is crucial, since they
do not like to wait for their car being repaired long in the lounge or go back and forth
between their house and the dealer. However, to a certain extent, it is supposed the
service speed is inversely associated with the quality that is considered to very important
service standard; for this reason, it is not easy to balance both sides of service. In order to
speed up the maintenance/repair process, the most sensible way is to review the current
flow chart of the service, analyzing specific relevant stages in terms of average timing,
tasks being performed. Afterwards, the dealers can try to simplify tasks at the stages that
they think it is possible to do more efficiently with computer supports, thereby reducing
the total service time.
The third issue is the record of customer’s car service history that is used to
keep track on customers‘ car statuses to remind them of upcoming routine maintenance
dates. To improve the tracking process, the study suggests personalizing customer‘s
profile. In other words, the current profile should include more specific data like main
purposes of the car usage, their regular driving conditions. More-detailed profiles help the
dealer staff forecast customers‘ next maintenance dates precisely, avoid them from
forgetting to call the customers. Information for the personalization process can be
obtained through either upgraded software or communication between dealer‘s customer
relation staff and the customers.

56
The ability to provide good advice for customers also needs improving. The
research suggests that the service advisor should first try to understand and express
sympathy for customers‘ requests instead of jumping into conclusions that it is
impossible to do. Afterwards, he needs to think of many possible solutions, discussing the
pros and cons of each of them to provide the best recommendation. Flexibility is the
second requirement for service advisors to help customer solve their service problems;
for this reason, to a certain extent, the dealers should empower their employees to make
their own decisions when they deal with customer‘s demands.
Overall, to monitor the customer satisfaction towards the dealers ‗service, the
study recommends integrating the following methods. The first thing to do is to increase
the flow of feedback by administering short service surveys periodically. Such surveys
need to be focused and updated through the accumulated customer complaints. Besides,
feedback can directly be collected by the dealer‘ staff, particularly the customer relation
team. Specifically, conducting deep interviews in the form of relaxing conversations at
the store or on the phone can make customers more open to share. However, to do so, the
employees need to be active and dynamic in approaching them and getting insights into
their thoughts as well.
In addition, it is fundamental for dealers to check customers‘ online comments
on forums of websites like otofun.net or otosaigon.com. Online webs are a common
means to share their complaints accurately. This is due to the facts that many customers
are afraid that their negative comments might make the dealer‘s staff not treat them well
subsequently, or some feel annoyed to be called if the employees know their personal
contacts though surveys.

57
5.3. Limitation
There are several limitations in the study. First, the sample that was collected
in the limited geographic area may not represent the targeted population completely.
Moreover, due to the limited sample, the research findings may not be valid enough to be
generalized in all cases. For this reason, if possible, future researches should cover the
North and Middle area in Vietnam. Finally, the lack of comparative investigations against
Honda's competitors is attributed to time and budget limit. In fact, this kind of study is
necessary to find out a new service trend, to benchmark Honda service against the best
manufacturers. Therefore, more competitors should be included in further studies instead
of one single automaker.

58
REFERENCES
Books and articles
1. Anderson, R.E., and Srinivasan, S.S. (2003). "E-Satisfaction and E-Loyalty: A
Contingency Framework". Psychology and Marketing, 20(2), 122–138.
2. Athaide G.A, Meyers P.W, Wilemon D.L. (1996) Seller-buyer interactions during the
commercialization of technological process innovations. Journal of Product
Innovation Management, Vol 13, No 5, p. 406-21.
3. Bitner & Zeithaml, M., 2000. Services Marketing, integrating customer focus across
the firm 2nd
edition. New York: Mc Graw Hill.
4. Bouman M, Van der Wiele T (1992). Measuring Service Quality in the Car Service
Industry: Building and Testing an Instrument. Inter. J. Service Industry Manag, 3(4):
4 -16.
5. Bowen, J. (1990). ‗Development of a Taxonomy of Services to Gain Strategic
Marketing Insights‘, Journal of the Academy of Marketing Science, 18, 1, 43-49
6. Cavana,R. Y., Delahaye, B.L. & Sekaran, U.(2001). Applied Business Research:
Qualitative and Quantitative Methods. Australia: John Wiley & Sons Ausralia. Ltd.
7. Chu, R., & Choi, T. (2000). An importance-performance analysis of hotel selection
factors in the Hong Kong hotel industry: a comparison of business and leisure
travelers. Tourism Management, 21, 363-377. Retrieved from
www.elsevier.com/locate/tourman
8. Cooper R.G, Kleinschmidt E.J. (1993) Major new products: what distinguishes the
winners in the chemical industry. Journal of Product Innovation Management, Vol 10,
No 2, p. 90-111.
9. Darby, M.R. and Karni, E. (1973). ―Free competition and the optimal amount of
fraud‖, Journal of Law and Economics, 16, 67-86
10. Ethington, B. (n.d.). Multicollinearity. Retrieved from
https://umdrive.memphis.edu/yxu/public/Multicollinearity.pdf.

59
11. Flees, L., &Senturia, T., (2008). It‘s the after-sales service, stupid. Business Week
Online 9/24/2008, 11–11.
12. Gaiardelli,P., Saccani,N., and Songini,L., (2007). Performance measurement of the
after-sales service network—Evidence from the automotive industry. Computers in
Industry, 58 698–708.
13. George, D., & Mallery, P. (2003). SPSS for Windows step by step: A simple guide
and reference. (4th ed.). Boston: Allyn & Bacon.
14. Goffin, K. and New, C., (2001), Customer support and new product development,
International Journal of Operations and Production Management, 21 (3), 275–301."
15. Jabnoun N., Al-Tamimi, H.A.H. (2003). Measuring Perceived Service Quality at
UAE Commercial Banks. International Journal of Quality & Reliability
Management, 20(4), 458-472.
16. Johnson, Michael D., Eugene W. Anderson, and Claes Fornell (1995),"Rational and
Adaptive Expectations in a Customer Satisfaction Framework," Journal of Consumer
Research, 21:4 (March), 695-707.
17. Juhola, J. (2011). Customer satisfaction in car maintenance service. Manuscript
submitted for publication, Satakunta University of Applied Sciences.
18. Kandampully J (1998). Service Quality to service loyalty: A relationship which goes
beyond customer services. Total Quality Management, 9(6): 431–443."
19. Katarne, R., & Sharma Truba College of Engineering and Technology, S. (2010, 1).
Measurement of service quality of an automobile service centre. International
conference on industrial engineering and operations management, Dhaka,
Bangladesh.
20. Katarne, R., Sharma, S., & Negi, J. (2010, 1).Measurement of service quality of an
automobile service centre. International conference on industrial engineering and
operations management, Dhaka, Bangladesh.
21. Kotler P. (1997). Marketing Management: Analysis, Planning, Implementation, and
Control. 9th ed., Prentice- Hall, New Jersey, USA"

60
22. Kotler P., Armstrong G., Saunders J. Wong V. (2002) Principle of Marketing, 3rd
edition, Pretence Hall, Europe.
23. Kotler, P. & Keller, K. L. (2009). Marketing management, 13th edition., Upper
Saddle River, New Jersey: Pearson Education Inc.
24. Kotler, P., & Clarke, R.N. (1987). Marketing for Health Care Organizations.
Englewood Cliffs, NJ: Prentice-Hall.
25. Lee, H., Lee, Y. & Yoo, D. (2000). The determinants of perceived service quality and
its relationship with satisfaction, Journal of Service Marketing, 14(3), 217-231.
26. Lele M.M. (1997) After-sales service – necessary evil or strategic opportunity?.
Bedford, Managing Service Quality, Vol.7, p. 141-145.
27. Levitt T. (1981). ―Marketing Intangible Products and Product Intangibles‖, Harvard
Business Review, 81, 94 - 102.
28. Loomba, A.P.S. (1998). Product distribution and service support strategy linkages: en
empirical investigation. International Journal of Physical Distribution & Logistics
Management, Vol. 28 No. 2, pp. 143-61.
29. Matsunaga, M. (2010). How to factor - analyze your data right: Do's, don'ts, and how-
to's. International Journal of Psychological Research, 3(1), 97-110.
30. Multiple regression. (n.d.). Retrieved from
facweb.cs.depaul.edu/sjost/csc423/documents/infl-collin.pdf.
31. Oliver, R.L. (1997). Satisfaction: A Behavioral Perspective on the Consumer. New
York, NY: McGraw-Hill.
32. Oliver, Richard, L. (1981). Measurement and Evaluation of Satisfaction Process in
Retail Setting. Journal of Retailing, 57, (Fall), 25-48
33. Pamsari, M., & Elham, M. (2013). Recognizing the effect of after sale services
operational characteristics on resale of products. World of Sciences Journal, 4(2307-
3071), 149-169.
34. Patelli L, Pelizzari M, Pistoni A, Saccani N. (2004). The after-sales service for
durable consumer goods. Methods for process analysis and empirical application to
61
industrial cases. 13th International Working Seminar on Production Economics, Vol
3, p. 289-299"
35. Pezzotta, G., Cavalieri, S., & Gaiardelli, P. (n.d.). A framework for an integrated
management of after sales service. Unpublished manuscript, Department of Industrial
Engineering, University of Bergamo, Italy.
36. Porter M.E. (1985). Competitive Advantage – Creating and Sustaining Superior
Performance. Weilin+Göös, Espoo, Finland.
37. Saravanan, R. & Rao, K. S. P. (2007). Measurement of service quality from the
customer‘s perspective – An empirical study, Total Quality Management, 18(4)
p.435-449.
38. Schiffman, L. G. and Tabachnick, Barbara G., and Linda S. Fidell. 2007. Using
Multivariate Statistics. 5th ed. Upper Saddle River, NJ: Pearson Allyn & Bacon.
39. Vitasek, K. (2005), Supply Chain & Logistics Terms and Glossary, Supply
ChainVision,Belevue,WA.
40. Wilson A., Zeithaml V.A., Bitner M.J., Gremler D.D. (2008) Services Marketing,
McGraw-Hill Education
41. Wyckham R.G., Fitzroy P.T. and Mandry G.D. (1975). ―Marketing of Services - An
Evaluation of the Theory‖, European Journal of Marketing, 9, 1, 59 - 67.
42. Zeithaml V.A.(1981). ―How Consumer Evaluation Processes Differ between Goods
and Services‖, reprinted in Lovelock, C. (1991), Services Marketing, 2nd Edition,
Upper Saddle River, New Jersey: Prentice Hall.
43. Zeithaml VA, Bitner MJ (2003). Services‘ Marketing: Integrating customer focus
across the firm. International Edition, Boston: McGraw-Hill
Websites
1. Bích Diệp. (2014, 1 11). Người Việt đã tiêu thụ 110.520 xe ô tô trong năm 2013.
Retrieved from http://fica.vn/tien-va-hang/nguoi-viet-da-tieu-thu-110520-xe-o-to-
trong-nam-2013-7-8655.html

62
2. Ế cả năm, doanh nghiệp ô tô trong nước lo đóng cửa sớm. (2014, 1 3). Autopro.
Retrieved from http://autopro.com.vn/tin-tuc/e-ca-nam-doanh-nghiep-o-to-trong-
nuoc-lo-dong-cua-som-20140103044431883.chn
3. Phương Nhung. (2013, 9 3). Giá ô tô sẽ rẻ hơn nhiều.Người Lao Động. Retrieved
from http://nld.com.vn/kinh-te/gia-o-to-se-re-hon-nhieu-2013090309112151.htm
4. Press release vietnam customer service index (csi) study. Retrieved from
http://businesscenter.jdpower.com
5. Retrieved from http://www.honda.com.vn/vn/gioi-thieu/lich-su/
6. Vietnam‘s automotive component industry: Ready to go global?* *. (2007). Retrieved
from http://pwc.blogs.com/files/vietnam.pdf.

63
APPENDICES
Questionnaire Hello, I am senior student at the International University, conducting a survey about the after-
sale service at Honda‘s dealers to fulfill my thesis. I am glad that you can spend around 5-10
minutes to fill out the questionnaire. The collected information is guaranteed to be kept
confidential and used for the research purpose only.
Section A: General information
1. Which model(s) that you are using? (you can choose more than one answer)
City
Civic
Accord
CR-V
Other brands:………(move to question 3)
2. From which sources do you get the updates of Honda‘s warranty/ maintenance programs?
(you can choose more than one answer)
Honda‘s website
Dealers‘ website
Online newspaper
Promotional materials at dealer
Dealer‘s personnel contacts me
Others: …………
Section B: Main question
3. The table below is the list of after-sale service statements,
a. In the question 3a, please give scores from 1 to 7 in the blank to express how
important each service item is to you (1= not at all important, 7= extremely
important)
1 7
Not at all
important
Extremely
important

64
b. In the question 3b, please rate your degree of agreement/ disagreement with the
dealer’s current performance of each service item.
1 2 3 4 5 6 7
Strongly
disagree Disagree
Somewhat
disagree Neutral
Somewhat
agree Agree
Strongly
agree
3a.
Importance
3b.
Service performance
Tangibles Points 1-7 1 2 3 4 5 6 7
Appearance of facilities is clean …………
Dealer infrastructure looks new …………
Spacious repairing workshop …………
Modern equipment for repair and maintenance …………
Well-groomed personnel …………
Comfortable waiting area …………
Modern entertainment devices …………
Attractive in-store ad materials …………
Reliability Points 1-7 1 2 3 4 5 6 7
Appointments are kept …………
My requests are fulfilled thoroughly …………
Car is ready at the promised time …………
Error-free repaired car …………
Clear explanation of charges …………
Responsiveness Points 1-7 1 2 3 4 5 6 7
I receive prompt attention on arrival …………
Quick service process …………
Detailed explanation of work to be performed …………
I get updated on my car's status …………
Assurance Points 1-7 1 2 3 4 5 6 7
Trustworthy service advisor …………
Skillful technician …………
Courteous personnel …………
The service advisor gives me good advice on
maintenance/ repair service …………

65
Empathy Points 1-7 1 2 3 4 5 6 7
Convenient operating hours …………
Customers can deliver their car outside the
operating hours …………
Personnel greets me in a friendly way upon
arrival …………
My requests are respected …………
Service advisor knows my car‘s service
history …………
Personnel contacts me after the service
completion to know if I am satisfied …………
4. Please use the scale below to rate your degree of agreement with the below statements
1 2 3 4 5 6 7
Strongly
disagree Disagree
Somewhat
disagree Neutral
Somewhat
agree Agree
Strongly
agree
1 2 3 4 5 6 7
I feel pleasant with the service quality at this dealer
I feel my expectations of the after-sale service are met
I am very satisfied with the service experience at this dealer
I will revisit the same dealer in the future
I will recommend the dealer to others
Section C: Demographics
Gender Employment status Year of birth
Male Self-employed
……………. Female Employed for wages
Housewife
Retired
THANK YOU FOR YOUR COOPERATION!
66
Bảng câu hỏi Xin chào, tôi hiện đang là sinh viên năm cuối của trường Đại học Quốc Tế vả đang tiến hành
một cuộc khảo sát về dịch vụ hậu mãi tại các đại lý của Honda để hoàn thành luận án. Tôi
mong anh/ chị có thể dành khoảng 5-10 phút giúp tôi trả lời bảng câu hỏi. Thông tin thu thập
đảm bảo được giữ bí mật và chỉ sử dụng cho mục đích nghiên cứu
Phần A: Thông tin chung
1. Anh/ chị đang sử dùng mẫu xe nào? (Có thể chọn nhiều câu trả lời)
City
Civic
Accord
CR-V
Hãng xe khác: ………….. (Trả lời tiếp câu 3)
2. Anh/ chị thường biết những thông tin cập nhật về bảo hành/ bảo dưỡng của Honda ở đâu?
(Có thể chọn nhiều câu trả lời)
Website chính thức của Honda
Website của đại lý Honda
Trang báo trực tuyến
Tài liệu quảng cáo đặt tại đại lý Honda
Người của đại lý gọi
Nguồn khác: ………….
Phần B: Câu hỏi chính
3. Bảng câu hỏi bên dưới bao gồm các yếu tố của dịch vụ hậu mãi,
Thang điểm 1-7 thể hiện mức độ quan trọng dùng cho cột 3a trong bảng câu hỏi bên
dưới
1 2 3 4 5 6 7
Hòan tòan
không quan
trọng
Cực kì quan
trọng

67
Thang điểm dùng cho cột 3b trong bảng câu hỏi bên dưới
1 2 3 4 5 6 7
Hoàn
toàn
không
đồng ý
Không
đồng ý
Hơi
không
đồng ý
Bình
thường
Hơi đồng
ý Đồng ý
Hoàn
toàn đồng
ý
3a. Vui lòng cho
biết tầm quan
trọng của
từng yếu tố
dịch vụ sau
đây đối với
anh/chị như
thế nào?
3b. Vui lòng thể hiện mức độ
đồng ý/không đồng ý về khả
năng thực hiện hiện tại
từng yếu tố dịch vụ của đại
lý này
Vật chất Cho điểm 17 1 2 3 4 5 6 7
Cơ sở vật chất sạch sẽ …………
Cơ sở hạ tầng nhìn mới …………
Khu vực sửa chữa rộng rãi …………
Trang thiết bị sửa chữa bảo dưỡng hiện đại …………
Nhân viên ăn mặc chỉnh tề …………
Khu vực chờ thoải mái …………
Trang thiết bị giải trí (TV, wifi,etc. ) hiện đại …………
Tài liệu quảng cáo trong cửa hàng nhìn thu
hút …………
Độ tin cậy Cho điểm 17 1 2 3 4 5 6 7
Cuộc hẹn của tôi được ghi nhớ …………
Yêu cầu của tôi được đáp ứng hoàn toàn …………
Xe sẵn sàng được giao vào thời gian đã hứa …………
Xe sau khi sửa chữa không có lỗi …………
Chi phí dich vụ được giải thích rõ ràng …………
Khả năng đáp ứng Cho điểm 17 1 2 3 4 5 6 7

68
Tôi được chú ý và tiếp đón ngay khi đến …………
Quá trình dịch vụ nhanh chóng …………
Nhân viên giải thích chi tiết công việc được
thực hiện …………
Tôi nhận được cập nhật về tình trạng xe của
mình …………
Sự đảm bảo Cho điểm 17 1 2 3 4 5 6 7
Cố vấn dịch vụ đáng tin cậy …………
Nhân viên kĩ thuật lành nghề …………
Nhân viên đại lý lịch sự …………
Cố vấn dịch vụ cho tôi lời khuyên hữu ích về
dịch vụ bảo dưỡng / sửa chữa …………
Sự cảm thông Cho điểm 17 1 2 3 4 5 6 7
Giờ làm việc của đại lý thuận tiện …………
Khách hàng có thể đem xe đến đại lý ngoài
giờ làm việc …………
Nhân viên chào đón một cách thân thiện …………
Yêu cầu của tôi được tôn trọng …………
Cố vấn dịch vụ biết lịch sử dịch vụ của xe tôi …………
Nhân viên đại lý liên hệ với tôi để biết liệu
tôi có hài lòng về chất lượng dịch vụ không …………
4. Vui lòng sử dụng thang đo sau để thể hiện mức độ đồng ý của anh chị đối với các câu
sau:
1 2 3 4 5 6 7
Hoàn toàn
không
đồng ý
Không
đồng ý
Hơi
không
đồng ý
Bình
thường
Hơi đồng
ý Đồng ý
Hoàn toàn
đồng ý
1 2 3 4 5 6 7
Tôi thấy hài lòng với chất lượng dịch vụ tại đại lý này
Những mong muốn về dịch vụ hậu mãi của tôi được đáp ứng
Tôi thỏa mãn với trải nghiệm dịch vụ tại đại lý này
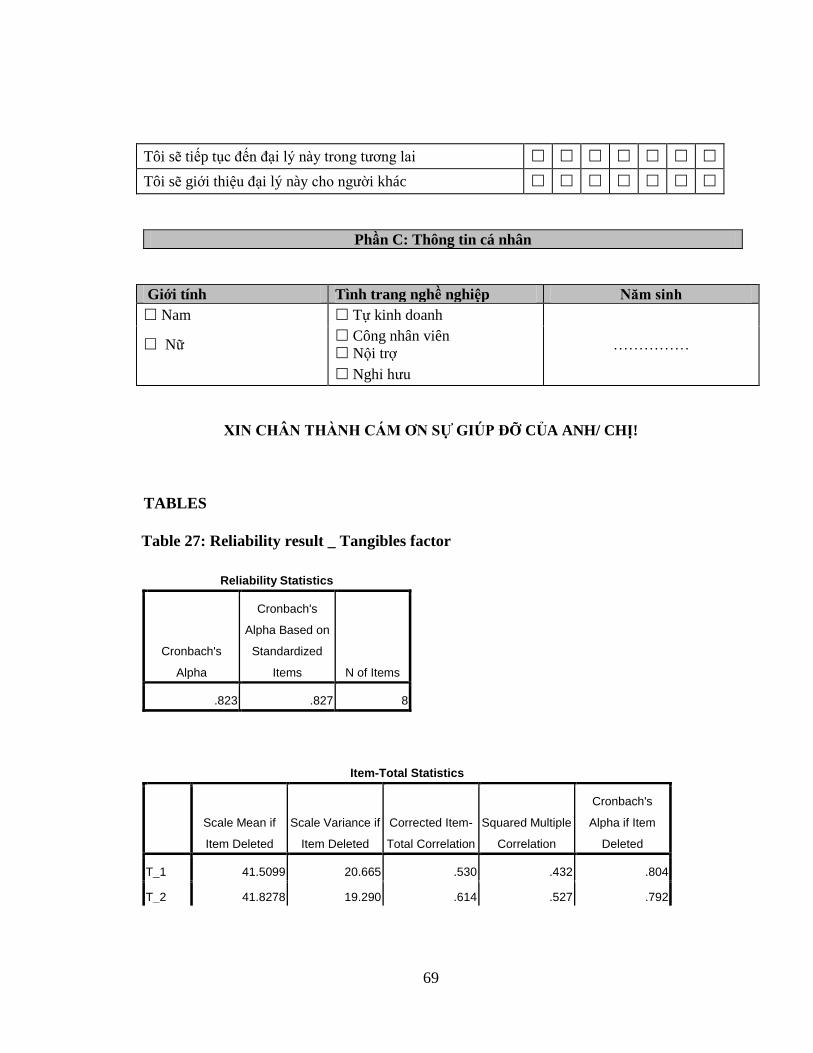
69
Table 27: Reliability result _ Tangibles factor
Tôi sẽ tiếp tục đến đại lý này trong tương lai
Tôi sẽ giới thiệu đại lý này cho người khác
Phần C: Thông tin cá nhân
Giới tính Tình trang nghề nghiệp Năm sinh
Nam Tự kinh doanh
…………… Nữ Công nhân viên
Nội trợ
Nghỉ hưu
XIN CHÂN THÀNH CÁM ƠN SỰ GIÚP ĐỠ CỦA ANH/ CHỊ!
TABLES
Reliability Statistics
Cronbach's
Alpha
Cronbach's
Alpha Based on
Standardized
Items N of Items
.823 .827 8
Item-Total Statistics
Scale Mean if
Item Deleted
Scale Variance if
Item Deleted
Corrected Item-
Total Correlation
Squared Multiple
Correlation
Cronbach's
Alpha if Item
Deleted
T_1 41.5099 20.665 .530 .432 .804
T_2 41.8278 19.290 .614 .527 .792

70
Table 28: Reliability result _ Reliability factor
T_3 41.8013 19.374 .661 .511 .786
T_4 41.8808 21.039 .474 .286 .811
T_5 41.5629 20.741 .579 .398 .799
T_6 41.5364 20.744 .578 .430 .799
T_7 41.8212 20.548 .505 .365 .808
T_8 42.4371 19.914 .451 .292 .820
Item-Total Statistics
Scale Mean if
Item Deleted
Scale Variance if
Item Deleted
Corrected Item-
Total Correlation
Squared Multiple
Correlation
Cronbach's
Alpha if Item
Deleted
R_9 24.2715 10.412 .578 .462 .843
R_10 24.3709 9.742 .741 .578 .804
R_11 24.4570 9.383 .692 .556 .814
R_12 24.7020 8.877 .682 .581 .819
R_13 24.2649 9.716 .645 .431 .826
Reliability Statistics
Cronbach's
Alpha
Cronbach's
Alpha Based on
Standardized
Items N of Items
.852 .854 5

71
Table 29: Reliability result _ Responsiveness factor
Table 30: Reliability result _ Assurance factor
Reliability Statistics
Cronbach's
Alpha
Cronbach's
Alpha Based on
Standardized
Items N of Items
.808 .808 4
Item-Total Statistics
Scale Mean if
Item Deleted
Scale Variance if
Item Deleted
Corrected Item-
Total Correlation
Squared Multiple
Correlation
Cronbach's
Alpha if Item
Deleted
Rs_14 18.3444 5.134 .616 .395 .764
Rs_15 18.6689 4.743 .652 .439 .746
Rs_16 18.5166 4.705 .660 .438 .742
Rs_17 18.5166 5.091 .573 .340 .784
Reliability Statistics
Cronbach's
Alpha
Cronbach's
Alpha Based on
Standardized
Items N of Items
.854 .855 4

72
Table 31: Reliability result _ Empathy factor
Item-Total Statistics
Scale Mean if
Item Deleted
Scale Variance if
Item Deleted
Corrected Item-
Total Correlation
Squared Multiple
Correlation
Cronbach's
Alpha if Item
Deleted
As_18 18.1656 5.752 .707 .500 .809
As_19 18.3841 5.531 .725 .532 .801
As_20 17.9868 6.333 .683 .480 .821
As_21 18.1987 5.760 .675 .462 .823
Reliability Statistics
Cronbach's
Alpha
Cronbach's
Alpha Based on
Standardized
Items N of Items
.742 .772 6
Item-Total Statistics
Scale Mean if
Item Deleted
Scale Variance if
Item Deleted
Corrected Item-
Total Correlation
Squared Multiple
Correlation
Cronbach's
Alpha if Item
Deleted
E_22 29.7417 10.886 .573 .350 .679
E_23 30.8411 11.428 .259 .117 .797
E_24 29.5033 11.772 .586 .533 .686
E_25 29.6225 11.543 .568 .560 .686
E_26 29.8079 10.823 .575 .372 .678
E_27 29.6556 11.747 .474 .268 .708

73
Table 32: Reliability result _ Satisfaction factor
Reliability Statistics
Cronbach's
Alpha N of Items
.893 5
Item-Total Statistics
Scale Mean if
Item Deleted
Scale Variance if
Item Deleted
Corrected Item-
Total Correlation
Cronbach's
Alpha if Item
Deleted
S1 23.9205 12.567 .670 .885
S2 24.0927 11.951 .650 .889
S3 24.1060 10.709 .822 .850
S4 24.0331 10.899 .776 .861
S5 24.1126 10.327 .789 .859