VIETNAM NATIONAL UNIVERSITY – HO CHI MINH CITY INTERNATIONAL UNIVERSITY DEVELOPMENT OF A VERSATILE...
32
VIETNAM NATIONAL UNIVERSITY – HO CHI MINH CITY INTERNATIONAL UNIVERSITY DEVELOPMENT OF A VERSATILE AND COMPACT PAPER-BASED MICROFLUIDIC BIOSENSOR FOR DETECTION OF COPPER IN FOOD PRODUCTS A thesis submitted to The School of Biotechnology, International University in partial fulfillment of the requirements for the degree of B.S. in Biotechnology Student’s name: Nguyễn Lan Thảo - ID:BTIU09046 Supervisor: Dr. Nguyễn Thái Lộc June 2013
Transcript of VIETNAM NATIONAL UNIVERSITY – HO CHI MINH CITY INTERNATIONAL UNIVERSITY DEVELOPMENT OF A VERSATILE...
VIETNAM NATIONAL UNIVERSITY – HO CHI MINH CITY
INTERNATIONAL UNIVERSITY
DEVELOPMENT OF A VERSATILE AND
COMPACT PAPER-BASED MICROFLUIDIC
BIOSENSOR FOR DETECTION OF COPPER
IN FOOD PRODUCTS
A thesis submitted to
The School of Biotechnology, International University
in partial fulfillment of the requirements for the degree of
B.S. in Biotechnology
Student’s name: Nguyễn Lan Thảo - ID:BTIU09046
Supervisor: Dr. Nguyễn Thái Lộc
June 2013
Acknowledgement First of all, it is of great importance to deliver my thankfulness to Dr. Loc
T. Nguyen, who dedicated his generous time and sound knowledge to my
research as a mentor. Truthfully, it was my absolute honor to work with Dr.
Nguyen. Thanks to his insightful instruction, valuable experiences and
motivating encouragement, I became brave and confident enough to take on
plenty of challenges. Had it not been for his constant supports, I would not have
successfully accomplished this study.
Secondly, my sincere gratitude is expressed to Dr. Khoi T. Nguyen for
consulting me with suitable techniques and stimulating ideas to deal with
difficulties that arose during the study of unfamiliar subjects. That was his
inspiration which kept me persistent until the end.
Moreover, I owe my gratefulness to all the laboratory managers and
staffs, particularly MSc. Long H. Nguyen, MSc. Dao Q. T. Tran, MSc. Lieu B. T.
Truong and BSc. Anh L. Dang, who devoted themselves to ensure a well-
equipped and safe laboratory and did not even mind working overtime or at
weekend.
I also would like to take this opportunity to say special thanks to Ms. Han
B. Nguyen, Ms. Yen K. T. Dang and Mr. Trong Q. Luu for standing by me
throughout hardships, as well as cheering me up in various situations. Besides,
the supports from Mr. Thien H. Nguyen are much appreciated. His interesting
lessons enabled me to perform sophisticated image analysis as well as to turn
ideas into vivid figures, all of which contributed to the best presentation I have
ever made.
It would be incomplete not to thank you all – my colleagues in lab 101,
including Ms. Dung M. T. Nguyen, Mr. Dang D. Nguyen, Ms. Hien T. T. Nguyen,
Ms. Khanh K. T. Nguyen, Ms. My H. T. Nguyen, Ms. Oanh K. T. Nguyen, Ms. Vien
L. Ngo and Ms. Tram N. L. Nguyen for supporting and sharing with me no matter
in good times or in bad that made every moment priceless. Together they
created the most memorable semester.
Last but not least, it is my family who I want to convey the deepest
appreciation to. Thank my mom, Mrs. Lan T. Ta and my dad, Mr. Hy D. Nguyen
for giving me such a favorable environment that I could concentrate and do the
best in the study. Thank my brothers for their sweet treats and assistance in
delivering necessary research equipment. No matter what the situations are, my
family is always the greatest back-up that I can count on.

For this moment, my heart is filled with endless love and sympathy from
many other people that I cannot list here due to limited scope. To all of those, I
would love to personally say big thank you and promise to continuously improve
myself.

DEVELOPMENT OF A VERSATILE AND COMPACT
PAPER-BASED MICROFLUIDIC BIOSENSOR FOR
DETECTION OF COPPER IN FOOD PRODUCTS
Thao L. Nguyena, Loc T. Nguyen
a,*
a: School of Biotechnology, International University – Vietnam National University - HCMC
*: Corresponding author’s email address: [email protected]
1
Abstract
In this contribution, a versatile, inexpensive and compact paper-based microfluidic
biosensor was developed to detect heavy metals in food products. The underlying
principle was based on sensing of ammonia (NH3) released during urease-
catalyzed hydrolysis of urea. At the presence of heavy metals, the amount of NH3
produced diminished due to inhibition of urease enzyme. Therefore, the
concentration of target heavy metals could be indirectly determined from NH3,
qualitatively, semi-quantitatively or quantitatively. Hydrophobic barriers of
functional areas the sensor were fabricated by paraffin-dipping method. Urease
enzyme was physically immobilized onto the sensor and phenol red was used for
qualitative and semi-quantitative detection of heavy metal via image analysis. The
sensor was also integrated into an electrochemical system using simple screen-
printed electrodes. In the current study, Cu++ was used as a model heavy metal
for testing performance of the sensor. Qualitative results showed that a strong
contrast between safe and unsafe sample, which was critical for the practical
applicability of the sensor. Relationship between color intensity and Cu++
concentration was characterized by a R2 of 0.98 and the linear range covered Cu++
concentrations from 0.01 – 1 ppm. Detection limit was estimated to be 0.018 ppm
which was well below standard limit established by WHO and EC for Cu++.
Quantitative tests were still at beginning stage and were worth further
investigations. The findings from this study demonstrated that the proposed
paper-based biosensor could be a promising platform to develop low-cost test kits
for detection of heavy metals in foods.
Keywords: Paper-based biosensor, wax-dipping, screen-printing electrodes, SPEs,
colorimetric test, amperometric test.
2
1. Introduction
Heavy metals are ubiquitous pollutants and their presence in the
environment can be attributed to natural or human activities. Many heavy metals
are carcinogens and may be involved in several dangerous diseases (Hossain et
al., 2011). In general, heavy metals are not easily degraded and tend to
accumulate in soils and sediments (Dominguez-Renedo et al. 2013). Major sources
of soil contamination with heavy metals are wastewater irrigation, solid waste
disposal, sludge applications, vehicular exhaust and industrial activities (Khan et
al. 2008). Plants grown on contaminated soils may build up excessive content of
heavy metals and eventually have negative effects on food quality and safety.
Therefore, it is of critical importance to monitor the contamination of heavy metals
in food products. Currently, analytical methods for heavy metals usually rely on
inductively coupled plasma/atomic, emission spectrometry (ICP/AES), inductively
coupled plasma, mass spectrometry (ICPMS), atomic absorption spectroscopy
(AAS), or wet chemical methods such as titrimetry, gravimetry, colorimetric
assays, etc (Hossain et al., 2011). Despite their high sensitivity, selectivity,
reliability, and accuracy, these methods are time-consuming, require sophisticated
instrumentation, skilled personnel and complicated sample pretreatment
(Turdean, 2011). Inherent drawbacks of these assays restrict their use mainly in
centralized laboratory. Thus, inexpensive, easy-to-use and portable test kits which
can screen contamination of heavy metals for a large number of samples are highly
desirable. Recently, the emergence of paper-based microfluidic devices has
become important resources for low-cost diagnosis. The underlying principle of
these devices is to pattern hydrophilic hydrophobic micron-size capillary channels
on paper using various methods including wax-printing, ink-jet printing,
flexography printing, screen printing, etc. (Li et al. 2012). Paper has advantages
of being inexpensive, lightweight, available everywhere and compatible with
biological samples (Martinez et al. 2010). Paper-based devices can be easily
disposed after use, require very small volume of sample and reagents, capable of
analyzing multianalytes at the same time and easily mass produced (Nie et al.
2010). Several paper-based assays with diverse formats developed for health
care, environmental monitoring, food quality control and forensic science (Li et al.
2012).
Paper-based devices can be applied for either qualitative or quantitative
analysis. When coupled with appropriate detection methods, paper-based devices
can produce quantitative results with reasonable accuracy. Popular detection
methods such as colorimetric, electrochemical, electrochemiluminescence or
3
chemiluminescence were extensively reviewed by Li et al. (2012). Paper-based
microfluidic devices can also serve as an excellent platform for biosensor
development. Biosensors with exceptional performance such as high specificity
and sensitivity, rapid response, low cost, compact size and easy-to-use were
considered as important means in clinical, food and environmental monitoring
(Amine et al. 2006). One of the most widely used technique in monitoring
pollutants and toxic compounds is enzyme inhibition-based biosensing in which
concentrations of target compounds can be determined from the extent to which
the enzyme is inhibited, signifying by the product concentration. Popular enzymes
used as bio-recognition elements for detection of heavy metals are horseradish
peroxidase, urease, glucose oxidase, alcohol oxidase, glycerol 3-phosphate
oxidase, invertase and acetylcholinesterase (Amine et al, 2006).
For analysis of heavy metals, several paper-based test kits with significant
contribution in term of sensing methods, sensitivity, selectivity were developed for
mercury (Gu et al., 2011; Hossain et al. 2011; Torabi et al. 2011; Aragay et al.
2012), cadimium (Abe et al. 2011; Hossain et al. 2011; Marzo et al. 2013), copper
(Fang et al. 2010; Hossain et al. 2011), iron (Apilux et al., 2010), lead (Mazumdar
et al., 2010; Hossain et al. 2011), chromium (Hossain et al. 2011; Liu et al., 2012)
and gold (Apilux et al., 2010). Considering the end-use of paper-based devices as
low-cost diagnostic kits in developing countries, they should be able to perform
analyses at different levels of complexity. In certain situation, an inexpensive
qualitative test requiring no advanced analytical skills is sufficient to make sure
that heavy metals in foods, agricultural products or water sources are under a safe
limit. If more accurate results are expected, the same device can be integrated
into colorimetric, electrochemical or other detection systems to produce semi-
quantitative or quantitative results.
Some authors (Fang et al. 2010; Abe et al. 2011; Gu et al., 2011; Torabi
et al. 2011; Aragay et al., 2012; Liu et al. 2012; Marzo et al. 2013) propose
approaches using fluorescence or strip reader to obtain quantitative results
besides qualitative test. However, these methods still require large sample
volume, bulky and sometime complicated fabrication process. Recently, methods
such as wax printing, wax dipping appeared as alternative approaches for
producing inexpensive micron size devices. The fundamental principle of creating
a microfluidic device was to pattern hydrophilic channels bounded by hydrophobic
barriers. One of the simplest method was to use a printer to deposit patterns of
solid wax on the paper which was then heated to enable the wax to penetrate into
the entire thickness of paper, thus generating complete hydrophobic barrier. An
4
alternative approach was wax dipping which was first proposed by Songjaroen et
al (2011) which are capable of both qualitative tests by visually observing color
change or quantitative analysis using digital camera. In this method, a mould was
used to produce the hydrophobic areas. The whole assembly of the mould and
paper was quickly dipped and withdrawn from the melting wax. Wax deposited on
the uncovered parts, resulting in desired hydrophobic areas. Paraffin was used in
this study for its easy availability and low prices while having similar characteristics
as wax. The fact is that digital cameras and scanners are not as selective and
sensitive as conventional analytical instrumentation, nevertheless, highly selective
and sensitive detectors are still required for low analyte concentrations (Dungchai
et al. 2009). Electrochemistry-based method is attractive detection soucheme for
paper-based biosensors due to its compact size, low-cost, high sensitivity and
selectivity. Using this method, Apilux et al. (2010) successfully detected gold in
waste stream. Nonetheless, few studies have yet to develop paper-based
biosensors capable of multiple testing schemes for detection of heavy metals in
foods and food products.
In this contribution, our objectives were a) to design and fabricate a paper-
based biosensor using wax-printing technology; b) to apply the produced
biosensors for qualitative and semi-quantitative detection of heavy metals and c)
to integrate the biosensors with electrochemical analyzer.
2. Materials and methods
2.1 Chemicals and solution preparation
Urease (type III, EC 3.5.1.5, 33U/mg) from Canavalia ensiformis (Jack
bean) was purchased from Sigma Aldrich (USA). Carbon ink (C-200) and Ag/AgCl
inks (AGCL-375) were obtained from Hudson (USA).Tris-HCl (min 99.0%) was
from HiMedia Labs (Mumbai, India). Urea, phenol red, CuSO4, KCl, NaOH and HCl
were of analytical grade and used as provided. Filter papers (60x60cm) and white
pellet paraffin wax were sourced from local chemical stores.
Stock solutions of enzyme (1000U/mL), Cu++ (680 ppm) were prepared in
Tris-HCl buffer solution (50mM, pH 7.0). The enzyme stock solution was made on
a weekly basis and kept in refrigerator after use. Urea (0.1M) and KCl (0.1M)
mixture was prepared in distilled water.
5
2.2 Fabrication of paper-based microfluidic biosensor
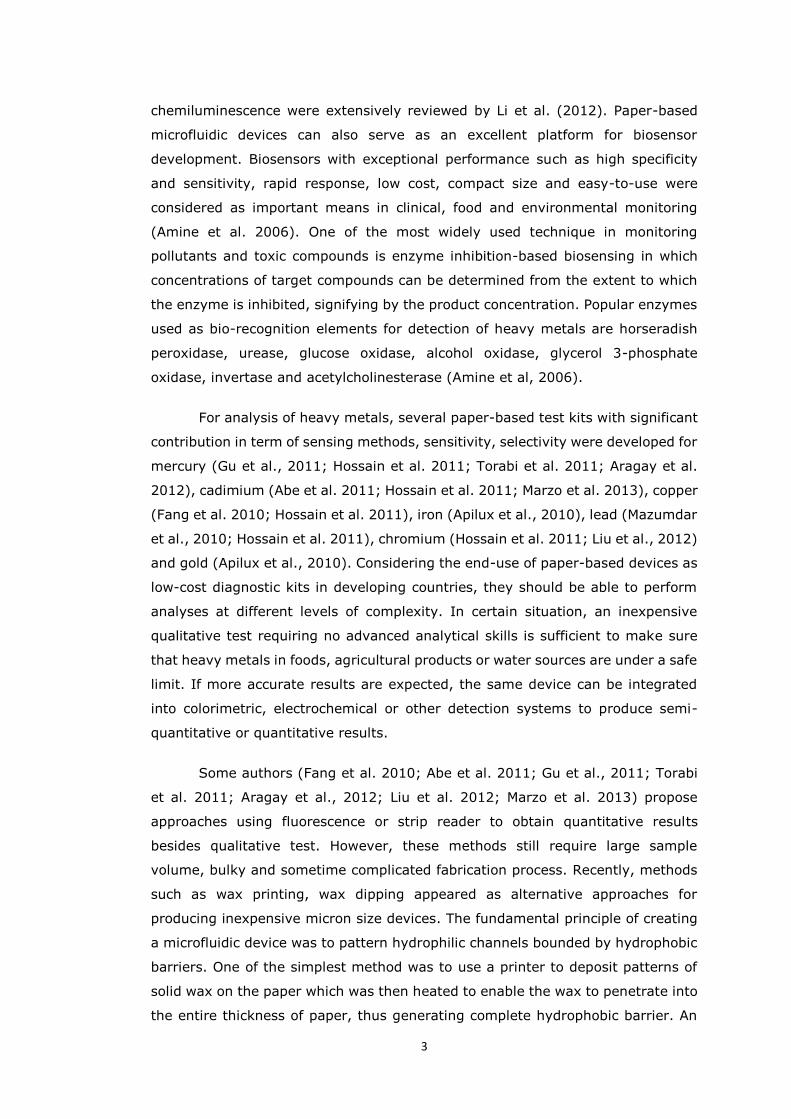
The design and dimensions of the sensor used in this study was illustrated
in Figure 1A. The sensor was developed to accommodate both colorimetric and
electrochemical tests simultaneously. The design was made using CorelDraw x3
(Corel Inc., Mountain View, USA). Initially, reference, working and counter
electrodes were patterned on reaction zone (Figure 1A) using screen printing
method. Carbon ink (C-200) was used for working and counter electrodes whereas
silver/silver chloride ink (AGCL-375) was used for reference electrode. The printed
electrodes sensor was dried at 65oC in oven for about 30 min. The printing patterns
of the electrodes were tested for continuity by a multimeter.
Figure 1. (A)Schematic design of the paper-based biosensor illustrating
sensing zones, loading area and conductive pads to interface electrochemical
system (B)Steel mould used to pattern hydrophilic-hydrophobic channels on
the sensor
In the next stage, the microfluidic channels were created. A mould (Figure
1B) was cut from a 0.3 mm steel plate using computer numerical control (CNC)
machine by a local workshop. The mould can be used many times without
deformation and decrease in resolution of the hydrophilic channels. About 200g
of paraffin was melted in a 500 ml beaker using hot plate (IKA RH Basic 2).
Experiment were conducted at different dipping temperature (55-80oC) and time
(1-5s) to determine the optimal conditions for patterning hydrophylic barrier. Prior
to wax dipping, the filter paper containing printed electrodes were cut into
rectangles (50 mm width x 80 mm length). And sensor was sandwiched between
6
the mould and a glass slide. The mould was positioned so that electrochemical
reaction zone was aligned with the printed electrodes. A permanent magnet was
used to hold the mould against the glass slide. The whole assembly was dipped
into the melted paraffin and quickly withdrawn in predetermined time. After the
paraffin was cooled to ambient temperature, the mould was removed and the
sensor was visually examined for any defections. The hydrophilic channels should
remain clear and sharp. The paraffin needed to penetrate evenly into the filter
paper. Those sensors which did not meet the requirements were discarded. The
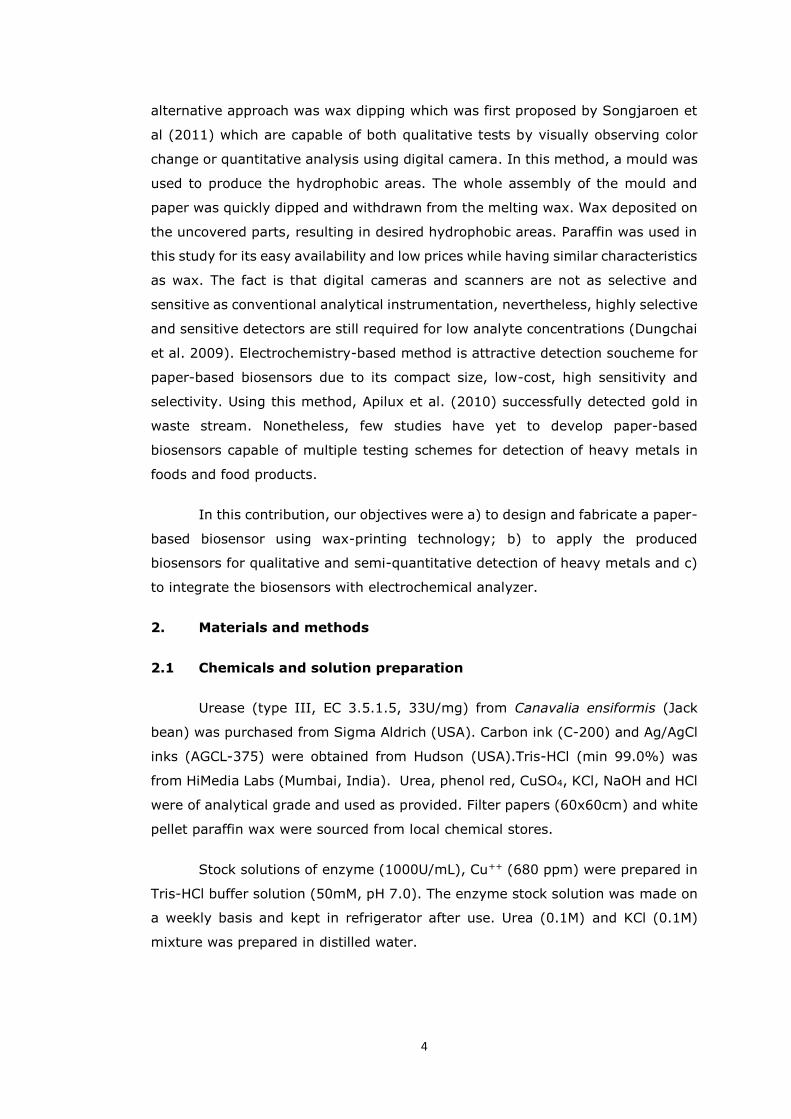
process was described in Figure 2
Figure 2. Fabricating procedures of paper-based biosensor includes: (1)
Screen-printing working electrode (WE) and counter electrode (CE) using
carbon inks, and (2) reference electrode (RE) and conductive pads with
Ag/AgCl inks .(3-4) The sensor was wax-dipped to create hydrophobic/hydrophilic pattern. (5) Tape was attached to the back side.
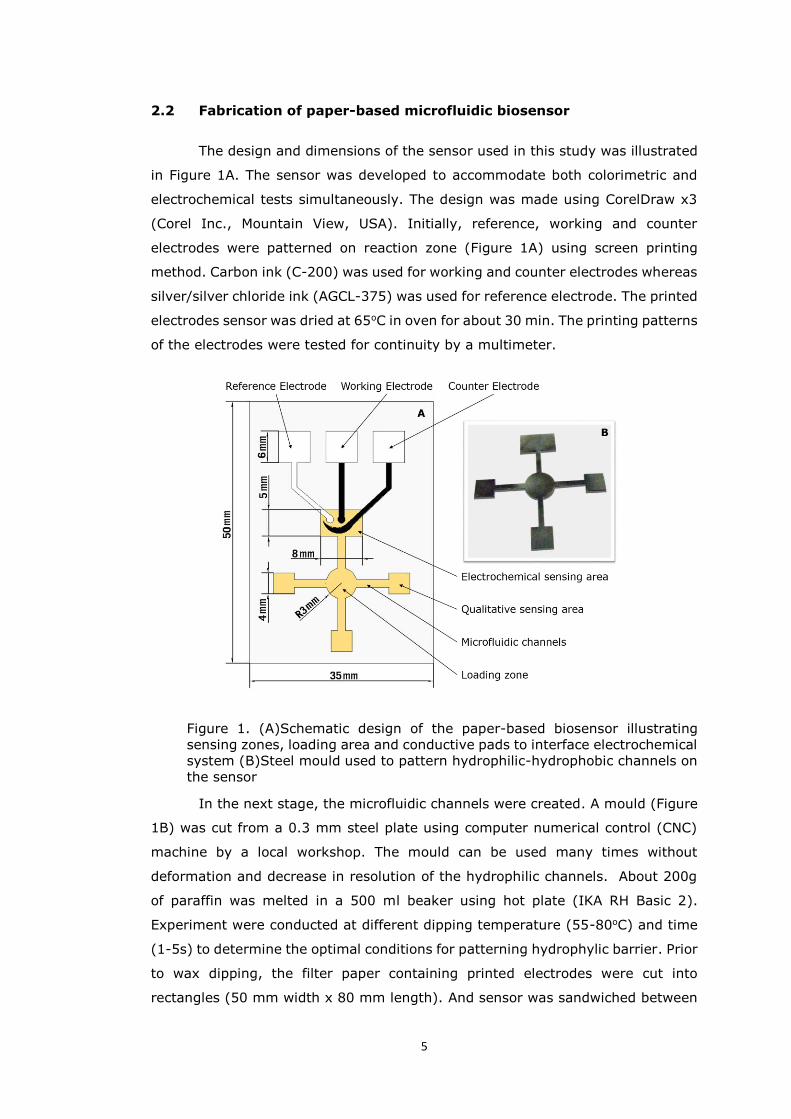
2.3 Qualitative and semi-quantitative analysis
The fundamental principle of the qualitative and semi-quantitative analysis
was based on hydrolysis reaction of urea ((NH2)2CO) (1).
32
Urease
222 NH2COOH CO)(NH (1)
The production of ammonia (NH3) led to an increase in pH of the solution,
hence change in color of phenol red. As heavy metals were added to the solution,
their binding to thiol group in the active center of urease diminished catalytic
activity of the enzyme. Since the amount of NH3 produced or pH was affected by
the heavy metals, concentrations of heavy metals can be determined from the
magnitude of color changes. For the proof of concept, the proposed biosensor was
7
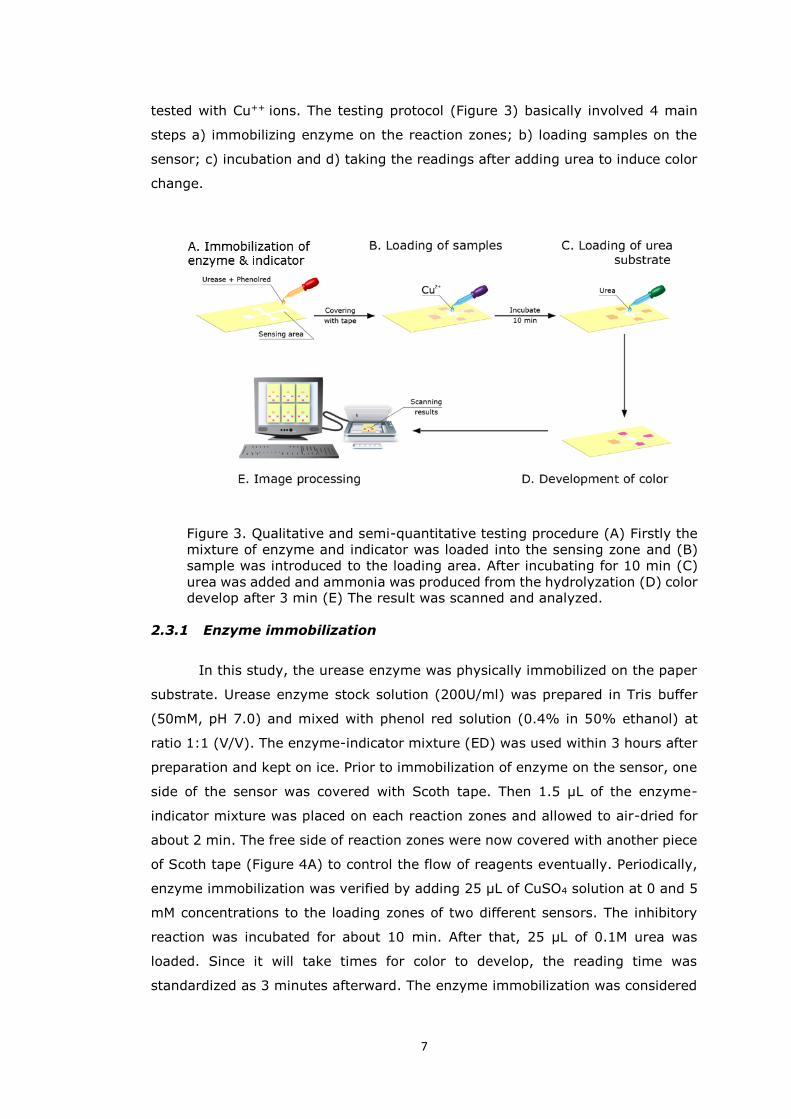
tested with Cu++ ions. The testing protocol (Figure 3) basically involved 4 main
steps a) immobilizing enzyme on the reaction zones; b) loading samples on the
sensor; c) incubation and d) taking the readings after adding urea to induce color
change.
Figure 3. Qualitative and semi-quantitative testing procedure (A) Firstly the
mixture of enzyme and indicator was loaded into the sensing zone and (B)
sample was introduced to the loading area. After incubating for 10 min (C)
urea was added and ammonia was produced from the hydrolyzation (D) color develop after 3 min (E) The result was scanned and analyzed.
2.3.1 Enzyme immobilization
In this study, the urease enzyme was physically immobilized on the paper
substrate. Urease enzyme stock solution (200U/ml) was prepared in Tris buffer
(50mM, pH 7.0) and mixed with phenol red solution (0.4% in 50% ethanol) at
ratio 1:1 (V/V). The enzyme-indicator mixture (ED) was used within 3 hours after
preparation and kept on ice. Prior to immobilization of enzyme on the sensor, one
side of the sensor was covered with Scoth tape. Then 1.5 µL of the enzyme-
indicator mixture was placed on each reaction zones and allowed to air-dried for
about 2 min. The free side of reaction zones were now covered with another piece
of Scoth tape (Figure 4A) to control the flow of reagents eventually. Periodically,
enzyme immobilization was verified by adding 25 µL of CuSO4 solution at 0 and 5
mM concentrations to the loading zones of two different sensors. The inhibitory
reaction was incubated for about 10 min. After that, 25 µL of 0.1M urea was
loaded. Since it will take times for color to develop, the reading time was
standardized as 3 minutes afterward. The enzyme immobilization was considered
8
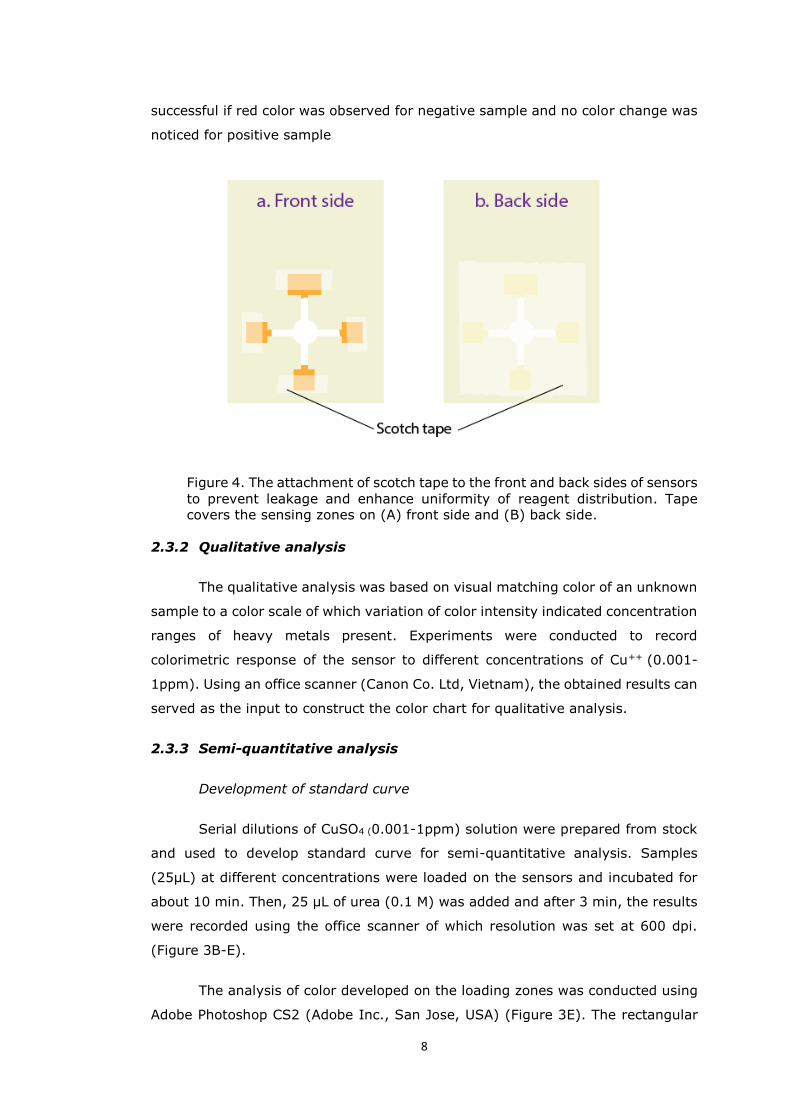
successful if red color was observed for negative sample and no color change was
noticed for positive sample
Figure 4. The attachment of scotch tape to the front and back sides of sensors
to prevent leakage and enhance uniformity of reagent distribution. Tape covers the sensing zones on (A) front side and (B) back side.
2.3.2 Qualitative analysis
The qualitative analysis was based on visual matching color of an unknown
sample to a color scale of which variation of color intensity indicated concentration
ranges of heavy metals present. Experiments were conducted to record
colorimetric response of the sensor to different concentrations of Cu++ (0.001-
1ppm). Using an office scanner (Canon Co. Ltd, Vietnam), the obtained results can
served as the input to construct the color chart for qualitative analysis.
2.3.3 Semi-quantitative analysis
Development of standard curve
Serial dilutions of CuSO4 (0.001-1ppm) solution were prepared from stock
and used to develop standard curve for semi-quantitative analysis. Samples
(25µL) at different concentrations were loaded on the sensors and incubated for
about 10 min. Then, 25 µL of urea (0.1 M) was added and after 3 min, the results
were recorded using the office scanner of which resolution was set at 600 dpi.
(Figure 3B-E).
The analysis of color developed on the loading zones was conducted using
Adobe Photoshop CS2 (Adobe Inc., San Jose, USA) (Figure 3E). The rectangular
9
selection was fixed to 1000 pixel as to cover reacting regions. As Histogram can
automatically filters out the desire single channel color, it was used to measure
the pink color directly from the RGB pictures. Giving that the Green color was the
major contributor to violet color, the Green channel value was measured.
The standard curve was constructed by plotting the color data against
concentrations of heavy metals used. All data points presented were the average
of 9 replications. The detection limits were calculated based on 3 times standard
deviations of the negative control.
Validation
To validate the results, an independent set of samples with known
concentrations were prepared and tested using the developed sensor. Colorimetric
signals were obtained as described in the previous section and the concentration
of heavy metals were estimated from the calibration curves. The recoveries
percentage was calculated as below (Eq.2):
100% )M,Cu oftration log(Concen Calculated
)M,Cu oftration log(Concen Actual = (%)Recovery
(Eq.2)
2.4 Electrochemical test
2.4.1 Experimental set-up
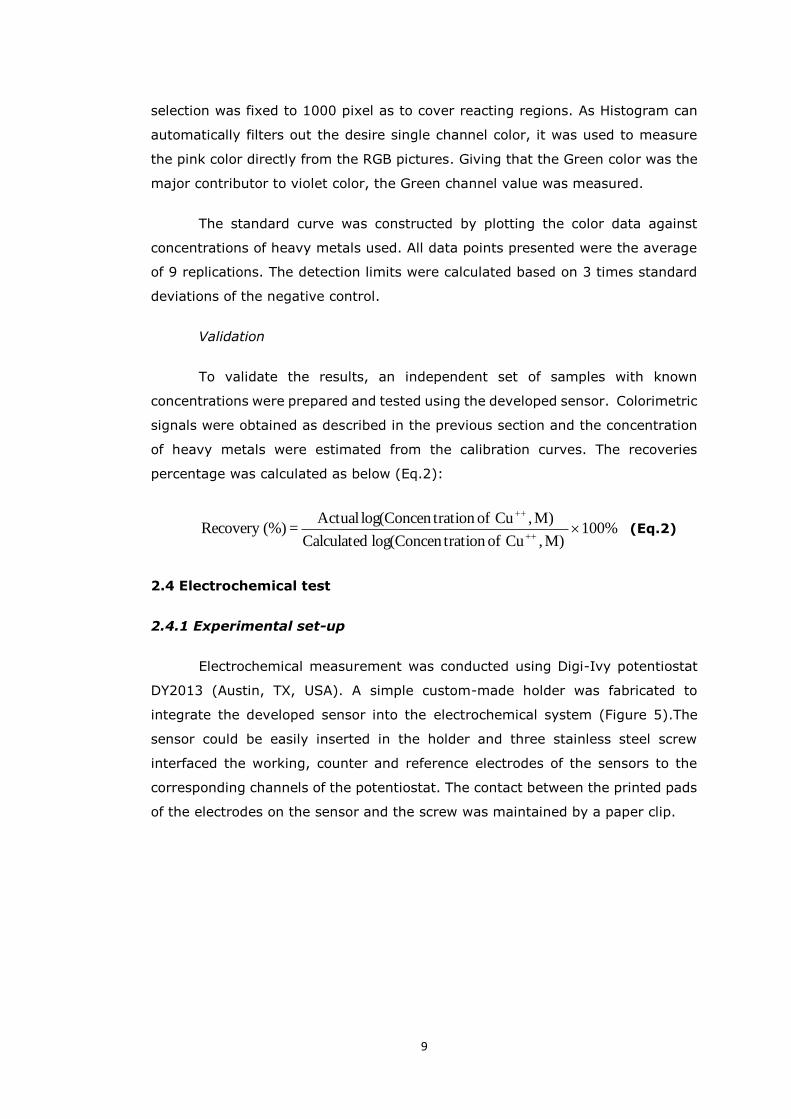
Electrochemical measurement was conducted using Digi-Ivy potentiostat
DY2013 (Austin, TX, USA). A simple custom-made holder was fabricated to
integrate the developed sensor into the electrochemical system (Figure 5).The
sensor could be easily inserted in the holder and three stainless steel screw
interfaced the working, counter and reference electrodes of the sensors to the
corresponding channels of the potentiostat. The contact between the printed pads
of the electrodes on the sensor and the screw was maintained by a paper clip.
10
Figure 5. Experimental set-up for electrochemical measurement.
2.4.2 Urease-based amperometric response of the sensor to different
concentrations of heavy metals.
After the sensor was placed in the holder, a fixed voltage (-1.5 V) was
applied and resulting current was measured for about 40 seconds . The current
intensity was dependent on the amount of NH3 produced in the reaction zone
during urea hydrolysis. Addition of heavy metals resulted in impaired catalytic
ability of urease, hence indirectly affecting the amount of NH3 formed. Therefore,
amperometric response of the sensor could reveal the amount of heavy metals
present in the samples. Percentage of current reduction was used to estimate the
contamination of heavy metals and was given by:
(%)reduction Current %100I
II
1
21
(Eq.3)
With I1, I2 were the measured electrochemical currents before and after
inhibition with Cu++, in µA.
To construct calibration curve, serial dilutions of Cu++ (0, 0.001, 0.01 and
0.1 ppm) were used. Correlation equation describing relationship between current
reduction and concentrations of Cu++ was obtained from regression analysis.
2.5 Data analysis
Each data point represents the average result of six replications. Using
descriptive analysis, the results were showed by mean values plus standard
deviation (SD). Next, the correlation between color intensity and Cu++
concentration was evaluated and the goodness of fit was considered using
coefficient of determination (R2). For comparison purpose, the variation between
measurements was evaluated using ANOVA and the Student t-test.

11
3. Result and discussion
3.1 Fabrication of the paper-based microfluidic sensor
Effects of dipping temperature and time
Patterns of paraffin on paper at different dipping temperatures were
presented in Figure 6.
Figure 6. Effect of different dipping temperatures on the resolution of
hydrophobic barrier with (a-f) corresponding to 55-80oC with 5oC increment.
The consistency and resolution of the channels were directly influenced by
melting temperature and dipping time. As evidenced from the photos, the optimal
temperature ranges were from 70-75oC. Under these conditions, hydrophobic-
hydrophilic boundaries were well-defined and the width of the channels was most
consistent. Lower temperatures led to the excessive build-up of paraffin on the
paper surface. When temperature of paraffin was greater than 75oC, melting
paraffin tended to diffuse under the mold and, consequently, damage the
channels, reaction zones and loading area. Quick observations during the
fabrication process revealed that dipping time should be limited within 1 second.
Longer exposure time would result in accumulation of paraffin on the surface,
hence affecting the final finish of the sensor. In a different study (Songjaroen et
al. 2011), white beeswax pellets required significantly higher temperature of
125oC to achieve the optimal patterns. However, dipping time was also
recommended to be no longer than 1 s to prevent the excessive spreading of wax
into the paper. In this study, paraffin was selected to create hydrophobic barriers
of the microfluidic channels. The cost of this material was lower than wax and it
could produce a smooth surface after setting. However, the barriers made by
paraffin were not as stable as expected. As illustrated from Figure 7, after a few
times of exposure to testing reagents, paraffin boundaries weakened and diffusion
of solutions through the hydrophobic barriers was noticed.

12
Figure 7. Leakage of reagent due to weakened of hydrophobic barrier after
testing. Comparison of (a) before and (b) after used sensor.
Further studies should investigate on the effects of potential factors such
as melting point, hydrophobic-hydrophilic balance of dipping agent etc. on the
quality of microfluidic channels. The information obtained would be valuable in
selecting appropriate materials for patterning the paper-based sensor.
Effects of fluid flow and evaporation
Performance of the paper-based microfluidic sensors was affected by the
flow and evaporation of the fluids. Due to capillary effects, fluids from loading area
diffused through channels and entered the reaction zones. It was found that,
moving fluid leached and transported the immobilized enzyme and indicators to
the borders of reaction zones. As a result, the variation of color intensity was less
visible for different samples (Figure 8) and this adversely affected the detection of
color change by naked eyes or by optical devices such as cameras or scanners.
Several studies (Martinez et al. 2007; 2008; Abe et al. 2008; Bruzewicz et al.
2008; Carrihlho et al. 2009; Fenton et al. 2009; Li et al. 2012) experienced the
same uneven distribution of color on paper-based microfluidic devices. Fluid
entering reaction zone from a channel spreads radially and carry coloring agents
and lower near the entry port. Visualization of fluid flow clearly confirmed the
patterns of color distribution (Kauffman et al. 2010). Abe et al. (2008) suggested
various solutions including using different geometrical arrangement and increasing
printing cycles of sensing inks. There was some improvement with pH and protein
but not glucose sensing. In this study, several geometrical arrangements,
including 3D patterns, were investigated and none yielded satisfactory results. The
effects of fluid flow on uniformity of color development worsened when the sensing
scheme required multiple loadings of samples and reagents. In the current
research, samples were loaded first and after incubation time, urea solution was
again added to loading area to impart final color change. The flows of sample and
urea solution severely washed off the indicator and it was hardly differentiate color
intensities of different samples.

13
Figure 8. Enhanced color stabilization and uniformity due to adhesive tape.
Comparison between sensor with sensing areas (a). uncovered and (b).
covered with tape
Another problem worth mentioning was dependency of color intensity on
evaporation of fluid in the sensing zone. If the sensor was exposed to open air,
the fluids quickly evaporated and color faded within 20 min. The lack of color
stability easily led to misjudgment of the results and left little time for image
capture and processing. To circumvent this problem, adhesive tape was first
covered on both sides of the sensor (Figure 4A). The adhesive tape was very
effective in preventing fluid evaporation, hence enhanced significantly color
stability. The developed color was observed to last for more than 3 to 4 hours.
However, this approach hindered the flow of fluids into reaction zone (possibly due
to build-up of pressure) and makes it difficult to load the samples and reagents.
In another attempt, one side of sensor was fully covered with adhesive tape and
on the other side, only sensing zones were covered, leaving a tiny gap near entry
port as “vent”. With this modification, there was no problem with fluid flow and
color development was very stable. It was also interesting to note that there was
initial radial spread of color to the edge of sensing zone but with increasing time,
coloring agents diffused from the edge to reaction zone and resulted in significantly
uniform color distribution. The findings could be very useful in fabricating paper-
based microfluidic devices with enhanced color stability and uniformity.
3.2 Qualitative test
The colorimetric test kits for heavy metals are applicable for qualitative
assay only if the contrast between safe and unsafe samples is adequately visible.
When exposed to Cu++ at different concentrations ranging from 0 to 10 ppm,
developed sensor revealed significant color change (Figure 9).
Figure 9. Development of color intensity with different concentrations of Cu++ with (a-f) equal 0, 0.001, 0.01, 0.1, 1 and 10 ppm Cu++ respectively.
14
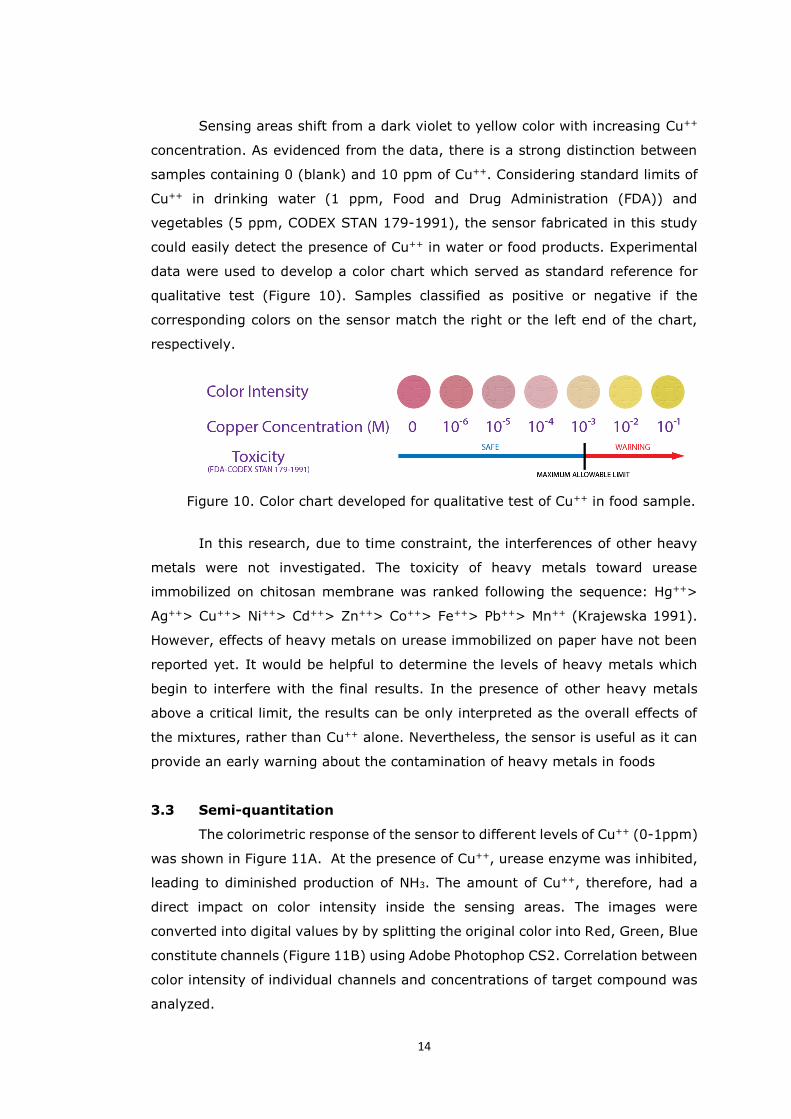
Sensing areas shift from a dark violet to yellow color with increasing Cu++
concentration. As evidenced from the data, there is a strong distinction between
samples containing 0 (blank) and 10 ppm of Cu++. Considering standard limits of
Cu++ in drinking water (1 ppm, Food and Drug Administration (FDA)) and
vegetables (5 ppm, CODEX STAN 179-1991), the sensor fabricated in this study
could easily detect the presence of Cu++ in water or food products. Experimental
data were used to develop a color chart which served as standard reference for
qualitative test (Figure 10). Samples classified as positive or negative if the
corresponding colors on the sensor match the right or the left end of the chart,
respectively.
Figure 10. Color chart developed for qualitative test of Cu++ in food sample.
In this research, due to time constraint, the interferences of other heavy
metals were not investigated. The toxicity of heavy metals toward urease
immobilized on chitosan membrane was ranked following the sequence: Hg++>
Ag++> Cu++> Ni++> Cd++> Zn++> Co++> Fe++> Pb++> Mn++ (Krajewska 1991).
However, effects of heavy metals on urease immobilized on paper have not been
reported yet. It would be helpful to determine the levels of heavy metals which
begin to interfere with the final results. In the presence of other heavy metals
above a critical limit, the results can be only interpreted as the overall effects of
the mixtures, rather than Cu++ alone. Nevertheless, the sensor is useful as it can
provide an early warning about the contamination of heavy metals in foods
3.3 Semi-quantitation
The colorimetric response of the sensor to different levels of Cu++ (0-1ppm)
was shown in Figure 11A. At the presence of Cu++, urease enzyme was inhibited,
leading to diminished production of NH3. The amount of Cu++, therefore, had a
direct impact on color intensity inside the sensing areas. The images were
converted into digital values by by splitting the original color into Red, Green, Blue
constitute channels (Figure 11B) using Adobe Photophop CS2. Correlation between
color intensity of individual channels and concentrations of target compound was
analyzed.
15
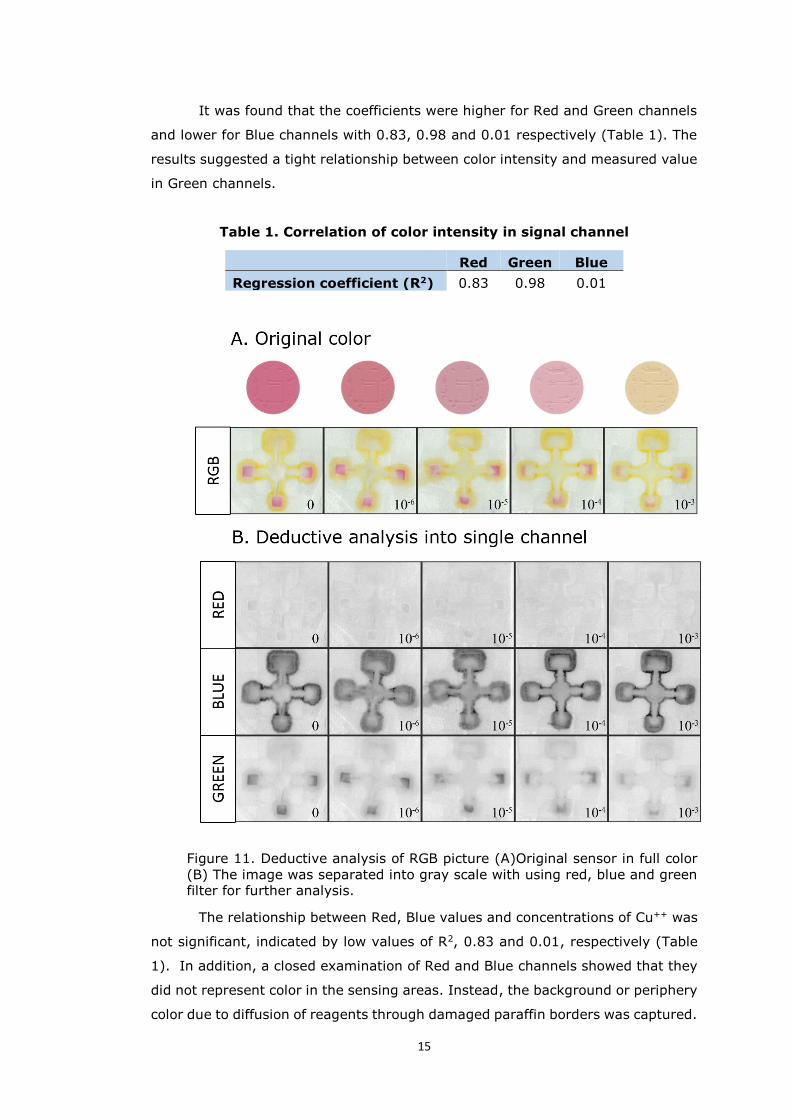
It was found that the coefficients were higher for Red and Green channels
and lower for Blue channels with 0.83, 0.98 and 0.01 respectively (Table 1). The
results suggested a tight relationship between color intensity and measured value
in Green channels.
Table 1. Correlation of color intensity in signal channel
Red Green Blue
Regression coefficient (R2) 0.83 0.98 0.01
Figure 11. Deductive analysis of RGB picture (A)Original sensor in full color
(B) The image was separated into gray scale with using red, blue and green filter for further analysis.
The relationship between Red, Blue values and concentrations of Cu++ was
not significant, indicated by low values of R2, 0.83 and 0.01, respectively (Table
1). In addition, a closed examination of Red and Blue channels showed that they
did not represent color in the sensing areas. Instead, the background or periphery
color due to diffusion of reagents through damaged paraffin borders was captured.
16
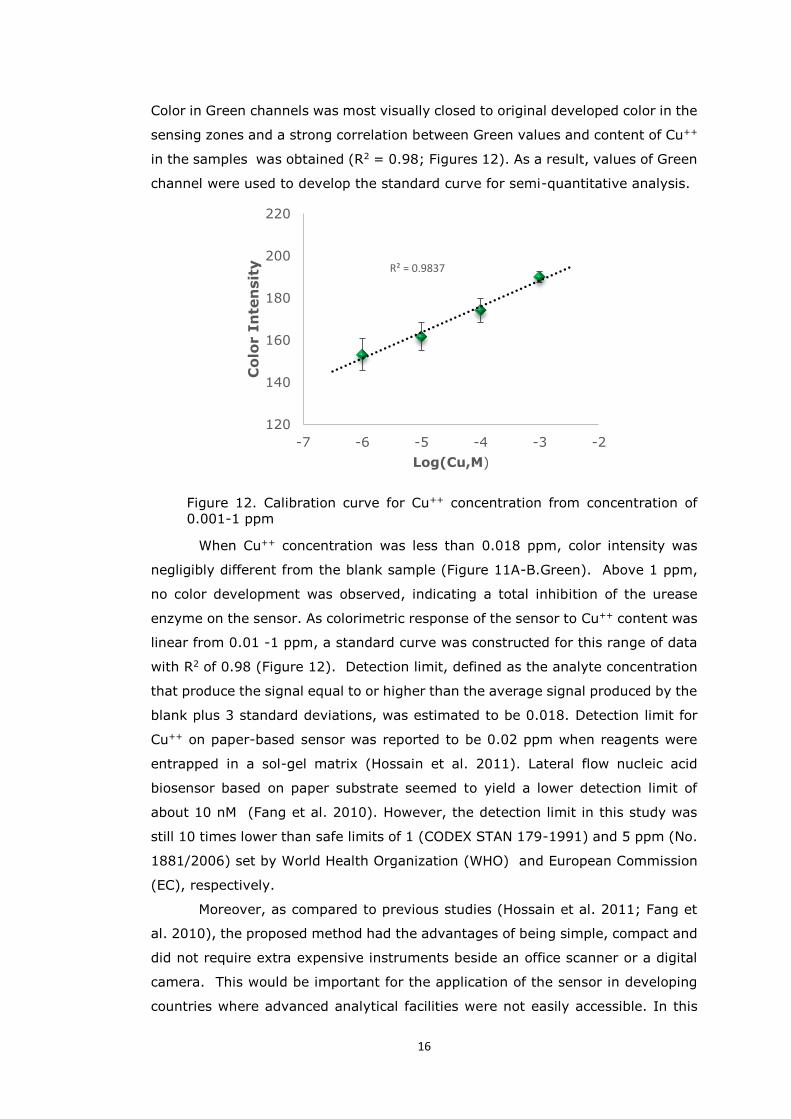
Color in Green channels was most visually closed to original developed color in the
sensing zones and a strong correlation between Green values and content of Cu++
in the samples was obtained (R2 = 0.98; Figures 12). As a result, values of Green
channel were used to develop the standard curve for semi-quantitative analysis.
Figure 12. Calibration curve for Cu++ concentration from concentration of 0.001-1 ppm
When Cu++ concentration was less than 0.018 ppm, color intensity was
negligibly different from the blank sample (Figure 11A-B.Green). Above 1 ppm,
no color development was observed, indicating a total inhibition of the urease
enzyme on the sensor. As colorimetric response of the sensor to Cu++ content was
linear from 0.01 -1 ppm, a standard curve was constructed for this range of data
with R2 of 0.98 (Figure 12). Detection limit, defined as the analyte concentration
that produce the signal equal to or higher than the average signal produced by the
blank plus 3 standard deviations, was estimated to be 0.018. Detection limit for
Cu++ on paper-based sensor was reported to be 0.02 ppm when reagents were
entrapped in a sol-gel matrix (Hossain et al. 2011). Lateral flow nucleic acid
biosensor based on paper substrate seemed to yield a lower detection limit of
about 10 nM (Fang et al. 2010). However, the detection limit in this study was
still 10 times lower than safe limits of 1 (CODEX STAN 179-1991) and 5 ppm (No.
1881/2006) set by World Health Organization (WHO) and European Commission
(EC), respectively.
Moreover, as compared to previous studies (Hossain et al. 2011; Fang et
al. 2010), the proposed method had the advantages of being simple, compact and
did not require extra expensive instruments beside an office scanner or a digital
camera. This would be important for the application of the sensor in developing
countries where advanced analytical facilities were not easily accessible. In this
R² = 0.9837
120
140
160
180
200
220
-7 -6 -5 -4 -3 -2
Colo
r I
nte
nsit
y
Log(Cu,M)
17
study, factors affecting detection limit of the developed sensor could be attributed
to immobilization of enzyme and hydrophobic barriers. Urease enzyme was
manually deposited on the paper and the immobilization was solely dependent on
physical absorption. Therefore, the distribution of enzyme on sensing zone owing
to spreading of the liquid droplets was not uniform. If reagents were dispensed
using a printer and the mobility of liquid phase was confined by a sol-gel matrix
as described by Hossain et al. (2011), the enzyme would be more uniformly
distributed and there would be enhancement in sensitivity and reproducibility of
the sensor. Moreover, effects from flows of fluid into the channels further had a
negative effect on the development of color in sensing zones. Regarding the
hydrophobic barriers, extended exposure of paraffin to testing reagents made the
borders more permeable to fluids. Consequently, hydrophobic barriers could not
confine the solutions inside sensing zone as expected. This could partly influence
the reproducibility of the test as enzymes and other reagents could have been
washed off the sensing zones. Within the limited time frame of the current study,
it was hardly possible to verify and address all the problems simultaneously.
Future studies should consider the use of a gel matrix for enzyme immobilization
and a different method for patterning hydrophobic barriers.
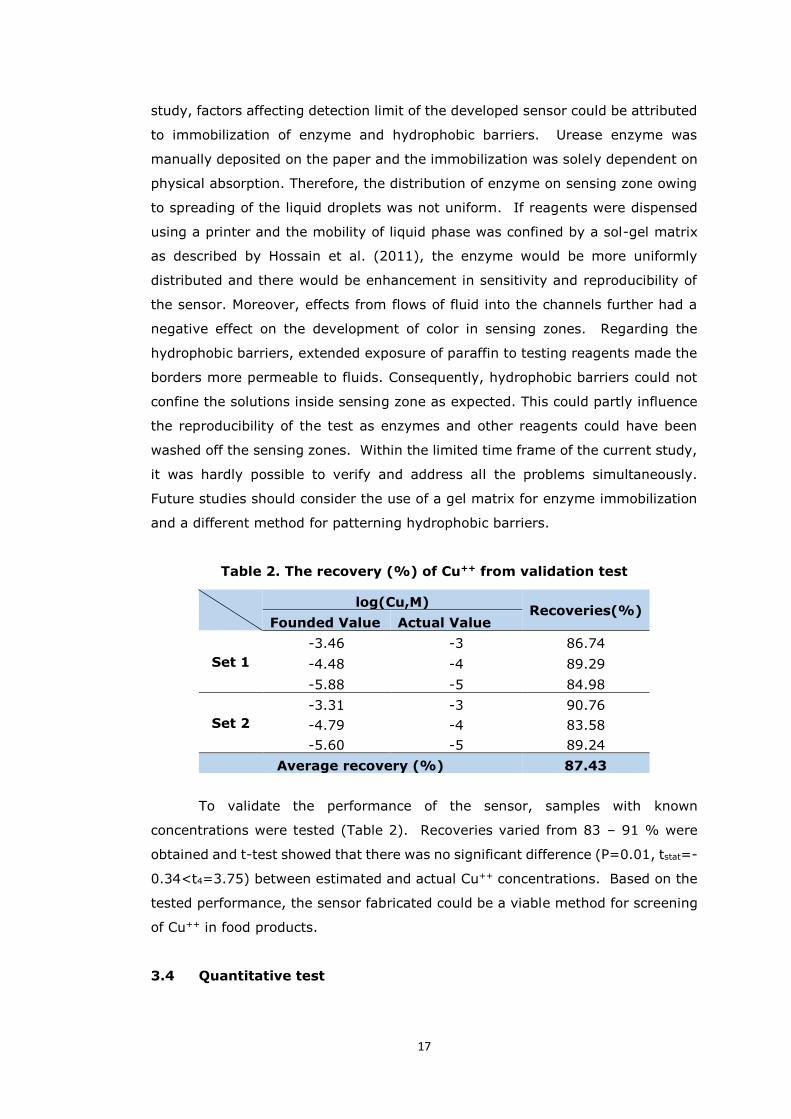
Table 2. The recovery (%) of Cu++ from validation test
log(Cu,M) Recoveries(%)
Founded Value Actual Value
Set 1
-3.46 -3 86.74
-4.48 -4 89.29
-5.88 -5 84.98
Set 2
-3.31 -3 90.76
-4.79 -4 83.58
-5.60 -5 89.24
Average recovery (%) 87.43
To validate the performance of the sensor, samples with known
concentrations were tested (Table 2). Recoveries varied from 83 – 91 % were
obtained and t-test showed that there was no significant difference (P=0.01, tstat=-
0.34<t4=3.75) between estimated and actual Cu++ concentrations. Based on the
tested performance, the sensor fabricated could be a viable method for screening
of Cu++ in food products.
3.4 Quantitative test
18
Colorimetric method was easy-to-use, inexpensive required no special
skills. However, image analysis was not as sensitive and selective as conventional
analytical instrumentation. Therefore, a quantitative scheme was implemented by
integrating the sensor into an electrochemical system (Digi Ivy 2013). Using
amperometric method, a constant potential was applied and resulting current was
recorded. With respect to the urea hydrolysis reaction (1), production of NH3
affected the ion balance of the solution and, consequently, the intensity of
measured electric current. Theoretically, the concentration of Cu++ was
proportional to degree of enzyme inhibition and indirectly to the amount of NH3
produced. The mechanism of the enzyme-inhibition reaction suggested that
electric current would have certain correlation to concentration of Cu++ in the
solution. Domínguez-Renedo et al. (2009) reported that the presence of heavy
metal induced inhibition of enzyme and subsequently led to decreased
amperometric signal. When samples containing various amounts of Cu++ (0.001 -
1ppm) were tested, interference was observed for Cu++ at 1ppm. The phenomena
was verified using cyclic voltammetry (data not shown) and it could be due to the
oxidation of Cu ion on the working electrode. As a result, solutions with lower Cu++
contents (0.001 – 0.1ppm) were used for electrochemical test. Preliminary
experiments demonstrated no clear relationship between measured current and
concentration of Cu++ using the fabricated sensor. Reproducibility of the
electrochemical test was then verified using the blank sample on different sensors
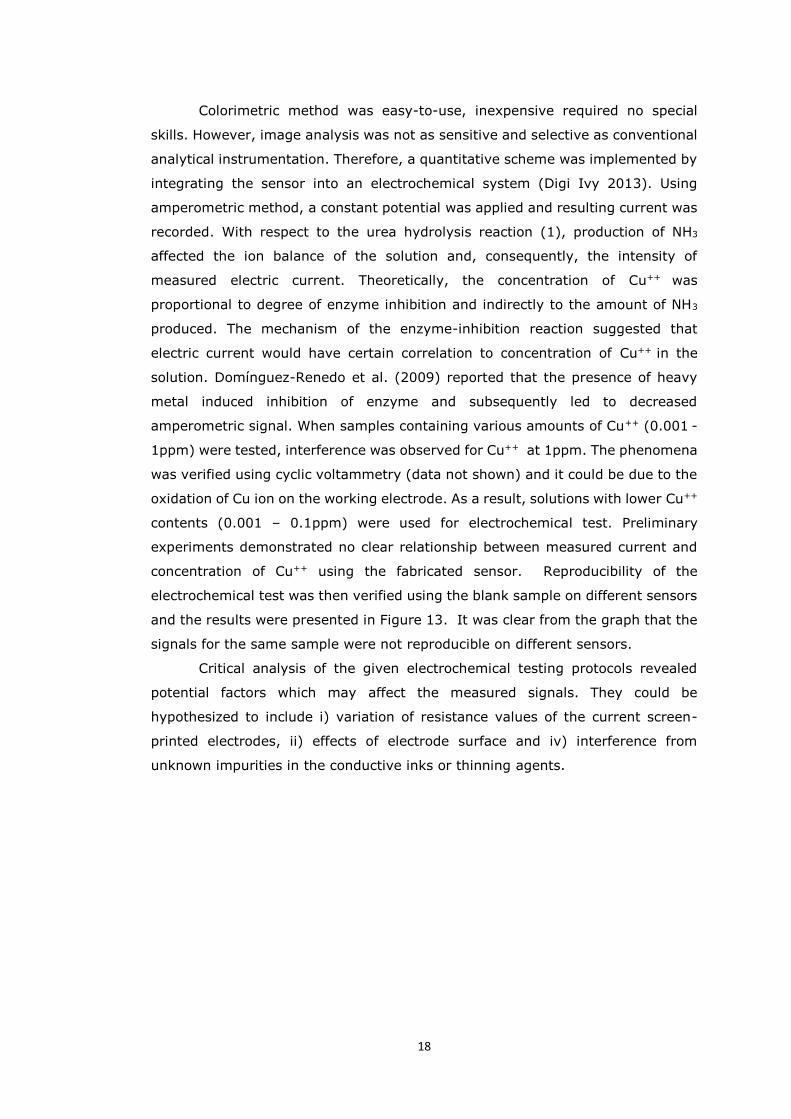
and the results were presented in Figure 13. It was clear from the graph that the
signals for the same sample were not reproducible on different sensors.
Critical analysis of the given electrochemical testing protocols revealed
potential factors which may affect the measured signals. They could be
hypothesized to include i) variation of resistance values of the current screen-
printed electrodes, ii) effects of electrode surface and iv) interference from
unknown impurities in the conductive inks or thinning agents.
19
Figure 13. Measured electrochemical signals using 4 different sensors in response to blank
A set of 32 sensors was first tested for values of resistance, from the
conductive pad to the tip of the electrode. Reference electrodes showed negligible
resistance value and were not different for the given sensors. However, working
and counter electrodes, made from carbon paste (Conductive Compounds
Company), were found to have significant variations in resistance values.
Resistances of working and counter electrodes had mean values of 315.94 ±
269.95 and 823.90 ± 540.80 ohms, respectively. Large standard deviations of
electrode resistances indicated large variations in quality of fabricated sensors
which could be one of the causes of poor reproducibility. To help eliminate the
differences of sensors, baseline corrections were conducted for individual sensors.
Electrochemical measurements were run for individual sensors using only buffer
solution and baseline was corrected based on blank sample (0 M Cu++) as follow:
Iii n
'
n (Eq.4)
nreference III (Eq.5)
where '
ni is the corrected current value of sample n, ni is the measured current
of sample n, referenceI is baseline current of blank sample and nI is base line current
of sample n.
-250
-200
-150
-100
-50
0
0 10 20 30 40
Cu
rren
t (µ
A)
Time (s)
S1
S2
S3
S4
20
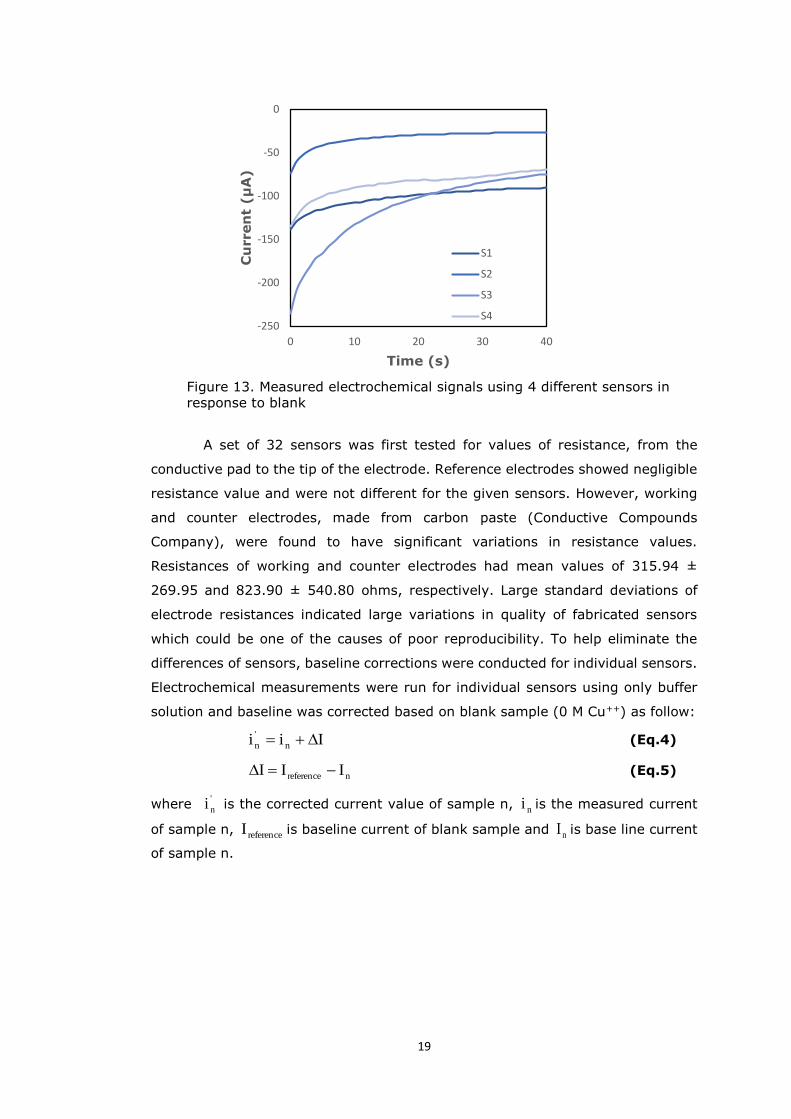
Figure 14 Measured electrochemical signals in response to concentration of Cu++ (0-0.1 ppm) after baseline corrected.
Figure 14 showed the results of a typical amperometric test after baseline
correction. After 40 s, the current recorded were -12.52, -10.96, -9.59 and -7.83
µA for samples at 0, 0.001, 0.01 and 0.1 ppm, respectively. The responses were
contradictory to results obtained by Domínguez-Renedo et al. (2009) regarding
relationship between current signal and concentrations of heavy metals. Moreover,
the trends also varied among different tests. Additional experiments were further
attempted to partly phase out the effects of electrode resistances, electrode
surfaces and contamination of impurities. Amperometric measurements were
conducted for samples at different concentrations on the same sensor.
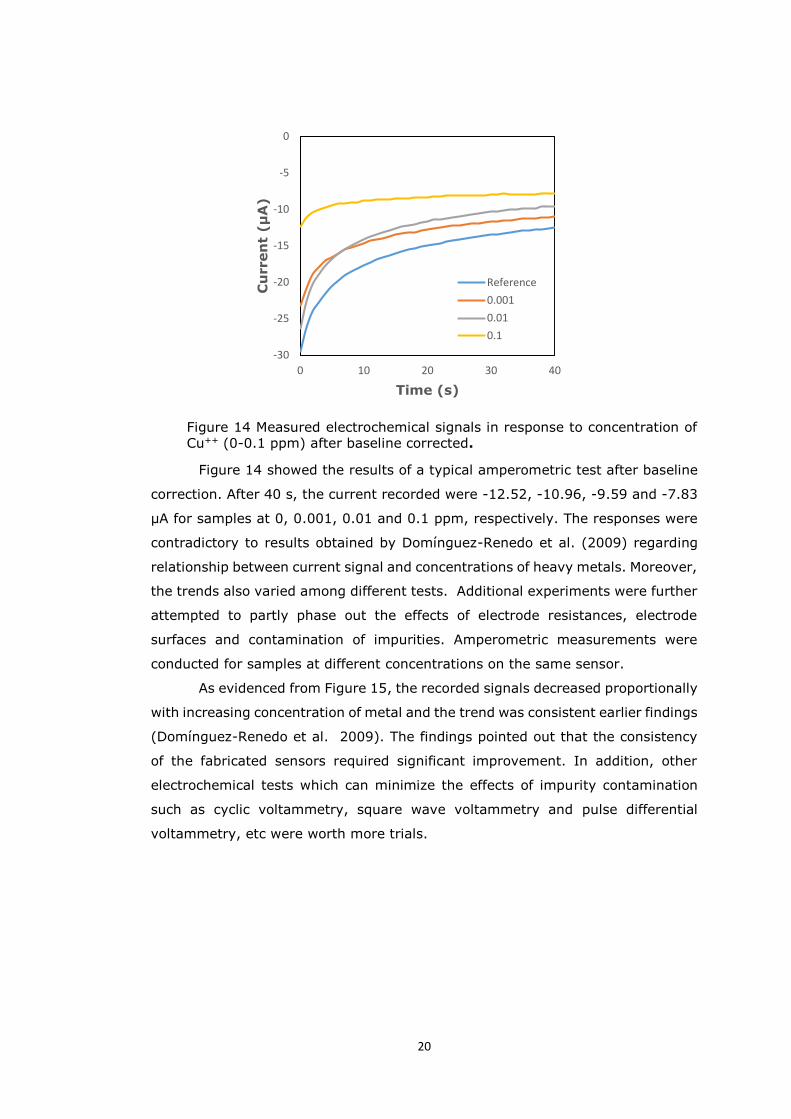
As evidenced from Figure 15, the recorded signals decreased proportionally
with increasing concentration of metal and the trend was consistent earlier findings
(Domínguez-Renedo et al. 2009). The findings pointed out that the consistency
of the fabricated sensors required significant improvement. In addition, other
electrochemical tests which can minimize the effects of impurity contamination
such as cyclic voltammetry, square wave voltammetry and pulse differential
voltammetry, etc were worth more trials.
-30
-25
-20
-15
-10
-5
0
0 10 20 30 40
Cu
rren
t (µ
A)
Time (s)
Reference
0.001
0.01
0.1
21
Figure 15. Current recorded from successive measurement of samples
containing different concentration of Cu++ (0-0.1ppm) on the same sensor
4. Recommended future studies
Within the time frame of the current research, not all problems could be
effectively addressed. To improve detection limit as well as electrochemical
analysis based of the existing sensor, it was recommended that the following
problems be investigated:
a. Utilization of sol-gel matrix to reduce the nonuniformity, leaching of
enzymes and other reagents. The approach was proposed by some authors
(Tsai et al. 2003; Hossain et al. 2011; Verma et al. 2010) and it seemed
that improved results were obtained.
b. Adoption of other electrochemical testing scheme such as bienzyme system
(Rodriguez et al. 2004), square wave voltametry, cyclic voltametry to
reduce the effects of sensor variations.
c. Trials with other electrode configurations to minimize the resistance
variation (Palchetti et al.2009 ,Crew et al.2011; Ge et al. 2012).
d. Considering the applicability of the device, stability of the sensor during
storage and its lifetime needs more researches.
e. Investigations are of essential as to explore the capacity of proposed
analytical sensor. For instance, the ability to detect more heavy metals are
of interest to disclosure. It was suggested by Krawczyk et al (2000) that
urease potentially inhibited by a wide range of metals
Hg++>Ag+>Cu++>Pb++>Cd++>Zn++>Ni++>Mn++ with sensitivity decreasing
accordingly.
-40
-35
-30
-25
-20
-15
-10
-5
0 10 20 30 40
Cu
rren
t (µ
A)
Time(s)
Reference
0.001
0.01
0.1
22
f. Replacing the key enzyme and establishing new signaling pathway, the use
of paper-based sensor could possibly be widen to other areas to detect also
pesticide, fungal toxins, bacteria or even DNA. (Hossain et al. 2009;
Luckham and Brannan. 2010; Crew. 2011; Ge et al. 2012)
5. Conclusion
In summary, this study had evidenced the applicability of a versatile paper-
based microfluidic biosensor for sensing heavy metals. Information on fabrication
protocols such as control of fluid flow, patterning hydrophobic barriers,
electrochemical analysis could be helpful for future studies on paper-based
biosensors. As compared to safe levels of Cu++ a significantly low detection limit
of 0.018 ppm was established and linear range from 0.01 – 1 ppm were obtained.
The performance of the sensor was further validated with samples at known
concentrations and recovery percentages were found to be from 83 to 91 %. The
current study was still unable to eliminate variations in characteristics of screen-
printed electrodes which could have been the causes of inconsistent trends in
electrochemical measurement. Nevertheless, the obtained results could provide
an important framework for continued research on paper-based biosensor for
detection of heavy metal.

Reference
Abe K., Nakamura K., Arao T., Sakurai Y., Nakano A., Suginuma C., Tawarada K., Sasaki K.
2011. Immunochromatography for the rapid determination of cadmium
concentrations in wheat grain and eggplant. Journal of the Science of Food and
Agriculture 91(8):1392-1397.
Abe K., Suzuki K., Citterio D. 2008. Inkjet-Printed Microfluidic Multianalyte Chemical
Sensing Paper. Analytical Chemistry 80(18):6928-6934.
Amine A., Mohammadi H., Bourais I., Palleschi G. 2006. Enzyme inhibition-based biosensors
for food safety and environmental monitoring. Biosens Bioelectron 21(8):1405-23.
Apilux A., Dungchai W., Siangproh W., Praphairaksit N., Henry C. S., Chailapakul O. 2010.
Lab-on-Paper with Dual Electrochemical/Colorimetric Detection for Simultaneous
Determination of Gold and Iron. Analytical Chemistry 82(5):1727-1732.
Aragay G., Monton H., Pons J., Font-Bardia M., Merkoci A. 2012. Rapid and highly sensitive
detection of mercury ions using a fluorescence-based paper test strip with an N-
alkylaminopyrazole ligand as a receptor. Journal of Materials Chemistry
22(13):5978-5983.
Bruzewicz D. A., Reches M., Whitesides G. M. 2008. Low-Cost Printing of
Poly(dimethylsiloxane) Barriers To Define Microchannels in Paper. Analytical
Chemistry 80(9):3387-3392.
Carrilho E., Martinez A. W., Whitesides G. M. 2009. Understanding Wax Printing: A Simple
Micropatterning Process for Paper-Based Microfluidics. Analytical Chemistry
81(16):7091-7095.
Crespilho F. N., Emilia Ghica M., Florescu M., Nart F. C., Oliveira Jr O. N., Brett C. M. A.
2006. A strategy for enzyme immobilization on layer-by-layer dendrimer–gold
nanoparticle electrocatalytic membrane incorporating redox mediator.
Electrochemistry Communications 8(10):1665-1670.
Crew A., Lonsdale D., Byrd N., Pittson R., Hart J. P. 2011. A screen-printed, amperometric
biosensor array incorporated into a novel automated system for the simultaneous
determination of organophosphate pesticides. Biosensors and Bioelectronics
26(6):2847-2851.
Di Risio S., Yan N. 2010. Adsorption and inactivation behavior of horseradish peroxidase on
various substrates. Colloids and Surfaces B: Biointerfaces 79(2):397-402.
Domínguez-Renedo O., Alonso-Lomillo M. A., Arcos-Martínez M. J. 2012. Determination of
Metals Based on Electrochemical Biosensors. Critical Reviews in Environmental
Science and Technology 43(10):1042-1073.
Domínguez-Renedo O., Alonso-Lomillo M. A., Ferreira-Gonçalves L., Arcos-Martínez M. J.
2009. Development of urease based amperometric biosensors for the inhibitive
determination of Hg (II). Talanta 79(5):1306-1310.
Dungchai W., Chailapakul O., Henry C. S. 2009. Electrochemical Detection for Paper-Based
Microfluidics. Analytical Chemistry 81(14):5821-5826.
El Kaoutit H., Estevez P., Garcia F. C., Serna F., Garcia J. M. 2013. Sub-ppm quantification
of Hg(ii) in aqueous media using both the naked eye and digital information from
pictures of a colorimetric sensory polymer membrane taken with the digital camera
of a conventional mobile phone. Analytical Methods 5(1):54-58.
Fang Z., Huang J., Lie P., Xiao Z., Ouyang C., Wu Q., Wu Y., Liu G., Zeng L. 2010. Lateral
flow nucleic acid biosensor for Cu2+ detection in aqueous solution with high
sensitivity and selectivity. Chemical Communications 46(47):9043-9045.
Fenton E. M., Mascarenas M. R., Lopez G. P., Sibbett S. S. 2009. Multiplex lateral-flow test
strips fabricated by two-dimensional shaping. ACS Appl Mater Interfaces 1(1):124-9.
Florescu M., Badea M., G. C., Marty J.-L., Mitrica M. 2009. Screen printed electrodes used
for detection of ionic heavy metals. Medical Sciences 2(51):49-54.
Ge L., Yan J., Song X., Yan M., Ge S., Yu J. 2012. Three-dimensional paper-based
electrochemiluminescence immunodevice for multiplexed measurement of
biomarkers and point-of-care testing. Biomaterials 33(4):1024-1031.
Gu Z., Zhao M., Sheng Y., Bentolila L. A., Tang Y. 2011. Detection of Mercury Ion by
Infrared Fluorescent Protein and Its Hydrogel-Based Paper Assay. Analytical
Chemistry 83(6):2324-2329.
Hossain S. M. Z., Brennan J. D. 2011. β-Galactosidase-Based Colorimetric Paper Sensor for
Determination of Heavy Metals. Analytical Chemistry 83(22):8772-8778.
Hossain S. M. Z., Luckham R. E., Smith A. M., Lebert J. M., Davies L. M., Pelton R. H., Filipe
C. D. M., Brennan J. D. 2009. Development of a Bioactive Paper Sensor for Detection
of Neurotoxins Using Piezoelectric Inkjet Printing of Sol−Gel-Derived Bioinks.
Analytical Chemistry 81(13):5474-5483.
Kauffman P., Fu E., Lutz B., Yager P. 2010. Visualization and measurement of flow in two-
dimensional paper networks. Lab on a Chip 10(19):2614-2617.
Khan M. S., Li X., Shen W., Garnier G. 2010. Thermal stability of bioactive enzymatic
papers. Colloids and Surfaces B: Biointerfaces 75(1):239-246.
Krajewska B. 1991. Urease immobilized on chitosan membrane. Inactivation by heavy metal
ions. Journal of Chemical Technology & Biotechnology 52(2):157-162.
Krawczyk T. K., Moszczyñska M., Trojanowicz M. 2000. Inhibitive determination of mercury
and other metal ions by potentiometric urea biosensor. Biosens Bioelectron
15(2000):681-691.
Lee A.-C., Liu G., Heng C.-K., Tan S.-N., Lim T.-M., Lin Y. 2008. Sensitive Electrochemical
Detection of Horseradish Peroxidase at Disposable Screen-Printed Carbon Electrode.
Electroanalysis 20(18):2040-2046.
Lei Ge J. Y., Xianrang Song, Mei Yan, Shenguang Ge, Jinghua Yu. 2011. Three-dimentional
paper-based electrochemiluminescence immunodevice for multiplexed measurement
of biomarkers and point-of-care testing. Elsevier:1024-1031.
Li X., Ballerini D. R., Shen W. 2012. A perspective on paper-based microfluidics: Current
status and future trends. Biomicrofluidics 6(1):011301-13.
Liu X., Xiang J.-J., Tang Y., Zhang X.-L., Fu Q.-Q., Zou J.-H., Lin Y. 2012. Colloidal gold
nanoparticle probe-based immunochromatographic assay for the rapid detection of
chromium ions in water and serum samples. Analytica Chimica Acta 745(0):99-105.
López Marzo A. M., Pons J., Blake D. A., Merkoçi A. 2013. All-Integrated and Highly
Sensitive Paper Based Device with Sample Treatment Platform for Cd2+
Immunodetection in Drinking/Tap Waters. Analytical Chemistry 85(7):3532-3538.
Luckham R. E., Brennan J. D. 2010. Bioactive paper dipstick sensors for
acetylcholinesterase inhibitors based on sol-gel/enzyme/gold nanoparticle
composites. Analyst 135(8):2028-2035.
Martinez A. W., Phillips S. T., Butte M. J., Whitesides G. M. 2007. Patterned Paper as a
Platform for Inexpensive, Low-Volume, Portable Bioassays. Angewandte Chemie
International Edition 46(8):1318-1320.
Martinez A. W., Phillips S. T., Whitesides G. M. 2008. Three-dimensional microfluidic devices
fabricated in layered paper and tape. Proceedings of the National Academy of
Sciences 105(50):19606-19611.
Martinez A. W., Phillips S. T., Whitesides G. M., Carrilho E. 2009. Diagnostics for the
Developing World: Microfluidic Paper-Based Analytical Devices. Analytical Chemistry
82(1):3-10.
Mazumdar D., Liu J., Lu G., Zhou J., Lu Y. 2010. Easy-to-use dipstick tests for detection of
lead in paints using non-cross-linked gold nanoparticle-DNAzyme conjugates.
Chemical Communications 46(9):1416-1418.
Metters J. P., Houssein S. M., Kampouris D. K., Banks C. E. 2013. Paper-based
electroanalytical sensing platforms. Analytical Methods 5(1):103-110.
Neelam Verma S. K., Hardeep K. 2010. Fiber Optic Biosensor for the Detection of Cd in Milk.
Journal of Biosensors & Bioelectronics 1(1):102.
Nie Z., Deiss F., Liu X., Akbulut O., Whitesides G. M. 2010. Integration of paper-based
microfluidic devices with commercial electrochemical readers. Lab on a Chip
10(22):3163-3169.
Ogończyk D., Tymecki Ł., Wyżkiewicz I., Koncki R., Głąb S. 2005. Screen-printed disposable
urease-based biosensors for inhibitive detection of heavy metal ions. Sensors and
Actuators B: Chemical 106(1):450-454.
Palchetti I., Laschi S., Mascini M. 2009. Electrochemical Biosensor Technology: Application
to Pesticide Detection. In: Rasooly A, Herold K, editors. Biosensors and Biodetection.
Humana Press. 504(8):115-126.
Pelton R. 2009. Bioactive paper provides a low-cost platform for diagnostics. TrAC Trends in
Analytical Chemistry 28(8):925-942.
Rodriguez B. B., Bolbot J. A., Tothill I. E. 2004. Development of urease and glutamic
dehydrogenase amperometric assay for heavy metals screening in polluted samples.
Biosens Bioelectron 19(10):1157-67.
Songjaroen T., Dungchai W., Chailapakul O., Laiwattanapaisal W. 2011. Novel, simple and
low-cost alternative method for fabrication of paper-based microfluidics by wax
dipping. Talanta 85(5):2587-2593.
Torabi S. F., Lu Y. 2011. Small-molecule diagnostics based on functional DNA
nanotechnology: a dipstick test for mercury. Faraday Discuss 149:125-35; discussion
137-57.
Tsai H.-C., Doong R.-A., Chiang H.-C., Chen K.-T. 2003. Sol–gel derived urease-based
optical biosensor for the rapid determination of heavy metals. Analytica Chimica Acta
481(1):75-84.
Turdean G. L. 2011. Design and Development of Biosensors for the Detection of Heavy
Metal Toxicity. International Journal of Electrochemistry 2011.