A prospective epidemiological study of gastrointestinal health effects due to the consumption of...
27
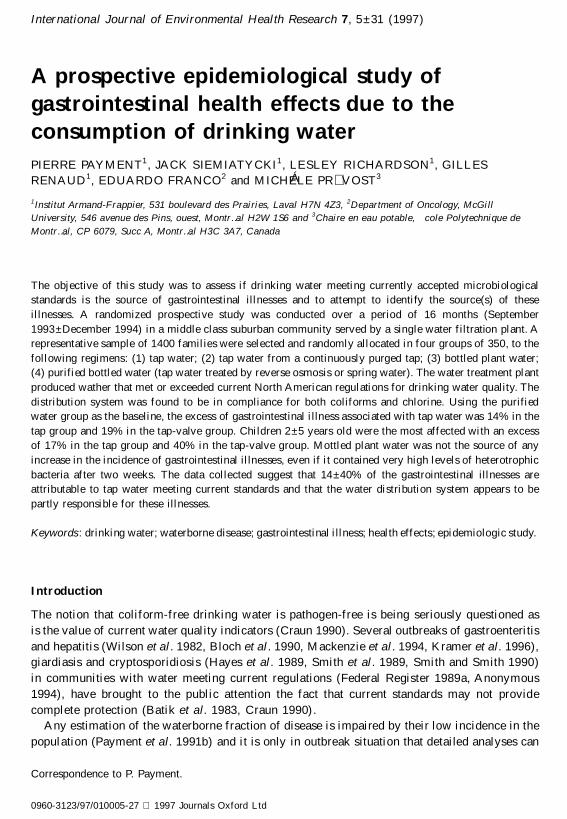
Correspondence to P. Payment. 0960-3123/97/010005-27 1997 Journals Oxford Ltd International Journal of Environmental Health Research 7 , 5±31 (1997) A prospective epidemiological study of gastrointestinal health effects due to the consumption of drinking water PIERRE PAYMENT 1 , JACK SIEMIATYCKI 1 , LESLEY RICHARDSON 1 , GILLES RENAUD 1 , EDUARDO FRANCO 2 and MICH Á ELE PR VOST 3 1 Institut Armand-Frappier, 531 boulevard des Prairies, Laval H7N 4Z3, 2 Department of Oncology, McGill University, 546 avenue des Pins, ouest, Montr…al H2W 1S6 and 3 Chaire en eau potable, cole Polytechnique de Montr…al, CP 6079, Succ A, Montr…al H3C 3A7, Canada The objective of this study was to assess if drinking water meeting currently accepted microbiological standards is the source of gastrointestinal illnesses and to attempt to identify the source(s) of these illnesses. A randomized prospective study was conducted over a period of 16 months (September 1993±December 1994) in a middle class suburban community served by a single water filtration plant. A representative sample of 1400 families were selected and randomly allocated in four groups of 350, to the following regimens: (1) tap water; (2) tap water from a continuously purged tap; (3) bottled plant water; (4) purified bottled water (tap water treated by reverse osmosis or spring water). The water treatment plant produced wather that met or exceeded current North American regulations for drinking water quality. The distribution system was found to be in compliance for both coliforms and chlorine. Using the purified water group as the baseline, the excess of gastrointestinal illness associated with tap water was 14% in the tap group and 19% in the tap-valve group. Children 2±5 years old were the most affected with an excess of 17% in the tap group and 40% in the tap-valve group. Mottled plant water was not the source of any increase in the incidence of gastrointestinal illnesses, even if it contained very high levels of heterotrophic bacteria after two weeks. The data collected suggest that 14±40% of the gastrointestinal illnesses are attributable to tap water meeting current standards and that the water distribution system appears to be partly responsible for these illnesses. Keywords : drinking water; waterborne disease; gastrointestinal illness; health effects; epidemiologic study. Introduction The notion that coliform-free drinking water is pathogen-free is being seriously questioned as is the value of current water quality indicators (Craun 1990). Several outbreaks of gastroenteritis and hepatitis (Wilson et al . 1982, Bloch et al . 1990, Mackenzie et al . 1994, Kramer et al . 1996), giardiasis and cryptosporidiosis (Hayes et al . 1989, Smith et al . 1989, Smith and Smith 1990) in communities with water meeting current regulations (Federal Register 1989a, Anonymous 1994), have brought to the public attention the fact that current standards may not provide complete protection (Batik et al . 1983, Craun 1990). Any estimation of the waterborne fraction of disease is impaired by their low incidence in the population (Payment et al . 1991b) and it is only in outbreak situation that detailed analyses can
-
Upload
independent -
Category
Documents
-
view
1 -
download
0
Transcript of A prospective epidemiological study of gastrointestinal health effects due to the consumption of...
Correspondence to P. Payment.
0960-3123/97/010005-27 � 1997 Journals Oxford Ltd
International Journal of Environmental Health Research 7, 5±31 (1997)
A prospective epidemiological study ofgastrointestinal health effects due to theconsumption of drinking waterPIERRE PAYMENT1 , JACK SIEMIATYCKI1 , LESLEY RICHARDSON1, GILLES
RENAUD1, EDUARDO FRANCO2 and MICH ÁELE PR� VOST3
1Institut Armand-Frappier, 531 boulevard des Prairies, Laval H7N 4Z3, 2Department of Oncology, McGill
University, 546 avenue des Pins, ouest, Montr…al H2W 1S6 and 3Chaire en eau potable, � cole Polytechnique de
Montr…al, CP 6079, Succ A, Montr…al H3C 3A7, Canada
The objective of this study was to assess if drinking water meeting currently accepted microbiological
standards is the source of gastrointestinal illnesses and to attempt to identify the source(s) of these
illnesses. A randomized prospective study was conducted over a period of 16 months (September
1993±December 1994) in a middle class suburban community served by a single water filtration plant. A
representative sample of 1400 families were selected and randomly allocated in four groups of 350, to the
following regimens: (1) tap water; (2) tap water from a continuously purged tap; (3) bottled plant water;
(4) purified bottled water (tap water treated by reverse osmosis or spring water). The water treatment plant
produced wather that met or exceeded current North American regulations for drinking water quality. The
distribution system was found to be in compliance for both coliforms and chlorine. Using the purified
water group as the baseline, the excess of gastrointestinal illness associated with tap water was 14% in the
tap group and 19% in the tap-valve group. Children 2±5 years old were the most affected with an excess
of 17% in the tap group and 40% in the tap-valve group. Mottled plant water was not the source of any
increase in the incidence of gastrointestinal illnesses, even if it contained very high levels of heterotrophic
bacteria after two weeks. The data collected suggest that 14±40% of the gastrointestinal illnesses are
attributable to tap water meeting current standards and that the water distribution system appears to be
partly responsible for these illnesses.
Keywords : drinking water; waterborne disease; gastrointestinal illness; health effects; epidemiologic study.
Introduction
The notion that coliform-free drinking water is pathogen-free is being seriously questioned as
is the value of current water quality indicators (Craun 1990). Several outbreaks of gastroenteritis
and hepatitis (Wilson et al. 1982, Bloch et al. 1990, Mackenzie et al. 1994, Kramer et al. 1996),
giardiasis and cryptosporidiosis (Hayes et al. 1989, Smith et al. 1989, Smith and Sm ith 1990)
in communities with water meeting current regulations (Federal Register 1989a, Anonymous
1994), have brought to the public attention the fact that current standards may not provide
complete protection (Batik et al. 1983, Craun 1990) .
Any estimation of the waterborne fraction of disease is impaired by their low incidence in the
population (Payment et al. 1991b) and it is only in outbreak situation that detailed analyses can
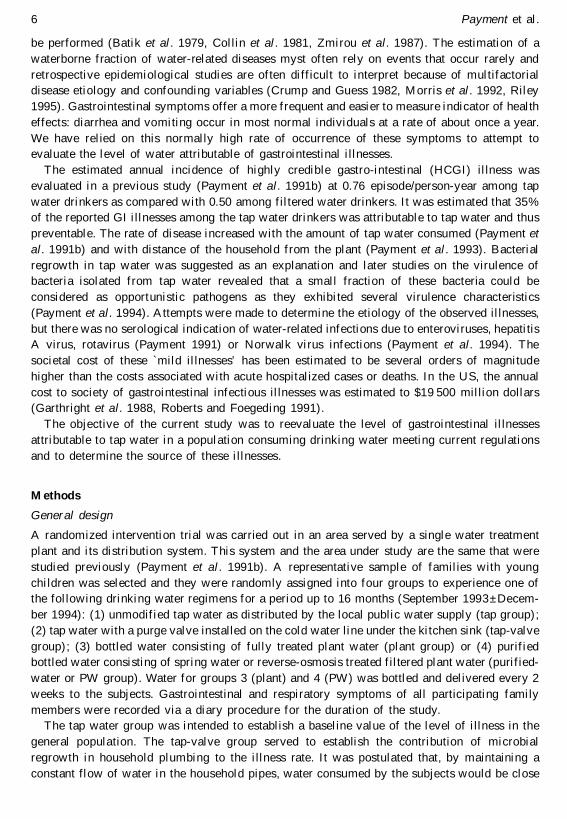
6 Payment et al.
be performed (Batik et al. 1979, Collin et al. 1981, Zmirou et al. 1987). The estimation of a
waterborne fraction of water-related diseases myst often rely on events that occur rarely and
retrospective epidemiological studies are often difficult to interpret because of multifactorial
disease etiology and confounding variables (Crump and Guess 1982, Morris et al. 1992, Riley
1995). Gastrointestinal symptoms offer a more frequent and easier to measure indicator of health
effects: diarrhea and vomiting occur in most normal individuals at a rate of about once a year.
We have relied on this normally high rate of occurrence of these symptoms to attempt to
evaluate the level of water attributable of gastrointestinal illnesses.
The estimated annual incidence of highly credible gastro-intestinal (HCGI) illness was
evaluated in a previous study (Paym ent et al. 1991b) at 0.76 episode/person-year among tap
water drinkers as com pared with 0.50 among filtered water drinkers. It was estimated that 35%
of the reported GI illnesses among the tap water drinkers was attributable to tap water and thus
preventable. The rate of disease increased with the amount of tap water consumed (Payment et
al. 1991b) and with distance of the household from the plant (Payment et al. 1993). Bacterial
regrowth in tap water was suggested as an explanation and later studies on the virulence of
bacteria isolated from tap water revealed that a small fraction of these bacteria could be
considered as opportunistic pathogens as they exhibited several virulence characteristics
(Payment et al. 1994). Attempts were made to determine the etiology of the observed illnesses,
but there was no serological indication of water-related infections due to enteroviruses, hepatitis
A virus, rotavirus (Paym ent 1991) or Norwalk virus infections (Paym ent et al. 1994). The
societal cost of these `mild illnesses’ has been estimated to be several orders of magnitude
higher than the costs associated with acute hospitalized cases or deaths. In the US, the annual
cost to society of gastrointestinal infectious illnesses was estimated to $19 500 million dollars
(Garthright et al. 1988, Roberts and Foegeding 1991).
The objective of the current study was to reevaluate the level of gastrointestinal illnesses
attributable to tap water in a population consuming drinking water meeting current regulations
and to determine the source of these illnesses.
Methods
General design
A randomized intervention trial was carried out in an area served by a single water treatment
plant and its distribution system. This system and the area under study are the same that were
studied previously (Payment et al. 1991b). A representative sample of families with young
children was selected and they were randomly assigned into four groups to experience one of
the following drinking water regimens for a period up to 16 months (September 1993±Decem-
ber 1994): (1) unmodified tap water as distributed by the local public water supply (tap group);
(2) tap water with a purge valve installed on the cold water line under the kitchen sink (tap-valve
group); (3) bottled water consisting of fully treated plant water (plant group) or (4) purified
bottled water consisting of spring water or reverse-osmosis treated filtered plant water (purified-
water or PW group). Water for groups 3 (plant) and 4 (PW) was bottled and delivered every 2
weeks to the subjects. Gastrointestinal and respiratory symptoms of all participating family
members were recorded via a diary procedure for the duration of the study.
The tap water group was intended to establish a baseline value of the level of illness in the
general population. The tap-valve group served to establish the contribution of microbial
regrowth in household plumbing to the illness rate. It was postulated that, by maintaining a
constant flow of water in the household pipes, water consumed by the subjects would be close
Gastrointestinal health effects of tap water 7
in quality to water in the distribution system mains. Plant water and purified-water were bottled
and delivered to participating families in unmarked containers effectively blinding the
consumers to the type of water they consumed. Plant water obtained directly at the treatment
plant was unmodified by the distribution system. Purified-water provided an uncontaminated
water source of drinking water and was a way to repeat our previous study in which each
individual households had been fitted with reverse-osmosis domestic filters as a barrier to all
contaminants (Payment et al. 1991a,b).
Water treatment plant
The population selected is served by a single water treatment plant and is located in the same
area that was studied during our previous study (Payment et al. 1991b). The watershed is over
300 km long and drains both rural and urban areas. A large relatively unpolluted lake acts as a
buffer zone before the river enters the suburban area under study which is polluted by untreated
sanitary and storm sewer discharges. The capacity of the water treatment plant is 130 000 cubic
meters per day and water is treated by a complete conventional treatment (alum flocculation,
settling, filtration on sand-anthracite, ozonation and a final chlorination).post-chlorination).
Fluoride is usually added to tap water and tracer experiments were performed using fluoride
concentration to assess residence in the plant and contact times for the oxidants.
Reverse-osmosis unit
A reverse-osmosis (RO) unit rated at a product flow rate of 120 l/min at 4ÊC was leased from
Airableau Inc. (Qu…bec, Canada) and installed at the water treatment plant. The unit was
composed of hydronautics membranes (10 cm dia.) in two sets of 10 modules. The unit was
connected through sanitary tubing to a high pressure main at the water treatment plant.
Efficiency of the unit was monitored by on-line by conductivity and pressure controls and
samples were taken at each use for bacteriological analysis of the product water.
Water consumed by each group
Tap-water and tap-valve groups. Subjects in these two groups consumed tap water and did not
change their normal consumption pattern. To evaluate if bacterial regrowth in household
plumbing plays a role in gastrointestinal health effects, purge valves were installed by
professional plumbers in a randomly chosen sub-group of households. These valves maintained
a sufficient flow rate to the drain to equilibrate the water quality in the household with the water
quality in the main. The diversion valve was installed under the kitchen sink, 30 ±60 cm from the
tap on the cold water line, with a continuous discharge to the sewer. The valve was fitted with
back-flow preventers according to local building codes. The valve was adjusted to deliver
100 ±500 ml/min with minimal background noise due to the flowing water.
Bottling of plant and purified water. Water was bottled by a commercial facility located
100 km from the water treatment plant. A sanitary stainless steel tanker truck dedicated to
drinking water transport was used to haul water from the treatment plant or the spring. Sanitary
connections to the tanker from the main water line or the RO-unit were provided and all water
lines were flushed for 10 min before the actual loading.
Plant finished water was bottled without further treatment while purified water, Spring water
or plant water treated by reverse osmosis were ozonated before bottling. Water was bottled in
standard 4-l plastic bottles marked only with a code that included the date, the time of bottling,
the work shift, and our own code. Bottled water was packaged in cases of four bottles which
8 Payment et al.
were delivered to a warehouse where they were kept at room temperature until delivery in the
next 2±4 days.
The study began in September 1993, however purifed water (RO-treated) was not available
until February 1994 and during spring water was obtained from the bottling company as a
replacement. This water is certified by the Ministry of Environment of Quebec and is obtained
from a protected underground aquifer which has no history of any contamination. This water
was ozonated at the time of bottling and was delivered to the subjects in the PW group until
February 1994.
Bottled water (purified or plant) was picked-up at the warehouse and delivered to the subjects
within 2±4 days of bottling. Subjects were instructed to use this water for the following 2 weeks
and were requested to discard left-over bottles from the previous delivery. Enough water was
provided to each family for a 2-week period. If they did not have sufficient water during this
2-week period, they could call our offices and obtain supplementary water from the same
production lot.
Popula tion evaluated
The study was planned to include 4 groups of 350 families followed for 16 months (September
1993±December 1994). The purpose of the study was not to evaluate the susceptibility of groups
at special risk such as immunosuppressed, immunocom promised, elderly, etc., thus the
individuals selected were in good health with no known medical conditions that may affect the
outcome. The study was carried out in a suburban area of average socio-economic level. Apart
from the fact that most of the population of this area is French-speaking, it is quite typical of
an average socioeconomic level, the subjects were in good health and should reflect an average
North American community.
Selection process
Four eligibility criteria were established for participation in the study: residence located within
the zone of influence of the water filtration plant, being a usual consumer of tap water supplied
by the city, at least one child aged 2 ±12 years living full-time in the household and ability to
communicate in French. The sampling frame was the list of families residents in the study area
and benefiting from a government-run income supplement program for families with children
under 18 years. The program is independent of incom e and does not denote a lower economic
class. The government agency responsible for the program provided us a list of 4800 qualifying
families residing in the area.
Families were first contacted by mail to inform them of the study and that someone would be
calling them within a few days. Within the next week, telephonists contacted the family to assess
eligibility. If the family satisfied the eligibility criteria and agreed to participate in the study, it
was assigned randomly to one of the four groups. This process of screening and random
allocation was continued until there were approximately 350 households per group. This number
of families was chosen in the hope that by the end of the follow-up period while there would
remain at least 250 families per group.
W hile subjects knew from the introductory letter that there would be four groups, they were
given no choice as to the group they could participate. They were however always given the
possibility to refuse to participate at any step of the selection process as well as during the
observation period.
All families were visited to explain the study and to obtain written consent forms from all
members of the family that agreed to participate, answer basic questions and explain to them the
Gastrointestinal health effects of tap water 9
Health Watch Calendar. Further sociodemographic and water consumption data were obtained on
two other occasions, in June and December 1994, from self-completed questionnaires which were
returned to us by mail. The baseline questionnaire included sociodemographic information, as
well as information on place of work, school or day-care attendance, trips, chronic medical
conditions and use of medication. Arrangements were made with each family to agree on a
convenient time for delivery of the water if they were in the bottled water groups. For those in the
tap-valve group, we made arrangements for a plumber to install the valve at the kitchen tap.
Health survey
Survey calendar and incentives. A simple diary-type questionnaire with a list of symptoms
was distributed to all subjects and one parent was designated to record daily symptoms
experienced by members of the family. The diary was distributed as a spiral bound booklet 8.5
3 11 in. containing an `Introductory Letter ’ and all 2-week questionnaires for the observation
period. Each record sheet was printed on both sides and could be used to record the events of
four individuals during each 2-week period. If there were more than four subjects in the
household, a second booklet was provided. The subjects were asked to record on the day it
occurred if they had experienced nausea, vomiting, diarrhea, cold or flu. A list of subsidiary
symptoms was also to be completed (see list in Table 5).
Every 2 weeks, families were contacted by telephone to obtain the information recorded on the
diary. The telephonist was only required to record the information already on the daily diary. As
most weekly reports were negative and the information sought fairly simple, telephone calls were
relatively short. The telephonist asked the designated person (i.e. informant) if any of the subjects
had experienced cold or flu, vomiting, diarrhea or nausea. If any of these symptoms were reported,
the telephonist requested the com plementary information recorded on the questionnaire (i.e. all
other symptoms experienced). Participants were also asked what was the perception of the family
of the water quality during the period. School or day-care attendance, trips out of the country or
absence from home were also noted on this diary. To minimize information bias, each telephonist
received alternatively a different subgroup of subjects to contact.
To maintain the level of participation and maximize contact with the participating families, a
lottery ticket was sent to each family every month with a short note thanking them for their
continued participation.
Water consumption surveys. Three water consumption surveys were done during the course of
thet study, one as part of the baseline survey at the time of enrollment, one in June 1994 and one
in December 1994. The questionnaire was designed to establish an estimate of the amount and
type of water, where it was consumed and whether it was consumed unmodified or was used for
preparing tea, coffee or juices.
Data entry and statistical analysis. The database was prepared using FileMaker Pro for the
Macintosh. All data on each member of the participating families were entered in this database,
verified and validated. Discrepancies were resolved. Data entered in the database were further
cross checked and re-verified to ensure its accuracy. All data were first analyzed using SAS
Software and SPSS Software installed on a SUN Microstation and stratified according to the
variables entered.
For analysis purposes two periods were distinguished: the 1993±94 school year from
September 1993 until June 1994 and the remaining months from July 1994 to December 1994.
In the Province of Quebec, the end of June marks the end of the school year as well as the period
10 Payment et al.
in which a relatively large proportion of the population moves from one household or apartment
to another.
Highly credible gastrointestinal (HCGI) episodes were defined as: (1) vomiting or liquid
diarrhea alone; or (2) soft stools or nausea with abdominal cramps. This is the same definition
that was used during our initial study (Payment et al. 1991b). The time criteria for inclusion in
the analysis and acceptance as a credible episode was a period of at least 6 consecutive
symptom-free days between the episodes. Symptom occurrence and HCGI rates were calculated
for each group and stratified according to the collected variables. Estimates of incidence of
HCGI illnesses in the groups were derived by means of Poisson regression methods (Frome
1983). Since this technique counts each episode as an independent event, a correction had to be
made for the correlation between repeat episodes by the same unit of observation. This was done
using the `quasi-likelihood’ approach (McCullagh and Nelder 1983), which amounts to reducing
the nominal significance of each result by a factor related to the amount of this correlation.
Some analyses were based on the entire famikly as the unit of observation, while others were
based on selected individuals within the family. In addition to group membership, som e
covariates were included in the corresponding models in order to adjust for any imbalance in the
groups. These covariates were: age, sex, and subregion. When the analyses were carried out for
the entire period of follow-up, the study period was also incorporated as a covariate in the
model. Adjusted rates were estimated from the results of the fitted models. Each regression
model gave an estimate of the p-value associated with group membership.
Poisson regression was also used to establish whether there was a dose-response relationship
between tap water consumption and incidence of HCGI in the tap and tap-valve groups. This
was done by adding the number of glasses of water consumed per week as an independent
variable to the models. These analyses were based on unmodified tap water, i.e. water other than
that used in food preparation or cold and hot beverages.
Bacteriological and physico-chemical analyses
Bacteriological and physico-chemical analyses were performed according to standard methods
(APHA 1992) unless otherwise indicated. Total coliforms, HPC, alkalinity, hardness and color
were monitored twice a day at the plant. Turbidity, pH, flow, pressure, temperature and
disinfectant residual are monitored continuously at the water treatment plant. Chlorinated water
samples were collected in bottles containing sodium thiosulfate. Compliance monitoring data
were obtained from the water utility authorities from analysis of samples collected at selected
consumers taps (two mid-point and two at the end of the distribution system). Three sets of
analyses were performed on three to six bottles of each lot of bottled water: at the time of
collection, upon delivery to our warehouse, and after 2 weeks at room temperature to simulate
storage by the subjects. Heterotrophic plate counts bacteria were determined (HPC) on R2A
medium at 20 and 35ÊC, total coliforms on m-Endo, Pseudomonas aeruginosa on m-PA,
Aeromonas hydrophila on Ryan medium, direct counts and viable counts were monitored using
membrane filtration equipment and the indicated medium (APHA 1992). Clostridium
perfringens was enumerated using the membrane filtration method on m-CP medium as
described by Bisson and Cabelli (1979) and modified by Armon and Paym ent (1988).
Virological and parasitological analyses
Raw water (100 l), filtered water (1000 l) and finished water (1000 l) samples were analyzed every
two weeks for the presence of human enteric viruses and parasites according to a single method
developed in our laboratories using electronegative wound fiberglass cartridges. Viruses in
Gastrointestinal health effects of tap water 11
concentrates were detected by two passages on MA-104 cells followed by an immunoperoxidase
test using human gamma globulins. Concentrated samples for parasite analysis were purified by
Sucrose-Percoll flotation, collected on membrane filters and analyzed for Giardia cysts and
Cryptosporidium oocysts by immunofluorescence using monoclonal antibodies (28, 33).
Results
Treatment plant and distribution system
The treatment plant produced water that met and exceeded all current North American drinking
water regulations in application at the time of the study including the Total Coliform Rule and
the Surface Water Treatment Rule. Water entering the plant was at pH 7.4, treated water was at
pH 8.0 and temperature varied from 1ÊC to 23ÊC. Ozone was applied to the filtered water at a
dose of 2±2.5 mg/l resulting in a final concentration of 0.3 ±0.4 mg/l after a 10 min, contact time.
Finished water turbidity was mostly below 0.1 NTU an the level of free chlorine residual
averaged 0.5 mg/l in the clearwell and at the first consum er. Plant effluent water had a biological
oxygen demand content of 0.5 mg/l. Most of the mains were put in place between 1960±70, but
some were as recent as 1990.
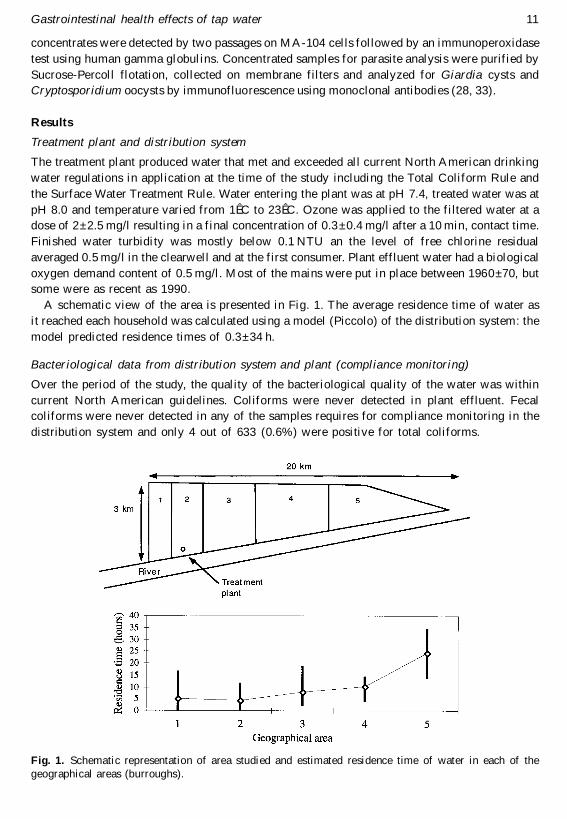
A schematic view of the area is presented in Fig. 1. The average residence time of water as
it reached each household was calculated using a model (Piccolo) of the distribution system: the
model predicted residence times of 0.3±34 h.
Bacteriological data from distribution system and plant (compliance monitoring)
Over the period of the study, the quality of the bacteriological quality of the water was within
current North American guidelines. Coliforms were never detected in plant effluent. Fecal
coliforms were never detected in any of the samples requires for com pliance monitoring in the
distribution system and only 4 out of 633 (0.6%) were positive for total coliforms.
Fig. 1. Schematic representation of area studied and estimated residence time of water in each of the
geographical areas (burroughs).
12 Payment et al.
Ta
ble
1.
Mic
rob
iolo
gic
al
resu
lts
(geo
met
ric
mean
) fr
om
an
aly
sis
of
larg
e v
olu
me
s w
ater
sam
ple
s co
llec
ted
at
wa
ter
tre
atm
ent
pla
nt
Mic
roo
rga
nis
ms
Ra
w w
ate
r
Geo
me
tric
mea
nP
osi
tive/
sam
ple
s
Fil
tere
d w
ate
r
Geo
me
tric
mea
nv
alu
eP
osi
tiv
e/sa
mp
les
Ave
rag
ere
mo
va
l(l
og
10
)
Fin
ish
ed
wa
ter
Geo
metr
icm
ean
Po
siti
ve/
sam
ple
s
Ave
rag
ere
mo
va
l(l
og
10
)
Clo
stri
diu
m p
erf
rin
gen
s (c
fu/1
00
l)2
33
10
03
3/3
33
09
/33
3.8
<1
00
/32
5.0
So
mati
c co
lip
hag
es
(pfu
/10
0l)
26
75
13
3/3
31
4.7
24
/32
3.2
<1
0/3
25
.0
En
teri
c v
iru
ses
(mp
niu
/10
0l)
41
33
1/3
3<
0.3
0/3
24
.1<
0.3
0/3
24
.1G
iard
ia (
cyst
s/1
00
l)2
00
33
/33
0.2
1/3
23
.1<
0.1
0/3
24
.3
Cry
pto
spo
rid
ium
(o
oc
yst
s/1
00
l)1
41
5/3
30
.37
/32
1.7
<0
.10
/32
3.2
Gastrointestinal health effects of tap water 13
Microbiological data from large volume analyses
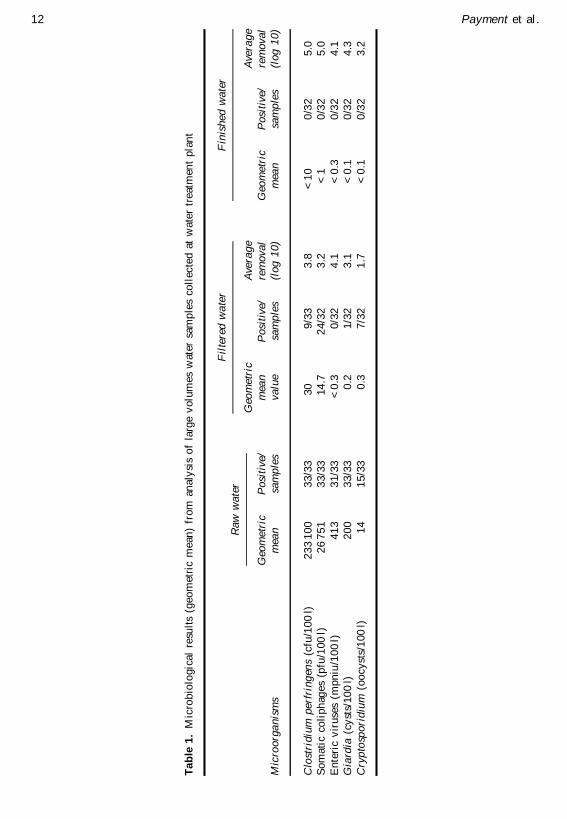
River water entering the treatment plant was contaminated by human enteric viruses, Giardia
cysts and Cryptosporidium oocysts (Table 1). Clostridium perfrongens and somatic coliphages
were also found in large numbers. The level of viruses detected in the raw water was relatively
stable until April 1994, when their numbers dropped sharply after the spring run-off (Fig. 2).
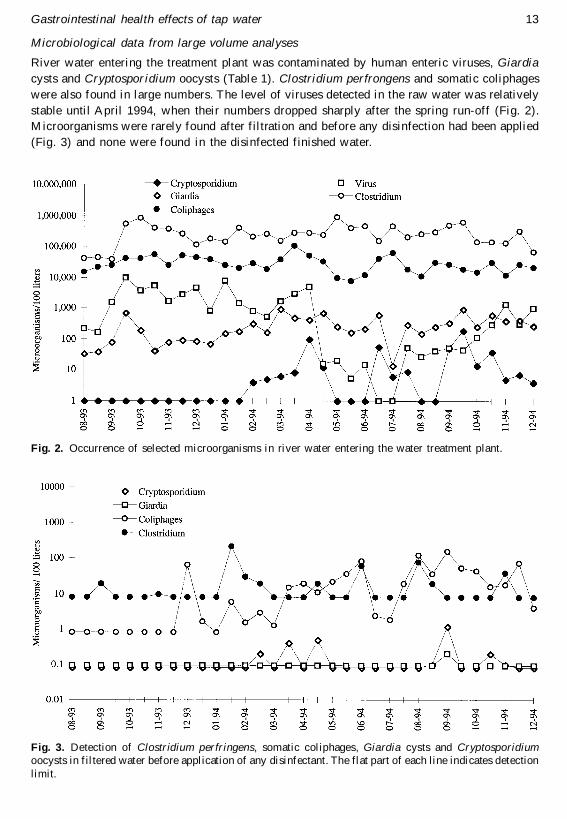
Microorganisms were rarely found after filtration and before any disinfection had been applied
(Fig. 3) and none were found in the disinfected finished water.
Fig. 2. Occurrence of selected microorganisms in river water entering the water treatment plant.
Fig. 3. Detection of Clostridium perfringens, somatic coliphages, Giardia cysts and Cryptosporidiumoocysts in filtered water before application of any disinfectant. The flat part of each line indicates detection
limit.
14 Payment et al.
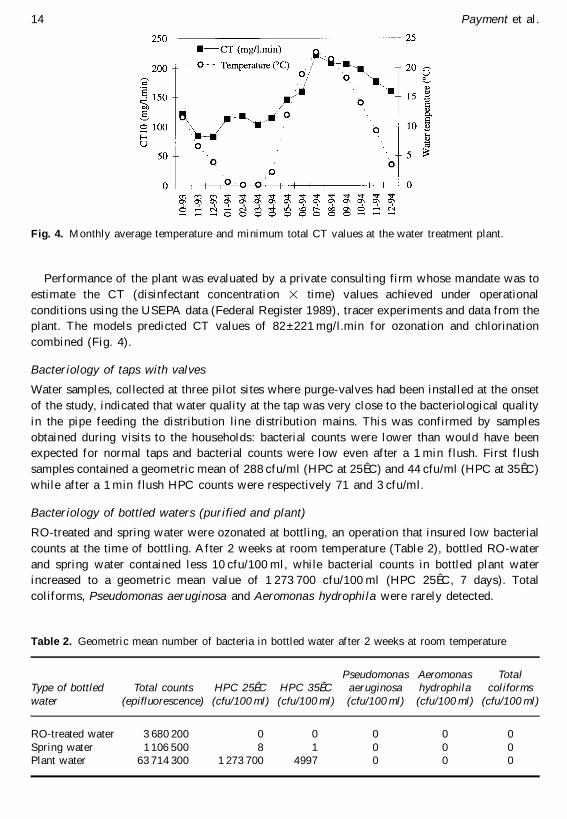
Performance of the plant was evaluated by a private consulting firm whose mandate was to
estimate the CT (disinfectant concentration 3 time) values achieved under operational
conditions using the USEPA data (Federal Register 1989), tracer experiments and data from the
plant. The models predicted CT values of 82 ±221 mg/l.min for ozonation and chlorination
combined (Fig. 4).
Bacteriology of taps with valves
Water samples, collected at three pilot sites where purge-valves had been installed at the onset
of the study, indicated that water quality at the tap was very close to the bacteriological quality
in the pipe feeding the distribution line distribution mains. This was confirmed by samples
obtained during visits to the households: bacterial counts were lower than would have been
expected for normal taps and bacterial counts were low even after a 1 min flush. First flush
samples contained a geometric mean of 288 cfu/ml (HPC at 25ÊC) and 44 cfu/ml (HPC at 35ÊC)
while after a 1 min flush HPC counts were respectively 71 and 3 cfu/ml.
Bacteriology of bottled waters (purified and plant)
RO-treated and spring water were ozonated at bottling, an operation that insured low bacterial
counts at the time of bottling. After 2 weeks at room temperature (Table 2), bottled RO-water
and spring water contained less 10 cfu/100 ml, while bacterial counts in bottled plant water
increased to a geometric mean value of 1 273 700 cfu/100 ml (HPC 25ÊC, 7 days). Total
coliforms, Pseudomonas aeruginosa and Aeromonas hydrophila were rarely detected.
Fig. 4. Monthly average temperature and minimum total CT values at the water treatment plant.
Table 2. Geometric mean number of bacteria in bottled water after 2 weeks at room temperature
Type of bottledwater
Total counts(epifluorescence)
HPC 25ÊC(cfu/100 ml)
HPC 35ÊC(cfu/100 ml)
Pseudomonasaeruginosa(cfu/100 ml)
Aeromonashydrophila
(cfu/100 ml)
Totalcoliforms
(cfu/100 ml)
RO-treated water 3 680 200 0 0 0 0 0
Spring water 1 106 500 8 1 0 0 0Plant water 63 714 300 1 273 700 4997 0 0 0
Gastrointestinal health effects of tap water 15
Recruitment and enrollment
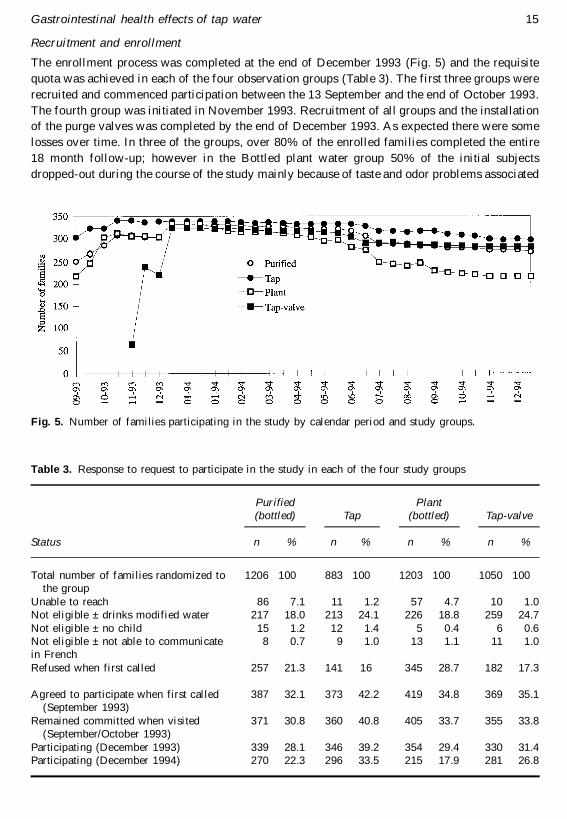
The enrollment process was completed at the end of December 1993 (Fig. 5) and the requisite
quota was achieved in each of the four observation groups (Table 3). The first three groups were
recruited and commenced participation between the 13 September and the end of October 1993.
The fourth group was initiated in November 1993. Recruitment of all groups and the installation
of the purge valves was completed by the end of December 1993. As expected there were some
losses over time. In three of the groups, over 80% of the enrolled families completed the entire
18 month follow-up; however in the Bottled plant water group 50% of the initial subjects
dropped-out during the course of the study mainly because of taste and odor problems associated
Fig. 5. Number of families participating in the study by calendar period and study groups.
Table 3. Response to request to participate in the study in each of the four study groups
Status
Purified(bottled)
n %
Tap
n %
Plant(bottled)
n %
Tap-valve
n %
Total number of families randomized to 1206 100 883 100 1203 100 1050 100the group
Unable to reach 86 7.1 11 1.2 57 4.7 10 1.0Not eligible ± drinks modified water 217 18.0 213 24.1 226 18.8 259 24.7
Not eligible ± no child 15 1.2 12 1.4 5 0.4 6 0.6Not eligible ± not able to communicate 8 0.7 9 1.0 13 1.1 11 1.0in French
Refused when first called 257 21.3 141 16 345 28.7 182 17.3
Agreed to participate when first called 387 32.1 373 42.2 419 34.8 369 35.1(September 1993)
Remained committed when visited 371 30.8 360 40.8 405 33.7 355 33.8(September/October 1993)
Participating (December 1993) 339 28.1 346 39.2 354 29.4 330 31.4Participating (December 1994) 270 22.3 296 33.5 215 17.9 281 26.8
16 Payment et al.
with bottled plant water. This water had a distinctive taste and odor that some subjects found
very unpleasant.
Several families moved house during the course of the study. The sharp drop in participation
in July (Fig. 5) is explained by the fact that this is a com mon moving date in Quebec. If the
family moved within the studied area, they were asked to continue participation in the same
observation group. For subjects in the tap-valve group, a new valve was installed in their new
house or apartment.
General observations and rates of symptoms
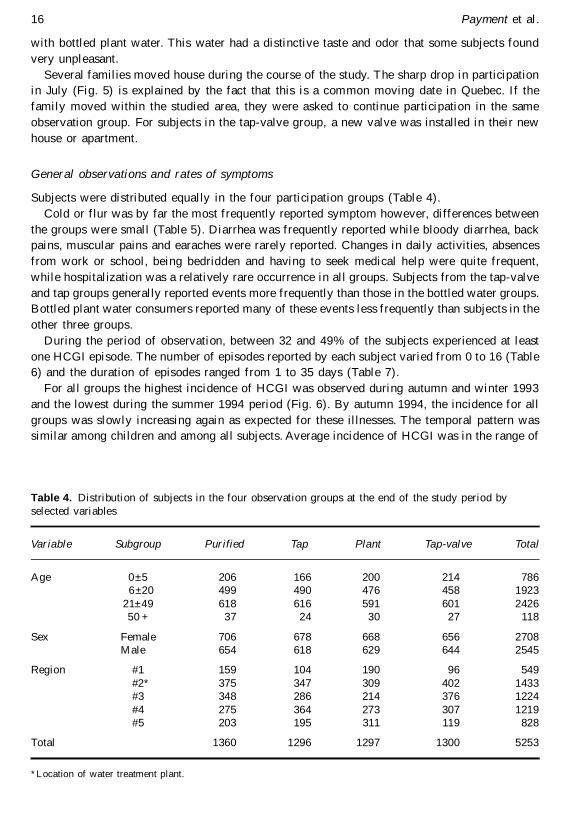
Subjects were distributed equally in the four participation groups (Table 4).
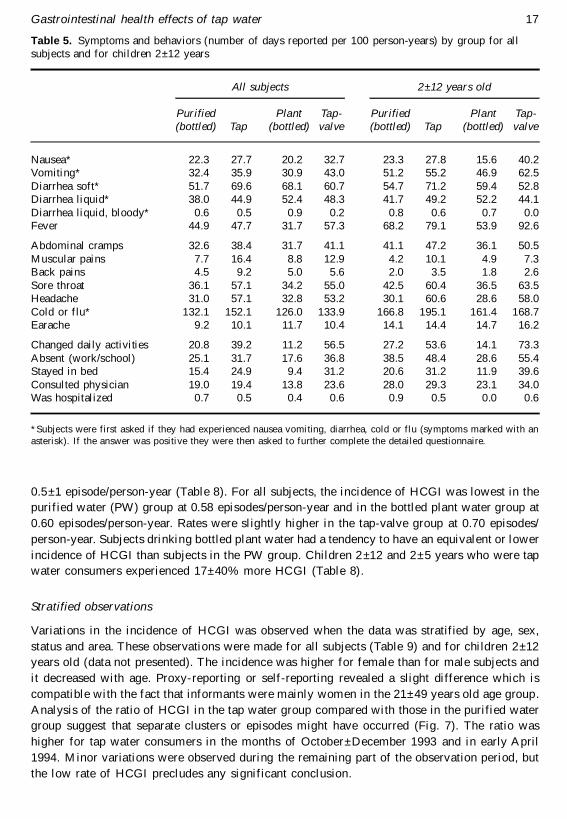
Cold or flur was by far the most frequently reported symptom however, differences between
the groups were small (Table 5). Diarrhea was frequently reported while bloody diarrhea, back
pains, muscular pains and earaches were rarely reported. Changes in daily activities, absences
from work or school, being bedridden and having to seek medical help were quite frequent,
while hospitalization was a relatively rare occurrence in all groups. Subjects from the tap-valve
and tap groups generally reported events more frequently than those in the bottled water groups.
Bottled plant water consumers reported many of these events less frequently than subjects in the
other three groups.
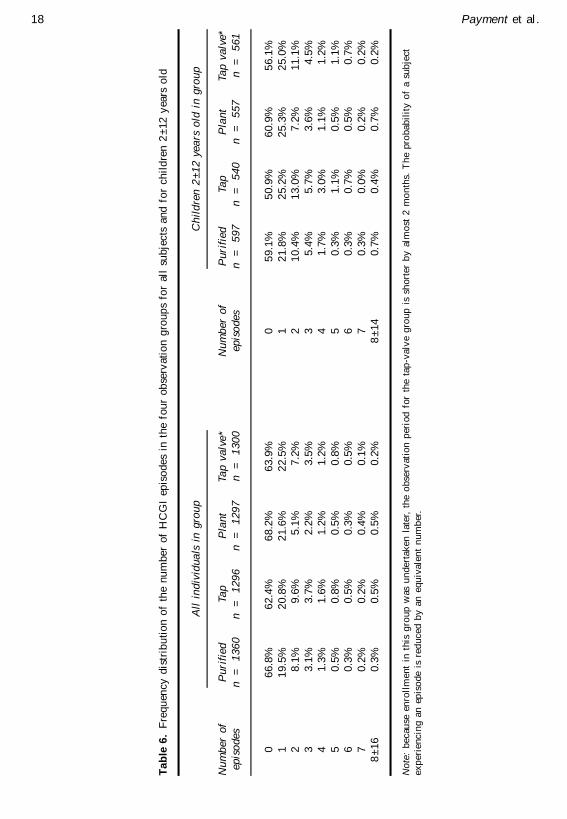
During the period of observation, between 32 and 49% of the subjects experienced at least
one HCGI episode. The number of episodes reported by each subject varied from 0 to 16 (Table
6) and the duration of episodes ranged from 1 to 35 days (Table 7).
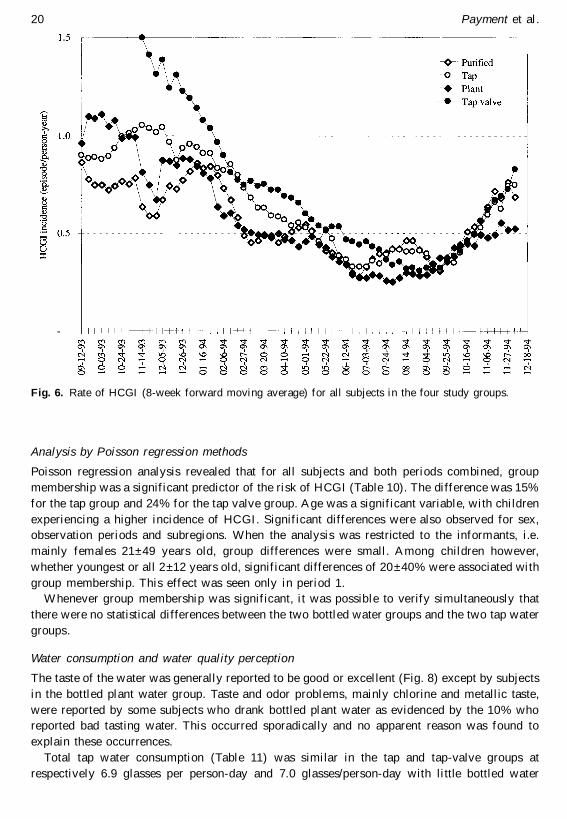
For all groups the highest incidence of HCGI was observed during autumn and winter 1993
and the lowest during the summer 1994 period (Fig. 6). By autumn 1994, the incidence for all
groups was slowly increasing again as expected for these illnesses. The temporal pattern was
similar among children and among all subjects. Average incidence of HCGI was in the range of
Table 4. Distribution of subjects in the four observation groups at the end of the study period by
selected variables
Variable Subgroup Purified Tap Plant Tap-valve Total
Age 0±5 206 166 200 214 7866±20 499 490 476 458 1923
21±49 618 616 591 601 242650 + 37 24 30 27 118
Sex Female 706 678 668 656 2708Male 654 618 629 644 2545
Region #1 159 104 190 96 549
#2* 375 347 309 402 1433#3 348 286 214 376 1224
#4 275 364 273 307 1219#5 203 195 311 119 828
Total 1360 1296 1297 1300 5253
*Location of water treatment plant.
Gastrointestinal health effects of tap water 17
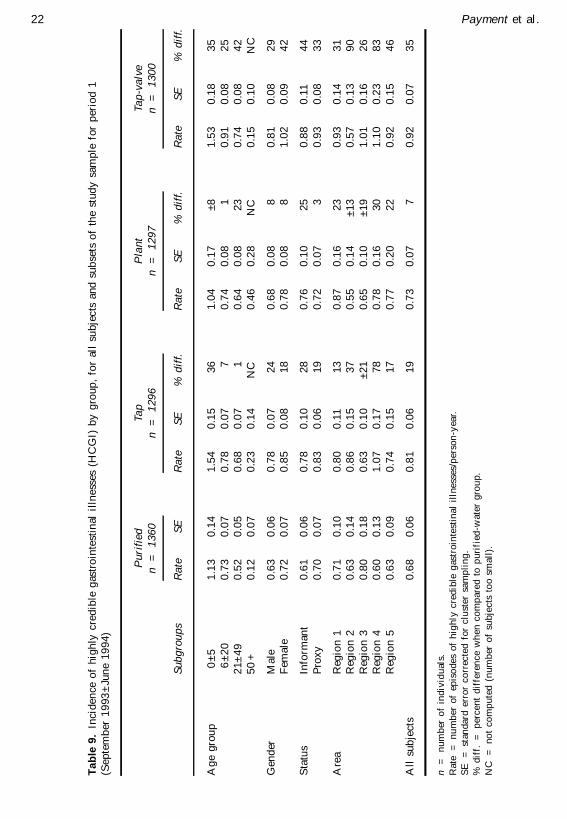
Stratified observations
Variations in the incidence of HCGI was observed when the data was stratified by age, sex,
status and area. These observations were made for all subjects (Table 9) and for children 2±12
years old (data not presented). The incidence was higher for female than for male subjects and
it decreased with age. Proxy-reporting or self-reporting revealed a slight difference which is
compatible with the fact that informants were mainly wom en in the 21±49 years old age group.
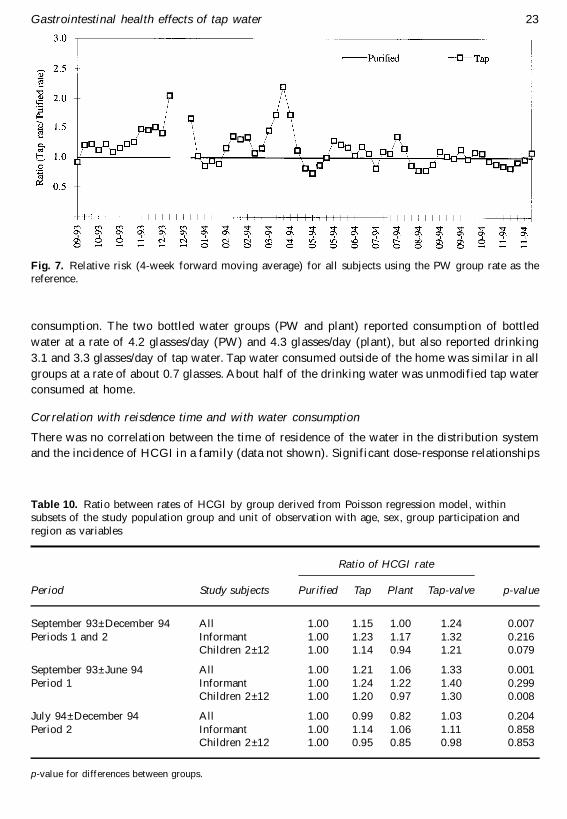
Analysis of the ratio of HCGI in the tap water group compared with those in the purified water
group suggest that separate clusters or episodes might have occurred (Fig. 7). The ratio was
higher for tap water consumers in the months of October±December 1993 and in early April
1994. Minor variations were observed during the remaining part of the observation period, but
the low rate of HCGI precludes any significant conclusion.
Table 5. Symptoms and behaviors (number of days reported per 100 person-years) by group for allsubjects and for children 2±12 years
All subjects
Purified(bottled) Tap
Plant(bottled)
Tap-valve
2 ± 12 years old
Purified(bottled) Tap
Plant(bottled)
Tap-valve
Nausea* 22.3 27.7 20.2 32.7 23.3 27.8 15.6 40.2Vomiting* 32.4 35.9 30.9 43.0 51.2 55.2 46.9 62.5
Diarrhea soft* 51.7 69.6 68.1 60.7 54.7 71.2 59.4 52.8Diarrhea liquid* 38.0 44.9 52.4 48.3 41.7 49.2 52.2 44.1
Diarrhea liquid, bloody* 0.6 0.5 0.9 0.2 0.8 0.6 0.7 0.0Fever 44.9 47.7 31.7 57.3 68.2 79.1 53.9 92.6
Abdominal cramps 32.6 38.4 31.7 41.1 41.1 47.2 36.1 50.5
Muscular pains 7.7 16.4 8.8 12.9 4.2 10.1 4.9 7.3Back pains 4.5 9.2 5.0 5.6 2.0 3.5 1.8 2.6
Sore throat 36.1 57.1 34.2 55.0 42.5 60.4 36.5 63.5Headache 31.0 57.1 32.8 53.2 30.1 60.6 28.6 58.0
Cold or flu* 132.1 152.1 126.0 133.9 166.8 195.1 161.4 168.7Earache 9.2 10.1 11.7 10.4 14.1 14.4 14.7 16.2
Changed daily activities 20.8 39.2 11.2 56.5 27.2 53.6 14.1 73.3
Absent (work/school) 25.1 31.7 17.6 36.8 38.5 48.4 28.6 55.4Stayed in bed 15.4 24.9 9.4 31.2 20.6 31.2 11.9 39.6
Consulted physician 19.0 19.4 13.8 23.6 28.0 29.3 23.1 34.0Was hospitalized 0.7 0.5 0.4 0.6 0.9 0.5 0.0 0.6
*Subjects were first asked if they had experienced nausea vomiting, diarrhea, cold or flu (symptoms marked with an
asterisk). If the answer was positive they were then asked to further complete the detailed questionnaire.
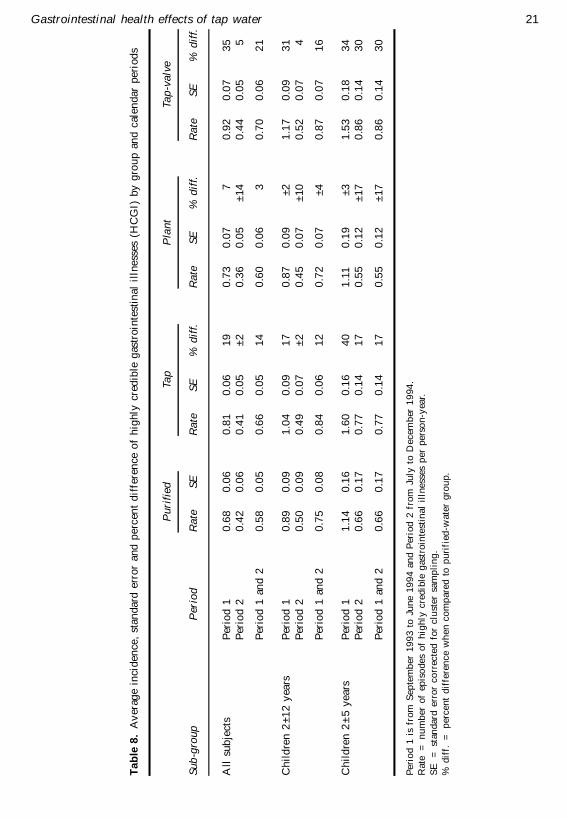
0.5±1 episode/person-year (Table 8). For all subjects, the incidence of HCGI was lowest in the
purified water (PW) group at 0.58 episodes/person-year and in the bottled plant water group at
0.60 episodes/person-year. Rates were slightly higher in the tap-valve group at 0.70 episodes/
person-year. Subjects drinking bottled plant water had a tendency to have an equivalent or lower
incidence of HCGI than subjects in the PW group. Children 2 ±12 and 2±5 years who were tap
water consumers experienced 17±40% more HCGI (Table 8).
18 Payment et al.
Ta
ble
6.
Fre
qu
enc
y d
istr
ibu
tio
n o
f th
e n
um
ber
of
HC
GI
epis
od
es
in t
he
fo
ur
ob
serv
ati
on
gro
up
s fo
r al
l su
bje
cts
an
d f
or
ch
ild
ren
2±
12
yea
rs o
ld
Nu
mb
er
of
ep
iso
de
s
All
in
div
idu
als
in
gro
up
Pu
rifi
ed
n
=
13
60
Ta
pn
=
1
29
6P
lan
tn
=
1
29
7T
ap
va
lve
*n
=
1
30
0N
um
ber
of
ep
iso
de
s
Ch
ild
ren
2±
12
yea
rs o
ld i
n g
rou
p
Pu
rifi
ed
n
=
59
7T
ap
n
=
54
0P
lan
tn
=
5
57
Ta
p v
alv
e*
n
=
56
1
06
6.8
%6
2.4
%6
8.2
%6
3.9
%0
59
.1%
50
.9%
60
.9%
56
.1%
11
9.5
%2
0.8
%2
1.6
%2
2.5
%1
21
.8%
25
.2%
25
.3%
25
.0%
28
.1%
9.6
%5
.1%
7.2
%2
10
.4%
13
.0%
7.2
%1
1.1
%
33
.1%
3.7
%2
.2%
3.5
%3
5.4
%5
.7%
3.6
%4
.5%
41
.3%
1.6
%1
.2%
1.2
%4
1.7
%3
.0%
1.1
%1
.2%
50
.5%
0.8
%0
.5%
0.8
%5
0.3
%1
.1%
0.5
%1
.1%
60
.3%
0.5
%0
.3%
0.5
%6
0.3
%0
.7%
0.5
%0
.7%
70
.2%
0.2
%0
.4%
0.1
%7
0.3
%0
.0%
0.2
%0
.2%
8±
16
0.3
%0
.5%
0.5
%0
.2%
8±
14
0.7
%0
.4%
0.7
%0
.2%
No
te:
bec
ause
en
roll
men
t in
th
is g
rou
p w
as u
nd
ert
ak
en
late
r, t
he
ob
serv
atio
n p
erio
d f
or
the t
ap
-va
lve
gro
up
is
sho
rte
r b
y a
lmo
st 2
mo
nth
s. T
he
pro
ba
bil
ity
of
a s
ub
ject
ex
pe
rien
cin
g a
n e
pis
od
e i
s re
du
ce
d b
y a
n e
qu
iva
len
t n
um
ber
.
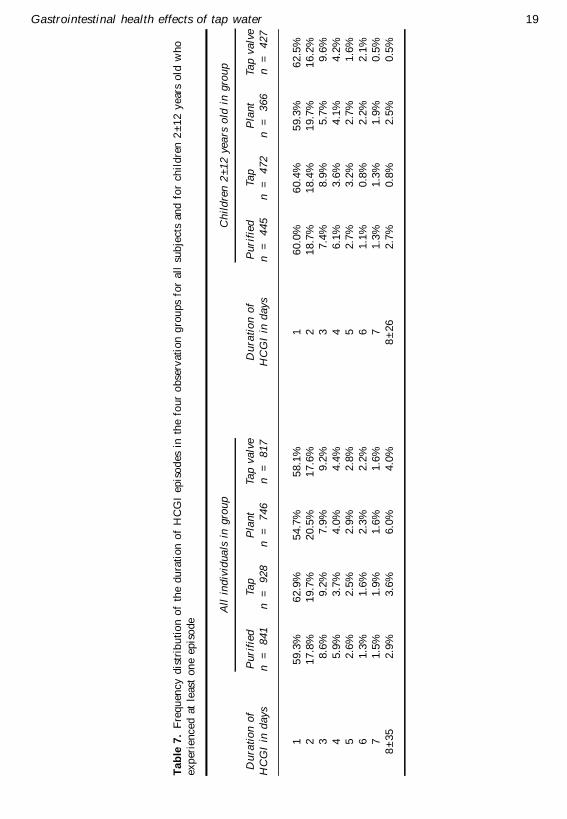
Gastrointestinal health effects of tap water 19
Ta
ble
7.
Fre
qu
enc
y d
istr
ibu
tio
n o
f th
e d
ura
tio
n o
f H
CG
I e
pis
od
es i
n t
he
fou
r o
bse
rva
tio
n g
rou
ps
for
all
su
bje
cts
and
fo
r ch
ild
ren
2±
12
ye
ars
old
wh
o
ex
per
ien
ce
d a
t le
ast
on
e e
pis
od
e
Du
rati
on
of
HC
GI
in d
ay
s
All
in
div
idu
als
in
gro
up
Pu
rifi
ed
n
=
84
1T
ap
n
=
92
8P
lan
tn
=
7
46
Ta
p v
alv
en
=
8
17
Du
rati
on
of
HC
GI
in d
ays
Ch
ild
ren
2±
12
yea
rs o
ld i
n g
rou
p
Pu
rifi
ed
n
=
44
5Ta
pn
=
4
72
Pla
nt
n
=
36
6T
ap
va
lve
n
=
42
7
15
9.3
%6
2.9
%5
4.7
%5
8.1
%1
60
.0%
60
.4%
59
.3%
62
.5%
21
7.8
%1
9.7
%2
0.5
%1
7.6
%2
18
.7%
18
.4%
19
.7%
16
.2%
38
.6%
9.2
%7
.9%
9.2
%3
7.4
%8
.9%
5.7
%9
.6%
45
.9%
3.7
%4
.0%
4.4
%4
6.1
%3
.6%
4.1
%4
.2%
52
.6%
2.5
%2
.9%
2.8
%5
2.7
%3
.2%
2.7
%1
.6%
61
.3%
1.6
%2
.3%
2.2
%6
1.1
%0
.8%
2.2
%2
.1%
71
.5%
1.9
%1
.6%
1.6
%7
1.3
%1
.3%
1.9
%0
.5%
8±
35
2.9
%3
.6%
6.0
%4
.0%
8±
26
2.7
%0
.8%
2.5
%0
.5%
20 Payment et al.
Analysis by Poisson regression methods
Poisson regression analysis revealed that for all subjects and both periods com bined, group
membership was a significant predictor of the risk of HCGI (Table 10). The difference was 15%
for the tap group and 24% for the tap valve group. Age was a significant variable, with children
experiencing a higher incidence of HCGI. Significant differences were also observed for sex,
observation periods and subregions. When the analysis was restricted to the informants, i.e.
mainly females 21±49 years old, group differences were small. Among children however,
whether youngest or all 2±12 years old, significant differences of 20 ±40% were associated with
group membership. This effect was seen only in period 1.
W henever group membership was significant, it was possible to verify simultaneously that
there were no statistical differences between the two bottled water groups and the two tap water
groups.
Water consumption and water quality perception
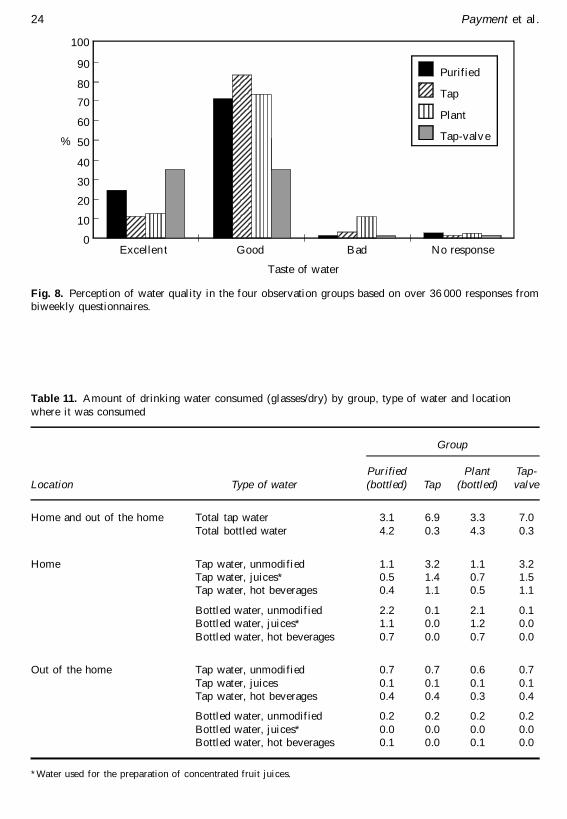
The taste of the water was generally reported to be good or excellent (Fig. 8) except by subjects
in the bottled plant water group. Taste and odor problems, mainly chlorine and metallic taste,
were reported by some subjects who drank bottled plant water as evidenced by the 10% who
reported bad tasting water. This occurred sporadically and no apparent reason was found to
explain these occurrences.
Total tap water consumption (Table 11) was similar in the tap and tap-valve groups at
respectively 6.9 glasses per person-day and 7.0 glasses/person-day with little bottled water
Fig. 6. Rate of HCGI (8-week forward moving average) for all subjects in the four study groups.
Gastrointestinal health effects of tap water 21
Ta
ble
8.
Av
erag
e in
cid
en
ce,
sta
nd
ard
err
or
an
d p
erc
ent
dif
fere
nce
of
hig
hly
cre
dib
le g
astr
oin
test
inal
illn
ess
es (
HC
GI)
by
gro
up
an
d c
ale
nd
ar
pe
rio
ds
Su
b-g
rou
pP
erio
d
Pu
rifi
ed
Ra
teS
E
Ta
p
Ra
teS
E%
dif
f.
Pla
nt
Ra
teS
E%
dif
f.
Ta
p-v
alv
e
Ra
teS
E%
dif
f.
All
su
bje
cts
Per
iod
10
.68
0.0
60
.81
0.0
61
90
.73
0.0
77
0.9
20
.07
35
Per
iod
20
.42
0.0
60
.41
0.0
5±
20
.36
0.0
5±
14
0.4
40
.05
5
Per
iod
1 a
nd
20
.58
0.0
50
.66
0.0
51
40
.60
0.0
63
0.7
00
.06
21
Ch
ild
ren
2±
12
yea
rsP
erio
d 1
0.8
90
.09
1.0
40
.09
17
0.8
70
.09
±2
1.1
70
.09
31
Per
iod
20
.50
0.0
90
.49
0.0
7±
20
.45
0.0
7±
10
0.5
20
.07
4
Per
iod
1 a
nd
20
.75
0.0
80
.84
0.0
61
20
.72
0.0
7±
40
.87
0.0
71
6
Ch
ild
ren
2±
5 y
ea
rsP
erio
d 1
1.1
40
.16
1.6
00
.16
40
1.1
10
.19
±3
1.5
30
.18
34
Per
iod
20
.66
0.1
70
.77
0.1
41
70
.55
0.1
2±
17
0.8
60
.14
30
Per
iod
1 a
nd
20
.66
0.1
70
.77
0.1
41
70
.55
0.1
2±
17
0.8
60
.14
30
Peri
od
1 i
s fr
om
Sep
tem
ber
19
93
to
Ju
ne
19
94
an
d P
erio
d 2
fro
m J
uly
to
De
cem
ber
19
94
.
Rate
=
n
um
ber
of
epis
od
es
of
hig
hly
cre
dib
le g
astr
oin
test
ina
l il
lness
es p
er
pe
rso
n-y
ear.
SE
=
st
and
ard
err
or
co
rrec
ted
fo
r c
lust
er
sam
pli
ng
.
% d
iff.
=
p
ercen
t d
iffe
ren
ce
wh
en
co
mp
are
d t
o p
uri
fied
-wa
ter
gro
up
.
22 Payment et al.
Ta
ble
9.
Inci
den
ce o
f h
igh
ly c
red
ible
gas
tro
inte
stin
al i
lln
ess
es (
HC
GI)
by
gro
up
, fo
r al
l su
bje
cts
an
d s
ub
sets
of
the s
tud
y s
amp
le f
or
per
iod
1(S
ep
tem
ber
19
93
±Ju
ne
19
94
)
Su
bg
rou
ps
Pu
rifi
ed
n
=
13
60
Ra
teS
E
Ta
pn
=
1
29
6
Ra
teS
E%
dif
f.
Pla
nt
n
=
12
97
Ra
teS
E%
dif
f.
Ta
p-v
alv
en
=
1
30
0
Ra
teS
E%
dif
f.
Ag
e g
rou
p0
±5
1.1
30
.14
1.5
40
.15
36
1.0
40
.17
±8
1.5
30
.18
35
6±
20
0.7
30
.07
0.7
80
.07
70
.74
0.0
81
0.9
10
.08
25
21
±4
90
.52
0.0
50
.68
0.0
71
0.6
40
.08
23
0.7
40
.08
42
50
+0
.12
0.0
70
.23
0.1
4N
C0
.46
0.2
8N
C0
.15
0.1
0N
C
Gen
der
Ma
le0
.63
0.0
60
.78
0.0
72
40
.68
0.0
88
0.8
10
.08
29
Fem
ale
0.7
20
.07
0.8
50
.08
18
0.7
80
.08
81
.02
0.0
94
2
Sta
tus
Info
rman
t0
.61
0.0
60
.78
0.1
02
80
.76
0.1
02
50
.88
0.1
14
4
Pro
xy
0.7
00
.07
0.8
30
.06
19
0.7
20
.07
30
.93
0.0
83
3
Are
aR
egio
n 1
0.7
10
.10
0.8
00
.11
13
0.8
70
.16
23
0.9
30
.14
31
Reg
ion
20
.63
0.1
40
.86
0.1
53
70
.55
0.1
4±
13
0.5
70
.13
90
Reg
ion
30
.80
0.1
80
.63
0.1
0±
21
0.6
50
.10
±1
91
.01
0.1
62
6R
egio
n 4
0.6
00
.13
1.0
70
.17
78
0.7
80
.16
30
1.1
00
.23
83
Reg
ion
50
.63
0.0
90
.74
0.1
51
70
.77
0.2
02
20
.92
0.1
54
6
All
su
bje
cts
0.6
80
.06
0.8
10
.06
19
0.7
30
.07
70
.92
0.0
73
5
n
=
nu
mb
er o
f in
div
idu
als.
Rate
=
n
um
ber
of
epis
od
es
of
hig
hly
cre
dib
le g
astr
oin
test
ina
l il
lness
es/p
ers
on
-yea
r.
SE
=
st
and
ard
err
or
co
rrec
ted
fo
r c
lust
er
sam
pli
ng
.
% d
iff.
=
p
ercen
t d
iffe
ren
ce
wh
en
co
mp
are
d t
o p
uri
fied
-wa
ter
gro
up
.
NC
=
n
ot
co
mp
ute
d (
nu
mb
er o
f su
bje
cts
to
o s
ma
ll).
Gastrointestinal health effects of tap water 23
consumption. The two bottled water groups (PW and plant) reported consumption of bottled
water at a rate of 4.2 glasses/day (PW) and 4.3 glasses/day (plant), but also reported drinking
3.1 and 3.3 glasses/day of tap water. Tap water consumed outside of the home was similar in all
groups at a rate of about 0.7 glasses. About half of the drinking water was unmodified tap water
consumed at home.
Correlation with reisdence time and with water consumption
There was no correlation between the time of residence of the water in the distribution system
and the incidence of HCGI in a family (data not shown). Significant dose-response relationships
Fig. 7. Relative risk (4-week forward moving average) for all subjects using the PW group rate as thereference.
Table 10. Ratio between rates of HCGI by group derived from Poisson regression model, withinsubsets of the study population group and unit of observation with age, sex, group participation and
region as variables
Period Study subjects
Ratio of HCGI rate
Purified Tap Plant Tap-valve p-value
September 93±December 94 All 1.00 1.15 1.00 1.24 0.007
Periods 1 and 2 Informant 1.00 1.23 1.17 1.32 0.216Children 2±12 1.00 1.14 0.94 1.21 0.079
September 93±June 94 All 1.00 1.21 1.06 1.33 0.001
Period 1 Informant 1.00 1.24 1.22 1.40 0.299Children 2±12 1.00 1.20 0.97 1.30 0.008
July 94±December 94 All 1.00 0.99 0.82 1.03 0.204
Period 2 Informant 1.00 1.14 1.06 1.11 0.858Children 2±12 1.00 0.95 0.85 0.98 0.853
p-value for differences between groups.
10
20
30
40
50
60
70
80
90
100
0
%
Excellen t Good Bad No response
Taste of water
Purified
Tap
Plant
Tap-valv e
24 Payment et al.
Fig. 8. Perception of water quality in the four observation groups based on over 36 000 responses frombiweekly questionnaires.
Table 11. Amount of drinking water consumed (glasses/dry) by group, type of water and location
where it was consumed
Location Type of water
Group
Purified(bottled) Tap
Plant(bottled)
Tap-valve
Home and out of the home Total tap water 3.1 6.9 3.3 7.0
Total bottled water 4.2 0.3 4.3 0.3
Home Tap water, unmodified 1.1 3.2 1.1 3.2Tap water, juices* 0.5 1.4 0.7 1.5Tap water, hot beverages 0.4 1.1 0.5 1.1
Bottled water, unmodified 2.2 0.1 2.1 0.1Bottled water, juices* 1.1 0.0 1.2 0.0
Bottled water, hot beverages 0.7 0.0 0.7 0.0
Out of the home Tap water, unmodified 0.7 0.7 0.6 0.7
Tap water, juices 0.1 0.1 0.1 0.1Tap water, hot beverages 0.4 0.4 0.3 0.4
Bottled water, unmodified 0.2 0.2 0.2 0.2
Bottled water, juices* 0.0 0.0 0.0 0.0Bottled water, hot beverages 0.1 0.0 0.1 0.0
*Water used for the preparation of concentrated fruit juices.
Gastrointestinal health effects of tap water 25
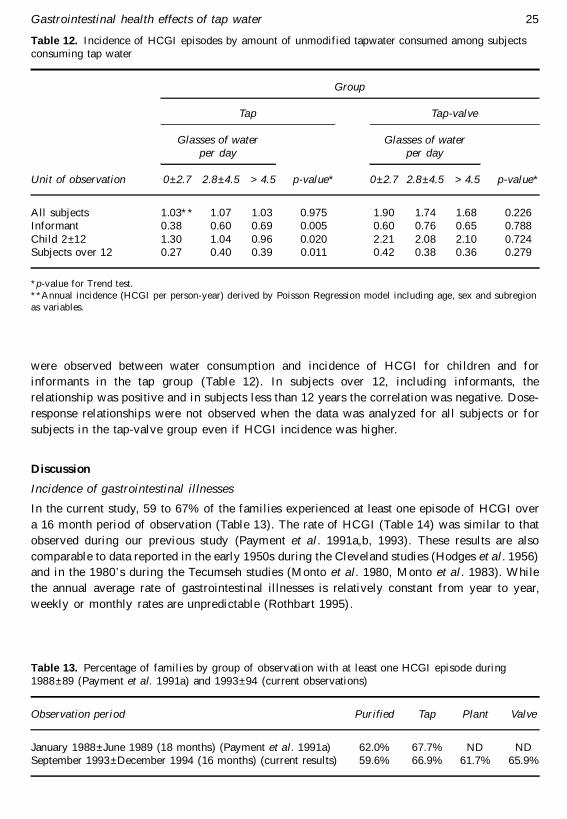
were observed between water consum ption and incidence of HCGI for children and for
informants in the tap group (Table 12). In subjects over 12, including informants, the
relationship was positive and in subjects less than 12 years the correlation was negative. Dose-
response relationships were not observed when the data was analyzed for all subjects or for
subjects in the tap-valve group even if HCGI incidence was higher.
Discussion
Incidence of gastrointestinal illnesses
In the current study, 59 to 67% of the families experienced at least one episode of HCGI over
a 16 month period of observation (Table 13). The rate of HCGI (Table 14) was similar to that
observed during our previous study (Paym ent et al. 1991a,b, 1993). These results are also
comparable to data reported in the early 1950s during the Cleveland studies (Hodges et al. 1956)
and in the 1980’ s during the Tecumseh studies (Monto et al. 1980, Monto et al. 1983). W hile
the annual average rate of gastrointestinal illnesses is relatively constant from year to year,
weekly or monthly rates are unpredictable (Rothbart 1995) .
Table 12. Incidence of HCGI episodes by amount of unmodified tapwater consumed among subjectsconsuming tap water
Group
Tap Tap-valve
Glasses of waterper day
Glasses of waterper day
Unit of observation 0 ± 2.7 2.8 ± 4.5 > 4.5 p-value* 0 ± 2.7 2.8 ± 4.5 > 4.5 p-value*
All subjects 1.03** 1.07 1.03 0.975 1.90 1.74 1.68 0.226Informant 0.38 0.60 0.69 0.005 0.60 0.76 0.65 0.788
Child 2±12 1.30 1.04 0.96 0.020 2.21 2.08 2.10 0.724Subjects over 12 0.27 0.40 0.39 0.011 0.42 0.38 0.36 0.279
*p-value for Trend test.
**Annual incidence (HCGI per person-year) derived by Poisson Regression model including age, sex and subregion
as variables.
Table 13. Percentage of families by group of observation with at least one HCGI episode during1988±89 (Payment et al. 1991a) and 1993±94 (current observations)
Observation period Purified Tap Plant Valve
January 1988±June 1989 (18 months) (Payment et al. 1991a) 62.0% 67.7% ND NDSeptember 1993±December 1994 (16 months) (current results) 59.6% 66.9% 61.7% 65.9%
26 Payment et al.
Autumn 1993 was extremely cold and winter came early with record breaking low
temperatures often below ±20ÊC. During this period, we observed high rates of respiratory and
gastrointestinal sym ptoms. While part of this higher level of illness can also be related to the
onset of the study and an eagerness to report, this is true for all groups and should not invalidate
the inter-group differences that we have observed.
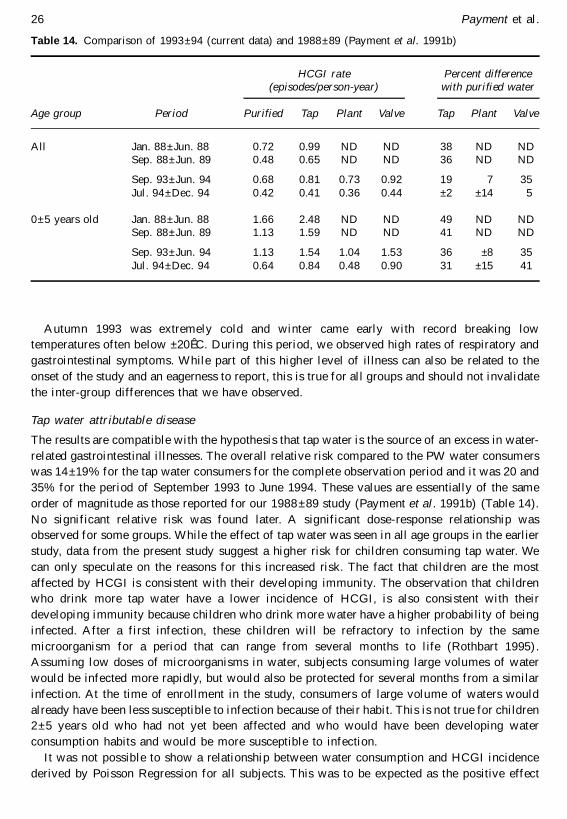
Tap water attributable disease
The results are compatible with the hypothesis that tap water is the source of an excess in water-
related gastrointestinal illnesses. The overall relative risk compared to the PW water consum ers
was 14 ±19% for the tap water consumers for the complete observation period and it was 20 and
35% for the period of September 1993 to June 1994. These values are essentially of the same
order of magnitude as those reported for our 1988 ±89 study (Payment et al. 1991b) (Table 14).
No significant relative risk was found later. A significant dose-response relationship was
observed for some groups. While the effect of tap water was seen in all age groups in the earlier
study, data from the present study suggest a higher risk for children consuming tap water. We
can only speculate on the reasons for this increased risk. The fact that children are the most
affected by HCGI is consistent with their developing immunity. The observation that children
who drink more tap water have a lower incidence of HCGI, is also consistent with their
developing immunity because children who drink more water have a higher probability of being
infected. After a first infection, these children will be refractory to infection by the same
microorganism for a period that can range from several months to life (Rothbart 1995) .
Assuming low doses of microorganisms in water, subjects consuming large volumes of water
would be infected more rapidly, but would also be protected for several months from a similar
infection. At the time of enrollment in the study, consum ers of large volume of waters would
already have been less susceptible to infection because of their habit. This is not true for children
2±5 years old who had not yet been affected and who would have been developing water
consumption habits and would be more susceptible to infection.
It was not possible to show a relationship between water consumption and HCGI incidence
derived by Poisson Regression for all subjects. This was to be expected as the positive effect
Table 14. Comparison of 1993±94 (current data) and 1988±89 (Payment et al. 1991b)
Age group Period
HCGI rate(episodes/person-year)
Purified Tap Plant Valve
Percent differencewith purified water
Tap Plant Valve
All Jan. 88±Jun. 88 0.72 0.99 ND ND 38 ND NDSep. 88±Jun. 89 0.48 0.65 ND ND 36 ND ND
Sep. 93±Jun. 94 0.68 0.81 0.73 0.92 19 7 35
Jul. 94±Dec. 94 0.42 0.41 0.36 0.44 ±2 ±14 5
0±5 years old Jan. 88±Jun. 88 1.66 2.48 ND ND 49 ND NDSep. 88±Jun. 89 1.13 1.59 ND ND 41 ND ND
Sep. 93±Jun. 94 1.13 1.54 1.04 1.53 36 ±8 35
Jul. 94±Dec. 94 0.64 0.84 0.48 0.90 31 ±15 41
Gastrointestinal health effects of tap water 27
observed in subjects over 12 years was balanced by the negative effect seen in young children.
The absence of a dose-response effect in subjects from the tap valve group is compatible with
a higher level of exposure during the first months of period 1. This exposure resulted in a higher
HCGI incidence during these months and accounts for less susceptible population for the
following months.
Effect of bacterial regrowth and stagnancy
One of the hypotheses that we were attempting to test in the current study was that there was
a health risk associated with bacterial growth resulting from stagnancy of water in household
pipes. The data collected does not support this hypothesis. If it had been true, the installation of
a valve keeping water running would have resulted in a lower incidence of HCGI. On the
contrary, we observed an increase and subjects in the tap-valve group were affected whatever
their age. Constantly flowing water might have brought pathogens to the consumer before a
significant inactivation occurs due to residual chlorine, especially if these pathogens had been
introduced by breaks in the distribution system.
The fact that subjects who drank bottled plant water with an extremely high bacterial content
had a lower rate of illness is consistent with the hypothesis of inactivation of pathogens by
bacterial growth. Stagnant water in pipes would be subjected to a similar efffect and would thus
have a protective effect on consumers by inactivating pathogens.
The fact that the subjects in the tap-valve group had a higher rate of illness is consistent with
the fact that their tap water had a shortened residence time resulting in reduced exposure to
residual disinfectant and low bacterial regrowth. The fact that water was flowing continuously
in the households with purge valves implies that pathogens, if present, would reach the
consumer faster than if the water is left to stand in pipes for several hours. During stagnation,
pathogens would be exposed to microbial growth, a known inactivating factor for viruses
(Cliver and Herrmann 1972, Hurst 1988a,b). They would also be exposed to leaching chemicals
from pipes. Most of the buging installed was copper and it has been reported that this type of
pipe can inactivate viruses and bacteria (Yahya et al. 1991, Abad et al. 1994).
W hile the water entering the plant was extremely contaminated we were unable to detect
pathogens or indicators in the treated water. Water obtained directly at the plant and bottled was
not affected by the distribution system. Any observed increase in this group would have
indicated that the source of the illnesses was insufficient treatment at the plant resulting in the
introduction of pathogens: this was rarely the case. In a previous study, we have observed a
correlation between disease and bacteria growing at 35ÊC in water produced by domestic
reverse-osmosis units (Payment et al. 1991a). It was thus quite surprising that in fact subjects
in this group generally experienced no increase in illness, but this could be due to different
bacterial populations in the tap and the RO-units. Bacteria detected in the RO-units were mainly
bacteria growing on the rubber substrate in the reservoir provided with these units. Bacteria in
the bottled plant water were bacteria common in tap water and in the distribution system: our
observation might indicate that bacterial regrowth in distribution systems and pipes could be
more beneficial than hazardous.
Significance of group differences
For subjects who drank bottled plant or purified water, it could be argued that their lower level
of reported illness is because they assumed that they were drinking high quality water (i.e. `if
it is bottled, it is better’ ). However, subjects consuming bottled plant water and having the
28 Payment et al.
lowest rate of symptoms ranked their water as of poor quality based on taste and odor while
those in the tap-valve group with the highest rate of symptoms were the ones who ranked their
water as being of `very good quality’ (i.e. continuously flowing water was less likely to have bad
taste or odor).
Subjects in the two bottled water groups were still drinking a significant proportion of tap
water, accounting for about 40% of their water consumption (Table 10). This is higher than
our earlier data which had showed only 20 ±30% tap water consum ption in the RO group
during the 1988±89 study (Payment et al. 1991b). In 1988±89, RO-filters had been installed
under the kitchen sink of each household and RO-treated water was always available from
a small tap located on the sink itself. In the current protocol, subjects had to physically get
a 4-l container of water from the refrigerator or the counter to obtain their drinking water.
It appears that this procedure was more cumbersome and resulted in having many subjects
get their water directly from the tap, a simpler procedure. As all subjects were originally tap
water consumers (one of the criteria for enrollment), it appears that they often reverted to
this source of drinking water. This has an overall conservative effect, as it reduced the
difference that could be observed by exposing subjects in these groups to tap water
contaminants. Any difference reported here or earlier must be recognized as being an
underestimation of any health effects. If our point estimates are accurate, then water-related
illness might have been 50% higher among tap water consumers than among the bottled water
consumers.
The fact that the rate of HCGI in the Plant group was equivalent or less than the PW group
suggests that the distribution system might be the source of the differences observed. Analysis
of the data and correlation of the HCGI rate in the families with the residence time of the
water in the distribution system did not reveal any link. This suggests that bacterial regrowth
in the distribution system is probably not the cause for the illnesses observed. If it were, the
longer residence time and the ensuing bacterial regrowth might have shown some correlation.
While som e regrowth did occur, the residence time never exceeded 34 h, a relatively short
period that would not result in high bacterial counts such as those encountered in the bottled
plant water.
The results of this epidemiological study appear to support and confirm that tap water is a
significance source of gastrointestinal illnesses even if it meets all current drinking water quality
criteria. Over the observation period, the fraction of these illnesses attributable to tap water
consumption was 14 ±19%. During certain subperiods, one in December 1993 and the other in
April 1994, the average monthly relative risk reached 2.0±2.5, sugggesting that part of the effect
observed could be the results of two episodes of contamination of the water. Most of the
observed effects were due to illnesses reported in children 2±5 years old in which an estimated
17±40% of the infections were attributable to drinking water.
Contrary to what was expected, installing a purge valve to enhance water flow and
maintaining water to a quality equivalent to the water in the distribution system resulted in an
increase in reported illnesses. This points to the distribution system as the major source of the
unknown etiologic agent(s) responsible for the reported illnesses. The usually short duration of
the illnesses suggests a viral origin. We were however unable to detect any microorganism in the
finished water and CT values attained at the plant were at the levels currently recommended.
Water from the distribution system did not contain bacteriological indicators of contamination,
but it was not tested for viral and parasitic contaminants. Finally, contrary to our hypothesis that
regrowth of bacterial contaminants in household pipes could be a health risk, we have shown
that it might in fact have a protective effect.

Gastrointestinal health effects of tap water 29
Acknowledgements
The authors want to acknowledge the time and efforts of the members of the project advisory
committee that was formed to review the proposal and numerous reports that were produced
during the course of this study. Their advice and com ments helped make this project a success.
The authors are also indebted to more than 100 individuals who reviewed the original
proposal(s) and helped by providing their constructive comments. The authors also acknowledge
the numerous people who were involved in the technical and daily aspects of this work.
This paper is based upon work supported by the following agencies: United States
Environmental Protection Agency (Cooperative agreement #CR820446-01), American Water
Works Association Research Foundation (Contract #919-93 ), National Water Research Institute
(Award No. HRA 699-510-95), Health Canada, Compagnie G…n…rale des Eaux (France), Institut
Armand-Frappier (Universit… du Qu…bec). Any opinions, findings, conclusions or recom menda-
tions expressed in this material are those of the author(s) and do not necessarily reflect the views
of these agencies.
References
Abad, F.X., Pinto, R.M., Diez, J.M. and Bosch, A. (1994) Disinfection of human enteric viruses in water
by copper and silver in combination with low levels of chlorine. Appl. Environ. Microbiol. 60,
2377±83.
American Public Health Association (1992) Standard Methods for the Examination of Water and
Wastewater, 18th edn. Washington, DC: American Public Health Association.
Anonymous (1994) Guidelines for Canadian Drinking Water Quality. Ottawa, Canada: Health Canada.
Armon, R. and Payment, P. (1988) A modified m-CP medium for the enumeration of Clostridium
perfringens from water samples. Can. J. Microbiol. 34, 78±9.
Batik, O., Craun, G.F. and Pipes, W.O. (1983) Routine coliform monitoring and water borne disease
outbreaks. H. Environ. Health 45, 227±30.
Batik, O., Craun, G.F., Tuthil, R.W. and Kroemer, D.F. (1979) An epidemiologic study of the relationship
between hepatitis A and water supply characteristics and treatment. Am. J. Public Health 70,
167±9.
Bisson, J.W. and Cabelli, V.J. (1979) Membrane filter enumeration method for Clostridium perfringens.
App. Environ. Microbiol. 37, 55±66.
Bloch, A.B., Stramer, S.L., Smith, J.D., Margolis, H.S., Fields, T.W., McKinley, C.P., Gerba, J.E.,
Maynard, J.E. and Sikes, R.K. (1990) Recovery of hepatitus A virus from a water supply
responsible for a common source outbreak of hepatitis A. Am. J. Public Health 80, 428±30.
Cliver, D.O. and Herrmann, J.E. (1972) Proteolytic and microbial inactivation of enteroviruses. Water Res.
6, 797±805.
Collin, J.F., Milet, J.J., Morlot, M. and Foliguet, J.M. (1981) Eau d’ adduction et gastroent…rites en
Meurthe-et-Moselle. J. Franc. Hydrologie 12, 155±74.
Craun, G.F. (1990) Causes of waterborne outbreaks in the United States. Water Sci. Technol. 22,
89±98.
Crump, K.S. and Guess, H.A. (1982) Drinking water and cancer: review of recent epidemiological findings
and assessment of risks. Ann. Rev. Public Health 3, 339±57.
Federal Register (1989) Part II and III, Environmental Protection Agency, 40FCR Parts 141 and 142.
National Primary Drinking Water Rules and Regulations. Total coliforms 54 (124) pp.27487±
568.
Frome, E.L. (1983) The analysis of rates using Poisson regression models. Biometrics 139, 665±74.
Garthright, W.E., Archer, D.L. and Kvenberg, J.E. (1988) Estimates of incidence and costs of intestinal
infectious diseases. Public Health Rep. 103, 107±16.

30 Payment et al.
Hayes, E.B., Matte, T.D., O’ Brien, T.R., McKinley, T.W., Logdson, G.S., Rose, J.B., Ungar, B.L.P., Word,
D.M., Pinsky, P.F., Cummings, M.L., Wilson, M.A., Long, E.G., Hurwitz, E.S. and Juranek, D.D.
(1989) Large community outbreak of cryptosporidiosis due to contamination of a filtered public
water supply. N. Engl. J. Med. 320, 1372±6.
Hodges, R.G., McCorkle, L.P., Badger, G.F., Curtiss, C., Dingle, J.H. and Jordan, W.S. (1956) A study of
illness in a group of Cleveland families. XI. The occurrence of gastrointestinal symptoms. Am. J.
Hyg. 64, 349±56.
Hurst, C.J. (1988a) Effect of environmental variables on enteric virus survival in surface freshwaters.
Water Sci. Technol. 20, 473±76.
Hurst, C.J. (1988b) Fate of viruses during wastewater sludge treatment processes. CRC Crit. Rev. Environ.
Cont. 18, 317±43.
Kramer, M.H., Herwaldt, B.L., Craun, G.F., Calderon, R.L. and Juranek, D.D. (1996) Surveillance for
waterborne disease outbreaks, United States, 1993±94. J. Am. Water Works Assoc. 88, 66±80.
Mackenzie, W.R., Hoxie, N.J., Proctor, M.E., Gradus, M.S., Blair, K.A., Peterson, D.E., Kazmierczak,
D.G., Addiss, K.R., Fox, J.B and Davis, J.P. (1994) A massive outbreak in Milwaukee of
Cryptosporidium infection transmitted through the public water supply. N. Engl. J. Med. 331,
161±7.
McCullagh, P. and Nelder, J.A. (1983) Generalized Linear Models, pp. 327±8. London: Chapman &
Hall.
Monto, A.S. and Koopman, J.S. (1980) The Tecumseh Study: II. Occurrence of acute enteric illness in the
community. Am. J. Epidemiol. 112, 323±33.
Monto, A.S., Koopman, J.S., Longini, I.M. and Isaacson, R.E. (1983) The Tecumseh study. XII. Enteric
agents in the community, 1976±1981. J. Inf. Dis. 148, 284±91.
Morris, R.D., Audet, A.M., Angelillo, I.F., Chalmers, T.C. and Mosteller, F. (1992) Chlorination,
chlorination by-products, and cancer: a meta-analysis. Am. J. Public Health 82, 955±63.
Payment, P. (1991) Antibody levels to selected enteric viruses in a French-Canadian population in the
Province of Quebec (Canada). Immunol. Infect. Dis. 1, 317±22.
Payment, P., B…rub…, A., Perreault, D., Armon, R. and Trudel, M. (1989) Concentration of Giardia lamblia,
Legionella pneumophila, Clostridium perfringens, enteric viruses and coliphages from large
volumes of drinking water. Can. J. Microbiol. 35, 932±5.
Payment, P., Franco, E., Richardson, L. and Siemiatycki, J. (1991a) Gastrointestinal health effects
associated with the consumption of drinking water produced by point-of-use domestic reverse-
osmosis filtration units. Appl. Env. Microbiol. 57, 945±8.
Payment, P., Richardson, L., Siemiatycki, J., Dewar, R., Edwardes, M. and Franco, E. (1991b) A
randomized trial to evaluate the risk of gastrointestinal disease due to the consumption of drinking
water meeting currently accepted microbiological standards. Am. J. Public Health 81, 703±8.
Payment, P., Franco, E. and Fout, G.S. (1994) Incidence of Norwalk virus infections during a prospective
epidemiological study of drinking water-related gastrointestinal illnesses. Can. J. Microbiol. 40,
805±9.
Payment, P., Coffin, E. and Paquette, G. (1994) Blood agar to detect virulence factors in tap water
heterotrophic bacteria. Appl. Environ. Microbiol. 60, 1179±83.
Payment, P. and Franco, E. (1993) Clostridium perfringens and somatic coliphages as indicators of the
efficiency of drinking water treatment for viruses and protozoan cysts. Appl. Environ. Microbiol.
59, 2418±24.
Payment, P., Franco, E. and Siemiatycki, J. (1993) Absence of relationship between health effects due to
tap water consumption and drinking water quality parameters. Water Sci. Technol. 27, 137±43.
Riley, T.C. (1995) Water chlorination and lipo-apolipoproteins: the relationship in elderly white women of
western Pennsylvania. Am. J. Public Health 85, 570±3.
Roberts, T. and Foegeding, P.M. (1991) Risk assessment for estimating the economic costs of foodborne
diseases caused by microorganisms. In Economics of Food Safety (J.A. Caswell, ed.), pp. 103±30.
New York: Elsevier.

Gastrointestinal health effects of tap water 31
Rotbart, H.A., ed. (1995) Human Enterovirus Infections. Washington, DC: ASM Press.
Smith, H.V., Patterson, W.J., Hardie, R., Greene, L.A., Benton, C., Tulloch, W., Gilmour, R.A., Girdwood,
R.W.A., Sharp, J.C.M. and Forbes, G.I. (1989) An outbreak of waterborne cryptosporidiosis
caused by post-treatment contamination. Epidemiol. Infect. 103, 703±15.
Smith, H.V. and Smith, P.G. (1990) Parasitic protozoa in drinking water. Endeavour 14, 74±9.
Wilson, R., Anderson, L.J., Holman, R.P., Gary, C.W. and Greenberg, H.B. (1982) Waterborne
gastroenteritis due to the Norwalk agent: clinical and epidemiologic investigation. Am. J. Public
Health 72, 72±8.
Zmirou, D., Ferley, J.P., Collin, J.F., Charrel, M. and Berlin, J. (1987) A follow-up study of gastrointestinal
diseases related to the consumption of bacteriologically substandard drinking water. Am. J. Public
Health 77, 582±4.
Yahya, M.T., Straub, T.M., Gerba, C.P. and Margolin, A.B. (1991) Inactivation of bacteriophage ms-2 and
poliovirus in copper, galvanized and plastic domestic water pipes. Int. J. Environ. Health Res. 1,
76±86.