District HIV/AIDS Epidemiological Profiles
71
India’s voice against AIDS Ministry of Health & Family Welfare, Government of India 6 th & 9 th Floors, Chandralok Building, 36, Janpath, New Delhi - 110001 www.naco.gov.in National AIDS Control Organisation FACT SHEETS Gujarat District HIV/AIDS Epidemiological Profiles developed through Data Triangulation District HIV/AIDS Epidemiological Profiles developed through Data Triangulation FACT SHEETS Gujarat VERSION 1.0 GOI/NACO/SIM/DEP/011214
-
Upload
khangminh22 -
Category
Documents
-
view
1 -
download
0
Transcript of District HIV/AIDS Epidemiological Profiles

India’s voice against AIDS Ministry of Health & Family Welfare, Government of India
6th & 9th Floors, Chandralok Building, 36, Janpath, New Delhi - 110001www.naco.gov.in
National AIDS Control Organisation
FACT SHEETSGujarat
District HIV/AIDS Epidemiological Profilesdeveloped through Data Triangulation
District HIV/AIDS Epidemiological Profilesdeveloped through Data Triangulation
FACT SHEETSGujarat
VERSION 1.0 GOI/NACO/SIM/DEP/011214

Published with support of the Centers for Disease Control and Prevention under Cooperative Agreement No. 3U2GPS001955 implemented by FHI 360

India’s voice against AIDS Ministry of Health & Family Welfare, Government of India
6th & 9th Floors, Chandralok Building, 36, Janpath, New Delhi - 110001www.naco.gov.in
December 2014
National AIDS Control Organisation
district HIV/AIDS Epidemiological Profilesdeveloped through Data Triangulation
FACT SHEETS
Gujarat


(Dr. Ashok Kumar)iii
FOREWORDThe national response to HIV/AIDS in India over the last decade has yielded encouraging outcomes in terms of prevention and control of HIV. However, in recent years, while declining HIV trends are evident at the national level as well as in most of the States, some low prevalence and vulnerable States have shown rising trends, warranting focused prevention efforts in specific areas.
The National AIDS Control Programme (NACP) is strongly evidence-based and evidence-driven. Based on evidence from ‘Triangulation of Data’ from multiple sources and giving due weightage to vulnerability, the organizational structure of NACP has been decentralized to identified districts for priority attention.
The programme has been successful in creating a robust database on HIV/AIDS through the HIV Sentinel Surveillance system, monthly programme reporting data and various research studies. However, the district level focus of the programme demands consolidated information that helps better understand HIV/AIDS scenario in each district, to enable effective targeting of prevention and treatment interventions to the vulnerable population groups and geographic areas.
Information collected and analysed during the extensive data triangulation exercise conducted during 2009-10 and 2010-11 and updated data from recent years has been the basis for this technical document on District HIV Epidemiological Profiling. For each district it consists of a brief narrative report on the district background, the HIV/ AIDS epidemic profile of the district based on the updated information compiled from all the available sources, and key recommendations based on the identified information gaps and areas for programme interventions. I strongly feel that this document will be highly useful for programme managers at district, State and national levels.
The major outcomes of this exercise were systematic compilation of the available data for a district at one place, identification of information gaps for effective strategic planning at district level, and development of a framework for re-prioritisation of districts under the programme. The other key achievements were institutional strengthening, capacity building of programme staff in data analysis and data use, and involvement and ownership of staff of service delivery units in the entire process.
We congratulate the efforts made by the National Technical Team, the State AIDS Control Societies, and the State Coordinating agencies and all the district level personnel involved in the process. The technical & financial support provided by our partner agencies UNAIDS, USAID, BMGF and PHFI for this exercise is gratefully acknowledged. Special thanks to the officers from CDC, FHI 360, WHO, UNAIDS & JSI for their efforts in finalizing the individual factsheets. The efforts of the Officers of Data Analysis & Dissemination Unit at NACO for planning, coordinating & successfully completing this process and bringing out this valuable document, are appreciated.
Dr. Ashok Kumar, M.D.F.I.S.C.D & F.I.P.H.A
Dy. Director GeneralTele : 91-11-23731956Fax : 91-11-23731746E-mail : [email protected]

AcknowledgementUnder the project ‘District Epidemiological Profiling’ using Data Tringulation, the National AIDS Control Organisation had undertaken a systematic compilation and analysis of all the available data for 539 districts of the country from multiple sources, including surveillance data and programme data, to derive meaningful inferences. This document is an outcome of the Data Triangulation excercise and provides the district-wise HIV epidemic summary and programme response.
This enormous task would not have been possible without the involvement and ownership of district level programme managers and staff of service delivery units. The contributions of the District AIDS Prevention and Control Unit teams (Programme Managers, M&E Officers), ICTC Supervisors, Counselors, Targeted Intervention staff, ART Research Officers, NRHM District Programme Officers and others who were actively involved in the entire process, are highly appreciated.
The collaborative effort of the State Coordinating Agencies and the State AIDS Control Societies (SACS) involved in identifying programme questions, performing quality checks and data validation, preparation of data tables and compiling data for development of district profile reports, is sincerely acknowledged. The efforts of Deputy Director (M&E), State Epidemiologists and M&E Officers of SACS who implemented this exercise under the guidance and leadership of the Project Directors and Additional Project Directors are also appreciated.
The efforts made by the National Technical Team members who developed guidelines and tools for undertaking this project, and the teams involved in finalizing the database for each district and in preparing the district factsheets, are highly commendable.
The technical & financial support provided by our partner agencies UNAIDS, USAID, BMGF and PHFI for this exercise is gratefully acknowledged. Special thanks to the officers from CDC, FHI 360, WHO, UNAIDS & JSI for their sincere efforts in finalizing the individual district database and factsheets.
Role of Officers of Data Analysis & Dissemination Unit at NACO are deeply appreciated for planning, coordinating & successfully completing this process and bringing out this valuable document.
iv

Contents
v
Introduction ............................................................. 1
Methodology ........................................................... 2
Specific Notes on Fact sheets .................................... 6
District Map of Gujarat ........................................... 9
1. Ahmedabad ................................................... 10
2. Amreli ............................................................ 12
3. Anand ............................................................ 14
4. Banaskantha .................................................. 16
5. Bharuch ......................................................... 18
6. Bhavanagar ................................................... 20
7. Dahod ........................................................... 22
8. Gandhinagar ................................................. 24
9. Jamnagar ...................................................... 26
10. Junagadh ...................................................... 28
11. Kutch ............................................................. 30
12. Kheda ............................................................ 32
13. Mahesana ..................................................... 34
14. Narmada ....................................................... 36
15. Navsari .......................................................... 38
16. Panchmahals ................................................. 40
17. Patan ............................................................. 42
18. Porbandar ...................................................... 44
19. Rajkot ............................................................ 46
20. Sabarkantha ................................................... 48
21. Surat .............................................................. 50
22. Surendranagar ............................................... 52
23. The Dangs ...................................................... 54
24. Vadodra ......................................................... 56
25. Valsad ............................................................ 58
Foreword ............................................................................................................................................. iii
Acknowledgement .............................................................................................................................. iv
Contents ........................................................................................................................................... v
Acronyms ........................................................................................................................................... vi
Glossary ............................................................................................................................................... vii

Acronyms
vi
AIDS Acquired Immune Deficiency Syndrome
ANC Antenatal Clinic
ART Anti-Retroviral Therapy
BSS Behavioral Surveillance Survey
CCC Community Care Centre
CMIS Computerised Management Information System
DEP district Epidemiological Profile
DIC Drop-in-Centre
DLHS district Level Health Survey
DLN district Level Network for HIV positive people
FSW Female Sex Workers
HIV Human Immunodeficiency Virus
HRG High Risk Group
HSS HIV Sentinel Surveillance
IBBA Integrated Biological and Behavioral Assessment
IBBS Integrated Biological and Behavioral Survey
ICTC Integrated Counseling and Testing Centre
IDU Injecting Drug Users
IEC Information Education & Communication
LAC Link ART Centre
MSM Men who have Sex with Men
NACO National AIDS Control Organisation
NACP National AIDS Control Programme
NFHS National Family Health Survey
PLHIV People Living with HIV
PPTCT Prevention of Parent to Child Transmission
RRC Red Ribbon Club
RTI Reproductive Tract Infection
SACS State AIDS Control Society
SCA State Coordinating Agency
STD Sexually Transmitted Disease
STI Sexually Transmitted Infection
TB Tuberculosis
TI Targeted Interventions
Glossary1. ART Centre: Free first line and second line Anti-Retroviral Treatment (ART) is provided to clinically eligible PLHIV
at designated centres across the country. As soon as the persons are detected to be HIV positive at ICTC, they are referred to the ART centre for pre-ART registration. At the time of registration, all the baseline investigations are done including CD4 count. If these persons are clinically eligible for treatment, they are started on first line ART. Otherwise, PLHIV are followed up every six months for CD4 count. The number of PLHIV on ART mentioned in the document refers to those on first line ART at NACO-supported ART centres. Another 30,000 PLHIV are estimated to be receiving ART in the private sector.
2. Blood Safety: Under the Blood Safety programme, Blood Banks across the country are supported by NACO and voluntary blood donation is strongly promoted to ensure that every blood unit collected is screened and is free from HIV and other infections.
3. Community Care Centres (CCC): CCC have been set up in the non-government sector with the objective of providing PLHIV with psychosocial support, counseling for drug adherence and nutrition, treatment of opportunistic infections, home-based care, referral and outreach services for follow up, besides tracing patients lost to follow up and those missing anti-retroviral drugs as per schedule.
4. Condom Promotion: The condom promotion strategy under NACP focuses on two aspects: ensuring availability of and creating demand for condoms. There are two channels of condom supply by the Government, namely free and socially marketed. Under the programme, free condoms are distributed to High Risk Groups through TI projects and service delivery outlets such as ICTCs, STI clinics, etc. Under the Targeted Condom Social Marketing Programme, condoms are provided at subsidized rates for HRG as well as general population through traditional and non-traditional condom outlets, rural outlets, and outlets at TIs and truck halt points.
5. Core Composite TI: Targeted Interventions providing HIV prevention services to more than one High Risk Group.
6. Counseling and Testing Services: Integrated Counseling and Testing Centre (ICTC) is a place where a person is counseled and tested for HIV on his/her own volition (Client-Initiated) or as advised by a health service provider (Provider-Initiated) in a supportive and confidential environment. These centres are the entry points for reinforcing HIV prevention messages and linking HIV positive people to HIV care, support and treatment services. There are several contexts for providing HIV testing services - voluntary counseling and testing, prevention of parent to child transmission, screening of TB patients and diagnostic testing of symptomatic patients.
7. Drop-in-Centre (DIC): DIC is a platform to provide PLHIV psycho-social support, linkages with services counseling on drug adherence, nutrition, livelihood and legal issues. They have been set up in the high prevalent districts and are managed primarily by PLHIV networks.
8. High Risk Groups (HRG): Populations with high risk behaviour for contracting HIV, include Female Sex Workers (FSW), Men who have Sex with Men (MSM) and Injecting Drug Users (IDU). The other risk groups identified as Bridge Population (between the General population and HRG) include the Single Male Migrants and Long Distance Truckers.
vii

IntroductionThe National AIDS Control Programme under National AIDS Control Organisation has a strong focus on district level planning, implementation and monitoring of interventions for prevention and control of HIV/AIDS. This approach requires consolidated information for each district to understand the HIV epidemic scenario and to identify programme areas for priority attention.
During the past few years, greater information related to HIV has become available for a substantial number of districts in the country in the form of monthly programme reports, mapping and size estimations of risk groups, data from HIV Sentinel Surveillance, behavioural surveys research studies, and etc.
In view of this context, the Department of AIDS Control had undertaken a project titled “Epidemiological Profiling of HIV/ AIDS Situation at district and Sub-district Level using Data Triangulation”/“district Epidemiological Profiling (DEP)” in 25 states (539 districts) in two phases during 2009-10 and 2010-11.
The exercise of district Epidemiological Profiling involved two broad components – Descriptive Analysis and Data Triangulation. The former part is guided by thematic areas and describes the ‘what, who, when & where’ of the HIV epidemic, while the latter ‘Triangulation’ part explains the ‘how and why’ of it by synthesizing data from multiple sources into a meaningful framework. The available epidemiological data, behavioural/ vulnerability data and programme data for the district level were compiled and analysed to get a comprehensive picture of the HIV/AIDS epidemic scenario, in order to guide programme decisions appropriately in each district.
The important outcomes of the district Epidemiological Profiling exercise included the generation of reports describing the HIV profile and programme response in each district, identification of information gaps for planning strategic information activities, capacity building of district level personnel in data management, institutional strengthening and fostering linkages between programme units and academic institutions for addressing strategic information needs in the programme.
This technical document consists of the epidemiological profile summary along with the available updated information for each district of the State. Each district summary highlights the key epidemiological features of the district and key recommendations based on these findings. The document would be useful to programme managers, academicians and researchers as a quick reference for the HIV/AIDS situation in a district.
Introduction9. Link ART Centres: In order to facilitate the delivery of ART services nearer to the homes of beneficiaries, the Link ART Centres (LAC), located mainly at ICTC in the district/Sub-district level hospitals, were set up and linked to nodal ART centres within accessible distance.
10. PLHIV Networks: Networks of HIV positive persons have been formed at the national, state and district levels. Such networks act as platforms for People Living with HIV/AIDS (PLHIV) to share their concerns, and seek support and legal aid. They address stigma and discrimination-related cases among their members and also provide social support for those isolated by their family and community. The networks are encouraged to advocate and promote the utilisation of HIV related services.
11. Prevention of Parent to Child Transmission (PPTCT): Mother to child transmission of HIV may take place during pregnancy, during childbirth or through breast feeding. To prevent this, under the PPTCT programme every pregnant woman visiting antenatal clinics or visiting hospital at the time of delivery is tested for HIV infection. A pregnant woman found positive for HIV infection is closely followed up to ensure institutional delivery. At the time of delivery, the pregnant woman and the new-born baby are given a single dose of Nevirapine to prevent mother to child transmission of HIV.
12. Red Ribbon Clubs: Red Ribbon Clubs (RRC) formed in colleges provide a forum for students to come together to share information on HIV/AIDS and safe behaviours, to discuss related issues and also motivate them to participate in voluntary blood donation.
13. STI/RTI Services: Sexually Transmitted Infections/Reproductive Tract Infections increase the risk of HIV transmission significantly. STI/RTI services are aimed at preventing HIV transmission and promoting sexual and reproductive health under the National AIDS Control Programme and the Reproductive and Child Health programme of the National Rural Health Mission (NRHM).
14. Targeted Intervention: Targeted Interventions (TI) are peer-led preventive interventions focused on HRG and bridge populations, implemented by Non-Government Organisations and Community-based Organisations in a defined geographic area. They provide prevention services such as behavioural change communication, condom distribution, STI/RTI services, needle and syringe exchange, Opioid substitution therapy, referrals and linkages to health facilities providing HIV/AIDS services, community mobilisation and creating enabling environment.
viii

District HIV/AIDS Epidemiological Profiles : Gujarat | 1
IntroductionThe National AIDS Control Programme under National AIDS Control Organisation has a strong focus on district level planning, implementation and monitoring of interventions for prevention and control of HIV/AIDS. This approach requires consolidated information for each district to understand the HIV epidemic scenario and to identify programme areas for priority attention.
During the past few years, greater information related to HIV has become available for a substantial number of districts in the country in the form of monthly programme reports, mapping and size estimations of risk groups, data from HIV Sentinel Surveillance, behavioural surveys research studies, and etc.
In view of this context, the Department of AIDS Control had undertaken a project titled “Epidemiological Profiling of HIV/ AIDS Situation at district and Sub-district Level using Data Triangulation”/“district Epidemiological Profiling (DEP)” in 25 states (539 districts) in two phases during 2009-10 and 2010-11.
The exercise of district Epidemiological Profiling involved two broad components – Descriptive Analysis and Data Triangulation. The former part is guided by thematic areas and describes the ‘what, who, when & where’ of the HIV epidemic, while the latter ‘Triangulation’ part explains the ‘how and why’ of it by synthesizing data from multiple sources into a meaningful framework. The available epidemiological data, behavioural/ vulnerability data and programme data for the district level were compiled and analysed to get a comprehensive picture of the HIV/AIDS epidemic scenario, in order to guide programme decisions appropriately in each district.
The important outcomes of the district Epidemiological Profiling exercise included the generation of reports describing the HIV profile and programme response in each district, identification of information gaps for planning strategic information activities, capacity building of district level personnel in data management, institutional strengthening and fostering linkages between programme units and academic institutions for addressing strategic information needs in the programme.
This technical document consists of the epidemiological profile summary along with the available updated information for each district of the State. Each district summary highlights the key epidemiological features of the district and key recommendations based on these findings. The document would be useful to programme managers, academicians and researchers as a quick reference for the HIV/AIDS situation in a district.
Introduction9. Link ART Centres: In order to facilitate the delivery of ART services nearer to the homes of beneficiaries, the Link ART Centres (LAC), located mainly at ICTC in the district/Sub-district level hospitals, were set up and linked to nodal ART centres within accessible distance.
10. PLHIV Networks: Networks of HIV positive persons have been formed at the national, state and district levels. Such networks act as platforms for People Living with HIV/AIDS (PLHIV) to share their concerns, and seek support and legal aid. They address stigma and discrimination-related cases among their members and also provide social support for those isolated by their family and community. The networks are encouraged to advocate and promote the utilisation of HIV related services.
11. Prevention of Parent to Child Transmission (PPTCT): Mother to child transmission of HIV may take place during pregnancy, during childbirth or through breast feeding. To prevent this, under the PPTCT programme every pregnant woman visiting antenatal clinics or visiting hospital at the time of delivery is tested for HIV infection. A pregnant woman found positive for HIV infection is closely followed up to ensure institutional delivery. At the time of delivery, the pregnant woman and the new-born baby are given a single dose of Nevirapine to prevent mother to child transmission of HIV.
12. Red Ribbon Clubs: Red Ribbon Clubs (RRC) formed in colleges provide a forum for students to come together to share information on HIV/AIDS and safe behaviours, to discuss related issues and also motivate them to participate in voluntary blood donation.
13. STI/RTI Services: Sexually Transmitted Infections/Reproductive Tract Infections increase the risk of HIV transmission significantly. STI/RTI services are aimed at preventing HIV transmission and promoting sexual and reproductive health under the National AIDS Control Programme and the Reproductive and Child Health programme of the National Rural Health Mission (NRHM).
14. Targeted Intervention: Targeted Interventions (TI) are peer-led preventive interventions focused on HRG and bridge populations, implemented by Non-Government Organisations and Community-based Organisations in a defined geographic area. They provide prevention services such as behavioural change communication, condom distribution, STI/RTI services, needle and syringe exchange, Opioid substitution therapy, referrals and linkages to health facilities providing HIV/AIDS services, community mobilisation and creating enabling environment.
viii

2 | District HIV/AIDS Epidemiological Profiles : Gujarat
MethodologyFramework of district Epidemiological Profiling (DEP): DEP has two broad components Descriptive Analysis and Data Triangulation.
Descriptive analysis of different datasets is organized into the following four thematic areas (Fig.1):
1. Current state of HIV epidemic (levels, trends, differentials and burden of HIV; profle of PLHIV)
2. Drivers of the epidemic (size and profle of risk groups; vulnerabilities STI, risk behaviour, Migration, contextual factors/regional vulnerabilities)
3. Programme response and gaps
4. Information gaps
Data Triangulation may be of information on same data element from different data sources or of information on different data elements. Triangulation may be done in the time plane or geographical plane. Triangulation synthesizes the data on the following three elements to explain the inferences arrived at in the descriptive analysis and provides answers to the programmatic questions.
1. Information on HIV and STIs in different population groups (epidemiological data)
2. Information on vulnerabilities (mapping and behavioural data on Risk Groups, district vulnerabilities)
3. Information on programme response (programme data)
Table 1: Components of district Epidemiological Profiling
Fig. 1: Thematic Areas of district ProfilingEpidemiological Framework of HIV/AIDS Scenario in the district
Componentsof district
ProlingWhat it Does?
GuidingElements
Action To Do Output
DescriptiveAnalysis
Describes(What? Who? When?
Where?)Themes
Analyse Data &Describe the Themes
Descriptive Section ofdistrict Report
TriangulationExplains
(How? Why?)Questions
Triangulate Data &Answer the Questions
Synthesis Section ofdistrict Report
Current State of Epidemic
ProgrammeResponse &
Gaps
InformationGaps
Drivers ofEpidemic
districtProfile
Concept of Data Triangulation: Data Triangulation is an Analytical Approach that synthesizes data from multiple sources to improve the understanding of a public health issue and guide programmatic decision-making to address the issue (Fig. 2). By putting different bits of information from different sources into a meaningful framework, it explains and improves the understanding of HIV/AIDS scenario in the district. By providing answers to vital programme questions, it helps in taking effective decisions for planning and implementation of HIV prevention and control efforts. It helps to understand the gap between need and programme response and also helps to identify the information gaps that hinder effective planning.
The basic principle of Data Triangulation is “to analyse and interpret a dataset in the light of information emerging from other datasets, so that the synthesis offers a better understanding of the issues than what will be inferred from a single dataset.” Triangulation involves compilation, examination, comparison and collective interpretation of data from multiple independent data sources, followed by reasonable explanation of facts pertaining to the issue under consideration (Fig. 3). The explanation is aimed towards developing a comprehensive picture of the issue, building an epidemiological framework that depicts the possible interplay among various factors and answering some pre-specified questions.
Fig. 2: Conceptual Framework of Data TriangulationSynthesis of Epidemiological, Behavioural and Programme Data
Fig. 3: Schematic representation of processes involved in Data Triangulation
HIV & STIsin Different
Groups
TRIANGULATION
Size &Vulnerability
of RiskGroups
ProgrammeResponse

District HIV/AIDS Epidemiological Profiles : Gujarat | 3
MethodologyFramework of district Epidemiological Profiling (DEP): DEP has two broad components Descriptive Analysis and Data Triangulation.
Descriptive analysis of different datasets is organized into the following four thematic areas (Fig.1):
1. Current state of HIV epidemic (levels, trends, differentials and burden of HIV; profle of PLHIV)
2. Drivers of the epidemic (size and profle of risk groups; vulnerabilities STI, risk behaviour, Migration, contextual factors/regional vulnerabilities)
3. Programme response and gaps
4. Information gaps
Data Triangulation may be of information on same data element from different data sources or of information on different data elements. Triangulation may be done in the time plane or geographical plane. Triangulation synthesizes the data on the following three elements to explain the inferences arrived at in the descriptive analysis and provides answers to the programmatic questions.
1. Information on HIV and STIs in different population groups (epidemiological data)
2. Information on vulnerabilities (mapping and behavioural data on Risk Groups, district vulnerabilities)
3. Information on programme response (programme data)
Table 1: Components of district Epidemiological Profiling
Fig. 1: Thematic Areas of district ProfilingEpidemiological Framework of HIV/AIDS Scenario in the district
Componentsof district
ProlingWhat it Does?
GuidingElements
Action To Do Output
DescriptiveAnalysis
Describes(What? Who? When?
Where?)Themes
Analyse Data &Describe the Themes
Descriptive Section ofdistrict Report
TriangulationExplains
(How? Why?)Questions
Triangulate Data &Answer the Questions
Synthesis Section ofdistrict Report
Current State of Epidemic
ProgrammeResponse &
Gaps
InformationGaps
Drivers ofEpidemic
districtProfile
Concept of Data Triangulation: Data Triangulation is an Analytical Approach that synthesizes data from multiple sources to improve the understanding of a public health issue and guide programmatic decision-making to address the issue (Fig. 2). By putting different bits of information from different sources into a meaningful framework, it explains and improves the understanding of HIV/AIDS scenario in the district. By providing answers to vital programme questions, it helps in taking effective decisions for planning and implementation of HIV prevention and control efforts. It helps to understand the gap between need and programme response and also helps to identify the information gaps that hinder effective planning.
The basic principle of Data Triangulation is “to analyse and interpret a dataset in the light of information emerging from other datasets, so that the synthesis offers a better understanding of the issues than what will be inferred from a single dataset.” Triangulation involves compilation, examination, comparison and collective interpretation of data from multiple independent data sources, followed by reasonable explanation of facts pertaining to the issue under consideration (Fig. 3). The explanation is aimed towards developing a comprehensive picture of the issue, building an epidemiological framework that depicts the possible interplay among various factors and answering some pre-specified questions.
Fig. 2: Conceptual Framework of Data TriangulationSynthesis of Epidemiological, Behavioural and Programme Data
Fig. 3: Schematic representation of processes involved in Data Triangulation
HIV & STIsin Different
Groups
TRIANGULATION
Size &Vulnerability
of RiskGroups
ProgrammeResponse

4 | District HIV/AIDS Epidemiological Profiles : Gujarat
Other key features of the process of Data Triangulation are as follow:
1. It gives importance to every bit of information
2. It helps overcome limitations and biases inherent in each dataset
3. It adds value to each dataset and improves their utility
4. It gives high importance to quality analysis of data and undertakes thorough quality checks and validation
5. Indicates the level of reliability in any inference or conclusion
Table 2: Data Sources used for district Epidemiological Profiling
Thematic areas for HIV Epidemiological Profling
Major Sources
HIV Levels, Trends and Differentials HIV Sentinel Surveillance (HSS); Integrated Biological &Behaviroual Assessment (IBBA); ICTC data; PPTCT data; Bloodbank data; NFHS-III; Any other HIV prevalence studies
STI Levels, Trends and Differentials Behaviroual Surveys (IBBA); STI Clinic data; TargetedIntervention (TI) data; NFHS-I,II & III; DLHS-I ,II & III;Other Behavioral studies
HIV burden in the district HIV estimations
Size Estimates of General Population and Other Risk Groups
Census Population Projections; Mapping of HRG; TI data
Profile, Turn-over & Migration of key risk groups
HSS ;IBBA; BSS; Mapping of HRG ;ICTC data; STI Clinic data; TI data; Other Studies on High Risk Groups; DLHS
Size & Patterns of Migration amongGeneral Population
Census data; Mapping of Migrants; Population Council studies;Other studies on migrants
Risk Behaviours and Prevention Practices among key risk groups and general population
BSS; IBBA; DLHS; TI data; Mapping of HRG; Other published/unpublished data
Profile of PLHIV HSS; IBBA; ICTC data; PPTCT data; ART data; Positive personnetworks; Blood Bank Data; NFHS-III; Any other HIV prevalence studies
District Vulnerabilities Local Knowledge; Open sources such as Wikipedia; districtWebsites; State Government Websites; etc.
Programme Response Programme reporting through CMIS
Process of district Epidemiological Profiling: The process starts with identifying a broad set of important, actionable and appropriate questions that the programme wants to find answers to, in a given region, and revisits and refines the questions at every step of the process. The process of DEP has the following steps:
1. Understanding thematic areas and questions for district Profiling and Triangulation
2. Review of data sources and assessment of data availability in the district
3. Decision on themes to be described and questions to be answered for the district
4. Compilation of secondary data
5. Quality check for completeness, correctness and consistency
6. Data validation, adjustments and filling data gaps
7. Preparation of data tables with clean data for analysis
8. Data analysis, interpretation and inferences; describe thematic areas
9. Data Triangulation (hypotheses building; answer triangulation questions)
10. Preparation of district and State reports
11. Discussions and consultation with SACS, local experts, district level programme managers and service delivery functionaries on draft reports
12. Presentation and discussion of draft reports with the National Technical Team
13. Finalisation of district Epidemiological Profile reports
Important Outcomes of district Epidemiological Profiling include:
1. Cleaning and validation of programme data (since 2004)
2. Systematic compilation of all data related to HIV for each district at one place for routine use
3. district reports describing the profile of HIV epidemic and programme response in each district
4. Development of framework for re-prioritisation of districts under the programme
5. Prioritisation extended upto Sub-district/Block level with high priority blocks identified
6. Identification of information gaps at district and state level for planning strategic Information activities
7. Capacity building of district level programme managers and staff of service delivery units in handling and analyzing data, enabling them to understand the importance of the data they generate and the need for ensuring its quality, and appreciate the use of data for programme review, decision-making and effecting improvements.
8. Enhanced understanding among the programme managers of HIV epidemic and response in the state and different districts
9. Better use of data in developing district and State Annual Action Plans
10. Institutional strengthening (building state level resource pools) and fostering linkages between programme units and academic institutions for addressing Strategic Information needs in the programme

District HIV/AIDS Epidemiological Profiles : Gujarat | 5
Other key features of the process of Data Triangulation are as follow:
1. It gives importance to every bit of information
2. It helps overcome limitations and biases inherent in each dataset
3. It adds value to each dataset and improves their utility
4. It gives high importance to quality analysis of data and undertakes thorough quality checks and validation
5. Indicates the level of reliability in any inference or conclusion
Table 2: Data Sources used for district Epidemiological Profiling
Thematic areas for HIV Epidemiological Profling
Major Sources
HIV Levels, Trends and Differentials HIV Sentinel Surveillance (HSS); Integrated Biological &Behaviroual Assessment (IBBA); ICTC data; PPTCT data; Bloodbank data; NFHS-III; Any other HIV prevalence studies
STI Levels, Trends and Differentials Behaviroual Surveys (IBBA); STI Clinic data; TargetedIntervention (TI) data; NFHS-I,II & III; DLHS-I ,II & III;Other Behavioral studies
HIV burden in the district HIV estimations
Size Estimates of General Population and Other Risk Groups
Census Population Projections; Mapping of HRG; TI data
Profile, Turn-over & Migration of key risk groups
HSS ;IBBA; BSS; Mapping of HRG ;ICTC data; STI Clinic data; TI data; Other Studies on High Risk Groups; DLHS
Size & Patterns of Migration amongGeneral Population
Census data; Mapping of Migrants; Population Council studies;Other studies on migrants
Risk Behaviours and Prevention Practices among key risk groups and general population
BSS; IBBA; DLHS; TI data; Mapping of HRG; Other published/unpublished data
Profile of PLHIV HSS; IBBA; ICTC data; PPTCT data; ART data; Positive personnetworks; Blood Bank Data; NFHS-III; Any other HIV prevalence studies
District Vulnerabilities Local Knowledge; Open sources such as Wikipedia; districtWebsites; State Government Websites; etc.
Programme Response Programme reporting through CMIS
Process of district Epidemiological Profiling: The process starts with identifying a broad set of important, actionable and appropriate questions that the programme wants to find answers to, in a given region, and revisits and refines the questions at every step of the process. The process of DEP has the following steps:
1. Understanding thematic areas and questions for district Profiling and Triangulation
2. Review of data sources and assessment of data availability in the district
3. Decision on themes to be described and questions to be answered for the district
4. Compilation of secondary data
5. Quality check for completeness, correctness and consistency
6. Data validation, adjustments and filling data gaps
7. Preparation of data tables with clean data for analysis
8. Data analysis, interpretation and inferences; describe thematic areas
9. Data Triangulation (hypotheses building; answer triangulation questions)
10. Preparation of district and State reports
11. Discussions and consultation with SACS, local experts, district level programme managers and service delivery functionaries on draft reports
12. Presentation and discussion of draft reports with the National Technical Team
13. Finalisation of district Epidemiological Profile reports
Important Outcomes of district Epidemiological Profiling include:
1. Cleaning and validation of programme data (since 2004)
2. Systematic compilation of all data related to HIV for each district at one place for routine use
3. district reports describing the profile of HIV epidemic and programme response in each district
4. Development of framework for re-prioritisation of districts under the programme
5. Prioritisation extended upto Sub-district/Block level with high priority blocks identified
6. Identification of information gaps at district and state level for planning strategic Information activities
7. Capacity building of district level programme managers and staff of service delivery units in handling and analyzing data, enabling them to understand the importance of the data they generate and the need for ensuring its quality, and appreciate the use of data for programme review, decision-making and effecting improvements.
8. Enhanced understanding among the programme managers of HIV epidemic and response in the state and different districts
9. Better use of data in developing district and State Annual Action Plans
10. Institutional strengthening (building state level resource pools) and fostering linkages between programme units and academic institutions for addressing Strategic Information needs in the programme

6 | District HIV/AIDS Epidemiological Profiles : Gujarat
Specific Notes on Fact sheets 1. Each district fact sheet has two parts: a narrative part consisting of background along with a map, HIV epidemic
profile and key recommendations, and a tabular part consisting HIV levels and trends, PLHIV profile, block-level details, vulnerabilities and programme response. While the narrative part gives an overview of the district HIV/AIDS profile, the table provides detailed information about the HIV/AIDS scenario in the district.
2. ‘Background’ gives a brief overview of the district with respect to its geographic location, key demographic information like total population with male-female distribution, literacy status – based on 2011 Census. The section also describes the district characteristics or contextual factors that makes it vulnerable to spread of HIV.
3. ‘Epidemic profile’ describes the thematic areas mentioned above (under the data sources) for each district based on available information.
4. From DLHS-III, percentages of ever married women aged 15-49 years who have heard of HIV/AIDS and RTI/STI have been taken as awareness indicators among women for HIV and RTI/STI respectively.
5. ‘Key recommendations’ is the final section of the factsheet where ‘Triangulation’ of data is attempted to highlight the key programme priorities for the district based on the HIV epidemic profile and programme gaps. Any future potential for spread of infection, if indicated by any information or results, is highlighted and appropriate action to address the situation is suggested. On the basis of this analysis, recommendations for improving existing programme, and the need for initiation of new programmes, etc. are highlighted. The recommendation section also highlights information gaps, if any.
6. Data on ANC utilization mentioned in the table refer to the proportion of women who received at least three or more antenatal checkups (Data source: DLHS-III).
7. HIV positivity rates among HSS-ANC, PPTCT and Blood Bank attendees are used to represent levels and trends of HIV Infection among general population. Level is interpreted as high (HIV positivity ≥1%), moderate (HIV positivity between 0.5-1%) or low (HIV positivity ≤ 0.5%). HIV trend is interpreted as rising, stable or declining.
8. HIV positivity rates among HSS-HRG, HSS-STD and ICTC general clients disaggregated by sex and nature of client (direct walk-in and referred) are used to represent levels and trends of HIV Infection among high risk groups and vulnerable population. Level is interpreted as high (HIV positivity ≥ 10%), moderate (HIV positivity between 5-10%) or low (HIV positivity ≤ 5%). HIV trend is interpreted as rising, stable or declining.
9. Positivity at HSS, PPTCT, Blood bank and ICTC sites is presented only for those years where the sample size is valid i.e. HSS-ANC: ≥ 300 tested, HSS-HRG/STD: ≥ 187 tested, ICTC (male + female/direct walk-in + referred): ≥ 600 tested, PPTCT and BB: ≥ 900 tested.
10. HIV positivity among PPTCT and ICTC attendees at sub-district level wherever data is available is presented under block level details.
11. Size, demographic and risk profile of PLHIV in a district is inferred from three data sources: ICTC data, ART Registration data and data from the PLHIV Network in the district.
12. Information on major vulnerabilities that are influencing the epidemic/high risk behaviour i.e drivers of the epidemic is included under the “vulnerabilities” section. It includes:
a. Size and Profile of HRG
b. STIs – levels and trends
c. Migration patterns
d. District Vulnerabilities/ Contextual Factors
13. Information on size and profile (demographic or sub-typology) of HRG is available from mapping data. Size of HRG as a proportion of the districts population has been stated wherever available, for comparison purposes. The Taluks/Blocks with high concentration of different HRGs have been given under block level details, wherever available. Targeted Intervention (TI) targets and coverage of HRG population are also mentioned, wherever available under “HRG size”.
14. Based on CMIS-STI data, number of episodes of STI/RTI managed using syndromic approach and VDRL/RPR test results for syphilis in the district are given under “STI/RTI”.
15. Wherever possible, an attempt has been made to describe the male out-migration patterns in the district based on Census 2001 data. The table also includes the proportion of male migrants going to other states (inter-state) along with top five destination districts.
16. The section on programme response describes the number of facilities offering HIV services under NACP and services provided in the district till 2012. This covers both prevention interventions and care, support and treatment interventions.
17. The number of TIs mentioned in the document includes only NACO-supported TIs. Migrant TIs include source, transit and destination TIs.
18. All maps used in this document have been prepared from the Survey of India.
19. The district wise factsheets include updated information till 2012. Therefore, the districts newly created after 2012 have not been shown as separate districts. The districts with insufficient data are also not included in this report.

District HIV/AIDS Epidemiological Profiles : Gujarat | 7
Specific Notes on Fact sheets 1. Each district fact sheet has two parts: a narrative part consisting of background along with a map, HIV epidemic
profile and key recommendations, and a tabular part consisting HIV levels and trends, PLHIV profile, block-level details, vulnerabilities and programme response. While the narrative part gives an overview of the district HIV/AIDS profile, the table provides detailed information about the HIV/AIDS scenario in the district.
2. ‘Background’ gives a brief overview of the district with respect to its geographic location, key demographic information like total population with male-female distribution, literacy status – based on 2011 Census. The section also describes the district characteristics or contextual factors that makes it vulnerable to spread of HIV.
3. ‘Epidemic profile’ describes the thematic areas mentioned above (under the data sources) for each district based on available information.
4. From DLHS-III, percentages of ever married women aged 15-49 years who have heard of HIV/AIDS and RTI/STI have been taken as awareness indicators among women for HIV and RTI/STI respectively.
5. ‘Key recommendations’ is the final section of the factsheet where ‘Triangulation’ of data is attempted to highlight the key programme priorities for the district based on the HIV epidemic profile and programme gaps. Any future potential for spread of infection, if indicated by any information or results, is highlighted and appropriate action to address the situation is suggested. On the basis of this analysis, recommendations for improving existing programme, and the need for initiation of new programmes, etc. are highlighted. The recommendation section also highlights information gaps, if any.
6. Data on ANC utilization mentioned in the table refer to the proportion of women who received at least three or more antenatal checkups (Data source: DLHS-III).
7. HIV positivity rates among HSS-ANC, PPTCT and Blood Bank attendees are used to represent levels and trends of HIV Infection among general population. Level is interpreted as high (HIV positivity ≥1%), moderate (HIV positivity between 0.5-1%) or low (HIV positivity ≤ 0.5%). HIV trend is interpreted as rising, stable or declining.
8. HIV positivity rates among HSS-HRG, HSS-STD and ICTC general clients disaggregated by sex and nature of client (direct walk-in and referred) are used to represent levels and trends of HIV Infection among high risk groups and vulnerable population. Level is interpreted as high (HIV positivity ≥ 10%), moderate (HIV positivity between 5-10%) or low (HIV positivity ≤ 5%). HIV trend is interpreted as rising, stable or declining.
9. Positivity at HSS, PPTCT, Blood bank and ICTC sites is presented only for those years where the sample size is valid i.e. HSS-ANC: ≥ 300 tested, HSS-HRG/STD: ≥ 187 tested, ICTC (male + female/direct walk-in + referred): ≥ 600 tested, PPTCT and BB: ≥ 900 tested.
10. HIV positivity among PPTCT and ICTC attendees at sub-district level wherever data is available is presented under block level details.
11. Size, demographic and risk profile of PLHIV in a district is inferred from three data sources: ICTC data, ART Registration data and data from the PLHIV Network in the district.
12. Information on major vulnerabilities that are influencing the epidemic/high risk behaviour i.e drivers of the epidemic is included under the “vulnerabilities” section. It includes:
a. Size and Profile of HRG
b. STIs – levels and trends
c. Migration patterns
d. District Vulnerabilities/ Contextual Factors
13. Information on size and profile (demographic or sub-typology) of HRG is available from mapping data. Size of HRG as a proportion of the districts population has been stated wherever available, for comparison purposes. The Taluks/Blocks with high concentration of different HRGs have been given under block level details, wherever available. Targeted Intervention (TI) targets and coverage of HRG population are also mentioned, wherever available under “HRG size”.
14. Based on CMIS-STI data, number of episodes of STI/RTI managed using syndromic approach and VDRL/RPR test results for syphilis in the district are given under “STI/RTI”.
15. Wherever possible, an attempt has been made to describe the male out-migration patterns in the district based on Census 2001 data. The table also includes the proportion of male migrants going to other states (inter-state) along with top five destination districts.
16. The section on programme response describes the number of facilities offering HIV services under NACP and services provided in the district till 2012. This covers both prevention interventions and care, support and treatment interventions.
17. The number of TIs mentioned in the document includes only NACO-supported TIs. Migrant TIs include source, transit and destination TIs.
18. All maps used in this document have been prepared from the Survey of India.
19. The district wise factsheets include updated information till 2012. Therefore, the districts newly created after 2012 have not been shown as separate districts. The districts with insufficient data are also not included in this report.

8 | District HIV/AIDS Epidemiological Profiles : Gujarat

District HIV/AIDS Epidemiological Profiles : Gujarat | 9
District Map of Gujarat

10 | District HIV/AIDS Epidemiological Profiles : Gujarat
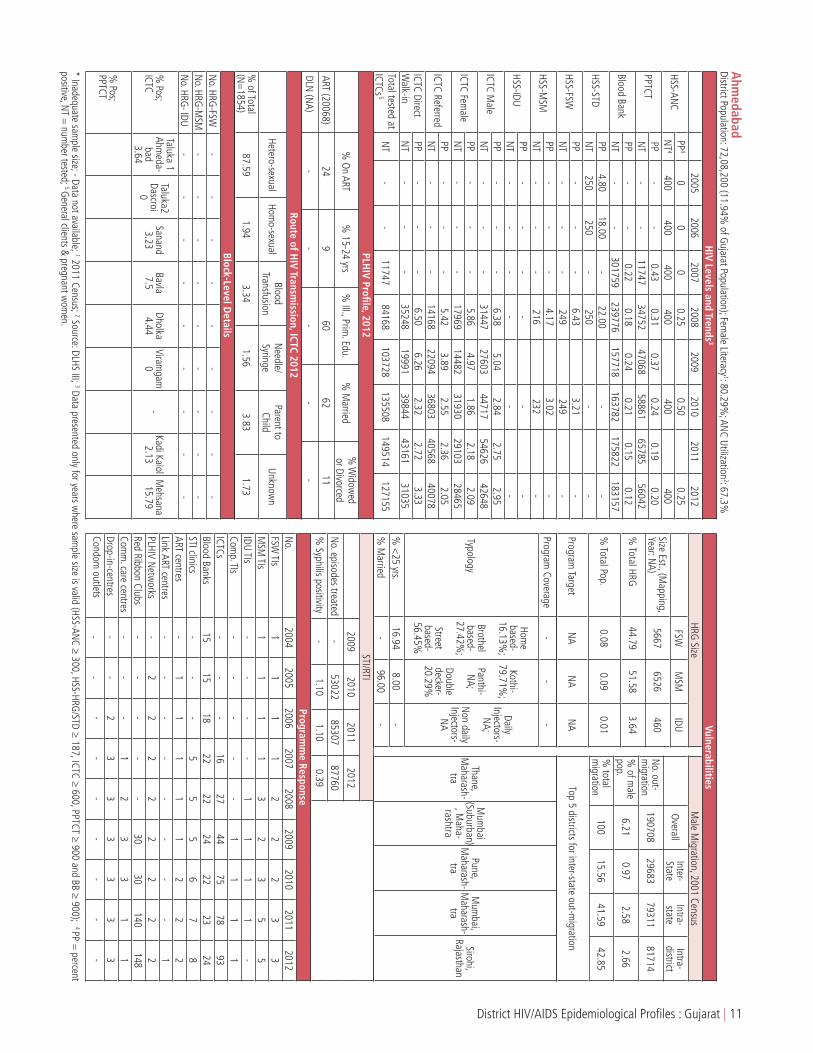
AhmedabadBackground:
Ahmedabad district comprises the city of Ahmedabad, the 7th largest city of India located in the central part of the state of Gujarat. It is the most populous district of Gujarat and the eighth most populous district in India with a population of 72.08 lakh, a sex ratio of 903 females per 1,000 males; female literacy rate of 80.29%, with an overall literacy rate of 86.65% (Census 2011). Ahmedabad is an industrial hub for textiles and is popularly known as the ‘Manchester of India’. Ahmedabad is developing excellent urban infrastructure for services economy which is largely an urban phenomenon. Ahmedabad is the center of Gujarati cultural activities and diverse traditions of different ethnic and religious communities. The district is home to one of the famous World Heritage Site, the Adalaj Vav (Stepwell), and other tourist spots. National Highway 8 passes through the district connecting it to major industrial centers.
HIV Epidemic Profile:
• Basedon2012HSS-ANCdata,HIVprevalencewaslowat0.25%amongtheANCattendees,representingafluctuatingtrend.
• Accordingto2012PPTCTdata,HIVpositivitywaslowat0.20%amongthePPTCTattendees,withastabletrend.
• Accordingto2012BloodBankdata,HIVpositivitywaslowat0.12%amongtheBloodBankdonors,withastabletrend.
• Accordingto2010HSS-FSWdata,HIVprevalencewaslowat3.21%amongtheFSWs.Accordingto2010HSS-MSMdata,HIVprevalencewas low at 3.02% among the MSM.
• In2012,HIVpositivityamongICTCattendeeswas lowamongmale(2.95%)andfemale(2.09%)clients,aswellasamongreferred(2.05%) and direct walk-in (3.33%) clients. A decreasing trend was observed over a period of five years among all the ICTC clients
• AccordingtoHRGmappingdata,MSM(6,526)represent51.58%ofthetotalHRGpopulationinthe)inthedistrictfollowedbyFSW(5,667) representing 44.79% , while IDU (460) represent the remaining 3.64%. 96% of the mapped MSM are married.
• In2012,87,760STI/RTIepisodesweretreatedandthesyphilispositivityrateamongSTIclinicattendeeswas0.39%.
• Asperthe2001Census,6.21%ofthemalepopulationweremigrants;amongthem15.56%migratedtootherstatesand41.59%migrated to other districts within the state.
• Thetoptwodestinationsforout-ofstatemigrationwereThaneandMumbai(Suburban),Maharashtra.
• AccordingtoDLHS-IIIdata,theHIVandSTI/RTIawarenessrateamongwomenwas67.1%and37.4%,respectively.
• In2012,ninetargetedintervention(TI)siteswereoperationalinthedistrict.
Key Recommendations:
• GiventhenumberofmappedHRGsandHIVprevalenceamongvulnerablegroups,increasethenumberofTIsitesinthedistrict.Conductsocio-demographic analysis and necessary outreach for HIV prevention delivery to spouses or partners of HRG also, and support their linkage to services.
• Conduct socio-demographic analysis of HSS-ANC data to ascertain risk factors, considering fluctuating prevalence among HSS-ANCattendees.
• districtneedstocontinueattentiontodecreaseandlimitthespreadofHIVinfectionfurtheramongbothgeneralandHRGpopulation.
• ConsideringhighrateofmigrationtohighHIVprevalentdistricts,strengthenoutreachprogrammethroughawarenesscampaignsaroundsource and transit points like railway stations and bus stands.
• AnalyzethepopulationsizeandprofileofFSW’sclients,includingmigrantsandtruckers,tobetterunderstanddistrictvulnerabilities.
• AvailabilityofARTorDLNdatawouldhelpinbetterunderstandingofdistrictvulnerabilities.
Ahmedabad District
District HIV/AIDS Epidemiological Profiles : Gujarat | 11
Ahm
edabadDistrict Population: 72,08,200 (11.94%
of Gujarat Population); Fem
ale Literacy1: 80.29%
; ANC Utilization
2: 67.3%
2005
20062007
20082009
20102011
2012
HSS-ANC
PP4
00
00.25
0.500.25
NT
4400
400400
400400
400
PPTCTPP
--
0.430.31
0.370.24
0.190.20
NT
--
1174734752
4706858861
6578556042
Blood BankPP
--
0.220.18
0.240.21
0.150.12
NT
--
301759239776
157718163782
175822183157
HSS-STDPP
4.8018.00
-22.00
--
NT
250250
-250
--
HSS-FSWPP
--
-6.43
3.21-
NT
--
-249
249-
HSS-MSM
PP-
--
4.173.02
-N
T-
--
216232
-
HSS-IDUPP
--
--
--
NT
--
--
--
ICTC Male
PP-
--
6.385.04
2.842.75
2.95N
T-
--
3144727603
4471754626
42648
ICTC Female
PP-
--
5.864.97
1.862.18
2.09N
T-
--
1796914482
3193029103
28465
ICTC ReferredPP
--
-5.42
3.892.55
2.362.05
NT
--
-14168
2209436803
4056840078
ICTC Direct W
alk-inPP
--
-6.50
6.262.32
2.723.33
NT
--
-35248
1999139844
4316131035
Total tested at ICTCs
5 N
T-
-11747
84168103728
135508149514
127155
PLHIV Profile, 2012
% O
n ART%
15-24 yrs%
Ill., Prim. Edu.
% M
arried%
Widow
ed or Divorced
ART (20068)24
960
6211
DLN (N
A)-
--
--
Block-Level Details
No. HRG
-FSW-
- -
- -
- -
- -
No. HRG
-MSM
- -
- -
- -
- -
- N
o. HRG- IDU
- -
- -
- -
- -
-
% Pos;
ICTC
Taluka 1 Ahm
eda-bad 3.64
Taluka2 Dascroi
0
Sanand 3.23
Bavla 7.5
Dholka 4.44
Viramgam
0
- Kadi Kalol
2.13M
ehsana 15.79
% Pos;
PPTCT
Route of HIV Transm
ission, ICTC 2012
Hetero-sexualHom
o-sexualBlood
TransfusionN
eedle/ Syringe
Parent to Child
Unknown
% of Total
(N=
1854)87.59
1.943.34
1.563.83
1.73
HIV Levels and Trends
3
* Inadequate sample size; - Data not available; 1 2011 Census; 2 Source: DLHS III; 3 Data presented only for years w
here sample size is valid (HSS-AN
C ≥ 300, HSS-HRG/STD ≥ 187, ICTC ≥ 600, PPTCT ≥ 900 and BB ≥ 900); 4 PP =
percent positive, N
T = num
ber tested; 5 General clients & pregnant w
omen.
STI/RTI2009
20102011
2012
No. episodes treated
-53022
8530787760
% Syphilis positivity
-1.10
1.100.39
Programm
e ResponseN
o.2004
20052006
20072008
20092010
20112012
FSW TIs
11
11
22
23
3M
SM TIs
11
11
32
35
5IDU TIs
--
--
11
11
-Com
p. TIs-
--
--
11
11
ICTCs-
--
1627
4475
7893
Blood Banks15
1518
2222
2422
2324
STI clinics-
--
55
56
78
ART centres-
11
11
12
22
Link ART centres-
--
--
--
-1
PLHIV Netw
orks-
22
22
22
22
Red Ribbon Clubs-
--
--
3030
140148
Comm
. care centres-
--
12
33
11
Drop-in-centres-
-2
33
33
33
Condom outlets
--
--
--
--
-
VulnerabilitiesM
ale Migration, 2001 Census
Overall
Inter-State
Intra-state
Intra-district
No. out-
migration
19070829683
7931181714
% of m
ale pop.
6.210.97
2.582.66
% total
migration
10015.56
41.5942.85
Top 5 districts for inter-state out-migration
Thane, M
aharash-tra
Mum
bai (Suburban)
, Maha-
rashtra
Pune, M
aharash-tra
Mum
bai, M
aharash-tra
Sirohi, Rajasthan
HRG Size
FSWM
SMIDU
Size Est., (Mapping,
Year: NA)
56676526
460
% Total HRG
44.7951.58
3.64
% Total Pop.
0.080.09
0.01
Program Target
NA
NA
NA
Program Coverage
--
-
Typology
Home
based-16.13%
;
Brothel based-
27.42%;
Street based-
56.45%
Kothi-79.71%
;
Panthi-N
A;
Double decker-20.29%
Daily Injectors-
NA;
Non daily
Injectors-N
A
% <
25 yrs.16.94
8.00-
% M
arried-
96.00-
12 | District HIV/AIDS Epidemiological Profiles : Gujarat
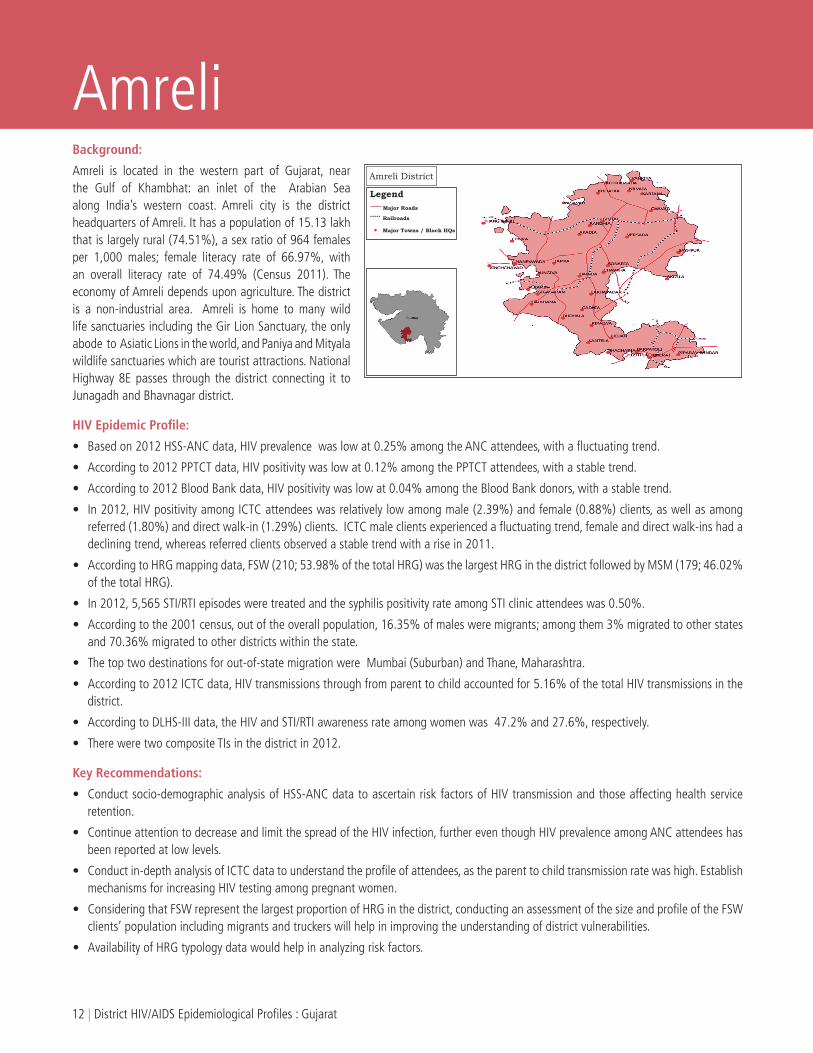
AmreliBackground:
Amreli is located in the western part of Gujarat, near the Gulf of Khambhat: an inlet of the Arabian Sea along India’s western coast. Amreli city is the district headquarters of Amreli. It has a population of 15.13 lakh that is largely rural (74.51%), a sex ratio of 964 females per 1,000 males; female literacy rate of 66.97%, with an overall literacy rate of 74.49% (Census 2011). The economy of Amreli depends upon agriculture. The district is a non-industrial area. Amreli is home to many wild life sanctuaries including the Gir Lion Sanctuary, the only abode to Asiatic Lions in the world, and Paniya and Mityala wildlife sanctuaries which are tourist attractions. National Highway 8E passes through the district connecting it to Junagadh and Bhavnagar district.
HIV Epidemic Profile:
• Basedon2012HSS-ANCdata,HIVprevalencewaslowat0.25%amongtheANCattendees,withafluctuatingtrend.
• Accordingto2012PPTCTdata,HIVpositivitywaslowat0.12%amongthePPTCTattendees,withastabletrend.
• Accordingto2012BloodBankdata,HIVpositivitywaslowat0.04%amongtheBloodBankdonors,withastabletrend.
• In2012,HIVpositivityamongICTCattendeeswasrelativelylowamongmale(2.39%)andfemale(0.88%)clients,aswellasamongreferred (1.80%) and direct walk-in (1.29%) clients. ICTC male clients experienced a fluctuating trend, female and direct walk-ins had a declining trend, whereas referred clients observed a stable trend with a rise in 2011.
• AccordingtoHRGmappingdata,FSW(210;53.98%ofthetotalHRG)wasthelargestHRGinthedistrictfollowedbyMSM(179;46.02%of the total HRG).
• In2012,5,565STI/RTIepisodesweretreatedandthesyphilispositivityrateamongSTIclinicattendeeswas0.50%.
• Accordingtothe2001census,outoftheoverallpopulation,16.35%ofmalesweremigrants;amongthem3%migratedtootherstatesand 70.36% migrated to other districts within the state.
• Thetoptwodestinationsforout-of-statemigrationwereMumbai(Suburban)andThane,Maharashtra.
• Accordingto2012ICTCdata,HIVtransmissionsthroughfromparenttochildaccountedfor5.16%ofthetotalHIVtransmissionsinthedistrict.
• AccordingtoDLHS-IIIdata,theHIVandSTI/RTIawarenessrateamongwomenwas47.2%and27.6%,respectively.
• ThereweretwocompositeTIsinthedistrictin2012.
Key Recommendations:
• Conductsocio-demographicanalysisofHSS-ANCdatatoascertainriskfactorsofHIVtransmissionandthoseaffectinghealthserviceretention.
• ContinueattentiontodecreaseandlimitthespreadoftheHIVinfection,furthereventhoughHIVprevalenceamongANCattendeeshasbeen reported at low levels.
• Conductin-depthanalysisofICTCdatatounderstandtheprofileofattendees,astheparenttochildtransmissionratewashigh.Establishmechanisms for increasing HIV testing among pregnant women.
• ConsideringthatFSWrepresentthelargestproportionofHRGinthedistrict,conductinganassessmentofthesizeandprofileoftheFSWclients’ population including migrants and truckers will help in improving the understanding of district vulnerabilities.
• AvailabilityofHRGtypologydatawouldhelpinanalyzingriskfactors.
Amreli District

District HIV/AIDS Epidemiological Profiles : Gujarat | 13
Am
reliDistrict Population: 15,13,614 (2.51%
of Gujarat Population); Fem
ale Literacy1: 66.97%
; ANC Utilization
2: 63.8%
2005
20062007
20082009
20102011
2012
HSS-ANC
PP4
-0
1.000.52
1.010.25
NT
4-
398400
382398
400
PPTCTPP
--
0.800.20
0.140.13
0.070.12
NT
--
9964586
80346357
1461610610
Blood BankPP
0.590.48
0.910.21
0.080.16
0.060.04
NT
31953973
36295765
63266806
71657155
HSS-STDPP
--
--
--
NT
--
--
--
HSS-FSWPP
--
--
--
NT
--
--
--
HSS-MSM
PP-
--
--
-N
T-
--
--
-
HSS-IDUPP
--
--
--
NT
--
--
--
ICTC Male
PP-
--
5.812.71
2.386.81
2.39N
T-
--
18923325
38676521
4565
ICTC Female
PP-
--
3.471.99
1.340.66
0.88N
T-
--
12952819
30715947
5202
ICTC ReferredPP
--
-2.71
1.571.66
5.221.80
NT
--
-1991
36244284
72595664
ICTC Direct W
alk-inPP
--
-8.44
3.532.34
2.001.29
NT
--
-1196
25202654
52094103
Total tested at ICTCs
5 N
T-
-996
777314178
1329527084
20377
PLHIV Profile, 2012
% O
n ART%
15-24 yrs%
Ill., Prim. Edu.
% M
arried%
Widow
ed or Divorced
ART (1058)66
884
6615
DLN (N
A)-
--
--
Block-Level Details
No. HRG
-FSW-
- -
- -
- -
- -
No. HRG
-MSM
- -
- -
- -
- -
-
No. HRG
- IDU-
- -
- -
- -
- -
% Pos;
ICTCAm
reli, 6.3
Babra, 20
Bagasara, 29.4
Dhari, 21.7
Lathi, 20.7
Liliya, 14.3
Rajula, 16.7
Sk, 34.8
Jafrabad, 33.3
% Pos;
PPTCT-
- -
- -
- -
- -
Route of HIV Transm
ission, ICTC 2012
Hetero-sexualHom
o-sexualBlood
TransfusionN
eedle/ Syringe
Parent to Child
Unknown
% of Total
(N=
155)88.39
2.581.29
05.16
2.58
HIV Levels and Trends
3
* Inadequate sample size; - Data not available; 1 2011 Census; 2 Source: DLHS III; 3 Data presented only for years w
here sample size is valid (HSS-AN
C ≥ 300, HSS-HRG/STD ≥ 187, ICTC ≥ 600, PPTCT ≥ 900 and BB ≥ 900); 4 PP =
percent positive, N
T = num
ber tested; 5 General clients & pregnant w
omen.
STI/RTI2009
20102011
2012
No. episodes treated
19985137
53795565
% Syphilis positivity
-0.65
0.800.50
Programm
e ResponseN
o.2004
20052006
20072008
20092010
20112012
FSW TIs
--
--
--
--
-M
SM TIs
--
--
--
--
-IDU TIs
--
--
--
--
-Com
p. TIs-
--
-2
22
22
ICTCs-
--
68
818
4444
Blood Banks1
11
11
11
11
STI clinics-
--
11
11
11
ART centres-
--
--
-1
11
Link ART centres-
--
-1
21
11
PLHIV Netw
orks-
--
--
--
--
Red Ribbon Clubs-
--
--
--
55
Comm
. care centres-
--
--
--
11
Drop-in-centres-
--
--
--
--
Condom outlets
--
--
--
--
-
VulnerabilitiesM
ale Migration, 2001 Census
Overall
Inter-State
Intra-state
Intra-district
No. out-
migration
1147003444
8069930557
% of m
ale pop.
16.350.49
11.514.36
% total
migration
1003.00
70.3626.64
Top 5 districts for inter-state out-migration
Mum
bai (Suburban)
, Maha-
rashtra
Thane, M
aharash-tra
Diu, Dam
an & Diu
Mum
bai, M
aharash-tra
-
HRG Size
FSWM
SMIDU
Size Est., (Mapping,
Year: NA)
210179
-
% Total HRG
53.9846.02
-
% Total Pop.
0.010.01
-
Program Target
NA
NA
NA
Program Coverage
--
-
Typology
Home
based-N
A;
Brothel based-
NA;
Street based-
NA
Kothi-N
A;
Panthi-N
A;
Double decker-
NA
Daily Injectors-
NA;
Non daily
Injectors-N
A
% <
25 yrs.-
--
% M
arried-
--
14 | District HIV/AIDS Epidemiological Profiles : Gujarat
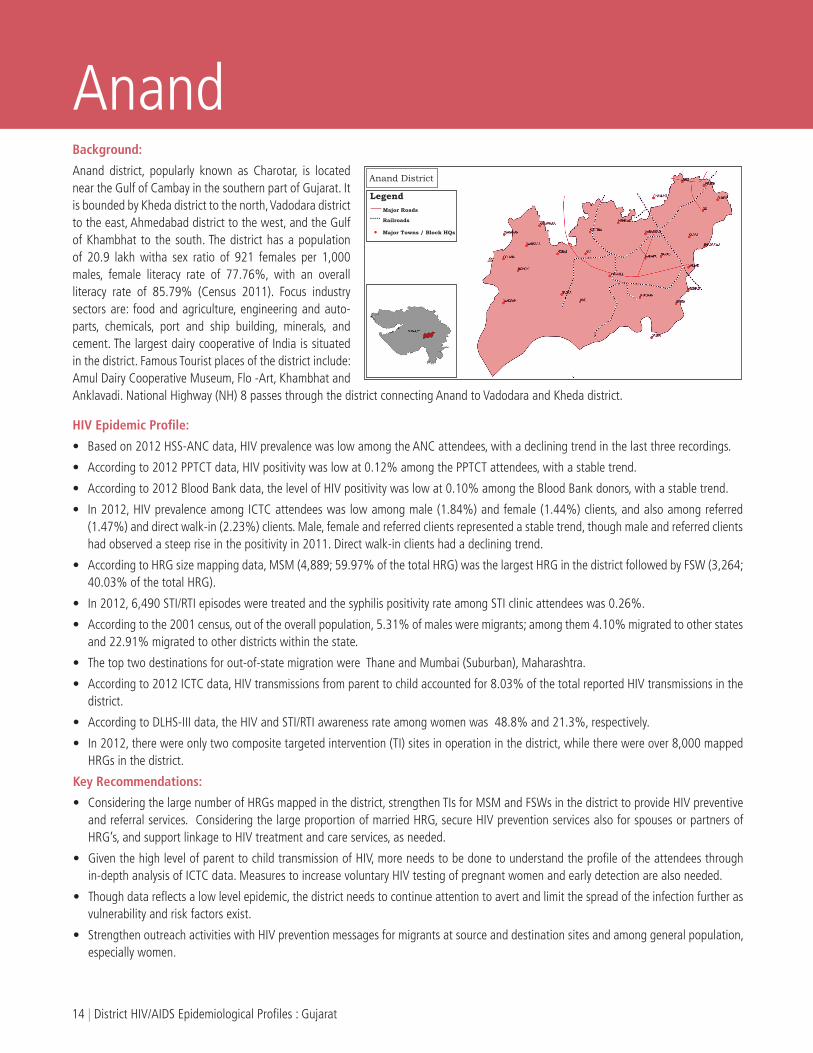
AnandBackground:
Anand district, popularly known as Charotar, is located near the Gulf of Cambay in the southern part of Gujarat. It is bounded by Kheda district to the north, Vadodara district to the east, Ahmedabad district to the west, and the Gulf of Khambhat to the south. The district has a population of 20.9 lakh witha sex ratio of 921 females per 1,000 males, female literacy rate of 77.76%, with an overall literacy rate of 85.79% (Census 2011). Focus industry sectors are: food and agriculture, engineering and auto-parts, chemicals, port and ship building, minerals, and cement. The largest dairy cooperative of India is situated in the district. Famous Tourist places of the district include: Amul Dairy Cooperative Museum, Flo -Art, Khambhat and Anklavadi. National Highway (NH) 8 passes through the district connecting Anand to Vadodara and Kheda district.
HIV Epidemic Profile:
• Basedon2012HSS-ANCdata,HIVprevalencewaslowamongtheANCattendees,withadecliningtrendinthelastthreerecordings.
• Accordingto2012PPTCTdata,HIVpositivitywaslowat0.12%amongthePPTCTattendees,withastabletrend.
• Accordingto2012BloodBankdata,thelevelofHIVpositivitywaslowat0.10%amongtheBloodBankdonors,withastabletrend.
• In2012,HIVprevalenceamongICTCattendeeswaslowamongmale(1.84%)andfemale(1.44%)clients,andalsoamongreferred(1.47%) and direct walk-in (2.23%) clients. Male, female and referred clients represented a stable trend, though male and referred clients had observed a steep rise in the positivity in 2011. Direct walk-in clients had a declining trend.
• AccordingtoHRGsizemappingdata,MSM(4,889;59.97%ofthetotalHRG)wasthelargestHRGinthedistrictfollowedbyFSW(3,264;40.03% of the total HRG).
• In2012,6,490STI/RTIepisodesweretreatedandthesyphilispositivityrateamongSTIclinicattendeeswas0.26%.
• Accordingtothe2001census,outoftheoverallpopulation,5.31%ofmalesweremigrants;amongthem4.10%migratedtootherstatesand 22.91% migrated to other districts within the state.
• Thetoptwodestinationsforout-of-statemigrationwereThaneandMumbai(Suburban),Maharashtra.
• Accordingto2012ICTCdata,HIVtransmissionsfromparenttochildaccountedfor8.03%ofthetotalreportedHIVtransmissionsinthedistrict.
• AccordingtoDLHS-IIIdata,theHIVandSTI/RTIawarenessrateamongwomenwas48.8%and21.3%,respectively.
• In2012,therewereonlytwocompositetargetedintervention(TI)sitesinoperationinthedistrict,whiletherewereover8,000mappedHRGs in the district.
Key Recommendations:
• ConsideringthelargenumberofHRGsmappedinthedistrict,strengthenTIsforMSMandFSWsinthedistricttoprovideHIVpreventiveand referral services. Considering the large proportion of married HRG, secure HIV prevention services also for spouses or partners of HRG’s, and support linkage to HIV treatment and care services, as needed.
• GiventhehighlevelofparenttochildtransmissionofHIV,moreneedstobedonetounderstandtheprofileoftheattendeesthroughin-depth analysis of ICTC data. Measures to increase voluntary HIV testing of pregnant women and early detection are also needed.
• Thoughdatareflectsalowlevelepidemic,thedistrictneedstocontinueattentiontoavertandlimitthespreadoftheinfectionfurtherasvulnerability and risk factors exist.
• StrengthenoutreachactivitieswithHIVpreventionmessagesformigrantsatsourceanddestinationsitesandamonggeneralpopulation,especially women.
Anand District

District HIV/AIDS Epidemiological Profiles : Gujarat | 15
Anand
District Population: 20,90,276 (3.46%of G
ujarat Population); Female Literacy
1: 77.76%; AN
C Utilization2: 68.5%
2005
20062007
20082009
20102011
2012
HSS-ANC
PP4
-0.25
0.250.25
00
NT
4-
400400
399400
400
PPTCTPP
**
*0.30
0.310.19
0.110.12
NT
**
*1578
954711415
1052113285
Blood BankPP
0.270.15
0.110.16
0.120.11
0.130.10
NT
75058928
925915058
2336527685
2707425821
HSS-STDPP
--
--
--
NT
--
--
--
HSS-FSWPP
--
--
--
NT
--
--
--
HSS-MSM
PP-
--
--
-N
T-
--
--
-
HSS-IDUPP
--
--
--
NT
--
--
--
ICTC Male
PP-
--
3.873.20
2.2212.69
1.84N
T-
--
61496995
94005924
8476
ICTC Female
PP-
--
2.341.85
1.320.63
1.44N
T-
--
47855576
69944605
6471
ICTC ReferredPP
--
-2.65
2.071.28
9.221.47
NT
--
-9013
1045212967
768611136
ICTC Direct W
alk-inPP
--
-5.78
5.243.94
2.532.23
NT
--
-1921
21193427
28433811
Total tested at ICTCs
5 N
T678
500747
1251222118
2780921050
28232
PLHIV Profile, 2012
% O
n ART%
15-24 yrs%
Ill., Prim. Edu.
% M
arried%
Widow
ed or Divorced
ART (NA)
--
--
-
DLN (N
A)-
--
--
Block-Level Details
No. HRG
- FSW
- -
- -
- -
- -
-
No. HRG
- M
SM-
- -
- -
- -
- -
No. HRG
- IDU
- -
- -
- -
- -
-
% Pos;
ICTC-
- -
- -
- -
- -
% Pos;
PPTCT-
- -
- -
- -
- -
Route of HIV Transm
ission, ICTC 2012
Hetero-sexualHom
o-sexualBlood
TransfusionN
eedle/ Syringe
Parent to Child
Unknown
% of Total
(N=
249)85.54
1.202.41
08.03
2.81
HIV Levels and Trends
3
* Inadequate sample size; - Data not available; 1 2011 Census; 2 Source: DLHS III; 3 Data presented only for years w
here sample size is valid (HSS-AN
C ≥ 300, HSS-HRG/STD ≥ 187, ICTC ≥ 600, PPTCT ≥ 900 and BB ≥ 900); 4 PP =
percent positive, N
T = num
ber tested; 5 General clients & pregnant w
omen.
STI/RTI2009
20102011
2012
No. episodes treated
7485216819
58266490
% Syphilis positivity
-0.55
0.210.26
Programm
e ResponseN
o.2004
20052006
20072008
20092010
20112012
FSW TIs
11
1-
--
--
-M
SM TIs
--
--
--
--
-IDU TIs
--
--
--
--
-Com
p. TIs-
--
-2
22
22
ICTCs-
--
78
815
1921
Blood Banks4
45
56
66
66
STI clinics-
--
22
22
33
ART centres-
--
--
--
--
Link ART centres-
--
-1
11
11
PLHIV Netw
orks-
-1
11
11
11
Red Ribbon Clubs-
--
--
3535
8686
Comm
. care centres-
--
--
--
--
Drop-in-centres-
--
--
--
--
Condom outlets
--
--
--
--
-
VulnerabilitiesM
ale Migration, 2001 Census
Overall
Inter-State
Intra-state
Intra-district
No. out-
migration
515972118
1182337656
% of m
ale pop.
5.310.22
1.223.87
% total
migration
1004.10
22.9172.98
Top 5 districts for inter-state out-migration
Thane, M
aharash-tra
Mum
bai (Suburban)
, Maha-
rashtra
Jaipur, Rajasthan
Mum
bai, M
aharash-tra
-
HRG Size
FSWM
SMIDU
Size Est., (Mapping,
Year: NA)
32644889
-
% Total HRG
40.0359.97
-
% Total Pop.
0.160.23
-
Program Target
NA
NA
NA
Program Coverage
--
-
Typology
Home
based-36.18%
;
Brothel based-49.1%
;
Street based-
14.73%
Kothi-48.76%
;
Panthi-N
A;
Double decker-51.24%
Daily Injectors-
NA;
Non daily
Injectors-N
A
% <
25 yrs.22.22
32.08-
% M
arried76.23
59.12-

16 | District HIV/AIDS Epidemiological Profiles : Gujarat
BanaskanthaBackground:
Banaskantha district’s administrative headquarters is Palanpur which is also its largest city. The district is located in the Northeast of Gujarat and is presumably named after the West Banas River which runs through the valley between Mount Abu and Aravalli Range, entering into the plains of Gujarat in this region and flowing towards the Rann of Kutch. It has a population of 31.16 lakh that is largely rural (86.73%), with a sex ratio of 936 females per 1,000 males; female literacy rate of 52.58%, with an overall literacy rate of 66.39% (Census 2011). The economy of the district is based on agro and food processing, tourism, textile and mineral based industries (ceramics). The district is famous for two pilgrim sites: the Ambaji temple and the Balaram temple which draw many tourists. National highway 14 and 15 and many other state highways pass through the district connecting it to other states and districts.
HIV Epidemic Profile:
• Basedon2010HSS-ANC,HIVprevalencewaslowat0.25%amongtheANCattendees.
• Accordingto2012PPTCTdata,HIVpositivitywaslowat0.17%amongthePPTCTattendees,withastabletrend.
• Accordingto2012BloodBankdata,HIVpositivitywaslowat0.11%amongtheBloodBankdonors,withastabletrend.
• Accordingto2010HSS-FSWdata,HIVprevalencewaslowamongFSWsat1.21%,butduetolackofpreviousyear’sdata,atrendcouldnot be determined.
• In2012,HIVpositivityamong ICTCattendeeswas lowamongmale (1.48%)andfemale (1.26%)clientsaswellasamongreferred(0.79%) and direct walk-in (2.21%) clients, with an overall declining trend.
• AccordingtoHRGsizemappingdata,MSM(785;60.02%ofthetotalHRG)wasthelargestHRGinthedistrictfollowedbyFSW(523;39.98% of the total HRG).
• In2012,6,778STI/RTIepisodesweretreatedandthesyphilispositivityrateamongSTIclinicattendeeswas1.18%.
• Thetoptwodestinationsforout-of-statemigrationwereMumbai(Suburban),MaharashtraandSirohi,Rajasthan.
• Accordingto2012ICTCdata,HIVtransmissionsfromparenttochildaccountedfor10.32%ofthetotalreportedtransmissionsinthedistrict.
• AccordingtoDLHS-IIIdata,theHIVandSTI/RTIawarenessrateamongwomenwas27.4%and14.2%,respectively.
• In2012,thereweretwocompositetargetedintervention(TI)sitesinoperationinthedistrict,whiletherewerearound1,300mappedHRGs in the district.
Key Recommendations:
• EstablishTIsitesexclusivelyforMSMandFSWstoprovideHIVpreventiveandreferralservices,consideringtheirsignificantpresenceinthedistrict. Considering the high proportion of married HRG in the district (62.45% for FSW and 83.38% for MSM) HIV prevention services for spouses or partners of HRGs’ are also needed in addition to HIV treatment and care services.
• ThoughHIVpositivityamongICTCattendeesisatlowlevels,thedistrictneedstocontinuefocusondecreasingandlimitingthespreadof HIV infection further.
• Conductin-depthanalysisofICTCdatatounderstandtheprofileofICTCattendeesgiventhehighparenttochildtransmissionrate(2012ICTC data).
• ConductoutreachcampaignonHIVandSTIawarenessandsexualriskreductionmessagesespeciallyamongwomen.
• Betterassessmentofthesizeandprofileofmigrantswillfurtherimproveunderstandingofdistrictvulnerabilities.
Banaskantha District

District HIV/AIDS Epidemiological Profiles : Gujarat | 17
BanaskanthaDistrict Population: 31,16,045 (5.16%
of Gujarat Population); Fem
ale Literacy1: 52.58%
; ANC Utilization
2: 28.7%
2005
20062007
20082009
20102011
2012
HSS-ANC
PP4
-1.00
00
0.25-
NT
4-
400400
399400
-
PPTCTPP
-*
**
0.290.16
0.180.17
NT
-*
**
1462621943
4227424136
Blood BankPP
0.170.09
0.140.05
0.130.11
0.090.11
NT
60425547
85278430
2392627981
3076332195
HSS-STDPP
0.402.00
0.95-
1.60-
NT
250250
210-
250-
HSS-FSWPP
--
--
1.21-
NT
--
--
248-
HSS-MSM
PP-
--
--
-N
T-
--
--
-
HSS-IDUPP
--
--
--
NT
--
--
--
ICTC Male
PP-
--
4.462.73
1.981.53
1.48N
T-
--
720410787
1561423460
18844
ICTC Female
PP-
--
4.702.75
2.061.30
1.26N
T-
--
43627029
1026616110
15543
ICTC ReferredPP
--
-3.09
1.901.51
1.070.79
NT
--
-8128
1202215853
2128220116
ICTC Direct W
alk-inPP
--
-8.00
4.452.79
1.862.21
NT
--
-3438
579410027
1828814271
Total tested at ICTCs
5 N
T-
56336
1205232442
4782381844
58523
PLHIV Profile, 2012
% O
n ART%
15-24 yrs%
Ill., Prim. Edu.
% M
arried%
Widow
ed or Divorced
ART (2230)53
1045
3710
DLN (N
A)-
--
--
Block-Level Details
No. HRG
-FSW-
- -
- -
- -
- -
No. HRG
-MSM
- -
- -
- -
- -
-
No. HRG
- IDU-
- -
- -
- -
- -
% Pos;
ICTC-
- -
- -
- -
- -
% Pos;
PPTCTAm
irgadh, 1.09
Bhabhar, 0.97
Danta, 2.69
Deesa, 6.84
Deodar, 0.99
Dhanera, 2.16
Kankrej, 2.03
Palanpur, 7.25
Tharad, 2.45
Route of HIV Transm
ission, ICTC 2012
Hetero-sexualHom
o-sexualBlood
TransfusionN
eedle/ Syringe
Parent to Child
Unknown
% of Total
(N=
475)88.00
1.260.42
010.32
0
HIV Levels and Trends
3
* Inadequate sample size; - Data not available; 1 2011 Census; 2 Source: DLHS III; 3 Data presented only for years w
here sample size is valid (HSS-AN
C ≥ 300, HSS-HRG/STD ≥ 187, ICTC ≥ 600, PPTCT ≥ 900 and BB ≥ 900); 4 PP =
percent positive, N
T = num
ber tested; 5 General clients & pregnant w
omen.
STI/RTI2009
20102011
2012
No. episodes treated
216606733
63596778
% Syphilis positivity
-1.45
1.301.18
Programm
e ResponseN
o.2004
20052006
20072008
20092010
20112012
FSW TIs
--
--
--
--
-M
SM TIs
--
--
--
--
-IDU TIs
--
--
--
--
-Com
p. TIs-
--
--
22
22
ICTCs-
--
716
2870
111112
Blood Banks4
44
89
109
910
STI clinics-
--
22
22
33
ART centres-
--
--
-1
11
Link ART centres-
--
-1
11
23
PLHIV Netw
orks-
--
-1
11
11
Red Ribbon Clubs-
--
--
4040
1717
Comm
. care centres-
--
--
--
11
Drop-in-centres-
--
--
--
--
Condom outlets
--
--
--
--
-
VulnerabilitiesM
ale Migration, 2001 Census
Overall
Inter-State
Intra-state
Intra-district
No. out-
migration
--
--
% of m
ale pop.
--
--
% total
migration
--
--
Top 5 districts for inter-state out-migration
Mum
bai (Suburban)
, Maha-
rashtra
Sirohi, Rajasthan
Thane, M
aharash-tra
Jalor, Rajasthan
Mum
bai, M
aharash-tra
HRG Size
FSWM
SMIDU
Size Est., (Mapping,
Year: NA)
523785
-
% Total HRG
39.9860.02
-
% Total Pop.
0.020.03
-
Program Target
NA
NA
NA
Program Coverage
2.974.45
N.A
Typology
Home
based-44.66%
;
Brothel based-
35.97%;
Street based-
19.37%
Kothi-30%
;
Panthi-N
A;
Double decker-70%
Daily Injectors-
NA;
Non daily
Injectors-N
A
% <
25 yrs.14.62
20.63-
% M
arried62.45
83.38-

18 | District HIV/AIDS Epidemiological Profiles : Gujarat
BharuchBackground:
Bharuch is located in the southern part of Gujarat, near the Gulf of Khambhat an inlet of the Arabian Sea along the west coast of India. The district has a population of 15.50 lakh, with a sex ratio of 924 females per 1,000 males; female literacy rate of 76.79%, with an overall literacy rate of 83.03% (Census 2011). Bharuch is a formidable industrial base in sectors as diversified as chemicals and petrochemicals, textiles, drugs and pharmaceuticals, and ports and ship building. There are a large number of industrial estates in the district’s Special Economic Zones (SEZ). Centrally located with in the industrial belt. Dahejport is an ideal location in Asia to serve north, west and central India and international destinations such as the Middle East, Africa, Europe and North America. National Highway 8 passes through the district, connecting it with Ahmedabad and Mumbai.
HIV Epidemic Profile:
• Basedon2012HSS-ANCdata,HIVprevalencewasmoderateat0.75%amongtheANCattendees,withanincreasingtrendoverthelastfour data recordings.
• Accordingto2012PPTCTdata,thelevelofHIVpositivitywaslowat0.15%amongthePPTCTattendees,withastabletrend.
• Accordingto2012BloodBankdata,thelevelofHIVpositivitywaslowat0.20%amongtheBloodBankdonors,withastabletrend.
• In2012,HIVprevalenceamongICTCattendeeswaslowamongmale(3.23%)andfemale(1.92%)clients,aswellasamongreferred(1.03%) and direct walk-in (3.82%) clients. While male and referred clients had a fluctuating trend, female and direct walk-ins had a declining trend.
• AccordingtoHRGsizemappingdataFSWs(272;74.11%ofthetotalHRG)wasthelargestHRGinthedistrict.ThemajortypologyforFSWs was street-based (68.41%).
• In2012,6,530STI/RTIepisodesweretreatedandthesyphilispositivityrateamongSTIclinicattendeeswas1.49%.
• Accordingtothe2001census,outoftheoverallpopulation,9.98%ofmalesweremigrants;amongthem4.49%migratedtootherstatesand 33.94% migrated to other districts within the state.
• Thetoptwodestinationsforout-of-statemigrationwereMumbai(Suburban)andThaneinMaharashtra.
• Accordingto2012ICTCdata,HIVtransmissionsfromparenttochildaccountedwas9.18%andthroughbloodtransfusionaccountedfor7.65% of the total transmissions in the district.
• AccordingtoDLHS-IIIdata,theHIVandSTI/RTIawarenessrateamongwomenwas46.6%and20.8%,respectively.
• In2012,onlyonecompositeTIwasoperationalinthedistrict.
Key Recommendations:
• ConsideringrisingHIVprevalenceamongHSS-ANCattendees,thedistrictneedstocontinueattentiontodecreaseandlimitthespreadofthe infection further.
• GiventhehighrateofparenttochildtransmissionofHIVinthedistrict,itisnecessarytostrengthenthePPTCTprogramcoverageinthedistrict including early HIV detection.
• Conductin-depthanalysisofICTCdatatobetterunderstandtheprofileofHIVpositiveindividuals.ThisisalsointhecontextoftheHIVtransmission rate through blood transfusion (ICTC data 2012) .
• Consideringthelevelofmalemigration,strengthenoutreachprogrammesthroughHIVawarenesscampaignsaroundsourceandtransitpoints such as railway stations and bus stands. Conduct special awareness campaign especially among pockets of out-migrants transit points and around truck halting points and highways in the district.
Bahruch District

District HIV/AIDS Epidemiological Profiles : Gujarat | 19
BharuchDistrict Population: 15,50,822 (2.57%
of Gujarat Population); Fem
ale Literacy1: 76.79%
; ANC Utilization
2: 64.6%
2005
20062007
20082009
20102011
2012
HSS-ANC
PP4
-0.75
00
0.250.75
NT
4-
400400
400398
399
PPTCTPP
-*
0.370.36
0.140.14
0.170.15
NT
-*
10791651
57295106
100047454
Blood BankPP
--
0.230.17
0.150.20
0.170.20
NT
--
1197413599
1340415992
1694516685
HSS-STDPP
--
--
--
NT
--
--
--
HSS-FSWPP
--
--
--
NT
--
--
--
HSS-MSM
PP-
--
--
-N
T-
--
--
-
HSS-IDUPP
--
--
--
NT
--
--
--
ICTC Male
PP-
--
5.684.92
2.685.30
3.23N
T-
--
13561972
28715451
3995
ICTC Female
PP-
--
4.575.10
2.441.71
1.92N
T-
--
8751195
22124037
3483
ICTC ReferredPP
--
-2.32
3.111.70
4.391.03
NT
--
-1164
19632002
39853209
ICTC Direct W
alk-inPP
--
-8.43
8.063.15
3.333.82
NT
--
-1067
12043081
55034269
Total tested at ICTCs
5 N
T-
3271079
38828896
1018919492
14932
PLHIV Profile, 2012
% O
n ART%
15-24 yrs%
Ill., Prim. Edu.
% M
arried%
Widow
ed or Divorced
ART (946)56
935
298
DLN (N
A)-
--
--
Block-Level Details
No. HRG
-FSW-
- -
- -
- -
- -
No. HRG
-MSM
- -
- -
- -
- -
-
No. HRG
- IDU-
- -
- -
- -
- -
% Pos;
ICTC-
- -
- -
- -
- -
% Pos;
PPTCTAnklesh-w
er, 7.83Bharuch,
3.97Am
od, 14.51
Vagra, 20
Jambusar,
21.05Valiya, 18.18
Hansot, 57.14
Zagdia, 30
-
Route of HIV Transm
ission, ICTC 2012
Hetero-sexualHom
o-sexualBlood
TransfusionN
eedle/ Syringe
Parent to Child
Unknown
% of Total
(N=
196)72.45
4.087.65
4.089.18
2.55
HIV Levels and Trends
3
* Inadequate sample size; - Data not available; 1 2011 Census; 2 Source: DLHS III; 3 Data presented only for years w
here sample size is valid (HSS-AN
C ≥ 300, HSS-HRG/STD ≥ 187, ICTC ≥ 600, PPTCT ≥ 900 and BB ≥ 900); 4 PP =
percent positive, N
T = num
ber tested; 5 General clients & pregnant w
omen.
STI/RTI2009
20102011
2012
No. episodes treated
46367328
84286530
% Syphilis positivity
-1.79
1.381.49
Programm
e ResponseN
o.2004
20052006
20072008
20092010
20112012
FSW TIs
--
--
--
--
-M
SM TIs
--
--
--
--
-IDU TIs
--
--
--
--
-Com
p. TIs-
--
--
11
11
ICTCs-
--
55
66
2227
Blood Banks1
12
22
22
22
STI clinics-
--
11
11
11
ART centres-
--
--
--
11
Link ART centres-
--
-1
11
--
PLHIV Netw
orks-
--
--
--
--
Red Ribbon Clubs-
--
--
--
99
Comm
. care centres-
--
--
--
--
Drop-in-centres-
--
--
--
--
Condom outlets
--
--
--
--
-
VulnerabilitiesM
ale Migration, 2001 Census
Overall
Inter-State
Intra-state
Intra-district
No. out-
migration
712253195
2417643854
% of m
ale pop.
9.980.45
3.396.15
% total
migration
1004.49
33.9461.57
Top 5 districts for inter-state out-migration
Mum
bai (Suburban), M
aharash-tra
Thane, M
aharash-tra
Nandurbar
,Maharash-
tra
Mum
bai, M
aharash-tra
Dadra & N
agar Haveli,
Dadra & N
agar Haveli
HRG Size
FSWM
SMIDU
Size Est., (Mapping,
Year: NA)
27295
NA
% Total HRG
74.1125.89
-
% Total Pop.
0.020.01
-
Program Target
NA
NA
NA
Program Coverage
--
-
Typology
Home
based-14.73%
;
Brothel based-
16.86%;
Street based-
68.41%
Kothi-70.95%
;
Panthi-N
A;
Double decker-29.05%
Daily Injectors-
NA;
Non daily
Injectors-N
A
% <
25 yrs.14.25
32.57-
% M
arried33.25
85.20-
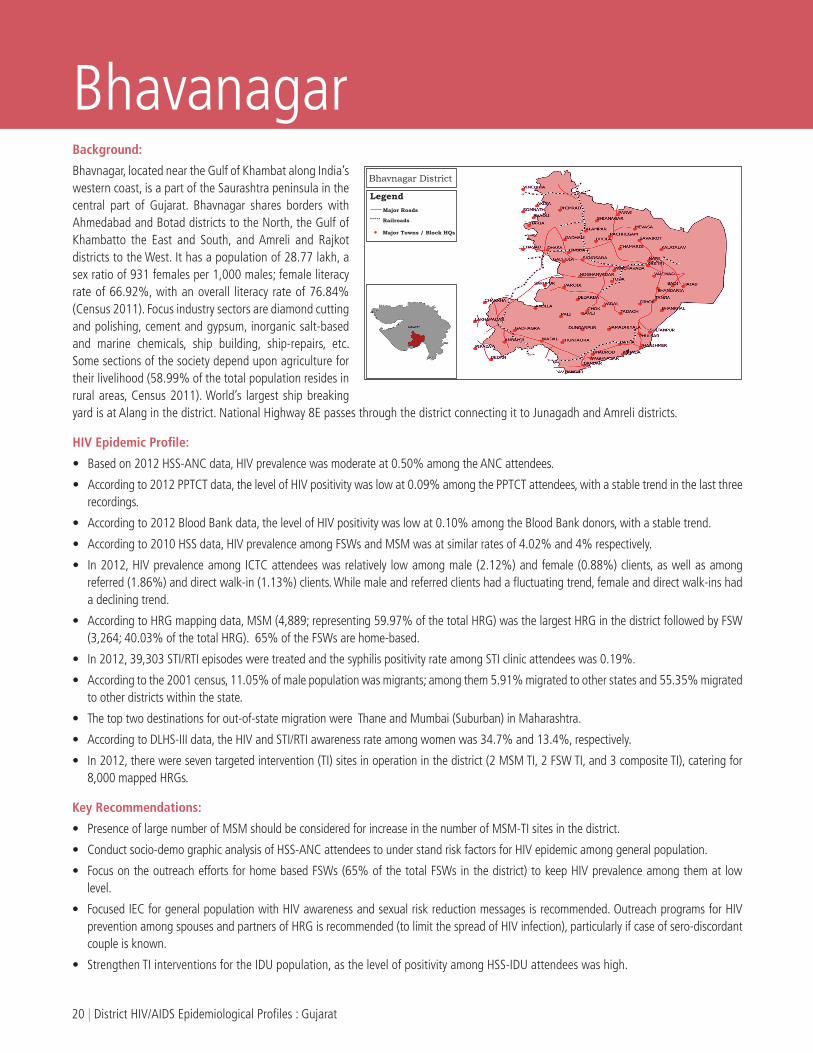
20 | District HIV/AIDS Epidemiological Profiles : Gujarat
BhavanagarBackground:
Bhavnagar, located near the Gulf of Khambat along India’s western coast, is a part of the Saurashtra peninsula in the central part of Gujarat. Bhavnagar shares borders with Ahmedabad and Botad districts to the North, the Gulf of Khambatto the East and South, and Amreli and Rajkot districts to the West. It has a population of 28.77 lakh, a sex ratio of 931 females per 1,000 males; female literacy rate of 66.92%, with an overall literacy rate of 76.84% (Census 2011). Focus industry sectors are diamond cutting and polishing, cement and gypsum, inorganic salt-based and marine chemicals, ship building, ship-repairs, etc. Some sections of the society depend upon agriculture for their livelihood (58.99% of the total population resides in rural areas, Census 2011). World’s largest ship breaking yard is at Alang in the district. National Highway 8E passes through the district connecting it to Junagadh and Amreli districts.
HIV Epidemic Profile:
• Basedon2012HSS-ANCdata,HIVprevalencewasmoderateat0.50%amongtheANCattendees.
• Accordingto2012PPTCTdata,thelevelofHIVpositivitywaslowat0.09%amongthePPTCTattendees,withastabletrendinthelastthreerecordings.
• Accordingto2012BloodBankdata,thelevelofHIVpositivitywaslowat0.10%amongtheBloodBankdonors,withastabletrend.
• Accordingto2010HSSdata,HIVprevalenceamongFSWsandMSMwasatsimilarratesof4.02%and4%respectively.
• In2012,HIVprevalenceamongICTCattendeeswasrelatively lowamongmale(2.12%)andfemale(0.88%)clients,aswellasamongreferred (1.86%) and direct walk-in (1.13%) clients. While male and referred clients had a fluctuating trend, female and direct walk-ins had a declining trend.
• AccordingtoHRGmappingdata,MSM(4,889;representing59.97%ofthetotalHRG)wasthelargestHRGinthedistrictfollowedbyFSW(3,264; 40.03% of the total HRG). 65% of the FSWs are home-based.
• In2012,39,303STI/RTIepisodesweretreatedandthesyphilispositivityrateamongSTIclinicattendeeswas0.19%.
• Accordingtothe2001census,11.05%ofmalepopulationwasmigrants;amongthem5.91%migratedtootherstatesand55.35%migratedto other districts within the state.
• Thetoptwodestinationsforout-of-statemigrationwereThaneandMumbai(Suburban)inMaharashtra.
• AccordingtoDLHS-IIIdata,theHIVandSTI/RTIawarenessrateamongwomenwas34.7%and13.4%,respectively.
• In2012,therewereseventargetedintervention(TI)sitesinoperationinthedistrict(2MSMTI,2FSWTI,and3compositeTI),cateringfor8,000 mapped HRGs.
Key Recommendations:
• PresenceoflargenumberofMSMshouldbeconsideredforincreaseinthenumberofMSM-TIsitesinthedistrict.
• Conductsocio-demographicanalysisofHSS-ANCattendeestounderstandriskfactorsforHIVepidemicamonggeneralpopulation.
• FocusontheoutreacheffortsforhomebasedFSWs(65%ofthetotalFSWsinthedistrict)tokeepHIVprevalenceamongthematlowlevel.
• FocusedIECforgeneralpopulationwithHIVawarenessandsexualriskreductionmessagesisrecommended.OutreachprogramsforHIVprevention among spouses and partners of HRG is recommended (to limit the spread of HIV infection), particularly if case of sero-discordant couple is known.
• StrengthenTIinterventionsfortheIDUpopulation,asthelevelofpositivityamongHSS-IDUattendeeswashigh.
Bhavnagar District

District HIV/AIDS Epidemiological Profiles : Gujarat | 21
BhavnagarDistrict Population: 28,77,961 (4.77%
of Gujarat Population); Fem
ale Literacy1: 66.92%
; ANC Utilization
2: 58%
2005
20062007
20082009
20102011
2012
HSS-ANC
PP4
-0.75
00
0.500.50
NT
4-
400400
392400
400
PPTCTPP
0.880.45
0.480.52
0.230.11
0.060.09
NT
20461782
10492889
1713920052
4471030290
Blood BankPP
0.200.30
0.300.10
0.190.13
0.100.10
NT
951910767
1331514379
2806232593
3621437999
HSS-STDPP
4.69-
6.905.94
--
NT
213-
203202
--
HSS-FSWPP
--
-2.02
4.02-
NT
--
-248
249-
HSS-MSM
PP-
--
5.624.00
-N
T-
--
249250
-
HSS-IDUPP
--
--
--
NT
--
--
--
ICTC Male
PP-
--
8.073.43
2.346.05
2.12N
T-
--
655715069
1818516138
16309
ICTC Female
PP-
--
5.212.34
1.040.35
0.88N
T-
--
443410850
1510816947
16448
ICTC ReferredPP
--
-4.05
3.212.19
5.211.86
NT
--
-5037
628611032
1590016414
ICTC Direct W
alk-inPP
--
-9.34
2.901.53
1.201.13
NT
--
-5954
1963322261
1718516343
Total tested at ICTCs
5 N
T2046
17821049
1388043058
5334577795
63047
PLHIV Profile, 2012
% O
n ART%
15-24 yrs%
Ill., Prim. Edu.
% M
arried%
Widow
ed or Divorced
ART (3372)47
1079
6014
DLN (N
A)-
--
--
Block-Level Details
No. HRG
- FSW
- -
- -
- -
- -
-
No. HRG
- M
SM-
- -
- -
- -
- -
No. HRG
- IDU
- -
- -
- -
- -
-
% Pos;
ICTC-
- -
- -
- -
- -
% Pos;
PPTCT-
- -
- -
- -
- -
Route of HIV Transm
ission, ICTC 2012
Hetero-sexualHom
o-sexualBlood
TransfusionN
eedle/ Syringe
Parent to Child
Unknown
% of Total
(N=
491)89.21
3.263.67
02.85
1.02
HIV Levels and Trends
3
* Inadequate sample size; - Data not available; 1 2011 Census; 2 Source: DLHS III; 3 Data presented only for years w
here sample size is valid (HSS-AN
C ≥ 300, HSS-HRG/STD ≥ 187, ICTC ≥ 600, PPTCT ≥ 900 and BB ≥ 900); 4 PP =
percent positive, N
T = num
ber tested; 5 General clients & pregnant w
omen.
STI/RTI2009
20102011
2012
No. episodes treated
4023136796
4108239303
% Syphilis positivity
-0.25
0.110.19
Programm
e ResponseN
o.2004
20052006
20072008
20092010
20112012
FSW TIs
--
--
-2
22
2M
SM TIs
--
--
-2
22
2IDU TIs
--
--
--
--
-Com
p. TIs-
--
--
33
33
ICTCs-
--
1318
3644
6767
Blood Banks5
56
77
77
77
STI clinics-
--
22
22
33
ART centres-
--
-1
11
11
Link ART centres-
--
--
-4
55
PLHIV Netw
orks-
11
11
11
11
Red Ribbon Clubs-
--
--
5050
3232
Comm
. care centres-
--
-1
11
11
Drop-in-centres-
--
-1
11
11
Condom outlets
--
--
--
--
-
VulnerabilitiesM
ale Migration, 2001 Census
Overall
Inter-State
Intra-state
Intra-district
No. out-
migration
1409588326
7802654606
% of m
ale pop.
11.050.65
6.124.28
% total
migration
1005.91
55.3538.74
Top 5 districts for inter-state out-migration
Thane, M
aharash-tra
Mum
bai (Subur-ban),
Maharash-
tra
Mum
bai, M
aharash-tra
Nashik,
Maharash-
tra
Dadra & N
agar Haveli,
Dadra & N
agar Haveli
HRG Size
FSWM
SMIDU
Size Est., (Mapping,
Year: 2008, 2009)3264
4889-
% Total HRG
40.0359.97
-
% Total Pop.
0.110.17
-
Program Target
NA
NA
NA
Program Coverage
--
-
Typology
Home
based-65%
;
Brothel based-25%
;
Street based-10%
Kothi-79.59%
;
Panthi-N
A;
Double decker-20.41%
Daily Injectors-
NA;
Non daily
Injectors-N
A
% <
25 yrs.-
--
% M
arried-
--

22 | District HIV/AIDS Epidemiological Profiles : Gujarat
DahodBackground:
Dahod is the eastern gateway of Gujarat. It was carved out of Panchmahal district in 1979. This district is bound by Panchmahal district to the west, Chhota-udepur district to the south, and shares borders with districts of two states: Jhabua district and Alirajpur district of Madhya Pradesh State to the east and southeast respectively, and Banswara district of Rajasthan State to the north and northeast. The district has a population of 21.26 lakh, a sex ratio of 986 females per 1,000 males; female literacy rate of 49.02%, with an overall literacy rate of 60.60% (Census 2011). Dahod is predominantly an agricultural region and the prime share of revenue in the district comes from agriculture-based products (91.01% of the total population reside in rural areas, Census 2011). Focus industry sectors are food products, rubber and plastic products, and mineral based industries. Tourist Destinationsinclude Chhab Lake, Aurangzeb’s Fort, the Shiva Temple at Bavka, Ratanmahal Sanctuary, etc. The district’s tribal culture and the tribal folklores are anothertourist attraction. National Highway (NH) 59, 8E and State Highway (SH) 2 pass through the district.
HIV Epidemic Profile:
• Basedon2012HSS-ANCdataHIVprevalencewaslowandhasseenaconsistentdeclineoverthepast3rounds.
• According to2012PPTCTdata,HIVpositivitywas lowat0.06%among thePPTCTattendees,witha stable trend in the last threerecordings.
• Accordingto2012BloodBankdata,HIVpositivitywaslowat0.04%amongtheBloodBankdonors.
• In2012,HIVprevalenceamongICTCattendeeswaslowamongmale(0.78%)andfemale(0.48%)clients,aswellasamongreferred(0.54%) and direct walk-in (0.76%) clients. While male and referred clients had a fluctuating trend, female clients had a stable trend and direct walk-ins observed a declining trend.
• Accordingto2008HRGsizemappingdata,FSW(223;representing76.63%ofthetotalHRG)wasthelargestHRGinthedistrict.Themajor typology of FSWs was street-based (80.6%).
• In2012,6,556STI/RTIepisodesweretreatedandthesyphilispositivityrateamongSTIclinicattendeeswas0.72%.
• According to the2001census,3.66%ofmalepopulationwasmigrants;amongthem4.36%migrated tootherstatesand49.38%migrated to other districts within the state.
• Thetoptwodestinationsforout-of-statemigrationwereBanswara,Rajasthan;andNashik,Maharashtra.
• Accordingto2012ICTCdata,HIVtransmissionsfromparenttochildaccountedfor5.29%ofthetotaltransmissionsinthedistrict.
• AccordingtoDLHS-IIIdata,theHIVandSTI/RTIawarenessrateamongwomenwas16.2%and5.6%,respectively.
Key Recommendations:
• DistrictneedstocontinueattentiontodecreaseandlimitthespreadofHIVinfectionfurtherconsideringthevulnerabilityandriskfactors,even though both, ANC HIV prevalence and HIV positivity detected at ICTC are low. Parent to child transmission rate was high, thus more needs to be done to reduce the transmission. Understanding the profile of the attendees through in-depth analysis of ICTC data is required
• OutreachprogramsfocusonearlyHIVdetectionandHIVtestingfocusedonspecificpopulation,isneeded.
• FocusonoutreacheffortsforstreetbasedFSW(80.6%ofthetotalFSWinthedistrict)todecreaseandlimitHIVtransmissionamongthem and to their clients to lower levels.
• StrengthenoutreachactivitieswithHIVpreventionmessagesformigrantsatsourceanddestinationsitesandamonggeneralpopulation,especially women.
Dahod District

District HIV/AIDS Epidemiological Profiles : Gujarat | 23
Dahod
District Population: 21,26,558 (3.52% of G
ujarat Population); Female Literacy
1: 49.02%; AN
C Utilization2: 46.5%
2005
20062007
20082009
20102011
2012
HSS-ANC
PP4
-1.38
0.751.50
0.500
NT
4-
363400
399399
400
PPTCTPP
-*
0.360.35
0.06-
0.070.06
NT
-*
13991709
14073-
2663722152
Blood BankPP
00
00
0.030
0.040.04
NT
11545277
31879613
1161211100
1089511049
HSS-STDPP
--
--
--
NT
--
--
--
HSS-FSWPP
--
--
--
NT
--
--
--
HSS-MSM
PP-
--
--
-N
T-
--
--
-
HSS-IDUPP
--
--
--
NT
--
--
--
ICTC Male
PP-
--
3.541.90
0.974.23
0.78N
T-
--
26866831
1150122620
15059
ICTC Female
PP-
--
2.861.19
0.540.36
0.48N
T-
--
21677453
1082020015
15009
ICTC ReferredPP
--
-2.61
1.080.56
3.880.54
NT
--
-3450
938615951
2188218064
ICTC Direct W
alk-inPP
--
-4.78
2.411.26
0.860.76
NT
--
-1403
48986370
2075312004
Total tested at ICTCs
5 N
T-
4601399
656228357
2232169272
52220
PLHIV Profile, 2012
% O
n ART%
15-24 yrs%
Ill., Prim. Edu.
% M
arried%
Widow
ed or Divorced
ART (578)42
1684
6516
DLN (N
A)-
--
--
Block-Level Details
No. HRG
- FSW
- -
- -
- -
- -
-
No. HRG
- M
SM-
- -
- -
- -
- -
No. HRG
- IDU
- -
- -
- -
- -
-
% Pos;
ICTC-
- -
- -
- -
- -
% Pos;
PPTCT-
- -
- -
- -
- -
Route of HIV Transm
ission, ICTC 2012
Hetero-sexualHom
o-sexualBlood
TransfusionN
eedle/ Syringe
Parent to Child
Unknown
% of Total
(N=
189)93.12
1.060
05.29
0.53
HIV Levels and Trends
3
* Inadequate sample size; - Data not available; 1 2011 Census; 2 Source: DLHS III; 3 Data presented only for years w
here sample size is valid (HSS-AN
C ≥ 300, HSS-HRG/STD ≥ 187, ICTC ≥ 600, PPTCT ≥ 900 and BB ≥ 900); 4 PP =
percent positive, N
T = num
ber tested; 5 General clients & pregnant w
omen.
STI/RTI2009
20102011
2012
No. episodes treated
10832533
45386556
% Syphilis positivity
-0.74
1.040.72
Programm
e ResponseN
o.2004
20052006
20072008
20092010
20112012
FSW TIs
--
--
--
--
-M
SM TIs
--
--
--
--
-IDU TIs
--
--
--
--
-Com
p. TIs-
--
--
11
11
ICTCs-
--
413
2051
5252
Blood Banks1
12
34
44
44
STI clinics-
--
11
11
22
ART centres-
--
--
--
-1
Link ART centres-
--
--
11
1-
PLHIV Netw
orks-
--
--
11
11
Red Ribbon Clubs-
--
--
--
--
Comm
. care centres-
--
--
--
--
Drop-in-centres-
--
-1
11
11
Condom outlets
--
--
--
--
-
VulnerabilitiesM
ale Migration, 2001 Census
Overall
Inter-State
Intra-state
Intra-district
No. out-
migration
301711314
1489813959
% of m
ale pop.
3.660.16
1.811.69
% total
migration
1004.36
49.3846.27
Top 5 districts for inter-state out-migration
Banswara,
Rajasthan
Nashik,
Maharash-
tra
Thane, M
aharash-tra
--
HRG Size
FSWM
SMIDU
Size Est., (Mapping,
Year: 2008)223
68-
% Total HRG
76.6323.37
-
% Total Pop.
0.010
-
Program Target
NA
NA
NA
Program Coverage
--
-
Typology
Home
based-13.6%
;
Brothel based-5.9%
;
Street based-80.6%
Kothi-57.45%
;
Panthi-N
A;
Double decker-34.04%
Daily Injectors-
NA;
Non daily
Injectors-N
A
% <
25 yrs.-
--
% M
arried-
--

24 | District HIV/AIDS Epidemiological Profiles : Gujarat
GandhinagarBackground:
Gandhinagar district is an administrative division of Gujarat, India, whose headquarters are at Gandhinagar, the state capital. It was organized in 1964. The district has a population of 13.87 lakh, with a sex ratio of 920 females per 1,000 males; female literacy rate of 77.37%, with an overall literacy rate of 85.78% (Census 2011).
A major section of the working population of Gandhinagar is employed in public sector services. Small scale industry sectors such as textiles, electronics, mineral based, wood products and engineering are the supporting pillars of the economy, providing direct and indirect employment to over 40,000 people in the district. National Highway (NH) 8 and 8C runs through the district connecting it with major cities of the State as also with the rest of India.
HIV Epidemic Profile:
• Basedon2012HSS-ANCdata,HIVpositivitywaslowamongtheANCattendeesat0%,withadecliningtrend.
• Accordingto2012PPTCTdata,HIVpositivitywaslowat0.14%amongthePPTCTattendees,withastabletrend.
• Accordingto2012BloodBankdata,HIVpositivitywaslowat0.09%amongtheBloodBankdonors,withastabletrend.
• In2012,HIVpositivityamongICTCattendeeswas lowamongmale(1.69%)andfemale(0.80%)clients,aswellasamongreferred(0.83%) and direct walk-in (2.14%) clients. Male clients observed a fluctuating trend but female, referred and direct walk-in clients had a declining trend.
• Accordingto2008HRGmappingdata,MSM(365;representing66.36%ofthetotalHRG)wasthelargestHRGinthedistrictfollowedby FSW (185; 33.64% of the total HRG).
• In2012,6,416STI/RTIepisodesweretreatedandthesyphilispositivityrateamongSTIclinicattendeeswas0.27%.
• Accordingtothe2001census,outoftheoverallpopulation,5.74%ofmalesweremigrants;amongthem7.64%migratedtootherstatesand 25.47% migrated to other districts within the state.
• Thetoptwodestinationsforout-of-statemigrationwereGanganagar,Rajasthan;and,Mumbai(Suburban),Maharashtra.
• Accordingto2012ICTCdata,HIVtransmissionsthroughunknownroutesaccountedfor7.19%ofthetotaltransmissionsinthedistrict.
• AccordingtoDLHS-IIIdata,theHIVandSTI/RTIawarenessrateamongwomenwas59.9%and23.3%,respectively.
• In2012,onecompositeTIwasoperationalandtherewereover500individualsclassifiedasHRGinthedistrict.
Key Recommendations:
• ThoughHIVprevalenceislow,thedistrictneedstocontinueattentiontodecreaseandlimitthespreadofHIVinfectionfurther.
• ImprovecounselingatICTCs,sincetherateofunknownHIVtransmissionisnotedhigh.
• AvailabilityofDLNdatawouldhelpinbetterunderstandingofdistrictvulnerabilities.
• StrengthenoutreachactivitieswithHIVpreventionmessagesformigrantsatsourceanddestinationsitesandamonggeneralpopulation,especially women.
• SincethelargestHRGwasMSM,betterassessmentofthesizeandprofileofMSMandpartnerpopulationwillhelpinbetterunderstandingof district vulnerabilities.
Gandhinagar District

District HIV/AIDS Epidemiological Profiles : Gujarat | 25
Gandhinagar
District Population: 13,87,478 (2.30% of G
ujarat Population); Female Literacy
1: 77.37%; AN
C Utilization2: 59.3%
2005
20062007
20082009
20102011
2012
HSS-ANC
PP4
-0.50
01.25
0.250
NT
4-
400400
400400
400
PPTCTPP
-0.20
0.300.20
0.230.17
0.080.14
NT
-979
18365599
993612019
1970414468
Blood BankPP
0.120.35
0.140.13
0.170.19
0.130.09
NT
33182856
49444768
1183213155
1514714811
HSS-STDPP
--
--
--
NT
--
--
--
HSS-FSWPP
--
--
--
NT
--
--
--
HSS-MSM
PP-
--
--
-N
T-
--
--
-
HSS-IDUPP
--
--
--
NT
--
--
--
ICTC Male
PP-
--
4.532.84
1.705.00
1.69N
T-
--
30684330
69599131
6317
ICTC Female
PP-
--
3.462.05
1.140.58
0.80N
T-
--
20802783
58717234
5735
ICTC ReferredPP
--
-2.92
2.061.15
3.820.83
NT
--
-2911
38808201
103918031
ICTC Direct W
alk-inPP
--
-5.63
3.091.97
1.712.14
NT
--
-2237
32334629
59744021
Total tested at ICTCs
5 N
T-
9791836
1074717049
2484936069
26520
PLHIV Profile, 2012
% O
n ART%
15-24 yrs%
Ill., Prim. Edu.
% M
arried%
Widow
ed or Divorced
ART (2264)61
1260
6012
DLN (N
A)-
--
--
Block-Level Details
No. HRG
-FSW-
- -
- -
- -
- -
No. HRG
-MSM
- -
- -
- -
- -
-
No. HRG
- IDU-
- -
- -
- -
- -
% Pos;
ICTC-
- -
- -
- -
- -
% Pos;
PPTCT
Gandhina-
gar, 3.8
Kalol, 2.2
Mansa, 1.7
Dahegam,
6.6O
ther, 8.8
- -
- -
Route of HIV Transm
ission, ICTC 2012
Hetero-sexualHom
o-sexualBlood
TransfusionN
eedle/ Syringe
Parent to Child
Unknown
% of Total
(N=
153)83.66
4.580
04.58
7.19
HIV Levels and Trends
3
* Inadequate sample size; - Data not available; 1 2011 Census; 2 Source: DLHS III; 3 Data presented only for years w
here sample size is valid (HSS-AN
C ≥ 300, HSS-HRG/STD ≥ 187, ICTC ≥ 600, PPTCT ≥ 900 and BB ≥ 900); 4 PP =
percent positive, N
T = num
ber tested; 5 General clients & pregnant w
omen.
STI/RTI2009
20102011
2012
No. episodes treated
14224192
60286416
% Syphilis positivity
00.39
0.060.27
Programm
e ResponseN
o.2004
20052006
20072008
20092010
20112012
FSW TIs
--
--
--
--
-M
SM TIs
--
--
--
--
-IDU TIs
--
--
--
--
-Com
p. TIs-
--
--
11
11
ICTCs-
--
77
837
3941
Blood Banks5
55
55
55
55
STI clinics-
--
11
11
11
ART centres-
--
--
--
--
Link ART centres-
--
-1
11
11
PLHIV Netw
orks-
11
11
11
11
Red Ribbon Clubs-
--
--
--
212
Comm
. care centres-
--
--
--
--
Drop-in-centres-
--
--
--
--
Condom outlets
--
--
--
--
-
VulnerabilitiesM
ale Migration, 2001 Census
Overall
Inter-State
Intra-state
Intra-district
No. out-
migration
401093064
1021426831
% of m
ale pop.
5.740.44
1.463.84
% total
migration
1007.64
25.4766.90
Top 5 districts for inter-state out-migration
Gan-
ganagar, Rajasthan
Mum
bai (Subur-ban),
Maharash-
tra
Thane, M
aharash-tra
--
HRG Size
FSWM
SMIDU
Size Est., (Mapping,
Year: 2008)185
365-
% Total HRG
33.6466.36
-
% Total Pop.
0.010.03
-
Program Target
NA
NA
NA
Program Coverage
--
-
Typology
Home
based-6.64%
;
Brothel based-
77.62%;
Street based-
15.73%
Kothi-59.96%
;
Panthi-N
A;
Double decker-40.04%
Daily Injectors-
NA;
Non daily
Injectors-N
A
% <
25 yrs.-
--
% M
arried-
--

26 | District HIV/AIDS Epidemiological Profiles : Gujarat
Jamnagar Background:
Jamnagar district is located on the southern coast of the Gulf of Kutch in the Saurashtra region of western Gujarat. The district has a population of 21.59 lakh, a sex ratio of 938 females per 1,000 males; female literacy rate of 65.97%, with an overall literacy rate of 74.40% (Census 2011). Focus industry sectors include brass parts, petroleum and petrochemicals, salt, and port related business. Other major industry sectors of the district include engineering and machinery, plastics and oil mills. Among its attractions include a Marine National Park the first in India Khijadiya Bird Sanctuary, and the Dwarka dish temple built in the 16th century. National Highway (NH) 8 Ext. passes through the district.
HIV Epidemic Profile:
• Basedon2012HSS-ANCdata,HIVprevalencewaslowamongtheANCattendees.
• According to2012PPTCTdata,HIVpositivitywas lowat0.13%among thePPTCTattendees,witha stable trend in the last threerecordings.
• Accordingto2012BloodBankdata,HIVpositivitywaslowat0.09%amongtheBloodBankdonors,withastabletrend.
• Accordingto2010HSSdata,HIVprevalencewaslowamongFSWsat0.40%butwasmoderateamongMSMsat5.20%.
• In2012,HIVpositivityamongICTCattendeeswas lowamongmale(1.81%)andfemale(0.99%)clients,aswellasamongreferred(1.22%) and direct walk-in (2.25%) clients. All the ICTC clients had a declining trend, but male and referred clients showed a steep rise in 2011.
• Accordingto2008HRGmappingdata,FSW(2,027;52%ofthetotalHRG)wasthelargestHRGinthedistrictfollowedbyMSM(1,871;48% of the total HRG). The major typology for FSWs was home-based (51.58%). 51.53% of the MSM and 43.23% of FSW respectively are married.
• In2012,23,236STI/RTIepisodesweretreatedandthesyphilispositivityrateamongSTIclinicattendeeswas0.03%.
• Accordingtothe2001census,10.17%ofmalepopulationwasmigrants;amongthem9.63%migratedtootherstatesand42.60%migrated to other districts within the state.
• Thetoptwodestinationsforout-of-statemigrationwereThaneandMumbai(Suburban),Maharashtra.
• Accordingto2012ICTCdata,HIVtransmissionsfromparenttochildaccountedfor5.17%ofthetotalreportedcases(n=329)inthedistrict.
• AccordingtoDLHS-IIIdata,theHIVandSTI/RTIawarenessrateamongwomenwere50.04%and28.4%,respectively.
• In2012,oneTIsiteforeachofFSWandMSM,andonecompositeTIwasoperationalinthedistrict.
Key Recommendations:
• SustaineffortstocontainandlimitthespreadofHIVinfectionfurther.
• IncreasethenumberofTIsitesinthedistricttoaccommodateandeffectivelyprovideservicestothelargesizeofHRGs.
• Conductsocio-demographicanalysisofHSS-ANCandPPTCTattendeestounderstandriskfactorsforHIVinfection.
• FocusoutreacheffortsalsoforhomebasedFSWs(51.58%ofthetotalFSWsinthedistrict)toreducetheirvulnerabilitytoHIVinfection,and prevent the transmission to clients and regular partners.
• ConsideringhighrateofmigrationtohighHIVprevalencedistricts,strengthenoutreachprogrammethroughawarenesscampaignsaroundsource and transit points such asrailway stations and bus stands.
• StrengthenpositivepreventionandPPTCTprograms.ReinforceoutreacheffortsforHIVtestingandlinkagetonecessarytreatmentandcare services.
Jamnagar District
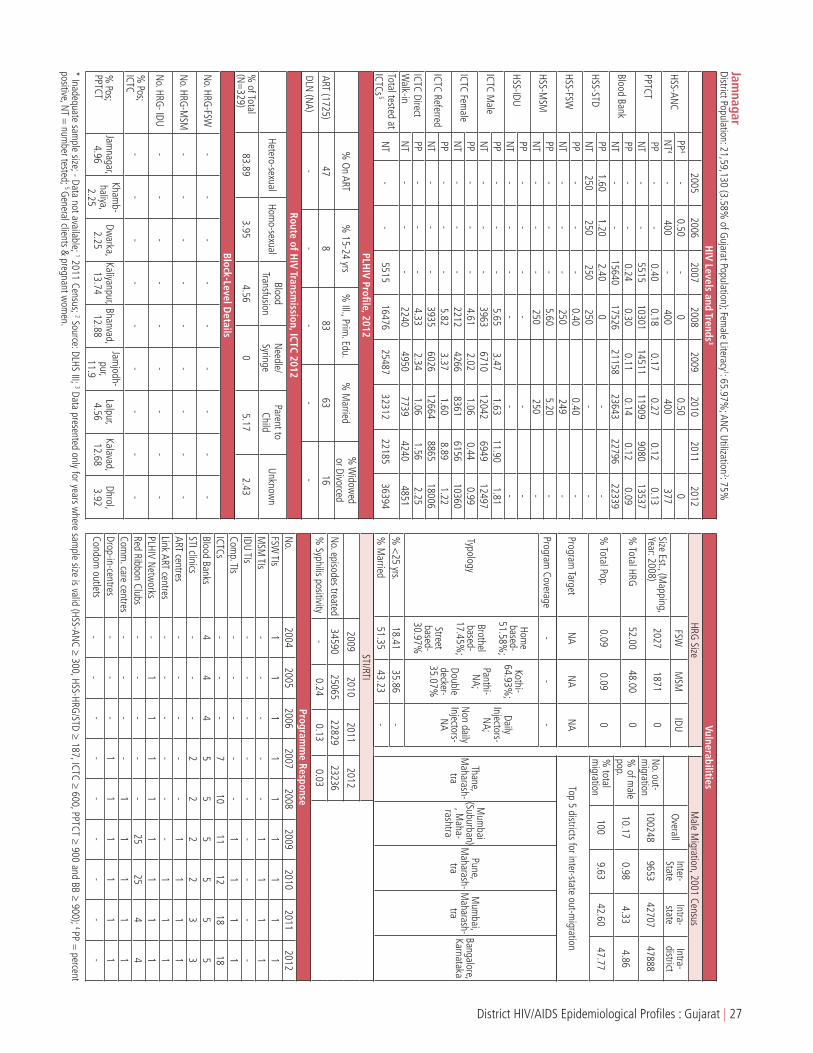
District HIV/AIDS Epidemiological Profiles : Gujarat | 27
Jamnagar
District Population: 21,59,130 (3.58% of G
ujarat Population); Female Literacy
1: 65.97%; AN
C Utilization2: 75%
2005
20062007
20082009
20102011
2012
HSS-ANC
PP4
-0.50
-0
0.500
NT
4-
400-
400400
377
PPTCTPP
--
0.400.18
0.170.27
0.120.13
NT
--
551510301
1451111909
908013537
Blood BankPP
--
0.240.30
0.110.14
0.120.09
NT
--
1564017526
2115823643
2279622339
HSS-STDPP
1.601.20
2.400
--
NT
250250
250250
--
HSS-FSWPP
--
-0.40
0.40-
NT
--
-250
249-
HSS-MSM
PP-
--
5.605.20
-N
T-
--
250250
-
HSS-IDUPP
--
--
--
NT
--
--
--
ICTC Male
PP-
--
5.653.47
1.6311.90
1.81N
T-
--
39636710
120426949
12497
ICTC Female
PP-
--
4.612.02
1.060.44
0.99N
T-
--
22124266
83616156
10360
ICTC ReferredPP
--
-5.82
3.371.60
8.891.22
NT
--
-3935
602612664
886518006
ICTC Direct W
alk-inPP
--
-4.33
2.341.06
1.562.25
NT
--
-2240
49507739
42404851
Total tested at ICTCs
5 N
T-
-5515
1647625487
3231222185
36394
PLHIV Profile, 2012
% O
n ART%
15-24 yrs%
Ill., Prim. Edu.
% M
arried%
Widow
ed or Divorced
ART (1725)47
883
6316
DLN (N
A)-
--
--
Block-Level Details
No. HRG
-FSW-
- -
- -
- -
- -
No. HRG
-MSM
- -
- -
- -
- -
-
No. HRG
- IDU-
- -
- -
- -
- -
% Pos;
ICTC-
- -
- -
- -
- -
% Pos;
PPTCTJam
nagar, 4.96
Khamb-
haliya, 2.25
Dwarka,
2.25Kaliyanpur,
13.74Bhanvad,
12.88
Jamjodh-
pur, 11.9
Lalpur, 4.56
Kalavad, 12.68
Dhrol, 3.92
Route of HIV Transm
ission, ICTC 2012
Hetero-sexualHom
o-sexualBlood
TransfusionN
eedle/ Syringe
Parent to Child
Unknown
% of Total
(N=
329)83.89
3.954.56
05.17
2.43
HIV Levels and Trends
3
* Inadequate sample size; - Data not available; 1 2011 Census; 2 Source: DLHS III; 3 Data presented only for years w
here sample size is valid (HSS-AN
C ≥ 300, HSS-HRG/STD ≥ 187, ICTC ≥ 600, PPTCT ≥ 900 and BB ≥ 900); 4 PP =
percent positive, N
T = num
ber tested; 5 General clients & pregnant w
omen.
STI/RTI2009
20102011
2012
No. episodes treated
3459025065
2282923236
% Syphilis positivity
-0.24
0.130.03
Programm
e ResponseN
o.2004
20052006
20072008
20092010
20112012
FSW TIs
11
11
11
11
1M
SM TIs
--
--
-1
11
1IDU TIs
--
--
--
--
-Com
p. TIs-
--
--
11
11
ICTCs-
--
710
1112
1818
Blood Banks4
44
55
55
55
STI clinics-
--
22
22
33
ART centres-
--
--
11
11
Link ART centres-
--
--
-1
11
PLHIV Netw
orks-
11
11
11
11
Red Ribbon Clubs-
--
--
2525
44
Comm
. care centres-
--
-1
11
11
Drop-in-centres-
--
11
11
11
Condom outlets
--
--
--
--
-
VulnerabilitiesM
ale Migration, 2001 Census
Overall
Inter-State
Intra-state
Intra-district
No. out-
migration
1002489653
4270747888
% of m
ale pop.
10.170.98
4.334.86
% total
migration
1009.63
42.6047.77
Top 5 districts for inter-state out-migration
Thane, M
aharash-tra
Mum
bai (Suburban)
, Maha-
rashtra
Pune, M
aharash-tra
Mum
bai, M
aharash-tra
Bangalore, Karnataka
HRG Size
FSWM
SMIDU
Size Est., (Mapping,
Year: 2008)2027
18710
% Total HRG
52.0048.00
0
% Total Pop.
0.090.09
0
Program Target
NA
NA
NA
Program Coverage
--
-
Typology
Home
based-51.58%
;
Brothel based-
17.45%;
Street based-
30.97%
Kothi-64.93%
;
Panthi-N
A;
Double decker-35.07%
Daily Injectors-
NA;
Non daily
Injectors-N
A
% <
25 yrs.18.41
35.86-
% M
arried51.35
43.23-

28 | District HIV/AIDS Epidemiological Profiles : Gujarat
JunagadhBackground:
Junagadh district is located on the Kathiawar peninsula in western Gujarat. It is surrounded by Rajkot district (North), Porbandar district (North-West); Amreli district (East). To the South and West is the Arabian Sea. It is the second least-populous district of Gujarat with a population of 27.42 lakh, a sex ratio of 952 females per 1,000 males; female literacy rate of 67.59%, with an overall literacy rate of 74.40% (Census 2011). Agriculture is the backbone of the district economy. 70% of the population is engaged in this primary sector, 22% in secondary sector and 8% in tertiary sector. Junagadh is famous for the Gir Sanctuary, the only abode to Asiatic lions. The mountain range Girnar is a pilgrimage destination for Jainism and Hinduism.Junagadh boasts of some of the best tourist destinations in the State and receives a large influx of tourists every year. National Highway 8D and 8E passes through the district.
HIV Epidemic Profile:
• Basedon2012HSS-ANCdata,HIVpositivitywasmoderateat0.50%amongtheANCattendees.Thisrepresentsanincreasecomparedwith 0.25% in the three previous HSS rounds..
• Accordingto2012PPTCTdata,HIVpositivitywaslowat0.10%amongthePPTCTattendees,withastabletrend.
• Accordingto2012BloodBankdata,thelevelofHIVpositivitywaslowat0.14%amongtheBloodBankdonors,withastabletrend.
• In2012,HIVpositivityamongICTCattendeeswas lowamongmale(1.46%)andfemale(0.72%)clients,aswellasamongreferred(0.88%) and direct walk-in (1.34%) clients. A decreasing trend was observed over a period of five years among all the ICTC clients.
• AccordingtoHRGmappingdata,FSW(230;61.99%ofthetotalHRG)wasthelargestHRGinthedistrictfollowedbyMSM(141;38.01%of the total HRG). 89.16% of the FSWs are married and the major typology for FSWs is home-based (67.47%) Similarly, 77.5% of MSM are married.
• In2012,8,543STI/RTIepisodesweretreatedandthesyphilispositivityrateamongSTIclinicattendeeswas0.03%.
• According to the2001 census,11.72%ofmalepopulationwasmigrants; among them4.09migrated toother statesand38.04%migrated to other districts within the state.
• Thetoptwodestinationsforout-of-statemigrationwereMumbai(Suburban)andThane,Maharashtra.
• Accordingto2012ICTCdata,HIVtransmissionsfromparenttochildaccountedfor8.05%ofthetotalreportedcases(n=385)inthedistrict.
• AccordingtoDLHS-IIIdata,theHIVandSTI/RTIawarenessrateamongwomenwas47.1%and28%,respectively.
• In2012,oneTIsiteforeachofFSWandMSMandonecompositeTIwereoperationalinthedistrict.
Key Recommendations:
• ConsideringtheHIVprevalenceamongHSS-ANCattendees,socio-demographicanalysisisrequiredtoascertainriskfactors.
• StrengthenPPTCTprogramcoverageinthedistrict,asparenttochildHIVtransmissionishighinthedistrict.Strengtheninterventionsforenabling early detection among pregnant mothers and spouses, and linkage to necessary HIV prevention, treatment and care services.
• Analysethenumberandprofileofmigrantstoimproveunderstandingofdistrictvulnerabilities,consideringhighrateofmigration.
• FocusinterventionsalsoamonghomebasedFSWconsideringtheirproportionoutofthosemapped(89.16%marriedFSW)andconsideroptions for reaching to their regular partners.
• AnalysevulnerabilityfactorsintransmissionofHIVfromICTCandSTIdata,althoughthereisalowlevelofHIVepidemicinthedistrict.
• AvailabilityofDLNdatawillhelpinbetterunderstandingofdistrictvulnerabilities.
Junagarh District

District HIV/AIDS Epidemiological Profiles : Gujarat | 29
JunagadhDistrict Population: 27,42,291 (4.54%
of Gujarat Population); Fem
ale Literacy1: 67.59%
; ANC Utilization
2: 74.7%
2005
20062007
20082009
20102011
2012
HSS-ANC
PP4
0.250.50
0.250.25
0.250.50
NT
4400
400400
400398
400
PPTCTPP
-*
*0.30
0.130.12
0.100.10
NT
-*
*4511
1749721406
3751825827
Blood BankPP
0.260.28
0.160.11
0.100.05
0.070.14
NT
85909090
978516726
1811719664
1829818700
HSS-STDPP
-1.20
2.403.20
2.02-
NT
-250
250250
247-
HSS-FSWPP
--
--
--
NT
--
--
--
HSS-MSM
PP-
--
--
-N
T-
--
--
-
HSS-IDUPP
--
--
--
NT
--
--
--
ICTC Male
PP-
--
4.563.06
2.424.58
1.46N
T-
--
73308670
1235828352
17388
ICTC Female
PP-
--
2.601.81
1.050.44
0.72N
T-
--
73429517
1411727435
18292
ICTC ReferredPP
--
-2.26
1.420.89
3.020.88
NT
--
-8419
1004217276
3566220492
ICTC Direct W
alk-inPP
--
-5.36
3.613.19
1.701.34
NT
--
-6253
81459199
2012515188
Total tested at ICTCs
5 N
T-
137804
1918335684
4788193305
61507
PLHIV Profile, 2012
% O
n ART%
15-24 yrs%
Ill., Prim. Edu.
% M
arried%
Widow
ed or Divorced
ART (2290)53
1285
6314
DLN (N
A)-
--
--
Block-Level Details
No. HRG
- FSW
- -
- -
- -
- -
-
No. HRG
- M
SM-
- -
- -
- -
- -
No. HRG
- IDU
- -
- -
- -
- -
-
% Pos;
ICTC-
- -
- -
- -
- -
% Pos;
PPTCT-
- -
- -
- -
- -
Route of HIV Transm
ission, ICTC 2012
Hetero-sexualHom
o-sexualBlood
TransfusionN
eedle/ Syringe
Parent to Child
Unknown
% of Total
(N=
385)88.31
0.521.56
0.528.05
1.04
HIV Levels and Trends
3
* Inadequate sample size; - Data not available; 1 2011 Census; 2 Source: DLHS III; 3 Data presented only for years w
here sample size is valid (HSS-AN
C ≥ 300, HSS-HRG/STD ≥ 187, ICTC ≥ 600, PPTCT ≥ 900 and BB ≥ 900); 4 PP =
percent positive, N
T = num
ber tested; 5 General clients & pregnant w
omen.
STI/RTI2009
20102011
2012
No. episodes treated
166676720
92028543
% Syphilis positivity
-0
0.010.03
Programm
e ResponseN
o.2004
20052006
20072008
20092010
20112012
FSW TIs
12
--
-1
11
1M
SM TIs
--
--
11
11
1IDU TIs
--
--
--
--
-Com
p. TIs-
--
-1
11
11
ICTCs-
--
912
1368
7676
Blood Banks4
44
57
77
77
STI clinics-
--
11
11
22
ART centres-
--
--
-1
11
Link ART centres-
--
--
23
44
PLHIV Netw
orks-
--
-1
11
11
Red Ribbon Clubs-
--
--
2525
66
Comm
. care centres-
--
--
-1
11
Drop-in-centres-
--
--
--
--
Condom outlets
--
--
--
--
-
VulnerabilitiesM
ale Migration, 2001 Census
Overall
Inter-State
Intra-state
Intra-district
No. out-
migration
1468306009
5585884963
% of m
ale pop.
11.720.48
4.466.78
% total
migration
1004.09
38.0457.86
Top 5 districts for inter-state out-migration
Mum
bai (Suburban), M
aharash-tra
Thane, M
aharash-tra
Diu, Dam
an & Diu
Mum
bai, M
aharash-tra
Dadra & N
agar Haveli,
Dadra & N
agar Haveli
HRG Size
FSWM
SMIDU
Size Est., (Mapping,
Year: 2008)230
141-
% Total HRG
61.9938.01
-
% Total Pop.
0.010.01
-
Program Target
NA
NA
NA
Program Coverage
--
-
Typology
Home
based-67.47%
;
Brothel based-4.82%
;
Street based-
27.71%
Kothi-30%
;
Panthi-N
A;
Double decker-70%
Daily Injectors-
NA;
Non daily
Injectors-N
A
% <
25 yrs.1.20
27.50-
% M
arried89.16
77.50-

30 | District HIV/AIDS Epidemiological Profiles : Gujarat
KutchBackground:
Kutch district (also spelled as Kachchh) is the largest district of both Gujarat State and India. The name Kutch was derived from its Geographical Characteristics and particularly resemblance of its earth surface with tortoise. Kutch district is surrounded by the Gulf of Kutch and the Arabian Sea in south and west, while northern and eastern parts are surrounded by the Great and Small Rann (seasonal wetlands) of Kutch. It has a population of 20.90 lakh, with a sex ratio of 907 females per 1,000 males; female literacy rate of 70.73%, with an overall literacy rate of 79.31% (Census 2011). The district is famous for ecologically important Banni grasslands with their seasonal marshy wetlands which form the outer belt of the Rann of Kutch. Kutch is a mineral rich region with very large reserves of Lignite, Bauxite, and Gypsum among other minerals. Transportation as a business has thrived in the district due to the presence of two major ports. National Highway 8A and 15 passes through the district.
HIV Epidemic Profile:
• Basedon2012HSS-ANCdata,HIVprevalencewasmoderateat0.75%amongtheANCattendees,withanincreasingtrend.
• Accordingto2012PPTCTdata,HIVpositivitywaslowat0.15%amongthePPTCTattendees,withastabletrend.
• Accordingto2012BloodBankdata,HIVpositivitywaslowat0.14%amongtheBloodBankdonors,withastabletrend.
• In2012,HIVpositivityamongICTCattendeeswas lowamongmale(1.67%)andfemale(1.76%)clients,aswellasamongreferred(1.70%) and direct walk-in (1.69%) clients. positivity levels showed a declining trend among all the ICTC attendees.
• AccordingtoHRGmappingdata,MSM(680;52.15%ofthetotalHRG)wasthelargestHRGinthedistrictfollowedbyFSW(624;47.85%of the total HRG). The major typology for FSWs was home-based (57.31%). 72.07% of MSM and 82.6% of FSW are married.
• In2012,9,394STI/RTIepisodesweretreatedandthesyphilispositivityrateamongSTIclinicattendeeswas0.03%.
• Asperthe2001Census,10.81%ofthemalepopulationweremigrants;amongthem24.77%migratedtootherstatesand17.01%migrated to other districts within the state.
• Thetoptwodestinationsforout-of-statemigrationwereMumbai(Suburban)andThane,Maharashtra.
• Accordingto2012ICTCdata,HIVtransmissionsfromparenttochildandbloodtransfusionaccountedfor5.14%and5.44%ofthetotalreported cases (n=331) in the district.
• AccordingtoDLHS-IIIdata,theHIVandSTI/RTIawarenessrateamongwomenwas40.9%and22.9%,respectively.
• In2012,thereweretwocompositeTIsoperationalinthedistrict.
Key Recommendations:
• Conduct socio-demographic analysis ofHSS-ANCandPPTCTattendees to ascertain risk factors, considering the increasing trendofprevalence among HSS-ANC attendees.
• StrengtheninterventionsforpositivepreventionamongspousesandpartnersofHRG,migrantsandgeneralpopulation,andoutreachefforts for early detection, and linkage to necessary treatment and care centers.
• StrengthenPPTCTprogramcoverageinthedistrict,asparenttochildtransmissionsishighinthedistrict(ICTCprogramdata).
• ImprovecounselingatICTCs,sincetherateofunknownHIVtransmissionwashigh.
• Consideringhighrateofmigration,conductspecialawarenesscampaignespeciallyamongpocketsofout-migrantstransitpointsandaround truck halting points and highways in the district.
• StrengthenandimprovequalityofoutreachprogrammeforMSMandFSWs.
Kutch District

District HIV/AIDS Epidemiological Profiles : Gujarat | 31
KutchDistrict Population: 20,90,313 (3.46%
of Gujarat Population); Fem
ale Literacy1: 61.62%
; ANC Utilization
2: 48.5%
2005
20062007
20082009
20102011
2012
HSS-ANC
PP4
00.50
00
0.500.75
NT
4400
400400
398400
400
PPTCTPP
-*
*0.40
0.220.16
0.170.15
NT
-*
*4881
72997353
134569915
Blood BankPP
0.080.09
0.130.14
0.190.18
0.140.14
NT
35704627
84139811
2150126252
2575424023
HSS-STDPP
--
--
--
NT
--
--
--
HSS-FSWPP
--
--
--
NT
--
--
--
HSS-MSM
PP-
--
--
-N
T-
--
--
-
HSS-IDUPP
--
--
--
NT
--
--
--
ICTC Male
PP-
--
-5.27
3.602.19
1.67N
T-
--
-4956
8675 15463
12581
ICTC Female
PP-
--
-4.29
4.00 2.07
1.76N
T-
--
-2679
3725 7446
6380
ICTC ReferredPP
--
--
3.723.12
1.621.70
NT
--
--
52408104
105548161
ICTC Direct W
alk-inPP
--
--
7.564.84
2.191.69
NT
--
--
23954296
1235510800
Total tested at ICTCs
5 N
T-
4391
488114934
735313456
28876
PLHIV Profile, 2012
% O
n ART%
15-24 yrs%
Ill., Prim. Edu.
% M
arried%
Widow
ed or Divorced
ART (1804)48
1120
171
DLN (N
A)-
--
--
Block-Level Details
No. HRG
- FSW
- -
- -
- -
- -
-
No. HRG
- M
SM-
- -
- -
- -
- -
No. HRG
- IDU
- -
- -
- -
- -
-
% Pos;
ICTC-
- -
- -
- -
- -
% Pos;
PPTCT-
- -
- -
- -
- -
Route of HIV Transm
ission, ICTC 2012
Hetero-sexualHom
o-sexualBlood
TransfusionN
eedle/ Syringe
Parent to Child
Unknown
% of Total
(N=
331)74.92
11.785.44
2.425.14
0.30
HIV Levels and Trends
3
* Inadequate sample size; - Data not available; 1 2011 Census; 2 Source: DLHS III; 3 Data presented only for years w
here sample size is valid (HSS-AN
C ≥ 300, HSS-HRG/STD ≥ 187, ICTC ≥ 600, PPTCT ≥ 900 and BB ≥ 900); 4 PP =
percent positive, N
T = num
ber tested; 5 General clients & pregnant w
omen.
STI/RTI2009
20102011
2012
No. episodes treated
123899046
110949394
% Syphilis positivity
-0.07
0.010.03
Programm
e ResponseN
o.2004
20052006
20072008
20092010
20112012
FSW TIs
23
33
2-
--
-M
SM TIs
--
--
--
--
-IDU TIs
--
--
--
--
-Com
p. TIs-
--
--
22
22
ICTCs-
--
78
823
3535
Blood Banks4
43
55
66
66
STI clinics-
--
11
11
11
ART centres-
--
--
-1
11
Link ART centres-
--
-1
1-
23
PLHIV Netw
orks1
11
11
11
11
Red Ribbon Clubs-
--
--
--
88
Comm
. care centres-
--
--
-1
11
Drop-in-centres-
--
11
11
11
Condom outlets
--
--
--
--
-
VulnerabilitiesM
ale Migration, 2001 Census
Overall
Inter-State
Intra-state
Intra-district
No. out-
migration
8458620954
1438949243
% of m
ale pop.
10.812.68
1.846.29
% total
migration
10024.77
17.0158.22
Top 5 districts for inter-state out-migration
Mum
bai (Suburban)
, Maha-
rashtra
Thane, M
aharash-tra
Mum
bai, M
aharash-tra
Nashik,
Maharash-
tra
Pune, M
aharash-tra
HRG Size
FSWM
SMIDU
Size Est., (Mapping,
Year: 2008)624
680-
% Total HRG
47.8552.15
-
% Total Pop.
0.030.03
-
Program Target
NA
NA
NA
Program Coverage
--
-
Typology
Home
based-57.31%
;
Brothel based-
38.94%;
Street based-4.13%
Kothi-77.34%
;
Panthi-N
A;
Double decker-17.2%
Daily Injectors-
NA;
Non daily
Injectors-N
A
% <
25 yrs.25.29
22.75-
% M
arried82.60
72.07-

32 | District HIV/AIDS Epidemiological Profiles : Gujarat
KhedaBackground:
Kheda, also known as ‘Kaira’ is located 35 km from Ahmedabad, on the bank of river Vatrak. Kheda district borders with Sabarkantha district in the north, Panchmahals district in the east, Vadodara district in the south and Ahmedabad district in the west. The district has a population of 22.98 lakh, 77.24% residing in rural areas, a sex ratio of 937 females per 1,000 males; female literacy rate of 74.67%, with an overall literacy rate of 84.31% (Census 2011). Focus industry sectors are agriculture, mineral-based industries, plastics, engineering and IT sector. Kheda district is also known by the name golden leaf since it is the major producer of tobacco in the state. Famous pilgrimage destinations in the district are Dakortemple, Santram temple, and Mahadev temple. A tourist attraction is Dinosaur and Fossil Park which is a treasure of fossils and fossilized eggs of a 10 meter long dinosaur. National Highway (NH) 8 passes through the district connecting it to cities such as Ahmedabad, Surat and Vadodara.
HIV Epidemic Profile:
• Basedon2012HSS-ANCdata,HIVprevalencewasmoderateat0.75%amongtheANCattendees,whileitwas0.25%in2010.
• Accordingto2012PPTCTdata,HIVpositivitywaslowat0.14%amongthePPTCTattendees,withastabletrend.
• Accordingto2012BloodBankdata,HIVpositivitywaslowat0.16%amongtheBloodBankdonors,withastabletrend.
• In2012,HIVpositivityamongICTCattendeeswas lowamongmale(3.90%)andfemale(2.41%)clients,aswellasamongreferred(2.10%) clients and moderate among direct walk-in (8.11%) clients. ICTC male, female and referred clients had a stable trend but observed a steep rise in 2011, whereas direct walk-ins had an increasing trend.
• Accordingto2008-09HRGmappingdata,FSWs(454;)wastheonlyHRGinthedistrict.52.78%ofthemweremarriedandthemajortypology was street-based (58.84%).
• In2012,12,061STI/RTIepisodesweretreatedandthesyphilispositivityrateamongSTIclinicattendeeswas0.60%.
• Asper the2001Census,6.94%of themalepopulationweremigrants; among them4.53%migrated toother statesand51.07%migrated to other districts within the state.
• Thetoptwodestinationsforout-of-statemigrationwereThaneandMumbai(Suburban),Maharashtra.
• Accordingto2012ICTCdata,HIVtransmissionsfromparenttochildandthroughbloodtransfusionaccountedfor6.99%and9.32%respectively of the total reported cases (n=515) respectively in the district.
• AccordingtoDLHS-IIIdata,theHIVandSTI/RTIawarenessrateamongwomenwas49.9%and27.7%,respectively.
• In2012,therewasonecompositeTIinthedistrict.
Key Recommendations:
• ConsideringrisingprevalenceamongHSS-ANCattendees,socio-demographicanalysisneedstobedonetoascertainriskfactors.
• Carryoutdifferentialanalysisofdirectwalk-inclientsatICTCclinics,(asrepresentativeofvulnerablepopulations)toinformdesignandfocusing of various efforts aimed at specific vulnerable groups. Since HIV transmission rate through blood transfusion is high, there is a need to better understand the profile of these positive individuals through in-depth analysis of ICTC data analysis.
• Parenttochildtransmissionratewashigh,thusmoreneedstobedonetounderstandtheprofileoftheseattendeesthroughin-depthanalysis of ICTC data. Strengthen outreach efforts and counselling to enable early HIV detection, positive prevention and / or link to necessary treatment centers.
• IntensifyoutreachactivitieswithHIVpreventionmessagesformigrantsatsourceanddestinationsites.Alsoconductspecialawarenesscampaign especially at tourist’s destinations.
Kheda District

District HIV/AIDS Epidemiological Profiles : Gujarat | 33
KhedaDistrict Population: 22,98,934 (3.81%
of Gujarat Population); Fem
ale Literacy1: 74.67%
; ANC Utilization
2: 62.2%
2005
20062007
20082009
20102011
2012
HSS-ANC
PP4
--
0.500
0.250.75
NT
4-
-400
322396
400
PPTCTPP
-*
*0.41
0.220.13
0.120.14
NT
-*
*1703
1073717935
2392415674
Blood BankPP
0.160.20
0.340.30
0.250.16
0.260.16
NT
49439793
97879994
1255613026
1403513393
HSS-STDPP
--
--
--
NT
--
--
--
HSS-FSWPP
--
--
--
NT
--
--
--
HSS-MSM
PP-
--
--
-N
T-
--
--
-
HSS-IDUPP
--
--
--
NT
--
--
--
ICTC Male
PP-
--
4.512.94
2.5410.11
3.90N
T-
--
43926192
810211456
9118
ICTC Female
PP-
--
3.812.63
1.461.33
2.41N
T-
--
31234404
69378248
6896
ICTC ReferredPP
--
-2.55
2.201.55
6.682.10
NT
--
-4675
778312365
1581812933
ICTC Direct W
alk-inPP
--
-6.97
4.514.30
5.438.11
NT
--
-2840
28132674
38863081
Total tested at ICTCs
5 N
T-
203705
921821333
3297443628
31688
PLHIV Profile, 2012
% O
n ART%
15-24 yrs%
Ill., Prim. Edu.
% M
arried%
Widow
ed or Divorced
ART (NA)
--
--
-
DLN (N
A)-
--
--
Block-Level Details
No. HRG
-FSW-
- -
- -
- -
- -
No. HRG
-MSM
- -
- -
- -
- -
-
No. HRG
- IDU-
- -
- -
- -
- -
% Pos;
ICTC-
- -
- -
- -
- -
% Pos;
PPTCTN
adiad, 9.56
Kheda, 5.14
Matar, 2.8
Mahudha,
0
Mehm
da-bad, 0.62
Thasara, 5.1
Balasinor, 0.14
Virpur, 0
Kathla, l 7.5
Route of HIV Transm
ission, ICTC 2012
Hetero-sexualHom
o-sexualBlood
TransfusionN
eedle/ Syringe
Parent to Child
Unknown
% of Total
(N=
515)75.53
3.699.32
1.366.99
3.11
HIV Levels and Trends
3
* Inadequate sample size; - Data not available; 1 2011 Census; 2 Source: DLHS III; 3 Data presented only for years w
here sample size is valid (HSS-AN
C ≥ 300, HSS-HRG/STD ≥ 187, ICTC ≥ 600, PPTCT ≥ 900 and BB ≥ 900); 4 PP =
percent positive, N
T = num
ber tested; 5 General clients & pregnant w
omen.
STI/RTI2009
20102011
2012
No. episodes treated
526939077
1168212061
% Syphilis positivity
-0.79
0.900.60
VulnerabilitiesM
ale Migration, 2001 Census
Overall
Inter-State
Intra-state
Intra-district
No. out-
migration
730463311
3730832427
% of m
ale pop.
6.940.31
3.543.08
% total
migration
1004.53
51.0744.39
Top 5 districts for inter-state out-migration
Thane, M
aharash-tra
Mum
bai (Suburban)
, Maha-
rashtra
Pune, M
aharash-tra
Raigarh, M
aharash-tra
-
HRG Size
FSWM
SMIDU
Size Est., (Mapping,
Year: 2008, 2009)454
00
% Total HRG
1000
0
% Total Pop.
0.020
0
Program Target
NA
NA
NA
Program Coverage
--
-
Typology
Home
based-19.37%
;
Brothel based-
21.79%;
Street based-
58.84%
Kothi-81.58%
;
Panthi-N
A;
Double decker-18.42%
Daily Injectors-
NA;
Non daily
Injectors-N
A
% <
25 yrs.47.46
29.63-
% M
arried52.78
--
Programm
e ResponseN
o.2004
20052006
20072008
20092010
20112012
FSW TIs
--
--
--
--
-M
SM TIs
--
--
--
--
-IDU TIs
--
--
--
--
-Com
p. TIs-
--
--
11
11
ICTCs-
--
68
960
6767
Blood Banks4
44
44
44
44
STI clinics-
--
22
22
33
ART centres-
--
--
-1
1Link ART centres
--
--
11
--
PLHIV Netw
orks-
-1
11
11
11
Red Ribbon Clubs-
--
--
--
-
Comm
. care centres-
--
--
--
--
Drop-in-centres-
--
--
--
--
Condom outlets
--
--
--
--
-

34 | District HIV/AIDS Epidemiological Profiles : Gujarat
MahesanaBackground:
Mehsana district is located in North Gujarat, about 75 km from Ahmedabad. It borders with Banaskantha district in the north, Patan and Surendranagar districts in west, Gandhinagar and Ahmedabad districts in south and Sabarkantha district in the east. It has a population of 20.27 lakh, 74.65% of population residing in rural areas, with a sex ratio of 925 females per 1,000 males; female literacy rate of 76.12%, with an overall literacy rate of 84.26% (Census 2011). There are more than 70 medium and large scale industries in Mehsana district primarily operating in engineering, chemicals, pharmaceuticals, dairy products, oil and textiles sectors. Asia’s second largest dairy ‘Dudhsagar Milk Cooperative Dairy’ and largest market yard ‘Unjha’ is located in Mehsana. ‘Sun Temple’ at Modhera is an important tourist destination of Mehsana district.
HIV Epidemic Profile:
• Basedon2012HSS-ANCdata,HIVprevalencewashighat2.75%among theANCattendees.Mahesanadistrict is knownashighprevalence district with prevalence at 2.75%, and also higher in the past HSS rounds.
• Accordingto2012PPTCTdata,HIVpositivitywaslowat0.13%amongthePPTCTattendees.
• Accordingto2012BloodBankdata,thelevelofHIVpositivitywaslowat0.13%amongtheBloodBankdonors.
• Accordingto2010HSSdata,HIVprevalencewaslowamongMSMsat1.60%.
• In2012,HIVpositivityamongICTCattendeeswas lowamongmale(1.56%)andfemale(0.95%)clients,aswellasamongreferred(1.12%) and direct walk-in (1.45%) clients with an overall declining trend.
• Accordingto2008HRGmappingdata,MSM(1,886;58.23%ofthetotalHRG)wasthelargestHRGinthedistrictfollowedbyFSWs(1,353; 41.77% of the total HRG).
• In2012,6,243STI/RTIepisodesweretreatedandthesyphilispositivityrateamongSTIclinicattendeeswas0.65%.
• Asperthe2001Census,12.32%ofthemalepopulationweremigrants;amongthem4.62%migratedtootherstatesand55.88%migrated to other districts within the state.
• Thetoptwodestinationsforout-of-statemigrationwereMumbai(Suburban)andThane,Maharashtra.
• Accordingto2012ICTCdata,HIVtransmissionsthroughparenttochildtransmissionandunknownroutesaccountedfor4.91%and9.04% respectively of the total HIV reported cases (n=387)-in the district.
• AccordingtoDLHS-IIIdata,theHIVandSTI/RTIawarenessrateamongwomenwas59.2%and29%,respectively.
• In2012,thereweretwocompositetargetedintervention(TI)sitesinoperationinthedistrict.
Key Recommendations:
• StrengtheneffortstodecreaseandlimitthespreadoftheinfectionfurtherconsideringthelevelofepidemicreportedbyHSSandprogramdata.
• EstablishTIsitesexclusivelyforMSMandFSWs,toprovideHIVpreventiveandreferralservices,consideringtheirlargenumberinthedistrict.
• Conduct socio-demographic analysis of HSS-ANC attendees to ascertain risk factors, considering high prevalence among HSS-ANCattendees. Strengthen efforts for positive prevention focused on couples and also among general population, and linkage to treatment and care services.
• SincethelargestproportionofHRGwasMSM,betterassessmentofthepopulationsizeandprofileofMSMandpartnerpopulationwillhelp in better understanding of district vulnerabilities.Availability of typology data will help to analyze risk factors.
Mahesana District

District HIV/AIDS Epidemiological Profiles : Gujarat | 35
Mahesana
District Population: 20,27,727 (3.36% of G
ujarat Population); Female Literacy
1: 76.12%; AN
C Utilization2: 59%
2005
20062007
20082009
20102011
2012
HSS-ANC
PP4
1.001.00
01.50
1.002.75
NT
4400
400400
400400
400
PPTCTPP
-*
0.460.33
0.20-
0.120.13
NT
-*
13098263
21807-
3888021780
Blood BankPP
0.160.10
0.090.12
--
-0.13
NT
1016110831
992715766
--
-20785
HSS-STDPP
--
--
--
NT
--
--
--
HSS-FSWPP
--
--
--
NT
--
--
--
HSS-MSM
PP-
--
2.871.60
-N
T-
--
244250
-
HSS-IDUPP
--
--
--
NT
--
--
--
ICTC Male
PP-
--
5.834.47
2.311.52
1.56N
T-
--
61219112
1374820945
16628
ICTC Female
PP-
--
4.883.25
1.571.07
0.95N
T-
--
42436333
1108217585
13642
ICTC ReferredPP
--
-4.74
3.881.78
1.311.12
NT
--
-6608
935814739
2088515542
ICTC Direct W
alk-inPP
--
-6.68
4.112.28
1.331.45
NT
--
-3756
608710091
1764514728
Total tested at ICTCs
5 N
T-
5711309
1862737252
2483077410
52050
PLHIV Profile, 2012
% O
n ART%
15-24 yrs%
Ill., Prim. Edu.
% M
arried%
Widow
ed or Divorced
ART (NA)
--
--
-
DLN (N
A)-
--
--
Block-Level Details
No. HRG
- FSW
- -
- -
- -
- -
-
No. HRG
- M
SM-
- -
- -
- -
- -
No. HRG
- IDU
- -
- -
- -
- -
-
% Pos;
ICTC-
- -
- -
- -
- -
% Pos;
PPTCT-
- -
- -
- -
- -
Route of HIV Transm
ission, ICTC 2012
Hetero-sexualHom
o-sexualBlood
TransfusionN
eedle/ Syringe
Parent to Child
Unknown
% of Total
(N=
387)83.72
1.031.29
04.91
9.04
HIV Levels and Trends
3
* Inadequate sample size; - Data not available; 1 2011 Census; 2 Source: DLHS III; 3 Data presented only for years w
here sample size is valid (HSS-AN
C ≥ 300, HSS-HRG/STD ≥ 187, ICTC ≥ 600, PPTCT ≥ 900 and BB ≥ 900); 4 PP =
percent positive, N
T = num
ber tested; 5 General clients & pregnant w
omen.
STI/RTI2009
20102011
2012
No. episodes treated
--
92846243
% Syphilis positivity
--
-0.65
Programm
e ResponseN
o.2004
20052006
20072008
20092010
20112012
FSW TIs
--
--
--
--
-M
SM TIs
--
--
--
--
-IDU TIs
--
--
--
--
-Com
p. TIs-
--
--
22
22
ICTCs-
--
815
3368
7378
Blood Banks4
44
44
44
44
STI clinics-
--
11
11
22
ART centres-
--
-1
11
11
Link ART centres-
--
--
-1
23
PLHIV Netw
orks-
--
--
11
11
Red Ribbon Clubs-
--
--
5555
1938
Comm
. care centres-
--
-1
11
11
Drop-in-centres-
--
-1
11
11
Condom outlets
--
--
--
--
-
VulnerabilitiesM
ale Migration, 2001 Census
Overall
Inter-State
Intra-state
Intra-district
No. out-
migration
1175545434
6568846432
% of m
ale pop.
12.320.57
6.894.87
% total
migration
1004.62
55.8839.50
Top 5 districts for inter-state out-migration
Mum
bai (Suburban)
, Maha-
rashtra
Thane, M
aharash-tra
North
West Delhi, Delhi
Nashik,
Maharash-
tra
Mum
bai, M
aharash-tra
HRG Size
FSWM
SMIDU
Size Est., (Mapping,
Year: 2008)1353
18860
% Total HRG
41.7758.23
0
% Total Pop.
0.070.09
0
Program Target
NA
NA
NA
Program Coverage
--
-
Typology
Home
based-N
A;
Brothel based-
NA;
Street based-
NA
Kothi-N
A;
Panthi-N
A;
Double decker-
NA
Daily Injectors-
NA;
Non daily
Injectors-N
A
% <
25 yrs.-
--
% M
arried-
--

36 | District HIV/AIDS Epidemiological Profiles : Gujarat
NarmadaBackground:
Narmada district is located at the southern part of Gujarat. The district is bounded by Vadodara district in the north, by Maharashtra state in the east, by Tapi district in the south and by Bharuch district in the west. It is the third least populous district of Gujarat with a population of 5.90 lakh, a sex ratio of 960 females per 1,000 males; female literacy rate of 63.62%, with an overall literacy rate of 73.29% (Census 2011). Located in Nandod taluka, Rajpipla is the district headquarters and the main industrial town of Narmada district. Focus industry sectors include, textiles, food and agriculture and chemicals. A major section of the population is dependent upon agriculture for their livelihood. Some of the main tourist destinations include Shoolpaneshwar Wildlife Sanctuary and Temple and Rajwant Palace, which accounts for a healthy influx of tourists. Major state roads connect the district with key industrial centers in the state.
HIV Epidemic Profile:
• Basedon2012HSS-ANCdata,HIVprevalencewasmoderateat0.75%amongtheANCattendees.Thisrepresentsanincreasefromthereported 0.25% in the previous HSS rounds among this population.
• Accordingto2012PPTCTdata,HIVpositivitywaslowat0.04%amongthePPTCTattendees.
• Accordingto2011BloodBankdata,HIVpositivitywaslowat0.13%amongtheBloodBankdonors.
• In2012,HIVpositivityamongICTCattendeeswas lowamongmale(1.10%)andfemale(1.30%)clients,aswellasamongreferred(0.67%) and direct walk-ins (2.13%), with a stable trend among all the ICTC clients, but a steep rise in the positivity was observed among male and referred clients in 2011.
• AccordingtoHRGmappingdata,therearesmallnumbersofHRGinthedistrict.FSW(130)accountedfor52%ofthetotalHRGandMSM (120) accounted for 48%.
• In2012,813STI/RTIepisodesweretreatedandthesyphilispositivityrateamongSTIclinicattendeeswas2.49%.
• Asperthe2001Census,8%ofthemalepopulationweremigrants;amongthem1.71%migratedtootherstatesand32.23%migratedto other districts within the state.
• Thetopdestinationforout-of-statemigrationwasNandurbarinMaharashtra.
• Accordingto2012ICTCdata,HIVtransmissionsfromparenttochildandbloodtransfusion,eachaccountedfor15.15%ofthetotalreported cases (n=33) in the district.
• AccordingtoDLHS-IIIdata,theHIVandSTI/RTIawarenessrateamongwomenwas22.1%and13.5%,respectively.
• In2012,therewasonecompositeTIsiteinoperationinthedistrict.
Key Recommendations:
• Districtneedscontinuedattentiontodecreaseandlimitthespreadoftheinfectionfurther.
• CarryoutdisaggregatedanalysisofHSS-ANCattendeestoidentifyriskfactorsforHIVepidemicamonggeneralpopulation.Consideringhigh syphilis positivity in the district, strengthen screening activities and management of syphilis.
• ThereisaneedtobetterunderstandtheprofileofHIVpositiveindividualsthroughin-depthanalysisofICTCdataanalysis.
• MoreneedstobedonetounderstandtheprofileoftheICTCattendeesthroughindepthanalysisofICTCdataastheparenttochildHIV transmission rate was high in the district and accordingly strengthen efforts for early detection and linkage to treatment centers, as required, and enable positive prevention among spouses.
• StrengthenIECprogrammeforcreatingHIVandSTIawarenessinthedistrictamonggeneralpopulation,especiallywomen.
Narmada District

District HIV/AIDS Epidemiological Profiles : Gujarat | 37
Narm
adaDistrict Population: 5,90,379 (0.98%
of Gujarat Population); Fem
ale Literacy1: 63.62%
; ANC Utilization
2: 48.4%
2005
20062007
20082009
20102011
2012
HSS-ANC
PP4
-0
0.250.25
0.250.75
NT
4-
400400
393399
399
PPTCTPP
--
*0.20
0.25*
0.080.04
NT
--
*999
1192*
36092524
Blood BankPP
--
--
--
0.13-
NT
--
--
--
15040-
HSS-STDPP
--
--
--
NT
--
--
--
HSS-FSWPP
--
--
--
NT
--
--
--
HSS-MSM
PP-
--
--
-N
T-
--
--
-
HSS-IDUPP
--
--
--
NT
--
--
--
ICTC Male
PP-
--
2.622.87
1.2613.15
1.10N
T-
--
611698
792844
1630
ICTC Female
PP-
--
2.561.59
1.790.40
1.30N
T-
--
352378
504752
1152
ICTC ReferredPP
--
-1.66
2.772.01
8.860.67
NT
--
-483
578747
11741794
ICTC Direct W
alk-inPP
--
-3.54
2.010.73
2.372.13
NT
--
-480
498549
422988
Total tested at ICTCs
5 N
T-
-236
19622268
19175205
5306
PLHIV Profile, 2012
% O
n ART%
15-24 yrs%
Ill., Prim. Edu.
% M
arried%
Widow
ed or Divorced
ART (NA)
--
--
-
DLN (N
A)-
--
--
Block-Level Details
No. HRG
-FSW-
- -
- -
- -
- -
No. HRG
-MSM
- -
- -
- -
- -
-
No. HRG
- IDU-
- -
- -
- -
- -
% Pos;
ICTC-
- -
- -
- -
- -
% Pos;
PPTCTN
andod, 3.71
Tilakwada,
0
Dedia-pada, 1.05
Sagbara, 0
Other,
4.41-
- -
-
Route of HIV Transm
ission, ICTC 2012
Hetero-sexualHom
o-sexualBlood
TransfusionN
eedle/ Syringe
Parent to Child
Unknown
% of Total
(N=
33)66.67
3.0315.15
015.15
0
HIV Levels and Trends
3
* Inadequate sample size; - Data not available; 1 2011 Census; 2 Source: DLHS III; 3 Data presented only for years w
here sample size is valid (HSS-AN
C ≥ 300, HSS-HRG/STD ≥ 187, ICTC ≥ 600, PPTCT ≥ 900 and BB ≥ 900); 4 PP =
percent positive, N
T = num
ber tested; 5 General clients & pregnant w
omen.
STI/RTI2009
20102011
2012
No. episodes treated
727953
521813
% Syphilis positivity
-1.62
3.412.49
Programm
e ResponseN
o.2004
20052006
20072008
20092010
20112012
FSW TIs
--
--
--
--
-M
SM TIs
--
--
--
--
-IDU TIs
--
--
--
--
-Com
p. TIs-
--
--
11
11
ICTCs-
--
12
211
1111
Blood Banks-
--
--
--
--
STI clinics-
--
11
11
11
ART centres-
--
--
--
--
Link ART centres-
--
--
-1
11
PLHIV Netw
orks-
--
--
--
11
Red Ribbon Clubs-
--
--
--
33
Comm
. care centres-
--
--
--
--
Drop-in-centres-
--
--
--
--
Condom O
utlets-
--
--
--
--
VulnerabilitiesM
ale Migration, 2001 Census
Overall
Inter-State
Intra-state
Intra-district
No. out-
migration
21116361
680513950
% of m
ale pop.
8.000.14
2.585.29
% total
migration
1001.71
32.2366.06
Top 5 districts for inter-state out-migration
Nandurbar
,Maharash-
tra-
--
-
HRG Size
FSWM
SMIDU
Size Est., (Mapping,
Year: NA)
130120
NA
% Total HRG
52.0048.00
-
% Total Pop.
0.020.02
-
Program Target
NA
NA
NA
Program Coverage
--
-
Typology
Home
based-N
A;
Brothel based-
NA;
Street based-
NA
Kothi-60.78%
;
Panthi-N
A;
Double decker-39.22%
Daily Injectors-
NA;
Non daily
Injectors-N
A
% <
25 yrs.-
52.63-
% M
arried-
--

38 | District HIV/AIDS Epidemiological Profiles : Gujarat
NavsariBackground:
Navsari district is located in the south eastern part of Gujarat state, in the coastal lowland along Purna River. It has a population of 13.30 lakh, with a sex ratio of 961 females per 1,000 males; female literacy rate of 79.30%, with an overall literacy rate of 84.78% (Census 2011). The district abounds in sugarcane fields, chikoo plantations, and mango trees. Navsari district is the largest producer of chikoo in the State and the largest exporter of the fruit in India. Navsari is known for its floriculture activities and sugar business. The focus sectors of the district are agro and food processing industries, textiles, drugs and pharmaceuticals, mineral related industries, and marine based industries. Famous historical place include Dandi and Vansda National Park. National Highway (NH) 8 and 228 passes through the district.
HIV Epidemic Profile:
• Basedon2012HSS-ANCdata,HIVprevalencewasmoderateat0.50%,amongtheANCattendees.DuringthepreviousHSSrounds,ANCprevalence was always between 0.5% and 1%.
• Accordingto2012PPTCTdata,HIVpositivitywaslowat0.09%amongthePPTCTattendees.
• Accordingto2012BloodBankdata,HIVpositivitywaslowat0.10%amongtheBloodBankdonors.
• In2012,HIVpositivityamongICTCattendeeswas lowamongmale(1.28%)andfemale(1.06%)clients,aswellasamongreferred(1.07%) and direct walk-in (1.43%) clients.
• Accordingto2008HRGmappingdata,FSW(559);wasthelargestHRGinthedistrictrepresenting81.49%followedbyMSM(127)representing 18.51%. The major typology for FSWs was home-based (46.69%).
• In2012,3,074STI/RTIepisodesweretreatedandthesyphilispositivityrateamongSTIclinicattendeeswas0.34%.
• Asper the2001Census,7.49%of themalepopulationweremigrants; among them7.36%migrated toother statesand20.68%migrated to other districts within the state.
• Thetoptwodestinationsforout-of-statemigrationwereNawada,Bihar;and,Mumbai(Suburban),Maharashtra.
• Accordingto2012ICTCdata,HIVtransmissionsfromparenttochildaccountedfor5.24%ofthetotalreportedcases(n=229)inthedistrict.
• AccordingtoDLHS-IIIdata,theHIVandSTI/RTIawarenessrateamongwomenwas60.2%and36.6%,respectively.
• In2012,therewasonecompositeTIinthedistrict.
Key Recommendations:
• Conductsocio-demographicanalysisofHSS-ANCattendeestoascertainriskfactorsforHIVinfection,consideringvaryinglevelsofHIVprevalence reported among HSS-ANC attendees over HSS rounds.
• Conductin-depthanalysisofICTCdatatounderstandtheprofileoftheseattendeesastheparenttochildHIVtransmissionrateishigh.Strengthen efforts for positive prevention focusing on sero-discordant couples.
• ConsideringhighrateofmigrationtohighHIVprevalentdistricts,strengthenoutreachprogramsthroughawarenesscampaignsaroundsource and transit points such as railway stations and bus stands.
• SincethelargestHRGwasFSW,betterassessmentofthepopulationsizeandtheprofileofclientpopulation,includingmigrantsandtruckers, will help in better understanding of district vulnerabilities Focus efforts on hard to reach sub groups such as home-based FSW.
Navsari District

District HIV/AIDS Epidemiological Profiles : Gujarat | 39
Navsari
District Population: 13,30,711 (2.20% of G
ujarat Population); Female Literacy
1: 79.30%; AN
C Utilization2: 77.8%
2005
20062007
20082009
20102011
2012
HSS-ANC
PP4
-1.00
0.750.50
0.750.50
NT
4-
400400
397399
400
PPTCTPP
-*
0.800.60
0.180.09
0.080.09
NT
-*
9961543
1034512190
1144913262
Blood BankPP
0.480.68
0.690.54
0.320.28
0.240.10
NT
87729366
1097113033
1320513718
840918937
HSS-STDPP
-4.00
2.001.20
9.24-
NT
-250
250250
249-
HSS-FSWPP
--
--
--
NT
--
--
--
HSS-MSM
PP-
--
--
-N
T-
--
--
-
HSS-IDUPP
--
--
--
NT
--
--
--
ICTC Male
PP-
--
3.702.02
1.686.90
1.28N
T-
--
43466787
87009280
10261
ICTC Female
PP-
--
3.331.95
1.370.35
1.06N
T-
--
27935175
76588250
9288
ICTC ReferredPP
--
-3.18
1.801.32
5.191.07
NT
--
-5092
825510809
1135714147
ICTC Direct W
alk-inPP
--
-4.49
2.401.95
1.301.43
NT
--
-2047
37075549
61735402
Total tested at ICTCs
5 N
T-
639996
868222307
2854828979
32811
PLHIV Profile, 2012
% O
n ART%
15-24 yrs%
Ill., Prim. Edu.
% M
arried%
Widow
ed or Divorced
ART (1402)51
973
5921
DLN (N
A)-
--
--
Block-Level Details
No. HRG
-FSW-
- -
- -
- -
- -
No. HRG
-MSM
- -
- -
- -
- -
-
No. HRG
- IDU-
- -
- -
- -
- -
% Pos;
ICTC-
- -
- -
- -
- -
% Pos;
PPTCTG
andevi, 3.89
Chikhli, 3.9
Vansda, 1.6
Jalalpor 5.68
Navsari, 3.87
- -
- -
Route of HIV Transm
ission, ICTC 2012
Hetero-sexualHom
o-sexualBlood
TransfusionN
eedle/ Syringe
Parent to Child
Unknown
% of Total
(N=
229)90.83
0.870.87
05.24
2.18
HIV Levels and Trends
3
* Inadequate sample size; - Data not available; 1 2011 Census; 2 Source: DLHS III; 3 Data presented only for years w
here sample size is valid (HSS-AN
C ≥ 300, HSS-HRG/STD ≥ 187, ICTC ≥ 600, PPTCT ≥ 900 and BB ≥ 900); 4 PP =
percent positive, N
T = num
ber tested; 5 General clients & pregnant w
omen.
STI/RTI2009
20102011
2012
No. episodes treated
79213955
9313074
% Syphilis positivity
-0.49
1.260.34
Programm
e ResponseN
o.2004
20052006
20072008
20092010
20112012
FSW TIs
--
--
--
--
-M
SM TIs
--
--
--
--
-IDU TIs
--
--
--
--
-Com
p. TIs-
--
--
11
11
ICTCs-
--
512
1721
2828
Blood Banks2
22
22
32
33
STI clinics-
--
11
11
33
ART centres-
--
--
-1
11
Link ART centres-
--
--
11
11
PLHIV Netw
orks-
--
--
11
11
Red Ribbon Clubs-
--
--
--
99
Comm
. care centres-
--
--
--
--
Drop-in-centres-
--
-1
11
11
Condom O
utlets-
--
--
--
--
VulnerabilitiesM
ale Migration, 2001 Census
Overall
Inter-State
Intra-state
Intra-district
No. out-
migration
470793463
973633880
% of m
ale pop.
7.490.55
1.555.39
% total
migration
1007.36
20.6871.96
Top 5 districts for inter-state out-migration
Naw
ada, Bihar
Mum
bai (Subur-ban),
Maharash-
tra
Thane, M
aharash-tra
Mum
bai, M
aharash-tra
Dadra & N
agar Haveli,
Dadra & N
agar Haveli
HRG Size
FSWM
SMIDU
Size Est., (Mapping,
Year: 2008)559
1270
% Total HRG
81.4918.51
0
% Total Pop.
0.040.01
0
Program Target
NA
NA
NA
Program Coverage
--
-
Typology
Home
based-46.69%
;
Brothel based-
13.06%;
Street based-
40.25%
Kothi-37.78%
;
Panthi-N
A;
Double decker-62.22%
Daily Injectors-
NA;
Non daily
Injectors-N
A
% <
25 yrs.-
--
% M
arried-
--

40 | District HIV/AIDS Epidemiological Profiles : Gujarat
PanchmahalsBackground:
Panchmahal, also PanchMahals, is a district in the eastern end of Gujarat State. Panch-mahal means “five tehsils/talukas” (5 sub-divisions), and refers to the five sub-divisions namely: Godhra, Dahod, Halol, Kalol and Jhalod that were transferred by the Maharaja Sindia of Gwalior to the British. The district has a population of 23.88 lakh, a sex ratio of 945 females per 1,000 males; female literacy rate of 59.95%, with an overall literacy rate of 72.32% (Census 2011). Panchmahals is rich in minerals and agricultural produce. Major occupations in the district are dairy farming and agriculture. Main crops cultivated are wheat, maize and pulses. Tourist attractions in the district include Champaner-Pavagadh Archeological Park (listed as World Heritage Site by UNESCO), temple of Mata Kalika in Pavagarh, the Jain pilgrimage center at Pavoli, fairs of ChaitiAtham and Math Kotal, Kadana Dam, etc. which attract a large number of tourists every year. National Highway (NH) 59, NH-8 and State Highway 4 pass through the district.
HIV Epidemic Profile:
• Basedon2012HSS-ANCdata,HIVprevalencewaslow(0.25%)amongtheANCattendees.ThisisconsistentwiththepreviousHSSrounds.
• Accordingto2012PPTCTdata,HIVpositivitywasmoderateat0.60%amongthePPTCTattendees,withastabletrendtill2011,butasudden rise was observed in 2012.
• Accordingto2012BloodBankdata,HIVpositivitywaslowat0.30%amongtheBloodBankdonors.
• In2012,HIVpositivityamongICTCattendeeswas lowamongmale(1.47%)andfemale(1.39%)clients,aswellasamongreferred(1.36%) and direct walk-in (1.80%) clients, with a stable trend among all the ICTC clients, but an increase in the positivity was observed among male and referred clients in 2011.
• According to2008HRGmappingdata,MSM(234)was the largestproportionofHRG in thedistrict representing55.45%followedby FSW (188) representing 44.55% of the total HRG. 71.62% of the FSWs were married and the major typology was street-based (95.83%).
• In2012,6,686STI/RTIepisodesweretreatedandthesyphilispositivityrateamongSTIclinicattendeeswas0.33%.
• Thetoptwodestinationsforout-of-statemigrationwerePuneandMumbai(Suburban),Maharashtra.
• Accordingto2012ICTCdata,HIVtransmissionsfromparenttochildaccountedfor9.43%ofthetotalHIVreportedcases(n=159)inthe district.
• AccordingtoDLHS-IIIdata,theHIVandSTI/RTIawarenessrateamongwomenwas36.3%and26.2%,respectively.
• In2012,therewasonecompositeTIinthedistrict.
Key Recommendations:
• AlthoughthereislowleveloftheHIVepidemicinthedistrict,continueeffortstocontainandlimitthespreadofHIVinfection.AnalyseICTC and STI data to ascertain vulnerability factors contributing to HIV transmission.
• ConductdisaggregatedanalysisofPPTCTdatatoassessriskfactorsinthedistrict.
• Withparenttochildtransmissionhighinthedistrict,itisnecessarytostrengthenPPTCTprogramcoverageinthedistrict.Strengthenefforts for enabling early detection, and positive prevention among couples.
• SinceMSMarethelargestproportionofHRGmapped,abetterassessmentofthepopulationsizeandprofileofMSMandtheirpartnerpopulation will enhance understanding of district vulnerabilities and accordingly inform the response. Availability of typology based data will help in analyzing risk factors.
Panchmahal District
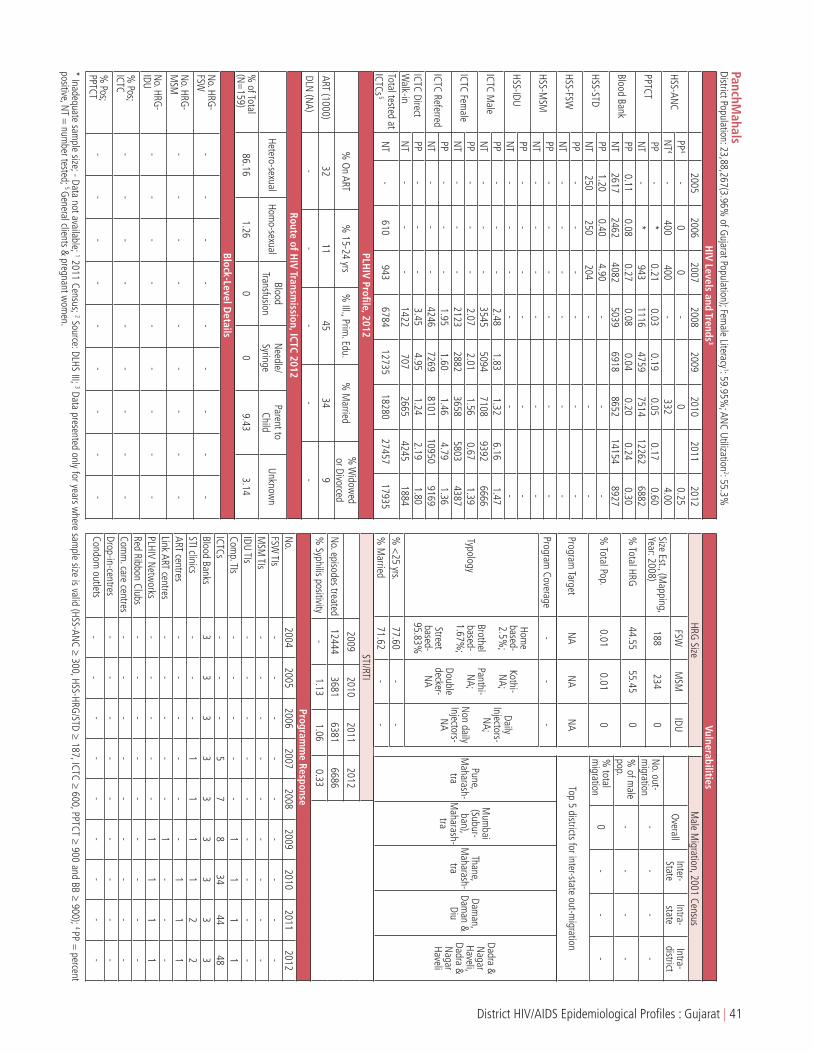
District HIV/AIDS Epidemiological Profiles : Gujarat | 41
PanchMahals
District Population: 23,88,267(3.96% of G
ujarat Population); Female Literacy
1: 59.95%; AN
C Utilization2: 55.3%
2005
20062007
20082009
20102011
2012
HSS-ANC
PP4
-0
0-
00.25
NT
4-
400400
-332
4.00
PPTCTPP
-*
0.210.03
0.190.05
0.170.60
NT
-*
9431116
47597514
122626882
Blood BankPP
0.110.08
0.270.08
0.040.20
0.240.30
NT
26172462
40825039
69188652
141548927
HSS-STDPP
1.200.40
4.90-
--
NT
250250
204-
--
HSS-FSWPP
--
--
--
NT
--
--
--
HSS-MSM
PP-
--
--
-N
T-
--
--
-
HSS-IDUPP
--
--
--
NT
--
--
--
ICTC Male
PP-
--
2.481.83
1.326.16
1.47N
T-
--
35455094
71089392
6666
ICTC Female
PP-
--
2.072.01
1.560.67
1.39N
T-
--
21232882
36585803
4387
ICTC ReferredPP
--
-1.95
1.601.46
4.791.36
NT
--
-4246
72698101
109509169
ICTC Direct W
alk-inPP
--
-3.45
4.951.24
2.191.80
NT
--
-1422
7072665
42451884
Total tested at ICTCs
5 N
T-
610943
678412735
1828027457
17935
PLHIV Profile, 2012
% O
n ART%
15-24 yrs%
Ill., Prim. Edu.
% M
arried%
Widow
ed or Divorced
ART (1000)32
1145
349
DLN (N
A)-
--
--
Block-Level Details
No. HRG
- FSW
- -
- -
- -
- -
-
No. HRG
- M
SM-
- -
- -
- -
- -
No. HRG
- IDU
- -
- -
- -
- -
-
% Pos;
ICTC-
- -
- -
- -
- -
% Pos;
PPTCT-
- -
- -
- -
- -
Route of HIV Transm
ission, ICTC 2012
Hetero-sexualHom
o-sexualBlood
TransfusionN
eedle/ Syringe
Parent to Child
Unknown
% of Total
(N=
159)86.16
1.260
09.43
3.14
HIV Levels and Trends
3
* Inadequate sample size; - Data not available; 1 2011 Census; 2 Source: DLHS III; 3 Data presented only for years w
here sample size is valid (HSS-AN
C ≥ 300, HSS-HRG/STD ≥ 187, ICTC ≥ 600, PPTCT ≥ 900 and BB ≥ 900); 4 PP =
percent positive, N
T = num
ber tested; 5 General clients & pregnant w
omen.
STI/RTI2009
20102011
2012
No. episodes treated
124443681
63816686
% Syphilis positivity
-1.13
1.060.33
Programm
e ResponseN
o.2004
20052006
20072008
20092010
20112012
FSW TIs
--
--
--
--
-M
SM TIs
--
--
--
--
-IDU TIs
--
--
--
--
-Com
p. TIs-
--
--
11
11
ICTCs-
--
57
834
4448
Blood Banks3
33
33
33
33
STI clinics-
--
11
11
22
ART centres-
--
--
-1
11
Link ART centres-
--
--
1-
--
PLHIV Netw
orks-
--
--
11
11
Red Ribbon Clubs-
--
--
--
--
Comm
. care centres-
--
--
--
--
Drop-in-centres-
--
--
--
--
Condom outlets
--
--
--
--
-
VulnerabilitiesM
ale Migration, 2001 Census
Overall
Inter-State
Intra-state
Intra-district
No. out-
migration
--
--
% of m
ale pop.
--
--
% total
migration
0-
--
Top 5 districts for inter-state out-migration
Pune, M
aharash-tra
Mum
bai (Subur-ban),
Maharash-
tra
Thane, M
aharash-tra
Daman,
Daman &
Diu
Dadra & N
agar Haveli,
Dadra & N
agar Haveli
HRG Size
FSWM
SMIDU
Size Est., (Mapping,
Year: 2008)188
2340
% Total HRG
44.5555.45
0
% Total Pop.
0.010.01
0
Program Target
NA
NA
NA
Program Coverage
--
-
Typology
Home
based-2.5%
;
Brothel based-1.67%
;
Street based-
95.83%
Kothi-N
A;
Panthi-N
A;
Double decker-
NA
Daily Injectors-
NA;
Non daily
Injectors-N
A
% <
25 yrs.77.60
--
% M
arried71.62
--

42 | District HIV/AIDS Epidemiological Profiles : Gujarat
PatanBackground:
Patan district is located in northern Gujarat and bounded by Banas kantha district in the north and northeast, Mehsana district in the east and southeast, Surendranagar district in the south and Kutch district and the Kutch nu Nanu Ran (Little Rann of Kutch) in the west. It has a population of 13.42 lakh, with a sex ratio of 935 females per 1,000 males; female literacy rate of 62.01%, with an overall literacy rate of 73.47% (Census 2011). The economy of Patan is mainly agrarian but food processing, agriculture, and textiles are the major vocational and industrial activities in Patan. There are many Hindu temples and Jain Temple (nearly 150 temples) in the district. Patan has a few good tourist spots, to attract people interested in heritage and history. National Highway 14, 15 and State Highway 7, 8 and 10 run through the district connecting it with major cities of the state and the rest of India.
HIV Epidemic Profile:
• Basedon2012HSS-ANCdata,HIVpositivitywasmoderateat0.50%,amongtheANCattendees,representinganincreasingtrendoverthe last three data recordings.
• Accordingto2012PPTCTdata,HIVpositivitywaslowat0.24%amongthePPTCTattendees.
• Accordingto2012BloodBankdata,HIVpositivitywaslowat0.19%amongtheBloodBankdonors.
• Accordingto2010HSSdata,theHIVprevalencewasmoderateamongMSMsat4.15%.
• In2012,HIVpositivityamongICTCattendeeswas lowamongmale(2.26%)andfemale(1.33%)clients,aswellasamongreferred(1.79%) and direct walk-in (1.87%) clients.
• Accordingto2009HRGmappingdata,FSW(295)representthelargestproportionofHRGinthedistrictwith79.95%.Therewere74MSM mapped.
• In2012,10,766STI/RTIepisodesweretreatedandthesyphilispositivityrateamongSTIclinicattendeeswas1.65%.
• Asperthe2001Census,7.10%ofthemalepopulationweremigrants;amongthem15.09%migratedtootherstatesand39.11%migrated to other districts within the state.
• Thetoptwodestinationsforout-of-statemigrationwereMumbai(Suburban)inMaharashtraandRanchiinJharkhand.
• Accordingto2012ICTCdata,HIVtransmissionsfromparenttochildaccountedfor6.10%ofthetotalreportedcases(n=295)inthedistrict.
• AccordingtoDLHS-IIIdata,theHIVandSTI/RTIawarenessrateamongwomenwas46.7%and29.5%,respectively.
• In2012,therewereatwocompositeTIsitesoperationalinthedistrict.
Key Recommendations:
• SustaineffortstocontainandlimitthespreadofHIVinfectionwhilenotingtheavailableepidemiologicandprogramdata.
• ConsideringHIVprevalenceamongHSS-ANCattendees,socio-demographicanalysisneedstobedonetoascertainriskfactorsforHIV.
• GiventhehighproportionofreportedparenttochildHIVtransmissionatICTC,moreneedstobedonetounderstandtheprofileoftheseattendees through in-depth analysis of ICTC data and accordingly strengthen efforts for early detection and positive prevention among couples.
• FocusontheoutreacheffortsforstreetbasedFSW(67.18%ofthetotalFSWinthedistrict)tokeepHIVprevalenceamongthematlowlevel.
• AvailabilityofDLNdatawillhelpinbetterunderstandingofdistrictvulnerabilities.
Patan District

District HIV/AIDS Epidemiological Profiles : Gujarat | 43
PatanDistrict Population: 13,42,746 (2.22%
of Gujarat Population); Fem
ale Literacy1: 62.01%
; ANC Utilization
2: 53.4%
2005
20062007
20082009
20102011
2012
HSS-ANC
PP4
-0.50
0.250
0.250.50
NT
4-
400400
400398
799
PPTCTPP
--
0.630.17
0.320.31
0.300.24
NT
--
23834632
102789211
1317011300
Blood BankPP
0.190.08
0.040.06
--
-0.19
NT
31503629
55637718
--
-13543
HSS-STDPP
--
--
--
NT
--
--
--
HSS-FSWPP
--
--
--
NT
--
--
--
HSS-MSM
PP-
--
-4.15
-N
T-
--
-241
-
HSS-IDUPP
--
--
--
NT
--
--
--
ICTC Male
PP-
--
5.194.64
3.497.99
2.26N
T-
--
42403923
61309990
8447
ICTC Female
PP-
--
3.092.35
1.850.53
1.33N
T-
--
35893613
55277936
7725
ICTC ReferredPP
--
-3.05
3.162.34
5.291.79
NT
--
-4922
53748817
1346610991
ICTC Direct W
alk-inPP
--
-6.23
4.493.87
2.851.87
NT
--
-2907
21622840
44605181
Total tested at ICTCs
5 N
T-
-2383
1246117814
2086831096
27472
PLHIV Profile, 2012
% O
n ART%
15-24 yrs%
Ill., Prim. Edu.
% M
arried%
Widow
ed or Divorced
ART (1290)49
664
5721
DLN (N
A)-
--
--
Block-Level Details
No. HRG
-FSW-
- -
- -
- -
- -
No. HRG
-MSM
- -
- -
- -
- -
-
No. HRG
- IDU-
- -
- -
- -
- -
% Pos;
ICTC-
- -
- -
- -
- -
% Pos;
PPTCTPatan, 3.94
Chansma,
1.69Harij, 1.99
Radhan-pur, 0
Sami,
0Siddhpur,
2.62Santalpur,
0.25M
ehsana, 0
Bk, 3.11
Route of HIV Transm
ission, ICTC 2012
Hetero-sexualHom
o-sexualBlood
TransfusionN
eedle/ Syringe
Parent to Child
Unknown
% of Total
(N=
295)87.80
3.730.34
0.346.10
1.69
HIV Levels and Trends
3
* Inadequate sample size; - Data not available; 1 2011 Census; 2 Source: DLHS III; 3 Data presented only for years w
here sample size is valid (HSS-AN
C ≥ 300, HSS-HRG/STD ≥ 187, ICTC ≥ 600, PPTCT ≥ 900 and BB ≥ 900); 4 PP =
percent positive, N
T = num
ber tested; 5 General clients & pregnant w
omen.
STI/RTI2009
20102011
2012
No. episodes treated
127759360
1138210766
% Syphilis positivity
-2.29
0.181.65
Programm
e ResponseN
o.2004
20052006
20072008
20092010
20112012
FSW TIs
--
--
--
--
-M
SM TIs
--
--
--
--
-IDU TIs
--
--
--
--
-Com
p. TIs-
--
--
22
22
ICTCs-
--
67
816
2737
Blood Banks2
23
33
43
44
STI clinics-
--
22
23
33
ART centres-
--
--
-1
11
Link ART centres-
--
--
1-
11
PLHIV Netw
orks-
--
-1
11
11
Red Ribbon Clubs-
--
--
2525
926
Comm
. care centres-
--
--
--
--
Drop-in-centres-
--
--
--
--
Condom O
utlets-
--
--
--
--
VulnerabilitiesM
ale Migration, 2001 Census
Overall
Inter-State
Intra-state
Intra-district
No. out-
migration
434096550
1697619883
% of m
ale pop.
7.101.07
2.783.25
% total
migration
10015.09
39.1145.80
Top 5 districts for inter-state out-migration
Mum
bai (Suburban) ,M
aharash-tra
Ranchi, Jharkhand
Mum
bai, M
aharash-tra
Thane, M
aharash-tra
South Delhi, Delhi
HRG Size
FSWM
SMIDU
Size Est., (Mapping,
Year: 2009)295
74-
% Total HRG
79.9520.05
-
% Total Pop.
0.020.01
-
Program Target
NA
NA
NA
Program Coverage
--
-
Typology
Home
based-17.52%
;
Brothel based-
15.31%;
Street based-
67.18%
Kothi-52.94%
;
Panthi-N
A;
Double decker-47.06%
Daily Injectors-
NA;
Non daily
Injectors-N
A
% <
25 yrs.6.43
47.06-
% M
arried95.34
57.35-

44 | District HIV/AIDS Epidemiological Profiles : Gujarat
PorbandarBackground:
Porbandar forms a part of the erstwhile Kathiawar peninsula located in the western part of Gujarat. This district is surrounded by Jamnagar district to the north, Junagadh district to the south and the Arabian Sea to the west. It is the second least-populous district of Gujarat with a population of 5.86 lakh, a sex ratio of 947 females per 1,000 males; female literacy rate of 68.32%, with an overall literacy rate of 76.63% (Census 2011). Porbandar is the birth place of Father of the Nation Mahatama Gandhi. Focus industry sectors areport and ship building, cement industry and mineral-based industries. Fishing industry is a prominent activity in Porbandar including sea food processing. The district is very famous for KirtiMandir (the birth place of Mahatma Gandhi), Bharat Mandir, Nehru Planetarium and Vijay Vilas. National highway 8 B and 8E (Ext.) passes through the district, connecting Porbandar with Rajkot and Jamnagar.
HIV Epidemic Profile:
• Basedon2012HSS-ANCdata,HIVprevalencewasmoderateat0.50%amongtheANCattendees,withafluctuatingtrend.
• Accordingto2012PPTCTdata,HIVpositivitywaslowat0.06%amongthePPTCTattendees,withastabletrend.
• Accordingto2012BloodBankdata,HIVpositivitywaslowamongtheBloodBankdonors,withadecreasingtrend.
• In2012,HIVpositivityamongICTCattendeeswas lowamongmale(0.85%)andfemale(0.60%)clients,aswellasamongreferred(0.48%) and direct walk-in (2.31%) clients a stable trend among all the ICTC clients, but an abrupt upsurge in the positivity was observed among male and referred clients in 2011.
• Accordingto2008-09HRGmappingdata,Thereare214FSWrepresentingthetotalHRGpopulationinthedistrict.Themajortypologyfor FSWs was home-based (69.63%).
• In2012,3,400STI/RTIepisodesweretreatedandthesyphilispositivityrateamongSTIclinicattendeeswas0.04%.
• Asper the2001Census,7.35%of themalepopulationweremigrants; among them5.40%migrated toother statesand45.59%migrated to other districts within the state.
• Thetoptwodestinationsforout-of-statemigrationwereThaneandMumbai(Suburban),Maharashtra.
• Accordingto2012ICTCdata,HIVtransmissionthroughbloodtransfusionaccountedfor6.02%ofthetotalreportedcases(n=93)inthedistrict.
• AccordingtoDLHS-IIIdata,theHIVandSTI/RTIawarenessrateamongwomenwas51.5%and30.6%,respectively.
• In2012,therewasonecompositeTIinthedistrict.
Key Recommendations:
• SustainfocusoncontainingandlimitingtheHIVepidemic,whilenotingtheavailableevidencesfromepidemiologicandprogramdata.
• Conductsocio-demographicanalysisofHSS-ANCattendeestounderstandriskfactorsforHIVepidemicamonggeneralpopulation,andaccordingly strengthen interventions.
• FocusoutreacheffortsamonghomebasedFSWs(69.63%ofthetotalFSWsinthedistrict)tokeepHIVtransmissionamongthemandtheir clients at low level.
• SincereportedHIVtransmissionthroughbloodtransfusionisrelativelyhigh,thereisaneedtobetterunderstandtheprofileofthesepositive individuals through in-depth analysis of ICTC and ART data.
• AvailabilityofDLNdatahelpinbetterunderstandingofdistrictvulnerabilities.
Porbandar District

District HIV/AIDS Epidemiological Profiles : Gujarat | 45
PorbandarDistrict Population: 5,86,062 (0.97%
of Gujarat Population); Fem
ale Literacy1: 68.32%
; ANC Utilization
2: 71.3%
2005
20062007
20082009
20102011
2012
HSS-ANC
PP4
-0
-0.50
00.50
NT
4-
400-
400399
400
PPTCTPP
-*
0.210.19
0.080.11
00.06
NT
-*
9462574
51816423
35778161
Blood BankPP
0.290.20
0.160.21
0.040.03
0.110
NT
27423915
57626592
67557676
809395756
HSS-STDPP
--
--
--
NT
--
--
--
HSS-FSWPP
--
--
--
NT
--
--
--
HSS-MSM
PP-
--
--
-N
T-
--
--
-
HSS-IDUPP
--
--
--
NT
--
--
--
ICTC Male
PP-
--
2.681.74
1.2014.29
0.85N
T-
--
27663498
49153947
6237
ICTC Female
PP-
--
2.000.87
0.990.18
0.60N
T-
--
15522172
33203290
5169
ICTC ReferredPP
--
-2.00
1.470.99
10.250.48
NT
--
-2452
34805744
54169805
ICTC Direct W
alk-inPP
--
-3.00
1.321.41
0.822.31
NT
--
-1866
21902491
18211601
Total tested at ICTCs
5 N
T-
175946
689210851
1465810814
19567
PLHIV Profile, 2012
% O
n ART%
15-24 yrs%
Ill., Prim. Edu.
% M
arried%
Widow
ed or Divorced
ART (546)61
486
6713
DLN (N
A)-
--
--
Block-Level Details
No. HRG
-FSW-
- -
- -
- -
- -
No. HRG
-MSM
- -
- -
- -
- -
-
No. HRG
- IDU-
- -
- -
- -
- -
% Pos;
ICTC-
- -
- -
- -
- -
% Pos;
PPTCTPorbandar,
0Ranavav,
0Kutiyana,
0-
- -
- -
-
Route of HIV Transm
ission, ICTC 2012
Hetero-sexualHom
o-sexualBlood
TransfusionN
eedle/ Syringe
Parent to Child
Unknown
% of Total
(N=
83)87.95
3.616.02
02.41
0
HIV Levels and Trends
3
* Inadequate sample size; - Data not available; 1 2011 Census; 2 Source: DLHS III; 3 Data presented only for years w
here sample size is valid (HSS-AN
C ≥ 300, HSS-HRG/STD ≥ 187, ICTC ≥ 600, PPTCT ≥ 900 and BB ≥ 900); 4 PP =
percent positive, N
T = num
ber tested; 5 General clients & pregnant w
omen.
STI/RTI2009
20102011
2012
No. episodes treated
127759360
1138210766
% Syphilis positivity
-2.29
0.181.65
Programm
e ResponseN
o.2004
20052006
20072008
20092010
20112012
FSW TIs
--
--
--
--
-M
SM TIs
--
--
--
--
-IDU TIs
--
--
--
--
-Com
p. TIs-
--
-1
11
11
ICTCs-
--
45
56
1414
Blood Banks2
23
33
33
33
STI clinics-
--
11
11
11
ART centres-
--
--
-1
11
Link ART centres-
--
--
--
--
PLHIV Netw
orks-
--
--
--
11
Red Ribbon Clubs-
--
--
--
22
Comm
. care centres-
--
--
--
--
Drop-in-centres-
--
--
--
--
Condom O
utlets-
--
--
--
--
VulnerabilitiesM
ale Migration, 2001 Census
Overall
Inter-State
Intra-state
Intra-district
No. out-
migration
434096550
1697619883
% of m
ale pop.
7.101.07
2.783.25
% total
migration
10015.09
39.1145.80
Top 5 districts for inter-state out-migration
Mum
bai (Suburban) ,M
aharash-tra
Ranchi, Jharkhand
Mum
bai, M
aharash-tra
Thane, M
aharash-tra
South Delhi, Delhi
HRG Size
FSWM
SMIDU
Size Est., (Mapping,
Year: 2009)295
74-
% Total HRG
79.9520.05
-
% Total Pop.
0.020.01
-
Program Target
NA
NA
NA
Program Coverage
--
-
Typology
Home
based-17.52%
;
Brothel based-
15.31%;
Street based-
67.18%
Kothi-52.94%
;
Panthi-N
A;
Double decker-47.06%
Daily Injectors-
NA;
Non daily
Injectors-N
A
% <
25 yrs.6.43
47.06-
% M
arried95.34
57.35-

46 | District HIV/AIDS Epidemiological Profiles : Gujarat
RajkotBackground:
Rajkot is located in the south-west region of Gujarat. The district headquarter is Rajkot city: the largest city in Saurashtra and fourth largest in Gujarat state. This district is surrounded by Kutch district in north, Surendranagar and Bhavnagar districts in the east, Amreli and Junagadh districts in south and Jamnagar district in the west.The district has a population of 37.99 lakh, a sex ratio of 924 females per 1,000 males; female literacy rate of 75.26%, with an overall literacy rate of 82.20% (Census 2011). Rajkot is one of the biggest centers for engineering industry. Special Economic Zone (SEZ) for engineering sector is proposed in the district, which will further boost the growth of engineering sector as well as increase the industrial output and exports of the district. The occupational pattern in Rajkot is primarily based on manufacturing and service sector. Rajkot is well connected to other cities through National Highways (NH) & State Highways (SH).
HIV Epidemic Profile:
• Basedon2012HSS-ANCdata,HIVprevalencewasmoderateat0.75%,amongtheANCattendees.HIVprevalencewas1%in2011.
• Accordingto2012PPTCTdata,HIVpositivitywaslowat0.16%amongthePPTCTattendees,withadecreasingtrend.
• Accordingto2012BloodBankdata,HIVpositivitywaslowat0.09%amongtheBloodBankdonors,withadecreasingtrend.
• Accordingto2010HSSdata,HIVpositivitywaslowamongFSWsandMSMsat0.40%and2.85%respectively,withadecreasingtrendover the years.
• In2012,HIVpositivityamongICTCattendeeswas lowamongmale(2.53%)andfemale(1.38%)clients,aswellasamongreferred(1.99%) and direct walk-in (1.94%) clients, with a decreasing trend among all the ICTC clients.
• Accordingto2008HRGmappingdata,FSW(2,487)represent51.07%ofHRGinthedistrictandMSM(2,383)representtheremaining48.93% . The major typologies for FSWs were home-based (37.43%) and street based (34.66%).
• In2012,30,318STI/RTIepisodesweretreatedandthesyphilispositivityrateamongSTIclinicattendeeswas0.55%.
• Asper the2001Census,9.16%of themalepopulationweremigrants; among them5.53%migrated toother statesand33.19%migrated to other districts within the state.
• Thetoptwodestinationsforout-of-statemigrationwereMumbai(Suburban)andThaneinMaharashtra.
• AccordingtoDLHS-IIIdata,theHIVandSTI/RTIawarenessrateamongwomenwas54.6%and34.3%,respectively.
• In2012,thereweresevenTIsites(2TIsiteseachforFSWandMSMand3compositesite)inoperationinthedistrictforover4,800HRGsin the district.
Key Recommendations:
• Continueattentiononthedistricttodecreaseandlimitthespreadoftheinfectionfurther.
• Considering theHIVprevalence level, conduct socio-demographic analysis ofHSS-ANCattendees to ascertain risk factors to informresponse.
• PresenceoflargesizeofHRGsshouldbeconsideredforstrengtheningHIVpreventiveandreferralservicesinthedistrict.Focuspositiveprevention also among spouses of HRG and strengthen interventions reaching out to potential clients including migrants .
• Assess the population size and profile of FSWs client population, including migrants and truckers, to better understand the districtvulnerabilities. Also, focus outreach efforts also among home based FSW (37.43% of the total FSWs in the district) to keep HIV prevalence among them at low level.
• Analyse the population size and profile of migrants to improve understanding of district vulnerabilities, considering high rate ofmigration.
Rajkot District

District HIV/AIDS Epidemiological Profiles : Gujarat | 47
RajkotDistrict Population: 37,99,770 (6.29%
of Gujarat Population); Fem
ale Literacy1: 75.26%
; ANC Utilization
2: 82.2%
2005
20062007
20082009
20102011
2012
HSS-ANC
PP4
00.75
0.500.50
1.000.75
NT
4400
400400
400400
400
PPTCTPP
1.581.45
1.080.85
0.230.19
0.180.16
NT
12001240
23104838
2260723232
3278729088
Blood BankPP
0.320.20
0.220.23
0.160.12
0.060.09
NT
4821545886
4496356413
6544577231
2091083034
HSS-STDPP
--
--
--
NT
--
--
--
HSS-FSWPP
4.402.80
2.802.00
0.40-
NT
250250
250250
250-
HSS-MSM
PP12.40
14.0015.60
6.402.85
-N
T250
250250
250246
-
HSS-IDUPP
--
--
--
NT
--
--
--
ICTC Male
PP-
--
16.817.56
4.285.86
2.53N
T-
--
679510780
1603328605
22553
ICTC Female
PP-
--
11.113.91
1.940.70
1.38N
T-
--
42409632
1395325796
21657
ICTC ReferredPP
--
-9.75
4.383.40
4.471.99
NT
--
-6018
1259618367
3119322670
ICTC Direct W
alk-inPP
--
-20.45
8.192.86
2.001.94
NT
--
-5017
781611619
2320821540
Total tested at ICTCs
5 N
T1200
12402310
1587343019
5321887188
73298
PLHIV Profile, 2012
% O
n ART%
15-24 yrs%
Ill., Prim. Edu.
% M
arried%
Widow
ed or Divorced
ART (9477)29
1086
7011
DLN (N
A)-
--
--
Block-Level Details
No. HRG
-FSW-
- -
- -
- -
- -
No. HRG
-MSM
- -
- -
- -
- -
-
No. HRG
- IDU-
- -
- -
- -
- -
% Pos;
ICTC-
- -
- -
- -
- -
% Pos;
PPTCTDoraji, 53.33
Gondal,
43.86
Jamkan-
dorana, 25
Jasdan, 34
Jetpur, 36.59
Kota-dasangani,
26
Lodhika, 14.29
Maliya
Miyana,
66.67
Morbi,
43.04
Route of HIV Transm
ission, ICTC 2012
Hetero-sexualHom
o-sexualBlood
TransfusionN
eedle/ Syringe
Parent to Child
Unknown
% of Total
(N=
869)90.45
3.221.15
0.353.34
1.50
HIV Levels and Trends
3
* Inadequate sample size; - Data not available; 1 2011 Census; 2 Source: DLHS III; 3 Data presented only for years w
here sample size is valid (HSS-AN
C ≥ 300, HSS-HRG/STD ≥ 187, ICTC ≥ 600, PPTCT ≥ 900 and BB ≥ 900); 4 PP =
percent positive, N
T = num
ber tested; 5 General clients & pregnant w
omen.
STI/RTI2009
20102011
2012
No. episodes treated
9209723921
3264130318
% Syphilis positivity
-1.26
0.640.55
Programm
e ResponseN
o.2004
20052006
20072008
20092010
20112012
FSW TIs
11
11
12
22
2M
SM TIs
11
11
12
22
2IDU TIs
--
--
--
--
-Com
p. TIs-
--
-2
33
33
ICTCs-
--
1021
4445
4645
Blood Banks6
65
611
1111
1111
STI clinics-
--
33
33
33
ART centres-
--
11
11
11
Link ART centres-
--
--
-2
46
PLHIV Netw
orks-
11
11
11
11
Red Ribbon Clubs-
--
--
4040
1010
Comm
. care centres-
--
-2
22
11
Drop-in-centres-
11
11
11
11
Condom O
utlets-
--
--
--
--
VulnerabilitiesM
ale Migration, 2001 Census
Overall
Inter-State
Intra-state
Intra-district
No. out-
migration
1499108285
4975491871
% of m
ale pop.
9.160.51
3.045.62
% total
migration
1005.53
33.1961.28
Top 5 districts for inter-state out-migration
Mum
bai (Suburban) ,M
aharash-tra
Thane, M
aharash-tra
Pune, M
aharash-tra
Mum
bai, M
aharash-tra
Jaipur, Rajasthan
HRG Size
FSWM
SMIDU
Size Est., (Mapping,
Year: 2008)2487
2383-
% Total HRG
51.0748.93
-
% Total Pop.
0.070.06
-
Program Target
NA
NA
NA
Program Coverage
--
-
Typology
Home
based-37.43%
;
Brothel based-
27.91%;
Street based-
34.66%
Kothi-53.76%
;
Panthi-N
A;
Double decker-44.15%
Daily Injectors-
NA;
Non daily
Injectors-N
A
% <
25 yrs.-
--
% M
arried-
--

48 | District HIV/AIDS Epidemiological Profiles : Gujarat
SabarkanthaBackground:
Sabarkantha district derives its name from the river Sabarmati that separates Sabarkantha from the neighbouring districts. The district is bounded by the Rajasthan State to the north, Banaskantha and Mehsana districts to the west, Gandhinagar, Kheda, and Panchmahal districts to the south. It has a population of 24.27 lakh, 85.04% of which reside in rural areas, with a sex ratio of 950 females per 1,000 males; female literacy rate of 65.29%, with an overall literacy rate of 76.60% (Census 2011). The economy of the district is heavily dependent on Agriculture and Dairy Farming. Food processing and textiles are the other emerging sectors which have opened up new opportunities for investment. Major tourist destinations are Idar, Shamlaji temple, Polo Forests, Vijaynagar. NH 8 passes through the district connecting it with major cities of the State and also with the rest of India.
HIV Epidemic Profile:
• Basedon2010HSS-ANCdata,HIVprevalencewashighat1.50%amongtheANCattendees.Sabarkantha isahighHIVprevalencedistrict with prevalence at 1% of higher in the last HSS round also (1.25% in 2008).
• Accordingto2012PPTCTdata,HIVpositivitywaslowat0.23%amongthePPTCTattendees,withadecreasingtrend.
• Accordingto2012BloodBankdata,HIVpositivitywaslowat0.08%amongtheBloodBankdonors,withaflattrend.
• In2012,HIVpositivityamongICTCattendeeswas lowamongmale(2.64%)andfemale(1.97%)clients,aswellasamongreferred(1.54%) and direct walk-in (4.16%) clients.
• Accordingto2008HRGmappingdata,FSW(829;64.56%ofthetotalHRG)wasthelargestHRGinthedistrictfollowedbyMSM(455;35.44% of the total HRG). The major typology for FSWs was street-based (49.58%).
• In2012,5,217STI/RTIepisodesweretreatedandthesyphilispositivityrateamongSTIclinicattendeeswas0.64%.
• Thetoptwodestinationsforout-of-statemigrationwereThaneandMumbai(Suburban),Maharashtra.
• Accordingto2012ICTCdata,HIVtransmissionsfromparenttochildaccountedfor7.58%ofthetotalreportedcases(n=409)inthedistrict.
• AccordingtoDLHS-IIIdata,theHIVandSTI/RTIawarenessrateamongwomenwas38.8%and14%,respectively.
• In2012,twocompositeTIsiteswereoperationalinthedistrict.
Key Recommendations:
• IncreasethenumberofTIsitesinthedistricttoprovideHIVpreventiveandreferralservicestoaccommodatethesizeablenumberofHRGs.
• Conductsocio-demographicanalysisofHSS-ANCattendeestoascertainriskfactors,consideringhighHIVprevalenceamongHSS-ANCattendees.
• NotingthelevelofHIVtransmissionviaparenttochildofallreportedcases,thereisaneedtobetterunderstandtheprofileanddynamicsof clinic attendees and their spouses also through analysis of ICTC data. Accordingly strengthen HIV prevention efforts among married women and encourage early detection and linkage to necessary treatment services.
• AnalysevulnerabilityfactorsintransmissionofHIVfromICTCandSTIdata,consideringtheHIVepidemicinthedistrict.
• StrengthenIECforgeneralpopulationwithHIVawarenessandHIVpreventionmessages,includingsexualriskreduction.
Sabarkantha District

District HIV/AIDS Epidemiological Profiles : Gujarat | 49
SabarkanthaDistrict Population: 24.27,346 (4.02%
of Gujarat Population); Fem
ale Literacy1: 65.29%
; ANC Utilization
2: 49.7%
2005
20062007
20082009
20102011
2012
HSS-ANC
PP4
0.250.75
0.251.25
1.50-
NT
4400
400400
399400
-
PPTCTPP
-0.85
0.550.34
0.250.28
0.230.23
NT
-1170
33017700
1329215859
1761113618
Blood BankPP
0.220.43
0.100.10
0.070.16
0.090.08
NT
50944636
94198954
1716420381
9378817829
HSS-STDPP
--
--
--
NT
--
--
--
HSS-FSWPP
--
--
--
NT
--
--
--
HSS-MSM
PP-
--
--
-N
T-
--
--
-
HSS-IDUPP
--
--
--
NT
--
--
--
ICTC Male
PP*
*8.60
3.903.31
2.407.72
2.64N
T*
*4009
131888219
962210672
9102
ICTC Female
PP*
*-
3.592.58
1.890.90
1.97N
T*
*-
61777355
907910986
8590
ICTC ReferredPP
--
-3.22
2.631.59
4.451.54
NT
--
-9739
1163513635
1513512501
ICTC Direct W
alk-inPP
--
-5.72
3.963.67
3.824.16
NT
--
-3744
39395066
65235191
Total tested at ICTCs
5 N
T214
17157310
2706528866
3456039269
31310
PLHIV Profile, 2012
% O
n ART%
15-24 yrs%
Ill., Prim. Edu.
% M
arried%
Widow
ed or Divorced
ART (NA)
--
--
-
DLN (N
A)-
--
--
Block-Level Details
No. HRG
- FSW
- -
- -
- -
- -
-
No. HRG
- M
SM-
- -
- -
- -
- -
No. HRG
- IDU
- -
- -
- -
- -
-
% Pos;
ICTC-
- -
- -
- -
- -
% Pos;
PPTCT-
- -
- -
- -
- -
Route of HIV Transm
ission, ICTC 2012
Hetero-sexualHom
o-sexualBlood
TransfusionN
eedle/ Syringe
Parent to Child
Unknown
% of Total
(N=
409)82.15
1.964.40
0.497.58
3.42
HIV Levels and Trends
3
* Inadequate sample size; - Data not available; 1 2011 Census; 2 Source: DLHS III; 3 Data presented only for years w
here sample size is valid (HSS-AN
C ≥ 300, HSS-HRG/STD ≥ 187, ICTC ≥ 600, PPTCT ≥ 900 and BB ≥ 900); 4 PP =
percent positive, N
T = num
ber tested; 5 General clients & pregnant w
omen.
STI/RTI2009
20102011
2012
No. episodes treated
27856508
79225217
% Syphilis positivity
-0.14
0.820.64
Programm
e ResponseN
o.2004
20052006
20072008
20092010
20112012
FSW TIs
--
--
--
--
-M
SM TIs
--
--
--
--
-IDU TIs
--
--
--
--
-Com
p. TIs-
--
--
22
22
ICTCs-
--
1112
1236
4645
Blood Banks2
22
35
55
55
STI clinics-
--
11
11
22
ART centres-
--
--
-1
11
Link ART centres-
--
-1
21
12
PLHIV Netw
orks-
--
-1
11
11
Red Ribbon Clubs-
--
--
--
2526
Comm
. care centres-
--
--
--
--
Drop-in-centres-
--
--
--
--
Condom outlets
--
--
--
--
-
VulnerabilitiesM
ale Migration, 2001 Census
Overall
Inter-State
Intra-state
Intra-district
No. out-
migration
--
--
% of m
ale pop.
--
--
% total
migration
0-
--
Top 5 districts for inter-state out-migration
Thane, M
aharash-tra
Mum
bai (Subur-ban),
Maharash-
tra
Dungarpur, Rajasthan
Udaipur, Rajasthan
Mum
bai, M
aharash-tra
HRG Size
FSWM
SMIDU
Size Est., (Mapping,
Year: 2008)829
455-
% Total HRG
64.5635.44
-
% Total Pop.
0.030.02
-
Program Target
NA
NA
NA
Program Coverage
--
-
Typology
Home
based-17.61%
;
Brothel based-
32.81%;
Street based-
49.58%
Kothi-82.85%
;
Panthi-N
A;
Double decker-17.15%
Daily Injectors-
NA;
Non daily
Injectors-N
A
% <
25 yrs.-
--
% M
arried-
--

50 | District HIV/AIDS Epidemiological Profiles : Gujarat
SuratBackground:
Surat district is surrounded by Bharuch and Narmada districts to the north, Navsari district to the southand east Tapi district. To the west is the Gulf of Khambat. Surat is the second most populous district of Gujarat with a population of 60.79 lakh, 79.68% of the population reside in urban areas, a sex ratio of 788 females per 1,000 males; female literacy rate of 81.02%, with an overall literacy rate of 86.65% (Census 2011). Focus industry sectors include textiles and apparels, gems and jewelry, chemicals and petrochemicals, ports, IT enabled services and bio technology. Emergence of a petro chemical complex, gems and jewelry park and the centrally promoted Surat SEZ are expected to further fuel the industrial and economic growth of the city. Famous tourist places are The Surat Castle, Mughalsarai, Andrews Library, Sardar Vallabhai Patel Museum and Marjan Shami Roza. Surat is well connected to various locations through national and state highways.
HIV Epidemic Profile:
• Basedon2012HSS-ANCdata,HIVprevalencewashighat1%amongtheANCattendees.SuratisknownasahighHIVprevalencedistrictwith 1% or more prevalence reported over HSS rounds (1.26% HIV prevalence among ANC in 2010).
• Accordingto2012PPTCTdata,HIVpositivitywaslowat0.27%amongthePPTCTattendees.
• Accordingto2012BloodBankdata,HIVpositivitywaslowat0.07%amongtheBloodBankdonors.
• Accordingto2010HSSdata,HIVprevalencewaslowamongFSWs(0.80%),MSM(1.20%)andIDUs(1.60%).
• In2012,HIVpositivityamongICTCattendeeswas lowamongmale(2.93%)andfemale(2.12%)clients,aswellasamongreferred(2.31%) and direct walk-in (3.01%) clients.
• AccordingtoHRGmappingdata,MSM(9,816;56.44%ofthetotalHRG)wasthelargestHRGinthedistrictfollowedbyFSW(5,775;33.21% of the total HRG) and IDU (1,800;10.35% of the total HRG). 55.09% of the mapped MSM and 67.67% of the mapped FSW were reported married. The major typology for FSWs was home-based (61.93%).
• In2012,1,43,237STI/RTIepisodesweretreatedandthesyphilispositivityrateamongSTIclinicattendeeswas0.13%.
• Accordingto2012ICTCdata,HIVtransmissionfromparenttochildaccountedfor4.85%ofthetotalreportedcases(n=1731).
• Asperthe2001Census,5.97%ofthemalepopulationweremigrants;amongthem14.50%migratedtootherstatesand18.36%migrated to other districts within the state.
• Thetoptwodestinationsforout-of-statemigrationwereGanjam,Odisha;andNandurbar,Maharashtra.
• AccordingtoDLHS-IIIdata,theHIVandSTI/RTIawarenessrateamongwomenwas60.5%and33.6%,respectively.
Key Recommendations:
• ContinueattentiontodecreaseandlimitthespreadofHIVinfectionfurther,notingtheHSSANCHIVprevalence,HRGpopulationsizeestimate, migration levels, and other vulnerability factors.
• Conductsocio-demographicanalysisofHSS-ANCattendeestounderstandriskfactorsforhighHIVepidemicamonggeneralpopulation.
• SincethelargestHRGareMSM,betterassessmentofthesizeandprofileofMSMandpartnerpopulationwillhelpinbetterunderstandingof district vulnerabilities.
• FocusonIDU-FSWsexualnetworksandaddressthedualriskthatisposedduetotherateofinfectionamongIDUsandthelargenumberof FSWs in a district with multiple industries.
• Consideringhighrateofmigration,strengthenoutreachprogrammethroughawarenesscampaignsaroundsourceandtransitpointssuchas railway stations and bus stands.
Surat District

District HIV/AIDS Epidemiological Profiles : Gujarat | 51
SuratDistrict Population: 60,79,231 (10.07%
of Gujarat Population); Fem
ale Literacy1: 81.02%
; ANC Utilization
2: 78.4%
2005
20062007
20082009
20102011
2012
HSS-ANC
PP4
1.251.25
1.500.76
1.261.00
NT
4400
400400
394398
400
PPTCTPP
--
2.530.66
0.380.27
0.210.27
NT
--
864724437
4800147928
5040136235
Blood BankPP
--
0.230.17
0.170.12
0.090.07
NT
--
7993087583
8330488889
9378889976
HSS-STDPP
--
--
--
NT
--
--
--
HSS-FSWPP
13.208.00
7.204.40
0.80-
NT
250250
250250
250-
HSS-MSM
PP15.60
12.807.60
101.20
-N
T250
250250
250250
-
HSS-IDUPP
--
--
1.60-
NT
--
--
250-
ICTC Male
PP-
--
14.194.99
2.591.95
2.93N
T-
--
1324531049
5240669332
38342
ICTC Female
PP-
--
14.664.98
2.131.81
2.12N
T-
--
701317819
3222942745
28647
ICTC ReferredPP
--
-10.62
4.332.79
2.452.31
NT
--
-7885
2496143483
5553740971
ICTC Direct W
alk-inPP
--
-16.74
5.672.01
1.353.01
NT
--
-12373
2390741152
5654026018
Total tested at ICTCs
5 N
T-
-8647
4469596869
132563162478
103224
PLHIV Profile, 2012
% O
n ART%
15-24 yrs%
Ill., Prim. Edu.
% M
arried%
Widow
ed or Divorced
ART (20049)33
1063
5713
DLN (N
A)-
--
--
Block-Level Details
No. HRG
-FSW-
- -
- -
- -
- -
No. HRG
-MSM
- -
- -
- -
- -
-
No. HRG
- IDU-
- -
- -
- -
- -
% Pos;
ICTCO
lpad, 4.43
Palsana, 2.52
Kamrej,
0.81Bardoli,
5.3Vyara, 3.29
Mandvi, 2.63
Valod, 0
Mahuva, 2.92
Mangrol, 3.35
% Pos;
PPTCT-
- -
- -
- -
- -
Route of HIV Transm
ission, ICTC 2012
Hetero-sexualHom
o-sexualBlood
TransfusionN
eedle/ Syringe
Parent to Child
Unknown
% of Total
(N=
1731)89.95
2.311.62
0.234.85
1.04
HIV Levels and Trends
3
* Inadequate sample size; - Data not available; 1 2011 Census; 2 Source: DLHS III; 3 Data presented only for years w
here sample size is valid (HSS-AN
C ≥ 300, HSS-HRG/STD ≥ 187, ICTC ≥ 600, PPTCT ≥ 900 and BB ≥ 900); 4 PP =
percent positive, N
T = num
ber tested; 5 General clients & pregnant w
omen.
STI/RTI2009
20102011
2012
No. episodes treated
484477190388
163724143237
% Syphilis positivity
-0.30
0.120.13
Programm
e ResponseN
o.2004
20052006
20072008
20092010
20112012
FSW TIs
11
11
35
55
5M
SM TIs
11
11
15
55
5IDU TIs
--
--
11
11
1Com
p. TIs-
--
--
44
44
ICTCs-
--
842
5083
9193
Blood Banks8
88
88
98
77
STI clinics-
--
33
34
44
ART centres-
-1
12
23
33
Link ART centres-
--
--
-1
11
PLHIV Netw
orks1
12
22
22
22
Red Ribbon Clubs-
--
--
5050
1818
Comm
. care centres-
--
-2
22
22
Drop-in-centres-
33
33
33
33
Condom O
utlets-
--
--
--
--
VulnerabilitiesM
ale Migration, 2001 Census
Overall
Inter-State
Intra-state
Intra-district
No. out-
migration
16254723574
29839109134
% of m
ale pop.
5.970.87
1.104.01
% total
migration
10014.50
18.3667.14
Top 5 districts for inter-state out-migration
Ganjam
, O
disha
Nandurbar,
Maharash-
tra
Thane, M
aharash-tra
Mum
bai (Suburban), M
aharash-tra
Dhule, M
aharash-tra
HRG Size
FSWM
SMIDU
Size Est., (Mapping,
Year: NA
57759816
1800
% Total HRG
33.2156.44
10.35
% Total Pop.
0.090.16
0.03
Program Target
NA
NA
NA
Program Coverage
--
-
Typology
Home
based-61.93%
;
Brothel based-
36.56%;
Street based-1.51%
Kothi-32.92%
;
Panthi-N
A;
Double decker-66.08%
Daily Injectors-
NA;
Non daily
Injectors-N
A
% <
25 yrs.28.63
11.93-
% M
arried67.67
55.09-

52 | District HIV/AIDS Epidemiological Profiles : Gujarat
SurendranagarBackground:
Surendranagar district is located in the central region ofGujarat, in the Saurashtra peninsula. The district has a population of 17.55 lakh, a sex ratio of 929 females per 1,000 males; female literacy rate of 62.20%, with an overall literacy rate of 73.19% (Census 2011). Surendranagar is one of the largest producers of “Shankar” Cotton in the world and, is also the home to the first cotton trading exchange in India. Surendranagar is a base for industrial sectors such as textiles, chemicals, ceramics and food processing industries. Some of the major tourist destinations in the district are Tarnetar Mela, Chotila Hills and Ranak devi Temple. Surendranagar’s dry air is believed to be the best place in Gujarat to cure tuberculosis patients, since the colonial times. National Highway 8A passes through the district connecting it to Ahmedabad and Kutch.
HIV Epidemic Profile:
• Basedon2012HSS-ANCdata,HIVprevalencewasmoderateat0.50%amongtheANCattendees.Itwasreportedat0.25%inboththe2010 and 2007 HSS rounds.
• Accordingto2012PPTCTdata,HIVpositivitywaslowat0.11%amongthePPTCTattendees,withastabletrend.
• Accordingto2012BloodBankdata,HIVpositivitywaslowat0.12%amongtheBloodBankdonors,withastabletrend.
• Accordingto2010HSS-FSWdata,HIVprevalencewaslowamongFSWs.
• In2012,HIVprevalenceamongICTCattendeeswaslowamongmale(1.46%)andfemale(0.54%)clients,aswellasamongreferred(1.18%) and direct walk-in clients (0.79%).
• Accordingto2008HRGmappingdata,FSW(1,793;51.82%ofthetotalHRG)wasthelargestHRGinthedistrictfollowedbyMSM(1,667; 48.18% of the total HRG). 80.41% and 45.49% of the mapped MSM and FSW were married. The major typology for FSWs was home-based (94.69%).
• In2012,7,397STI/RTIepisodesweretreatedandthesyphilispositivityrateamongSTIclinicattendeeswas0.53%.
• Asper the2001Census,8.43%of themalepopulationweremigrants; among them4.34%migrated toother statesand46.66%migrated to other districts within the state.
• Thetoptwodestinationsforout-of-statemigrationwereThaneandMumbai(Suburban),Maharashtra.
• Accordingto2012ICTCdata,HIVtransmissionsfromparenttochild,throughunknownroutesatandthroughhomosexualrouteswasat 8.70%, 6.52% 5.80%, respectively, out of the total reported cases in the district.
• AccordingtoDLHS-IIIdata,theHIVandSTI/RTIawarenessrateamongwomenwas37.9%and24.1%,respectively.
• In2012,therewereonlytwocompositeTIsitesinoperation,fortheover3,000estimatedHRGsinthedistrict.
Key Recommendations:
• InitiateatleasttwoTIsiteseachforFSWandMSMinthedistrictimmediately,asthereisasizableHRGpopulationinthedistrict.
• ConsideringtheHIVprevalenceamongHSS-ANCattendees,socio-demographicanalysisisneededtoascertainriskfactors.
• ImprovethequalityofcounselingatICTCs,sincetherateofunknownHIVtransmissionishigh.Reinforcepositivepreventionmessages.
• Conductin-depthanalysisofICTCdatatounderstandtheprofileoftheseattendees,asthetransmissionfromparenttochild(8.70%ofall reported cases) and through MSM (5.80% of all reported cases) is notable.
• Vulnerability factors forHIV transmissionneeds tobeanalysed from ICTCandSTI data.This accordingly can informHIVpreventioninterventions
Surendranagar District

District HIV/AIDS Epidemiological Profiles : Gujarat | 53
SurendranagarDistrict Population: 17,55,873 (2.91%
of Gujarat Population); Fem
ale Literacy1: 62.20%
; ANC Utilization
2: 39%
2005
20062007
20082009
20102011
2012
HSS-ANC
PP4
-1.75
0.25-
0.250.50
NT
4-
400400
-397
400
PPTCTPP
**
*0.10
0.180.06
0.100.11
NT
**
*7033
1242212472
1933619560
Blood BankPP
*0.18
*0.25
0.180.17
0.040.12
NT
*1126
*1187
85628470
54899669
HSS-STDPP
03.27
--
--
NT
250214
--
--
HSS-FSWPP
--
--
0-
NT
--
--
249-
HSS-MSM
PP-
--
--
-N
T-
--
--
-
HSS-IDUPP
--
--
--
NT
--
--
--
ICTC Male
PP-
--
4.753.13
1.743.57
1.46N
T-
--
43827659
1043226441
13856
ICTC Female
PP-
--
2.851.69
0.910.24
0.54N
T-
--
32336504
974021294
13730
ICTC ReferredPP
--
-3.63
2.171.37
3.681.18
NT
--
-4741
888112712
2364214814
ICTC Direct W
alk-inPP
--
-4.45
2.971.29
0.510.79
NT
--
-2874
52827460
2409312772
Total tested at ICTCs
5 N
T833
400470
1464826585
3264467071
47146
PLHIV Profile, 2012
% O
n ART%
15-24 yrs%
Ill., Prim. Edu.
% M
arried%
Widow
ed or Divorced
ART (1554)57
1179
6213
DLN (N
A)-
--
--
Block-Level Details
No. HRG
-FSW-
- -
- -
- -
- -
No. HRG
-MSM
- -
- -
- -
- -
-
No. HRG
- IDU-
- -
- -
- -
- -
% Pos;
ICTC-
- -
- -
- -
- -
% Pos;
PPTCTLim
bdi, 5.4
Sayla, 4.76
Wadhw
an, 2.2
Chotila, 3.4
Dhan-gadhra,
2.9
Halvad, 3.2
Patdi, 0.64
Other, 5.7
Total, 4.6
Route of HIV Transm
ission, ICTC 2012
Hetero-sexualHom
o-sexualBlood
TransfusionN
eedle/ Syringe
Parent to Child
Unknown
% of Total
(N=
276)75.72
5.802.54
0.728.70
6.52
HIV Levels and Trends
3
* Inadequate sample size; - Data not available; 1 2011 Census; 2 Source: DLHS III; 3 Data presented only for years w
here sample size is valid (HSS-AN
C ≥ 300, HSS-HRG/STD ≥ 187, ICTC ≥ 600, PPTCT ≥ 900 and BB ≥ 900); 4 PP =
percent positive, N
T = num
ber tested; 5 General clients & pregnant w
omen.
STI/RTI2009
20102011
2012
No. episodes treated
213587731
70277739
% Syphilis positivity
-1.82
1.520.53
Programm
e ResponseN
o.2004
20052006
20072008
20092010
20112012
FSW TIs
--
--
--
--
-M
SM TIs
--
--
--
--
-IDU TIs
--
--
--
--
-Com
p. TIs-
--
--
22
22
ICTCs-
--
1114
1530
3647
Blood Banks2
22
45
55
55
STI clinics-
--
22
22
33
ART centres-
--
--
11
11
Link ART centres-
--
--
-1
22
PLHIV Netw
orks-
--
-1
11
11
Red Ribbon Clubs-
--
--
--
88
Comm
. care centres-
--
--
11
--
Drop-in-centres-
--
-1
11
11
Condom O
utlets-
--
--
--
--
VulnerabilitiesM
ale Migration, 2001 Census
Overall
Inter-State
Intra-state
Intra-district
No. out-
migration
664012879
3098032542
% of m
ale pop.
8.430.37
3.934.13
% total
migration
1004.34
46.6649.01
Top 5 districts for inter-state out-migration
Thane, M
aharash-tra
Mum
bai (Subur-ban),
Maharash-
tra
Ahmadna-
gar, M
aharash-tra
Nashik,
Maharash-
tra
Pune, M
aharash-tra
HRG Size
FSWM
SMIDU
Size Est., (Mapping,
Year: 2008)1793
1667N
A
% Total HRG
51.8248.18
-
% Total Pop.
0.100.09
-
Program Target
NA
NA
NA
Program Coverage
--
-
Typology
Home
based-94.69%
;
Brothel based-5.31%
;
Street based-
NA
Kothi-59.23%
;
Panthi-N
A;
Double decker-40.77%
Daily Injectors-
NA;
Non daily
Injectors-N
A
% <
25 yrs.14.69
47.27-
% M
arried80.41
45.49-

54 | District HIV/AIDS Epidemiological Profiles : Gujarat
The DangsBackground:
Dangs is a tribal district located in southern Gujarat. The district shares its border with the State of Maharashtra and is covered with high hills and dense forests. It is the least populous district of Gujarat with a population of 2.26 lakh, with a sex ratio of 1007 females per 1,000 males; female literacy rate of 68.75%, with an overall literacy rate of 76.80% (Census 2011). As per the Planning Commission, Dangs is the most backward district in India. In Dangs, 50% of population is working. Majority of population is dependent on agriculture for their livelihood. Animal husbandry and bamboo cutting are the other economic activities in the region. Dangs district is gradually emerging into an agro processing and tourism hub. The reserved forests in Dangs are amongst the richest forests in the State. Saputara is an important tourist destination in the district. Rich wildlife, gardens, ropeway, sunrise point and echo point are some of the main tourist attractions in Dangs. Dangs is well connected with Maharashtra state by roads.
HIV Epidemic Profile:
• Basedon2010HSS-ANCdata,HIVprevalencewaslowat0.28%amongtheANCattendeescomparedto0.27%and0%ANCHIVprevalence in 2010 and 2008 respectively .
• Accordingto2010PPTCTdata,HIVpositivitywaslowamongthePPTCTattendees.
• In2012,HIVpositivity among ICTCattendeeswas lowamongmale (0.89%)and female (0.67%) clients, andalsoamong referred(0.95%) and direct walk-in (0.47%) clients, with a stable trend among all the ICTC clients, but an abrupt increase in the positivity was observed among male and referred clients in 2011.
• In2012,1,362STI/RTIepisodesweretreated.
• Asperthe2001Census,13.30%ofthemalepopulationweremigrants;amongthem3.97%migratedtootherstatesand50.51%migrated to other districts within the state.
• Thetoptwodestinationsforout-of-statemigrationwereNandurbarandNashik,Maharashtra.
• AccordingtoDLHS-IIIdata,theHIVandSTI/RTIawarenessrateamongwomenwas15.2%and8.8%,respectively.
• In2012,therewasnoinformationaboutthepresenceofafunctionalTIinthedistrict.
Key Recommendations:
• ContinuationofHIVpreventioneffortstocontainandreducetheHIVepidemic.
• Conductsocio-demographicanalysisofHSS-ANCattendeestoascertainriskfactors,consideringtheHIVprevalenceandHIVpositivityrate among ANC attendees.
• ConductdisaggregatedanalysisofPPTCTdatatoassessriskfactorsinthedistrict.
• Consideringhighrateofmigration,strengthenoutreachprogrammethroughawarenesscampaignsaroundsourceandtransitpointssuchas railway stations and bus stands. Conduct special awareness campaign especially among general population, pockets of out-migrants transit points and around truck halting points and highways in the district.
• AvailabilityofARTorDLNdatawillhelpinbetterunderstandingofdistrictvulnerabilities.
The Dangs District

District HIV/AIDS Epidemiological Profiles : Gujarat | 55
The Dangs
District Population: 2,26,769 (0.38% of G
ujarat Population); Female Literacy
1: 68.75%; AN
C Utilization2: 20.9%
2005
20062007
20082009
20102011
2012
HSS-ANC
PP4
--
00.27
0.28-
NT
4-
-400
376361
-
PPTCTPP
-*
*0
0-
0-
NT
-*
*1133
1198-
1111-
Blood BankPP
*-
**
--
--
NT
*-
**
--
--
HSS-STDPP
--
--
--
NT
--
--
--
HSS-FSWPP
--
--
--
NT
--
--
--
HSS-MSM
PP-
--
--
-N
T-
--
--
-
HSS-IDUPP
--
--
--
NT
--
--
--
ICTC Male
PP-
--
1.060.66
0.8211.46
0.89N
T-
--
658455
972803
1119
ICTC Female
PP-
--
1.401.09
1.250
0.67N
T-
--
571460
878528
893
ICTC ReferredPP
--
-2.12
1.521.39
9.540.95
NT
--
-660
5261151
9221375
ICTC Direct W
alk-inPP
--
-0.18
00.43
0.980.47
NT
--
-569
389699
409637
Total tested at ICTCs
5 N
T-
52519
23622113
18502442
3446
PLHIV Profile, 2012
% O
n ART%
15-24 yrs%
Ill., Prim. Edu.
% M
arried%
Widow
ed or Divorced
ART (NA)
--
--
-
DLN (N
A)-
--
--
Block-Level Details
No. HRG
- FSW
- -
- -
- -
- -
-
No. HRG
- M
SM-
- -
- -
- -
- -
No. HRG
- IDU
- -
- -
- -
- -
-
% Pos;
ICTC-
- -
- -
- -
- -
% Pos;
PPTCT-
- -
- -
- -
- -
Route of HIV Transm
ission, ICTC 2012
Hetero-sexualHom
o-sexualBlood
TransfusionN
eedle/ Syringe
Parent to Child
Unknown
% of Total
(N=
16)100
00
00
0
HIV Levels and Trends
3
* Inadequate sample size; - Data not available; 1 2011 Census; 2 Source: DLHS III; 3 Data presented only for years w
here sample size is valid (HSS-AN
C ≥ 300, HSS-HRG/STD ≥ 187, ICTC ≥ 600, PPTCT ≥ 900 and BB ≥ 900); 4 PP =
percent positive, N
T = num
ber tested; 5 General clients & pregnant w
omen.
STI/RTI2009
20102011
2012
No. episodes treated
97183792
21791362
% Syphilis positivity
1.972.56
2.57-
Programm
e ResponseN
o.2004
20052006
20072008
20092010
20112012
FSW TIs
--
--
--
--
-M
SM TIs
--
--
--
--
-IDU TIs
--
--
--
--
-Com
p. TIs-
--
--
--
--
ICTCs-
--
11
14
44
Blood Banks1
11
11
11
11
STI clinics-
--
11
11
11
ART centres-
--
--
--
--
Link ART centres-
--
--
--
-1
PLHIV Netw
orks-
--
--
--
--
Red Ribbon Clubs-
--
--
--
13
Comm
. care centres-
--
--
--
--
Drop-in-centres-
--
--
--
--
Condom outlets
--
--
--
--
-
VulnerabilitiesM
ale Migration, 2001 Census
Overall
Inter-State
Intra-state
Intra-district
No. out-
migration
12506496
63175693
% of m
ale pop.
13.300.53
6.726.06
% total
migration
1003.97
50.5145.52
Top 5 districts for inter-state out-migration
Nandurbar,
Maharash-
tra
Nashik,
Maharash-
tra-
--
HRG Size
FSWM
SMIDU
Size Est., (Mapping,
Year: 2008)57
00
% Total HRG
1000
0
% Total Pop.
0.030
0
Program Target
NA
NA
NA
Program Coverage
--
-
Typology
Home
based-N
A;
Brothel based-
NA;
Street based-
NA
Kothi-N
A;
Panthi-N
A;
Double decker-
NA
Daily Injectors-
NA;
Non daily
Injectors-N
A
% <
25 yrs.-
--
% M
arried-
--

56 | District HIV/AIDS Epidemiological Profiles : Gujarat
VadodraBackground:
Vadodara, one of India’s most cosmopolitan cities, is located to the south east of Ahmedabad, on the banks of river Vishwamitri. The district is bounded by Panch mahal and Dahod districts to the north, Anand and Kheda districts to the west, Bharuch and Narmada districts to the south, and the state of Madhya Pradesh to the east. The district has a population of 41.57 lakh, a sex ratio of 934 females per 1,000 males; female literacy rate of 74.40%, with an overall literacy rate of 81.21% (Census 2011). The district is referred to as the “Sanskar Nagari” (City of Culture) due to its rich cultural traditions. The industrial clusters include chemicals and fertilizers, pharmaceuticals, biotechnology, cotton textiles, machine tools, glass, engineering, tobacco, fisheries and dairy. It has major tourist attractions including The Baroda Museum and Art Gallery, Sursagar Lake, The Tribal Museum, etc. National Highway (NH) 8 and State Highway 6 pass through the district.
HIV Epidemic Profile:
• Basedon2012HSS-ANCdata,HIVprevalencewasmoderateat0.50%amongtheANCattendees,withafluctuatingtrend.
• Accordingto2012PPTCTdata,HIVpositivitywaslowat0.16%amongthePPTCTattendees,withastabletrend.
• Accordingto2012BloodBankdata,HIVpositivitywaslowat0.11%amongtheBloodBankdonors,withastabletrend.
• Accordingto2010HSSdata,HIVprevalencewaslowamongFSWs(3.61%)andMSM(2.01%),withanoveralldecliningtrend.
• In2012,HIVpositivityamongICTCattendeeswas lowamongmale(2.82%)andfemale(2.19%)clients,aswellasamongreferred(2.47%) and direct walk-in (2.91%) clients, with a fluctuating trend among male and referred client, but a declining trend among female and direct walk-in clients.
• Accordingto2008HRGsizemappingdata,MSM(5,894;65.21%ofthetotalHRG;54.04%married)wasthelargestHRGinthedistrictfollowed by FSW (2,770; 30.65% of the total HRG; married) and IDU (374; 4.14% of the total HRG). 54.04% and 84.04% of the mapped MSM and FSW respectively, were married. The major typology for FSWs was home-based (34.13%).
• In2012,22,826STI/RTIepisodesweretreatedandthesyphilispositivityrateamongSTIclinicattendeeswas0.52%.
• Asper the2001Census,6.85%of themalepopulationweremigrants; among them8.89%migrated toother statesand28.39%migrated to other districts within the state.
• Thetoptwodestinationsforout-of-statemigrationwereThaneandMumbai(Suburban),Maharashtra.
• AccordingtoDLHS-IIIdata,theHIVandSTI/RTIawarenessrateamongwomenwas37.2%and17.7%,respectively.
• In2012,sevenTIsites(4MSMTI,2FSWTIand1compositeTI)wereinoperation,whiletherewereover8,500estimatednumberofHRGin the district.
Key Recommendations:
• Continueeffortstodecreaseandlimitthespreadoftheinfectionfurther,consideringthenumberofHIVpositivecases,HRGsizeestimate,and other vulnerability factors.
• IncreasethenumberofTIsitesinthedistrictconsideringthelargenumberofmappedHRGs.
• Conduct socio-demographic analysis of HSS-ANC attendees to understand risk factors associated with HIV transmission among thegeneral population. Strengthen HIV prevention efforts among married women.
• FocusonIDU-FSWsexualnetworksandaddressthedualriskthatisposedduetoinfectionamongIDUsandalargenumberofFSWs.Strengthen and improve quality of outreach programme for IDUs and FSWs.
• SincethelargestHRGareMSM,abetterassessmentofthesizeandprofileofMSMandpartnerpopulation,willhelpinbetterunderstandingof district vulnerabilities.
Vadodara District

District HIV/AIDS Epidemiological Profiles : Gujarat | 57
VadodraDistrict Population: 41,57,568 (6.89%
of Gujarat Population); Fem
ale Literacy1: 74.40%
; ANC Utilization
2: 50.2%
2005
20062007
20082009
20102011
2012
HSS-ANC
PP4
0.250.25
0.500
00.50
NT
4400
400400
399400
400
PPTCTPP
**
0.740.40
0.280.22
0.120.16
NT
**
17604712
2565626775
4352335611
Blood BankPP
0.200.15
0.090.11
0.160.16
0.130.11
NT
2032625366
2767535627
6547870915
3124680823
HSS-STDPP
2.403.35
--
--
NT
250239
--
--
HSS-FSWPP
6.808.40
9.607.20
3.61-
NT
250250
250250
249-
HSS-MSM
PP4.00
6.802.00
3.352.01
-N
T250
250250
239249
-
HSS-IDUPP
--
--
--
NT
--
--
--
ICTC Male
PP-
--
8.655.47
3.378.60
2.82N
T-
--
542314400
1846323455
19895
ICTC Female
PP-
--
8.885.10
2.950.63
2.19N
T-
--
29968276
1250520564
13364
ICTC ReferredPP
--
-7.29
4.633.08
5.882.47
NT
--
-5569
1683825629
3112525391
ICTC Direct W
alk-inPP
--
-11.54
7.373.78
2.452.91
NT
--
-2850
58385339
128947868
Total tested at ICTCs
5 N
T318
4701760
1313148332
5774387542
68870
PLHIV Profile, 2012
% O
n ART%
15-24 yrs%
Ill., Prim. Edu.
% M
arried%
Widow
ed or Divorced
ART (6063)36
1172
6113
DLN (N
A)-
--
--
Block-Level Details
No. HRG
- FSW
- -
- -
- -
- -
-
No. HRG
- M
SM-
- -
- -
- -
- -
No. HRG
- IDU
- -
- -
- -
- -
-
% Pos;
ICTC-
- -
- -
- -
- -
% Pos;
PPTCT-
- -
- -
- -
- -
Route of HIV Transm
ission, ICTC 2012
Hetero-sexualHom
o-sexualBlood
TransfusionN
eedle/ Syringe
Parent to Child
Unknown
% of Total
(N=
855)88.07
1.751.99
0.584.44
3.16
HIV Levels and Trends
3
* Inadequate sample size; - Data not available; 1 2011 Census; 2 Source: DLHS III; 3 Data presented only for years w
here sample size is valid (HSS-AN
C ≥ 300, HSS-HRG/STD ≥ 187, ICTC ≥ 600, PPTCT ≥ 900 and BB ≥ 900); 4 PP =
percent positive, N
T = num
ber tested; 5 General clients & pregnant w
omen.
STI/RTI2009
20102011
2012
No. episodes treated
3757518713
2421522826
% Syphilis positivity
-1.37
0.620.52
Programm
e ResponseN
o.2004
20052006
20072008
20092010
20112012
FSW TIs
11
11
12
22
2M
SM TIs
11
11
14
44
4IDU TIs
--
--
--
--
-Com
p. TIs-
--
--
11
11
ICTCs-
--
818
2662
89119
Blood Banks5
57
78
98
99
STI clinics-
--
22
22
33
ART centres-
--
--
11
11
Link ART centres-
--
--
--
--
PLHIV Netw
orks1
11
11
11
11
Red Ribbon Clubs-
--
--
5050
--
Comm
. care centres-
--
-1
11
--
Drop-in-centres-
11
11
11
11
Condom outlets
--
--
--
--
-
VulnerabilitiesM
ale Migration, 2001 Census
Overall
Inter-State
Intra-state
Intra-district
No. out-
migration
13002211557
3691781548
% of m
ale pop.
6.850.61
1.954.30
% total
migration
1008.89
28.3962.72
Top 5 districts for inter-state out-migration
Thane, M
aharash-tra
Mum
bai (Subur-ban),
Maha-
rashtra
Pune, M
aharash-tra
Raigarh, M
aharash-tra
Jhabua, M
adhya Pradesh
HRG Size
FSWM
SMIDU
Size Est., (Mapping,
Year: 2008)2770
5894374
% Total HRG
30.6565.21
4.14
% Total Pop.
0.070.14
0.01
Program Target
NA
NA
NA
Program Coverage
--
-
Typology
Home
based-34.13%
;
Brothel based-
33.13%;
Street based-
32.74%
Kothi-66.67%
;
Panthi-N
A;
Double decker-33.33%
Daily Injectors-
NA;
Non daily
Injectors-N
A
% <
25 yrs.18.65
46.67-
% M
arried84.04
54.04-
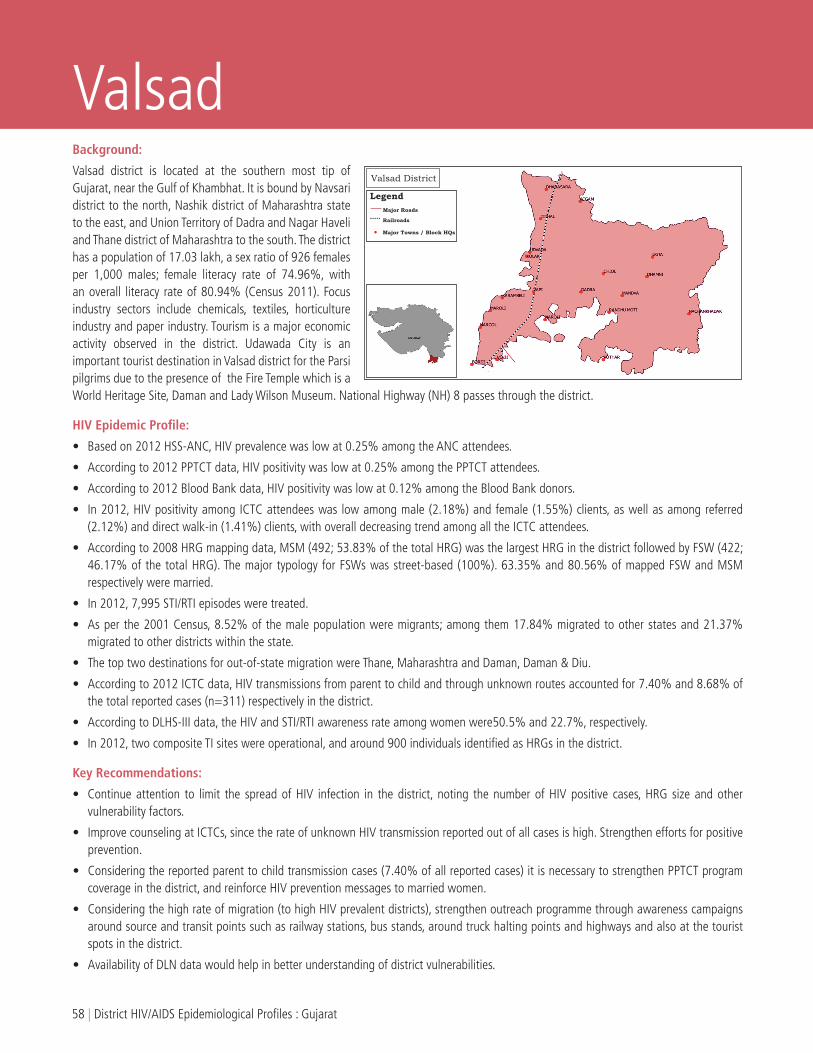
58 | District HIV/AIDS Epidemiological Profiles : Gujarat
ValsadBackground:
Valsad district is located at the southern most tip of Gujarat, near the Gulf of Khambhat. It is bound by Navsari district to the north, Nashik district of Maharashtra state to the east, and Union Territory of Dadra and Nagar Haveli and Thane district of Maharashtra to the south. The district has a population of 17.03 lakh, a sex ratio of 926 females per 1,000 males; female literacy rate of 74.96%, with an overall literacy rate of 80.94% (Census 2011). Focus industry sectors include chemicals, textiles, horticulture industry and paper industry. Tourism is a major economic activity observed in the district. Udawada City is an important tourist destination in Valsad district for the Parsi pilgrims due to the presence of the Fire Temple which is a World Heritage Site, Daman and Lady Wilson Museum. National Highway (NH) 8 passes through the district.
HIV Epidemic Profile:
• Basedon2012HSS-ANC,HIVprevalencewaslowat0.25%amongtheANCattendees.
• Accordingto2012PPTCTdata,HIVpositivitywaslowat0.25%amongthePPTCTattendees.
• Accordingto2012BloodBankdata,HIVpositivitywaslowat0.12%amongtheBloodBankdonors.
• In2012,HIVpositivityamongICTCattendeeswas lowamongmale(2.18%)andfemale(1.55%)clients,aswellasamongreferred(2.12%) and direct walk-in (1.41%) clients, with overall decreasing trend among all the ICTC attendees.
• Accordingto2008HRGmappingdata,MSM(492;53.83%ofthetotalHRG)wasthelargestHRGinthedistrictfollowedbyFSW(422;46.17% of the total HRG). The major typology for FSWs was street-based (100%). 63.35% and 80.56% of mapped FSW and MSM respectively were married.
• In2012,7,995STI/RTIepisodesweretreated.
• Asperthe2001Census,8.52%ofthemalepopulationweremigrants;amongthem17.84%migratedtootherstatesand21.37%migrated to other districts within the state.
• Thetoptwodestinationsforout-of-statemigrationwereThane,MaharashtraandDaman,Daman&Diu.
• Accordingto2012ICTCdata,HIVtransmissionsfromparenttochildandthroughunknownroutesaccountedfor7.40%and8.68%ofthe total reported cases (n=311) respectively in the district.
• AccordingtoDLHS-IIIdata,theHIVandSTI/RTIawarenessrateamongwomenwere50.5%and22.7%,respectively.
• In2012,twocompositeTIsiteswereoperational,andaround900individualsidentifiedasHRGsinthedistrict.
Key Recommendations:
• Continueattention to limit the spreadofHIV infection in thedistrict, noting thenumberofHIVpositive cases,HRGsizeandothervulnerability factors.
• ImprovecounselingatICTCs,sincetherateofunknownHIVtransmissionreportedoutofallcasesishigh.Strengtheneffortsforpositiveprevention.
• Consideringthereportedparenttochildtransmissioncases(7.40%ofallreportedcases)itisnecessarytostrengthenPPTCTprogramcoverage in the district, and reinforce HIV prevention messages to married women.
• Consideringthehighrateofmigration(tohighHIVprevalentdistricts),strengthenoutreachprogrammethroughawarenesscampaignsaround source and transit points such as railway stations, bus stands, around truck halting points and highways and also at the tourist spots in the district.
• AvailabilityofDLNdatawouldhelpinbetterunderstandingofdistrictvulnerabilities.
Valsad District

District HIV/AIDS Epidemiological Profiles : Gujarat | 59
ValsadDistrict Population: 17,03,068 (2.82%
of Gujarat Population); Fem
ale Literacy1: 74.96%
; ANC Utilization
2: 47%
2005
20062007
20082009
20102011
2012
HSS-ANC
PP4
-0
0.500.76
00.25
NT
4-
400400
397399
399
PPTCTPP
-*
0.540.31
0.330.16
0.220.25
NT
-*
11096522
88089589
817710010
Blood BankPP
1.100.45
0.280.21
0.120.12
00.12
NT
1925520017
2226821654
2803330388
3126821624
HSS-STDPP
--
--
--
NT
--
--
--
HSS-FSWPP
--
--
--
NT
--
--
--
HSS-MSM
PP-
--
--
-N
T-
--
--
-
HSS-IDUPP
--
--
--
NT
--
--
--
ICTC Male
PP-
--
5.773.33
1.965.73
2.18N
T-
--
36044325
86579657
8956
ICTC Female
PP-
--
5.952.66
1.510.81
1.55N
T-
--
21342854
62756445
7505
ICTC ReferredPP
--
-5.22
2.911.78
5.252.12
NT
--
-4369
51828000
934811124
ICTC Direct W
alk-inPP
--
-7.82
3.461.77
1.691.41
NT
--
-1369
19976932
67545337
Total tested at ICTCs
5 N
T-
4381109
1226015987
2452124279
26471
PLHIV Profile, 2012
% O
n ART%
15-24 yrs%
Ill., Prim. Edu.
% M
arried%
Widow
ed or Divorced
ART (1454)54
1621
205
DLN (N
A)-
--
--
Block-Level Details
No. HRG
-FSW-
- -
- -
- -
- -
No. HRG
-MSM
- -
- -
- -
- -
-
No. HRG
- IDU-
- -
- -
- -
- -
% Pos;
ICTCValsad, 7.41
Pardi, 9.04
Umargam
, 4.69
Dharam-
pur, 3.42
Kaparada, 4.16
Other,
5.26-
- -
% Pos;
PPTCT-
- -
- -
- -
- -
Route of HIV Transm
ission, ICTC 2012
Hetero-sexualHom
o-sexualBlood
TransfusionN
eedle/ Syringe
Parent to Child
Unknown
% of Total
(N=
311)79.74
2.571.61
07.40
8.68
HIV Levels and Trends
3
* Inadequate sample size; - Data not available; 1 2011 Census; 2 Source: DLHS III; 3 Data presented only for years w
here sample size is valid (HSS-AN
C ≥ 300, HSS-HRG/STD ≥ 187, ICTC ≥ 600, PPTCT ≥ 900 and BB ≥ 900); 4 PP =
percent positive, N
T = num
ber tested; 5 General clients & pregnant w
omen.
STI/RTI2009
20102011
2012
No. episodes treated
1120014712
200657995
% Syphilis positivity
-0.05
0.070
Programm
e ResponseN
o.2004
20052006
20072008
20092010
20112012
FSW TIs
--
--
--
--
-M
SM TIs
--
--
--
--
-IDU TIs
--
--
--
--
-Com
p. TIs-
--
--
22
22
ICTCs-
--
57
721
2121
Blood Banks4
45
55
65
55
STI clinics-
--
11
11
11
ART centres-
--
--
--
11
Link ART centres-
--
--
11
11
PLHIV Netw
orks-
--
-1
11
11
Red Ribbon Clubs-
--
--
--
99
Comm
. care centres-
--
--
--
--
Drop-in-centres-
--
--
--
--
Condom O
utlets-
--
--
--
--
VulnerabilitiesM
ale Migration, 2001 Census
Overall
Inter-State
Intra-state
Intra-district
No. out-
migration
6259411164
1337638054
% of m
ale pop.
8.521.52
1.825.18
% total
migration
10017.84
21.3760.79
Top 5 districts for inter-state out-migration
Thane, M
aharash-tra
Daman,
Daman &
Diu
Dadra & N
agar Haveli,
Dadra & N
agar Haveli
Mum
bai, M
aharash-tra
Mum
bai (Suburban), M
aharash-tra
HRG Size
FSWM
SMIDU
Size Est., (Mapping,
Year: 2008)422
492-
% Total HRG
46.1753.83
-
% Total Pop.
0.020.03
-
Program Target
NA
NA
NA
Program Coverage
--
-
Typology
Home
based-0%
;
Brothel based-0%
;
Street based-100%
Kothi-84.3%
;
Panthi-N
A;
Double decker-15.7%
Daily Injectors-
NA;
Non daily
Injectors-N
A
% <
25 yrs.10.42
29.85-
% M
arried80.56
63.35-


India’s voice against AIDS Ministry of Health & Family Welfare, Government of India
6th & 9th Floors, Chandralok Building, 36, Janpath, New Delhi - 110001www.naco.gov.in
National AIDS Control Organisation
The National AIDS Control Programme has a strong focus on district level planning, implementation and monitoring of interventions for prevention and control of HIV. The Programme is generating a rich evidence base on HIV/AIDS through a robust and expanded HIV Sentinel Surveillance system, monthly reporting from programme units, mapping and size estimations, behavioural surveys as well as several studies, research projects and evaluations.
In this context of increased availability of data and the requirement of decentralized planning at the district level, a project titled “Epidemiological Profiling of HIV/AIDS Situation at district and Sub-district Level using Data Triangulation” was undertaken by the National AIDS Control Organisation in 25 states (539 districts). The objective of this exercise was to develop district HIV/ AIDS epidemic profiles, by consolidating all the available information for a district at one place and drawing meaningful inferences using Data Triangulation approaches.
This technical document is an outcome of the data triangulation process and consists of a snapshot on the district background, and on the HIV epidemic profile of each district based on the available updated information, thereby giving an overview of the HIV epidemic scenario in each of the districts of the State.
This document would be useful for the HIV programme managers and policy makers at all levels to help in decision making, as well as for researchers and academicians as a quick reference guide to the HIV/AIDS situation in the districts.