Nigeria : epidemiological fact sheets on HIV/AIDS ... - UNAIDS
20
2004 Update Nigeria
-
Upload
khangminh22 -
Category
Documents
-
view
0 -
download
0
Transcript of Nigeria : epidemiological fact sheets on HIV/AIDS ... - UNAIDS

2004 Update
Nigeria
2 NigeriaPage -
UNAIDS/WHO Epidemiological Fact Sheet - 2004 Update
Adults (15-49)
HIV/AIDS estimatesIn 2003 and during the first quarter of 2004, UNAIDS and WHO worked closely with national governments and research institutions to recalculate current estimates on people living with HIV/AIDS. These calculations are based on the previously published estimates for 1999 and 2001 and recent trends in HIV/AIDS surveillance in various populations. A methodology developed in collaboration with an international group of experts was used to calculate the new estimates on prevalence and incidence of HIV and AIDS deaths, as well as the number of children infected through mother-to-child transmission of HIV. Different approaches were used to estimate HIV prevalence in countries with low-level, concentrated or generalised epidemics. The current estimates do not claim to be an exact count of infections. Rather, they use a methodology that has thus far proved accurate in producing estimates that give a good indication of the magnitude of the epidemic in individual countries. However, these estimates are constantly being revised as countries improve their surveillance systems and collect more information. Adults in this report are defined as women and men aged 15 to 49. This age range covers people in their most sexually active years. While the risk of HIV infection obviously continues beyond the age of 50, the vast majority of those who engage in substantial risk behaviours are likely to be infected by this age. The 15 to 49 range was used as the denominator in calculating adult HIV prevalence.
UNAIDS/WHO Working Group on Global HIV/AIDS and STI Surveillance
Global Surveillance of HIV/AIDS and sexually transmitted infections (STIs) is a joint effort of WHO and UNAIDS. The UNAIDS/WHO Working Group on Global HIV/AIDS and STI Surveillance, initiated in November 1996, guides respective activities. The primary objective of the Working Group is to strengthen national, regional and global structures and networks for improved monitoring and surveillance of HIV/AIDS and STIs. For this purpose, the Working Group collaborates closely with national AIDS programmes and a number of national and international experts and institutions. The goal of this collaboration is to compile the best information available and to improve the quality of data needed for informed decision-making and planning at national, regional, and global levels. The Epidemiological Fact Sheets are one of the products of this close and fruitful collaboration across the globe. Within this framework, the Fact Sheets collate the most recent country-specific data on HIV/AIDS prevalence and incidence, together with information on behaviours (e.g. casual sex and condom use) which can spur or stem the transmission of HIV. Not unexpectedly, information on all of the agreed upon indicators was not available for many countries in 2003. However, these updated Fact Sheets do contain a wealth of information which allows identification of strengths in currently existing programmes and comparisons between countries and regions. The Fact Sheets may also be instrumental in identifying potential partners when planning and implementing improved surveillance systems. The fact sheets can be only as good as information made available to the UNAIDS/WHO Working Group on Global HIV/AIDS and STI Surveillance. Therefore, the Working Group would like to encourage all programme managers as well as national and international experts to communicate additional information to them whenever such information becomes available. The Working Group also welcomes any suggestions for additional indicators or information proven to be useful in national or international decision-making and planning.
Estimated number of adults and children living with HIV/AIDS, end of 2003
These estimates include all people with HIV infection, whether or not they have developed symptoms of AIDS, alive at the end of 2003:
Adults and children
Women (15-49)
Children (0-15)
3,600,000
3,300,000
1,900,000
290,000
Adult rate (%) 5.4
Estimated number of deaths due to AIDS
Estimated number of adults and children who died of AIDS during 2003:
Deaths in 2003 310,000
Estimated number of orphans
Current living orphans 1,800,000
Assessment of the epidemiological situation 2004
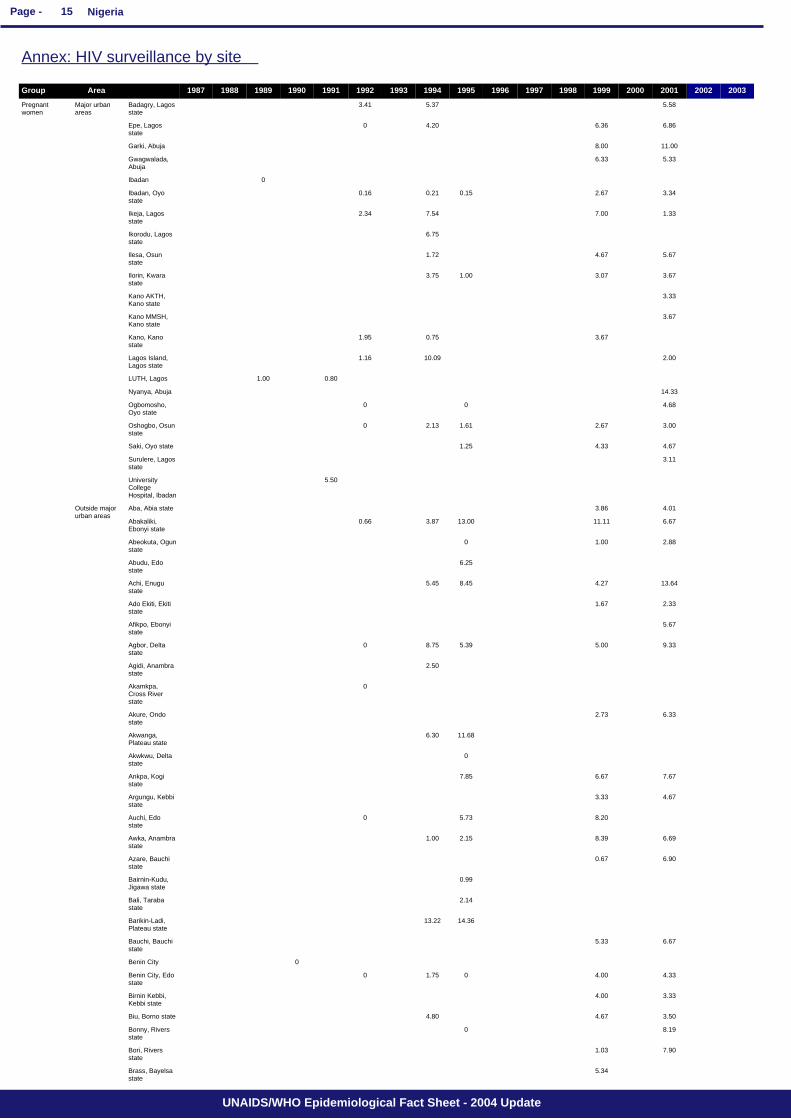
HIV seroprevalence information among antenatal clinic (ANC) attendees is available since the mid-1980s from Nigeria. However, reporting from more than one or two sites per year did not begin until 1992. By 1993-1994 ten major urban sites reported HIV prevalence among ANC women. By 1988-1990, 1 percent of ANC women tested in Lagos were HIV positive. Among sites in major urban areas, median HIV prevalence reached 4 percent by 1993-1994 and stayed at that level in 1999 and 2001. Prevalence among 16 sites in 2001 ranged from 1 percent in Lagos (Ikeja) to 14 percent in Abuja (Nyanya). By 1991-1992, 20 sites from ten states outside of the major urban areas reported HIV prevalence from sentinel surveillance of antenatal women. The number of sites increased to 69 sites in 2001 and then to 125 in 2003. Median HIV prevalence among ANC women tested at these sites increased from less than 1 percent in 1991-1992 to 4.6 percent in 2003. Prevalence among 125 sites in 2003 ranged from no evidence of infection in 10 sites to over 10 percent in 12 sites with 17 percent HIV prevalence in antenatal women tested in Badagry, Lagos. HIV prevalence among 15-24 year old women was 5.7 in 1999, 5.9 in 2001 and 5.4 in 2003. Testing of sex workers in Lagos began in 1988-1989. Two percent of sex workers tested at that time were HIV positive and increased to 15 percent in 1993. Median HIV prevalence among 7 sites in 1994 and 3 sites in 1995 was 29 percent and 33 percent, respectively. In 1996, 31 percent of sex workers tested in Lagos were HIV positive. In 1986-1987, less than 1 percent of sex workers tested in Maiduguri in Borno State were HIV positive; by 1989-1990, 4 percent of sex workers tested HIV positive. In 1992, 14 sites outside of the major urban centers were reporting information on HIV prevalence among sex workers. At that time, a median of 11.5 percent of sex workers tested were HIV positive. The prevalence among these sites ranged from no evidence of HIV infection to 52 percent of sex workers tested. By 1995, median prevalence among 17 sites was 24 percent. Prevalence ranged from no evidence of infection to 68 percent of sex workers tested. In 1996, median HIV prevalence was 55 percent for 2 sites. In major urban areas from 1992 to 1995, median HIV prevalence among STD clinic patients tested ranged from 1 percent to 6 percent. Median HIV prevalence from 22 sites outside of the major urban areas was 7 percent in 1993-1994. From 20 sites in 1995, median HIV prevalence was 12.5 percent among STD clinic patients tested. HIV prevalence ranged from 1 percent to 70 percent of STD clinic patients tested in 1995. In 2000, 11 percent of soldiers tested in an unspecified area were HIV positive. In 1993-1994, 4 percent of long distance truck drivers tested in Anambra State were HIV positive.
Low estimateHigh estimate
170,000500,000
Low estimateHigh estimate
1,200,0002,600,000
Estimated number of children who have lost their mother or father or both parents to AIDS and who were alive and under age 17 at the end of 2003:
Low estimateHigh estimate
200,000490,000
Low estimateHigh estimate
2,400,005,400,000
Low estimateHigh estimate
2,200,0004,900,000
Low estimateHigh estimate
1,200,0002,700,000
Low estimateHigh estimate
3.68.0

3 NigeriaPage -
UNAIDS/WHO Epidemiological Fact Sheet - 2004 Update
DEMOGRAPHIC DATA YEAR ESTIMATE
Basic indicators
Total population (thousands)
Average annual growth rate of urban population
Female population aged 15-24 (thousands)
Population aged 15-49 (thousands)
Annual population growth rate (%)
% of population in urban areas
Crude birth rate (births per 1,000 pop.)
Crude death rate (deaths per 1,000 pop.)
Maternal mortality rate (per 100,000 live births)
Life expectancy at birth (years)
Total fertility rate
Infant mortality rate (per 1,000 live births)
Under 5 mortality rate (per 1,000 live births)
SOURCE
2004
2004
2004
1992-2002
2003
2000-2005
2004
SOCIO-ECONOMIC DATA YEAR ESTIMATE SOURCE
2004
2000
2002
2002
2000
2000
127,117
12,810
58,559
2.8
46.2
4.4
38.3
13.7
800
48.8
5.5
103
183
UN population division database
UN population division database
UN population division database
UN population division database
UN population division database
UN population division database
UN population division database
UN population division database
WHO (WHR2004)/UNICEF
World Health Report 2004, WHO
World Health Report 2004, WHO
World Health Report 2004, WHO
World Health Report 2004, WHO
Gross national income, ppp, per capita (Int.$)
Gross domestic product, per capita % growth
Per capita total expenditure on health (Int.$)
General government expenditure on health as % of total expenditure on health
Total adult illiteracy rate
Adult male illiteracy rate
Adult female illiteracy rate
Gross primary school enrolment ratio, male
Gross primary school enrolment ratio, female
Gross secondary school enrolment ratio, male
Gross secondary school enrolment ratio, female
Contact address
UNAIDS/WHO Working Group on Global HIV/AIDS and STI Surveillance 20, Avenue Appia CH - 1211 Geneva 27 Switzerland Fax: +41-22-791-4834
email: [email protected] or [email protected]
2002
2001-2002
2001
2001 23.2 World Health Report 2004, WHO
2000 36 UNESCO
2000 27.8 UNESCO
2000 43.9 UNESCO
2000/2001 not available UNESCO
2000/2001 not available UNESCO
2000/2001 not available UNESCO
2000/2001 not available UNESCO
780 World Bank
-3.1 World Bank
31 World Health Report 2004, WHO
Extracts of the information contained in these fact sheets may be reviewed, reproduced or translated for research or private study but not for sale or for use in conjunction with commercial purposes. Any use of information in these fact sheets should be accompanied by the following acknowledgment "UNAIDS/WHO epidemiological fact sheets on HIV/AIDS and Sexually Transmitted Infections, 2004 Update".
For consistency reasons the data used in the table below are taken from official UN publications.
http://www.who.int/hiv
http://www.unaids.org
website:

4 NigeriaPage -
UNAIDS/WHO Epidemiological Fact Sheet - 2004 Update
HIV prevalence in different populations
This section contains information about HIV prevalence in different populations. The data reported in the tables below are mainly based on the HIV database maintained by the United States Bureau of the Census where data from different sources, including national reports, scientific publications and international conferences are compiled. To provide a simple overview of the current situation and trends over time, summary data are given by population group, geographical area (Major Urban Areas versus Outside Major Urban Areas), and year of survey. Studies conducted in the same year are aggregated and the median prevalence rates (in percentages) are given for each of the categories. The maximum and minimum prevalence rates observed, as well as the total number of surveys/sentinel sites, are provided with the median, to give an overview of the diversity of HIV-prevalence results in a given population within the country. Data by sentinel site or specific study from which the medians were calculated are printed at the end of this fact sheet. The differentiation between the two geographical areas Major Urban Areas and Outside Major Urban Areas is not based on strict criteria, such as the number of inhabitants. For most countries, Major Urban Areas were considered to be the capital city and - where applicable - other metropolitan areas with similar socio-economic patterns. The term Outside Major Urban Areas considers that most sentinel sites are not located in strictly rural areas, even if they are located in somewhat rural districts.
HIV sentinel surveillance*
35.1016.5039.2425.005.45
23.1014.749.093.521.08
9.3012.9901.000
9.002.0023.0018.009.00
20.807.3720.0014.290.902.002.60
12.403.755.002.300.902.002.60
4.200000.902.002.60
3.003.005.006.001.001.001.00
23.0069.7431.3022.421.681.280.49
13.6512.437.001.741.681.280.49
5.601.14001.681.280.49
8.0020.0021.0011.001.001.001.00
9.503.038.916.1514.93
8.352.075.006.150.67
7.201.122.006.150
2.002.006.001.003.00
60.6067.7457.8951.794.2601.970.52
54.7020.5021.3412.004.2601.230.37
48.806.78004.2600.490.21
2.0014.0016.0013.001.001.002.002.00
30.5081.7346.0015.309.941.71
30.5081.7322.3515.309.941.71
30.5081.739.8915.309.941.71
1.001.006.001.001.001.00
15.0021.0076.6713.220.875.771.800.1601.690
5.224.332.422.900.870.501.800.0801.690
1.080.54000.8701.80001.690
70.0063.0052.0033.001.0021.001.002.001.001.001.00
14.338.001.6110.093.415.501.00
4.174.501.003.980.663.150.50
1.332.6700.2100.800
16.0010.005.0010.008.002.002.00
Maximum
Median
Minimum
N-Sites
Maximum
Median
Minimum
N-Sites
Maximum
Median
Minimum
N-Sites
Maximum
Median
Minimum
N-Sites
Maximum
Median
Minimum
N-Sites
Maximum
Median
Minimum
N-Sites
Maximum
Median
Minimum
N-Sites
Maximum
Median
Minimum
N-Sites
Outside major urban areas
Major urban areas
Outside major urban areas
Major urban areas
Outside major urban areas
Major urban areas
Outside major urban areas
Major urban areas
Tuberculosis patients
Men having sex with men
STI patients
Injecting drug users
Sex workers
Pregnant women
20032002200120001999199819971996199519941993199219911990198919881987Group Area
*Detailed data by site can be found in the Annex.
5 NigeriaPage -
UNAIDS/WHO Epidemiological Fact Sheet - 2004 Update
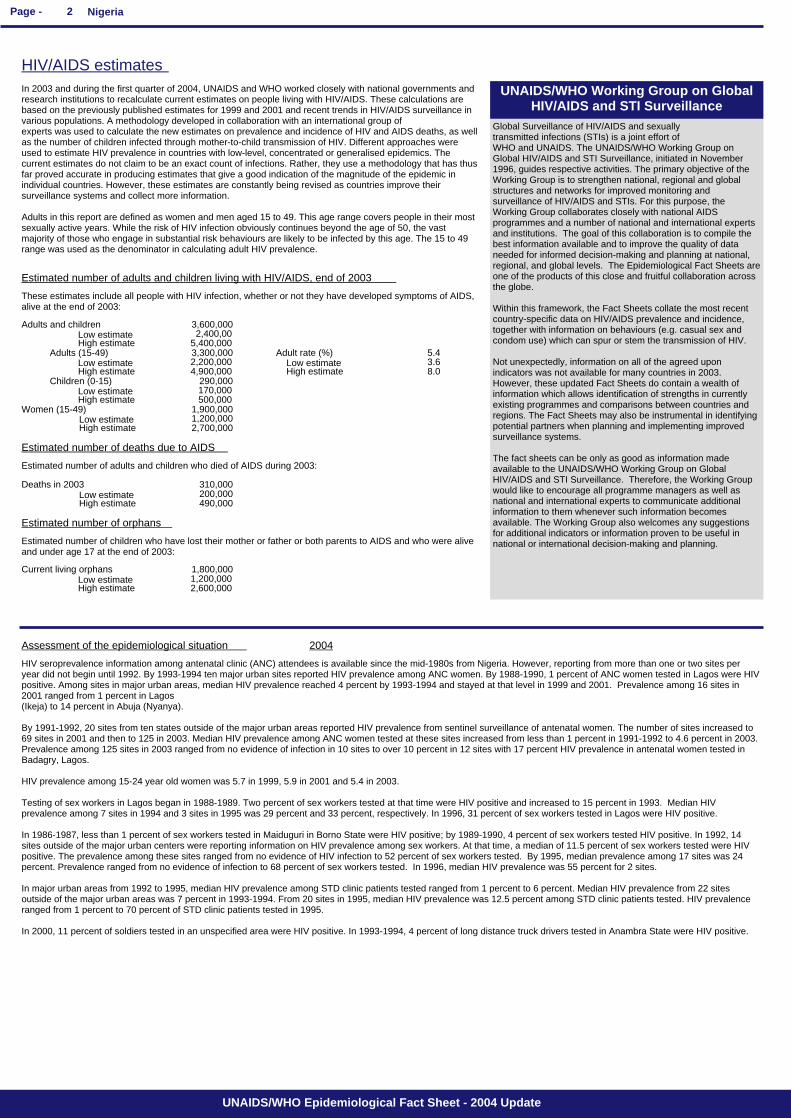
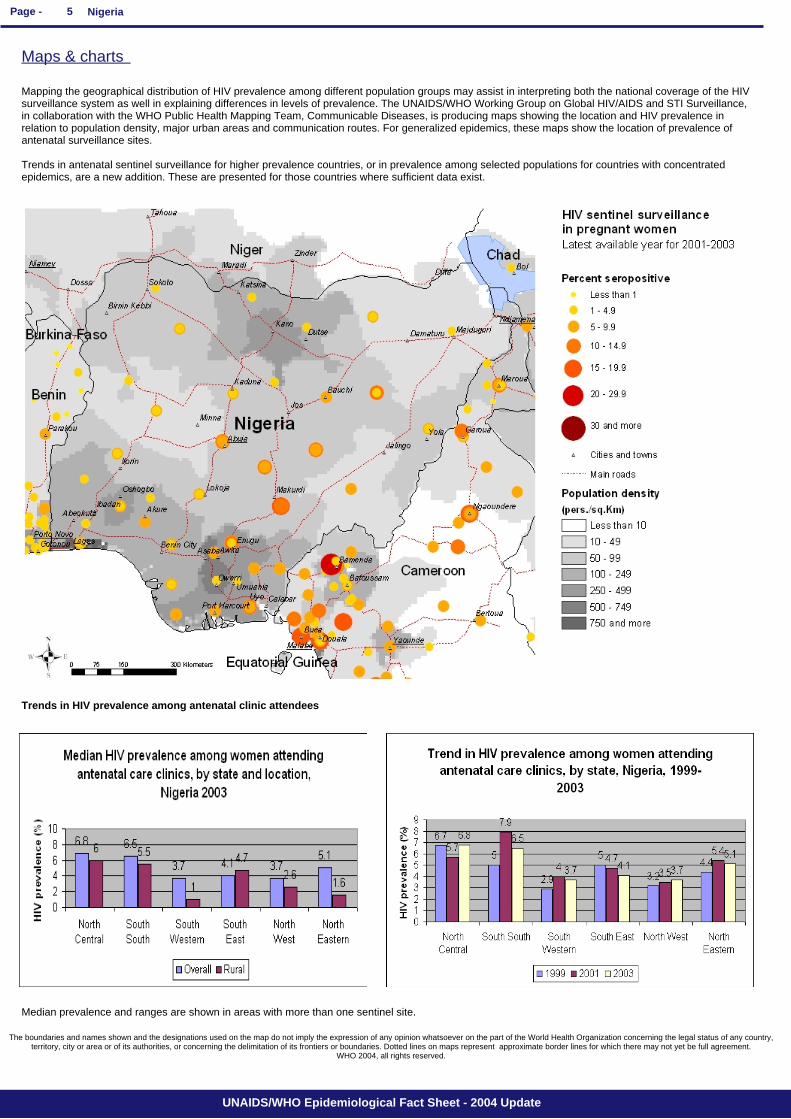
Mapping the geographical distribution of HIV prevalence among different population groups may assist in interpreting both the national coverage of the HIV surveillance system as well in explaining differences in levels of prevalence. The UNAIDS/WHO Working Group on Global HIV/AIDS and STI Surveillance, in collaboration with the WHO Public Health Mapping Team, Communicable Diseases, is producing maps showing the location and HIV prevalence in relation to population density, major urban areas and communication routes. For generalized epidemics, these maps show the location of prevalence of antenatal surveillance sites. Trends in antenatal sentinel surveillance for higher prevalence countries, or in prevalence among selected populations for countries with concentrated epidemics, are a new addition. These are presented for those countries where sufficient data exist.
The boundaries and names shown and the designations used on the map do not imply the expression of any opinion whatsoever on the part of the World Health Organization concerning the legal status of any country, territory, city or area or of its authorities, or concerning the delimitation of its frontiers or boundaries. Dotted lines on maps represent approximate border lines for which there may not yet be full agreement.
WHO 2004, all rights reserved.
Trends in HIV prevalence among antenatal clinic attendees
Maps & charts
Median prevalence and ranges are shown in areas with more than one sentinel site.

6 NigeriaPage -
UNAIDS/WHO Epidemiological Fact Sheet - 2004 Update
Following WHO and UNAIDS recommendations, AIDS case reporting is carried out in most countries. Data from individual AIDS cases are aggregated at the national level and sent to WHO. However, case reports come from surveillance systems of varying quality. Reporting rates vary substantially from country to country and low reporting rates are common in developing countries due to weaknesses in the health care and epidemiological systems. In addition, countries use different AIDS case definitions. A main disadvantage of AIDS case reporting is that it only provides information on transmission patterns and levels of infection approximately 5-10 years in the past, limiting its usefulness for monitoring recent HIV infections. Despite these caveats, AIDS case reporting remains an important advocacy tool and is useful in estimating the burden of HIV-related morbidity as well as for short-term planning of health care services. AIDS case reports also provide information on the demographic and geographic characteristics of the affected population and on the relative importance of the various exposure risks. In some situations, AIDS reports can be used to estimate earlier HIV infection patterns using back-calculation. AIDS case reports and AIDS deaths have been dramatically reduced in industrialized countries with the introduction of Anti-Retroviral Therapy (ART).
Reported AIDS cases
1987 1988 1989 1990 1991 1992 1993 1994 1995 1996 1997 1998
1999 2000 2001 2002 2003
1979 1980 1981 1982 1983 1984 1985 1986
Total UNK Date of last report
2 2 33 58 163 341 484 719 1114 2829 2980 3815 18490
16188 9715 3661 60564 11/22/2001
7 NigeriaPage -
UNAIDS/WHO Epidemiological Fact Sheet - 2004 Update
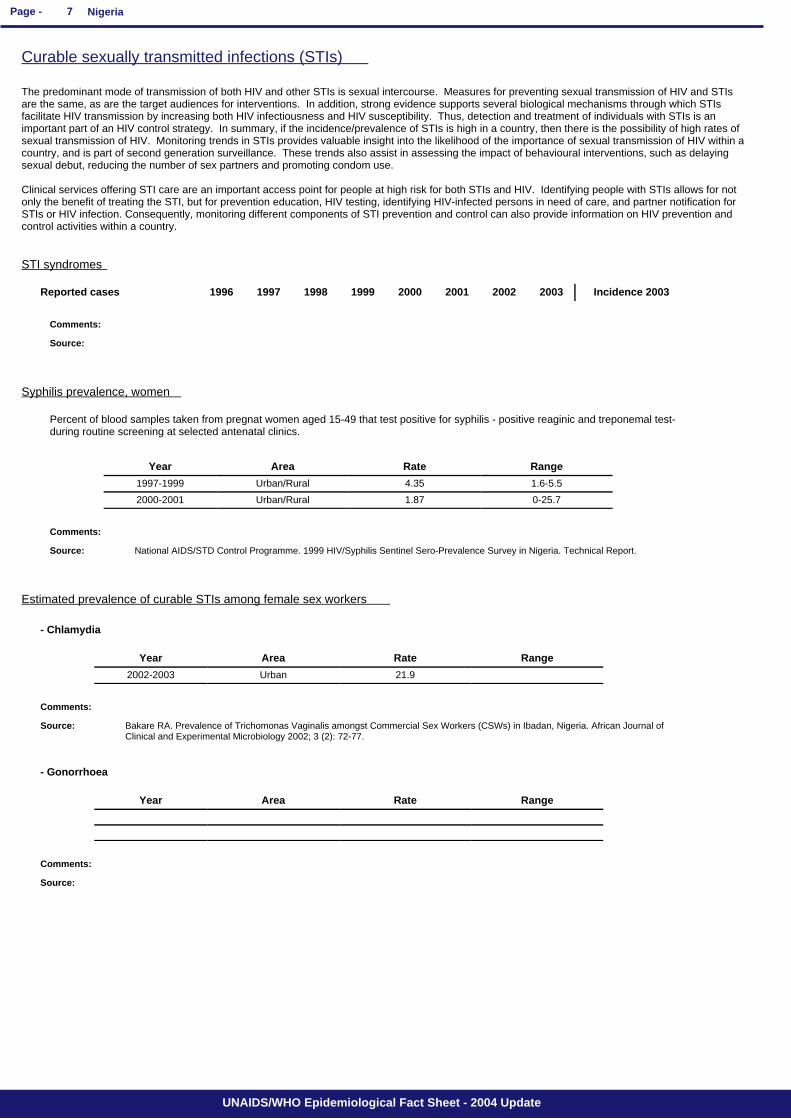
Curable sexually transmitted infections (STIs)
The predominant mode of transmission of both HIV and other STIs is sexual intercourse. Measures for preventing sexual transmission of HIV and STIs are the same, as are the target audiences for interventions. In addition, strong evidence supports several biological mechanisms through which STIs facilitate HIV transmission by increasing both HIV infectiousness and HIV susceptibility. Thus, detection and treatment of individuals with STIs is an important part of an HIV control strategy. In summary, if the incidence/prevalence of STIs is high in a country, then there is the possibility of high rates of sexual transmission of HIV. Monitoring trends in STIs provides valuable insight into the likelihood of the importance of sexual transmission of HIV within a country, and is part of second generation surveillance. These trends also assist in assessing the impact of behavioural interventions, such as delaying sexual debut, reducing the number of sex partners and promoting condom use. Clinical services offering STI care are an important access point for people at high risk for both STIs and HIV. Identifying people with STIs allows for not only the benefit of treating the STI, but for prevention education, HIV testing, identifying HIV-infected persons in need of care, and partner notification for STIs or HIV infection. Consequently, monitoring different components of STI prevention and control can also provide information on HIV prevention and control activities within a country.
STI syndromes
Source:
Syphilis prevalence, women
Estimated prevalence of curable STIs among female sex workers
- Chlamydia
- Gonorrhoea
Reported cases 1996 1997 1998 1999 2000 2001 2002 2003 Incidence 2003
Comments:
Percent of blood samples taken from pregnat women aged 15-49 that test positive for syphilis - positive reaginic and treponemal test- during routine screening at selected antenatal clinics.
2000-2001 Urban/Rural 1.87 0-25.7
1997-1999 Urban/Rural 4.35 1.6-5.5
Year Area Rate Range
Source: National AIDS/STD Control Programme. 1999 HIV/Syphilis Sentinel Sero-Prevalence Survey in Nigeria. Technical Report.
Comments:
2002-2003 Urban 21.9
Year Area Rate Range
Source: Bakare RA. Prevalence of Trichomonas Vaginalis amongst Commercial Sex Workers (CSWs) in Ibadan, Nigeria. African Journal of Clinical and Experimental Microbiology 2002; 3 (2): 72-77.
Comments:
Year Area Rate Range
Source:
Comments:
8 NigeriaPage -
UNAIDS/WHO Epidemiological Fact Sheet - 2004 Update
- Syphillis
Year Area Rate Range
Source:
Comments:
- Trichomoniasis
Year Area Rate Range
Source:
Comments:
Estimated prevalence of curable STIs among female sex workers (continued)

9 NigeriaPage -
UNAIDS/WHO Epidemiological Fact Sheet - 2004 Update
Health service and care indicators
HIV prevention strategies depend on the twin efforts of care and support for those living with HIV or AIDS, and targeted prevention for all people at risk or vulnerable to the infection. It is difficult to capture such a large range of activities with one or just a few indicators. However, a set of well-established health care indicators may help to identify general strengths and weaknesses of health systems. Specific indicators, such as access to testing and blood screening for HIV, help to measure the capacity of health services to respond to HIV/AIDS - related issues.
Access to health care
% of population with access to health services - total
% of 1-yr-old children fully immunized - DPT 2002 26 WHO/UNICEF
% of births attended by skilled health personnel 2000 41.6 WHO
% of ANC clinics where HIV testing is available
% of 1-yr-old children fully immunized - Measles 2001 40 WHO/UNICEF
Percentage of contraceptive users using condoms
% of population with access to health services - urban
% of population with access to health services - rural
Contraceptive prevalence rate (%) 1999 7.4 UNICEF/UNPOP
Indicators Year Estimate Source
Number of adults (15-49) with advanced HIV infection receiving ARV therapy as of June 2004
Source:
Number:
Adults on treatment
17,000
WHO
Estimated number of adults (15-49) in need of treatment in 2003
Source:
Number:
Adults needing treatment
520,000
WHO/UNAIDS
Coverage of HIV testing and counselling
Number of public and NGO services providing testing and counselling services.
Year Area N=
Source:
Comments:

10 NigeriaPage -
UNAIDS/WHO Epidemiological Fact Sheet - 2004 Update
Knowledge and behaviour
In most countries the HIV epidemic is driven by behaviours (e.g.: multiple sexual partners, injecting drug use) that expose individuals to the risk of infection. Information on knowledge and on the level and intensity of risk behaviour related to HIV/AIDS is essential in identifying populations most at risk for HIV infection and in better understanding the dynamics of the epidemic. It is also critical information in asssessing changes over time as a result of prevention efforts. One of the main goals of the 2nd generation HIV serveillance systems is the promotion of a standard set of indicators defined in the National Guide (Source: National AIDS Programmes, A Guide to Monitoring and Evaluation, UNAIDS/00.17) and regular behavioural surveys in order to monitor trends in behaviours and to target interventions. The indicators on knowledge and misconceptions are an important prerequisite for prevention programmes to focus on increasing people's knowledge about sexual transmission, and, to overcome the misconceptions that act as a disincentive to behaviour change. Indicators on sexual behaviour and the promotion of safer sexual behaviour are at the core of AIDS programmes, particulary with youg people who are not yet sexually active or are embarking on their sexual lives, and who are more amenable to behavioural change than adults. Finally, higher risk male-male sex reports on unprotected anal intercourse, the highest risk behaviour for HIV among men who have sex with men.
Knowledge of HIV prevention methods
Prevention indicator: Percentage of young people 15-24 who both correctly identify two ways of preventing the sexual transmission of HIV and who reject three misconceptions about HIV transmission.
Year Male Female
Source:
Comments:
Reported condom use at last higher risk sex (young people 15-24)
Prevention indicator: Proportion of young people reporting the use of a condom during sex with a non-regular partner.
Year Male Female
Source:
Comments: For this indicator only data will be shown if they were collected after 1998.
Age-mixing in sexual partnerships among youg women
The proportion of young women who have had sex in the last 12 months with a partner who is 10 or more years older than themselves.
Year Area Age group Male Female All
Source:
Comments:
Reported non-regular sexual partnerships
Prevention indicator: Proportion of young people 15-24 having at least one sex partner other than a regular partner in the last 12 months.
Year Male Female
Source:
Comments:

11 NigeriaPage -
UNAIDS/WHO Epidemiological Fact Sheet - 2004 Update
Ever used a condom
Percentage of people who ever used a condom.
Year Area Age group Male Female All
Source:
Comments:
Adolescent pregnancy
Percentage of teenagers 15-19 who are mothers or pregnant with their first child.
Year Percentage
Source:
Comments:
Age at first sexual experience
Proportion of 15-19 year olds who have had sex before age 15.
1999 8 16
Year Male Female
Source: DHS
Comments:
Knowledge and behaviour (continued)
12 NigeriaPage -
UNAIDS/WHO Epidemiological Fact Sheet - 2004 Update
Prevention indicators
Male and female condoms are the only technology available that can prevent sexual transmission of HIV and other STIs. Persons exposing themselves to the risk of sexual transmission of HIV should have consistent access to high quality condoms. AIDS Programs implement activities to increase both availability of and access to condoms. Thes activities should be monitored and have resources directed to problem aresas. The indicator below highlights the availability of condoms. However, even if condoms are widely available, this does not mean that individuals can or do acess them.
Condom availability nationwide
Total number of condoms available for distribution nationwide during the preceding 12 months, divided by the total population aged 15-49.
Source:
Comments:
Year N Rate
Prevention of mother-to-child transmission (MTCT) nationwide
Percentage of women who were counselled during antenatal care for their most recent pregnancy, accepted an offer of testing and received their test results, of all women who were pregnant at any time in the preceding two years.
Year N Rate
Comments:
Source:
Blood safety programs aim to ensure that the majority of blood units are screened for HIV and other infectious agents. This indicator gives an idea of the overall percentage of blood units that have been screened to high enough standards that they can confidently be declared free of HIV.
Screening of blood transfusions nationwide
Percentage of blood units transfused in the last 12 months that have been adequately screened for HIV according to national or WHO guidelines.
Year N Rate
Comments:
Source:

13 NigeriaPage -
UNAIDS/WHO Epidemiological Fact Sheet - 2004 Update
Sources
Data presented in this Epidemiological Fact Sheet come from several sources, including global, regional and country reports, published documents and articles, posters and presentations at international conferences, and estimates produced by UNAIDS, WHO and other United Nations agencies. This section contains a list of the more relevant sources used for the preparation of the Fact Sheet. Where available, it also lists selected national Web sites where additional information on HIV/AIDS and STI are presented and regularly updated. However, UNAIDS and WHO do not warrant that the information in these sites is complete and correct and shall not be liable whatsoever for any damages incurred as a result of their use.
National AIDS/HIV/STD Control Programme 1995 1993/94 Sentinel Sero-Prevalence Surveillance Report National AIDS/HIV/STD Control Programme, Federal Ministry of Health and Social Services, unpublished report.
National AIDS/STD Control Programme 1997 Report of 1995/96 HIV Sentinel Sero-Surveillance in Nigeria National AIDS/STD Control Programme, Federal Ministry of Health, unpublished report.
National AIDS and STD Control Programme 2001 The 2001 National HIV/Syphilis Sentinel Survey among Pregnant Women Attending Ante-natal Clinics in Nigeria National AIDS/STDs Control Programme, The Federal Ministry of Health; Department of Public Health, December, Technical report.
Ilori, O., C. M. Awolaru, G. K. Macaulay, et al. 1994 STD and HIV among Patients at a Public Health Lab Tenth International Conference on AIDS, Yokohama, Japan, 8/7-12, Poster P.C.0565.
Johns Hopkins University 1986 AIDS -- A Public Health Crisis Population Information Program, Population Reports, Issues in World Health, July-Aug., Series L, no. 6, pp. 194-228.
Nnatu, S. N., C. E. Anyiwo, C. L. Obi, et al. 1993 Prevalence of Human Immunodeficiency Virus (HIV) Antibody among Apparently Healthy Pregnant Women in Nigeria International Journal of Gynecology and Obstetrics, vol. 40, no. 2, pp. 105-107.
Offor, E., I. Osunde, M. Phillips 1993 HIV Seroprevalence in Women of Childbearing Age in Benin City, Nigeria (Unlinked Anonymous Testing Versus Voluntary Testing) IX International Conference on AIDS, Berlin, 6/6-11, Poster PO-C29-3259.
Onipede, A. O., O. Idigbe, A. K. Ako-Nai, et al. 1999 Sero-Prevalence of HIV Antibodies in Tuberculosis Patients in Ile-Ife, Nigeria East African Medical Journal, vol. 76, no. 3, pp. 127-132.
Olaleye, O. D., L. Bernstein, C. C. Ekweozor, et al. 1993 Prevalence of Human Immunodeficiency Virus Types 1 and 2 Infections in Nigeria Journal of Infectious Diseases, vol. 167, no. 3, pp. 710-714.
Obi, C. L., B. A. Ogbonna, E. O. Igumbor, et al. 1993 HIV Seropositivity among Female Prostitutes and Nonprostitutes: Obstetric and Perinatal Implications Viral Immunology, vol. 6, no. 3, pp. 171-174.
Olaleye, D. O., C. C. Ekweozor, Z. Sheng, et al. 1995 Evidence of Serological Cross-Reactivities with Human Immunodeficiency Virus Types 1 and 2 and Human T-Lymphotropic Virus . .. International Journal of Epidemiology, vol. 24, no. 1, pp. 198-203.
Asagba, A. O., J. J. Andy, T. Ayele, et al. 1992 HIV Sentinel Surveillance in Nigeria Nigeria Bulletin of Epidemiology, vol. 2, no. 2, pp. 10-13.
Adebajo, A. O., D. J. Smith, B. L. Hazleman, et al. 1994 Seroepidemiological Associations between Tuberculosis, Malaria, Hepatitis B, and AIDS in West Africa Journal of Medical Virology, vol. 42, pp. 366-368.
Asamoah-Odei, E., N. Ogundiran, N. Sani Gwaro, et al. 1999 HIV/Syphilis Sentinel Sero-Prevalence Survey in Nigeria National AIDS/STD Control Programme, Federal Ministry of Health, November, technical report.
Akinsete, I., A. Nasidi, S. A. Egbewunmi, et al. 1989 Seroprevalence of HIV-Infection in Various Groups Tested at the Lagos University Teaching Hospital, Lagos, Nigeria, between ... IV Internat. Conf.: AIDS and Assoc. Cancers in Africa, Marseille, Oct. 18-20, Poster 400.
Akinsete, I., O. S. Ayelari, Y. Olurinde, et al. 1991 The Pattern of HIV-Infection at the Lagos University Teaching Hospital (Luth) Lagos, Nigeria. From January 1988 - Dec. 1990 VII International Conference on AIDS, Florence, Italy, 6/16-20, Abstract M.C.3306.
Akinsete, I., R. N. Okwudiafor, E. O. Bamidele 1992 Seroprevalence of HIV Infection in Patients with Pulmonary Tuberculosis in 3 Hospitals in Lagos, Nigeria VII International Conference on AIDS in Africa, Yaounde, Cameroon, 12/8-11, Abstract W.P.050.
Chikwem, J. O., I. Mohammed, T. Oyebode-Ola, et al. 1988 Prevalence of Human Immunodeficiency Virus (HIV) Infection in Borno State of Nigeria East African Medical Journal, vol. 65, no. 5, pp. 342-346.
Harry, T. O., W. Gashau, O. Ekenna, et al. 1990 Growing Threat of HIV Infection in a Low Prevalence Area V International Conference: AIDS in Africa, Kinshasa, Zaire, Oct. 10-12, Poster T.P.E.21.
Harry, T. O., O. Kyari, I. Mohammed 1992 Prevalence of Human Immunodeficiency Virus-Infection among Pregnant Women Attending Ante-Natal Clinic in Maiduguri, North . .. Tropical and Geographical Medicine, vol. 44, pp. 238-241.
Harry, T. O., D. N. Bukbuk, A. Idrisa, et al. 1993 HIV Infection among Pregnant Women: A Worsening Situation in Maiduguri, Nigeria IX International Conference on AIDS, Berlin, 6/6-11, Poster PO-C11-2862.
Chikwem, J. O., I. Mohammed, H. G. Bwala, et al. 1990 Human Immunodeficiency Virus (HIV) Infection in Patients Attending a Sexually Transmitted Diseases Clinic in Borno State of . .. Tropical and Geographical Medicine, vol. 42, pp. 17-22.
Esu-Williams, E., C. Mulanga-Kabeya, T. O. Harry, et al. 1997 Seroprevalences of HIV-1, HIV-2 and HIV-1 Group O in Nigeria: Evidence for a Growing Increase of HIV Infection Xth International Conference on AIDS and STD in Africa Abidjan, Cote d'Ivoire, 12/7-11, Poster A.908.
Gboun, M. 2002 HIV/Syphilis Seroprevalence in Nigeria: Results of the 2000 National Sentinel Surveillance Survey of Patients with STD and ... XIV International AIDS Conference, Barcelona, Spain, 7/7-12, Poster WePeC6152.

14 NigeriaPage -
UNAIDS/WHO Epidemiological Fact Sheet - 2004 Update
Williams, E. E., I. Mohammed, J. Chikwem, et al. 1989 HIV-2 Infection in High and Low Risk Populations in Nigeria IV Internat. Conf.: AIDS and Assoc. Cancers in Africa, Marseille, Oct. 18-20, Abstract 049.
Williams, E. E., N. Hearst, O. Udofia, et al. 1989 Sexual Practices and HIV, Infection of Female Prostitutes in Nigeria V International Conference on AIDS, Montreal, 6/4-9, Poster W.G.O. 24.
Websites: www.aids.africa.com
15 NigeriaPage -
UNAIDS/WHO Epidemiological Fact Sheet - 2004 Update
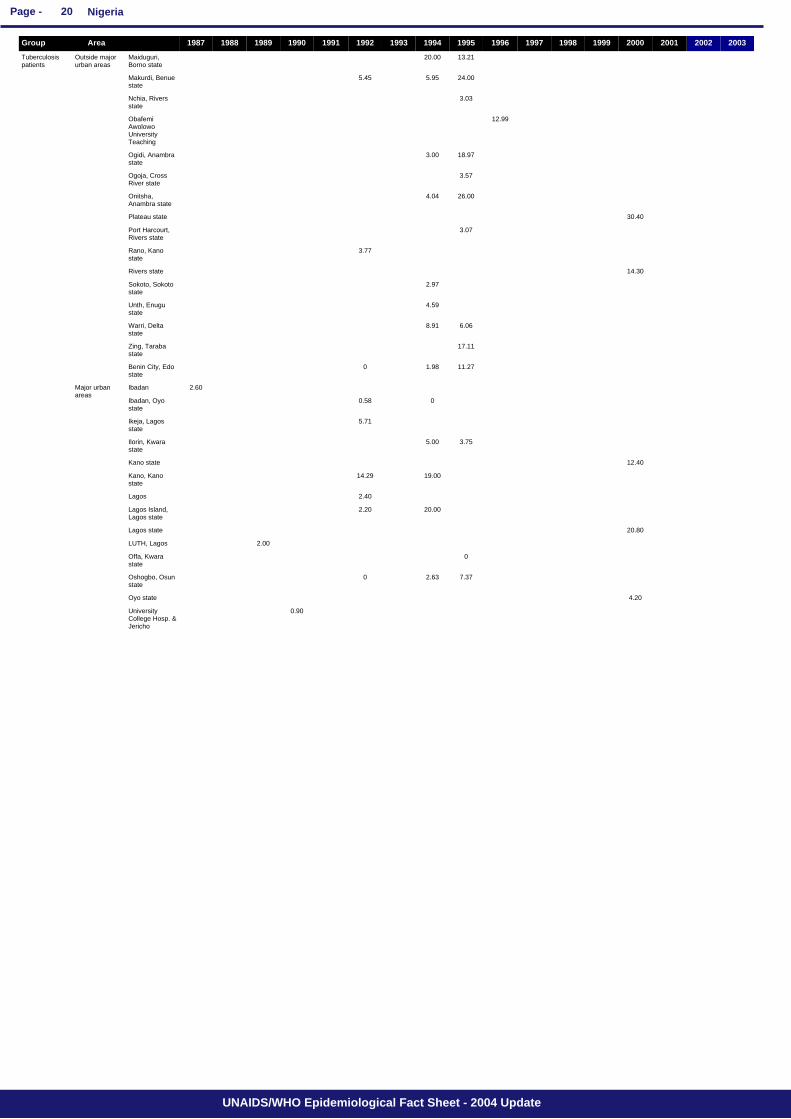
Annex: HIV surveillance by site
5.34
7.901.03
8.190
3.504.674.80
3.334.00
4.334.0001.750
0
6.675.33
14.3613.22
2.14
0.99
6.900.67
6.698.392.151.00
8.205.730
4.673.33
7.676.677.85
0
11.686.30
6.332.73
0
2.50
9.335.005.398.750
5.67
2.331.67
13.644.278.455.45
6.25
2.881.000
6.6711.1113.003.870.66
4.013.86
5.50
3.11
4.674.331.25
3.002.671.612.130
4.6800
14.33
0.801.00
2.0010.091.16
3.670.751.95
3.67
3.33
3.673.071.003.75
5.674.671.72
6.75
1.337.007.542.34
3.342.670.150.210.16
0
5.336.33
11.008.00
6.866.364.200
5.585.373.41
Brass, Bayelsa state
Bori, Rivers state
Bonny, Rivers state
Biu, Borno state
Birnin Kebbi, Kebbi state
Benin City, Edo state
Benin City
Bauchi, Bauchi state
Barikin-Ladi, Plateau state
Bali, Taraba state
Bairnin-Kudu, Jigawa state
Azare, Bauchi state
Awka, Anambra state
Auchi, Edo state
Argungu, Kebbi state
Ankpa, Kogi state
Akwkwu, Delta state
Akwanga, Plateau state
Akure, Ondo state
Akamkpa, Cross River state
Agidi, Anambra state
Agbor, Delta state
Afikpo, Ebonyi state
Ado Ekiti, Ekiti state
Achi, Enugu state
Abudu, Edo state
Abeokuta, Ogun state
Abakaliki, Ebonyi state
Aba, Abia state
University College Hospital, Ibadan
Surulere, Lagos state
Saki, Oyo state
Oshogbo, Osun state
Ogbomosho, Oyo state
Nyanya, Abuja
LUTH, Lagos
Lagos Island, Lagos state
Kano, Kano state
Kano MMSH, Kano state
Kano AKTH, Kano state
Ilorin, Kwara state
Ilesa, Osun state
Ikorodu, Lagos state
Ikeja, Lagos state
Ibadan, Oyo state
Ibadan
Gwagwalada, Abuja
Garki, Abuja
Epe, Lagos state
Badagry, Lagos state
Outside major urban areas
Major urban areas
Pregnant women
20032002200120001999199819971996199519941993199219911990198919881987Group Area

16 NigeriaPage -
UNAIDS/WHO Epidemiological Fact Sheet - 2004 Update
0
3.412.50
4.00
5.193.332.762.50
0.92
5.714.21
0
1.55
5.267.50
3.334.48
5.679.00
14.3812.672.250.40
4.334.330.258.00
0.160
3.673.671.44
10.6713.67
11.97
3.673.01
12.336.00
9.3315.0576.674.982.25
4.008.054.290.42
11.337.794.504.99
6.694.001.26
0
1.76
0
7.675.335.000
4.003.03
4.004.030.22
15.003.50
00.250
0
1.331.335.005.77
02.50
5.001.67
1.43
4.003.34
15.22
1.080.54
4.990.84
3.331.67
8.3313.33
5.009.660.50
6.803.674.504.00
7.00
2.332.01
2.67
0
5.002.55
8.336.331.034.740
Okene, Kogi state
Ogoja, Cross River state
Ogidi, Anambra state
Offa, Kwara state
Oblaruku, Delta state
Nsukka, Enugu state
Ngala, Borno state
Nchia, Rivers state
N/Eggon, Nasarawa state
Mubi, Adamawa state
Minna, Niger state
Makurdi, Benue state
Maiduguri, Borno state
Maiduguri
Lokoja, Kogi state
Lafia, Nasarawa state
Keffi, Plateau state
Katsina, Katsina state
Kaltungo, Gombe state
Kafanchan, Kaduna state
Kaduna, Kaduna state
Jos, Plateau state
Jalingo, Taraba state
Isiokpo, Rivers state
Ilella, Sokoto state
Ilaro, Ogun state
Ikom, Cross River state
Ikole Ekiti, Ekiti state
Ijebu-Ode, Ogun state
Ihugh, Benue state
Ife-Ejigbo or Ife, Osun state
Idah, Kogi state
Hadejia, Jigawa state
Gwarzu, Kano state
Gusau, Zamfara state
Gumel, Jigawa state
Gombe, Gombe state
Giwa, Kaduna state
Geidam, Yobe state
Gboko, Benue state
Funtua, Katsina state
Essien-Udim, Akwa Ibom state
Enugu, Enugu state
Ekwulobia, Anambra state
Ekpoma, Edo state
Dutse, Jigawa state
Dogon Daji, Sokoto state
Danbata, Kano state
Damaturu, Yobe state
Calabar, Cross River state
Outside major urban areas
Pregnant women
20032002200120001999199819971996199519941993199219911990198919881987Group Area

17 NigeriaPage -
UNAIDS/WHO Epidemiological Fact Sheet - 2004 Update
49.0030.08
27.27
0
19.23
0
0.49
0.52
12.17
1.30
56.3812.00
7.07
17.004.04
2.17
17.000
37.1412.00
30.50
29.70
15.301.71
10.899.94
81.7315.00
39.33
46.00
9.89
5.677.009.87
3.33
5.675.485.251.26
7.583.37
3.334.33
8.92
2.333.340.751.501.57
13.0011.67
2.022.90
0.872.301.8001.69
2.682.33
2.60
45.79
2.003.69
3.002.671.49
5.674.68
27.610
6.73
0
4.335.001.001.21
7.054.671.46
4.670
4.005.33
11.0021.005.513.67
4.6710.61
7.50
6.027.412.00
7.002.99
01.01
Gboko, Benue s
Enugu, Enugu state
Danbata, Kano state
Calabar, Cross River state
Calabar
Borno/Cross River state
Borno state
Biu, Borno state
Benin City, Edo state
Barikin-Ladi, Plateau state
Bairnin-Kudu, Jigawa state
Awka, Anambra state
Auchi, Edo state
Agbor, Delta state
Abakaliki, Ebonyi state
Lagos state
Lagos Island, Lagos state
Lagos
Kano, Kano state
Ilorin, Kwara state
Ilesa, Osun state
Ikeja, Lagos state
Badagry, Lagos state
Zing, Taraba state
Zaria, Kaduna state
Yola, Adamawa state
Yenogoa, Bayelsa state
Wushishi, Niger state
Wukari, Taraba state
Warri, Delta state
Uyo, Akwa Ibom state
Unth, Enugu state
University of Maiduguri Teaching Ho
Umuahia, Abia state
Uba, Borno state
Tudun-Wada Kaduna, Kaduna state
Talata-Marafa, Zamfara state
Sokoto, Sokoto state
Shendam, Plateau state
Saminaka, Kaduna state
Sagbama, Bayelsa state
Sagamu, Ogun state
Rano, Kano state
Port Harcourt, Rivers state
Parklane, Enugu state
Owerri, Imo state
Oturkpo, Benue state
Orlu, Imo state
Onueke, Ebonyi state
Onitsha, Anambra state
Ondo, Ondo state
Omu-Aran, Kwara state
Outside major urban areas
Major urban areas
Outside major urban areas
Sex workers
Pregnant women
20032002200120001999199819971996199519941993199219911990198919881987Group Area

18 NigeriaPage -
UNAIDS/WHO Epidemiological Fact Sheet - 2004 Update
6.12
9.00
11.00
22.42
9.470
6.49
10.90
13.863.00
24.00
17.50
11.86
23.00
0
12.10
9.004.10
11.00
17.825.00
3.000
8.0016.50
21.20
10.000.52
8.00
9.214.11
9.50
3.032.300
8.00
6.15
5.0014.93
7.20
8.91
5.00
1.122.00
0.67
17.0028.28
28.0027.082.50
57.89
14.0011.00
14.85
51.79
24.007.00
6.80
13.04
43.6831.00
25.68
60.604.261.970.21
45.00
67.7437.96
60.87
48.80
29.4144.12
010.78
6.78
Jalingo, Taraba state
Ikom, Cross River state
Ihugh, Benue state
Hadejia, Jigawa state
Gboko, Benue state
Enugu, Enugu state
Enugu state
Ekwulobia, Anambra state
Calabar, Cross River state
Borno state
Bonny, Rivers state
Benue state
Benin City, Edo state
Bauchi state
Barikin-Ladi, Plateau state
Bairnin-Kudu, Jigawa state
Awka, Anambra state
Auchi, Edo state
Akwanga, Plateau state
Akwa Ibom state
Agbor, Delta state
Abia state
Abakaliki, Ebonyi state
Oyo state
Oshogbo, Osun state
Lagos Island, Lagos state
Lagos
Kano, Kano state
Kano state
Ilorin, Kwara state
Ikeja, Lagos state
Ife-Ejigbo or Ife, Osun state
Ibadan, Oyo state
Yola, Adamawa state
Warri, Delta state
Unth, Enugu state
Rano, Kano state
Port Harcourt, Rivers state
Oturkpo, Benue state
Onitsha, Anambra state
Ngala, Borno state
Mubi, Adamawa state
Makurdi, Benue state
Maiduguri, Borno state
Maiduguri
Keffi, Plateau state
Jos, Plateau state
Jalingo, Taraba state
Ikom
Hadejia, Jigawa state
Gwarzu, Kano state
Gumel, Jigawa state
Outside major urban areas
Major urban areas
Outside major urban areas
STI patients
Injecting drug users
Sex workers
20032002200120001999199819971996199519941993199219911990198919881987Group Area
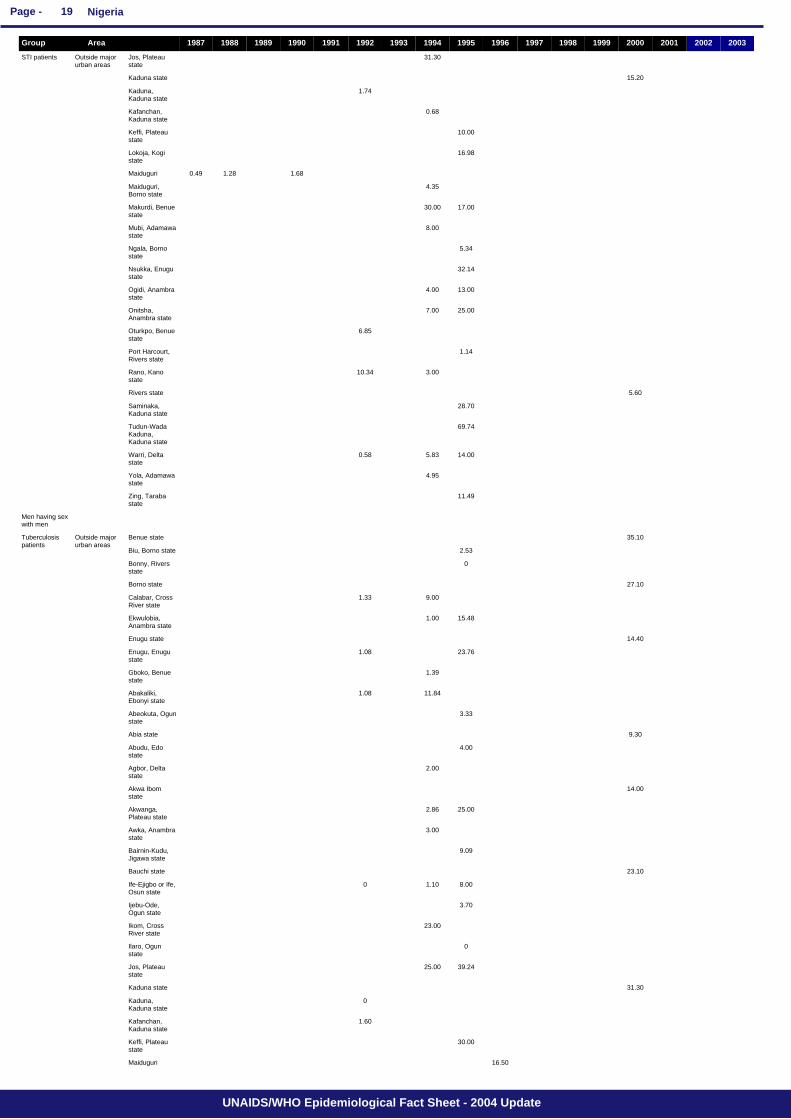
19 NigeriaPage -
UNAIDS/WHO Epidemiological Fact Sheet - 2004 Update
16.50
30.00
1.60
0
31.30
39.2425.00
0
23.00
3.70
8.001.100
23.10
9.09
3.00
25.002.86
14.00
2.00
4.00
9.30
3.33
11.841.08
1.39
23.761.08
14.40
15.481.00
9.001.33
27.10
0
2.53
35.10
11.49
4.95
14.005.830.58
69.74
28.70
5.60
3.0010.34
1.14
6.85
25.007.00
13.004.00
32.14
5.34
8.00
17.0030.00
4.35
1.681.280.49
16.98
10.00
0.68
1.74
15.20
31.30
Maiduguri
Keffi, Plateau state
Kafanchan, Kaduna state
Kaduna, Kaduna state
Kaduna state
Jos, Plateau state
Ilaro, Ogun state
Ikom, Cross River state
Ijebu-Ode, Ogun state
Ife-Ejigbo or Ife, Osun state
Bauchi state
Bairnin-Kudu, Jigawa state
Awka, Anambra state
Akwanga, Plateau state
Akwa Ibom state
Agbor, Delta state
Abudu, Edo state
Abia state
Abeokuta, Ogun state
Abakaliki, Ebonyi state
Gboko, Benue state
Enugu, Enugu state
Enugu state
Ekwulobia, Anambra state
Calabar, Cross River state
Borno state
Bonny, Rivers state
Biu, Borno state
Benue state
Zing, Taraba state
Yola, Adamawa state
Warri, Delta state
Tudun-Wada Kaduna, Kaduna state
Saminaka, Kaduna state
Rivers state
Rano, Kano state
Port Harcourt, Rivers state
Oturkpo, Benue state
Onitsha, Anambra state
Ogidi, Anambra state
Nsukka, Enugu state
Ngala, Borno state
Mubi, Adamawa state
Makurdi, Benue state
Maiduguri, Borno state
Maiduguri
Lokoja, Kogi state
Keffi, Plateau state
Kafanchan, Kaduna state
Kaduna, Kaduna state
Kaduna state
Jos, Plateau state
Outside major urban areas
Outside major urban areas
Tuberculosis patients
Men having sex with men
STI patients
20032002200120001999199819971996199519941993199219911990198919881987Group Area
20 NigeriaPage -
UNAIDS/WHO Epidemiological Fact Sheet - 2004 Update
0.90
4.20
7.372.630
0
2.00
20.80
20.002.20
2.40
19.0014.29
12.40
3.755.00
5.71
00.58
2.60
11.271.980
17.11
6.068.91
4.59
2.97
14.30
3.77
3.07
30.40
26.004.04
3.57
18.973.00
12.99
3.03
24.005.955.45
13.2120.00
University College Hosp. & Jericho
Oyo state
Oshogbo, Osun state
Offa, Kwara state
LUTH, Lagos
Lagos state
Lagos Island, Lagos state
Lagos
Kano, Kano state
Kano state
Ilorin, Kwara state
Ikeja, Lagos state
Ibadan, Oyo state
Ibadan
Benin City, Edo state
Zing, Taraba state
Warri, Delta state
Unth, Enugu state
Sokoto, Sokoto state
Rivers state
Rano, Kano state
Port Harcourt, Rivers state
Plateau state
Onitsha, Anambra state
Ogoja, Cross River state
Ogidi, Anambra state
Obafemi Awolowo University Teaching
Nchia, Rivers state
Makurdi, Benue state
Maiduguri, Borno state
Major urban areas
Outside major urban areas
Tuberculosis patients
20032002200120001999199819971996199519941993199219911990198919881987Group Area