Islamic Republic of Iran AIDS Progress Report - UNAIDS
72
In the Name of God Islamic Republic of Iran AIDS Progress Report On Monitoring of the United Nations General Assembly Special Session on HIV and AIDS March 2015 National AIDS Committee Secretariat, Ministry of Health and Medical Education
-
Upload
khangminh22 -
Category
Documents
-
view
0 -
download
0
Transcript of Islamic Republic of Iran AIDS Progress Report - UNAIDS
In the Name of God
Islamic Republic of Iran
AIDS Progress Report
On Monitoring of the United Nations General
Assembly Special Session on HIV and AIDS
March 2015
National AIDS Committee Secretariat, Ministry
of Health and Medical Education

content page Acknowledgment 3
Acronym 5
Introduction 6
Status at a glance 7
Overview of the epidemic 12
National response to AIDS 23
Best practices 57
Challenges and remidial 60
Support from the Country’s Development Partners 63
Monitoring and evaluation environment 66
Annexes 67
references 70

3
Acknowledgement
We would like to acknowledge the participation of the following organizations (in alphabetical order). We also appreciate the work of our colleagues working in each organization, their
names are mentioned under the title of each organization:
AIDS Experts of Disease Prevention Groups, Health Deputies of Universities of Medical Sciences and Health Services
Drug Control Headquarters o Parviz Afshar, MD, Deputy of demand reduction and community participation
o Fariborz Ahmadi, MD, General director of treatment and social support
o Mehdi Ghambari Mohmmadi, MD, expert at Treatment and social affairs
Iranian Research Center for HIV/AIDS(IRCHA) - Tehran University of Medical Sciences o Minoo Mohraz, MD, Chief at Iranian Research Center for HIV/AIDS
Joint United Nations Program on HIV and AIDS in the Islamic Republic of Iran (UNAIDS)
o Fadad Doroudi, MD, Country Coordinator, UNAIDS Iran
o Alireza Vasigh, MD, Monitoring and evaluation expert, UNAIDS Iran
Ministry of Health and Medical Education, Centre of Communicable Disease Control o Mohammad Mehdi Gouya, MD, Chief of Centre of Communicable Disease
Control
o Abbas Sedaghat, MD, Chief of AIDS Office
o Kianoosh Kamali, MD, Centre of Communicable Disease Control
o Nooshin Fahimfar, MD, responsible expert AIDS Control Office
o Hengameh Namdaritabar, MD, responsible expert of AIDS Control Office
o Maryam Sargozaee, MD. MD, responsible expert of AIDS Control Office
o Homeira Fallahi, MD, responsible expert of AIDS Control Office
o Zahra Rajabpoor, BS, expert of AIDS Control Office
o Sara Sharyatmadar, expert of AIDS Control Office
o Nazanin Heidari, expert of AIDS Control Office
o Azam Valipoor, expert of AIDS Control Office
Ministry of Health and Medical Education, Psychosocial Health and Addiction Office o Ahmad Hajebi, MD, General Director at Psychosocial Health and Addiction Office
o Alireza Norooai, MD, Chief of Drug Prevention Office
o Ebrahim Ghodoosi, MD, responsible expert at Drug Prevention Office
Ministry of Interior, Deputy of Social Affairs
o Reza Mahboobi, Deputy of social affair center
o Nasrin Goodarzi, Expert at social affair center Non-governmental Organizations active in the field of HIV and AIDS
o Mohammad Reza Seyed Ghasemi, MD
Prisons Organization, Health office o Mehrzad Tashakorian, MD, General Director at Health Office
o Ramin Alasvand, MD, responsible expert at Health Office of Prison Organization
Regional Knowledge Hub for HIV/AIDS Surveillance, Kerman University of Medical Sciences
o Ali Akbar Haghdoost, MD, Chief of Regional Knowledge Hub for HIV/AIDS
Surveillance
o Hamidli Sharifi, Manager and Deputy at Regional Knowledge Hub for HIV/AIDS
Surveillance
o Mostafa Shokoohi, , Expert at Regional Knowledge Hub for HIV/AIDS Surveillance

4
o Razieh Khajekazemi, expert at Regional Knowledge Hub for HIV/AIDS Surveillance
State Welfare Organization
o Mijid Rezazadeh, MD, Head of Prevention and Development Centre
o Kambiz Mahzari, MD, Expert at State Welfare Organization
Working Group Technical Coordinator Behnam Farhoudi, MD, Assistant Professor of Islamic Azad University, Tehran
Medical Branch
Acronyms
Acronyms
AIDS Acquired Immunodeficiency Syndrome

5
ART
ARV
Antiretroviral Therapy
Antiretroviral(drugs)
ATS Amphetamine like stimulants
CCM Country Coordinating Mechanism
SW Sex Worker
DIC Drop in Center
HIV Human Immunodeficiency Virus
IDU Injecting Drug User
DoC Declaration of Commetment
MSM Men who have Sex with Men NGO
Non- governmental Organization PEP Post-
exposure prophylaxis
PITC Provider Initiated Testing and Counselling
PWID People Who Inject Drug
PLWH People living with HIV
RDS Respondent Driven Sampling
STI Sexually Transmitted Infection
VCT Voluntary Counselling and Testing
UNAIDS Joint United Nations Program on HIV/AIDS
UNGASS United Nations General Assembly Special Session (on
AIDS)

6
Introduction
With the HIV epidemic among people who inject drug (PWID), I.R.Iran encountered
concentrated HIV epidemic. Fortunately respecting the implemented intervention among
PWID, increasing rate of HIV prevalence was blunted. But HIV transmission by route of
sexual relationship increased in recent years. At each of the three United Nations General
Assembly Special Sessions on HIV/AIDS in 2003, 2008 and 2011, the Islamic Republic
of Iran has committed itself to HIV control by signing the declarations of these sessions.
This report is the most important country report in the field of HIV/AIDS, and while
providing a general view of the HIV epidemic in Iran, presents DoC core indicator and
the situation of country response. The core indicators for monitoring DoC progress are
significant on four grounds: first, they help evaluate the effectiveness of our national
response to the epidemic; second, they form a basis for comparing trends in service
delivery, program outcomes and the epidemic itself; third, they show the level of our
country’s commitment to the DoC; and fourth, they express the relative status of our
country within the global response to HIV/AIDS.
This is the Sixth report of Iran on Declaration of Commitment indicators within the
framework of UNAIDS guidelines. Despite its possible shortcomings, this report contains
very important information, which was produced, collected and analyzed by thousands of
our colleagues at country level. We hope that it constitutes a step towards controlling the
spread of HIV in Iran. Nevertheless some shortcomings in the report are to be expected
and we sincerely welcome any criticism or comment in this regard.

7
Status at a glance
Inclusiveness of Reporting Process
A Working Group was established to prepare this report whose members included the Ministry
of Health & Medical Education, the State Prisons Organization, the State Welfare Organization,
the Ministry of Interior, the Ministry of Education, Drug Control Headquarters, the Blood
Transfusion Organization, medical universities, the UNAIDS Country Office, PLWH and non-
governmental organizations. The Working Group began work on 30th January 2015, and its
members have been involved in developing the various sections of the report, by
participating in meeting, and giving feedbacks to official and email communications.
The Status of the Epidemic
The prevalence of HIV among the general population in Iran remains low. (1,2)
But it stands at
13.8 per cent among injecting drug users.(3)
Accordingly, since HIV prevalence exceeds 5 per
cent in this sub-population, the epidemic in Iran is classified as being concentrated. Concentrated
epidemics, if neglected and not probably addressed by effective counter-measures, have the
potential to evolve into generalized epidemics. (4)
Since one and a half decade ago, measures taken have successfully slowed progression of the
epidemic among injecting drug users.(5)
Nevertheless, injecting drug use remains the most
important factor fuelling the epidemic in Iran (6,7)
because the sharing of injecting equipment has
not yet reached zero.(3)
It is therefore critical to sustain and scale up preventive harm reduction
programs quantitatively and qualitatively for this key group in order to reach the goal of zero
new infections through injecting drug use.
On the other hand, sexual transmission of HIV in Iran is on the rize in recent years.(8)
such that
the proportion of recorded cases attributed to sexual transmission has been steadily growing and
the prevalence of HIV among female sex workers has reached 4.5 per cent.(9)
The majority of
female sex workers do not use condoms consistently.(9)
Injecting drug users are sexually
active and their sexual intercourse is frequently unprotected.(3)
High-risk sexual practices are
not rare among young people,(10)
and 19.5% of those between 20-29 years old had extramarital
sex. In recent year, the use of amphetamine-type stimulants is rising, and the effect of their use
on high risk sexual behavior, causes concerns. (11)
For all these reasons, we must inevitably set up
interventions to reduce the prevalence of high-risk sexual practices in order to control the
epidemic.
The number of women infected with HIV by sexual route, has increased in recent years. (8)
The
corresponding increase in the number of pregnant women living with HIV has led to an
increasing number of children being born with HIV in recent years.(8)
Even though the
8
absolute number of these children remains low, failure to scale up effective PMTCT
programs could prove problematic in the future.
It seems that activities to control HIV transmission through contaminated blood or blood
products have been appropriate and since 2007 there is no cases affected by blood or blood
product transfusion. (8)
However, existing control measures need to continue stronger than
before, using the most updated measures.
The Policy and Programmatic Response
The Government of the Islamic Republic of Iran is committed to controlling HIV as a means of
promoting the health of the community as a whole. It therefore promotes a participatory and
proactive approach by all program partners in controlling the epidemic. It seeks to advance
a common strategic vision rooted in the “Three Ones” concept: one strategic program, one
coordinating institution, and one monitoring and evaluation framework, which is used by all
partners to gauge their interventions. The Government approves and implements interventions,
whose effectiveness has been scientifically proven beforehand, and strives to avoid measures
that could potentially fuel the epidemic further.
Indicator data in an overview table
Table of summarization of core indicators
9
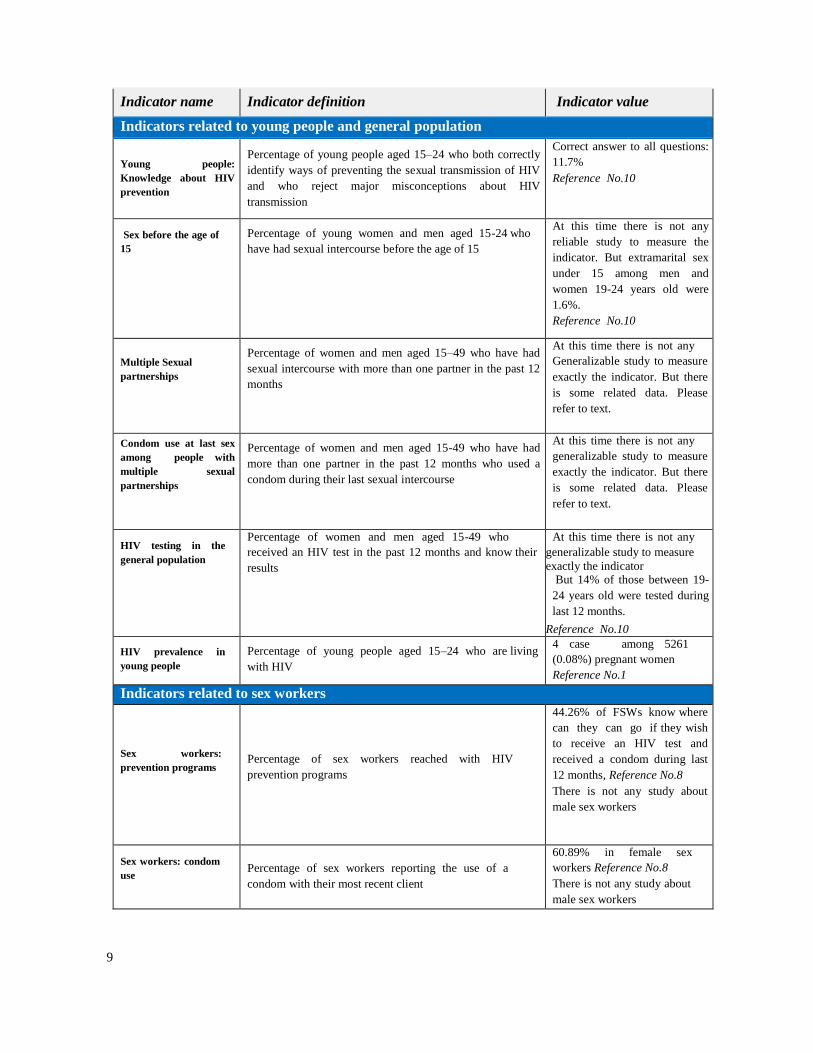
Indicator name Indicator definition Indicator value
Indicators related to young people and general population
Young people:
Knowledge about HIV
prevention
Percentage of young people aged 15–24 who both correctly
identify ways of preventing the sexual transmission of HIV
and who reject major misconceptions about HIV
transmission
Correct answer to all questions:
11.7%
Reference No.10
Sex before the age of
15
Percentage of young women and men aged 15-24 who
have had sexual intercourse before the age of 15
At this time there is not any
reliable study to measure the
indicator. But extramarital sex
under 15 among men and
women 19-24 years old were
1.6%.
Reference No.10
Multiple Sexual
partnerships
Percentage of women and men aged 15–49 who have had
sexual intercourse with more than one partner in the past 12
months
At this time there is not any
Generalizable study to measure
exactly the indicator. But there
is some related data. Please
refer to text.
Condom use at last sex
among people with
multiple sexual
partnerships
Percentage of women and men aged 15-49 who have had
more than one partner in the past 12 months who used a
condom during their last sexual intercourse
At this time there is not any
generalizable study to measure
exactly the indicator. But there
is some related data. Please
refer to text.
HIV testing in the
general population
Percentage of women and men aged 15-49 who
received an HIV test in the past 12 months and know their
results
At this time there is not any
generalizable study to measure
exactly the indicator But 14% of those between 19-
24 years old were tested during
last 12 months.
Reference No.10
HIV prevalence in
young people
Percentage of young people aged 15–24 who are living
with HIV
4 case among 5261
(0.08%) pregnant women
Reference No.1
Indicators related to sex workers
Sex workers:
prevention programs
Percentage of sex workers reached with HIV
prevention programs
44.26% of FSWs know where
can they can go if they wish
to receive an HIV test and
received a condom during last
12 months, Reference No.8
There is not any study about
male sex workers
Sex workers: condom
use
Percentage of sex workers reporting the use of a
condom with their most recent client
60.89% in female sex
workers Reference No.8
There is not any study about
male sex workers

10
HIV testing in sex
workers
Percentage of sex workers who received an HIV test in the
past 12 months and know their results
27.87% in female sex
workers Reference No.8
There is not any study about
male sex workers
HIV prevalence in sex
workers
Percentage of sex workers who are living with HIV
In female sex workers, using
weighted analysis: 4.5%
Reference No.8
There is not any study about
male sex workers
Indicators related to men who have sex with men
Men who have sex
with men: prevention
programs
Percentage of men who have sex with men reached with
HIV prevention programs
At this time there is not any
reliable study to measure the
indicator.
Men who have sex
with men: condom
use
Percentage of men reporting the use of a condom the last
time they had anal sex with a male partner
At this time there is not any
reliable study to measure the
indicator.
HIV testing in men
who have sex with
men
Percentage of men who have sex with men who received an
HIV test in the past 12 months and know their results
At this time there is not any
reliable study to measure the
indicator.
HIV prevalence in men
who have sex with men
Percentage of men who have sex with men risk who are
living with HIV
At this time there is not any
reliable study to measure the
indicator. Please refer to text.
Indicators related to injecting drug users
People who inject drugs:
prevention programs
Number of Syringes distributed per person who injects
drugs per year by Needle and Syringe Programs
Between 44 to 60 syringes
for every IDU
Reference for nominator:
No.12 and 13
For denominator: 14 and 15
People who inject
drugs: condom use
Percentage of people who inject drugs reporting the use of a
condom the last time they had sexual intercourse
Weighted:44.3%
Reference No.3
People who inject drugs:
safe injecting practices
Percentage of people who inject drugs reporting the use of
sterile injecting equipment the last time they injected
Weighted:81.5%
Reference No.3
HIV testing in people
who inject drugs
Percentage of people who inject drugs who received an
HIV test in the past 12 months and know their results
Weighted:27.2%
Reference No.3
HIV prevalence in
people who inject
drugs
Percentage of people who inject drugs who are living with
HIV
Weighted: 13.8% Reference No.3
Indicators related to mother to child transmission

11
Prevention of mother-
to- child transmission
Percentage of HIV-positive pregnant women who received
antiretroviral to reduce the risk of mother-to- child
transmission
19.9%
Numerator: 168 pregnant
women
Denominator 845 estimated
pregnant women
Reference: Numerator No.12
and Denominator No16
No.16
Early infant diagnosis
Percentage of infants born to HIV-positive women receiving
a virological test for HIV within 2 months of birth
56.8% (71 out of 125 neonates)
Reference: Numerator and
Denominator No.12
Mother-to-Child
transmission of HIV
(modelled)
Estimated percentage of child HIV infections from HIV-
positive women delivering in the past 12 months
Please refer to text
Indicators related to antiretroviral treatment
HIV treatment:
antiretroviral therapy
Percentage of eligible adults and children currently
receiving antiretroviral therapy
20.1%
Numerator: 5585 under ART
Denominator: 27800 estimated
number in need of ART
Reference for nominator:
No.17
For denominator: No.16
Twelve Month retention
on antiretroviral therapy
Percentage of adults and children with HIV known to be
on treatment 12 months after initiation of antiretroviral
therapy
84.8%
Female PLWH: 88.4%
Male PLWH:83.4%
Reference No.17
Indicator related to TB and HIV co-management
Co-management of
tuberculosis and HIV
Treatment
Percentage of estimated HIV-positive incident TB
cases that received treatment for both TB and HIV
40.8%
Reference for nominator:
No.18
For denominator No.19
Indicators related to policy and HIV related contextual factors
AIDS spending Domestic and international AIDS spending by
categories and financing sources
1,676,898,000,000 Rials in 2012
Reference No. 20
Prevalence of recent
intimate partner violence
Proportion of ever-married or partnered women aged
15-49 who experienced physical or sexual violence from
a male intimate partner in the past 12 months
At this time there is not any
study to measure the
indicator
Orphans school
attendance
Current school attendance among orphans and non- orphans
(10–14 years old, primary school age, secondary school age)
92.4%
Reference No.24
External economic
support to the poorest
households
Proportion of the poorest households who received
external economic support in the last 3 months
At this time there is not any
study to measure directly the
indicator. Please refer to
text.

12
Overview of the HIV epidemic
This section presents the general state of the HIV/AIDS epidemic in the Islamic Republic of Iran,
based on data collected in case registry system of CDC MOH, data from sentinel sites, Data from
integrated biobehavioral studies and other relevant studies.
Analysis Case Registry System statistics
Total Number of registered cases: Based on the data of case registry system, a total of
28663 PLWH had been identified in Iran until September 21, 2014: So far, 6435 of these
identified cases have entered AIDS stage.(8)
The first case of HIV in Iran was reported in 1986 and until 1995; a gradual and slight
Increase was noted in the country’s annual reports. With an HIV epidemic identified in 1996 in
some of Iran’s penitentiaries, the number of identified cases suddenly underwent a significant
increase and this trend continued until 2004 when the total number of identified cases reached its
maximum in the course of one year. Then, there was a fall with a slight slope in the number of
the identified cases (figure 1 and 2) (8)
It is worth noting here that the system for recording of
identified cases was reviewed in 2004 with the reporting forms changed and a number of cases
who had not appeared in the system before were reported in 2004. (25)
Hence, the interpretation
of the curve for annual identified cases based on the registry system data must be done with
precaution. (22)
Figure1: Trend of transmission route from 2006 to 2013 based on case registry system
Distribution of registered cases by sex: Until September 21, 2014, of total registered cases,
89.3% were men and 10.7% were women. In comparison to all reported cases, in those
reported from 20 March 2012 to 20 March 2013, 70.8% were men and 29.2% were women. This
1986
1987
1988
1989
1990
1991
1992
1993
1994
1995
1996
1997
1998
1999
2000
2001
2002
2003
2004
2005
2006
2007
2008
2009
2010
2011
2012
2013
Sex 0 1 3 3 12 14 28 35 20 21 32 59 36 51 40 76 78 124 260 158 181 222 269 321 353 365 512 552
IDU 0 0 0 1 3 10 5 7 3 11 228 777 360 311 397 10721290143217121897155216081526124211051027 819 684
Total 5 17 22 45 56 61 51 61 31 33 276 876 457 468 554 1539177523733063235219622034197917291662170115631500
0
500
1000
1500
2000
2500
3000
3500
Nu
mb
er

13
show an increase in the proportion of female cases alongside the increase in the proportion of
those infected by sexual route (Figure 2 and 3). (8)
Figure 2: Trends of registered cases from 2006 to 2013 disaggregated by sex
Figure 3: Percent of registered women living with HIV from 2001 to 2013
Distribution of registered cases by age: Until September 21, 2014, of total registered cases, some
45.7% of HIV infected cases are in the 25-34 age and this is the highest in any age group. The
second largest age group was those of 35-44 years old with 28.2%. Alongside increase in the
number of women living with HIV and those infected by mother to child transmission, the number
of children under 5 years old was increasing continuously (Figure 4).(8)
These increases in the
number of children under 5 years old is very important and indicate the necessity of MTCTP
services.
1986
1987
1988
1989
1990
1991
1992
1993
1994
1995
1996
1997
1998
1999
2000
2001
2002
2003
2004
2005
2006
2007
2008
2009
2010
2011
2012
2013
Female 0 1 0 4 9 3 11 8 4 1 7 15 23 34 28 67 71 144 203 142 163 193 264 282 333 363 397 438
Total 5 17 22 45 56 61 51 61 31 33 276 876 457 468 554 1538177323723062235119602031197317241658169515601491
0
500
1000
1500
2000
2500
3000
3500
4.3% 4.0% 6.1% 6.6% 6.0%
8.3% 9.5%
13.4%
16.4%
20.1% 21.4%
25.4%
29.2%
0.0%
5.0%
10.0%
15.0%
20.0%
25.0%
30.0%
35.0%
2001 2002 2003 2004 2005 2006 2007 2008 2009 2010 2011 2012 2013

14
Figure 4: Percent of children under 5 years living with HIV from 2001 to 2013
Distribution of registered cases by transmission route: The HIV transmission routes in all the
cases which have been registered since 1986 are (in order of magnitude) sharing injection
equipment among injecting drug users (67.2%), sexual intercourse (13.9%), blood transfusion
(0.9%), and mother-to-child transmission(1.3%). The route of transmission among 16.7% of this
group is unknown. In comparison to all reported cases, transmission routes in those reported
from 20 March 2012 to 20 March 2013 include IDU, 45.5%, sexual transmission 36.8%, and
mother to child transmission 2.9%. In 14.8 % of the identified cases in this year, the transmission
mode was unknown and no new cases of transmission through blood transfusion were reported.
(Figure 5). (8)
The first case of HIV transmission through injecting drug use was identified in 1989 and
until 1995, there were only around 5-10 new such cases having been identified. With the
outbreak of the epidemic among injecting drug users, however, the rate of transmission within
this cohort increased 23 times as much in 1996 compared to the rate of the previous year and was
for the first time identified as the most prevalent form of transmission, a fact that has remained in
place to this day. The number of registered cases of transmission through drug injection
underwent a gradual increase until 2005 and afterwards begin to fall and this decreasing trend
continue until now.(Figure 1) (8)
Alongside with the fall in the share of transmission through drug
injection of in the identified cases, the share of sexual and mother to child transmission increased
continuously. (8)
(Figure 1 and 2)
There are some cases with unknown route of transmission in the case registry system. This may
be due to stigmatization that surrounds the HIV related risk factors and registration of cases
found in researches and in surveying at the sentinel sites
Figure 5: Comparison of transmission routes between those diagnosed in 2013 and until 20
0.1% 0.1%
0.6% 0.4% 0.3%
0.6% 0.7% 0.6%
1.0%
1.9%
2.8%
2.5%
1.9%
0.0%
0.5%
1.0%
1.5%
2.0%
2.5%
3.0%
2001 2002 2003 2004 2005 2006 2007 2008 2009 2010 2011 2012 2013

15
Mortality among registered cases: Among those registered until September 2024, 6016 were
dead. The number of death reached maximum level in 2008, and the continued with small
decrease (Figure 6). (8)
Figure 6: Number of AIDS related death according to registry system from 2007 to 2013
45.50%
36.80%
2.90%
0.00% 14.80%
IDU
Sex
Mother to Child
Blood & BloodProduct
Unknown
In 2014
67.20%
3.20%
1.40%
0.90% 16.70%
IDU
Sex
Mother to Child
Blood & BloodProduct
Unknown
Commulative untill 2014

16
Figure 7 shows the number of registered death disaggregated by sex. (8)
Death among women living
with HIV was less than men. Although overally death among PLWH is decreasing, the figure for
female is increasing and for men is decreasing. (8)
Figure 7: Frequency of registered death disaggregated by sex
Estimation of the Number of HIV Cases
Just as is the case with other countries, the identified cases in Iran comprise only a part of all the
cases. New estimates for 2014 (March 2014- March 2015) derived using the software
1 5 7 9 13 17 28 28 18 49 31
56 56 84
179 221 211
370
462 504
551 541
458
519
449 494
470
0
100
200
300
400
500
600
18 25 25 31 44 46
539 448 466
407 427
385
0
100
200
300
400
500
600
2008 2009 2010 2011 2012 2013
ادعدت
مرد
زن

17
SPECTRUM, based on UNAIDS-recommended models, are presented below. Note that because
of newly available data as well as the refining of previous data, the estimates made by the
software differ, to some extent, from previous estimates in each case.
Estimation of the Number of HIV Cases in the General Population: The estimated figures
indicate an increasing trend in the number of PLWH in the general population (figure 8). The
median for the total number of cases in 2014 has been calculated at 75700 persons (49600-
135400, at CI: %95). This includes 55000 men and 20700 women. Though the figure
corresponding to male cases is greater than that of women, the rate of growth of the number of
cases is higher for women. Inconsistency in the number of estimated cases in the present report,
as compared to the last, is due to changes and improvements in the software SPECTRUM,
optimization of the procedure and improvement of the quality of entered data. (16)
Figure 8: Estimated number of PLWH in the general population
Estimation of Prevalence in the General Population: In 2005, prevalence in the general
population for the age range 15-49, was %0.1 while the estimate for 2014 is %0.14. Yet, the
figure is expected to rise to %0.16 by 2020 (figure 9). (16)
Figure 9: Estimated prevalence of HIV cases in the 15-49 year-old population
0
20,000
40,000
60,000
80,000
100,000
HIV
Po
pu
lati
on
Years
HIV Population Female (n)
Male (n)

18
Estimation of the Number of New Cases of HIV: The estimated number of new cases of HIV
infection for 2014 is 8190 (5570 men and 2620 women). Predictions have indicated an increasing
trend up to 2013 with a reversal of trend in men and continued increase in the number of new
cases among women after that point (figure 10). (16)
Figure 10: Estimated number of new cases of HIV in Iran
Estimation of the Annual Mortality Due to HIV: The estimated mortality due to HIV was 5530
in 2014, of which 4280 were male and 1240 were female. The trend in men is fairly constant while
in women it is a rising trend at a moderate slope (figure 11). (16)
Since the relatively faster growth of the HIV epidemic among women has emerged only during
recent years, it seems that the estimate for female HIV mortality may be inflated and should be
treated with caution.
Figure 11: Estimated annual mortality due to HIV in Iran
0.14
0
0.05
0.1
0.15
0.2
Prevalence (15-49) (%)
5,973
2,741
0
2,000
4,000
6,000
8,000
Nu
mb
er o
f N
ew H
IV
infe
ctio
n
Years
New HIV Infection Male (n) Female (n)

19
Estimation of the Number of Cases of MTCT: The number of new cases of MTCT in 2014
totaled 359 (184 boys and 175 girls). The trend is ascending for the whole population, for boys and
for girls (figure 12). (16)
Figure 12: New HIV cases among infants in Iran due to MTCT
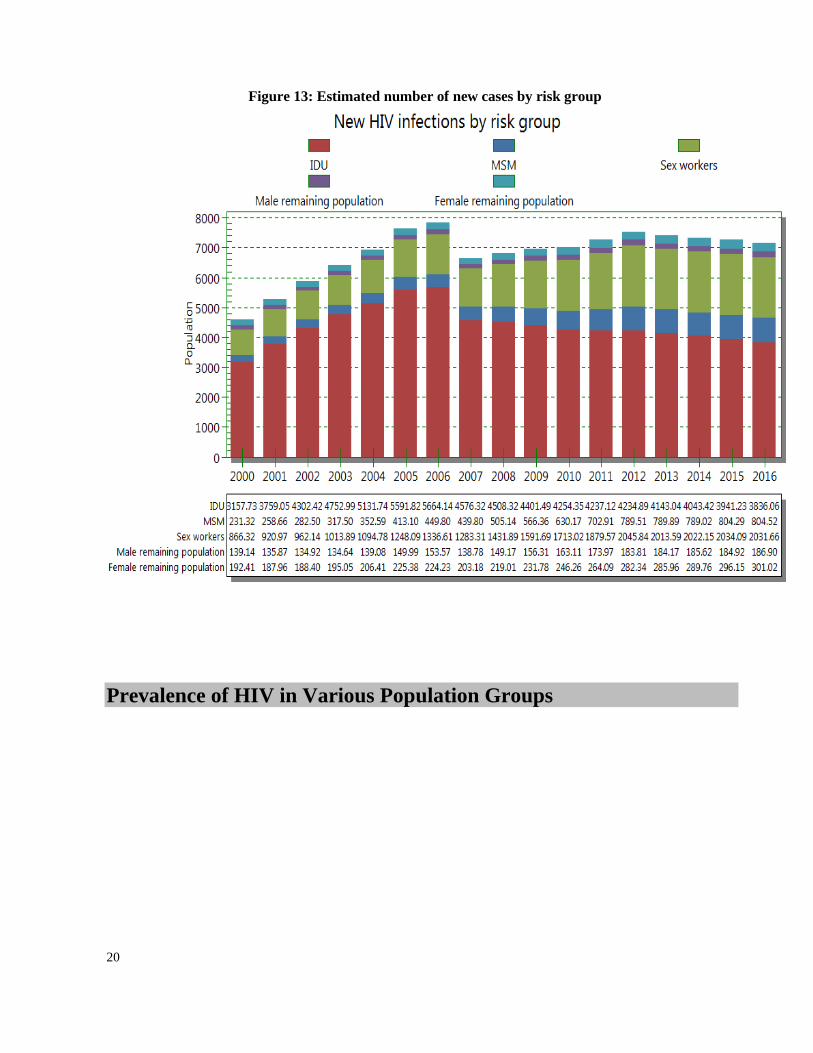
Estimation of HIV Cases by Risk Group: The estimate for new cases of HIV in 2014 is 4043 in
IDUs, 2022 in sex workers and 789 in MSM. (Figure 13) (16)
0500
1,0001,5002,0002,5003,0003,5004,0004,5005,0005,5006,000
An
nu
al A
IDS
de
ath
s Annual AIDS deaths Female (n)
Male (n)
0
100
200
300
400
500 Female
Male
20
Figure 13: Estimated number of new cases by risk group
Prevalence of HIV in Various Population Groups

21
Injecting Drug Users: The prevalence of HIV among IDUs which had been nearly constant at
%15 up to the most recent bio-behavioral survey conducted in 2011, (23, 24)
has now reached %13.8. (3)
While the meager decline is not statistically significant, it is probably the combined result of a
reduction of new cases of HIV among IDUs because of changed behavior due to harm reduction
interventions and the depletion of the number of existing cases due to mortality. It must be noted,
however, that the percentage varies by province with the figure being alarmingly high in certain
provinces. (3)
A systematic review was conducted in 2012 aiming to examine the prevalence of HIV among
IDUs. The systematic review included 22 studies with a total sample size of 3916 IDUs, wherein
the pooled HIV infection prevalence was found to be %18.4 for studies after 2005 (%16.7-20.2)
and %8.7 (%7.5-10) for studies conducted before that date. The pooled prevalence of HIV was
%18.7 for Tehran and %5.2 for other cities. (25)
Since more than half of the population studied were
from Tehran the figures obtained might not be representative for the whole country.
Sex Partners of IDUs: In the 2010 bio-behavioral survey of IDUs and their sex partners,
the prevalence of HIV was found to be %1 among partners and %4.2 among IDUs. Sex partner of
an IDU in this context means anyone with whom the IDU participating in the study has had sex at
least once in the one month period leading up to the study. Additionally, the total prevalence for
both groups in the cities where the study had been conducted was 10.8%, 4.6% and zero. (26)
Female Sex-Workers: The results of the 2010 bio-behavioral survey indicate an HIV prevalence
in this category o f about 4.5% across the country (CI=95%, % 2.4-%8.3). Yet the figure
varied among provinces, ranging from 0 to 28%. Among those with a history of drug injection,
HIV prevalence was found to be as high as %13. (9)
Prisoners: In the 2012-2013 bio-behavioral survey, the prevalence of HIV infection among
inmates amounted to % 1.4 (CI: 95%, % 0.6 - % 2.22). The change is not significant
compared with the figure for the study conducted in 2009 (%2.1: CI: %95, %1.2-3.6). The figure
for those who had a history of injecting drugs was %5.42 (CI: %95, %2.09-8.76). (27)
MSM: Studies of prevalence among MSM are very limited and thus unrepresentative of the
group as a whole. Therefore, no generalized inference could be drawn in this regard.
Nevertheless there are some studies that have looked at this behavior as a subgroup of the main
population studied, most of which have been in closed settings like prisons or among IDUs. (3, 27-
29) In the bio-behavioral survey of inmates in 2009, % 15.6 of men reported sexual relations
with other men. Prevalence of HIV among this subgroup was found to be 3.7% (% 0.6-18.8). (28)
In another study, which covered several cities in Iran in 2009, of 360 male drug users, %20.8
reported unprotected homosexual sex in the previous month. (30)
Non-injecting Drug Users: A systematic review in 2012 that included 10 studies of non-injecting
drug users found the pooled prevalence of HIV to be %2.6 (%2-3.4) for this population group
(based on a total sample size of 2275). Studies covering Tehran had indicated a prevalence of
%5.6 while the figure for other locations was %0.4. (31)
Street Children: In the 2010 bio-behavioral survey of 1000, 10-18 year-old street children in
Tehran, HIV prevalence in the total sample was found to be %4.5, while the figure reached %9
for those who used drugs. (32)
Clearly the result of this study cannot be generalized for the whole
country. In another study of 386 street children in another city (from 2005 to 2007), the
prevalence of HIV was found to be zero. (33)

22
Vagrants and the Homeless: In a 2010 study of 4230 Tehran vagrants relocated to a special
camp in exchange for free services, the prevalence of HIV was found to be %1 (%0.7-1.3, CI:
%95). The prevalence among men (%1.2) was greater than the prevalence among women (%0.6). (34)
In another 2010 study of 10672 homeless persons, the prevalence of HIV was found to be %1.7
(CI: %95, %1.4-1.9). (35)
TB Patients: Figure 14 shows the prevalence of HIV among TB patients for the years 2006-2011
according to Iran’s TB case reporting system. The 5-year average TB-HIV comorbidity in TB
patients was %2.3 (2315 in 100000) which was 64 times that of the general population (35 in
100000). (36)
A nationwide study of 3132 identified TB patients in 2010 found the prevalence of
HIV among them to be %3.8 (120 persons). (37)
Figure 14: Percentage of cases of HIV comorbidity to the total number of TB cases
Transsexual Women: In a 2014 cross-sectional study based on time-location sampling, of 104
transsexual women (female to male), there were two cases of HIV infection, thus a %1.9
prevalence. (38)
Female transsexual in this context refers to having a female appearance while a
male sexual identity.
General Population: HIV prevalence in the general population is quite low. A study conducted
among pregnant women in 2010 in 7 provinces, identified only four case of HIV out of 5261
pregnant women referring for delivery. (1)
In the years 2010-2013 there were 8 surveillance
studies conducted for pregnant women wherein of the 6876 participants only one case of HIV
infection was detected. (2)
2.27% 2.16% 2.21% 2.23% 2.29% 2.68%
0.00%
0.50%
1.00%
1.50%
2.00%
2.50%
3.00%
1385 1386 1387 1388 1389 1390

23
National response to the HIV
epidemic
This section of the report deals with the national response to the HIV epidemic in the
Islamic Republic of Iran based on information and data acquired form monitoring of
programs, measurement of main indicators of the report, integrated bio-behavioral survey of
the HIV surveillance system, and some other studies.
Reducing HIV sexual transmission Indicators related to sexual transmission of HIV Indicators related to General Population
1.1. Indicator name: Knowledge about HIV prevention
Definition of indicator: Percentage of young people aged 15–24 who both correctly identify
ways of preventing the sexual transmission of HIV and who reject major misconceptions about
HIV transmission
Measurement tools: A study conducted among young people 15-29 years old in 13 provinces
(Tehran, Alborz, east Azarbaijan, Kurdistan, Kermanshah, Lorestan, Esfahan, Khuzestan, Fars,
Sistan and Baluchistan, Khorasan razavi and Mazandaran) in 2013. Participants were selected from
capital city of each province and another randomly selected city of the province. Sample size was
4868. Sampling method was a combination of “multistage clustering” and “stratified sampling”.
Overall, 50.5% of study population were male (2456 participants) and 49.5% were female (2412
participants). 28.2% (1372 participants) and (3495 participants) were from rural and urban area
respectively. (10)
Indicator value: In this study 11.1% of young population gave correct response to all of the
questions. (10)
Discussion: A review of this indicator by corresponding questions indicates the greatest dearth of
knowledge regarding rejection of misconceptions, particularly as concerns the possibility of
transmission through mosquito bites, which has been answered correctly by only %32 of the
respondents. (10)
Given the significance of such misconceptions in eliminating stigma and
discrimination, educational programs need to address these misconceptions. Nevertheless, it is
important to note that knowledge of non-transmission of HIV through mosquito bites is not on par
with it being sexually transmissible. Yet, even though cases of valid knowledge outnumber

24
misconceptions for other questions, such as sexual transmission or prevention through condom use,
the figures still require improvement. According to the results of the study average scores regarding
knowledge of transmission factors is higher for women compared to men and urban residents
compared to rural residents. There is a wide variance in knowledge of HIV related factors in
different regions across the country.
The indicator was calculated on the basis of a DHS study on urban and rural women aged 15 to 24
in the previous GARPR report. (24)
Since the measurement process has been altered, the data trend
for these two years cannot be adjudged.
1.2. Indicator name: Sex before the age of 15
Definition of indicator: Percentage of young women and men aged 15-24 who have had
sexual intercourse before the age of 15
Measurement tools: The same as indicator number 1.1.
Indicator value: Percentage of young women and men aged 15-24 who have had sexual
intercourse before the age of 15 was 1.6% (28 out of 1733).(10)
Discussion: In this study, sexual behaviors were asked from those 19 years or older. The
frequency of sex before 15 years old among those between 19 – 24 years old was low. But it
increases for sex before 18 and reaches 6.3% (109 out of 1733). The figure for sex before 15 was
3.0% (2 out of 870) for men and 0.2% (2 out of 870). Sex before 18 was 10.4% (90 out of 863)
for men and 2.2% (19 out of 863) for women. (10)
There is not any study conducted over the
country before this study, and the trends cannot be determined.
1.3. Indicator name: Multiple sexual partnerships
Definition of indicator: Percentage of women and men aged 15–49 who have had sexual
intercourse with more than one partner in the past 12 months
Measurement tools: Population based study is recommended.
Indicator value: At this time there is not any representative study to measure the indicator.
Discussion: As stated above, there is not any representative study to measure the indicator. But the
study presented in indicator 1.1 suggests among study population, 93.8% responded to the
question about extramarital sex. Among them 74.3% (2411 persons) responded “yes” to the
question and 19.5% (633 persons) said “no”. The figure for extramarital sex was 31.7% for men
and 9.6 % for women. (10)
1.4. Indicator name: Condom use at last sex among people with multiple
sexual partnerships
Definition of indicator: Percentage of women and men aged 15-49 who have had more than one partner in the past 12 months who used a condom during their last sexual intercourse
Measurement tools: Population based study is recommended.
Indicator value: At this time there is not any representative study to measure the indicator.
Discussion As mentioned above, there is currently no study that could measure this indicator.
Nevertheless, in the study mentioned for indicator 1-1, of the 623 persons who had had sex outside
of formal marriage, 222 (%35.6) motioned condom-use in their most recent sexual contact. The
study fails to measure the incidence of sexual contact over the past 12 months, yet of the 617
respondents who have answered the question regarding condom use in extramarital sex 134

25
(%21.7) reported consistent use, 95 (%15.4) reported nearly consistent use, 218 (%35.3) reported
occasional condom use and 170 (%27.6) reported to have never used condoms. (10)
1.5. Indicator name: HIV testing in the general population
Definition of indicator: Percentage of women and men aged 15-49 who received an HIV test in
the past 12 months and know their results
Measurement tools: Population based study is recommended.
Indicator value: At this time there is not any representative study to measure the indicator.
Discussion: As stated above, there is not any representative study to measure the indicator. But the
study presented in indicator 1.1 suggests among 2641 participants (86%) never were tested for HIV
and 435 (14%) received HIV testing. (10)
Although almost all of them who received HIV testing
generally receive it results, but in this study, participants were not asked about whether they
received the test results. So the indicator value cannot be reported.
Among 435 participants who were tested for HIV, 407 were determined the time of last HIV
testing. Among them, 49.4% (201 participants) were tested during last year, 27% between 1-2 year,
and 23.6% were tested before 2 years. (10)
1.6. Indicator name: HIV prevalence in young people
Definition of indicator: Percentage of young people aged 15–24 who are living with HIV
Measurement tools: A study conducted among pregnant women referring for labor in
seven provinces in 2010. Sampling method was convenience sampling method. Blood sampling
was taken after informed consent. (1)
Indicator value: Among 5261 pregnant women participated in the study, 4 were positive by one ELISA testing. This means a frequency of 0.07%.
(1) Between 2010 to 2013, in eight sentinel
surveys among pregnant women of general population which included 6876 cases, only one was HIV positive.
(2)
Discussion: HIV prevalence remains low among general population in the country.
Indicators related to Sex Workers
1.7. Indicator name: Sex workers: prevention programs
Definition of indicator: Percentage of sex workers reached with HIV prevention programs
Measurement tools: The first round of bio-behavioural surveillance among female sex workers
was conducted in 2010. At first a sample of drop in centers which give services to female sex
workers were selected in 12 provinces. It is tried to select at least 5 DIC in each province. At
least 20 -35 female sex workers were recruited in the study in each DIC. So, approximately 150
cases were included from each province. Sampling method was convenience sampling in DICs.
The data were collected by a standardized questionnaire. Dried Blood Spot was used for HIV
testing. Each positive test was reconfirmed and then reported as positive. 10% of all blood
samples were sent to a reference laboratory for quality control. In this study 1005 female sex
workers were recruited and after deletion of incomplete questionnaire, the results of 872 cases
were used for final analysis. (9)
Indicator value: 44.26% (386 out of 872) of study population knew where they can go if they wish to receive an HIV test and in the last 12 months, they had received condoms the figure was 38.6% (81 out of 210) for those under 25 year and 46.5% (304 out of 654) for those 25 year or

26
more. Knowledge about location of HIV testing and receiving condom during last 12 months was 54.0% (471 out of 872) and 62.7% (547 out of 872) respectively.
(9)
Discussion: Most of the study population was from women specific Drop in Centers. These
female sex workers had lower socioeconomic status. So we should be cautious in generalizing
findings to all female sex workers. There is not any similar study previously conducted for
comparison. But in a study among female sex workers in Tehran in 2007, 63.9% of study
population had correct knowledge about location of HIV testing. (32)
There is not any study about male sex workers.
1.8. Indicator name: Sex workers: condom use Definition of indicator: Percentage of sex workers reporting the use of a condom with their
most recent client
Measurement tools: The same indicator number 1.7.
Indicator value: 531 out of 872 (60.89%) of female sex, used condom with their most recent
client. This figure was 61.9% (130 out of 210) for those under 25 years old and 61.2% (400 out
of 654) for those of 25 years old or greater. In the above mentioned study, using the weighted
analysis, condom use in the last intercourse with a client was 57.1% (9)
and this figure was used as
a basis for prevention planning at the national level.
Discussion: Most of the study population was from women specific Drop in Centers. These
female sex workers had lower socioeconomic status. So we should be cautious in generalizing
findings to all female sex workers. There is not any similar previously conducted study for
comparison. But in a study among female sex workers in Tehran in 2007, 55% of study
population had used condom in the last sexual intercourse with a client. (42)
Another study conducted among 161 FSW in Tehran in 2012- 2013. Sampling method
was RDS. Condom use was 65.2% in the last sex with a client. Among 105 respondents who
were answered to the question about condom use with the permanent sexual partner in the
last sex, 49.5% (52 people) used condom. (43)
There is not any study about male sex workers.
1.9. Indicator name: HIV testing in sex workers
Definition of indicator: Percentage of sex workers who received an HIV test in the past 12
months and know their results
Measurement tools: The same as indicator number 1.7.
Indicator value: 243 out of 872 (27.87%) of female sex workers, received an HIV test in the
past 12 months and know their results. This figure was 25.2% (53 out of 210) for those under 25
years old and 28.9% (189 out of 654) for those of 25 year old or more. (9)
Discussion: Most of the study population was from women specific Drop in Centers. These
female sex workers had lower socioeconomic status. So we should be cautious in generalizing
findings to all female sex workers. There is not any similar
Previously conducted study for comparison. But in a study among female sex workers in Tehran
in 2007, 20.4% (57 out of 280) of study population received an HIV test in the past 12 months
and know their results. (42)

27
On the other hand, in a study conducted among 161 female sex workers in Tehran in 2013, 53
persons (32.9%) received an HIV test in the past 12 months and know their results. (43)
There is not any study about male sex workers. 1.10. Indicator name: HIV prevalence in sex workers Definition of indicator: Percentage of sex workers who are living with HIV Measurement tools: The same indicator number 1.7. Indicator value: Thirty out of 817 (3.7%) of female sex workers, were HIV positive. This figure was zero percent for those under 25 year old and 4.9% (30 out of 614) for those of 25 years old or more. 3.4% (3 out of 88) of female sex workers with a history of less than 1 year sex working were HIV positive and the figure was 3.7% for those with more than 1 year sex working. Using the weighted analysis, HIV prevalence in female sex workers was 4.5 %
(9) and this figure was
used as a basis for program planning at the national level. In the study conducted among 161 FSW in Tehran in 2012- 2013, there were 8 PLWH (5%). (43)
There is not any study about male sex workers.
Indicators related to MSM 1.11. Indicator name: Men who have sex with men: prevention programs
Definition of indicator: Percentage of men who have sex with men reached with HIV
prevention programs
Measurement tools: Population based study is recommended.
Indicator value: At this time there is not any study to measure the indicator.
Discussion: There are some evidences that this behavior do occur over the country especially in
closed setting such as inside prisons. (3, 27-30) But at this time there is not any representative and
documented studies in this group. It seems there is a need to conduct specifically tailored studies
in this group.
1.12. Indicator name: Men who have sex with men: condom use Definition of indicator: Percentage of men reporting the use of a condom the last time they
had anal sex with a male partner Measurement tools: Population based study is recommended. Indicator value: At this time there is not any study to measure the indicator.
1.13. Indicator name: HIV testing in men who have sex with men Definition of indicator: Percentage of men who have sex with men who received an HIV test in
the past 12 months and know their results Measurement tools: Population based study is recommended. Indicator value: At this time there is not any study to measure the indicator.
1.14. Indicator name: HIV prevalence in men who have sex with men Definition of indicator: Percentage of men who have sex with men who are living with HIV Measurement tools: Population based study is recommended. Indicator value: At this time there is not any study to measure the indicator.
Activities to reduce HIV sexual transmission

28
To reduce the risk HIV sexual transmission, different strategies of national strategic plan
including education and information to different population groups, harm reduction among PWID,
condom distribution for prevention of sexual transmission, care and treatment for STI, and care
and treatment for PLWH, deal with issue. Their activities can be divided into two general
categories: education and information; and safer sex promotion. In this section, information about
activities among different population groups except for PWID, are presented. Those for PWID are
presented in the section entitled as “reducing transmission of HIV among PWID”.
The same token, triangular clinics provide services such as education and information; and safer
sex promotion among PLWH and their spouses.
Following the publication of Consolidated WHO guideline (2013), initiation of ART among
PLWH with serodiscordant couple were recommended in national care and treatment guidelines.
In addition post exposure prophylaxis by ARVs after rape or inadvertent condom rupture was
recommended. Also pre-exposure prophylaxis was considered for spouses of PLWH who do not
accept ART and not continuesly adherent to condom use. (49)
Promotion of safer sex
Condoms are provided free of charge to clients at triangular clinics, DICs and conjugal visit rooms
in prisons. Access to condoms is also possible by purchase at pharmacies and other retail venues.
At present there are different varieties of condoms available at market. (41)
Female condom which
was previously piloted is provided in some centers to FSW at limited scale. (24)
Although it is not
yet fully accepted by target group. Although changes in population control policy, has some
effects on the trends of availability of condom, condom promotion to prevent HIV and STI are still
considered in programs and activities.
Young population: In a nationwide survey of 4868 individuals aged 15-29 in 2013, which included
13 provinces, of the 633 (%19.5) who reported sexual relations outside of formal marriage, %21.7
(134 persons) said that they had used condoms in “every instance”; %15.4 (95 persons) in “almost
every instance” %35.3 “occasionally” and %27.6 “never.” It seems that healthy sexual behavior
promotion programs need to be strengthened. The most prevalent reasons for failing to use
condoms were reported to be: “inaccessibility” (%29.5), “expendability” (%24.9), and
“unpleasantness” (%22.1), in that order. Of the 633 persons who reported sexual relations outside
of formal marriage, 623 responded to a question regarding condom use in the most recent sexual
contact. Accordingly, %35.6 (222 persons) had used a condom in their most recent sexual contact.
Of the 633 persons who reported sexual relations outside of formal marriage, 621 responded to a
question regarding stimulant or alcohol use prior to sexual contact. Accordingly %39.9 (248
persons) responded affirmatively, meaning they had indeed used stimulants or alcohol prior to
extramarital sex. This finding further highlights the need to consider the possible role of
methamphetamines in the spread of HIV. (10)
Female Sex-Workers: in the 2010 bio-behavioral survey of female sex-workers, two- thirds of the
respondents reported receiving free condoms in the preceding year. (9)
The ratio of those who had
29
consistently used a condom during sex with a paying partner over the preceding month was 30%.
Meanwhile, 30% had never used a condom at all. In 47.7% of the cases they had not used a
condom in their non-commercial sexual contact during the preceding month. 60.9% had used a
condom during commercial sex in the preceding month. (9)
The figure was found to have been
55% among sex workers in Tehran in a study conducted in 2006. (42)
The comparison indicates the
relative effectiveness of prevention programs that have been launched in recent years, albeit
limited in scope. It is estimated that an increase of condom use coverage by 40% in female sex-
workers and their clients (from 55% to 95%) could reduce new cases of HIV infection by 89% in
both categories. (7)
Transgender women: In a cross sectional study using time – location sampling in 2014, 82.7% of
study population had ever sex contact. Condom use in the last sex with casual and permanent
sexual partner was infrequent. (38)
The transsexual woman is someone who has the appearance of a
female but the tendency of male sexuality.
Inmates: According to biobehavioural survey among prisoner conducted in 2012, among those
who had a history of sex, 24.5% used condom in their last sexual contact. The study showed that
19.1% of those with a history of sex inside prison, had access to condom in the prison. (27)
Men who have sex with men: There are indications that the behavior does occur in certain places in
Iran, particularly in confined spaces such as prisons. (3, 27-30)
Nevertheless, there is no reliable,
documented study conducted for this category. It would seem that a thorough study of this
population needs to be conducted.
HIV Information and Education
Information and educational activities have been performed for different target populations. As a
matter of their nature, monitoring, documentation or measuring of coverage for such programs is
generally quite difficult. (5)
Youth and general population: Activities for youth and general population include limited AIDS
education at school level; and at universities, factories, business centers, hospitals, clinics and
health centers, health houses, prisons, barracks, addiction treatment centers, family education
courses at universities, educational courses at some municipal Culture Houses, some State
broadcaster programs, mandatory HIV/AIDS & STD lectures for couples before marriage, and
some activities within the framework of peer education. Other activities include establishing
hotlines, development of two online AIDS site and updating them, provision of educational key
information in airlines, metros, trains, buses, bus terminals and home video networks are other
activities.
Extensive community-based activities have taken place in Iran with the cooperation of artists,
volleyballists (supported by the Islamic Republic of Iran Volleyball Federation), as well as an
information campaign by certain football teams in the Premier League in the context of an indoor-
football tournament held simultaneously with the 2014 football World Cup. There have also been
information campaigns for university students on HIV and STDs at certain universities in four

30
cities. Other community-based activities included Information Carnivals held in Tehran and other
cities, Information booths and tents at busy street corners across the country, street performances
and sports-information programs.
Still it seems that these activities need to be improved quantitatively and quantitatively. In a study
conducted in 2011, a total of only 20.6% of boys responded correctly to all question on modes of
transmission, prevention methods and misconceptions on HIV. (21)
In a nationwide survey of 4868 individuals aged 15-29 in 2013, which included 13 provinces,
41.8% of study population had high level knowledge about transmission route of HIV, and 32.8%
had moderate level, and 18.4% had poor level. (10)
Table 1 shows a summary of proportion of correct answer to standard questions about HIV related
knowledge according to abovementioned study.
Table1: Knowledge of young people aged 15-29 years about HIV
Questions Proportion of correct answer
male female
Can a person get HIV by sharing food with someone who is infected?
66.4% 70.3%
Can a person get HIV from mosquito bites? 43.0% 29.0%
Can a healthy-looking person have HIV? 39.1% 80.3%
Can a person reduce the risk of getting HIV by using a condom every time
they have sex?
61.4% 59.4%
Can the risk of HIV transmission be reduced by having sex with only one
uninfected partner who has no other partners?
77.3% 72.9%
Correct answer to all questions 19.6% 9.0%
Female Sex Workers: Educational activities for female sex workers are generally designed based
on peer education and delivery of services at Welfare Organization supervised Women’s DICs and
NGO run Vulnerable Women’s Counselling Centers supervised by Medical Sciences Universities. (25)
In the 2010 bio-behavioral survey
91.8% of the respondents were able to correctly answer the question: “Could the chances of AIDS
infection be reduced by limiting sexual relations to a single, non- infected, faithful partner?”
Furthermore 96.9% held that the probability of AIDS infection could be reduced by condom use
during sex. (9)
Less than half of the respondents of this study knew that HIV could not be
transmitted by mosquito bites or sharing a meal with an infected person. Only a total of 55.3% of
these individuals considered themselves to be at risk of HIV infection. (9)
Another study conducted among 161 FSW in Tehran in 2012-2013 using RDS sampling method,
found only 20.5% of study population responded correctly to all questions about knowledge of
HIV. (43)
Correct answer to reduce the risk of getting HIV by using a condom every time they have
sex, were 66.5%. 86.3% responded correctly to whether condom use can reduce the risk of HIV,
79.5% knew a healthy- looking person can be HIV infected, 40.4% knew that HIV cannot be
transmitted by mosquito and 59.6% knew HIV is not transmissible by eating food with a PWLH. (43)
31
Inmates: Some activities have been implemented by the Prisons’ Organization. Education has
taken the shape of classrooms, face-to-face education, peer education and telephone counselling
hotlines. Upon entering a prison, inmates receive information on harm reduction through
pamphlets, group education and prison audio- visual systems. (52)
In the 2012 – 2013 survey of
inmates, 24.4% of prisoners knew how to prevent sexual prevention of HIV and were able to reject
misconceptions in this regard. (27)
The figure was 157% in 2009. (28)
Findings of this study indicate
that in almost every category, the knowledge of respondents of the modes of transmission and
rejection of misconceptions has been greater than that of those surveyed in 2009. As in the
previous study, the least level of knowledge in the present study concerned misconceptions
regarding HIV transmission. (27)
The same study shows that a high percentage of inmates fail to
use condoms in their sexual contacts despite knowledge of the role of condoms in preventing HIV
transmission. Additionally fear of HIV infection shows no effect on condom use. Meanwhile, the
findings indicate that fear of HIV transmission does significantly affect shared injections while the
same militating effect is not observed regarding condom use. (27)
The findings highlight the need
for strengthening effective measures to increase the coverage of harm reduction interventions in
prisons.
Men who have sex with men: there are indications that the hidden behavior does occur in certain
places in Iran, particularly in confined spaces such as prisons. (3, 27-30)
Nevertheless, there is no
reliable, documented study conducted for this category. It would seem that a thorough study of
this population needs to be conducted.
Reducing transmission of HIV among PWID Indicators related to injection drug users
2.1. Indicator name: People who inject drugs: prevention programs
Definition of indicator: Number of Syringes distributed per person who injects drugs per year by
Needle and Syringe Programs
Measurement tools: Numerator: Inquiries from Universities of Medical Sciences and Health
Services and State Welfare Organization. Denominator: Size estimation of injection drug user
population
Indicator measurement: Numerator: Over a one-year period ending in September 2014,
10,136,060 free needles and syringes have been distributed. (12, 13)
Denominator: According to
several Rapid situation Assessments implemented in Iran, it is estimated that there are between
170,000 to 230,000, IDUs in Iran. (14, 15)
Indicator value: Between 44 and 60 needle and syringe per IDU per year were distributed.
Discussion: The coverage is still behind the suitable value (200 syringes per PWID per year). (44)
The figure needs to be improved. However it should be considered that most behavioural study
among PWID indicates that a high proportion of them purchase their syringes from pharmacies.
This may contribute to high rate of using new syringes in the last injection.

32
2.2. Indicator name: People who inject drugs: condom use
Definition of indicator: Percentage of people who inject drugs reporting the use of a condom the
last time they had sexual intercourse
Measurement tools: The third round of bio-behavioural surveillance among injection drug was
conducted in 2014. Study population was people who injected drugs at least once in the last 12
months. They were recruited from facilities serving these people in the ten selected provinces.
Five different sources of sampling sites were defined for the sampling; Drop-In Centers, shelters,
drug treatment centers, voluntary Counseling and Testing (VCT) centers, and outreach groups.
Two stage cluster sampling was used to select the facilities and potential participants from the
eligible clients at these facilities. A structured questionnaire was used to collect data on the
demographic characteristics, and the key indicators of injection and sexual risk behaviors. Dried
blood samples (DBS) were taken from the participants to test for HIV antibodies by ELISA. In
this study 2400 PWID were recruited. (3)
Indicator value: 41.8% (122 out of 292) of PWID who injected drug and had sex during last
month, used condom in their last intercourse. (Weighted 44.3%) (3)
Discussion: It seems that scaling up of condom usage in this very important group which fuels
HIV epidemic, needs more efforts. The figure in previous biobehavioural study in 2010 was
34.1%. (23)
On the other hand the role of increasing use of methamphetamine on unsafe sexual
behavior should be considered. (11)
2.3. Indicator name: People who inject drugs: safe injecting practices
Definition of indicator: Percentage of people who inject drugs reporting the use of sterile
injecting equipment the last time they injected
Measurement tools: The same as indicator number 2.2.
Indicator value: After weighting 81.5%. Of those who injected drug in the last month (1035
persons), 815 (78.7%) used sterile syringes in their last injection. The figure was 803 out of 1018
(78.9%) for men and 12 out of 17 (70.6%) women and 41 out of 65 (63.1%) for those under 25. (3)
Discussion: After weighting, the figure was 88.8% in 2010, and reduced to 81.5% in 2014. (3)
This reduction in safe injection practice can be a warning sign and we need to explore its possible
causes. In recent years, programs based on the transmission of repeat offenders” Residential
Facilities” have begun to be implemented along with harm reduction programs. In” Residential
Facilities” program, repeat offenders drug addicts are transferred to public and private sector
facilities certified to provide drug treatment and harm reduction services for one to three months. (45)
The round-up of drug addicts and their detoxification has not been successful elsewhere in the
world in treating addiction, in bringing about long-term behavioural change, and in many cases
actually led to an increase in HIV prevalence. (46)
But one also needs to accept the possibility that
harm reduction programs may be preferentially absorbing the subset of PWID who are susceptible
to behavioural change and transforming them into “ex-PWID”, whilst the remaining, refractory
PWID population requires not only continuation of current services but also the design of new
evidence-based interventions that can bring about the desired behavioural changes. One must

33
remember that Iran has successfully stopped the explosive growth of HIV among PWID, although
the intrinsic nature of the HIV epidemic among PWID means that any such success remains under
threat and fragile. There is room for optimism however since the cumulative proportion of PWID
have injected drug during last month and who reported using either a sterile needle-syringe
(78.7%) or re-using his/her own needle-syringe (13.9%) equals 92.6%, which compares favorably
with the figure of 96.6 per cent reported in 2010. (3)
Thus, some of the apparent decrease in sterile-
syringe-needle coverage is offset by the aforementioned safe-injection practices.
2.4. Indicator name: HIV testing in people who inject drugs
Definition of indicator: Percentage of people who inject drugs who received an HIV test in the
past 12 months and know their results
Measurement tools: The same as indicator number 2.2
Indicator value: 27.6% (661 out of 2399) of the study population received an HIV test in the past
12 months and know their results (weighted 27.2%). The figure was 50.8% (30 out of 59) for
women, 27% (631 out of 2340) for men and 25% (49 out of 196) for IDUs less than 25 years old. (3)
Discussion: The indicator value is relatively low, did not changed significantly since last report
and should be improved with PIHT using HIV rapid test. In addition some factors may potentially
prevent the use of health services among injecting drug users and this should be considered. It
seems community-based intervention approaches and avoiding punishment based interventions
could be helpful in this regard.
2.5. Indicator name: HIV prevalence in people who inject drugs
Definition of indicator: Percentage of people who inject drugs who are living with HIV
Measurement tools: The same as indicator number 2.2.
Indicator value: After weighting, 13.8% of study population was HIV positive (9.3% before
weighting, 215 out of 2307). The figure was 8.9% (201 out of 2249) for men, 24.1% (14 out of 58)
for women and 2.1% (4 out of 190) for PWID, 25 years old or less. (3)
Discussion: In the previous round of bio-behavioural surveillance in 2010, weighted adjustment
yielded a figure of 15.1 per cent; the latest prevalence figure shows a slight (and statistically non-
significant) decrease compared with it. Clearly, some of the HIV-positive PWID have died. The
possible causes of death include those specifically related to drug use/injection, those specifically
related to not accessing HIV treatment and care, and non-specific or general causes such as
cardiovascular disease. We know from the experience of other countries that in the absence of
effective interventions, HIV prevalence among PWID rapidly increases to more than 40 per cent
through a surge in the number of new infections. (46)
However, the relative success of harm
reduction programs in decreasing HIV incidence among PWID has meant that incident cases can
no longer “compensate” for the number of deaths in this key population [hence the observed drop
in prevalence]. Further, PWID who switch to non-injecting forms of drug use or to substitution
therapy will also be excluded over time from this population. The possibility also exists that the

34
study did not reach some of the most at risk PWID. To conclude, we need further studies to
elucidate the relative contribution of these factors to the observed changes in HIV prevalence
among PWID.
Activities to reduce HIV transmission among and from
PWID Needle and Syringe Programs Based on report of Drug Control Headquarters, the total number of PWID is estimated to be
200000 (170000 – 230000).(14,15)
By September 2014, there were 580 centers operating under
supervision of universities of medical sciences or the State Welfare Organization that delivered
free needles and syringes to IDUs.(12,13)
Over a one-year period ending in September 2014 these
centers had distributed some 10,136,060 free needles and syringes.(12,13)
This amounts to 44-
60 syringes per individual IDU. The figure is still far from recommended coverage (200
syringes per PWID per year). (44)
However it seems that a significant number of IDUs are
obtaining their needles and syringes from pharmacies. Based on the 2007 bio-behavioral survey of
IDUs 48.6% of those who had injected drugs over the preceding month had, in fact, bought the
syringes and needles they had used on most occasions from a pharmacy. (50)
The figure in
biobehaviour study in 2014 was 51.2%. (3)
In the same study, those who had obtained the syringes
and needles they had used on most occasions from DICs and outreach teams amounted
respectively to 43.6% and 7.3% of the IDUs.(3)
According to the bio-behavioral survey of IDUs in 2014, respondents continue to carry out risky
behavior on a daily basis despite relatively high levels of awareness (94.1%) regarding HIV
transmission risk factors. (3)
The study indicates that - after weighting- 81.5% of PWID used
sterile needle and syringe in their last drug injection. (3)
In the same study, 28.5% of PWID,
used shared drug injection equipment other than syringe, 26.8%had shared injection, and 53.2%
had more than 2 injection partners. (3)
Therefore, it seems that further development of harm-
reduction programs remains a serious imperative. It should be considered that although HIV
epidemic could spread very rapidly among PWID, it is also the one that respond effectively to
harm reduction activities and new cases reduce rapidly. (46)
It is estimated that an increase in
coverage level of sterile syringe programs in IDUs from 80% to 95% could lead to an estimated
75% drop in the rate of incidence of HIV infections in this population. (7) So reconsidering the
quality of harm reduction services, reviewing necessary intervention in respect to changing pattern
of drug use is a major necessity. It is seems that community based intervention should replace
policies based on detention of drug user
Substance Maintenance Treatment
Methadone Maintenance Treatment: By September 2014, methadone maintenance treatment was
being offered to IDUs at 5983 centers supervised by medical sciences universities, State Welfare
Organization or Prisons’ Organization. Of them, 5744 (96.1%) were private sector centers and 239
35
public sector centers. (12, 52)
Over a one-year period ending in September 2011, a total of about
half a million (476232) drug users have received methadone maintenance treatment. Of them
420929 (88.4%)were on treatment for more than 6 months. (51)
Among those under MMT, 25580
(5.4%) were IDU and 476232 (94.6%) non IDU drug user. (51)
This figure needs to be improved.
The 2014 bio-behavioral survey had found that of those individuals who had injected drugs over
the preceding one-year period, 42.1 % were receiving maintenance treatment at the time of the
study. (3)
This figure was 42.6% in 2010 and 33% in the biologic-behavioral survey of 2007. (50)
Though the increase indicates an improvement of MMT coverage, it also underscores the need for
expansion of the program. The trend of development of MMT programs in Iranian prisons has
been one of growth since 2001, although in the last two year, its growth was slowed down. By
February 2014, more than 43,500 inmates were receiving methadone maintenance
treatment.(Figure 15) (52)
Therefore it seems that all this substantial progress notwithstanding,
still far from all inmates in need of MMT are covered by treatment. Therefore further support for
MMT is essential for extending coverage without compromising quality of treatment both at
community level and in prison settings.
Another important issue pertains to indications of increased use of amphetamine like substances
among drug users and MMT recipients. (11)
The same concern also extends to inmates. (27, 28)
Biobehavioural survey among PWID in 2014 showed that among those who injected in the last
month, 20.7% mostly used methamphetamine and of them 21.1% injected it. (3)
In addition using
methamphetamine – like drugs along side of other drugs were prevalent. (3)
Based on the
biobehavioural survey conducted in 2012- 2013, 11.6% of prisoner used ALS in the last month in
comparison of 2.8% in 2009. (27)
It is noteworthy that 27.98% of those used ALS injected it. (27)
This may compromise the success of current harm reduction programs seriously. Research for
situation assessment as well as design and implementation of evidence-based interventions in this
regard seems vital.
Other Substance Maintenance Treatments: In addition to MMT, buprenorphine maintenance
treatment is also offered for drug users, including injectors. Opium tincture solution maintenance
treatment has been delivered as a pilot project during 2008- 2010. It is a kind of OST medication
in a form of a Tincture containing predetermined concentration of opium, which prescribed under
supervision of trained Physician. Trail results suggest it to be effective for certain categories of
drug users who are not suitable candidates for MMT and at this time 26276 persons are
under treatment with this tincture. (51)
Figure 15: Graph depicting growth of the number of inmates covered by methadone maintenance
treatment nationwide

36
0 100 300 1400 2800
8040
19539
25407 25000
28826
38256 40088 40143
43500
0
5000
10000
15000
20000
25000
30000
35000
40000
45000
50000
1380 1381 1382 1383 1384 1385 1386 1387 1388 1389 1390 1391 1392 1393

37
Table 2 shows characteristics of substitution maintenance treatment in Iran.
Type treatment Private Public Total 6 month retention
on treatment
MMT (female) 30915 2358 33273 26276
MMT (male) 410062 32897 442959 394653
MMT (total) 440977 35255 476232 420929
Buprenorphine Maintenance
treatment 96937 87462
Tincture of opium 26276
Prevention of sexual transmission of HIV from PWID Condoms are provided free of charge to clients at triangular clinics and DICs and by
outreach teams. (41, 53)
PWID: In the 2014 bio-behavioral survey about 49.7% of IDUs were found to be ever-
married or married with 15.8% currently living with their spouses.(2) About 44.9% of them
had sex with their spouses over the preceding year. About 9% of them reported the
consistent use of condom. (3)
In this study, 47.4% reported having had sex with giving or
receiving money or something, of them 63.9% were in the preceding year. (3)
About 16.5%
of male IDU had ever sex with another man. The frequency of having more than one sexual
partner among those who had casual sex and sex with a SW during last year, were
respectively 62.4% and 76.4%. Ratios of those who have used a condom in their last selling
or buying sex; or casual sex were 39.5% and 31.5% respectively. (3)
So it seems there is a long way to go in improving coverage of condom use. In a study
that was conducted to determine the impact of interventions on HIV incidence, it was
estimated that an increase of condom use in IDUs from 30% to 90% could reduce new
cases of HIV in their sex partners by 93 %. (7)
Sex Partners of PWID: A study among sexual partners of PWID in three cities in Iran,,
found they used condoms in the last sexual contact with their regular and non-regular
partners in 60% and 25% of the cases respectively. (26)
Education and information among PWID Information and education for PWID is delivered at Triangular Clinics, outreach
programs, drug treatment center, community based educational centers, prisons, DICs and
NGOs. (53)
In the 2014 survey there were only a small percentage (6.5%%) of IDUs who
had never heard about HIV. (3)
This value was about two times of the value that found in
the first survey in 2007 and the second one in 2010. (3)
An overwhelming majority of
respondents knew of the effect of condom use (94.4%) and limiting sexual contact to a
single, non-infected partner in preventing HIV transmission (90.2%). (3)
Thus the
Knowledge about sexual prevention of HIV among PWID is high, but its effect on the
practice is limited and high risk sexual behavior is routinely experienced by them. To
38
improve the behavior, strengthening educational programs and increasing access to
prevention services in needed.
The same study indicated 94.1% of PWID know about the risk of HIV transmission by
sharing syringes. (3)
Because of high risk of HIV transmission by sharing syringes, the
figure should be increased still.
Misconceptions such as believing that mosquito bites (56.7% correct answer) and sharing
meals with PLWH could lead to transmission of the infection (78.9% correct answer)
improved among PWID, but other population groups should be improved more. (3)
Eliminate new HIV infections among children Indicators related to mother to child transmission
3.1. Indicator name: Prevention of mother-to-child transmission
Definition of indicator: Percentage of HIV-positive pregnant women who received
antiretroviral to reduce the risk of mother-to-child transmission
Measurement tools: Numerator: Inquiries from Universities of Medical Sciences and
Health Services. Denominator: Estimation method.
Indicator measurement: Numerator: From 21 September 2013 to 21 September 2014,
totally 168 pregnant women received ART for prevention of mother-to-child transmission. (12)
Denominator: According to Spectrum, there were 845 pregnant women living with
HIV in 2014. (16)
Indicator value: 19.9% during the abovementioned period.
Discussion: A comprehensive PMTCT program began to be implemented from March
2014. This intervention was implemented in 16 high risk region over the country. The
intervention caused an increase in the finding of pregnant women living with HIV, so that
the number of them increased from 132 I the previous reporting period to 168 in this
report. (12)
However, PMTCT program should intensified in Iran.
3.2. Indicator name: Early infant diagnosis
Definition of indicator: Percentage of infants born to HIV-positive women receiving
a virological test for HIV within 2 months of birth
Measurement tools: Denominator and nominator: Program monitoring.
Indicator measurement: From 21 September 2013 to 21 September 2014, totally 125
neonates was born from pregnant HIV positive women, and 71 (56.8%) received a
virological test for HIV within 2 months of birth. (12)
Discussion: According to limited access to virologic testing, neonates who did not access
to this test were followed by immunologic tests. 122 of these neonate received 6 weeks
AZT, From 71 neonate who were tested virologically, 9 were positive. A some of 121
received exclusive formula milk. (12)
However, PMTCT program should intensified in
Iran.
3.3. Indicator name: Mother-to-Child transmission of HIV (modelled)
Definition of indicator: Estimated percentage of child HIV infections from HIV-positive
women delivering in the past 12 months

39
Measurement tools: Spectrum software was used.
Indicator value: 42.5%
Discussion: Although all diagnosed neonate received prevention services, but critical
point to intervene is diagnosis of HIV positive pregnant women. Interventions to prevent
mother to child transmission were scaled up in 2014 and the latest projection estimation
were conducted before this scale up, so it seems that final transmission rate should be
lower. It seems that the software failed to determine the effect of this intervention.
Although the coverage of the intervention is yet limited and need to be increased, but it
should not be without any effect. Based on the latest version of Spectrum software,
projection estimation will be revised soon.
Activities to reduce HIV MTCT The process of identifying HIV positive women has seen an ascending trend in recent
years. (8)
This might help explain the aforementioned increase in the number of HIV
positive children.
The provision of ARV therapy for prevention of MTCT has been placed in the national
care and treatment guidelines since 2006. (49)
Originally related services were delivered as
part of those intended for HIV positive women under the PLWH Care and Treatment
Strategy, (54)
but with the establishment of Triangular clinics, the provision of reproductive
health services and ARV therapy aimed at prevention of MTCT as well as care and
treatment of infected children were all included in the package of services delivered by
these centers. In 2013 a plan to link AIDs programs to RH programs was developed with
the aim of reducing MTCT. The plan was implemented in 166 high-risk zones in 14
provinces in Iran starting in March 2014. (53)
The plan envisions the following four areas:
prevention of infections in women and young girls; family planning and reproductive
health for women infected with HIV, healthy childbirth for infected women, and newborn
follow-ups and care and treatment for infected newborns. One of the core services planned
is the delivery of VCTs to all pregnant women residents of these high-risk zones based on
the PITC approach. (53)
A six-month operation of the plan led to an increase in the
number of identified pregnant women such that the total number of infected women
identified increased from 132 women in the previous year to 181 cases after
implementation. According to data pertaining to government-run health and treatment
centers 26603 pregnant women were tested for HIV from August 2013 to August 2014, of
whom 26518 were informed of their test results. (12)
There were 67 positive cases found
among these women.
Since many private and academic sector physicians routinely request HIV testing for all
pregnant women, in the absence of a recording and reporting mechanism in these sectors,
the real figure for HIV tests remains unknown. (53)
Of the 181 HIV positive pregnant
women identified, 168 cases were provided with ARV medication. (12)
In 100 such cases
the ARV regimen was initiated solely for prevention of MTCT, while in the remaining 68
cases, the mothers themselves required therapy for their own health. Treatment initiation
indication was clinical in 25 cases, whereas in the other cases it was due to CD4 levels
below required treatment initiation level. (12)

40
Provision of antiretroviral treatment Indicators related to treatment and care 4.1. Indicator name: HIV treatment: antiretroviral therapy
Definition of indicator: Percentage of eligible adults and children currently receiving
antiretroviral therapy
Measurement tools: Numerator: Data acquired from antiretroviral therapy registry system
Denominator: Spectrum software for estimation
Measurement Method: Numerator: At the September 2014, 5585 PLWH (Including
1516 female and 4069 male) were receiving Antiretroviral Therapy.(17) Denominator:
Estimated by Spectrum Software, the number of PLWH was 76100 and those who need
ART across the country was 27800 in 2014.(17)
Value of indicator: In September 2014, 7.3% of PLWH and 20.1% of PLWH eligible to
ART (according to national guidelines) received it.
Discussion: A study about HIV test, retain and treat cascade was done last year in Iran. According to this study, the biggest defect was in the diagnosis of those PLWH who do not know their serostatus. At present the development of an action plan to scale up care and treatment coverage is underway. Case finding began to scale up from last year and the number of those were tested for HIV increased two times. These interventions are expected to increase coverage of ART.
4.2. Indicator name: Twelve month retention on antiretroviral therapy Definition of indicator: Percentage of adults and children with HIV known to be on
treatment 12 months after initiation of antiretroviral therapy
Measurement tools: ART registries (17)
Indicator value: Twelve months retention on ART for those that initiated ART
during 20 September 2012 until 20 September 2013 was 84.8%. The figure for women
was 88.4% and for men 83.4%. (17) 12, 24, 60 months retention on ART in 2008 to 2013
disaggregated by sex, age and drug history were showed in annexes.
Activities in the field of ART A study conducted in the field of HIV test-retain- treat cascade in I.R.Iran in 2013. An updated
summary of this study is presented following sections.
Step 1: HIV testing HIV testing and counselling is one of the strategies of National Strategic Plan for HIV
control. It is emphasized that HIV testing should be provided with confidentiality,
informed consent, counselling, correct results, and correct services. Main target groups for
HIV testing and counselling are: PWID and their sexual partners, SW and their sexual
partners, people at high risk sexual behaviour (MSM and transsexuals), sexual partners of
those with history unsafe sexual behaviour, partners of known PLWH, prisoners, at risk
pregnant women and pregnant women living in marginalized region of the cities, and STI
patients. The recommended approach for these groups is provider-initiated method. In
addition, providing access to these services was considered for all people older than 15
year. Recently HIV testing was offered to TB patients regardless of risk factors. Also VCT

41
is offered to all people requested for, through triangular clinics. HIV testing algorithm for
case detection is based on three serial testing. (40)
At present 1017 health care facility are responsible for HIV testing and counselling, using
rapid test and/or Elisa test. The types of these centers and number of each type include
Triangular clinics and sites (310 centers); antenatal clinics (132 centers), centers developed
specifically for PMTCT (166 centers), drop in centers for men (75 centers), drop in centers
for women (7 centers), shelters for men (3 centers), shelters for men (1 center), special
centers for vulnerable women (28 centers), prisons(85 centers),MMT centers (74 centers),
some selected hospitals(86 centers) and private clinics(50 centers). (12)
HCT in public health
system (e.g. triangular clinics, public MMT centres, DICs and centres for vulnerable
women, TB clinics, ANCs) are free of charge. (40)
HTC Coverage among all population: During one year ending to September 2014, 113413
persons were tested for HIV almost all in public facilities. (12)
Although clinicians in private
section widely test their patient for HIV testing, at this time there is no statistics to provide. (40(
HTC Coverage among young people: A study among young population 15-29 years old
conducted over the country in 2013 revealed, 14% were tested for HIV during last year. (10)
HTC Coverage among PWID: The 2014 bio-behavioral survey among PWID indicated that
56.2% of PWID knew where they could receive HIV testing if they want. Based on this
study, 55.9% of PWID ever received HIV testing. Of the study population 27.2% received
HIV testing in the last year and know its result. (3)
Because of high rate of incarceration and
refer to health care services, (3)
it seems that these setting provide good opportunity for HIV
testing provision. (40)
HTC Coverage among sex partners of PWID: Study on PWID and their sexual partners in 3
provinces in 2010, revealed that 56.0% knew where to go to receive HIV testing, 28.4% of
them have been ever tested for HIV, of those 81% knew their results. 77% of the
respondents received the test during last 12 months. (26)
HTC Coverage among female sex workers: Biobehavioral study on FSWs shows that
48.3% of them have history of HIV testing. This study also indicated referring to
governmental and private clinics and addiction treatment centers is high and provide a good
opportunity that should be taken into consideration. (9)
HTC Coverage among female transgenders: A cross-sectional study conducted on female
transgenders in Tehran in 2014 suggests that 49 out of 104 (47.1%) have history of at least
one HIV testing and 24 (23.1%) of the respondents received the test during last 12 months
and knew their results. (38)
HTC Coverage among prisoners: BBS study on prisoners in 2012 shows that among 5429
prisoners who responded to a question about ever HIV testing, 2054 (37.7%) had a history
of testing, the mean time of last test were 1.9 year and 61.3% knew their test result. (27)
HTC Coverage among MSM: Studies about prevalence of HIV in men who have sex with
men are very limited and not representative for this group thus is not applicable to a
generalizable conclusion.
HTC Coverage in TB patients: Of total 11073 TB cases in last year 1633(17.7%) received
HIV test. (18)
HTC Coverage in ANC clinics: Between September 22, 2013 and September 22, 2014,
26676 pregnant women received HIV testing in public clinics. Of them 26643 (99.9%)
were informed about their test results and 69 (0.26%) were positive. During the same
period, 8650 pregnant women received HIV testing at the time of labor and 6 (0.07%) were

42
positive. (12)
Private and academic sector screen a very high proportion of pregnant women
for HIV and refer those with positive results to triangular clinics for further services
including confirmatory tests and ART. However, data is not available on number of
pregnant women tested for HIV in theses setting. (40)
HTC Coverage among neonates born to HIV positive mothers: Estimated number of
children exposed to HIV was 845 in 2014. Between September 22, 2013 and September 22,
2014, of 181 pregnant women living with HIV, 125 children were born which 71 of them
(56.8%) were screened with early infant diagnostic tests (PCR) in 2 months after birth.
Only 9 cases (12.7%) were found to be positive. (12)
Nevertheless, counselling and HIV testing service usage usually remains insufficient in
high-risk groups. The most important factors involved in this topic include poor knowledge
about processes of testing and treatment, worrying about discrimination and stigma, fear
and unwillingness of health care workers to work with PLWH or key groups, and poor
information about HIV and available services and poor motivation of key populations. (40)
Regarding necessity of increasing HIV testing coverage, the following intervention is
considered in the national strategic plan (54)
and its implementation is initiated:
1. Strengthening diagnosis of PLWH including:
a. Changing the policy of HIV testing from VCT to PITC in following
population groups:
i. Population with higher risk of HIV infection including PWID and
their sexual partners, FSW and their sexual partners, MSM and their
sexual partners, STI patients and their sexual partners, prisoners,
street children and their sexual partners of PLWH
ii. Population with paramount early diagnosis including pregnant
women and TB patients.
2. Increased access to HIV testing for abovementioned groups including:
a. Usage of HIV rapid test as option for the first test HIV diagnostic algorithm
b. Integrating HTC in centers providing care and treatment or harm reduction
services to HPIT target groups. These centers include DICs, MMT clinics,
centers providing services for FSWs and MSMs, outreach services for street
children, reception wards and triangular clinics of prisons, ANC, TB centers
and private clinics or hospital providing services for most at risk groups
Step 2: Enrollment in HIV Care Up to September 2014, among those diagnosed as HIV positives, 22982 registered in
triangular clinics. (12)
Of them, 19561 (85.1%) were male and 3421 (14.9%) were females.
Of those registered 6716 (29.2%) were dead. This figure was 11.3% for women and 32.3%
for men. Of those registered and alive, 9568 (58.8%) have been visited at least once during
one year ending to September 2014. Attending once annually in triangular clinics were
55.2% and 74.5% for men and women respectively. (12)
This suggests high rate of attrition
in those enrolled in care.
A qualitative study among AIDS officer over the country indicated education and
communication, counseling, supports presented to PLWH, use of peers, hiring motivated

43
experienced personnel and active follow up are the most important mechanisms usually in
place in triangular clinics to retain patients in care. (40)
Regarding necessity of increasing enrollment in care and retention on it, the following
intervention is considered in the national strategic plan (54)
and its implementation is
initiated:
1. Enrolment of diagnosed cases in HIV care and treatment centers including
a. Establishing a referral system from centers providing services for target
groups and with HIV care and treatment centers and vice versa
b. Availability of confirmatory tests in centers providing HIV PITC
Step 3: Pre-ART care Currently 38 Districts are equipped with CD4 counters. This figure has been increased
more than 5 times since 2007. The other ART providing sites refer their patients to the
closest district for this service. (40)
Between September 2013 and September 2014, 6745
PLWH checked their CD4 count at least once annually (41.5% of PLWH registered in
triangular clinics and alive). This figure was 37.3% and 59.7% for men and women
respectively. Over the same period, among those newly registered in triangular clinics
(1600), 1341 (82.3%) checked at least once for CD4. Of them 722 (53.8%) had CD4 below
350. During same period, among those newly diagnosed as HIV positive and at stage 3 or 4
(467 PLWH), 435 (93.1%) checked their CD4 counts. (12)
In 2012, 217 out of 1177 (18%) who initiated ART had clinical staging only (i.e. no CD4
counting) before ART initiation. This figure was 34% (148 out of 434) in 2009. Overally
the figure was 22.1% (532 out of 2406) during 2011-2012 after implementation of latest
national ART guideline in 2011. Before that, the figure was 60% (1195 out of 1989) during
2007- 2010.(40)
Between September22, 2013 and September 22, 2014, 181 out of 1600 (11.3) newly
registered for care, received isoniazid chemoprophylaxis. (12)
Currently 48 positive clubs are functioning supported by Ministry of Health and Welfare
Organization. (12, 13)
Regarding necessity of increasing retention on care, the following intervention is
considered in the national strategic plan and its implementation is initiated:
1. Improving care and treatment services for those enrolled in care Including:
a. Increasing availability and improving quality of laboratory services
b. Availability of CD4 counter in all HIV care and treatment centers
Step 4: Initiation of ART and retention in ART Triangular clinics are responsible venue for ART delivery.
(40) At this time there is 162
health facilities providing ART to PLWH (including 60 centers in working in prisons). (12)
In addition there another 36 health centers in the prisons that have the capability to provide
ART, but have any patient on ART. (12)
Also there 160 VCT sites which can continue ART,
but do not initiate it. (12)
In each triangular clinic, a general practitioner and periodically an
infectious disease specialist visit HIV patients. Prescription of ARVs and any change in
regimen is responsibility of infectious disease specialist. The general practitioner under

44
supervision of the infectious disease specialist provides routine and follow up visits. Patient
receives counseling before and after initiation of ART. The Triangular clinics are modeled
to meet the needs of high-risk population with specific focus on PWID. There is no
restriction to initiate ART for those who meet eligibility criteria.(40)
History of active
drug/alcohol use is not considered as criteria for exclusion of ART.(40)
There is a
continuous increase in proportion of those beginning ART in clinical stage 1 or 2 to those
in clinical stage 3 or 4 from 2006 to 2012. (figure 16) (40)
Figure 16: Trend in proportion of patients started ART in clinical stage 1-2 to clinical stage 3-4
Figure 17 shows outcome of ART among those ever started ART. (17)
Based on ART
registry system, 84.7% (1225 out of 1445) of the cases starting ART from September 2013
to September 2014, retained on ART after 12 months follow up. In the same period, 353
cases stopped ART. The reasons to stop ART were death (134 cases), non-compliance (4
cases), and LTFU (81 cases). (17)
0.26 0.24
0.34
0.26
0.39 0.43
0.66
0
0.1
0.2
0.3
0.4
0.5
0.6
0.7
1385 1386 1387 1388 1389 1390 1391
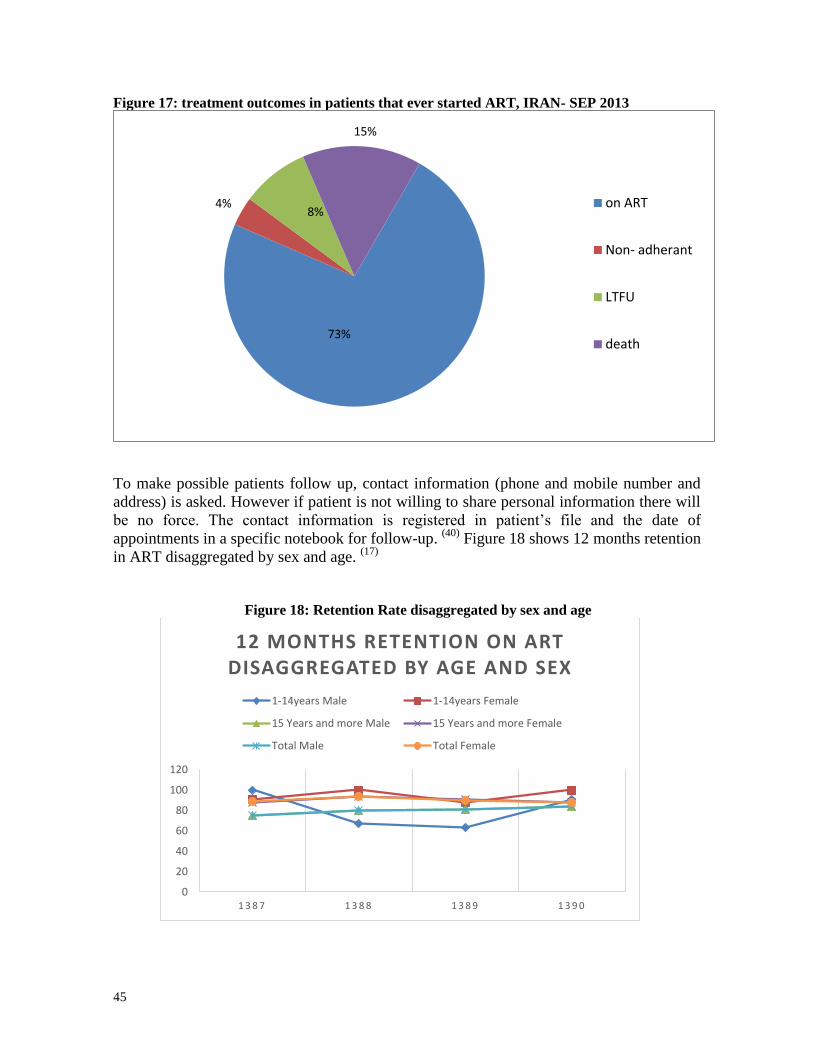
45
Figure 17: treatment outcomes in patients that ever started ART, IRAN- SEP 2013
To make possible patients follow up, contact information (phone and mobile number and
address) is asked. However if patient is not willing to share personal information there will
be no force. The contact information is registered in patient’s file and the date of
appointments in a specific notebook for follow-up. (40)
Figure 18 shows 12 months retention
in ART disaggregated by sex and age. (17)
Figure 18: Retention Rate disaggregated by sex and age
73%
4% 8%
15%
on ART
Non- adherant
LTFU
death
0
20
40
60
80
100
120
1 3 8 7 1 3 8 8 1 3 8 9 1 3 9 0
12 MONTHS RETENTION ON ART DISAGGREGATED BY AGE AND SEX
1-14years Male 1-14years Female
15 Years and more Male 15 Years and more Female
Total Male Total Female

46
A study to evaluate adherence rate among a sample of 174 PLWH on ART suggests that
based on Morisky scoring system, (56)
the study showed 26.4% of those on ART had high
adherence, 41.4% medium adherence, and 32.2% of cases had low adherence rate to ART. (40)
Regarding necessity of increasing coverage of ART and increasing its adherence, the
following intervention is considered in the national strategic plan (54)
and its implementation
is initiated:
1. Increasing access to care and treatment services and improving its quality including
a. Hiring one general practitioner for every 50 PLWH enrolled in care, trained
as “AIDS Care Givers Practitioner”. “AIDS Care Givers Practitioner” will
practice under supervision of ‘AIDS focal points” who are infectious disease
specialist working in each province
b. Establishing and equipping new HIV care and treatment centers as necessary
c. Insuring supply of ARV drugs
d. Establishing regional laboratory centers for testing HIV viral load
e. improving quality of national laboratory center for HIV drug resistance
testing
2. Improving retention on ART Including:
a. providing support services including insurance coverage, financial support,
Professional training, employment, palliative care services, MMT services
for PWID, ART adherence counselling
b. Strengthening infrastructure targeted to improve quality of care and
treatment services including Development of required guidelines and
training materials
Specific considerations for PWID The country tried to design the system in a way to meet their needs and specific
consideration. As an example, three angles of triangular clinics are HIV, STIs and drug use. (57)
The existence of harm reduction services has resulted in better access of injection drug
users to HIV testing services. National guideline promotes inclusion of PWID in all aspects
of comprehensive package of HIV services. In addition, it gives advices to solve specific
problems of PWID like adjustment of methadone dosage for those on ART and anti TB.(49)
Currently, 68 out of 269 sites offering ART have MMT services in place. 142 out of 269
ART sites without MMT in place link their clients to MMT services free of charge. (40)
2404
HIV positive PWID were on ART in September 2013 and 1997 (83.1%) were referred to
their triangular clinic during the last month.
However, there are some problems in access to PWID including poor motivation for
seeking care, being marginalized and stigmatized, high frequency of moving in and out of
prison, which affect continuum of care. ARVs are available in prisons however; changing
situation of the case at the time of incarceration or release that may interrupt treatment at
least temporarily. (40)
Reduce tuberculosis deaths in PLWH
47
Indicators related to HIV/TB coinfection 5.1. Indicator name: Co-management of tuberculosis and HIV
treatment Definition of indicator: Percentage of estimated HIV-positive incident TB cases that
received treatment for both TB and HIV
Measurement tools: Numerator: Inquiries from Universities of Medical Sciences and Health Services. Denominator: estimation method.
Indicator measurement: Numerator: Since 22 September 2013 Till 22 September 2014,
106 persons living with HIV and incident TB, received TB treatment and ART. (18)
Denominator: 260. (19)
Indicator value: Totally 40.8% of PLWH with incident TB, received ART.
Discussion: Although 86% of those referred at least once a year to Triangular clinics
screened for active TB in the year ending in September 2014(12), it seem difficulty of TB
diagnosis among PLWH and inadequate diagnosis of PLWH contribute to low coverage
of indicator improvement in both factors may increase the indicator. Access to more
sensitive diagnostic test may improve TB diagnosis. In recent years, Iran tried to expand
access to GenExpert, but unfurtunately sanctions were a major obstacle. (53)
TB-HIV Activities In order to identify cases of tuberculosis, a requirement has been put in place whereby
HIV positive patients must be proactively examined for active TB in every visit. (49)
In the
one-year period ending in August 2014, of the total 9568 clients who had visited
behavioral disease counseling centers at least once, 8233 (%86) were examined for active
TB. (12)
There is also a requirement to conduct PPD skin testing for all HIV positive cases
with no history of active or latent TB. The recommended time of ART initiation is before
completion of TB treatment. (49)
Financial spending Core indicators related to financial resources 6.1. Indicator name: AIDS spending Definition of indicator: Domestic and international AIDS spending by categories and
financing sources
Indicator Measurement: A program was set up as agenda of Center of Communicable
Diseases Control, titled by “National AIDS Spending Assessment-NASA".
Indicator value: According to NASA, Iran spent a total of 1,676,898,000,000 IR Rial
(US $ 129,650,000) on HIV and AIDS in 2012. (20)
Situation of financial spending (20) Iran spent a total of 1,676,898,000,000 IR Rial (US $ 129,650,000) on HIV and AIDS in
2012. It is near 0.37% of total health expenditure. Public funds constituted 57% of the total
expenditure.

48
Funds from external sources made up 8% of all HIV expenditure in 2012, while private
sources of funding accounted for 35%. The NASA findings regarding providers of HIV
services show that public organizations finance and provide the majority of these services
in Iran.
An estimated 894,979,000,000 IR Rial (53.4% of total expenditure) was spent by public
service providers in 2012. Private sector providers of HIV-related services include are
totally for-profit organizations and was spent 728,402,000,000 IR Rial (43.4% of total
expenditure). The results of NASA confirm the general trend that provision of targeted HIV
prevention services to MARP (45.7% of total expenditure) has relied mostly on Private for
-profit providers (NGOs) funded by private and public sector. Multilateral organizations are
also involved in the provision of various HIV and AIDS services (3.1%).
A further disaggregation of data according to the NASA categories shows that the key
spending priorities in 2012 have been prevention activities (81.1% of total expenditure);
Care and Treatment (9.6% of total expenditure) and Program Management and
Administrative Strengthening (5.8% of total expenditure).
Total expenditure on Care and Treatment in 2012 was 160,147,000,000 IR Rial (US $
12,381,900) (9.6% of total expenditure). Over 72.8% of the total expenditure on Care and
Treatment was spent on outpatient care. Inpatient care has had 25.2% and other spending
categories have had 2% share of total expenditure on Care and Treatment in 2012.
Resources for the national AIDS response have contributed to program management,
planning and coordination, upgrading laboratory facilities, infrastructure and new
equipment, serological surveillance, monitoring and evaluation and other activities within
the area of program management and administrative strengthening. Total spending on this
area was 97416,000,000 IR Rial (5.8% of total expenditure).
Spending on Human Resources made up 31,727,000,000 IR Rial (US $ 2,453,000 (1.9% of
total expenditure)). Although 35.3% of total human resource expenditure is not broken
down but in 2012 most of human resources amount went into monetary incentives for
human resources (35.1% of total human resources expenditure), and training public health
sector personnel (22.3%).
Analysis beneficiary populations show that the most beneficiary population of HIV/AIDS
services is MARP. 45.7% of total spent benefited the MARP and 16.9% other key
population, 2.9 specific “accessible” population (people attending STI clinics, youth at
school, etc.), 15% general population, 11.9% PLHIV, 7.1% non- targeted interventions.
There are some key AIDS related services in the NASA guideline that they are not provide
and deliver in Iran or provide at the very small scale such as social condom marketing,
social services and social protection.
Based on the National Health Account (NHA) reporting, the Out Of Pocket (OOP) in health
sector is high in Iran. The share of it in AIDS related services financing is 35%. But since
the many service of HIV/AIDS are free of charge in Iran so that it was expected the value
of it's would be very low.
Eliminating gender inequalities, stigma and
discrimination Related core indicators

49
7.1. Indicator name: Prevalence of recent intimate partner violence
Definition of indicator: Proportion of ever-married or partnered women aged 15-49
who experienced physical or sexual violence from a male intimate partner in the past 12
months
Measurement tools: Population based study is recommended.
Indicator value: At this time there is not any study to measure the indicator
8.1. Indicator name: attitudes towards people living with HIV
Measurement tools: Population based (DHS 2010).
Indicator value: 45.6% of women 14- 49 year old do not boy vegetable from HIV
positive shopkeeper and 43.1% reject the work of an HIV positive teacher. (48)
Discussion: In both questions, correct answers were lower in rural area in
comparison to urban area. (48)
Stigma and discrimination situation Discrimination and stigmatization are among key, impactful factors in the HIV epidemic,
the easing of which requires solutions and interventions in many areas including national,
social, family, educational and health and treatment levels.
While it seems that compared with findings of studies conducted in the past, public
perceptions have improved, discrimination and stigmatization continue to prevail against
PLWH in Iran, as is true elsewhere in the world.
In a survey of 4868 persons aged 15 to 29 years old in 2013 in 13 provinces across the
country %87.6 of the respondents agreed with the statement: “HIV infected individuals
should be supported and receive treatment.” %66.3 of the respondents agreed that “AIDS
is not just the problem for injecting drug users and sexually promiscuous individuals (such
as homosexuals and prostitutes),” while %66.2 agreed that “one must not shun or ostracize
family members of an HIV positive individual.” The same study reports that %61.4 of the
respondents rejected the statement: “the best way to prevent AIDS is to quarantine PLWH”
and %60.2 disagreed with the statement “HIV infected persons bring shame to themselves
and their families.” Lower scores included %45.8 agreeing with the statement “ I am
willing to dine at the same table with an HIV positive person” and %38.3 with the
statement “I am willing to be a classmate or coworker of an HIV positive person.” The
study concludes that %5.3 of the respondents (260 persons) had a negative attitude toward
PLWH while the attitude of %52.7 (2567 persons) was positive. The grading placed %41.9
of those surveyed in the “neutral” category. (10)
Among the interventions and solutions to reduce stigmatization and discrimination against
PLWH is the drafting and legislation of laws promoting the social rights of PLWH in order
to end any exclusion from public rights and to provide social and occupational security.
Other effective interventions against stigmatization and discrimination include education,
consciousness raising, public awareness with regard to the disease and its prevention,

50
treatment and care as well as integrating MTCT prevention and harm reduction
interventions into existing public health programs.
Eliminate HIV-related restrictions on entry,
stay and residence
9.1. This indicator would be measured directly by UNAIDS.
Strengthening HIV integration Related core indicators 10.1. Indicator name: Orphans school attendance
Definition of indicator: Current school attendance among orphans and non-orphans (10–
14 years old, primary school age, secondary school age)
Measurement tools: A population based survey was utilized to work out this indicator. Based on multiple cluster random sampling, a survey was implemented in 2008 on 2000 teen aged and young individuals aged 10-24 with record of over one year residence in the 9 region of 7 cities , Knowledge scale of the young people was measured by a standard questionnaire. In this way target data about the young people aged 15-24 was acquired.
(21)
Indicator value: 92.4% of the children survey in this report and aged 10-14 with at least
one parent alive attended school at the time of the study. Due to the small number of those
children who had lost both parents, it is impossible to give reliable figures for this group. (21)
10.2. Indicator name: External economic support to the poorest households
Definition of indicator: Proportion of the poorest households who received external
economic support in the last 3 months
Measurement tools: Population based study is recommended.
Indicator value: At this time there is not any study to measure directly the indicator. But
regarding that at this time, 100% of Iranian families have been receiving monthly
financial subsidy from 14 months ago, the ratio of direct financial help is definitely
100%. Moreover, Imam Khomeini Relief Committee and Welfare Organization also
provide some special financial and non-financial help to the poorest families.
In “Health Structure Plan” which began in last year, a significant part of health fees are
paid by government.
Support situation A core component of the Strategic Plan to Control AIDS is one that encompasses activities
pertaining to empowerment and support for PLWH, including insurance coverage, shelter,
vocational training & employment and subsistence financial support for those who qualify.
(43, 54) These activities aim to improve the quality of life among PLWH and reduce the risk
of HIV transmission from these individuals to other members of society. Base on this idea,
the establishment of “Positive Clubs” was envisioned. (43)
The underlying idea for positive

51
clubs is that all PLWH must be provided with appropriate psycho-social support given their
status, in a manner no different from other members of the general public. Positive clubs
are a safe setting established by the non-government sector alongside behavioral counseling
centers in some districts meeting certain requirements. They work to improve services
related to positive prevention and psycho-social support among people living or affected by
HIV. (54)
There are currently 48 such clubs operating across the country. Their activities extend to
various areas and scopes. Ongoing activities include: services to create an atmosphere of
amity, services to promote positive prevention, services to improve individual life styles
and enhance adherence to treatment and services related to psycho-social support. (54)
According to MoH AIDS Office reports, by March 2014 there were a total of 1446 positive
club members among PLWH. Activities planned at these clubs including life-skills
education, psychological services and vocational training, are all delivered and managed by
the members themselves. The State Welfare Organization provides these clubs with
financial support. (43)
Another important program in the area of support is the establishment of the sub-committee
for social support led by the Ministry of Welfare and Social Affairs. The committee handles
health insurance coverage for all PLWH and their families.
Furthermore, there has been legislation put in place at national level to reduce
discrimination against PLWH, including those prohibiting non-enrollment of HIV positive
children at schools, employment and public sector recruitment restrictions against PLWH
and restrictions against travel for PLWH. (54)
The National Organization for Technical and Vocational Training is engaged in the
vocational empowering of 30000 recovering male and female drug addicts annually at
prisons, drug rehabilitation camps and centers for MMT. It has also engaged in center-
based and distance vocational education and empowerment of women, particularly women
heads of household, street children and foreign citizens.(54)

52
The State Welfare Organization provides care and support for 100 AIDS orphans. Of these
children 22 live at centers run by the Organization among other children, while the
remaining 78 are supported by positive clubs.
Situation of strategic plan With the identification of the first case of HIV infection in 1987, Iran’s national response
commenced in 1988 with the formation of the Supreme Council for AIDS.(5)
The Islamic
Republic of Iran is committed to controlling the AIDS infection and to improve the health
of its populace, in cooperation with other countries of the world. It has therefore adopted a
participatory approach in developing three national strategic plans that have involved all
program stakeholders in an integrated plan implemented at the national level by a unified
steering committee, while also conducting monitoring and evaluation. The First
Comprehensive National Strategic Plan for HIV Control was drafted in 2001.(5)
The Fourth National Strategic Plan for HIV Control (55)
covering the 2015-2019 period has
been drafted and finalized through close collaboration of all program partners and
stakeholders, including national organizations, international agencies, non-government
sectors, NGOs, academicians, representatives of high-risk population groups and
representatives of PLWH. In order to insure political support and guarantee enforceability,
starting with the 2nd
NSP, all national strategic plans have been approved by the Cabinet
and their implementation has been officially mandated for all state organizations by orders
of the senior vice president. The 4th
NSP for AIDS control has already been submitted to
the Cabinet of Ministers for approval. The executive order of president mandating its
implementation is expected to be issued by the beginning of its first year of operation in
2015 (March 21st, the beginning of the Iranian calendar year).

53
Similar to the first three NSPs the Fourth National Strategic Plan for AIDS Control has
been drafted and shall be implemented monitored and evaluated using a systematic
framework. There is a National Committee for AID Control comprising high-ranking
officials from all partner organizations and bodies and representatives of stakeholders who
oversee the trend of the epidemic and the national response. A technical working group
under this National Committee was in charge of developing the 4th
NSP for AIDS Control.
It comprised 54 experts and pundits from across the country within a framework of 7
specialized sub-groups including Education and Information, Harm Reduction, Prevention
of Sexual Transmission, Care for Street Children, Care and Treatment, Support, and
Monitoring & Evaluation. The 4th
NSP has been developed on the bases of the results of a
situation analysis and assessment of indicators related to achievement of the objectives and
strategies delineated in the 3rd
NSP. Key members of the technical working group are
experts and pundits at various offices of the MoH, Ministry of Interior, Ministry of Labor
and Social Welfare, MoE, Ministry of Sports and Youth Affairs, the DCHQ, the Prisons’
Organization, State Welfare Organization and the IRIB (State-run National Broadcaster).
In accordance with its underlying vision, the 4th
NSP for AIDS Control includes five goals
which are based on the results of a situation analysis of the state of the HIV epidemic in
Iran and have been developed using the outcomes for indicators and objectives of previous
NSPs and in line with international experiences and objectives. In developing the
objectives and goals, special heed has been paid to the fact that Iran is in the IDU
concentrated epidemic stage, while the sexual mode of transmission of HIV has been on the
rise in recent years. Thus the goals mostly focus on reduction of incidence of new cases and
reduction of mortality. The objectives are fully targeted with relevant indicators focusing
on control of HIV prevalence in three target populations, i.e the general public; IDUs and

54
persons at risk of sexual transmission; and reduction of incidence of infection in newborns,
all aiming to reduce AIDS related mortality.
The five goals of the 4th
NSP for AIDS Control are as follows: (55)
- Maintaining prevalence of HIV infection at a level of under %0.15 in the general
population by the end of the Plan,
- Maintaining prevalence of HIV infection at a level of under %15 in IDUs by the end of the
Plan,
- Maintaining prevalence of HIV infection at a level of under %5 in people at risk of sexual
transmission by the end of the Plan,
- A %90 reduction in the incidence of HIV in live neonates born to HIV positive pregnant
women by the end of the Plan,
- A %20 reduction in AIDS related mortality in PLWH by the end of the Plan.
Among the strengths of the 4th
NSP is the aim of maintaining the level of HIV prevalence
in the three aforementioned populations based on the expected realization of the objective
of reducing the number of new incidences of HIV infection to the target level of zero as
well as the expected realization of the objective of reducing mortality to the target level of
zero.
The 4th
NSP for AIDS Control includes 168 short-term (annual) objectives which are
structured under 14 medium-term objectives and 11 underlying strategies. The core criteria
in developing these objectives have been the population sub-groups and their need for
special service packages in order to achieve the medium term goals. Thus the main
components of each package of services for short-term objectives have been determined in
correspondence with medium-term objectives and Plan goals. Furthermore, in accordance
with each partner organization’s mission statement, sponsor organization or organizations
have been designated for each objective . In cases where there is more than one sponsor for
an objective , the share and contribution of each has been specified under each objective.
Other strengths of the 4th
NSP which set it aside from previous NSPs include an emphasis
on Provider Initiated HIV Testing in the third strategy; Promotion of condom use in

55
preventing HIV infection and STDs in the fifth strategy; emphasis on follow-up programs
for MTCT as a separate strategy; and planning for infrastructural reinforcement in the
eleventh strategy.
Main intervention issues which have been specifically heeded in the 4th
NSP in addition to
existing objectives and strategies of the 3rd
NSP include: 54
- Special attention to sexual health in high-risk populations and among youth and the
promotion of healthy sexual behaviors,
- Qualitative and quantitative expansion of coverage of harm reduction services for IDUs,
- Special attention to the shifting patterns of drug use and emphasis on reducing the
consequences of sexual transmission of HIV as a result of stimulant and psychoactive
substance use,
- Improvement of prevention programs for women and girls and identification of HIV
infected pregnant women for the purpose of delivering MTCT prevention services,
- Improvement of programs aimed at identifying cases of HIV infection, monitoring of
positive cases and increasing coverage of ARV therapy programs,
- Improvement of the supply and distribution chain for ARV medication and enhancement of
care and treatment for cases resistant to treatment,
- Improvement of case identifications for TB infection in HIV positive individuals as well as
HIV infections in TB patients,
- Qualitative and quantitative improvement of HIV prevention, care and treatment programs
for inmates,
- Increased number of programs to de-stigmatize HIV with the aim of reducing
discrimination and facilitate access to services,
- Strengthening of applied research particularly in the areas of treatment monitoring and
medication resistance.
Best practices
In cooperation with other UN member states, the Islamic Republic of Iran has consistently
been committed to comprehensive, strategic, large-scale planning aimed at realizing global,
regional and national objectives in controlling the spread of HIV in Iran. In this context,
within the framework of the National Plan for HIV control, significant measures have been

56
designed and implemented with the close collaboration of all Plan partners over the past
two decades. This can unquestionably be considered among the “Best Practices.”
The previous report mentions some of these successful programs and measures which have
significantly improved control of the load of HIV infection and high-risk behavior as
evidenced by scientific surveys and findings. These include:
- Establishment of Behavioral Disease Counseling Centers and gratuitous delivery of
all HIV prevention, care and treatment services therein,
- Establishment of three international training centers in the Eastern-Mediterranean
region focusing on harm reduction, treatment and the HIV care system,
- Establishment of Special Centers for Vulnerable Women,
- Establishment of Positive Clubs,
- Extension of insurance coverage for PLWH and their families
- Successful operation of harm reduction programs particularly through MMT,
- Establishment of a comprehensive second generation HIV care system,
- Establishment of 11 advanced diagnostic index laboratories and the utilization of
novel molecular methods,
- Implementation of a PMTCT program
- Introduction of rapid HIV testing laboratories to the diagnostic network in the
public and private sector,
- Annual updating of national treatment guidelines,
- Continuous training of focal points for treatment at provincial level and treatment
providers at field level.
In addition to measures to maintain and qualitatively improve these practices, there have
been others designed and put in place in the interval between the previous and current
reports, with the cooperation of all stakeholders at national and provincial levels aiming to
fill the gaps in the national AIDS control plan and improve the national response to the
epidemic. Some of these, which can be considered best practices, are as follows:
- Two internet information and social media sites have been launched at national
level by the public sector in Kerman and an NGO in Mashhad. These sites work to
provide effective information to the general public with special emphasis on
adolescents and youth in order to create an appropriate attitude to STIs and HIV and
their modes of transmission. Launched on this year’s World AIDS Day and during
the World AIDS Week, these social networks intend to improve and optimize the
performance of prevention measures for these diseases. Moreover, given the size of
Iran’s student population, there have been several information campaigns at various

57
universities across the country, aiming to improve student awareness of modes of
transmission and prevention of HIV and STDs. In addition to providing educational
material, these campaigns provide access to counseling and rapid HIV testing.
- One of Iran’s medical sciences universities has been piloting a scheme titled: “HIV
Control Friendly City” to address both stigmatization and discrimination and the
issue of intra- and inter-sectoral cooperation, both of which constitute important
gaps in NSP planned interventions. The scheme is intended as an example of a
comprehensive solution to the said challenges and may be said to be a first and best
practice in this regard in terms of planning.
- Promoting donor interest has always been a strategic objective of Iran’s health
sector in its HIV prevention and control programs. In the past there have been many
donors involved in health sector programs. But it often seems that, for many
reasons, their presence in HIV control programs is less pronounced. However,
during the past year, two medical sciences universities have succeeded in gaining
support from local donors, thus filling many of the serious financial gaps in their
programs. Likewise on the national scale, the Center for Contagious Disease
Management has succeeded in gaining donor cooperation in vocational and social
support programs for at-risk women in dozens of localities nationwide. This
process seems worthy of mention in the present report given the clear significance
of such participation in the effectiveness of the national Plan.
- Like other Eastern-Mediterranean and North African countries, coverage of
programs in Iran remains less than satisfactory. Many PLWH and target populations
are of IDUs, inmates and their spouses who lack the adherence needed to access
primary health and treatment services or the adherence needed to enter and be
retained into Iran’s free and accessible HIV treatment programs. Even though
action to respond to this challenge has been ongoing, measures that could be
considered as best practice within the framework of the present report include:
strengthening of demand generation for diagnosis, case identification policy shift
from VCT to PITC in vulnerable groups; direct supervision of treatment failure
detection, launching of a treatment monitoring software, regional evaluation of care
and treatment indicators with the presence local administrators and experts,
formation of a network of HIV physicians and health professionals where
specialized treatment courses are delivered with technical support from the Iranian
National AIDS research Center.
- As a setting, prisons are a place considered by planners as high-risk for addiction
and for the HIV epidemic in every society. While the development and
implementation of harm reduction programs and the establishment of behavioral
disease counseling clinics in Iran’s prisons have slowed down the prevalence of
HIV among inmates and have been already recognized as an effective practice, new
to this report in terms of successful practices is the development and
implementation of the Prison based Highly Structured Tuberculosis and AIDS Case
Finding and Follow ups Model which has made active TB and HIV case detection
possible in its pilot run, thus also providing for the delivery of follow-up care and
treatment services after the release of inmates. Among the strengths of this model is
the direct contact between the prison infirmary and outside community healthcare
and treatment centers in referring members of the target population for provision of
post-release planned services or more effective follow-ups. The model is currently

58
being extended to include prisons with an inmate population of 3000 or more across
the country.

59
Challenges and remedial actions Challenges As in many other countries throughout the world, the national plan for HIV control faces
several challenges in the Islamic Republic of Iran; challenges which despite all the efforts
made do not readily avail themselves to solutions. Even though Iran has a comprehensive,
targeted and smart National Strategic Plan in place to control the HIV infection, the
prevailing challenges in managing the epidemic have either not been identified properly or
have not been planned against effectively.
The 4th
NSP for AIDS control has considered the challenges facing the plan on the basis of
the situation analysis of the HIV epidemic and the national response thereof. These
challenges can be categorized as follows:
- The social taboo associated with high-risk behaviors such as substance use and
high-risk sexual contacts, which are the main behavioral factors in HIV
transmission, impede access to at-risk populations. This constitutes an important
part of the challenges facing the HIV control plan. The third NSP has managed to
facilitate access to some at-risk population groups including drug users and even
sex-workers through expansion of drug substitution programs and establishment of
vulnerable women’s counseling centers by involving non-government sectors.
However, certain other at-risk groups, such as working street children, transsexual
individuals, and MSM remain hard to reach. Meanwhile an emerging concern is the
fact that focus and support for harm reduction programs is dwindling both in the
community and in prisons, where the qualitative and quantitative expansion of harm
reduction programs is under serious thread because of severe financial restraints.
- Iran’s Population Youth is another challenge facing preventive interventions
against the spread of HIV. In managing crisis situations, young people are prone to
come across high-risk behaviors related to HIV transmission. Meanwhile the level
of youth awareness of HIV modes of transmission and prevention methods remain
low because of cultural sensitivities and social restrictions against effective public
delivery of information as well as other obstacles in this regard.
- The shifting of the epidemiological pattern of the disease during the
implementation of the 3rd
NSP as a result of the shift of substance abuse pattern
from narcotics to stimulants and the shift of the transmission mode to the sexual,
represents another challenge for the 4th
Plan. Beyond the stage of mere alarm, the
shift in choice of substance of abuse together with other observations regarding
stimulant abuse in prison settings and the concomitant sexual behavior associated
60
with stimulant use, now represent a serious threat in reigniting the epidemic, not
only in drug users but in other population groups as well.
- Infrastructural and administrative limitations are yet another challenge facing
the Plan causing concern regarding implementation of planned interventions.
Excessive red-tape in approving and mandating the Plan vis-a-vis government
organizations and the already difficult task of fully involving all program partners at
various government and ministerial levels impedes any response to this concern.
Other concerns stemming from this challenge include insufficient participation of
non-government and private sectors and the limitedness of social and human
resources needed to implement the interventions.
- The inadequate coverage of HIV care and treatment services is a very impactful
challenge against the national response in HIV infection control. According to the
latest report from Iran’s HIV case recording system, by the end of summer 2014
some … percent of those infected were IDUs. IDUs and their spouses who
constitute the largest group of PLWH, lack the appropriate attitude needed to utilize
even primary healthcare services. Despite the fact that over the course of
implementing the 3rd
Plan, the MoH has tried to provide sufficient access to free
HIV diagnostic, care and treatment services across the country, members of this
population group tend to lack the necessary adherence to be inducted and retained
in HIV care and treatment programs.
- Lack of information on the viral load results in uncertainty regarding treatment
effectiveness. Unfortunately, Iran’s capacity to measure the viral load remains low.
The imposition of international sanctions against Iran represents a serious obstacle
against resolving this challenge.
Remedial actions The following are some suggested executive solutions or remedial actions against the
aforementioned challenges foreseen in the National AIDS Control Program, which have
also been emphasized in the 4th NSP:
- Improvement of HIV case detection through facilitating access to counseling and
testing with the promotion of use of rapid testing kits and adopting a Provider
Initiated Testing and Counseling approach at public and private healthcare and
treatment centers.
- Strengthening discrimination & stigmatization reduction programs in delivery of
prevention and care services to at-risk populations and PLWH
- Improvement of relevant programs to reach street children, adolescents and other
populations at risk of HIV infection for the delivery of health services.
- Continuous training of interested parties for implementation of interventions
foreseen in the NSP at various organizational levels in various organizations.
- Greater involvement of competent and interested NGOs in implementing
community based harm reduction interventions
- enhancement of comprehensive harm reduction programs in the community and
prisons as well as planning for improvement of the proper foundations needed for
management of harms resulting from stimulant and psycho-active substance use.

61
- Qualitative and quantitative expansion of comprehensive HIV prevention and harm
reduction programs designed for at-risk women.
- Qualitative and quantitative expansion of comprehensive HIV prevention and harm
reduction programs designed for adolescents and youth
- Greater focus on the need to improve knowledge and awareness of modes of HIV
transmission among school pupils and university students.
- Improvement of coverage and quality of HIV care and treatment programs
- Stage by stage expansion of PMTCT programs
- Planning for full integration of HIV prevention, care and treatment into the Health
Transformation System
- Increased number of comprehensive, large-scale and continuous public information
and education campaigns on HIV prevention methods through all media outlets,
particularly virtual media and the National Broadcaster
- Greater advocacy among high ranking policymakers and decision makers in
securing the necessary political commitment to support the National AIDS Control
Program

62
Support from the Country’s
Development Partners The National HIV Control Program has always emphasized participation by all government
and non-government program partners as well as representative offices of international
agencies in all stages of planning, implementation, monitoring and evaluation. The 4th
NSP
is no exception.
The national plan engages in annual joint programs aimed at controlling the spread of HIV
with WHO, UNAIDS, UNICEF, UNFPA, UNDP and the Global Fund. The activities in
these programs are based on the AIDS Control NSPs which are developed regularly and
approved by both parties for implementation in order to address existing gaps and
requirements in interventions.
The main reason for involving international agencies, is to bring about comprehensive
cooperation in the program, receive technical and financial support and align the programs
to a greater extent with Iran’s international objectives and commitments. At the same time,
both sides have continually stressed the importance of observing the socio-cultural context
in which the content of these joint programs are to be developed and implemented.
Though in many of these joint programs the quality of technical support has improved since
the previous report, the categorization of Islamic Republic of Iran among Upper-Middle
Income Countries has imposed certain restrictions against financial support and the funding
needed for these programs, particularly as concerns resources from the Global Fund,
causing concerns regarding sustenance and improvement of valuable best practices in
various parts of the National AIDS Control Program, particularly those related to harm

63
reduction and procurement of its required items, HIV care and treatment programs and
procurement of vital medication needed by the patients.
Many HIV prevention, harm reduction and hard-to-reach-population access programs are
delivered through outsourcing to private or non-government sectors. These are generally
financed by international funding because of legal restrictions in this regard in Iranian law.
Therefore, the slowing trend of financial support for such programs may pose a serious
threat against their continuation.
The Islamic Republic of Iran has produced successful experiences in AIDS control and the
existing infrastructure contains the necessary potentials for filling the gaps and improving
the quality and quantity of the programs. Through international support Iran’s national
program indicators could be significantly improved by bringing about program
sustainability; positive international experience exchanges resulting from increased
presence of Iranian administrators, experts and professionals in international forums; and
participation in special training courses.
Doubtlessly, the presence of notable international consultants, experts and pundits in Iran
has proven invaluable to the improvement of the quality and quantity of Iran’s AIDS
control effort through strengthening of existing programs. The continuation of the trend in
the 4th
NSP is expected to facilitate the realization of the envisaged objectives.
Another area where international agencies could help respond to the needs of Iran’s AIDS
control effort is drawing corporate support at national, regional and international levels in
allocating financial and other resources or product label information delivery which could
help fill the existing gaps in the Plan. Also drawing support from athletes, artists and other
celebrities could also help increase public sensitivity in self-protection against the disease.

64
Finally, international organizations are expected to work toward the lifting of the currently
imposed sanctions, which affect various aspects of HIV infection management in Iran. The
sanctions pose a serious concern in key areas of HIV prevention, care and treatment
programs, particularly in procurement of equipment needed by the HIV detection
mechanism as well as procurement of basic medicines.

65
Monitoring and evaluation
environment The national M&E program is a key component of the AIDS Control NSP intended to
measure the objectives set in each part of the program based on each partner organization’s
contribution. It was developed and approved at the same time as the NSP and is
implemented as one of its supplements.
The M&E component of the AIDS Control NSP is led by a national M&E working group
which comprises fully authorized representatives and technical experts from all the program
partner organizations plus representatives from the academia, international agencies, NGOs
and PLWH. The MoH Center for Contagious Disease Management handles the working
group’s secretariat affairs. The working group is also active with the same make-up of
members at provincial level where its secretariat tasks are handled by the deputy directors
of health affairs at each province’s medical sciences university.
The establishment of the second generation HIV care system in Iran during the
implementation of the 3rg NSP constitutes an important achievement in the national
response to HIV as a vital technical asset supporting the monitoring and evaluation of the
AIDS Control Plan. The second generation HIV care system in Iran has been designed
based on the latest international standards and indicators, and includes a number of vital
subsystems, allowing for annual process evaluation as well as evaluation of all output ,
outcome and impact indicators within the Plan. The subsystems within the second
generation HIV care system include: the HIV Case Reporting Software System, snapshot
prevalence studies (sentinel sites) in high-risk populations, bio-behavioral studies of high-
risk populations, model making studies in HIV case estimation and projection, STD
surveillance system, and molecular studies to assess the state of the virus genotype and drug
resistance.
As in the previous plans, in the 4th
AIDS Control NSP, a comprehensive M&E component
is adjunct to the plan and has been developed through the ever-increasing efforts of the
national M&E working group. As such, with the establishment of the second generation
HIV care system, an enhanced analysis of the state of the epidemic and the national
response is now possible.
The M&E program has been ongoing in recent years but did not publish a comprehensive
report until last year. Its documented findings have, nevertheless, been available. .

66
Annexes
Annex 1: Preparation Process of the Report
The work begun in January 2014 by developing the working group..
Data Collection Methods: In order to obtain the data required to monitor national
programme activities, extensive correspondence took place with medical universities and
governmental organizations (the Prisons Organizations, State Welfare Organization,
Blood Transfusion Organization, Ministry of Education, and departments within the
Ministry of Health and Medical Education, such as the Drug Abuse Prevention and
Treatment Office). Existing data in the Centre for Diseases Control was also brought
together. Further, in order to complete and validate, these data was shared with key
informants to compare with data from other sources. Eventually data was triangulated
and finalized.
Reports of BSS studies which are routinely supervised by CDC were reviewed, for
some specific analysis of BSS data, the group contacted directly to principle investigator
of these studies.
Searching strategies was included with online search of Farsi and English scientific
websites. Also request letters was sent to all universities of medical science, HIV related
organizations, and key informants in order to collect all available information which may
be included in the report.
In order to compile the National Composite Policy Index, key individuals from the
governmental and non–governmental sectors as well as representative of PLWHs
were identified and interviewed using the questionnaire in the UNAIDS guidelines.
Data classification, summary and analysis: All the studies obtained were
reviewed, and the data needed to produce the DoC indicators extracted, summarized and
stratified, compared with each other and analyzed and presented as descriptive
indicators as relevant.
Finalizing the report: Over the duration of drafting of the report, program partners have
been involved in preparing various parts, with each part of the text being discussed,
reviewed and approved by program partners via email and participating in meetings. Prior
to submission, program partners reviewed the draft of the report. The report was finalized
after discussion and revision of the initial draft.
.

Annex2: Table of retention on ART
Survival on ART after 24 month ART initiation disaggregated by sex and age-groups
Time period Age
group
Number of those starting
ART(person)
Number of those retained on ART after 24 month
imitation
Percentage of cases survived on ART after
24 month imitation
female male total
female male total
female
Sep. 2011 to
Sep. 2012
<15 23 42 65 20 30 50 86.96% 71.43% 76.92%
15+ 299 1000 1299 246 698 944 82.27% 69.80% 72.67%
Survival on ART after 60 month ART initiation disaggregated by sex and age-groups
Time
period
Age
group
Number of those starting
ART(person)
Number of those retained on ART after 60 month
imitation
Percentage of cases survived on ART after 60
month imitation
female male total
female male total
Sep.
2008 to
Sep.
2009
<15 14 8 22 12 5 17 85.71% 62.50% 77.27%
15+ 110 506 616 87 252 339 79.09% 49.80% 55.03%
Survival on ART after 12 month ART initiation disaggregated by sex and age-groups
Time
period
Age
group
Number of those starting ART(person)
Number of those retained on ART after 12 month
imitation
Percentage of cases survived on ART after
12 month imitation
female male total female male total female male total
Sep.
2012 to
Sep.
2013
15> 21 30 51 19 28 47 90.48% 93.33% 92.16%
+15 376 1018 1394 332 846 1178 88.30% 83.10% 84.51%

Causes of non retention on ART disaggregated by 12, 24, 60 survival
Time period of ART
initiation
Time period
of ART
initiation
Time
period of
ART
initiation
Number of
treatment
interruption
Number of loss to
follow up Total
Sep. 2012 to Sep.
2013 1225 134 5 81 1445
Sep. 2011 to Sep.
2012 994 216 36 118 1364
Sep. 2008 to Sep.
2009 356 183 27 72 638

References
1.Shogli and Fallahnejad, 2012, assessing effectiveness of HIV risk evaluation among pregnant women in
case detection, unpublished
8. AIDS Control Office, MOHME Center for Communicable Disease Management; database of HIV Surveys,
December 2014 (unpublished)
3. Haghdoost et.al, 2014, Bio-behavioral study of IDUs, Kerman HIV knowledge hub(unpublished)
4.Wolfe D. Ilicit drug policies and the global HIV epidemic. International Harm Reduction Development
program. New York, 2004.
5.National HIV committee, situation and response analysis to HIV epidemic, CDC, 2009
6.Haghdoost AA, Mostafavi E, Mirzazadeh A, et al. (2011) Modeling of HIV/AIDS in Iran up to 2014;
Journal of AIDS and HIV research, 3(12): 231-239.
7. Nasirian M, Haghdoost A.A, Feizzadeh A, Mostafavi A, et al; HIV Infection Frequency in Iran: Modeling
for the years 2009- 2015 Project Report; Center for Communicable Disease Management, Regional
Knowledge Hub for HIV/AIDS Surveillance at Kerman University of Medical Sciences, UNAIDS- Iran,
2009, project report.
8. AIDS Control Office, MOHME Center for Communicable Disease Management; HIV/AIDS Case
Registers, December 2014 (unpublished)
9.Haghdoost A. A, et al; Bio-Behavioral Surveillance of Women Sex Workers 2010: Project Report;
Center for Communicable Disease Management, Regional Knowledge Hub for HIV/AIDS Surveillance at
Kerman University of Medical Sciences.
10. Haghdoost A.A., Rafieeyan Rad A, et.al, 2014. Study on Knowledge, attitude and practice about HIV
and amphetamine like amphetanmine (2013-2014) Regional Knowledge Hub for HIV/AIDS Surveillance at
Kerman University of Medical Sciences, UNAIDS- Iran, 2009, project report.
11. Mokrt A. .Methamphetamine and Sexual Behavior: Investigating the Impact of Methamphetamine Use
on Sexual Behavior and HIV Related Risk-taking in a Sample of Iranian Meth-users. Project
report,2010.(Unpublished)
12. Response to Inquiry on Monitoring of Services Delivered at Medical Sciences Universities across Iran,
Feb 2014 (unpublished).
13.Response to Inquiry on Monitoring of Services Delivered at Welfare Organization Centers across Iran,
Feb 2015 (unpublished).
14.Narenjiha, H, Rafii H, Baghestani A, Noori R, Shirin Bayan P, Farhadi M, Vojdani Roshan A O,
Etemadi H; Rapid Situation Assessment of Substance Abuse and Drug Dependence in Iran; Darius
Institute, University of Social Welfare and Rehabilitation Sciences, Tehran, 2005 pp73-86
15.Narenjiha H; Drug Abuse and Dependence Rapid Situation Analysis Report; Darius Institute,
University of Social Welfare and Rehabilitation Sciences, Tehran 2007, pp 49-53
16.Response to Inquiry from the Research Team Conducting the Study “HIV Infection Frequency in Iran:
Modeling for the years 2005- 2020” Center for Communicable Disease Management, Regional
Knowledge Hub for HIV/AIDS Surveillance at Kerman University of Medical Sciences, UNAIDS , Feb
2015 (unpublished).
17.AIDS Control Office, MOHME Center for Communicable Disease Management; ART Registers,
December 2014 (unpublished)
18.Response to Inquiry from TB Office, MOHME Center for Communicable Disease Management; ART
Registers, December 2014 (unpublished)
19. Accessed at: http://www.who.int/tb/country/data/profiles/en/
20.Abulhalaj M, Najafi B. National AIDS Spending Assessmennt, 2012. AIDS Control Office, MOHME
Center for Communicable Disease Management, 2014.

21.Shoghli AR, Rakhshani F, Moosavinasab N, Mohajeri M, Sedaghat A, Gooya M.M; HIV/AIDS-Related
Knowledge, Attitude and Behavior of Adolescents and Youth in Select Areas in Iran: Project Report.
Summer 2008 (unpublished)
22.National AIDS Working Group Secretariat; Islamic Republic of Iran Country Report on Monitoring of
the United Nations General Assembly Special Session on HIV and AIDS; MOHME Feb- Mar 2010.
23. Haghdoost et.al, 2010, Bio-behavioral study of IDUs, Kerman HIV knowledge hub(unpublished)
24.National AIDS Working Group Secretariat; Islamic Republic of Iran Country Report on Monitoring of
the United Nations General Assembly Special Session on HIV and AIDS; MOHME Feb- Mar 2013.
25.Rahimi-Movaghar A1, Amin-Esmaeili M, Haghdoost AA, Sadeghirad B, Mohraz M. HIV prevalence
amongst injecting drug users in Iran: a systematic review of studies conducted during the decade 1998-2007.
Int J Drug Policy. 2012 Jul;23(4):271-8. doi: 10.1016/j.drugpo.2011.09.002. Epub 2011 Oct 14.
26.Haghdoost A. A, Sadjadi L, Mirzazadeh A, Navadeh S,; Behavioral and Serologic Surveillance of
Injecting Drug Users and their Primary Sex Partners in Tehran Shiraz and Mashhad in 2010: Project
Report, MOHME Center for Communicable Disease Management, Regional Knowledge Hub for HIV/AIDS
Surveillance at Kerman University of Medical Sciences, UNODC-Iran (unpublished)
27.Haghdoost A, et al ; Serologic- Behavioral Surveillance of Iranian Inmates in 2012 -2013: Project
Report. (unpublished)
28.Haghdoost A. A, Arabnezhad S, Mirzazadeh A, Navadeh S, Fahimfar N, Kamali K, et al ; Serologic-
Behavioral Surveillance of Iranian Inmates in 2009: Project Report; (unpublished)
29. Shokoohi M, Mohammad, Baneshi MR, Haghdoost AA. Size estimation of most at risk population for HIV
infection in Iran using network scale up (Unpublished)
30. Zamani S, Ono-Kihara M, Ichikawa S, Kihara M. Potential for sexual transmission of HIV infection from
male injecting-drug users who have sex with men in Tehran, Iran. Sex Transm Dis. 2010 Nov;37(11):7 15-8 .
doi: 10.1097/OLQ.0b013e3181e2c73f.
31. Amin-Esmaeili M, Rahimi-Movaghar A, Haghdoost AA, Mohraz M. Evidence of HIV epidemics among
non-injecting drug users in Iran: a systematic review. Addiction .2012 Nov;107(11):1929-38. doi:
10.1111/j.1360-0443.2012.03926.x. Epub 2012 Jun 15.
32.Shoghli S, Mohraz M; Biologic-Behavioral Survey of Working/Street Children In Tehran in Connection
with HIV/AIDS Infection: Project Report; MOHME Center for Disease Management 2010 (unpublished)
33. Ataei B, Nokhodian Z, Babak A, Shoaei P, Mohhammadzadeh M , Sadeghi R. Seroprevalence of Hepatitis
C (HCV) and Human Immunodeficiency Virus (HIV) infection among street children in Isfahan, Iran. Tehran
Univ Med J. 2010; 67 (11 :811-816. )
34. SeyedAhmad SeyedAlinaghi, Abbas OstadTaghi Zadeh, et al. Prevalence of HIV infection and the
correlates among beggars in Tehran, Iran. Asian Pac J Trop Dis 2013; 3(1): 76-78.
35. Zadeh AO, SeyedAlinaghi S, Hassanzad FF, Hajizadeh M, Mohamadi S, Emamzadeh-Fard S, Paydary K,
Hosseini M. Prevalence of HIV infection and the correlates among homeless in Tehran, Iran. Asian Pac J
Trop Biomed. 2014 Jan;4(1):65-8. doi: 10.1016/S2221-1691(14)60210-0.
36.TB Control National Strategic Plan of the Islamic Republic of Iran 2014-2018
37.Nasehi M, Azadmanesh K, et al. Prevalence of HIV infection among TB patient in Iran in 2010. TB
Office, MOHME Center for Communicable Disease Management.
38.Moayedi nia S, et al. HIV prevalence and HIV related behaviour female among transsexual,
2013-2013, (unpublished).
39. Inquiry about implemented programs in Prison Organization, Health Office, January 2015
(unpublished).
40. HIV Test-Treat-Retain Cascade Analysis. National AIDS Committee Secretariat,,Ministry of Health and
Medical Education,I.R.Iran, December 2013.
41.Tirth HIV/AIDS Control National Strategic Plan of the Islamic Republic of Iran 2010-2014
42.Madani S, Shaditalab J, Raeesdana F, Kamkar M; Rapid Situation Analysis of Sex Workers in Tehran
with Emphasis on AIDS-Related High-Risk Behavior; MOHME 2007 (unpublished)
43.Moayedinia s, et al. HIV and some STI prevalence among female sex workers by RDS samling in

Tehrran 2012 – 2013. Project report, (unpublished)
44. Global AIDS Response Progress Reporting, 2014, Construction of Core Indicators for monitoring the
2011 United Nations Political Declaration on HIV and AIDS. UNAIDS, December 2013, Geneva,
Switzerland.
45. Drug control law and additional articles, 7 October 1997.
46. Marlatt G.A. 1998. “Harm Reduction Pragmatic strategies for managing high risk behaviours”. The
Guilford Press, Loundon.
47. The Handbook on Alternatives to Imprisonment, Criminal Justice Handbook Series. UNODC, United
Nations, New York, 2007.
48. Rashidian A and et al. Development and Health Survey, 2010.
49. National clinical PLWH care and treatment guidelines (2014)
Accessedat:http://behdasht.gov.ir/index.aspx?siteid=1&siteid=1&siteid=1&siteid=1&siteid=1&pageid=15
6&catid=64

50.Zamani S, et al; Integrated Biologic-Behavioral Surveillance of HIV Infections among Injecting Drug
Users: Project Report; 2007 (unpublished)
51.Haghdoost AA, Mostafavi E, Mirzazadeh A, et al. (2011) Modeling of HIV/AIDS in Iran up to 2014;
Journal of AIDS and HIV research, 3(12): 231-239.
52.Inquiry with Officers at SAPTO ,MOHEC. January 2015 (unpublished).
53.Inquiry with Officers at Prison Organization , January 2015 (unpublished).
54.Inquiry with Officers at AIDS office and reviewing document. ,MOHEC. January 2015 (unpublished).
55.Forth HIV/AIDS Control National Strategic Plan of the Islamic Republic of Iran 2015-2018
56. Morinsky adherence tool.
Accessedat:http://www.measureuppressuredown.com/HCProf/Find/Toolkit/Plank4Tool1.pdf
57. Best practice in HIV/AIDS prevention and care for injecting drug abusers, the Triangular Clinic in Kermanshah,
Islamic Republic of Iran. WHO, Regional Office for the Eastern Mediterranean Cairo, 2004.