A method for the study of the effects of combining multiple pseudorandom fusimotor stimulation on...
13
Journal of Neuroscience Methods 178 (2009) 103–115 Contents lists available at ScienceDirect Journal of Neuroscience Methods journal homepage: www.elsevier.com/locate/jneumeth A method for the study of the effects of combining multiple pseudorandom fusimotor stimulation on the responses of muscle-spindle primary-ending afferents Manuel Hulliger a , Robert W. Banks b,∗ a Department of Clinical Neurosciences, University of Calgary, Heritage Medical Research Building, Room 106, 3330 Hospital Drive NW, Calgary, Alberta T2N 4N1, Canada b School of Biological and Biomedical Sciences, University of Durham, South Road, Durham DH1 3LE, UK article info Article history: Received 2 September 2008 Received in revised form 27 November 2008 Accepted 1 December 2008 Keywords: Pseudorandom stimulation Fusimotor Multiple independent inputs Muscle spindle abstract We describe a new method of investigation of the integrative action of fusimotor inputs in mammalian muscle spindles by stimulation of multiple fusimotor axons using independent pseudorandom pulse trains, each of low mean rate with pseudorandomly distributed stimulus intervals. Technically it was feasible only because of the development of (1) a novel, highly efficient approach to functional isolation of fusimotor efferents in ventral-root filaments, which we have called the isodyne strategy; (2) a real-time, microprocessor-based stimulus artefact cancellation device (SACAD); and (3) a highly adjustable, multi- branch stimulation electrode array. The general approach of using multiple, independent, pseudorandom stimulation of several input channels has wider applications in controlled-activation paradigms. © 2008 Elsevier B.V. All rights reserved. 1. Introduction The outputs of the sensory endings (primary or secondary) of the mammalian muscle spindle can be considered as functions that involve the integration of time-dependent length, offset (or bias), and sensitivity signals. The offset and sensitivity signals are in the form of motor input from the central nervous system transmit- ted by fusimotor nerve fibres that either supply muscle spindles exclusively ( fibres) or reach the muscle spindle as collateral branches of motoneuronal axons, which, in this context, are often called fibres (for reviews of muscle-spindle structure and function see Banks (2005), Banks and Barker (2004) and Hulliger (1984)). Whereas the responses of spindle afferents to well-defined, time- dependent length and fusimotor drive inputs, including random signals, have been extensively studied, the fusimotor stimulation patterns have mostly been used at relatively high constant rates, typically 100 s −1 , and often applied to a single fibre. Such methods have been used, for example, to establish the 2 main functional cat- egories of fusimotor action: dynamic and static (Matthews, 1962), their subdivisions (Emonet-Dénand et al., 1977), their control of the sensitivity of primary-ending afferents (Hulliger et al., 1977a) and their intrafusal distributions (e.g. Banks, 1991). ∗ Corresponding author. Tel.: +44 191 334 1254; fax: +44 191 334 1201. E-mail addresses: [email protected] (M. Hulliger), [email protected] (R.W. Banks). A single primary ending is the focus of convergence of up to about 10 fusimotor fibres (Banks, 1994), whose natural activation patterns generally involve variable rates of firing with individual mean rates that may be much lower than 100s −1 (as shown e.g. in simulation experiments by Hulliger et al. (1989); and in recordings of fusimotor action potentials during locomotion in the decerebrate cat by Taylor et al. (2006)). In a series of experiments to be described fully elsewhere, we set out to simulate more realistic patterns of fusimotor activation than had previously been achieved, by the combined stimulation of up to 2 static and 2 dynamic fusimotor fibres, or , all act- ing on the same primary ending, using reproducible pseudorandom trains of stimuli. Moreover, each fusimotor fibre could be stimulated with its own individual pattern of impulses, in principle allowing its contribution to the overall response to be analysed by cross- correlation. This was technically very demanding because of the need to remove the stimulation artefacts from the recording of the primary-ending afferent response, or reduce them to manageable levels, in order to provide reliable triggering for data acquisition of the afferent’s firing rate. The difficulty of managing appreciable numbers of fine filaments on the complex arrays of recording and stimulating electrodes necessary for these experiments meant that large stimulation artefacts were usually inevitable. Reliable record- ing during combined fusimotor stimulation using 4 independent pulse patterns, even of the relatively large action potentials of the primary-ending afferents, was only feasible because of the avail- ability of a purpose-built, real-time, stimulus artefact cancellation 0165-0270/$ – see front matter © 2008 Elsevier B.V. All rights reserved. doi:10.1016/j.jneumeth.2008.12.002
Transcript of A method for the study of the effects of combining multiple pseudorandom fusimotor stimulation on...

Afa
Ma
b
a
ARR2A
KPFMM
1
tiaftebcsWdspthetst
r
0d
Journal of Neuroscience Methods 178 (2009) 103–115
Contents lists available at ScienceDirect
Journal of Neuroscience Methods
journa l homepage: www.e lsev ier .com/ locate / jneumeth
method for the study of the effects of combining multiple pseudorandomusimotor stimulation on the responses of muscle-spindle primary-endingfferents
anuel Hulligera, Robert W. Banksb,∗
Department of Clinical Neurosciences, University of Calgary, Heritage Medical Research Building, Room 106, 3330 Hospital Drive NW, Calgary, Alberta T2N 4N1, CanadaSchool of Biological and Biomedical Sciences, University of Durham, South Road, Durham DH1 3LE, UK
r t i c l e i n f o
rticle history:eceived 2 September 2008eceived in revised form
a b s t r a c t
We describe a new method of investigation of the integrative action of fusimotor inputs in mammalianmuscle spindles by stimulation of multiple fusimotor axons using independent pseudorandom pulsetrains, each of low mean rate with pseudorandomly distributed stimulus intervals. Technically it was
7 November 2008ccepted 1 December 2008
eywords:seudorandom stimulationusimotorultiple independent inputs
feasible only because of the development of (1) a novel, highly efficient approach to functional isolationof fusimotor efferents in ventral-root filaments, which we have called the isodyne strategy; (2) a real-time,microprocessor-based stimulus artefact cancellation device (SACAD); and (3) a highly adjustable, multi-branch stimulation electrode array. The general approach of using multiple, independent, pseudorandomstimulation of several input channels has wider applications in controlled-activation paradigms.
© 2008 Elsevier B.V. All rights reserved.
uscle spindle. Introduction
The outputs of the sensory endings (primary or secondary) ofhe mammalian muscle spindle can be considered as functions thatnvolve the integration of time-dependent length, offset (or bias),nd sensitivity signals. The offset and sensitivity signals are in theorm of motor input from the central nervous system transmit-ed by fusimotor nerve fibres that either supply muscle spindlesxclusively (� fibres) or reach the muscle spindle as collateralranches of � motoneuronal axons, which, in this context, are oftenalled � fibres (for reviews of muscle-spindle structure and functionee Banks (2005), Banks and Barker (2004) and Hulliger (1984)).
hereas the responses of spindle afferents to well-defined, time-ependent length and fusimotor drive inputs, including randomignals, have been extensively studied, the fusimotor stimulationatterns have mostly been used at relatively high constant rates,ypically 100 s−1, and often applied to a single fibre. Such methodsave been used, for example, to establish the 2 main functional cat-
gories of fusimotor action: dynamic and static (Matthews, 1962),heir subdivisions (Emonet-Dénand et al., 1977), their control of theensitivity of primary-ending afferents (Hulliger et al., 1977a) andheir intrafusal distributions (e.g. Banks, 1991).∗ Corresponding author. Tel.: +44 191 334 1254; fax: +44 191 334 1201.E-mail addresses: [email protected] (M. Hulliger),
[email protected] (R.W. Banks).
165-0270/$ – see front matter © 2008 Elsevier B.V. All rights reserved.oi:10.1016/j.jneumeth.2008.12.002
A single primary ending is the focus of convergence of up toabout 10 fusimotor fibres (Banks, 1994), whose natural activationpatterns generally involve variable rates of firing with individualmean rates that may be much lower than 100 s−1 (as shown e.g. insimulation experiments by Hulliger et al. (1989); and in recordingsof fusimotor action potentials during locomotion in the decerebratecat by Taylor et al. (2006)).
In a series of experiments to be described fully elsewhere, weset out to simulate more realistic patterns of fusimotor activationthan had previously been achieved, by the combined stimulationof up to 2 static and 2 dynamic fusimotor fibres, � or �, all act-ing on the same primary ending, using reproducible pseudorandomtrains of stimuli. Moreover, each fusimotor fibre could be stimulatedwith its own individual pattern of impulses, in principle allowingits contribution to the overall response to be analysed by cross-correlation. This was technically very demanding because of theneed to remove the stimulation artefacts from the recording of theprimary-ending afferent response, or reduce them to manageablelevels, in order to provide reliable triggering for data acquisitionof the afferent’s firing rate. The difficulty of managing appreciablenumbers of fine filaments on the complex arrays of recording andstimulating electrodes necessary for these experiments meant that
large stimulation artefacts were usually inevitable. Reliable record-ing during combined fusimotor stimulation using 4 independentpulse patterns, even of the relatively large action potentials of theprimary-ending afferents, was only feasible because of the avail-ability of a purpose-built, real-time, stimulus artefact cancellation
1 euros
dcwao1svh1
2
2
sMiroeebatomtadftveag
smochcTmoaceraTtl1lofasep
t
04 M. Hulliger, R.W. Banks / Journal of N
evice (SACAD), developed in the laboratory of one of us (MH). Wehose to restrict our attention to primary-ending afferents becausee wished to study the non-linearities of static and dynamic inter-
ctions. The afferents of secondary endings, although numerous, arenly rarely affected by dynamic fusimotor axons (Appelberg et al.,966), nevertheless our method could in principle be applied to theecondary ending or, indeed, any other system that integrates con-ergent, independent inputs. A preliminary account of the methodas been published previously in abstract form (Hulliger et al.,996).
. Materials and methods
.1. Animal preparation and experimental arrangement
The experiments were carried out on 12 adult cats of bothexes, anaesthetised using sodium pentobarbitone (Somnotol,TC Pharmaceuticals, Ontario, Canada) 40 mg/kg administered
ntraperitoneally, supplemented intravenously with 2–4 mg/kg asequired. The left hind limb was extensively denervated, sparingnly the nerve to peroneus tertius whose tendon was attached to anlectromagnetic puller equipped with length and tension transduc-rs (Baumann and Hulliger, 1991). The muscle was chosen primarilyecause of the relatively few spindles it contains (14.4 on aver-ge; Scott and Young, 1987), since this was expected to enhancehe likelihood of finding at least one target combination of a totalf 2 dynamic and 2 static fusimotor fibres acting on a single pri-ary ending (“pentuplet”). According to Scott and Young (1987),
he full complement of intrafusal muscle fibres is present in onlybout 12 of the spindle capsules per muscle, whereas the remain-er lack the bag1 fibre and are therefore unresponsive to dynamicusimotor stimulation. The basic preparative techniques of func-ionally single-unit afferent and efferent nerve fibres in dorsal- andentral-root filaments have been described previously (e.g. Hulligert al., 1977a). Further details of the division of the ventral-root fil-ments, specifically developed to facilitate these experiments, areiven below.
The experimental arrangement is shown in the simplifiedchematic diagram of Fig. 1. The electromagnetic puller controllinguscle length was driven by a servo-controlled power amplifier
perating under length feedback. The command signal for mus-le length was provided by the summed outputs of an 8-channelybrid signal generator (Frei et al., 1981). Various patterns of mus-le length stimulation were used (constant, trapezoidal, sinusoidal).rains of pulses used to stimulate the fusimotor fibres had fixedean rates (typically 30, 50 or 100 s−1) that were steady (coefficient
f variation 0) or irregular (pseudorandom Gaussian noise, gener-ted mathematically in software and added to the mean interval;oefficient of variation 0.1–0.4). Individual pulse trains were pre-dited with customized software and stored as data files so as to beeproducible. Up to 4 of these trains were read simultaneously byVME microprocessor operating at 10 kHz (channels 1–9, Fig. 1).
he remaining output channels of the VME processor were usedo provide timing signals for the hybrid signal generator control-ing muscle length, including an 8 s master period signal (channel6). The pulse trains for fusimotor stimulation were fed to the iso-ated stimulators via a buffer-amplified matrix, allowing selectionf a particular group of trains, and via the SACAD for stimulus arte-act cancellation (see below for further details of the SACAD). Inll experimental tests the period of data acquisition and recording
panned 40 s, being composed of 5 × 8 s master periods. In the sev-ral examples illustrated in Figs. 4–9 only the immediately relevantortions are included, while retaining the original times.Several dorsal-root filaments each containing a single peroneusertius primary-ending afferent were mounted separately on the
cience Methods 178 (2009) 103–115
branches of a 12-way electrode/pre-amplifier head stage. The out-put of one of the channels was selected for recording, was amplified,filtered, processed by the SACAD, and led to a Schmitt trigger togenerate TTL pulses for data logging by a LSI 11/73 computer sam-pling at 100 kHz, whose clock was used to synchronize the VMEprocessor to ensure precise timing of all control events and stim-ulation profiles. This general synchronization of signals permitted,in particular, a strictly identical reproduction of stimulation pro-files both within and between experiments. The LSI computer alsologged the fusimotor stimulus trains, and both these and the out-put of the Schmitt trigger were continuously monitored visually ininstantaneous discharge rate display mode. Finally, a pair of wire-hook electrodes in contact with the peroneus tertius nerve, andconnected to an electronic switch/pre-amplifier head stage, couldbe used either for stimulation of the nerve to determine afferent-fibre conduction latencies, or to record the neurogram for signalaveraging by a separate, dedicated microprocessor in order to mon-itor fusimotor action potentials and to determine their conductionlatencies.
2.2. Dorsal- and ventral-root filament preparation
Standard methods were used for isolation of functionally singleprimary afferents. Up to 12 (typically 6–10) single-unit filamentswere mounted on the 12-branch recording electrode (see above),which permitted convenient rapid switching between recordingchannels. In contrast, we developed new methods for isolation ofappreciable numbers of suitable fusimotor efferents from ventral-root filaments, which we shall refer to as the isodyne microdissectionstrategy. Conventionally, fusimotor effects would first have beendetected by recording responses to stretch of a primary afferent,chosen on the basis of favourable signal-to-noise and morpho-logical (optimal size) characteristics of its dorsal-root filament,during systematic stimulation of individual ventral-root filamentsobtained by preliminary division of the L7 and S1 ventral roots intoevenly sized subdivisions. Although up to 20 apparently suitable(and often natural) subdivisions of the roots are readily obtained bythis procedure, it is typically carried out blindly, i.e. without beingguided by indications of likely fusimotor yield.
In the isodyne microdissection strategy muscle force and num-bers of � and � potentials (but not fusimotor effects) weremonitored following each ventral-root division, so as to focus thepreliminary microdissection on those filaments that elicited mostforce from the peroneus tertius muscle, on the assumption thatthey probably also contained most fusimotor efferents supplied toit, an assumption which indeed was subsequently borne out byour experience. The new procedure typically also yielded about20 ventral-root subdivisions, which, however, tended to be of veryuneven size while generating comparable amounts of muscle force(200–400 mN).
The next critical step that was decisive for success and effi-ciency of establishing pentuplets (configuration of a single primaryafferent operated by 2 static and 2 dynamic, individually isolated,fusimotor efferents) was the creation of a systematic inventory offusimotor effects, which we refer to as the interaction matrix. To thisend each isodyne ventral-root filament was systematically screenedfor fusimotor effects. During screening, the fusimotor actions on theresponses of each primary afferent of the recording array were mon-itored in turn, while the muscle was mechanically stretched witha 1 mm peak to peak, 1 Hz sinusoidal stretch to allow the prelimi-nary identification of the type of action of any fusimotor effect, and
its strength to be estimated. In this way a preliminary interactionmatrix was constructed relatively quickly. Notably, such creation ofa systematic matrix of fusimotor effects helped identify much largernumbers of them (typically around 40, occasionally up to 60) thanare encountered with conventional methods. The matrix informa-
M. Hulliger, R.W. Banks / Journal of Neuroscience Methods 178 (2009) 103–115 105
F for te r in th
ttstdeofilycSt(ect
tia6eutteee
ig. 1. Schematic diagram of the experimental arrangement. The main pathwaysmphasized. For further detail see text. (For interpretation of the references to colo
ion enabled us to rank the available primary afferents accordingo suitability and to concentrate further ventral-root divisions foringle fibre isolation in those filaments that had the best poten-ial to furnish our target groupings (pentuplets) of 2 static and 2ynamic fusimotor fibres acting on a single primary-ending affer-nt. The resulting prioritization of afferents could result in rejectionf biophysically and morphologically favourable primary-afferentlaments in favour of filaments that, on the same criteria, were
ess favourable, but that scored more on the promise of pentupletield. It is possible that at least in some cases the rejected filamentsontained afferents from spindle capsules lacking bag1 fibres (seeection 2.1). By this strategy of isodyne microdissection and interac-ion matrix construction, we were able to isolate single fusimotor� or �) axons into individual filaments much more rapidly andfficiently than by the conventional method, thus allowing earlierommencement of, and providing more time for, the irreduciblyime-consuming phase of data collection.
Physical placement of multiple filaments during screening ofheir effects and subsequent data acquisition was enabled by thentroduction of a novel, custom-built, 6-channel bipolar electroderray. The array consisted of 12 silver wire electrodes mounted as a× 2 array, using 2 layers of standard circuit board, such that eachlectrode could be readily positioned using minimal-force manip-lation, then held in position by static friction. We consider that
he independent four-channel stimulation of our main data acquisi-ion protocols would have been extremely difficult without the newlectrode array, since the spatial constraints imposed by using sev-ral conventional bipolar electrodes carried an unacceptable risk oflectrode or filament displacement during manipulation, filamenthe input (blue boxes), output (red boxes) and control (yellow boxes) signals areis figure legend, the reader is referred to the web version of the article.)
damage, and uncontrollable cross-talk due to spontaneous filamentadhesion.
By positioning the muscle-nerve electrodes as far distally as pos-sible (merely a few mm from the muscle) peroneus tertius emgsignals as well as nerve action potentials were readily recorded, theformer due to electrotonic spread of signals that were appreciablylarger at their source (multiple muscle fibre currents). Therefore aventral-root filament could be confirmed as containing a single �fibre to peroneus tertius because on stimulation it elicited an actionpotential of � latency in the muscle-nerve, together with fusimo-tor effects, but with neither external force nor emg. Conversely, aventral-root filament that, on stimulation, elicited an all-or-nonefusimotor effect (usually on only one primary-ending afferent) butno action potentials of � latency in the muscle nerve, was acceptedas containing a skeletofusimotor (�) fibre, provided that the recruit-ment thresholds of the associated nerve action potential (a singlepotential of fixed latency in the � range) and of the remote motor-unit potential (emg) were identical. If unloading by the extrafusalmuscle-unit of a skeletofusimotor fibre was evident, immediatelybefore further testing we would fatigue the extrafusal componentby continuous high-rate (100 s−1) stimulation until the active forcewas essentially abolished. In practice, this procedure had to be usedonly very rarely since extrafusal fatigue tended to be fully devel-oped by the time recordings were made, as a consequence of the
extensive screening and testing procedures. Thus functionally iso-lated � fibres activated during the recordings typically did not elicitany measurable tension or visible local contraction. Conduction dis-tance was measured at the conclusion of the experiment to allowcalculation of conduction velocities.
1 euroscience Methods 178 (2009) 103–115
2
apfabrtwDiobarTo0bmvcslnorw
2
actetmaf
Fig. 2. Cancellation of stimulus artefacts. The effectiveness of the SACAD in can-celling stimulus artefacts is illustrated in this Polaroid photograph of a storageoscilloscope display from a real-time experiment with one simulated afferent and 3
Feco
06 M. Hulliger, R.W. Banks / Journal of N
.3. Fusimotor classification and functional characterisation
Preliminary classification of the fusimotor fibres into dynamicnd static categories was made on the basis of their effects on therimary afferent sensitivity to sinusoidal muscle stretch of 1 Hzrequency and 0.5 mm amplitude, during construction of the inter-ction matrix. Confirmation of their classification was subsequentlyased on trapezoidal stretches during data collection, using crite-ia established by Emonet-Dénand et al. (1977). Since our targeto construct pentuplets was a set of 2 dynamic and 2 static fibres,e made no further classification into the sub-types of Emonet-énand et al. (1977). In order to characterise fully the actions of
ndividual fusimotor axons, and in particular to be able to compareur observations with those previously published that have beenased on high, constant rates of stimulation, we prepared severalncillary stimulation protocols in addition to the multiple, low-ate stimulation whose effects were the main objects of our study.he standard ones were as follows: (i) fusimotor stimulus trainsf nominal mean rate 100 s−1 and interval distributions of 0 and.2 coefficient of variation; together with mechanical stimulationy trapezoidal stretches; (ii) fusimotor stimulus trains of nominalean rate 100 s−1 and interval distributions of 0.2 coefficient of
ariation applied singly or to pairs of dynamic and static axons inombination, together with mechanical stimulation by sinusoidaltretches; (iii) with the muscle held at the mid-point of its physio-ogical excursion (defined as 0 length), fusimotor stimulus trains ofominal mean rates 30 and 100 s−1, each with interval distributionsf 0 and 0.2 coefficient of variation, and, in addition, a train whoseate profile had triangular shape (from 0 to 150 to 0 impulses/s),ith the triangle triggered repeatedly.
.4. Stimulus artefact cancellation
In experiments of this kind contamination of the dorsal-root fil-ment signals with stimulus artefacts is, of course, inevitable. Withombined mean stimulation rates of up to 200 impulses/s and upo 0.4 coefficient of variation, this was a major challenge in our
xperiments. Conventional methods of stimulus artefact minimiza-ion (by optimal spatial arrangement of single fibre filaments) wereostly ineffective, since with up to 15 fine and occasionally short fil-ments mounted on various electrodes there was virtually no scopeor optimal spatial reconfiguration of filament arrays. The problem
ig. 3. Cancellation of stimulus artefacts. The display output from a digital oscilloscopexperimental protocol with one stimulus channel operating with a constant stimulationontaining a dynamic fusimotor efferent acting on the afferent illustrated. Top trace: rawf the stimulus artefact, updated at each stimulus; bottom trace: the afferent signal outpu
sources of stimulus artefacts. Upper trace: input to the SACAD indicating an afferentaction potential (long arrow to left) and examples of the 3 stimulus artefacts (shortarrows to right). Lower trace: the output of the SACAD containing only the cleanedup afferent action potentials.
could be mitigated, and in most cases practically overcome, usingthe SACAD, only a brief description of which is given here, a separatefull account being in preparation. The SACAD is based on a Motorola56001 digital signal processor, which operates at 24 MHz (masterclock) with a sampling rate of 25 KHz, and which subtracts, in realtime, an adaptively estimated (running) average of the stimulusartefacts from the digitised dorsal-root filament signal. It has pro-vision to process up to 10 separate adaptive estimates of artefactsof different size, each of which can be used for corrective subtrac-tion from the contaminated signal. In the experiments describedhere 4 estimates were routinely used to minimize the artefacts pro-duced by the 4 fusimotor channels. Fig. 2 shows an example of the
effectiveness of the SACAD in removing the artefacts arising from 3stimulus channels in a performance test, which was carried out inreal time and based on electronically simulated signals of an affer-ent action potential and various shapes of stimulus artefacts similarto those that occur in actual experiments. These signals were gen-sampling at 8 kHz per channel showing the operation of the SACAD in an actualrate of 100 s−1. The stimuli were applied to a relatively large ventral-root filamentrecording from a dorsal-root filament; middle trace: the SACAD’s running estimatet from the SACAD after removal of the stimulus artefact estimate.

euros
e(RlbstnwSipauSe1amwmcaoa
2
ptfs(obe(amAf
3
3
rawhtsoafatfiitoat
M. Hulliger, R.W. Banks / Journal of N
rated in parallel using the multi-channel hybrid signal generatorFrei et al., 1981; above), whereby the waveforms were stored inAM memories and released by trigger pulses from external oscil-
ators. Thus, the time of occurrence, not only of the various stimuliut also of the (simulated) action potentials were known, so thatignal recovery could be examined unambiguously. It turned outhat, following a brief period of initial adaptation (“learning”), sig-al recovery was complete and that the recovered action potentialsere at worst only marginally distorted. The performance of the
ACAD was routinely monitored throughout the experiments whent was found to permit improvements in signal-to-noise (i.e. actionotential to artefact) ratio by factors of up to 100. An example ofn experimental recording is shown in Fig. 3, with a single stim-lus channel operating at a constant stimulation rate of 100 s−1.everal instances in which afferent impulses coincide with differ-nt phases of the stimulus artefact are indicated (afferent impulses, 4, 8, 9 and 11), to show the successful removal of the stimulusrtefact whether it is coincident with an afferent impulse or not. Iterits mention that such decomposition of complex superpositionaveforms is a notorious challenge (and normally limitation) ofore traditional window discriminators. In addition, the adaptive
apability of the SACAD proved to be a major benefit on changingfferent recording and efferent stimulation configurations, since itperated with remarkable reliability during many hours withoutny need of intervention.
.5. Multiple, low-rate protocol
With a full set of 2 static and 2 dynamic axons activating a singlerimary ending (see below), the standard sequence of combina-ions of stimulus trains in the multiple low-rate protocol was asollows: (i) all 4 trains at 30 s−1 mean rate; (ii) static 1 alone; (iii)tatic 2 alone; (iv) statics 1 and 2 combined; (v) dynamic 1 alone;vi) dynamic 2 alone; (vii) dynamics 1 and 2 combined; (viii) repeatf all 4 trains at 30 s−1 mean rate, to check for reproducibility; (ix)oth statics (each at 30 s−1 mean rate) together with both dynamicsach at 50 s−1 mean rate; (x) dynamic 1 alone at 50 s−1 mean rate;xi) dynamic 2 alone at 50 s−1 mean rate; (xii) both dynamics eacht 50 s−1 mean rate; and (xiii) repeat of both statics each at 30 s−1
ean rate together with both dynamics each at 50 s−1 mean rate.dditional trial repetitions for reproducibility assessment were per-
ormed as deemed necessary.
. Results
.1. Statistical properties of the stimulus pulse trains
We begin by illustrating the statistical properties of the pseudo-andom trains of impulses used to stimulate individual fusimotorxons in our combined, multiple, low-rate protocol. Our targetsere that the intervals between impulses in each train shouldave a Gaussian distribution with 0.2 coefficient of variation, suchhat the mean rate of impulses was either 30 or 50 s−1. The trainshould also be independent of each other. There is a general scarcityf direct recordings of �-fibre activity in any animal preparation,nd particularly under physiological conditions. We have there-ore been guided by the little available from diverse preparations,nd on this basis have aimed to choose realistic values, ratherhan attempt to model any actual values. First, regarding meanring rate, Murphy et al. (1984), studying treadmill locomotion
n the premammillary cat, described 2 populations of � fusimo-or fibres supplying ankle extensor muscles of the cat that hadverall average resting discharge rates of 10 and 44 impulses/snd whose actions they identified as static and dynamic, respec-ively. During locomotion the overall mean rate of the first group
cience Methods 178 (2009) 103–115 107
increased to 56, whereas that of the second group decreasedto 36 impulses/s. Secondly, regarding discharge rate variability,Ellaway (1972) showed that in tonically firing � fibres, again sup-plying ankle extensors of the cat, the distribution of interspikeintervals in the decerebrate preparation is Gaussian with an overallcoefficient of variation of 0.106 and independent of mean interval.In the spinal preparation, variability in the firing rate of individ-ual � fibres was greater than in the decerebrate condition, thecoefficient of variation rising from 0.33 to 0.55 as mean intervalincreased from 15 to 100 ms (Ellaway, 1972). In addition, althoughMurphy et al. (1984) did not explicitly report variability figures, asingle illustration of their paper (Fig. 11B) shows a � efferent dis-charging at approximately 0.15 coefficient of variation. Thereforethe parameter values we used were within realistic limits set bythese known intrinsic states, rather than to modelling any one ofthem.
Six different stimulus trains were generated for the multiple,low-rate protocol: 4 had nominal mean rates of 30 s−1, to allowa combination of 2 static and 2 dynamic axons to act on a sin-gle primary ending; the remaining 2 had nominal mean rates of50 s−1, to allow selectively greater rates of activation of the dynamicaxons. Fig. 4 shows the trains used to stimulate the 2 static axonsat 30 s−1 and the 2 dynamic axons at 50 s−1. The trains are plottedas instantaneous rate displays in column A, with the correspondinginterval histograms and their target normal distributions in col-umn B. Actual mean intervals and coefficients of variation were,rows 1–4: 33.4 ms and 0.19; 33.1 ms and 0.21; 20.2 ms and 0.19; and19.9 ms and 0.20. The frequency distributions of the actual intervalswere not significantly different from the calculated target values ineach case (�2-test). Independence of the trains is illustrated by aselection of cross-correlograms in column C, all of which are flat.From top to bottom these are constructed between the first staticand second dynamic trains; the 2 static trains; the second staticand first dynamic trains; and the 2 dynamic trains. All other possi-ble combinations of pairs of trains showed similar independence.The same trains were used for the multiple low-rate protocol witheither trapezoidal or sinusoidal stretch.
3.2. Reproducibility
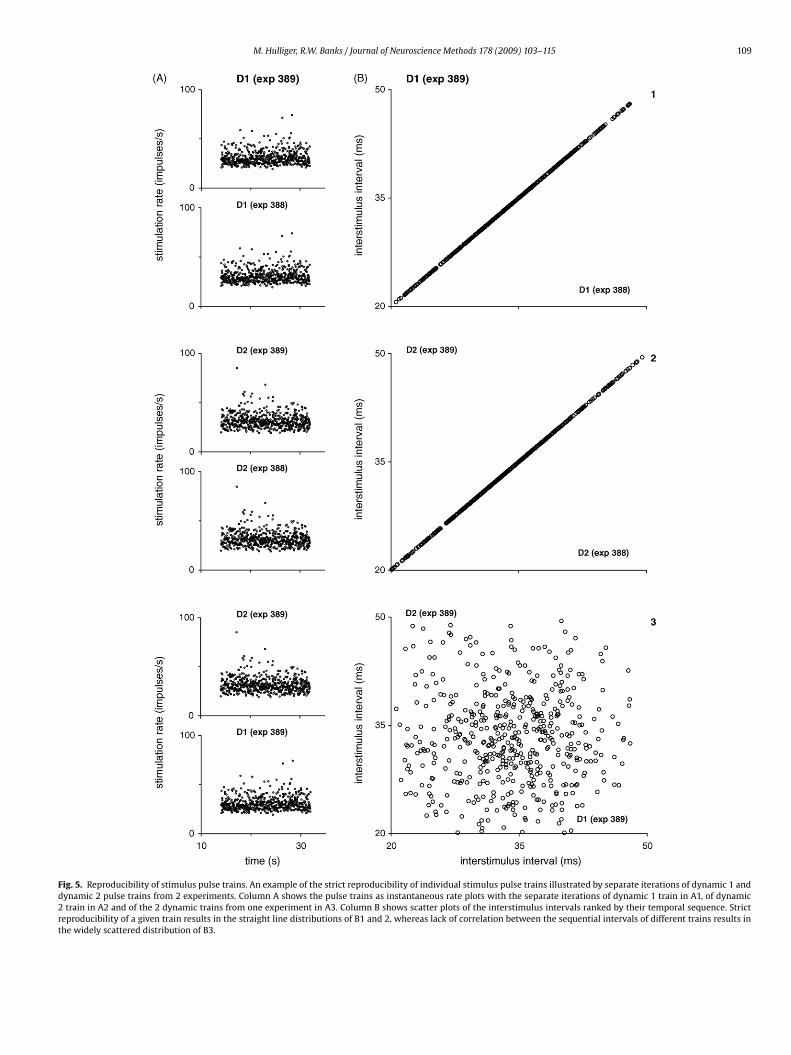
The strict reproducibility of particular stimulus pulse trains canbe confirmed by inspection of the interstimulus intervals that wererecorded each time they were read by the VME processor. An exam-ple, using the pulse trains for dynamic 1 and 2 stimulation profilesas recorded in 2 separate experiments (388 and 389) is shown inFig. 5. Column A shows the individual pulse trains as instantaneousrate displays, which are all superficially similar due to their statis-tical properties, while column B shows plots of pairs of intervals ofthe same temporal rank when the same train is deployed on dif-ferent occasions (e.g. interval n D1 exp 389 plotted against intervaln D1 exp 388, A1; interval n D2 exp 389 plotted against interval nD2 exp 388, A2), or when different trains are deployed (e.g. intervaln D1 exp 389 plotted against interval n D2 exp 389, A3). The strictreproducibility of the intervals in the same train results in the indi-vidual points lying along a straight line (B1, 2), whereas the lackof any correlation in the ordered intervals of the different trainsresults in the individual points being widely scattered throughoutthe plot area (B3), although individually each exhibited a Gaussiandistribution.
3.3. Characterisation of fusimotor action
Fusimotor axons were initially characterised as static or dynamicon the basis of their effects on primary-ending afferent responsesto 1 mm peak-to-peak sinusoidal stretches at 1 Hz during construc-tion of the interaction matrix (see Section 2.2). Their identification

108 M. Hulliger, R.W. Banks / Journal of Neuroscience Methods 178 (2009) 103–115
Fig. 4. Statistical properties of stimulus pulse trains. The individual pulse trains are shown as used in a protocol for the separate or combined stimulation of 2 static fusimotoraxons, each at a target mean rate of 30 s−1, and 2 dynamic fusimotor axons, each at a target mean rate of 50 s−1, and all with a target of 0.2 coefficient of variation. Ineach row from left to right are shown: column A, the pulse train as an instantaneous rate plot; column B, the actual interpulse interval histogram of the train, togetherwith the corresponding normal distribution having the target mean rate and coefficient of variation shown as a continuous line; and column C, a cross-correlogram. Thec 2 (rowC e cross
wtawa
ross-correlograms are constructed as follows: C1, static 1 (row 1) against dynamic4, dynamic 1 against dynamic 2. Note the absence of significant peaks in any of th
as subsequently confirmed on the basis of their effects duringrapezoidal stretch. The standard high constant rate of stimulationt 100 s−1 was used in both these tests to ensure comparabilityith the published data. An example to illustrate the further char-
cterisation of a static � fusimotor axon is given in Fig. 6. The
4); C2, static 1 against static 2 (row 2); C3, static 2 against dynamic 1 (row 3); and-correlograms.
primary afferent’s responses are shown in row 1, then in row 2 areshown the stimulus trains, with the respective interval histogramsin rows 3 and 4. This particular fusimotor action is characterisedby a tendency to entrainment of the primary afferent’s responseat the stimulus rate, together with low-pass filtering. Thus, at low
M. Hulliger, R.W. Banks / Journal of Neuroscience Methods 178 (2009) 103–115 109
Fig. 5. Reproducibility of stimulus pulse trains. An example of the strict reproducibility of individual stimulus pulse trains illustrated by separate iterations of dynamic 1 anddynamic 2 pulse trains from 2 experiments. Column A shows the pulse trains as instantaneous rate plots with the separate iterations of dynamic 1 train in A1, of dynamic2 train in A2 and of the 2 dynamic trains from one experiment in A3. Column B shows scatter plots of the interstimulus intervals ranked by their temporal sequence. Strictreproducibility of a given train results in the straight line distributions of B1 and 2, whereas lack of correlation between the sequential intervals of different trains results inthe widely scattered distribution of B3.

110 M. Hulliger, R.W. Banks / Journal of Neuroscience Methods 178 (2009) 103–115
Fig. 6. An example of some of the ancillary tests used to characterise the fusimotor axons. Illustration of the actions of a static � fibre on a single primary-ending afferentwith the muscle at the constant mid-excursion length of 0 mm. Row 1: the primary afferent’s responses. Row 2: stimulus trains used to activate the static axon. Rows 3 and 4:c w 4), ct in E2s e of th
mBaacicetnftdoTrdtilsitsmec1
orresponding interval histograms for the responses (row 3) and stimulus trains (rohe same rate as the triangularly modulated �-stimulation rate (0–150–0 s−1 shownlopes of the rising and falling stimulation rates (continuous lines) on the final phas
ean stimulation rates (30 s−1) with 0.2 (column A) or 0 (column) coefficient of variation the mean firing rate of the afferent ispproximately the same as that of the stimulus, but note that thefferent has an irreducible intrinsic variability (B3, 4) and that itannot follow the higher instantaneous rates of stimulation (shorterntervals) (A3, 4). At a high mean stimulation rate (100 s−1) with 0oefficient of variation (column D) the mean firing rate of the affer-nt is close to 60 s−1, but with a variable stimulus pulse train athe same high mean rate (100 s−1) (column C) the afferent can-ot follow the higher instantaneous rates and its mean firing rate
alls to about 52 s−1. This same phenomenon of the inability ofhe afferent to follow the higher rates of stimulation is also evi-ent in the response to smoothly increasing and decreasing ratesf stimulation with the triangular profile of 0–150–0 (column E).he lines superimposed on the third phase of the response in E1epresent the stimulus rate below 100 s−1. They indicate that 1:1riving of the afferent’s response occurs with stimulus rates upo about 60 s−1 The long tails in both the response and stimulusnterval histograms (E3, 4) also show that the afferent can fol-ow the low rates of stimulation, but there is a sharp cut off attimulus intervals of less than about 12 ms (equivalent to a fir-ng rate of about 83 s−1). With dynamic axons (not illustrated)here is usually little difference between an afferent’s responses to
teady or variable stimulation rates, and rarely any sign of entrain-ent by the stimulation. The entrainment properties of fusimotorfferents are particularly relevant when efferents with differentharacteristics interact during concomitant activation (Banks et al.,997).
onstructed between 14 and 33 s (see bar in C1). Note that in E1 the afferent fires at) up to, and below, about 50 s−1. This is demonstrated clearly by the superimposede afferent response in E1.
3.4. Multiple, low-rate protocol
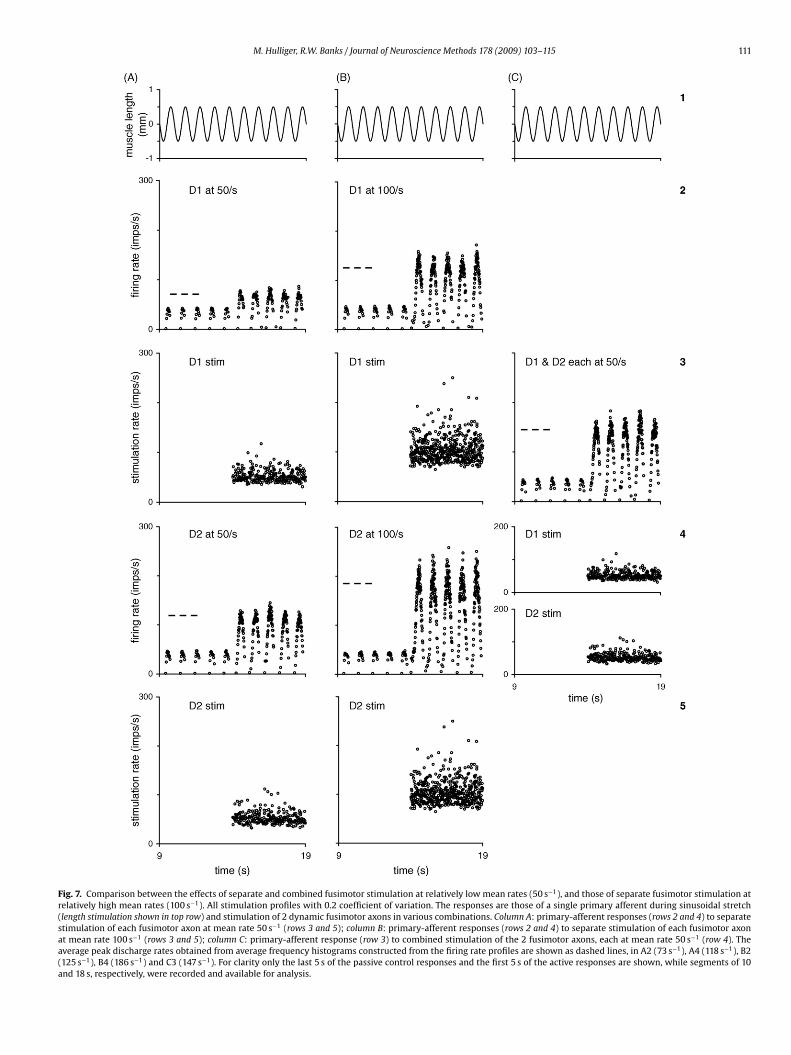
An example of the separate and combined stimulation of a pairof dynamic axons, each stimulated at 50 s−1 mean rate (paradigms(x–xii) in Section 2.5), is given in Fig. 7. In this case the mechan-ical stimulation is a 1 Hz sinusoidal stretch of 0.5 mm amplitudecentred on length 0. For comparison with previous studies usinghigh rates of stimulation responses to stimulation of the sameaxons to trains of impulses with intervals of (target) mean dura-tion 10 ms and 0.2 coefficient of variation are also included. Cyclehistograms and curve-fitting were used to analyse the responsesduring sinusoidal stretch, details of which will be given elsewhere.In the instantaneous discharge rate plots shown here (Fig. 7) themost obvious feature is the peak firing rate. The measured averagepeak rate, based on average frequency displays, is indicated in eachresponse included in the figure by a short horizontal dashed line.In this example, doubling the mean stimulation rate of either axoncauses an approximate doubling of the peak firing rates in the pri-mary afferent’s responses; in contrast, the peak rates in responseto the combined actions of the 2 dynamic axons are less than thelinear sum of peak rates resulting from their separate stimulation,indicating that afferent responses during multi-fibre stimulationare not easily nor reliably predictable from single fibre activation at
the high rates (e.g. 100 s−1) that have previously been used for thevery purpose of inferring multiple low rate fusimotor action fromthe action of a single efferent stimulated at a high rate.The statistical independence of the stimulation impulse trainsallows post-stimulus-time histograms to be constructed between
M. Hulliger, R.W. Banks / Journal of Neuroscience Methods 178 (2009) 103–115 111
Fig. 7. Comparison between the effects of separate and combined fusimotor stimulation at relatively low mean rates (50 s−1), and those of separate fusimotor stimulation atrelatively high mean rates (100 s−1). All stimulation profiles with 0.2 coefficient of variation. The responses are those of a single primary afferent during sinusoidal stretch(length stimulation shown in top row) and stimulation of 2 dynamic fusimotor axons in various combinations. Column A: primary-afferent responses (rows 2 and 4) to separatestimulation of each fusimotor axon at mean rate 50 s−1 (rows 3 and 5); column B: primary-afferent responses (rows 2 and 4) to separate stimulation of each fusimotor axonat mean rate 100 s−1 (rows 3 and 5); column C: primary-afferent response (row 3) to combined stimulation of the 2 fusimotor axons, each at mean rate 50 s−1 (row 4). Theaverage peak discharge rates obtained from average frequency histograms constructed from the firing rate profiles are shown as dashed lines, in A2 (73 s−1), A4 (118 s−1), B2(125 s−1), B4 (186 s−1) and C3 (147 s−1). For clarity only the last 5 s of the passive control responses and the first 5 s of the active responses are shown, while segments of 10and 18 s, respectively, were recorded and available for analysis.

112 M. Hulliger, R.W. Banks / Journal of Neuroscience Methods 178 (2009) 103–115
Fig. 8. An example of the temporal relationships between a primary-afferent response during sinusoidal stretch and the stimulus train of a single static axon (static 1)activated at a mean rate of 30 s−1. Column A: stimulation of static 1 alone. Columns B and C: combined stimulation of static 1 with a second static axon (static 2) and a pair ofdynamic axons (dynamics 1 and 2). In column B each of the fusimotor axons is stimulated at a mean rate of 30 s−1; in column C the static axons are stimulated at mean rates of30 s−1 whereas the dynamic axons are stimulated at mean rates of 50 s−1 each. There is a progressive attenuation of the size of the post-stimulus-time histogram peak withincreasing competing fusimotor input. Row 1: length stimulation; row 2: primary afferent response; row 3: static 1 stimulus train, used to construct the post-stimulus-timehistograms in row 7; row 4: static 2 stimulus train; row 5: dynamic 1 stimulus train; row 6: dynamic 2 stimulus train; row 7: post-stimulus-time histograms, constructedbetween 14 and 32 s, i.e. over the entire episode of efferent stimulation in each case. For clarity only the last 5 s of the passive control responses and the first 5 s of the activeresponses are shown, while segments of 10 and 18 s, respectively, were recorded and available for analysis.

M. Hulliger, R.W. Banks / Journal of Neuroscience Methods 178 (2009) 103–115 113
Fig. 9. The effects of multiple, low-rate fusimotor stimulation compared with combined stimulation at high mean rates. Recordings from a primary afferent during stimulationof 4 efferents at low rates (rows 3 and 4) vs. stimulation of a subset of 2 efferents at high rates (rows 1 and 2). Columns A, B, D, E: single fibre paradigms. Column C multi-fibrep profile3 frequed ive coo
atdiiwaiamRs1cfpapalvofiuwA
tw
aradigms. Rows 1 and 3: afferent responses. Rows 2 and 4: fusimotor stimulation0 or 50 s−1 (mean rates). The overall mean discharge rates obtained from averageashed lines, in C1 (104 s−1) and C3 (145 s−1). For clarity only the last 5 s of the passf 10 and 18 s, respectively, were recorded and available for analysis.
ny one of them and the primary response, either when used aloneo stimulate a single fusimotor fibre, or when used in combinationuring stimulation of 2 or more fibres. In particular, if there is a peak
n the post-stimulus-time histogram when a single fusimotor fibres stimulated alone, the attenuation of the peak can be observed
hen the same stimulus train is again applied in the presence ofdditional fusimotor inputs. An example of this phenomenon isllustrated in Fig. 8. In this instance the mechanical stimulus is oncegain a 1 Hz sinusoidal stretch of 0.5 mm amplitude, centred on auscle length of 0 mm (i.e. mid-excursion), and is shown in row 1.
ow 2 shows the primary-afferent responses, rows 3–6 successivelyhow the impulse trains used to stimulate static 1, static 2, dynamic, and dynamic 2 fusimotor fibres. Post-stimulus-time histogramsonstructed between the primary responses and the stimulus trainor static 1 are shown in row 7, where peaks of fixed latency, butrogressively diminishing size in the face of increasingly greaterdditional inputs, may be seen in each case. Note that the subsidiaryeak evident in A7, and just discernable in B7, occurs at a latency ofbout 25 ms. The difference between this and the principal peak’satency of about 15 ms is much less than the mean stimulus inter-al (33.3 ms). It is therefore probably due to partial entrainment,r phase shifting, of successive afferent spikes when the intrinsicring rate determined by the combined fusimotor and length stim-li is close to 100 s−1 (equivalent to the difference in the latencies),
hich happened often as can be seen from the firing rate display in2.This type of analysis should provide important information onhe integrative action of the muscle spindle, and is only possibleith the independent, multi-channel approach adopted here.
s (all with 0.2 coefficient of variation), in row 2 at 100 s−1 (mean rate), in row 4 atncy histograms constructed from the firing rate profiles of column C are shown asntrol responses and the first 5 s of the active responses are shown, while segments
3.5. Comparison of multiple, low rate with conventional high-ratestimulation
We present a selection of data from just one of the many pos-sible such comparisons as a final illustration of the value of ourmethod. Fig. 9 shows a single primary afferent responding to sinu-soidal muscle stretch of 1 Hz frequency and 0.5 mm amplitude,under various conditions of fusimotor stimulation. Rows 1 and 2show the effects of a static and a dynamic axon when stimulated athigh mean rate (100 s−1), either singly (B1, D1) or combined (cen-tre, C1). All other similar combinations from the same pentupletwere also tested and recorded. These data allow direct compari-son with previous observations on static and dynamic interactions,such as those of Hulliger et al. (1977b). Rows 3–5 in Fig. 9 show theeffects on the response of the same primary afferent to the mul-tiple, low-rate stimulation of a pair of static axons each at 30 s−1
mean rate and a pair of dynamic axons each at 50 s−1 mean rate.Static 2 (column B) and dynamic 1 (column D) are the same axonsshown stimulated at high rates in rows 1 and 2. Full quantitativeanalysis will not be given here, but it is apparent on inspectionthat the non-linearities in the primary afferent responses pre-vent any simple additive estimation or prediction of the effects ofcombined activation, in particular those of near physiological multi-fibre activation from high rate single fibre activation. For instance,
mean firing rate during high-rate action (with an ensemble stim-ulation rate of 200 s−1, C1 horizontal bar) was appreciably lowerthan during 4-channel low-rate stimulation (C3 horizontal bar),in spite of the latter’s lower ensemble stimulation rate (160 s−1,C4–C7).
1 euros
4
iemwpbagtaotnmspos
srpfsv(omeauditli
tevosFtemrcf
wotab(btrlbgt
14 M. Hulliger, R.W. Banks / Journal of N
. Discussion
With its 3 types of intrafusal muscle fibre, their complex motornnervation, and the frequent occurrence of secondary sensoryndings as well as the primary ending (Banks, 2005), the mam-alian muscle spindle is a site of integration of the length inputith convergent motor inputs, and of potentially divergent out-uts. To provide a complete, deterministic, functional relationshipetween the range of outputs of muscle-spindle sensory endingsnd the domain of realistic inputs has remained an unattainedoal of spindle physiology at least since Matthews (1972) notedhat “for the time being [. . .] all that can be done is to give a cat-logue of the way each kind of ending behaves under a varietyf circumstances”. The necessity of cataloguing the behaviour ofhe sensory endings is due to the presence in their responses ofon-linearities, which were first recognised using a variety of deter-inistic length stimuli, in particular ramp-and-hold and sinusoidal
tretches. Since Matthews’ comment there has been considerablerogress in this area, especially regarding the passive responsesf the sensory endings, but the problem remains in essence as hetated it.
Although our multiple, low-rate stimulation technique may beeen simply as an obvious extension from highly artificial, highate of stimulation of single fusimotor fibres towards more realistic,hysiological rates of stimulation of a significant fraction of all theusimotor fibres innervating a single spindle, it should be empha-ized that it would have been technically extremely difficult, orirtually impossible, without several key developments. These arei) the optimised search strategy for fusimotor fibres having actionsn the group of isolated afferents; that is, the isodyne dissectionethod combined with a full matrix inventory of the fusimotor
ffects; (ii) the stimulation artefact management using the SACAD;nd (iii) the development of a highly adjustable multi-branch stim-lation electrode array. Furthermore, although our technique waseveloped with the express purpose of studying the non-linear
ntegration of fusimotor inputs (e.g. Figs. 7 and 9), we feel thathe approach using multiple, pseudorandom, independent stimu-us pulse trains could be applicable in many other independentlyntegrative systems.
The development and application of the method in relation tohe muscle spindle are justified on 3 main criteria: (1) the limitedvidence available shows that natural firing rates exhibit significantariability (e.g. Ellaway, 1972; Murphy et al., 1984); (2) the effectsf irregular stimulation on primary afferent responses can differignificantly from those of regular stimulation (see, for example,ig. 6), which is relevant for pacemaker modelling where preciseiming of events has significant effects on the outcome (e.g. Bankst al., 1997); and (3) the presence of non-linearities in the intrafusalechanisms that prevent simple prediction of primary afferent
esponses to ensemble fusimotor activity at presumed physiologi-al rates, based on high rate actions of single fusimotor axons (see,or example, Figs. 8 and 9).
Stochastic stimulation, in the form of random length changes,as first used in spindle studies to describe the non-linearitiesf the sensory responses of passive spindles (Poppele, 1981), ando take account of them in modelling (Kröller et al., 1985; Moorend Auriemma, 1985; Kröller, 1993). Although the mechanisticases of some of the non-linearities are now generally recognisede.g. short-range stiffness of intrafusal muscle fibres due to cross-ridges; and multiple encoding sites in the preterminal branches ofhe primary ending) they remain to be comprehensively incorpo-
ated into models, whose usefulness is otherwise correspondinglyimited. Stochastic fusimotor stimulation was introduced, in 1985,y Auriemma and Moore who used it to examine the multiple spike-enerator hypothesis, and by Rosenberg and Rigas who examinedhe spectral composition of primary-ending responses to combinedcience Methods 178 (2009) 103–115
length and fusimotor inputs. Both groups also used random lengthinputs, and confined their attention to single static fusimotor fibres.The only remaining instances of random, or pseudorandom, fusimo-tor stimulation that have come to our attention, once again usingsingle static fibres but with the muscle held at constant length, wereconcerned with the problem of identifying the type, or types, ofintrafusal muscle fibre activated in each case (Taylor et al., 1998;Petit et al., 1999).
Multi-channel stimulation of skeletomotor (�) axons has pre-viously been used in studies of tension generation (Rack andWestbury, 1969) and emg (Hulliger et al., 2001; Day and Hulliger,2001) in extrafusal muscle; however, combined stimulation of morethan one fusimotor fibre has been, somewhat surprisingly, ratherrarely attempted. We have previously made use of highly artificialpatterns of stimulation of pairs of dynamic and static axons in ourstudies on multiple pacemaker (or spike-generating) sites in theprimary ending (Hulliger et al., 1977a,b; Hulliger and Noth, 1979;Banks et al., 1997). Similarly rare are studies that set out to usepresumed physiological rates of stimulation (e.g. Baumann et al.,1982; Emonet-Dénand and Laporte, 1983). Extending the stimula-tion paradigm to one whose aims are the independent co-activationof a pair of dynamic and a pair of static fibres, all activating a singleprimary ending, and each fibre stimulated using a distinct, repro-ducible train of impulses of pseudorandom interval duration andlow mean rate to simulate naturally occurring activation, is, as faras we are aware, unprecedented. It should provide uniquely com-prehensive information to Matthews’ (1972) catalogue of spindlefunction.
Acknowledgements
We should like to thank John Gemmill and Richard Swayzewho assisted with several of the experiments, William Morrow fordeveloping the software for the stimulus pulse trains, Boris Kac-mar for construction of electronic equipment and for the design ofthe multi-branch electrode, and the CIHR for an operating grant toMH.
References
Appelberg B, Bessou P, Laporte Y. Action of static and dynamic fusimotor fibres onsecondary endings of cat’s spindles. J Physiol 1966;185:160–71.
Auriemma RA, Moore GP. Testing a gamma-activated multiple spike-generatorhypothesis for the Ia afferent. In: Boyd IA, Gladden MH, editors. The MuscleSpindle. Basingstoke: Macmillan; 1985. p. 391–5.
Banks RW. The distribution of static gamma axons in the tenuissimus muscle of thecat. J Physiol 1991;442:489–512.
Banks RW. Intrafusal motor innervation: a quantitative histological analysis oftenuissimus muscle spindles in the cat. J Anat 1994;185:151–72.
Banks RW. The muscle spindle. In: Dyck PJ, Thomas PK, editors. Peripheral Neuropa-thy. 4th edition Philadelphia: W.B. Saunders; 2005. p. 131–50.
Banks RW, Barker D. The muscle spindle. In: Engel AG, Franzini-Armstrong C, editors.Myology. 3rd. edition New York: McGraw-Hill; 2004. p. 489–509.
Banks RW, Hulliger M, Scheepstra KA, Otten E. Pacemaker activity in a sensory endingwith multiple encoding sites: the cat muscle-spindle primary ending. J Physiol1997;498:177–99.
Baumann TK, Emonet-Dénand F, Hulliger M. After-effects of fusimotor stimulationon spindle Ia afferents’ dynamic sensitivity, revealed during slow movements.Brain Res 1982;232:460–5.
Baumann TK, Hulliger M. The dependence of the response of cat spindle Ia affer-ents to sinusoidal stretch on the velocity of concomitant movement. J Physiol1991;439:325–50.
Day SJ, Hulliger M. Experimental simulation of cat electromyogram: evidencefor algebraic summation of motor unit action potential trains. J Neurophysiol2001;86:2144–58.
Ellaway PH. Variability in discharge of fusimotor neurons in decerebrate cat. ExpBrain Res 1972;14:105–17.
Emonet-Dénand F, Laporte Y. Observations on the effects on spindle primaryendings of the stimulation at low frequency of dynamic �-axons. Brain Res1983;258:101–4.
Emonet-Dénand F, Laporte Y, Matthews PBC, Petit J. On the subdivision of static anddynamic fusimotor actions on the primary ending of the cat muscle spindle. JPhysiol 1977;268:827–61.

euros
F
H
H
H
H
H
H
H
K
K
Taylor A, Durbaba R, Ellaway PH, Rawlinson S. Static and dynamic �-motor out-
M. Hulliger, R.W. Banks / Journal of N
rei JB, Hulliger M, Lengacher D. A programmable wide-range analogue signal gen-erator based on digital memories for use in physiological experiments. J Physiol1981;318:2P–3P.
ulliger M. The mammalian muscle spindle and its central control. Rev PhysiolBiochem Pharm 1984;101:1–110.
ulliger M, Banks RW, Gemmill JF. A method for the study of the effects ofcombining multiple pseudorandom fusimotor inputs on the responses ofmuscle-spindle primary endings in peroneus tertius of the anaesthetized cat.J Physiol 1996;494:71P.
ulliger M, Day SJ, Guimaraes A, Herzog W, Zhang YT. A new method for experimen-tal simulation of EMG using multi-channel independent stimulation of smallgroups of motor units. Motor Control 2001;5:61–87.
ulliger M, Dürmüller N, Prochazka A, Trend P. Flexible fusimotor control of mus-cle spindle feedback during a variety of natural movements. Prog Brain Res1989;80:87–101.
ulliger M, Matthews PBC, Noth J. Effects of static and of dynamic fusimotor stimula-tion on the response of Ia fibres to low frequency sinusoidal stretching coveringa wide range of amplitudes. J Physiol 1977a;267:811–38.
ulliger M, Matthews PBC, Noth J. Effects of combining static and dynamic fusimotorstimulation on the response of the muscle spindle primary ending to sinusoidalstretching. J Physiol 1977b;267:839–56.
ulliger M, Noth J. Static and dynamic fusimotor interaction and the possibil-
ity of multiple pace-makers operating in the cat muscle spindle. Brain Res1979;173:21–8.röller J. Reverse correlation analysis of the stretch response of primary musclespindle afferent fibers. Biol Cybern 1993;69:447–56.
röller J, Grüsser O-J, Weiss L-R. The response of primary muscle spindle endings torandom muscle stretch: a quantitative analysis. Exp Brain Res 1985;61:1–10.
cience Methods 178 (2009) 103–115 115
Matthews PBC. The differentiation of two types of fusimotor fibre by their effects onthe dynamic response of muscle spindle primary endings. Quart J Exp Physiol1962;47:324–33.
Matthews PBC. Mammalian Muscle Receptors and Their Central Actions. London:Edward Arnold; 1972.
Moore GP, Auriemma RA. Prediction of muscle stretch receptor behavior usingWiener kernels. Brain Res 1985;331:185–9.
Murphy PR, Stein RB, Taylor J. Phasic and tonic modulation of impulse ratesin g-motoneurons during locomotion in premammillary cats. J Neurophysiol1984;52:228–43.
Petit J, Banks RW, Laporte Y. Testing the classification of static � axons using differentpatterns of random stimulation. J Neurophysiol 1999;81:2823–32.
Poppele RE. An analysis of muscle spindle behavior using randomly appliedstretches. Neuroscience 1981;6:1157–65.
Rack PMH, Westbury D. The effects of length and stimulus rate on tension in theisometric cat soleus muscle. J Physiol 1969;204:443–60.
Rosenberg JR, Rigas A. Spectral composition of muscle spindle Ia responses to com-bined length and fusimotor inputs. In: Boyd IA, Gladden MH, editors. The MuscleSpindle. Basingstoke: Macmillan; 1985. p. 397–402.
Scott JJA, Young H. The number and distribution of muscle spindles and tendonorgans in the peroneal muscles of the cat. J Anat 1987;151:143–55.
put to ankle flexor muscles during locomotion in the decerebrate cat. J Physiol2006;571:711–23.
Taylor A, Ellaway PH, Durbaba R. Physiological signs of activation of bag2 and chainintrafusal muscle fibers of gastrocnemius muscle spindles in the cat. J Neuro-physiol 1998;80:130–42.