A framework for integrated biophysical and economic land use analysis at different scales
19
Agriculture, Ecosystems and Environment 75 (1999) 55–73 A framework for integrated biophysical and economic land use analysis at different scales Bas A.M. Bouman a,b,* , Hans G.P. Jansen a , Rob A. Schipper c , Andre Nieuwenhuyse a , Huib Hengsdijk a , Johan Bouma d a Wageningen Agricultural University, REPOSA, Apartado 224, 7210 Guápiles, Costa Rica b DLO-Research Institute for Agrobiology and Soil Fertility, Wageningen, The Netherlands c Wageningen Agricultural University, Department of Development Economics, Wageningen, The Netherlands d Wageningen Agricultural University, Department of Environmental Sciences, Laboratory of Soil Science and Geology, Wageningen, The Netherlands Received 1 September 1998; received in revised form 1 February 1999; accepted 18 March 1999 Abstract There is a general need for quantitative tools that can be used to support policy makers in regional rural development. Here, a framework for (sub-) regional land use analysis is presented that quantifies biophysical and economic sustainability trade-offs. The framework, called sustainable options for land use (SOLUS), was developed over a 10-year period of investigation in the Northern Atlantic Zone of Costa Rica and encompasses scale levels that range from field to region. SOLUS consists of technical coefficient generators to quantify inputs and outputs of production systems, a linear programming model that selects production systems by optimizing regional economic surplus, and a geographic information system. Biophysical and economic disciplines are integrated and various types of knowledge, ranging from empirical expert judgement to deterministic process models are synthesized in a systems-analytical manner. Economic sustainability indicators include economic surplus and labor employment, and biophysical ones include soil N, P and K balances, biocide use and its environmental impact, greenhouse gas emission and nitrogen leaching loss and volatilization. Land use scenarios can be implemented by varying properties of production inputs (e.g., prices), imposing sustainability restrictions in the optimization, and incorporating alternative production systems based on different technologies. Examples of application of SOLUS in the Northern Atlantic Zone of Costa Rica show that introduction of alternative technologies may result in situations that satisfy both economic as well as biophysical sustainability. On the other hand, negative trade-offs were found among different dimensions of biophysical sustainability themselves. ©1999 Elsevier Science B.V. All rights reserved. Keywords: Land use analysis; Sustainability; Policy decision support * Corresponding author. Present address: Soil and Water Sci- ences Division, International Rice Research Institute, P.O. Box 3127, 1271 Makati City, Philippines; Tel.: +63-2-845-0563; fax: +63-2-891-1292 E-mail address: [email protected] (B.A.M. Bouman) 1. Introduction Policy makers and stakeholders (i.e., individuals, communities or governments that have a traditional, current or future right to co-decide on the use of land (FAO, 1995)) concerned with regional (rural) devel- opment increasingly face the need for instruments that 0167-8809/99/$ – see front matter ©1999 Elsevier Science B.V. All rights reserved. PII:S0167-8809(99)00059-6
Transcript of A framework for integrated biophysical and economic land use analysis at different scales

Agriculture, Ecosystems and Environment 75 (1999) 55–73
A framework for integrated biophysical and economic land use analysisat different scales
Bas A.M. Boumana,b,∗, Hans G.P. Jansena, Rob A. Schipperc, Andre Nieuwenhuysea,Huib Hengsdijka, Johan Boumad
a Wageningen Agricultural University, REPOSA, Apartado 224, 7210 Guápiles, Costa Ricab DLO-Research Institute for Agrobiology and Soil Fertility, Wageningen, The Netherlands
c Wageningen Agricultural University, Department of Development Economics, Wageningen, The Netherlandsd Wageningen Agricultural University, Department of Environmental Sciences, Laboratory of Soil Science and Geology, Wageningen, The
Netherlands
Received 1 September 1998; received in revised form 1 February 1999; accepted 18 March 1999
Abstract
There is a general need for quantitative tools that can be used to support policy makers in regional rural development. Here, aframework for (sub-) regional land use analysis is presented that quantifies biophysical and economic sustainability trade-offs.The framework, called sustainable options for land use (SOLUS), was developed over a 10-year period of investigation inthe Northern Atlantic Zone of Costa Rica and encompasses scale levels that range from field to region. SOLUS consists oftechnical coefficient generators to quantify inputs and outputs of production systems, a linear programming model that selectsproduction systems by optimizing regional economic surplus, and a geographic information system. Biophysical and economicdisciplines are integrated and various types of knowledge, ranging from empirical expert judgement to deterministic processmodels are synthesized in a systems-analytical manner. Economic sustainability indicators include economic surplus and laboremployment, and biophysical ones include soil N, P and K balances, biocide use and its environmental impact, greenhousegas emission and nitrogen leaching loss and volatilization. Land use scenarios can be implemented by varying propertiesof production inputs (e.g., prices), imposing sustainability restrictions in the optimization, and incorporating alternativeproduction systems based on different technologies. Examples of application of SOLUS in the Northern Atlantic Zone ofCosta Rica show that introduction of alternative technologies may result in situations that satisfy both economic as wellas biophysical sustainability. On the other hand, negative trade-offs were found among different dimensions of biophysicalsustainability themselves. ©1999 Elsevier Science B.V. All rights reserved.
Keywords:Land use analysis; Sustainability; Policy decision support
∗ Corresponding author. Present address: Soil and Water Sci-ences Division, International Rice Research Institute, P.O. Box3127, 1271 Makati City, Philippines; Tel.: +63-2-845-0563; fax:+63-2-891-1292E-mail address:[email protected] (B.A.M. Bouman)
1. Introduction
Policy makers and stakeholders (i.e., individuals,communities or governments that have a traditional,current or future right to co-decide on the use of land(FAO, 1995)) concerned with regional (rural) devel-opment increasingly face the need for instruments that
0167-8809/99/$ – see front matter ©1999 Elsevier Science B.V. All rights reserved.PII: S0167-8809(99)00059-6
56 B.A.M. Bouman et al. / Agriculture, Ecosystems and Environment 75 (1999) 55–73
can improve transparency in the policy debate andthat enhance understanding of opportunities and limi-tations to development. To this end, a number of landuse models have been developed in the last decadebased on methods of systems analysis (De Wit et al.,1988; Rabbinge and van Latesteijn, 1992; Krusemanet al., 1995; Kuyvenhoven et al., 1995; Penning deVries et al., 1995). A common characteristic of suchmodels is that they aim at the quantification of bio-physical and economic sustainability trade-offs to sup-port policy decision making with respect to agricul-tural land use. Quite often, however, such models arestrongly biased to either the biophysical sciences (Pen-ning de Vries et al., 1995) or economics (Krusemanet al., 1995) which has been both defended (Van Lat-esteijn, 1995) as well as criticized (Tims, 1995). Thesuccessful integration of the biophysical sciences andeconomics still constitutes a major challenge to re-searchers in land use studies (Crissman et al., 1997).Another issue that recently received much attentionis that of spatial scale (Fresco, 1995; Jansen, 1995;Bouma, 1997; Dumanski et al., 1998). Spatial scale is-sues relate to aggregation and up- and down-scaling ofinformation (model input data) and of biophysical andeconomic relationships. Many of the mentioned landuse models operate at a particular scale level, vary-ing from farm level (Kruseman et al., 1995) to globallevel (Penning de Vries et al., 1995), and integrationof scales is yet another research challenge.
In 1986, the Wageningen Agricultural Universityinitiated a joint program with the Centre for Researchand Education in Tropical Agriculture (CATIE) andthe Ministry of Agriculture and Livestock of CostaRica on sustainable land use in the Northern AtlanticZone (AZ) of Costa Rica, of lately known as researchprogram on sustainability in agriculture (REPOSA).Its aims were to develop quantitative methodologiesfor analysis and evaluation of alternative scenarios forprofitable and sustainable land use at the farm and(sub) regional level, that can serve to support pol-icy design and decision making. Among the mainchallenges were integration of biophysical and eco-nomic disciplines, and spatial scale issues. A numberof approaches were elaborated at various scale levels,ranging from field-level decision support (Stoorvogel,1998), to farm-level policy models (Kruseman et al.,1995), regional biophysical exploration of land use(Bessembinder, 1997) and national trend extrapolation
and land use allocation (Veldkamp and Fresco, 1996).Over the years, a general framework has evolved forland use studies at (sub) regional level using toolsand methods of systems-analysis, called sustainableoptions for land use (SOLUS). The framework en-compasses scale levels that range from field to farm,sub-region and region. This paper presents the SO-LUS framework with examples for three applicationsin the Northern AZ of Costa Rica: a farmers’ settle-ment (Neguev), an administrative canton (Guácimo)and the entire Northern AZ. Special attention is givento the integration of biophysical disciplines with eco-nomics; to issues relating to scale in the design; andto building and application of the framework. The ul-timate clients of the framework are regional to na-tional stakeholders in rural development, such as gov-ernments, policy makers and interest groups (suchas producer groups or nature conservation groups).Farmers are not considered individually as stakehold-ers, nor are they individually addressed in SOLUS;specific models developed at the level of individualfarms within the REPOSA program have been reportedby Kruseman et al. (1995) and Kuyvenhoven et al.(1995).
2. Site description
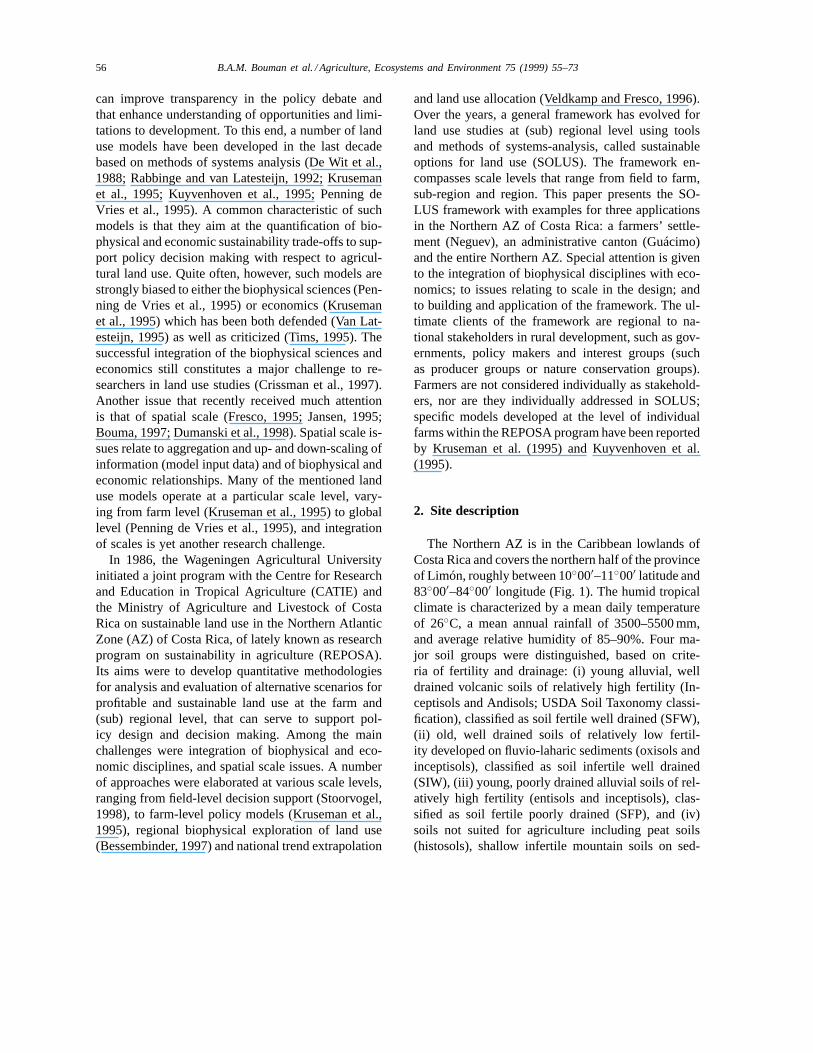
The Northern AZ is in the Caribbean lowlands ofCosta Rica and covers the northern half of the provinceof Limón, roughly between 10◦00′–11◦00′ latitude and83◦00′–84◦00′ longitude (Fig. 1). The humid tropicalclimate is characterized by a mean daily temperatureof 26◦C, a mean annual rainfall of 3500–5500 mm,and average relative humidity of 85–90%. Four ma-jor soil groups were distinguished, based on crite-ria of fertility and drainage: (i) young alluvial, welldrained volcanic soils of relatively high fertility (In-ceptisols and Andisols; USDA Soil Taxonomy classi-fication), classified as soil fertile well drained (SFW),(ii) old, well drained soils of relatively low fertil-ity developed on fluvio-laharic sediments (oxisols andinceptisols), classified as soil infertile well drained(SIW), (iii) young, poorly drained alluvial soils of rel-atively high fertility (entisols and inceptisols), clas-sified as soil fertile poorly drained (SFP), and (iv)soils not suited for agriculture including peat soils(histosols), shallow infertile mountain soils on sed-
B.A.M. Bouman et al. / Agriculture, Ecosystems and Environment 75 (1999) 55–73 57
Fig. 1. Location of the Northern Atlantic Zone, canton Guacimo and the Neguev settlement in Costa Rica.
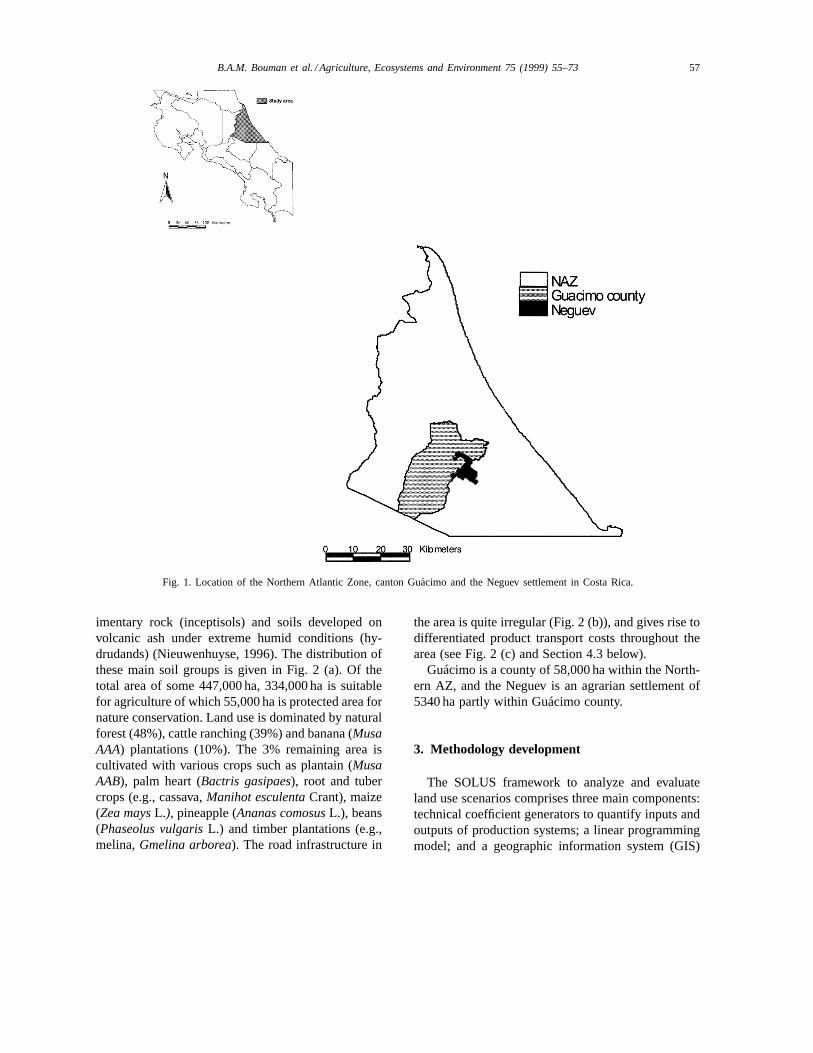
imentary rock (inceptisols) and soils developed onvolcanic ash under extreme humid conditions (hy-drudands) (Nieuwenhuyse, 1996). The distribution ofthese main soil groups is given in Fig. 2 (a). Of thetotal area of some 447,000 ha, 334,000 ha is suitablefor agriculture of which 55,000 ha is protected area fornature conservation. Land use is dominated by naturalforest (48%), cattle ranching (39%) and banana (MusaAAA) plantations (10%). The 3% remaining area iscultivated with various crops such as plantain (MusaAAB), palm heart (Bactris gasipaes), root and tubercrops (e.g., cassava,Manihot esculentaCrant), maize(Zea maysL.), pineapple (Ananas comosusL.), beans(Phaseolus vulgarisL.) and timber plantations (e.g.,melina,Gmelina arborea). The road infrastructure in
the area is quite irregular (Fig. 2 (b)), and gives rise todifferentiated product transport costs throughout thearea (see Fig. 2 (c) and Section 4.3 below).
Guácimo is a county of 58,000 ha within the North-ern AZ, and the Neguev is an agrarian settlement of5340 ha partly within Guácimo county.
3. Methodology development
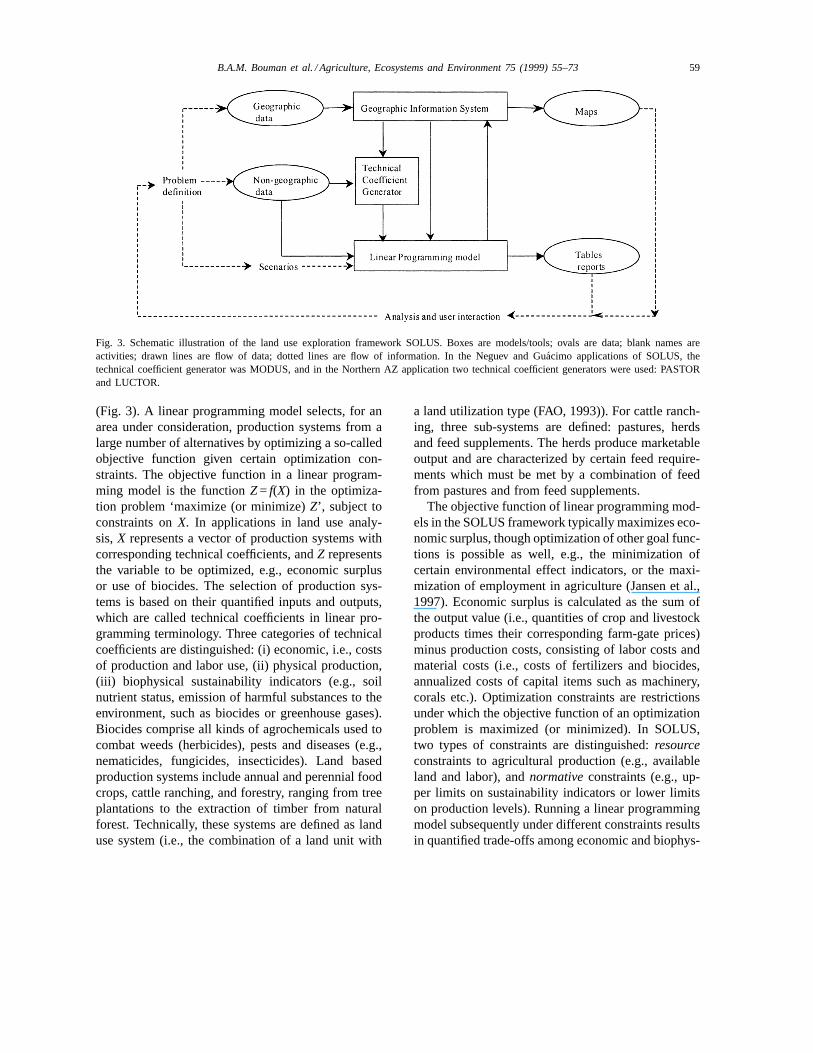
The SOLUS framework to analyze and evaluateland use scenarios comprises three main components:technical coefficient generators to quantify inputs andoutputs of production systems; a linear programmingmodel; and a geographic information system (GIS)

58 B.A.M. Bouman et al. / Agriculture, Ecosystems and Environment 75 (1999) 55–73
Fig. 2. Distribution of major soil types (a), road infrastructure (b), and identified sub-regions (c) on the basis of product transport costs inthe Northern AZ. Maps were created in GIS, and the data served as input for SOLUS in the Northern AZ implementation.
B.A.M. Bouman et al. / Agriculture, Ecosystems and Environment 75 (1999) 55–73 59
Fig. 3. Schematic illustration of the land use exploration framework SOLUS. Boxes are models/tools; ovals are data; blank names areactivities; drawn lines are flow of data; dotted lines are flow of information. In the Neguev and Guacimo applications of SOLUS, thetechnical coefficient generator was MODUS, and in the Northern AZ application two technical coefficient generators were used: PASTORand LUCTOR.
(Fig. 3). A linear programming model selects, for anarea under consideration, production systems from alarge number of alternatives by optimizing a so-calledobjective function given certain optimization con-straints. The objective function in a linear program-ming model is the functionZ= f(X) in the optimiza-tion problem ‘maximize (or minimize)Z’, subject toconstraints onX. In applications in land use analy-sis,X represents a vector of production systems withcorresponding technical coefficients, andZ representsthe variable to be optimized, e.g., economic surplusor use of biocides. The selection of production sys-tems is based on their quantified inputs and outputs,which are called technical coefficients in linear pro-gramming terminology. Three categories of technicalcoefficients are distinguished: (i) economic, i.e., costsof production and labor use, (ii) physical production,(iii) biophysical sustainability indicators (e.g., soilnutrient status, emission of harmful substances to theenvironment, such as biocides or greenhouse gases).Biocides comprise all kinds of agrochemicals used tocombat weeds (herbicides), pests and diseases (e.g.,nematicides, fungicides, insecticides). Land basedproduction systems include annual and perennial foodcrops, cattle ranching, and forestry, ranging from treeplantations to the extraction of timber from naturalforest. Technically, these systems are defined as landuse system (i.e., the combination of a land unit with
a land utilization type (FAO, 1993)). For cattle ranch-ing, three sub-systems are defined: pastures, herdsand feed supplements. The herds produce marketableoutput and are characterized by certain feed require-ments which must be met by a combination of feedfrom pastures and from feed supplements.
The objective function of linear programming mod-els in the SOLUS framework typically maximizes eco-nomic surplus, though optimization of other goal func-tions is possible as well, e.g., the minimization ofcertain environmental effect indicators, or the maxi-mization of employment in agriculture (Jansen et al.,1997). Economic surplus is calculated as the sum ofthe output value (i.e., quantities of crop and livestockproducts times their corresponding farm-gate prices)minus production costs, consisting of labor costs andmaterial costs (i.e., costs of fertilizers and biocides,annualized costs of capital items such as machinery,corals etc.). Optimization constraints are restrictionsunder which the objective function of an optimizationproblem is maximized (or minimized). In SOLUS,two types of constraints are distinguished:resourceconstraints to agricultural production (e.g., availableland and labor), andnormativeconstraints (e.g., up-per limits on sustainability indicators or lower limitson production levels). Running a linear programmingmodel subsequently under different constraints resultsin quantified trade-offs among economic and biophys-
60 B.A.M. Bouman et al. / Agriculture, Ecosystems and Environment 75 (1999) 55–73
ical sustainability indicators. Different linear program-ming models were developed for the various applica-tions of SOLUS to the Northern AZ (see Section 4).
The technical coefficients of production systemsthat feed a linear programming model are calculatedby so-called technical coefficient generators. Tech-nical coefficient generators are expert systems thatcombine process-based knowledge with empirical dataand expert knowledge to calculate inputs and outputsof production systems (Hengsdijk et al., 1998). Fordifferent production systems, a large number of op-tions can be generated by varying (targeted) outputlevels and the level and/or type of technology em-ployed, including possibilities for substitution betweeninputs. As with the linear programming models, dif-ferent technical coefficient generators were developedfor the various applications of SOLUS (as describedin Section 4).
In SOLUS, two types of input data exist: non-geographically referenced and geographically ref-erenced data. Most non-geographic data are useddirectly in the calculation of technical coefficients,and include such elements as crop, pasture and herdcharacteristics, land and soil properties, a discountrate and so-called attribute data of production in-puts. Examples of attribute data are prices, labor use,depreciation time and, in the case of biocides, con-centrations of active ingredients, toxicity parametersand half-life time. Examples of non-geographic dataused in the linear programming model are prices andquantities of products, price elasticities of demandand supply for outputs and labor. Geographic datacharacterize the region under study and quantify thespatial distribution of resource endowments such asland and labor. Information on characteristics of landunits and weather is used in the generation of tech-nical coefficients, while resource endowments figurein the linear programming model as boundary con-straints in scenario analysis. GIS is used for archivingand manipulating geo-referenced input data and forpresenting spatial output results. The data flow be-tween the GIS, the technical coefficient generatorsand the linear programming model is highly auto-mated due to well specified data exchange protocols(Stoorvogel, 1995; Bouman et al., 1998b).
The basic spatial unit of SOLUS is the land unit,which is defined as a unique combination of soil, land-scape and weather. All crop and pasture production
systems are quantified per land unit. Where possible,scale effects are taken into consideration in the cal-culations of technical coefficients by using produc-tion functions that are homogeneous in the secondorder. Up-scaling is done in the linear programmingmodel where land units are aggregated into farms,sub-regions or whole regions.
The general temporal unit of analysis is one year.Occasionally, it might be necessary to define labor usefor shorter time periods, e.g., to take account of theeffects of labor peaks due to coinciding managementoperations of different production systems. Similarly,in regions with pronounced growing seasons, it mightbe decided to define technical coefficients on a sea-sonal basis. The use of different temporal scales intechnical coefficients presents no problem as long asthey are properly used in the constraint and balanceequations in the linear programming model. Typicaltime horizons of land use studies with SOLUS varyfrom short term (0–5 years) to long term (≈50 years).
4. Implementation of SOLUS
4.1. The Neguev settlement
The implementation of SOLUS to the Neguev set-tlement was known by the Spanish acronym USTED(Uso Sostenible de Tierras En el Desarrollo) (Schip-per et al., 1995; Stoorvogel et al., 1995). Main datainput and characteristics for the Neguev implementa-tion are given in Tables 1 and 2. The study focusedon the exploration of cropping options for small andmedium-scale farmers (i.e., below 50 ha in size).Large-scale banana plantations and cattle ranchingwere excluded from the analysis, although pasturewas included by directly valuing forage production.The technical coefficient generator that was devel-oped for this study is called MODUS (modules fordata management in USTED; Stoorvogel et al., 1995).MODUS is mainly a descriptive book-keeping systemwhere all inputs and outputs of production systems arespecified by the user. For example, for a certain landuse system, yield level and all operations should bespecified by the user. The specification of operationsincludes a full description of timing and use of pro-duction factors (labor hours, machines, tools, fertil-

B.A.M. Bouman et al. / Agriculture, Ecosystems and Environment 75 (1999) 55–73 61
Table 1Characteristics of the implementation of SOLUS to the Neguev settlement (taken from Alfaro et al., 1994), Guacimo county (taken fromJansen et al., 1997) and the NAZ region (taken from Bouman et al., 1999)
Characteristics Neguev Guacimo Northern AZ
Production systems 5 crops: cassava, maize, palm 5 crops: cassava, maize, palm 8 crops: banana, bean, cassava, grainheart, pineapple, plantain heart, pineapple, plantain maize, fresh cobs maize, palm heart,
pineapple, plantain2 forestry (1 logged, natural 2 forestry (1 logged, natural 3 forestry (1 logged forest, 2 plantationsforest, 1 plantationGmelina forest, 1 plantationGmelina (Gmelina arboreaand Tectona grandis))arborea) arborea)1 natural pasture (mixture of 1 natural pasture (mixture of 5 pastures: natural grass pasture (mixturevarious spp.) various spp.) various spp.), grass–legume mixture (B.
brizantha–A. pintoi), Estrella (Cynodonnlemfuensis), Brachiaria (Brachiariabrizantha), Tanner (Brachiaria radicans);2 beef cattle systems: breeding, fatteninga
5 feed supplements: rejected bananas, sugarcane molasses, two types of chicken-dungbased concentrates, P mineral salt.
Production system 120 land use systems 169 land use systems 3288 land use systems (1532 crops andoptions and forests; 1756 pastures)
8 animal production systems5 feed supplements
Farm types 5 9 none
Sub-regions none none 12
Markets not included not included demand and supply relationships forproduct prices and labor
aIn the breeding system, calves are bred and subsequently sold at a certain age or live weight; no animals are bought externally. In thefattening system, young animals are bought, fattened for a period of time, and then sold; no animals are bred internally.
izer, biocides, etc.) for all activities carried out duringthe cropping cycle (land preparation, sowing, weed-ing, harvesting, etc.) (Jansen and Schipper, 1995). Forthe Neguev application, this information was mainlyderived from field experiments and farm surveys, sup-plemented by data obtained from crop growth modelsfor alternative cropping systems not (yet) encounteredin the area (such as the near potential productionof maize). The biophysical sustainability indicatorsare not entered by the user, but are calculated byMODUS as a function of production inputs and soilproperties. The indicators were derived from relevantsustainability issues in the area (see Jansen et al.,1995, for a detailed review of sustainability issues inNeguev), and included soil N, P and K balances andan index that quantifies the environmental hazard ofbiocides by taking account of the amount of toxicingredients used, their toxicity level and their half lifetime, called biocide index (Jansen et al., 1995). Thebiocide index is calculated from all biocide inputs
in the production system. The soil nutrient balancesare calculated using the NUTMON model (Stoorvo-gel, 1993), which is a straightforward book-keepingof all inputs (such as atmospheric deposition, fixa-tion by micro-organisms, manure, urine, fertilizer)and all outputs (such as losses by erosion, leaching,volatilization and denitrification/nitrification). Inputdata for NUTMON were obtained from a wide rangeof literature data, own field experiments and mea-surements in the area, and expert opinions (see e.g.,Bouman and Nieuwenhuyse (1999) for a detailed pre-sentation and discussion of data and their sources).The reasoning behind the use of soil nutrient balancesis that with negative balances, soils are being minedand productivity is expected to decline over time.Three land units were identified exclusively basedon soil type differentiation (landscape aspects andweather being uniform over soil types). A total of120 land use systems were quantified by varying thelevel of technology and production (as specified by

62 B.A.M. Bouman et al. / Agriculture, Ecosystems and Environment 75 (1999) 55–73
Table 2Input data inputs for the application of SOLUS to the Neguev settlement (taken from Alfaro et al., 1994), Guacimo county (taken fromJansen et al., 1997) and the NAZ region (taken from Bouman et al., 1999)
Data Neguev/Guacimo NAZ
Biophysical crop, forest and pasture characteristics crop, forest and pasture characteristics (e.g., yield(e.g., yield potential, nutrient concentrations) potential, nutrient concentrations) herd characteritics
(e.g., meat production , feed requirements)management characteristics of crops, forests and pastures management characteristics of crops, forests and pasturesweather data management characteristics of herdsland characteristics weather datasoil properties land characteristics ( e.g., slope, stoniness, drainage class)attribute data soil properties
attribute data
GIS soils soilsadministrative boundaries roadsfarm boundariesa district boundaries
labor force distributionprotected areas
Economic input/output prices input pricesfarm size distribution base prices and quantities of productsfarm assets: land (soil) and labor base quantity and wage of agricultural labortotal labor availability national price elasticities of demandbase labor wage regional price elasticities of product supplydiscount rate share of regional product supply
price elasticities of product supply of other regionsnational price elasticity of labor supplynational price elasticity of labor demandshare of regional labor in national labor supplyproduct market outletstransport costs of productslabor mobility coststotal labor sizediscount rate
aNeguev only.
the description of operations and the associated yieldlevel in MODUS) for five crops, two forestry systemsand one pasture on the three land units (Table 1).
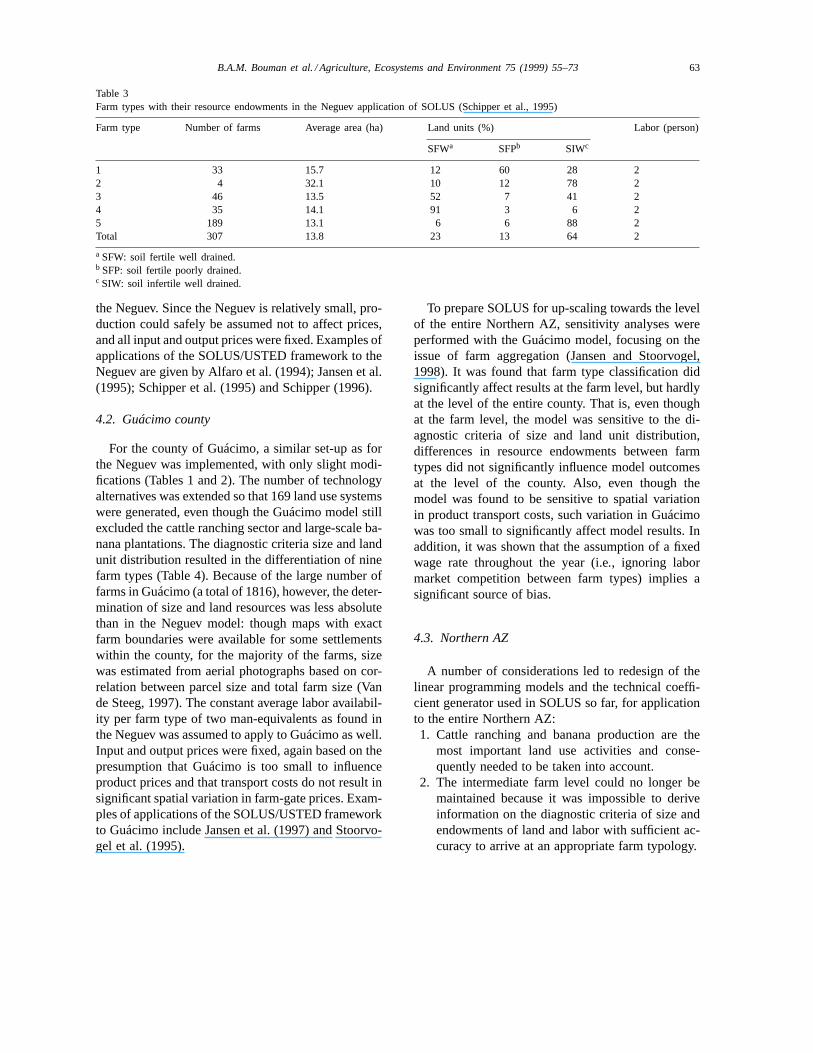
Decisions regarding land use are usually taken bythe farmer. Therefore, in USTED, the farm level servedas intermediate level between the level of land unitand the Neguev as a whole. Farms were classified intofive types based on resource endowments: size, avail-ability of land units and land–labor ratio (Table 3).Information on farm size and land units was derivedfrom overlaying a map of boundaries of all 307 farmsthat were present in the Neguev at the time of thestudy with a detailed 1 : 20,000 soil map; land–laborratios were based on an assumed labor force of twoper household derived from field inquiries. Attemptsto further refine the farm typology by including ob-
jectives of the farm household did not result into animproved classification (Schipper et al., 1995). Thefive farm types are specified in the linear program-ming model by their resource endowments, which aresummed to get the total resources of the whole Neguevsettlement. Interaction among the farm types was takeninto consideration by restricting the amount of hiredlabor on each farm type by the availability of off-farmlabor from other farm types. Employment opportuni-ties outside the Neguev consisted of work in bananaplantations which, at this scale level, could safely beassumed unlimited. Next to these fixedresourcecon-straints, optionalnormativeconstraints could be im-posed on the biophysical sustainability parameters atthe level of land unit, farm type or the whole Neguev.Transport costs were found to be the same throughout
B.A.M. Bouman et al. / Agriculture, Ecosystems and Environment 75 (1999) 55–73 63
Table 3Farm types with their resource endowments in the Neguev application of SOLUS (Schipper et al., 1995)
Farm type Number of farms Average area (ha) Land units (%) Labor (person)
SFWa SFPb SIWc
1 33 15.7 12 60 28 22 4 32.1 10 12 78 23 46 13.5 52 7 41 24 35 14.1 91 3 6 25 189 13.1 6 6 88 2Total 307 13.8 23 13 64 2
a SFW: soil fertile well drained.b SFP: soil fertile poorly drained.c SIW: soil infertile well drained.
the Neguev. Since the Neguev is relatively small, pro-duction could safely be assumed not to affect prices,and all input and output prices were fixed. Examples ofapplications of the SOLUS/USTED framework to theNeguev are given by Alfaro et al. (1994); Jansen et al.(1995); Schipper et al. (1995) and Schipper (1996).
4.2. Guácimo county
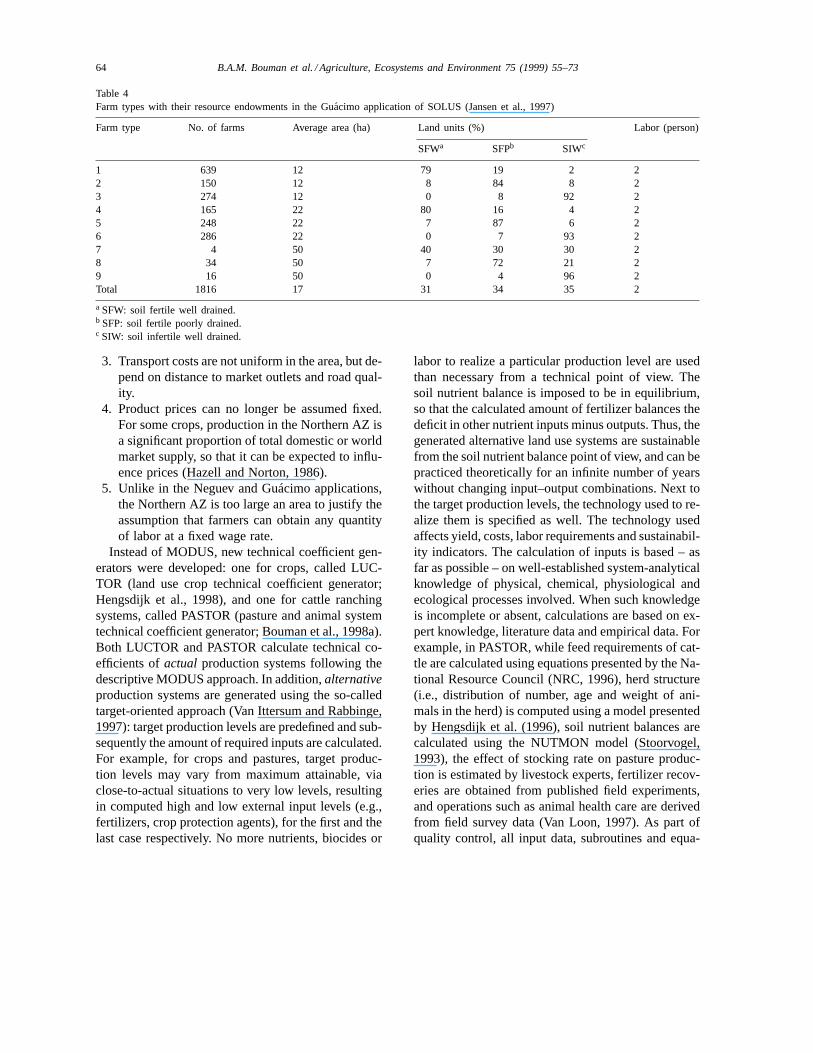
For the county of Guácimo, a similar set-up as forthe Neguev was implemented, with only slight modi-fications (Tables 1 and 2). The number of technologyalternatives was extended so that 169 land use systemswere generated, even though the Guácimo model stillexcluded the cattle ranching sector and large-scale ba-nana plantations. The diagnostic criteria size and landunit distribution resulted in the differentiation of ninefarm types (Table 4). Because of the large number offarms in Guácimo (a total of 1816), however, the deter-mination of size and land resources was less absolutethan in the Neguev model: though maps with exactfarm boundaries were available for some settlementswithin the county, for the majority of the farms, sizewas estimated from aerial photographs based on cor-relation between parcel size and total farm size (Vande Steeg, 1997). The constant average labor availabil-ity per farm type of two man-equivalents as found inthe Neguev was assumed to apply to Guácimo as well.Input and output prices were fixed, again based on thepresumption that Guácimo is too small to influenceproduct prices and that transport costs do not result insignificant spatial variation in farm-gate prices. Exam-ples of applications of the SOLUS/USTED frameworkto Guácimo include Jansen et al. (1997) and Stoorvo-gel et al. (1995).
To prepare SOLUS for up-scaling towards the levelof the entire Northern AZ, sensitivity analyses wereperformed with the Guácimo model, focusing on theissue of farm aggregation (Jansen and Stoorvogel,1998). It was found that farm type classification didsignificantly affect results at the farm level, but hardlyat the level of the entire county. That is, even thoughat the farm level, the model was sensitive to the di-agnostic criteria of size and land unit distribution,differences in resource endowments between farmtypes did not significantly influence model outcomesat the level of the county. Also, even though themodel was found to be sensitive to spatial variationin product transport costs, such variation in Guácimowas too small to significantly affect model results. Inaddition, it was shown that the assumption of a fixedwage rate throughout the year (i.e., ignoring labormarket competition between farm types) implies asignificant source of bias.
4.3. Northern AZ
A number of considerations led to redesign of thelinear programming models and the technical coeffi-cient generator used in SOLUS so far, for applicationto the entire Northern AZ:1. Cattle ranching and banana production are the
most important land use activities and conse-quently needed to be taken into account.
2. The intermediate farm level could no longer bemaintained because it was impossible to deriveinformation on the diagnostic criteria of size andendowments of land and labor with sufficient ac-curacy to arrive at an appropriate farm typology.
64 B.A.M. Bouman et al. / Agriculture, Ecosystems and Environment 75 (1999) 55–73
Table 4Farm types with their resource endowments in the Guacimo application of SOLUS (Jansen et al., 1997)
Farm type No. of farms Average area (ha) Land units (%) Labor (person)
SFWa SFPb SIWc
1 639 12 79 19 2 22 150 12 8 84 8 23 274 12 0 8 92 24 165 22 80 16 4 25 248 22 7 87 6 26 286 22 0 7 93 27 4 50 40 30 30 28 34 50 7 72 21 29 16 50 0 4 96 2Total 1816 17 31 34 35 2
a SFW: soil fertile well drained.b SFP: soil fertile poorly drained.c SIW: soil infertile well drained.
3. Transport costs are not uniform in the area, but de-pend on distance to market outlets and road qual-ity.
4. Product prices can no longer be assumed fixed.For some crops, production in the Northern AZ isa significant proportion of total domestic or worldmarket supply, so that it can be expected to influ-ence prices (Hazell and Norton, 1986).
5. Unlike in the Neguev and Guácimo applications,the Northern AZ is too large an area to justify theassumption that farmers can obtain any quantityof labor at a fixed wage rate.
Instead of MODUS, new technical coefficient gen-erators were developed: one for crops, called LUC-TOR (land use crop technical coefficient generator;Hengsdijk et al., 1998), and one for cattle ranchingsystems, called PASTOR (pasture and animal systemtechnical coefficient generator; Bouman et al., 1998a).Both LUCTOR and PASTOR calculate technical co-efficients ofactual production systems following thedescriptive MODUS approach. In addition,alternativeproduction systems are generated using the so-calledtarget-oriented approach (Van Ittersum and Rabbinge,1997): target production levels are predefined and sub-sequently the amount of required inputs are calculated.For example, for crops and pastures, target produc-tion levels may vary from maximum attainable, viaclose-to-actual situations to very low levels, resultingin computed high and low external input levels (e.g.,fertilizers, crop protection agents), for the first and thelast case respectively. No more nutrients, biocides or
labor to realize a particular production level are usedthan necessary from a technical point of view. Thesoil nutrient balance is imposed to be in equilibrium,so that the calculated amount of fertilizer balances thedeficit in other nutrient inputs minus outputs. Thus, thegenerated alternative land use systems are sustainablefrom the soil nutrient balance point of view, and can bepracticed theoretically for an infinite number of yearswithout changing input–output combinations. Next tothe target production levels, the technology used to re-alize them is specified as well. The technology usedaffects yield, costs, labor requirements and sustainabil-ity indicators. The calculation of inputs is based – asfar as possible – on well-established system-analyticalknowledge of physical, chemical, physiological andecological processes involved. When such knowledgeis incomplete or absent, calculations are based on ex-pert knowledge, literature data and empirical data. Forexample, in PASTOR, while feed requirements of cat-tle are calculated using equations presented by the Na-tional Resource Council (NRC, 1996), herd structure(i.e., distribution of number, age and weight of ani-mals in the herd) is computed using a model presentedby Hengsdijk et al. (1996), soil nutrient balances arecalculated using the NUTMON model (Stoorvogel,1993), the effect of stocking rate on pasture produc-tion is estimated by livestock experts, fertilizer recov-eries are obtained from published field experiments,and operations such as animal health care are derivedfrom field survey data (Van Loon, 1997). As part ofquality control, all input data, subroutines and equa-

B.A.M. Bouman et al. / Agriculture, Ecosystems and Environment 75 (1999) 55–73 65
tions, as well as simulated output of both PASTORand LUCTOR were carefully checked against field ob-servations and were reviewed by a number of outsideexperts. Detailed information on PASTOR and LUC-TOR is given by Bouman et al. (1998a) and Hengsdijket al. (1998), respectively.
In the implementation for the Northern AZ, LUC-TOR quantifies technical coefficients of various op-tions for eight crops and three forestry systems, andPASTOR for five pastures, two cattle production sys-tems, and five feed supplements (Table 1). Beside soiltype, other characteristics on which the differentiationin land units was based include slope and stoniness,being diagnostic criteria for mechanization feasibility.The four biophysical sustainability parameters alreadyincluded in the SOLUS applications for the Neguevand Guácimo were augmented with N leaching loss(a possible water pollutant), the amount of N lost by(de)nitrification (as a proxy for emissions of the green-house gasses NO and N2O; Keller et al., 1993), theamount of N lost via volatilization (NH3 being a po-tential contributor to acid rain), and the quantities ofactive ingredients in biocides applied. In a later stage,the emission/sequestration of the greenhouse gas CO2was included as well (Plant and Bouman, 1999). Es-pecially the potential for water pollution and the emis-sion/sequestration of greenhouse gasses are sustain-ability issues that various stakeholders in the NorthernAZ are getting concerned with (Jansen et al., 1995;SEPSA, 1997). For example, based on their functionof carbon sequestration, Costa Rican landowners re-ceive (1997 situation) an average of $31 ha−1 per yearfrom the government for maintaining a forest cover ontheir land.
Instead of using the farm as the intermediate levelbetween the level of land unit and the entire region,the Northern AZ was divided into sub-regions to ac-count for spatial variation in transport costs. Basedon presence and quality of roads (Fig. 2 (b)) and ge-ographical distances between farm gates and marketoutlets, transportation cost models were developed fordifferent classes of products (Hoekstra, 1996). Thesemodels were used to stratify the Northern AZ into 12sub-regions using procedures available in GIS (Fig.2 (c)). Climatic characteristics and major topograph-ical features are distributed rather homogeneouslythroughout the Northern AZ, doing away with theneed to include these biophysical characteristics in the
zonation. For each sub-region, land unit and labor en-dowments were calculated by map overlaying in GIS(Table 5). Agricultural labor availability was derivedfrom combining administrative boundaries with pop-ulation and labor market data (Schipper et al., 1998).
For some products, the production originating fromthe AZ is a large part of domestic supply, viz., bananas(95%), plantain (94%), palm heart (50%) and meat(13%), whereas the AZ production is even a consider-able part of the world supply for bananas (21%), plain-tain (21%) and palm heart (11%) (Roebeling et al.,1999). Therefore, it can be assumed that price forma-tion in the markets for each of these products is sig-nificantly influenced by the supply from the North-ern AZ. A method presented by Hazell and Norton(1986) was used to endogenize prices in the linearprogramming model. The procedure consists of lin-earizing downward-sloping demand curves around ob-served price and quantity values, using estimated priceelasticities of demand, the share of the supply from theregion in total supply (domestic or world market), andprice elasticities of supply of other suppliers (Schip-per et al., 1998). In order to adequately model the la-bor market in the Northern AZ, including competitionfor labor between sub-regions, it was assumed that theavailable labor pool in each sub-region can be em-ployed at a fixed wage. Labor can move freely betweensub-regions within the Northern AZ but at a so-calledlabor mobility cost calculated on the basis of bus faresbetween sub-regions. Labor from the non-agriculturalsector and from outside the Northern AZ can be at-tracted at increasing cost, i.e., an upward-sloping sup-ply curve for labor is assumed based on a calculatedelasticity of national labor supply (Schipper et al.,1998).
The linear program model for the entire NorthernAZ is called REALM (regional economic and agricul-tural land use model). REALM selects, per sub-regionand per land unit, the optimal combination of croppingand livestock options by maximizing regional eco-nomic surplus. For products with endogenous prices,REALM selects the optimal price-quantity combina-tions for all products taken together, thereby maximiz-ing the sum of producer and consumer surplus (Hazelland Norton, 1986). Optional,normativeconstraintscan be imposed on biophysical sustainability parame-ters at the level of land unit, sub-region or the wholeNorthern AZ.
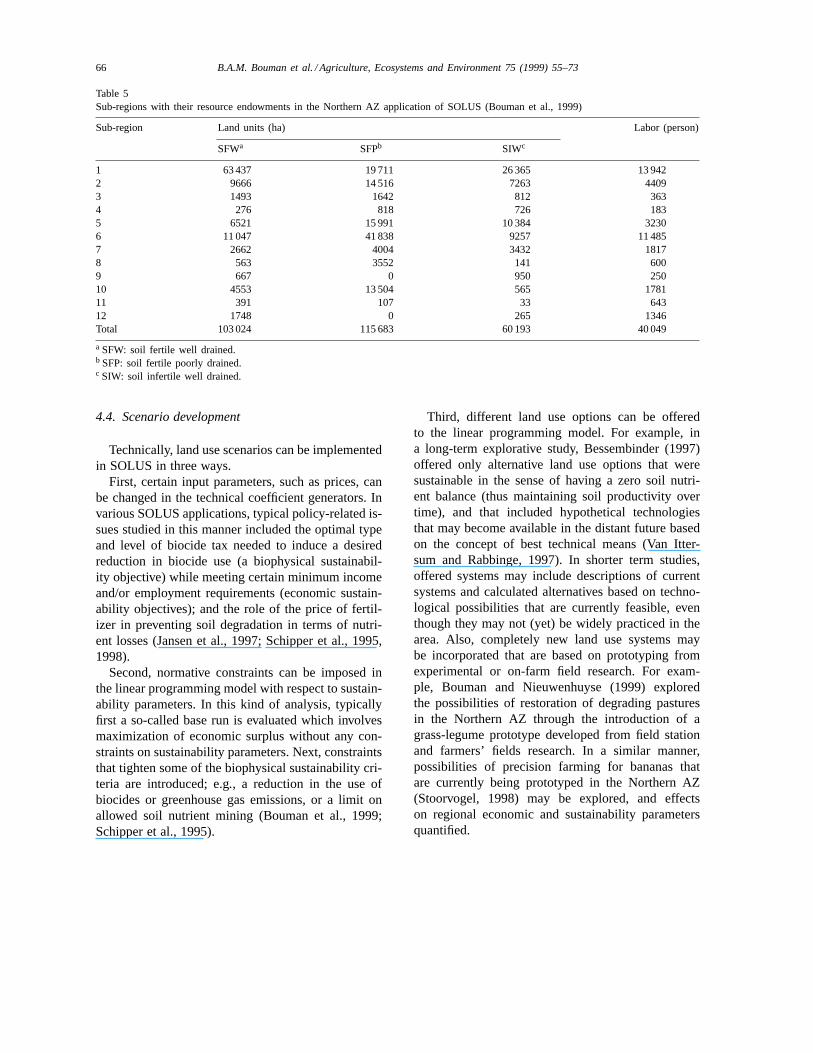
66 B.A.M. Bouman et al. / Agriculture, Ecosystems and Environment 75 (1999) 55–73
Table 5Sub-regions with their resource endowments in the Northern AZ application of SOLUS (Bouman et al., 1999)
Sub-region Land units (ha) Labor (person)
SFWa SFPb SIWc
1 63 437 19 711 26 365 13 9422 9666 14 516 7263 44093 1493 1642 812 3634 276 818 726 1835 6521 15 991 10 384 32306 11 047 41 838 9257 11 4857 2662 4004 3432 18178 563 3552 141 6009 667 0 950 25010 4553 13 504 565 178111 391 107 33 64312 1748 0 265 1346Total 103 024 115 683 60 193 40 049
a SFW: soil fertile well drained.b SFP: soil fertile poorly drained.c SIW: soil infertile well drained.
4.4. Scenario development
Technically, land use scenarios can be implementedin SOLUS in three ways.
First, certain input parameters, such as prices, canbe changed in the technical coefficient generators. Invarious SOLUS applications, typical policy-related is-sues studied in this manner included the optimal typeand level of biocide tax needed to induce a desiredreduction in biocide use (a biophysical sustainabil-ity objective) while meeting certain minimum incomeand/or employment requirements (economic sustain-ability objectives); and the role of the price of fertil-izer in preventing soil degradation in terms of nutri-ent losses (Jansen et al., 1997; Schipper et al., 1995,1998).
Second, normative constraints can be imposed inthe linear programming model with respect to sustain-ability parameters. In this kind of analysis, typicallyfirst a so-called base run is evaluated which involvesmaximization of economic surplus without any con-straints on sustainability parameters. Next, constraintsthat tighten some of the biophysical sustainability cri-teria are introduced; e.g., a reduction in the use ofbiocides or greenhouse gas emissions, or a limit onallowed soil nutrient mining (Bouman et al., 1999;Schipper et al., 1995).
Third, different land use options can be offeredto the linear programming model. For example, ina long-term explorative study, Bessembinder (1997)offered only alternative land use options that weresustainable in the sense of having a zero soil nutri-ent balance (thus maintaining soil productivity overtime), and that included hypothetical technologiesthat may become available in the distant future basedon the concept of best technical means (Van Itter-sum and Rabbinge, 1997). In shorter term studies,offered systems may include descriptions of currentsystems and calculated alternatives based on techno-logical possibilities that are currently feasible, eventhough they may not (yet) be widely practiced in thearea. Also, completely new land use systems maybe incorporated that are based on prototyping fromexperimental or on-farm field research. For exam-ple, Bouman and Nieuwenhuyse (1999) exploredthe possibilities of restoration of degrading pasturesin the Northern AZ through the introduction of agrass-legume prototype developed from field stationand farmers’ fields research. In a similar manner,possibilities of precision farming for bananas thatare currently being prototyped in the Northern AZ(Stoorvogel, 1998) may be explored, and effectson regional economic and sustainability parametersquantified.
B.A.M. Bouman et al. / Agriculture, Ecosystems and Environment 75 (1999) 55–73 67
5. Results of scenarios with SOLUS for theNorthern AZ
The Costa Rican government has called for theexecution of research that explicitly analyzes, fora range of policy options, the trade-offs betweensocio-economic and environmental goals (SEPSA,1997). In this context, the capabilities of the SOLUSmethodology are demonstrated through the evaluationof five scenarios related to projected technologicaldevelopments and to relevant policy and sustainabilityissues:1. Actual. The linear programming model was solved
by optimizing regional economic surplus, takingaccount of key biophysical boundary constraints(i.e., distribution and quantity of land resourcesand labor availability) but without any additionalnormative constraints. Only production optionsthat are currently prevailing in the Northern AZ(i.e., that are representative for current farmingpractices in the region) were offered to the linearprogramming model.
2. Base. As above, but now alternative productionsystems, based on technologies that can be ex-pected to be within farmers’ reach in the mediumterm (say, during the next 25 years or so) werealso included.
3. Soil. The same as the base scenario, but with azero soil mining constraint, thus excluding unsus-tainable land use options with a negative soil nu-trient balance.
4. Environment. The same as the base scenario, butwith the constraint that the values of all biophysi-cal sustainability indicators do not exceed 50% ofthe values in the base scenario. This scenario ex-plores the scope for reducing environmental con-tamination as caused by biocide use, N leachingloss and greenhouse gas emissions etc.
5. Soil/Environment. A combination of the above soilandenvironmentscenarios: in addition to zero soilmining, biocide use, N leaching and greenhousegas emission indicators are not allowed to exceed50% of the values in the base scenario.
The SOLUS framework as set-up for the wholeNorthern AZ was used (i.e., using the technical coeffi-cient generators LUCTOR and PASTOR, and the lin-ear programming model REALM); details are givenin Tables 1 and 2.
5.1. Results for entire Northern AZ
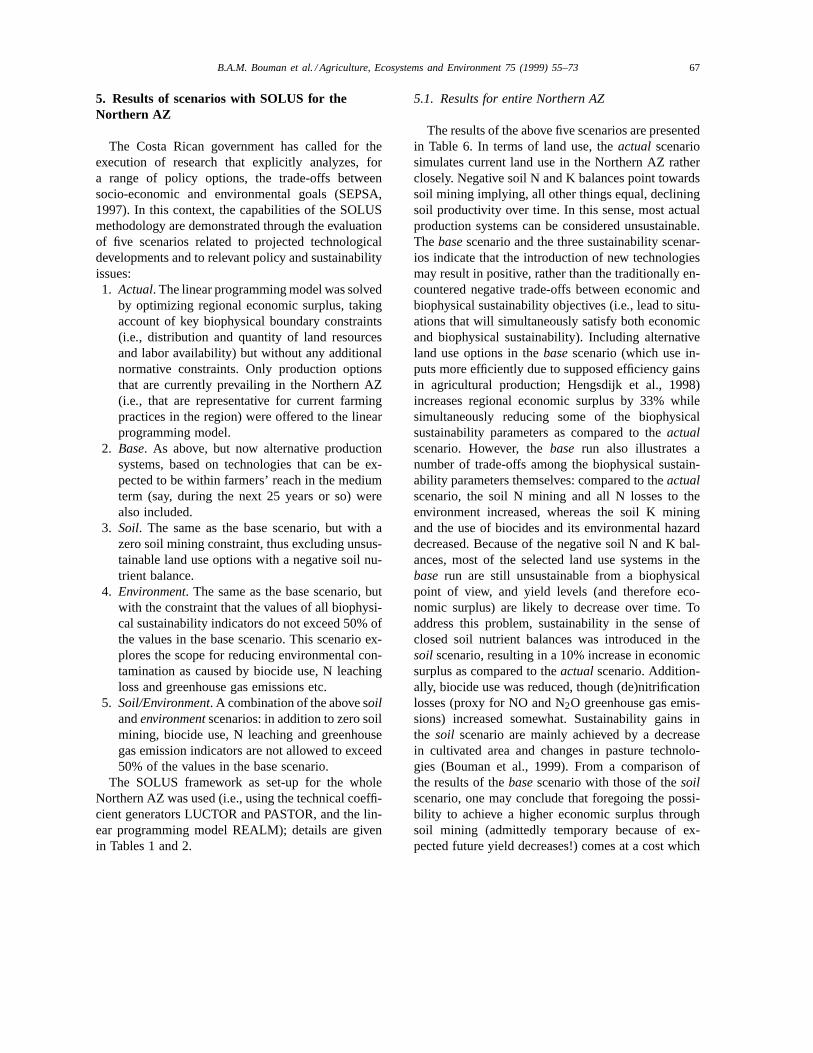
The results of the above five scenarios are presentedin Table 6. In terms of land use, theactual scenariosimulates current land use in the Northern AZ ratherclosely. Negative soil N and K balances point towardssoil mining implying, all other things equal, decliningsoil productivity over time. In this sense, most actualproduction systems can be considered unsustainable.Thebasescenario and the three sustainability scenar-ios indicate that the introduction of new technologiesmay result in positive, rather than the traditionally en-countered negative trade-offs between economic andbiophysical sustainability objectives (i.e., lead to situ-ations that will simultaneously satisfy both economicand biophysical sustainability). Including alternativeland use options in thebasescenario (which use in-puts more efficiently due to supposed efficiency gainsin agricultural production; Hengsdijk et al., 1998)increases regional economic surplus by 33% whilesimultaneously reducing some of the biophysicalsustainability parameters as compared to theactualscenario. However, thebase run also illustrates anumber of trade-offs among the biophysical sustain-ability parameters themselves: compared to theactualscenario, the soil N mining and all N losses to theenvironment increased, whereas the soil K miningand the use of biocides and its environmental hazarddecreased. Because of the negative soil N and K bal-ances, most of the selected land use systems in thebase run are still unsustainable from a biophysicalpoint of view, and yield levels (and therefore eco-nomic surplus) are likely to decrease over time. Toaddress this problem, sustainability in the sense ofclosed soil nutrient balances was introduced in thesoil scenario, resulting in a 10% increase in economicsurplus as compared to theactualscenario. Addition-ally, biocide use was reduced, though (de)nitrificationlosses (proxy for NO and N2O greenhouse gas emis-sions) increased somewhat. Sustainability gains inthe soil scenario are mainly achieved by a decreasein cultivated area and changes in pasture technolo-gies (Bouman et al., 1999). From a comparison ofthe results of thebasescenario with those of thesoilscenario, one may conclude that foregoing the possi-bility to achieve a higher economic surplus throughsoil mining (admittedly temporary because of ex-pected future yield decreases!) comes at a cost which
68 B.A.M. Bouman et al. / Agriculture, Ecosystems and Environment 75 (1999) 55–73
Table 6Results of SOLUS for five scenario analyses (see text for explanation)
Scenario Actual Base Soil Environment Soil/environment
Economic surplus (106 US$) 220 292 241 210 189Labora (%) 75 72 69 39 38
Land useb
Forest (%) 38 38 69 67 90Pasture (%) 43 43 19 23 2Crops (%) 19 19 12 10 8
Per crop type:Pineapple (%) 0.7 0.7 0.7 0.5 0.5Palm heart (%) 2.8 1.6 1.7 1.2 1.6Tree plantation (%) 0.0 4.1 0.0 0.0 0.0Banana (%) 10.0 7.9 8.1 3.9 4.2Plantain (%) 0.5 0.4 0.2 0.2 0.1Cassava (%) 4.4 4.6 1.7 4.4 1.8Beans (%) 0.0 0.0 0.0 0.0 0.0Maize (%) 0.0 0.0 0.0 0.0 0.0
Number of animals 313 219 410 508 172 356 207 001 39 629
Sustainability indicatorsSoil nitrogen balance (kg ha−1) −51 −62 0 −29 0Soil phosphorus balance (kg ha−1) 3 1 0 0 0Soil potassium balance (kg ha−1) −113 −20 0 −10 0Nitrogen lost by (de)nitrification (kg ha−1) 15 41 37 20 20Nitrogen lost by leaching (kg ha−1) 90 94 92 47 44Nitrogen lost by volatilization (kg ha−1) 15 24 23 12 12Pesticide active ingredients used (kg ha−1) 12 8 7 4 4Biocide index (–) 398 264 98 132 25
a Labor employment in the primary production sector as % of the total agricultural labor pool.b Land use as % of the total of 447 000 ha. The land use class forest includes 38% surface area permanently under forest in protectedareas and on nonsuitable soil, plus the land left fallow.
is equivalent to 23% of the maximum achievable eco-nomic surplus. On the other hand, besides halting soilmining and preventing future yield decreases, thesoilscenario (as compared to thebasescenario) also leadsto other sustainability benefits including decreasesin both biocide use and greenhouse gas emissions.Limiting the environmental indicators in theenviron-ment scenario to half of their corresponding valuesin the basescenario is relatively costly in economicterms (as evidenced by a 28% decline in economicsurplus), even though much less so relative to theAc-tual scenario. Again, environmental gains are mainlyachieved by significant decreases in pasture area.The cost of reducing biocide use and (de)nitrificationlosses is born to a considerable extent by agriculturallaborers who see their employment opportunities cutin half. Combining constraints on soil nutrient bal-
ances with those on the environmental effect indica-tors in thesoil/environmentscenario leads to an evenfurther reduction in economic surplus. Constraintson the environmental indicators effectively precludeextensive use of fertilizers to satisfy the zero soilnutrient balance constraint. As a result, a significantportion of agricultural land is taken out of productionbecause, without fertilizers, the constraint of zero soilnutrient balances can not be satisfied. Consequently,there is scope for forest regeneration, which might beconsidered an extra environmental gain. The regionaleconomic surplus stays at a relatively high level dueto the fact that even though crops account for onlya relatively small part of agricultural land use, theyare responsible for most of the economic surplus inthe area (particularly the cultivation of bananas forexport).
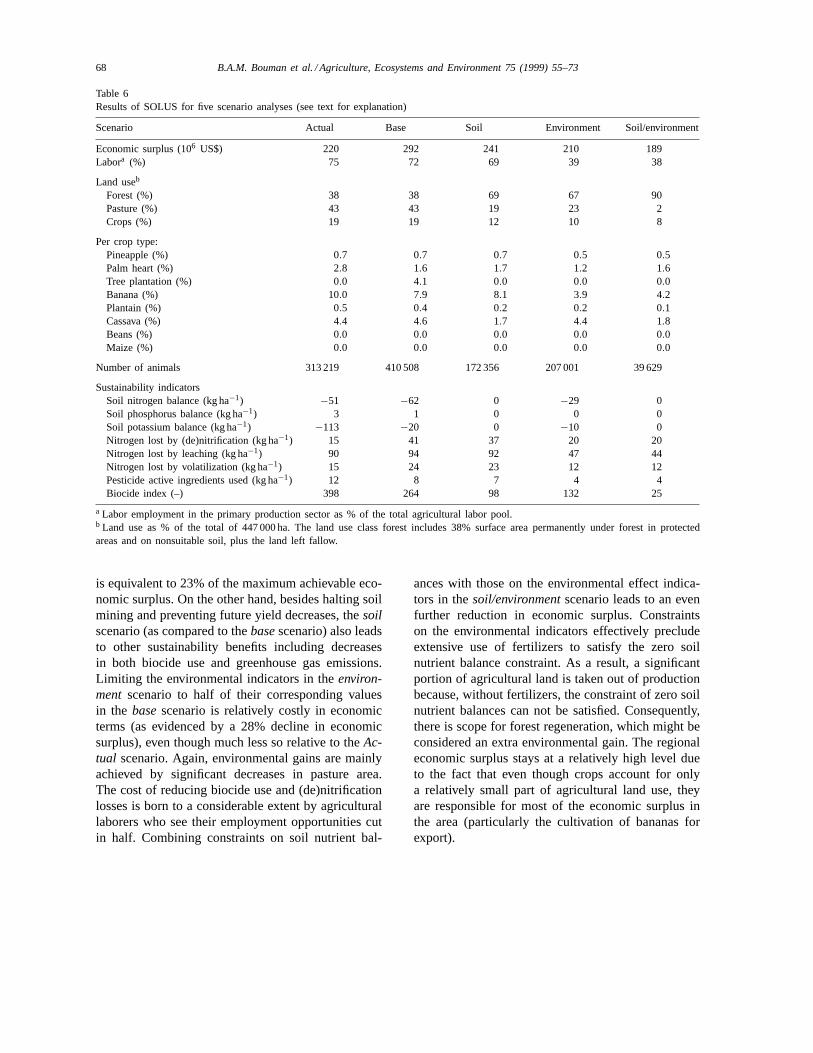
B.A.M. Bouman et al. / Agriculture, Ecosystems and Environment 75 (1999) 55–73 69
Fig. 4. Percentage of suitable land area under crops (%) in thebaserun (a) and in thesoil/environmentrun (b), of the SOLUS implementationfor the Northern AZ.
5.2. Results for sub-regions of Northern AZ
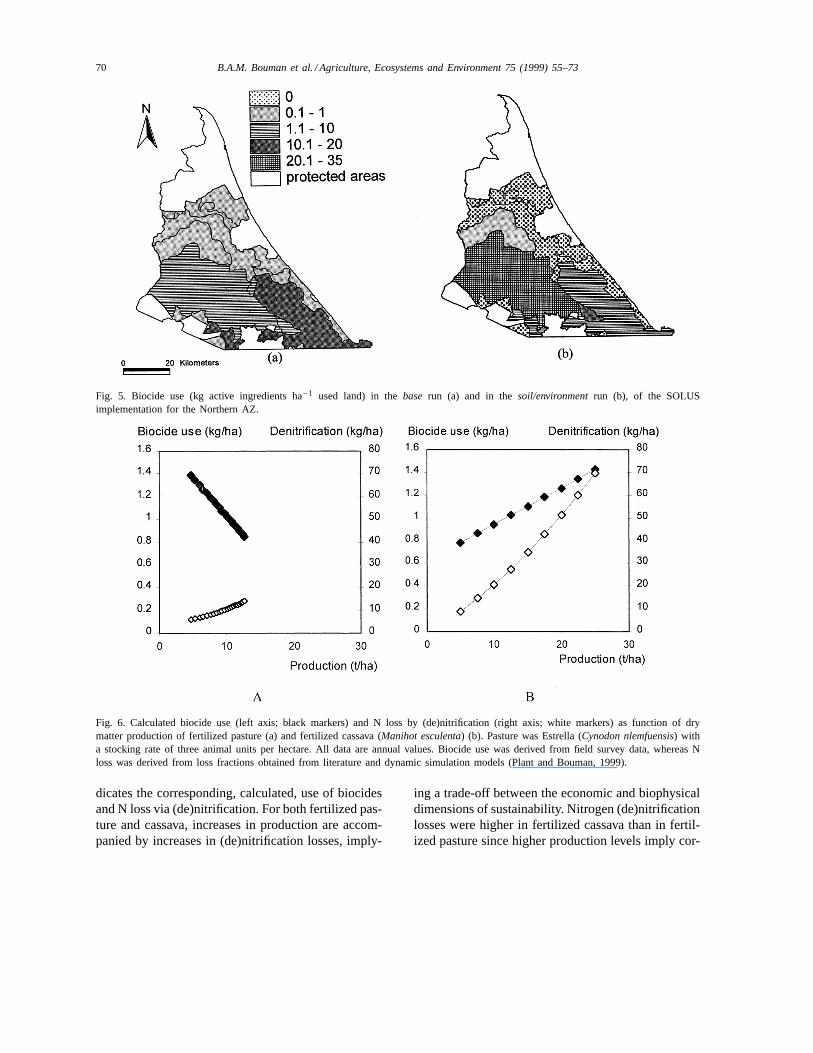
The spatial distribution of results of scenario anal-yses are best illustrated with maps created with GIS(Bouman et al., 1998b). For example, Fig. 4 (a) and(b) present maps for the percentage land used forcrops in thebaseand thesoil/environmentscenario,respectively. In thebasescenario, the percentage landused for cropping is highest in the southern zonesand lowest in the northern zones because of increas-ing transport costs from south to north. While in thesoil/environmentscenario considerably less land isused for crops than in thebasescenario, sub-regions9 and 12 (see Fig. 2 (c)), which had the highest per-centage cropped land in thebasescenario, have nolonger any area with crops because of relatively hightransport costs. The latter are caused by relativelypoor infrastructure, despite the close proximity ofboth sub-regions to the main road in the Northern AZ(see Fig. 2 (b)). Fig. 5 (a) and (b) show the amount ofbiocides (in terms of active ingredients) applied, as anaverage per hectare of used agricultural land, for thebasescenario and thesoil/environmentscenario, re-spectively. Differences among sub-regions are relatedto land use types and associated technologies (data notshown). In thesoil/environmentscenario, the averageamount of biocides applied per hectare of agricul-
tural land generally decreases in most sub-regions incomparison with thebasescenario result. However,in sub-regions 1 and 3 (see Fig. 2 (c)), the averageper hectare application of biocides increases becauseof shifts in crop production technologies (data notshown). Figs. 4 and 5 illustrate the geographical di-mension of potential conflicts and trade-offs that existbetween farmers’ interests, who have a strong marketorientation (Kuyvenhoven et al., 1995) and have aninterest to crop the available land to maximize eco-nomic surplus, and environmentalists’ interests, whoare after minimizing environmental pollution causedby the use of biocides. Moreover, they visualize geo-graphical ’hot-spots’ where local goals (at the levelof the sub-region) may conflict with regional goals(at the level of the entire Northern AZ).
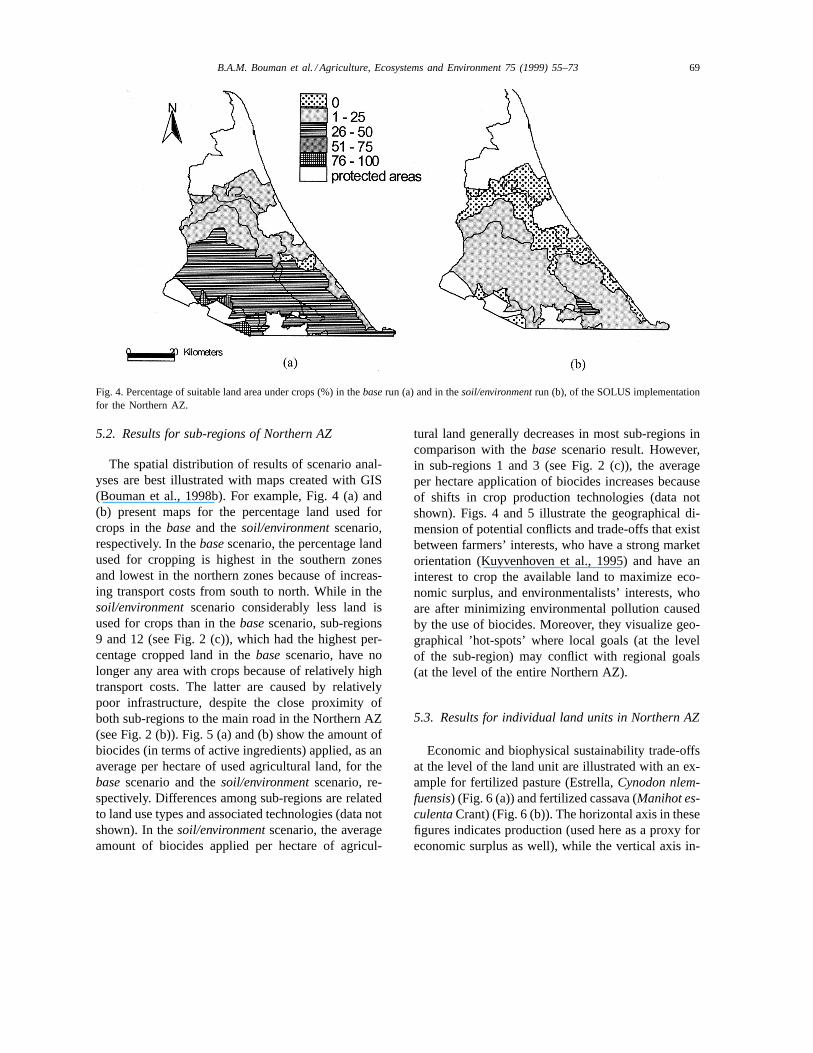
5.3. Results for individual land units in Northern AZ
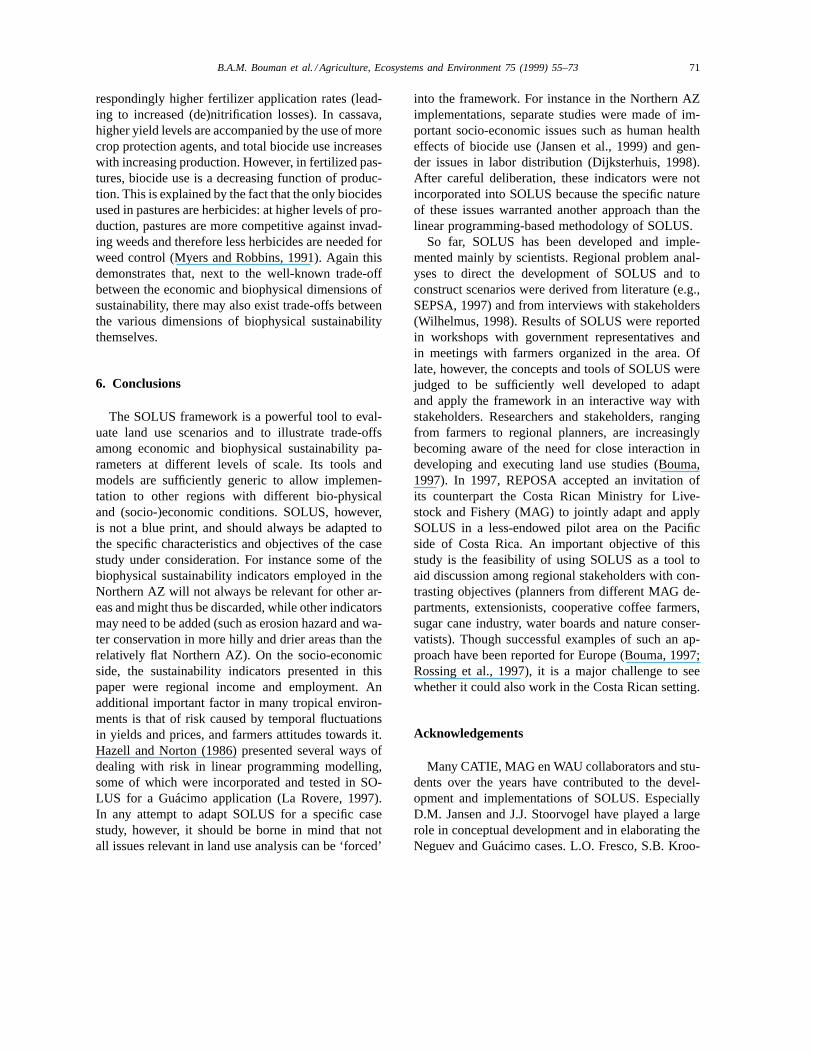
Economic and biophysical sustainability trade-offsat the level of the land unit are illustrated with an ex-ample for fertilized pasture (Estrella,Cynodon nlem-fuensis) (Fig. 6 (a)) and fertilized cassava (Manihot es-culentaCrant) (Fig. 6 (b)). The horizontal axis in thesefigures indicates production (used here as a proxy foreconomic surplus as well), while the vertical axis in-
70 B.A.M. Bouman et al. / Agriculture, Ecosystems and Environment 75 (1999) 55–73
Fig. 5. Biocide use (kg active ingredients ha−1 used land) in thebase run (a) and in thesoil/environmentrun (b), of the SOLUSimplementation for the Northern AZ.
Fig. 6. Calculated biocide use (left axis; black markers) and N loss by (de)nitrification (right axis; white markers) as function of drymatter production of fertilized pasture (a) and fertilized cassava (Manihot esculenta) (b). Pasture was Estrella (Cynodon nlemfuensis) witha stocking rate of three animal units per hectare. All data are annual values. Biocide use was derived from field survey data, whereas Nloss was derived from loss fractions obtained from literature and dynamic simulation models (Plant and Bouman, 1999).
dicates the corresponding, calculated, use of biocidesand N loss via (de)nitrification. For both fertilized pas-ture and cassava, increases in production are accom-panied by increases in (de)nitrification losses, imply-
ing a trade-off between the economic and biophysicaldimensions of sustainability. Nitrogen (de)nitrificationlosses were higher in fertilized cassava than in fertil-ized pasture since higher production levels imply cor-
B.A.M. Bouman et al. / Agriculture, Ecosystems and Environment 75 (1999) 55–73 71
respondingly higher fertilizer application rates (lead-ing to increased (de)nitrification losses). In cassava,higher yield levels are accompanied by the use of morecrop protection agents, and total biocide use increaseswith increasing production. However, in fertilized pas-tures, biocide use is a decreasing function of produc-tion. This is explained by the fact that the only biocidesused in pastures are herbicides: at higher levels of pro-duction, pastures are more competitive against invad-ing weeds and therefore less herbicides are needed forweed control (Myers and Robbins, 1991). Again thisdemonstrates that, next to the well-known trade-offbetween the economic and biophysical dimensions ofsustainability, there may also exist trade-offs betweenthe various dimensions of biophysical sustainabilitythemselves.
6. Conclusions
The SOLUS framework is a powerful tool to eval-uate land use scenarios and to illustrate trade-offsamong economic and biophysical sustainability pa-rameters at different levels of scale. Its tools andmodels are sufficiently generic to allow implemen-tation to other regions with different bio-physicaland (socio-)economic conditions. SOLUS, however,is not a blue print, and should always be adapted tothe specific characteristics and objectives of the casestudy under consideration. For instance some of thebiophysical sustainability indicators employed in theNorthern AZ will not always be relevant for other ar-eas and might thus be discarded, while other indicatorsmay need to be added (such as erosion hazard and wa-ter conservation in more hilly and drier areas than therelatively flat Northern AZ). On the socio-economicside, the sustainability indicators presented in thispaper were regional income and employment. Anadditional important factor in many tropical environ-ments is that of risk caused by temporal fluctuationsin yields and prices, and farmers attitudes towards it.Hazell and Norton (1986) presented several ways ofdealing with risk in linear programming modelling,some of which were incorporated and tested in SO-LUS for a Guácimo application (La Rovere, 1997).In any attempt to adapt SOLUS for a specific casestudy, however, it should be borne in mind that notall issues relevant in land use analysis can be ‘forced’
into the framework. For instance in the Northern AZimplementations, separate studies were made of im-portant socio-economic issues such as human healtheffects of biocide use (Jansen et al., 1999) and gen-der issues in labor distribution (Dijksterhuis, 1998).After careful deliberation, these indicators were notincorporated into SOLUS because the specific natureof these issues warranted another approach than thelinear programming-based methodology of SOLUS.
So far, SOLUS has been developed and imple-mented mainly by scientists. Regional problem anal-yses to direct the development of SOLUS and toconstruct scenarios were derived from literature (e.g.,SEPSA, 1997) and from interviews with stakeholders(Wilhelmus, 1998). Results of SOLUS were reportedin workshops with government representatives andin meetings with farmers organized in the area. Oflate, however, the concepts and tools of SOLUS werejudged to be sufficiently well developed to adaptand apply the framework in an interactive way withstakeholders. Researchers and stakeholders, rangingfrom farmers to regional planners, are increasinglybecoming aware of the need for close interaction indeveloping and executing land use studies (Bouma,1997). In 1997, REPOSA accepted an invitation ofits counterpart the Costa Rican Ministry for Live-stock and Fishery (MAG) to jointly adapt and applySOLUS in a less-endowed pilot area on the Pacificside of Costa Rica. An important objective of thisstudy is the feasibility of using SOLUS as a tool toaid discussion among regional stakeholders with con-trasting objectives (planners from different MAG de-partments, extensionists, cooperative coffee farmers,sugar cane industry, water boards and nature conser-vatists). Though successful examples of such an ap-proach have been reported for Europe (Bouma, 1997;Rossing et al., 1997), it is a major challenge to seewhether it could also work in the Costa Rican setting.
Acknowledgements
Many CATIE, MAG en WAU collaborators and stu-dents over the years have contributed to the devel-opment and implementations of SOLUS. EspeciallyD.M. Jansen and J.J. Stoorvogel have played a largerole in conceptual development and in elaborating theNeguev and Guácimo cases. L.O. Fresco, S.B. Kroo-
72 B.A.M. Bouman et al. / Agriculture, Ecosystems and Environment 75 (1999) 55–73
nenberg, A. Kuyvenhoven and M.A. Van Ittersum arethanked for valuable suggestions and continuing sup-port.
References
Alfaro, R., Bouma, J., Fresco, L.O., Jansen, D.M., Kroonenberg,S.B., van Leeuwen, A.J.C., Schipper, R.A., Sevenhuysen, R.J.,Stoorvogel, J.J., Watson, V., 1994. Sustainable land use planningin Costa Rica: a methodological case study on farm and regionallevel. In: Fresco, L.O., Stroosnijder, L., Bouma, J.,Van Keulen,H. (Eds.), The Future of the Land; Mobilising and IntegratingKnowledge for Land Use Options. Wiley, Chichester, UK, pp.183–202.
Bessembinder, J., 1997. Uncertainty and temporal aspects inlong-term explorations of sustainable land use; with referenceto the Northern Atlantic Zone of Costa Rica. Ph.D.Thesis, Wageningen Agricultural University, Wageningen, TheNetherlands.
Bouma, J., 1997. The role of quantitative approaches in soil sciencewhen interacting with stakeholders. Geoderma 78, 1–12.
Bouman, B.A.M., Nieuwenhuyse, A., 1999. Exploring options forsustainable beef cattle ranching in the humid tropics: a casestudy for the Atlantic Zone of Costa Rica. Agric. Syst. 59,145–161.
Bouman, B.A.M., Nieuwenhuyse, A., Hengsdijk, H., 1998a.PASTOR: A technical coefficient generator for pasture andlivestock Systems in the Humid Tropics; version 2.0. AUsers Guide. Quantitative Approaches in Systems Analysis 18.AB-DLO-PE, Wageningen, 59 pp. + appendices.
Bouman, B.A.M., Nieuwenhuyse, A., Schipper, R.A., Hengsdijk,H., Jansen, H.G.P., 1998b. An integrated methodology forsustainable land use exploration using GIS. In: Proc. First Int.Conf. Geospatial Information in Agriculture and Forestry, vol.II. ERIM, Ann Arbor, USA, pp. 230–237.
Bouman, B.A.M., Schipper, R.A., Nieuwenhuyse, A., Hengsdijk,H., Jansen, H.G.P., 1999. Quantifying economic andenvironmental trade-offs in land use exploration at the regionallevel: a case study for the Northern Atlantic Zone of CostaRica. Ecol. Model. 114, 95–109.
Crissman, C.C., Antle, J.M., Capaldo, S.M., 1997. Economic,Environmental, and Health Trade-Offs in Agriculture: Pesticidesand the Sustainability of Andean Potato Production. KluwerAcademic Publishers, Dordrecht, The Netherlands.
De Wit, C.T., van Keulen, H., Seligman, N.G., Spharim, I.,1988. Application of interactive multiple goal programmingtechniques for analysis and planning of regional agriculturaldevelopment. Agric. Syst. 26, 211–230.
Dijksterhuis, H.L., 1998. Female participation in the agriculturalsector of the Northern Atlantic Zone of Costa Rica. FieldReport 129, REPOSA, CATIE, Turialba, Costa Rica, 46pp. + appendices.
Dumanski, J., Pettapiece, W.W., McGregor, R.J., 1998. Relevanceof scale dependent approaches for integrating biophysical andsocio-economic information and development of agroecological
indicators. In: Finke, P.A., Bouma, J., Hoosbeek, M.R. (Eds.),Soil and Water Qualities at Different Scales. Kluwer AcademicPublishers, Dordrecht, The Netherlands, pp. 13–22.
FAO (Food and Agriculture Organization of the United Nations),1993. Guidelines for land use planning. FAO DevelopmentsSeries 1, FAO, Rome, Italy, 96 pp.
FAO (Food and Agriculture Organization of the United Nations)1995. Planning for sustainable use of land resources. Towardsa new approach. Background paper to the FAO’s Taskmembership for Chapter 10 of the Agenda 21 of the UnitedNations Conference on Environment (UNCED). FAO Land andWater Bulletin 2. FAO, Rome, Italy, 60 pp.
Fresco, L.O., 1995. Agro-ecological knowledge at different scales.In: Bouma, J., Kuyvehoven, A., Bouman, B.A.M., Luyten, J.C.,Zandstra, H.G. (Eds.), Eco-Regional Approaches for SustainableLand Use and Food Production. Kluwer Academic Publishers,Dordrecht, The Netherlands, pp. 133–143.
Hazell, P.B.R., Norton, R.D., 1986. Mathematical Programmingfor Economic Analysis in Agriculture. Macmillan, New York,400 pp.
Hengsdijk, H., Quak, W., Bakker, E.J., Ketelaars, J.J.M.H.,1996. A technical coefficient generator for land useactivities in the Koutiala region of south Mali. DLV ReportNo. 6, AB-DLO/Department of Development Economics,Wageningen, The Netherlands, 40 pp. + appendices.
Hengsdijk, H., Nieuwenhuyse, A., Bouman, B.A.M., 1998.LUCTOR.: Land use crop technical coefficient generator. Amodel to quantify crop systems in the Atlantic Zone ofCosta Rica; version 2.0. Quantitative Approaches in SystemsAnalysis 17. AB-DLO-PE, Wageningen, The Netherlands. 65pp. + appendices.
Hoekstra, S.L., 1996. Field research on transportation costs,farm-gate, and farmer market prices in the Atlantic Zone ofCosta Rica. Field report 110, REPOSA, CATIE, Turialba, CostaRica, 89 pp.
Jansen, W.G., 1995. Aggregating economic knowledge for useat national, regional, sector, and farm level. In: Bouma, J.,Kuyvehoven, A., Bouman, B.A.M., Luyten, J.C., Zandstra, H.G.(Eds.), Eco-Regional Approaches for Sustainable Land Use andFood Production. Kluwer Academic Publishers, Dordrecht, TheNetherlands, pp. 143–166.
Jansen, D.M., Schipper, R.A., 1995. A static descriptive approachto quantify land use systems. Netherlands J. Agric. Sci. 43,31–46.
Jansen, H.G.P., Stoorvogel, J.J., 1998. Quantification ofaggregation bias in regional agricultural land use models:application to Guácimo county, Costa Rica. Agric. Syst. 58,417–439.
Jansen, D.M., Stoorvogel, J.J., Schipper, R.A., 1995. Usingsustainability indicators in agricultural land use analysis: anexample from Costa Rica. Netherlands J. Agric. Sci. 43, 61–82.
Jansen, D.M., Stoorvogel, J.J., Jansen, J.G.P., 1997. A quantitativetool for regional land-use analysis. In: Teng, P.S., Kropff, M.J.,ten Berge, H.F.M., Dent, J.B., Lansigan, F.P., van Laar, H.H.(Eds.), Applications of Systems Approaches at the Farm andRegional Levels, Kluwer Academic Publishers, Dordrecht, TheNetherlands, vol. 1, pp. 399–412.
B.A.M. Bouman et al. / Agriculture, Ecosystems and Environment 75 (1999) 55–73 73
Jansen, H.G.P., Uytewaal, E., Stoorvogel, J., 1999. Healthexternalities and pesticide use in the Atlantic Zone ofCosta Rica: an economic evaluation. Ambio, submitted forpublication.
Keller, M., Veldkamp, E., Weitz, A.M., Reiners, W.A., 1993. Effectof pasture age on soil trace-gas emissions from a deforestedarea of Costa Rica. Nature 365, 244–246.
Kruseman, G., Ruben, R., Hengsdijk, H., van Ittersum, M.K., 1995.Farm household modelling for estimating the effectiveness ofprice instruments in land use policy. Netherlands J. Agric. Sci.43, 111–230.
Kuyvenhoven, A., Ruben, R., Kruseman, G., 1995. Options forsustainable agricultural systems and policy instruments to reachthem. In: Bouma, J., Kuyvehoven, A., Bouman, B.A.M., Luyten,J.C., Zandstra, H.G. (Eds.), Eco-Regional Approaches forSustainable Land Use and Food Production. Kluwer AcademicPublishers, Dordrecht, The Netherlands, pp. 187–212.
La Rovere, R., 1997. Risk, income and land use in theAtlantic Zone of Costa Rica: an assessment with a linearprogramming model. REPOSA report 125, CATIE/MAG/AUW,CATIE Turialba, Costa Rica, 93 pp. + appendices.
Myers, R.J.K., Robbins, G.B., 1991. Sustaining productive pasturesin the tropics 5. Maintaining productive sown grass pastures.Trop. Grasslands 25, 104–110.
Nieuwenhuyse, A., 1996. Soils, geology and soil-relatedsustainability aspects of the perhumid tropical Limon basin,Costa Rica. Serie Tecnica. Informe Tecnico 272. CATIE,Turialba, Costa Rica, 85 pp.
NRC, 1996. Nutrient requirements of beef cattle. NationalAcademy Press, Washington, D.C., 242 pp.
Penning de Vries, F.W.T., van Keulen, H., Rabbinge, R., 1995.Natural resources and limits of food production in 2040. In:J. Bouma, A. Kuyvehoven, B.A.M. Bouman, J.C. Luyten andH.G. Zandstra (Eds.), Eco-regional approaches for sustainableland use and food production. Kluwer Academic Publishers,Dordrecht, The Netherlands, pp. 65–88.
Plant, R.A.J., Bouman, B.A.M., 1999. Modeling nitrogen trace gasemissions from current and alternative pastures in the NorthernAtlantic Zone of Costa Rica, J. Environ. Quality 28(3).
Rabbinge, R., van Latesteijn, H.C., 1992. Long term options forland use in the European Community. Agric. Syst. 40, 195–210.
Roebeling, P.C., Jansen, H.G.P., Schipper, R.A., Saenz, F.,Castro, E., Ruben, R., Hengsdijk, H., Bouman, B.A.M., 1999.Farm modelling for policy analysis at the farm and regionallevel. In: B.A.M. Bouman, H.G.P. Jansen, R.A. Schipper, A.Nieuwenhuyse and H. Hengsdijk (Eds.), Tools for Land useAnalysis at Different Scale Levels,With Case Studies for theAtlantic Zone of Costa Rica. Kluwer Academic Publishers,Dordrecht, The Netherlands, in press.
Rossing, W.A.H., Meynard, J.M., van Ittersum, M.K., 1997.Model-based explorations to support development of sustainablefarming systems: case studies from France and The Netherlands.Eur. J. Agron. 7, 271–283.
Schipper, R.A., 1996. Farming in a fragile future. Economicsof land use with applications in the Atlantic Zone of CostaRica. Ph.D. Thesis, Wageningen Agricultural University, TheNetherlands, 282 pp.
Schipper, R.A., Jansen, D.M., Stoorvogel, J.J., 1995. Sub-regionallinear programming models in land use analysis: a case study ofthe Neguev settlement. Netherlands J. Agric. Sci. 43, 83–109.
Schipper, R. A., Jansen, H.G.P., Bouman, B.A.M., Hengsdijk, H.,Nieuwenhuyse, A., Saenz, F., 1998. Evaluation of developmentpolicies using integrated bio-economic land use models:applications to Costa Rica. Field Report 136, Program paper 16,REPOSA. CATIE/UAW/WAU, CATIE, Turialba, Costa Rica.80 pp.
SEPSA, 1997. [Secretarıa Ejecutiva de Planificación SectoralAgropecuaria]Polıticas del sector agropecuario (revisión yajuste). Ministry of Agriculture and Livestock (MAG), SanJosé, Costa Rica.
Stoorvogel, J.J., 1993. Optimizing land use distribution to minimizenutrient depletion: a case study for the Atlantic Zone of CostaRica. Geoderma 60, 277–292.
Stoorvogel, J.J., 1995. Linking GIS and models: structure andoperationalisation for a Costa Rica case study. Netherlands J.Agric. Sci. 43, 19–29.
Stoorvogel, J.J., 1998. BanMan: a decision support system forbanana management. In: Stoorvogel, J.J., Bouma, J., Bowen,W.T. (Eds.), Information Technology as a Tool to Assess LandUse Options in Space and Time. Quantitative Approachesin Systems Analysis 16. AB-DLO-PE, Wageningen, TheNetherlands. pp. 13–22.
Stoorvogel, J.J., Schipper, R.A., Jansen, D.M., 1995. USTED: amethodology for quantitative analysis of land use scenarios..Netherlands J. Agric. Sci. 43, 5–18.
Tims, 1995. Responses. In: Bouma, J., Kuyvehoven, A., Bouman,B.A.M., Luyten, J.C., Zandstra, H.G. (Eds.), Eco-regionalApproaches for Sustainable Land Use and Food Production.Kluwer Academic Publishers, Dordrecht, The Netherlands, pp.113–122.
Van de Steeg, J., 1997. A farm typology for the Atlantic Zone.Field report 117, REPOSA, CATIE, Turialba, Costa Rica. 44pp.
Van Ittersum, M.K., Rabbinge, R., 1997. Concepts in productionecology for analysis and quantification of agriculturalinput-output combinations. Field Crops Res. 52, 197–208.
Van Latesteijn, 1995. Scenarios for land use in Europe:agro-ecological options within socio-economic boundaries. In:Bouma, J., Kuyvehoven, A., Bouman, B.A.M., Luyten, J.C.,Zandstra, H.G. (Eds.), Eco-regional Approaches for SustainableLand Use and Food Production. Kluwer Academic Publishers,Dordrecht, The Netherlands, pp. 43–64.
Van Loon, M., 1997. Characterization of beef cattle farmingin the Atlantic Zone of Costa Rica. REPOSA Report 127,CATIE/MAG/AUW, CATIE Turialba, Costa Rica. 46 pp.
Veldkamp, A., Fresco, L.O., 1996. CLUE-CR: an integratedmulti-scale model to simulate land use change scenarios inCosta Rica. Ecol. Model. 91, 231–248.
Wilhelmus, C.M., 1998. Supporting consensus on land use policy’the merits and limitations of computer modelling. A case studyin Costa Rica. Field report 131, REPOSA, CATIE, Turialba,Costa Rica, 45 pp.