Spectral and pseudo-spectral methods for parabolic problems with non periodic boundary conditions
THE ASTROPHYSICAL JOURNAL, 541 :166È179, 2000 September 202000. The American Astronomical Society. All rights reserved. Printed in U.S.A.(
X-RAY EMISSION OF MARKARIAN 421 : NEW CLUES FROM ITS SPECTRAL EVOLUTION.II. SPECTRAL ANALYSIS AND PHYSICAL CONSTRAINTS
G. FOSSATI
Center for Astrophysics and Space Sciences, University of California at San Diego, 9500 Gilman Drive, La Jolla, CA 92093-0424 ;gfossati=ucsd.edu
A. CELOTTI, M. CHIABERGE, AND Y. H. ZHANG
International School for Advanced Studies, via Beirut 2-4, 34014 Trieste, Italy
L. CHIAPPETTI
Istituto di Fisica Cosmica G. Occhialini, via Bassini 15, 20133 Milano, Italy
G. GHISELLINI,1 L. MARASCHI, AND F. TAVECCHIO
Osservatorio Astronomico di Brera, via Brera 28, 20121 Milano, Italy
E. PIAN
ITeSRE/CNR, via Gobetti 101, 40129 Bologna, Italy
AND
A. TREVES
dellÏInsubria, via Lucini 3, 22100 Como, ItalyUniversitaReceived 2000 April 10 ; accepted 2000 April 21
ABSTRACTMrk 421 was repeatedly observed with BeppoSAX in 1997 and 1998. The source showed a very rich
phenomenology with remarkable spectral variability. This is the second of two papers presenting theresults of a thorough temporal and spectral analysis of all the data available to us, focusing in particularon the Ñare of April 1998, which was simultaneously observed also at TeV energies. The spectral analysisand correlations are presented in this paper, while the data reduction and timing analysis are the contentof the companion paper. The spectral evolution during the Ñare has been followed over few ks intervals,allowing us to detect for the Ðrst time the peak of the synchrotron component shifting to higher energiesduring the rising phase and then receding. This spectral analysis nicely conÐrms the delay of the Ñare atthe higher energies, which in Paper I we quantiÐed as a hard lag of a few ks. Furthermore, at the highestenergies, evidence is found of variations of the inverse Compton component. The spectral and temporalinformation obtained challenge the simplest models currently adopted for the (synchrotron) emissionand, most important, provide clues on the particle acceleration process. A scenario accounting for all theobservational constraints is discussed, where electrons are injected at progressively higher energies duringthe development of the Ñare and the achromatic decay is ascribed to the source light crossing timeexceeding the particle cooling timescales.Subject headings : BL Lacertae objects : general È BL Lacertae objects : individual (Markarian 421) È
galaxies : active È X-rays : galaxies È X-rays : general
1. INTRODUCTION
Blazars are radio-loud AGNs characterized by strongvariability, large and variable polarization, and high lumi-nosity. Radio spectra smoothly join the infrared-optical-UVones. These properties are successfully interpreted in termsof synchrotron radiation produced in relativistic jets andbeamed into our direction because of plasma moving rela-tivistically close to the line of sight (e.g., Urry & Padovani1995). Many blazars are also strong and variable sources ofGeV c-rays, and in a few objects, the spectrum extends up toTeV energies. The hard X-ray to c-ray radiation forms aseparate spectral component, with the luminosity peaklocated in the MeVÈTeV range. The emission up to X-raysis thought to be caused by synchrotron radiation from high-energy electrons in the jet, while it is likely that c-rays derivefrom the same electrons via inverse Compton (IC) scatteringof soft (IR-UV) photonsÈsynchrotron or ambient softphotons (e.g., Sikora, Begelman, & Rees 1994 ; Ghisellini &
1 Osservatorio Astronomico di Brera, via Bianchi 46, 22055 Merate(Lecco), Italy.
Madau 1996 ; Ghisellini et al. 1998). The contributions ofthese two mechanisms characterize the average blazar spec-tral energy distribution (SED), which typically shows twobroad peaks in a representation (e.g., Fossati et al.lFl1998a). The energies at which the peaks occur and theirrelative intensity provide a powerful diagnostic tool toinvestigate the properties of the emitting plasma, such aselectron energies and magnetic Ðeld (e.g., Ghisellini et al.1998). In X-ray bright BL Lac objects (HBL, from high-energyÈpeak BL Lacs, Padovani & Giommi 1995), the syn-chrotron maximum occurs in the softÈX-ray band.
Variability studies constitute the most e†ective means toconstrain the emission mechanisms taking place in thesesources as well as the geometry and modality of the energydissipation.
The quality and amount of X-ray data on the brightestsources start to allow thorough temporal analysis as func-tion of energy and the characterization of the spectralevolution with good temporal resolution.
Mrk 421 is the brightest HBL at X-ray and UV wave-lengths and thus it is the best available target to study indetail the properties of the variability of the highest fre-
166
X-RAY EMISSION OF MARKARIAN 421. II. 167
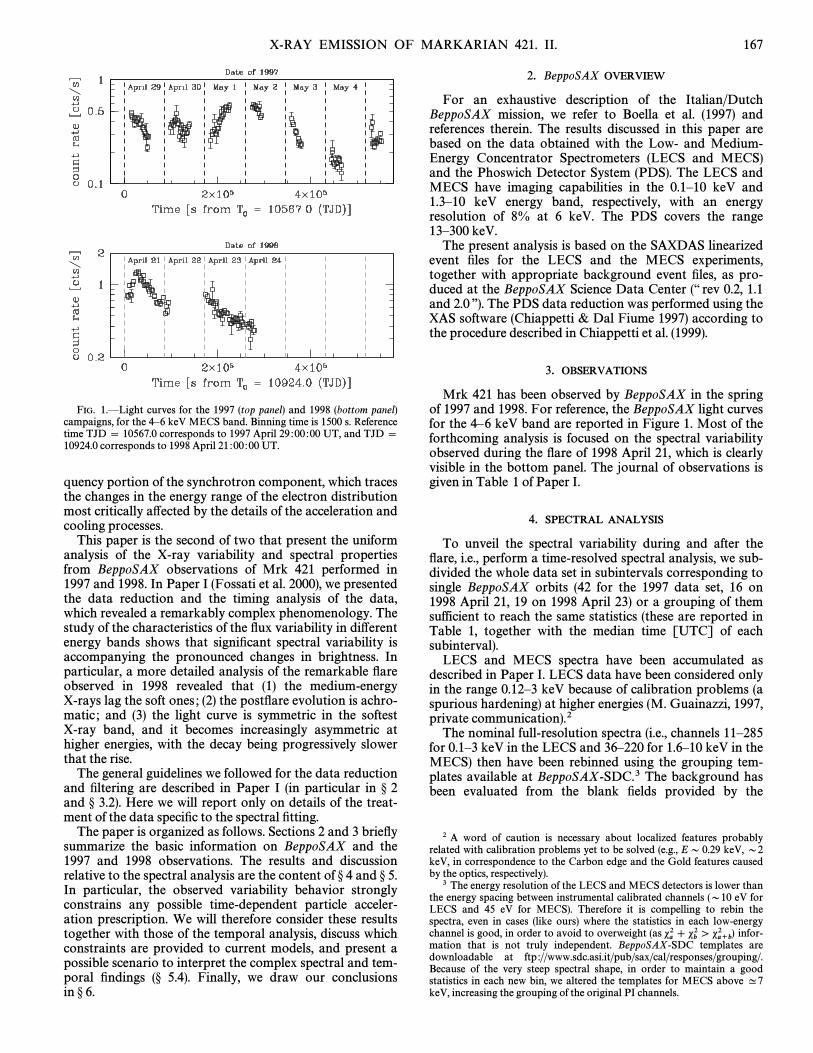
FIG. 1.ÈLight curves for the 1997 (top panel) and 1998 (bottom panel)campaigns, for the 4È6 keV MECS band. Binning time is 1500 s. Referencetime TJD \ 10567.0 corresponds to 1997 April 29 :00 :00 UT, and TJD \10924.0 corresponds to 1998 April 21 :00 :00 UT.
quency portion of the synchrotron component, which tracesthe changes in the energy range of the electron distributionmost critically a†ected by the details of the acceleration andcooling processes.
This paper is the second of two that present the uniformanalysis of the X-ray variability and spectral propertiesfrom BeppoSAX observations of Mrk 421 performed in1997 and 1998. In Paper I (Fossati et al. 2000), we presentedthe data reduction and the timing analysis of the data,which revealed a remarkably complex phenomenology. Thestudy of the characteristics of the Ñux variability in di†erentenergy bands shows that signiÐcant spectral variability isaccompanying the pronounced changes in brightness. Inparticular, a more detailed analysis of the remarkable Ñareobserved in 1998 revealed that (1) the medium-energyX-rays lag the soft ones ; (2) the postÑare evolution is achro-matic ; and (3) the light curve is symmetric in the softestX-ray band, and it becomes increasingly asymmetric athigher energies, with the decay being progressively slowerthat the rise.
The general guidelines we followed for the data reductionand Ðltering are described in Paper I (in particular in ° 2and ° 3.2). Here we will report only on details of the treat-ment of the data speciÐc to the spectral Ðtting.
The paper is organized as follows. Sections 2 and 3 brieÑysummarize the basic information on BeppoSAX and the1997 and 1998 observations. The results and discussionrelative to the spectral analysis are the content of ° 4 and ° 5.In particular, the observed variability behavior stronglyconstrains any possible time-dependent particle acceler-ation prescription. We will therefore consider these resultstogether with those of the temporal analysis, discuss whichconstraints are provided to current models, and present apossible scenario to interpret the complex spectral and tem-poral Ðndings (° 5.4). Finally, we draw our conclusionsin ° 6.
2. BeppoSAX OVERVIEW
For an exhaustive description of the Italian/DutchBeppoSAX mission, we refer to Boella et al. (1997) andreferences therein. The results discussed in this paper arebased on the data obtained with the Low- and Medium-Energy Concentrator Spectrometers (LECS and MECS)and the Phoswich Detector System (PDS). The LECS andMECS have imaging capabilities in the 0.1È10 keV and1.3È10 keV energy band, respectively, with an energyresolution of 8% at 6 keV. The PDS covers the range13È300 keV.
The present analysis is based on the SAXDAS linearizedevent Ðles for the LECS and the MECS experiments,together with appropriate background event Ðles, as pro-duced at the BeppoSAX Science Data Center (““ rev 0.2, 1.1and 2.0 ÏÏ). The PDS data reduction was performed using theXAS software (Chiappetti & Dal Fiume 1997) according tothe procedure described in Chiappetti et al. (1999).
3. OBSERVATIONS
Mrk 421 has been observed by BeppoSAX in the springof 1997 and 1998. For reference, the BeppoSAX light curvesfor the 4È6 keV band are reported in Figure 1. Most of theforthcoming analysis is focused on the spectral variabilityobserved during the Ñare of 1998 April 21, which is clearlyvisible in the bottom panel. The journal of observations isgiven in Table 1 of Paper I.
4. SPECTRAL ANALYSIS
To unveil the spectral variability during and after theÑare, i.e., perform a time-resolved spectral analysis, we sub-divided the whole data set in subintervals corresponding tosingle BeppoSAX orbits (42 for the 1997 data set, 16 on1998 April 21, 19 on 1998 April 23) or a grouping of themsufficient to reach the same statistics (these are reported inTable 1, together with the median time [UTC] of eachsubinterval).
LECS and MECS spectra have been accumulated asdescribed in Paper I. LECS data have been considered onlyin the range 0.12È3 keV because of calibration problems (aspurious hardening) at higher energies (M. Guainazzi, 1997,private communication).2
The nominal full-resolution spectra (i.e., channels 11È285for 0.1È3 keV in the LECS and 36È220 for 1.6È10 keV in theMECS) then have been rebinned using the grouping tem-plates available at BeppoSAX-SDC.3 The background hasbeen evaluated from the blank Ðelds provided by the
2 A word of caution is necessary about localized features probablyrelated with calibration problems yet to be solved (e.g., ED 0.29 keV, D2keV, in correspondence to the Carbon edge and the Gold features causedby the optics, respectively).
3 The energy resolution of the LECS and MECS detectors is lower thanthe energy spacing between instrumental calibrated channels (D10 eV forLECS and 45 eV for MECS). Therefore it is compelling to rebin thespectra, even in cases (like ours) where the statistics in each low-energychannel is good, in order to avoid to overweight (as infor-s
a2] s
b2[s
a`b2 )
mation that is not truly independent. BeppoSAX-SDC templates aredownloadable at ftp ://www.sdc.asi.it/pub/sax/cal/responses/grouping/.Because of the very steep spectral shape, in order to maintain a goodstatistics in each new bin, we altered the templates for MECS above ^7keV, increasing the grouping of the original PI channels.
168 FOSSATI ET AL. Vol. 541
TABLE 1
LECS AND MECS CURVED MODEL SPECTRAL FIT : 1997 AND 1998a
SPECTRAL INDICES FLUXESbMEDIAN OBSERVING E
BEpeak
ORBITS TIME (UTC) 0.5 keV 1 keV 5 keV 10 keV (keV) (keV) 0.2È1 2È10 0.1È10 sl2c
1997 April 29 to May 5
1È3 . . . . . . . . 1997/04/29 :06 :08 0.91~0.04`0.04 1.19~0.04`0.05 1.83~0.05`0.05 1.99~0.10`0.13 1.27~0.62`1.15 0.62~0.05`0.05 2.09 1.01 4.68 1.244È7 . . . . . . . . 1997/04/29 :11 :43 1.00~0.03`0.03 1.28~0.03`0.04 1.93~0.05`0.05 2.09~0.09`0.11 1.34~0.55`0.96 0.49~0.05`0.04 1.89 0.75 4.07 1.038È10 . . . . . . . 1997/04/30 :05 :01 0.94~0.06`0.05 1.24~0.06`0.08 1.91~0.06`0.07 2.08~0.13`0.20 1.26~0.79`1.95 0.57~0.08`0.07 2.15 0.92 4.65 0.9511È12 . . . . . . 1997/04/30 :08 :37 1.01~0.04`0.04 1.24~0.04`0.05 1.91~0.06`0.07 2.11~0.14`0.21 1.99~1.08`2.65 0.48~0.11`0.07 1.96 0.83 4.29 0.9413È15 . . . . . . 1997/04/30 :12 :36 0.95~0.03`0.03 1.26~0.04`0.04 1.95~0.05`0.05 2.13~0.09`0.12 1.25~0.53`0.90 0.55~0.04`0.04 1.92 0.78 4.14 0.9116È18 . . . . . . 1997/05/01 :05 :08 1.03~0.05`0.05 1.35~0.07`0.07 1.84~0.06`0.07 1.94~0.09`0.13 0.57~0.42`0.91 0.46~0.07`0.05 1.99 0.76 4.20 1.1419È20 . . . . . . 1997/05/01 :08 :43 1.00~0.04`0.04 1.25~0.05`0.05 1.78~0.05`0.06 1.91~0.10`0.14 1.14~0.66`1.51 0.49~0.08`0.06 2.00 0.89 4.42 1.3121È23 . . . . . . 1997/05/01 :12 :39 0.92~0.03`0.03 1.20~0.03`0.04 1.86~0.04`0.04 2.04~0.08`0.11 1.44~0.58`0.98 0.61~0.04`0.04 2.60 1.22 5.79 1.2124È25 . . . . . . 1997/05/02 :05 :36 0.93~0.04`0.04 1.18~0.04`0.05 1.83~0.05`0.06 2.00~0.11`0.15 1.57~0.80`1.64 0.61~0.07`0.06 2.74 1.34 6.20 0.7726È27 . . . . . . 1997/05/02 :08 :35 0.93~0.05`0.05 1.24~0.05`0.06 1.88~0.06`0.06 2.03~0.10`0.15 1.08~0.60`1.27 0.58~0.06`0.06 2.56 1.12 6.20 1.0328È30 . . . . . . 1997/05/03 :05 :21 1.07~0.05`0.05 1.30~0.05`0.07 1.88~0.07`0.07 2.05~0.14`0.22 1.63~1.05`3.04 0.37~0.19`0.09 2.01 0.78 4.35 1.1331È32 . . . . . . 1997/05/03 :08 :38 1.05~0.06`0.06 1.28~0.05`0.06 2.13~0.09`0.10 2.49~0.24`0.39 3.50~2.05`6.97 0.39~0.19`0.12 1.65 0.62 3.63 0.7933È34 . . . . . . 1997/05/04 :04 :22 1.11~0.07`0.07 1.47~0.10`0.13 2.15~0.12`0.15 2.30~0.20`0.37 0.91~0.75`2.84 0.39~0.20`0.07 1.59 0.42 3.16 1.2735È37 . . . . . . 1997/05/04 :07 :55 1.21~0.05`0.05 1.49~0.06`0.08 2.14~0.08`0.10 2.31~0.16`0.25 1.38~0.88`2.42 0.23~0.22`0.11 1.60 0.40 3.25 0.9238È40 . . . . . . 1997/05/05 :05 :22 1.10~0.04`0.04 1.43~0.06`0.07 2.01~0.07`0.07 2.13~0.11`0.15 0.74~0.47`1.01 0.39~0.09`0.05 2.04 0.62 4.16 1.0741È42 . . . . . . 1997/05/05 :08 :46 1.10~0.06`0.06 1.35~0.06`0.08 1.98~0.08`0.10 2.15~0.16`0.29 1.61~1.08`3.73 0.33~0.24`0.10 1.88 0.65 4.00 0.62
1998 April 21
1È2 . . . . . . . . 1998/04/21 :02 :55 0.83~0.06`0.05 1.10~0.06`0.07 1.64~0.06`0.06 1.68~0.07`0.09 1.19~0.34`0.47 0.80~0.08`0.10 5.10 3.00 11.96 0.913 . . . . . . . . . . . 1998/04/21 :05 :07 0.87~0.05`0.05 1.02~0.04`0.04 1.65~0.07`0.08 1.74~0.10`0.15 1.82~0.49`0.74 0.92~0.10`0.12 5.34 3.46 13.08 0.974 . . . . . . . . . . . 1998/04/21 :06 :40 0.78~0.04`0.04 0.95~0.03`0.03 1.64~0.06`0.06 1.73~0.09`0.11 1.85~0.38`0.51 1.13~0.10`0.11 5.96 4.41 15.22 1.025 . . . . . . . . . . . 1998/04/21 :08 :19 0.81~0.04`0.04 0.96~0.03`0.03 1.58~0.05`0.06 1.66~0.08`0.11 1.82~0.44`0.64 1.09~0.10`0.12 5.77 4.22 14.63 0.866 . . . . . . . . . . . 1998/04/21 :09 :56 0.80~0.04`0.04 1.03~0.04`0.05 1.50~0.05`0.05 1.53~0.06`0.07 1.16~0.30`0.40 0.91~0.09`0.10 5.35 3.76 13.24 1.177 . . . . . . . . . . . 1998/04/21 :11 :32 0.79~0.04`0.04 1.00~0.04`0.05 1.53~0.05`0.06 1.57~0.07`0.08 1.36~0.33`0.46 0.98~0.10`0.11 5.05 3.62 12.64 0.858È9 . . . . . . . . 1998/04/21 :13 :57 0.85~0.03`0.03 1.05~0.03`0.04 1.50~0.04`0.04 1.54~0.05`0.06 1.26~0.27`0.35 0.85~0.06`0.07 4.62 3.10 11.35 1.3810È12 . . . . . . 1998/04/21 :17 :57 0.87~0.02`0.02 1.05~0.02`0.03 1.54~0.03`0.04 1.58~0.04`0.05 1.40~0.24`0.30 0.85~0.05`0.06 3.99 2.63 9.76 0.8913È16 . . . . . . 1998/04/21 :23 :35 0.91~0.03`0.03 1.06~0.02`0.03 1.61~0.05`0.05 1.67~0.07`0.08 1.67~0.36`0.48 0.79~0.07`0.07 3.61 2.23 8.73 0.99
1998 April 23
1È5 . . . . . . . . 1998/04/23 :03 :49 0.93~0.03`0.02 1.10~0.02`0.03 1.67~0.04`0.04 1.74~0.05`0.07 1.59~0.29`0.37 0.71~0.05`0.05 4.15 2.32 9.74 1.116È11 . . . . . . . 1998/04/23 :12 :31 0.95~0.02`0.02 1.17~0.02`0.02 1.78~0.03`0.03 1.84~0.04`0.05 1.47~0.18`0.21 0.60~0.04`0.03 3.73 1.78 8.42 1.2712È19 . . . . . . 1998/04/23 :23 :39 1.03~0.02`0.02 1.19~0.02`0.02 1.79~0.04`0.04 1.85~0.05`0.06 1.68~0.26`0.32 0.38~0.23`0.09 3.25 1.47 7.30 1.16
a Since there are always three varying parametersÈeither two a and or one a, one E and the quoted errors are for 1p for three parameters (i.e.,EB
EBÈall
*s2\ 3.53), a quite conservative choice.b Unabsorbed Ñuxes in units of 10~10 ergs cm~2 s~1, in the reported energy band, the boundaries of which are expressed in keV.c The degrees of freedom are 57 for all cases.
BeppoSAX-SDC,4 using an extraction region similar in sizeand position to the source extraction region. The 1998November release of public calibration Ðles, matrices, ande†ective areas was used.
For the PDS spectra, we applied the improved screening,implementing the temperature and energy dependence ofthe pulse rise time (soÈcalled PSA correction method).
Owing to a slight mismatch in the cross-calibrationamong the di†erent detectors, it has been necessary toinclude in the Ðtting models multiplicative factors of thenormalization (LECS/MECS and PDS/MECS ratios).The correct absolute Ñux normalization is provided by theMECS (the agreement between MECS units is within the2%È3% limit of the systematics). The expected value ofthese constant factors is now well known and does notconstitute a major/additional source of uncertainty.According to Fiore, Guainazzi, & Grandi (1999), the accept-able range for LECS/MECS is 0.7È1.0, with some depen-
4 Blank Ðelds event Ðles were accumulated on Ðve di†erent pointings ofempty Ðelds and are available at the anonymous ftp : ftp ://www.sdc.asi.it/pub/sax/cal/bgd/.
dence on the source position in the detectors, while thePDS/MECS ratio can be constrained between 0.77 and0.95. The latter parameter is indeed crucial in sources likeMrk 421 where there is a signiÐcant possibility that a di†er-ent component arises in the PDS range, the recognition ofwhich critically depends on the capability/sensitivity toreject the hypothesis that the PDS counts can be accountedfor by the extrapolation of the LECS-MECS spectrum (see° 4.3.3).
4.1. Single and Broken Power L awsWe do not discuss in detail any power-law spectral
models. For each LECS] MECS spectrum, we Ðt the datawith the single and the broken power-law models,5 bothwith free and Ðxed6 absorbing column density.
5 In Appendix C, Table 6 reports the best-Ðt values for the relevantparameters for the broken power-law model.
6 In the direction of Mrk 421, the Galactic equivalent absorbing columnis cm~2 (Lockman & Savage 1995), with theNH \ (1.61^ 0.1) ] 1020estimated uncertainty for high Galactic latitudes.
No. 1, 2000 X-RAY EMISSION OF MARKARIAN 421. II. 169
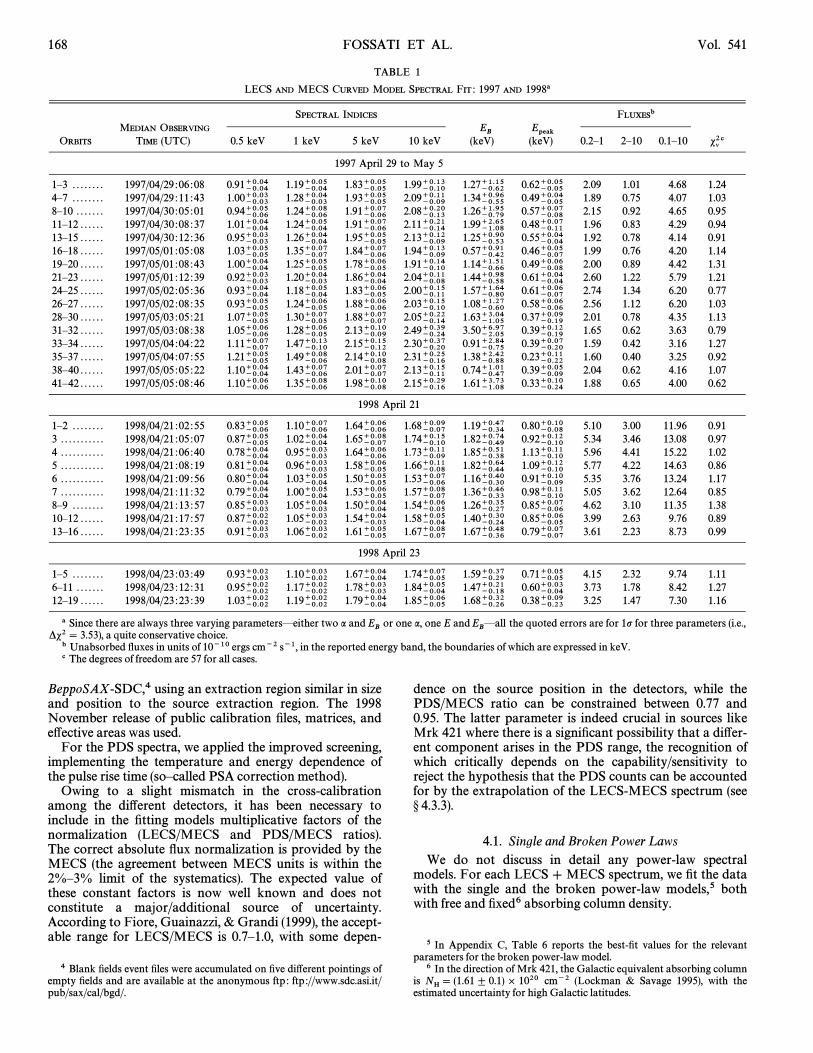
FIG. 2.ÈData/Model ratios for di†erent spectral models applied to the1998 data. Top to bottom: single power law, with (a) Galactic and (b) freeabsorbing column; broken power law, with (c) Galactic and (d) free absorb-ing column; curved model, with (e) Galactic and ( f ) free absorbing column.Corresponding values of s2 are reported in Table 2.
Here we just show that they are an inadequate descrip-tion of the downward curved spectra.7 To illustrate thediscrepancy, we took the data/model ratio for the best-Ðtcontinuum model for each of the individual LECS] MECSspectra (16 for 1997 ; 12 for 1998), and we summed all ofthem, propagating the errors accordingly. The results areshown in Figure 2 for the 1998 data only, while in Table 2we report the total s2 value for each trial model, togetherwith the (simple) average value of for Ðts with freeNHabsorption.
Neither the single nor the broken power laws provide anadequate representation of the data, not even when thevalue of the absorbing column density is left free tovary8Èa common workaround used when the spectrum
7 In Fossati et al. (1998b) we presented a preliminary analysis of 1997data, where LECS and MECS spectra have been Ðt with a variety ofcombinations of single and broken power-law models to better describethe spectral curvature. We refer the interested reader to that work.
8 Although the plot shown in Fig. 2d could appear as a good Ðt, thesigniÐcance of the small deviations above a few keV is indeed high, yieldingan unsatisfactory Ðt.
shows either a soft excess or a marked steepening towardhigher energies (e.g., Takahashi et al. 1996).
Indeed, the description of the curvature by means of softX-ray absorption is not only unphysical, but it hinders thepossibility of extracting all the information from the data byleaving as meaningful parameter only the higher energyspectral index and accounting for all the other e†ects by NH.Furthermore, this yields spectral indices that are only roughestimates, as it is clear that the best-Ðt single power law doesnot describe the observed data in any (even narrow) energyrange (see Figs. 2a, 2b). Finally, in the case of Mrk 421 thereis no reason to postulate any intrinsic absorbing com-ponent responsible for the observed spectral curvature (seealso ° 4.3.2).
4.2. T he Curved ModelMotivated by the failure of the simplest power-law
models, we developed a spectral model that is intrinsicallycurved,9 the aim of which is extracting all the informationcontained in the data and, in particular, estimate the posi-tion of the peak of the synchrotron componentÈone of thecrucial quantities in blazars modeling.
A spectral model providing an improved description ofthe continuum shape also allows a more sensitive study ofdiscrete spectral features such as absorption edges, the pres-ence of which has been long searched in the soft X-rayblazars spectra (e.g., Canizares & Kruper 1984 ; Sambrunaet al. 1997 ; Sambruna & Mushotzky 1998).
We started from the following general description of acontinuously curved shape (see e.g., Inoue & Takahara1996 ; Tavecchio, Maraschi, & Ghisellini 1998) :
F(E) \ KE~a~=C1 ]
A EEB
BfD(a~=~a`=)@f, (1)
where and are the asymptotic values of spectrala~= a`=indices for and respectively, while and fE> EB
E? EB, E
Bdetermine the scale length of the curvature.We reexpressed this function in terms of the spectral
indices at Ðnite values of E, which characterize the localshape of the spectrum, instead of the asymptotic ones,which do not have any direct reference to the observedportion of the spectrum.
The spectral model is then expressed in a form such thatthe available parameters are instead(E1, a1, E2, a2, E
B, f )
of f ) (for more details see Appendix B). As(a~=, a`=, E
B,
we have two extra parameters, for a meaningful use of thisspectral description we have to Ðx one for each of the pairs
9 In Appendix A, we discuss an important caveat concerning the deÐni-tion of curved models.
TABLE 2
SUMMARY OF POWER-LAW MODELS RESULTS
1997 1998
MODEL NHa s2 sl2 dof NHa s2 sl2 dof
Single power law . . . . . . . Galactic 11903.1 12.609 944 Galactic 11245.0 15.883 708Single power law . . . . . . . 3.78 ^ 0.18 3012.7 3.246 928 3.22 ^ 0.14 3413.2 4.905 696Broken power law . . . . . . Galactic 1162.6 1.275 912 Galactic 997.6 1.458 684Broken power law . . . . . . 2.23 ^ 0.46 1083.2 1.209 896 2.05 ^ 0.19 866.6 1.289 672Curved . . . . . . . . . . . . . . . . . . . Galactic 935.7 1.026 912 Galactic 721.1 1.054 684Curved . . . . . . . . . . . . . . . . . . . 1.73 ^ 0.12 917.8 1.024 896 1.70 ^ 0.12 705.2 1.049 672
a Absorbing column units are 1020 cm~2.
170 FOSSATI ET AL. Vol. 541
and Eventually, this degeneracy turns out(E1, a1) (E2, a2).to be a powerful property of this model because it allows usto derive the spectral index at selected energies (setting atE
ithe preferred values) or, even more interestingly, to estimatethe energy at which a certain spectral index is obtained(setting at the desired value). The most relevant examplea
iof this latter possibility is the determination of the positionof the peak (as seen in representation) of the synchro-lFltron component it falls within the observed energyEpeakÈifbandÈand the estimate of the associated error. This can beobtained by setting one spectral index, i.e., anda1\ 1leaving the corresponding energy free to vary in the Ðt.E1The best-Ðt value of E(a \ 1) gives Epeak.
4.3. ResultsMost of the spectral analysis with the curved model has
been performed by keeping the absorbing column Ðxed tothe Galactic value to remove the degeneracy between thee†ects of a variable absorption and intrinsic spectral curva-ture. We will brieÑy comment on the Ðts with a variableabsorbing column in the next section.
To determine the values for the really interesting param-eters, we tried a set of values for the parameter f rangingfrom 0.5 to 3 (with a step of 0.5). All other parameters wereleft free to vary during these step-Ðts. We then selected thevalue of f yielding the minimum total s2. The best-Ðt valuefor 1997 is f\ 1, while for 1998 f\ 2, as expected from thestronger curvature of the spectra. In Table 1, we report thespectral parameters, together with the 0.2È1, 2È10, and0.1È10 keV Ñuxes (dereddened) and s2 values, for each of thetime-sliced spectra. The global Data/Model ratio is shownin Figure 2e, and the total s2 is reported in Table 2. Thecurved model is strongly preferred also from the purelystatistical standpoint : in fact, the model with Galactic NÉHhas a signiÐcantly better s2 than the broken power law withfree although it has one less adjustable parameter (i.e.,NH,one more degree of freedom).
Each spectrum has been Ðtted a few times in order toderive spectral indices at several energies (0.5, 1, 5, 10 keV)and also For consistency, we checked each time thatEpeak.not only the value of the s2 remained the same but also thatall the other untouched parameters took the same valueand conÐdence intervals. The Ðts are indeed very robust inthis sense.
The main new result is that we were able to determine theenergy of the peak of the synchrotron component and toassign an error to it. This has been possible with reasonableaccuracy for both 1997 and 1998 spectra, with a couple ofcases yielding only an upper limit for the peak energy.10
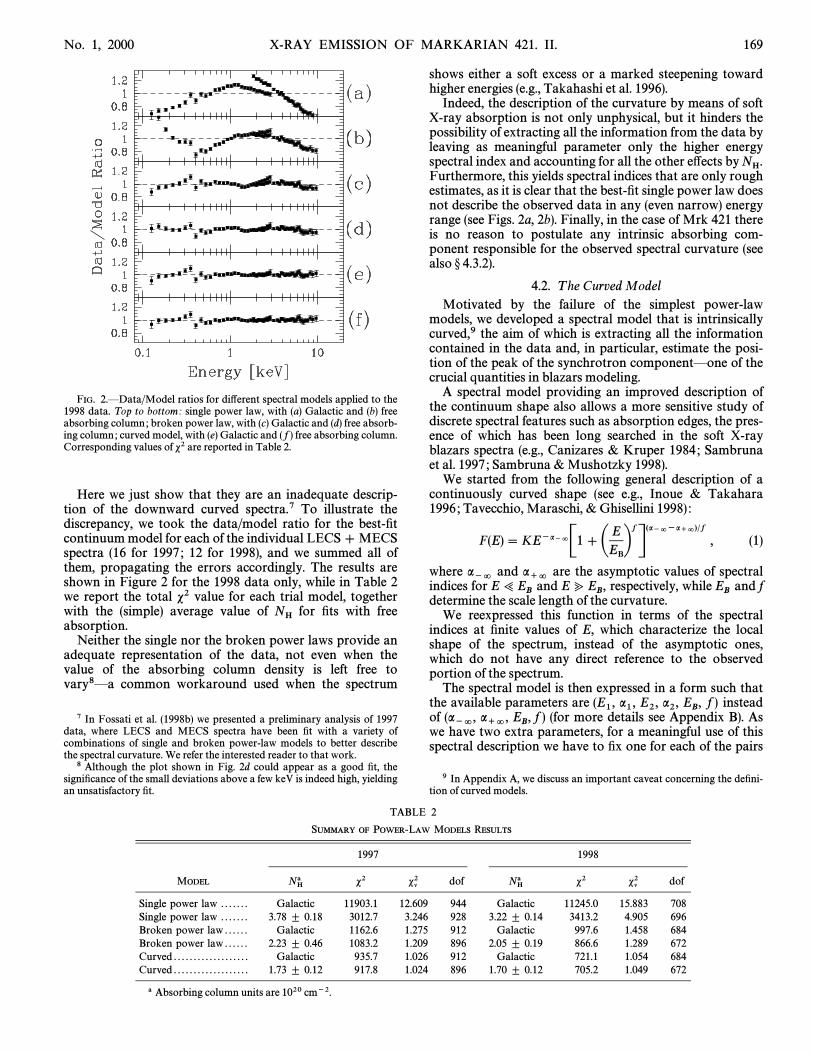
An example of the remarkable spectral evolution duringthe 1998 Ñare is shown by the deconvolved spectra inFigure 3, which also illustrates the strong convexity of thespectrum and the well-deÐned peak.
In 1997, the source was in a lower brightness state, withan average X-ray spectrum softer (at all energies
and a peak energy 0.5 keV lower.*a97?98 ^ 0.4)More globally, the analysis shows that there is a clear
relation between the Ñux variability and the spectral param-eters, both in 1998 and, albeit less strikingly, in 1997. Partic-ularly important is the correlation between changes in the
10 These are the cases ““ 35È37 ÏÏ and ““ 41È42 ÏÏ of 1997. Actually, theformal Ðtting yields a conÐdence interval but with the lower extreme fallingoutside of the observed energy range.
FIG. 3.ÈInferred BeppoSAX spectra of Mrk 421 in 1998. PlottedlFlspectra correspond to the orbit groupings 1 ] 2, 4, 8] 9 of April 21, and12È19 of April 23 (see Table 1). For comparison, we also plotted in lightgray color the spectrum of the previous box.
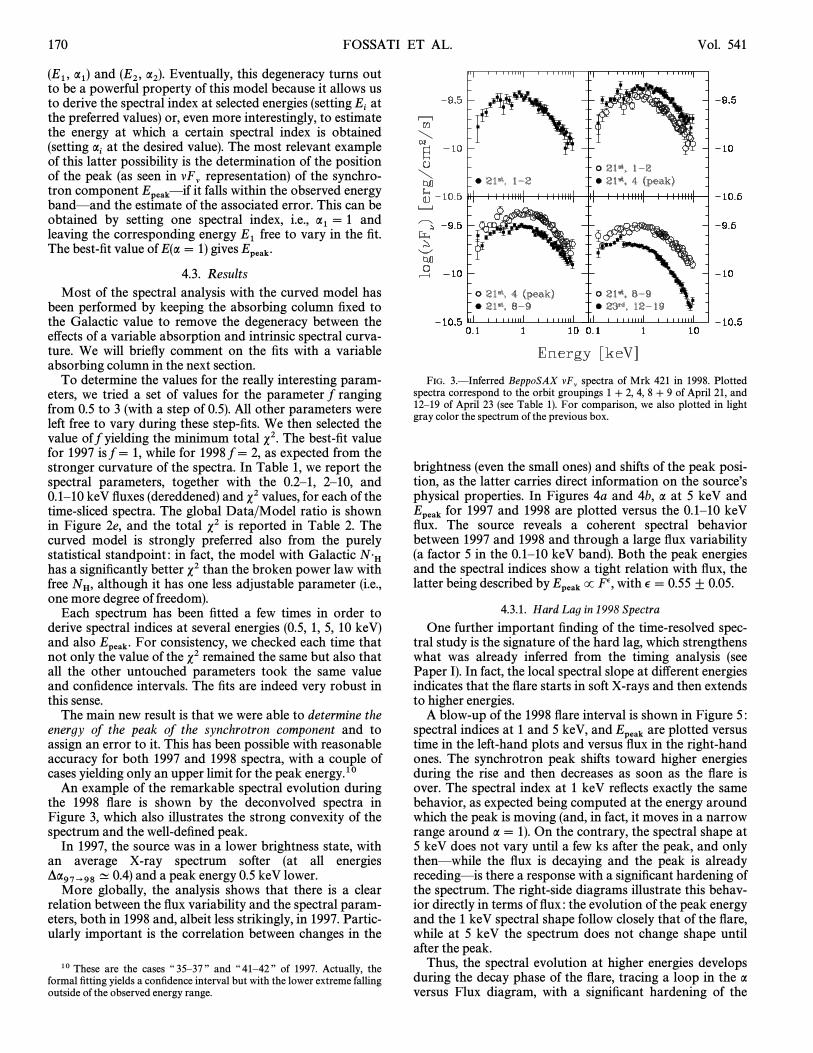
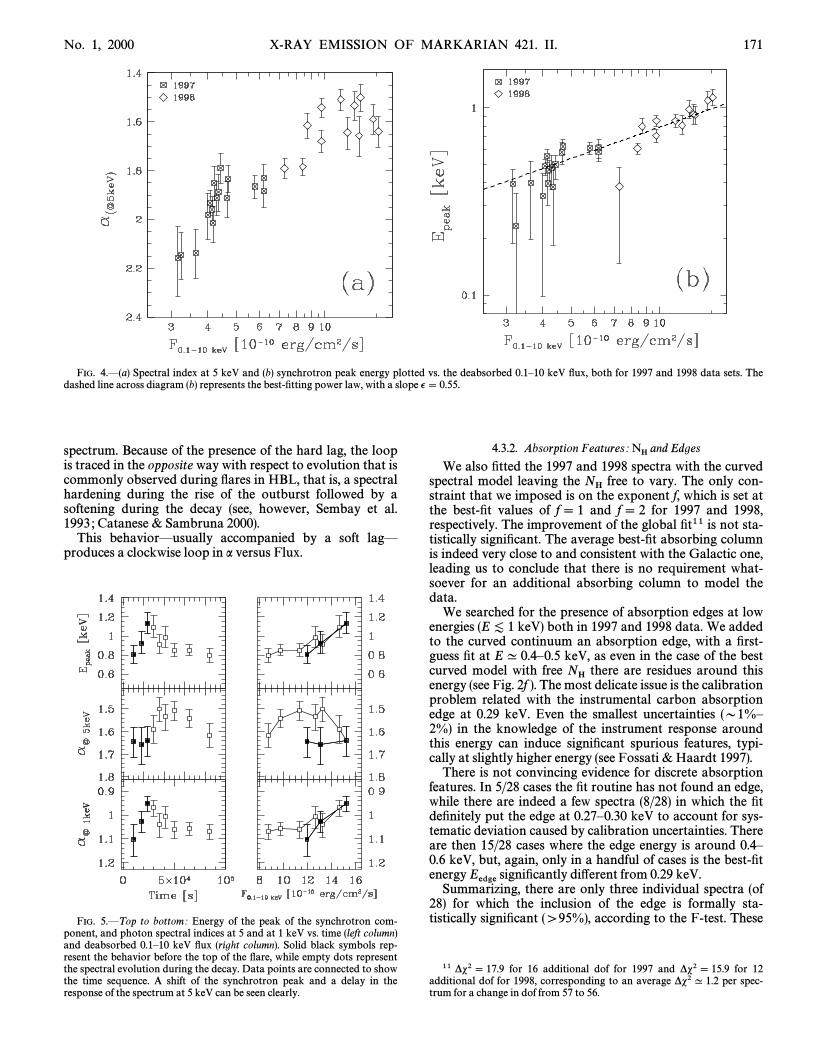
brightness (even the small ones) and shifts of the peak posi-tion, as the latter carries direct information on the sourceÏsphysical properties. In Figures 4a and 4b, a at 5 keV and
for 1997 and 1998 are plotted versus the 0.1È10 keVEpeakÑux. The source reveals a coherent spectral behaviorbetween 1997 and 1998 and through a large Ñux variability(a factor 5 in the 0.1È10 keV band). Both the peak energiesand the spectral indices show a tight relation with Ñux, thelatter being described by with v\ 0.55^ 0.05.EpeakP Fv,
4.3.1. Hard L ag in 1998 Spectra
One further important Ðnding of the time-resolved spec-tral study is the signature of the hard lag, which strengthenswhat was already inferred from the timing analysis (seePaper I). In fact, the local spectral slope at di†erent energiesindicates that the Ñare starts in soft X-rays and then extendsto higher energies.
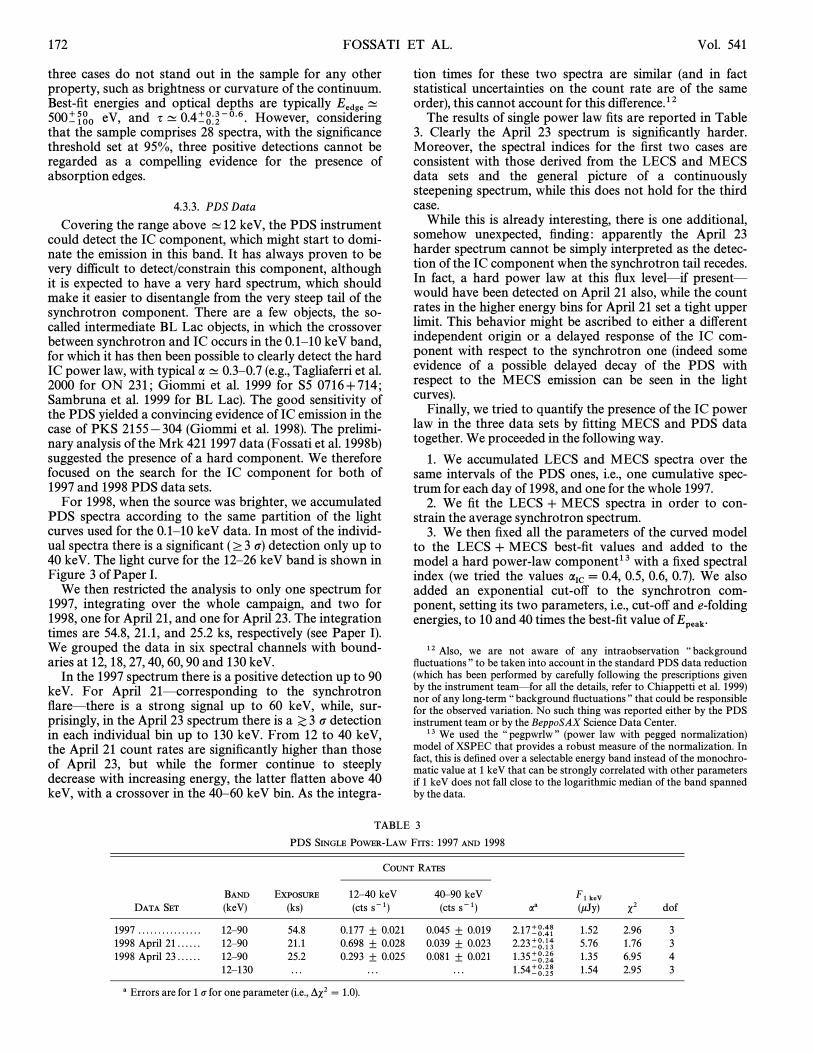
A blow-up of the 1998 Ñare interval is shown in Figure 5 :spectral indices at 1 and 5 keV, and are plotted versusEpeaktime in the left-hand plots and versus Ñux in the right-handones. The synchrotron peak shifts toward higher energiesduring the rise and then decreases as soon as the Ñare isover. The spectral index at 1 keV reÑects exactly the samebehavior, as expected being computed at the energy aroundwhich the peak is moving (and, in fact, it moves in a narrowrange around a \ 1). On the contrary, the spectral shape at5 keV does not vary until a few ks after the peak, and onlythenÈwhile the Ñux is decaying and the peak is alreadyrecedingÈis there a response with a signiÐcant hardening ofthe spectrum. The right-side diagrams illustrate this behav-ior directly in terms of Ñux : the evolution of the peak energyand the 1 keV spectral shape follow closely that of the Ñare,while at 5 keV the spectrum does not change shape untilafter the peak.
Thus, the spectral evolution at higher energies developsduring the decay phase of the Ñare, tracing a loop in the aversus Flux diagram, with a signiÐcant hardening of the
No. 1, 2000 X-RAY EMISSION OF MARKARIAN 421. II. 171
FIG. 4.È(a) Spectral index at 5 keV and (b) synchrotron peak energy plotted vs. the deabsorbed 0.1È10 keV Ñux, both for 1997 and 1998 data sets. Thedashed line across diagram (b) represents the best-Ðtting power law, with a slope v\ 0.55.
spectrum. Because of the presence of the hard lag, the loopis traced in the opposite way with respect to evolution that iscommonly observed during Ñares in HBL, that is, a spectralhardening during the rise of the outburst followed by asoftening during the decay (see, however, Sembay et al.1993 ; Catanese & Sambruna 2000).
This behaviorÈusually accompanied by a soft lagÈproduces a clockwise loop in a versus Flux.
FIG. 5.ÈTop to bottom: Energy of the peak of the synchrotron com-ponent, and photon spectral indices at 5 and at 1 keV vs. time (left column)and deabsorbed 0.1È10 keV Ñux (right column). Solid black symbols rep-resent the behavior before the top of the Ñare, while empty dots representthe spectral evolution during the decay. Data points are connected to showthe time sequence. A shift of the synchrotron peak and a delay in theresponse of the spectrum at 5 keV can be seen clearly.
4.3.2. Absorption Features : and EdgesNHWe also Ðtted the 1997 and 1998 spectra with the curved
spectral model leaving the free to vary. The only con-NHstraint that we imposed is on the exponent f, which is set atthe best-Ðt values of f \ 1 and f \ 2 for 1997 and 1998,respectively. The improvement of the global Ðt11 is not sta-tistically signiÐcant. The average best-Ðt absorbing columnis indeed very close to and consistent with the Galactic one,leading us to conclude that there is no requirement what-soever for an additional absorbing column to model thedata.
We searched for the presence of absorption edges at lowenergies keV) both in 1997 and 1998 data. We added(E[ 1to the curved continuum an absorption edge, with a Ðrst-guess Ðt at E^ 0.4È0.5 keV, as even in the case of the bestcurved model with free there are residues around thisNHenergy (see Fig. 2f ). The most delicate issue is the calibrationproblem related with the instrumental carbon absorptionedge at 0.29 keV. Even the smallest uncertainties (D1%È2%) in the knowledge of the instrument response aroundthis energy can induce signiÐcant spurious features, typi-cally at slightly higher energy (see Fossati & Haardt 1997).
There is not convincing evidence for discrete absorptionfeatures. In 5/28 cases the Ðt routine has not found an edge,while there are indeed a few spectra (8/28) in which the ÐtdeÐnitely put the edge at 0.27È0.30 keV to account for sys-tematic deviation caused by calibration uncertainties. Thereare then 15/28 cases where the edge energy is around 0.4È0.6 keV, but, again, only in a handful of cases is the best-Ðtenergy signiÐcantly di†erent from 0.29 keV.EedgeSummarizing, there are only three individual spectra (of28) for which the inclusion of the edge is formally sta-tistically signiÐcant ([95%), according to the F-test. These
11 *s2\ 17.9 for 16 additional dof for 1997 and *s2\ 15.9 for 12additional dof for 1998, corresponding to an average *s2^ 1.2 per spec-trum for a change in dof from 57 to 56.
172 FOSSATI ET AL. Vol. 541
three cases do not stand out in the sample for any otherproperty, such as brightness or curvature of the continuum.Best-Ðt energies and optical depths are typically Eedge ^
eV, and However, considering500~100`50 q^ 0.4~0.2`0.3~0.6.that the sample comprises 28 spectra, with the signiÐcancethreshold set at 95%, three positive detections cannot beregarded as a compelling evidence for the presence ofabsorption edges.
4.3.3. PDS Data
Covering the range above ^12 keV, the PDS instrumentcould detect the IC component, which might start to domi-nate the emission in this band. It has always proven to bevery difficult to detect/constrain this component, althoughit is expected to have a very hard spectrum, which shouldmake it easier to disentangle from the very steep tail of thesynchrotron component. There are a few objects, the so-called intermediate BL Lac objects, in which the crossoverbetween synchrotron and IC occurs in the 0.1È10 keV band,for which it has then been possible to clearly detect the hardIC power law, with typical a ^ 0.3È0.7 (e.g., Tagliaferri et al.2000 for ON 231 ; Giommi et al. 1999 for S5 0716]714 ;Sambruna et al. 1999 for BL Lac). The good sensitivity ofthe PDS yielded a convincing evidence of IC emission in thecase of PKS 2155[304 (Giommi et al. 1998). The prelimi-nary analysis of the Mrk 421 1997 data (Fossati et al. 1998b)suggested the presence of a hard component. We thereforefocused on the search for the IC component for both of1997 and 1998 PDS data sets.
For 1998, when the source was brighter, we accumulatedPDS spectra according to the same partition of the lightcurves used for the 0.1È10 keV data. In most of the individ-ual spectra there is a signiÐcant (º3 p) detection only up to40 keV. The light curve for the 12È26 keV band is shown inFigure 3 of Paper I.
We then restricted the analysis to only one spectrum for1997, integrating over the whole campaign, and two for1998, one for April 21, and one for April 23. The integrationtimes are 54.8, 21.1, and 25.2 ks, respectively (see Paper I).We grouped the data in six spectral channels with bound-aries at 12, 18, 27, 40, 60, 90 and 130 keV.
In the 1997 spectrum there is a positive detection up to 90keV. For April 21Ècorresponding to the synchrotronÑareÈthere is a strong signal up to 60 keV, while, sur-prisingly, in the April 23 spectrum there is a p detectionZ3in each individual bin up to 130 keV. From 12 to 40 keV,the April 21 count rates are signiÐcantly higher than thoseof April 23, but while the former continue to steeplydecrease with increasing energy, the latter Ñatten above 40keV, with a crossover in the 40È60 keV bin. As the integra-
tion times for these two spectra are similar (and in factstatistical uncertainties on the count rate are of the sameorder), this cannot account for this di†erence.12
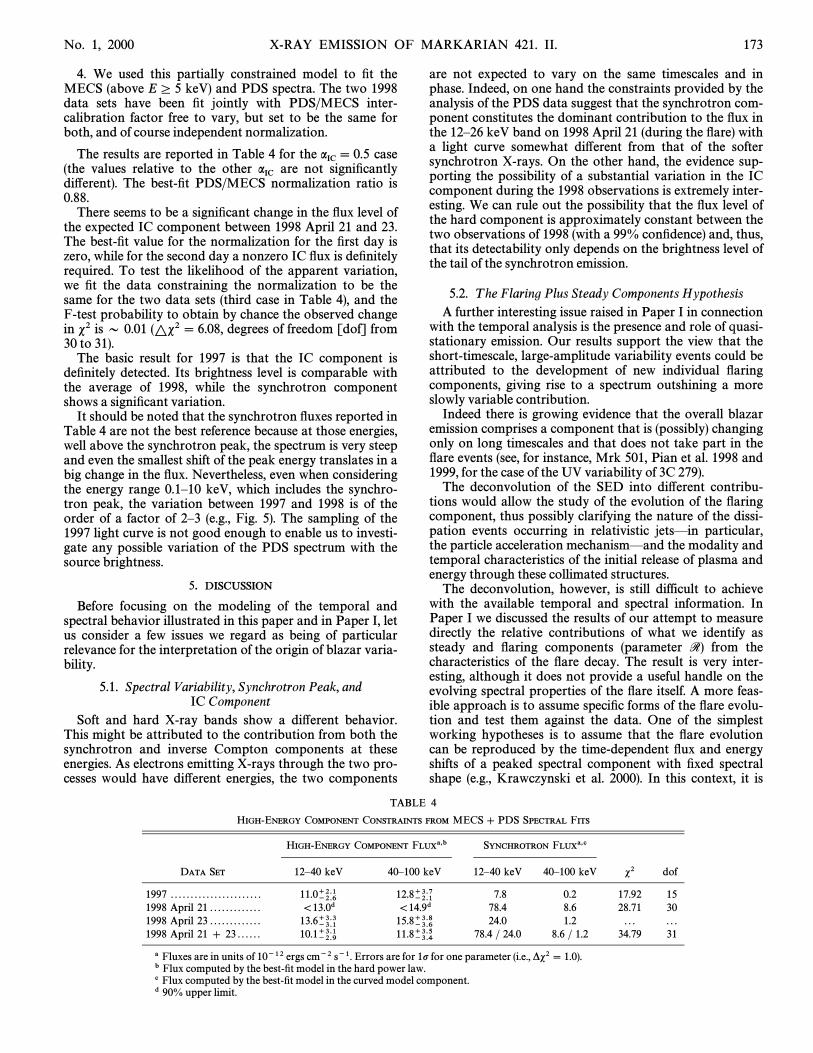
The results of single power law Ðts are reported in Table3. Clearly the April 23 spectrum is signiÐcantly harder.Moreover, the spectral indices for the Ðrst two cases areconsistent with those derived from the LECS and MECSdata sets and the general picture of a continuouslysteepening spectrum, while this does not hold for the thirdcase.
While this is already interesting, there is one additional,somehow unexpected, Ðnding : apparently the April 23harder spectrum cannot be simply interpreted as the detec-tion of the IC component when the synchrotron tail recedes.In fact, a hard power law at this Ñux levelÈif presentÈwould have been detected on April 21 also, while the countrates in the higher energy bins for April 21 set a tight upperlimit. This behavior might be ascribed to either a di†erentindependent origin or a delayed response of the IC com-ponent with respect to the synchrotron one (indeed someevidence of a possible delayed decay of the PDS withrespect to the MECS emission can be seen in the lightcurves).
Finally, we tried to quantify the presence of the IC powerlaw in the three data sets by Ðtting MECS and PDS datatogether. We proceeded in the following way.
1. We accumulated LECS and MECS spectra over thesame intervals of the PDS ones, i.e., one cumulative spec-trum for each day of 1998, and one for the whole 1997.
2. We Ðt the LECS] MECS spectra in order to con-strain the average synchrotron spectrum.
3. We then Ðxed all the parameters of the curved modelto the LECS] MECS best-Ðt values and added to themodel a hard power-law component13 with a Ðxed spectralindex (we tried the values We alsoaIC\ 0.4, 0.5, 0.6, 0.7).added an exponential cut-o† to the synchrotron com-ponent, setting its two parameters, i.e., cut-o† and e-foldingenergies, to 10 and 40 times the best-Ðt value of Epeak.
12 Also, we are not aware of any intraobservation ““ backgroundÑuctuations ÏÏ to be taken into account in the standard PDS data reduction(which has been performed by carefully following the prescriptions givenby the instrument teamÈfor all the details, refer to Chiappetti et al. 1999)nor of any long-term ““ background Ñuctuations ÏÏ that could be responsiblefor the observed variation. No such thing was reported either by the PDSinstrument team or by the BeppoSAX Science Data Center.
13 We used the ““ pegpwrlw ÏÏ (power law with pegged normalization)model of XSPEC that provides a robust measure of the normalization. Infact, this is deÐned over a selectable energy band instead of the monochro-matic value at 1 keV that can be strongly correlated with other parametersif 1 keV does not fall close to the logarithmic median of the band spannedby the data.
TABLE 3
PDS SINGLE POWER-LAW FITS : 1997 AND 1998
COUNT RATES
BAND EXPOSURE 12È40 keV 40È90 keV F1 keVDATA SET (keV) (ks) (cts s~1) (cts s~1) aa (kJy) s2 dof
1997 . . . . . . . . . . . . . . . . 12È90 54.8 0.177 ^ 0.021 0.045 ^ 0.019 2.17~0.41`0.48 1.52 2.96 31998 April 21 . . . . . . 12È90 21.1 0.698 ^ 0.028 0.039 ^ 0.023 2.23~0.13`0.14 5.76 1.76 31998 April 23 . . . . . . 12È90 25.2 0.293 ^ 0.025 0.081 ^ 0.021 1.35~0.24`0.26 1.35 6.95 4
12È130 . . . . . . . . . 1.54~0.25`0.28 1.54 2.95 3
a Errors are for 1 p for one parameter (i.e., *s2\ 1.0).
No. 1, 2000 X-RAY EMISSION OF MARKARIAN 421. II. 173
4. We used this partially constrained model to Ðt theMECS (above Eº 5 keV) and PDS spectra. The two 1998data sets have been Ðt jointly with PDS/MECS inter-calibration factor free to vary, but set to be the same forboth, and of course independent normalization.
The results are reported in Table 4 for the caseaIC \ 0.5(the values relative to the other are not signiÐcantlyaICdi†erent). The best-Ðt PDS/MECS normalization ratio is0.88.
There seems to be a signiÐcant change in the Ñux level ofthe expected IC component between 1998 April 21 and 23.The best-Ðt value for the normalization for the Ðrst day iszero, while for the second day a nonzero IC Ñux is deÐnitelyrequired. To test the likelihood of the apparent variation,we Ðt the data constraining the normalization to be thesame for the two data sets (third case in Table 4), and theF-test probability to obtain by chance the observed changein s2 is D 0.01 degrees of freedom [dof] from(*s2\ 6.08,30 to 31).
The basic result for 1997 is that the IC component isdeÐnitely detected. Its brightness level is comparable withthe average of 1998, while the synchrotron componentshows a signiÐcant variation.
It should be noted that the synchrotron Ñuxes reported inTable 4 are not the best reference because at those energies,well above the synchrotron peak, the spectrum is very steepand even the smallest shift of the peak energy translates in abig change in the Ñux. Nevertheless, even when consideringthe energy range 0.1È10 keV, which includes the synchro-tron peak, the variation between 1997 and 1998 is of theorder of a factor of 2È3 (e.g., Fig. 5). The sampling of the1997 light curve is not good enough to enable us to investi-gate any possible variation of the PDS spectrum with thesource brightness.
5. DISCUSSION
Before focusing on the modeling of the temporal andspectral behavior illustrated in this paper and in Paper I, letus consider a few issues we regard as being of particularrelevance for the interpretation of the origin of blazar varia-bility.
5.1. Spectral Variability, Synchrotron Peak, andIC Component
Soft and hard X-ray bands show a di†erent behavior.This might be attributed to the contribution from both thesynchrotron and inverse Compton components at theseenergies. As electrons emitting X-rays through the two pro-cesses would have di†erent energies, the two components
are not expected to vary on the same timescales and inphase. Indeed, on one hand the constraints provided by theanalysis of the PDS data suggest that the synchrotron com-ponent constitutes the dominant contribution to the Ñux inthe 12È26 keV band on 1998 April 21 (during the Ñare) witha light curve somewhat di†erent from that of the softersynchrotron X-rays. On the other hand, the evidence sup-porting the possibility of a substantial variation in the ICcomponent during the 1998 observations is extremely inter-esting. We can rule out the possibility that the Ñux level ofthe hard component is approximately constant between thetwo observations of 1998 (with a 99% conÐdence) and, thus,that its detectability only depends on the brightness level ofthe tail of the synchrotron emission.
5.2. T he Flaring Plus Steady Components HypothesisA further interesting issue raised in Paper I in connection
with the temporal analysis is the presence and role of quasi-stationary emission. Our results support the view that theshort-timescale, large-amplitude variability events could beattributed to the development of new individual Ñaringcomponents, giving rise to a spectrum outshining a moreslowly variable contribution.
Indeed there is growing evidence that the overall blazaremission comprises a component that is (possibly) changingonly on long timescales and that does not take part in theÑare events (see, for instance, Mrk 501, Pian et al. 1998 and1999, for the case of the UV variability of 3C 279).
The deconvolution of the SED into di†erent contribu-tions would allow the study of the evolution of the Ñaringcomponent, thus possibly clarifying the nature of the dissi-pation events occurring in relativistic jetsÈin particular,the particle acceleration mechanismÈand the modality andtemporal characteristics of the initial release of plasma andenergy through these collimated structures.
The deconvolution, however, is still difficult to achievewith the available temporal and spectral information. InPaper I we discussed the results of our attempt to measuredirectly the relative contributions of what we identify assteady and Ñaring components (parameter R) from thecharacteristics of the Ñare decay. The result is very inter-esting, although it does not provide a useful handle on theevolving spectral properties of the Ñare itself. A more feas-ible approach is to assume speciÐc forms of the Ñare evolu-tion and test them against the data. One of the simplestworking hypotheses is to assume that the Ñare evolutioncan be reproduced by the time-dependent Ñux and energyshifts of a peaked spectral component with Ðxed spectralshape (e.g., Krawczynski et al. 2000). In this context, it is
TABLE 4
HIGH-ENERGY COMPONENT CONSTRAINTS FROM MECS] PDS SPECTRAL FITS
HIGH-ENERGY COMPONENT FLUXa,b SYNCHROTRON FLUXa,c
DATA SET 12È40 keV 40È100 keV 12È40 keV 40È100 keV s2 dof
1997 . . . . . . . . . . . . . . . . . . . . . . . 11.0~2.6`2.1 12.8~2.1`3.7 7.8 0.2 17.92 151998 April 21 . . . . . . . . . . . . . \13.0d \14.9d 78.4 8.6 28.71 301998 April 23 . . . . . . . . . . . . . 13.6~3.1`3.3 15.8~3.6`3.8 24.0 1.2 . . . . . .1998 April 21 ] 23 . . . . . . 10.1~2.9`3.1 11.8~3.4`3.5 78.4 / 24.0 8.6 / 1.2 34.79 31
a Fluxes are in units of 10~12 ergs cm~2 s~1. Errors are for 1p for one parameter (i.e., *s2\ 1.0).b Flux computed by the best-Ðt model in the hard power law.c Flux computed by the best-Ðt model in the curved model component.d 90% upper limit.
174 FOSSATI ET AL. Vol. 541
relevant to remind ourselves that the maximum of the syn-chrotron emission corresponds to the energy at which mostof the energy in particles is located. Its value and temporalbehavior thus trace the evolution of the bulk of the energydeposition into particles by the dissipation mechanism.
It is therefore possible that the variability characteristics(both temporal and spectral) might chieÑy depend on the(particles/photons) energy relative to the synchrotron peak.In particular, the results on (Paper I) can be eitherTshortrelated to the dominance of the light crossing time over thecooling timescales or, alternatively, to the di†erent positionof the sampled energies with respect to the synchrotronpeak as, above the peak, the timescales are shorter. In anycase, the fact that timescales are similar at the di†erentenergies possibly indicates the evolution of a (observed)Ðxed-shape Ñaring component.
5.3. Sign of the L agOne of the main new results of the temporal analysis
presented in Paper I is the signiÐcant detection of a hardlag, opposite of the behavior commonly detected in HBL.Interestingly, a recent study by Zhang et al. (1999) on thesource PKS 2155-304 has shown the presence of an appar-ent inverse trend between the source brightness level andthe duration of the (soft) lag. And, intriguingly, the 1998Ñare represents the brightest state ever observed from Mrk421, thus possibly suggesting that an extrapolation of theabove phenomenological trend might even account for ahard lag. This possibility is currently under study (Y. H.Zhang et al., in preparation).
Again, the relative contribution of two componentsmight be responsible for this trend. During the most intenseevents, the Ñaring component would completely dominateover the quasi-stationary one, progressively shifting tohigher energies (hard lag) while in weaker Ñares the varyingcomponent would exceed the steady one only at energieshigher than the peak, where the spectrum steepens, produc-ing an observed soft lag behavior.
However, one should also consider that in di†erentbrightness states the di†erent observed energies correspondto di†erent positions with respect to (e.g., in compar-Epeaking the 1997 and 1998 data sets we showed that its valuewas typically a factor 2 di†erent), requiring a more subtleanalysis before deriving inferences on the lag-brightnessrelationship.
5.4. Physical Interpretation : T he Signature ofParticle Acceleration
Let us now focus on the interpretation of the two mainand robust results of this work, namely, the hard lag and theevolution of the synchrotron peak.
The occurrence of the peak at di†erent times for di†erentenergies is most likely related to the particle acceleration/heating process. Although models to reproduce the tempo-ral evolution of a spectral distribution have been developed(e.g., Chiaberge & Ghisellini 1999 ; Georganopoulos &Marscher 1998 ; Kirk, Rieger, & Mastichiadis 1998), theymostly do not consider the role of particle acceleration (see,however, Kirk et al. 1998).
To account for the above results, we thus introduced a(parametric) acceleration term in the particle kinetic equa-tion within the time-dependent model studied by Chiaberge& Ghisellini (1999). In particular, this model takes intoaccount the cooling and escape in the evolution of the parti-cle distribution and the role of delays in the receivedphotons caused by the light crossing time of di†erent partsof the emitting region.
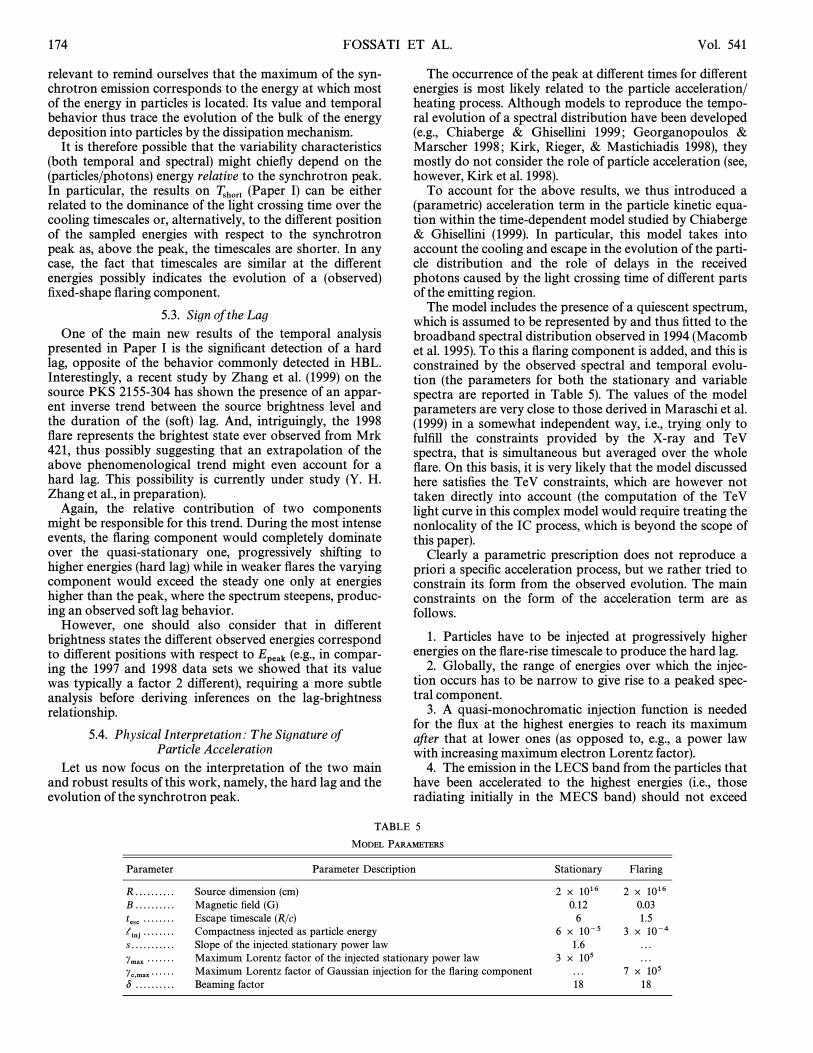
The model includes the presence of a quiescent spectrum,which is assumed to be represented by and thus Ðtted to thebroadband spectral distribution observed in 1994 (Macombet al. 1995). To this a Ñaring component is added, and this isconstrained by the observed spectral and temporal evolu-tion (the parameters for both the stationary and variablespectra are reported in Table 5). The values of the modelparameters are very close to those derived in Maraschi et al.(1999) in a somewhat independent way, i.e., trying only tofulÐll the constraints provided by the X-ray and TeVspectra, that is simultaneous but averaged over the wholeÑare. On this basis, it is very likely that the model discussedhere satisÐes the TeV constraints, which are however nottaken directly into account (the computation of the TeVlight curve in this complex model would require treating thenonlocality of the IC process, which is beyond the scope ofthis paper).
Clearly a parametric prescription does not reproduce apriori a speciÐc acceleration process, but we rather tried toconstrain its form from the observed evolution. The mainconstraints on the form of the acceleration term are asfollows.
1. Particles have to be injected at progressively higherenergies on the Ñare-rise timescale to produce the hard lag.
2. Globally, the range of energies over which the injec-tion occurs has to be narrow to give rise to a peaked spec-tral component.
3. A quasi-monochromatic injection function is neededfor the Ñux at the highest energies to reach its maximumafter that at lower ones (as opposed to, e.g., a power lawwith increasing maximum electron Lorentz factor).
4. The emission in the LECS band from the particles thathave been accelerated to the highest energies (i.e., thoseradiating initially in the MECS band) should not exceed
TABLE 5
MODEL PARAMETERS
Parameter Parameter Description Stationary Flaring
R . . . . . . . . . . Source dimension (cm) 2 ] 1016 2 ] 1016B . . . . . . . . . . Magnetic Ðeld (G) 0.12 0.03tesc . . . . . . . . Escape timescale (R/c) 6 1.5linj . . . . . . . . Compactness injected as particle energy 6 ] 10~5 3 ] 10~4s . . . . . . . . . . . Slope of the injected stationary power law 1.6 . . .cmax . . . . . . . Maximum Lorentz factor of the injected stationary power law 3 ] 105 . . .cc,max . . . . . . Maximum Lorentz factor of Gaussian injection for the Ñaring component . . . 7 ] 105d . . . . . . . . . . Beaming factor 18 18
No. 1, 2000 X-RAY EMISSION OF MARKARIAN 421. II. 175
that from the lower energy ones, as after the peak no furtherincrease of the (LECS) Ñux is observed ; this in particularrequires that the injection stop after reaching the highestenergies.
5. The total decay timescale might be dominated by theachromatic crossing-time e†ects, although the initial fadingmight be determined by di†erent cooling timescales.
The acceleration term has then been described as a Gauss-ian distribution in energy, centered at a typical particleLorentz factor and with width exponen-c
c(t) p \ 0.01c
c(t),
tially evolving with time : where corre-cc(t)P e~(tmax~t), tmaxsponds to the end of the acceleration phase, when the
maximum is reached. The injected luminosity iscc,maxassumed to be constant in time.
The duration of the injection, assumed to correspond tothe light crossing time of the emitting region, is such that itmimics the passage of a shock front (i.e., a moving surfacepassing through the region in the same time interval ; seeChiaberge & Ghisellini 1999).
It should also be noted that, within this scenario, thesymmetry between the rise and decay in the soft energy lightcurve seems to suggest that if the energy where most of thepower is released is determined by the balance between theacceleration and cooling rates, at this very same energythe latter timescales are comparable to the light crossingtime of the region.
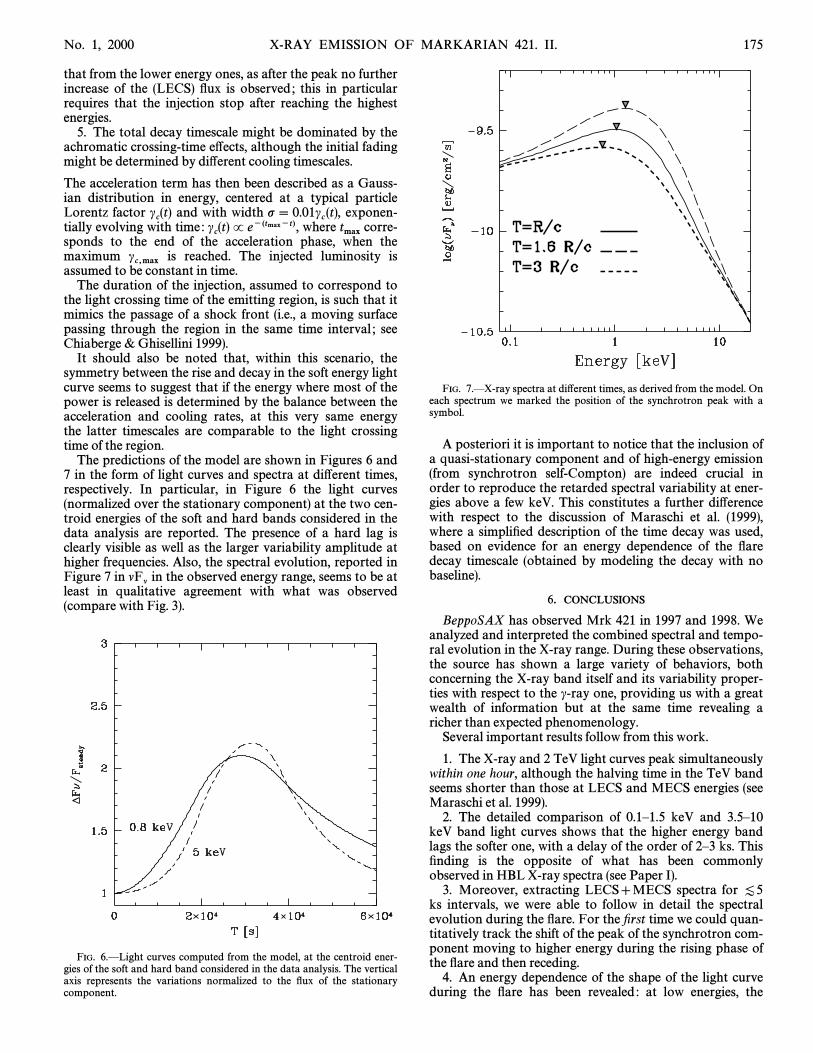
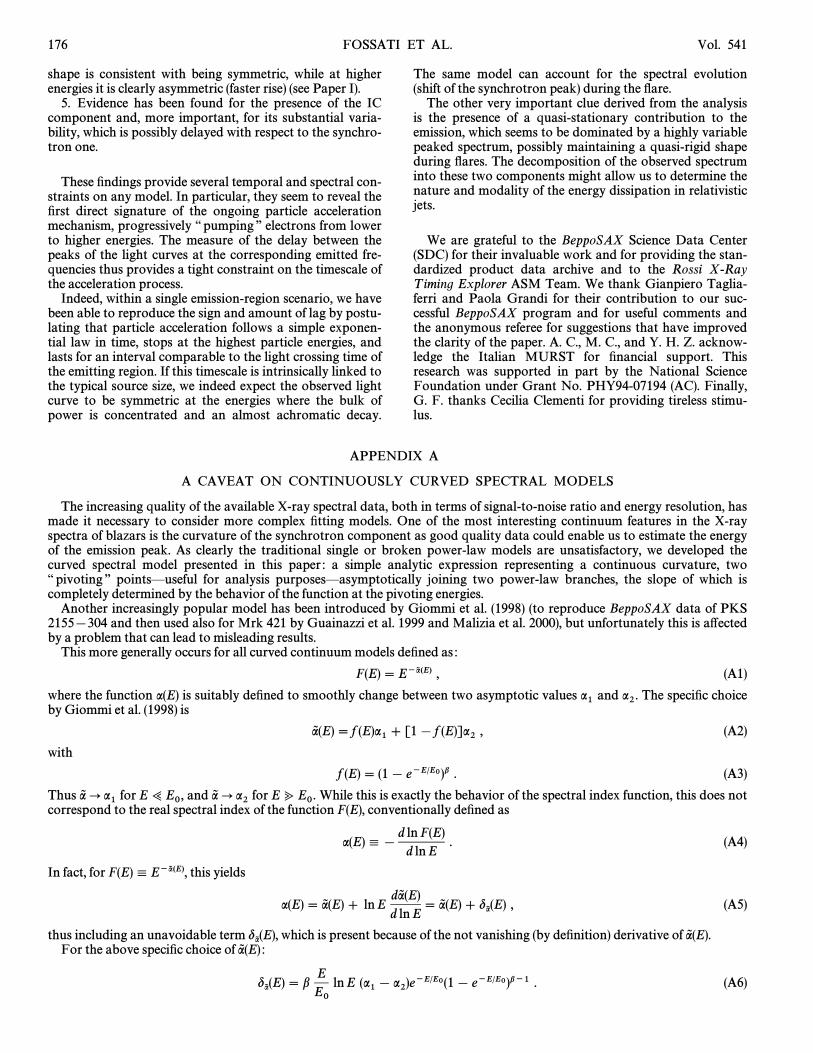
The predictions of the model are shown in Figures 6 and7 in the form of light curves and spectra at di†erent times,respectively. In particular, in Figure 6 the light curves(normalized over the stationary component) at the two cen-troid energies of the soft and hard bands considered in thedata analysis are reported. The presence of a hard lag isclearly visible as well as the larger variability amplitude athigher frequencies. Also, the spectral evolution, reported inFigure 7 in in the observed energy range, seems to be atlFlleast in qualitative agreement with what was observed(compare with Fig. 3).
FIG. 6.ÈLight curves computed from the model, at the centroid ener-gies of the soft and hard band considered in the data analysis. The verticalaxis represents the variations normalized to the Ñux of the stationarycomponent.
FIG. 7.ÈX-ray spectra at di†erent times, as derived from the model. Oneach spectrum we marked the position of the synchrotron peak with asymbol.
A posteriori it is important to notice that the inclusion ofa quasi-stationary component and of high-energy emission(from synchrotron self-Compton) are indeed crucial inorder to reproduce the retarded spectral variability at ener-gies above a few keV. This constitutes a further di†erencewith respect to the discussion of Maraschi et al. (1999),where a simpliÐed description of the time decay was used,based on evidence for an energy dependence of the Ñaredecay timescale (obtained by modeling the decay with nobaseline).
6. CONCLUSIONS
BeppoSAX has observed Mrk 421 in 1997 and 1998. Weanalyzed and interpreted the combined spectral and tempo-ral evolution in the X-ray range. During these observations,the source has shown a large variety of behaviors, bothconcerning the X-ray band itself and its variability proper-ties with respect to the c-ray one, providing us with a greatwealth of information but at the same time revealing aricher than expected phenomenology.
Several important results follow from this work.
1. The X-ray and 2 TeV light curves peak simultaneouslywithin one hour, although the halving time in the TeV bandseems shorter than those at LECS and MECS energies (seeMaraschi et al. 1999).
2. The detailed comparison of 0.1È1.5 keV and 3.5È10keV band light curves shows that the higher energy bandlags the softer one, with a delay of the order of 2È3 ks. ThisÐnding is the opposite of what has been commonlyobserved in HBL X-ray spectra (see Paper I).
3. Moreover, extracting LECS]MECS spectra for [5ks intervals, we were able to follow in detail the spectralevolution during the Ñare. For the Ðrst time we could quan-titatively track the shift of the peak of the synchrotron com-ponent moving to higher energy during the rising phase ofthe Ñare and then receding.
4. An energy dependence of the shape of the light curveduring the Ñare has been revealed : at low energies, the
176 FOSSATI ET AL. Vol. 541
shape is consistent with being symmetric, while at higherenergies it is clearly asymmetric (faster rise) (see Paper I).
5. Evidence has been found for the presence of the ICcomponent and, more important, for its substantial varia-bility, which is possibly delayed with respect to the synchro-tron one.
These Ðndings provide several temporal and spectral con-straints on any model. In particular, they seem to reveal theÐrst direct signature of the ongoing particle accelerationmechanism, progressively ““ pumping ÏÏ electrons from lowerto higher energies. The measure of the delay between thepeaks of the light curves at the corresponding emitted fre-quencies thus provides a tight constraint on the timescale ofthe acceleration process.
Indeed, within a single emission-region scenario, we havebeen able to reproduce the sign and amount of lag by postu-lating that particle acceleration follows a simple exponen-tial law in time, stops at the highest particle energies, andlasts for an interval comparable to the light crossing time ofthe emitting region. If this timescale is intrinsically linked tothe typical source size, we indeed expect the observed lightcurve to be symmetric at the energies where the bulk ofpower is concentrated and an almost achromatic decay.
The same model can account for the spectral evolution(shift of the synchrotron peak) during the Ñare.
The other very important clue derived from the analysisis the presence of a quasi-stationary contribution to theemission, which seems to be dominated by a highly variablepeaked spectrum, possibly maintaining a quasi-rigid shapeduring Ñares. The decomposition of the observed spectruminto these two components might allow us to determine thenature and modality of the energy dissipation in relativisticjets.
We are grateful to the BeppoSAX Science Data Center(SDC) for their invaluable work and for providing the stan-dardized product data archive and to the Rossi X-RayT iming Explorer ASM Team. We thank Gianpiero Taglia-ferri and Paola Grandi for their contribution to our suc-cessful BeppoSAX program and for useful comments andthe anonymous referee for suggestions that have improvedthe clarity of the paper. A. C., M. C., and Y. H. Z. acknow-ledge the Italian MURST for Ðnancial support. Thisresearch was supported in part by the National ScienceFoundation under Grant No. PHY94-07194 (AC). Finally,G. F. thanks Cecilia Clementi for providing tireless stimu-lus.
APPENDIX A
A CAVEAT ON CONTINUOUSLY CURVED SPECTRAL MODELS
The increasing quality of the available X-ray spectral data, both in terms of signal-to-noise ratio and energy resolution, hasmade it necessary to consider more complex Ðtting models. One of the most interesting continuum features in the X-rayspectra of blazars is the curvature of the synchrotron component as good quality data could enable us to estimate the energyof the emission peak. As clearly the traditional single or broken power-law models are unsatisfactory, we developed thecurved spectral model presented in this paper : a simple analytic expression representing a continuous curvature, two““ pivoting ÏÏ pointsÈuseful for analysis purposesÈasymptotically joining two power-law branches, the slope of which iscompletely determined by the behavior of the function at the pivoting energies.
Another increasingly popular model has been introduced by Giommi et al. (1998) (to reproduce BeppoSAX data of PKS2155[304 and then used also for Mrk 421 by Guainazzi et al. 1999 and Malizia et al. 2000), but unfortunately this is a†ectedby a problem that can lead to misleading results.
This more generally occurs for all curved continuum models deÐned as :
F(E) \ E~a8 (E) , (A1)
where the function a(E) is suitably deÐned to smoothly change between two asymptotic values and The speciÐc choicea1 a2.by Giommi et al. (1998) is
a8 (E)\ f (E)a1] [1[ f (E)]a2 , (A2)
with
f (E) \ (1[ e~E@E0)b . (A3)
Thus for and for While this is exactly the behavior of the spectral index function, this does nota8 ] a1 E> E0, a8 ] a2 E? E0.correspond to the real spectral index of the function F(E), conventionally deÐned as
a(E) 4 [ d ln F(E)d ln E
. (A4)
In fact, for this yieldsF(E)4 E~a8 (E),
a(E)\ a8 (E) ] ln Eda8 (E)d ln E
\ a8 (E) ] da8 (E) , (A5)
thus including an unavoidable term which is present because of the not vanishing (by deÐnition) derivative ofda8 (E), a8 (E).For the above speciÐc choice of a8 (E) :
da8 (E)\ bEE0
ln E (a1[ a2)e~E@E0(1[ e~E@E0)b~1 . (A6)
No. 1, 2000 X-RAY EMISSION OF MARKARIAN 421. II. 177
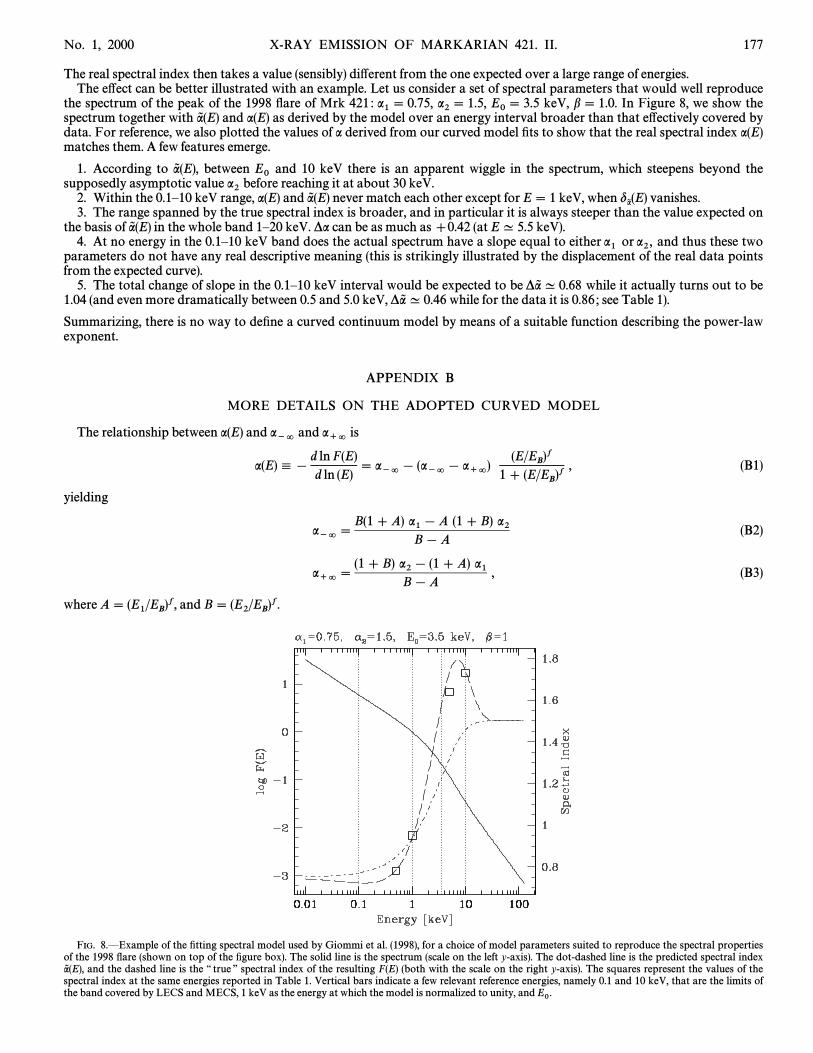
The real spectral index then takes a value (sensibly) di†erent from the one expected over a large range of energies.The e†ect can be better illustrated with an example. Let us consider a set of spectral parameters that would well reproduce
the spectrum of the peak of the 1998 Ñare of Mrk 421 : keV, b \ 1.0. In Figure 8, we show thea1\ 0.75, a2\ 1.5, E0\ 3.5spectrum together with and a(E) as derived by the model over an energy interval broader than that e†ectively covered bya8 (E)data. For reference, we also plotted the values of a derived from our curved model Ðts to show that the real spectral index a(E)matches them. A few features emerge.
1. According to between and 10 keV there is an apparent wiggle in the spectrum, which steepens beyond thea8 (E), E0supposedly asymptotic value before reaching it at about 30 keV.a22. Within the 0.1È10 keV range, a(E) and never match each other except for E\ 1 keV, when vanishes.a8 (E) da8 (E)3. The range spanned by the true spectral index is broader, and in particular it is always steeper than the value expected on
the basis of in the whole band 1È20 keV. *a can be as much as ]0.42 (at E^ 5.5 keV).a8 (E)4. At no energy in the 0.1È10 keV band does the actual spectrum have a slope equal to either or and thus these twoa1 a2,parameters do not have any real descriptive meaning (this is strikingly illustrated by the displacement of the real data points
from the expected curve).5. The total change of slope in the 0.1È10 keV interval would be expected to be while it actually turns out to be*a8 ^ 0.68
1.04 (and even more dramatically between 0.5 and 5.0 keV, while for the data it is 0.86 ; see Table 1).*a8 ^ 0.46
Summarizing, there is no way to deÐne a curved continuum model by means of a suitable function describing the power-lawexponent.
APPENDIX B
MORE DETAILS ON THE ADOPTED CURVED MODEL
The relationship between a(E) and and isa~= a`=
a(E)4 [ d ln F(E)d ln (E)
\ a~= [ (a~=[ a`=)
(E/EB)f
1 ] (E/EB)f
, (B1)
yielding
a~= \ B(1] A) a1[ A (1] B) a2B[ A
(B2)
a`= \ (1] B) a2[ (1] A) a1
B[ A, (B3)
where andA\ (E1/EB)f, B\ (E2/EB
)f.
FIG. 8.ÈExample of the Ðtting spectral model used by Giommi et al. (1998), for a choice of model parameters suited to reproduce the spectral propertiesof the 1998 Ñare (shown on top of the Ðgure box). The solid line is the spectrum (scale on the left y-axis). The dot-dashed line is the predicted spectral index
and the dashed line is the ““ true ÏÏ spectral index of the resulting F(E) (both with the scale on the right y-axis). The squares represent the values of thea8 (E),spectral index at the same energies reported in Table 1. Vertical bars indicate a few relevant reference energies, namely 0.1 and 10 keV, that are the limits ofthe band covered by LECS and MECS, 1 keV as the energy at which the model is normalized to unity, and E0.
178 FOSSATI ET AL. Vol. 541
TABLE 6
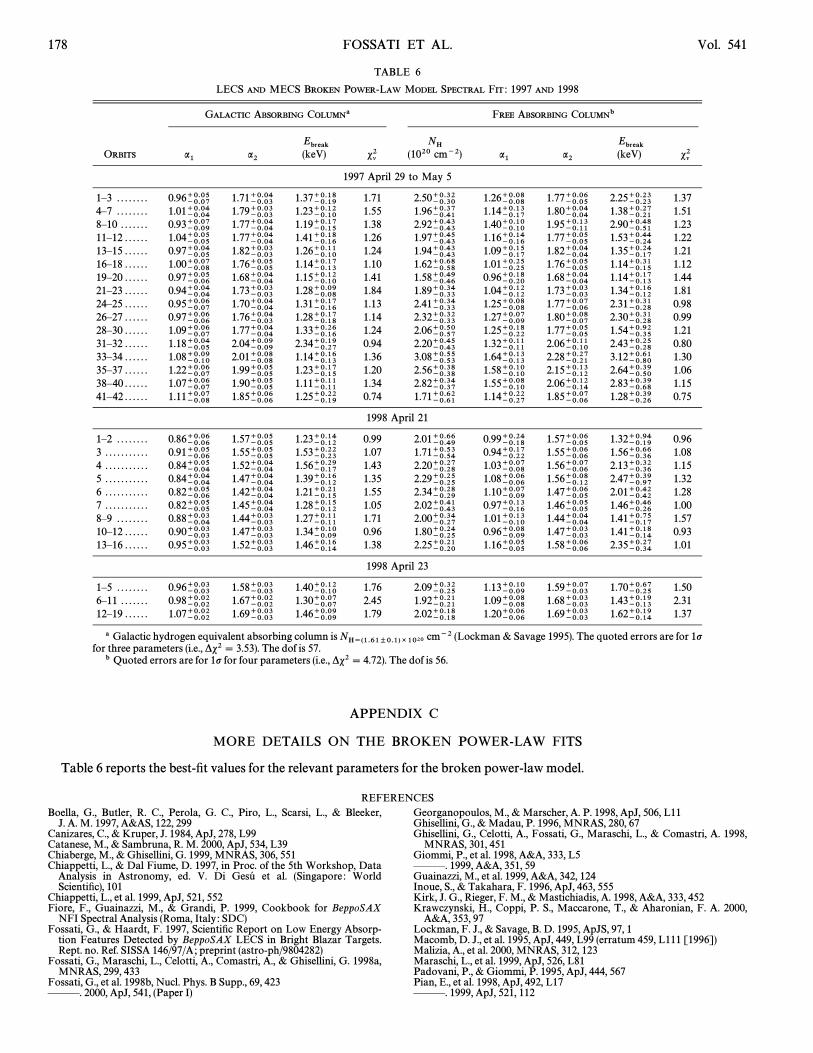
LECS AND MECS BROKEN POWER-LAW MODEL SPECTRAL FIT : 1997 AND 1998
GALACTIC ABSORBING COLUMNa FREE ABSORBING COLUMNb
Ebreak NH EbreakORBITS a1 a2 (keV) sl2 (1020 cm~2) a1 a2 (keV) sl2
1997 April 29 to May 5
1È3 . . . . . . . . 0.96~0.07`0.05 1.71~0.03`0.04 1.37~0.19`0.18 1.71 2.50~0.30`0.32 1.26~0.08`0.08 1.77~0.05`0.06 2.25~0.23`0.23 1.374È7 . . . . . . . . 1.01~0.04`0.04 1.79~0.03`0.03 1.23~0.10`0.12 1.55 1.96~0.41`0.37 1.14~0.17`0.13 1.80~0.04`0.04 1.38~0.21`0.27 1.518È10 . . . . . . . 0.93~0.09`0.07 1.77~0.04`0.04 1.19~0.15`0.17 1.38 2.92~0.43`0.43 1.40~0.10`0.10 1.95~0.11`0.13 2.90~0.51`0.48 1.2311È12 . . . . . . 1.04~0.05`0.05 1.77~0.04`0.04 1.41~0.16`0.18 1.26 1.97~0.43`0.45 1.16~0.16`0.14 1.77~0.05`0.05 1.53~0.24`0.44 1.2213È15 . . . . . . 0.97~0.05`0.04 1.82~0.03`0.03 1.26~0.10`0.11 1.24 1.94~0.43`0.43 1.09~0.17`0.15 1.82~0.04`0.04 1.35~0.17`0.24 1.2116È18 . . . . . . 1.00~0.08`0.07 1.76~0.05`0.05 1.14~0.13`0.17 1.10 1.62~0.58`0.68 1.01~0.25`0.25 1.76~0.05`0.05 1.14~0.15`0.31 1.1219È20 . . . . . . 0.97~0.06`0.05 1.68~0.04`0.04 1.15~0.10`0.12 1.41 1.58~0.46`0.49 0.96~0.20`0.18 1.68~0.04`0.04 1.14~0.13`0.17 1.4421È23 . . . . . . 0.94~0.04`0.04 1.73~0.03`0.03 1.28~0.08`0.09 1.84 1.89~0.33`0.34 1.04~0.12`0.12 1.73~0.03`0.03 1.34~0.12`0.16 1.8124È25 . . . . . . 0.95~0.07`0.06 1.70~0.04`0.04 1.31~0.16`0.17 1.13 2.41~0.33`0.34 1.25~0.08`0.08 1.77~0.06`0.07 2.31~0.28`0.31 0.9826È27 . . . . . . 0.97~0.06`0.06 1.76~0.03`0.04 1.28~0.18`0.17 1.14 2.32~0.33`0.32 1.27~0.09`0.07 1.80~0.07`0.08 2.30~0.28`0.31 0.9928È30 . . . . . . 1.09~0.07`0.06 1.77~0.04`0.04 1.33~0.16`0.26 1.24 2.06~0.57`0.50 1.25~0.22`0.18 1.77~0.05`0.05 1.54~0.35`0.92 1.2131È32 . . . . . . 1.18~0.05`0.04 2.04~0.09`0.09 2.34~0.27`0.19 0.94 2.20~0.43`0.45 1.32~0.11`0.11 2.06~0.10`0.11 2.43~0.28`0.25 0.8033È34 . . . . . . 1.08~0.10`0.09 2.01~0.08`0.08 1.14~0.13`0.16 1.36 3.08~0.53`0.55 1.64~0.13`0.13 2.28~0.21`0.27 3.12~0.80`0.61 1.3035È37 . . . . . . 1.22~0.07`0.06 1.99~0.05`0.05 1.23~0.15`0.17 1.20 2.56~0.38`0.38 1.58~0.10`0.10 2.15~0.12`0.13 2.64~0.50`0.39 1.0638È40 . . . . . . 1.07~0.07`0.06 1.90~0.05`0.05 1.11~0.11`0.11 1.34 2.82~0.37`0.34 1.55~0.10`0.08 2.06~0.14`0.12 2.83~0.68`0.39 1.1541È42 . . . . . . 1.11~0.08`0.07 1.85~0.06`0.06 1.25~0.19`0.22 0.74 1.71~0.61`0.62 1.14~0.27`0.22 1.85~0.06`0.07 1.28~0.26`0.39 0.75
1998 April 21
1È2 . . . . . . . . 0.86~0.06`0.06 1.57~0.05`0.05 1.23~0.12`0.14 0.99 2.01~0.49`0.66 0.99~0.18`0.24 1.57~0.05`0.06 1.32~0.19`0.94 0.963 . . . . . . . . . . . 0.91~0.06`0.05 1.55~0.05`0.05 1.53~0.23`0.22 1.07 1.71~0.54`0.53 0.94~0.22`0.17 1.55~0.06`0.06 1.56~0.36`0.66 1.084 . . . . . . . . . . . 0.84~0.04`0.05 1.52~0.04`0.04 1.56~0.17`0.29 1.43 2.20~0.28`0.27 1.03~0.08`0.07 1.56~0.06`0.07 2.13~0.36`0.32 1.155 . . . . . . . . . . . 0.84~0.04`0.04 1.47~0.04`0.04 1.39~0.12`0.16 1.35 2.29~0.25`0.25 1.08~0.06`0.06 1.56~0.12`0.08 2.47~0.97`0.39 1.326 . . . . . . . . . . . 0.82~0.06`0.05 1.42~0.04`0.04 1.21~0.15`0.21 1.55 2.34~0.29`0.28 1.10~0.09`0.07 1.47~0.05`0.06 2.01~0.42`0.42 1.287 . . . . . . . . . . . 0.82~0.05`0.05 1.45~0.04`0.04 1.28~0.12`0.15 1.05 2.02~0.43`0.41 0.97~0.16`0.13 1.46~0.05`0.05 1.46~0.26`0.46 1.008È9 . . . . . . . . 0.88~0.04`0.03 1.44~0.03`0.03 1.27~0.11`0.11 1.71 2.00~0.27`0.34 1.01~0.10`0.13 1.44~0.04`0.04 1.41~0.17`0.75 1.5710È12 . . . . . . 0.90~0.03`0.03 1.47~0.03`0.03 1.34~0.09`0.10 0.96 1.80~0.25`0.24 0.96~0.09`0.08 1.47~0.03`0.03 1.41~0.14`0.18 0.9313È16 . . . . . . 0.95~0.03`0.03 1.52~0.03`0.03 1.46~0.14`0.16 1.38 2.25~0.20`0.21 1.16~0.05`0.05 1.58~0.06`0.06 2.35~0.34`0.27 1.01
1998 April 23
1È5 . . . . . . . . 0.96~0.03`0.03 1.58~0.03`0.03 1.40~0.10`0.12 1.76 2.09~0.25`0.32 1.13~0.09`0.10 1.59~0.03`0.07 1.70~0.25`0.67 1.506È11 . . . . . . . 0.98~0.02`0.02 1.67~0.02`0.02 1.30~0.07`0.07 2.45 1.92~0.21`0.21 1.09~0.08`0.08 1.68~0.03`0.03 1.43~0.13`0.19 2.3112È19 . . . . . . 1.07~0.02`0.02 1.69~0.03`0.03 1.46~0.09`0.09 1.79 2.02~0.18`0.18 1.20~0.06`0.06 1.69~0.03`0.03 1.62~0.14`0.19 1.37
a Galactic hydrogen equivalent absorbing column is cm~2 (Lockman & Savage 1995). The quoted errors are for 1pNH/(1.61B0.1)C1020for three parameters (i.e., *s2\ 3.53). The dof is 57.
b Quoted errors are for 1p for four parameters (i.e., *s2\ 4.72). The dof is 56.
APPENDIX C
MORE DETAILS ON THE BROKEN POWER-LAW FITS
Table 6 reports the best-Ðt values for the relevant parameters for the broken power-law model.
REFERENCESBoella, G., Butler, R. C., Perola, G. C., Piro, L., Scarsi, L., & Bleeker,
J. A. M. 1997, A&AS, 122, 299Canizares, C., & Kruper, J. 1984, ApJ, 278, L99Catanese, M., & Sambruna, R. M. 2000, ApJ, 534, L39Chiaberge, M., & Ghisellini, G. 1999, MNRAS, 306, 551Chiappetti, L., & Dal Fiume, D. 1997, in Proc. of the 5th Workshop, Data
Analysis in Astronomy, ed. V. Di et al. (Singapore : WorldGesu�ScientiÐc), 101
Chiappetti, L., et al. 1999, ApJ, 521, 552Fiore, F., Guainazzi, M., & Grandi, P. 1999, Cookbook for BeppoSAX
NFI Spectral Analysis (Roma, Italy : SDC)Fossati, G., & Haardt, F. 1997, ScientiÐc Report on Low Energy Absorp-
tion Features Detected by BeppoSAX LECS in Bright Blazar Targets.Rept. no. Ref. SISSA 146/97/A; preprint (astro-ph/9804282)
Fossati, G., Maraschi, L., Celotti, A., Comastri, A., & Ghisellini, G. 1998a,MNRAS, 299, 433
Fossati, G., et al. 1998b, Nucl. Phys. B Supp., 69, 423ÈÈÈ. 2000, ApJ, 541, (Paper I)
Georganopoulos, M., & Marscher, A. P. 1998, ApJ, 506, L11Ghisellini, G., & Madau, P. 1996, MNRAS, 280, 67Ghisellini, G., Celotti, A., Fossati, G., Maraschi, L., & Comastri, A. 1998,
MNRAS, 301, 451Giommi, P., et al. 1998, A&A, 333, L5ÈÈÈ. 1999, A&A, 351, 59Guainazzi, M., et al. 1999, A&A, 342, 124Inoue, S., & Takahara, F. 1996, ApJ, 463, 555Kirk, J. G., Rieger, F. M., & Mastichiadis, A. 1998, A&A, 333, 452Krawczynski, H., Coppi, P. S., Maccarone, T., & Aharonian, F. A. 2000,
A&A, 353, 97Lockman, F. J., & Savage, B. D. 1995, ApJS, 97, 1Macomb, D. J., et al. 1995, ApJ, 449, L99 (erratum 459, L111 [1996])Malizia, A., et al. 2000, MNRAS, 312, 123Maraschi, L., et al. 1999, ApJ, 526, L81Padovani, P., & Giommi, P. 1995, ApJ, 444, 567Pian, E., et al. 1998, ApJ, 492, L17ÈÈÈ. 1999, ApJ, 521, 112

No. 1, 2000 X-RAY EMISSION OF MARKARIAN 421. II. 179
Sambruna, R. M., George, I. M., Madejski, G., Urry, C. M., Turner, T. J.,Weaver, K. A., Maraschi, L., & Treves, A. 1997, ApJ, 483, 774
Sambruna, R. M., Ghisellini, G., Hooper, E., Kollgaard, R. I., Pesce, J. E.,& Urry, C. M. 1999, ApJ, 515, 140
Sambruna, R. M., & Mushotzky, R. F. 1998, ApJ, 502, 630Sembay, S., Warwick, R. S., Urry, C. M., Sokoloski, J., George, I. M.,
Makino, F., Ohashi, T., & Tashiro, M. 1993, ApJ, 404, 112
Sikora, M., Begelman, M. C., & Rees, M. J. 1994, ApJ, 421, 153Tagliaferri, G., et al. 2000, A&A, 354, 431Takahashi, T., et al. 1996, ApJ, 470, L89Tavecchio, F., Maraschi, L., & Ghisellini, G. 1998, ApJ, 509, 608Urry, C. M., & Padovani, P. 1995, PASP, 107, 803Zhang, Y. H., et al. 1999, ApJ, 527, 719
Copyright © 2022 FDOKUMEN