The Lgr5 intestinal stem cell signature: robust expression of proposed quiescent ‘+4’ cell markers
Upload
independentCategory
view
1download
0
Physics
Physics Research Publications
Purdue University Year
Spectral energy distribution of markarian
501: Quiescent state versus extreme
outburstV. A. Acciari, T. Arlen, T. Aune, M. Beilicke, W. Benbow, M. Bottcher, D.Boltuch, S. M. Bradbury, J. H. Buckley, V. Bugaev, A. Cannon, A. Cesarini,L. Ciupik, W. Cui, R. Dickherber, C. Duke, M. Errando, A. Falcone, J. P.Finley, G. Finnegan, L. Fortson, A. Furniss, N. Galante, D. Gall, S. Godambe,J. Grube, R. Guenette, G. Gyuk, D. Hanna, J. Holder, D. Huang, C. M. Hui,T. B. Humensky, A. Imran, P. Kaaret, N. Karlsson, M. Kertzman, D. Kieda,A. Konopelko, H. Krawczynski, F. Krennrich, A. S. Madhavan, G. Maier, S.McArthur, A. McCann, P. Moriarty, R. A. Ong, A. N. Otte, D. Pandel, J. S.Perkins, A. Pichel, M. Pohl, J. Quinn, K. Ragan, L. C. Reyes, P. T. Reynolds, E.Roache, H. J. Rose, M. Schroedter, G. H. Sembroski, D. Steele, S. P. Swordy, M.Theiling, S. Thibadeau, A. Varlotta, V. V. Vassiliev, S. Vincent, S. P. Wakely, J.E. Ward, T. C. Weekes, A. Weinstein, T. Weisgarber, D. A. Williams, M. Wood,B. Zitzer, J. Aleksic, L. A. Antonelli, P. Antoranz, M. Backes, J. A. Barrio, D.Bastieri, J. B. Gonzalez, W. Bednarek, A. Berdyugin, K. Berger, E. Bernardini,A. Biland, O. Blanch, R. K. Bock, A. Boller, G. Bonnoli, P. Bordas, D. B.Tridon, V. Bosch-Ramon, D. Bose, I. Braun, T. Bretz, M. Camara, E. Carmona,A. Carosi, P. Colin, E. Colombo, J. L. Contreras, J. Cortina, S. Covino, F. Dazzi,A. De Angelis, E. D. Del Pozo, B. De Lotto, M. De Maria, F. De Sabata, C.D. Mendez, A. D. Ortega, M. Doert, A. Dominguez, D. D. Prester, D. Dorner,M. Doro, D. Elsaesser, D. Ferenc, M. V. Fonseca, L. Font, R. J. G. Lopez, M.Garczarczyk, M. Gaug, G. Giavitto, N. Godinovic, D. Hadasch, A. Herrero, D.Hildebrand, D. Hohne-Monch, J. Hose, D. Hrupec, T. Jogler, S. Klepser, T.Krahenbuhl, D. Kranich, J. Krause, A. La Barbera, E. Leonardo, E. Lindfors,S. Lombardi, F. Longo, M. Lopez, E. Lorenz, P. Majumdar, M. Makariev, G.Maneva, N. Mankuzhiyil, K. Mannheim, L. Maraschi, M. Mariotti, M. Martinez,D. Mazin, M. Meucci, J. M. Miranda, R. Mirzoyan, H. Miyamoto, J. Moldon,A. Moralejo, D. Nieto, K. Nilsson, R. Orito, I. Oya, R. Paoletti, J. M. Paredes,S. Partini, M. Pasanen, F. Pauss, R. G. Pegna, M. A. Perez-Torres, M. Persic,L. Peruzzo, J. Pochon, F. Prada, P. G. P. Moroni, E. Prandini, N. Puchades,
I. Puljak, I. Reichardt, R. Reinthal, W. Rhode, M. Ribo, J. Rico, M. Rissi, S.Rugamer, A. Saggion, K. Saito, T. Y. Saito, M. Salvati, M. Sanchez-Conde, K.Satalecka, V. Scalzotto, V. Scapin, C. Schultz, T. Schweizer, M. Shayduk, S.N. Shore, A. Sierpowska-Bartosik, A. Sillanpaa, J. Sitarek, D. Sobczynska, F.Spanier, S. Spiro, A. Stamerra, B. Steinke, J. Storz, N. Strah, J. C. Struebig, T.Suric, L. Takalo, F. Tavecchio, P. Temnikov, T. Terzic, D. Tescaro, M. Teshima,D. F. Torres, H. Vankov, R. M. Wagner, Q. Weitzel, V. Zabalza, F. Zandanel,R. Zanin, D. Paneque, and M. Hayashida
This paper is posted at Purdue e-Pubs.
http://docs.lib.purdue.edu/physics articles/1155

The Astrophysical Journal, 729:2 (9pp), 2011 March 1 doi:10.1088/0004-637X/729/1/2C© 2011. The American Astronomical Society. All rights reserved. Printed in the U.S.A.
SPECTRAL ENERGY DISTRIBUTION OF MARKARIAN 501: QUIESCENT STATE VERSUSEXTREME OUTBURST
V. A. Acciari1, T. Arlen
2, T. Aune
3, M. Beilicke
4, W. Benbow
1, M. Bottcher
5, D. Boltuch
6, S. M. Bradbury
7,
J. H. Buckley4, V. Bugaev
4, A. Cannon
8, A. Cesarini
9, L. Ciupik
10, W. Cui
11, R. Dickherber
4, C. Duke
12, M. Errando
13,
A. Falcone14
, J. P. Finley11
, G. Finnegan15
, L. Fortson10
, A. Furniss3, N. Galante
1, D. Gall
11,51, S. Godambe
15,
J. Grube10
, R. Guenette16
, G. Gyuk10
, D. Hanna16
, J. Holder6, D. Huang
17, C. M. Hui
15, T. B. Humensky
18, A. Imran
19,
P. Kaaret20
, N. Karlsson10
, M. Kertzman21
, D. Kieda15
, A. Konopelko17
, H. Krawczynski4, F. Krennrich
19,
A. S. Madhavan19
, G. Maier16,52
, S. McArthur4, A. McCann
16, P. Moriarty
22, R. A. Ong
2, A. N. Otte
3, D. Pandel
20,
J. S. Perkins1, A. Pichel
23, M. Pohl
19,52,53, J. Quinn
8, K. Ragan
16, L. C. Reyes
24, P. T. Reynolds
25, E. Roache
1, H. J. Rose
7,
M. Schroedter19
, G. H. Sembroski11
, D. Steele10,54
, S. P. Swordy18
, M. Theiling1, S. Thibadeau
4, A. Varlotta
11,
V. V. Vassiliev2, S. Vincent
15, S. P. Wakely
18, J. E. Ward
8, T. C. Weekes
1, A. Weinstein
2, T. Weisgarber
18,
D. A. Williams3, M. Wood
2, B. Zitzer
11
(the VERITAS Collaboration),
J. Aleksic26
, L. A. Antonelli27
, P. Antoranz28
, M. Backes29
, J. A. Barrio30
, D. Bastieri31
, J. Becerra Gonzalez32,33
,
W. Bednarek34
, A. Berdyugin35
, K. Berger32
, E. Bernardini36
, A. Biland37
, O. Blanch26
, R. K. Bock38
, A. Boller37
,
G. Bonnoli27
, P. Bordas39
, D. Borla Tridon38
, V. Bosch-Ramon39
, D. Bose30
, I. Braun37
, T. Bretz40
, M. Camara30
,
E. Carmona38
, A. Carosi27
, P. Colin38
, E. Colombo32
, J. L. Contreras30
, J. Cortina26
, S. Covino27
, F. Dazzi41,55
,
A. De Angelis41
, E. De Cea del Pozo42
, B. De Lotto41
, M. De Maria41
, F. De Sabata41
, C. Delgado Mendez32,56
,
A. Diago Ortega32,33
, M. Doert29
, A. Domınguez43
, D. Dominis Prester44
, D. Dorner37
, M. Doro31
, D. Elsaesser40
,
M. Errando26
, D. Ferenc44
, M. V. Fonseca30
, L. Font45
, R. J. Garcıa Lopez32,33
, M. Garczarczyk32
, M. Gaug32
,
G. Giavitto26
, N. Godinovic44
, D. Hadasch42
, A. Herrero32,33
, D. Hildebrand37
, D. Hohne-Monch40
, J. Hose38
,
D. Hrupec44
, T. Jogler38
, S. Klepser26
, T. Krahenbuhl37
, D. Kranich37
, J. Krause38
, A. La Barbera27
, E. Leonardo28
,
E. Lindfors35
, S. Lombardi31
, F. Longo41
, M. Lopez31
, E. Lorenz37,38
, P. Majumdar36
, M. Makariev46
, G. Maneva46
,
N. Mankuzhiyil41
, K. Mannheim40
, L. Maraschi27
, M. Mariotti31
, M. Martınez26
, D. Mazin26
, M. Meucci28
,
J. M. Miranda28
, R. Mirzoyan38
, H. Miyamoto38
, J. Moldon39
, A. Moralejo26
, D. Nieto30
, K. Nilsson35
, R. Orito38
,
I. Oya30
, R. Paoletti28
, J. M. Paredes39
, S. Partini28
, M. Pasanen35
, F. Pauss37
, R. G. Pegna28
, M. A. Perez-Torres43
,
M. Persic41,47
, L. Peruzzo31
, J. Pochon32
, F. Prada43
, P. G. Prada Moroni28
, E. Prandini31
, N. Puchades26
, I. Puljak44
,
I. Reichardt26
, R. Reinthal35
, W. Rhode29
, M. Ribo39
, J. Rico48,26
, M. Rissi37
, S. Rugamer40
, A. Saggion31
, K. Saito38
,
T. Y. Saito38
, M. Salvati27
, M. Sanchez-Conde32,33
, K. Satalecka36
, V. Scalzotto31
, V. Scapin41
, C. Schultz31
,
T. Schweizer38
, M. Shayduk38
, S. N. Shore49
, A. Sierpowska-Bartosik34
, A. Sillanpaa35
, J. Sitarek38,34
,
D. Sobczynska34
, F. Spanier40
, S. Spiro27
, A. Stamerra28
, B. Steinke38
, J. Storz40
, N. Strah29
, J. C. Struebig40
, T. Suric44
,
L. Takalo35
, F. Tavecchio27
, P. Temnikov46
, T. Terzic44
, D. Tescaro26
, M. Teshima38
, D. F. Torres48,42
, H. Vankov46
,
R. M. Wagner38
, Q. Weitzel37
, V. Zabalza39
, F. Zandanel43
, R. Zanin26
(the MAGIC Collaboration),
D. Paneque38,50
, and M. Hayashida50
1 Fred Lawrence Whipple Observatory, Harvard-Smithsonian Center for Astrophysics, Amado, AZ 85645, USA2 Department of Physics and Astronomy, University of California, Los Angeles, CA 90095, USA
3 Santa Cruz Institute for Particle Physics and Department of Physics, University of California, Santa Cruz, CA 95064, USA4 Department of Physics, Washington University, St. Louis, MO 63130, USA
5 Astrophysical Institute, Department of Physics and Astronomy, Ohio University, Athens, OH 45701, USA6 Department of Physics and Astronomy and the Bartol Research Institute, University of Delaware, Newark, DE 19716, USA
7 School of Physics and Astronomy, University of Leeds, Leeds LS2 9JT, UK8 School of Physics, University College Dublin, Belfield, Dublin 4, Ireland
9 School of Physics, National University of Ireland Galway, University Road, Galway, Ireland10 Astronomy Department, Adler Planetarium and Astronomy Museum, Chicago, IL 60605, USA
11 Department of Physics, Purdue University, West Lafayette, IN 47907, USA; [email protected], [email protected] Department of Physics, Grinnell College, Grinnell, IA 50112-1690, USA
13 Department of Physics and Astronomy, Barnard College, Columbia University, NY 10027, USA14 Department of Astronomy and Astrophysics, 525 Davey Lab, Pennsylvania State University, University Park, PA 16802, USA
15 Department of Physics and Astronomy, University of Utah, Salt Lake City, UT 84112, USA16 Physics Department, McGill University, Montreal, QC H3A 2T8, Canada
17 Department of Physics, Pittsburg State University, 1701 South Broadway, Pittsburg, KS 66762, USA18 Enrico Fermi Institute, University of Chicago, Chicago, IL 60637, USA
19 Department of Physics and Astronomy, Iowa State University, Ames, IA 50011, USA20 Department of Physics and Astronomy, University of Iowa, Van Allen Hall, Iowa City, IA 52242, USA
21 Department of Physics and Astronomy, DePauw University, Greencastle, IN 46135-0037, USA22 Department of Life and Physical Sciences, Galway-Mayo Institute of Technology, Dublin Road, Galway, Ireland
23 Instituto de Astronomia y Fisica del Espacio, Casilla de Correo 67-Sucursal 28, (C1428ZAA) Ciudad Autnoma de Buenos Aires, Argentina24 Kavli Institute for Cosmological Physics, University of Chicago, Chicago, IL 60637, USA
25 Department of Applied Physics and Instrumentation, Cork Institute of Technology, Bishopstown, Cork, Ireland26 IFAE, Edifici Cn., Campus UAB, E-08193 Bellaterra, Spain
27 INAF National Institute for Astrophysics, I-00136 Rome, Italy
1
The Astrophysical Journal, 729:2 (9pp), 2011 March 1 Acciari et al.
28 Dipartimento di Fisica dell’Universita di Siena, and INFN Pisa, I-53100 Siena, Italy29 Fakultat Physik, Technische Universitat Dortmund, D-44221 Dortmund, Germany
30 Atomic Physics Department, Universidad Complutense, E-28040 Madrid, Spain31 Dipartimento di Fisica dell’Universita di Padova and INFN, I-35131 Padova, Italy
32 Inst. de Astrofısica de Canarias, E-38200 La Laguna, Tenerife, Spain33 Depto. de Astrofısica, Universidad, E-38206 La Laguna, Tenerife, Spain
34 Department of Experimental Physics, University of Łodz, PL-90236 Lodz, Poland35 Tuorla Observatory, University of Turku, FI-21500 Piikkio, Finland
36 Deutsches Elektronen-Synchrotron (DESY), D-15738 Zeuthen, Germany37 ETH Zurich, CH-8093, Switzerland
38 Max-Planck-Institut fur Physik, D-80805 Munchen, Germany39 Departament d’Astronomia i Meteorologia, Universitat de Barcelona (ICC/IEEC), E-08028 Barcelona, Spain
40 Universitat Wurzburg, Institut fur Theoretische Physik und Astrophysik, D-97074 Wurzburg, Germany41 Dipartimento di Fisica dell’Universita di Udine, and INFN Trieste, I-33100 Udine, Italy
42 Institut de Ciencies de l’Espai (IEEC-CSIC), E-08193 Bellaterra, Spain43 Inst. de Astrofısica de Andalucıa (CSIC), E-18080 Granada, Spain
44 Croatian MAGIC Consortium, Institute R. Boskovic, University of Rijeka and University of Split, HR-10000 Zagreb, Croatia45 Department of Applied Physics, Universitat Autonoma de Barcelona, E-08193 Bellaterra, Spain
46 Institute for Nuclear Research and Nuclear Energy, BG-1784 Sofia, Bulgaria47 INAF/Osservatorio Astronomico and INFN, I-34143 Trieste, Italy
48 ICREA, E-08010 Barcelona, Spain49 Dipartimento di Fisica dell’Universita di Pisa, and INFN Pisa, I-56126 Pisa, Italy
50 W. W. Hansen Experimental Physics Laboratory, Kavli Institute for Particle Astrophysics and Cosmology, Department of Physics andSLAC National Accelerator Laboratory, Stanford University, Stanford, CA 94305, USA
Received 2010 August 19; accepted 2010 December 9; published 2011 February 3
ABSTRACT
The very high energy (VHE; E > 100 GeV) blazar Markarian 501 (Mrk 501) has a well-studied history of extremespectral variability and is an excellent laboratory for studying the physical processes within the jets of activegalactic nuclei. However, there are few detailed multiwavelength studies of Mrk 501 during its quiescent state, dueto its low luminosity. A short-term multiwavelength study of Mrk 501 was coordinated in 2009 March, focusingaround a multi-day observation with the Suzaku X-ray satellite and including γ -ray data from VERITAS, MAGIC,and the Fermi Gamma-ray Space Telescope with the goal of providing a well-sampled multiwavelength baselinemeasurement of Mrk 501 in the quiescent state. The results of these quiescent-state observations are compared tothe historically extreme outburst of 1997 April 16, with the goal of examining variability of the spectral energydistribution (SED) between the two states. The derived broadband SED shows the characteristic double-peakedprofile. We find that the X-ray peak shifts by over two orders of magnitude in photon energy between the two fluxstates while the VHE peak varies little. The limited shift in the VHE peak can be explained by the transition to theKlein–Nishina (KN) regime. Synchrotron self-Compton models are matched to the data and the implied KN effectsare explored.
Key words: BL Lacertae objects: individual (Markarian 501 = VER J1653+397) – galaxies: active – gamma rays:galaxies – radiation mechanisms: non-thermal – X-rays: galaxies
Online-only material: color figures
1. INTRODUCTION
Blazars, a subclass of active galactic nuclei (AGNs), are thedominant extragalactic source class in γ -rays. They have beenobserved to show rapid variability and non-thermal spectra, pre-senting a broad continuum across nearly the entire electromag-netic spectrum. This implies that the observed photons orig-inate within highly relativistic jets oriented very close to theobserver’s line of sight (Urry & Padovani 1995). This orienta-tion results in Doppler beaming that boosts the intensity andfrequency of the observed jet emission, often overwhelming all
51 Now at the Department of Physics and Astronomy, University of Iowa, VanAllen Hall, Iowa City, IA 52242, USA.52 Now at DESY, Platanenallee 6, 15738 Zeuthen, Germany.53 Now at the Institut fur Physik und Astronomie, Universitat Potsdam, 14476Potsdam-Golm, Germany.54 Now at the Los Alamos National Laboratory, MS H803, Los Alamos, NM87545, USA.55 Supported by INFN Padova.56 Now at the Centro de Investigaciones Energeticas, Medioambientales yTecnologicas (CIEMAT), Madrid, Spain.
other emission from the source. Therefore, blazars make excel-lent laboratories for studying the physical processes within thejets of AGNs. They were among the first sources to be detectedin the very high energy (VHE) band, and at the time of writingthis paper there are 34 known VHE γ -ray blazars.57 Markarian501 (Mrk 501; 1H1652+398), at a redshift of z = 0.034, wasthe second blazar to be detected at VHE (Quinn et al. 1996).
The spectral energy distribution (SED) of Mrk 501 charac-teristically shows a double-peaked profile. These peaks occurat keV and TeV energies when the SED is plotted in the νFν
versus ν representation. This structure is common among allVHE γ -ray blazars, and several models have been developedto account for the double-peaked structure. These models uni-formly attribute the peak at keV energies to synchrotron radia-tion from relativistic electrons and positrons within the blazarjets, but they differ in accounting for the source of the VHEpeak. The models are generally divided into two classes: lep-tonic and hadronic, named for their attributed source for the
57 http://tevcat.uchicago.edu/
2
The Astrophysical Journal, 729:2 (9pp), 2011 March 1 Acciari et al.
VHE peak. The leptonic models advocate inverse Compton scat-tering to VHE of either the synchrotron photons from within thejet or an external photon field (e.g., Marscher & Gear 1985;Maraschi et al. 1992; Dermer et al. 1992; Sikora et al. 1994).The hadronic models, however, account for the VHE emissionby π0 decay or by π± decay with subsequent synchrotron and/orCompton emission from decay products, or by synchrotron ra-diation from ultra-relativistic protons (e.g., Mannheim 1993;Aharonian 2000; Pohl & Schlickeiser 2000).
Observationally, Mrk 501 has been known to undergo bothmajor outbursts on long timescales and rapid flares on shorttimescales, most prominently in the keV and VHE range (e.g.,Catanese et al. 1997; Pian et al. 1998; Xue & Cui 2005; Albertet al. 2007a). During these outbursts, both of the SED peakshave been observed to shift toward higher energies. During themost extreme cases, the keV peak has been observed above200 keV, well above typical values below 1 keV. Historically,the SED has been measured in the VHE band primarilyduring outbursts, due to the lower sensitivity of previousgenerations of instruments. A previous study examined thequiet state, but it was performed before the launch of the FermiLarge Area Telescope (Fermi-LAT), which provides coveragein the range between keV and VHE energies (Anderhub et al.2009). This work attempts to provide state-of-the-art short-term multiwavelength measurements of the quiescent state ofMrk 501, with broad spectral coverage in the critical keVand VHE bands as well as coverage with the Fermi-LAT.These measurements are then compared to observations byBeppoSAX in X-rays and by the Whipple 10 m and CATCerenkov telescopes in VHE γ -rays during the 1997 extremeoutburst. This outburst has been well studied using multipleinstruments (e.g., Aharonian et al. 2001; Catanese et al. 1997;Pian et al. 1998) and provides a good comparison to the quietstate observed in 2009.
2. DATA SELECTION AND ANALYSIS
2.1. Suzaku: X-ray
The Suzaku X-ray observatory, a collaborative project be-tween institutions in the United States and Japan, is an excellenttool for studying the broadband SED of sources such as Mrk 501due to its broad energy range (0.2–600 keV). Suzaku has twooperating instruments for studying X-ray emission: the X-rayimaging spectrometer (XIS; Koyama et al. 2007) and the hardX-ray detector (HXD; Takahashi et al. 2007).
The XIS instrument consists of four X-ray telescopes withimaging CCD cameras at their focal planes. Three of the CCDsare front illuminated, and one CCD is back illuminated to pro-vide extended sensitivity to soft X-rays. The combined energyrange of these CCDs is 0.2–12.0 keV. The HXD is a non-imaginginstrument that expands the energy sensitivity of Suzaku to the10–600 keV band by using two types of detectors. Silicon PINdiodes provide sensitivity in the range 10–70 keV, and gadolin-ium silicate (GSO; Gd2SiO5(Ce)) scintillators placed behindthe PIN diodes provide sensitivity in the range 40–600 keV.One limitation of Suzaku with respect to attaining simultaneousmultiwavelength observations is that it resides in a low Earthorbit, so observations are subject to frequent Earth occultations,limiting continuous temporal coverage.
Observations of Mrk 501 were carried out with the SuzakuX-ray satellite from 2009 March 23 UT 18:39 to 2009 March25 UT 07:59 (sequence number 703046010). After good timeinterval selection and dead-time correction, a total of approxi-
mately 72 ks of live time remained for the XIS and 61 ks for theHXD. To reduce the occurrence of photon pile-up in the XIS, acommon problem when dealing with bright X-ray point sources,the XIS observations were carried out in 1/4 window mode andSuzaku was operated with a pointing nominally centered on theHXD field of view (FoV). In addition, HXD nominal pointingincreases the effective area of the HXD instrument. The result-ing XIS count rates are well below the threshold where pile-upbecomes a significant issue. Even with the HXD nominal point-ing, there was no significant detection in the GSO scintillators,so the maximum useful energy for these observations using onlythe HXD/PIN detector was around 70 keV.
The raw XIS data were reprocessed following the guidelinesfrom the Suzaku team58 using Suzaku FTOOLS version 12.0.The events were graded and only those with ASCA grades 0, 2,3, 4, and 6 were included in further analysis. In addition, the datawere screened to exclude times when the Suzaku spacecraft waspassing through the South Atlantic Anomaly (SAA), includinga 436 s post-SAA buffer to allow the instrument backgroundsto settle. Additional cuts were made requiring the data usedto be taken at least 5◦ in elevation above Earth’s limb and atleast 20◦ above Earth’s daytime limb. These cuts help reducecontamination from Earth’s atmosphere.
Source events were extracted from a circular region with aradius of 1.′92 centered on Mrk 501. Background events wereextracted from a circular region with the same radius located farfrom the source in each XIS detector. The redistribution matrixfile (RMF) and ancillary response file (ARF) were generatedfor each XIS detector using the analysis tools included in theSuzaku analysis package.
The HXD data were also reprocessed from the raw files,following the guidelines provided by the Suzaku team.59 Thedata were filtered with similar criteria to the XIS data with aslightly longer settling time of 500 s required following passagethrough the SAA. In addition, the only elevation requirementwas for data to be taken at least 5◦ above Earth’s limb.
Because the HXD is a non-imaging instrument, the cosmic X-ray background (CXB) and instrumental non-X-ray background(NXB) must be accounted for in different ways than for the XIS.The time-variable NXB has been modeled and provided by theHXD team. The CXB is not included in this model and mustbe accounted for separately as the CXB flux is about 5% ofthe background for PIN observations. The model suggested bythe HXD team is based on results from HEAO-1 and modifiedfor input to XSPEC. The imported model reproduces the PINbackground with an HXD nominal pointing (Boldt 1987). Themodel is given by
dF
dE= 8.0 × 10⁻⁴
(E
1 keV
)−1.29
× exp
( −E
40 keV
)
photons cm−2 s−1 FoV−1 keV−1. (1)
The CXB background model was added to the NXB back-ground model and used to subtract background events in XSPECduring spectral analysis of the PIN data. The response fileae_hxd_pinhxnome5_20080716.rsp provided by the HXDteam was used for the PIN spectral analysis.
2.2. VERITAS: VHE γ -ray
The Very Energetic Radiation Imaging Telescope Ar-ray System (VERITAS) is an array of four imaging
58 http://heasarc.gsfc.nasa.gov/docs/suzaku/analysis/abc/node9.html59 http://heasarc.gsfc.nasa.gov/docs/suzaku/analysis/hxd_repro.html
3

The Astrophysical Journal, 729:2 (9pp), 2011 March 1 Acciari et al.
atmospheric-Cerenkov telescopes (IACTs) located at the FredLawrence Whipple Observatory in southern Arizona (31◦40′ N,110◦57′ W) at an altitude of 1.28 km above sea level (Holderet al. 2008). These telescopes capture the Cerenkov light emit-ted by extensive air showers that are initiated in the upper at-mosphere by γ -rays and cosmic rays. The telescopes have 12 mdiameter tessellated reflectors directing light onto imaging cam-eras, each consisting of 499 photomultiplier tubes (PMTs), lo-cated in the focal plane of each telescope. The cameras have anFoV of 3.◦5 with an angular size per pixel of 0.◦15. VERITAS issensitive in the range of approximately 100 GeV–30 TeV withan energy resolution of between 15% and 20%. Images of the ex-tensive air showers captured by each telescope can be combinedto reconstruct the direction and energy of the shower initiator.The telescopes typically operate in “wobble” mode, where thelocation of the object to be observed is offset from the centerof the FoV by 0.◦5, allowing for simultaneous source and back-ground measurements (Fomin et al. 1994). The offset directionalternates between north, south, east, and west for each data run(typically lasting 20 minutes) to reduce systematic effects fromthe offset.
The VERITAS data were analyzed using the standard analysispackage (Cogan et al. 2007). Images of the Cerenkov lightproduced by the extensive air showers are parameterized, andquality cuts are placed on the data to ensure that the showerreconstruction procedure can be performed reliably. Separationof showers initiated by γ -ray photons from hadronic showersinitiated by cosmic rays is performed with the aid of lookuptables. The lookup tables are calculated for each telescope withseveral values of zenith angle, azimuth angle, and the nightsky background noise level. The observed parameters lengthand width are scaled by the corresponding parameters in thelookup tables and averaged among the telescopes to find the“mean scaled parameters” in the method first suggested byDaum et al. (1997). Selection criteria for γ /hadron separation(optimized with data taken on the Crab Nebula) are placed onthe mean scaled parameters of the shower images to excludemost hadronic showers while still retaining a large proportionof γ -ray initiated showers.
To perform a background subtraction of the surviving cosmic-ray events, an estimation of these background counts is madeusing the “reflected-region” background model (Berge et al.2007). Events within a squared angular distance of θ2 < 0.0169of the anticipated source location are considered ON events.Background measurements (OFF events) are taken from regionsof the same size and at the same angular distance from thecenter of the FoV. For this analysis, a minimum of eightbackground regions were used. The excess number of eventsfrom the anticipated source location is found by subtractingthe number of OFF events (scaled by the relative exposure)from the ON events. Statistical significances are calculated usingEquation (17) of Li & Ma (1983). More details about VERITAS,the calibration, and analysis techniques can be found in Acciariet al. (2008).
On 2009 March 24 (MJD 54914), VERITAS was used totake data on Mrk 501 while operating in wobble mode, with anoffset angle of 0.◦5. VERITAS was used to observe Mrk 501 for2.6 hr from 9:11 UT to 11:58 UT using a series of 20 minuteruns, with a live time of 2.4 hr and zenith angles ranging from35◦ to 9◦. Additional observations totaling 2.9 hr were madeon March 23 and 25 but were discarded due to poor weatherconditions. The data were processed using standard VERITASanalysis cuts, finding 431 ON events and 1810 OFF events with
a maximum ratio between ON and OFF exposure of 0.125. Thetotal significance of the excess for this observation was 12.7standard deviations (σ ) with an average significance per run of3.8σ .
2.3. MAGIC: VHE γ -ray
MAGIC is a system of two IACTs for VHE γ -ray astronomylocated on the Canary Island of La Palma (2.2 km above sealevel, 28◦45′ N, 17◦54′ W). At the time of the observation,MAGIC-II, the second telescope of the array, was still in itscommissioning phase so Mrk 501 was observed by MAGIC-Iin stand-alone mode.
MAGIC-I has a 17 m diameter tessellated reflector dish anda hexagonal camera with an FoV of 3.◦5 mean angular diameter.The camera comprises 576 high-sensitivity PMTs of differentdiameters (0.◦1 in the inner portion of the camera and 0.◦2 in theouter portion). The trigger threshold of MAGIC at low zenithangles is between 50 and 60 GeV with the standard triggerconfiguration used in this campaign. The accessible energyrange extends up to tens of TeV with a typical energy resolutionof 20%–30%, depending on zenith angle and energy. Furtherdetails, telescope parameters, and performance information canbe found in Albert et al. (2008a).
The MAGIC data for this campaign were recorded between3:50 UT and 5:10 UT on the night of 2009 March 23 (MJD54913). The observations were performed in wobble mode.The zenith angle of the observations ranged from 15◦ to 30◦.The recorded data fulfill the standard quality requirements, sonone of the runs were removed from the data sample. The totallive time for this observation is 1.3 hr.
The data were analyzed using the standard MAGIC calibra-tion and analysis (Albert et al. 2008a). The analysis is basedon image parameters (Hillas 1985; Aliu et al. 2009) and therandom forest (RF) method (Albert et al. 2008b), which areused to define the so-called hadronness of each event. Thecut in hadronness for background rejection was chosen usingMonte Carlo data, setting a cut efficiency for γ -rays of 70%.Three background (OFF) sky regions are used for the residualbackground estimation, giving a ratio between ON and OFFexposure of 0.333. The OFF regions are chosen to be at thesame angular distance from the camera center as the ON region.The excess of γ -ray events from the source was extracted fromthe distribution of the ALPHA parameter, which is related to theimage orientation on the camera (Hillas 1985). The final cut onALPHA was also chosen using Monte Carlo γ -ray events, againimposing a cut efficiency of 70%. With these less restrictivecuts, suitable for the spectrum calculation, the significance ofthe excess is 2.2σ with 9527 ON events and 27846 OFF events,whereas applying stricter cuts in the optimal energy range forsignal detection leads to a significance of 9.7σ with 123 ONevents and 97 OFF events.
The energies of the VHE γ -ray candidates were also esti-mated using the RF method. A cut was applied on the SIZEparameter, requiring a minimum of 100 photoelectrons in theshower images. Because the SIZE parameter is related to theenergy of the initiator of the shower, this cut results in an energythreshold for the analysis (defined as the peak position of thedistribution of the reconstructed energy parameter for simulatedγ -ray events after the cut) of ∼100 GeV.
2.4. Fermi-LAT: HE γ -ray
The Fermi-LAT is a satellite instrument for performingγ -ray astronomy from 20 MeV to several hundred GeV. The
4

The Astrophysical Journal, 729:2 (9pp), 2011 March 1 Acciari et al.
instrument is an array of 4 × 4 identical towers, each oneconsisting of a tracker (where the photons are pair converted)and a calorimeter (where the energies of the pair-convertedphotons are measured). The entire instrument is covered with ananticoincidence detector to reject charged-particle background.The LAT has a peak effective area of 0.8 m2 for 1 GeV photons,energy resolution typically better than 10%, and an FoV of about2.4 sr, with angular resolution (68% containment angle) betterthan 1◦ for energies above 1 GeV. Further details about the LATcan be found in Atwood et al. (2009)
The analysis was performed with the ScienceTools softwarepackage version v9r15p2, which is available from the FermiScience Support Center (FSSC). Only events having the highestprobabilities of being photons, those in the “diffuse” class, wereused. The Pass 6v3 diffuse-class instrument-response functionswere used for the analysis. The LAT data were extracted from acircular region of 10◦ radius centered at the location of Mrk 501.The spectral fit was performed using photon energies greaterthan 0.3 GeV in order to minimize systematic effects, and acut on the zenith angle (>105◦) was also applied to reducecontamination from Earth-albedo γ -rays, which are producedby cosmic rays interacting with the upper atmosphere.
The background model used to extract the γ -ray signal in-cludes a Galactic diffuse emission component and an isotropiccomponent. The model that we adopted for the Galactic com-ponent is gll_iem_v02.fit.60 The isotropic component, which isthe sum of the extragalactic diffuse emission and the residualcharged-particle background, is parameterized here with a sin-gle power-law function. Owing to the relatively small size ofthe region analyzed (radius 10◦) and the hardness of the spec-trum of Mrk 501, the high-energy structure in the standard tab-ulated isotropic background spectrum, isotropic_iem_v02.txt,does not dominate the total counts at high energies. In addi-tion, we find that for this region a power-law approximation tothe isotropic background results in somewhat smaller residu-als for the model overall, possibly because the isotropic term,with a free spectral index, compensates for an inaccuracy inthe model for the Galactic diffuse emission, which is also ap-proximately isotropic at the high Galactic latitude of Mrk 501(b ∼ 39◦). In any case, the resulting spectral fits for Mrk 501are not significantly different if isotropic_iem_v02.txt is usedfor the analysis. To further reduce systematic uncertainties inthe analysis, the photon index of the isotropic component andthe normalization of both components in the background modelwere allowed to vary freely during the spectral point fitting. Inaddition, the model also includes five nearby sources from the1FGL catalog (Abdo et al. 2010): 1FGL J1724.0+4002, 1FGLJ1642.5+3947, 1FGL J1635.0+3808, 1FGL J1734.4+3859, and1FGL J1709.6+4320. The spectra of those sources were also pa-rameterized by power-law functions, whose photon index valueswere fixed to the values from the 1FGL catalogue, and only thenormalization factors for the single sources were left as freeparameters. The spectral analysis was performed with the post-launch instrument-response functions P6_V3_DIFFUSE usingan unbinned maximum likelihood method (Mattox et al. 1996).The Fermi collaboration estimates the current systematic uncer-tainties on the flux as 10% at 0.1 GeV, 5% at 560 MeV, and 20%at 10 GeV and above.61
60 http://fermi.gsfc.nasa.gov/ssc/data/access/lat/BackgroundModels.html61 See http://fermi.gsfc.nasa.gov/ssc/data/analysis/LAT_caveats.html.
Figure 1. Overall time coverage of Mrk 501 by the instruments involved in themultiwavelength campaign. Gaps due to orbital constraints are not indicated inthe Fermi and Suzaku plots.
(A color version of this figure is available in the online journal.)
3. RESULTS
3.1. Light Curves
The time coverage of the data sets used for this campaignis illustrated in Figure 1. Light curves were produced in thepassband of each instrument involved in the campaign tounderstand the flux levels and variability of Mrk 501 duringthese observations; however, the Fermi-LAT detection wasnot significant enough to include a light curve. The resultingmultiwavelength light curves are shown in Figure 2.
Light curves produced from the XIS and HXD/PIN Suzakudata, with 5 ks time bins, are shown in the top two panels ofFigure 2. Individual light curves for each of the XIS detectorswere created and then summed. The best fit of a constant forthe summed XIS (0.6–10.0 keV) light curve is 16.14 counts s−1
with a χ2 value of 4207 for 26 degrees of freedom. The poor fitof a constant to the data corresponds to the moderate variabilitythat is visible by inspection in the XIS count rate. A constantvalue was also fitted to the HXD/PIN light curve, yielding avalue of 0.11 counts s−1 with a χ2 value of 43.7 for 26 degreesof freedom, again indicating variability.
In the VHE γ -ray band, the source appears to be in a “quies-cent” state when compared to contemporaneous long-term stud-ies of the source’s broadband behavior (Abdo et al. 2011; Huanget al. 2009; Pichel et al. 2009). The light curves produced fromthe VERITAS and MAGIC data used 20 minute time bins and areplotted in the bottom panel of Figure 2. To produce light curves,the spectral slope from the corresponding data is assumed (seeSection 3.2), and the effective collection areas were used withthe excess counts to determine the spectral normalization. Anenergy threshold of 300 GeV was then used to calculate theintegral flux for each bin. A constant flux value was fitted to theVERITAS and MAGIC data separately, yielding a best-fitvalue of (2.8 ± 0.5) × 10−11 photons cm−2 s−1 for VERITASand (3.9 ± 0.8) × 10−11 photons cm−2 s−1 for MAGIC. TheVERITAS data show no evidence for any variability, with a χ2
value of 3.6 for seven degrees of freedom for the constant fit.Likewise, the constant fit to the MAGIC data yields a χ2 valueof 3.2 for three degrees of freedom. The individual constant fitsto the VERITAS and MAGIC data differ slightly but show thatthe flux measurements from the two instruments are reasonablycompatible, with no large-scale variability.
5

The Astrophysical Journal, 729:2 (9pp), 2011 March 1 Acciari et al.
Figure 2. Light curves of Mrk 501 in the energy ranges used for Suzaku/XIS(0.6 keV < E < 10.0 keV), Suzaku/HXD (10 keV < E < 70 keV), MAGIC andVERITAS (E > 300 GeV). Error bars show 1σ statistical errors. The constantfits to the Suzaku data are shown. See the discussion in Section 3.1.
(A color version of this figure is available in the online journal.)
3.2. Spectral Analysis and Modeling
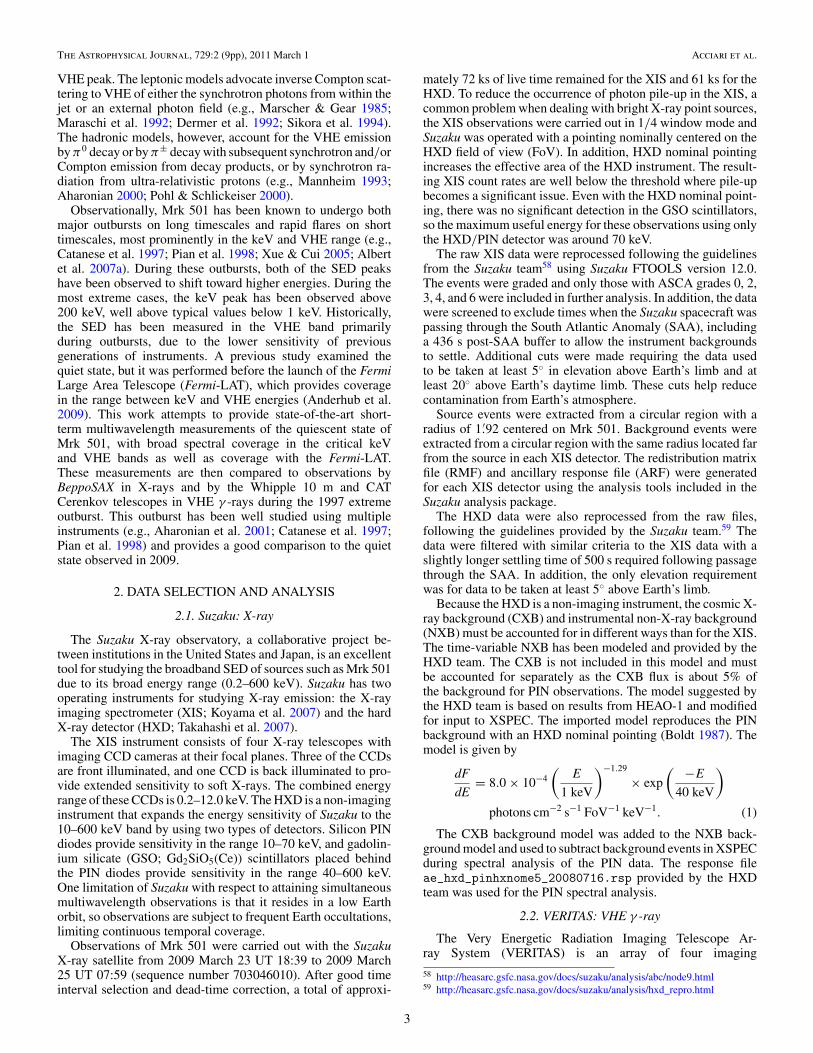
The spectral results for the observations taken during thiscampaign when Mrk 501 was in the quiescent or low-flux stateare shown in Figures 3–5. For comparison, they are also shownin Figure 6 along with archival data from Pian et al. (1998),Catanese et al. (1997), and Djannati-Ataı et al. (1999) takenwhen Mrk 501 was in a high-flux state.
The data from all Suzaku instruments were fitted jointlyin XSPEC 12 (Arnaud 1996). A cross-normalization param-eter was introduced to account for the calibration differencesbetween the individual XIS detectors and the HXD/PIN. Abroken power-law function modified by interstellar absorptionwith a fixed column density NH = 1.73 × 1020 cm−2 (Starket al. 1997) was fitted to the data, yielding power-law indicesΓ1 = 2.133 ± 0.003stat and Γ2 = 2.375 ± 0.009stat, and abreak energy of Ebreak = 3.21 ± 0.07stat keV. After the fit-ting procedure, the cross-normalization factors for the XIS1and XIS3 detectors relative to the XIS0 detector are compatiblewith previous calibration measurements of the Crab Nebula flux(Serlemitsos et al. 2007). A fixed normalization factor of 1.18was introduced between the HXD/PIN and XIS0 as specifiedby the Suzaku team for HXD nominal pointings (Maeda et al.2008). The resulting fit, with χ2/dof = 1.33 for 1511 degreesof freedom, is plotted in Figure 3. After an acceptable fit wasfound, the result was unfolded through the instrument responseand de-absorbed to derive the intrinsic X-ray spectrum shownin Figure 6.
The Fermi-LAT spectral measurement shown in Figures 4and 6 is derived using a time interval of seven days centeredon the Suzaku observing time window—from MJD 54911 up
Figure 3. Observed X-ray spectra of Mrk 501 made from Suzaku XIS and HXD/
PIN data separately. A joint fit to a broken power-law model was performed forthe three XIS CCDs and the HXD/PIN. The solid histogram shows the best fitsto the data (see Section 3.2). The error bars represent 1σ statistical errors. Thebottom panel shows the residuals of the fit.
E [MeV]
210 310 410 510 610
]
−1
s−
2d
N/d
E [
erg
cm
2E
−1210
−1110
−1010
−910
MJD 54911−54918; TS = 46−1 s−2 cm
−8 0.9) x 10±Flux (E>300 MeV) = (1.7
0.3±Photon Index = 1.7
Figure 4. Plot of the Fermi spectral results for the seven days centered onthe Suzaku observing time window (MJD 54911–MJD 54918). The solid linedepicts the result of the unbinned likelihood power-law fit, and the contour showsthe 68% uncertainty of the fit. The data points show the energy fluxes computedin differential energy ranges, with a 95% confidence level upper limit for thehighest energy range. The Fermi analysis was performed in the energy range0.3–400 GeV. The vertical bars show 1σ statistical errors, and the horizontalbars show the energy range for each point.
(A color version of this figure is available in the online journal.)
to MJD 54918. Mrk 501 is detected with a test statistic (TS)value of 46 (∼7σ ). The spectrum can be fitted with a sin-gle power-law function with photon flux F (>0.3 GeV) =(1.7 ± 0.9stat) × 10−8 photons cm−2 s−1 and differential pho-ton spectral index ΓLAT = 1.7 ± 0.3stat. The number of pho-tons (predicted by the model) for the entire spectrum is 12, outof which 9 are in the energy range 0.3–3 GeV, 2 in the en-ergy range 3–30 GeV, and 1 in the energy range 30–300 GeV.In order to increase the simultaneity of the reported SED, wealso performed the analysis of the LAT data over a period of3 days centered at the Suzaku observations, namely the timeinterval from MJD 54913 to MJD 54916. For such a short timeinterval the detection has a TS value of 10 (∼3σ ), and sig-nificantly greater uncertainties in the power-law parameters:F (>0.3 GeV) = (1.8 ± 1.3stat) × 10−8 photons cm−2 s−1,ΓLAT = 1.9 ± 0.5stat. Since the two spectral shapes are com-patible within errors and there is no indication of flux variabilityduring this time, the spectrum derived with the 7 day time inter-val is used in the SED plot in Figures 4 and 6.
6
The Astrophysical Journal, 729:2 (9pp), 2011 March 1 Acciari et al.
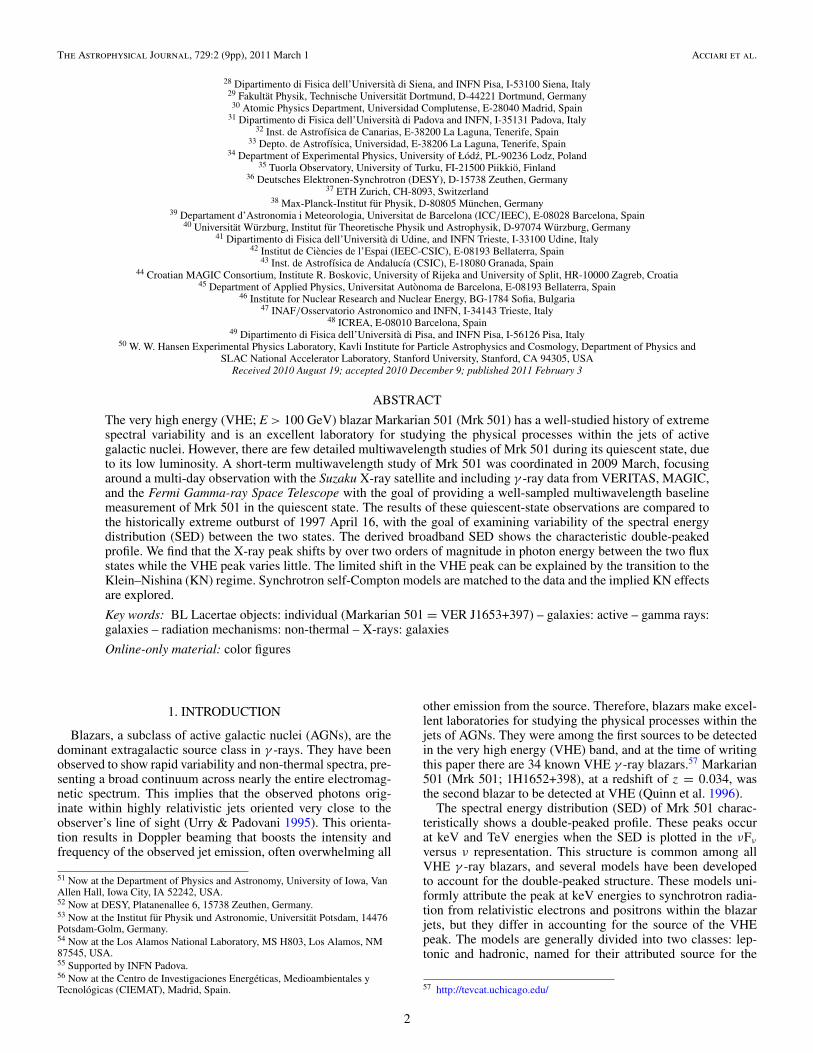
Figure 5. VHE spectrum from VERITAS (diamonds) and MAGIC (triangles),including the best-fit power-law models. The VERITAS fit is shown witha solid line, and the MAGIC fit is shown with a dashed line. The slopesof the power-law models agree well (ΓVERITAS = 2.72 ± 0.15stat ± 0.10sysand ΓMAGIC = 2.67 ± 0.21stat ± 0.20sys). The slight normalization offsetcorresponds to the moderately higher VHE flux levels during the MAGICobservation. The vertical bars show 1σ statistical errors.
For the VERITAS spectral analysis, the spectrum was un-folded using effective collection areas for the array that werecalculated using Monte Carlo simulations of extensive air show-ers passed through the analysis chain with a configuration corre-sponding to the data-taking conditions and the γ /hadron selec-tion cuts. The unfolding process takes into account the energyresolution of the array and potential energy bias. The effectiveareas are then used for each reconstructed event to calculate thedifferential photon flux. The VHE γ -ray differential spectralpoints were fit with a simple power law of the form
dN
dE= F0 × 10−12 ×
(E
1 TeV
)−ΓVHE
photons cm−2 s−1 TeV−1.
(2)
For the VERITAS analysis, best-fit parameters of ΓVHE =2.72 ± 0.15stat ± 0.1sys and F0 = 5.78 ± 0.83stat ± 1.16sys werefound.
For the MAGIC analysis, the derived spectrum was unfoldedto correct for the effects of the energy resolution of the de-tector (Albert et al. 2007b) and of possible bias. Four statis-tically significant spectral bins were obtained. The spectrumis compatible with a simple power-law function with ΓVHE =2.67±0.21stat ±0.20sys and F0 = 8.34±1.53stat ±2.50sys withinthe MAGIC energy range (see Figure 5).
A simple synchrotron self-Compton (SSC) model62 is usedto match the results with an emission scenario (Krawczynskiet al. 2004). This model assumes a spherical emission region ofradius R with the emission Doppler-boosted by the factor
D = [ΓLorentz(1 − β cos θ )]−1 , (3)
where the emission region is moving with Lorentz factor ΓLorentztoward the observer, β gives the bulk velocity of the plasma interms of the speed of light, and θ is the angle between the jetaxis and the line of sight in the observer frame. The emission
62 The SSC code is available athttp://jelley.wustl.edu/multiwave/spectrum/?code.
Figure 6. SEDs of Mrk 501 in the quiescent state (in filled points) and during the1997 extreme outburst (in open points). The former is made from data obtainedin the present campaign with Suzaku (filled circles), Fermi (filled squares),VERITAS (filled diamonds), and MAGIC (filled triangles). The latter was takenfrom Pian et al. (1998) and Djannati-Ataı et al. (1999), with X-ray data fromBeppoSAX (open circles), GeV γ -ray upper limit from EGRET (open square),and VHE γ -ray data from the Whipple 10 m (open diamond), and the CATCerenkov telescope (open triangles). Note that the Whipple 10 m spectral pointoverlaps with the lowest energy CAT spectral point. The vertical bars for all datashow 1σ statistical errors and the upper limits are at the 95% confidence level.Corresponding SED models matched to the data for each year are shown. Thesolid lines show the SSC match; dashed lines take EBL absorption into account.The VHE data points are not EBL corrected.
(A color version of this figure is available in the online journal.)
region contains an isotropic non-thermal electron populationand randomly oriented magnetic field, B. The electron spectrumis assumed to be in the form of a broken power-law function withindex p1 between γmin and γb and index p2 between γb and γmax.The model accounts for γ -ray absorption by the extragalacticbackground light (Franceschini et al. 2008). After computingthe synchrotron and inverse Compton emission, the modelcorrects the photon spectrum that is produced for synchrotron-self-absorption and internal absorption due to pair-productionprocesses. The model does not evolve the electron spectrumself-consistently.
In general, it is difficult to fully constrain the parameters inSSC models. This requires both the flux and energies of thetwo (synchrotron and SSC) peaks to be fully determined byobservations as well as an independent estimate of the Dopplerfactor (Tavecchio et al. 1998). In addition, measurements of thesynchrotron spectrum are used to help determine the indices ofthe modeled electron spectrum (p1 and p2). The SEDs from bothsets of observations presented here constrain the synchrotronand SSC peak locations well (particularly for the low-flux state).In addition, p1 for the 1997 high-flux state and p2 for the 2009low-flux state are well constrained by the data, while the otherelectron spectral indices are not as restricted. The parametersfor the models used in this work for the 1997 high-flux stateand the 2009 low-flux state are given in Table 1 along withmodel parameters from other works for comparison. Some of themodel parameters were matched to previous models as discussedbelow.
4. DISCUSSION
This data set provides a high-quality sampling of the broad-band SED of Mrk 501 in the quiescent state, and it allowscomparisons to be made over a broad energy range with theextreme outburst observed in 1997. In choosing the values for
7
The Astrophysical Journal, 729:2 (9pp), 2011 March 1 Acciari et al.
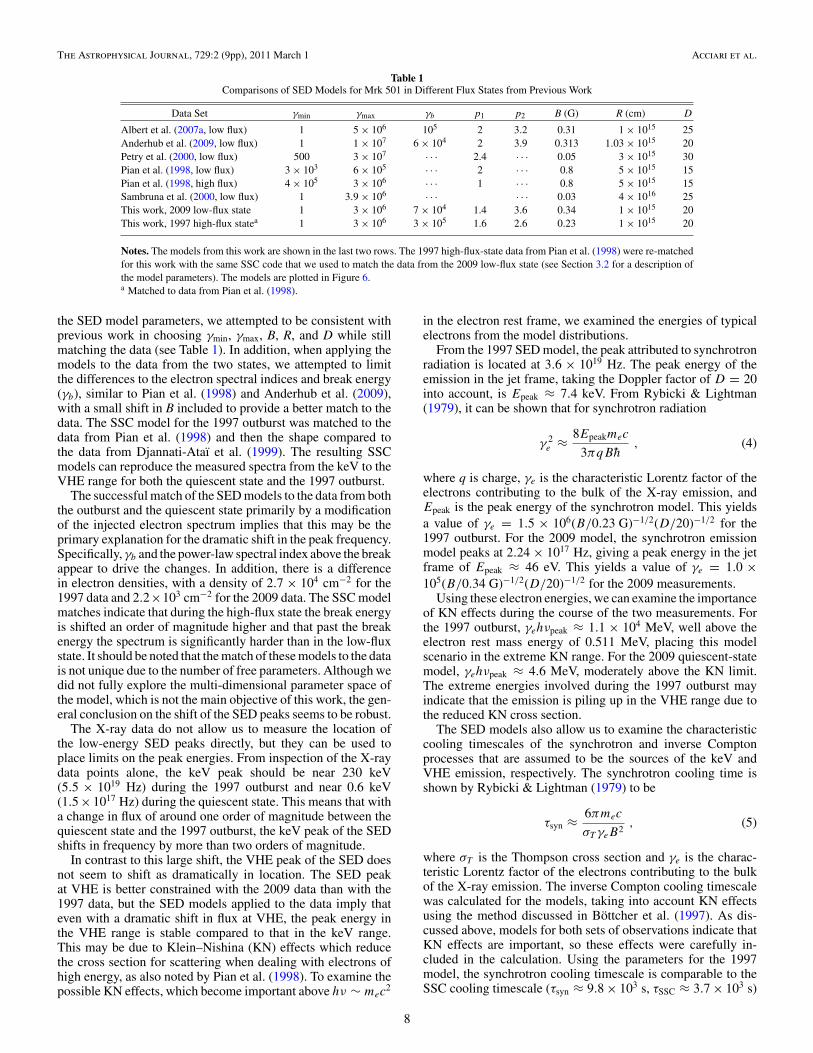
Table 1Comparisons of SED Models for Mrk 501 in Different Flux States from Previous Work
Data Set γmin γmax γb p1 p2 B (G) R (cm) D
Albert et al. (2007a, low flux) 1 5 × 10⁶ 105 2 3.2 0.31 1 × 10¹⁵ 25Anderhub et al. (2009, low flux) 1 1 × 10⁷ 6 × 10⁴ 2 3.9 0.313 1.03 × 10¹⁵ 20Petry et al. (2000, low flux) 500 3 × 10⁷ · · · 2.4 · · · 0.05 3 × 10¹⁵ 30Pian et al. (1998, low flux) 3 × 10³ 6 × 10⁵ · · · 2 · · · 0.8 5 × 10¹⁵ 15Pian et al. (1998, high flux) 4 × 10⁵ 3 × 10⁶ · · · 1 · · · 0.8 5 × 10¹⁵ 15Sambruna et al. (2000, low flux) 1 3.9 × 10⁶ · · · · · · 0.03 4 × 10¹⁶ 25This work, 2009 low-flux state 1 3 × 10⁶ 7 × 10⁴ 1.4 3.6 0.34 1 × 10¹⁵ 20This work, 1997 high-flux statea 1 3 × 10⁶ 3 × 10⁵ 1.6 2.6 0.23 1 × 10¹⁵ 20
Notes. The models from this work are shown in the last two rows. The 1997 high-flux-state data from Pian et al. (1998) were re-matchedfor this work with the same SSC code that we used to match the data from the 2009 low-flux state (see Section 3.2 for a description ofthe model parameters). The models are plotted in Figure 6.a Matched to data from Pian et al. (1998).
the SED model parameters, we attempted to be consistent withprevious work in choosing γmin, γmax, B, R, and D while stillmatching the data (see Table 1). In addition, when applying themodels to the data from the two states, we attempted to limitthe differences to the electron spectral indices and break energy(γb), similar to Pian et al. (1998) and Anderhub et al. (2009),with a small shift in B included to provide a better match to thedata. The SSC model for the 1997 outburst was matched to thedata from Pian et al. (1998) and then the shape compared tothe data from Djannati-Ataı et al. (1999). The resulting SSCmodels can reproduce the measured spectra from the keV to theVHE range for both the quiescent state and the 1997 outburst.
The successful match of the SED models to the data from boththe outburst and the quiescent state primarily by a modificationof the injected electron spectrum implies that this may be theprimary explanation for the dramatic shift in the peak frequency.Specifically, γb and the power-law spectral index above the breakappear to drive the changes. In addition, there is a differencein electron densities, with a density of 2.7 × 104 cm−2 for the1997 data and 2.2×103 cm−2 for the 2009 data. The SSC modelmatches indicate that during the high-flux state the break energyis shifted an order of magnitude higher and that past the breakenergy the spectrum is significantly harder than in the low-fluxstate. It should be noted that the match of these models to the datais not unique due to the number of free parameters. Although wedid not fully explore the multi-dimensional parameter space ofthe model, which is not the main objective of this work, the gen-eral conclusion on the shift of the SED peaks seems to be robust.
The X-ray data do not allow us to measure the location ofthe low-energy SED peaks directly, but they can be used toplace limits on the peak energies. From inspection of the X-raydata points alone, the keV peak should be near 230 keV(5.5 × 10¹⁹ Hz) during the 1997 outburst and near 0.6 keV(1.5 × 10¹⁷ Hz) during the quiescent state. This means that witha change in flux of around one order of magnitude between thequiescent state and the 1997 outburst, the keV peak of the SEDshifts in frequency by more than two orders of magnitude.
In contrast to this large shift, the VHE peak of the SED doesnot seem to shift as dramatically in location. The SED peakat VHE is better constrained with the 2009 data than with the1997 data, but the SED models applied to the data imply thateven with a dramatic shift in flux at VHE, the peak energy inthe VHE range is stable compared to that in the keV range.This may be due to Klein–Nishina (KN) effects which reducethe cross section for scattering when dealing with electrons ofhigh energy, as also noted by Pian et al. (1998). To examine thepossible KN effects, which become important above hν ∼ mec
2
in the electron rest frame, we examined the energies of typicalelectrons from the model distributions.
From the 1997 SED model, the peak attributed to synchrotronradiation is located at 3.6 × 10¹⁹ Hz. The peak energy of theemission in the jet frame, taking the Doppler factor of D = 20into account, is Epeak ≈ 7.4 keV. From Rybicki & Lightman(1979), it can be shown that for synchrotron radiation
γ 2e ≈ 8Epeakmec
3πqBh, (4)
where q is charge, γe is the characteristic Lorentz factor of theelectrons contributing to the bulk of the X-ray emission, andEpeak is the peak energy of the synchrotron model. This yieldsa value of γe = 1.5 × 10⁶(B/0.23 G)−1/2(D/20)−1/2 for the1997 outburst. For the 2009 model, the synchrotron emissionmodel peaks at 2.24 × 10¹⁷ Hz, giving a peak energy in the jetframe of Epeak ≈ 46 eV. This yields a value of γe = 1.0 ×10⁵(B/0.34 G)−1/2(D/20)−1/2 for the 2009 measurements.
Using these electron energies, we can examine the importanceof KN effects during the course of the two measurements. Forthe 1997 outburst, γehνpeak ≈ 1.1 × 10⁴ MeV, well above theelectron rest mass energy of 0.511 MeV, placing this modelscenario in the extreme KN range. For the 2009 quiescent-statemodel, γehνpeak ≈ 4.6 MeV, moderately above the KN limit.The extreme energies involved during the 1997 outburst mayindicate that the emission is piling up in the VHE range due tothe reduced KN cross section.
The SED models also allow us to examine the characteristiccooling timescales of the synchrotron and inverse Comptonprocesses that are assumed to be the sources of the keV andVHE emission, respectively. The synchrotron cooling time isshown by Rybicki & Lightman (1979) to be
τsyn ≈ 6πmec
σT γeB2, (5)
where σT is the Thompson cross section and γe is the charac-teristic Lorentz factor of the electrons contributing to the bulkof the X-ray emission. The inverse Compton cooling timescalewas calculated for the models, taking into account KN effectsusing the method discussed in Bottcher et al. (1997). As dis-cussed above, models for both sets of observations indicate thatKN effects are important, so these effects were carefully in-cluded in the calculation. Using the parameters for the 1997model, the synchrotron cooling timescale is comparable to theSSC cooling timescale (τsyn ≈ 9.8 × 10³ s, τSSC ≈ 3.7 × 10³ s)
8

The Astrophysical Journal, 729:2 (9pp), 2011 March 1 Acciari et al.
for electrons with γe = 1.5 × 10⁶(B/0.23 G)−1/2(D/20)−1/2.However, for the quiescent-state model from 2009, the timescalefor inverse Compton cooling is two orders of magnitude shorterthan the synchrotron cooling timescale (τsyn ≈ 6.7 × 10⁴ s,τSSC ≈ 4.6 × 10² s) for electrons with γe = 1.0 ×10⁵(B/0.34 G)−1/2(D/20)−1/2, indicating that in this modelscenario, radiative cooling is dominated by the SSC processfor the values of γe calculated above. This seems to indicatethat the SSC peak energy is determined by the transition intothe KN regime rather than the maximum or peak electron ener-gies. Beyond this transition energy, the ratio of inverse Comp-ton to synchrotron cooling timescales should decrease dramat-ically. An estimate for the KN transition can be found usingthe peak of the synchrotron spectrum. For example, from the2009 data, this peak resides at 46 eV in the jet frame. Thiscorresponds to a value of ε′ = E′/(mec
2) = 9 × 10⁻⁵. Thetransition to the KN regime is then at the observed energy ofEKN ∼ mec
2D(1/ε′) ∼ 110 GeV, very near the observed SSCpeak. In addition, all of the timescales calculated were com-parable to or less than the light-crossing time for the modeledemission regions, indicating that light travel time effects maydominate the light curve profiles.
Further intense multiwavelength observations of the source,in conjunction with long-term monitoring campaigns, willcontinue to be important to understand the broadband behaviorof Mrk 501 and to shed light on the blazar phenomenon ingeneral.
We thank Elena Pian for providing the BeppoSAX data.This work was supported in part by NASA through grantsNNX08AZ98G and NNX08AX53G. This research has madeuse of data obtained from the Suzaku satellite, a collaborativemission between the space agencies of Japan (JAXA) and USA(NASA). The VERITAS research is supported by grants fromthe U.S. Department of Energy, the U.S. National ScienceFoundation, and the Smithsonian Institution, by NSERC inCanada, by Science Foundation Ireland, and by STFC in theUK. We acknowledge the excellent work of the technicalsupport staff at the Fred Lawrence Whipple Observatory andthe collaborating institutions in the construction and operationof the instrument.
The Fermi-LAT Collaboration acknowledges generous ongo-ing support from a number of agencies and institutes that havesupported both the development and the operation of the LATas well as scientific data analysis. These include the NationalAeronautics and Space Administration and the Department ofEnergy in the United States, the Commissariat a l’EnergieAtomique and the Centre National de la Recherche Scientifique/Institut National de Physique Nucleaire et de Physique des Par-ticules in France, the Agenzia Spaziale Italiana and the IstitutoNazionale di Fisica Nucleare in Italy, the Ministry of Educa-tion, Culture, Sports, Science, and Technology (MEXT), HighEnergy Accelerator Research Organization (KEK) and JapanAerospace Exploration Agency (JAXA) in Japan, and the K. A.Wallenberg Foundation, the Swedish Research Council, and theSwedish National Space Board in Sweden. Additional supportfor science analysis during the operations phase is gratefullyacknowledged from the Istituto Nazionale di Astrofisica in Italyand the Centre National d’Etudes Spatiales in France.
The MAGIC Collaboration thanks the Instituto de Astrofısicade Canarias for the excellent working conditions at the Obser-vatorio del Roque de los Muchachos in La Palma. The sup-port of the German BMBF and MPG, the Italian INFN, the
Swiss National Fund SNF, and the Spanish MICINN is grate-fully acknowledged. This work was also supported by the MarieCurie program, by the CPAN CSD2007-00042 and MultiDarkCSD2009-00064 projects of the Spanish Consolider-Ingenio2010 program, by grant DO02-353 of the Bulgarian NSF, bygrant 127740 of the Academy of Finland, by the YIP of theHelmholtz Gemeinschaft, by the DFG Cluster of Excellence“Origin and Structure of the Universe,” and by the PolishMNiSzW Grant N N203 390834.
REFERENCES
Abdo, A. A., et al. 2010, ApJS, 188, 405Abdo, A. A., et al. 2011, ApJ, 727, 129Acciari, V. A., et al. (VERITAS Collaboration) 2008, ApJ, 679, 1427Aharonian, F. A. 2000, New Astron., 5, 377Aharonian, F. A., et al. 2001, A&A, 366, 62Albert, J., et al. (MAGIC Collaboration) 2007a, ApJ, 669, 862Albert, J., et al. (MAGIC Collaboration) 2007b, Nucl. Instrum. Methods, A583,
494Albert, J., et al. (MAGIC Collaboration) 2008a, ApJ, 674, 1037Albert, J., et al. (MAGIC Collaboration) 2008b, Nucl. Instrum. Methods, A588,
424Aliu, E., et al. (MAGIC Collaboration) 2009, Astropart. Phys., 30, 293Anderhub, H., et al. (MAGIC Collaboration) 2009, ApJ, 705, 1624Arnaud, K. A. 1996, in ASP Conf. Ser. 101, Astronomical Data Analysis
Software and Systems V, ed. G. Jacoby & J. Barnes (San Francisco, CA:ASP), 17
Atwood, W. B., et al. 2009, ApJ, 697, 1071Berge, D., Funk, S., & Hinton, J. 2007, A&A, 466, 1219Boldt, E. 1987, in IAU Symp. 124, Observational Cosmology (Dordrecht:
Reidel), 611BBottcher, M., Mause, H., & Schlickeiser, R. 1997, A&A, 324, 395Catanese, M., et al. 1997, ApJ, 487, L143Cogan, P., et al. 2007, Proc. 30th ICRC (Merida), 3, 1385Daum, A., et al. (HEGRA Collaboration) 1997, Astropart. Phys., 8, 1Dermer, C. D., Schlickeiser, R., & Mastichiadis, A. 1992, A&A, 256,
L27Djannati-Ataı, A., et al. 1999, A&A, 350, 17Fomin, V. P., Stepanian, A. A., Lamb, R. C., Lewis, D. A., Punch, M., & Weekes,
T. C. 1994, Astropart. Phys., 2, 137Franceschini, A., Rodighiero, G., & Vaccari, M. 2008, A&A, 487, 837Hillas, A. M. 1985, Proc. 19th ICRC (La Jolla), 3, 445 (available at:
http://catalog.hathitrust.org/Record/006239301)Holder, J., et al. (VERITAS Collaboration) 2008, in AIP Conf. Proc. 1085,
High Energy Gamma-Ray Astronomy, ed. F. A. Aharonian, W. Hofmann, &F. Rieger (Melville, NY: AIP), 657
Huang, D., et al. (VERITAS Collaboration) 2009, in 2009 Fermi Symp., ed.W. N. Johnson & D. J. Thompson, eConf C0911022 (arXiv:0912.3772)
Koyama, K., et al. 2007, PASJ, 59, S23Krawczynski, H., et al. 2004, ApJ, 601, 151Li, T., & Ma, Y. 1983, ApJ, 272, 317Maeda, Y., et al. 2008, JX-ISAS-SUZAKU-MEMO-2008-06, ftp://legacy.gsfc.
nasa.gov/suzaku/doc/xrt/suzakumemo-2008-06.pdfMannheim, K. 1993, A&A, 269, 67Maraschi, L., Ghisellini, G., & Celotti, A. 1992, ApJ, 397, L5Marscher, A. P., & Gear, W. K. 1985, ApJ, 298, 114Mattox, J. R., et al. 1996, ApJ, 461, 396Petry, D., et al. 2000, ApJ, 536, 742Pian, E., et al. 1998, ApJ, 492, L17Pichel, A., et al. (VERITAS Collaboration) 2009, Proc. 31st ICRC (Lodz),
arXiv:0908.0010Pohl, M., & Schlickeiser, R. 2000, A&A, 354, 395Quinn, J., et al. 1996, ApJ, 456, L83Rybicki, G. B., & Lightman, A. P. 1979, Radiative Processes in Astrophysics
(New York: Wiley)Sambruna, R. M., et al. 2000, ApJ, 538, 127Serlemitsos, P. J., et al. 2007, PASJ, 59, 9Sikora, M., Begelman, M. C., & Rees, M. J. 1994, ApJ, 421, 153Stark, A. A., Gammie, C. F., Wilson, R. W., Bally, J., Linke, R. A., Heiles, C.,
& Hurwitz, M. 1992, ApJS, 79, 77Takahashi, T., et al. 2007, PASJ, 59, 35Tavecchio, F., Maraschi, L., & Ghisellini, G. 1998, ApJ, 509, 608Urry, C. M., & Padovani, P. 1995, PASP, 107, 803Xue, Y., & Cui, W. 2005, ApJ, 622, 160
9
Copyright © 2022 FDOKUMEN