The dependence of luminous efficiency on chromatic adaptation
Upload
khangminh22Category
view
3download
0
LATE TIME MULTI-WAVELENGTH OBSERVATIONS OF SWIFT J1644+5734:A LUMINOUS OPTICAL/IR BUMP AND QUIESCENT X-RAY EMISSION
A. J. Levan1, N. R. Tanvir
2, G. C. Brown
1, B. D. Metzger
3, K. L. Page
2, S. B. Cenko
4,5, P. T. O’Brien
2, J. D. Lyman
1,
K. Wiersema2, E. R. Stanway
1, A. S. Fruchter
6, D. A. Perley
7,8, and J. S. Bloom
9
1 Department of Physics, University of Warwick, Coventry, CV4 7AL, UK; [email protected] Department of Physics and Astronomy, University of Leicester, Leicester, LE1 7RH, UK
3 Columbia Astrophysics Laboratory, New York, NY 10027, USA4 Astrophysics Science Division, NASA Goddard Space Flight Center, Mail Code 661, Greenbelt, MD 20771, USA
5 Joint Space-Science Institute, University of Maryland, College Park, MD 20742, USA6 Space Telescope Science Institute, 3700 San Martin Drive, Baltimore, MD 21218, USA
7 Department of Astronomy, California Institute of Technology, MC 249-17, 1200 East California Boulevard, Pasadena, CA 91125, USA8 Dark Cosmology Centre, Niels Bohr Institute, DK-2100 Copenhagen, Denmark 0000-0002-4571-2306
9 Astronomy Department, University of California, Berkeley, CA 94720-7450, USAReceived 2015 September 28; accepted 2015 December 23; published 2016 February 26
ABSTRACT
We present late time multi-wavelength observations of Swift J1644+57, suggested to be a relativistic tidaldisruption flare (TDF). Our observations extend to>4 years from discovery and show that 1.4 years after outburstthe relativistic jet switched off on a timescale less than tens of days, corresponding to a power-law decay faster thant−70. Beyond this point weak X-rays continue to be detected at an approximately constant luminosity ofLX∼5×1042 erg s−1 and are marginally inconsistent with a continuing decay of t−5/3, similar to that seen priorto the switch-off. Host photometry enables us to infer a black hole mass of MBH= 3×10⁶Me, consistent with thelate time X-ray luminosity arising from sub-Eddington accretion onto the black hole in the form of either anunusually optically faint active galactic nucleus or a slowly varying phase of the transient. Optical/IR observationsshow a clear bump in the light curve at timescales of 30–50 days, with a peak magnitude (corrected for host galaxyextinction) of MR∼−22 to −23. The luminosity of the bump is significantly higher than seen in other, non-relativistic TDFs and does not match any re-brightening seen at X-ray or radio wavelengths. Its luminosity, lightcurve shape, and spectrum are broadly similar to those seen in superluminous supervnovae, although subject tolarge uncertainties in the correction of the significant host extinction. We discuss these observations in the contextof both TDF and massive star origins for Swift J1644+5734 and other candidate relativistic tidal flares.
Key words: galaxies: active – galaxies: jets – supernovae: general
1. INTRODUCTION
Recent years have seen the discovery of new populations ofextremely long duration γ-ray transients, visible for hours todays compared to seconds or minutes, for the well studiedpopulations of gamma-ray bursts (GRBs; e.g., Burrowset al. 2011; Levan et al. 2011, 2014; Gendre et al. 2013).These events stretch plausible progenitor models for normalGRBs that arise from stellar core collapse and in particular, thelongest events have been well explained by the tidal disruptionof stars by supermassive black holes, accompanied by amoderately relativistic outflow, creating a γ-ray transient whenviewed down the jet (Bloom et al. 2011b; Burrows et al. 2011;Zauderer et al. 2011).
Tidal disruption flares (TDFs) occur when a star strayssufficiently close to a massive black hole that the tidal forcefrom the hole exceeds the star’s self-gravity. At this point thestar may be partly or completely disrupted depending on thepericenter separation and structure of the star itself. Roughlyhalf of the disrupted material is expelled, while the remainingbound material is placed on eccentric orbits but eventuallyreturns to form an accretion disk around the black hole,powering a luminous electromagnetic transient, with a black-body spectrum expected to peak in the EUV or soft X-rayregime (e.g., Rees 1988). This process effectively creates atransient active nucleus, which, unlike most active galacticnuclei (AGNs), moves from a quiescent accretion phase
through a super-Eddington one and back to quiescence on atimescale of years.The detection of a TDF provides both a window on accretion
physics and a signal of the presence of a supermassive blackhole in an otherwise inactive galaxy. This is particularlyvaluable for low-mass galaxies where direct confirmation ofmassive black holes has proved challenging. While somemassive black holes have been identified within dwarf galaxies(e.g., Reines et al. 2011, 2014) their interpretation remainsuncertain: some lie apparently well off the bulge mass—blackhole mass relation (e.g., Seth et al. 2014), and it is unclear ifthese rare examples are representative of other dwarfs (whereno activity can be found) or result from unusual interactionssuch as the tidal stripping of more massive galaxies (Reines2014; Seth et al. 2014). TDFs can occur, in principle, around alllow-mass black holes, while they will be observationallyinvisible for the most massive systems MBH>108Me wherethe tidal radius for a main-sequence star lies within theSchwarzschild radius of the black hole. Thus they provide aparticularly powerful probe of the low-mass end of the nuclearblack hole population (e.g., Metzger & Stone 2015), potentiallyextending down to the scale of intermediate mass black holeswithin globular clusters (e.g., Ramirez-Ruiz & Rosswog 2009;MacLeod et al. 2015a, 2015b), and offer important constraintson models of galaxy formation and evolution.However, TDFs themselves are challenging to locate and
identify. They are much rarer than supernovae; they reside in
The Astrophysical Journal, 819:51 (15pp), 2016 March 1 doi:10.3847/0004-637X/819/1/51© 2016. The American Astronomical Society. All rights reserved.
1
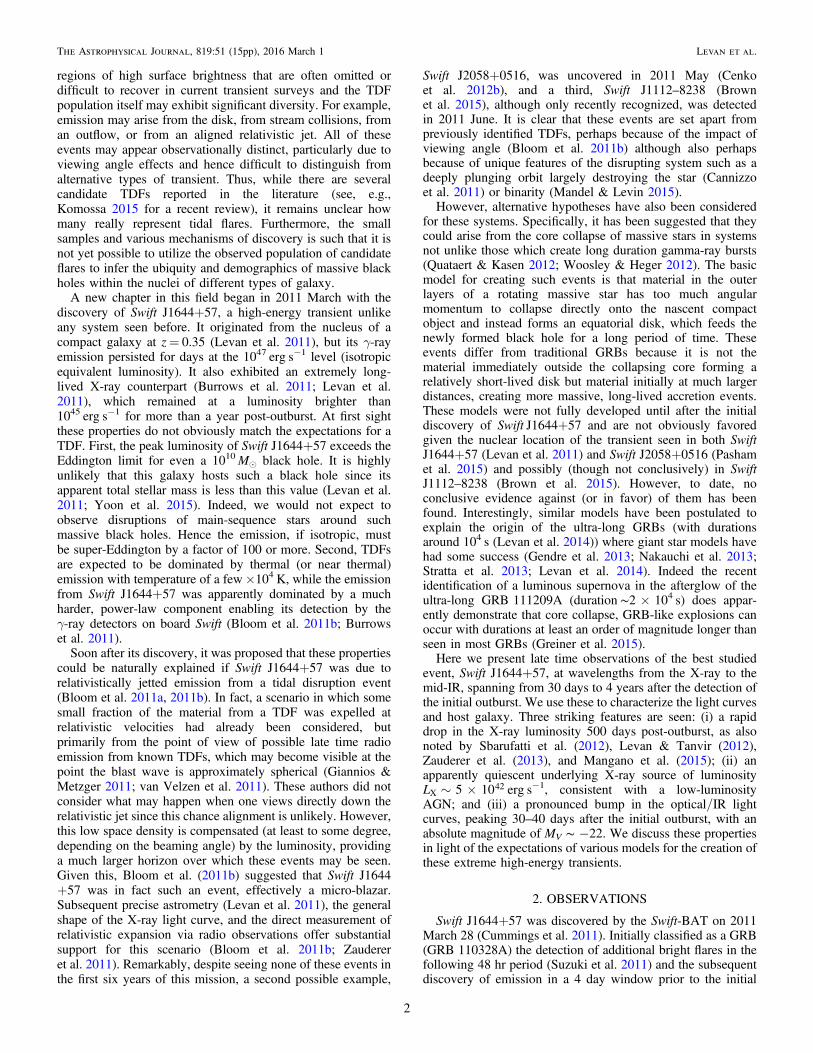
regions of high surface brightness that are often omitted ordifficult to recover in current transient surveys and the TDFpopulation itself may exhibit significant diversity. For example,emission may arise from the disk, from stream collisions, froman outflow, or from an aligned relativistic jet. All of theseevents may appear observationally distinct, particularly due toviewing angle effects and hence difficult to distinguish fromalternative types of transient. Thus, while there are severalcandidate TDFs reported in the literature (see, e.g.,Komossa 2015 for a recent review), it remains unclear howmany really represent tidal flares. Furthermore, the smallsamples and various mechanisms of discovery is such that it isnot yet possible to utilize the observed population of candidateflares to infer the ubiquity and demographics of massive blackholes within the nuclei of different types of galaxy.
A new chapter in this field began in 2011 March with thediscovery of Swift J1644+57, a high-energy transient unlikeany system seen before. It originated from the nucleus of acompact galaxy at z= 0.35 (Levan et al. 2011), but its γ-rayemission persisted for days at the 1047 erg s−1 level (isotropicequivalent luminosity). It also exhibited an extremely long-lived X-ray counterpart (Burrows et al. 2011; Levan et al.2011), which remained at a luminosity brighter than1045 erg s−1 for more than a year post-outburst. At first sightthese properties do not obviously match the expectations for aTDF. First, the peak luminosity of Swift J1644+57 exceeds theEddington limit for even a 1010Me black hole. It is highlyunlikely that this galaxy hosts such a black hole since itsapparent total stellar mass is less than this value (Levan et al.2011; Yoon et al. 2015). Indeed, we would not expect toobserve disruptions of main-sequence stars around suchmassive black holes. Hence the emission, if isotropic, mustbe super-Eddington by a factor of 100 or more. Second, TDFsare expected to be dominated by thermal (or near thermal)emission with temperature of a few×104 K, while the emissionfrom Swift J1644+57 was apparently dominated by a muchharder, power-law component enabling its detection by theγ-ray detectors on board Swift (Bloom et al. 2011b; Burrowset al. 2011).
Soon after its discovery, it was proposed that these propertiescould be naturally explained if Swift J1644+57 was due torelativistically jetted emission from a tidal disruption event(Bloom et al. 2011a, 2011b). In fact, a scenario in which somesmall fraction of the material from a TDF was expelled atrelativistic velocities had already been considered, butprimarily from the point of view of possible late time radioemission from known TDFs, which may become visible at thepoint the blast wave is approximately spherical (Giannios &Metzger 2011; van Velzen et al. 2011). These authors did notconsider what may happen when one views directly down therelativistic jet since this chance alignment is unlikely. However,this low space density is compensated (at least to some degree,depending on the beaming angle) by the luminosity, providinga much larger horizon over which these events may be seen.Given this, Bloom et al. (2011b) suggested that Swift J1644+57 was in fact such an event, effectively a micro-blazar.Subsequent precise astrometry (Levan et al. 2011), the generalshape of the X-ray light curve, and the direct measurement ofrelativistic expansion via radio observations offer substantialsupport for this scenario (Bloom et al. 2011b; Zaudereret al. 2011). Remarkably, despite seeing none of these events inthe first six years of this mission, a second possible example,
Swift J2058+0516, was uncovered in 2011 May (Cenkoet al. 2012b), and a third, Swift J1112–8238 (Brownet al. 2015), although only recently recognized, was detectedin 2011 June. It is clear that these events are set apart frompreviously identified TDFs, perhaps because of the impact ofviewing angle (Bloom et al. 2011b) although also perhapsbecause of unique features of the disrupting system such as adeeply plunging orbit largely destroying the star (Cannizzoet al. 2011) or binarity (Mandel & Levin 2015).However, alternative hypotheses have also been considered
for these systems. Specifically, it has been suggested that theycould arise from the core collapse of massive stars in systemsnot unlike those which create long duration gamma-ray bursts(Quataert & Kasen 2012; Woosley & Heger 2012). The basicmodel for creating such events is that material in the outerlayers of a rotating massive star has too much angularmomentum to collapse directly onto the nascent compactobject and instead forms an equatorial disk, which feeds thenewly formed black hole for a long period of time. Theseevents differ from traditional GRBs because it is not thematerial immediately outside the collapsing core forming arelatively short-lived disk but material initially at much largerdistances, creating more massive, long-lived accretion events.These models were not fully developed until after the initialdiscovery of Swift J1644+57 and are not obviously favoredgiven the nuclear location of the transient seen in both SwiftJ1644+57 (Levan et al. 2011) and Swift J2058+0516 (Pashamet al. 2015) and possibly (though not conclusively) in SwiftJ1112–8238 (Brown et al. 2015). However, to date, noconclusive evidence against (or in favor) of them has beenfound. Interestingly, similar models have been postulated toexplain the origin of the ultra-long GRBs (with durationsaround 104 s (Levan et al. 2014)) where giant star models havehad some success (Gendre et al. 2013; Nakauchi et al. 2013;Stratta et al. 2013; Levan et al. 2014). Indeed the recentidentification of a luminous supernova in the afterglow of theultra-long GRB111209A (duration∼2×10⁴ s) does appar-ently demonstrate that core collapse, GRB-like explosions canoccur with durations at least an order of magnitude longer thanseen in most GRBs (Greiner et al. 2015).Here we present late time observations of the best studied
event, Swift J1644+57, at wavelengths from the X-ray to themid-IR, spanning from 30 days to 4 years after the detection ofthe initial outburst. We use these to characterize the light curvesand host galaxy. Three striking features are seen: (i) a rapiddrop in the X-ray luminosity 500 days post-outburst, as alsonoted by Sbarufatti et al. (2012), Levan & Tanvir (2012),Zauderer et al. (2013), and Mangano et al. (2015); (ii) anapparently quiescent underlying X-ray source of luminosityL 5 10X
42~ ´ erg s−1, consistent with a low-luminosityAGN; and (iii) a pronounced bump in the optical/IR lightcurves, peaking 30–40 days after the initial outburst, with anabsolute magnitude of MV∼−22. We discuss these propertiesin light of the expectations of various models for the creation ofthese extreme high-energy transients.
2. OBSERVATIONS
Swift J1644+57 was discovered by the Swift-BAT on 2011March 28 (Cummings et al. 2011). Initially classified as a GRB(GRB 110328A) the detection of additional bright flares in thefollowing 48 hr period (Suzuki et al. 2011) and the subsequentdiscovery of emission in a 4 day window prior to the initial
2
The Astrophysical Journal, 819:51 (15pp), 2016 March 1 Levan et al.

detection (Krimm & Barthelmy 2011) marked it as havingexceptionally long γ-ray emission, persisting for several days(see also Levan et al. 2014). Indeed, a possible detection at>3σ significance was present in a single day integration>1month before the main trigger (Krimm & Barthelmy 2011).While possibly a chance noise fluctuation, it is interestinglyclose to the time of the first trigger so earlier activity cannot bediscounted. Although initially suggested to be a Galactic X-raytransient (Kennea et al. 2011), a redshift of a persistent opticalsource underlying the X-ray location revealed a redshift ofz= 0.354 (Levan et al. 2011) and subsequent monitoringlocated X-ray, infrared, and radio emission consistent with thenucleus of this galaxy. The early observations have beendescribed in detail (Bloom et al. 2011b; Burrows et al. 2011;Levan et al. 2011; Zauderer et al. 2011) and the source hascontinued to be monitored by the Swift-XRT. The late timeradio afterglow has also received significant monitoring(Berger et al. 2012; Zauderer et al. 2013). Below we reportthe results of ongoing late time optical/IR and X-raymonitoring from both the ground and space.
2.1. Further Infrared and Optical Imaging
We have continued to monitor Swift J1644+57 in the IRfrom the United Kingdom Infrared Telescope (UKIRT) andGemini-North. A log of our new photometric observations isshown in Table 1. The UKIRT images were obtained with theWide Field Camera (WFCAM) and reduced through thestandard CASU pipeline. The data were retrieved in calibratedform from the WFCAM science archive.10 The Gemini-Northimages were reduced using the standard Gemini IRAF package.Photometric calibration was performed relative to several2MASS stars, with the zeropoint tied to the star atR.A.= 16:44:50.96, decl.=+57:35:31.6 (J= 13.121,H= 12.798, K= 12.727) as in Levan et al. (2011) such thatthe photometric observations should be directly comparablebetween earlier work and this one.
We also include in our analysis other published IRphotometry from Burrows et al. (2011). Observations taken
at similar times provide reasonable agreement with ourmeasured photometry within ∼0.1–0.2 mag and hence shouldbe on a comparable scale. There is no apparent systematicoffset that could be applied to reduce this scatter significantly,and so it is likely that the differences in measurements reflect acombination of measurement error (often significant at latertimes) and true variation within the source (often significant atearlier times).
2.2. HST and Spitzer Observations
We have also obtained further observations of Swift J1644+57 with the Hubble Space Telescope (HST). These observa-tions were obtained in the F606W and F160W bands using theWFC3 camera with both UVIS and IR channels, matching theearlier data presented in Levan et al. (2011). The images wereretrieved from the archive after standard post-processing. TheUVIS observations were corrected for pixel-dependent CTEutilizing the method of Anderson (2014). The images were thendrizzled (Fruchter & Hook 2002) onto a common frame,utilizing a pixel scale of 0.025 arcsec pixel−1 for F606W and0.07 arcsec pixel−1 for F160W. The first and last epochs, aswell as a subtraction, are shown in Figure 1. To obtainmagnitudes of the counterpart only the final epoch of HSTobservations was subtracted from the earlier data and theresulting residual measured. The photometry is shown inTable 2, where both transient fluxes and combined host plustransient magnitudes are listed. To avoid including additionalsky noise, which may impair the estimation of transientcontributions, the combined magnitudes were measured in anaperture of radius 15 pixels for F160W (1 05) and correctedassuming a pointlike aperture correction. In practice thisunderestimates the true host galaxy magnitude, and so the hostgalaxy magnitude itself is calculated based on the Sérsic profilefit to the host galaxy, yielding a magnitude approximately0.2 mag brighter. The resulting magnitudes for the host galaxyare comparable to those obtained by Yoon et al. (2015) from anindependent analysis of our data. The relatively bright pointsources in subtractions were measured in small apertures(2× FWHM), and aperture corrected, while due to possiblegalaxy residuals we measured the F606W subtractions in
Table 1Ground-based Photometric Observations of Swift J1644+57
Date-obs MJD-obs ΔT Telescope Band Exptime Mag(days) (s) (host+OT)
2011 Aug 02 55775.26 126.73 UKIRT/WFCAM K 1800 20.72±0.072011 Aug 02 55775.26 126.76 UKIRT/WFCAM J 2160 21.52±0.032011 Oct 07 55841.24 192.70 UKIRT/WFCAM K 2160 20.53±0.172011 Oct 09 55843.20 194.66 UKIRT/WFCAM K 2160 20.94±0.082011 Oct 09 55843.24 194.70 UKIRT/WFCAM J 2160 21.84±0.232011 Oct 10 55844.20 195.66 UKIRT/WFCAM H 2160 21.57±0.202012 Mar 13 55999.64 351.10 Gemini/GMOS r 900 22.49±0.022012 Mar 13 55999.66 351.12 Gemini/GMOS z 900 21.94±0.022012 May 02 56049.45 400.91 Gemini/NIRI K 1560 21.42±0.042012 May 02 56049.47 400.93 Gemini/NIRI H 1560 21.83±0.092012 May 02 56049.49 400.95 Gemini/NIRI J 1560 21.99±0.112012 Jun 30 56108.39 459.85 Gemini/NIRI J 2280 21.90±0.062012 Jun 30 56108.43 459.89 Gemini/NIRI H 1560 21.63±0.042012 Jun 30 56108.46 459.92 Gemini/NIRI K 2040 21.30±0.052012 Oct 11 56211.20 592.66 UKIRT/WFCAM K 1800 21.22±0.12
Note. Magnitudes are not host subtracted. This table supplements the photometry given in Levan et al. (2011).
10 http://wsa.roe.ac.uk/
3
The Astrophysical Journal, 819:51 (15pp), 2016 March 1 Levan et al.

apertures of 0 4. We note that as expected the choice ofaperture size has little impact on our final photometry.
A clear residual is seen in both bands. In fact, this is the firstdetection of transient optical emission in the r-band, previous
detections having only been possible in the z band andlongwards (Levan et al. 2011), likely due to the strongextinction within the host galaxy. Interestingly, the optical lightappears to rise between the first two epochs (6.6 and 23 days
Figure 1. Early to late time space-based observations of Swift J1644+57 with HST and Spitzer. At early times the NIR and mid-IR are dominated by afterglowemission, while in the optical the host dominates at all epochs, although a weak transient can be seen in our F606W observations.
Table 2Late-time Space-based Optical/IR/MIR Observations of Swift J1644+57
Date-obs MJD-obs ΔT Telescope Band Exptime Transient Flux Mag(days) (s) (μJy) (Host+OT)
2011 Apr 04 55655.13 6.59 HST F160W 997 10.47±0.04 20.76±0.012011 Apr 04 55655.14 6.60 HST F606W 1260 0.129±0.023 22.82±0.032011 Apr 20 55671.56 23.02 HST F160W 997 9.545±0.04 20.83±0.012011 Apr 20 55671.57 23.03 HST F606W 1260 0.185±0.021 22.76±0.042011 Aug 04 55777.26 128.72 HST F160W 1412 3.39±0.04 21.29±0.012011 Aug 04 55777.27 128.73 HST F606W 4160 0.09±0.015 22.89±0.022011 Dec 02 55897.70 249.16 HST F160W 1209 3.13±0.03 21.35±0.012011 Dec 02 55897.68 249.14 HST F606W 1113 0.004±0.020 22.92±0.052013 Apr 12 56394.30 745.76 HST F160W 2812 K 21.73±0.012013 Apr 12 56394.44 745.90 HST F606W 2600 K 22.93±0.032011 Apr 28 55679.98 31.44 Spitzer 3.6 480 58.00±1.76 19.39±0.022011 Apr 28 55679.98 31.44 Spitzer 4.5 480 72.96±1.75 19.18±0.022011 Oct 31 55865.02 216.48 Spitzer 3.6 480 4.02±1.86 21.30±0.122011 Oct 31 55865.02 216.48 Spitzer 4.5 480 6.95±1.55 21.10±0.102012 Feb 24 55981.54 333.00 Spitzer 3.6 480 3.31±1.68 21.37±0.092012 Feb 24 55981.54 333.00 Spitzer 4.5 480 3.63±1.35 21.41±0.082014 Mar 13 56729.03 1080.49 Spitzer 3.6 480 K 21.77±0.272014 Mar 13 56729.03 1080.49 Spitzer 4.5 480 K 21.88±0.24
Note. Log of late time observations of Swift J1644+57 obtained with the Hubble Space Telescope and the Spitzer Space Telescope. Photometry is listed with andwithout host subtraction.
4
The Astrophysical Journal, 819:51 (15pp), 2016 March 1 Levan et al.

post-outburst) during which time the IR appears to show adecline. This is puzzling if both the optical and IR are arisingfrom the same component and is discussed further below.
We can determine the location of the transient within thehost galaxy by comparing the centroid in the subtracted frameswith the center of the host galaxy in late epoch images, utilizingcompact sources in the field for astrometric purposes. This isbest done in the IR since the signal to noise for the transient ismuch higher, does not risk any systematic shift due to poorersubtraction of the host galaxy light, and minimizes the risk ofmis-identifying the centroid due to differential extinctionwithin the host galaxy. We compared our first and last epoch,using eight sources in common between the two frames foralignment. As the first and last images were taken at the sameorientation we can utilize a direct shift between the two ratherthan more complex fits (which may underestimate the errors forthe small number of sources considered). This yields an offsetof (0.010± 0.012)″, equivalent to a spatial offset of <60 pcfrom the centroid of the galaxy. Although it has limitations thisapproach can also be used in the F606W observations, whichyields an offset of (0.033± 0.010)″. This is formally incon-sistent with the nucleus at the 3σ level, but may be due to acombination of the effects described above. However, thistechnique is based on utilizing compact sources (predominantlystars) in the field of view and so proper motion can be asignificant factor. A new technique, employing cross correla-tion with galaxies, can improve this and will be presentedseparately (R. Hounsell et al. 2015, in preparation).
We also observed Swift J1644+57 with the Spitzer SpaceTelescope at four epochs. The first three roughly span a yearafter the outburst, with a final epoch obtained in 2014 Marchfor host subtraction. Observations were obtained in both the 3.6and 4.5 μm bands. Photometry was performed directly on thePBCD mosaics and on aligned and subtracted images to isolatethe transient flux utilizing a 4 pixel (2 native pixel) aperture andcorrecting for excluded light. The IRAC observations suggest abright mid-IR outburst, consistent with a highly extinguishedsource, which fades by by a factor of 10 over the course of thefirst year. A log of observations and resulting photometry isshown in Table 2.
2.3. Host Galaxy Spectroscopy
In addition to the early spectroscopy reported in Levan et al.(2011) we obtained further optical spectroscopy with Gemini-N/GMOS on 2011 July 23 and 2012 March 23 to April 4.
Observations were obtained in the R400 filter spanning awavelength range from∼5900 to 10000Å and utilizing thenod-and-shuffle mode to improve sky subtraction. The datawere reduced via the Gemini GMOS pipeline appropriate forsimple longslit (for our earlier observations) or nod and shuffle(for later data). The previously reported emission lines of Hα,Hβ, [O III], and [O II] (Levan et al. 2011) remain visible and noclear evolution is seen. In particular, the lines remain narrowwith no sign of the development of broad lines around Hα,where some recently identified TDF candidates have showntransient broad features (Gezari et al. 2012; Arcavi et al. 2014).This is unsurprising given the low level of broadband opticalvariability in the source and may be indicative of a lack ofbroad features, or could suggest that the lines seen are fromrelatively unobscured star formation within the host galaxy,while any broadline region remains highly obscured.
2.4. Late Time X-Ray Observations WithXMM-Newton and Chandra
We obtained several epochs of late time observations ofSwift J1644+57 with both XMM-Newton and Chandra. A logof these observations with exposure times is shown in Table 3.All XMM-Newton observations utilized the thin filter for bothPN and MOS observations. Chandra observations used ACIS-S in very faint mode with the source placed at the default aimpoint on the S3 chip.For our Chandra observations we extracted images from the
cleaned event files in the 0.3–10 keV energy band. We thendetermined count rates in an aperture of 2″ radius. Althoughfaint, the source is detected in each individual image withbetween 7 and 17 source counts and within our aperture thebackground is negligible (<1 count expected). Given the smallnumber of counts it is not possible to determine detailedspectral parameters for our data, although as noted by Bergeret al. (2012) the X-ray photons arise across the energy rangeand are not dominated by soft photons as would be expectedfor a thermal blackbody typically thought to underly TDFs.The XMM-Newton data were reduced with SAS 14.0.0 using
EPCHAIN and EMCHAIN to extract the event lists. All the XMM-Newton observations utilized the thin filter for both pn andMOS observations; single- and double-pixel events (patterns0–4) for pn and all events up to quadruple pixels (patterns0–12) for MOS were selected. The event lists were screened fortimes of high, flaring background and an energy range of0.3–10 keV was then considered. Source count rates were
Table 3Late Time X-Ray Observations of Swift J1644+57
Date-obs MJD-obs ΔT Telescope ks Count Rate Flux(days) (0.3–10 keV) (erg s−1 cm−2)
2012 Sep 27 56197.81 549.27 XMM 22.7 (1.9 ± 0.3) × 10−3 9.93 × 10⁻¹⁵
2012 Oct 05 56205.80 557.26 XMM 28.7 (1.2 ± 0.2) × 10−3 6.27 × 10⁻¹⁵
2012 Nov 26 56257.44 608.90 Chandra 24.7 (3.0 ± 1.1) × 10−4 4.18×10⁻¹⁵
2013 Jul 17 56490.70 842.16 XMM 44.1 (8.1 ± 1.5) × 10−4 4.21×10⁻¹⁵
2015 Feb 17 57070.20 1421.66 Chandra 27.8 (4.6 ± 1.3) × 10−4 6.40×10⁻¹⁵
2015 Apr 06 57118.85 1470.31 Chandra 18.7 (2.7 ± 1.3) × 10−4 3.76×10⁻¹⁵
2012 Sep 02 56172.86 524.32 1734
-+ XRT 110.7 (1.90±0.69)×10−4 9.19×10⁻¹⁵
2013 Mar 15 56366.85 718.31 160251
-+ XRT 146.4 (1.61±0.67)×10−4 7.79×10⁻¹⁵
Note. Log of late time observations of Swift J1644+57 obtained with XMM-Newton, Chandra, and the Swift-XRT. The XMM-Newton and Chandra observations wereobtained as single observations. In contrast, the Swift-XRT observations were based on stacking multiple observations over a long period and so have a significant timeerror bar. The dates given for these observations correspond to the ΔT given, as determined by the methods described in Evans et al. (2007, 2010).
5
The Astrophysical Journal, 819:51 (15pp), 2016 March 1 Levan et al.

extracted using a 10″ radius circle centered on the sourceposition and corrected for point-spread function (PSF) lossescaused by the small region size. The background was estimatedfrom a nearby, larger, source-free region. The numbers given inTable 3 for the XMM-Newton observations are from the pn datasets in each case.
We convert the measured X-ray count rates in the0.3–10 keV bands into fluxes assuming a simple modeldetermined from the fit to the late time X-ray spectra measuredby the Swift-XRT, namely, an absorbed power law of indexΓ= 1.99 and contributions from Galactic and host galaxyabsorption (NH,gal= 1.75×10²⁰, NH,host= 2.07×10²²;(Willingale et al. 2013)). We note this does differ in detailfrom the fit found by more detailed spectral fitting when thesource was brighter, which required an additional thermalcomponent providing a few percent of the soft flux. However,the errors associated with the choice of spectrum are smallcompared to the photon counting errors for the source at thisbrightness. It is possible to fit the XMM-Newton PNobservations directly since the combined observations contain130 counts (of which approximately half are from the source).Doing so with the absorption fixed to the values determined bythe XRT yields a power-law index of 1.85 0.73
0.51G = - (at 90%confidence), consistent with the earlier observations andimplying no strong hard to soft evolution.
3. DISCUSSION
3.1. Late Time X-Ray Light Curve
The updated X-ray light curve of Swift J1644+57 is shownin Figure 2 on both logarithmic and linear time axes. Our latetime observations have been supplemented by the ongoingobservations with the Swift-XRT, taken from the Swift UK data
center11, processed via the techniques described in Evans et al.(2007, 2010). As previously noted (Bloom et al. 2011b;Burrows et al. 2011; Levan et al. 2011) the early light curve isdominated by pronounced flaring and variability, which thensettles into a steady decay, punctuated by notable dips, whichhave been suggested to show some signs of periodicity (Saxtonet al. 2012). The ongoing variability means that attempts to fitany simple decay model to the data inevitably lead to poorquality fits, although the data from ∼100–500 days, if fit with asingle power-law do favor a slope of −5/3 (Levan 2015). Morecomplex fits could be attempted to investigate the presence orabsence of additional breaks in the light curve, but these requiresome attempt to remove dipping activity, and so are necessarilylimited in statistical power.The final good detection reported by the Swift-XRT is at
around 500 days, with a flux of (5.5±0.8)×10−13
erg s−1 cm−2, based on the stacking of images obtained ∼4days either side of this midpoint. After this, the X-ray fluxdecreased markedly. By the time of our XMM-Newtonobservations the source had declined by a factor of at least50 in flux. In a factor of ΔT/T= 0.08 in time a fall of a factorof 50 corresponds to a decay index of around t−70. In practice,the decay was too fast to be resolved since beyond the steepdrop-off, XRT observations cannot recover the flux in shortexposure times and there was a significant delay before theXMM-Newton and Chandra observations were scheduled.Hence we conclude that the power-law decay rate was fasterthan t−70. Assuming we are observing X-ray activity from thebase of the jet this suggests that activity suddenly shut off, dueto either a switch of accretion mode or the cessation ofaccretion. Given the size of emitting regions at the head of thejet at this late time it is difficult to envision a scenario in whichthis shut off was not due to the cessation of activity close to thebase of the jet since otherwise it would have smeared out over amuch longer time period.
Figure 2. X-ray light curve of Swift J1644+57 obtained with the Swift-XRT (black), XMM-Newton (green), and Chandra (blue). The data plotted in each fit areidentical but are plotted on a logarithmic (left) and linear (right) scale to emphasize both the overall shape and behavior after the rapid decay. The solid red line showsa t−5/3 decay plotted through the X-ray observations. This is not a fit to the data, but an indicative reference model. A sharp break of t−70 is shown at 500 days,followed by a constant level. For comparison, a continued decay of t−5/3 after the end of the steep decline is shown as the dashed line.
11 The data presented are based on the calibrated XRT light curve availablefrom the UKSSDC as of 2015 November 26.
6
The Astrophysical Journal, 819:51 (15pp), 2016 March 1 Levan et al.

It is interesting to note that such rapid cessation of X-rayactivity was explicitly predicted in the massive star models ofQuataert & Kasen (2012) since this represents the point atwhich all of the star has accreted onto the central compactobject. Such predictions were not made for jetted TDF-likeevents prior to the detection of the rapid drop in Swift J1644+57, although can potentially be explained via magneticprocesses within the disk (Tchekhovskoy et al. 2014). Inparticular, once the black hole accretion rate becomes sub-Eddington and radiatively efficient (geometrically thin), itenters a thermally dominant accretion state, which isempirically not observed to produce powerful jets in GalacticX-ray binaries (e.g., Russell et al. 2011).
After this rapid decay, X-rays of luminosityLX∼5×1042 erg s−1 continue to be detected until at least2015 April (day 1500). These X-rays appear to be approxi-mately constant in luminosity with little sign of a decay. A fit tothe available Swift-XRT, XMM-Newton, and Chandra observa-tions with a constant source is not especially good (χ2/dof= 13.7/7). The fit is not improved by allowing for a power-law model, which gives a best fit decay of 0.5 0.2
0.7a = -+ (χ2/
dof= 10.22/6), with an F-test probability of chance improve-ment of 20%. However, these data are dominated byobservations immediately after the break and may containadditional systematic errors from comparison between threedifferent instruments. If instead we compare the Chandra countrates then a constant source provides a very good description(χ2/dof= 1.27/2), and the power-law slope of 0.2 0.4
0.8a = - -+
rules out a continuing decay around t−5/3 at >2.3σ (and t−4/3
at 1.9σ). This is at first sight surprising since it is reasonable toassume that after the cessation of jet activity we begin toobserve forward shock emission at all wavelengths (Zaudereret al. 2013). The absence of continued decay of this emissionwould then suggest that these X-rays either do not originatefrom the forward shock or that it is somehow continuing to beenergized despite the cessation of jet activity. It is henceinteresting to compare this late time behavior to the generalexpectations of differing progenitor models.
In a TDF scenario, once the jet turns off, thermal X-rayemission from the inner accretion disk could be observed(which was originally considered the hallmark signature ofTDFs; e.g., Rees 1988). For stellar tidal disruption by a blackhole of mass∼106Me, the fall-back time of the most tightlybound tidal debris (i.e., the time at which we expect accretionto start and an observable electromagnetic transient to beproduced) is tfb∼ 1 month, similar to the duration of peakhard X-ray activity in Swift J1644+57 and J2058+05. Theaccretion luminosity is then some fraction, η, of the rest massof the disrupted star (Må) accreted. Since this mass returns ast/tfb)
−5/3 (Rees 1988; Phinney 1989), this luminosity can beexpressed as
L McM c
t
t
t
M
M
t t
3
3 10 erg s0.1 0.5
month 1000 day. 1
X2
2
fb fb
5 3
43 1
fb2 3 5 3
˙
( )
⎜ ⎟
⎜ ⎟
⎛⎝⎜
⎞⎠⎟
⎛⎝
⎞⎠
⎛⎝⎜
⎞⎠⎟
⎛⎝
⎞⎠
⎛⎝⎜
⎞⎠⎟
h h
h
» »
» ´
´
-
-
-
To order of magnitude, the predicted luminosity at 500–1000days is similar to that observed in J1644+57 after the steep
drop (once a bolometric correction is included). However, thepredicted t 5 3µ - decay is steeper than the observed light curvebetween 500 and 1000 days. A dimmer and flatter light curvethan predicted by Equation (1) could be explained if the blackhole accretion rate after the jet shut off no longer tracks themass fall-back rate due to the viscous spreading of the disk(Cannizzo et al. 1990; Shen & Matzner 2014). Such a transitionfrom rapid to slow processing by the disk is naturally instigatedby the sudden and large increase in the viscous timescale∝H−2
once the disk scale height H shrinks following the sub-Eddington state transition (Shen & Matzner 2014). However,the apparently relatively hard X-ray spectrum after the rapiddecay is not in keeping with the very soft thermal spectrumexpected in TDFs, and so it seems less likely that this is theobserved origin of the late time X-ray emission.In the case where all the material from a collapsing star
has been accreted (Quataert & Kasen 2012) it seems unlikelythat an essentially quiescent source would persist. Onepossibility is that some level of ongoing accretion may occurfrom the dense region in which the SN occurred, although theluminosity is orders of magnitude larger than possible fromeither Bondi-Hoyle accretion in a giant molecular cloud orfrom accretion from a companion star. Indeed, the luminosityof∼5×1042 erg s−1 remains ∼3 orders of magnitude largerthan possible from a stellar mass black hole, and would requireboth a continued high accretion rate and a significant degree ofbeaming unless the supernova had been from an extremelymassive star that had created an exceptionally massive blackhole (e.g., Portegies Zwart et al. 2004).Finally, it is possible that the late time X-rays represent
ongoing AGN activity, separate to the transient outburst. TheX-ray luminosity itself would be fairly typical for a low-luminosity AGN, however, the host galaxy would be unusualin this case since the majority of AGNs are hosted inrather more luminous galaxies. This is illustrated in Figure 3which, following Levan et al. (2011), shows the comparativeluminosity evolution of Swift J1644+57 in the X-rayluminosity against the optical/IR absolute magnitude plane.The track of the counterpart of Swift J1644+57 is shown atseveral characteristic times and shows that it evolves fromextreme X-ray luminosity through to rather fainter luminositiesin both the optical/IR and X-ray. However, at late times it doesnot fall within the locus of X-ray emitting galaxies, eitherof local galaxies harboring relatively quiescent black holes orof more luminous AGNs. For example, in the comparison ofPineau et al. (2011) of SDSS with 2XMM, only a handful ofmatches have optical absolute magnitudes fainter than −19 andin most of these galaxies the X-ray luminosity is sufficientlylow (1038–40 erg s−1) that discrete X-ray emission frombinaries, etc. could be responsible for the observed flux.Indeed, the optical absolute magnitude of the host galaxy ofSwift J1644+57 of MV∼−18.5 is fainter than the cases ofHeinze 2–10 (Reines et al. 2011) or Mrk 709 (Reineset al. 2014), both nearby dwarf galaxies thought to harbormassive black holes. Thus, despite the apparent plateau inX-ray luminosity, this argues against the presence of a standardAGN within the host galaxy, as supported by the absence ofobvious AGN features in either optical spectroscopy (seeabove) or late time radio follow-up (Zauderer et al. 2013).Further X-ray observations over increasingly long time periodsshould ultimately offer a sensitive test of any variability withinthe source.
7
The Astrophysical Journal, 819:51 (15pp), 2016 March 1 Levan et al.

3.2. Optical/IR Light Curve
A striking feature of the optical/IR light curves is thepresence of an apparent upturn to a peak in the light curve
around 30 days after the outburst. Initially the plateauing seenat these times was assumed to be due to the source fading intoits host galaxy light, but later observations clearly demonstratefurther fading by a factor of >3 from this time. There is
Figure 3. Evolution of the location of the transient in the LX–Mopt/IR plane, showing the infrared and optical fading over several years following the first outburst.While at early times the source occupied a region of parameter space largely distinct from that of other transients, its final location is much closer to the locale ofnormal galaxies. However, it remains unusually X-ray luminous given its optical absolute magnitude. The solid lines represent the total observed light (host galaxyplus transient), while the dashed lines show the host-subtracted transient light not corrected for host galaxy extinction. The final optical counterpart point is plotted asthe measured flux with an associated error bar, but could also be represented as an upper limit of Mr∼−13.5 (2σ). The X-ray error bars are approximate and accountfor both the photon noise in X-ray images and the fact that the X-ray source shows some degree of small scale variability; particularly at late times the X-ray andoptical observations are not simultaneous.
Figure 4. Optical and infrared photometry of Swift J1644+57 with the contribution of the host galaxy subtracted. The early time behavior is apparently achromatic,with a constant offset between the bands up to ∼10 days after the BAT trigger, although some variability is visible on top of a gradual decay. After 10 days thecounterpart re-brightens to a bump that peaks 30–50 days after trigger. The left-hand panel shows the X-ray light curve for comparison; although there is a significantre-brightening in X-rays, it occurs well before the optical/IR brightening and is much sharper. The optical bump feature is also shown in all the available bands,although it is clearly stronger in the bluer bands. After the peak the behavior is apparently chromatic, with the redder bands falling more rapidly than the blue.
8
The Astrophysical Journal, 819:51 (15pp), 2016 March 1 Levan et al.

significant point-to-point scatter in the IR observations at manyepochs, possibly due to intrinsic variation in the source on shorttimescales. Direct comparison of observations taken with thesame instrument and telescope combination implies that thisvariability is real, at least at early times. There is also likely tobe some scatter due to slight systematic differences betweenour photometry and that reported by Burrows et al. (2011). Thismeans that as with the X-ray, simple fits to the data do not yieldhigh-quality fits and will provide only an approximation of thetrue behavior. However, the host-subtracted K-band data canbe described by a multiply broken power law as shown inFigure 4. The counterpart declines with α1≈ 1.3 (whereFν∝ t−α), then rises with α2≈−0.7 to a peak at 30 days.From this point a decline with α3≈ 0.8 describes the finalfading into the host galaxy, although there are significant errorson the late time points due to the uncertainty in hostsubtraction. This crude model of three power-law segmentsalso provides a reasonable fit to the H- and J-band observationsif an arbitrary offset is applied (see Figure 4). If this offset isscaled to provide a good match to the early data (<10 dayspost-burst) then it significantly underpredicts the strength of thebump in the H and J bands. This suggests that the bump doesnot have the same underlying spectral energy distribution(SED) as the earlier counterpart and is much bluer withrelatively weak IR emission.
The HST observations provide the best measurements of thisbump since they can cleanly be subtracted for host contributionwithout the need for PSF matching or differences betweencameras or filters. However, the HST observations also provideextremely poor temporal sampling. Nonetheless, it is striking tonote that the F606W optical observations show an apparent risebetween 6 and 23, with the 23 day flux ∼1.5 times brighter thanat day 6, while the IR light at 23 days is 0.9 times as bright as at6 days (see Figure 5). This offers further evidence that thebump is a separate feature rather than a simple, achromatic re-brightening. The HST observations also suggest that at latertimes the decay cannot be well fit as a single power-law decay,although this is again based on very small sampling (3 pointsper band).
In Figure 6 we show the evolution of the SED of Swift J1644+57. It can be seen to be extremely red, as previously noted. ItsSED, combined with the significant X-ray column density,favors an optical extinction in the region 1.5<E(B−V)<2(Bloom et al. 2011b; Burrows et al. 2011; Levan et al. 2011).To highlight the possible impact of extinction, we then also plotthe SED corrected for a maximal extinction of E(B−V)= 2assuming a Milky Way extinction law, although since none ofour wavelengths are close to the rest-frame 2175Åbump, thechoice of extinction law has minimal impact on the correction.The peak of the bump at 30 days has an absolute magnitude ofMB∼−22 for a maximal extinction, comparable to the peakmagnitude in the K band (which is far less affected by hostextinction).
3.3. The Origin of the Optical Bump
Perhaps the most plausible explanation is that the opticalbump originates as the hot thermal component of the tidal flare.Such components are typically those expected based on non-relativistic models (e.g., Rees 1988). This peak luminosityoccurs well after the disruption itself since the peak accretionrate is after the return of the most bound debris. Indeed,numerical models of mass return suggest that luminous UV
flares may peak on timescales of∼20–50 days at optical andUV wavelengths (Lodato & Rossi 2011) with luminositiesrather similar to those of normal SNe. This is broadly borne outby observations of candidate disruptions to date, with many ofthe most promising candidates showing such rises. However,suggested examples of TDFs actually show a surprisingly largevariation in their properties. Some peak early and very bright(MV<−20 and rise times of a few days, e.g., PTF10iya(Cenko et al. 2012a)) while those with much longer lifespansare also significantly fainter (MV>−18 with rise times of20–50 days). There are no examples that apparently match theenergy output for Swift J1644+57, although there remainssignificant uncertainty about both the extinction and thecontribution of any non-thermal component. We plot the lightcurves of Swift J1644+57 (after subtraction of the hostcontribution and correction for host extinction) against thoseof candidate TDFs in Figure 5. Unfortunately, such acomparison is non-trivial since Swift J1644+57 is predomi-nantly observed in the rest-frame IR, while the thermal flaresare strong UV and optical emitters. Therefore, the poorlysampled optical light curve of Swift J1644+57 (cyan line inFigure 5) is probably the best comparison with knownexamples. However, the strong evolution in the optical/IRSED of the source occurs primarily at early times, where the IRlight is falling as the optical rises. As this is before the peak ofthe bump, we can compare the later evolution by scaling thewell sampled K-band light curve to the optical. It should alsobe noted that this comparison is further complicated since theorigin of many suggested TDFs remains uncertain, forexample, some may be unusual SNe and others due to partialdisruption (e.g., Chornock et al. 2014; Holoien et al. 2014) orthe disruption of unusual stars (e.g., Gezari et al. 2012).Another possibility is that the re-brightening is due to the
optical/IR contribution of the second synchrotron componentidentified by Berger et al. (2012). This peaks at radiowavelengths at ∼100 days, although plausible synchrotronmodels could result in an earlier peak for the optical/IRemission (as seen in GRBs for example (Sari et al. 1998)),depending on the location of spectral breaks. This would havethe appeal of representing the manifestation of a feature knownat other wavelengths and might also explain the relatively highpolarization (7.4±3.5%) seen in the IR 17 days after theoutburst as the bump is beginning to dominate (Wiersemaet al. 2012). Indeed, as noted by De Colle et al. (2012), thedelay between viewing energy injection at the base of the jet inX-rays and radio emission from the jet head is naturallyexpected in models of jetted TDFs, and this “lag” in which theoptical/IR peak is between these two extremes may have someappeal. However, the parameters would necessarily requiresome tuning to provide the brightening without the presence ofany moving spectral breaks in the optical/IR since while therelative strength of the bump emission varies with wavelength,the shape of the bump is broadly similar. The bump colorswould also be unusually blue-corrected for host extinction: thespectrum would follow Fν∼ν2 or steeper, much bluer thanexpected for GRB-blast waves in this wavelength regime. Thepolarization measurement could also represent underlyingasymmetry in the source, as is seen in some SNe (e.g., Patatet al. 2011), while its intrinsic value is significantly uncertainsince interstellar polarization within the host could also play animportant role (Wiersema et al. 2012). To date there do not
9
The Astrophysical Journal, 819:51 (15pp), 2016 March 1 Levan et al.

exist polarimetric observations of the thermal components ofTDF flares, and so this cannot be compared directly.
An alternative hypothesis is that the optical bump could bedue to reverberation of the X-ray light. Yoon et al. (2015) claimthat the morphology of the optical is similar to that of theX-ray, but with a delay of ∼15 days. While this does not appearthe case in a detailed comparison (for example, the X-ray rise israpid while the optical/IR rise apparently takes place over thetimescale of several days) it is possible that a prompt injectionof energy in the X-ray could be smoothed out should thereverberating material be spread out at an average distance of∼15 light days from the central engine. While the lags to thebroadline region can be of this size (Peterson et al. 2004)simultaneous optical/X-ray monitoring of AGNs typicallyyields much smaller lags (∼1 day) between X-ray and opticalemission (e.g., Breedt et al. 2009, 2010), while lags due toprocesses within the disk are also short (∼1 day) and shouldincrease with increasing wavelength (McHardy et al. 2014).Hence the properties of the light curves do not naturally matchthe expectations of reverberation seen in AGNs and wouldrequire an unusual, pre-existing AGN-like geometry to existwithin the host. On the other hand, the unexpectedly highoptical luminosities and low effective temperatures of many
optically selected TDFs have also been attributed to “reproces-sing” of the inner disk emission by debris from the merger,either bound debris still returning to the BH (Guillochonet al. 2014) or an unbound outflow from the accretion disk(e.g., Strubbe & Quataert 2011; Metzger & Stone 2015).The other class of astrophysical transient that can reach
such extreme luminosities are the superluminous supernovae(SLSNe; e.g., Gal-Yam 2012). These events peak at magni-tudes of MV<−21 and have slow rise times of 30–100 days,followed by slow decays. The peak luminosity of Swift J1644+57 is comparable to these events and given the uncertainty inboth the explosion date of SLSNe and the true “trigger” timefor Swift J1644+57, it is possible to obtain a reasonable matchin both light curve shape and luminosity. For the case of E(B−V)= 2 the luminosity would be among the highest forSLSNe, although the recent discovery of the most luminousSLSNe ASASSN-15lh would be comparable (in fact, it shouldalso be noted that ASASSN-15h is apparently coincident withthe nucleus of its host galaxy (Dong et al. 2016), as is thesecond brightest SLSNe, CSS 100217, (Drake et al. 2011),perhaps offering further hints of similarities between classesof astrophysical transient). Given the uncertainties in hostextinction one can also find a reasonable match in terms of
Figure 5. Comparison of the host subtracted, extinction corrected light curves of Swift J1644+57 with other luminous transient events, in particular the light curves ofsuggested candidate tidal disruption systems (top, including the luminous “Dougie” discovered by ROTSE (Vinkó et al. 2015), PS1–10jh (Gezari et al. 2012),PTF10iya (Cenko et al. 2012a), and Swift J2058+0516 (Cenko et al. 2012b; Pasham et al. 2015)) and SLSNe (bottom, including ASASSN-15lh (Dong et al. 2016),PTF12dam (Nicholl et al. 2013), SCP 06F6 (Barbary et al. 2009), and PTF09cnd (Quimby et al. 2011)). The left axis shows the events as they would appear at thesame redshift as Swift J1644+57, and the right-hand axis shows absolute magnitudes. Unfortunately, the poor sampling of the optical component of Swift J1644+57(cyan line) makes a direct comparison with the predominantly optical observations of other transient classes difficult. To attempt to mitigate this we have also shownthe smoothed K-band light curve, scaled to the optical at 23 days. The strong chromatic evolution at early times can be seen with the optical rising as the K band falls.However, around and after the peak, this suggests that the overall light curve shape suggested by the optical observations is probably a reasonable expectation.However, SLSNe can provide a reasonable match to the observations (in particular ASASSN-15lh), while TDFs match the light curve shape, but are required to besignificantly brighter than previous examples.
10
The Astrophysical Journal, 819:51 (15pp), 2016 March 1 Levan et al.

spectral shape between hydrogen poor SLSNe and Swift J1644+57 (see Figure 6).
At first sight, the strong simultaneous X-ray emission wouldappear to rule out an SLSNe origin, however, two recentdevelopments may be important in this regard. First, theapparently normal hydrogen poor SLSNe, SCP 06F6 has astrong X-ray detection >100 days after its discovery, with aluminosity very similar to that of Swift J1644+57 at the sameepoch (Gänsicke et al. 2009; Levan et al. 2013). X-rayobservations were not obtained of SCP 06F6 until very late, butit is possible that it is due to jetlike emission that could havebeen persistent but undetected over a long period in a systemsimilar to Swift J1644+57. Although it is also possible that theX-ray detection of SCP 06F6 was due to a shorter breakout ofmagnetar emission (Levan et al. 2013) and the possibilitiescannot be distinguished between with the paucity of earlierX-ray observations. Second, in the case of one ultra-long GRB,GRB 111209A (Gendre et al. 2013; Levan et al. 2014) therehas recently been the identification of a luminous supernovasignature (Greiner et al. 2015), indicating that one cansimultaneously observe strong X-ray emission and a luminousSNe bump. If these SNe are in fact powered by either a blackhole or long-lived magnetar central engines then one mightexpect to sometimes observe them down a jet axis, in whichcase events like Swift J1644+57 or GRB 111209A could beobserved. Motivated in part by these results Metzger et al.(2015) have shown that the full variety of luminous SNe andextremely long-lived high-energy transients can be explained(although not necessarily uniquely) by magnetars with differingmagnetic fields and spin-down times, extending the suggestionby Mazzali et al. (2014) that most GRBs can be explained bysuch a mechanism. Indeed, they note that this model wouldnaturally predict the luminosity of Swift J2058+0516. The caseof Swift J1644+57 would then also fit on the extrapolation ofthese models.
Indeed, it is instructive to consider Swift J2058+0516 in thisregard, since it exhibited similar high-energy properties to SwiftJ1644+57, but lacked the heavy extinction. Thus we mightexpect to be able to test any SN hypothesis, especially as theredshift was almost identical to the SLSNe SCP 06F6. In thiscase the luminosity of the optical afterglow was comparable toSLSNe, and the inferred temperature (T∼2×10⁴ K, Pashamet al. 2015) was similar to both GRB 111209A/SN2011kl andASASSN-15lh (Dong et al. 2016; Greiner et al. 2015).However, there was only rather minimal evidence of anyoptical rise (although observations started late) and opticalspectroscopy did not yield any sign of the strong absorptionfeatures seen in most SLSNe. This casts some doubt on anymodel linking events such as Swift J1644+57 and Swift J2058+0516 with stellar core collapse, although it should equally benoted that in the case of GRB 111209A/SN2011kl (Greineret al. 2015) the high ejecta velocities diluted any absorptionfeatures such that they were not obvious in the observedspectra. The final case of Swift J1112–8238 (Brown et al. 2015)unfortunately does not yield such strong constraints due torather patchy follow-up, although the absolute magnitude of thetransient of MB∼−21.4, 20 days after the BAT detection is inkeeping with the absolute magnitudes seen in both Swift J1644+57 and Swift J2058+0516.Finally, the observed rates of different events could
potentially provide some discrimination between progenitormodels. Before correction for beaming, GRBs likely show avolumetric rate of a few Gpc−3, corrected for likely beamingthis becomes ∼300 Gpc−3 (e.g., Kanaan & de FreitasPacheco 2013), rather comparable to the rate of SLSNe(Quimby et al. 2013). The rate of Swift J1644+57-liketransients, or ultra-long GRBs is significantly lower than theGRB rate, although poorly constrained given the smallpopulation observed, and observational biases against theirdetection as long-lived, low peak-flux events (Levan et al.
Figure 6. Spectral energy distribution of the Swift J1644+57 at four representative epochs spanning the 200 days after outburst. The left-hand panel shows themultiple epochs as observed (solid lines) and corrected for E(B−V)host = 2 (dashed lines). The right-hand panel shows the extinction-corrected SED (the shadedregion represents the range between E(B−V)host = 2 and E(B−V)host = 1.5) in comparison with two representative lines of SLSNe, in particular PTF13ajg (blue)(Vreeswijk et al. 2014) and PTF14bdq (cyan) (Nicholl et al. 2015), taken from WISEREP (Yaron & Gal-Yam 2012), as well as blackbodies of two differenttemperatures.
11
The Astrophysical Journal, 819:51 (15pp), 2016 March 1 Levan et al.

2014). Brown et al. (2015) estimate a rate of 3×10⁻¹⁰
galaxy−1 yr−1 for Swift J1644+57-like events. Accounting forbiases in their detection could give an order of magnitude largerrate, with a similar boost given if shorter events, such as theultra-long GRBs are included (Levan et al. 2014). Given thevolume density of galaxies in the relatively local universe (ormore specifically massive black holes) is ∼10−2
–10−3 Mpc−3
the inferred volumetric rate of the Swift J1644+57-like eventsis ∼3×10⁻³ Gpc−3 yr−1, or allowing for the various selec-tions against their discovery perhaps as high as ∼0.1Gpc−3 yr−1. Hence, even with very small beaming angles(e.g., the factor of∼102–3 needed to bring the observedluminosity below the Eddington limit for a 107–8Me blackhole) such jets need only be launched from a small fraction ofSLSNe. This would explain why evidence for their existence inX-ray monitoring of SLSNe is rare to date (Levan et al. 2013).Equally, these rates are significantly below the rates of TDFs,whose canonical rate of 1×10⁻⁵ galaxy−1 yr−1 is 5 orders ofmagnitude higher than that of the relativistic counterparts. Asnoted by Cenko et al. (2012b) and Brown et al. (2015) it istherefore unlikely that any significant fraction of TDFs couldlaunch such powerful relativistic jets as seen in Swift J1644+57and other examples. Overall, the rate arguments suggest thatthese very long duration transients could arise from some smallsubset of either TDFs or SLSNe.
3.4. Host Galaxy Properties
After the X-ray break it is likely that the observed flux in allbands is now dominated by the host galaxy, affording us theopportunity to investigate it in more detail than previouslypossible. Indeed, this is supported by the analysis of Yoon et al.(2015) who attempt to fit a point source onto the host,concluding that at later times the point source contribution isminimal. The galaxy is detected in 12 photometric bands from0.45–4.5 μm, with upper limits available from GALEX in the
UV (Gezari et al. 2011) and WISE in the mid-IR (Levan et al.2011), although in practice the upper limits are weak and donot aid in the determination of galaxy properties since they liewell above any plausible galaxy model fitted through the bandsin which the host is detected. The photometric detections andlimits are shown in Table 4. From this we can derive thephysical properties of the host galaxy based on template fittingto the available SED shown in Figure 7. Considering theBinary Population and Spectral Synthesis (BPASS) library ofmodels (Eldridge & Stanway 2009), we find the SED to be wellreproduced by a relatively old dominant stellar population(age= 3.2×10⁹ years), although the emission lines clearlyindicate the presence of a younger population as well (Figure 7).Importantly, the fitting also provides a much more robustdetermination of the stellar mass than was previously possible,since earlier attempts were significantly contaminated at redwavelengths by transient light. Specifically we find a stellarmass of M* = 5.5×10⁹Me. This value is somewhat largerthan that found by Yoon et al. (2015) from their more detailedstudy (M 1.38 100.27
0.48 9* = ´-
+ ). However, this may beexplained by the use of differing spectral models, and ouruse of later time Spitzer observations, free from transientcontamination. This stellar mass can be used to infer anapproximate mass for the central black hole. Scott et al. (2013)find that for core-Sérsic profiles the scaling is roughly linear(M MBH
0.97 0.14*
µ ), but for galaxies with low masses (theydefine low to be M*<3×10¹⁰Me) they find a much steeperrelation of M MBH
2.22 0.58*
µ . Under the assumption thatthe galaxy stellar mass is equal to its spheroid mass (whichseems a reasonable assumption given the surface brightnessprofile, see below) the implied black hole mass is thenMBH∼3×10⁶Me, which could be taken as an upper limit onthe likely BH mass.Despite its luminosity appearing very similar to the LMC
(MB∼−18), the morphological properties of the host of SwiftJ1644+57 are rather different. The core of the galaxy is barelyresolved by the HST IR observations, although is reasonablyresolved in the optical. The galaxy has little ellipticity e≈0.1and is very concentrated, with R20,50,80= 0.077, 0.184,0 388= 0.39, 0.92, 1.95 kpc at z= 0.354. Its surface bright-ness profile is well fit with a Sérsic fit with n= 4 (i.e., a deVaucouleurs profile) in both the optical and IR, suggesting it isdominated by a spheroidal component (see also Yoon et al.2015). However, a subtraction of a rotated image does revealsome asymmetry with a knotlike structure extending ∼0 1from the galaxy nucleus, but interestingly including thelocation of the transient. These are potentially the star-formingregions creating emission lines and lead to a formalconcentrated asymmetry measure of C≈ 3.5, A≈ 0.1, placingthe host in a region of in the concentration asymmetry planesimilar to many GRB hosts (Conselice et al. 2005).
4. SUMMARY
We have presented multi-wavelength observations of SwiftJ1644+57, continuing for >4 years after its initial detection. Atthis stage the observed light at X-ray, optical, and infraredwavelengths appears to be dominated by quiescent emission.In the case of the optical/IR this is likely the host galaxy.In X-rays, an apparently persistent source of luminosityL= 4×1042 erg s−1 either represents a slowly declining phaseof the counterpart or an underlying low-luminosity AGN.The presence of an AGN in a tidal disruption event is not
Table 4Host Galaxy Photometry for the Host of Swift J1644+57
Band Mag (AB) References
GALEX/FUV >22.1 Gezari et al. (2011)GALEX/NUV >22.4 Gezari et al. (2011)B 24.14±0.05 Levan et al. (2011)g 23.66±0.05 Levan et al. (2011)r 22.80±0.10 Levan et al. (2011)F606W 22.72±0.03 This worki 22.31±0.10 Levan et al. (2011)z 22.03±0.03 This workJ 21.87±0.06 This workH 21.63±0.04 This workF160W 21.53±0.01 This workK 21.42±0.04 This workSpitzer ch1 21.77±0.27 This workSpitzer ch2 21.88±0.24 This workWISE W3 >17.95 Levan et al. (2011)WISE W4 >16.14 Levan et al. (2011)
Note. Since HST observations indicate at early times there was a small transientcontribution even in the optical bands we have included an additional error of0.1 mag on the r- and i-band data.
12
The Astrophysical Journal, 819:51 (15pp), 2016 March 1 Levan et al.

unprecedented; in particular, the recent ASASSN-14li appearsto arise from a pre-existing radio galaxy and indeed thecoincidence of the source with an apparently active nucleusmay increase the confidence in which it can be assigned toa TDF.
More puzzling is the nature of the optical and IR emission. Astrong, luminous bump at∼30 days with an absolute magnitudeofMB∼−22 is not well matched by the thermal bumps seen inother tidal flares, since it is much more luminous. The bump ismore pronounced than seen in the case of the other candidateflares Swift J2058+0516 and Swift J1112–8238, although thismay be due to the earlier initiation of observations in the caseof Swift J1644+57. For Swift J1644+57 observations weretaken within hours of the BAT trigger, and within at most a fewdays of the clear onset of activity, in the case of Swift J2058+0516 and Swift J1112–8238 the first optical observations tookplace >10 and 20 days after the BAT detections respectively,meaning that any rise could have been missed. In all three casesthe luminosity of the counterpart is brighter than MB∼−21.
The properties of these bumps may represent extremeversions of the thermal flares from TDFs. In the case of SwiftJ2058+0516 the inferred temperature is comparable to thosefound for thermal TDF flares and the soft X-ray components(Burrows et al. 2011; Levan et al. 2011) may also be consistentwith those expectations, although the inferred temperatures ofthe X-ray blackbodies are much higher than inferred from theoptical. Given the apparent differences in total energetics inrelativistic TDFs and thermal events it might be less surprisingthat the thermal bumps are also different and may reflectdifferences in the stars being accreted (differences in mass,radius, magnetic field, binarity, etc. (e.g., Krolik & Piran 2011;Mandel & Levin 2015)). Alternatively, it may be that theseevents are not in fact from TDFs but from luminous supernovaeexplosions. In this case they may arise when a luminous SNlaunches a relativistic jet upon collapse, in which case theywould be GRB-like events arising from some subset of SLSNe,
as normal long duration GRBs arise from some small subset ofSN Ic. The observed rate of SLSNe are comparable to those ofGRBs (Quimby et al. 2013), while the rates of the very longtransients, even allowing for beaming factors of 100–1000, aremuch lower, implying that visible high-energy transientsassociated with SLSNe would be rare, even compared to theSLSNe rate. Metzger & Stone (2015) develop a model for theoptical TDF emission which is qualitatively similar to thosedeveloped for engine-powered SLSNe (i.e., reprocessing ofcentral engine energy by approximately a solar mass ofoutflowing matter; e.g., Dexter & Kasen 2013), highlightingthe challenges of distinguishing TDFs and core collapse eventsbased on their optical light curves alone.Further diagnostics are clearly needed to form firm
conclusions. There are likely to be three routes through whichthis can come. The first is via spectroscopy of the bumps in anyfurther examples. High quality spectroscopy, allied to detailedmodeling can yield diagnostics even in the case of relativelyweak or featureless spectra, as recently demonstrated in thecase of the ultra-long and luminous supernovae pairing GRB111209A/SN2011kl (Greiner et al. 2015). The uniqueidentification of features expected in luminous SNe (e.g.,turn-off due to line blanketing, absorption lines seen in SLSNe)or TDFs (e.g., blueshifted narrow lines from streams (Strubbe& Quataert 2011)) would then provide a clinching argument asto the origin of the bumps in the longest high-energy transients.A second route arises through studying the locations of thetransients within their hosts. Swift J1644+57 clearly arises veryclose to the galactic nucleus, and Swift J2058+0516 is alsoconsistent with the nucleus of a much fainter galaxy (Pashamet al. 2015). In the case of GRBs, approximately 1/6 ofexamples are consistent with a galaxy nucleus (Fruchteret al. 2006; Svensson et al. 2010); this number may be lowerfor SLSNe (Lunnan et al. 2015) although the origin of SLSNein the nuclei of galaxies may be ambiguous (e.g., Donget al. 2016). Further examples, all in the nuclei of their hosts,
Figure 7. Spectral energy distribution of the host galaxy of Swift J1644+57 from our late time photometry, together with our best-fitting BPASS model. The relativelyred optical colors favor a system dominated by an older underlying population, consistent with a morphological classification as an elliptical galaxy. However,emission lines observed in the optical spectrum demonstrate the presence of some ongoing star formation.
13
The Astrophysical Journal, 819:51 (15pp), 2016 March 1 Levan et al.

would rapidly remove any SNe model from consideration.Finally, we can also consider the host galaxy more globally.TDFs can be observed in quiescent, non-star-forming galaxieswhile SLSNe are thought to arise from massive star collapse(Gal-Yam 2012) and in principle should occur only in starforming galaxies. A prime model for SLSNe is that they arisefrom supernovae in which the shock wave is re-energized bythe spin-down energy of a recently formed magnetar (Kasen &Bildsten 2010). While magnetars similar to those suggested topower SLSNe can be formed via accretion induced collapse oftwo merging white dwarfs (Usov 1992; Levan et al. 2006), andmay provide a similar energy input, in the case of a white dwarfmerger there would be minimal remnant to re-energize, andhence no luminous SNe. This means that the presence of anextremely long event within an quiescent elliptical galaxywould rule out SNe models, and strongly favor an origin as arelativistic tidal flare. Since a reasonable fraction (∼50%) ofcandidate tidal disruptions arise from passive systems, (i.e.,those with little sign of star formation) (e.g., Arcavi et al. 2014)such a test should be possible with only a handful of additionalexamples since we would expect to observe an example in asystem without star formation in the near future.
We thank the referee for constructive comments on thepaper. A. J. L., N. R. T., K. W., and P. T. O. thank STFC forsupport. K. L. P. thanks the UK Space Agency. We thank MattMountain, Harvey Tannenbaum, and Norbert Schartel and theteams from STScI, CXC, and ESAC for the approval and rapidscheduling of DDT observations with HST, Chandra andXMM-Newton respectively.
Based on observations made with the NASA/ESA HubbleSpace Telescope, obtained [from the Data Archive] at theSpace Telescope Science Institute, which is operated by theAssociation of Universities for Research in Astronomy, Inc.,under NASA contract NAS 5-26555. These observations areassociated with HST programs GO 12447, 12378 and 12764.
The scientific results reported in this article are based to asignificant degree on observations made by the Chandra X-rayObservatory. The observations reported are from programnumbers 12900486, 13708437, and 15700509.
Based on observations obtained with XMM-Newton, an ESAscience mission with instruments and contributions directlyfunded by ESA Member States and NASA.
Based on observations obtained at the Gemini Observatory,which is operated by the Association of Universities forResearch in Astronomy, Inc., under a cooperative agreementwith the NSF on behalf of the Gemini partnership: the NationalScience Foundation (United States), the National ResearchCouncil (Canada), CONICYT (Chile), the Australian ResearchCouncil (Australia), Ministério da Ciência, Tecnologia eInovação (Brazil), and Ministerio de Ciencia, Tecnología eInnovación Productiva (Argentina).
This work made use of data supplied by the UK SwiftScience Data Centre at the University of Leicester, funded bythe UK Space Agency.
REFERENCES
Anderson, J. 2014, BAAS, 224, 12205Arcavi, I., Gal-Yam, A., Sullivan, M., et al. 2014, ApJ, 793, 38Barbary, K., Dawson, K. S., Tokita, K., et al. 2009, ApJ, 690, 1358Berger, E., Zauderer, A., Pooley, G. G., et al. 2012, ApJ, 748, 36Bloom, J. S., Butler, N. R., Cenko, S. B., & Perley, D. A. 2011a, GCN,
11847, 1
Bloom, J. S., Giannios, D., Metzger, B. D., et al. 2011b, Sci, 333, 203Breedt, E., Arévalo, P., McHardy, I. M., et al. 2009, MNRAS, 394, 427Breedt, E., McHardy, I. M., Arévalo, P., et al. 2010, MNRAS, 403, 605Brown, G. C., Levan, A. J., Stanway, E. R., et al. 2015, MNRAS, 452, 4297Burrows, D. N., Kennea, J. A., Ghisellini, G., et al. 2011, Natur, 476, 421Cannizzo, J. K., Lee, H. M., & Goodman, J. 1990, ApJ, 351, 38Cannizzo, J. K., Troja, E., & Lodato, G. 2011, ApJ, 742, 32Cenko, S. B., Bloom, J. S., Kulkarni, S. R., et al. 2012a, MNRAS, 420, 2684Cenko, S. B., Krimm, H. A., Horesh, A., et al. 2012b, ApJ, 753, 77Chornock, R., Berger, E., Gezari, S., et al. 2014, ApJ, 780, 44Conselice, C. J., Vreeswijk, P. M., Fruchter, A. S., et al. 2005, ApJ, 633, 29Cummings, J. R., Barthelmy, S. D., Beardmore, A. P., et al. 2011, GCN,
11823, 1De Colle, F., Guillochon, J., Naiman, J., & Ramirez-Ruiz, E. 2012, ApJ,
760, 103Dexter, J., & Kasen, D. 2013, ApJ, 772, 30Dong, S., Shappee, B. J., Prieto, J. L., et al. 2016, Sci, 351, 257Drake, A. J., Djorgovski, S. G., Mahabal, A., et al. 2011, ApJ, 735, 106Eldridge, J. J., & Stanway, E. R. 2009, MNRAS, 400, 1019Evans, P. A., Beardmore, A. P., Page, K. L., et al. 2007, A&A, 469, 379Evans, P. A., Willingale, R., Osborne, J. P., et al. 2010, A&A, 519, A102Fruchter, A. S., & Hook, R. N. 2002, PASP, 114, 144Fruchter, A. S., Levan, A. J., Strolger, L., et al. 2006, Natur, 441, 463Gal-Yam, A. 2012, Sci, 337, 927Gänsicke, B. T., Levan, A. J., Marsh, T. R., & Wheatley, P. J. 2009, ApJL,
697, L129Gendre, B., Stratta, G., Atteia, J. L., et al. 2013, ApJ, 766, 30Gezari, S., Chornock, R., Rest, A., et al. 2012, Natur, 485, 217Gezari, S., Forster, K., & Martin, D. C. 2011, ATel, 3292, 1Giannios, D., & Metzger, B. D. 2011, MNRAS, 416, 2102Greiner, J., Mazzali, P. A., Kann, D. A., et al. 2015, Natur, 523, 189Guillochon, J., Manukian, H., & Ramirez-Ruiz, E. 2014, ApJ, 783, 23Holoien, T. W.-S., Prieto, J. L., Bersier, D., et al. 2014, MNRAS, 445, 3263Kanaan, C., & de Freitas Pacheco, J. A. 2013, A&A, 559, A64Kasen, D., & Bildsten, L. 2010, ApJ, 717, 245Kennea, J. A., Romano, P., Krimm, H. A., et al. 2011, ATel, 3242, 1Komossa, S. 2015, JHEAp, 7, 148Krimm, H. A., & Barthelmy, S. D. 2011, GCN, 11891, 1Krolik, J. H., & Piran, T. 2011, ApJ, 743, 134Levan, A. J. 2015, JHEAp, 7, 44Levan, A. J., Read, A. M., Metzger, B. D., Wheatley, P. J., & Tanvir, N. R.
2013, ApJ, 771, 136Levan, A. J., & Tanvir, N. R. 2012, ATel, 4610, 1Levan, A. J., Tanvir, N. R., Cenko, S. B., et al. 2011, Sci, 333, 199Levan, A. J., Tanvir, N. R., Starling, R. L. C., et al. 2014, ApJ, 781, 13Levan, A. J., Wynn, G. A., Chapman, R., et al. 2006, MNRAS, 368, L1Lodato, G., & Rossi, E. M. 2011, MNRAS, 410, 359Lunnan, R., Chornock, R., Berger, E., et al. 2015, ApJ, 804, 90MacLeod, M., Guillochon, J., Ramirez-Ruiz, E., Kasen, D., & Rosswog, S.
2015a, arXiv:1508.02399MacLeod, M., Trenti, M., & Ramirez-Ruiz, E. 2015b, arXiv:1508.07000Mandel, I., & Levin, Y. 2015, ApJL, 805, L4Mangano, V., Burrows, D. N., Sbarufatti, B., & Cannizzo, J. K. 2015,
arXiv:1511.06447Mazzali, P. A., McFadyen, A. I., Woosley, S. E., Pian, E., & Tanaka, M. 2014,
MNRAS, 443, 67McHardy, I. M., Cameron, D. T., Dwelly, T., et al. 2014, MNRAS, 444, 1469Metzger, B. D., Margalit, B., Kasen, D., & Quataert, E. 2015, MNRAS,
454, 3311Metzger, B. D., & Stone, N. C. 2015, arXiv:1506.03453Nakauchi, D., Kashiyama, K., Suwa, Y., & Nakamura, T. 2013, ApJ, 778, 67Nicholl, M., Smartt, S. J., Jerkstrand, A., et al. 2013, Natur, 502, 346Nicholl, M., Smartt, S. J., Jerkstrand, A., et al. 2015, ApJL, 807, L18Pasham, D. R., Cenko, S. B., Levan, A. J., et al. 2015, ApJ, 805, 68Patat, F., Taubenberger, S., Benetti, S., Pastorello, A., & Harutyunyan, A.
2011, A&A, 527, L6Peterson, B. M., Ferrarese, L., Gilbert, K. M., et al. 2004, ApJ, 613, 682Phinney, E. S. 1989, in IAU Symp Proc., Vol. 136, The Center of the Galaxy,
ed. M. Morris (Dordrecht: Kluwer), 543Pineau, F.-X., Motch, C., Carrera, F., et al. 2011, A&A, 527, A126Portegies Zwart, S. F., Baumgardt, H., Hut, P., Makino, J., &
McMillan, S. L. W. 2004, Natur, 428, 724Quataert, E., & Kasen, D. 2012, MNRAS, 419, L1Quimby, R. M., Kulkarni, S. R., Kasliwal, M. M., et al. 2011, Natur, 474, 487Quimby, R. M., Yuan, F., Akerlof, C., & Wheeler, J. C. 2013, MNRAS,
431, 912
14
The Astrophysical Journal, 819:51 (15pp), 2016 March 1 Levan et al.

Ramirez-Ruiz, E., & Rosswog, S. 2009, ApJL, 697, L77Rees, M. J. 1988, Natur, 333, 523Reines, A. E. 2014, Natur, 513, 322Reines, A. E., Plotkin, R. M., Russell, T. D., et al. 2014, ApJL, 787, L30Reines, A. E., Sivakoff, G. R., Johnson, K. E., & Brogan, C. L. 2011, Natur,
470, 66Russell, D. M., Miller-Jones, J. C. A., Maccarone, T. J., et al. 2011, ApJL,
739, L19Sari, R., Piran, T., & Narayan, R. 1998, ApJL, 497, L17Saxton, C. J., Soria, R., Wu, K., & Kuin, N. P. M. 2012, MNRAS,
422, 1625Sbarufatti, B., Burrows, D. N., Gehrels, N., & Kennea, J. A. 2012, ATel,
4398, 1Scott, N., Graham, A. W., & Schombert, J. 2013, ApJ, 768, 76Seth, A. C., van den Bosch, R., Mieske, S., et al. 2014, Natur, 513, 398Shen, R.-F., & Matzner, C. D. 2014, ApJ, 784, 87Stratta, G., Gendre, B., Atteia, J. L., et al. 2013, ApJ, 779, 66Strubbe, L. E., & Quataert, E. 2011, MNRAS, 415, 168
Suzuki, D., Tristram, P. J., Kobara, S., et al. 2011, GCN, 11824, 1Svensson, K. M., Levan, A. J., Tanvir, N. R., Fruchter, A. S., & Strolger, L.-G.
2010, MNRAS, 405, 57Tchekhovskoy, A., Metzger, B. D., Giannios, D., & Kelley, L. Z. 2014,
MNRAS, 437, 2744Usov, V. V. 1992, Natur, 357, 472van Velzen, S., Körding, E., & Falcke, H. 2011, MNRAS, 417, L51Vinkó, J., Yuan, F., Quimby, R. M., et al. 2015, ApJ, 798, 12Vreeswijk, P. M., Savaglio, S., Gal-Yam, A., et al. 2014, ApJ, 797, 24Wiersema, K., van der Horst, A. J., Levan, A. J., et al. 2012, MNRAS,
421, 1942Willingale, R., Starling, R. L. C., Beardmore, A. P., Tanvir, N. R., &
O’Brien, P. T. 2013, MNRAS, 431, 394Woosley, S. E., & Heger, A. 2012, ApJ, 752, 32Yaron, O., & Gal-Yam, A. 2012, PASP, 124, 668Yoon, Y., Im, M., Jeon, Y., et al. 2015, ApJ, 808, 96Zauderer, B. A., Berger, E., Margutti, R., et al. 2013, ApJ, 767, 152Zauderer, B. A., Berger, E., Soderberg, A. M., et al. 2011, Natur, 476, 425
15
The Astrophysical Journal, 819:51 (15pp), 2016 March 1 Levan et al.
Copyright © 2022 FDOKUMEN