Intermediate Filaments in Muscle and Epithelial Cells of ...
arX
iv:0
807.
3526
v2 [
astr
o-ph
] 22
Oct
200
8SUBMITTED TO THE ASTROPHYSICALJOURNALPreprint typeset using LATEX style emulateapj v. 05/04/06
THE X-RAY CAVITIES, FILAMENTS AND COLD FRONTS IN THE CORE OF THE GALAXY GROUPNGC 5044
FABIO GASTALDELLO1,2,3, DAVID A. BUOTE3, PASQUALE TEMI4,5, FABRIZIO BRIGHENTI6,7, WILLIAM G. MATHEWS7 & STEFANOETTORI8,9
Submitted to the Astrophysical Journal
ABSTRACTWe present a two-dimensional analysis of the bright nearby galaxy group NGC 5044 using the currently
availableChandraandXMM data. In the inner 10 kpc a pair of cavities are evident together with a set of brightX-ray filaments. If the cavities are interpreted as gas displaced by relativistic plasma inflated by an AGN, evenin the absence of extended 1.4 GHz emission, this would be consistent with a recent outburst as also indicatedby the extent of dust and Hα emission. The soft X-ray filaments coincident with Hα and dust emission arecooler than the ones which do not correlate with optical and infrared emission. We suggest that dust-aidedcooling contributes to form warm (T ∼ 104 K) gas, emitting Hα radiation. At 31 kpc and 67 kpc a pair of coldfronts are present, indicative of sloshing due to a dynamical perturbation caused by accretion of a less massivegroup, also suggested by the peculiar velocity of the brightest galaxy NGC 5044 with respect to the mean groupvelocity.
Subject headings:cooling flows — galaxies: clusters: general — galaxies: clusters: individual(NGC 5044) — X-rays: galaxies: clusters
1. INTRODUCTION
The current X-ray observatories,ChandraandXMM, haverevolutionized our understanding of the cores of relaxedgalaxies, groups and clusters, which show a highly peaked X-ray emission from a hot interstellar medium whose radiativecooling time is less than 1 Gyr (for recent determinations ofcooling times in these objects see for example Voigt & Fabian2004; Sanderson et al. 2006; Jetha et al. 2007). In the ab-sence of heating, a cooling flow is established, in which thegas cools, condenses and flows toward the center, accretingonto the central galaxy (Fabian 1994). However the masssink for all this supposedly cooling and condensing gas hasnever been found (Donahue & Voit 2004). X-ray observa-tions with ChandraandXMM have established that there islittle evidence for emission from gas cooling below∼ Tvir/3:just when gas should be cooling most rapidly it appears not tobe cooling at all (see the recent review by Peterson & Fabian2006, and references therein).
A compensating heat source must therefore resupply theradiative losses, and many possibilities have been proposed,including thermal conduction (e.g., Narayan & Medvedev2001), energy released by mergers (e.g., Motl et al. 2004)or by supernovae (e.g., Silk et al. 1986). However, feedbackfrom the central AGN has become the most appealing solution
1 IASF-Milano, INAF, via Bassini 15, Milano 20133, Italy2 Occhialini Fellow3 Department of Physics and Astronomy, University of California at Irvine,
4129 Frederick Reines Hall, Irvine, CA 92697-45754 Astrophysics Branch, NASA/Ames Research Center, MS 245-6,Moffet
Field, CA 940355 SETI Institute, Mountain View, CA 94043; and Department of physics
and Astronomy, University of Western Ontario, London ON N6A, 3K7,Canada
6 Dipartimento di Astronomia, Università di Bologna, via Ranzani 1,Bologna 40127, Italy
7 UCO/Lick Observatory, University of California at Santa Cruz, 1156High Street, Santa Cruz, CA 95064
8 INAF, Osservatorio Astronomico di Bologna, via Ranzani 1, Bologna40127, Italy
9 INFN, Sezione di Bologna, viale Berti Pichat 6/2, I-40127 Bologna, Italy
to the problem (see the recent review by McNamara & Nulsen2007, and references therein). There is, in fact, clear obser-vational evidence for AGN heating as the majority of bright-est central galaxies of clusters and groups host a radio loudAGN (e.g., Burns 1990; Best et al. 2007) and, following thelaunch ofChandra, in an increasing number of objects suchdisturbances as shocks, ripples and cavities have been foundin the central atmospheres of clusters, groups and ellipticalgalaxies (e.g., Fabian et al. 2006; Bîrzan et al. 2004; Dunn &Fabian 2006; Forman et al. 2005; Vrtilek et al. 2002; Jethaet al. 2007; Croston et al. 2008; Finoguenov & Jones 2001;Allen et al. 2006). The cavities, which appear as X-ray sur-face brightness depressions, have been interpreted as bubblesof low density relativistic plasma inflated by radio jets, dis-placing the thermal gas causingPdV heating (e.g., Churazovet al. 2002), although Mathews & Brighenti (2008) pointedout that cavity formation contributes thermal energy that mayoffset radiative cooling only by injecting ultra-hot but non rel-ativistic gas; X-ray cavities formed solely from relativistic gashave a global cooling effect. In most cases, the energy intro-duced by the AGN is more than sufficient to counteract puta-tive cooling flows (McNamara & Nulsen 2007), although thephysical process of the coupling of the feedback energy withthe ambient medium is not well understood. While many ofthe observed X-ray cavities are filled with plasma emitting inthe radio at 1.4 GHz, some are undetected at this frequencyand have been referred to as “ghost cavities”. These may re-sult from the aging of the relativistic particle populationandbe the signature of a previous AGN outburst. Observations atlow radio frequency of several rich clusters with ghost cavitiesshow that they are indeed filled with relativistic plasma (e.g.,A 2597, Clarke et al. 2005), although even low frequencyemission cannot be easily detected.
However, some net cooling is probably occurring, as thegalaxies at the center of cool cores show properties not sharedby typical elliptical galaxies (Crawford 2004): 1) the pres-ence of strong, low-ionization emission line nebulae both inclusters (e.g., Crawford et al. 1999; Conselice et al. 2001)and in groups (e.g. Macchetto et al. 1996); 2) the galaxies

2 Gastaldello et al.
at the center of clusters that display these nebular emissionshow a component of excess ultraviolet/blue continuum asso-ciated with young stars (e.g., Cardiel et al. 1998; Crawfordet al. 1999). This excess blue light is again extended on scalesof several kpc and there is evidence that some (spatially ex-tended) star formation has been triggered by interaction withthe radio source (McNamara 2004) 3) CO emission lines havebeen detected in several cool core clusters at millimeter wave-lengths (e.g., Edge 2001; Salomé & Combes 2003), implyingthe presence of a substantial amount of warm molecular gas(109−11.5 M⊙) within a 50 kpc radius of the central galaxy.Less massive warmer molecular regions have been observedin H2 lines, which are often spatially associated with the stel-lar UV and Hα emission extending over∼ 20 kpc (Jaffe et al.2005).
The origin and excitation mechanism of the nebular Hαemission have been much debated and they are still poorlyknown. The nebulae require a constant and distributed heatingsource (e.g. Johnstone & Fabian 1988) which could be stellar(e.g. massive OB stars, Allen et al. 1992) or the ICM (e.g.conduction, Sparks et al. 1989). DeepChandraX-ray imag-ing of Perseus (Fabian et al. 2003b) and M87 (Sparks et al.2004) have renewed interest in conduction because of the spa-tial coincidence of filamentary Hα and soft X-ray emission,which can be due to conduction and mixing of the cold gaswith the ICM. The disposition of some of the optical fila-ments in Perseus strongly suggests that the filaments are dueto the buoyant radio bubbles drawing out the cold gas from acentral reservoir (Fabian et al. 2003b) and it reveals the pos-sibility of tracing the flow of the rising bubbles (Hatch et al.2006). But the question is still open if galaxy-galaxy interac-tions are required to stimulate the central optical nebulaeandif the optical filaments are trails of galaxies punching througha molecular hydrogen reservoir as suggested by the examplesin Wilman et al. (2006). The excitement caused by the shiftin the cooling flow paradigm is stimulating also a renewedtheoretical interest in the quest for the origin and excitationof molecular (Ferland et al. 2008) and Hα emission (Nipoti& Binney 2004; Pope et al. 2008; Revaz et al. 2008). In par-ticular Nipoti & Binney (2004) have shown how the Hα neb-ulae can be stable against thermal evaporation only for theconditions of temperature and pressure found in cool cores,explaining their association with that type of environment.
High resolutionChandraobservations have also revealedanother interesting and unexpected feature in the ICM of re-laxed clusters: the presence of cold fronts. Many clusters havebeen found to exhibit sharp arc-shaped jumps in their gas den-sity and temperature which, unlike shock fronts, have the gason the dense side cooler, so the pressure is continuous acrossthe front (e.g., Markevitch et al. 2000; Vikhlinin et al. 2001).In merging systems they were interpreted as contact disconti-nuities between gases from different sub-clusters (Markevitchet al. 2000). However cold fronts are present in the centersof many, if not most, relaxed clusters with cool cores (e.g.,Mazzotta et al. 2001; Markevitch et al. 2003; Dupke & White2003; Ascasibar & Markevitch 2006; Ghizzardi et al. 2007).The widely accepted scenario is that cold fronts in these sys-tems are due to sloshing of the cool gas in the central gravita-tional potential, which is set off by minor mergers/accretions;the only necessary condition is a steep entropy profile as ob-served in relaxed clusters (Ascasibar & Markevitch 2006).
Whereas a growing number of clusters and elliptical galax-ies have deep enough multi-wavelength data (X-rays, radioand optical) to study the rich phenomenology of cool cores
in a detailed spatially resolved fashion, only an handful ofgroups with such coverage exists, as for example the GEMSobjects (Osmond & Ponman 2004) presented in Rasmussen& Ponman (2007), and therefore, “unfortunately, AGN heat-ing is not as well studied in groups as in clusters” (McNa-mara & Nulsen 2007). Examination of AGN feedback at themass scale of groups is valuable because, although the scaleof outbursts in groups is less energetic and often on a smallerspatial scale than in clusters, the impact can be even moredramatic than in rich clusters due to the shallower group po-tential. Statistical studies examining the impact of AGN ongroups are starting to address the points raised above (Cros-ton et al. 2005; Jetha et al. 2007). Cold fronts have not beeninvestigated in detail so far in relaxed groups of galaxies.
In this paper we show with more detail the currently avail-ableChandraandXMM data for the galaxy group NGC 5044,one of the brightest groups in X-rays: it is one of the only 5objects with kT < 2 keV in the HIFLUGCS sample (Reiprich& Böhringer 2002). Our estimate, using the newChandraandXMM data, for the bolometric (0.1-100 keV) X-ray lu-minosity within r500 = 443h−1
70 kpc (Gastaldello et al. 2007b)is 1.05±0.06×1043h−2
70 erg s−1, in good agreement with theROSATestimate presented in Reiprich & Böhringer (2002)of 2.46×1043h−2
50 within 560h−150 kpc. In our previous analy-
sis, mainly focused on radial, azimuthally averaged propertiesof the system (Buote et al. 2003a,b), interesting features likeholes and filaments within 10 kpc, a sharp edge, resemblinga cold front, at 67 kpc, and unusually low iron abundances atlarge radii (Buote et al. 2004) were already pointed out. AnHα nebula is present in the core of NGC 5044 showing anextended filamentary structure (Goudfrooij et al. 1994a; Caonet al. 2000). NGC 5044 is also remarkable becauseSpitzerdata show extended cold dust emitting at 70µm (Temi et al.2007a). Moreover, Temi et al. (2007b) showed extended 8µmexcess (likely arising from PAH, polycyclic aromatic hydro-carbon, molecules) extending out to several kpc and spatiallycoincident with the Hα emitting nebulosity and the brightestsoft X-ray emission. As proposed in Temi et al. (2007b), cur-rent evidence is consistent with an internal origin of this dust,which has been buoyantly transported from the galactic coreout to several kpc into the hot X-ray emitting gas followingan AGN outburst.
All distance-dependent quantities have been computed as-sumingH0= 70 km s−1 Mpc−1, Ωm= 0.3 andΩΛ= 0.7. At theredshift ofz= 0.009 1′ corresponds to 11.1 kpc. All the errorsquoted are at the 68% confidence limit.
2. OBSERVATIONS AND DATA PREPARATION
NGC 5044 has been observed byChandrawith the ACIS-Sconfiguration on September 1999 (obsID 798) for 20.7 ks andby XMM on January 2001 (obsID 0037950101) with the EPICMOS and pn cameras for 23 and 20 ks, respectively (see alsoBuote et al. 2003a,b). We focused mainly on theChandradata because its PSF is much better suited for the high-spatialresolution study that constitutes most of the paper. We takeadvantage of theXMM data when we discuss the properties atlarger radii (see section §3.2 and §4.2) where the resolutionrequirements are not so important and we can benefit fromthe larger accessible field. Here we provide just a brief de-scription of the data preparation, more details can be foundinGastaldello et al. (2007b).
2.1. Chandra
The X-ray cavities, filaments and cold fronts of NGC 5044 3
198.875 198.870 198.865 198.860 198.855 198.850 198.845 198.840 198.835 198.830
-16.370
-16.375
-16.380
-16.385
-16.390
-16.395
-16.400
-16.405
-16.410
Right ascension
Dec
linat
ion
NGC 5044
30 arcsec
5 kpc
8 18 8138
NE filament
NW filament
N cavity
S cavity
SW filament
SE filament
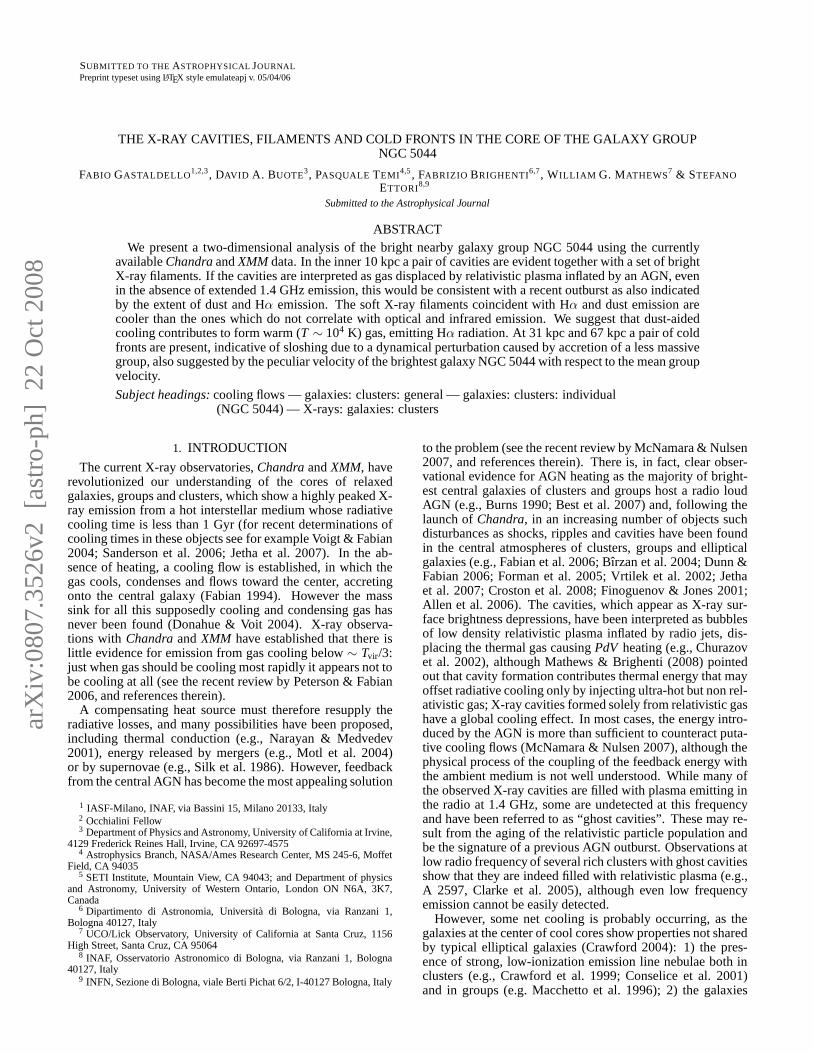
FIG. 1.— Chandra0.5-5 keV X-ray image of the inner 30x30 kpc ofNGC 5044. The image has been processed to remove point sources, flatfielded with a 1.0 keV exposure map. The figure has been contourbinned us-ing the algorithm of Sanders (2006) with a S/N of 10. Color barunits are totalcounts per pixel. Interesting features discussed in the text are highlighted.
The data were analyzed with the X-ray analysis packagesCIAO 3.4 andHeasoft6.4 in conjunction with theChandracalibration database (Caldb) version 3.4.2. In order to en-sure the most up-to-date calibration, all data were reprocessedfrom the “level 1” events files, following the standardChan-dra data-reduction threads10. We applied the standard cor-rections to take account of a time-dependent drift in the de-tector gain and charge transfer inefficiency, as implementedin the CIAO tools. From low surface brightness regions ofthe active chips we extracted a light-curve (5.0-10.0 keV) toidentify and excise periods of enhanced background. The ob-servation was quiescent resulting in a final exposure time of20 ks. Point source detection was performed using theCIAOtool wavdetect and removed, so as not to contaminate thediffuse emission, using appropriate elliptical regions contain-ing 99% of their flux. We generated an image in the 0.5-5.0keV and a corresponding exposure map computed at an en-ergy of 1.0 keV. A zoom of the image in the inner region ispresented in Fig.1 and Fig.10 and the the region covered bythe ACIS-S3 chip is presented in Fig.4.
2.2. XMM
We generated calibrated event files with SAS v7.1.0 usingthe tasksemchainandepchain. We considered only event pat-terns 0-12 for MOS and 0 for pn, and the data were cleanedusing the standard procedures for bright pixels and hot columnremoval and pn out-of-time correction. Periods of high back-ground due to soft protons were filtered as in Gastaldello et al.(2007b) resulting in a net exposure time of 22 ks for MOS1and MOS2 and 17ks for pn. For each detector, we created im-ages in the 0.5-2 keV band with point sources detected usingthe taskewavelet and masked using circular regions of 25radius centered at the source position. We created exposuremaps for each detector and we combined the MOS imagesinto a single exposure-corrected image, smoothed on a scaleof 10′′, shown in Fig.5.
10 http://cxc.harvard.edu/ciao/threads/index.html
198.870 198.860 198.850 198.840 198.830
-16.370
-16.375
-16.380
-16.385
-16.390
-16.395
-16.400
-16.405
-16.410
Right ascension
Dec
linat
ion
NGC 5044
Sector VI
Sector V
Sector IV
Sector IIISector II
Sector I
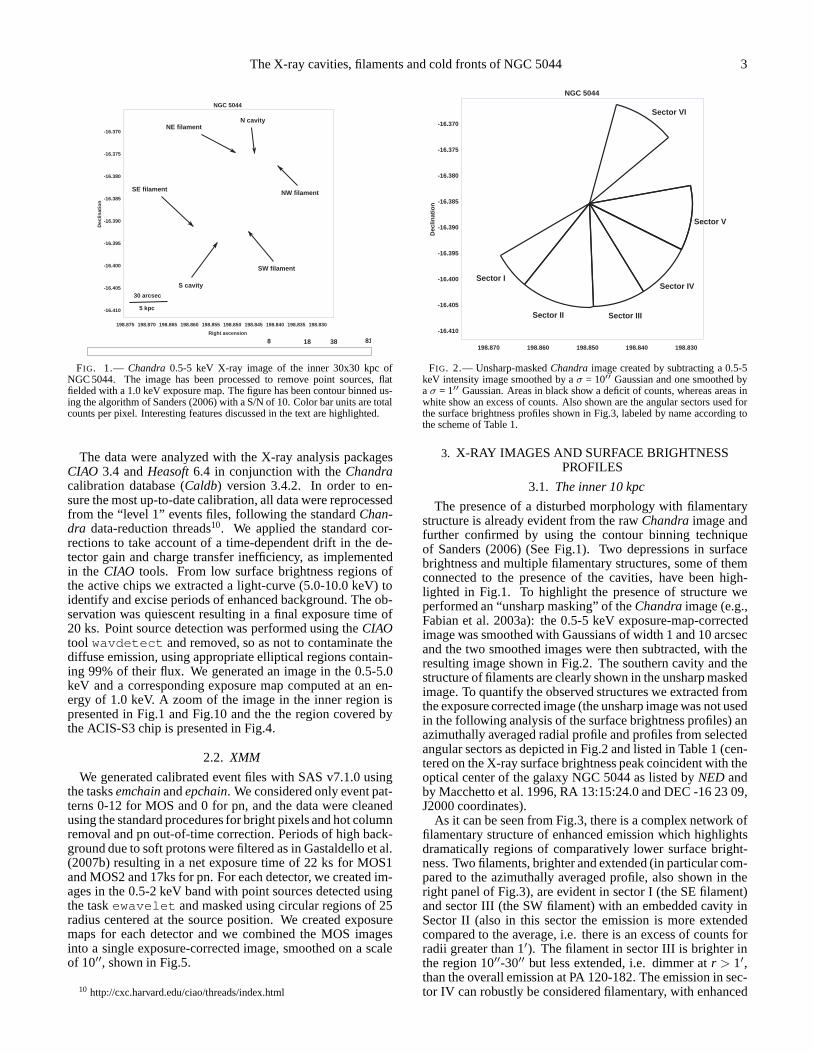
FIG. 2.— Unsharp-maskedChandraimage created by subtracting a 0.5-5keV intensity image smoothed by aσ = 10′′ Gaussian and one smoothed byaσ = 1′′ Gaussian. Areas in black show a deficit of counts, whereas areas inwhite show an excess of counts. Also shown are the angular sectors used forthe surface brightness profiles shown in Fig.3, labeled by name according tothe scheme of Table 1.
3. X-RAY IMAGES AND SURFACE BRIGHTNESSPROFILES
3.1. The inner 10 kpc
The presence of a disturbed morphology with filamentarystructure is already evident from the rawChandraimage andfurther confirmed by using the contour binning techniqueof Sanders (2006) (See Fig.1). Two depressions in surfacebrightness and multiple filamentary structures, some of themconnected to the presence of the cavities, have been high-lighted in Fig.1. To highlight the presence of structure weperformed an “unsharp masking” of theChandraimage (e.g.,Fabian et al. 2003a): the 0.5-5 keV exposure-map-correctedimage was smoothed with Gaussians of width 1 and 10 arcsecand the two smoothed images were then subtracted, with theresulting image shown in Fig.2. The southern cavity and thestructure of filaments are clearly shown in the unsharp maskedimage. To quantify the observed structures we extracted fromthe exposure corrected image (the unsharp image was not usedin the following analysis of the surface brightness profiles) anazimuthally averaged radial profile and profiles from selectedangular sectors as depicted in Fig.2 and listed in Table 1 (cen-tered on the X-ray surface brightness peak coincident with theoptical center of the galaxy NGC 5044 as listed byNED andby Macchetto et al. 1996, RA 13:15:24.0 and DEC -16 23 09,J2000 coordinates).
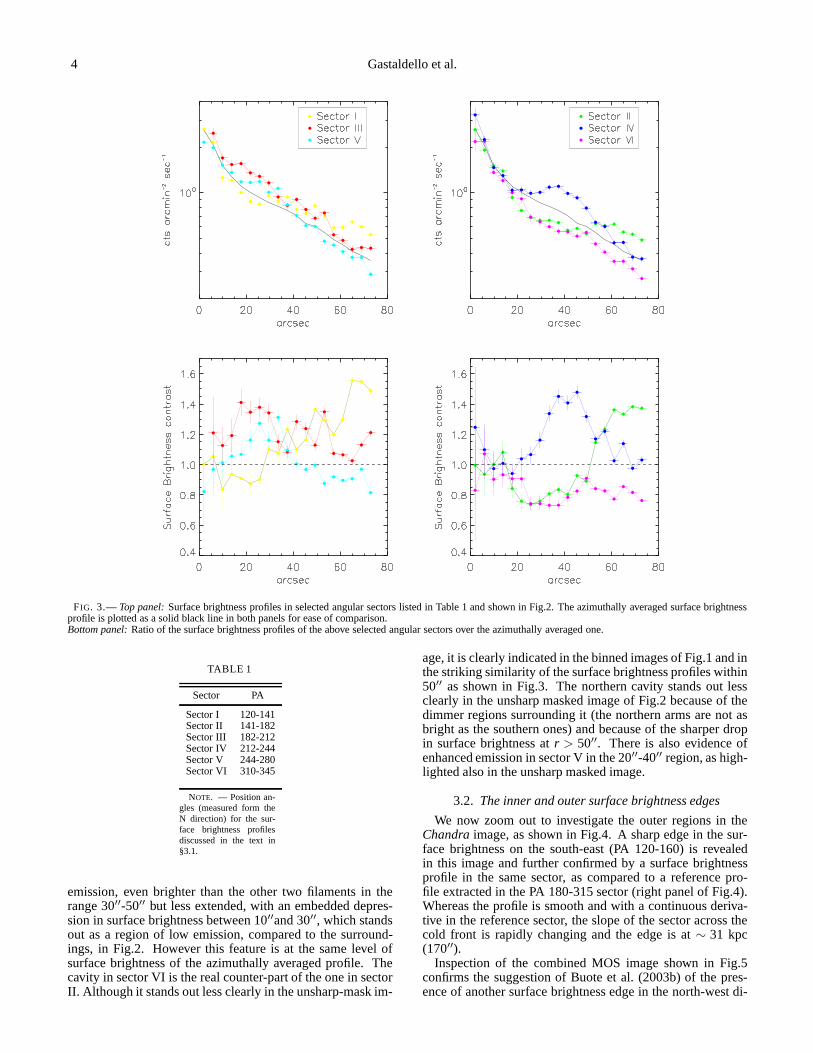
As it can be seen from Fig.3, there is a complex network offilamentary structure of enhanced emission which highlightsdramatically regions of comparatively lower surface bright-ness. Two filaments, brighter and extended (in particular com-pared to the azimuthally averaged profile, also shown in theright panel of Fig.3), are evident in sector I (the SE filament)and sector III (the SW filament) with an embedded cavity inSector II (also in this sector the emission is more extendedcompared to the average, i.e. there is an excess of counts forradii greater than 1′). The filament in sector III is brighter inthe region 10′′-30′′ but less extended, i.e. dimmer atr > 1′,than the overall emission at PA 120-182. The emission in sec-tor IV can robustly be considered filamentary, with enhanced
4 Gastaldello et al.
FIG. 3.—Top panel:Surface brightness profiles in selected angular sectors listed in Table 1 and shown in Fig.2. The azimuthally averaged surface brightnessprofile is plotted as a solid black line in both panels for easeof comparison.Bottom panel:Ratio of the surface brightness profiles of the above selected angular sectors over the azimuthally averaged one.
TABLE 1
Sector PA
Sector I 120-141Sector II 141-182Sector III 182-212Sector IV 212-244Sector V 244-280Sector VI 310-345
NOTE. — Position an-gles (measured form theN direction) for the sur-face brightness profilesdiscussed in the text in§3.1.
emission, even brighter than the other two filaments in therange 30′′-50′′ but less extended, with an embedded depres-sion in surface brightness between 10′′and 30′′, which standsout as a region of low emission, compared to the surround-ings, in Fig.2. However this feature is at the same level ofsurface brightness of the azimuthally averaged profile. Thecavity in sector VI is the real counter-part of the one in sectorII. Although it stands out less clearly in the unsharp-mask im-
age, it is clearly indicated in the binned images of Fig.1 andinthe striking similarity of the surface brightness profiles within50′′ as shown in Fig.3. The northern cavity stands out lessclearly in the unsharp masked image of Fig.2 because of thedimmer regions surrounding it (the northern arms are not asbright as the southern ones) and because of the sharper dropin surface brightness atr > 50′′. There is also evidence ofenhanced emission in sector V in the 20′′-40′′ region, as high-lighted also in the unsharp masked image.
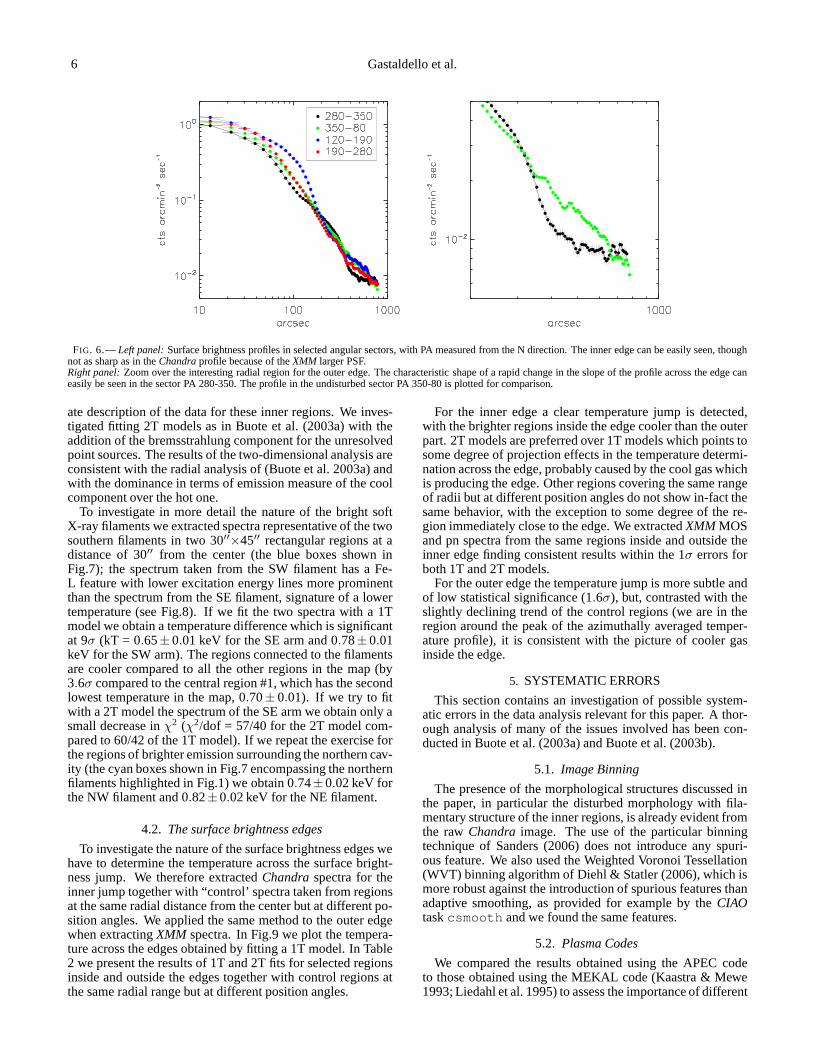
3.2. The inner and outer surface brightness edges
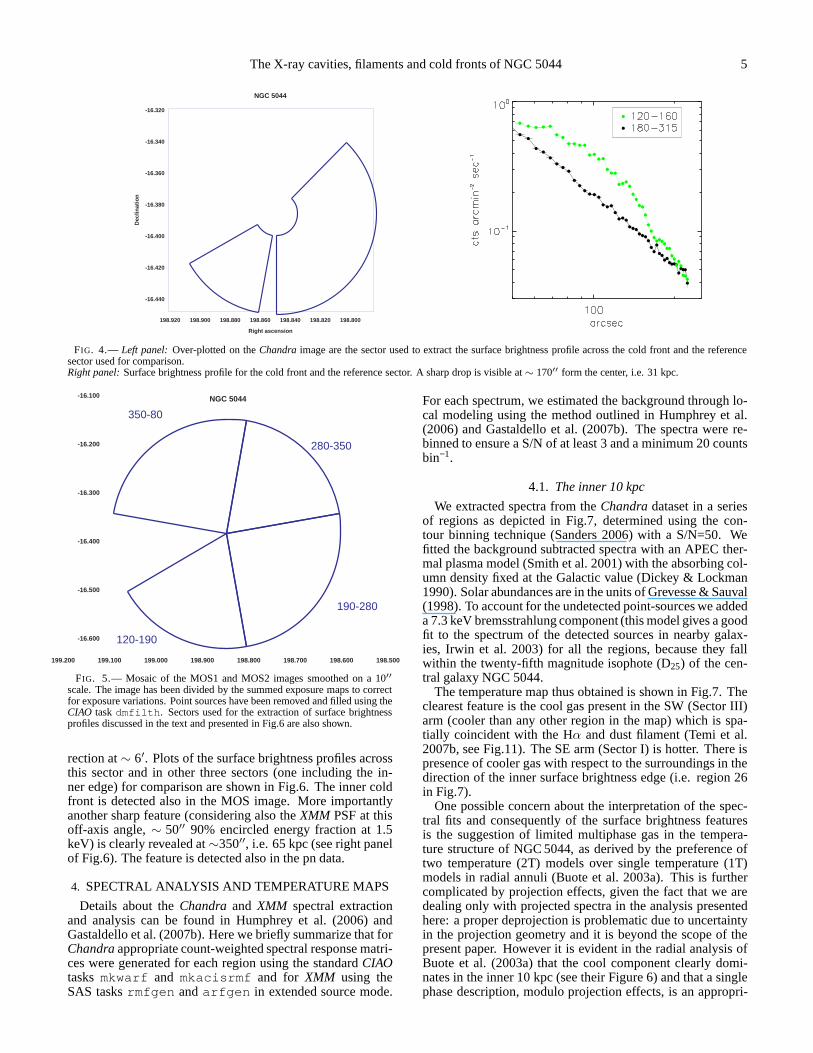
We now zoom out to investigate the outer regions in theChandraimage, as shown in Fig.4. A sharp edge in the sur-face brightness on the south-east (PA 120-160) is revealedin this image and further confirmed by a surface brightnessprofile in the same sector, as compared to a reference pro-file extracted in the PA 180-315 sector (right panel of Fig.4).Whereas the profile is smooth and with a continuous deriva-tive in the reference sector, the slope of the sector across thecold front is rapidly changing and the edge is at∼ 31 kpc(170′′).
Inspection of the combined MOS image shown in Fig.5confirms the suggestion of Buote et al. (2003b) of the pres-ence of another surface brightness edge in the north-west di-
The X-ray cavities, filaments and cold fronts of NGC 5044 5
198.920 198.900 198.880 198.860 198.840 198.820 198.800
-16.320
-16.340
-16.360
-16.380
-16.400
-16.420
-16.440
Right ascension
Dec
linat
ion
NGC 5044
FIG. 4.— Left panel:Over-plotted on theChandraimage are the sector used to extract the surface brightness profile across the cold front and the referencesector used for comparison.Right panel:Surface brightness profile for the cold front and the reference sector. A sharp drop is visible at∼ 170′′ form the center, i.e. 31 kpc.
199.200 199.100 199.000 198.900 198.800 198.700 198.600 198.500
-16.100
-16.200
-16.300
-16.400
-16.500
-16.600
NGC 5044
350-80
120-190
190-280
280-350
FIG. 5.— Mosaic of the MOS1 and MOS2 images smoothed on a 10′′
scale. The image has been divided by the summed exposure mapsto correctfor exposure variations. Point sources have been removed and filled using theCIAO taskdmfilth. Sectors used for the extraction of surface brightnessprofiles discussed in the text and presented in Fig.6 are alsoshown.
rection at∼ 6′. Plots of the surface brightness profiles acrossthis sector and in other three sectors (one including the in-ner edge) for comparison are shown in Fig.6. The inner coldfront is detected also in the MOS image. More importantlyanother sharp feature (considering also theXMM PSF at thisoff-axis angle,∼ 50′′ 90% encircled energy fraction at 1.5keV) is clearly revealed at∼350′′, i.e. 65 kpc (see right panelof Fig.6). The feature is detected also in the pn data.
4. SPECTRAL ANALYSIS AND TEMPERATURE MAPS
Details about theChandraand XMM spectral extractionand analysis can be found in Humphrey et al. (2006) andGastaldello et al. (2007b). Here we briefly summarize that forChandraappropriate count-weighted spectral response matri-ces were generated for each region using the standardCIAOtasksmkwarf and mkacisrmf and for XMM using theSAS tasksrmfgen andarfgen in extended source mode.
For each spectrum, we estimated the background through lo-cal modeling using the method outlined in Humphrey et al.(2006) and Gastaldello et al. (2007b). The spectra were re-binned to ensure a S/N of at least 3 and a minimum 20 countsbin−1.
4.1. The inner 10 kpc
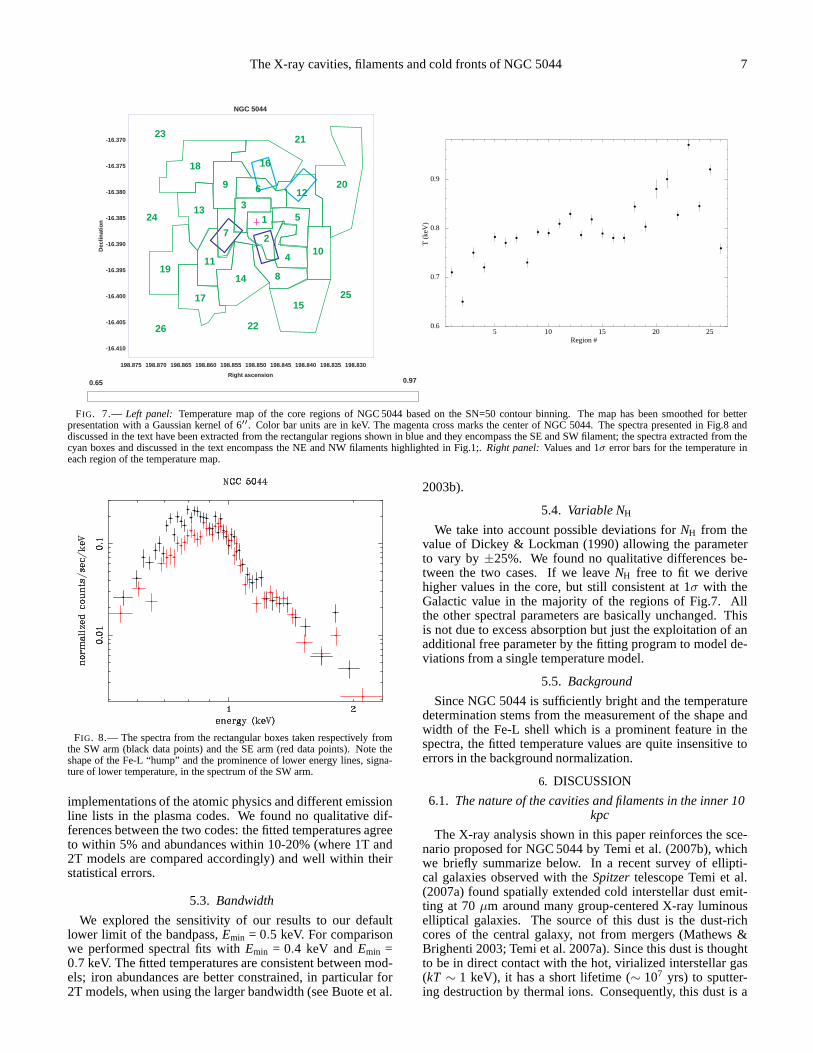
We extracted spectra from theChandradataset in a seriesof regions as depicted in Fig.7, determined using the con-tour binning technique (Sanders 2006) with a S/N=50. Wefitted the background subtracted spectra with an APEC ther-mal plasma model (Smith et al. 2001) with the absorbing col-umn density fixed at the Galactic value (Dickey & Lockman1990). Solar abundances are in the units of Grevesse & Sauval(1998). To account for the undetected point-sources we addeda 7.3 keV bremsstrahlung component (this model gives a goodfit to the spectrum of the detected sources in nearby galax-ies, Irwin et al. 2003) for all the regions, because they fallwithin the twenty-fifth magnitude isophote (D25) of the cen-tral galaxy NGC 5044.
The temperature map thus obtained is shown in Fig.7. Theclearest feature is the cool gas present in the SW (Sector III)arm (cooler than any other region in the map) which is spa-tially coincident with the Hα and dust filament (Temi et al.2007b, see Fig.11). The SE arm (Sector I) is hotter. There ispresence of cooler gas with respect to the surroundings in thedirection of the inner surface brightness edge (i.e. region26in Fig.7).
One possible concern about the interpretation of the spec-tral fits and consequently of the surface brightness featuresis the suggestion of limited multiphase gas in the tempera-ture structure of NGC 5044, as derived by the preference oftwo temperature (2T) models over single temperature (1T)models in radial annuli (Buote et al. 2003a). This is furthercomplicated by projection effects, given the fact that we aredealing only with projected spectra in the analysis presentedhere: a proper deprojection is problematic due to uncertaintyin the projection geometry and it is beyond the scope of thepresent paper. However it is evident in the radial analysis ofBuote et al. (2003a) that the cool component clearly domi-nates in the inner 10 kpc (see their Figure 6) and that a singlephase description, modulo projection effects, is an appropri-
6 Gastaldello et al.
FIG. 6.—Left panel:Surface brightness profiles in selected angular sectors, with PA measured from the N direction. The inner edge can be easily seen, thoughnot as sharp as in theChandraprofile because of theXMM larger PSF.Right panel:Zoom over the interesting radial region for the outer edge. The characteristic shape of a rapid change in the slope of the profile across the edge caneasily be seen in the sector PA 280-350. The profile in the undisturbed sector PA 350-80 is plotted for comparison.
ate description of the data for these inner regions. We inves-tigated fitting 2T models as in Buote et al. (2003a) with theaddition of the bremsstrahlung component for the unresolvedpoint sources. The results of the two-dimensional analysisareconsistent with the radial analysis of (Buote et al. 2003a) andwith the dominance in terms of emission measure of the coolcomponent over the hot one.
To investigate in more detail the nature of the bright softX-ray filaments we extracted spectra representative of the twosouthern filaments in two 30′′×45′′ rectangular regions at adistance of 30′′ from the center (the blue boxes shown inFig.7); the spectrum taken from the SW filament has a Fe-L feature with lower excitation energy lines more prominentthan the spectrum from the SE filament, signature of a lowertemperature (see Fig.8). If we fit the two spectra with a 1Tmodel we obtain a temperature difference which is significantat 9σ (kT = 0.65±0.01 keV for the SE arm and 0.78±0.01keV for the SW arm). The regions connected to the filamentsare cooler compared to all the other regions in the map (by3.6σ compared to the central region #1, which has the secondlowest temperature in the map, 0.70± 0.01). If we try to fitwith a 2T model the spectrum of the SE arm we obtain only asmall decrease inχ2 (χ2/dof = 57/40 for the 2T model com-pared to 60/42 of the 1T model). If we repeat the exercise forthe regions of brighter emission surrounding the northern cav-ity (the cyan boxes shown in Fig.7 encompassing the northernfilaments highlighted in Fig.1) we obtain 0.74±0.02 keV forthe NW filament and 0.82±0.02 keV for the NE filament.
4.2. The surface brightness edges
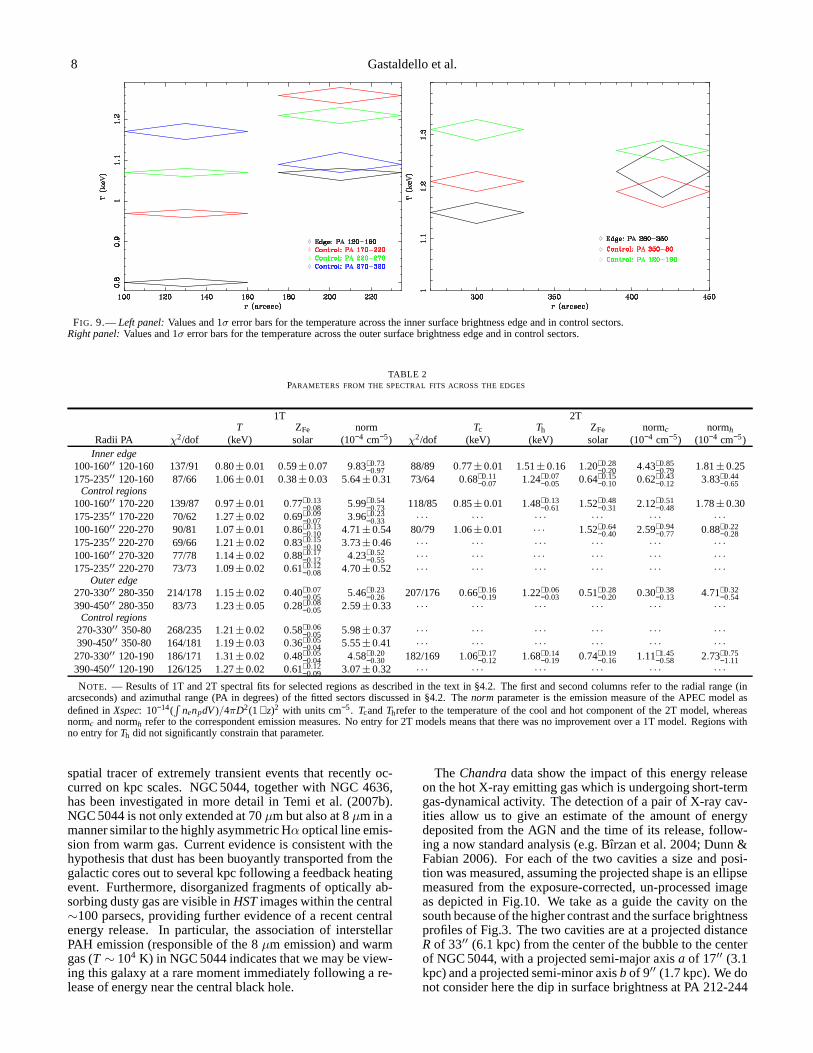
To investigate the nature of the surface brightness edges wehave to determine the temperature across the surface bright-ness jump. We therefore extractedChandraspectra for theinner jump together with “control’ spectra taken from regionsat the same radial distance from the center but at different po-sition angles. We applied the same method to the outer edgewhen extractingXMM spectra. In Fig.9 we plot the tempera-ture across the edges obtained by fitting a 1T model. In Table2 we present the results of 1T and 2T fits for selected regionsinside and outside the edges together with control regions atthe same radial range but at different position angles.
For the inner edge a clear temperature jump is detected,with the brighter regions inside the edge cooler than the outerpart. 2T models are preferred over 1T models which points tosome degree of projection effects in the temperature determi-nation across the edge, probably caused by the cool gas whichis producing the edge. Other regions covering the same rangeof radii but at different position angles do not show in-factthesame behavior, with the exception to some degree of the re-gion immediately close to the edge. We extractedXMM MOSand pn spectra from the same regions inside and outside theinner edge finding consistent results within the 1σ errors forboth 1T and 2T models.
For the outer edge the temperature jump is more subtle andof low statistical significance (1.6σ), but, contrasted with theslightly declining trend of the control regions (we are in theregion around the peak of the azimuthally averaged temper-ature profile), it is consistent with the picture of cooler gasinside the edge.
5. SYSTEMATIC ERRORS
This section contains an investigation of possible system-atic errors in the data analysis relevant for this paper. A thor-ough analysis of many of the issues involved has been con-ducted in Buote et al. (2003a) and Buote et al. (2003b).
5.1. Image Binning
The presence of the morphological structures discussed inthe paper, in particular the disturbed morphology with fila-mentary structure of the inner regions, is already evident fromthe rawChandra image. The use of the particular binningtechnique of Sanders (2006) does not introduce any spuri-ous feature. We also used the Weighted Voronoi Tessellation(WVT) binning algorithm of Diehl & Statler (2006), which ismore robust against the introduction of spurious features thanadaptive smoothing, as provided for example by theCIAOtaskcsmooth and we found the same features.
5.2. Plasma Codes
We compared the results obtained using the APEC codeto those obtained using the MEKAL code (Kaastra & Mewe1993; Liedahl et al. 1995) to assess the importance of different
The X-ray cavities, filaments and cold fronts of NGC 5044 7
198.875 198.870 198.865 198.860 198.855 198.850 198.845 198.840 198.835 198.830
-16.370
-16.375
-16.380
-16.385
-16.390
-16.395
-16.400
-16.405
-16.410
Right ascension
Dec
linat
ion
NGC 5044
0.65 0.97
26
25
24
23
22
21
20
19
18
17
16
15
14
13
12
1110
9
8
7
6
5
4
3
2
1
5 10 15 20 250.6
0.7
0.8
0.9
T (
keV
)
Region #
FIG. 7.— Left panel: Temperature map of the core regions of NGC 5044 based on the SN=50 contour binning. The map has been smoothed for betterpresentation with a Gaussian kernel of 6′′. Color bar units are in keV. The magenta cross marks the center of NGC 5044. The spectra presented in Fig.8 anddiscussed in the text have been extracted from the rectangular regions shown in blue and they encompass the SE and SW filament; the spectra extracted from thecyan boxes and discussed in the text encompass the NE and NW filaments highlighted in Fig.1;.Right panel:Values and 1σ error bars for the temperature ineach region of the temperature map.
FIG. 8.— The spectra from the rectangular boxes taken respectively fromthe SW arm (black data points) and the SE arm (red data points). Note theshape of the Fe-L “hump” and the prominence of lower energy lines, signa-ture of lower temperature, in the spectrum of the SW arm.
implementations of the atomic physics and different emissionline lists in the plasma codes. We found no qualitative dif-ferences between the two codes: the fitted temperatures agreeto within 5% and abundances within 10-20% (where 1T and2T models are compared accordingly) and well within theirstatistical errors.
5.3. Bandwidth
We explored the sensitivity of our results to our defaultlower limit of the bandpass,Emin = 0.5 keV. For comparisonwe performed spectral fits withEmin = 0.4 keV andEmin =0.7 keV. The fitted temperatures are consistent between mod-els; iron abundances are better constrained, in particularfor2T models, when using the larger bandwidth (see Buote et al.
2003b).
5.4. Variable NH
We take into account possible deviations forNH from thevalue of Dickey & Lockman (1990) allowing the parameterto vary by±25%. We found no qualitative differences be-tween the two cases. If we leaveNH free to fit we derivehigher values in the core, but still consistent at 1σ with theGalactic value in the majority of the regions of Fig.7. Allthe other spectral parameters are basically unchanged. Thisis not due to excess absorption but just the exploitation of anadditional free parameter by the fitting program to model de-viations from a single temperature model.
5.5. Background
Since NGC 5044 is sufficiently bright and the temperaturedetermination stems from the measurement of the shape andwidth of the Fe-L shell which is a prominent feature in thespectra, the fitted temperature values are quite insensitive toerrors in the background normalization.
6. DISCUSSION
6.1. The nature of the cavities and filaments in the inner 10kpc
The X-ray analysis shown in this paper reinforces the sce-nario proposed for NGC 5044 by Temi et al. (2007b), whichwe briefly summarize below. In a recent survey of ellipti-cal galaxies observed with theSpitzertelescope Temi et al.(2007a) found spatially extended cold interstellar dust emit-ting at 70µm around many group-centered X-ray luminouselliptical galaxies. The source of this dust is the dust-richcores of the central galaxy, not from mergers (Mathews &Brighenti 2003; Temi et al. 2007a). Since this dust is thoughtto be in direct contact with the hot, virialized interstellar gas(kT ∼ 1 keV), it has a short lifetime (∼ 107 yrs) to sputter-ing destruction by thermal ions. Consequently, this dust isa
8 Gastaldello et al.
FIG. 9.—Left panel:Values and 1σ error bars for the temperature across the inner surface brightness edge and in control sectors.Right panel:Values and 1σ error bars for the temperature across the outer surface brightness edge and in control sectors.
TABLE 2PARAMETERS FROM THE SPECTRAL FITS ACROSS THE EDGES
1T 2TT ZFe norm Tc Th ZFe normc normh
Radii PA χ2/dof (keV) solar (10−4 cm−5) χ
2/dof (keV) (keV) solar (10−4 cm−5) (10−4 cm−5)Inner edge
100-160′′ 120-160 137/91 0.80±0.01 0.59±0.07 9.83+0.73−0.97 88/89 0.77±0.01 1.51±0.16 1.20+0.28
−0.20 4.43+0.85−0.79 1.81±0.25
175-235′′ 120-160 87/66 1.06±0.01 0.38±0.03 5.64±0.31 73/64 0.68+0.11−0.07 1.24+0.07
−0.05 0.64+0.15−0.10 0.62+0.43
−0.12 3.83+0.44−0.65
Control regions100-160′′ 170-220 139/87 0.97±0.01 0.77+0.13
−0.08 5.99+0.54−0.73 118/85 0.85±0.01 1.48+0.13
−0.61 1.52+0.48−0.31 2.12+0.51
−0.48 1.78±0.30175-235′′ 170-220 70/62 1.27±0.02 0.69+0.09
−0.07 3.96+0.23−0.33 · · · · · · · · · · · · · · · · · ·
100-160′′ 220-270 90/81 1.07±0.01 0.86+0.13−0.10 4.71±0.54 80/79 1.06±0.01 · · · 1.52+0.64
−0.40 2.59+0.94−0.77 0.88+0.22
−0.28175-235′′ 220-270 69/66 1.21±0.02 0.83+0.15
−0.10 3.73±0.46 · · · · · · · · · · · · · · · · · ·
100-160′′ 270-320 77/78 1.14±0.02 0.88+0.17−0.12 4.23+0.52
−0.55 · · · · · · · · · · · · · · · · · ·
175-235′′ 220-270 73/73 1.09±0.02 0.61+0.12−0.08 4.70±0.52 · · · · · · · · · · · · · · · · · ·
Outer edge270-330′′ 280-350 214/178 1.15±0.02 0.40+0.07
−0.05 5.46+0.23−0.26 207/176 0.66+0.16
−0.19 1.22+0.06−0.03 0.51+0.28
−0.20 0.30+0.38−0.13 4.71+0.32
−0.54390-450′′ 280-350 83/73 1.23±0.05 0.28+0.08
−0.05 2.59±0.33 · · · · · · · · · · · · · · · · · ·
Control regions270-330′′ 350-80 268/235 1.21±0.02 0.58+0.06
−0.05 5.98±0.37 · · · · · · · · · · · · · · · · · ·
390-450′′ 350-80 164/181 1.19±0.03 0.36+0.05−0.04 5.55±0.41 · · · · · · · · · · · · · · · · · ·
270-330′′ 120-190 186/171 1.31±0.02 0.48+0.05−0.04 4.58+0.20
−0.30 182/169 1.06+0.17−0.12 1.68+0.14
−0.19 0.74+0.19−0.16 1.11+1.45
−0.58 2.73+0.75−1.11
390-450′′ 120-190 126/125 1.27±0.02 0.61+0.12−0.09 3.07±0.32 · · · · · · · · · · · · · · · · · ·
NOTE. — Results of 1T and 2T spectral fits for selected regions as described in the text in §4.2. The first and second columns referto the radial range (inarcseconds) and azimuthal range (PA in degrees) of the fittedsectors discussed in §4.2. Thenorm parameter is the emission measure of the APEC model asdefined inXspec: 10−14(
R
nenpdV)/4πD2(1+ z)2 with units cm−5. TcandThrefer to the temperature of the cool and hot component of the 2T model, whereasnormc and normh refer to the correspondent emission measures. No entry for 2T models means that there was no improvement over a 1T model. Regions withno entry forTh did not significantly constrain that parameter.
spatial tracer of extremely transient events that recentlyoc-curred on kpc scales. NGC 5044, together with NGC 4636,has been investigated in more detail in Temi et al. (2007b).NGC 5044 is not only extended at 70µm but also at 8µm in amanner similar to the highly asymmetric Hα optical line emis-sion from warm gas. Current evidence is consistent with thehypothesis that dust has been buoyantly transported from thegalactic cores out to several kpc following a feedback heatingevent. Furthermore, disorganized fragments of optically ab-sorbing dusty gas are visible inHSTimages within the central∼100 parsecs, providing further evidence of a recent centralenergy release. In particular, the association of interstellarPAH emission (responsible of the 8µm emission) and warmgas (T ∼ 104 K) in NGC 5044 indicates that we may be view-ing this galaxy at a rare moment immediately following a re-lease of energy near the central black hole.
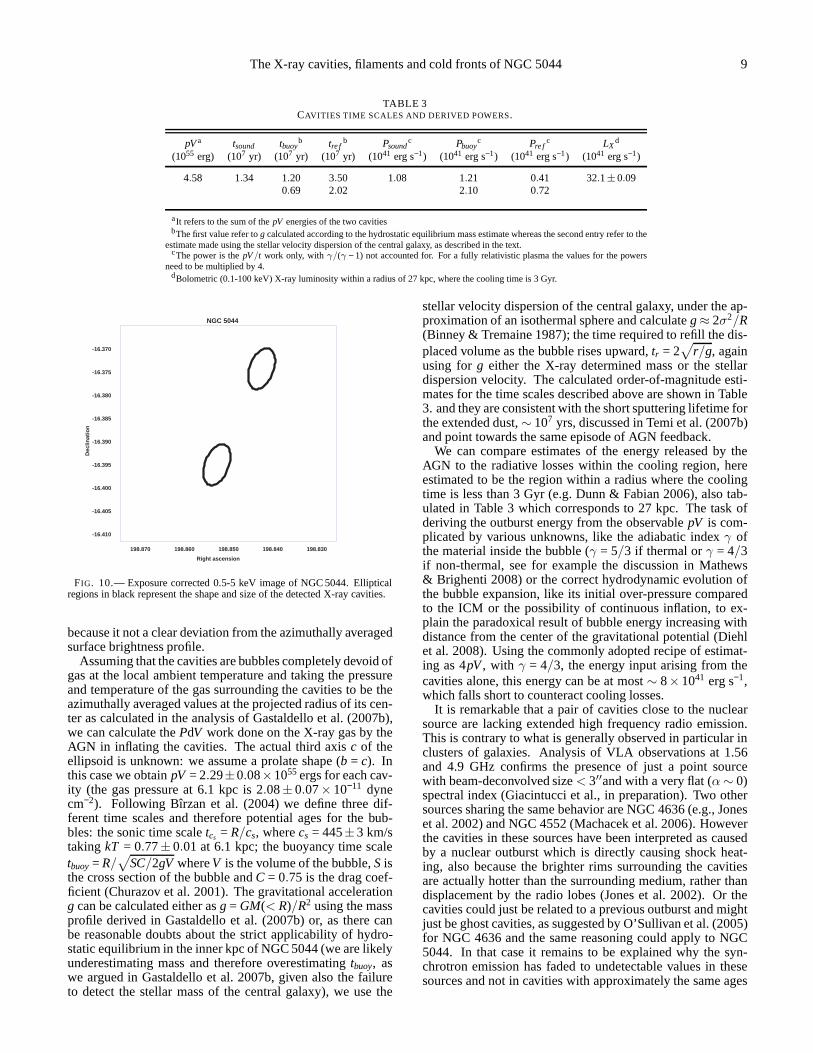
The Chandradata show the impact of this energy releaseon the hot X-ray emitting gas which is undergoing short-termgas-dynamical activity. The detection of a pair of X-ray cav-ities allow us to give an estimate of the amount of energydeposited from the AGN and the time of its release, follow-ing a now standard analysis (e.g. Bîrzan et al. 2004; Dunn &Fabian 2006). For each of the two cavities a size and posi-tion was measured, assuming the projected shape is an ellipsemeasured from the exposure-corrected, un-processed imageas depicted in Fig.10. We take as a guide the cavity on thesouth because of the higher contrast and the surface brightnessprofiles of Fig.3. The two cavities are at a projected distanceR of 33′′ (6.1 kpc) from the center of the bubble to the centerof NGC 5044, with a projected semi-major axisa of 17′′ (3.1kpc) and a projected semi-minor axisb of 9′′ (1.7 kpc). We donot consider here the dip in surface brightness at PA 212-244
The X-ray cavities, filaments and cold fronts of NGC 5044 9
TABLE 3CAVITIES TIME SCALES AND DERIVED POWERS.
pVa tsound tbuoyb tre f
b Psoundc Pbuoy
c Pre fc LX
d
(1055 erg) (107 yr) (107 yr) (107 yr) (1041 erg s−1) (1041 erg s−1) (1041 erg s−1) (1041 erg s−1)
4.58 1.34 1.20 3.50 1.08 1.21 0.41 32.1±0.090.69 2.02 2.10 0.72
aIt refers to the sum of thepV energies of the two cavitiesbThe first value refer tog calculated according to the hydrostatic equilibrium mass estimate whereas the second entry refer to the
estimate made using the stellar velocity dispersion of the central galaxy, as described in the text.cThe power is thepV/t work only, with γ/(γ − 1) not accounted for. For a fully relativistic plasma the values for the powers
need to be multiplied by 4.dBolometric (0.1-100 keV) X-ray luminosity within a radius of 27 kpc, where the cooling time is 3 Gyr.
198.870 198.860 198.850 198.840 198.830
-16.370
-16.375
-16.380
-16.385
-16.390
-16.395
-16.400
-16.405
-16.410
Right ascension
Dec
linat
ion
NGC 5044
FIG. 10.— Exposure corrected 0.5-5 keV image of NGC 5044. Ellipticalregions in black represent the shape and size of the detectedX-ray cavities.
because it not a clear deviation from the azimuthally averagedsurface brightness profile.
Assuming that the cavities are bubbles completely devoid ofgas at the local ambient temperature and taking the pressureand temperature of the gas surrounding the cavities to be theazimuthally averaged values at the projected radius of its cen-ter as calculated in the analysis of Gastaldello et al. (2007b),we can calculate thePdV work done on the X-ray gas by theAGN in inflating the cavities. The actual third axisc of theellipsoid is unknown: we assume a prolate shape (b = c). Inthis case we obtainpV = 2.29±0.08×1055 ergs for each cav-ity (the gas pressure at 6.1 kpc is 2.08± 0.07× 10⁻¹¹ dynecm−2). Following Bîrzan et al. (2004) we define three dif-ferent time scales and therefore potential ages for the bub-bles: the sonic time scaletcs = R/cs, wherecs = 445±3 km/stakingkT = 0.77± 0.01 at 6.1 kpc; the buoyancy time scaletbuoy= R/
√
SC/2gV whereV is the volume of the bubble,S isthe cross section of the bubble andC = 0.75 is the drag coef-ficient (Churazov et al. 2001). The gravitational accelerationg can be calculated either asg = GM(< R)/R2 using the massprofile derived in Gastaldello et al. (2007b) or, as there canbe reasonable doubts about the strict applicability of hydro-static equilibrium in the inner kpc of NGC 5044 (we are likelyunderestimating mass and therefore overestimatingtbuoy, aswe argued in Gastaldello et al. 2007b, given also the failureto detect the stellar mass of the central galaxy), we use the
stellar velocity dispersion of the central galaxy, under the ap-proximation of an isothermal sphere and calculateg≈ 2σ2/R(Binney & Tremaine 1987); the time required to refill the dis-placed volume as the bubble rises upward,tr = 2
√
r/g, againusing for g either the X-ray determined mass or the stellardispersion velocity. The calculated order-of-magnitude esti-mates for the time scales described above are shown in Table3. and they are consistent with the short sputtering lifetime forthe extended dust,∼ 107 yrs, discussed in Temi et al. (2007b)and point towards the same episode of AGN feedback.
We can compare estimates of the energy released by theAGN to the radiative losses within the cooling region, hereestimated to be the region within a radius where the coolingtime is less than 3 Gyr (e.g. Dunn & Fabian 2006), also tab-ulated in Table 3 which corresponds to 27 kpc. The task ofderiving the outburst energy from the observablepV is com-plicated by various unknowns, like the adiabatic indexγ ofthe material inside the bubble (γ = 5/3 if thermal orγ = 4/3if non-thermal, see for example the discussion in Mathews& Brighenti 2008) or the correct hydrodynamic evolution ofthe bubble expansion, like its initial over-pressure comparedto the ICM or the possibility of continuous inflation, to ex-plain the paradoxical result of bubble energy increasing withdistance from the center of the gravitational potential (Diehlet al. 2008). Using the commonly adopted recipe of estimat-ing as 4pV, with γ = 4/3, the energy input arising from thecavities alone, this energy can be at most∼ 8×1041 erg s−1,which falls short to counteract cooling losses.
It is remarkable that a pair of cavities close to the nuclearsource are lacking extended high frequency radio emission.This is contrary to what is generally observed in particularinclusters of galaxies. Analysis of VLA observations at 1.56and 4.9 GHz confirms the presence of just a point sourcewith beam-deconvolved size< 3′′and with a very flat (α ∼ 0)spectral index (Giacintucci et al., in preparation). Two othersources sharing the same behavior are NGC 4636 (e.g., Joneset al. 2002) and NGC 4552 (Machacek et al. 2006). Howeverthe cavities in these sources have been interpreted as causedby a nuclear outburst which is directly causing shock heat-ing, also because the brighter rims surrounding the cavitiesare actually hotter than the surrounding medium, rather thandisplacement by the radio lobes (Jones et al. 2002). Or thecavities could just be related to a previous outburst and mightjust be ghost cavities, as suggested by O’Sullivan et al. (2005)for NGC 4636 and the same reasoning could apply to NGC5044. In that case it remains to be explained why the syn-chrotron emission has faded to undetectable values in thesesources and not in cavities with approximately the same ages

10 Gastaldello et al.
198.870 198.860 198.850 198.840 198.830
-16.370
-16.375
-16.380
-16.385
-16.390
-16.395
-16.400
-16.405
-16.410
Right ascension
Dec
linat
ion
NGC 5044
FIG. 11.— Left Panel: Hα + [N II ] map of NGC 5044 taken from Caon et al. (2000).Right Panel: Surface brightness contours of the Hα + [N II] mapsuperimposed on the contour binned image of Fig.1.
in many other sources (e.g., Bîrzan et al. 2004). Other ghostcavity systems with a weak central radio source bearing noobvious relation to the observable cavities which are closetothe central galaxy are HCG 62 (Morita et al. 2006) and NGC741 (Jetha et al. 2008, where only one cavity is present). Sen-sitive low-frequency radio observations will shed furtherlighton this issue.
The association of dust, Hα and soft X-ray emissionshowed by Temi et al. (2007b) is also strengthened by theanalysis in this paper. The presence of the N cavity and inparticular of the relatively cooler emission in the NW filament(see §4.1) likely explains the origin of the N Hα filament. X-ray filaments are present at both sides of the cavities, but onlythe ones with the presence of dust are showing optical emis-sion andcooler X-ray emission (see Fig.11 and the analysisof §4.1). Temi et al. (2007b) showed that the cospatiality ofthese features can be explained as the result of dust-assistedcooling in an outflowing plume of hot dusty gas: dust can coolbuoyant gas to 104 K, which emits the optical emission linesobserved. The warm-gas phase is maintained in thermal equi-librium near∼ 104 K by radiative losses and likely a combi-nation of thermal conduction and UV heating from post-AGBstars (see the calculation of Tab.5 in Macchetto et al. 1996,ionization from post-AGB stars could explain only 42% ofthe optical line emission in NGC 5044). It is unfortunate thatthe deeper Hα observation of Caon et al. (2000), comparedto the one by Goudfrooij et al. (1994b) used in the compar-ison of Temi et al. (2007b), is affected by a CCD defect inthe southern region co-spatial to the X-ray cavity: it lookslike the nebular emission is more extended and can cover alsothe cavity. Another tantalizing evidence of the association ofthese three components comes for example from NGC 5846(Trinchieri & Goudfrooij 2002, and references therein). Evi-dence of PAH emission inSpitzerIRS spectra has been foundalso in NGC 1275 (Johnstone et al. 2007). It has been dis-cussed that AGN feedback can provide some heating (nega-tive feedback), but it can also be responsible for a positivefeedback, i.e. for inducing cold gas production (e.g., Pizzo-lato & Soker 2005; Revaz et al. 2008). In this scenario AGNfeedback itself is responsible for the production of overdenseblobs which cool rapidly producing Hα emitting gas, molec-
ular gas and star formation. Dust transported from the dustydisks of the central elliptical into the ICM by the episode ofAGN feedback acts as a catalyst for the cooling of the gas.It would be therefore interesting for the recent renewed the-oretical interest in the generation and survival of the opticalline emission filaments (Nipoti & Binney 2004; Revaz et al.2008; Pope et al. 2008) to include the neglected dust-assistedcooling in the energy balance equation.
6.2. The cold fronts and the dynamical state of the groupNGC 5044
The spectral analysis presented in §4.2 indicated that thepair of surface brightness discontinuities detected in theChandraandXMM images are cold fronts. Given the largescale relaxed morphology of NGC 5044 and its rising entropyprofile (Gastaldello et al. 2007a) as commonly observed forbright relaxed groups, the source nicely fits in the explanationfor the emergence of these features proposed by Ascasibar &Markevitch (2006) as due to gas sloshing caused by an off-axis merger with a smaller satellite. Another tell-tale signof this encounter, as also suggested by Ascasibar & Marke-vitch (2006), is the presence of a peculiar velocity of thecentral galaxy, which is often exhibited by central cD galax-ies in relaxed clusters (e.g., Oegerle & Hill 2001). IndeedNGC 5044 is known to have a∼ 150 km/s peculiar velocitywith respect to the mean group velocity (Mendel et al. 2008,and references therein). A sub-clump of galaxies statisticallysignificant to the Dressler-Schectman test (Dressler & Shect-man 1988) has been detected in the north-east outskirts of theNGC 5044 (Mendel et al. 2008) which might be the smallermerging sub-group responsible for the gas sloshing and thecold fronts. For a virial mass for NGC 5044 of 3.7×10¹³ M⊙
(Gastaldello et al. 2007b), assuming a mass ratio of 5 as inthe reference case of Ascasibar & Markevitch (2006) wouldimply a mass of∼ 8×10¹² M⊙ for the satellite. If this can-didate sub-clump is real, it would corroborate the proposedscenario and the mechanism proposed by Ascasibar & Marke-vitch (2006) for the formation of cold fronts (see also the caseof the cluster A 496, Dupke et al. 2007)
Surface brightness discontinuities as cold fronts have so farbeen discussed in many merging elliptical galaxies and groups
The X-ray cavities, filaments and cold fronts of NGC 5044 11
(e.g., NGC 1404, Machacek et al. 2005). An unusual discon-tinuity for the group NGC 507, interpreted as an abundancejump, closely related to the expansion of a radio lobe, hasbeen discussed by Kraft et al. (2004). NGC 5044 is to ourknowledge the first relaxed group for which cold fronts havebeen discussed in close similarity to the ubiquitous ones de-tected in relaxed clusters. Further examples, given enoughdata quality, are likely to be discovered: suggestions havealready been made for objects like MKW 4 and IC 1860(Gastaldello et al. 2007b).
7. CONCLUSIONS
We have presented results of a two-dimensional analysis ofthe currently availableChandraandXMM data for the brightnearby galaxy group NGC 5044. The results can be summa-rized as follows:
– A pair of X-ray cavities have been detected, further con-firming the recent outburst indicated by the extent andmorphology of Hα and dust emission.
– The presence of cooler filamentary X-ray emission co-spatial with Hα and dust emission strengthens our pre-vious suggestion that dust-aided cooling could con-tribute to the Hα emission.
– The presence of a set of two cold fronts together with apeculiar velocity of the central galaxy NGC 5044 sug-gests a disturbance of an overall relaxed system by anoff-axis merger with a smaller satellite.
The detection of such a rich phenomenology has been pos-sible due to NGC 5044 being bright and nearby, much like onbigger mass scales has been possible with M87 and Perseus.As for these objects up-coming deeper X-ray observationswith Chandra(David 2007) andXMM (Kaastra 2007) willshed further light on the properties of NGC 5044 and groupsof galaxies in general. Multi-wavelength observations, i.e. inHα and radio bands, are needed for a deeper understanding ofthe physical processes in the core.
We would like to thank N. Caon for kindly providing theHα image used in Figure 11 and for useful discussions; S. Gi-acintucci for sharing her results prior to publication and foruseful discussions; P.J. Humphrey for the use of hisChan-dra data reduction and analysis code; J. Sanders for the useof his contour binning code; L. Zappacosta for a critical read-ing of the manuscript; the anonymous referee for a carefulrreading and for suggestions that improved the work presentedhere. We made use of the WVT binning algorithm by Diehl& Statler (2006), which is a generalization of Cappellari &Copin’s (2003) Voronoi binning algorithm. F.G., F.B. and S.E.acknowledge the financial contribution from contract ASI-INAF I/023/05/0 and I/088/06/0. D.A.B. gratefully acknowl-edges partial support from NASA grant NNG04GE76G, is-sued through the Office of Space Sciences Long-Term SpaceAstrophysics Program.
Facilities: CXO, XMM
REFERENCES
Allen, S. W., Dunn, R. J. H., Fabian, A. C., Taylor, G. B., & Reynolds, C. S.2006, MNRAS, 372, 21
Allen, S. W., Edge, A. C., Fabian, A. C., Boehringer, H., Crawford, C. S.,Ebeling, H., Johnstone, R. M., Naylor, T., & Schwarz, R. A. 1992,MNRAS, 259, 67
Ascasibar, Y. & Markevitch, M. 2006, ApJ, 650, 102Best, P. N., von der Linden, A., Kauffmann, G., Heckman, T. M., & Kaiser,
C. R. 2007, MNRAS, 379, 894Binney, J. & Tremaine, S. 1987, Galactic dynamics (Princeton, NJ, Princeton
University Press, 1987, 747 p.)Bîrzan, L., Rafferty, D. A., McNamara, B. R., Wise, M. W., & Nulsen, P. E. J.
2004, ApJ, 607, 800Buote, D. A., Brighenti, F., & Mathews, W. G. 2004, ApJ, 607, L91Buote, D. A., Lewis, A. D., Brighenti, F., & Mathews, W. G. 2003a, ApJ, 594,
741—. 2003b, ApJ, 595, 151Burns, J. O. 1990, AJ, 99, 14Caon, N., Macchetto, D., & Pastoriza, M. 2000, ApJS, 127, 39Cardiel, N., Gorgas, J., & Aragon-Salamanca, A. 1998, MNRAS, 298, 977Churazov, E., Brüggen, M., Kaiser, C. R., Böhringer, H., & Forman, W. 2001,
ApJ, 554, 261Churazov, E., Sunyaev, R., Forman, W., & Böhringe r, H. 2002,MNRAS,
332, 729Clarke, T. E., Sarazin, C. L., Blanton, E. L., Neumann, D. M.,& Kassim,
N. E. 2005, ApJ, 625, 748Conselice, C. J., Gallagher, III, J. S., & Wyse, R. F. G. 2001,AJ, 122, 2281Crawford, C. S. 2004, in Clusters of Galaxies: Probes of Cosmological
Structure and Galaxy Evolution, ed. J. S. Mulchaey, A. Dressler, &A. Oemler
Crawford, C. S., Allen, S. W., Ebeling, H., Edge, A. C., & Fabian, A. C. 1999,MNRAS, 306, 857
Croston, J. H., Hardcastle, M. J., & Birkinshaw, M. 2005, MNRAS, 357, 279Croston, J. H., Hardcastle, M. J., Birkinshaw, M., Worrall,D. M., & Laing,
R. A. 2008, MNRAS, 386, 1709David, L. 2007, in Chandra Proposal, 2448–+Dickey, J. M. & Lockman, F. J. 1990, ARA&A, 28, 215Diehl, S., Li, H., Fryer, C., & Rafferty, D. 2008, ArXiv e-prints, 801Diehl, S. & Statler, T. S. 2006, MNRAS, 368, 497Donahue, M. & Voit, G. M. 2004, in Clusters of Galaxies: Probes of
Cosmological Structure and Galaxy Evolution, ed. J. S. Mulchaey,A. Dressler, & A. Oemler, 143–+
Dressler, A. & Shectman, S. A. 1988, AJ, 95, 985Dunn, R. J. H. & Fabian, A. C. 2006, MNRAS, 373, 959Dupke, R. & White, III, R. E. 2003, ApJ, 583, L13
Dupke, R. A., Mirabal, N., Bregman, J. N., & Evrard, A. E. 2007, ApJ, 668,781
Edge, A. C. 2001, MNRAS, 328, 762Fabian, A. C. 1994, ARA&A, 32, 277Fabian, A. C., Sanders, J. S., Allen, S. W., Crawford, C. S., Iwasawa, K.,
Johnstone, R. M., Schmidt, R. W., & Taylor, G. B. 2003a, MNRAS, 344,L43
Fabian, A. C., Sanders, J. S., Crawford, C. S., Conselice, C.J., Gallagher,J. S., & Wyse, R. F. G. 2003b, MNRAS, 344, L48
Fabian, A. C., Sanders, J. S., Taylor, G. B., Allen, S. W., Crawford, C. S.,Johnstone, R. M., & Iwasawa, K. 2006, MNRAS, 366, 417
Ferland, G. J., Fabian, A. C., Hatch, N. A., Johnstone, R. M.,Porter, R. L.,van Hoof, P. A. M., & Williams, R. J. R. 2008, MNRAS, 386, L72
Finoguenov, A. & Jones, C. 2001, ApJ, 547, L107Forman, W., Nulsen, P., Heinz, S., Owen, F., Eilek, J., Vikhlinin, A.,
Markevitch, M., Kraft, R., Churazov, E., & Jones, C. 2005, ApJ, 635, 894Gastaldello, F., Buote, D. A., Humphrey, P. J., Zappacosta,L., Brighenti,
F., & Mathews, W. G. 2007a, in Heating versus Cooling in Galaxies andClusters of Galaxies, ed. H. Böhringer, G. W. Pratt, A. Finoguenov, &P. Schuecker, 275–+
Gastaldello, F., Buote, D. A., Humphrey, P. J., Zappacosta,L., Bullock, J. S.,Brighenti, F., & Mathews, W. G. 2007b, ApJ, 669, 158
Ghizzardi, S., Molendi, S., Rossetti, M., & Leccardi, A. 2007, in Heatingversus Cooling in Galaxies and Clusters of Galaxies, ed. H. Böhringer,G. W. Pratt, A. Finoguenov, & P. Schuecker, 33–+
Goudfrooij, P., Hansen, L., Jorgensen, H. E., & Norgaard-Nielsen, H. U.1994a, A&AS, 105, 341
Goudfrooij, P., Hansen, L., Jorgensen, H. E., Norgaard-Nielsen, H. U., deJong, T., & van den Hoek, L. B. 1994b, A&AS, 104, 179
Grevesse, N. & Sauval, A. J. 1998, Space Science Reviews, 85,161Hatch, N. A., Crawford, C. S., Johnstone, R. M., & Fabian, A. C. 2006,
MNRAS, 367, 433Humphrey, P. J., Buote, D. A., Gastaldello, F., Zappacosta,L., Bullock, J. S.,
Brighenti, F., & Mathews, W. G. 2006, ApJ, 646, 899Irwin, J. A., Athey, A. E., & Bregman, J. N. 2003, ApJ, 587, 356Jaffe, W., Bremer, M. N., & Baker, K. 2005, MNRAS, 360, 748Jetha, N. N., Hardcastle, M. J., Babul, A., O’Sullivan, E., Ponman, T. J.,
Raychaudhury, S., & Vrtilek, J. 2008, MNRAS, 384, 1344Jetha, N. N., Ponman, T. J., Hardcastle, M. J., & Croston, J. H. 2007,
MNRAS, 376, 193Johnstone, R. M. & Fabian, A. C. 1988, MNRAS, 233, 581Johnstone, R. M., Hatch, N. A., Ferland, G. J., Fabian, A. C.,Crawford, C. S.,
& Wilman, R. J. 2007, MNRAS, 382, 1246
12 Gastaldello et al.
Jones, C., Forman, W., Vikhlinin, A., Markevitch, M., David, L., Warmflash,A., Murray, S., & Nulsen, P. E. J. 2002, ApJ, 567, L115
Kaastra, J. 2007, in XMM-Newton Proposal ID #05546802, 141–+Kaastra, J. S. & Mewe, R. 1993, A&AS, 97, 443Kraft, R. P., Forman, W. R., Churazov, E., Laslo, N., Jones, C., Markevitch,
M., Murray, S. S., & Vikhlinin, A. 2004, ApJ, 601, 221Liedahl, D. A., Osterheld, A. L., & Goldstein, W. H. 1995, ApJ, 438, L115Macchetto, F., Pastoriza, M., Caon, N., Sparks, W. B., Giavalisco, M., Bender,
R., & Capaccioli, M. 1996, A&AS, 120, 463Machacek, M., Dosaj, A., Forman, W., Jones, C., Markevitch,M., Vikhlinin,
A., Warmflash, A., & Kraft, R. 2005, ApJ, 621, 663Machacek, M., Nulsen, P. E. J., Jones, C., & Forman, W. R. 2006, ApJ, 648,
947Markevitch, M., Ponman, T. J., Nulsen, P. E. J., Bautz, M. W.,Burke, D. J.,
David, L. P., Davis, D., Donnelly, R. H., Forman, W. R., Jones, C., Kaastra,J., Kellogg, E., Kim, D.-W., Kolodziejczak, J., Mazzotta, P., Pagliaro, A.,Patel, S., Van Speybroeck, L., Vikhlinin, A., Vrtilek, J., Wise, M., & Zhao,P. 2000, ApJ, 541, 542
Markevitch, M., Vikhlinin, A., & Forman, W. R. 2003, in AstronomicalSociety of the Pacific Conference Series, Vol. 301, Astronomical Societyof the Pacific Conference Series, ed. S. Bowyer & C.-Y. Hwang,37–+
Mathews, W. G. & Brighenti, F. 2003, ApJ, 590, L5—. 2008, ArXiv e-prints, 805Mazzotta, P., Markevitch, M., Vikhlinin, A., Forman, W. R.,David, L. P., &
VanSpeybroeck, L. 2001, ApJ, 555, 205McNamara, B. R. 2004, in The Riddle of Cooling Flows in Galaxies and
Clusters of galaxies, ed. T. Reiprich, J. Kempner, & N. Soker, 177–+McNamara, B. R. & Nulsen, P. 2007, Annual Review of Astronomyand
Astrophysics, 45Mendel, J. T., Proctor, R. N., Forbes, D. A., & Brough, S. 2008, MNRAS,
389, 749Morita, U., Ishisaki, Y., Yamasaki, N. Y., Ota, N., Kawano, N., Fukazawa, Y.,
& Ohashi, T. 2006, PASJ, 58, 719
Motl, P. M., Burns, J. O., Loken, C., Norman, M. L. ., & Bryan, G. 2004,ApJ, 606, 635
Narayan, R. & Medvedev, M. V. 2001, ApJ, 562, L129Nipoti, C. & Binney, J. 2004, MNRAS, 349, 1509Oegerle, W. R. & Hill, J. M. 2001, AJ, 122, 2858Osmond, J. P. F. & Ponman, T. J. 2004, MNRAS, 350, 1511O’Sullivan, E., Vrtilek, J. M., & Kempner, J. C. 2005, ApJ, 624, L77Peterson, J. R. & Fabian, A. C. 2006, Phys. Rep., 427, 1Pizzolato, F. & Soker, N. 2005, ApJ, 632, 821Pope, E., Pittard, J., Hartquist, T., & Falle, S. 2008, ArXive-prints, 801Rasmussen, J. & Ponman, T. J. 2007, MNRAS, 380, 1554Reiprich, T. H. & Böhringer, H. 2002, ApJ, 567, 716Revaz, Y., Combes, F., & Salomé, P. 2008, A&A, 477, L33Salomé, P. & Combes, F. 2003, A&A, 412, 657Sanders, J. S. 2006, MNRAS, 371, 829Sanderson, A. J. R., Ponman, T. J., & O’Sullivan, E. 2006, MNRAS, 372,
1496Silk, J., Djorgovski, S., Wyse, R. F. G., & Bruzual A., G. 1986, ApJ, 307, 415Smith, R. K., Brickhouse, N. S., Liedahl, D. A., & Raymond, J.C. 2001, ApJ,
556, L91Sparks, W. B., Donahue, M., Jordán, A., Ferrarese, L., & Côté, P. 2004, ApJ,
607, 294Sparks, W. B., Macchetto, F., & Golombek, D. 1989, ApJ, 345, 153Temi, P., Brighenti, F., & Mathews, W. G. 2007a, ApJ, 660, 1215—. 2007b, ApJ, 666, 222Trinchieri, G. & Goudfrooij, P. 2002, A&A, 386, 472Vikhlinin, A., Markevitch, M., & Murray, S. S. 2001, ApJ, 551, 160Voigt, L. M. & Fabian, A. C. 2004, MNRAS, 347, 1130Vrtilek, J. M., Grego, L., David, L. P., Ponman, T. J., Forman, W., Jones, C.,
& Harris, D. E. 2002, APS Meeting Abstracts, 17107Wilman, R. J., Edge, A. C., & Swinbank, A. M. 2006, MNRAS, 371,93
Copyright © 2022 FDOKUMEN