District Court of Appeal Workload and Jurisdiction Assessment ...
Workload Characterization for Software Aging Analysis
Antonio Bovenzi∗, Domenico Cotroneo∗, Roberto Pietrantuono∗, Stefano Russo∗†,∗Dipartimento di Informatica e Sistemistica, Universit di Napoli Federico II, Via Claudio 21, 80125, Naples, Italy.
†Laboratorio CINI-ITEM “Carlo Savy”, Complesso Universitario Monte Sant’Angelo, Via Cinthia, 80126, Naples, Italy.{antonio.bovenzi, cotroneo, roberto.pietrantuono, stefano.russo}@unina.it
Abstract—The phenomenon of software aging is increasinglyrecognized as a relevant problem of long-running systems. Nu-merous experiments have been carried out in the last decade toempirically analyze software aging. Such experiments, besideshighlighting the relevance of the phenomenon, have shown thataging is tightly related to the applied workload. However, dueto the differences among the experimented applications andamong the experimental conditions, results of past studies arenot comparable to each other. This prevent from drawing gen-eral conclusions (e.g., about the aging-workload relationship),and from comparing systems from the aging perspective.In this paper, we propose a procedure to carry out agingexperiments in different applications for: i) assessing agingtrend of the individual systems, as well as assessing differencesamong them (i.e., obtaining comparable results); ii) infer-ring workload-aging relationships from experiments performedon different applications, by highlighting the most relevantworkload parameters. The procedure is applied, through aset of long-running experiments, to three real-scale softwareapplications, namely Apache Web Server, James Mail Server,and CARDAMOM, a middleware for the development of airtraffic control (ATC) systems.
Keywords-Software Aging, Empirical Study
I. INTRODUCTION
The term software aging denotes a continued and growingdegradation of software internal state during its operationallife. This phenomenon is due to accrued error conditionsthat lead to progressive performance loss, eventually causingsystem hang or crash. Due to its cumulative property, itoccurs more intensively in continuously and long-runningrunning applications.Until some years ago, software aging was judged as anoccasional phenomenon experienced by few badly designedsystems. Currently, as more and more software applicationsare reported to exhibit aging, it is recognized as a systematicnon-negligible problem of long-running systems.Past research efforts focused on predicting the time to failureof a system affected by aging, in order to trigger properproactive recovery actions, known as rejuvenation, with anoptimal schedule. Past studies can be distinguished in twoclasses. The former aims to estimate the optimal rejuvena-tion time by analytic modeling. It is referred to as model-based approach. The latter relies on measurements of thesystem’s runtime health aiming to obtain predictions aboutimpending aging failures. This is known as Measurements-based approach.
Among these, several studies reveal that aging dynamicsare related to the workload applied to the system [12][13].Aging bugs activation and resulting error accumulationdepend on the way application is exercised; hence distinctworkload patterns cause different behaviors in terms ofaging dynamics. Such studies contributed to realize that abroader view on software aging needs to go beyond a mereworkload-independent approach, since this turned out to beinsufficient to describe the complexity of the phenomenon.However, even if many of them reported relevant experi-ences, often on real-world applications, allowing researchersto claim the relevance of aging in today’s systems, resultsof these analyses are often not comparable with each other,and hardly generalizable; workload parameters, when theyare taken into account, are tied to the specific applicationunder analysis.
This paper proposes a method to support a broad-scopeanalysis of software aging. We outline the sequence ofsteps to perform a workload-dependent aging analysis whoseresults can serve to practitioners as experimental samples forempirical analyses. Specifically, our goal is to:
• provide experimenters with a method to evaluate agingdynamics of their systems, producing results that canhighlight aging of the specific application under analy-sis, but that can also be considered together with otherstudies’ results for contributing to the body of empiricalknowledge about the aging phenomenon. With time,this can lead researchers to analyze the phenomenon ofaging from a general perspective, independently fromthe specific application under analysis;
• enable a comparison among applications in terms ofaging, in order that experimenters can figure out howtheir application behave as compared to others (a sortof aging benchmarking);
• figure out, through a high-level workload characteriza-tion, how the aging phenomenon is tied to workload;i.e., what application-independent workload featuresstatistically affect the aging variation;
The method is based on a workload characterization processthat, starting from a high-level description, leads to designthe list of experiments to perform on the target applica-tion(s). To validate the proposed method, we have designedand performed a series of long-running experiments on

three real-scale software applications, i.e., the Apache WebServer, the James Mail Server (the Java mail server), andCARDAMOM, a middleware used by air traffic control(ATC) applications. Results highlight aging trends in each ofthe proposed case study in different experimental conditions;moreover, due to the proposed characterization, it has beenpossible to compare the applications among each other,and to evidence the most statistically relevant workloadparameters influencing aging dynamics.The rest this paper is organized as follows: Section II surveysthe existing literature about software aging, whereas SectionIII describes the steps of the proposed method. Section IVdetails the experimental study carried out by applying theproposed method, while Section V presents the obtainedresults. Finally, Section VI concludes the paper.
II. BACKGROUND AND RELATED WORK
Software aging refers to the accumulation of errors duringlong-running application execution, which may lead to i)performance degradation, and ii) application/system hangor crash. This phenomenon has been observed in variousoperational systems (e.g., web servers [2], middleware [3],spacecraft systems [4], military systems [5]), causing seriousdamages such as loss of money or human lives. It isdue to the activation of the so-called aging-related bugs, aparticular class of software bugs, which manifest their effectonly after a long period of time from their activation [1].Some examples of aging bugs are: memory leaks (memoryallocated portions of a process but no longer used or usable),unterminated threads, poor management of shared resources,data corruption, unreleased file-locks, accumulation of nu-merical errors (e.g., round- off and truncation), and diskfragmentation.
Rejuvenation techniques are widely adopted to mitigatesoftware aging effects, by preventing the system from fail-ing. Their purpose is to restore a “clean state” of the systemby releasing OS resources and removing error accumulation.Some common examples are garbage collectors (e.g., in JavaVirtual Machines) and process recycling (e.g., in MicrosoftIIS 5.0). In other cases, rejuvenation techniques result inpartial or total restarting of the system: application restart,node reboot and/or activation of a standby spare.Research studies on software aging, [7][8][10], try to thefigure out the optimal time for scheduling the rejuvenationactions. This is typically done by either Analytical ap-proaches, in which the optimal rejuvenation schedule is de-termined by models, or by Measurements-based approaches,in which the optima schedule is determined by statisticalanalyses on data collected from system execution. In theformer case, stochastic processes (e.g., Markov DecisionProcesses, Semi-Markovian process, Stochastic Petri Nets),representing the system’s states, are adopted to model thesoftware affected by aging, through several distributions [7],[8]. Instead, the work presented in [11], and then in [12],
is an example of the measurements-based approach; in thiscase authors report results of an analysis where the 33% ofoutages were due to aging. Other examples of measurement-based analyses are about performance degradation of OLTPserver [9], and of the Apache Web Server [2]. Trivedi etal. [10] proposed also a combined solution by composingmodelling with a measurement-based approach.Several works have investigated the dependence of softwareaging on the workload applied to the system, by showingthe importance of considering the workload in models thatcontrol rejuvenation activities. In [12], authors present ananalysis, extending the work in [11], that takes into accountsome workload parameters, such as the number of CPUcontext switches and the number of system call invocations.Their results confirm that aging trends are related to theworkload states. A comparison with [11] (on the same casestudy) shows that the workload-driven methodology is byfar more powerful and useful to model aging phenomenon.However, workload indicators used in [12] are internal (i.e.,system-level) parameters, and are hardly controllable factors.A work that addresses the impact of application-level work-load on aging trends is presented in [14]. Authors appliesthe Design of Experiments approach to draw the effectof controllable application-level workload parameters onaging. However, their focus was on one specific application,i.e., Apache Web Server, and so they consider application-specific workload parameters (e.g., the page size, the pagetype, http requests rate).Madeira et al. [15] highlighted the presence of aging ina Java-based SOAP server, highlighting that aging trendsare related to the workload distribution. In [16] some bestpractices are provided to build empirical models for TimeTo Exhaustion (TTE) prediction. These best practices alsoaddress the selection of workload variables. Our previousworks [6] [17] report the presence of aging trends bothat JVM and OS level; results showed relationship betweenworkload parameters, such as method invocation frequencyand object allocation frequency, and aging trends.However, in all the cases parameters are specific either tothe system (such as in [12]), or to the particular applicationunder analysis (such as Apache, JVM, Linux OS), leavingthe final considerations valid only for that specific case.Results of these works would be much more useful if theywere comparable to each other, since they would enablemore general analysis of aging-workload relationship.Our aim is to define a methodological approach to obtaincomparable results about aging of different applications, i.e.,results produced under comparable workload conditions.
III. DEFINITION OF THE EXPERIMENTAL PROCEDURE
The proposed procedure allows: i) to carry out exper-imental campaigns to assess aging trends, whose resultsare comparable to each other, and ii) to infer workload-aging relationships, and highlight the most relevant workload
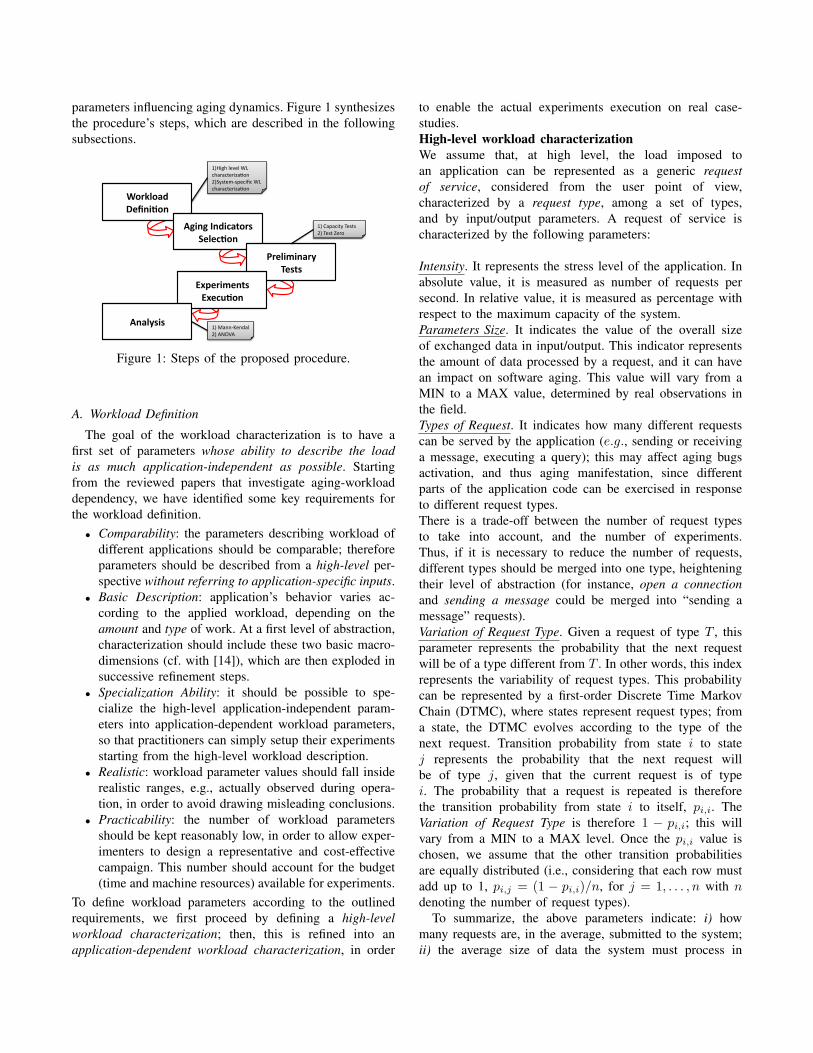
parameters influencing aging dynamics. Figure 1 synthesizesthe procedure’s steps, which are described in the followingsubsections.
!"#$%"&'()*+,-.",(
/0-,0(1,'-2&3"#4(5*%*2.",(
6#*%-7-,(9*434(
:;<*#-7*,34(:;*2=.",(
/,&%84-4(
!"#$%&'()*)('+,'-&./.-0)/$1.234'5"6780)9:8;)-$<-'+,'-&./.-0)/$1.234'
!"'=.;.-$07'>)808'5"'>)80'?)/3'
!"'@.44:A)4B.(''5"'CDEFC'
Figure 1: Steps of the proposed procedure.
A. Workload Definition
The goal of the workload characterization is to have afirst set of parameters whose ability to describe the loadis as much application-independent as possible. Startingfrom the reviewed papers that investigate aging-workloaddependency, we have identified some key requirements forthe workload definition.• Comparability: the parameters describing workload of
different applications should be comparable; thereforeparameters should be described from a high-level per-spective without referring to application-specific inputs.
• Basic Description: application’s behavior varies ac-cording to the applied workload, depending on theamount and type of work. At a first level of abstraction,characterization should include these two basic macro-dimensions (cf. with [14]), which are then exploded insuccessive refinement steps.
• Specialization Ability: it should be possible to spe-cialize the high-level application-independent param-eters into application-dependent workload parameters,so that practitioners can simply setup their experimentsstarting from the high-level workload description.
• Realistic: workload parameter values should fall insiderealistic ranges, e.g., actually observed during opera-tion, in order to avoid drawing misleading conclusions.
• Practicability: the number of workload parametersshould be kept reasonably low, in order to allow exper-imenters to design a representative and cost-effectivecampaign. This number should account for the budget(time and machine resources) available for experiments.
To define workload parameters according to the outlinedrequirements, we first proceed by defining a high-levelworkload characterization; then, this is refined into anapplication-dependent workload characterization, in order
to enable the actual experiments execution on real case-studies.High-level workload characterizationWe assume that, at high level, the load imposed toan application can be represented as a generic requestof service, considered from the user point of view,characterized by a request type, among a set of types,and by input/output parameters. A request of service ischaracterized by the following parameters:
Intensity. It represents the stress level of the application. Inabsolute value, it is measured as number of requests persecond. In relative value, it is measured as percentage withrespect to the maximum capacity of the system.Parameters Size. It indicates the value of the overall sizeof exchanged data in input/output. This indicator representsthe amount of data processed by a request, and it can havean impact on software aging. This value will vary from aMIN to a MAX value, determined by real observations inthe field.Types of Request. It indicates how many different requestscan be served by the application (e.g., sending or receivinga message, executing a query); this may affect aging bugsactivation, and thus aging manifestation, since differentparts of the application code can be exercised in responseto different request types.There is a trade-off between the number of request typesto take into account, and the number of experiments.Thus, if it is necessary to reduce the number of requests,different types should be merged into one type, heighteningtheir level of abstraction (for instance, open a connectionand sending a message could be merged into “sending amessage” requests).Variation of Request Type. Given a request of type T , thisparameter represents the probability that the next requestwill be of a type different from T . In other words, this indexrepresents the variability of request types. This probabilitycan be represented by a first-order Discrete Time MarkovChain (DTMC), where states represent request types; froma state, the DTMC evolves according to the type of thenext request. Transition probability from state i to statej represents the probability that the next request willbe of type j, given that the current request is of typei. The probability that a request is repeated is thereforethe transition probability from state i to itself, pi,i. TheVariation of Request Type is therefore 1 − pi,i; this willvary from a MIN to a MAX level. Once the pi,i value ischosen, we assume that the other transition probabilitiesare equally distributed (i.e., considering that each row mustadd up to 1, pi,j = (1 − pi,i)/n, for j = 1, . . . , n with ndenoting the number of request types).
To summarize, the above parameters indicate: i) howmany requests are, in the average, submitted to the system;ii) the average size of data the system must process in

a request; iii) what types of request are submitted to thesystem; iv) how frequently request types vary.Application-dependent workload characterization.Since the goal is to conduct real experiments, thesehigh-level workload parameters need to be refined intoapplication-dependent ones. In this stage, the experimenterhas to characterize the parameters with respect to the appli-cation(s) involved in the experimental campaign.The intensity of request is viewed, at high level, as thenumber of service requests per unit time. We need to knowwhat “request” means for each application. For instance,if we consider a Web Server, it can be the number ofpage requests per second, as quantified in several works[14],[18]. Hence, the Types of Request parameter valueshave to be determined. This is done by considering the mostrelevant requests for each application, which can be retrievedfrom documentation and/or from field data. Requests canbe merged if the number is too high (as described above).The Variation of Request Type parameter will then referto the established types of request. As for the Parameterssize, values should be representative of the actual size ofparameters exchanged between user and application (i.e.,realistic requirement). A practical way to determine the MINand MAX values, i.e., the Low and High levels, is to considerfield data regarding the application under study.
B. Aging Indicators Selection
After the workload definition, the second step concernswith the selection of aging indicators. Aging effects can beobserved during the system execution, by monitoring theso-called aging indicators. Aging indicators are explanatoryvariables that, individually or in combination, suggest if thesystem state is degrading or not [23]. Past studies showedthat software aging manifests itself mainly as resourcedepletion (typically, memory depletion) and performancedegradation [22], [14], [15], which are therefore the mostcommon indicators in the literature. While memory deple-tion can be considered an application-independent measure,performance degradation can be measured in several waysdepending on the application (e.g., response time, round triptime, number of served requests per second). Moreover, itshould be considered that aging dynamics may be differentamong the considered applications: in order to carry outcomparable analyses we cannot consider absolute values,but the increase (or decrease) of aging must be measuredby relative values. In other words, data must be normalized.Along with the absolute aging indicators, also relative agingindicators need to be considered, e.g., by normalizing datawith respect to the minimum observed aging for that system.
C. Preliminary tests
In the previous steps, workload parameters to be set inthe experiments and aging indicators to monitor are defined.Before executing the experiments, some tests should be
performed in order to determine the limits of the applicationsunder test, and complete the previous steps.For instance, the measurement of the intensity parameter hasbeen hypothesized as the percentage of the maximum sys-tem’s capacity. Thus, experimenter should determine whatis the maximum capacity for the system under test, i.e., s/hehas to perform a Capacity test. This implies: i) determininga metric to measure the throughput of the system, and thenii) soliciting the system with an increasing load, in terms ofintensity, until a knee in the throughput curve is reached.The knee indicates the limit of the system’s capacity, sincebeyond such limit the system is no longer able to serve re-quests properly (i.e., as the request rate increases beyond thatlimit, its throughput does not increase anymore, as it wouldbe expected, but it remains the same or even decreases).Since different limits can be reached with different requesttypes, capacity tests have to be performed per each requesttype. Then, either the average of the observed limits, or, tobe conservative, the minimum of such limits, is chosen asthe system’s capacity. The latter choice assures that, duringexperiments, the system will not fail due to the system’scapacity exceeded; this helps distinguishing failures due toaging, from failures due to excessive loads.One more issue is related to the time duration (T ) ofexperiments. An experiment should last for an amount oftime at least sufficient to observe a significant trend in data.Such time is system-dependent; a pre-defined experimentaltime for all the applications would imply either a uselessexperiment, if T is too low, because of insufficient number ofsamples to determine a trend, or an expensive experiment, ifT is too high. Thus, an additional preliminary test is neededto estimate the best experimental time: we name it Testzero. Under the assumption that the less intensive workloadparameters, the lower aging trends are, the Test zero aimsto investigate if there is a trend with the least stressfulworkload. Least stressful means that parameters are set attheir minimum level, including the intensity parameter. Withsamples of this test, the experimental time for each systemis evaluated, by using an algorithm developed and presentedin our previous study [3]. The algorithm determines theminimum time in order to observe statistically significanttrends for a given response variable. It takes the desirederror that one can tolerate and samples of the Test zero, asinputs; then it estimates if the number of samples collectedup to a given time t is sufficient to have a significanttrend (e.g., at 95% confidence level). When more responsevariables are involved, the minimum experimental time T isthe maximum of times obtained for the considered responsevariables. Since the Test zero considers the least stressfulworkload, all the experiments with more stressful workloadwill exhibit, under the mentioned assumption, aging trendswithin T . Note that the formulated assumption is reasonableand confirmed by previous works [3], [14]. Output of thistest may be used for aging indicator normalization.

D. Experiments and Data Analysis
Design of Experiments (DoE).After preliminary tests, the experiments planning is carriedout by the Design of Experiments (DoE) technique. TheDoE [19] is a systematic approach to the investigation of asystem or a process. A series of measurement experimentsare designed, in which planned changes are made to one ormore system (or process) input factors. The effects of thesechanges on one or more response variables are then assessed.The DoE aims to plan a minimal list of experiments to beapplied in order to get statistically significant answers.The first step in planning such experiments is to formulate aclear statement of the objectives of the investigation. Then,the next steps are concerned with the choice of responsevariables, and with the identification of factors of interestthat can potentially affect the response variables. A particularvalue of a factor is called level. A factor is said to becontrollable if its level can be set by the experimenter,whereas the levels of an uncontrollable factor cannot be set,but only observed. The identification of response variables,factors, and levels is followed by the definition of a list ofexperiments, called treatments. Each treatment is obtainedby assigning a level to each one of the controllable factors.In order to assess the impact of workload on softwareaging, we have to plan a set of experiments by varyingworkload parameters value, and by evaluating the effect ofplanned changes on aging trends. Thus, the chosen agingindicators are the response variables to be observed, whereasthe defined workload parameters are the factors of theexperiments. Since experiments, in our case, will be carriedout on more than one software application, we also consideran additional factor, i.e., the software type. The output of thisphase is the list of experiments to perform.Data Analysis.The obtained list of treatments is finally executed (step 4 ofFigure 1). Collected data are analyzed, in order to determinethe presence of trends through statistical hypothesis tests (themost common one is the Mann-Kendall test [20]) for eachresponse variable.For data analysis (step 5), both absolute and relative (i.e.,the normalized) aging indicators must be considered. Theformer are useful to highlight the aging trends experiencedby each application. The latter are used for conducting theclassical Analysis of Variance (ANOVA), which tell whatworkload parameters mainly impact on aging trends.The objective of the analysis is to figure out: i) if (and towhat extent) the analyzed systems suffer from aging, ii) howmuch the variation of workload parameters from low levelsto high levels impacts the variation of aging trends, andiii) which is the most influential application-independentworkload parameters. Since we consider various systems,results allow us also to compare them in terms of aging.
IV. EXPERIMENTS EXECUTION
In this Section we apply the outlined procedure to planand execute experiments in three different software applica-tions. Starting from the defined high-level characterization,the application-dependent workload characterization, as wellas the experimental design, are shown in the following.
A. Application-Dependent Workload Characterization1) Case-studies: Applications selected as case-studies
belong to three different classes of long-running softwaresystems, which are employed in several contexts rangingfrom business to mission critical scenarios. They are:Apache Web ServerApache is one of the most popular Web HTTP server.We used the version 2.0.48. In the configuration, we en-abled SSL, by including the SSL module, and used theMySQL DBMS, version 4.5. The configuration parametershave been tuned as in past studies [14], also to com-pare results: StartServers=150, MinSpareServers=150, Max-Clients=150, MaxSpareServer=0, MaxRequestsPerChild=0,MaxKeepAliveRequests=0. By setting the first three direc-tives to 150 we minimize the waiting time for the man-agement of a request. The directive MaxClients lets itserve 150 simultaneous connections, whereas the MinS-pareServers and MaxSpareServers directives allow having150 child processes waiting for managing connections.MaxKeepAliveRequests and MaxRequestsPerChild directivesallow a process to serve an unlimited number of requests,and a connection to have an unlimited number of requests.CARDAMOMCARDAMOM is a CORBA-based middleware tailored forthe development of mission critical, near real-time, dis-tributed applications1. Its current usage is in the field of AirTraffic Control (ATC) systems. The CARDAMOM architec-ture is composed of several services, classifiable in basic andpluggable services (i.e., which are included/excluded accord-ing to the user needs). In our experiment, we configured theNaming Service, Load Balancer and Trace Service2, whichare widely used in practice. We use the version 3.1.JamesJames is a JAVA-based mail server supporting several mail-ing protocols, such as SMTP, LMTP, POP3, IMAP3. It hasa modular architecture designed to separate the processingphase from the delivery of a message. The system consistsof several components: SMTP server, POP server, NNTPserver, DNS server, FetchMail, SpoolManager. The heart ofthe system is the spool manager, which implements the pro-cessing layer. However we have disabled the components notwell tested (e.g., the NNTP server). We used the JVM 1.5 16with 512MByte of initial allocated memory, extendable upto 1024MByte.
1http://cardamom.ow2.org/2see http://cardamom.ow2.org/docs/ for documentation3http://james.apache.org/

2) Factors and levels specification: In this Section, high-level workload parameters are mapped to system-specificones. Factors and levels are specified for each application.Apache Web ServerFirst, the Types of Request factor has to be determined.Unlike past studies (e.g., [14], [18]), that considered at mosttwo types of request (i.e., static and dynamic), we considerthe following requests: HTTP request of a static page, HTTPrequest of a dynamic page (created by a CGI script), HTTPSrequest of a static page, and HTTPS request of a dynamicpage. As for levels, this factor ranges from a minimum of2 requests, to a maximum of 4 requests. For the Intensityfactor, we take the number of pages requested by clientsper second. Levels of this factor will be determined afterpreliminary tests, reported in the next Section.The parameters size factor is intended as the size of therequired page. To determine the values for levels of thisfactor, we take into account the average page size for thehome pages of the most popular web sites, which was foundto be 200KB [14], as medium level. The low and up levelsare set respectively to 50KB and 450KB. Finally, levels forthe Variation of Request Type are set to 50%, 30% and 90%(medium, high, and low level, respectively), meaning thatthe probability of not repeating the same request, 1− pi,i inthe DTMC representation, is 0.5 in the medium level, 0.3(i.e., pi,i = 0.7) in the low level, and 0.9 (i.e., pi,i = 0.1) inthe high level. pi,j values are derived as explained in SectionIII-A: pi,j = (1− pi,i)/n, for j = 1, . . . , n with n = 4 (wehave four request types).JamesIn order to stimulate different parts of the code, the Typesof Request for James include: sending of emails (SMTPprotocol), receiving of emails (POP3 protocol), sendingspam messages (testing of the SPAM processor), and sendingmessages with an attachment (testing of the virus processor).The levels range from a minimum of 2 requests, to amaximum of 4 requests. The intensity parameter is measuredas number of mails processed per second (its levels aredetermined after preliminary tests). Parameters size refersto the size of the email. The medium level was set to theaverage size of emails processed by a provider 4, i.e., 70KB ;the high and low level of the parameters size are respectivelyset to 5KB and 200 KB. As for the Variation of Request Typeparameter, we have the same probabilities as in Apache,since four request types are considered also in this case.CARDAMOMTo stimulate the middleware we use a client-server applica-tion (developed in the context of the COSMIC project5),which exploits CARDAMOM facilities by using the fol-lowing services: Naming, Load Balance, and Trace Service.Therefore, we tested the following request types: sending
4http://www.email-marketing-reports.com/5http://cosmicsite.criai.it/
of messages, receiving of messages, ping messages, logging(i.e. a request that stresses the Trace service). Again, levelsare from 2 to 4 requests. The intensity of requests is mea-sured in terms of number of concurrent clients processing therequests (each client performing 200 operations); levels forthis factor are determined after preliminary tests. Parameterssize refers in this case to the size of the exchanged message.Such messages correspond to flight data plans, which inthe average are of 20 KB6. The low and high levels arerespectively of 5KB and 200KB. The Variation of RequestType parameter assumes again the same parameter as in theprevious two applications, i.e., 30%, 50%, and 90%.
B. Experimental campaign
All the experiments are executed on the same machines,with the same OS, equipped with 2 Xeon Hyper-Threaded2.8 GHz CPUs, 5 GB of physical memory (both clients andservers). The machines are on LAN connected via a 100Megabit Ethernet, and each workstation has Red Had 4 OSwith kernel version 2.3.19, initialized with minimal systemservices. Each case study is composed of a client, which hasthe role of traffic generator, and a server.In our experiments, we focused on the following agingindicators: memory depletion and throughput loss.To measure memory consumption (MC), we use the stan-dard Linux kernel utility, free. MC is given by:
MC = TM − FM − PC (1)
where TM, FM, and PC are total memory, free memory, andpage cache size, respectively. In particular the page cachecontains a copy of recently accessed files in kernel memory.Since the page cache can get all the free memory, its memoryconsumption can be quite large, and could bias the analysis;therefore, it is subtracted from MC. The MC is periodicallysampled (each 30 seconds) and stored in a trace.
To measure throughput loss we use existent or ad-hoc loadgenerators, which are placed in the client machines. They areextensively tested before experiments, in order to assure thatthey are aging-free. In particular, for Apache we use httperf 7
during capacity test, and JMeter8 during experiments execu-tion (which allows better control on experimental factors).These tools can collect the total number of correct reply, andthe average response times. For CARDAMOM and James,we developed ad-hoc load generators.After the experiments, trend detection is performed by theMann-Kendal test (adopted also in [11], [2], [17]). The trend,if any, is estimated by means of the non-parametric Sen’sprocedure [20], which is known to be robust, i.e., it doesnot assume normally distributed measurement errors, andresistant, i.e., it is not sensitive to outliers. For data analysis,a significance level (denoted by α) of 10% is considered.
6http://www.swim-suit.aero/swimsuit/projdoc.php7http://www.hpl.hp.com/research/linux/httperf/8http://jakarta.apache.org/jmeter/

1) Preliminary Tests: The goal of preliminary tests is tomeasure: (i) the maximum limit of the intensity factor, (Ca-pacity tests); (ii) the minimum time duration of experimentsnecessary to observe aging (Test Zero); (iii) the aging trendwith all the parameters set to their low level (Test Zero).The latter acts as comparison term, and may be used tobuild normalized, i.e., relative, aging indicators.Capacity TestBy increasing the number of requests (i.e., the intensityfactor), systems eventually reach a knee where the through-put no longer increases. We evaluate several limits, reachedby submitting in each capacity test a different type ofrequest. Then, the minimum of such limits is chosen, asexplained in Section III-C. Referring to Apache, it has beenexperienced that increasing the number of requests beyondabout 400 requests per second, the server is no longer ableto correctly reply. Specifically, the limit has been measuredat 382 requests per second. As for CARDAMOM, the loadgenerator increases the number of concurrent clients overtime. In this case, the percentage of correctly processedrequests gets saturated with more than 10 concurrent clients,i.e., more than 2000 requests. Finally, with James, the testreports that beyond 22 emails per second, the number ofcorrectly processed emails decreases. These values are usedto determine the levels of the factor Intensity: we set thehigh level at 90% of the maximum capacity, the mediumlevel at 50% of the limit, and the low level at 30% of thelimit. This completes the factor levels determination. TableI summarizes the list of all the factors and their levels.
Table I: Application-dependent Factors and their Levels
Intensity Parameter Variation of # of requests(req/sec) size (KB) request type typeLow: 115 Low: 50 Low: 30% Low: 2
Apache Medium: 191 Medium: 200 Medium: 50%High: 344 High: 450 High: 90% High: 4Low: 400 Low: 5 Low: 30% Low: 2
CARDAM. Medium: 1000 Medium: 20 Medium: 50%High: 1800 High: 200 High: 90% High: 4
Low: 7 Low: 5 Low: 30% Low: 2James Medium: 11 Medium: 70 Medium: 50%
High: 20 High: 200 High: 90% High: 4
Test ZeroTo evaluate the minimum time duration of each experiment,the algorithm that we proposed in [3] has been adopted.It outputs this time starting from samples of Test Zero andfrom the error value ε that can be tolerated (we set ε = 0.01).Table II reports the levels of each factor set for the Test Zero.According to what described in Section III-C, factors are setto the least stressful configuration that let us observe aging.The lightest type of request, among the types identifiedfor each application, is determined by the experimenterthrough a quick test with each request (it is necessaryto monitor system behavior for a few minutes per type).The factor Variation of request type is always set to 0%
(i.e., the current request is repeated in 100% of the cases);the values of the factor parameter size are set to theirminimum level. Finally, as for the Intensity factor, the rightvalue are empirically tuned; i.e., if the first experiment doesnot cause aging, it is repeated by increasing the intensityvalue until a trend is observed. For all the applications, we
Table II: Levels of each factor for the Test Zero
Types of Intensity Parameter Variation ofrequest (req/sec) size (KB) request type
Apache HTTP static 115 50 0%Cardamom send message 600 5 0%
James send mail 7 5 0%
found, by executing this test, a relevant trend in the memorydepletion indicator; whereas, for throughput loss, a slighttrend has been observed only in James, and amounts to−3.1902 · 10−6 operations per second.Giving samples of these tests as inputs to the algorithm,the minimum experimental time is also obtained. Resultsof Capacity Test and Test Zero are summarized in TableIII, which reports the Capacity limit, the Minimum timeduration, the Memory depletion trend and the Throughputloss trend, with the lightest workload.
Table III: Results of Capacity tests and Test Zero.
Apache Cardamom JamesCapacity limit (req/sec) 382 2000 22Minimum exp. time (h) 24 4 24
Memory depletion (KB/sec) 0.163 78.2 38.3Throughput loss (Op./sec) no trend 3.190210−6 no trend
2) Experimental plan and execution: In previous Sec-tions, the workload to apply has been characterized interms of parameters and their levels; then aging indicatorsto observe have been selected, and, finally, the limits ofeach application have been determined. According to theoutlined procedure, we are in this phase provided with allthe necessary information to design experiments. To generatethe experimental plan according to the DoE approach (step4 of Figure 1), we adopt the tool JMP R©9. JMP allowsto create a plan that adheres to the principle of DoE(e.g., randomization, orthogonality), generating a minimallist of treatments necessary to get statistically significantresponses. In this plan, factors are workload parameters(Table I), response variables are the aging indicators. Thelist of treatments is reported in Table IV. Columns reportthe involved factors, set with a given level value. In addition,we also consider the software type as factor, whose levelsare the chosen applications. Experiments are executed forthe time duration determined by the Test Zero, amounting toa total of 210 hours of experimental time.
9http://www.jmp.com/

Table IV: Experimental plan. M=Medium, L=low, H=High
Exp Case Types of Intensity Parameter Variation ofID study Request (req/sec) size (KB) request type1 Apache L (2) M (191) H (450) M (50%)2 Cardamom H (4) L (400) H (250) H (90%)3 James L (2) M (11) M (70) H (90%)4 Apache L (2) L (115) L (5) L (30%)5 Cardamom H (4) M (1000) M (20) L (30%)6 Cardamom L (2) M (1000) L (5) M (50%)7 Apache H (4) M (1000) L (50) H (90%)8 Apache L (2) L (115) M (200) H (90%)9 James L (2) H (20) H (200) L (30%)
10 Apache H (4) H (344) M (200) M (50%)11 Cardamom L (2) H (1800) L (5) H (90%)12 James H (4) L (7) L (5) M (50%)
V. RESULTS AND DATA ANALYSIS
Aging indicators’ samples, collected each 30 seconds,are first analyzed by means of statistical tests, in order toestimate aging trends, if present. Table V lists the results thatwe obtained for each treatment. It reports trends, estimatedby the Mann-Kendal test, for both memory depletion (MDT)and throughput loss (TLT), and the computed indexes,named, respectively, MDI (memory depletion index) and TLI(throughput loss index). These relative indexes are computedby normalizing the MDT and the TLT by means of themin-max formula (index = (RawTrend−Min)/(Max−Min)) in order to have aging indexes between 0 and 1 (Minis the minimum between the Test Zero and trends observedin these treatments).
Table V: Results of experiments
Id MDT MDI TTE TLT (∗10−2) TLIKB/sec hours op/sec
1 0.185 0.4557 7357.4 0 0.002 110.4 0.3852 12.3 3.43 1.003 153.4 1.0000 8.9 6.85 1.004 0.149 0.0000 9135.0 0 0.005 116.7 0.4605 11.7 2.33 0.686 84.39 0.0740 16.1 0 0.007 0.203 0.6835 6705.0 0 0.008 0.176 0.3418 7733.6 0 0.009 122.9 0.7350 11.1 0 0.0010 0.228 1.0000 5969.8 0 0.0011 161.8 1.0000 8.4 2.07 0.1312 64.1 0.2242 21.2 1.94 0.28
From results, it is clear that memory depletion is themost significant aging indicator, since we have experienceda trend in all the treatments; contrarily, a slight throughputloss trend has been observed only in five treatments. Hence,since throughput loss exhibits much slower dynamics, weconduct the subsequent analyses only considering the mem-ory depletion trend. Figure 2 shows snapshots of the mostrelevant (i.e., with the highest slopes) memory depletiontrends, observed for each of the considered applications.
0 1 2 3 4 5 6 7 8 9
x 104
1.5
2
2.5
3
3.5
4x 10
5
rss[K
B]
time[sec]
(a) Treatment 10, MDT Apache.
0 500 1000 1500 2000 2500 30000
1
2
3
4
5
6
7
8x 10
5
time[sec]
rss[K
B]
(b) Treatment 11, MDT Cardamom.
0 500 1000 1500 2000 2500 3000 3500 4000 4500 50000
5
10
15x 10
5
time[sec]
rss[K
B]
(c) Treatment 3, MDT James.
Figure 2: Most relevant experiments
Considering the absolute values (cf. column 2 and 4 ofTable V), the treatments that revealed by far the lowestaging trends are those carried out on Apache (that are:#1, #4, #7, #8, #10), which exhibited trends two orders ofmagnitude lower than CARDAMOM and James. Observedvalues for Apache are also consistent with those observed inpast studies [21]. Apache experienced an average trend of0.1856 KB/sec, whereas in CARDAMOM and James it isof 110.298 KB/sec and 94.75 KB/sec, respectively. Thisbehavior leads CARDAMOM and James to very short timesto failure due to resource exhaustion (the expected Time ToExhaustion, i.e., the TTE, is reported in Table V, column4.). For CARDAMOM, consequences of this result could beeven more dangerous, since its foreseen employment is inmission critical systems for Air Traffic Control (ATC). Notethat results are comparable to each other, since they havebeen obtained under comparable workload conditions, i.e.,referring to the same high-level workload parameters, setwith values that are relative to the limits of each application.

To complete the analysis, we conduct the ANOVA in orderto assess the effect of factors on response variables. Theanalysis consists in determining which of the principalfactors (i.e., the workload parameters: Intensity, Paramaterssize, Types of request, and Variation of request type), impacton aging indicators. Since aging dynamics turned out tobe noticeably different depending on the application, weevaluate the influence of workload parameters on aging byconsidering the relative aging indicator, i.e., the MDI.ANOVA is conducted by testing the hypothesis, H0, that thefactor Fi does not statistically affect the response variable.Table VI reports results of one-way ANOVA for each consid-ered factor, with a significance level for acceptance/rejectionof α = 0.10 (i.e., confidence of 90%). The analysis shows
Table VI: Results of the Anova
Factor p-value OutcomeIntensity 0.0235 H0 can be rejected with α < 0.1
Parameter size 0.4837 H0 cannot be rejectedTypes of requests 0.55 H0 cannot be rejected
Variation of req. type 0.13 H0 cannot be rejected
that the most influential factor is the Intensity factor, with ap-value lower than 0.05. Other factors do not significantlyaffect the response variable. More in detail, Table VII reportsdata aggregated by factors. It is evident that requests withhigh intensity exhibit, in the average, much higher trends.Differences can be noticed also in the other parameters,whose variation from low to high level causes an increasein the experienced aging. However, only for the intensityparameter, we found a statistical evidence. Hypothesis testsreport that the difference between experiments with high andlow level of the factor:• intensity (i.e., 0.6738) is significant at p − value =
0.00153, i.e., with a confidence greater than 90% (ap-proximately of 99%);
• parameter size (i.e., 0.1289) is not significant (p −value = 0.3235);
• number of request type (i.e., 0.0354) is not significant(p− value = 0.4367);
• variation of request type (i.e., 0.2836) is not significant(p− value = 0.1466).
Other than the intensity parameter, it should be noted that thesecond greatest difference is in the variation of request type,i.e., of how often the type of request is varied. The difference
Table VII: Results of MDI. Average MDI grouped by factors
Factors High Medium LowGrouped by Intensity 0.9117 0.5348 0.2378
Grouped by Parameters Size 0.5253 0.7006 0.3963Grouped by Types of Request 0.5507 - 0.5152
Grouped by Variation of Request Type 0.6821 0.4385 0.3985
between experiments with 90% and with 30% of chances tonot repeat the same request, is significant with a confidenceof about 85%. It seems that more varying workload causesgreater aging.Finally, regarding the additional factor software type, thedifferences between CARDAMOM and Apache, and be-tween James and Apache turns out to be significant withp − value << α = 0.1, (CARDAMOM-Apache, p −value = 2 ∗ 10−4, James-Apache p − value = 4 ∗ 10−4),unlike the difference between CARDAMOM and James.
VI. CONCLUSIONS
In this work, the phenomenon of software aging and itsrelation with workload have been investigated. To overcomelimitations of past studies, which typically analyze the phe-nomenon on single software applications, we defined a pro-cedure to design experiments for revealing aging, and ableof producing comparable results as well. The procedure hasbeen applied through an experiment on three large softwareapplications. The first result regards the identification ofaging trends, in terms of memory depletion, in all the exper-imented applications. As secondary result, due to the adop-tion of the outlined procedure, we have been able to comparesystems from the aging point of view: the comparisonhighlighted that CARDAMOM and James showed higheraging dynamics than Apache (the average differences are118.13 KB/sec and 113.27 KB/sec for CARDAMOM-Apache and James-Apache, respectively). The average TTEin hours, for our configuration, are: 7672, 12.1, and 13.7for Apache, CARDAMOM and James, respectively. Finally,the third result is about the possibility to infer aging-workload relationships using results obtained from differentapplications; from this point of view, the analysis, eventhough preliminary, showed that more stressful workloads,in terms of Intensity (number of requests per unit time),greatly influence the manifestation of software aging, and isstatistically the most influential factor. As for the Parametersize, Types of requests, and Variation of Request Type factors,although some of them seem to affect aging (e.g., Variationof Request Type, at 85%), there is no statistical evidence ata confidence of 90%. However, regarding the latter point,it is no possible to provide a definitive answer about theirinfluence on aging, since the obtained results are affected bythe limited number of samples. As any in empirical study,this represents a threat to results validity. On the other hand,this limitation is what the proposed procedure intends toovercome: if future analyses are performed by adopting theoutlined steps, their results can be considered as “samples”of the same experiment, increasing the confidence on theobserved relationships between workload and aging.This knowledge can also be used for predicting purposes,e.g., to improve model-based solutions, or develop tools foraging estimation. Along this direction, next steps include:i) the execution of additional experimental campaigns on

different systems, in order to enrich the knowledge of aging-workload relationship, and to promote the comparabilityamong systems; ii) the implementation of a tool for runtimeTTE prediction, which, based on the defined workloadparameters, monitors the runtime workload and evaluatesaging trends by means of workload-dependent models; iii)the definition of benchmarking approach in which aging isone of the dependability aspects to consider.
REFERENCES
[1] M. Grottke and K. S. Trivedi. Fighting bugs: Remove,retry, replicate, and rejuvenate. Computer Communications,40(2):107–109, 2007.
[2] M. Grottke, L. Lie, K. Vaidyanathan, and K. S. Trivedi,Analysis of software aging in a web server, IEEE Trans.Reliability, vol. 55, no. 3, pp. 411–420, 2006.
[3] G. Carrozza, D. Cotroneo , R. Natella, A. Pecchia, S. Russo,Memory Leak Analysis of Mission-Critical Middleware. Jour-nal of Systems and Software vol. 83, no. 9, 2010.
[4] E. Marshall Fatal Error: How Patriot Overlooked Scud. Sci-ence, p. 1347, Mar.1992
[5] A.Tai, S.Chau, L. Alkalaj and H.Hecht. On-board Preven-tive Maintenance: Analysis of Effectiveness an Optimal DutyPeriod. Proc. 3rd Workshop on Object-Oriented Real-TimeDependable Systems, 1997
[6] D. Cotroneo, S. Orlando, S. Russo, Characterizing AgingPhenomena of the Java Virtual Machine. Proc. of the 26thSymp. on Reliable Distributed Systems, 2007, pp. 127–136.
[7] S. Garg, A. Puliato, K. Trivedi, Analysis of Software Rejuve-nation using Markov Regenerative Stochastic Petri Nets. Proc.of 6th Intl. Symp. on Software Reliability Engineering, 1995.
[8] Y. Bao, X. Sun, and K. Trivedi, A Workload-Based Analysisof Software Aging, and Rejuvenation, IEEE Transactions onReliability, vol. 54, no. 3, p. 541, 2005.
[9] K.J. Cassidy, K.C. Gross, A. Malekpour. Advanced patternrecognition for detection of complex software aging phenom-ena in online transaction processing servers. Proc. of the Intl.Confer. on Dependable Systems and Networks, 2002, 478–482.
[10] K. Vaidyanathan and K. Trivedi, A Comprehensive Model forSoftware Rejuvenation, IEEE Transactions on Dependable andSecure Computing, vol. 2, no. 2, pp. 124137, 2005.
[11] S. Garg, A. V. Moorsel, K. Vaidyanathan, and K. S. Trivedi,A Methodology for Detection and Estimation of SoftwareAging, in Proc. of the 9th Intl. Symp. on Software ReliabilityEngineering, 1998.
[12] K. Vaidyanathan and K.S. Trivedi. A measurement-basedmodel for estimation of resource exhaustion in operationalsoftware systems. Proc. of 10th International Symposium onSoftware Reliability Engineering, 1999, 84–93.
[13] Wang, Dazhi and Xie, Wei and Trivedi, Kishor S.. Performa-bility analysis of clustered systems with rejuvenation undervarying workload. Performance Evaluation, 247–265, 2007.
[14] R. Matias Jr and P. Freitas, An Experimental Study onSoftware Aging and Rejuvenation in Web Servers. Proc. ofthe 30th Intl. Computer Software and Applications Conference(COMPSAC), vol. 01, 2006, pp. 189196.
[15] L. Silva, H. Madeira, and J.G. Silva. Software aging and reju-venation in a soap-based server. Proc. of 5th Intl. Symposiumon Network Computing and Applications, 56 65, 2006.
[16] G. A. Hoffmann, K. S. Trivedi, and M. Malek. A best practiceguide to resources forecasting for the apache webserver. In12th IEEE Pacic Rim International Symposium on DependableComputing, 183–193, 2006.
[17] D. Cotroneo, R. Natella, R. Pietrantuono, S. Russo, SoftwareAging Analysis of the Linux Operating System. Proc. of 21stIEEE Intl. Symp. on Software Reliability Engineering, 2010.
[18] R. Matias, Jr., Pedro A. Barbetta, K. S. Trivedi, P. J. FreitasFilho, Accelerated Degradation Tests Applied to SoftwareAging Experiments, IEEE Trans. on Reliability, 59 (1), 2010.
[19] Douglas C. Montgomery, Design and Analysis of Experi-ments. 5th edition.
[20] Pranab, Kumar, Sen, Estimates of the Regression CoefficientBased on Kendalls Tau, Journal of the American StatisticalAssociation, Vol. 63, No. 324 (Dec., 1968), pp. 1379- 1389
[21] Yun-Fei Jia, Xiu-E Chen, Lei Zhao and Kai-Yuan Cai. On theRelationship between Software Aging and Related Parameters.Proc. of the 8th Intl. Conference on Quality Software, 2008
[22] A.Avritzer, A. Bondi, M. Grottke, K. Trivedi,. E.J. Weyuker.Performance Assurance via Software Rejuvenation: Moni-toring, Statistics and Algorithms, Proc. of the InternationalConference on Dependable Systems and Networks 2006
[23] M. Grottke, R. Matias Jr., K. S. Trivedi, The Fundamentalsof Software Aging. Proc. of the 1st International Workshopon Software Aging and Rejuvenation/19th IEEE InternationalSymposium on Software Reliability Engineering, 2008.
Copyright © 2022 FDOKUMEN