Driver Workload Metrics Project - NHTSA
600
Driver Workload Metrics CAMP IVI Light Vehicle Enabling Research Program DOT HS 810 635 November 2006 This document is available to the public from the National Technical Information Service, Springfield, Virginia 22161 Driver Workload Metrics Project Task 2 Final Report Appendices
-
Upload
khangminh22 -
Category
Documents
-
view
3 -
download
0
Transcript of Driver Workload Metrics Project - NHTSA

Driver Workload Metrics CAMP
IVI Light Vehicle Enabling Research Program
DOT HS 810 635 November 2006
This document is available to the public from the National Technical Information Service, Springfield, Virginia 22161
Driver Workload Metrics Project
Task 2 Final Report Appendices


A-1
Appendix A. Rationale for Selecting Tasks for Study
A.1 The Need for a Theoretical Framework The experimental work that was done in this project required that a set of in-vehicle tasks be selected for study. A sound methodology was needed to choose for which tasks should be included in the research to evaluate appropriate driver workload metrics. The methodology or framework had to allow predictions to be derived about how demanding and/or interfering a task was likely to be when it was performed concurrently with driving. It also needed to allow these predictions to be derived in a way that was independent from the measures of driving performance that were also being obtained. That is, the measures of driving performance were to be used to confirm whether or not the findings on surrogate measures were correctly predicting task loading and/or interference. Were tasks that were supposed to be high in distraction potential in fact observed to be high on driving performance measures? And did surrogate measures similarly assess them to be high? In practice, the selection framework used applied both a top-down approach (i.e., to analytically identify tasks and predict their effects) and a bottom-up approach (i.e., to apply constraints and use empirical results to refine the selection of tasks). Using this top-down and bottom-up approach, a set of tasks were selected to: (a) span a range of driver workload effects, and (b) span a range of prominent interface types, functionalities, and known effects.
Thus, before collecting any data, there was a need to identify which tasks were expected to be “low” in their potential to interfere, which were “moderate,” and which were “high.” Therefore, in the interest of identifying (or developing) a framework which would accomplish this on a basis other than performance measures, this appendix describes the frameworks which existed at that time and were considered, describes those that were identified as the most promising among them, and summarizes research that was seen as relevant for extending them for use in this project. This is followed by a consideration of the rationale used for selecting tasks for use in this study. It should be noted, that this model-based analytic approach was also explored as a surrogate method in its own right. Thus, the framework reported here is also mentioned again in the discussion of surrogates.
The Multiple Resource Theory (MRT) model was chosen as the base model to be used in guiding the selection of tasks for this project. The model was modified to produce a Modified MRT model, which is described in detail later in this appendix. The Modified MRT model was selected for the following reasons:
• It was one of the few models available that could generate predictions about a task’s interference with a primary task (in this case, driving) simply on the basis of a task’s attributes and the demands they place on human processing resources. In other words, it could make predictions about a task’s effect on driving performance without using driving performance itself to make the prediction. This was deemed a critical property so that circularity in predictions was avoided.
• At the time of project Task 1, it was the only model meeting the above criterion, which also met a second key criterion of the project viz. practicality. The Modified MRT model did not require the use of specialized computer platforms, computer languages, or programming expertise to implement. The other candidate models, such as the models based on ACT-R, like the Integrated Driver

Appendix A Rationale for Selecting Tasks
A-2
Model developed by Salvucci, Boer, and Liu (2001), required special expertise, programming languages, and specific computing platforms for their use.
• It was a model that could be modified to address working memory, supervisory attention, and global task difficulty. These have emerged from the recent literature as potentially important factors for task effects on driving performance.
A.2 Candidate Frameworks At the time that tasks needed to be selected for study in this project, there were a variety of existing frameworks that could be considered for use. Few appeared to have been developed for specific application to driving, but a large number were potentially adaptable for application to the task of driving. These included models developed for aviation-oriented tasks that are described in Sarno and Wickens (1995b), such as Time-Line Analysis and Prediction (TLAP) Workload Model (Parks and Boucek, 1989), the VACP workload model (Aldrich, Szabo and Bierbaum, 1989), and the WITHINDEX model (North and Riley, 1989). These also included models which are based upon, or which include, a task-analytic approach, such as GOMS (Card, Moran, and Newell, 1983), the IVIS DEMAnD model (Wierwille, 2000; Hankey, Dingus, Hanowski, Wierwille and Monk, 2000), which was developed specifically to predict driving performance and models based on cognitive architectures (e.g., SOAR (Laird and Newell, 1983), and Salvucci (2001), which was specifically developed to predict driving performance). These types of models vary widely in their ability to predict effects of concurrent task execution upon performance data. The variance in performance-based measures that can be accounted for by models that employ some explicit analysis and representation of tasks ranges from approximately 59 percent to 84 percent (based on aviation-types of tasks) (cf. Sarno and Wickens, 1995a). It should be kept in mind, that validity coefficients are highly sensitive to the range of tasks evaluated, in addition to the predictive quality of the model.
Nearly all of these modeling approaches make an attempt to (1) characterize a task in terms of certain attributes and then to (2) relate task attributes to demands placed on human input, processing, and output resources during task performance. The models depend not just on a representation of task structure but also upon some conceptualization of human perception, information-processing, attention, and response resources. Both underpinnings of these models are discussed briefly—the characterization of task structure—and the conceptualization of human perception, information-processing, attention, and response resources.
A.2.1 Analyzing and Representing Tasks A methodology for Hierarchical Task Analysis (HTA) was first proposed in the late 1960s. It has been widely used in human factors practice since that time (Shepard, 2001), and various techniques for doing task analysis have been developed (cf. Jonassen, Hannum and Tessmer, 1989). Using these techniques, tasks can be analyzed along several dimensions. The breakdown of tasks into subtasks and task elements is a common task analysis result. A task’s resource requirements can also be specified, as well as the simultaneous or successive nature of task components and their durations. In addition, these techniques are also sometimes used in conjunction with ability and skills analysis or assessment techniques (e.g., Fleischman, 1975, 1991).

Appendix A Rationale for Selecting Tasks
A-3
The basic approach to task analysis (identifying goals and subgoals, and decomposing them into tasks and individual steps, operations, and procedures or methods) has changed very little over the years. However, by the late 1970’s, theoretical developments in cognitive science had incorporated some of the elements of hierarchical task analysis (along with other concepts and a computational framework) into formalisms known as production-systems which were used to implement cognitive models (see Universal Subgoaling and Chunking: The Automatic Generation and Learning of Goal Hierarchies, by Laird, Rosenbloom and Newell (1986) in which the SOAR model is described). The models known as ACT (Anderson, 1976) and ACT-R (Anderson, 1983) are other examples of models for complex cognitive operations that utilize the so-called “cognitive architecture” of production-systems. The latter (ACT-R) provided a basis for the Integrated Driver Model developed by Dario Salvucci jointly with Erwin Boer and Andrew Liu (2001) to predict driving performance during concurrent task performance. While production-system models often required special expertise, specialized programming languages, and specific computing platforms for their use (at least at the time a framework was selected for this project), the more basic techniques of task analysis may be used without these formalisms. In fact, basic task analysis techniques are generally easy to use and practical enough to apply in product development settings (though they can be labor-intensive). However, when a task analysis is done, one issue requires substantially more work, and that is knowing what human perceptual, cognitive, and response resources are tapped by a task (and the magnitude of demands placed on each resource). This is an issue that will be addressed later, following a review of recent work on human information processing and attention.
Key issues in the application of task analysis are the definition of a task and the use of analysis conventions that facilitate agreement between analysts in breaking a task into its elements. Shepard (2001) defines a task as the unit of behavior necessary to achieve a goal, and treats the task as including a goal to be met, a set of resources to be used, and a set of constraints on resource use. The SAE practice, J2365, offers the following (excerpted) definitions for use with driving-related tasks:
• Task A sequence of control operations (i.e., a specific method) leading to a goal at which a driver will normally persist until the goal is reached.
• Goal A system end state sought by a driver.
• Subgoal A change in system or device state necessary to achieve a goal.
• Method The description of how a goal is accomplished.
To illustrate typical outcomes from task analysis, Table 0-1 shows two task analyses. A decomposition of a goal into task steps is highlighted in the table, but other analytic outputs are also typically obtained.

Appendix A Rationale for Selecting Tasks
A-4
Table 0-1. Two Illustrative Task Analyses
TASK A TASK B Goal: Place call to son Goal: Place call to person at 810-3132 Task:
1. Press “VOICE” button
2. Say “Dial son”
3. Listen for system response
4. Listen for ringing of son’s phone
5. Listen for son to answer
Task: 1. Recall phone number
2. Move hand to phone
3. Move attention to phone
4. Enter digit
5. Enter digit
6. Enter digit
7. Enter digit
8. Enter digit
9. Enter digit
Device: Integrated phone with voice I/O and button for accessing voice
Device: Hand-held phone docked in vehicle with earbud in place prior to task
Task analyses and findings in the literature have revealed that some task attributes that may be salient for understanding multi-tasking performance include:
• Number of resources required to perform the task (and the magnitude of demand on each resource)
• Number of resource conflicts required by concurrent performance of tasks
• Duration for which resources are required
• Duration for which “competing” resource demands persist
• Structure of tasks being concurrently performed
o Number of subgoals to be managed
o Contingencies between related or concurrently active subgoals, or tasks
o Choices and sequences within a task
o Interruptability of the task (and perhaps “resumability” of the task)
A.2.2 Relating Task Attributes to Demands Placed on Human Resources In addition to providing a way to represent tasks, most existing models and frameworks also contain a conceptualization of human resources demanded by tasks. At a high level, structural resources are often thought of in terms of three broad categories: sensory (or input modality) resources, cognitive resources, and response (or output modality) resources. In addition, most conceptualizations posit some form of more fluid resources (attentional capacity, activation within the brain, or some other construct), and this capacity is usually viewed as not strictly fixed in nature, but dependent upon arousal, motivation, etc. However, models differ in terms of the specific way in which they characterize human resources that may be demanded by tasks. A review of recent driving-related research provided some important insights that helped guide a choice of model for use in selecting tasks to study.

Appendix A Rationale for Selecting Tasks
A-5
A.3 Review of Recent Developments in Human Information-Processing and Attention
At the time a framework for task selection was chosen for this project, an examination of recent work on human attention (e.g., Pashler, 1998; Groeger, 2000; and Miyake and Shah, 1999) led to the conclusion that theories which characterize the human operator in terms of multiple resources that interact dynamically during task performance offer the most promise for accounting for existing empirical findings in the field. A leading candidate in this regard was, and is, the MRT formulated by Wickens (e.g., Wickens and Hollands, 2000). It has been explored in various versions (e.g., WITHINDEX North and Riley, 1989, Sarno and Wickens, 1995, Wickens et al., 1988). Recent work confirms the importance of the concept of multiple resources that can be dynamically allocated (a concept captured, for instance, in MRT). At the same time, recent research at the time suggested that it was desirable to build upon and extend the MRT to comprehend recent findings on working memory and supervisory attention (Groeger, 2000). Working memory and supervisory attention seemed to be particularly relevant for the question of multi-tasking while driving. Although these concepts had received some treatment in recent work on MRT, there was the potential to address them more explicitly. They are discussed here because of their relevance for any framework that might be applied to issues of driver workload and distraction. The MRT framework is described below, as well as how recent conceptualizations of working memory and supervisory attention were relevant and were applied for this project. However, first, a brief discussion of driver multi-tasking and distraction is appropriate.
A.3.1 Driver Multi-tasking and Distraction Research has shown that the extent to which a secondary task interferes with the ability to perform the driving task depends crucially on the maneuver underway. Verwey (1991) reported a study showing that driving situations differ in the extent to which they are demanding of attention. In particular, different driving maneuvers require different information processing and attentional resources. Performance on a secondary task, such as auditory or visual serial addition, suffered more when drivers carried it out while doing a turning maneuver than while driving straight. Furthermore, some maneuvers required more visual processing than others, and thus were interfered with more by concurrent performance of a visual secondary task. Duncan, Williams, Nimro-Smith and Brown (1992) examined driving performance measures while drivers concurrently said aloud a single digit per second that they were instructed should be unrelated to the previous digit. They found that some elements of driving performance were influenced by concurrent performance of the secondary task but not others. For example, during random digit production, drivers applied their brakes later when approaching intersections and tended to check mirrors more but at inappropriate times. However, other measures of driving performance were unaffected by the concurrent task. These findings of differential task interference, and others, are not consistent with the notion that a driver’s central attentional capacity is exceeded whenever two tasks are performed simultaneously. Rather, the results are indicative of specific interference between tasks when the tasks simultaneously demand use of the same (or similar) perceptual, information-processing, or response resources.

Appendix A Rationale for Selecting Tasks
A-6
Further, driving has sometimes been characterized as largely “automatic,” implying that there is little or no cost to supervisory attentional processes (Groeger, 2000). This leads to the expectation that multi-tasking during driving can be done with no reduction in performance. However, several studies have demonstrated that this is not the case. Groeger and Clegg (1998) and Shinar, Meir, and Ben-Shoam (1998) have shown that highly practiced processes, such as gear changing, do require attention (though not necessarily conscious attention). In the Shinar et al. (1998) study, drivers drove either an automatic or manual shift car over a fixed route. They were asked to signal when they detected either of two types of road signs. Drivers using automatic transmission vehicles rather than manual shift vehicles correctly detected more target signs, suggesting that manual shifting diverted more attention than did automatic shifting. If gear shifting were so highly practiced that it required virtually no attentional resources, then performance with manual shift cars should have been indistinguishable from performance with automatic transmission vehicles. This is not what occurred. Furthermore, while differences between novice and experienced drivers were observed, both groups were affected by the attentional demand of shifting gears to the point that sign detection was affected.
Findings such as these lead to the conclusion that interference between tasks is predicted not just by their difficulty per se, but by the structural overlaps between the resource demands of the two tasks (Groeger, 2000). This is a central tenet of MRT and supported the use of the Wickens’ framework in the DWM project. MRT provides a way to identify the structural interference between driving and other concurrently performed tasks, and suggests that time-sharing difficulties between tasks arise under conditions in which structural interference occurs. It is hypothesized that driver inattention and distraction are examples of such time-sharing difficulties, which arise when structural interference occurs between concurrently performed tasks.
Recent research also suggests that working memory and attention play a key part in distraction. In fact, some of this research suggests that susceptibility to distraction may sometimes result from task demands that are competing for the structural resource of working memory. Although MRT addresses working memory to some degree (e.g., Wickens and Hollands, 2000), it was felt that further enhancements related to working memory may be desirable in the model.
To illustrate, a very important study appeared in Science (de Fockert, Rees, Frith and Lavie, 2001) entitled, “The Role of Working Memory in Visual Selective Attention.” The authors reported research in which subjects performed a task requiring that five digits be held in working memory. Subjects had to remember either a fixed order of five digits (e.g., 01234) or a different order of digits on each trial (e.g., 03124), with memory probes to ensure that information was being held in working memory. While remembering the digits, subjects were also asked to perform the following task. They were to view a photograph of a celebrity, followed by the name of a celebrity (shown in text). Sometimes the named celebrity was the same as the one in the photograph and sometimes it was different. Subjects were to respond by categorizing the celebrity named in the text presentation as either a politician or pop star. This essentially required subjects to ignore the celebrity pictured in the photo and inhibit themselves from responding to the pictured celebrity, while attending to the name that appeared in text. The researchers found that carrying a working memory load interfered with the ability to inhibit a competing response or, in the author’s terms, reduced the availability of working memory for maintaining priorities that guide visual selective attention. This, in turn, lead to greater intrusion of irrelevant distracters.
Such findings underscore the importance of working memory on concurrent task performance, including that done while driving. They confirm the need for some explicit treatment of these issues, both working memory and supervisory attentional functions in a framework.

Appendix A Rationale for Selecting Tasks
A-7
A.3.2 Selected Framework: MRT and MRT-Based Computational Models MRT, developed by Wickens (1980, 1984,1991), grew out of a concept of multiple processing resources proposed by Kantowitz and Knight (1976) and elaborated on by Navon and Gopher (1979). In its current state, it proposes that there are multiple information-processing or attentional resources upon which humans draw in performing tasks. This contrasts with the concept of a limited, central and undifferentiated pool of information-processing and attentional resources posited by earlier theories. MRT is often graphically depicted as shown in Figure 0-1.
Figure 0-1. Illustration MRT
Adapted from C. D. Wickens, “Processing Resources in Attention,” in Varieties of Attention, ed. R. Parasuraman and R. Davies (New York: Academic Press, 1984).
MRT holds that the following dichotomous dimensions account for variance in time-sharing performance:
• Perceptual Modalities (visual, auditory)
• Visual Channels (focal, ambient) and nested within the visual perceptual channel
• Processing Codes (spatial, verbal) often coupled with response modalities of manual versus speech
• Stages of Processing (perception/cognition versus response selection/execution, early versus late)
The theory allows tasks to be characterized in terms of the demands placed on the multiple resources defined by these dichotomous dimensions. It suggests that competition between tasks tapping the same resources can degrade performance on one or both tasks.

Appendix A Rationale for Selecting Tasks
A-8
Within this theory, the concept of structural interference plays a central role. This concept is sometimes misunderstood to refer only to competition between two tasks for the same input modality (e.g., vision) or the same output modality (e.g., manual responding). However, structural interference is a much more general concept. In addition to structural interference on input and output channels, it also encompasses: (a) competition between tasks for similar stages of perceptual/cognitive and response processing (e.g., early versus late processing stages), and (b) competition between tasks for similar processing codes. With enhancement, it could also encompass competition between tasks for structural cognitive resources.
Various computational models have been derived from or based on MRT (Wickens et al., 1988; North and Riley, 1986). These types of models (e.g., WITHINDEX incorporate the following three concepts (Wickens, 2002):
• A task can be represented as a vector of the resources it demands.
• Task conflict arises when concurrent tasks tap the same or related resources.
• When two tasks are concurrently performed, there is a loss of performance on one or both tasks (relative to the level of performance that is associated with single task performance). This loss can be calculated by an interference formula which penalizes performance to the extent that:
o The total demand on both tasks is high
o The two tasks conflict in their needs for resources
In addition, the extent to which one or the other of the two tasks shows performance degradation can be treated explicitly in an MRT-based computational model. However, this requires the application of a policy or heuristic for guiding the allocation of resources between the tasks. At the present time little is known about heuristics that drivers might use to prioritize their attention to concurrently performed tasks. As a result, this element of modeling was not included in the framework proposed for the DWM project at this time.
Essentially, an MRT-based computational model calculates the total amount of interference expected between two tasks using a conceptual formula like the following:
Total Interference = Demand + Conflict
In this equation, Demand refers to the sum of the resource requirements for each task and Conflict refers to overlapping resource needs of concurrent tasks and the penalties associated with these conflicts. Total Interference is a dimensionless, rank-order value presumably correlated with degradation on one or both tasks.
To implement an MRT-based model requires (from Wickens, 1991):
• A task analysis that identifies the demands placed by the task on resources and codes them as a vector of resource demands.
• A conflict matrix in which the penalty or relative cost of conflict between resource pairs and across tasks is determined.
• A computational formula that combines demand and conflict values into an overall estimate of dual-task interference.
• Optionally, the application of a time-line analysis in those circumstances where the particular combination of tasks will be time-dependent.

Appendix A Rationale for Selecting Tasks
A-9
A computational model of this type was used for the selection of tasks studied in this project. However, modifications to the model were needed to incorporate some of the research findings described above.
A.4 Rationale and Motivation for Explicit Treatment of Supervisory Attention
In his book, Understanding Driving, John Groeger (2000) provides an excellent overview of work that is specifically relevant to the driving task and, in particular, to the issue of multi-tasking while driving. Groeger suggests that human attention, and specifically the functions of supervisory attention, play a central role in multi-tasking. They may, in fact, play a central role in understanding the issue of distraction and workload interference while driving, and may be important to include in any theoretical framework used to predict which concurrently performed tasks may result in performance decrements.
Groeger (2000) suggests that during driving, different schemata compete for the control of thought and behavior. A schema in this context can be thought of as a routine mental program for control of highly-practiced skills. Examples of some schemata that compete for driver attention include: gear-changing, speed-control, and perhaps some elements of object and event detection (OED). The attentional system determines which of the schema that are active and/or vying for attention will in fact get attention, when they get attention, and for how long.
Functions of the attentional system are now thought to include (as characterized by Groeger, 2000; and based on work by Stuss, Shallice, Alexander and Picton, 1995; Shallice, 1982; and others):
• Setting attentional allocation to a goal (e.g., drive to a specific destination).
• Sustaining preparedness, or vigilance to enable response to relatively rare events (e.g., unexpected hazards).
• Maximizing activation of current schema and preparing for upcoming action (e.g., concentration to manage triggering and coordination of lower-level schemas such as schema for “exiting freeway” and “turning left onto Van Dyke road” This also includes generating updated expectations which may be associated with Situation Awareness.
• Suppressing associated irrelevant schemata (e.g., inhibiting the schema for “overtaking a car” near intended freeway exit).
• Sharing across schemata (e.g., listen to radio and drive).
• Switching between schemata (e.g., between lanekeeping and cell-phone dialing).
Many of these functions are now known to involve the pre-frontal cortex (PFC) of the brain, as shown in Table 0-2. As an additional example, D’Esposito et al. (1995) examined patterns of brain activation while participants were performing a spatial task (mental rotation) and a verbal task (semantic verification) concurrently. The key finding of the study was that, when the two tasks are performed simultaneously, the dorsolateral PFC is activated (as well as parts of the brain regions implicated in the performance of the spatial and verbal tasks), even though neither of the tasks activates that particular area (the PFC) by itself. This result suggests that some sort of executive control processes, in which the PFC seems to play an important role, are implicated in coordination of multiple tasks simultaneously (Miyake and Shah, 1999, p. 464). In short, the role of the pre-frontal cortex in phenomena related to supervisory attention appears consistent with the Wickens concept of structural resources.

Appendix A Rationale for Selecting Tasks
A-10
Table 0-2. Brain Areas Primarily Involved in Schema Control Functions
(Taken from Groeger, 2000, p. 59.)
Supervisory Control Function Involved Brain Areas Primarily Involved
Setting attentional allocation to a goal Dorsolateral prefrontal cortex Sustaining preparedness (vigilance) Right lateral mid-frontal regions of the brain,
possibly activation/inhibition of target Maximizing activation of current schema Anterior cingulated with reciprocal
connections to dorsolateral frontal cortex, or circuit comprising connecting midline thalamo, cingulated, and supplementary motor areas
Suppressing associated irrelevant schemata
Bilateral orbitofrontal areas
Sharing across schemata Orbitofrontal and anterior cingulated regions Switching Dorsolateral frontal regions of either
hemisphere, also more diffuse areas
The functions identified above also bear similarities to concepts described by Posner and Peterson (1990). Their work characterizes the major functions of attention as: (1) orienting to sensory stimuli, (2) engaging in executive control, and (3) maintaining an alert state. Also worth noting here, are the notions of Norman and Shallice (1980), who postulate two basic control mechanisms through which supervisory attentional functions operate:
• Contention scheduling, a bottom-up, data-driven process through which sensory input activates processes, concepts, and goals and schedules them to receive attention
• Supervisory attention which involves:
o Conscious thoughts about internal states
o Prioritization of action (this prioritization could be different from that emerging from the contention scheduler, and is not necessarily conscious, though it can be)
While the functions of supervisory attention are becoming clearer in recent research, there are many questions to be addressed. Among those that hold some relevance for understanding driver workload, distraction, and inattention are:
• Concepts of attentional or processing capacity—current thinking suggests that the total amount of attentional capacity that is available is not fixed and may be dependent on motivation and arousal (e.g., Kahneman, 1973)
• Emotions and how they may influence the strength of activation for items contending for attention
In material that follows, one possible idea is described on how functions of supervisory attention and task management might be treated by explicitly incorporating them as subtasks within the driving task (when applying a computational model based on the MRT framework). However, first a consideration of the recent research on working memory, which motivated the explicit inclusion of working memory in the computational model selected, is presented.

Appendix A Rationale for Selecting Tasks
A-11
A.5 Rationale for Extending the Treatment of Working Memory In the MRT Framework
Many new findings have emerged over the last several years related to the concept of working memory. Working memory is the theoretical construct that has come to be used in cognitive psychology to refer to the system or mechanism underlying the maintenance of task-relevant information during the performance of a cognitive task (Baddeley and Hitch, 1974; Daneman and Carpenter, 1980)” (from Shah and Miyake, 1999 in Miyake and Shah, 1999, p. 1). This definition highlights the importance of the concept for developing a way to select which tasks should be studied in this project.
A recent book, Models of Working Memory, by Miyake and Shah (1999) provides an outstanding overview of recent thinking on this subject. Only a few of the most important findings and ideas can be mentioned here. However, emerging from this in-depth work is a consensus that working memory is not merely a structure or place or box, but a set of phenomena. However, it is also now clear that various brain areas, including the prefrontal cortex, work together to produce working memory phenomena (Miyake and Shah, 1999, p. 444). Baddeley (1998) proposed a model of working memory in which a controlling attentional system supervises and coordinates two subordinate systems—one that can be called visual-spatial working memory and one that can be called verbal working memory. Considerably less is known about the supervisory attentional system (or central executive) than about the other two component subsystems.
However, it is in connection with the central attentional system that many researchers believe that working memory phenomena encompass processes related to control and regulation of cognitive action. This makes it especially pertinent for understanding distracted driving (which may represent lapses in the control and regulation of cognitive action). Cowan (1999) elaborates on how voluntary and involuntary mechanisms of the central executive interact to control and regulate the focus of attention (which may be relevant, for example, to eye movements during driving which result from both voluntary and involuntary mechanisms of control). Engel, Kane and Tuholski (1999) describe studies that have demonstrated that controlled attention is what crucially mediates the correlation between working memory spans and complex cognitive tasks (and, hence, may provide insight into individual differences that may relate to distraction).
Furthermore, working memory is known to be limited in capacity and the limits on working memory capacity are described as reflecting multiple factors, rather than a single all-encompassing factor. Some limits are believed to be domain-specific, while others are domain-general, yet little is understood about the nature of these limits. It is thought that task variables such as novelty or complexity of the task (Ericsson and Delaney, 1999) may impact the limits constraining working memory, along with rates of decay for information stored in working memory, processing speed, and efficiency of inhibitory mechanisms (all of which may change with age). O’Reilly, Braver and Cohen (1999) suggest that limitations on working memory may help prevent too much activity in the brain and may help to keep the ongoing cognitive processes well-focused and coherent (see also Glenberg, 1997, for a related argument). However, how people actually manage multiple tasks and maintain coherent prioritization of focus is still not well understood. For example, performing a random number or letter generation task is known to disrupt central attentional or working memory functioning (e.g., Baddeley and Logie, 1999), but the underlying processes and task demands which are responsible for this interference have only begun to be examined in detail. Nonetheless, the implication of all of these findings is that enhancing the treatment of working memory and supervisory attention in a computational model based on MRT may strengthen predictive power and offer a framework within which to understand task variables as well as individual differences.

Appendix A Rationale for Selecting Tasks
A-12
Miyake and Shah (1999) comment upon limitations of previous research. They note that studies have tended to focus on one highly specific aspect of working memory at a time, using rather simple experimental tasks. They furthermore point out that this is understandable and, at early stages of research, can be a sensible approach. However, they also emphasize that more studies are needed on the performance of complex cognitive tasks to learn more about how different regions of the brain dynamically work together as a whole to enable that performance. This observation suggests that in choosing tasks for this project, it will be important to choose those that are appropriate reflections of the type of multi-tasking that actually occurs in a complex task like driving.
A.5.1 Individual Differences and Developmental Factors Differences among drivers in working memory capacity and attentional breadth may contribute in important ways to variability in performance while driving. Such differences might include age-related changes in working memory, as noted above (e.g., such variables as decay rates for stored items, processing speed, and inhibitory efficiency may change with age). Recommendations regarding assessments of test participants in key areas, including working memory are presented in Chapter 7, Individual Differences.
A.5.2 Emotional Factors Emotions have been shown to influence working memory functioning (e.g., anxiety has been documented to have a negative impact on working memory performance, especially on verbal tasks). Recent research has shown that there may be a closer relationship between working memory and emotions than is generally appreciated, even at the neuroanatomical level. The pre-frontal cortex, which is integral to working memory function, is also closely connected with some brain structures known for their role in the processing of emotions. While the pre-frontal cortex is believed to be the interface between perception and cognition, very recently researchers have hypothesized that the pre-frontal cortex is also the interface between emotion and cognition and that emotions may in fact be represented in working memory (LeDoux, 1996). This is important in a consideration of driver distraction because emotions may play a more active role than appreciated in executive attentional processes. (For example, emotions may help reduce the number of choices in working memory from which to select responses. Negative emotions have been hypothesized to be attached to choices, such that they become “somatically” marked in the pre-frontal cortex, perhaps to facilitate future avoidance of those choices. Some researchers have demonstrated that this type of processing may relate to unconscious evaluation of risk. And there have been anecdotal reports that “emotional loading” of in-vehicle conversation may contribute to some types of distraction-related driving incidents. Thus, including working memory in a predictive framework may allow a model to provide broader coverage of issues like emotional distraction and also individual differences. However, emotional impacts on driver distraction were not explored within the DWM project. (There are several issues that would make research on emotions and distraction particularly difficult. First, it is difficult to manipulate emotions in a test setting. Second, there are ethical issues that surround the manipulation of emotions for experimental purposes.) For this project, evaluations were conducted in an emotionally neutral setting. Distraction effects observed without the impact of emotional loading can be expected to worsen in the face of fear, aggression, stress, etc., based on the collective experience of the researchers. Nonetheless, it must be noted that working memory phenomena may have relevance for emotions and driver distraction, should these topics become tractable for other researchers to examine in the future.
Having reviewed some of the research that prompted enhancements to a computational model based on MRT, the following section provides the specific framework that was used in a top-down manner to select tasks for study in the subsequent phases of the project.

Appendix A Rationale for Selecting Tasks
A-13
A.6 Framework for Selecting Tasks A computational model that is based on MRT was used to select tasks for this project. There were two issues to be addressed in formulating the specific computational model that was deemed most appropriate for the project:
• How best to incorporate enhancements to the model.
• How to determine what resources are required for a task? (Coding which input/output channels are tapped by a task is straightforward; however, determining when tasks place loads on cognitive resources, working memory, and supervisory attention is not so easy.)
A computational model was developed (resembling WITHINDEX, but with some modifications) with which to characterize and select tasks for use in the DWM project. In this model, three enhancements have been incorporated: (a) an explicit treatment of working memory, (b) a way to capture demands of supervisory task management activities on working memory and attention, and (c) a global task difficulty variable. The model calculates “Total Interference Potential” (TIP) between tasks and thus allows tasks to be selected across the range from low to high in their potential to interfere with driving.
Specifically, the following resource dimensions and levels have been included in the computational model:
• Input (perceptual) modalities (visual, auditory)
• Working memory resources (spatial and verbal)
• Response modalities (manual, speech)
The inclusion of working memory as a resource dimension represents a small change from the MRT (since it has been aligned with Processing Codes), but one that may allow explicit encoding of the loads placed on working memory by a task. Although the importance of a central executive or attentional system that controls spatial and verbal working memory must be recognized, at this time and for simplicity in the initial phases of modeling, only the two working memory subsystems were utilized and an additional central executive function was not. At a later time, the model may be enhanced with the inclusion of a central executive function. However, it is hoped that by explicitly including working memory functions in the model as a resource, the cognitive demands can more effectively be captured than may have been possible before.
In addition, the functions associated with supervisory attention (i.e., task prioritization and scheduling) were handled by representing them as part of what is modeled as the primary task. Handling them in this way allowed the demands they place on working memory to be formally represented, and entered into the computation of TIP between tasks. While task prioritization and scheduling functions do appear to demand resources associated with working memory phenomena involving the prefrontal cortex, whether these are most appropriately represented as demands on verbal or spatial working memory, or as demands on a central executive function overarching their joint functioning is not yet known. Therefore, in the initial stages of modeling, the loads of supervisory attention on working memory were shown by coding non-zero entries in the demand vectors for the primary task. This approach may be modified or enhanced as more is learned in the course of the research.
To illustrate, the primary driving task for a test scenario conducted on a straight, flat test track and including car following would include subtasks for:
• Controlling lane position

Appendix A Rationale for Selecting Tasks
A-14
• Controlling headway
• Controlling speed
• Detecting and responding to visual events (e.g., lead vehicle braking)
• Task management (supervisory attentional tasks)
The driving task and each potential secondary task (which could be performed concurrently with driving) may be described in terms of the resource demands they place on the driver. The resource demands for each task can, in their simplest form, be represented by utilizing 0, 1 coding (where 0 indicates that a resource is not used by a task, and 1 indicates that a resource is used by task). Sarno and Wickens (1995b) found that this type of coding did as well as attempts to quantify level of demand, at least for the tasks they studied. Examples of 0, 1 coding are provided in Table 0-3 for a sample of in-vehicle tasks taken from Nakayama et al. (1999). Note that a given task’s demands are represented by a single row taken from this table.

Appendix A Rationale for Selecting Tasks
A-15
Table 0-3. Matrix of Demand Vectors for Illustrative Tasks
Task Input-Visual
Input-Auditory
WM-Spatial
WM-Verbal
Output-Manual
Output-Speech
Listen to traffic information for congestion on specified location
0 1 0 1 0 0
Conversation: Repeat spoken words
0 1 0 1 0 1
Conversation: “Do you like restaurant A?”
0 1 0 1 0 1
Conversation: “Do you like restaurant A?”
0 1 0 1 0 1
Conversation: “Which restaurant do you like – A, B, or C?”
0 1 0 1 0 1
Mental arithmetic – Count down from 950 by 7’s
0 1 1 1 0 1
Check navigation map display for position and street name
1 0 1 1 0 1
Select name you like from a list of 4 names
1 0 0 1 0 1
Change A/C mode by pushing a switch and repeat
1 0 1 0 1 0
Change A/C mode by means of a touch screen and repeat
1 0 1 0 1 0
Scroll map display so that a specific location (highlighted route) is visible on the screen
1 0 1 0 1 0
Change scale in a navigation display
1 0 1 0 1 0
Take a specific amount of coins from the console box
1 0 1 0 1 0
Pick up a cell phone in one hand and dial a specified number
1 1 1 1 1 0
When cell phone rings, pick it up from console box cluttered with similar things
1 0 1 0 1 0
o Note: The demands of the driving task were coded as values of 1 on the
resources dimensions of Visual Input Modality, Spatial Working Memory, and Manual Responding (with 0’s on the other resource dimensions).
Subsequent to the project, the possibility of going beyond the absent-present 0,1 coding scheme to quantifying the level of demand placed by each task on each resource may be considered. However, for purposes of selecting tasks to be studied in the project itself, the simple 0, 1 coding illustrated above was employed.

Appendix A Rationale for Selecting Tasks
A-16
The conflict matrix used the values provided in Sarno and Wickens (1990) for expressing magnitude of conflict between two competing task demands. A complete and symmetric matrix was used to account for the full set of task pairings as shown in Table 0-4. The values in the matrix (which vary between 0 and 1) are based on a set of heuristic values for quantifying conflict between task demands described in Sarno and Wickens (1995b). For example, entries where both tasks tap the very same resources (i.e., along the diagonal) are higher than conflict values for concurrently demanded but non-overlapping resources. These are still non-zero to reflect the notion that concurrently performing two tasks creates some cost of concurrence. Also, very high conflict values are assigned to resource demands that are essentially not suitable for sharing (e.g., listening to two auditory channels at once).
Table 0-4. Matrix of Conflict Coefficients
Task B
Input –
Visual Input –
Auditory Working
Memory – Spatial
Working Memory –
Verbal
Output – Manual
Output – Speech
Input- Visual
0.8 0.6 0.8 0.6 0.4 0.2
Input-Auditory
0.6 0.9 0.6 0.8 0.2 0.4
Working Memory – Spatial
0.8 0.6 0.8 0.6 0.4 0.2
Working Memory -Verbal
0.6 0.8 0.6 0.8 0.2 0.4
Output – Manual
0.4 0.2 0.4 0.2 0.8 0.6
Output –Speech
0.2 0.4 0.2 0.4 0.6 1.0
The global difficulty of the task was also added to the basic MRT framework. In its simplest form, it too was coded using 0 and 1, where 0 = low difficulty and 1 = high difficulty. The concept of “task difficulty” was introduced and used in Sarno and Wickens (1995) and mentioned again in Wickens and Hollands (2000). To illustrate the modified model, Table 0-5 shows the coding of task difficulty used in this study for the Nakayama et al. (1999) set of tasks. This construct of “global task difficulty” was intended to reflect elements of task difficulty and complexity that may not be captured in other parts of the model (for example, number of steps in the task, timing of subtasks within a task, etc.).
Table 0-5. Matrix of Global Difficulty Values
Task Difficulty Listen to traffic information for congestion 0
Task A

Appendix A Rationale for Selecting Tasks
A-17
Conversation: Repeat spoken words 0 Conversation: “Do you like restaurant A?” 0 Conversation: “Which restaurant do you like, A, B, or C?”
0
Mental arithmetic: Count down from 950 by 7’s 1 Check navigation map display for position and street name
0
Select name you like from a list of 4 names 0 Change A/C mode by pushing a switch and repeat 0 Change A/C mode by means of a touch screen and repeat
0
Scroll map display so that a specific location (highlighted route) is visible
1
Change scale in a navigation display 1 Take a specific amount of coins from the console box
1
Pick up a cell phone in one hand and dial a specified number
1
When (handheld) cell phone rings, take from the console box cluttered with things similar in size
1
The Total Interference Potential of each task’s pairing with the driving task will be calculated as the difficulty-weighted sum of demands for Task A (driving) plus the difficulty-weighted demands for Task B (a secondary task) plus twice the sum of conflict values obtained for the resources used by Task A and Task B.
This calculation, when done for each pairing of driving with a secondary task, results in a table of values for Total Interference Potential (TIP). Table 0-6 shows the Nakayama et al (1999) dataset along with the modified MRT predictions developed in this project.
As is apparent, tasks range from low to high in terms of their TIP. Thus, the value of TIP can serve as an indicator of which tasks, when paired with driving, might be expected to affect driving performance (as indicated by measures such as lane exceedances, speed variability, response times to visual events, etc.). Using this value, then, tasks can then be chosen from a pool of candidate tasks for inclusion in the next phase of research, so that they represent high, moderate, and low ranges. A representative pool of candidate tasks is provided in the exhibit to this appendix.

Appendix A Rationale for Selecting Tasks
A-18
Table 0-6. Predicted Values of “TIP” Relative to Driving Performance Data
(from Simulator Study of Nakayama et. al., 1999)
Task Total
Interference Potential
Steering Entropy
Reaction Time to Visual Events
Subjective Workload Rating
Listen to traffic information for congestion on specified location
1.13 0.46 429 2.5
Conversation: Repeat spoken words 1.40 0.47 386 1.5 Conversation: “Do you like restaurant A?”
1.40 0.47 417 1.5
Conversation: “Which restaurant do you like – A, B, or C?”
1.40 0.47 413 1.8
Mental arithmetic: Count down from 950 by 7’s
2.44 0.52 439 3.0
Check navigation map display for position and street name
1.84 0.51 465 2.0
Select name you like from a list of 4 names
1.46 0.58 498 3.0
Change A/C mode by pushing a switch and repeat
1.59 0.59 477 3.8
Change A/C mode by means of a touch screen and repeat
1.59 0.60 583 4.0
Scroll map display so that a specific location (highlighted route) is visible on the screen
2.09 0.68 517 5.0
Change scale in a navigation display 2.09 0.59 545 4.0 Take a specific amount of coins from the console box
2.09 0.69 620 5.0
Pick up a cell phone in one hand and dial a specified number
3.05 0.68 506 4.8
When cell phone rings, pick it up from console box cluttered with similar things
2.09 0.68 506 4.0
When the results of this computational model were applied to the tasks in Nakayama et al. (1999) study and the TIP results were correlated with performance measurements reported in their simulator study (in which participants drove and concurrently performed secondary tasks), the correlation coefficients shown in Table 0-7 were obtained. The magnitude of these correlations demonstrates that this predictive framework (which is independent of performance measures) can be reasonably applied to tasks and generate predictions that can be meaningfully confirmed by performance data.
Table 0-7. Correlations between Predictions of TIP and Performance Measures

Appendix A Rationale for Selecting Tasks
A-19
Simulator Study Total Interference Potential
Steering Entropy 0.69
Reaction Time to PDT 0.54
Subject Rating of Workload 0.72
After completion of the DWM project, further enhancements could perhaps be added to the computational model, such as some or all of the following:
• Timeline and stage of processing information for each of the tasks
• Quantification of the magnitude of demand placed on each resource by the tasks
• A way to link in individual differences
A.7 Selection of Tasks There were a variety of automotive secondary tasks from which to select those for study in this research. These span the following range:
• Device-Oriented Tasks
o Conventional tasks (e.g., tune radio manually)
o New and evolving tasks integrated into the vehicle
o Navigation
o Communications
o Entertainment
o Internet and E-tasks
• Tasks Done on Portable, Carried-in Devices
o Cell Phone
o PDAs, etc.
• Non-Device-Oriented Tasks
o Eating and drinking
o Grooming
o Attending to children
o Conversing with passengers
o Giving instructions to passengers, etc.
Of these, the major focus for the CAMP DWM research was on device-oriented tasks. Tasks were selected from a pool of tasks that could be potentially integrated with vehicles. These were selected from among those shown in Table 0-1, along with others that were added and modeled later. Some tasks using portable devices were also be studied, along with some non-device-oriented tasks. The selection of all tasks (regardless of type) was guided by the application of the MRT-based computational model described previously.
However, to equip OEMs to support the development of systems offered as original equipment, it was determined that the most in-depth understanding was needed around the metrics and methods

Appendix A Rationale for Selecting Tasks
A-20
that are appropriate for integrated devices and systems. Toward that end, the top-down application of the MRT computational model was complemented with the bottom-up application of constraints. This was necessary to determine whether surrogate metrics would work for all interface types that could be anticipated in the near future (or just some of them), and also whether they could be applied to a broad variety of system functions (or just a few).
In addition, the application of bottom-up constraints ensured that every meaningful combination of resource demands on driver resources was represented by at least one task in the task set input modalities (visual, auditory), output modalities (manual, vocal), and working memory (verbal, spatial).
Interface Types The task set was refined to ensure (to the extent possible) that some tasks in the set used an interface that was primarily visual-manual in nature, some used an interface that was primarily hear-speak, and some used an interface that required mixed-mode (visual, manual, auditory, and vocal) operations. This was done to help determine whether metrics work effectively across interface types.
System Functionality The task set was also refined in an effort to make sure that all major system functions were represented with one or more task exemplars. The major areas of functionality that were covered included: navigation functions, communication functions, electronic information functions, and advanced entertainment functions
A.8 Selected Task Set The tasks that were selected through this process are listed below and described in Appendix B.
• Visual-Manual
o Coins
o HVAC
o Radio (Easy)
o Radio (Hard)
o Manual Cell Phone Dial
o Cassette Insertion
o CD/Track 7
o Destination Entry
o Route Tracing
o Read (Easy)
o Read (Hard)
o Map (Easy)
o Map (Hard)
• Auditory-Vocal
o Sports Broadcast
o Trip Computations

Appendix A Rationale for Selecting Tasks
A-21
o Book-On-Tape Listen
o Book-On-Tape Summarize
o Route Instructions
o Route Orientation
• Mixed-Mode
o Voice Dial
o Delta Flightline
o Just Drive (For 2-Minutes)
These tasks spanned all meaningful combinations of demands on driver resources within the context of the Modified MRT model (see Figure 0-2). Along the horizontal axis, primary input-output modality pairings are shown. Along the vertical axis, demands on working memory are shown (spatial versus verbal). Within the cells of the matrix, tasks have been listed to show what types of demands they are hypothesized to place on drivers. As can be seen, every quadrant of the space was represented by at least some tasks in the experiment, so that conclusions could be drawn about how well surrogate metrics worked for that class of task demands.
Figure 0-2. Illustration of Distribution of Tasks Across Types of Demands Placed on Driver Resources
In addition, each task that was selected for study was modeled using the Modified MRT computational model and developed to guide task selection. Table 0-8 shows the predicted values for each task’s potential to interfere with driving when done concurrently with it or TIP values. These are provided for three levels of difficulty for each task.
Table 0-8. Predicted Total Interference Potential Values by Task

Appendix A Rationale for Selecting Tasks
A-22
Difficulty Levels Modeled
Tasks Predicted Modified MRT TIP Value
Demand Vector Easy Level Mod. Level Hard Level
1 Coins 1.840 V- S – M 1.590 1.840 2.090
2 Cassette 1.840 V- S – M 1.590 1.840 2.090
3 HVAC** 1.524 V- V – M 1.524 1.774 2.024
4 Radio Tuning Easy 1.774 V- V – M 1.524 1.774 2.024
5 Manual Dial 2.024 V- V – M 1.524 1.774 2.024
6 Travel Comp 1.961 A- S – V 1.461 1.711 1.961
7 Route Orient 1.961 A- S – V 1.461 1.711 1.961
8 Voice Dial 2.487 VA-V-M 1.827 2.157 2.487
9 BOT Listen 1.793 A- V –--- 1.123 1.288 1.453
10 Just Drive ------
11 Bio Q & A 1.398 A- V – V 1.398 1.648 1.898
12 Route Instrucs 1.961 A– S – V 1.461 1.711 1.961
13 Sports Broadcast 1.898 A– V – V 1.398 1.648 1.898
14 Radio Tuning Hard 2.024 V– V – M 1.524 1.774 2.024
16 CD Track 7 2.024 V- V – M 1.524 1.774 2.024
17 Route Tracing 2.090 V – S – M 1.590 1.84 2.090
18 Delta 2.941 VA-V-MV 2.108 2.524 2.941
19 BOT Summary 1.390 -----V – V 1.060 1.225 1.390
21 Nav Dest Entry 2.553 V– SV – M 1.893 2.223 2.553
24 Read Easy 1.761 V – V – V 1.461 1.711 1.961
25 Read Hard 1.961 V – V –V 1.461 1.711 1.961
28 Map Easy 1.857 V – S – V 1.607 1.857 2.107
29 Map Hard 2.107 V – S – V 1.607 1.857 2.107
* Demand Vector is coded in terms of Input Mode (V=Visual, A=Auditory, VA=Visual and Auditory),Working Memory (S=Spatial, V= Verbal, SV=Spatial and Verbal), and Output Mode (M=Manual, V= Vocal, MV=Manual and Vocal). ** HVAC could have been coded as V-S-M, but there was mixed opinion among the technical team, so it was left it as visual –verbal-manual.

Appendix A Rationale for Selecting Tasks
A-23
A.9 Summary The rationale for selecting tasks for study in the CAMP DWM project was based on both a top-down, theoretically-based computational model and a set of bottom-up constraints. The top-down, theoretical approach consisted of a framework and computational model based on Multiple Resource Theory. It was deemed to offer the most promise as a means of describing and guiding the selection of tasks to be studied in the CAMP DWM project. This approach was specially-developed for this purpose and should not be viewed as fully proven. Therefore, it was also developed and evaluated more fully as an analytic tool or surrogate in its own right as the research progressed. However, because it offered a way to select secondary tasks for further study and to derive predictions about their effects on driving performance in a way that was independent of performance data and based only on task attributes, it was used in this project for guiding task selection. In addition, this model also provided the ability to comprehend recent research findings in the areas of working memory and supervisory attention that were relevant for the issue of driver distraction. Exploratory application of the framework to a data set, which was obtained in a simulator study revealed moderate to high-moderate correlations, suggesting that there was indeed a reasonable basis for applying this framework to automotive tasks. The set of tasks resulting from this top-down application of a computational model was refined through the bottom-up application of constraints so that it also spanned major types of interfaces and functionalities that were likely to be considered for future products, and spanned all meaningful combinations of resource demands likely to be placed on drivers by in-vehicle tasks.
A.10 Appendix References Aldrich, T. B., Szabo, S. M., and Bierbaum, C. R. (1989). The development and application of models to predict operator workload during system design. In G. R. McMillan (Ed.), Human performance models. Orlando, FL: NATA AGARD Symposium.
Anderson, J. R. (1976). Language, Memory and Thought. Hillsdale, N.J.: Lawrence Erlbaum Associates.
Anderson, J. R. (1983). The Architecture of Cognition. Harvard Press.
Baddeley, A. D. (1968). A three-minute reasoning test based on grammatical transformation. Psychonomic Science, 10, 341-342.
Baddeley, A.D., and Hitch, G. J. (1974) Working memory. In G. H. Bower (Ed.), The psychology of learning and motivation: Advances I research and theory (Vol.8, pp. 47-89). New York: Academic Press.
Baddeley, A. and Logie, R. H. (1999) Working memory: The multiple-component model. In A. Miyake and P. Shah (Eds.), Models of Working Memory: Mechanisms of Active Maintenance and Executive Control. Cambridge, UK: Cambridge University Press, pp. 28-61.
Card, S. K., Moran, T. P., and Newell, A. The Psychology of Human-Computer Interaction. Hillsdale, N.J.: Lawrence Erlbaum Associates.
Cowan, N. (1999) An embedded-processes model of working memory. In A. Miyake and P. Shah (Eds.), Models of Working Memory: Mechanisms of Active Maintenance and Executive Control. Cambridge, UK: Cambridge University Press, pp. 62-101.
Daneman, M., and Carpenter, P. A. (1980). Individual differences in working memory and reading. Journal of Verbal Learning and Verbal Behavior, 19, 450-466.

Appendix A Rationale for Selecting Tasks
A-24
de Fockert, J. W., Rees, G., Frith, C. D., and Lavie, N. (2001) The role of working memory in visual selective attention. Science, Vol. 291, 2001, p. 1803-1806.
D’Esposito, M., Detre, J.A., Alsop, D.C., Shin, R.K., Atlas, S., and Grossman, M. (1995). The neural basis of the central executive system of working memory. Nature, 378, 279-281.
Duncan, J., Williams, P., Nimro-Smith, I., and Brown, I. D. (1992). The control of skilled behavior: Learning, intelligence and distraction. In D. E. Meyer and S. Kornblum (Eds.), Attention and performance XIV. Cambridge, MA: MIT Press.
Endsley, M. R. and Garland, D. J. (Eds.) (2000). Situation Awareness Analysis and Measurement. New Jersey: Lawrence Erlbaum Associates.
Engel, R. W., Kane, M. J., Tuholski, S. W. (1999) Individual differences in working memory capacity and what they tell us about controlled attention, general fluid intelligence, and functions of the prefrontal cortex. In A. Miyake and P. Shah (Eds.), Models of Working Memory: Mechanisms of Active Maintenance and Executive Control. Cambridge, UK: Cambridge University Press, pp. 102-134.
Ericsson, K. A., and Delaney, P. F. (1999). Long-term working memory as an alternative to capacity models of working memory in everyday skilled performance. In A. Miyake and P. Shah (Eds.), Models of Working Memory: Mechanisms of Active Maintenance and Executive Control. Cambridge, UK: Cambridge University Press, pp. 257-297.
Fleischman, E. A. (1975). Manual for ability requirement scales (MARS), Form A (Original Version).
Fleischman, E. A. (1991). Manual for ability requirement scales (MARS), Form A (Revised Version).
Glenberg, A. M. (1997). What memory is for. Behavioral and Brain Sciences, 20, 1-55.
Groeger, J.A. (2000). Understanding Driving: Applying cognitive psychology to a complex everyday task. Taylor and Francis Inc., Philadelphia, PA.
Groeger, J. A., and Clegg, B. A. (1998). Automaticity and driving: Time to change gear conceptually. In J. S. Rothengatter and E. Carbonell Vaya (Eds.), Traffic and transport psychology: Theory and application (pp. 137-146). Amsterdam: Elsevier.
Hankey, J. M., Dingus, T. A., Hanowski, R. J., Wierwille, W. W., and Monk, C. A. (2000). The development of a design evaluation tool and model of attention demand.
Report on work sponsored by the Federal Highway Administration (FHWA) under Contract No. DTFH61-96-C-00071.
Jonassen, D. H., Hannum, W. H., and Tessmer, M. (1989). Handbook of task analysis procedures. Westport, CN: Praeger.
Kahneman, D. (1973). Attention and effort. Englewood Cliffs, NJ: Prentice-Hall.
Kantowitz, B. H., and Knight, J. L. (1976). Testing tapping timesharing: I. Auditory secondary tasks. Acta Psychologica, 40, 343-362.
Laird, J., and Newell, A. (1983). A universal weak method (Tech. Rep.). Computer Science Department, Carnegie-Mellon University (unpublished).
Laird, J., Rosenbloom, P. and Newell, A. (1986). Universal Subgoaling and Chunking: The Automatic Generation and Learning of Goal Hierarchies. Boston: Kluwer Academic Publishers.

Appendix A Rationale for Selecting Tasks
A-25
LeDoux, J. (1996). The emotional brain: The mysterious underpinnings of emotional life. New York: Simon and Schuster.
Miyake, A. and Shah, P. (Eds.), 1999. Models of Working Memory: Mechanisms of Active Maintenance and Executive Control. Cambridge, UK: Cambridge University Press.
Nakayama, O., Futami, T., Nakamura, T., and Boer, E. R. (1999). Development of a steering entropy method for evaluating driver workload. SAE Technical Paper Series 1999-01-0892. Warrendale, PA: SAE International.
Navon, D., and Gopher, D. (1979). On the economy of the human processing system. Psychological Review, 86, 214-255.
Norman, D. A., and Shallice, T. (1980). Attention to action: Willed and automatic control of behavior. CHIP Document No. 99. Centre for Human Information Processing, University of California, San Diego, La Jolla.
North, R. A., and Riley, V. A. (1989). WITHINDEX: A predictive model of operator workload. In G. R. McMillan, D. Beevis, E. Salas, M. H. Strub, R. Sutton, and L. Van Breda (Eds.), Applications of human performance models to system design (pp. 81-89). New York: Plenum Press.
O’Reilly, R. C., Braver, T. S., and Cohen, J. D. (1999). A biologically based computational model of working memory. In A. Miyake and P. Shah (Eds.), Models of Working Memory: Mechanisms of Active Maintenance and Executive Control. Cambridge, UK: Cambridge University Press, pp. 375-411.
Parks, D., and Boucek, G. (1989). Workload prediction, diagnosis, and continuing challenges. In G. R.
Pashler, H. E. (1998). The psychology of attention. Cambridge, MA: The MIT Press.
Posner, M.I. and Peterson, S.E. (1990). The attention system of the human brain. Annual Review of Neuroscience, 13, 25-42.
Salvucci, D. D. (2001). Predicting the effects of in-car interfaces on driver behavior using a cognitive architecture. Manuscript submitted for publication.
Salvucci, D., Boer, E.. Liu, A. (2001). Modeling driver behavior in a cognitive architecture. Presentation at Carnegie-Mellon University.
Sarno, K. J., and Wickens, C. D. (1995a). The role of multiple resources in predicting time-sharing efficiency: An evaluation of three workload models in a multiple task setting. Technical Report ARL-91-3/NASA A3I-91-1, Aviation Research Laboratory, Institute of Aviation, University of Illinois at Urbana-Champaign. Prepared for NASA Ames Research Center. Contract NASA NCC 2-632.
Sarno, K. J. and Wickens, C. D. (1995b). Role of multiple resources in predicting time-sharing efficiency: evaluation of three workload models in a multiple-task setting. The International Journal of Aviation Psychology, 5 (1), 107-130.
Shah, A., and Miyake, P. (1999). Models of working memory: An introduction. In A. Miyake and P. Shah (Eds.), Models of Working Memory: Mechanisms of Active Maintenance and Executive Control. Cambridge, UK: Cambridge University Press, pp. 1-27.
Shallice, T. (1982). Specific impairments in planning. Philosophical Transaction of the Royal Society of London, B29, 199-209.
Shepard, A. (2001). Hierarchical Task Analysis. London: Taylor and Francis.

Appendix A Rationale for Selecting Tasks
A-26
Shinar, D., Meir, M. and Ben-Shoam, I (1998). How automatic is manual gear shifting? Human Factors, 40 (4), 647-654.
Stuss, D. T., Shallice, T. Alexander, M. P., and Picton, T. W. (1995). A multi-disciplinary approach to anterior attentional functions. In J. Grafman, K. Holyoak, and F. Boller (Eds.), Structure and function of the human prefrontal cortex. Annals of New York Academy of Sciences, 279, 191-211.
Verwey, W. B. (1991). Towards guidelines for in-car information management: Driver workload in specific driving situations. Report IZF 1991 C-13. Soesterberg, The Netherlands: Institutes of Perception.
Wickens, C. J. (1980). The structure of attentional resources. In R. S. Nickerson (Ed.), Attention and performance VIII (pp. 23-257). Hillsdale, NJ: Erlbaum.
Wickens, C. J. (1984). Processing resources in attention. In R. Parasuraman and R. Davies (Eds.), Varieties of attention (pp. 63-101). New York: Academic Press.
Wickens, C. J. (1991). Processing resources and attention. In D. Damos (Ed.), Multiple task performance. London: Taylor and Francis.
Wickens, C. J. (2002). Multiple Resources and Performance Prediction. Theoretical Issues in Ergonomic Sciences, 3 (2), 159-177.
Wickens, C. D., and Hollands, J. G. (2000). Engineering psychology and human performance. Upper Saddle River, N. J.: Prentice Hall.
Wierwille, W. W. (2000). Initial development of a computer program for assessment and evaluation of in-vehicle task visual and manual demands. In A. G. Gale (Ed.), Vision in Vehicles VIII, North Holland/Elsevier Press, Amsterdam. (In press.) Also, paper presented at the Eighth International Conference on Vision in Vehicles, Boston, MA, August, 1999.

Appendix A Rationale for Selecting Tasks
A-27
Exhibit
Partial Pool of Candidate Tasks Device-Oriented Tasks: New &and Evolving Tasks
Function Task Communications Call “son” using prestored voice tag Call “son” using prestored visual tag Call “son” where “son” is item #6 in a list Call specific phone number by manually dialing 7-digits Call specific phone number by manually dialing 10-digits Call specific phone number using voice dial Make recording on message system (e.g., “This is Dad. The freeway is closed. I’ll be late for dinner.”) Delete third message on message system Retrieve cell phone from seat/console/pocket/bag Answer incoming call Receive and remember information from call (e.g., grocery list) Generate instructions to someone else on call Have interactive conversation on phone Access voice messages Listen to voice messages Respond to pager (worn on belt) Advanced Entertainment Listen for weather prediction for tomorrow Change radio band Tune to JAZZ (or other RDS source) Download MP3 file Select and Play MP3 file

Appendix A Rationale for Selecting Tasks
A-28
Advanced Information Read the weather prediction for Detroit on Friday, (Internet Access) using hand controls Read the weather prediction for Detroit on Friday, using voice Get the third stock quote (manually)
Get the third stock quote (with voice) Read the fourth story in sports channel Listen to the fourth story in sports channel Browse custom info channel Access email Listen to email message Read email message
Navigation Enter information into address book (manual, voice, mixed mode)
Enter/find/select destination (manual, voice, mixed mode) Select/plan route Get directions to specific location (both select destination and route; manual, voice, mixed mode) Follow route (visual, voice input, or both) Find destination on map (visual) Choose hotel nearest to current location Zoom in/out two levels Scroll map toward destination

Appendix A Rationale for Selecting Tasks
A-29
Device-Oriented: Conventional Tasks
Function Task Navigation Find destination on paper map Follow route using paper map Select/reset trip A/B Entertainment Retrieve, insert, and play CD
Eject CD Store CD Retrieve, insert, and play audiotape Eject audiotape Store audiotape Increase volume two levels Change radio station to preset 105.5 Tune to 710 AM radio frequency Select next track on current tape Play CD, Disk 3, Track 5 Select next track on current CD Select CD disk, one number lower than current CD disk Increase treble Balance sound to the right Fade sound to the rear Mute the radio Change from AM to FM Climate Adjust center-left airflow vent Increase HVAC fan speed two notches Set A/C to maximum cool Set A/C to recirculate air within vehicle Adjust airflow from face to feet Open window Open sunroof Cruise Control Set cruise control Resume cruise control Improve Vision Adjust right side (passenger’s side) outside mirror Adjust rearview mirror Turn on headlights to low beam Turn on headlights to high beam Switch headlights from high to low beam Turn on wipers to low Turn on wipers to intermittent Turn windshield wash and wipe on Defrost windshield

Appendix A Rationale for Selecting Tasks
A-30
Miscellaneous Turn timer on Switch from English to metric measurement on gauges Adjust instrument cluster brightness
Non-Device-Oriented
Function Converse with passenger Give instructions to child in rear seat Take drink from beverage container in cup holder Eat sandwich Eat French fries Comb hair Apply makeup Shave face Put on earring Pick up dropped object Light a cigarette Take off jacket Pull-down sun visor and position Note: Additional tasks were added to this list, developed, and modeled, prior to final task selection. This list illustrates the large variety of candidate tasks from which task were selected.

B-1
B Appendix B. Tasks Used in the Study Twenty-three tasks were selected for use in the study. These tasks are listed below and described in the remaining sections of this appendix:
• Visual-Manual Tasks
o Coins
o HVAC
o Radio (Easy)
o Radio (Hard)
o Manual Cell Phone Dial
o Cassette Insertion
o CD/Track 7
o Destination Entry
o Route Tracing
o Read (Easy)
o Read (Hard)
o Map (Easy)
o Map (Hard)
• Auditory-Vocal Tasks
o Sports Broadcast
o Travel Computations
o Book-on-Tape Listen
o Book-on-Tape Summarize
o Biographical Question & Answer
o Route Instructions
o Route Orientation
• Mixed-Mode Tasks
o Voice Dial
o Delta Flightline
• Just Drive Task (for two Minutes)

Appendix B Tasks Used in the Study
B-2
B.1 Visual-Manual Tasks B.1.1 Coins Task In this task, the driver was instructed to select a specified amount of change from the coinholder, similar to what would have to be done to prepare for a tollbooth on an interstate. The driver was to select coins totaling the amount specified in the task request. An example task command was: “Your task is to retrieve coins from the coinholder totaling 65 cents. Please begin now.”
The amount of money to be selected was different on each task trial. Drivers were to place the retrieved coins on the console or in the hand of the safety observer in the car or experimenter in the lab. This way, the accuracy of the coin selection could be scored before the coins were returned to the coinholder.
The coinholder was a cup, fastened down in the cupholder of the vehicle’s console. It contained three nickels, two dimes, three quarters, two half-dollars, and one Sacagawea dollar coin.
The task was scored “fully successful” if the correct amount of change was selected. Otherwise, it was scored “not successful.
Figure B-1. Cup Holder in Laboratory
Cup holder used in the laboratory test buck for Task #1 contained 3 nickels, 2 dimes, 3 quarters, 2 half dollars and 1 Sacagawea dollar.

Appendix B Tasks Used in the Study
B-3
B.1.2 HVAC Task This task made use of a conventional three-knob (fan, temperature, and airflow) climate control panel mounted on the top of the center stack area above the CD unit. The test participant was asked to adjust all three controls to desired levels using conversational language, e.g., “Your task is to adjust the heating, ventilation, and air conditioning unit so that the fan is high, at a moderately warm temperature, to warm both face and feet. Please begin now.” The HVAC controller is shown in Figure B-2.
The design of the HVAC task was such that all three knobs had to be adjusted each time. However, each task request required six steps to be accomplished from its start state. Unlike most of the other requested tasks used in this study, the sequence of HVAC tasks was prescribed such that the previous trial's final settings were the initial settings on the next HVAC trial. This was done to alleviate workload from the front-seat safety observer in the on-road portion of the study that was subsequently conducted.
•
Figure B-2. OEM Type 3 Knob HVAC Controller as Installed in Laboratory
Also, it should be noted that the task requests were initially developed for HVAC systems that used slider controls instead of knobs but were adapted for use with the HVAC selected for this study. As a result, the order of settings specified in each task request did not correspond with the sequence of the knobs in the spatial layout of the device. This meant that the test participant had to listen closely to each task command and retain the settings long enough to accomplish them on the three-knob panel.
The completion time was determined by the participant’s performance, as measured from the instruction to “begin now” to the time at which they said “done.” A task trial was scored “fully successful” if all tree settings were correctly set. It was scored “partially successful” if only some were correctly set. Otherwise, it was scored “not successful.”

Appendix B Tasks Used in the Study
B-4
B.1.3 Radio (Easy) Task The Radio (Easy) task involved tuning the radio only. An OEM-style AM/FM in-dash radio/CD unit was used for this task (see Figure B-3). The knob on the left side was pushed to turn the radio off/on and rotated to adjust the volume. The knob on the right side was rotated to tune the radio. For the easy radio tuning task, participants were asked to manually tune the radio. The radio was already on, already set to the appropriate band (FM), and at a given preset station (100.1 FM). The test participant was asked to manually tune the radio to a specific frequency that was an approximately equal number of increments up or down from that setting (104.3 FM or 97.1 FM). They were to do this by means of the rotary knob provided for manual tuning on the device. This task was designed to be similar to the radio tuning reference task that was initially specified in Principle 2.1B of the Alliance of Automotive Manufacturers Driver Focus Principles, Version 2.0 (2002), but was slightly easier when implemented (it did not require turning on the radio, nor did it require selecting or changing bands, and required tuning slightly fewer increments to the target frequency). The order of requested frequencies (up or down) was randomized across blocks of trials. Prior to the start of each trial, the radio was configured back to the appropriate start state for the trial. Note that at the time the task was designed, the Alliance Principles called for a radio reference task that required at least 40 steps of 0.1 MHz from the start state. Using this as a guideline, it was balanced also with the need for an actual radio station to exist at the destination frequency specified, and for the start state to be near the middle of the band to ease the load on the experimenters by enabling a standard preset to be used on all trials, from which up and down tuning was possible. These additional constraints meant that the two target frequencies could not be exactly the same number of increments up or down from the preset. The target frequency of 97.1FM was 30 increments of 0.1 MHz down from the preset, and the target frequency of 104.3FM was 42 increments of 0.1 MHz up from the preset of 100.1FM). Note that most American radios move in 0.2 MHz increments, so if that method of counting increments is used, the number of increments down was 15 for 97.1FM and 21 up for 104.3FM. Drivers, of course, usually used large twists of the tuning knob initially and finer adjustments as they approached their target frequency, so the number of increments used to develop the task should not be taken to indicate the number of control inputs used by drivers to perform the task. The order of requested frequencies was balanced across blocks of trials.
A sample task command was: “Your task is to: tune the radio to 104.3. Please begin now.” Participants said “done” when they had reached the specified frequency. The radio provided no auditory feedback during the task.
The time to complete the task was measured from the word “begin” in the task instruction to the participant’s utterance of the word “done.” A task trial was scored “fully successful” if the correct frequency was set at the end of the task. Otherwise, it was scored “not successful.”

Appendix B Tasks Used in the Study
B-5
Figure B-3. Radio Ready for Radio (Easy) Task in Laboratory
B.1.4 Radio (Hard) Task The Radio (Hard) task involved turning on the radio, selecting the specified band, and then tuning to the specified frequency. The same OEM-style AM/FM in-dash radio/CD unit used for the Radio (Easy) task was also used for the Radio (Hard) tuning task (see Figure B-3). At the beginning of the task, the radio was (a) set to 100.1 FM, (b) switched to the wrong band (AM), and (c) turned to the off state. In addition, the specified target frequency was a larger number of increments away from the preset start state than in the Radio (Easy) Task, and the target frequencies were near the end of the band on either side of the start state (93.1 and 107.5). As such, the Radio (Hard) Task was intended to represent the type of reference task specified in the Alliance Driver Focus Principles, Versions 2.0 and 2.1, Principles 2.1B (2002, 2003). As mentioned previously, the Alliance Driver Focus Principles called for a radio reference task that required (in addition to turning on the radio, and switching bands), tuning to a target frequency at least 40 steps of 0.1 MHz increments from the start state. This was used as a guideline, but was again balanced with the need for an actual radio station to exist at the destination frequency specified, and for the start state to be near the middle of the band to ease the load on the experimenters by enabling a standard preset to be used on all trials, from which up and down tuning was possible. In addition, a more difficult version of this task was needed for the Radio (Hard) Task. These additional constraints meant that the two target frequencies could not be exactly the same number of increments up or down from the preset. The target frequency of 93.1 FM was 70 increments of 0.1 MHz down from the preset (or 35 increments of 0.2 MHz), and the target frequency of 107.5 FM was 74 increments of 0.1 MHz (or 37 increments of 0.2 MHz) up from the preset of 100.1 FM). Drivers, of course, usually used large twists of the tuning knob initially and finer adjustments as they approached their target frequency, so the number of increments used to develop the task should not be taken to indicate the number of control inputs used by drivers to perform the task.
This was a self-paced task. A sample task command was: “Your task is to, turn on the radio, select the FM band, and tune to 107.5 FM.” Participants were to do this by means of the rotary knob provided for manual tuning on the device. The order of requested frequencies (up or down)
This Panasonic radio was used for multiple tasks in the study. The radio was preset to FM 100.1 for Task #4 Radio (Easy).

Appendix B Tasks Used in the Study
B-6
was randomized across blocks of trials. Participants said “done” when they reached the specified frequency. The radio provided no auditory feedback during the task. Prior to the start of the trial, the experimenter/observer reconfigured the radio to its appropriate start state for the radio task.
The time to complete the task was measured from the word “begin” in the task instruction to the participant’s utterance of the word “done.” A task trial was scored “fully successful” if all three steps (turn on, select band, and tune to specified frequency) were done correctly. It was scored “partially successful” if only some were done correctly. It was scored “not successful” otherwise.
B.1.5 Manual Cell Phone Dial Task A Samsung Model SPH-A460 cellular flip-phone was used in this study (see Figure B-4 and Figure B-5). The Manual Dial task required the test participant to dial his or her own home using 10-digit dialing. The task was designed to represent just the dialing portion of placing a phone call (not opening the phone or waiting for the phone to connect). At the start of the task, the flip-phone was positioned on the center console, flipped open. The test participant picked up the phone, keyed in his or her own home telephone number (area code, followed by prefix and suffix) and then pressed <TALK> After dialing the last digit, the participant pressed <END> (instead of <TALK>) to end the call. This was done to prevent the home phone from ringing repeatedly during the test. Test participants were observed to position the phone in a variety of ways, including at the console, in the lap, and at the steering wheel. This was a self-paced task.
The task request was: “Your task is to call home by manually dialing the phone. Please begin now.”
•
Figure B-4. Samsung SPH-A460 Cellular Flip-Phone

Appendix B Tasks Used in the Study
B-7
Figure B-5. Cellular Flip-Phone Ready for Use in Laboratory
The completion time observed determined the task duration. A task trial was scored “fully successful” if the home number was correctly called (this was recorded on a reference card in advance of data collection by the experimenter for use in scoring task performance). A trial was scored “partially successful” if some of the task steps were done correctly. Otherwise, it was scored “not successful.”
B.1.6 Cassette Insertion Task A Legacy™ LR-204PX aftermarket cassette radio unit mounted in the center stack area, toward the bottom of the stack near the center console was used for this task. A single cassette in a hard-plastic cassette case was positioned on the center console.
The test participant was asked to reach over, pick up the cassette case, open it, remove the tape, and then insert the cassette into the Legacy cassette radio player, with the requested side up (side A or side B). The cassette tape was stored in a clear case, with a blank white label on it so that any identifying information on the side of the cassette could not be seen (that is, the side A or side B label was not visible through the case and could not be seen until the case was opened).
A sample task request was: “Your task is to remove the tape from this case and insert to play side B. Please begin now.” The side that was to be inserted face-up was varied from task request to task request in an apparently random fashion. Participants said “done” when they completed the task.
At the left, a cellular phone is open and sitting in the center console cup holder, as it would be at the start of phone tasks in the laboratory.

Appendix B Tasks Used in the Study
B-8
Figure B-6. Aftermarket AM/FM Cassette Radio as Installed in Laboratory
The task duration was based on the completion time. A task trial was scored “fully successful” if the tape snapped into place and the correct side was up. It was scored “partially correct” if the tape snapped into place and the wrong side was up. Otherwise, it was scored “not successful.”
B.1.7 CD/Track 7 Task In this task, the test participant received an auditory prompt to select a specific color-coded CD from a visor wallet containing six CDs, insert it into the CD slot on the radio/CD unit, and then select Track 7.
This task required the test participant to reach for a color-coded CD from a visor wallet that contained six CDs. Colors and surface patterns for the CDs were selected to minimize effects from any color vision limitations that a participant might have. The CD colors were gold swirl, purple, silver, red, black, pale gold (no swirl), and blue.
The participant was required to slide the CD out of the visor wallet and insert it into the CD slot in the radio/CD unit located in the center console. This automatically turned the system on. Then the participant needed to use a button to locate Track 7 (the readout of tracks appeared in the radio/CD unit display). The duration of the task was measured from the instruction to “begin now” until the participant said “done.”
Figure B-7 shows the radio with a CD inserted. Figure B-8 shows the visor-mounted CD wallet in the laboratory and Figure B-9 shows the visor-mounted CD wallet in the test car.
Inserting a cassette is a mechanical function of the radio, so power was not supplied to the device.

Appendix B Tasks Used in the Study
B-9
Figure B-7. Radio Ready for CD/Track 7 Task in Laboratory
Figure B-8. Visor Mounted CD wallet in Test Buck
The radio has read an inserted CD and has begun to automatically play the first track. For this task, participants were instructed to use the Seek-Track button, located in the lower-left corner of the radio, to change to Track #7.
A cloth CD wallet was used to hold CDs in the lab and cars. On the test buck, the wallet was mounted on an overhead bar with a mocked up sun visor. The positioning was based on the visor position in the test cars relative to the steering wheel and seat.

Appendix B Tasks Used in the Study
B-10
Figure B-9. Visor Mounted CD Wallet in Test Car
A task trial was scored “fully successful” if the correct CD was inserted and Track 7 was selected. It was scored “partially successful” if the wrong CD was selected, but it was correctly inserted. It was scored “not successful” otherwise.
B.1.8 Destination Entry Task Navigation Destination entry was accomplished with a Visteon Navmate 2.0 navigation system. The primary methods of destination entry for this Zexel/Navmate/PathMaster-type interface are street address, intersection, and point of interest. Only street address was used for this study.
Two strategies were available, spell a name or pick from a scrolling list. The test participant used the Visteon navigation system to enter driving destinations via street address. The test participant pressed four arrow keys and an enter button on the front of this display to enter the destination. The system was pre-set at the beginning of every trial so that the main menu screen was visible.
The first step in this process was to select Address/Intersection from the main menu as shown in Figure B-10. By default this selection was highlighted so the test participant would simply press Enter.
A cloth CD wallet was used to hold CDs for this task in the laboratory and the test cars. Here the wallet was mounted in a test car while the auxiliary visor was used to block sun for participants.
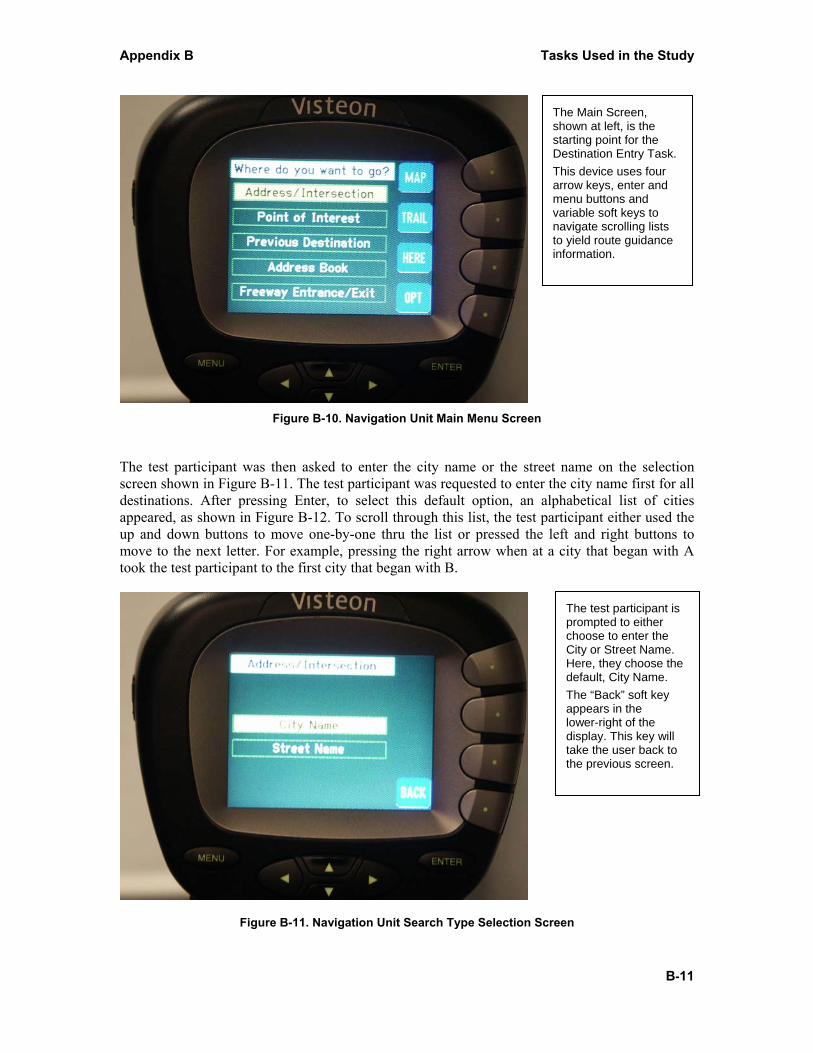
Appendix B Tasks Used in the Study
B-11
Figure B-10. Navigation Unit Main Menu Screen
The test participant was then asked to enter the city name or the street name on the selection screen shown in Figure B-11. The test participant was requested to enter the city name first for all destinations. After pressing Enter, to select this default option, an alphabetical list of cities appeared, as shown in Figure B-12. To scroll through this list, the test participant either used the up and down buttons to move one-by-one thru the list or pressed the left and right buttons to move to the next letter. For example, pressing the right arrow when at a city that began with A took the test participant to the first city that began with B.
Figure B-11. Navigation Unit Search Type Selection Screen
The Main Screen, shown at left, is the starting point for the Destination Entry Task. This device uses four arrow keys, enter and menu buttons and variable soft keys to navigate scrolling lists to yield route guidance information.
The test participant is prompted to either choose to enter the City or Street Name. Here, they choose the default, City Name. The “Back” soft key appears in the lower-right of the display. This key will take the user back to the previous screen.

Appendix B Tasks Used in the Study
B-12
Figure B-12. Navigation Unit City Selection Screen
After locating the desired city, the test participant would press Enter to get to the street selection screen. After arriving at the street selection menu, shown in Figure B-13, the same controls were used to choose the correct street name in the same manner as for the city selection. After the desired street was found, the Enter key was pressed.
Figure B-13. Navigation Unit Street Selection Screen
The system then asked the test participant to choose an address range or an intersection. Only the default, address range was used for this study and this screen is shown in Figure B-14.
The test participant must use the arrows at the bottom of the display to scroll up or down the list select get to the target city name. Right and left arrows move the highlight to the first entry of the next division, for instance from Abita Springs to the first city beginning with the letter B.
After a city name is selected, the Street Selection screen appears. Using the arrows the test participant must scroll up or down to choose the target street name.

Appendix B Tasks Used in the Study
B-13
Figure B-14. Navigation Unit Address Type Selection Screen
After address range was selected, the system notified the user which address numbers were valid at the top of the screen as shown in Figure B-15. The desired address was entered by using the up and down arrows to pick the first number, the test participant then used the right arrow to go to the next number, and so on.
Figure B-15. Navigation Unit Address Number Entry Screen
Once the correct address number was entered, the test participant pressed Enter and the system asked for route criteria on the screen shown in Figure B-16. The test participant then pressed Enter because the default settings, Quick and Shortest Time Route, was the one the test
Once city and street names are entered, the next step is to choose the Address Range option to enter the address number. This option is the default so the test participant must only press Enter at this screen.
This screen displays all valid street numbers for the address that has been entered. The test participant must now use the arrow keys to enter the number. Left and right arrows move the cursor while up and down arrows change the digit.

Appendix B Tasks Used in the Study
B-14
participant was requested to use. Once the test participant pressed Enter, destination entry was completed.
Figure B-16. Navigation Unit Route Type Selection Screen
Each destination was chosen such that each address would have nearly the identical number of key presses for entry, if the most efficient method of scrolling and spelling were used in each case. Nearly all of the addresses required 40 key presses, plus 7 Enter key presses to be successfully input into the system. The range of key presses was from 38 to 40. The 7 Enter key presses were consistent for each address. An example destination for entry was:
9841 Amanda Ln Algonquin, IL
Destinations were presented to test participants on paper that was positioned on the center console at the beginning of each trial. Each destination appeared in 36-point Times New Roman font, centered on the page as shown in Figure B-17. A different destination was entered for each trial.
To select the type of route desired, test participants were instructed to select the default “Shortest Time Route” by pressing the Enter key.

Appendix B Tasks Used in the Study
B-15
Figure B-17. Paper Stimulus Materials Book Ready in the Car
The task command was, “Your task is to enter a destination into the navigation system using the scrolling-list function. Please read the address from the paper at the right. Please begin now.”
If a destination was entered correctly, the trial was scored as “fully successful.” Otherwise, it was scored “not successful.”
B.1.9 Route Tracing Task In this task, the participant was asked to trace a path from a point of origin to a point of destination through a maze. The mazes were 8 x 8 inches dimension and were created through the maze generator program of Delorie, D. J. (2000). The program used to generate the mazes can be found at www.delorie.com/game-room/mazes/genmaze.cgi. Mazes were pre-tested for equivalence of difficulty prior to selection. The task was intended to be analogous to the task of developing a route from a given location to a destination through surface streets and city blocks.
For this task no device was used. Instead, a paper stimulus materials book and a marker were given to the participant. An example of the materials book opened to a printed maze as presented in the laboratory is shown in Figure B-18.
For the Destination Entry task a paper stimulus materials book was used. At left, the book is open to an address and lying on the center console in a test vehicle. The Safety Observer covered the book with a sheet of paper until the start of the task.

Appendix B Tasks Used in the Study
B-16
Figure B-18. Paper Stimulus Materials Book Ready for the Maze Task in Vehicle
B.1.10 Read (Easy) and Read (Hard) Tasks The Read (Easy) text and the Read (Hard) text tasks were developed to examine the distraction impact of a task that had visual input, vocal output, and verbal processing demands. The search for materials that would accommodate such task testing resulted in the use of a method called the “cloze procedure,” developed to test reading comprehension. In this procedure, text is to be read silently. The participant then vocalizes a word or phrase that he or she thinks best fits a blank provided in the text. Note that test participants were not encouraged to read aloud as this would have generated auditory stimuli and alter the nature of the task somewhat. In the cloze procedure, the speaking out of the missing word or phrase is unique.
A search for materials to use in testing led to the development of project-specific materials. Various reading tests were considered and the Watson reading test was a source of inspiration for the materials used in testing. However, reading tests are traditionally designed to be graded in difficulty such that progressively harder materials are used across the testing. The goal of our testing required more uniform materials within each category of task (easy versus hard). Thus, materials were developed that were, to the extent possible, matched in length and in terms of reading difficulty as indexed by the Flesch-Kincaid Readability Score. The easy materials were approximately 60 words in length with a Flesch-Kincaid (F-K) Grade Level Score of 4th to 5th grade reading level. The hard reading materials were approximately 90 words in length with a F-K Grade Level Score of 7th to 8th grade.
The Flesch-Kincaid Grade Level Score rates text on U. S. grade-school levels. Thus, a score of 8.0 indicates than an eighth-grader can understand the document. The F-K formula, given below, emphasizes only surface aspects of the text, namely average sentence length and average number of syllables per word. This type of readability formula has been criticized on the grounds that it does not take adequate account of idea units or other more cognitive units of analysis (Crowder, 1982). However, it was readily calculated in Microsoft Word®, Version 6.0, has some generally monotonic relationship to reading difficulty, and is used here only as a rough index of reading difficulty. The Flesh-Kincaid Grade Level Score is calculated as:
For the Maze Tracing task, a paper stimulus materials book was used. At left, the book is open to a maze and lying on the center console in a test vehicle. A marker is in the cup holder under the book. The Safety Observer covered the book with a sheet of paper until the start of the task.

Appendix B Tasks Used in the Study
B-17
F-K Grade Level Score = (0.39 x ASL) + (11.8 x ASW) –15.59
Where: • ASL is the Average Sentence Length (number of words divided by number
of sentences).
• ASW is the Average Syllables per Word (the number of syllables divided by the number of words).
Figure B-19 shows the paper stimulus materials book that contained the Read- Easy Text and the Read- Hard Text.
Figure B-19. Paper Stimulus Materials Book Ready in Laboratory
B.1.11 Map (Easy) and (Hard) Tasks The map reading task was originally adopted in an attempt to match a task being tested in the ADAM project. The ADAM map task involved Michelin maps of Ireland and Scotland (to ensure that test participants were unfamiliar with the area). In ADAM, participants were asked to pick up a map book from the front passenger seat, turn to a particular map book page and indicate which of two cities on that page was further north. It appeared from ADAM presentation slides that only three or four cities were present on a given map, making the ADAM map task significantly easier that it might otherwise be.
A paper stimulus materials book was given to the test participant for this task. This book was opened to a text passage, which can be found in Appendix J, and placed on the center console as seen at left.

Appendix B Tasks Used in the Study
B-18
A similar task using city maps or state maps instead was attempted and several concerns emerged. First, target streets (for city maps) or towns (for state maps) were tried and found to be far too difficult to search for while driving. Such a difficult task would almost certainly have resulted in crashes during the STISIM runs or some test participants would not have been able to attempt the task. It appears that the ADAM task worked around this problem by using target cities that were both large and sparse on a map page (e.g., only 2 or 3 large target cities per map). Second, a simplifying strategy was found for the task of “which of these two cities is further north” task that might make the task significantly easier than it might otherwise appear. The strategy is to start visual search from the top (north) of the paper map until a target is found or, happened upon, to restrict the visual search to the area of the map above it, i.e., north. This simplifies the task a great deal since one might be able to answer the question after finding only one target, not both targets. (The same appears to apply to the ADAM map task as well but the benefits would presumably be small since only 2 or 3 targets are present and they are visually quite salient due to size and color coding). Third, there was the need to reduce or eliminate the manual component of this task associated with turning the map book to a particular page. This should, allow for a task that more purely represented visual input, spatial processing, and vocal response. Fourth, there was the need to vary the difficulty of this task to have at least two levels. In the end, the testing version of the map reading task had two difficulty levels.
The map reading task begins with an auditory request and presentation of the custom map book already turned to the appropriate page. This eliminates the need to page through a map book. Participants could hold the map up or point to it with their finger. Second, a simplified visual search using labeled targets on the maps rather than the plain maps themselves was used. Third, to require that both targets be found, the participant heard the experimenter say: “Your task is to determine the relative orientation between <Target A> and <Target B>” By requesting the relative orientation between the two targets, both targets had to be found. A correct answer was along the lines of “Destination A is south and to the east of Destination B,” or “Destination A is southeast of Destination B,” or “Destination B is above and to the left of Destination A,” and so forth. Finally, both easy and hard versions of the map reading tasks by were enabled having a map with 12 labeled (easy) and a map with 22 labeled (hard) targets.
Each of six easy maps was used twice for test-retest evaluation, with different target pairs each time. Thus, for test-retest trials, exactly the same paper map display was used but different pairs of targets were used. Also, attempts were made to ensure that the targets in each pair of targets were roughly similarly spaced from each other. Each of six hard maps was also used twice for test-retest evaluation, with different target pairs each time.
Figure B-20 shows the map reading book as used in the laboratory.

Appendix B Tasks Used in the Study
B-19
Figure B-20. Map Book Ready in Laboratory
B.2 Auditory-Vocal Tasks B.2.1 Sports Broadcast Task This task was an auditory-vocal task which involved listening to a broadcast about a series of games in order to find out who played a specific team and who won. The pre-recorded broadcast lasted approximately 2 minutes and consisted of a series of short “soundbytes” about baseball games that had been played. The game, which was probed in the task request (and for which the driver listened), was near the end of the broadcast in a controlled position, third from the end. An illustrative task request was, “Your task is to listen to this sports broadcast and find out who played the Orioles and who won. Please begin now.” On each trial, the participant received a different pairing of broadcast and probe.
The duration of the task was pre-determined by the length of the recording (to approximately two minutes). The task was scored “fully successful” if the correct opponent and winner were reported. It was scored “partially successful” if one was correctly identified, and “not successful” otherwise.
B.2.2 Travel Computations Task In this task, test participants listened to recorded messages that presented information about a multi-leg travel itinerary. Periodically, the recording would pause while the test participant was asked to answer a travel-related question using mental arithmetic. These questions involved adding quantities that a traveling companion might inquire about (e.g., travel distances, gallons of fuel needed, time to reach a destination, and money needed to pay tolls. All questions involved adding two numbers that required a carry). This task was included because previous research used mental arithmetic as a cognitive task load (e.g., McKnight and McKnight, 1990; Tijerina, et al., 1995), and because cognitive psychology research suggests that mental arithmetic may be done through imaging and perhaps treated as involving spatial processing. The recordings were never repeated, each lasted between 1.75 and 2 minutes, and this task externally paced the test participant.
A set of paper maps assembled into map books were used for this task. These maps can be found in Appendix J. An open map book would be placed on the center console as shown at left.

Appendix B Tasks Used in the Study
B-20
First, the test participant listened to a request, performed the mental addition to get the answer, said the answer out loud, received feedback giving the correct answer, and then heard another question until four questions had been asked. A sample task request is: “Your task is to help with some trip computations. Please begin now. Today we are going from the city of Starburst to the city of Ogden, and then on to Brightland. The first leg of our trip is 19 miles in length, and the second is 45 miles in length. How far do we have to drive altogether? 64 miles is correct . . . " and so on until all four types of questions had been asked (travel distance, gallons of fuel, time to reach destination, and money needed for tolls). At the end of the sequence of four computation requests, the participant heard the words, “We are done.”
As noted above, the duration of the task was pre-determined by task design to be between 1.75 and 2 minutes. A task trial was scored as “fully successful” if all four computations were correct. It was scored “partially successful” if one to three computations were correct. Otherwise it was scored as “not successful.”
B.2.3 Book-on-Tape Listen Task The stimulus materials for this task came from the book Two-Minute Mysteries by Donald J. Sobol (Scholastic Inc., 1967). Each story is a mystery that requires Sherlock Holmes-like deduction to unravel the mystery. For example, one story is about a sheriff who stops by a bakery. The sheriff asks the proprietor for some baking soda and the proprietor claims not to have any. This prompts the sheriff to check a load of baked goods only to find contraband liquor hidden inside bread loaves. Each story asks the reader to solve the mystery (e.g., the sheriff grew suspicious when he thought how odd it would be for a bakery not to have baking soda).
Each story was recorded to last approximately 2 minutes. The test participant was asked to listen to the story (“Your task is to: Listen to this book-on-tape selection. Please begin now”), rather than attempt to solve the mystery (an engaging task, perhaps, but harder than it might seem) the test participant was asked to summarize the gist of the story afterward. This was an auditory-vocal task; it was receptive, and placed a diffuse demand on memory.
The task duration was determined by the length of the recording (approximately 2 minutes). A task trial was scored “fully successful” if the participant listened to the story and was able to summarize the story’s gist and reasonably. If no summary could be accomplished, the task was scored “not successful.”
B.2.4 Book-on-Tape Summarize Task Immediately after the book-on-tape selection was played, the test participant was asked to summarize the story in his or her own words (“Your task is to: summarize the selection you just heard. Please begin now.” During training on the task, participants were instructed to summarize main characters, plot events, etc. and had the opportunity to practice summarization and receive feedback on the quality of their summaries. Nonetheless, test participants varied widely in their expressive ability. Many often provided a very terse summary. Even though this was a generative task, test participants appeared to approach it within their own comfort zone of ability. However, the summaries provided two things: (1) a way to determine whether the listen task was performed successfully, and (2) a means of imposing a generate speech load that was separable from the listen portion of the task and that provided all the participants with the same set of information to be talked about. This was done so that the effects of generating speech on driving performance could be examined (since generating speech is one component of other tasks, such as conversing with a passenger, or talking on the phone).
The task duration was measured from the instruction to begin to the point when the participant said “done.” A task trial was scored “fully successful” if the participant summarized the story accurately (with no errors) and reasonably. It was scored “partially successful” if the participant’s

Appendix B Tasks Used in the Study
B-21
summary contained either errors or missed key concepts (main characters, summary of main plot events). If no summary could be accomplished, the task was scored “not successful.”
B.2.5 Biographical Question and Answer Task This auditory-vocal task involved paced question-and-answer dialogue based on elementary biographical questions such as: What is your name? What is your address? What make and model of vehicle do you drive? How long have you owned your present vehicle? And so on. The recorded dialogue included preset periods (of approximately 4 sec) during which test participants provided a response. This task used the same questions on each block, and so it was presumed to place little load on the test participants. However, this task became so monotonous that some test participants complained about it and from time to time generated creative responses.
The duration of this task was pre-determined by the length of the recording (approximately 2 minutes). A task trial was scored “fully successful” if all questions were answered; it was scored “partially successful” if some of the questions were answered. Otherwise, it was scored “not successful.”
B.2.6 Route Instructions Task This auditory-vocal task involved route instructions for a set of errands. Participants listened to a set of route instructions and then were asked to paraphrase them. Each task was comprised of four such listen-and-repeat sets. The total task was pre-recorded and lasted approximately 2 minutes (including intervals which allowed participants to respond). An example is: “Your task is to listen to some route instructions for a set of errands we need to run today and then paraphrase them back to me. Please begin now. Today we need to take the dog to the vet, pick up some dry cleaning, and pick up a friend from work. First, to take the dog to Pet Doctors, take Main Street to 6th Avenue and turn left. It’s the big blue building. Could you please paraphrase the instructions for getting to the vet?" Three more sets were given before the task was over, as designated by the phrase, “We are done.” A different set of errands and route instructions were presented on each task occurrence.
The duration of this task was pre-determined by the length of the recording, approximately two minutes. A task trial was scored “fully successful” if all four sets of route instructions were correctly reported. It was scored “partially successful” if some of the route instructions were correctly reported. Otherwise, it was scored “not successful.”
B.2.7 Route Orientation Task This artificial task was created as another auditory-vocal task that emphasized spatial processing. The test participant listened to recorded route instructions and, after each turn in the sequence, was asked to indicate the direction in which they would be headed after that turn. The participant was told that he/she is traveling in a particular direction (for example, North) and then would be making a turn (either left or right). After becoming reoriented to the new direction, the participant was to tell the observer the new direction. An example of what the participant heard is: “You are traveling north. After a time, you turn left; in what direction will you be traveling then?”
Note that after a pause, during which the test participant provided a response to the question, the recorded message provided the correct answer before proceeding to the next leg of the journey, e.g., “West is the correct answer. You now travel straight for a short distance and then turn right. What direction will you be traveling then?” Participants heard eleven of these questions, one after another, until they heard the words “We are done.”
This was an externally paced task that lasted approximately 1.75 to 2 minutes. A task trial was scored “fully successful” if all eleven orientations were correctly identified. It was scored

Appendix B Tasks Used in the Study
B-22
“partially successful” if only some of the orientations were correctly identified. If none of the orientations were correctly reported, it was scored “not successful.”
B.3 Mixed-Mode Tasks B.3.1 Voice-dial Task Voice Dial used was the Samsung Model SPH-A460 flip-phone enabled with Sprint PCS© digit-by-digit voice recognition. This system used “continuous recognition” and allows participants to speak digits in a natural way. The task was designed to represent just the voice-dialing portion of placing a call (not opening the phone, or waiting for the phone to connect). At the start of a trial, the flip-phone was positioned open on the center console area. The test participant picked up the phone, pressed <*> <TALK>, then engaged in dialogue with the Sprint PCS Interactive Voice Response (IVR) system. He/she listened for the system to say, “Ready,” and then said, “Call,” followed by the 10-digit number, spoken digit by digit. The system then repeated the entire phone number and queried the participant as to whether it was correct. The participant responded appropriately. After the participant verified, he/she said, “Cancel” to end the call. The phone was put back on the center console at the end of the task. This task was paced by the nature of the interaction with Sprint PCS voice dialing.
B.3.2 Delta Flightline Task In this task, the test participant was given the following type of verbal instruction via a recorded voice prompt: “Your task is to find the arrival time of the flight from Cincinnati to Albuquerque, leaving Cincinnati at 5:00 p.m. today. Please begin now.”
This task involved listening for the arrival time of a direct flight from a point of origin to a point of destination. It made use of a commercial, interactive voice-response system provided by Delta Airlines. This task was intended to be primarily auditory-input and vocal-output with verbal processing requirements. However, the task began with a voice-dial that required the test participant to press the button sequence <*><TALK> on the flip-phone and then use the Sprint PCS voice-dialing name tag feature “Call Delta.” An example of a Delta Flightline dialogue is given in Figure B-21.
The Delta Flightline IVR system was chosen because it had a reasonably good interface and performance. However, some participants found that working with the system (and also the Sprint PCS voice-dialing system) was frustrating and error-prone.

Appendix B Tasks Used in the Study
B-23
•
Using cell phone dial * TALKand say “Call Delta”
Listen to the welcome message
InstructionsFlight
NumberSay Departure
City
Say Arrival City
Confirm Departureand Arrival Cities
Say “Correct”Say “Incorrect”
Do you have arrival ordeparture information?
Say “Departure” Arrival
What Day?
Say “Tomorrow”
ApproximateTime?
Say “Afternoon”Say “Morning” Say “Evening”
Listen to Departure/Arrival Time/Location, Flight, andGate Number
Remember Arrival Time, Repeat Aloud the time, andsay “Done”
•
Figure B-21. Delta Flightline Example Dialogue

Appendix B Tasks Used in the Study
B-24
B.4 Just Drive Task To establish a baseline for driving only, two-minute "just drive" task was created. This task would provide a baseline without any concurrent task activity. The test participant was told that his task was simply to drive, and respond to any event-detection stimuli that occurred. A two-minute period of just driving was recorded for each Just Drive task. The task request was: “Your task is to just drive. Please begin now.” The task continued until the participant heard the words “We are done,” at the end of two minutes.
The logic of providing a 2-minute observation period explicitly for observing single-task driving performance merits further comment. Between tasks there were potentially a large number of activities under way. The test participant might be prompted to surge forward to regain a nominal 1.5 sec time headway in separation prior to the start of a new task. Task requests might be played. The test participant might engage in conversation with a staff member. And so forth. For these reasons, time periods between tasks can never be considered “just driving” and any analysis comparing between-task periods is essentially meaningless because the nature of between-task activities was unique to each participant, and was not coded or captured in anyway due to its idiosyncratic nature. There is no way for an analyst to know what the data during between-task periods reflects.
B.5 Task Command Presentation All task commands, which asked a subject to begin task performance, were pre-recorded and stored in MP3 digital music format. Task commands were arranged in order according to the task sequence being used for a particular subject and loaded into the memory of a Creative Labs Nomad IIc music player. This device was selected for ease of use by the experimenter when in-vehicle. The four-way hat switch allowed the experimenter to start and stop task command presentations easily and without taking his/her eyes off other areas of interest. The ordering of task commands to match the experimental order being used also meant that experimenters simply played the requests sequentially rather than having to select the required file from a list. The music player is shown in Figure B-22.

Appendix B Tasks Used in the Study
B-25
Figure B-22. Digital Music Player
B.6 Appendix References Alliance of Automotive Manufacturers, Driver Focus-Telematics Working Group. Statement of Principles, Criteria, and Verification Procedures on Driver Interactions with Advanced In-Vehicle Information and Communication Systems. Version 2.0 (2002) and Version 2.1 (2003).
Crowder, R.G. (1982). The psychology of reading: An introduction. Oxford: Oxford University Press.
Delorie, D J., (2000) Maze Generator Program. www.delorie.com/game-room/mazes/genmaze.cgi
McKnight, J.A., and McKnight, A.S. (1991). The effect of cellular phone use upon drive attention. Landover, MD: National Public Services Research Institute.
Sobol, Donald J. (1967). Two-Minute Mysteries. New York: Scholastic Inc.
Tijerina, L., Kiger, S., Rockwell, T., and Tornow, C. (October, 1996). NHTSA heavy vehicle driver workload assessment final report supplement – Task 7A: In-cab text message system and cellular phone use by heavy vehicle drivers on the road. (DOT HS 808 467). Washington, DC: National Highway Traffic Safety Administration.
The portable battery-powered MP3 player that was used to play task request recordings in all venues is shown. This particular model was chosen for ease of use and navigation by the experimenter. For standard operation, only the 4-way button in the middle was needed.

C-1
C Appendix C. Instrumented Vehicles Used in Road and Track Trials
C.1 Background Platoon Requirements Throughout the experimental design of the Driver Workload Metrics Project, a platoon of three instrumented vehicles was required. The subject vehicle housed the majority of instrumentation and the test subject. The other two vehicles provided object and event detection (OED) stimuli. This required two types of instrumentation, one heavily instrumented car would record driver performance and carry out all command and control functions. The other two vehicles would need little instrumentation aside from methods of presenting information to their drivers.
•
Three-Vehicle Platoon, with “multitasking” driver inmiddle vehicle (and lead/follow vehicles providing
OED stimuli)
Turn SignalIllumination
CHMSLIllumination
Deceleration ofLead Vehicle
Driving Test Approach
LaneBust
Figure C-1. Platoon OED Stimuli
The OED events would consist of CHMSL or turn signal lights being activated in the lead and follow vehicles as well as maneuvers such as a decelerating lead car or a car leaving its lane as is represented in Figure C-1. This required that the instrumentation in the subject vehicle be able to communicate with the computer in the lead and follow vehicles to send and receive commands and data. This was accomplished with a wireless LAN system utilizing an access point in the subject vehicle with client cards in the lead and follow vehicle computers. A basic overview of this communication is shown in Figure C-2.

Appendix C Instrumented Vehicles Used in Trials
C-2
Figure C-2. Platoon Communications Overview
C.2 Vehicle Data Acquisition Hardware C.2.1 Subject Vehicle The subject vehicle is the heavily instrumented heart of the platoon. This vehicle, driven by test subjects, recorded engineering and video data on driver performance and allowed the experimenter to control the actions of the data acquisition systems in the lead and follow vehicles. In addition to subject and experimenter, the subject vehicle also carried a safety observer who ensured that the vehicle was operated safely and assisted the experimenter with materials and subject interaction.
Figure C-3 shows a simplified view of the equipment used in the subject vehicle. There are four general locations in the vehicle where equipment was installed: the driver’s station, safety observer’s station (front passenger seat), the experimenter’s station (in the back seat), and the trunk for equipment that was not a part of the system interface. Equipment installed in the vehicle included computer equipment, audio/video equipment, intelligent sensors, basic sensors, support equipment, and test devices.

Appendix C Instrumented Vehicles Used in Trials
C-3
•
A B C D E F G HSELEC TED
ON-LIN E
Monitor
Mouse
C
C
C
C
SD
DATAXiZ 9200
SD RDPORT A
SD RDPORT B
AONLINE
B
BWD - ENTER
PORT SEL DISC DATA
+A B C D E F G H
SELECTED
ON-LINE
ΩDVD
C
C
C
SD
DATAXiZ 9200
SD RDPORT A
SD RDPORT B
AONLINE
B
BWD - ENTER
PORT SEL DISC DATA
+A B C D E F G H
SELECTED
ON-LINE
ΩDVD
C
C
C
C ToKVM
KVM
ToKVM
C
Digital Quad Processor
Digital Quad ProcessorHoritaSerialTitler
HoritaSerialTitler
LCD TV
LCD TV
MPEGEncoder
Channel #1
MPEGEncoder
Channel #2
Satellite dish
DGPS Receiver
Serial Hub
IScan ETL-500
SD
DATAXeZ 128K TA ER DR RS/C CS SO/TRD/R CD/1
32 16 8 4 2 1 SYNCOVFERR -
ALM TEST PWR
ERR INS ERR RSTMODE
0 1
RATE ST SP NCRMODE RATE
+ +
SD
SD
Cisco 1720
BRIS/T
CONSOLE
AUXWIC 0 OK
OK
B2
B1
WIC 1 OK
DSUCPU
LNK100FDX
S3
LOOP
LP
SDCoreBuild er 3500Co m3
™
SD
8000HP J4110A
ProCurve
DAQ Computer
ACC 1 RadarCAN Emulator
LaneTracker
DMI
SCXIChassis
Digitaland
AnalogI/O
LCD MonitorKeyboard
andMouse
VideoSwitch
PWR
OK
WIC0ACT/CH0
ACT/CH1
WIC0ACT/CH0
ACT/CH1
ETHACT
COL
Radio tower
WLAN Access Point
Figure C-3. Data Acquisition System Overview Diagram
Computer equipment installed in the subject vehicle included computers, data acquisition devices, and communication and interface devices. Most of this equipment was installed in the vehicle’s trunk (see Figure C-4). The core of the DAQ system was a Super Micro SuperServer 6040G, an industrial 4U rack mountable server with dual 1.06 GHz Pentium 4 processors. This computer also was equipped with MPEG encoding cards. In addition, this computer contained a National Instruments PCI-6025E multi-function DAQ card that was used to interface with a National Instruments SCXI chassis. The chassis contained a number of modules that allowed for digital and analog input and output for data channels such as speed sensors, position sensors, and indicator LEDs. These modules included isolation amplifiers, frequency counters, and input/output modules. This computer also contained a 16-port serial communication card from Comtrol, which allowed for connection to a 16-port Comtrol Rocket Port serial hub though which all of the serial devices sent and received data from the DAQ computer.

Appendix C Instrumented Vehicles Used in Trials
C-4
•
Figure C-4. Subject Vehicle Trunk Mounted Equipment
A standard network card connected the DAQ computer to a Lucent Technologies Orinoco AP-500 access point. This device acted as both the IEEE 802.11b radio and as a router for the WLAN system. The confederate vehicle computers were connected to the network via Lucent Technologies Orinoco Gold PCMCIA WLAN cards.
The trunk also contained the desktop computer portion of the Iscan ETL-500 eye tracking system. This computer did not need network access and was connected to the DAQ computer as an intelligent sensor through the serial port hub. Both the Iscan computer and the DAQ computer were connected to a Tripplite KVM switch, which allowed both to be controlled from a single set of keyboard, mouse, and 15” LCD monitor.
The Audio/Video (A/V) System comprised a large portion of the overall DAQ instrumentation. Much of the A/V equipment was mounted at the Experimenter’s Station as shown in Figure C-7. In all, the vehicle contained four cameras for forward, rearward, right, and left lane scenes, grouped as external scenes and combined onto one video image by a Sensormatic B + W Digital Quad Processor. The exterior video channel, Figure C-5, shows the confederate vehicles as well as lane lines on both sides of the car. An additional four cameras were used to record the drivers face, the steering wheel, and center console areas. These are grouped together as the interior scene into one image with a Sensormatic Color Digital Quad Processor. A combination of B+W and color C-mount bullet cameras were used. All were high-resolution CCD cameras with auto gain control.
Pertinent vehicle data was overlaid on the video image in real time by Horita SCT-50 serial titlers. This not only provided information to a video reviewer but also to the experimenter during system operation. Data displayed on the exterior video channel included Frame Number, Range, and Range Rate at the top with Trial Number, Lane Position, Wheel Speed, and Longitudinal

Appendix C Instrumented Vehicles Used in Trials
C-5
Acceleration. The exterior video channel displayed frame and trial numbers, steering wheel and accelerator position, brake pedal force and roadway curvature. The interior video channel also included an SMPTE time code applied by a Horita TG-50 time code generator/inserter to aid in any manual data reduction from the video recordings.
These videos with their overlaid data were then displayed to the experimenter on two Sharp Electronics LC-10A2U 10” LCD TVs.
•
Figure C-5. Subject Vehicle Exterior Video Channel

Appendix C Instrumented Vehicles Used in Trials
C-6
•
Figure C-6. Subject Vehicle Interior Video Channel
This allowed the experimenter to easily monitor critical data channels as well as camera aim and performance. The video channels were then sent to the Vitec Multimedia MPEG Profiler MPEG encoding cards in the DAQ computer. These cards encoded audio and video into MPEG 2.0 format with DVD standard settings, which was then stored on removable hard disks in the computer until the data could be archived.

Appendix C Instrumented Vehicles Used in Trials
C-7
•
Figure C-7. Subject Vehicle Experimenter Station
Due to a limitation in the number of cameras that could be used, a number of IR LEDs were placed in the interior camera views to convey desired information without the use of a camera. One of these groups of LEDs indicated whether the subject was pressing the gas or brake pedals or if the safety observer was braking the vehicle with the auxiliary brake. A second group of LEDs, also in the interior view, was used to indicate whether a lead or follow car lane-bust was occurring. Thus a video reviewer would know, even without seeing the exterior scene, when one of these OED events was taking place. Two individual LEDs were placed in the cabin so that one would show up in both interior and exterior video scenes. These individual LEDs were activated by the DAQ computer to mark the start of testing, thus giving a redundant way of synchronizing the video with engineering data files.
The subject vehicle audio system had a number of components. To collect general audio, a boundary microphone was placed on the ceiling near the front of the vehicle cabin. The experimenter also wore a second microphone. These two inputs were combined, filtered, and amplified by a Beringer MX-602A Eurorack mixing console before being input to the MPEG encoding hardware. In addition, since all task requests were presented using MP3 digital format prerecorded instructions, the experimenter had a Creative Labs Nomad IIc digital music player connected to standard amplified stereo computer speakers placed behind the driver’s seat.

Appendix C Instrumented Vehicles Used in Trials
C-8
•
Figure C-8. Subject Vehicle Driver's Station
Intelligent sensors comprised an important part of the overall DAQ system. Lane position and environment variables were gathered by an Assistware SafeTRAC Drowsy Driver Warning system. While this device usually is installed in commercial vehicles and alerts drivers of unsafe operation via a small display and auditory tones, it also has data collection capability. The video image processing device tracks lane lines by their contrast with surrounding pavement and can be made to output a number of channels of data with regard to lateral vehicle control. These data channels were transmitted via serial port to the DAQ computer and logged in the engineering data stream at a rate of 10 Hz.
Positional information was also obtained and logged from a DGPSMAX unit from CSI Wireless. This device recorded a number of types of GPS information after applying differential corrections from the Coast Guard’s L-band or the FAA’s Wide Area Augmentation System. This information was then transmitted at 5 Hz via a serial port to the DAQ computer to be logged to its own data file along with the DGPS information from the lead vehicle.
With no viable commercially available range finding system to determine the range to the lead vehicle, a solution was developed in-house for this purpose. The CAMP range sensor combined a number of elements to utilize off-the-shelf parts for accurate range finding. The heart of the system was a Jaguar ACC1 module for a British model 2001 Jaguar XKR. With the aid of the developers and manufacturer, the unit was re-programmed to output a number of range related variables. Since the ACC1 was made to work with an automotive CAN network, a network simulator was needed that could control the sensor. Smart Engineering Tool’s Netway 4.0 is a multi-protocol network emulator with a proprietary programming environment. The device is stand-alone and was programmed to start the radar and begin transmitting and receiving data on power up. Radar messages were transmitted on the CAN bus while data to and from the DAQ

Appendix C Instrumented Vehicles Used in Trials
C-9
system utilized the built in RS-485 protocol. A serial converter was then used to drop line-levels to RS-232 levels and the messages were then transmitted to and from the DAQ via the serial hub. The entire system provided a relatively low cost solution to the commercially available products while yielding the same longitudinal data.
A Nitestar Distance Measuring Instrument (DMI) was installed at the Safety Observer’s station for three main purposes. First, the data collection side of this device allowed for a redundant measure of speed and distance traveled. Second, this device allowed the Safety Observer to mark events or trigger events based on speed or distance traveled. Finally, with serial communication and the DMI number pad, the device was also used as a data-entry channel for the Safety Observer to be prompted for numbers that, when entered, would become a part of the engineering data stream. For example, one of the tasks performed by the Safety Observer was to ask the test participant a question about workload during the last task performed and enter this data into the engineering data via the DMI. The DMI and Safety Observer marker buttons are shown in Figure C-9.
•
Figure C-9. Safety Observer's Clipboard with Event Markers and DMI
A number of basic sensors were also installed in the subject vehicle to record driver control inputs. Accelerator and brake pedals used micro switches for on/off determination to drive the IR LEDs detailed in the Audio/Video section. Percent of travel of the accelerator pedal and both the driver’s and safety observer’s brake pedals contained transducers to measure pressure applied to the pedal. In addition, a pressure transducer was added to the brake line near the master cylinder to collect brake-line pressure information. Steering wheel position was recorded with a Computer Optical Products CP-85012AN360 12-bit analog optical encoder. This encoder output an analog voltage representing the position of the steering wheel, which was transmitted to one of the SCXI modules.

Appendix C Instrumented Vehicles Used in Trials
C-10
A number of basic sensors were used to record vehicle motion data. An SCXI frequency counter connected to the OEM transmission sensor obtained vehicle speed. Vehicle acceleration and yaw data were collected using a Crossbow DMU-6. This sensor pack contains an accelerometer and a gyroscope that yield an analog signal for each axis of acceleration and rotation.
Multiple vehicle switches including cruise control activation, turn signal, and headlamp status were recorded as analog voltages. The driver’s horn was disabled so that the horn switch could be used as a driver response button during the study. An auxiliary horn button was added at the Safety Observer’s station to replace the one disabled at the steering wheel. In addition, there were three switch inputs at the driver station that could be connected to finger or foot switches to allow the subject to respond to stimuli.
A lapel microphone connected to an amplification circuit provided another mode of subject response. By calibration of this analog voltage, the system could treat a vocal response from the driver just like a physical switch for subject responses.
Support equipment was also required in the subject vehicle for electrical power, cooling, and braking. The vehicle’s stock alternator was upgraded to a 130A OEM high output model to charge a two-battery system. The vehicle’s stock battery was replaced with an Optima 1000CCA gel cell battery. A second, auxiliary, Optima 1000CCA battery was installed in the trunk. A Perko battery disconnect switch provided isolation of the auxiliary battery from the vehicle system to prevent the DAQ system from draining the main battery. An Excel Tech XPK116 1100W true sine wave inverter was connected to the auxiliary battery to provide 120V AC for the electrical devices in the car.
With the computers and much of the support equipment mounted in the trunk, auxiliary cooling was needed to prevent temperatures from rising too high and causing damage to the electronics during summer testing. A Manex MX-3 auxiliary AC unit was installed for trunk cooling (see Figure C-10). This unit was connected to the OEM AC compressor and was manually controlled by the experimenter to maintain trunk temperature at suitable levels via separate controls mounted at the Experimenter’s Station. The spare tire and jack for this vehicle were moved to the lead vehicle trunk to make space for the auxiliary AC unit.

Appendix C Instrumented Vehicles Used in Trials
C-11
•
Figure C-10. Auxiliary Air Conditioner Unit
The primary job of the Safety Observer was to ensure that the vehicle was operated in a safe manner, warn the test participant, and take control if needed. To aid this function, a Stromberg Hydraulic Instructor’s Dual Control Brake was installed at the Safety Observer’s station. The unit consisted of a pedal attached to a hydraulic master cylinder, brake line, and a slave cylinder connected to the driver’s side brake pedal. Thus, in the event of an unsafe closing rate, the Safety Observer could remotely depress the driver’s side brake pedal and actuate the vehicle brakes. The Safety Observer’s brake is shown in Figure C-11.

Appendix C Instrumented Vehicles Used in Trials
C-12
•
Figure C-11. Safety Observer's Auxiliary Brake System
A number of electronic devices and other components were also installed in the subject vehicle. While not used to record data, these items were used by the test participants during execution of the in-vehicle tasks examined in this study. The center-console cup holder was used to hold coins, a cassette tape, a marker, and a cellular phone.
The cellular phone used was a Samsung SPH-A460 PCS tri-band model. Cellular phone service was purchased from Sprint. In the instrumented subject vehicle, the cellular phone was used in conjunction with a hands-free device, a Brookstone Hands-Free Headrest Car Cell Phone System, shown in Figure C-12. The Brookstone unit plugs into the external headset jack on the cellular phone. The unit mounts to the driver’s headrest and has a speaker on the left and boom microphone on the right. This allowed the driver to press two buttons on the phone to start a call and use voice commands to complete the call. To ensure cellular signal strength and improve voice recognition in areas with low-cellular signal strength, an amplifier was installed. The Cell Antenna Corp.’s PowerMAX DA4000 analog and digital cellular signal amplifier was installed with a CA55M car mount cellular antenna.
Any paper materials required for a task were placed on the center console for the driver to pick up. The overhead sun visor held a CD wallet, shown in Figure C-13, containing seven different colored CDs.

Appendix C Instrumented Vehicles Used in Trials
C-13
Figure C-12. Brookstone Hands-Free Headrest Car Cell Phone System
Figure C-13. Interior Roof of Instrumented Subject Car

Appendix C Instrumented Vehicles Used in Trials
C-14
The remaining test devices were installed in or near a heavily modified center stack. The original center-stack components, which came from the manufacturer, were moved to the Experimenter’s Station. The radio and multi-function display, which contained the OEM navigation system, HVAC, radio, and CD changer controls were relocated to the Experimenter’s Station as shown in Figure C-14. Then, three 2-DIN mounting racks were installed in the center stack at low, middle, and high dash heights. Each unit was provided with DC power, wiring to a pair of auxiliary door-mounted speakers, and a signal amplifier connected to the OEM radio antenna. These racks allowed for the installation of many types of standard automotive accessories in any of the three locations.
Devices that were installed in the center stack included a Legacy AM/FM cassette radio near the console height, a Panasonic AM/FM CD radio in the middle location, and a three rotary knob HVAC controller in the top position. A flexible, gooseneck-mounting arm was used to position the display of a Visteon NavMate navigation system, near the HVAC controller at the high dash location.
•
Figure C-14. Relocated Center Stack Components
C.2.2 Lead Vehicle The lead vehicle (see Figure C-15) was one of two lightly instrumented confederates to the subject vehicle. The basic requirements for this car were that it be able to receive signals to direct the driver to perform the deceleration maneuver and that it collect DGPS data on its position for relative comparison with the subject vehicle. The equipment required to perform these tasks consisted of a computer, interfaces, sensors, vehicle components, and support equipment.

Appendix C Instrumented Vehicles Used in Trials
C-15
•
Figure C-15. Rear View of Lead Vehicle
The lead vehicle required much less computing and data acquisition power than the subject vehicle. The data acquisition system for the lead vehicle consisted mainly of a laptop and custom LabVIEW code used in conjunction with a few external components. The laptop was an IBM 233 MHz Pentium II ThinkPad running the Windows 98® operating system. This machine was networked with the subject vehicle computers via a wireless LAN with an Orinoco PC Gold PCMCIA card and a roof mounted high-gain antenna. The laptop serial port was used to connect a Dataq Instruments analog to serial converter to the computer. This allowed the data acquisition software to read the steering position from a Celesco Cable Extension Position Transducer over the serial port without a more costly analog data acquisition card. The external video port was connected to a TView Micro scan converter to change the VGA video to NTSC format. This allowed for the use of an inexpensive 6.8” LCD TV panel, mounted on top of the dashboard, to present various types of information to the driver of the car. Due to the short operating time of laptop batteries, a 150-Watt 12V AC inverter was installed in the vehicle to provide AC power to the laptop.

Appendix C Instrumented Vehicles Used in Trials
C-16
•
Figure C-16. Lead Vehicle Cockpit View
The lead vehicle had two custom made interfaces to communicate with the driver and vehicle signals. The first interface was connected to the laptop’s parallel port and presented signals to the driver. Whenever the laptop sent an instruction to the driver, this interface sounded an audible tone to signal the driver to examine either this interface or the video screen. To signal a lane bust maneuver1, there were two red LEDs that the laptop could illuminate. Upon hearing the tone and seeing one of these LEDs, the driver would begin the maneuver and press one of two acknowledgement buttons on the interface to signal its start. In this way, the computer could signal the driver and get a response to indicate the start of the maneuver.
This interface also housed a switch that the driver used to cutout the rear turn signals. This switch was required to prevent the subject car driver from seeing turn signals flashing, thus keying them into a lane-bust maneuver, while still warning other drivers that the car was going to change lanes. The status of this switch was also returned to the laptop so that information on the status of the back turn signals of this vehicle could be sent to the subject vehicle and logged. This box also tapped into the factory brake pedal switch to signal the computer when the brake was depressed at the start of a lead-vehicle deceleration event. Circuitry in this interface used signals from the laptop computer to illuminate either the back right or left turn signals or an auxiliary CHMSL, which was added to the vehicle for OED events.
1 Subsequent to the development of the lead vehicle hardware, a decision was made not to include the lane-bust maneuver in testing. This hardware functionality is described here for completeness.

Appendix C Instrumented Vehicles Used in Trials
C-17
A second interface was built for this vehicle to allow the driver to disable the vehicle brake lights. During a deceleration event, brake lights were disabled because cruise control was deactivated by tapping the brake pedal to start the deceleration event. The state of this switch was also recorded by the laptop computer and sent to the subject vehicle to be logged.
The only complex sensor in the lead vehicle was the DGPS MAX from CSI Wireless. This device was used to collect DGPS data on the lead vehicle position, which was output via a serial port to the laptop at 5 Hz. and then sent on to the subject vehicle by WLAN to be logged. Since the laptop’s only serial port was in use by the steering data channel, a GoldX serial to USB converter was used to connect the GPS serial port to the laptop’s USB port.
The lead vehicle also carried a spare tire for the subject vehicle because that vehicle's tire well was used to house the auxiliary air conditioner. The lead vehicle was also equipped with a fire extinguisher, first aid kit, and a cooler for refreshments for the test participants.
C.2.3 Follow Vehicle For the most part, the follow vehicle was very similar to the lead vehicle. The few differences were related to the role the car played in the platoon. The follow vehicle was not equipped with the GPS unit used by the other two vehicles, therefore, no serial to USB converter was required. Since the deceleration event was only used for the lead vehicle, this car did not require the external LCD monitor or the brake light cutout circuitry.
The other main differences in the instrumentation of the follow vehicle were in the primary interface box. Rather than controlling lights on the rear of the vehicle, a box controlled the front turn signals and an auxiliary light placed in the center of the front bumper was a counterpart to the lead vehicle’s auxiliary CHMSL. Similarly the turn-signal cutout switch deactivated only the front turn signals in this vehicle. This interface contained double the LEDs and more acknowledgement buttons than found in the lead vehicle interface. All messages from the subject vehicle were sent to the follow vehicle and then forwarded to the lead vehicle, if that was their intended destination. This feature allowed the follow vehicle driver to postpone maneuvers if overtaking traffic made it infeasible to execute them. Two of the four LED and switch combinations were used to instruct the driver to perform a lane-bust maneuver. The other two LEDs were used to indicate the lead car should act, given favorable traffic, the driver could press the third button and the request would be sent to the lead vehicle.
The follow vehicle also carried a toolbox and supplies for field repairs and an Agilent automatic external defibrillator, which all staff were certified to use. A rotating, yellow safety beacon was also placed on the rear of the car to warn other traffic to stay clear of the platoon.
C.3 Subject Vehicle Data Acquisition Software The subject vehicle was the command and control center for the platoon of test vehicles. Therefore, the data acquisition software package had to do more than simply log data. In an effort to make the software as easy to use as possible, a number of features, such as user interface, configuration driven automatic functions, and self-monitoring functions were programmed into the package. These features allowed the user to easily monitor the health of the system and control the flow of the experiment with only a few indicators and button clicks.
Initial screen is shown as Figure C-17. This screen required each field to be completed with the appropriate information before the software would start operations. The information was then used in naming data files and included as a part of the header information in all data files.

Appendix C Instrumented Vehicles Used in Trials
C-18
Figure C-17. Initial Screen (Subject Vehicle DAQ Software)
When an experimenter logs into the DAQ software, the Main Interface screen displays (Figure C-19). Located along the bottom are buttons to access the Header Information and Channel Selection screens. Accessing these screens, the experimenter can see the information, but is prevented from changing anything.

Appendix C Instrumented Vehicles Used in Trials
C-19
Figure C-18. Service Mode Main Panel Screen (Subject Vehicle DAQ Software)
Starting in the upper-left of the Main Interface Screen (Figure C-19), the two rectangular indicator lights can be seen. These are normally green but are changed to red by the system to indicate either a loss of network connectivity or an out-of-range condition with a data channel. Below these are four indicators, two of which represent the On/Off status of the in-vehicle PDT lights2 while the other two represent the Left and Right Driver Response Switches. Two indicators below the PDT box represent the third driver response switch and the horn button, both of which could be used for driver responses. The Manual/Automatic Mode toggle changes operating modes between the scenario file driven automatic execution and the manually set execution of tasks and events in the software. A toggle was provided to activate and de-activate the use of the Workload Question feature. The Set Previous Scenario button was used in case of a failed or interrupted task to reset the Automation’s position in the scenario file to the previous line so that the task could be easily repeated.
2 The in-vehicle PDT lights were not used during the DWM study.

Appendix C Instrumented Vehicles Used in Trials
C-20
Figure C-19. Main Interface Screen (Subject Vehicle DAQ Software)
Soft keys at the top center of the display are tied to the keyboard function keys and can be clicked with the mouse or activated via the keyboard. The soft keys are used by the experimenter to indicate various conditions during tasks or to flag problems with the tasks. Below these are dials used to set and indicate the Task Number, Replication, and OED condition. In Automatic Mode, these are set by the computer and triggered by the experimenter. In Manual Mode, the experimenter could do both. The Lane Change Request box has four indicators representing the four possible requested Lane Change directions and lights when a request was made and extinguished once the maneuver was executed. Similarly, the Lead/Follow Light Event box indicated which of three possible lights in either of the confederate vehicles were being activated. Lead Braking Event is the last OED indicator and lights when a lead vehicle deceleration event was requested and extinguished when the subject had responded. The Current Scenario Line Number box provided the experimenter with the current location in the scenario to track progress within a block of testing. The Comment Text Box provides a place for the experimenter to type in information about a task performance or about a particular problem that occurred during the task. These text comments were entered into a log file along with the internal variables the DAQ system generated during operations.
The Vocal Response Encoding box (upper right) is a pull-down menu that allows the experimenter to enter a response given by the driver from among a list of predefined responses. In practice, however, the Vocal Response Encoding feature was used to expand the number of tasks that could be processed by the DAQ system. This capability was needed during test track testing when the number of tasks studied was increased beyond the number initially planned during equipment development. Vocal responses by the test participant were not used in this study.
The Workload Question box indicators show which questions the system had been programmed to ask for the current task as well as the response to the question.

Appendix C Instrumented Vehicles Used in Trials
C-21
The Start/Stop toggle activated the recording of engineering and video data, allowing the system to be paused without shutting down the system. The Exit button stopped the recording and shut down the DAQ software.
On the initial screen (Figure C-17) the Service Mode button, brings up a password dialog box followed by a number of configuration tools for setting up the software functions.
The first of these options is Header Information shown in the Service Mode Main Panel Figure C-20. Here the labels that are assigned to all the codes generated by the software can be set. This allows for entering names for task numbers, OED conditions, completion code meanings, and labels for a number of data channels such as PDT lights and vehicle signals. This screen also allows the administrator to add, remove, or change the formulas and constants used to calculate real time data channels such as steering position and rate. The scenario table can be edited directly from this screen or edited off-line using a basic text editor. This table contains the information the DAQ software needs to run an experiment by pre-selecting task numbers, OED conditions and , replication values as well as timing and duration variables. Using configuration files to set these variable reduces experimenter error because all that must be done is to trigger the start of events and OEDs. The same holds true for the workload question table, a configuration file that will cause the system to prompt the Safety Observer with a specific question number after a task and then wait for the driver’s response to be input.
Figure C-20. Header Information Screen (Subject Vehicle DAQ Software)
The Signal Fault Interface, shown in Figure C-21, provides the experimenter with a way to monitor the system state and data channels. The Numeric Inputs section provides a scrolling list of all serial and analog data channels and their current values. The buttons next to each channel are indicators, which will turn red if the values leave a pre-defined range, and therefore, are
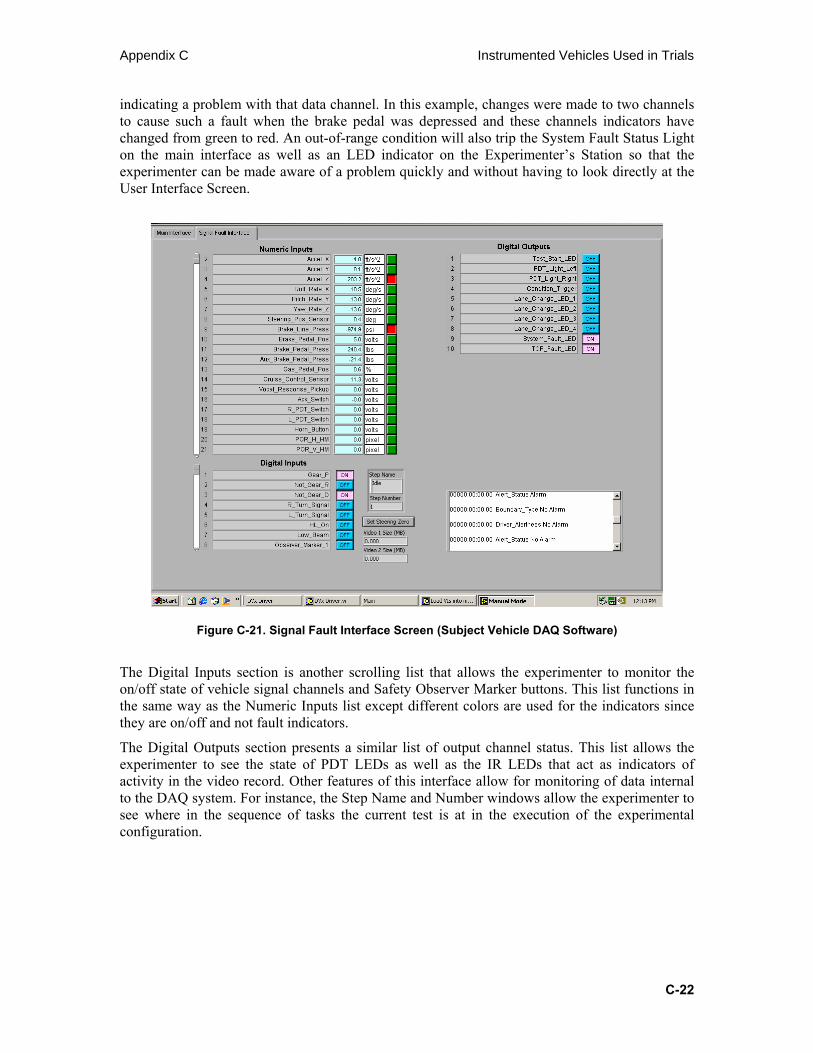
Appendix C Instrumented Vehicles Used in Trials
C-22
indicating a problem with that data channel. In this example, changes were made to two channels to cause such a fault when the brake pedal was depressed and these channels indicators have changed from green to red. An out-of-range condition will also trip the System Fault Status Light on the main interface as well as an LED indicator on the Experimenter’s Station so that the experimenter can be made aware of a problem quickly and without having to look directly at the User Interface Screen.
Figure C-21. Signal Fault Interface Screen (Subject Vehicle DAQ Software)
The Digital Inputs section is another scrolling list that allows the experimenter to monitor the on/off state of vehicle signal channels and Safety Observer Marker buttons. This list functions in the same way as the Numeric Inputs list except different colors are used for the indicators since they are on/off and not fault indicators.
The Digital Outputs section presents a similar list of output channel status. This list allows the experimenter to see the state of PDT LEDs as well as the IR LEDs that act as indicators of activity in the video record. Other features of this interface allow for monitoring of data internal to the DAQ system. For instance, the Step Name and Number windows allow the experimenter to see where in the sequence of tasks the current test is at in the execution of the experimental configuration.

Appendix C Instrumented Vehicles Used in Trials
C-23
The Set Steering Zero button allows the calculated Steering Position channel to be zeroed when the steering wheel is in the center position. With this real-time channel, a 0 to 360 degree steering position is calculated from the lock-to-lock value obtained from the position sensor. Two windows are provided to monitor the size of the two video files being encoded. With these windows, the size of video can be monitored to ensure that the videos are both being encoded correctly and that after extended testing, the files are not getting too large to be handled by the equipment.
The last feature is the scrolling text window. This window prints the text of system steps, warnings, data channel errors, and input commands on the screen as they are written to the event log file. This information can help the experimenter determine that the system is functioning correctly or to diagnose the exact nature of a data channel problem.
The Service Mode Main Panel (Figure C-18) allows access to the account manager, which allows user permissions to be set, much like a standard Windows user. In this way, experimenters can be granted privileges to change some settings while protecting others, perhaps turning off a problem channel but not changing header information or real time channel formulas.
The last screen in the Service Mode is the Channel Selection screen (Figure C-22). This screen lists all the DAQ’s data channels as well as their descriptions. If a particular channel has failed or is causing problems with the system, it can be turned off without affecting system operation or other data channels. This feature also requires no hardware changes and allows for continuation of data collection activities even with hardware failures.
Figure C-22. Channel Selection Screen (Subject Vehicle DAQ Software)

D-1
D Appendix D. Laboratory Hardware and Software
D.1 Laboratory Hardware D.1.1 Laboratory Requirement Overview The Driver Workload Laboratory was designed to meet a number of testing requirements with direct and indirect effects on the actual testing hardware. In general, the laboratory had to accommodate multiple types of testing for up to four test participants comfortably at one time. Participants would often be at different points in the testing/training schedule so these activities had to be separate and not interfere with other participant’s activities. To this end, the laboratory was constructed with two sections—one section with room for meals, breaks, and individual differences testing (labeled Training Room in Figure D-1) and the other section for vehicle oriented testing.
The vehicle oriented testing required four cubicles (labeled Lab 1 through 4 in Figure D-1), which were separated by sound suppressing materials. Each cubicle contained a driving buck, which was constructed to be similar to the instrumented car to aid in transfer of learning when participants transitioned to the vehicles for testing. In addition to the driving buck, the cubes contained an experimenter station where the experimenter would control the training and testing activities. The laboratory also needed to have data and video recording and archiving capability to allow for the transfer of the collected data to the main office.
Figure D-1. Overall CAMP DWM Laboratory Layout
CAMP / DWM
3-0
3-0
Lab 1Lab 2Lab 3
Lab 4 Training Room
Store Room
25.500
3-0
24.0
00
Enter
Maintance Room
2-6
Bathroom
4.000
2.000SCALE
Lab Facility Arrangement

Appendix D Laboratory Hardware and Software
D-2
D.1.2 Overall Laboratory Equipment The laboratory contained eleven computers, which needed to be connected to each other through a local wired network and to the main office via a wireless network. A network hub and two IEEE 802.11b WLAN radios allowed the data archivist to transfer data from testing computers to the archiving machine in the laboratory and to transfer the data to other machines in the main office for archiving. The archiving machine in the laboratory was a P4 desktop computer with a high-capacity hard-disk drive and a Pioneer DVD burner.
The laboratory also had audio-video recording capability in all the testing cubicles. Audio and video feeds from each testing cubicle were encoded on one computer with a specialized encoding card. An auxiliary feed from a Horita Time Code Generator overlaid an SMTP time code on one of the videos as well. To encode the four audio and video streams, a P4 desktop computer with a high-capacity hard disk drive was equipped with a GeoVision GV-800-4 digital video recording DVR card. The station is shown in Figure D-2.
•
Figure D-2. Laboratory Audio Visual Recording Station
The DVR card had input for four audio and video streams, which were encoded at 120 frames/sec, NTSC format with wavelet and MPEG-4 compression codes. This produced four sets of DVD format video with audio at the NTSC video standard 30 fps. This large quantity of video was then transferred each night to the archiving equipment to be burned onto DVD media the next day.

Appendix D Laboratory Hardware and Software
D-3
D.1.3 Testing Cube Equipment D.1.3.1 Test Buck The main components of the laboratory were the individual testing cubicles. These cubicles were separated by sound deadening curtains and contained a test buck, an experimenter’s station, and audio-video equipment. The overall layout of the cubicle had the participant seated in the car-like test buck in front of a large projection screen with the experimenter seated at a desk behind the participant, as shown in the diagrammatic view from the right-hand side of a cubicle in Figure D-3.
Figure D-3. Right-Side View of Test Buck and Experimenter Station
The test buck, labeled Participant Seating Station, was designed to mimic the relative locations between seating, vehicle controls, and the test devices that a participant would encounter in the test vehicles, as shown in Figure D-4. The test buck was constructed of plywood and provided a deck for an automotive 6-way power adjustable seat and the Act Labs Force-RS game controller wheel and pedals. The enclosure at the front of the test buck provided a mounting point for the Act Labs Force-RS game controller steering wheel and a deck for placement of visual stimuli presentation equipment as well as a base for the attachment of a sun-visor mounting arm.
Projector
Laptop MonitorMP3
Keyboard MouseSwt. Box
Mixer
Desktop
CustomBox
LCD MonitorSteering Wheel
Power SeatVideo Switch
Participant Seating Station
Video Cables
Laser
LAN Cables
Instrumentation Tower
DC SupplyPedalPackageOCCLUSION
GOGGLES
ControlBox
GOGGLES
Cell Phone
Experimenter Cart
Driving Buck and Seating Dimension CAMP / DWM
T-ViewAC Pwr. Distribution
Peripheral Stimulus
SubjectResponse Swt.
ACDistribution
LCDRelay
Screen
Face Cam
CD / Visor

Appendix D Laboratory Hardware and Software
D-4
Figure D-4. Diagram of Participant Eye Point Positioning
To the right of the participant’s seat is a console dimensioned to mimic the center console of the test vehicle. This console provides an armrest, cup holder, and mounting point for the center-stack tower, which holds the task devices. This arrangement allowed a participant to be trained and tested on a number of tasks in a physical layout very similar to the one in the test vehicles.
All of the devices and materials that a participant would be asked to use in the vehicles were present in nearly the same relative locations in the test buck. Coins and a Samsung SPH-A460 cellular phone with Sprint PCS service were placed in the cup holder of the center console. Paper maps, printed addresses, and the reading materials were placed on the center console by the experimenter when required. The center stack, mounted at the front of the center console, was constructed as a tower with three 2 DIN sized bays to allow for mounting of typical automotive devices as shown in Figure D-5. For this study, the tower contained a Legacy AM/FM cassette radio, a Panasonic AM/FM radio with CD player, and a typical three rotary-knob style HVAC controller. The center stack also contained the DVD-ROM unit for the Visteon Navigation unit, the display of which was mounted on a flexible gooseneck at the right side of the center stack. A mounting frame was constructed over the steering wheel to hold a replica of a sun visor on which was mounted a CD holder containing several different colored CDs.
Although the radios in the center stack were powered, the audio output was not connected. DC power was provided to these units by a 12V, 3A DC power supply. The automotive seat and the navigation unit were powered by a 12V, 25A Tripplite DC power supply.
3.00
0
23.0
00
44.0
0 048.0
00
22.000
27.000
32.000
12.000
22w x 23 1/2d
CL
SEAT Con
sole
CenterStack
2 x 4
Eye point
seat rail mounting (tbd)
Power 6/way Seat
3/4" plywood2 x 4 / 3 req'd
11.0
00
Steering wheel shelf 3 Bin Din rack
Materials3ea. 2 x 4 x 81 ea. 3/4" Sheet Plywood
Miss. fasteners
Finish
Sand all rough edgesPaint Flat Black
2 ea. Pedistal Mounts
9.000
28.0
00
14.0
00
26.0
00
PedalPackage
Top Panel
14.700
15.0
00
37.0
00
Center-ConsoleArmrest
24.0
00 SidePanel
30.0
00
A
C
D
Screen
Carpet Floor
Eye-Point ViewsSternbergDisplay
B
A Top of Din RackB Center of DisplayC Center of St. WheelD Bottom of Rack
66.000
23.000
25.495
41.23120.591
32.016
2 x 4 Brace
Cup Holder(3.625 Dia)
42.0
00
Floor
PLAN VIEW SIDE VIEW
Single Testing Seating BuckCAMP / DWM
6.0" 6.0"
12.000

Appendix D Laboratory Hardware and Software
D-5
Figure D-5. Lab Test Buck Center Console and Center Stack
D.1.3.2 Experimenter’s Station To the rear of the test buck was the Experimenter’s Station, shown in Figure D-6. This location gave the experimenter access to the participant and devices as needed and minimized the amount that the experimenter’s activities might interfere with the participant’s task performances. The base of the station is a standard, wheeled-computer cart to allow for changing its location in the event that a participant adjusts the power seat to one of its extremes.
Figure D-6. Experimenter’s Station and Driving Buck

Appendix D Laboratory Hardware and Software
D-6
The Experimenter’s Station contained the electronics and computer hardware needed to execute the testing; a detailed diagram of this hardware is shown in Figure D-7. The first of these components was a basic P3 desktop computer. This computer utilized a Measurement Computing PCI-CTR05 counter timer board with 8 digital inputs and 8 digital outputs connected to a custom designed and built interface. These computers were also equipped with an Appian Hurricane dual output high-resolution video card. One of these outputs was connected to a 15-inch Cornea LCD monitor for the experimenter and the other to a Focus Enhancements TView Micro VGA–NTSC scan converter. The primary purpose of this computer was to execute the various surrogate software applications developed by CAMP DWM for participant testing. The software used in this study included programs for an Occlusion Surrogate, a Sternberg Memory Task, Static Task Measurement, and a Peripheral Detection Task. The software is detailed later in this appendix.
Figure D-7. Diagrammatic Representation of Test Cube Data Acquisition System
A second computer was also located at the Experimenter’s Station. This computer was a Dell Inspirion 8100 laptop with UXGA display, NVIDIA graphics card, a Pentium 4, 1.2 Ghz processor, and 512 MB of memory. This allowed for high-resolution display to be available both on the laptop monitor and on the external video output, which was connected to an LCD projector. The LCD projector was an Eiki LC-XM4 1100 Lumen True XGA LCD projector suspended from the ceiling on an adjustable mount and projecting to a standard hanging screen. The laptop also contained a Measurement Computing DIO-48, digital input/output PCMCIA card that connected to the same custom designed and built interface as the desktop machine.
The primary use of this machine was to execute System Technology’s STISIM Drive, a low-cost custom-configurable driving simulator with flexible data input and output capability. The LCD projector displayed the simulator’s driving scene on the screen hanging in front of the test buck and the driver inputs were obtained through the Act Labs Force-RS wheel and pedal set. The resultant participant forward scene while driving the simulator is shown in Figure D-8.
P u sh B u t to n P u s h B u t to n
41 2 3 1 2 P rojectorLCD
Monitor
KEYBOARD
MOUSE
ADAPT. #2
ADAPT. #3
ADAPT. #4
ADAPT. #5
AD
APT
. #1
LASER
OCCLUSION
GOGGLES
#7#2#3
#4
#1
#19
#20
#5
#6
#10
#9
1 2
#12#11
LaserDriver
#8
#18
#28
MAGICBOXDESKTOP
STISIMSt. WHEEL
&PEDALS
TviewAUXMon.
SWT. SWT.
#22
#27
2 Cond.
ControlBox
GogglesDriverCircuit
GOGGLES
#24
#17#16
#14
#12 #13 #15
#21
C TR 05
P AR R .POR T
V GA / 1
V GA / 2
U SB
V GA
D IO48
K VM
F
F
F
F
F F
F
#23
#26
m
F
#25
F
F
D B -2 5 D B -2 5 D B -2 5 D B -2 5
D B -2 5
D B -2 5
F
F
FFFF
P S/2
P S/2
FACE CAMERA
A B
To System Desktop
( Main V ideo Out)
#29TV
Driver CKT.
m
m
m
m
F
mF
F
F
Fm
m m m m
m
m
m
m
mm
F
m
F
m
F
L .E. D .I . R .
1/8" Phono
1/8" Phono
1/8" Phono
I.R. DRIVER BOX
E X TE N S I ON COR D R E LA Y C I RC U I T
Lab System Flow DiagramCAMP /DWM

Appendix D Laboratory Hardware and Software
D-7
Figure D-8. STISIM Forward Scene
The Experimenter’s Station also contained a custom-built data acquisition interface box, shown in Figure D-6, developed by CAMP DWM for two primary functions. The first of these functions allowed for transmission of data between the two computers mentioned above via their parallel ports and the digital I/O cards. The second function was to use the same inputs and outputs to control various pieces of hardware, thus allowing for greater reuse of software code and ease of use between different surrogate tests. All an experimenter was required to do to run a particular surrogate test was to set two switches and start the required software. This was accomplished with a number of device drivers that used the same signals to perform different tasks. One of these tasks was to control the opening and closing of the Translucent Technologies Plato Goggles for the Occlusion surrogate. The same signal output from the desktop computer also triggered the on/off timing of an NVG Inc. EPM660-5 laser module that showed a red dot in the periphery of the driving scene for the peripheral detection task. Another set of drivers used the signal from the desktop computer to activate a 5.7-inch color LCD TV that displayed images for the Sternberg Memory Task surrogate. The data acquisition box also made the participant’s responses via finger or steering wheel buttons available to both computers.
D.1.3.3 Audio-Video System Each testing cubicle also contained audio and video equipment for recording the participant’s activities during testing and training. A Pro Video CVC-120R black and white CCD bullet camera with 12MM narrow field of view lens that was used to collect video of the participant’s face. The video from this camera was sent to the video-encoding computer for recording. This camera view was also available to the experimenter on the small LCD used for surrogate presentations through a video switch, enabling the proper aiming of the camera for each participant.

Appendix D Laboratory Hardware and Software
D-8
The audio system for a testing cubicle was set up with a number of objectives. Providing audio to the recording computer to accompany video was the first objective. Other concerns were to allow the participant and experimenter to communicate without interference from other cubicles. A part of this participant/experimenter communication was the playing of MP3 task requests, which were also incorporated into the audio. One of the tasks that participants were asked to perform was to use a cellular phone with a hands-free headset, so the phone audio and microphone had to be part of the audio system. To meet all these demands, a Behringer Eurorack MX-602A six channel, two bus, audio mixing console was employed as the base of the audio system.
Experimenter and participant alike wore headphones with microphones on a boom arm. The experimenter’s microphone was fed into the mixing console and combined with all other inputs for recording. The participant’s microphone was handled in the same way with one exception; the audio signal also was fed directly into the cellular phone’s microphone input. The last audio input to the system was the task requests; these were in MP3 format and were presented to the participant using a Nomad IIc digital MP3 player. In Figure D-6, the headphones and MP3 player can be seen on the Experimenter’s Station and the Mixing Console can be seen on the shelf below them.
D.1.4 Individual Differences Equipment The laboratory provided for two distinct types of individual differences testing utilizing both the testing cubes and a separate room. Due to the audio system, the testing cubicles were used for the Baddely tests where the Experimenter would read numbers to a participant for them to repeat back. Other pencil and paper type tests were conducted at a large table in the separate training room, thus eliminating distraction due to other individuals.
The training room also housed two P3 desktop computers with 15-inch high-resolution LCD monitors for the presentation of computer-based testing. These computers with their monitors and speakers were used to perform the Patsys and UFOV visual-based tests.
D.1.5 Test Track Laboratory Setup The set up at the test track was different than in the laboratory due to the layout of the available space. One area had to function as all portions of the laboratory as originally constructed and also had to provide room for test vehicle storage and a workshop for maintenance and repair of all equipment. The general layout of the test track laboratory is shown in Figure D-9.

Appendix D Laboratory Hardware and Software
D-9
Figure D-9. Overall Test Track Facility Layout
A portion of the laboratory was packed up and moved to a facility at the test track. This included two testing cubicles, individual differences equipment, and data archiving computers. While no surrogates were needed at the test track, the entire cubicles were taken as they were designed to be semi-portable as two modules—Test Buck and Experimenter Station.
The functions of the equipment at the test track facility mimicked the functions in the laboratory with the exception of a few pieces of the overall system. The pieces that were not used at the test track include the surrogate testing hardware, the computer network, and the audio-video recording capability. A picture of the testing cubicles as implemented at the test track is shown in Figure D-10.
Bathroom
Ope
n S
hel v
ing
Garage Doors
TEST STA. #1
Uni-Sex
Subject Car
Subject CarWater
#1
#3
Subject Car#2
115 VAC 115 VAC
115 VAC
115 VAC
115 VAC
TABLE
Floor Lamp
Tools
AC
AC
Floor Lamp
AC
AC
AC
Grate
TEST STA. #2
Floor Lamp
Individual Diff.Testing
Training RoomDebrief
MPG STUDY FACILITY LAYOUT CAMP / DWM
Engineering

Appendix D Laboratory Hardware and Software
D-10
Figure D-10. Test Tracking Testing Cube Setup
D.2 Laboratory Software A number of software packages were developed by CAMP personnel to utilize the laboratory hardware to execute various surrogate tests. This software is a research tool that was designed to work in conjunction with the custom-configured computers and hardware present in the test bucks. For instance, the surrogate software runs on a custom computer equipped with specific data acquisition and video cards. A brief description of the functionality and operation of each of the software tools as well as the driving simulator software follows.
D.2.1 Static Time Assessment This program was used to measure the completion times for a pre-defined list of tasks performed by the test participant in a static setting. Static means that the participant performed only the task in question and did not perform any other task concurrently. The program collects data in a manner that is similar to that described in SAE J-2364. The benefit of this program is that data are collected and assembled into electronic data files and thus avoids the potential for errors in transcribing data. The main interface for this program is shown in Figure D-11.

Appendix D Laboratory Hardware and Software
D-11
Figure D-11. Static Assessment Program Interface
For this program, an initial screen would prompt the user to select the appropriate configuration file. The program would then create a data file based on a name in the configuration file. In particular the program created a data file using the participant number, which was used as part of the configuration file name as well.
Once the configuration file was selected, the main interface would appear. This interface listed the tasks that were to be assessed in the order they were to be executed, and included a pointer to indicate the current task. This was also the screen where the experimenter was to set the replication number. This feature allowed for the use of only one configuration file for a participant as well as for repeating a task that was incorrectly or unsuccessfully performed.
At the start of a task performance, the experimenter would click on the Start Task button, and click the End Task button upon task completion. To aid in elimination of incorrect button clicks, buttons that were not appropriate at any given time were unavailable. For instance the End Task button could not be clicked until the Start Task button had been clicked. After the End Task button had been clicked, the experimenter could not advance until the Save Data button had been clicked. At any time between clicking the Start Task and Save Data button, the Mark “Bad Task” button could be clicked. Since data was written to the data file as a single line per task performance, this allowed the experimenter to mark the task as being unsuitable for later analysis prior to the performance being included in the data set.
When the Save Data button was clicked, a line of data consisting of Run Date, Participant ID, Data File Type, Sequence Number, Task Number, Task Name, Replication Number, Elapsed Time, and Task Status for the particular performance of the task was recorded.

Appendix D Laboratory Hardware and Software
D-12
The basic interface and function of this program was then augmented with new functionality and features to create the other surrogate assessment programs. Where other programs have the same functionality they will not be detailed again. In the following sections the unique features of each program will be explained, but where the basic operation is the same as in Static Assessment this section will be referenced.
D.2.2 Occlusion Assessment The Occlusion Assessment program worked in conjunction with a pair of Translucent Technologies Plato Goggles and contains more flexibility than the Static Assessment program. The first screen for this program is shown in Figure D-12.
•
Figure D-12. Occlusion Assessment Program Initial Screen
This initial screen allows the experimenter to select the shutter open/close timing in a number of discrete steps from 1 to 5 sec. For the CAMP DWM study, all Occlusion testing followed the proposed ISO standard of 1.5 sec open and 2.0 sec closed, thus this option was not utilized. The experimenter was first required to select the configuration file for the particular session being conducted, but now could also enter a text comment that would be attached to all data rows recorded during the session. In addition, before beginning the testing, the experimenter could use the Open Lenses and Close Lenses buttons to not only verify correct system operation, but also to introduce the participant to the phenomena of the goggles and allow them to practice some tasks with the shutters opening and closing without data being recorded. Once ready to begin testing, the experimenter would click the Continue button and the Main Interface screen, shown in Figure D-13, would appear.

Appendix D Laboratory Hardware and Software
D-13
•
Figure D-13. Occlusion Assessment Main Interface Screen
The Main Interface uses the same display of tasks and task order as for Static Assessment but has different timing button functions and a comment function.
Prior to the start of a task, the experimenter can control the opening and closing of the goggles both for demonstration and system testing purposes. Once ready to being a particular task, the experimenter would click the Start Task button. This would lock out the manual control of the shutters, close the occlusion shutters, and enable the timing button functions. This display also provides the experimenter with the status of the shutters without the experimenter needing to see the goggles. At the start of the task performance, the experimenter would click the Start Timer button. For this program the Start Timer and Stop Timer behave as the Start Task and End Task buttons in Static Assessment. Here the Mark “Bad Task” and Save Data buttons behave as in Static Assessment. For this assessment, the Save Data button generates a line of data including Run Date, Participant ID, Data Type, Open and Closed Interval Durations, Sequence Number, Task ID Number and Name, Replication Number, Open Count, Closed Count, TSOT, TSCT, TTT, Experimenter’s Note, Experimenter’s Comment, and Task Status. An additional feature of this program is the Make Comment button, which unlike the note button on the initial screen, would attach a comment only to the current task performance. In this program, the replication number is set on the initial screen and is not accessible for change beyond that point of execution.
D.2.3 PDT-Alone Assessment The PDT-Alone Assessment program and the Peripheral Detection Task With STISIM Assessment utilize the same program and are distinguished by the selection of the appropriate simulation option on the initial interface shown in the upper-left corner of Figure D-14.

Appendix D Laboratory Hardware and Software
D-14
In either case, the program triggers the illumination of a red laser to shine a small bright light onto the screen in front of the participant. The light will be activated for a duration of 1 sec and aimed to appear in front of and to the left of the participant’s seated position. This light could appear multiple times during the execution of a task depending on task length. The inter-stimulus interval was randomly drawn from a Uniform Distribution from 2 to 10 sec.
The program then records whether or not the participant detects the event by monitoring the status of a response switch worn on the participant’s hand or mounted on the simulator’s steering wheel. Responses are recorded as a positive detection if they occur between 200 msec and 2000 msec after stimulus onset. This initial period in which responses are ignored is a lockout to prevent anticipation responses. The response window is cut off at 2 sec after stimulus onset to ensure that the response is truly a detection of the light event.
•
Figure D-14. PDT-Alone Assessment Initial Interface
To begin this assessment, the experimenter would select No STISIM to indicate in the data file that this test was performed without the task of driving the simulator. Next the light location was selected to indicate whether the light was aimed directly in front of the participant or to the right or left of the forward scene. The experimenter then selected the number of lights that were used from a pull-down menu. Lastly, the experimenter selected the appropriate configuration file, as previously described in the Static Assessment. All PDT Assessments in the CAMP DWM study utilized only one light, which was directed to the participant’s periphery in a location corresponding to the left-hand most lane line of the roadway in the STISIM driving scene, approximately 5 5/8 inches ahead of the A-pillar of the simulated vehicle.
The PDT Assessment main interface, as it appears during execution of a task, is shown in Figure D-15. The main interface shows that the task currently being executed is highlighted during execution and the only available buttons are the End Task and Mark “Bad Task” buttons. While the buttons function in the same manner as in previous assessments, here the Mark “Bad

Appendix D Laboratory Hardware and Software
D-15
Task” button is only available after clicking the Start Task button and before clicking the Save Data button. The main interface also shows that the controls over the replication number are not available once testing has begun.
Figure D-15. PDT - Alone Assessment Main Interface
The small red dot below the Subject ID box on the main interface is an indicator that the PDT stimulus light is illuminated at a particular instant. An indicator also appears on-screen when the participant depresses the response switch. These features are included to allow an experimenter to monitor the performance of the participant without watching the participant or the forward scene and thus potentially alerting the participant to the light events.
The data created by this program includes Run Date, Participant ID, Data Type, Stimulus on Time, Inter-Stimulus Interval, Response Time Limit, Response Lockout Duration, Sequence Number, Task Number, Task Name, Replication Number, Event Number, Response Time, Response Outcome, Simulation Mode, LED Location, and Task Status.
D.2.4 PDT with STISIM Assessment The PDT with STISIM Assessment utilizes the software described for the PDT-Alone Assessment with two differences. The first difference being that the Simulation Option radio button is set to STISIM, as is the Simulation Mode in the data file. The second difference is that outside of the PDT software, the driving simulator is running and the participant is driving the simulated vehicle while performing secondary tasks and responding to the PDT light.
D.2.5 Sternberg-Spatial/Verbal Assessment The Sternberg memory task is a paradigm for investigating how information is retrieved from working memory. This method was used by Wickens, et al. (1986) as an indicator of pilot

Appendix D Laboratory Hardware and Software
D-16
workload and is implemented in the DWM study as a measure of driver workload. In this study, road signs were used as the stimuli. Two types of road signs, one for verbal and one for spatial working memory, were used. Eight route-number signs were used as verbal stimuli and eight route-junction signs were used as spatial stimuli. Each sign type loads a different portion of working memory. The signs are shown in Figure D-16.
Sternberg Assessment Verbal Working Memory Stimuli Set
Sternberg Assessment Spatial Working Memory Stimuli Set
Figure D-16. Sternberg Assessment Stimuli
The participant is initially asked to commit a set of verbal or spatial road signs to memory. This is known as the memory set. After storing the memory set in working memory, the participant is prompted to begin the in-vehicle task. During execution of the in-vehicle task, probe stimuli (e.g., a single route number sign or a single roadway geometry sign) are presented. The participant must then determine if the probe sign was a part of the initial memory set and respond accordingly by pressing one of two buttons to indicate Yes or No.

Appendix D Laboratory Hardware and Software
D-17
This assessment tests the load on a participant’s verbal and spatial working memory by presenting either a verbal or spatial memory set for a task and then presenting the same type of probes. Test participants were given as much time as needed to commit the memory set to memory, then once the task starts, probes of the same type are presented for 1 sec durations according to a uniform distribution from 2 to 10 sec. Typically, half the probes are contained in the memory set (requiring a Yes response) and half are not (requiring a No response). Participants respond Yes or No to each probe via two finger switches or steering wheel buttons.
The initial Sternberg screen is shown in Figure D-17. The experimenter starts by selecting the stimuli type (either verbal or spatial) that will be presented first. Each set thereafter will alternate between the verbal and spatial sets. Next, the experimenter selects the size of the memory set (i.e., the number of signs in the set to vary the difficulty of the memory task). In the DWM study, a set size of three was used exclusively. As in the other assessment programs, the experimenter would then select the configuration file, insert any note to apply to the entire file, adjust the replication number, and test the participant response switches.
•
Figure D-17. Sternberg Assessment Initial Interface
After clicking the continue button on the initial interface, the practice screen, shown in Figure D-18, would appear. The starting memory set is displayed to the experimenter and can be changed by clicking the Select Memory Set button, which will randomly assemble a new set each time it is clicked. When the Show Memory Set button is clicked, it is also displayed to the participant on the secondary monitor. Once the participant indicates that they have memorized the set, it is hidden with the Hide Memory Set button. Next, Select Probe List is clicked. This displays a probe on the experimenter’s screen and enables the Show Probe List and Hide Probe List buttons, which allow the experimenter to introduce a participant to the probes. In addition, this screen displays the correct response and the actual response as well as a button to change the type of stimuli. After the participant is acquainted with the assessment, the Continue button is clicked.

Appendix D Laboratory Hardware and Software
D-18
Figure D-18. Sternberg Assessment Practice Screen
After familiarizing the participant with the assessment, the main interface, shown in Figure D-19, is displayed. This interface uses the same display and function as the previous assessments and is most similar to PDT in form and function. The difference here is that clicking the Start Task button causes the memory set to be displayed on the participant’s monitor. The Start Timer button hides the memory set and causes the probes to be displayed on the participant’s monitor with the same characteristics as the PDT light. Now, however, the participant has a choice of responding with the Same button if the probe was in the memory set or the Different button if it was not, rather than simply responding to acknowledge seeing the probe as in the PDT Assessment. As with other programs, the probe is displayed on the experimenter’s screen, as is the status of the participant response switches. All other parts of the interface function as in the previously discussed assessments.
The save data will cause a unique set of variables to be written to a tab delimited ASCII text data file. These variables include Run Date, Participant, Data Type, Memory Set Size, Stimulus Type, Stimulus Duration, Inter-stimulus Interval, Response Limit, Lockout Duration, Sequence Number, Task ID Number, Task Name, Replication Number, Event Number, Expected Response, Actual Response, Outcome, Experimenter Note, Comment, and Task Status.

Appendix D Laboratory Hardware and Software
D-19
Figure D-19. Sternberg Assessment Main Interface
D.2.6 STISIM Drive STISIM Drive is a relatively low-cost, high-fidelity driving simulator, which is fully user configurable and capable of running on Pentium-class personal computers. This interactive driving simulator provides visual, auditory, and tactile feedback to the driver while providing data collection and input/output functions. STISIM Drive was implemented for the DWM study on a laptop computer with a custom scenario and improved dynamics to provide a stable environment for studying driver performance and distraction.
Via the menu options that are available on the main STISIM Drive interface, shown in Figure D-20, a custom scenario was developed to provide for steady-state vehicle following and varied performance related metrics to be recorded. The scenario is a 60-mile long section of 4-lane highway with 12-ft lanes and a posted 55 mph speed limit. The scenario contains a total of 28 curves, each separated by 2 miles and possessing a radius of 0.0005 1/ft. Half of the curves are to the right and half to the left. In order to more realistically represent real world driving, the simulation randomly inserts traffic in the opposing lanes approximately every 2 miles. Realism was also improved by adding a crown to the roadway with the center of the highway being 40 percent higher than the edges. In order to actively engage the driver in vehicle control, a yaw instability factor was added so that the car would drift to the left or right, after a period of time if the driver did not engage in driving. With this instability factor, a vehicle traveling at 55 mph would have a time to line crossing of approximately 5 sec. The interface used to edit the vehicle dynamics and other simulation parameters are shown in Figure D-21.

Appendix D Laboratory Hardware and Software
D-20
Figure D-20. STISIM Main Interface
Figure D-21. STISIM Vehicle Dynamics Interface
Calpot32 is a data acquisition configuration utility that comes with STISIM and its interface is shown in Figure D-22. In the upper-left of this interface, the type of controller can be selected. The DWM study utilized a standard PC gaming-force feedback wheel and pedal set that was

Appendix D Laboratory Hardware and Software
D-21
recognized by the utility as a joystick. In this application, the particular game controller has a number of buttons that are recognized as inputs on Digital Inputs on Port A and Digital Inputs on Port B, output to the game controller, for force feedback, can be programmed on Digital Outputs on Port C. For the DWM study, only four of these inputs were used. Two buttons on the left-hand spoke of the game controller’s wheel were used as was their right-hand spoke counterparts. In the lower-left corner of the interface are the indicators for the digital I/O that can be configured on the digital data acquisition PCMCIA card. In this application, Port A was used for the 8 bit Task ID transmitted by the surrogates program via the surrogates computer’s parallel port. The lower 2 bits of input on Port CL were used by the data acquisition system to transmit the external participant switch statuses. The upper 2 bits on this input received Task and Stimulus Status from the surrogates programs via the data acquisition card in the surrogates computer. The option of digital outputs from the simulator was not used in this application. The right-hand side of the interface controls the analog outputs that the simulator can generate with an analog data acquisition card, these were not used with the DWM configuration.
Once the dynamics model has been suitably modified for the study, the game controller and data acquisition cards configured, and a proper scenario developed, the simulator was ready to be run. On the main interface screen, Figure D-20, a scenario file is selected, as is a data output file. The simulation is started by clicking the run button on the top of the interface (the button portraying two cars). It should be noted here that prior to starting the STISIM software, any external monitor or projector should be configured and operating. In order to run in real time, STISIM must take control of the computer graphics and any changes to graphics properties or video outputs on the computer will cause the simulator to lock up the computer and force a re-boot.
After the initialization of the graphics and construction/loading of the scenario, the simulator will display a message instructing the participant to await further instructions.
Figure D-22. STISIM – Calpot Data Acquisition Configuration Utility When the experimenter and participant are ready to begin, the inner-most button on the right spoke of the game controller was programmed as a start button. When the participant depressed this button, the forward road scene will be displayed and the participant will begin to drive the

Appendix D Laboratory Hardware and Software
D-22
simulator. Once the run is complete, the simulation can be exited by depressing the Alt and F1 keys.
In the DWM scenario, after a short period the participant will catch up to a Lead Car. This is a red sedan traveling at a steady 55 mph, shown in Figure D-23. The scenario developed for the DWM study was intentionally sparse to allow test participants to focus on driving, the secondary task, and the surrogate assessment test. However, traffic signs, trees, and opposing traffic periodically appear in the forward scene.
STISIM Drive collects data at a rate of 10 Hz and includes a number of measures related to ownship speed, lane position, and range to other vehicles. Data is also recorded on the position, both lateral and longitudinal, of other vehicles in the current scene. There are also two data channels recorded unrelated to vehicle position; these include the status of steering wheel switches and data input to the simulator from the surrogates testing machine. These data files also contain a copy of the scenario that was being executed and a summary of traffic incidents such as speeding, lane excursions, collisions, and accidents. The files are space delimited ASCII text and, due to the multiple types of data, further explanation of their format is reserved for coverage in the database documentation.
Figure D-23. STISIM Forward Road Scene

Appendix D Laboratory Hardware and Software
D-23
D.2.7 STISIM Emulator The Testing Station was designed to share information between the STISIM laptop and the surrogates desktop computer such as switch status and task numbers. For this reason, if a surrogate is conducted without running the driving simulator, an emulator, shown in Figure D-24, is needed to fill in and perform the data input/output functions of the simulator. This emulator program records no data, it simply transmits the steering wheel switch status to the surrogates machine so that the same switches can be used for all testing. Thus, if a surrogate is to be run without the simulator, the emulator must be started and left running during the test if the steering wheel buttons are to be used for participant responses.
Figure D-24. STISIM Emulator Interface
D.2.8 Parallel Port Communications Test Program The Parallel Port Test program is one of two programs that were developed to aid with diagnosing and repairing hardware problems. This program is a utility developed to read and write data on a bitwise basis to the parallel port of the surrogates testing computer. The interface is shown in Figure D-25. This is required as the surrogate assessments utilize the parallel port to communicate with the STISIM Drive laptop computer. Each output bit can be individually toggled on or off by clicking the respective button below the display boxes. The output pattern can also be inverted with the Toggle All Bits button.
D.2.9 Data Acquisition Card Communications Test Program The CTR05 Board Test Program is the second utility developed to aid in diagnosis and repair of hardware issues. This is a utility developed to work with the data acquisition card in the surrogates computer and the interface is shown in Figure D-26. This program is used to read and write to the data acquisition card in the surrogates assessment desktop computer. When Read All Bits is clicked, the program will begin monitoring inputs from the data acquisition box to the card and is a way to verify switch inputs, as a closed switch will set the respective bit to 1. The output bits can also be set individually with the button below the display box and the pattern can be inverted as a whole with the Toggle All Bits button as well. This utility is useful for manually testing the system as bit 0 controls the stimuli such as PDT light and Occlusion goggles, and bit 1 activates the IR indicator in the face camera view discussed previously.

Appendix D Laboratory Hardware and Software
D-24
•
Figure D-25. Parallel Port Test Program\Interface
•
Figure D-26. Data Acquisition Card Test Program Interface

Appendix D Laboratory Hardware and Software
D-25
D.3 References Wickens, C.D., Hyman, F., Dellinger, J., Taylor, H., and Meador, M. (1986). The Sternberg memory task as an index of pilot workload. Ergonomics, 29(11), 1371-1383.

E-1
E Appendix E. Test Participants
E.1 Background Participants for this study were recruited from the Detroit metropolitan area by an independent marketing research firm. The participants were licensed Michigan drivers evenly distributed between the two genders as well as six age ranges: 21 to 29 years, 30 to 39 years, 40 to 49 years, 50 to 59 years, 60 to 69 years, and 70 to 79 years. Before being admitted into the study, prospective participants were screened for demographic, health, and driving record characteristics. The full text of the screening questionnaire used for the study is presented in Appendix J. Some of the criteria used in selecting participants were:
• Must hold a valid Michigan driver license with no restrictions.
• At least two years of driving experience and drive at least 3,000 miles per year.
• Not employed by a vehicle manufacturer, Tier 1 automotive supplier, advertising agency, or a public relations, media, marketing research or legal firm.
• A good driving record, including a combined total of no more than three moving violations and at-fault accidents in the last 12 months and no convictions for operating a vehicle while impaired or other significant violations resulting in a license suspension.
• Generally, in good health and free of certain diseases or health conditions (e.g., heart disease, shortness of breath, susceptibility to motion sickness, glaucoma, epilepsy with a seizure in the last 12 months, etc.).
• Not taking medications that could impair driving (e.g., narcotics or antihistamines that cause drowsiness).
• Available on two consecutive days for testing.
Participants were paid for their time involvement in the study. The laboratory and on-road participants each received $320, while the test track participants received $400. The additional incentive paid to the test track participants was judged necessary to minimize the occurrence of “no shows” resulting from the longer travel time to the test track facility in Romeo, Michigan.
In total, 234 participants were selected for the three phases of the study. Each participant appeared in only one of the three venues. Fifty-seven participants were selected for the laboratory phase, 108 for the on-road phase, and 69 for the test track phase. Although 234 participants were selected, it should be noted that not all successfully completed the study. For example, several participants were involved with equipment problems, weather-related testing delays, illness, or an unwillingness to perform the requested in-vehicle tasks while driving or perform them in the prescribed manner. When such testing interruptions became significant (i.e., to the point where the majority of the test plan could not be executed), the participants were excused from the study.
In addition to the Screening Questionnaire, demographic information was collected from participants using the Initial Questionnaire found in Appendix I, Data Collection Forms. In some cases, such as age and gender, the two questionnaires collected duplicate data for verification purposes. The majority of questions in the Screening Questionnaire were required in order to provide suitable participants for the study. The remaining questions included years and miles per year of driving experience, vehicle make and model, and rate of use of corrective devices or aids (glasses and hearing aids).

Appendix E Test Participants
E-2
E.2 Selected Demographic Details Table E-1 presents the age and gender distribution of the study participants by venue. This distribution applies to all lateral, longitudinal, and object-and-event detection driving performance variables, and analysis not related to eye-glance metrics.
Table E-1. Participant Age and Gender by Testing Venue
Age of Participant (Years)
Gender Statistic 21 - 29 30 - 39 40 - 49 50 - 59 60 - 69 70 - 79 Totals
Female N 4 5 5 6 5 4 29
Row Pct. 13.79 17.24 17.24 20.69 17.24 13.79 100.00
Male N 4 5 5 5 5 4 28
Lab
Row Pct. 14.29 17.86 17.86 17.86 17.86 14.29 100.00
Female N 10 10 10 11 9 7 57
Row Pct. 17.54 17.54 17.54 19.30 15.79 12.28 100.00
Male N 8 9 8 9 9 8 51
Road
Row Pct. 15.69 17.65 15.69 17.65 17.65 15.69 100.00
Female N 6 7 8 6 6 4 37
Row Pct. 16.22 18.92 21.62 16.22 16.22 10.81 100.00
Male N 6 5 5 6 5 5 32
Test Track
Row Pct. 18.75 15.63 15.63 18.75 15.63 15.63 100.00
Due to the extensive time and cost involved in preparing eye-glance data for analysis, only a subset of participants was available. The subset is evenly distributed across venues, gender, and three equal age groups that contain two decades of ages each. Table E-2 presents the age and gender distribution of the eye-glance data by venue.
Table E-2. Eyeglance Data Participant Age and Gender by Testing Venue
Age of Participant (Years)
Venue Gender Statistic 21 - 39 40 - 59 60 - 79 Totals
Female N 3 3 3 9 Road
Male N 3 3 3 9
Female N 3 3 3 9 Test Track Male N 3 3 3 9

Appendix E Test Participants
E-3
The remaining portion of this appendix provides a number of selected demographic measures that describe the sample population used in the study. This material is intended to give the reader a general feel for the group of people who participated in the study. The design of the experiments was intended to evaluate the tasks relative each other and not the participants directly. The sample of participants was comprised of well-educated middle class drivers in good health. All were recruited from the general public and none had professional driving training. This group closely matches the type of drivers who are likely to purchase and utilize in-vehicle type devices. It is the design and related modes and extent of use of these devices that were the focus of this research and the cause for concern about the types of driver workload in this study.
Data from the screening questionnaire used during the initial telephone interview showed that participants fell well within the expected range of corrected vision and hearing as well as driving experience in both number of years and miles per year. Drivers in this study drove an average of 16,000 miles per year. There was an average of about 32 years of driving experience per person. Approximately, 66 percent wore glasses or needed hearing aids to drive. Details of the distribution of driving experience are shown in Table E-3 for years and Table E-4 for miles per year. Simple comparative statistics showed no significant differences in balance on these measures. There is an obvious increase in driving years with increasing age.
Table E-3. Participant Driving Miles Per Year by Age, Gender, and Testing Venue
Participant Age
Venue Gender 21 - 29 30 - 39 40 - 49 50 - 59 60 - 69 70 - 79 Grand Total
Lab female 12,250 10,400 14,400 11,667 10,200 9,750 11,483
male 14,250 18,100 17,800 19,000 16,000 13,250 16,589
On Road female 13,350 15,100 13,400 13,273 14,778 19,571 14,640
male 17,500 38,556 26,375 18,444 14,167 14,500 21,716
Test Track female 14,500 15,143 12,750 12,667 13,583 6,375 12,919
male 13,083 16,900 18,600 18,500 33,600 16,400 19,281
Grand Total 14,342 20,268 17,098 15,442 16,436 14,141 16,387
Table E-4. Participant Years Driving Experience by Age, Gender, and Testing Venue
Participant Age
Venue Gender 21 - 29 30 - 39 40 - 49 50 - 59 60 - 69 70 - 79 Grand Total
Lab female 7 15 27 38 51 52 32
male 8 21 24 39 49 49 32
On Road female 8 19 27 37 46 51 30
male 8 20 27 38 47 56 33
Test Track female 9 18 29 38 46 56 31
male 7 20 31 37 53 53 33
Grand Total 8 19 28 38 48 53 32

Appendix E Test Participants
E-4
Table E-5 shows the experimental distribution of vehicle types driven by participants most often at home. During the study all participants drove the same passenger vehicle type.
Table E-5. Participant Vehicle Type Driven by Testing Venue
Vehicles Types and Venues
Laboratory On-Road Test Track Vehicle Type
N Percent (%) N Percent (%) N Percent (%)
Passenger Cars 39 68.42 75 69.44 42 60.87
Sport Utility Vehicles 10 17.54 18 16.67 8 11.59
Vans & Minivans 7 12.28 11 10.19 13 18.84
Pickup Trucks 1 1.75 4 3.70 6 8.70
Totals 57 100 108 100 69 100
In addition to the screener data, the Initial Questionnaire reveals details of education, employment, income, and computer and cell phone-related usage rates for participants. Figure E-1 shows the education levels of participants across the three venues. The majority of participants were highly educated, falling between a post secondary and masters level of formal education. Distribution between venues is somewhat an artifact of the interaction between the testing and school year schedules and changes between data collection procedures between venues. This can again be seen in the employment by venue distribution in Figure E-2.
0% 5% 10% 15% 20% 25% 30% 35% 40%
Some High School
High School Grad
Some Post-Secondary School
Some Trade School/College
Trade School/College Grad
Undergraduate Degree
Master's Degree
Ph.D. Degree
Other
Percent of Venue Sample
Lab OnRoad TestTrack
Figure E-1. Educational Distribution of Participants

Appendix E Test Participants
E-5
0% 5% 10% 15% 20% 25% 30% 35% 40% 45% 50%
Missing data
Full Time
Part-time
Unemployed
Retired
Other
Student
Homemaker
Percent of Venue Sample
Lab OnRoad TestTrack
TestTrack 1.4% 46.4% 13.0% 7.2% 18.8% 2.9% 4.3% 5.8%OnRoad 0.0% 39.8% 13.0% 13.0% 25.9% 7.4% 0.0% 0.9%Lab 7.0% 36.8% 14.0% 14.0% 26.3% 1.8% 0.0% 0.0%
Missing data Full Time Part-time Unemploy
ed Retired Other Student Homemaker
Figure E-2. Employment Distribution of Participants
Participants were paid well for their involvement in the study, however, the distribution of their household incomes, as shown in Figure E-3, does not indicate a financial bias. The majority of participants fell into the upper-middle class with incomes of $25,000 to $100,000 per year.
0% 5% 10% 15% 20% 25% 30% 35% 40%
Not Provided
$0 to $25k
$25k to $50k
$50k to $75k
$75k to $100k
$100k to $125k
More Than $125k
Percent of Venue Sample
Lab OnRoad TestTrack
TestTrack 7.2% 8.7% 27.5% 29.0% 15.9% 5.8% 5.8%
OnRoad 4.6% 6.5% 32.4% 19.4% 13.0% 9.3% 14.8%
Lab 24.6% 12.3% 15.8% 26.3% 14.0% 1.8% 5.3%
Not Provided
$0 to $25k
$25k to $50k
$50k to $75k
$75k to $100k
$100k to $125k
More Than
$125k
Figure E-3. Household Income Distribution of Participants

Appendix E Test Participants
E-6
Several screener questions were designed to gather information about the electronic device usage rates of the participants. These results were very consistent across venues and showed a general high-use rate of computers and cellular phones. About one-half of all participants used computers on a daily basis and another one-fifth used them one or more times per week. Over 85 percent of participants owned cellular telephones with over 80 percent of those using them daily. Interestingly, only 30 percent of those owning cellular phones had hands-free talking capabilities. This is about the same as the number of those having the voice or hands-free dialing capability.

F-1
F Appendix F. Experimenter Protocols
F.1 Lab Procedures The laboratory-testing segment was conducted in a modified office space with four testing stations. Each testing station was equipped with a STISIM simulation computer with a projector and pedals and a steering wheel. The station was also equipped with occlusion glasses, an LCD monitor for Sternberg stimuli presentations, and a PDT light. The layout of the center console was similar to that used in the vehicles for the on-road and test track testing venues. A document detailing the start-up procedures was provided for all instruments in each testing station. Each testing station also had a cellular phone with a hands-free device and a MP3 player with the tasks requests that were part of the experimental protocols.
Laboratory setup procedures required each experimenter to check a list of testing station props everyday to verify all materials were ready for task training and data collection. The props included checking for seven different colored compact discs, one cassette, eleven coins of different denominations, radio station preset to 100.1 FM, an operational navigation system, and a flip cellular phone turned on and face open with the hands-free cord plugged in. The experimenters’ and the participants’ headsets were cleaned with alcohol swabs and fresh nose and ear covers were placed on the occlusion glasses each morning.
Startup protocols also required the STISIM computer to be powered up, the cables checked, and the projector tested to verify the proper image quality was present. The data acquisition computer was powered on to load task request audio files into the MP3 player. The experimenter also verified that surrogate scenario files for the participant were available on that computer for use during surrogate testing.
Prior to the arrival of the participants each day, the experimenters were required to retrieve the participants’ folders and verify the requisite documents for the day were available. The experimenters were required to fill in the participants’ numbers, and date and initialize each document. The experimenters also used the screener sheet in the folder to familiarize themselves with the background information provided about each participant.
Laboratory testing was conducted over a two-day period. On Day 1, after the participant arrived and introductions were made, coffee and refreshments were offered. The participants were required to answer a health questionnaire and provide a level of alertness at that time. An overview of the informed consent document was provided, in addition to the information letter that was mailed to each participant prior to his/her arrival at the testing site. Once the participants understood their role in the study and all their questions were satisfactorily answered, they signed the informed consent document. The participants were also asked to complete an initial questionnaire, an in-vehicle task activities questionnaire, and a comfort and confidence questionnaire.
The initial questionnaire collected information on each participant’s education level, income, occupation, employment status, computer knowledge and usage, cellular phone use with and without hands-free device. The participants were also asked to mark their familiarity level on an extensive list of in-vehicle devices that included navigation systems, voice and text communication, and multi-function devices. The in-vehicle activities questionnaire prompted the participant to answer questions on usage and the frequency of usage on a list of in-vehicle tasks such as coins, cassette, and radio. Participants were also asked to specify their multi-tasking ability and the frequency of multi-tasking while driving. They were asked to rate their psychological state while driving and multi-tasking and their level of performance on tasks when they multi-task.

Appendix F Experimenter Protocols
F-2
In the comfort and confidence questionnaire, the participants were requested to rate their level of comfort in performing in-vehicle tasks such as selecting coins, inserting a cassette, changing climate control, etc., while driving. The rating scale ranged from one to seven where one was not comfortable at all to seven being very comfortable. The participants were asked to rate their level of confidence in completing an in-vehicle task successfully while maintaining vehicle speed, lane position, and observing all traffic rules. They were also asked to rate their level of comfort if a driver in an adjacent vehicle were to perform the same in-vehicle task and the participant’s confidence in the other drivers' ability in maintaining good vehicle control.
After completing the aforementioned forms, the participants were provided a short break while the experimenters inspected the completed forms and checked the readiness of the systems in the testing stations. Once the testing station readiness was confirmed, the participants were oriented with the seating operations, headphone adjustments, center console devices, and other equipment used during the testing procedure. After a participant was seated comfortably, a video calibration was performed prior to recording video for task training and testing. The task request format and the task training methodologies were explained to each participant. Volume level adjustments were made for the MP3 tasks and for the headphones for both the participant and for the experimenter. The experimenters proceeded with the task training procedures as addressed in the task training document. Sufficient time was provided for the participant to become acclimatized with the tasks. Breaks were provided to alleviate excessive levels of fatigue during the training period.
During the task training phase, the participants were also introduced to the six different types of surrogates used during the laboratory data collection phase. The six surrogates were static task time, occlusion glasses, peripheral detection task (PDT), PDT with STISIM, Sternberg Verbal, and Sternberg Spatial. Only tasks with visual-manual components were tested in the static task time and occlusion testing period. For static task time, the participant was requested to perform the task as quickly as possible to reach the end result. The participant was instructed that one hand must always been at the steering wheel while performing any task with any surrogate. In the occlusion glasses test, the participant adorned modified glasses with lenses that turn from opaque to clear, with the timing interval set to 1.5 sec open and 2 sec closed. The participant was asked to complete the task as quickly as possible and was allowed to see the display/devices only when allowed to by the lenses.
In the PDT alone test, the participant was asked to complete the task as quickly as possible while responding to a red laser dot appearing on a screen with a button press that was located in front of the participant. The PDT light appeared randomly between 2 and 10 sec. For the STISIM with PDT task, the participant was asked to drive a simulated vehicle in a fixed-base driving simulator and perform the tasks while responding to the PDT light that appeared on the screen. The participant was provided ample time to get used to the simulation prior to practicing with the tasks and the PDT light. The Sternberg test was conducted under two different stimuli—spatial and verbal. In the spatial test, three road-sign images were displayed on a LCD monitor and the participant was asked to memorize the signs. Once ready, multiple road sign images were presented one at a time with a random interval of 2 and 10 sec, and the participant was asked to respond to each presented image with a similar/dissimilar button press. For the verbal component of the Sternberg test, the test was identical to the spatial test except that three two-digit highway numbers were displayed on the LCD monitors that the participant had to remember.
Appendix F Experimenter Protocols
F-3
At the end of the task-training period, the participant was introduced to two subjective rating scales—the overall workload scale and the multi-tasking difficulty rating scale. The overall workload scale was a linear scale ranging from a very low workload to a very high workload for each task that was practiced during the training session. The participant was asked to mark a point on the scale that best reflects the workload involved in performing that task. For the multi-tasking difficulty rating scale, the Radio Tune Hard task while driving was used as a reference task, and the participants were asked to compare each of the other tasks as either more, less, or the same difficulty with respect to the reference task. For the purpose of the multi-tasking rating scale, participants were asked to assume that they were always driving while performing the tasks. In addition to rating the difficulty level, the participants were asked to input a value of difficulty for each task. For example, a task twice as difficult as the reference task would have a value rating of 200 points.
Lunch was provided for all participants between 11:30 a.m. and 12:30 p.m. and all task training and surrogate training was halted during that interval. After lunch, participants would resume their task training and surrogate training activities prior to beginning actual testing sessions. Individual differences tests were conducted during the afternoon session using the Patsys, Universal Field of View (UFOV), and the Baddeley dual tasking tests. The Patsys test is a computer-based test developed by RSK Assessments, Inc. and a copy was purchased for use in this study. Three Patsys modules were used for each participant—the temporal acuity test, manikin test, and the grammatical reasoning test. UFOV is a computer-administered and computer-scored test of functional vision and visual attention. UFOV was developed by Visual Awareness, Inc. and a license was purchased for use in this study. The UFOV test was divided into three sub-sections; processing speed, divided attention, and selective attention. A third individual differences test, Baddeley dual task, was used to measure dual tasking abilities of individuals by first performing two tasks independently and then together. Each participant was presented with twelve blocks of testing with surrogates, six surrogates replicated twice. The surrogates were balanced between participants to counter ordering effects. Experimenters concluded Day 1 testing no later than 4:30 pm. Participants were asked to sign a Day 1 completion form and were asked to return at 8 a.m. the next day to conclude the remainder of the study.
Upon the arrival of the participants on Day 2, the experimenters proceeded to complete the surrogate testing. A 10 min break was provided for every hour of testing for both days of testing. After completing surrogate testing, individual differences tests were conducted if they had not been completed on Day 1 of testing. The participants were then asked to complete the overall workload and multi-tasking difficulty ratings prior to signing a Day 2 completion form and being released from the study. In addition to the multi-tasking difficulty rating, a situational awareness rating scale was introduced for Day 2. The Radio Tune Hard task while driving was used as a reference task, and the participants were asked to compare each of the other tasks as either more, less, or same level of awareness of events around them as compared to the reference task. As in the multi-tasking rating scale, the participants were asked to assume that they were always driving while performing the tasks. The participants were also asked to input a value of awareness for each task, for example a task in which a participant may feel they were half as aware as compared to the reference task, would have a value rating of 50 points.

Appendix F Experimenter Protocols
F-4
F.2 On-Road Procedures The setup used in the laboratory testing segment was also used for the on-road testing segment. In the on-road segment, participants were required to perform only two surrogates—the occlusion goggles and the static task time test. The participants were required to complete the testing over a period of two days. On the morning of day one, participants were familiarized with the testing protocol much like in the laboratory segment, and during the afternoon they were involved with the testing on public roads. As this segment of the study required driving a vehicle on public roads, the testing efforts had to be coordinated. The experimenters had to ensure that the participants would complete their training in the time allotted and complete all necessary paperwork prior to heading out to the test site. The experimenters would drive the participants to the rendezvous point at an exit of Interstate I-96. The meeting time was scheduled to be 11:30 am. The participants were introduced to the rest of the crew and headed for lunch. Due to the nature of certain paper pencil tasks (Route Tracing, Delta Flightline, Navigation Display, Read Text Easy, Read Text Hard, Read Map Easy, and Read Map Hard), they were omitted from the on-road segment due to safety concerns. .
After lunch, the participants were familiarized with the vehicle and its controls. They were also shown the lead vehicle they were to follow at all times, and the follow vehicle that would be following them during the testing period. A radio check was performed for all three vehicles in the platoon prior to departing. A video calibration was performed prior to start of the practice driving segment. Safe driving was emphasized and the participants were made aware that they were not obliged to perform a task if they felt uncomfortable with the driving conditions. The participants were asked to drive in the right lane at all times at about 55 mph during the testing. The east and west bound lanes of Interstate I-96 between Howell and Lansing, exit 157 and 110 respectively, was chosen as the test segment due to low traffic and the evenness of the road conditions. After a participant had an opportunity to become familiar with the vehicle’s feel and controls, the experimenter explained what the participant was required to do and the objects and events detection (OED) they were to monitor during the tests. Three events were chosen for this study: the Lead Vehicle Center High Mounted Stop Light (CHMSL), the Follow Vehicle Left Turn Signal (FVTS), and the Lead Vehicle Deceleration (LVD). To respond to the CHMSL and the FVTS the participant was provided with a button attached to a Velcro to tie it on the index finger. To respond to the LVD, the participant was required to gently tap the brakes to indicate they had observed the event. The experimenter explained each of the three OEDs and provided examples for the benefit of the participant. The participant was also informed that he/she was required to follow 120 ft behind the lead vehicle during the task, which was about 3-car lengths. The experimenter helped the participant to get a feel for the following distance with the assistance of the radar installed in the vehicle.
The experimenter was required to check the readiness of the data collection system, including checking for all relevant button presses and OEDs. A radio check was performed one more time to confirm the commencement of actual testing. An audio check for the task requests was also performed for the participant to verify the loudness of the tasks. To ensure that a task OED would not be called off due to a traffic hazard, the experimenter was to avoid beginning a task at or around an entry or an exit ramp and emergency vehicles. The lead and follow vehicle drivers were to inform the experimenter if the traffic scenario was unsafe to perform a LVD as only the experimenter was empowered with canceling the LVD event. The CHMSL and the FVTS events could be performed independent of the lead and follow vehicle drivers.

Appendix F Experimenter Protocols
F-5
In all, eight blocks of data had to be completed through the afternoon of Day 1 and the morning of Day 2. At least six blocks of data per participant had to be finished to complete the counter-balanced task layout with respect to the OEDs. Every effort was made by each experimenter to complete the practice drive segment and four blocks of data collection on Day 1, if the traffic and weather conditions were suitable for testing. This allowed sufficient time for completing four blocks on Day 2 with time to spare in case of hardware and software problems or weather and traffic concerns. Data collection was halted by 4 p.m. on Day 1 and the participants were released for the day around 4:30 p.m. after completing Day 1 formalities. The participant was requested to arrive at the base testing station around 7 a.m. the following day. Swappable data drives were used for the data collection purposes and were replaced with empty drives at the end of each day. The data drives with the data for each day were returned to the project manager for archiving.
On Day 2, a health check questionnaire was completed prior to the participant getting behind the wheel of the instrumented subject vehicle. The participant drove the instrumented vehicle to the starting point of testing, exit 157 on Interstate I-96, allowing sufficient time for re-familiarization with the operations and the handling of the vehicle. Blocks 1 through 6 were usually conducted in pairs and took about 50 min to complete each pair. A 15 min break was provided after completing a pair of blocks to alleviate excessive levels of fatigue for the entire crew. All in-vehicle testing for the participant were stopped by lunch time, 11:30 am, to allow time for the next participant and experimenter to start a set of data collection activities. After lunch the participant returned with the experimenter to base where additional Day 2 formalities were to be completed. These formalities included completing multi-tasking difficulty, overall workload, and situational awareness questionnaires. In addition, each participant was required to complete two blocks each of the static task time and occlusion surrogates. If the participant was unable to complete all of the individual differences testing activities, they were completed in the afternoon of Day 2. The participant was required to sign an end of Day 2 data collection form prior to being released from the study.
F.3 Test Track Procedures The test track at the Ford Proving Grounds in Romeo, Michigan was chosen for completing the test track segment of the study. Two laboratory stations were set up at the proving grounds for task training and individual differences testing purposes only. No surrogate data was collected at the test track. The testing format as used in the on-road segment was also used in the test track segment. The participants were greeted at the lobby at 7 a.m. and were escorted to the testing site by the experimenters. The order of protocols was similar to that of the on-road segment; however in this segment, all 23 tasks were used in the data collection process. After completing the informed consent form and other background information questionnaires, the participants were trained on the operation of each of the 23 tasks. If adequate time was available before lunch the participant started individual differences testing.
The test track was a 5-mile oval track with 5 lanes and the platoon was given access to lane 2, with lane 5 being the banked lane on the oval. The participant was introduced to the vehicle and its controls after lunch. A video calibration was performed prior to start of the practice-driving segment. Sufficient time was provided to the participant to drive around the track and get a feel for the vehicle dynamics and the controls in the vehicle. The OEDs and the testing protocols used in the test track were identical to the ones used on the on-road segment. The OEDs were explained to the participant and examples were provided during the practice drive. As mentioned previously, all 23 tasks were used in the test track segment and a total of 6 blocks were to be completed by each participant. A participant required about 45 min to complete a block and a 10 min break was provided after each block to minimize excessive fatigue levels. A health check questionnaire was administered in the morning of both Day 1 and Day 2.

Appendix F Experimenter Protocols
F-6
Experimenters made every effort to complete at least 2 blocks prior to end-of-testing on Day 1. Day 1 formalities were completed prior to releasing the participant for the day. They were asked to return the following day to complete the remainder of the test blocks. The experimenters were trained to start a task at the beginning of the straightaway, but long tasks spilled over to the curved segment of the roadway. Day 2 testing for a participant was wrapped up before lunch to allow the next participant to commence a testing session. The remainder of the individual differences tests were conducted after lunch and the participant was also required to complete multi-tasking difficulty, overall workload, and situational awareness questionnaires. The participant was required to sign an end of Day 2 data collection form prior to being released from the study.

G-1
G Appendix G. Task Training Protocol This appendix contains the Task Training Protocol developed for the CAMP DWM Project, Task 2. The materials are presented as they were reported in Task 2.
Instructions for administering the DWR training tasks are provided. Each protocol includes an explanation of the setup and purpose of the task, provides guidance on demonstrating and practicing the task, and information on running the criterion trial.

Appendix G Task Training Protocol
G-2
DWM Task 2
Task Training Protocol
Driver Workload Metrics CAMP
IVI Light Vehicle Enabling Research Program

Appendix G Task Training Protocol
G-3
Protocol For Task Training General Instructions You will be asked to perform a variety of tasks the next couple days and we would like you to be comfortable and familiar with these tasks. So this morning I would like to take some time to introduce you to each of the tasks. Before we begin, however, it is important for you to know that when I ask you to do a task, I will follow a specific request format. This format will let you know when to begin a task. The requests have all been pre-recorded, and will all follow this same format. In that format, you will first hear what task you are to do, and then you will hear the phrase, “Please Begin Now.” For example, you might hear: “Your task is to tune the radio to 95.7 FM. Please begin now.” When you hear the words “Please begin now” be sure to listen for the word “now” – because we would like you to proceed to the task right when you hear the word “now.” Please DO NOT begin the task before you hear the word “now.” Also, please try to avoid any delays between hearing the word “now” and beginning the task. After you complete a task and feel that you have reached the desired outcome, we want you to say the word “Done.” Please try to say this just as soon as you finish the task. At first you may find it hard to remember to say “Done” each time that you finish a task, but after you practice a few times, you will get used to it. Finally, we would like to ask that you keep one hand on the steering wheel at all times while performing the tasks. Okay, then. . . as we go through each task, I will:
• Explain each of the tasks to you. • Demonstrate each of them for you. • Give you a chance to practice each of them. • And then give you one trial to test your understanding of how to do the task.
Okay, do you have any questions? Great, then let’s get started with the first task.

Appendix G Task Training Protocol
G-4
Task 1: Coins Setup
Check that all the coins are in the holder: 3 nickels, 2 dimes, 3 quarters, 2 half-dollars, and 1 Sacagawea dollar
Jumble the coins in hand and return to the coin holder Explanation of Task The first task that we will practice is selecting a certain amount of change from a coin holder. The coin holder, located to your right, is similar to the cup holder location in the car that you will drive later. The coin holder is fixed in its place. Your task will be to find a certain amount of change from the coin holder. The coin holder has the following coins: 3 nickels, 2 dimes, 3 quarters, 2 half-dollars, and 1 Sacagawea dollar. You will always be asked to select coins from the coin holder that total the target amount. For example, your task might be as follows, “Your task is to retrieve coins from the coin holder totaling 65 cents. Please begin now.” In doing this task, please remember to keep one hand on the steering wheel at all times. Demonstration Let me show you how I want you to perform the coins task by doing it myself. After hearing and the words “Please Begin Now” I would reach over and pull out a half dollar coin, a dime, and a nickel, totaling 65 cents, and put them onto the center console and then say “Done” indicating the completion of the task. Practice Now I would like you to practice doing the task. Let me play the task request for you and you may proceed on the word “Now” when you hear the words “Please begin now.” Remember to say “Done” after you finish. <Play task request> Okay, good. <Offer any coaching that may be needed> Do you have any questions? Criterion Trial Let’s do it one more time. This time I will be recording whether or not the task is successfully completed. Ready? <Play task request> Note any special codes or comments.
Repeat criterion trial if task was not fully successful and re-verify task setup states.
This may be done up to three times (recording success of attempt each time). Go on to the next task if successful completion achieved or three criterion trials run.
Scoring Key: Score as Y if correct amount of change is selected. Otherwise, score N.

Appendix G Task Training Protocol
G-5
Task 2: Cassette Setup
Make sure tape is in the case and in the position marked under the cassette deck Make sure “Side A/B” on the tape is not visible
Explanation of Task The next task we will practice is inserting a cassette in the cassette player. The cassette will be in its case stored in the empty slot under the cassette deck. You will be asked to reach over and pick up the case, open it, remove the tape and then insert the cassette with the requested side facing up. If you are asked to insert the cassette to play side A, then insert the cassette with side A facing up. If you are asked to insert the cassette to play side B, then insert the cassette with side B facing up. The cassette must be inserted such that the small holes in the cassette are to the right. You will not need to turn on the cassette player, so all you need to do is slide the cassette into the slot with the requested side up and say “Done” to signal the end of task. Demonstration of Task Your task request will be as follows, “Your task is to insert the cassette into the cassette player and play side A. Please begin now.” When you hear the word now, we would like you to reach for the cassette case, open it, and insert the tape with side A facing up and say “Done” when finished. Okay, do you have any questions? Practice I would like you to practice inserting the cassette a few times, just to get comfortable with handling the cassette case and inserting the case. Let me play the task request for you and you may proceed on the word “Now” when you hear the words “Please begin now.” Remember to say the word “Done” when you are finished. <Play task request> Criterion Trial Let’s do it one more time. This time I will be recording whether or not the task is successfully completed. Ready? <Play task request> Note any special codes or comments.
Repeat criterion trial if task was not fully successful and re-verify task setup states.
This may be done up to three times (recording success of attempt each time). Go on to the next task if successful completion achieved or three criterion trials run.
Scoring Key: Score as Y if tape snaps into place and correct side is up. Score P if tape snaps into place and wrong side is up. Otherwise, score N.

Appendix G Task Training Protocol
G-6
Task 3: Heating, Ventilation, and Air-Conditioning (HVAC )
Setup
Verify that settings match the appropriate start state: moderately warm, both face and feet, and medium fan speed
Explanation of Task You will be asked to adjust the heating, ventilation, and air conditioning (HVAC) control located above the radio/CD unit. The HVAC unit has three controls: fan speed, temperature control, and vent selector. The fan speed knob control ranges from off, low, medium, and high while the temperature knob rotates from cold (blue) to hot (red). The six different temperature settings possible are maximum cold, moderately cold, slightly cold, slightly warm, moderately warm, and maximum heat. The direction of airflow can be adjusted to upper body, to both your face and feet, to just your feet, to the windshield and feet, or to the windshield only. After you have finished a task, please do not change the settings on the HVAC again until you are requested to do so. Demonstration of Task Let me show you how to do this task now. Your task request would say, “Your task is to adjust the heating and air-conditioning system so that moderately warm air is directed to both our face and feet at medium fan speed. Please begin now.” I would then reach for the unit and change the temperature setting to moderately warm, the vent selector to face and feet, turn the fan speed to medium setting, and say “Done” when finished. Okay, do you have any questions? Practice I would like you to practice adjusting the heating, ventilation, and air conditioning system, just to get comfortable with handling it. Let me play the task request for you and you may proceed on the word “Now” when you hear the words “Please begin now.” Remember to say the word “Done” when you are finished. <Play task request> Criterion Trial Let’s do it one more time. This time I will be recording whether or not the task is successfully completed. Ready? <Play task request> Note any special codes or comments.
Repeat criterion trial if task was not fully successful and re-verify task setup states.
This may be done up to three times (recording success of attempt each time). Go on to the next task if successful completion achieved or three criterion trials run.

Appendix G Task Training Protocol
G-7
<IMPORTANT: If task performance is not successful, the experimenter must return the state of the HVAC to its prior setting BEFORE proceeding to repeat the criterion trail>
Scoring Key: Score as Y if all three settings are correctly set, P if only some are correctly set, and N if none are correctly set.

Appendix G Task Training Protocol
G-8
Task 4: Radio Tune “Easy” Setup
<Experimenter’s Note: This must be done prior to every radio task> Check radio to ensure that it is turned “ON” Check to ensure that all radio presets are set to 100.1 FM on both FM1 and FM2 (if
not, set it again) Explanation of Task The radio/CD entertainment system will be used for multiple operations over the next couple of days. The first operation with this system will be to tune the radio. Before we begin, let me point out the TUNE knob, which will be used to tune to a requested radio frequency. As you turn it to the right, it adjusts the radio frequency upward and if you turn it to the left, it adjusts the radio frequency downward. Prior to the radio task, the radio will be turned ON and the radio will be set to 100.1 FM. Your first task involves simply tuning the radio to a specific frequency and you can do that by using the TUNE knob, and turning it one way or the other, to get to the specific frequency that has been requested. You will be asked to tune to various stations on the FM band during the next few days. Demonstration of Task Let me show you how to do this task. The task request will say, “Your task is to tune the radio to 104.3. Please begin now.” I would reach for the radio and turn the tune knob to the right until I reach 104.3 FM and say “Done” to indicate completion of the task. Okay, do you have any questions?
Practice
I would like you to practice tuning the radio. Let me play the task request for you and you may proceed on the word “Now” when you hear the words “Please begin now.” Remember to say the word “Done” when you are finished. <Play task request> Criterion Trial Let’s do it one more time. This time I will be recording whether or not the task is successfully completed. Ready? <Play task request> Note any special codes or comments.
Repeat criterion trial if task was not fully successful and re-verify task setup states.
This may be done up to three times (recording success of attempt each time.) Go on to the next task if successful completion achieved or three criterion trials run.

Appendix G Task Training Protocol
G-9
Scoring Key: Score as Y if correct radio station is selected. Otherwise, score N.

Appendix G Task Training Protocol
G-10
Task 5: Manual Dial Cell Phone
Setup
Check that cell phone is ON Check that phone is face open and placed in the cup holder with the headset cord
attached to the phone Write down participant’s 10-digit phone number on paper to verify correct dialing
Explanation of Task
The cell phone that will be used over the next couple of days is sitting in the cup-holder with its face open. You will be asked to dial your home phone number including the area code. You DO NOT need to dial “1” on the phone. In order to make a call, you must pick up the phone from the cup-holder dial the 10-digit number and then press TALK. At that point, you will say “Done” because you have completed the task of dialing your home telephone number. Then please press the END key IMMEDIATELY AFTER you press the TALK button to cancel the call. (This way you prevent your home phone from actually ringing. We don’t want to bother anyone who may be home.) You may then place the phone back in the cup holder. A word of caution, please try to keep your fingers away from the wires on top of the phone as the connection is rather fragile.
Demonstration of Task
Let me show you how to do this task now. The task request may say, “Your task is to call home by manually dialing the phone. Please begin now.” I would begin keying the number on the keypad. Once all 10 digits had been entered, I would press the green TALK button on the top left and say “Done.” Then I would immediately press the red END button on the top right to cancel the call. Again, let me emphasize that after I press TALK I would say “Done” as I press the END key. Should you accidentally misdial a digit, you can go back one number by pressing the CLR button. This removes the last digit you entered. If you would like to remove all the digits you have entered, e.g. the first digit was wrong and you have already dialed all 10 digits, press and hold the CLR button as I am demonstrating now. Okay, do you have any questions?
Practice
I would like you to practice manually dialing the phone to call home. Let me play the task request for you and you may proceed on the word “Now” when you hear the words “Please begin now.” Remember to say the word “Done” when you are finished. <Play task request> I would like you to practice manually dialing home again, but purposely misdial a digit. I would like you to practice with the clear button, so should you make a mistake, you know how to correct it. Let me play the task request for you again, and when you hear the word “Now,”

Appendix G Task Training Protocol
G-11
Scoring Key: Score as Y if number is correctly dialed, P if error is made but recovered from and goal state is reached, and N if number is not correctly dialed.
you may proceed to dial… but please misdial at least one digit and then use the clear button to erase that digit. Remember to say the word “Done” when you are finished. <Play task request>
Criterion Trial Let’s do it one more time. This time I will be recording whether or not the task is successfully completed. Ready? <Play task request> Note any special codes or comments.
Repeat criterion trial if task was not fully successful and re-verify task setup states.
This may be done up to three times (recording success of attempt each time). Go on to the next task if successful completion achieved or three criterion trials run.
<When scoring, press the TALK button twice to see the last number dialed>

Appendix G Task Training Protocol
G-12
Task 6: Travel Computations
Setup
None
Explanation of Task
Thus far we have practiced manual tasks such as coins, cassette, and cell phone dialing. Our next task will be slightly different and involve performing some mental arithmetic to answer questions that we will ask you. The task is called Travel Computations and you will be asked to answer questions like adding distances, gallons of fuel, time required for travel, and money needed to pay tolls. When you hear the question, perform the mental calculations and say aloud the answer. You will hear feedback on the correct answer and then the next question will be asked. You will be required to answer a total of four questions. After you hear feedback on the fourth question’s answer the recording will say “We are done. Thank you.” indicating the end of task.
Demonstration of Task
Let me show you how to do this task now. The request will be “Your task is to help me with some trip computations. Please begin now.”
First, I would listen . . . and would hear the following instructions, “Today we’re going to go from the city of Starburst to the city of Ogden, and then on to the city of Brightland. The first leg of our trip is 19 miles in length and the second leg is 45 miles in length. How far do we have to drive altogether?”
So upon hearing this question, I would perform the mental arithmetic of adding the length of the two legs of the trip together, 19 and 45 that would equal 64. Then I would say my answer, 64 miles. <There is a pause of 4 seconds to let me do this> I would then wait to hear the correct answer. <64 miles is the correct answer>
Then I would listen again for the next segment of the instructions, “Also, on the first leg of our trip we have to pay an entrance toll of 51 cents, and on the second leg the toll is 39 cents. How much money in total will we need to pay the tolls?”
I would mentally add 51 and 39, which would equal 90 cents, and I would say my answer and listen for the correct answer. <90 cents is the correct answer>
In the third segment we might hear, “If we travel at the posted speeds on each leg of our trip, it will take 42 minutes to go the first leg, and 38 minutes to go the second leg. How long must we travel altogether?”

Appendix G Task Training Protocol
G-13
Then I would perform the mental addition of 42 and 38 equaling 80 minutes, and I would say my answer and then listen for the correct answer. Then I would wait to hear the correct answer. <80 minutes is the correct answer>
The last segment might go as follows, “In terms of how much fuel we will need, it looks like we will need 9 gallons of fuel to drive the first leg of our trip and another 13 gallons of fuel for the second leg. How many gallons of fuel are we going to need for the trip?”
The addition of 9 and 13 gallons would yield 22 gallons, which I would say aloud, and then wait to hear the correct answer. <22 gallons is the correct answer> And a moment later, the recording would say “We are done.” Okay, do you have any questions?
Practice
I would like you to practice this travel computations task. Let me play the task request for you and your task will begin when you hear the words “Please begin now.” For this task, you will not need to say the word “Done” as the recording will let you know when the task is over by saying “We are done.” <Play task request>
Criterion Trial
Prepare to monitor and record whether each of the four task parts is successfully completed or not. Let’s do it one more time. This time I will be recording whether or not the task is successfully completed. Ready? <Play task request> Note any special codes or comments.
Repeat criterion trial if task was not fully successful and re-verify task setup states.
This may be done up to three times (recording success of attempt each time). Go on to the next task if successful completion achieved or three criterion trials run.
Scoring Key: Score as Y if all four computations are correct, P if one to three of the computations are correct, and N if none of the computations are correct.

Appendix G Task Training Protocol
G-14
Task 7: Route Orientation
Setup
None
Explanation of Task
Another task that you will be asked to do during the next few days is called Routing Orientation. It involves listening to some route instructions and, after each turn in the sequence, determining the direction in which you would be headed after that turn. You will be told that you are traveling in particular direction (for example, NORTH) and then will be making a turn (either left or right). You will then need to reorient yourself to the new direction you are heading and tell the experimenter which direction that is. You will be asked nine of these questions, one after the other until you hear the words “We are done.” For example, you might hear something like this, “We are heading east, and turn left, what direction are we heading?” <There is a pause of 4 seconds to let me do this> <North is the correct answer> It will be followed by, “If you continue in that direction and turn left, what direction are you heading?” <West is the correct answer> We would like you to state your answer out loud after each question, and then listen for the correct answer. This is important because you will need to remember the correct direction of travel from the prior question in order to be able to answer the next question in the sequence.
Demonstration of Task
Let me show you how to do this task now. The request will be: “The task is to listen to this travel route and tell me the direction in which we will be headed after each turn. Please begin now.” First, I would listen to the first bit of information, “We will first head south and make a left turn.” I would form a mental image of heading south, and then making a left turn. Then I would listen for the question.
“What direction are we heading?” I would use my mental image to reorient myself to the new direction and say “East” and wait to listen for the correct answer. The recoding would then say, “East is the correct answer.”
I would remember the new direction as I hear the next message, “Then after continuing, we will turn left again. What direction are we heading? I would respond “North” and listen for the correct answer. The recording would then say, “North is the correct answer.”
“Continuing on, at the next junction we turn right. What direction are we heading?” I would respond “East” and listen for, “East is the correct answer.”

Appendix G Task Training Protocol
G-15
“Okay, then we go straight and make a right turn at the next junction. What direction are we heading?” I would respond “South” and listen for, “South is the correct answer.”
--------------- Can stop here if participant understands --------------------------------
“Then our next turn is to the left. What direction are we heading?” I would say “East” and listen for, “East is the correct answer.”
“That road takes us to our next turn, which is to the left. What direction are we heading?” I would say “North” and listen for, “North is the correct answer.”
“Then after several miles, we turn left again. What direction are we heading?” I would say “West” and listen for, “West is the correct answer.”
“Then again we travel for awhile until we reach a junction and we turn left. What direction are we heading?” I would say “South” and listen for, “South is the correct answer.” “We go straight and our next turn is to the right. What direction are we heading?” I would say “West” and listen for “West is the correct answer.”
Finally we would hear, “We are done. Thank you.”
Okay, any questions?
Practice
Now I would like you to practice this route orientation task. Let me play the task request for you and your task will begin when you hear the words “Please begin now.” You will not need to say the word “Done” when you are finished, because the recording will let you know when the task is done. <Play task request>
Criterion Trial
Prepare to monitor and record whether each of the nine task parts is successfully completed or not. Let’s do it one more time. This time I will be recording whether or not the task is successfully completed. Ready? <Play task request> Note any special codes or comments.
Repeat criterion trial if task was not fully successful and re-verify task setup states.
This may be done up to three times (recording success of attempt each time). Go on to the next task if successful completion achieved or three criterion trials run.

Appendix G Task Training Protocol
G-16
Scoring Key: Score as Y if all nine orientations are correctly identified, P if one to eight of the orientations are correct, and N if none of the orientations are correct.

Appendix G Task Training Protocol
G-17
Task 8: Voice-dial Cell Phone
Setup
Check that cell phone is ON Check that phone is face open and placed in the cup holder with the headset cord
attached to the phone Write down participant’s 10-digit phone number on paper to verify correct dialing
Explanation of Task
Have you ever used voice dialing before? In this task we will practice dialing your home telephone number using a voice recognition system with the same cell phone as the one in the manual dial task. However, this time we shall use it with a hands-free device. To make a call, press * and then TALK to connect with the voice recognition system. The system will say “Ready” and you will then say “Call” followed by the number, digit by digit, of your home telephone number. You must wait for the system to say “Ready” before you begin speaking the number you wish to dial. It will expect you to speak the digits of your phone number continuously, as if telling the phone number to a friend. The system will repeat the number it heard you say. If it understood you correctly, say “Yes” or “Correct.” If the system did not understand you correctly, say “No” or “Cancel.” You may also say “Cancel” at any time to reset the system so it says “Ready” and you can begin again. Remember to always wait for the word “Ready” before telling the system the number to call. Once the system has understood you correctly and says “Dialing” say, “Done” and press the END button on the phone so that it does not ring through.
Demonstration of Task
Let me show you how to do this task now. The task request may say, “Your task is to call home by voice-dialing the phone. Please begin now.” I first would need to connect to the voice recognition system by pressing * TALK. I would wait for the tone and then hear the word “Ready.” Then I would say “Call two four eight eight four eight nine five nine five.” The system would then repeat the number back to me. If that number was correct I would say “Yes” or “Correct.” If the number were incorrect I would say “No” or “Cancel” and then wait for the system to say “Ready” again. I would then attempt the number again by saying, “Call” and then saying the number, repeating as necessary until the system understood me correctly. Once the system said “Dialing,” I would say, “Done” and press the END button on the phone. Simply closing the phone does not end the call. Okay, do you have any questions?

Appendix G Task Training Protocol
G-18
Practice
Now I would like you to practice voice dialing the phone to call home. Let me play the task request for you and you may proceed on the word “Now” when you hear the words “Please begin now.” Remember to say the word “Done” when you are finished. <Play task request> (You may need to prompt them, “Now press * TALK and begin your call.”) Any questions? Now I would like you to voice-dial your home phone again, only this time I would like you to practice saying the word “Cancel” to cancel the call. Do this after the system speaks back the number it understood you to have dialed. Just say “Cancel” at that time.
Criterion Trial
Let’s do it one more time. This time I will be recording whether or not the task is successfully completed. Ready? <Play task request> Note any special codes or comments.
Repeat criterion trial if task was not fully successful and re-verify task setup states.
This may be done up to three times (recording success of attempt each time). Go on to the next task if successful completion achieved or three criterion trials run.
<When scoring, press the TALK button twice to see the last number dialed>
Scoring Key: Score as Y if number is correctly dialed, P if error is made but recovered from and goal state is reached, and N if number is not correctly dialed.

Appendix G Task Training Protocol
G-19
Task 9: Book-on-Tape Listen & Task 19: Book-on-Tape Paraphrase
Setup
None <Experimenter’s Note: This task actually consists of two subtasks, a listen subtask and a summarize subtask. As the listen subtask comes to an end, you will always hear the story ending with a question . . . as you hear the question, you should mark the listen task “Done.”>
Explanation of Task
The next task we will practice is called a Book-on-Tape task. In this task you will listen to a recorded story from a collection of short stories called, Two-Minute Mysteries by Donald Sobol. These stories all involve a Sherlock-Holmes-type detective named Dr. Haledjian. We ask that you listen to the story closely enough to be able to retell it. When it has finished playing, you will NOT be asked to solve the mystery. Instead, you will be asked to summarize or retell the story that you just heard. Let’s try an example to get an idea of the stories and the task requests. Demonstration of Task Let me show you how to do this task now. The first task request will be, “Your task is to listen to this book-on-tape selection. Please begin now.” Here I would listen carefully to the story on the tape – I won’t play it right now, but I would listen and remember main events in the plot, and main characters, so that I could retell the story. When the story ended, I would wait for the second task request. The second task request will be, “Your task to summarize, in your own words, the passage you just heard. Please begin now.” Here I would summarize the story – describing the major things that happened, and the main characters in the story. And then I would say “Done.” Practice Now I would like you to practice this book-on-tape task. Let me play the task request for you and your task will begin when you hear the words “Please begin now.” <Play task request> You may begin to summarize the story after you hear “Your task is to summarize, in your own words, the passage you just heard. Please begin now.”

Appendix G Task Training Protocol
G-20
Criterion Trial Let’s do it one more time. This time I will be recording whether or not the task is successfully completed. Ready? <Play task request> You may begin to summarize the story after you hear, “Your task is to summarize, in your own words, the passage you just heard. Please begin now.” Note any special codes or comments.
Repeat criterion trial if task was not fully successful and re-verify task setup states.
This may be done up to three times (recording success of attempt each time). Go on to the next task if successful completion achieved or three criterion trials run. Note: If the summary needs to be improved, coach the participant on the kinds of things they could/should be retelling.
Scoring Key: Score as Y if a reasonable summary is provided, P if a very sketchy summary is provided (or if some elements are incorrectly summarized), and N if no summary is provided or if the summary is entirely incorrect.

Appendix G Task Training Protocol
G-21
Task 10: Just Drive
Setup
None
Explanation of Task
While driving in a driving simulator, or while driving on the road, we will occasionally ask you to drive and maintain your lane position, speed, and headway appropriately, and to monitor the roadway for objects and events just as you normally would when you drive. During this time you will not be asked to perform any other additional tasks. At the end of the task the recording will say “We are done” indicating the end of the task.
Demonstration of Task
I won’t do a demonstration of this now. However, I would like to play the task request for you as practice (so that you know what the request will sound like).
Practice
Just as before, when you hear the words “Please begin now,” you would proceed with just driving. You will be on the road or in the driving simulator when this task is presented to you. <Play task request>
Criterion Trial
None

Appendix G Task Training Protocol
G-22
Task 11: Biographical Q&A
Setup
None Explanation of Task
The next task is called the Question and Answer task, and the task request will ask you a total of thirteen questions that you will have to answer. The questions are similar to ones that a travel companion may ask you on a drive. Please limit your answers to a short sentence.
Demonstration of Task
The task request might say, “Your task is to answer the following questions. Please begin now.” The first question might be, “Where were you born?” And I would say, “Michigan.” The next question might then be, “What’s your favorite sport?” And I would say, “Baseball.” And so on. At the end of the dialog, you will hear a message, “We are done.”
Practice
Now I would like you to practice this Question and Answer task. Let me play the task request for you and your task will begin when you hear the words “Please begin now.” <Play task request>
Criterion Trial
Let’s do it one more time. This time I will be recording whether or not the task is successfully completed. Ready? <Play task request> Note any special codes or comments.
Repeat criterion trial if task was not fully successful and re-verify task setup states.
This may be done up to three times (recording success of attempt each time). Go on to the next task if successful completion achieved or three criterion trials run.
Scoring Key: Score as Y if a reasonable response is provided, P if one or more questions are not answered, and N if none of the questions are answered

Appendix G Task Training Protocol
G-23
Task 12: Route Instructions
Setup
None Explanation of Task The next task is called Route Instructions. The task will require you to listen, remember, and then re-tell directions to get to a certain place. When the task begins, you will be asked to remember two street names and two turns along with the destination, which you will then be asked to repeat. Each of these route instructions will have four such sets. After you repeat the fourth set of instructions you will hear the message “We are done” to signal the end of task.
Demonstration of Task
Let me demonstrate. <Play task request> “Your task is to listen to some route instructions for a set of errands we need to run today and then repeat them back to me. Please begin now.” “Today we need to take the dog to the vet, pick up some dry cleaning and pick up a friend from work. First, to take the dog to Pet Doctors, we take Main to 6th Avenue and make a left there. Then we take 6th to Maple and turn right. Pet Doctors will be right there at the corner. Please repeat.” <Paraphrase back> “Next we will go to pick up the dry cleaning. To get to the cleaners, take Maple to Gilmore and turn right. Follow Gilmore to Clermont and take a left. The dry cleaners will be just beyond your turn. Please repeat.” <Paraphrase back> Our last stop is to pick up a friend from work. Take College Street to the light and make a left onto Birch Street. Take Birch until you reach Beach Lane and make a right turn. Our friend will be waiting for us on the corner there. Please repeat.” <Paraphrase back> You would then hear, “We are done.” Okay, do you have any questions about that task?
Practice
Now I would like you to practice this route instructions task. Let me play the task request for you and your task shall begin when you hear the words “Please begin now.” <Play task request>
Criterion Trial
Let’s do it one more time. This time I will be recording whether or not the task is successfully completed. Ready? <Play task request>

Appendix G Task Training Protocol
G-24
Note any special codes or comments.
Repeat criterion trial if task was not fully successful and re-verify task setup states.
This may be done up to three times (recording success of attempt each time). Go on to the next task if successful completion achieved or three criterion trials run.
Scoring Key: Score as Y if reasonable responses are provided, P if one or more turns, streets, or features are not answered, and N if none of the turns, streets, or features are answered.

Appendix G Task Training Protocol
G-25
Task 13: Sports Broadcast
Setup
None Explanation of Task This task involves trying to listen to a typical sports broadcast in order to find out who won a specific game and which teams played. You will be prompted to listen for a baseball team before the broadcast, and you have to remember who played against this team and who won the game. After the broadcast, the experimenter will ask you who played against the team and who won. The task will end after you say aloud the answer.
Demonstration of Task
Let me show you how to do this task now. <Play task request> “Your task is to listen to this sport broadcast and find out who the Orioles played and who won. Please begin now.”
• The Cubbies continued their streak by blowing away the Padres 7-1 in San Diego.
• On the opposite side of the country, Boston put away the Angels 4-2 at home.
• Last night the A’s rallied in the 8th to avoid a sweep by the Indians in Oakland. The final score was 6-4 after Ellis hit a double to send Long and Myers home.
• Bonds returned last night with a bang, but could not put a stop to the Phillies in the Giants’ 6-8 loss. Bonds’ solo homer in the 5th was his career 596th.
• The Rangers slugged their way to a 17-6 thrashing of the Yankees. Texas had an amazing 6 doubles in the 2nd- a feat that last occurred in the AL in 1982.
• The Tigers finished a three-game sweep against the Royals in Kansas City with a score of 5-2.
• The Cards finally snapped a 4-game losing skid against the Marlins with a score of 3-1.
• Moyer spearheaded the Mariners 2-hit shutout over the Twins with final score of 4-0.
• The Reds edged Montreal 2-1. The only runs were scored in the 3rd inning.
• In Pirates-Mets action last night, Pittsburgh cleaned up with a 7-2 win.
• The Orioles pounded the Rays in a 13-0 blowout. Baltimore scored 6 runs in the first inning at Tropicana Field.

Appendix G Task Training Protocol
G-26
• The Red Sox blew their lead in the 9th and fell to Texas in the 10th. The outcome was 3-2.
• The Phillies won in 11, as the Marlins ran out of options, 7-6.
At the end of the task the experimenter shall ask you, “Who did the Orioles play and who won?” to which you should answer, “The Orioles played the Rays and the Orioles won.” Do you have any questions? Okay, then, I would like you to practice this task. Are you ready? Practice Now I would like you to practice this sports broadcast task. Let me play the task request for you and your task will begin when you hear the words “Please begin now.” <Play task request> Criterion Trial Let’s do it one more time. This time I will be recording whether or not the task is successfully completed. Ready? <Play task request> Note any special codes or comments.
Repeat criterion trial if task was not fully successful and re-verify task setup states.
This may be done up to three times (recording success of attempt each time). Go on to the next task if successful completion achieved or three criterion trials run.
Scoring Key: Score as Y if both pieces of information are correctly provided (who the team played and who won), P if one of the two are correctly provided, and N if neither piece of information is correct or if no correct information is provided.

Appendix G Task Training Protocol
G-27
Task 14: Radio Tune “Hard”
Setup - Note: This must be done PRIOR TO EVERY radio task.
Push Preset 1 (it should be set to 100.1 FM) Press AM band Press “OFF”
Explanation of Task As mentioned earlier, the radio/CD entertainment system will be used for multiple operations over the next couple of days. The first operation with this system was to tune the radio. Your second task will also be to tune the radio; however this task will be slightly different. Before we begin, let me point out the POWER knob to turn on/off the radio unit, the TUNE knob that will be used to tune to a requested radio frequency, and the FM button to switch to the FM band. As you turn the TUNE knob to the right, it adjusts the radio frequency upward and if you turn it to the left, it adjusts the radio frequency downward. Prior to this radio task, the radio will be turned OFF and the radio will be set to the AM band. Your task will involve turning ON the radio, switching to the FM band by pushing the FM button, and then tuning to a particular frequency by using the TUNE knob. Remember to say “Done” to indicate that you have completed the task.
Demonstration of Task
Let me show you how to do this task now. Your task request will be as follows, “Your task is to turn on the radio, switch to the FM band, and tune to 107.5. Please begin now.” When you hear the word “Now,,” reach for the POWER button on the radio unit and press it to turn it on. Then press the FM band button to switch to the FM band and then turn the tune knob to the right to tune the radio to 107.5 FM and say “Done” to indicate completion of task. Okay, do you have any questions?
Practice
Now I would like you to practice tuning the radio. Let me play the task request for you and you may proceed on the word “Now” when you hear the words “Please begin now.” Remember to say the word “Done” when you are finished. <Play task request> Criterion Trial Let’s do it one more time. This time I will be recording whether or not the task is successfully completed. Ready? <Play task request> Note any special codes or comments.

Appendix G Task Training Protocol
G-28
Repeat criterion trial if task was not fully successful and re-verify task setup states.
This may be done up to three times (recording success of attempt each time). Go on to the next task if successful completion achieved or three criterion trials run.
Scoring Key: Score as Y if frequency is correctly set, and N if it is not correctly set.

Appendix G Task Training Protocol
G-29
Task 16: CD Insertion Task Setup
Push EJECT button to make sure there is no CD in the player Check that the radio/entertainment system is turned OFF Check that all CDs are in visor wallet in proper sequence
Explanation of Task The third task that will use the radio/CD entertainment unit, will involve the use of the CD player. Your task will involve retrieving the requested CD from the CD visor above your head and then inserting it into the open slot in the unit. When a CD is inserted, the unit automatically turns on and reads the disc. Once read, the number 1 shows up on the display and you can use the SEEK/TRACK button to play the correct track. Once you have reached the correct track say “Done” to signal the end of task. Also, you will find that it is easiest to remove the CDs from the visor wallet by using a slide-and-grasp technique. First, slide it a little to the right, then grasp it and pull it out. Demonstration Having already mentioned the task let me show you how I want you to perform it by doing it myself. After hearing the task command, and the words “Please begin now” I would reach up to the visor wallet, and find the black CD and then I would slip it out of the wallet, and reach over to insert the CD. Once the CD is in the system, I would move my hand to this SEEK/TRACK button and push repeatedly to get to Track 7. Each time that I push, I would check the display readout to determine what track it’s on. I would continue to do this until “7” is displayed on the unit. At that point, I would say the “Done” to signal completion of task. Practice <Eject CD, and turn system off> Now I would like you to practice doing the task. Let me play the task request for you and you may proceed on the word “Now” when you hear the words “Please begin now.” Remember to say “Done” after you finish. <Play task request> Okay, good. <Offer any coaching that may be needed> Do you have any questions? Criterion Trial Also, prepare to monitor and record whether task is successfully completed or not. <Eject CD and turn system off> Let’s do it one more time. This time I will be recording whether or not the task is successfully completed. Ready? <Play task request>

Appendix G Task Training Protocol
G-30
Note any special codes or comments.
Repeat criterion trial if task was not fully successful and re-verify task setup states.
This may be done up to three times (recording success of attempt each time). Go on to the next task if successful completion achieved or three criterion trials run.
Scoring Key: Score as Y if correct CD is inserted and correct track is selected, P if the wrong CD is correctly inserted & proper track selected, and if the correct CD is inserted, but wrong track is selected.
Otherwise score N.

Appendix G Task Training Protocol
G-31
Task 17: Route Tracing Setup
Have a felt tip pen open and the open end in the cup-holder Have correct maze (correct according to task orderings) on top of the coin holder
and covered Explanation of Task The next task to practice will be the Route Tracing task. You will be provided with a maze through which you will need to draw a continuous line without crossing any solid lines. The maze sheet will be placed on the cup-holder and the pen will be placed in the cup-holder with the cap removed and the tip pointing down. Your task involves picking up the maze sheet and placing it at a position most comfortable for you to draw a line on it. All mazes will begin with the entrance at the top left and shall exit at the bottom right. You may backtrack on the maze if you reach a dead-end however you may not cross any solid lines to reach the exit. Remember to say “Done” when you exit the maze. Demonstration This is a maze similar to the ones you will be doing the next few days. When the task request says, “Your task is to draw a line through the printed maze. Please begin now,” you would start at the top left and draw a line through the maze and exit out the bottom right. If you hit a dead end then you can retrace your steps. Remember to say “Done” when you exit the maze. Practice I have a practice maze for you to do. Before we begin, do you have any questions? I’m first going to play the task request, then, I would like you to start the task. Once you have completed the maze, I’d like you to say, “Done.” Are you ready? <Play task request> Criterion Trial I’d like you to trace one more maze. This time I will be recording whether you complete the task successfully. Are you ready? <Play task request> Note any special codes or comments.
Repeat criterion trial if task was not fully successful and re-verify task setup states.
This may be done up to three times (recording success of attempt each time). Go on to the next task if successful completion achieved or three criterion trials run.
Scoring Key: Score as Y if maze is correctly completed. Otherwise score N.

Appendix G Task Training Protocol
G-32
Task 18: Delta Flightline Setup
Phone turned ON, face open in the cup-holder. Delta preprogrammed in Sprint Voice Command (1-800-325-1999)
Explanation of Task Have you ever retrieved flight information using a voice recognition system? Your task will involve calling Delta Airline’s automated voice recognition system and retrieve the arrival time for a particular flight. You will be provided with the departure city, arrival city, day of the flight, and approximate departure time and I would like you to listen for and remember the arrival time for the flight. The voice recognition system works best if you speak clearly and naturally. I have a diagram here of the menu choices you will be making during this call. To make a call, press * TALK on the cell phone and once the system says “Ready” say, “Call Delta.” The system will then call Delta Flightline. It will say “Welcome” and give you the option for receiving instructions. You may say the departure city at any time. The system will then ask you for the arrival city. After you say the arrival city, Flightline will ask if it heard you correctly and read back the departure and arrival cities. If it is incorrect, say “No” and it will ask whether the departure or arrival city is incorrect. If it is correct, say “Yes.” The system will then ask whether you are interested in departure or arrival times. Because you are searching for a flight with a particular departure time, say “Departure.” You will then be asked whether the flight is today. At this point you can simply say “Tomorrow.” We ask that you always look up tomorrow’s flight information. Flightline will now ask for the approximate departure time. After you say the time, it will ask whether that time is in the morning, afternoon, or evening. Now you have answered all the questions Delta needs to find the flight. It will read back to you the departure and arrival information, including time, gate and flight number. We ask that you remember the arrival time for the flight and repeat it aloud. After you have said the actual arrival time aloud, please press the END button, and then say “Done.” Some helpful phrases that you may use at any time are “Start Over” which brings you back to the top of the Delta Flightline menu and asks for the departure city again, “Help” will give you tips as to what information the system needs, and “Repeat” if you didn’t hear the last instruction the system said. Demonstration Let me show you how to get flight information using the voice recognition system. <Play task request> Practice Are you ready to have a try? I will first play the task request you will hear each time we want you to use the Delta Flightline. Then I would like you to call and complete the requested task. If you have any questions along the way, please feel free to ask. You will

Appendix G Task Training Protocol
G-33
have several chances to practice using this system, until you feel comfortable with it. <Play task request> “Your task is to voice-dial Delta Flightline to locate a flight departing from Cincinnati at 9:00 pm, heading to Albuquerque. Listen to the flight information that is given and repeat the arrival time in Albuquerque. Please Begin Now.” <10:11 p.m. is the correct answer> Now I would like you to try the task again and practice some of the commands you can use at any time, to see how they work, should you need them. At any time during the call to Delta Flightline, say “Start Over,” “Repeat” and “Help.” I would like you to try all these possible commands so you can see how the system reacts to them. <Play task request> Do you have any questions? Criterion Trial I’d like you to call Delta Flightline and find the arrival time of a certain flight. This time I will be recording whether you complete the task successfully. Are you ready? Ok, let me play the request now. <Play task request> Note any special codes or comments.
Repeat criterion trial if task was not fully successful and re-verify task setup states.
This may be done up to three times (recording success of attempt each time). Go on to the next task if successful completion achieved or three criterion trials run.
Scoring Key: Score as Y if arrival time is correctly reported N if they are not able to give the correct arrival time

Appendix G Task Training Protocol
G-34
Using cell phone dial * TALKand say “Call Delta”
Listen to the welcome message
InstructionsFlight
NumberSay Departure
City
Say Arrival City
Confirm Departureand Arrival Cities
Say “Correct”Say “Incorrect”
Do you have arrival ordeparture information?
Say “Departure” Arrival
What Day?
Say “Tomorrow”
ApproximateTime?
Say “Afternoon”Say “Morning” Say “Evening”
Listen to Departure/Arrival Time/Location, Flight, andGate Number
Remember Arrival Time, Repeat Aloud the time, andsay “Done”

Appendix G Task Training Protocol
G-35
Task 19: Book-on-Tape Paraphrase This task is a follow-on task of the Book-on-Tape Listen Task and has been described in that task. See the task description presented earlier in this section along with Task 9 Book-On-Tape Listen.

Appendix G Task Training Protocol
G-36
Task 22: Destination Entry Setup
Navigation system should be turned ON with database CD loaded (if CD is not loaded there will be an error message)
First two screens should be cleared (the warning screens need not appear to participant). Do this by pressing enter.
Press <Menu> button to return screen to main menu (start point) Stimulus material with the address must be ready and covered
Explanation of Task Have you ever used a navigation system before? Our next task will involve entering an address into a navigation system. We are going to be asking you to use one particular function of this system for entering destinations. It is called the scrolling list function. There are several buttons on the front of this display that you will have to press to enter the destination. Mostly, you will be using the four arrow keys and the enter button. Your task command will ask you to read an address from a paper that will be located on the cup-holder and enter it into the navigation system. Let me take you through a request step by step and you can ask any questions along the way. Demonstration For example, the task request would say “Your task is to enter an address into the navigation system using the scrolling-list function. Please begin now.” Read the address to be entered, 400 W. Jefferson Ave, Detroit, MI. Then the next step in this process would be to select ADDRESS/INTERSECTION from the main menu on the navigation screen. ADDRESS/INTERSECTION is selected by pressing the up or down arrows until it is highlighted (by default it is highlighted to begin with), and then pressing ENTER. This takes you to the next screen where you would be given the choice of entering a CITY NAME or a STREET NAME. We would like you to enter the CITY NAME first for all destinations. After pressing ENTER, you will see a screen of cities listed alphabetically. To scroll through this list, you can either use the up and down arrow buttons to move you one-by-one through the list, or you can press the left and right arrow buttons to move you to the next letter, in other words, pressing right when you are on a city that begins with “C” will take you to the first city that begins with “D.” Do you understand how the scrolling buttons work? After you have located the desired city, in this case Detroit, press ENTER to get to the street selection screen. If you accidentally press ENTER at the wrong city, you can go back to the menu by pressing BACK and then selecting the correct city. After you arrive at the street selection menu, you must use the same controls as you did in the city selection menu to choose the correct street name. The same controls include the up and down buttons for line-by-line movement and the right and left buttons for categorical or sectional movements. Once the desired street has been found, in this example, West Jefferson Avenue, press the ENTER key.

Appendix G Task Training Protocol
G-37
Now the system asks that you choose either an address range or an intersection. Because we have been given an address number and not a cross street, you will pick ADDRESS RANGE. The system will then let you know which address numbers are valid at the top of the screen and the desired address can be entered by using the up and down arrows to pick the first number, then the right arrow to go to the next number, and so on. Once the correct address number is entered, press ENTER and the system will ask for route details. You can then choose the QUICK AND SHORTEST TIME ROUTE option, then press ENTER and say “Done” to indicate completion of task. Practice Do you have any questions at this point? I’d like you to try the system on your own now. I will play the task request and I would like you to attempt to enter an address by scrolling. Remember that if you are stuck or have any questions, feel free to ask me. <Play task request> Ok, good. Do you feel comfortable with that? Let’s try a few more practices, and I’d like you to purposely make a mistake in selecting the city, street and street number. Just in case you make a mistake later today, it is important that you know how to recover and complete the address entry. I’m going to play another task request and I’d like you to start the task and make a few mistakes along the way to see what the system does and how you can get back on the right track. Feel free to take your time, make a few mistakes, and try to recover from them. Let me know if you have any questions. Are you ready to begin? <Play task request> Criterion Trial I’d like you to enter an address on the navigation system by scrolling one more time. This time I will be recording whether you complete the task successfully. Are you ready? Ok, let me play the request now. <Play task request> Note any special codes or comments.
Repeat criterion trial if task was not fully successful and re-verify task setup states.
This may be done up to three times (recording success of attempt each time). Go on to the next task if successful completion achieved or three criterion trials run. Scoring Key: Score as Y if destination is correctly entered.
Otherwise, score N.

Appendix G Task Training Protocol
G-38
Task 24: Read Text “Easy” Setup
Stimulus material with the correct Read Text “Easy” passage must be ready and covered
Explanation of Task Our next task to practice will involve reading a passage. A paper with the reading passage will be placed on the cup-holder and you will be asked to pick up the paper and read the passage silently. You will notice that there is a missing word in the passage and your task is to find a word that best fits in place of the missing word. There is often more than one word that could fit well into the blank, so do not agonize over whether the word you have in mind is the exactly the one the author intended. We are just looking for you to say something that works well in the blank, if you can think of such a word. If you cannot, then just say “skip” or “don’t know.” Here is a quick example. . . Remember the nursery rhyme, “Mary Had A Little Lamb?” Well in this task, the passage that we ask you to read might look like this:
Mary had a little lamb, whose fleece was white as snow. And everywhere that Mary went, the
_______ was sure to go.
You would read this to your self and say the word “lamb” when you came to the blank. Please be sure to read the entire passage silently, all the way through to the last word. Also, please do not try to guess the word that goes in the blank by just reading a few words. We want you to read the whole passage, say the missing word out loud, and then say “Done.” Demonstration Okay, let me show you a real example and demonstrate how I want you to perform this task. After hearing the task request and the words “Please begin now,” I would pick up the paper and would begin reading it silently to myself. When I come to the blank, I would think of a word that best fits in the blank and finish reading the rest of the sentence to make sure the missing word I have in mind is appropriate. Then I will say the word followed by “Done” and put the paper down. Practice Okay, now I would like you to practice the task. Let me play the task request for you and you may proceed on the word “Now” when you hear the words “Please begin now.” Remember to say “Done” after you finish. <Play task request> Okay, good. <Offer any coaching that may be needed> Do you have any questions?

Appendix G Task Training Protocol
G-39
Criterion Trial <Prepare to monitor and record whether task is successfully completed or not> Let’s do it one more time. This time I will be recording whether or not the task is successfully completed. Ready? <Play task request> Note any special codes or comments.
Repeat criterion trial if task was not fully successful and re-verify task setup states.
This may be done up to three times (recording success of attempt each time). Go on to the next task if successful completion achieved or three criterion trials run.
Scoring Key: Score as Y if appropriate words are said for the blank. Score as N if the subject’s response is incorrect or if they respond “Don’t knowithSkip”

Appendix G Task Training Protocol
G-40
Task 25: Read Text “Hard” Setup
Stimulus material with the correct Read Text “Hard” passage must be ready and covered
Explanation of Task This next task is very similar to the Read Text “Easy” task you just performed. The only difference in this task is that the reading passage provided to you is a little longer and may take slightly longer to read and to come up with the missing word. Like in the Read Text “Easy” task you will be provided with a reading passage and will be asked to read the passage silently and say out aloud the missing word then say “Done” to indicate completion of task. Again, I want to emphasize that you should try to fill in the blank with something that makes sense to you. There is often more than one word that could fit well into the blank, so do not agonize over whether the word you have in mind is the exactly the one the author intended. We are just looking for you to say something that works well in the blank, if you can think of such a word. If you cannot, then just say “skip” or “don’t know.” Please be sure to read the entire passage, all the way through to the last word. Also, please do not try to guess the word that goes in the blank by just reading a few words. Demonstration Okay, let me show you an example and demonstrate how I want you to perform this task. After hearing the task request and the words “Please begin now,” I would pick up the paper and would begin reading it silently to myself. When I come to the blank, I would think of a word that best fits in the blank and finish reading the rest of the sentence to make sure the missing word I have in mind is appropriate. Then I will say the word followed by “Done” and put the paper down. Practice Okay, now I would like you to practice the task. Let me play the task request for you and you may proceed on the word “Now” when you hear the words “Please begin now.” Remember to say “Done” after you finish. <Play task request> Okay, good. <Offer any coaching that may be needed> Do you have any questions? Criterion Trial <Prepare to monitor and record whether task is successfully completed or not> Let’s do it one more time. This time I will be recording whether or not the task is successfully completed. Ready? <Play task request> Note any special codes or comments.

Appendix G Task Training Protocol
G-41
Repeat criterion trial if task was not fully successful and re-verify task setup states.
This may be done up to three times (recording success of attempt each time). Go on to the next task if successful completion achieved or three criterion trials run.
Scoring Key: Score as Y if appropriate words are said for the blank. Score as N if the subject’s response is incorrect or if they respond “Don’t knowithSkip”

Appendix G Task Training Protocol
G-42
Task 28: Read Map “Easy” Setup
Stimulus material with the correct Read Map “Easy” map must be ready and covered
Explanation of Task The last two tasks we will practice will involve the use of a map book placed on the cup-holder. In the task request, you will be asked to find the relative cardinal directions between two locations on the map. When the task request says “Please begin now,” pick up the map and look for the first location on the map and then look for the second location on the map. Once the two locations have been identified find the relative cardinal direction between them and say it aloud, for example from point A to point B we will go north and east or south and west and say “Done” to indicate end of task. Demonstration Let me demonstrate how this task is to be done. I will pick up the map and look for the first location and then the second location and indicate the direction I need to take to get from one place to another and say “Done.” Practice I have a practice map task for you to try out. Before we begin, do you have any questions? I’m first going to play the task request, and then I would like you to start the task when you hear the words “Please begin now.” Once you have completed the task, I’d like you to say, “Done.” Are you ready? <Play task request> Criterion Trial Okay, now I’d like you to do the map task one more time. This time I will be recording whether you complete the task successfully. Are you ready? Ok, let me play the request now. <Play task request> Note any special codes or comments.
Repeat criterion trial if task was not fully successful and re-verify task setup states.
This may be done up to three times (recording success of attempt each time). Go on to the next task if successful completion achieved or three criterion trials run.
Scoring Key: Score as Y if the vocal response given by the subject is correct. Otherwise, score N.

Appendix G Task Training Protocol
G-43
Task 29: Read Map “Hard” Setup
Stimulus material with the correct Read Map “Hard” map must be ready and covered
Explanation of Task This task is very similar to the Read Map “Easy” task we just practiced. The task request will provide you with two new locations and ask you to indicate the relative cardinal directions to take to get from one location to another. The only difference in this map task is that there are more locations on the map than in the previous one, making the map a little more cluttered and requiring additional time to identify the locations. When the task request says “Please begin now,” pick up the map and look for the first location on the map and then look for the second location on the map. Once the two locations have been identified find the relative cardinal direction between them and say it aloud, for example from point A to point B we will go north and east or south and west and say “Done” to indicate end of task. Demonstration Let me demonstrate how this task is to be done. I will pick up the map and look for the first location and then the second location and indicate the direction I need to take to get from one place to another and say “Done.” Practice I have a practice map task for you to try out. Before we begin, do you have any questions? I’m first going to play the task request, then, I would like you to start the task when you hear the words “Please begin now.” Once you have completed the task, I’d like you to say, “Done.” Are you ready? <Play task request> Criterion Trial Okay, now I’d like you to do the map task one more time. This time I will be recording whether you complete the task successfully. Are you ready? Ok, let me play the request now. <Play task request> Note any special codes or comments.
Repeat criterion trial if task was not fully successful and re-verify task setup states.
This may be done up to three times (recording success of attempt each time). Go on to the next task if successful completion achieved or three criterion trials run.
Scoring Key: Score as Y if the vocal response given by the subject is correct. Otherwise, score N.

Appendix H Task Instructions
H-1
H Appendix H. Task Instructions This appendix contains the Task Instructions developed for the CAMP DWM Project, Task 2. The materials are presented as they were reported in Task 2.
During the DWM project study, participants received auditory instructions regarding each task performed. The instructions were recorded and this appendix presents the text of each task instruction recording used in the study.

Appendix H Task Instructions
H-2
DWM Task 2
Task Instructions
Driver Workload Metrics CAMP
IVI Light Vehicle Enabling Research Program

Appendix H Task Instructions
H-3
Introduction In this study, participants received auditory instructions regarding each task that was performed during both the testing and practice sessions. The instructions were recorded in an MP3 digital audio file and subsequently played to the participant prior to the execution of each task. This document presents the text of each task instruction recording that was used in the study. Table 1 below lists the 23 tasks used during testing, along with the total number of recordings made for each task. Note that the number of instruction recordings made for a task differs significantly across tasks. This is attributed to the nature of the task. For example, the Cassette task (i.e., insert cassette and play the specified side) has only two possible variants. The cassette can be inserted either to play Side A or to play Side B. In comparison, some of the other tasks involved the use of many stimulus variations and, consequently, multiple versions of the task instruction were required. The Delta Flightline and Map Reading tasks are examples of this latter situation.
Table 1. Total number of recordings per task
Task Number Task Name Total Number
of Recordings1 Coins 142 Cassette 23 HVAC 134 Radio Tune "Easy" 35 Manual Dial Cell Phone 16 Travel Computations 137 Route Orientation 138 Voice Dial Cell Phone 19 Book On Tape Listen 1410 Just Drive 111 Biographic Q&A 112 Route Instructions 1013 Sports Broadcast 914 Radio Tune "Hard" 316 CD Track 7 417 Route Tracing 118 Delta Flightline 1919 Book on Tape Paraphrase 122 Destination Entry 124 Read Text "Easy" 125 Read Text "Hard" 128 Read Map "Easy" 1429 Read Map "Hard" 14

Appendix H Task Instructions
H-4
For tasks such as Route Tracing, Destination Entry, Read Text “Easy,” and Read Text “Hard,” only one task instruction was recorded as the task required the use of paper stimulus materials that differed between trials. In the material that follows, the instructions used for practice and criterion trials for a given task are noted and listed first. Following the practice and criterion trial instructions are the remaining instructions used during the testing blocks. It should also be noted that italicized text appearing within the symbols “<…>” represents a directive about how the instruction should be recorded. For example, the directive “<Pause up to 4 sec>” appears numerous times in the instructions to allow the participant to answer a question. This material was not actually included as part of the MP3 recording.

Appendix H Task Instructions
H-5
Task 1: Coins Practice and Criterion Task: Coins 4 (Practice) Your task is to retrieve coins from the coin holder totaling 35 cents. Please begin now. Coins 1 Your task is to retrieve coins from the coin holder totaling 15 cents. Please begin now. Coins 2 Your task is to retrieve coins from the coin holder totaling 20 cents. Please begin now. Coins 3 Your task is to retrieve coins from the coin holder totaling 25 cents. Please begin now. Coins 5 Your task is to retrieve coins from the coin holder totaling 40 cents. Please begin now. Coins 6 Your task is to retrieve coins from the coin holder totaling 50 cents. Please begin now. Coins 7 Your task is to retrieve coins from the coin holder totaling 55 cents. Please begin now. Coins 8 Your task is to retrieve coins from the coin holder totaling 60 cents. Please begin now. Coins 9 Your task is to retrieve coins from the coin holder totaling 65 cents. Please begin now. Coins 10 Your task is to retrieve coins from the coin holder totaling 75 cents. Please begin now. Coins 11 Your task is to retrieve coins from the coin holder totaling 1 dollar. Please begin now. Coins 12 Your task is to retrieve coins from the coin holder totaling 1 dollar, 15 cents. Please begin now. Coins 13 Your task is to retrieve coins from the coin holder totaling 1 dollar, 25 cents. Please begin now. Coins 14 Your task is to retrieve coins from the coin holder totaling 1 dollar, 30 cents. Please begin now.

Appendix H Task Instructions
H-6
Task 2: Cassette Practice and Criterion Task: Cassette 1 (Practice) Your task is to remove the tape from this case and insert to play Side A. Please begin now. Cassette 1 Your task is to remove the tape from this case and insert to play Side A. Please begin now. Cassette 2 Your task is to remove the tape from this case and insert to play Side B. Please begin now.

Appendix H Task Instructions
H-7
Task 3: Heating, Ventilation, and Air-Conditioning (HVAC ) Practice and Criterion Task: HVAC 13 (Practice) Your task is to adjust the heating/air-conditioning system to maximum heat on our upper bodies at the fastest fan speed. Please begin now. HVAC 1 Your task is to adjust the heating/air-conditioning system so that it will moderately warm both our face and feet at a medium fan rate. Please begin now. HVAC 2 Your task is to adjust the heating/air-conditioning system to maximum cool on our feet at the fastest fan speed. Please begin now. HVAC 3 Your task is to adjust the heating/air-conditioning system so that it will maximally heat the windshield with the fan set to high. Please begin now. HVAC 4 Your task is to adjust the heating/air-conditioning system so that it will moderately cool our feet at medium fan speed. Please begin now. HVAC 5 Your task is to adjust the heating/air-conditioning system so that it will slightly heat the windshield at low fan speed. Please begin now. HVAC 6 Your task is to adjust the heating/air-conditioning system so that it will slightly cool both our face and feet at a low fan speed. Please begin now. HVAC 7 Your task is to adjust the heating/air-conditioning system so that it will moderately cool our upper bodies at the slowest fan speed. Please begin now. HVAC 8 Your task is to adjust the heating/air-conditioning system so that it will send maximally cold air to the windshield with the fan set to low speed. Please begin now. HVAC 9 Your task is to adjust the heating/air-conditioning system so that it will moderately warm our feet at low fan speed. Please begin now. HVAC 10 Your task is to adjust the heating/air-conditioning system so that it will maximally cool our face at a medium fan speed. Please begin now.

Appendix H Task Instructions
H-8
HVAC 11 Your task is to adjust the heating/air-conditioning system so that it will maximally heat both face and feet at a low fan speed. Please begin now. HVAC 12 Your task is to adjust the heating/air-conditioning system so that it will slightly heat the windshield at moderate fan speed. Please begin now.

Appendix H Task Instructions
H-9
Task 4: Radio Tune “Easy” Practice and Criterion Task: Radio Tune Easy 3 (Practice) Your task is to tune the radio to 101.9 FM. Please begin now. Radio Tune Easy 1 Your task is to tune the radio to 104.3 FM. Please begin now. Radio Tune Easy 2 Your task is to tune the radio to 97.1 FM. Please begin now.

Appendix H Task Instructions
H-10
Task 5: Manual Dial Cell Phone Practice and Criterion Task: Manual Dial Cell Phone (Practice) Your task is to call home by manually dialing the phone. Please begin now. Manual Dial Cell Phone 1 Your task is to call home by manually dialing the phone. Please begin now.

Appendix H Task Instructions
H-11
Task 6: Travel Computations Practice and Criterion Task: Travel Computation 13 (Practice) Your task is to help me with some trip computations. Let us begin now. Today we’re going to go from the city of Starburst to the city of Ogden, and then on to the city of Brightland. The first leg of our trip is 19 miles in length and the second leg is 45 miles in length. How far do we have to drive altogether? <Pause up to 4 sec for participant to answer the question and then continue with> <64 miles is the correct answer>
Also, on the first leg of our trip we have to pay an entrance toll of 51 cents, and on the second leg the toll is 39 cents. How much money in total will we need to pay the tolls? <Pause up to 4 sec> <90 cents is the correct answer>
If we travel at the posted speeds on each leg of our trip, it will take 42 minutes to go the first leg, and 38 minutes to go the second leg. How long must we travel altogether? <Pause up to 4 sec> <80 minutes is the correct answer> Okay, then, in terms of how much fuel we will need, it looks like we will need 9 gallons of fuel to drive the first leg of our trip and another 13 gallons of fuel for the second leg. How many gallons of fuel are we going to need for the trip? <Pause up to 4 sec> <22 gallons is the correct answer> We are done. Thank you. Travel Computation 1 Your task is to help me with some trip computations. Let us begin now. Today we are going from the city of Belden to the city of Caribou, and then on to the city of Ridgemont. The first leg of our trip is 28 miles in length and the second is 36 miles in length. How far do we have to travel altogether? <Pause up to 4 sec for participant to answer the question and then continue with> <64 miles is the correct answer>
Also, on the first leg of our trip the entrance toll is 38 cents, and on the second the toll is 23 cents. How much money in total will we need to pay the tolls? <Pause up to 4 sec> <61 cents is the correct answer>
If we travel at the posted speeds on our trip, it will take 28 minutes to go the first leg, and 44 minutes to go the second leg. How long must we travel altogether? <Pause up to 4 sec> <72 minutes is the correct answer> Okay, then, in terms of how much fuel we will need, it looks like we will need 15 gallons of fuel to drive the first leg of our trip and another 6 gallons of fuel for the second. How many gallons of fuel are we going to need for the trip? <Pause up to 4 sec> <21 gallons is the correct answer> We are done. Thank you. Travel Computation 2 Your task is to help me with some trip computations. Let us begin now. Today we are going from the city of Dixon to the city of Wayne, and then on to the city of Creston. The first leg of our trip is 17 miles in length and the second leg is 34 miles in length. How far do we have

Appendix H Task Instructions
H-12
to drive altogether? <Pause up to 4 sec for participant to answer the question and then continue with> <51 miles is the correct answer>
Also, on the first leg of our trip the entrance toll is 41 cents, and on the second the toll is 19 cents. How much money in total will we need to pay the tolls? <Pause up to 4 sec> <60 cents is the correct answer>
If we travel at the posted speeds on our trip, it will take 65 minutes to go the first leg, and 16 minutes to go the second leg. How long must we travel altogether? <Pause up to 4 sec> <81 minutes is the correct answer> All right, then, in terms of how much fuel we will need, it looks like we will need 12 gallons of fuel to drive the first leg of our trip and another 9 gallons of fuel for the second. How many gallons of fuel are we going to need for the trip? <Pause up to 4 sec> <21 gallons is the correct answer> We are done. Thank you. Travel Computation 3 Your task is to help me with some trip computations. Let us begin now. Today, we are going to the city of Sterling to the city of Fremont, and then on to the city of Amherst. The first leg of our trip is 43 miles in length and the second is 48 miles in length. How far do we have to drive altogether? <Pause up to 4 sec for participant to answer the question and then continue with> <91 miles is the correct answer>
Also, on the first leg of our trip the entrance toll is 59 cents, and on the second the toll is 21 cents. How much money in total will we need to pay the tolls? <Pause up to 4 sec> <80 cents is the correct answer>
If we travel at the posted speeds on our trip, it will take 39 minutes to go the first leg, and 38 minutes to go the second leg. How long must we travel altogether? <Pause up to 4 sec> <77 minutes is the correct answer> Okay, then, in terms of how much fuel we will need, it looks like we will need 8 gallons of fuel to drive the first leg of our trip and another 13 gallons of fuel for the second. How many gallons of fuel are we going to need for the trip? <Pause up to 4 sec> <The correct answer is 21 gallons> We are done. Thank you. Travel Computation 4 Your task is to help me with some trip computations. Let us begin now. Today we’re going to the city of Oakwood to the city of Ogallala, and then on to the city of Steamboat Springs. The first leg of our trip is 33miles in length and the second leg is 27 miles in length. How far do we have to drive altogether? <Pause up to 4 sec for participant to answer the question and then continue with> <60 miles is the correct answer>
Also, on the first leg of our trip the entrance toll is 15 cents, and on the second leg the toll is 16 cents. How much money in total will we need to pay the tolls? <Pause up to 4 sec> <31 cents is the correct answer>

Appendix H Task Instructions
H-13
If we travel at the posted speeds on our trip, it will take 67 minutes to go the first leg, and 24 minutes to go the second. How long must we travel altogether? <Pause up to 4 sec> <91 minutes is the correct answer> All right, then, in terms of how much fuel we will need, it looks like we will need 19 gallons of fuel to drive the first leg of our trip and another 5 gallons of fuel for the second. How many gallons of fuel are we going to need for the trip? <Pause up to 4 sec> <24 gallons is the correct answer> We are done. Thank you. Travel Computation 5 Your task is to help me with some trip computations. Let us begin now. Today we’re going from the city of Crested Butte to the city of Dillon, and then on to the city of Westview. The first leg of our trip is 74 miles in length and the second is 9 miles in length. How far do we have to drive altogether? <Pause up to 4 sec for participant to answer the question and then continue with> <83 miles is the correct answer>
On the first leg of our trip the entrance toll is 57 cents, and on the second the toll is 14 cents. How much money in total will we need to pay the tolls? <Pause up to 4 sec> <71 cents is the correct answer>
If we travel at the posted speeds on our trip, it will take 82 minutes to go the first leg, and 9 minutes to go the second. How long must we travel altogether? <Pause up to 4 sec> <91 minutes is the correct answer> In terms of how much fuel we will need, it looks like we will need 21 gallons of fuel to drive the first leg of our trip and another 9 gallons of fuel for the second. How many gallons of fuel are we going to need for the trip? <Pause up to 4 sec> <30 gallons is the correct answer> We are done. Thank you. Travel Computation 6 Your task is to help me with some trip computations. Let us begin now. Today we’re going from the city of Evergreen to Estes Park, and then on to the city of Glenwood. The first leg of our trip is 68 miles in length and the second is 25 miles in length. How far do we have to drive altogether? <Pause up to 4 sec for participant to answer the question and then continue with> <93 miles is the correct answer>
Also, on the first leg of our trip the entrance toll is 75 cents, and on the second the toll is 16 cents. How much money in total will we need to pay the tolls? <Pause up to 4 sec> <91 cents is the correct answer>
If we travel at the posted speeds on our trip, it will take 73 minutes to go the first leg, and 17 minutes to go the second. How long must we travel altogether? <Pause up to 4 sec> <90 minutes is the correct answer>

Appendix H Task Instructions
H-14
Okay, then, in terms of how much fuel we will need, it looks like we will need 12 gallons of fuel to drive the first leg of our trip and another 18 gallons of fuel for the second. How many gallons of fuel are we going to need for the trip? <Pause up to 4 sec> <30 gallons is the correct answer> We are done. Thank you. Travel Computation 7 Your task is to help me with some trip computations. Let us begin now. Today we’re going from Tuba City to Grand Valley, and then on to Lakeview. The first leg of our trip is 54 miles in length and the second is 16 miles in length. How far do we have to drive altogether? <Pause up to 4 sec for participant to answer the question and then continue with> <70 miles is the correct answer>
Also, on the first leg of our trip the entrance toll is 26 cents, and on the second the toll is 15 cents. How much money in total will we need to pay the tolls? <Pause up to 4 sec> <41 cents is the correct answer>
If we travel at the posted speeds on our trip, it will take 52 minutes to go the first leg, and 9 minutes to go the second. How long must we travel altogether? <Pause up to 4 sec> <61 minutes is the correct answer> Okay, then, in terms of how much fuel we will need, it looks like we will need 16 gallons of fuel to drive the first leg of our trip and another 5 gallons of fuel for the second. How many gallons of fuel are we going to need for the trip? <Pause up to 4 sec> <21 gallons is the correct answer> We are done. Thank you. Travel Computation 8 Your task is to help me with some trip computations. Let us begin now. Today we’re going from the city of Lafayette to Nederland and then on to the city of Boulder. The first leg of our trip is 29 miles in length and the second is 33 miles in length. How far do we have to drive altogether? <Pause up to 4 sec for participant to answer the question and then continue with> <62 miles is the correct answer>
Also, on the first leg of our trip the entrance toll is 37 cents, and on the second leg the toll is 23 cents. How much money in total will we need to pay the tolls? <Pause up to 4 sec> <60 cents is the correct answer>
If we travel at the posted speeds on our trip, it will take 21 minutes to go the first leg, and 29 minutes to go the second leg. How long must we travel altogether? <Pause up to 4 sec> <50 minutes is the correct answer> Okay, then, in terms of how much fuel we will need, it looks like we will need 3 gallons of fuel to drive the first leg of our trip and another 19 gallons of fuel for the second. How many gallons of fuel are we going to need for the trip? <Pause up to 4 sec> <22 gallons is the correct answer> We are done. Thank you.

Appendix H Task Instructions
H-15
Travel Computation 9 Your task is to help me with some trip computations. Let us begin now. Today we’re going from the city of Hastings to the city of Columbus , and then on to the city of Skyler. The first leg of our trip is 73 miles in length and the second is 8 miles in length. How far do we have to drive altogether? <Pause up to 4 sec for participant to answer the question and then continue with> <81 miles is the correct answer>
Also, on the first leg of our trip the entrance toll is 49 cents, and on the second the toll is 12 cents. How much money in total will we need to pay the tolls? <Pause up to 4 sec> <61 cents is the correct answer>
If we travel at the posted speeds on our trip, it will take 76 minutes to go the first leg, and 15 minutes to go the second leg. How long must we travel altogether? <Pause up to 4 sec> <91 minutes is the correct answer> Okay, then, in terms of how much fuel we will need, it looks like we will need 13 gallons of fuel to drive the first leg of our trip and another 8 gallons of fuel for the second. How many gallons of fuel are we going to need for the trip? <Pause up to 4 sec> <21 gallons is the correct answer> We are done. Thank you. Travel Computation 10 Your task is to help me with some trip computations. Let us begin now. Today we’re going from Central City to the city of Blackhawk, and then on to the city of Hayes. The first leg of our trip is 22 miles in length and the second is 39 miles in length. How far do we have to drive altogether? <Pause up to 4 sec for participant to answer the question and then continue with> <61 miles is the correct answer>
Also, on the first leg of our trip the entrance toll is 11 cents, and on the second the toll is 29 cents. How much money in total will we need to pay the tolls? <Pause up to 4 sec> <40 cents is the correct answer>
If we travel at the posted speeds on our trip, it will take 18 minutes to go the first leg, and 33 minutes to go the second. How long must we travel altogether? <Pause up to 4 sec> <51 minutes is the correct answer> In terms of how much fuel we will need, it looks like we will need 6 gallons of fuel to drive the first leg of our trip and another 16 gallons of fuel for the second. How many gallons of fuel are we going to need for the trip? <Pause up to 4 sec> <22 gallons is the correct answer> We are done. Thank you. Travel Computation 11 Your task is to help me with some trip computations. Let us begin now. Today we’re going to go from Shanty Creek to Lofgren, and then on to Laurel. The first leg of our trip is 45 miles in length and the second is 26 miles in length. How far do we have to drive altogether?

Appendix H Task Instructions
H-16
<Pause up to 4 sec for participant to answer the question and then continue with> <71 miles is the correct answer>
Also, on the first leg of our trip the entrance toll is 34 cents, and on the second the toll is 17 cents. How much money in total will we need to pay the tolls? <Pause up to 4 sec> <51 cents is the correct answer>
If we travel at the posted speeds on our trip, it will take 42 minutes to go the first leg, and 28 minutes to go the second. How long must we travel altogether? <Pause up to 4 sec> <70 minutes is the correct answer> Okay, then, in terms of how much fuel we will need, it looks like we will need 19 gallons of fuel to drive the first leg of our trip and another 4 gallons of fuel for the second. How many gallons of fuel are we going to need for the trip? <Pause up to 4 sec> <23 gallons is the correct answer> We are done. Thank you. Travel Computation 12 Your task is to help me with some trip computations. Let us begin now. Today we’re going from the city of Shawnee to Castle Rock, and then on to Sandstone City. The first leg of our trip is 54 miles in length and the second is 17 miles in length. How far do we have to drive altogether? <Pause up to 4 sec for participant to answer the question and then continue with> <71 miles is the correct answer>
Also, on the first leg of our trip the entrance toll is 35 cents, and on the second the toll is 16 cents. How much money in total will we need to pay the tolls? <Pause up to 4 sec> <51 cents is the correct answer>
If we travel at the posted speeds on our trip, it will take 32 minutes to go the first leg, and 8 minutes to go the second. How long must we travel altogether? <Pause up to 4 sec> <40 minutes is the correct answer> Okay, then, in terms of how much fuel we will need, it looks like we will need 11 gallons of fuel to drive the first leg of our trip and another 9 gallons of fuel for the second. How many gallons of fuel are we going to need for the trip? <Pause up to 4 sec> <20 gallons is the correct answer> We are done. Thank you.

Appendix H Task Instructions
H-17
Task 7: Route Orientation Practice and Criterion Task: Route Orientation 13 (Practice) Your task is to listen to this travel route and tell me the direction in which we will be headed after each turn. Please begin now.
We will first head south and make a left turn. What direction are we heading? <Pause up to 4 sec for participant to answer the question and then continue with> <East is the correct answer.>
Then after continuing, we will turn left again. What direction are we heading? <Pause up to 4 sec> <North is the correct answer>
Continuing on, at the next junction we turn right. What direction are we heading? <Pause up to 4 sec> <East is the correct answer>
Okay, then we go straight and make a right turn at the next junction. What direction are we heading? <Pause up to 4 sec> <South is the correct answer>
Then our next turn is to the left. What direction are we heading? <Pause up to 4 sec> <East is the correct answer>
That road takes us to our next turn, which is to the left. What direction are we heading? <Pause up to 4 sec> <North is the correct answer>
Then after several miles, we turn left again. What direction are we heading? <Pause up to 4 sec> <West is the correct answer>
Then again we travel for awhile until we reach a junction and we turn left. What direction are we heading? <Pause up to 4 sec> <South is the correct answer>
We go straight and our next turn is to the right. What direction are we heading? <Pause up to 4 sec> <West is the correct answer>
Then we turn right again. What direction are we heading? <Pause up to 4 sec> <North is the correct answer>
Following that road, we turn left at the next junction. What direction are we heading? <Pause up to 4 sec> <West is the correct answer>
Finally, our last turn is to the left. What direction are we heading? <Pause up to 4 sec> <South is the correct answer> We are done. Thank you very much.

Appendix H Task Instructions
H-18
Route Orientation 1 Your task is to listen to this travel route and tell me the direction in which we will be headed after each turn. Please begin now.
We will first head north and make a right turn. What direction are we heading then? <Pause up to 4 sec for participant to answer the question and then continue with> <East is the correct answer>
Then after continuing, we will turn right again. What direction are we heading then? <Pause up to 4 sec> <South is the correct answer>
Continuing on, at the next junction we turn left. What direction are we heading then? <Pause up to 4 sec> <East is the correct answer>
Okay, then we go straight and make a left turn at the next junction. What direction are we heading then? <Pause up to 4 sec> <North is the correct answer>
Then our next turn is to the right. What direction are we heading then? <Pause up to 4 sec> <East is the correct answer>
That road takes us to our next turn, which is to the right. What direction are we heading then? <Pause up to 4 sec> <South is the correct answer>
Then after several miles, we turn right again. What direction are we heading then? <Pause up to 4 sec> <West is the correct answer>
Then again we travel for a while until we reach a junction and we turn right. What direction are we heading then? <Pause up to 4 sec> <North is the correct answer>
We go straight and our next turn is to the left. What direction are we heading then? <Pause up to 4 sec> <West is the correct answer> We are done. Thank you very much.
Route Orientation 2
Your task is to listen to this travel route and tell me the direction in which we will be headed after each turn. Please begin now.
We will first head east and make a right turn. What direction are we heading then? <Pause up to 4 sec for participant to answer the question and then continue with> <South is the correct answer>
Then after continuing, we will turn left again. What direction are we heading then? <Pause up to 4 sec> <East is the correct answer>

Appendix H Task Instructions
H-19
Continuing on, at the next junction we turn left. What direction are we heading then? <Pause up to 4 sec> <North is the correct answer>
Then we go straight and make a right turn at the next junction. What direction are we heading then? <Pause up to 4 sec> <East is the correct answer>
Then our next turn is to the right. What direction are we heading then? <Pause up to 4 sec> <South is the correct answer>
That road takes us to our next turn, which is to the right. What direction are we heading then? <Pause up to 4 sec> <West is the correct answer>
Then after several miles, we turn right again. What direction are we heading then? <Pause up to 4 sec> <North is the correct answer>
Then again we travel for awhile until we reach a junction and we turn left. What direction are we heading then? <Pause up to 4 sec> <West is the correct answer>
We go straight and our next turn is to the left. What direction are we heading then? <Pause up to 4 sec> <South is the correct answer> We are done. Thank you.
Route Orientation 3 Your task is to listen to this travel route and tell me the direction in which we will be headed after each turn. Please begin now.
We will first head south and make a left turn. What direction are we heading then <Pause up to 4 sec for participant to answer the question and then continue with> East is the correct answer>
Then after continuing, we will turn left again. What direction are we traveling then? <Pause up to 4 sec> <North is the correct answer>
Continuing on, at the next junction we turn right. What direction are we heading then? <Pause up to 4 sec> <East is the correct answer>
Okay, then we go straight and make a right turn at the next junction. What direction are we heading then? <Pause up to 4 sec> <South is the correct answer>
Then our next turn is to the right. What direction are we heading then? <Pause up to 4 sec> <West is the correct answer>
That road takes us to our next turn, which is to the right. What direction are we heading then? <Pause up to 4 sec> <North is the correct answer>

Appendix H Task Instructions
H-20
Then after several miles, we turn left again. What direction are we heading then? <Pause up to 4 sec> <West is the correct answer>
Then again we travel for awhile until we reach a junction and we turn left. What direction are we heading then? <Pause up to 4 sec> <South is the correct answer>
We go straight and our next turn is to the right. What direction are we heading then? <Pause up to 4 sec> <West is the correct answer>
Then we turn right again. What direction are we heading then? <Pause up to 4 sec> <North is the correct answer> We are done. Thank you.
Route Orientation 4 Your task is to listen to this travel route and tell me the direction in which we will be headed after each turn. Please begin now.
We will first head east and make a left turn. What direction are we heading then? <Pause up to 4 sec for participant to answer the question and then continue with> <North is the correct answer>
Then after continuing, we will turn right. What direction are we heading then? <Pause up to 4 sec> <East is the correct answer>
Continuing on, at the next junction we turn right. What direction are we heading then? <Pause up to 4 sec> <South is the correct answer>
Then we go straight and make a right turn at the next junction. What direction are we heading then? <Pause up to 4 sec> <West is the correct answer>
Then our next turn is to the right. What direction are we heading then? <Pause up to 4 sec> <North is the correct answer>
That road takes us to our next turn, which is to the left. What direction are we heading then? <Pause up to 4 sec> <West is the correct answer>
Then after several miles, we turn left again. What direction are we heading then? <Pause up to 4 sec> <South is the correct answer>
Then again, we travel for awhile until we reach a junction and we turn right. What direction are we heading then? <Pause up to 4 sec> <West is the correct answer>
We go straight and our next turn is to the right. What direction are we heading then?

Appendix H Task Instructions
H-21
<Pause up to 4 sec> <North is the correct answer> We are done. Thank you. Route Orientation 5 Your task is to listen to this travel route and tell me the direction in which we will be headed after each turn. Please begin now.
We will first head north and make a right turn. What direction are we heading then? <Pause up to 4 sec for participant to answer the question and then continue with> <East is the correct answer>
Then after continuing, we will turn right again. What direction are we heading? <Pause up to 4 sec> <South is the correct answer>
Continuing on, at the next junction we turn right. What direction are we heading then? <Pause up to 4 sec> <West is the correct answer>
Okay, then we go straight and make a right turn at the next junction. What direction are we heading then? <Pause up to 4 sec> <North is the correct answer>
Then our next turn is to the left. What direction are we heading then? <Pause up to 4 sec> <West is the correct answer>
That road takes us to our next turn, which is to the left. What direction are we heading then? <Pause up to 4 sec> <South is the correct answer>
Then after several miles, we turn right again. What direction are we heading then? <Pause up to 4 sec> <West is the correct answer>
Then again we travel for awhile until we reach a junction and we turn right. What direction are we heading then? <Pause up to 4 sec> <North is the correct answer>
We go straight and our next turn is to the right. What direction are we heading then?
<Pause up to 4 sec> <East is the correct answer> We are done. Thank you. Route Orientation 6 Your task is to listen to this travel route and tell me the direction in which we will be headed after each turn. Please begin now.
We will first head east and make a right turn. What direction are we heading then? <Pause up to 4 sec for participant to answer the question and then continue with> <South is the correct answer>
Then after continuing, we will turn right again. What direction are we heading then? <Pause up to 4 sec> <West is the correct answer>

Appendix H Task Instructions
H-22
Continuing on, at the next junction we turn right. What direction are we heading then? <Pause up to 4 sec> <North is the correct answer>
Okay, then we go straight and make a left turn at the next junction. What direction are we heading then? <Pause up to 4 sec> <West is the correct answer>
Then our next turn is to the left. What direction are we heading then? <Pause up to 4 sec> <South is the correct answer>
That road takes us to our next turn, which is to the right. What direction are we heading then? <Pause up to 4 sec> <West is the correct answer>
Then after several miles, we turn right again. What direction are we heading then? <Pause up to 4 sec> <North is the correct answer>
Then again we travel for awhile until we reach a junction and we turn right. What direction are we heading then? <Pause up to 4 sec> <East is the correct answer>
We go straight and our next turn is to the right. What direction are we heading then? <Pause up to 4 sec> <South is the correct answer>
Then we turn left again. What direction are we heading then? <Pause up to 4 sec> <East is the correct answer> We are done. Thank you.
Route Orientation 7 Your task is to listen to this travel route and tell me the direction in which we will be headed after each turn. Please begin now.
We will first head south and make a right turn. What direction are we heading then? <Pause up to 4 sec for participant to answer the question and then continue with> <West is the correct answer>
Then after continuing, we will turn right again. What direction are we heading then? <Pause up to 4 sec> <North is the correct answer>
Continuing on, at the next junction we turn left. What direction are we heading then? <Pause up to 4 sec> <West is the correct answer>
Okay, then we go straight and make a left turn at the next junction. What direction are we heading then? <Pause up to 4 sec> <South is the correct answer>

Appendix H Task Instructions
H-23
Then our next turn is to the right. What direction are we heading then? <Pause up to 4 sec> <West is the correct answer>
That road takes us to our next turn, which is to the right. What direction are we heading then? <Pause up to 4 sec> <North is the correct answer>
Then after several miles, we turn right again. What direction are we heading then? <Pause up to 4 sec> <East is the correct answer>
Then again we travel for awhile until we reach a junction and turn right. What direction are we heading then? <Pause up to 4 sec> <South is the correct answer>
We go straight and our next turn is to the left. What direction are we heading then? <Pause up to 4 sec> <East is the correct answer>
Then we turn left again. What direction are we heading then? <Pause up to 4 sec> <North is the correct answer> We are done. Thank you.
Route Orientation 8 Your task is to listen to this travel route and tell me the direction in which we will be headed after each turn. Please begin now.
We will first head west and make a right turn. What direction are we heading then? <Pause up to 4 sec for participant to answer the question and then continue with> <North is the correct answer>
Then after continuing, we will turn left. What direction are we heading then? <Pause up to 4 sec> <West is the correct answer>
Continuing on, at the next junction we turn left. What direction are we heading then? <Pause up to 4 sec> <South is the correct answer>
Okay, then we go straight and make a right turn at the next junction. What direction are we heading then? <Pause up to 4 sec> <West is the correct answer>
Then our next turn is to the right. What direction are we heading then? <Pause up to 4 sec> <North is the correct answer>
That road takes us to our next turn, which is to the right. What direction are we heading then? <Pause up to 4 sec> <East is the correct answer>
Then after several miles, we turn right again. What direction are we heading then? <Pause up to 4 sec> <South is the correct answer>

Appendix H Task Instructions
H-24
Then again we travel for awhile until we reach a junction and we turn left. What direction are we heading then? <Pause up to 4 sec> <East is the correct answer>
We go straight and our next turn is to the left. What direction are we heading then? <Pause up to 4 sec> <North is the correct answer>
Then we turn right again. What direction are we heading then? <Pause up to 4 sec> <East is the correct answer> We are done. Thank you.
Route Orientation 9 Your task is to listen to this travel route and tell me the direction in which we will be headed after each turn. Please begin now.
We will first head north and make a left turn. What direction are we heading then? <Pause up to 4 sec for participant to answer the question and then continue with> <West is the correct answer>
Then after continuing, we will turn left again. What direction are we heading then? <Pause up to 4 sec> <South is the correct answer>
Continuing on, at the next junction we turn right. What direction are we heading then? <Pause up to 4 sec> <West is the correct answer>
Okay, then we go straight and make a right turn at the next junction. What direction are we heading then? <Pause up to 4 sec> <North is the correct answer>
Then our next turn is to the right. What direction are we heading then? <Pause up to 4 sec> <East is the correct answer>
That road takes us to our next turn, which is to the right. What direction are we heading then? <Pause up to 4 sec> <South is the correct answer>
Then after several miles, we turn left again. What direction are we heading then? <Pause up to 4 sec> <East is the correct answer>
Then again we travel for awhile until we reach a junction and we turn left. In what direction are we heading then? <Pause up to 4 sec> <North is the correct answer>
We go straight and our next turn is to the right. What direction are we heading then? <Pause up to 4 sec> <East is the correct answer> We are done. Thank you.
Route Orientation 10

Appendix H Task Instructions
H-25
Your task is to listen to this travel route and tell me the direction in which we will be headed after each turn. Please begin now.
We will first head west and make a left turn. In what direction are we heading then? <Pause up to 4 sec for participant to answer the question and then continue with> <South is the correct answer>
Then after continuing, we will turn right. In what direction are we heading then? <Pause up to 4 sec> <West is the correct answer>
Continuing on, at the next junction we turn right. In what direction are we heading then? <Pause up to 4 sec> <North is the correct answer>
Okay, then we go straight and make a right turn at the next junction. In what direction are we heading then? <Pause up to 4 sec> <East is the correct answer>
Then our next turn is to the right. In what direction are we heading then? <Pause up to 4 sec> <South is the correct answer>
That road takes us to our next turn, which is to the left. In what direction are we heading then? <Pause up to 4 sec> <East is the correct answer>
Then after several miles, we turn left again. In what direction are we heading then? <Pause up to 4 sec> <North is the correct answer>
Then again we travel for awhile until we reach a junction and we turn right. In what direction are we heading then? <Pause up to 4 sec> <East is the correct answer>
We go straight and our next turn is to the right. In what direction are we heading then? <Pause up to 4 sec> <South is the correct answer> We are done. Thank you.
Route Orientation 11 Your task is to listen to this travel route and tell me the direction in which we will be headed after each turn. Please begin now.
We will first head south and make a right. In what direction are we heading then? <Pause up to 4 sec for participant to answer the question and then continue with> <West is the correct answer>
Then after continuing, we will turn right again. In what direction are we traveling then? <Pause up to 4 sec> <North is the correct answer>
Continuing on, at the next junction we turn right. In what direction are we traveling then? <Pause up to 4 sec> <East is the correct answer>

Appendix H Task Instructions
H-26
Okay, then we go straight and make a right turn at the next junction. In what direction are we heading then? <Pause up to 4 sec> <South is the correct answer>
Then our next turn is to the left. In what direction are we heading then? <Pause up to 4 sec> <East is the correct answer>
That road takes us to our next turn, which is to the left. In what direction are we heading then? <Pause up to 4 sec> <North is the correct answer>
Then after several miles, we turn right again. In what direction are we traveling then? <Pause up to 4 sec> <East is the correct answer>
Then again we travel for awhile until we reach a junction and we turn right. In what direction are we traveling then? <Pause up to 4 sec> <South is the correct answer>
We go straight and our next turn is to the right. In what direction are we traveling then? <Pause up to 4 sec> <West is the correct answer> We are done. Thank you.
Route Orientation 12 Your task is to listen to this travel route and tell me the direction in which we will be headed after each turn. Please begin now.
We will first head west and make a right turn. In what direction are we traveling then? <Pause up to 4 sec for participant to answer the question and then continue with> <North is the correct answer>
Then after continuing, we will turn right again. In what direction are we traveling then? <Pause up to 4 sec> <East is the correct answer>
Continuing on, at the next junction we turn right. In what direction are we traveling then? <Pause up to 4 sec> <South is the correct answer>
Okay, then we go straight and make a left turn at the next junction. In what direction are we traveling then? <Pause up to 4 sec> <East is the correct answer>
Then our next turn is to the left. In what direction are we traveling then? <Pause up to 4 sec> <North is the correct answer>
That road takes us to our next turn, which is to the right. In what direction are we traveling then? <Pause up to 4 sec> <East is the correct answer>

Appendix H Task Instructions
H-27
Then after several miles, we turn right again. In what direction are we traveling then? <Pause up to 4 sec> <South is the correct answer>
Then again we travel for awhile until we reach a junction and we turn right. In what direction are we traveling then? <Pause up to 4 sec> <West is the correct answer>
We go straight and our next turn is to the right. In what direction are we traveling then? <Pause up to 4 sec> <North is the correct answer> We are done. Thank you.

Appendix H Task Instructions
H-28
Task 8: Voice-Dial Cell Phone Practice and Criterion Task: Voice-Dial Cell Phone (Practice) Your task is to call home by voice-dialing the phone. Please begin now. Voice-Dial Cell Phone 1 Your task is to call home by voice-dialing the phone. Please begin now.

Appendix H Task Instructions
H-29
Task 9: Book-on-Tape Listen Practice and Criterion Task: Book-on-Tape Listen 1 (Practice) Your task is to listen to this book-on-tape selection. Please begin now. The Case of the Bogus Robbery.
Since she was the richest woman in New York City, Mrs. Sidney had gratified every whim but one. She had never confounded Dr. Haledjian.
So Haledjian knew that the game of stump-the-detective had commenced again when at two o’clock in the morning he was summoned from the guest room of Mrs. Sidney’s Fifth Avenue mansion by the butler who announced, “Madam’s jewels have been stolen.”
Entering Mrs. Sidney’s bedroom the famed sleuth closed the door and swiftly surveyed the scene. The French windows were open, to the left of the disordered bed stood an end table with a book and two candles. The candles had burned down to three inches, spilling all their drippings down the side facing the door. A bell cord lay on the thick green carpet. A drawer on the vanity table was open.
“What happened?” inquired Haledjian. “I was reading in bed by candle light when the door blew open,” said Mrs. Sidney.
“As you perhaps felt, a strong draft comes in. I pulled the bell cord for James, the butler, to come shut the door.”
“Before he arrived, a masked man with a gun entered and forced me to tell him where I kept my jewels. As he scooped them into his pocket, James entered. The thief bound him with a bell cord and tied my hands and legs with these,” she said, holding up a pair of stockings.
“As he departed, I asked him to have the decency to close the door. He merely laughed, and deliberately left it open.”
“It took James twenty minutes to work free and release me. I shall have beastly cold in the morning!” concluded Mrs. Sidney.
“My compliments,” said Haledjian, “on a nicely staged crime, with a fallacy fairly displayed.” What was the fallacy? Book-on-Tape Listen 2 Your task is to listen to this book-on-tape selection. Please begin now. The Case of the Home Bakery.
“I was driving by when I got the darkness attack of indigestion,” said Sheriff Monahan apologetically. “Do you have some bicarbonate of soda, madam?”
Mrs. Duffy, a motherly woman of 60, smiled cheerfully. “You just sit right down in the kitchen, Sheriff,” she said. “I don’t keep bicarbonate of soda on hand, but I’ll brew you up a nice of tea. It’ll work wonders, I promise.”
Sheriff Monahan seated himself obediently while Mrs. Duffy bustled around her neat little kitchen. He had always admired the kindly woman, who dwelt alone and made her own living. After the sheriff had finished his tea, he rose to leave. “I feel better already. Many thanks to you, madam”
Outside, he saw Mrs. Duffy’s panel truck. It was parked by the south wing of the house. He had always assumed that the south wing was where she made the breads, cakes, and pies she sold to inns along the highway. He studied the pink lettering on the truck: “Ma Duffy’s Homemade Pies, Cakes, and Bread.” He stared thoughtfully at the house.

Appendix H Task Instructions
H-30
Back in town, he telephoned Dr. Haledjian. The famed criminologist heartily advised him to get a search warrant, and within the hour the sheriff had returned to Mrs. Duffy’s. The search of the premises disclosed that Ma Duffy’s pies, cakes, and bread were commercial products with wrappers removed, but the bottles of whiskey, illegally secreted within each Pullman loaf was strictly home-brewed. What was it that made the sheriff suspicious? Book-on-Tape Listen 3 Your task is to listen to this book-on-tape selection. Please begin now. The Case of the Buried Treasure.
“From the gleam in your eye, I deduce you are about to get rich,” said Dr. Haledjian. “Clever of you, old chap,” said Bertie Tilford, a young Englishman with a superiority
complex toward work. “If I had a mere ten thousand, I should realize a fortune! Have you ten?”
“What’s the game now?” demanded Haledjian. “Pieces of eight amongst the corals? Doubloons from Captain Kidd’s chest?” Bertie opened a sack and triumphantly produced a shining silver candlestick. “Sterling silver,” he sang. “See what is engraved in the bottom.”
Haledjian upended the candle stick and read the name Lady North. “Wasn’t that the ship that sank in 1956?”
“The Lady North sank, but not with all hands onboard, as generally believed,” replied Bertie. “Four men got away with a fortune in loot before the ship capsized in the storm. They hid their loot in a cave,” continued Bertie. “But the storm started an avalanche and sealed off the entrance, burying three of the sailors inside. The fourth, a chap named Pembroot escaped. Pembroot’s been trying to raise ten thousand dollars to buy the land on which the cave is located.”
“Ah! I see. You put up the money, the cave is opened, and the loot is divided two ways instead of four. Enchanting!” said Haledjian. “Only how do you know, Pembroot isn’t a swindler?”
“Earlier tonight, he took me to the cave,” said Bertie. “This sack was half buried in the bushes, and I nearly sprained my ankle on it. I took one look and brought the candlestick here non-stop. You have got to agree it is the real thing, old chap.”
“It is,” admitted Haledjian. “There is no doubt that Pembroot planted it by the cave for your benefit.” How did Haledjian know? Book-on-Tape Listen 4 Your task is to listen to this book-on-tape selection. Please begin now. The Case of Flawless Phil.
“I’ve caught a good many crooks, but I have never tried to catch one while posing as a used-car salesman” confessed Dr. Haledjian.
“We think one of the men who have been smuggling dope across the border will be around for that car,” replied Sheriff Monahan. He pointed to a 1984 gray sedan. “Last week we got a tip that dope was being smuggled in a car parked outside Priestly’s Bar and Grill. We missed the smugglers, but we got that car. Under the back seat of that car we found a million dollars worth of pure heroin.”

Appendix H Task Instructions
H-31
“We had to rip off the entire floor of the car to get that stuff,” the sheriff went on. “Phil Barton, who runs this car lot here as Phil’s Flawless Finds, has agreed to put the car on display, as bait. We hope the smugglers will try to find out if the dope is still hidden in it.”
Haledjian agreed to play the part of a salesman. On the windshield he stuck a poster that announced: Phil’s Flawless Special today only.
After a while, a dark haired man moved towards the sedan. “May I help you?” inquired Haledjian, and he began his sales pitch. The customer edged towards the sedan without ever getting nearer than six feet of it. He seemed only half-heartedly interested as he peered at the engine. Haledjian stepped around to the driver’s window. “The engine has only12,000 miles on it. The inside,” he admitted, “is floorless.”
“Is it?” said the man, and walked hurried away. “He’s one of the smugglers,” shouted Haledjian. “Arrest him!” How did Haledjian
know? Book-on-Tape Listen 5 Your task is to listen to this book-on-tape selection. Please begin now. The Case of Willy the Wisp.
Dr. Haledjian was vacationing in Europe when Count Schwinn, head of customs in Germany, requested help on a perplexing problem of suspected smuggling. Schwinn had scarcely entered Haledjian’s hotel suite when he blurted, “Are you acquainted with this Eugene McNally?”
“Better known as Willy the Wisp?” asked Haledjian. “Well, he fenced diamonds in American for years and never got caught.”
“Such is the man,” replied Schwinn. “He got a new game now. Six months ago he showed up at our custom post at Arkin driving a new black convertible Fiorta, a foreign car that costs $81,000 American. Naturally, we checked every inch of it. Nothing. But each of his three pieces of luggage had a false bottom.”
Schwinn shook his head in exasperation. “In the false bottom were three jars; one filled with molasses, one with ground oyster shells, and one with splits of colored glass. We could not hold him for hiding such things naturally. Now, twice a month, here comes a big, black, expensive Fiorta into the country at Arkin. Willie again! Hidden in his bags are the jars filled with the same curious contents; molasses, glass, and shells. He just sits and smirks at my customs men. There are forced to admit him into the country,” concluded Schwinn.
“Molasses, shells, and colored glass,” mused Haledjian. “What do you think they add up to? What is he smuggling?” cried Schwinn.
Haledjian lit a pipe and drew up it reflectively. At length he grinned. “Darn clever fellow, Willy.” What was Willy smuggling? Book-on-Tape Listen 6 Your task is to listen to this book-on-tape selection. Please begin now. The Case of the Phony Financier.
“Last week I pulled off my best act yet,” groaned Cyril Makin, the backfiring ladykiller. “I can’t figure out how Ginger Faulk knew I was bluffing.”
Makin flopped despondently into an armchair in Dr. Haledjian’s study and recounted his latest tale of curdled courtship. “Ginger’s father is head of Affiliated Banks of California. She’s accustomed to million-dollar deals being closed on the telephone.”
Appendix H Task Instructions
H-32
“So I decided to trump anything she had ever heard off Mr. Bell’s business line. So I had her meet me at noon for lunch at Behlen’s, the swankiest restaurant in Los Angeles. After we had ordered, I called for a table phone. I asked to talk with Northern Airlines at Kennedy Airport, New York. John Goch, an old buddy, was on the other end of the line, speaking from Behlen’s kitchen. ‘Page Mr. Leonard Coffin,’ ” I said. ‘It’s urgent!’”
Well after three minutes John came online as Coffin. “We have got the Best Western award,” I said. “Tell Grifaldos in Zurich the deal, re-offer the bonds at 99.5 percent for the 15-year maturity, the selling commission of 1 percent on the long longs and 0.5 percent on the short ought to net us $300 million.” Then I hung up.
“‘Coffin,’ I explained to Ginger, ‘is taking the 1 p.m. flight to Zurich. By suppertime I should have the European cartel’s answer.’ ”
“You are lucky,” commented Haledjian, “Miss Faulk didn’t throw something at you.” What was Makin’s slip? Book-on-Tape Listen 7 Your task is to listen to this book-on-tape selection. Please begin now. The Case of the Stolen Rubens. Unable to sleep, Dr. Haledjian was walking about the grounds of his host, Percy Kilbrew, former right-handed pitching great, when he noticed a limousine by the back door. Suddenly a man, fully clothed, stepped out the door and passed the driver what appeared to be a painting. Then the man dashed into the house and the car roared off, bowling over a garbage can with enough noise to awaken the dead. In the 4 a.m. darkness Haledjian could not identify the men or the car. But the fate of the Rubens oil was plain enough – it was missing from the living-room wall. Haledjian sprinted upstairs to his host’s room and received a prompt “Come in” to his knock. Kilbrew stood half-clothed by a rumpled bed, his right leg in his trousers and his left leg out.
“I heard the clatter and was just getting dressed to investigate,” he said. “What happened?” “The Rubens has been stolen,” said Haledjian. Kilbrew finished pulling on his trousers and followed Haledjian downstairs barefooted. In a few minutes Kilbrew’s three other house guests descended the stairs. John Ward, the art critic, wore an Oriental robe over black silk pajamas. Marty Latham, the singer, wore an old-fashioned nightshirt and cap. Everette Maloski, the painter, wore only tattered pajama bottoms. “The Rubens is heavily insured,” said Kilbrew. “But I don’t care about the money. I want the painting back!” “You don’t have a worry on that score,” Haledjian assured him. Whom did Haledjian suspect? Book-on-Tape Listen 8 Your task is to listen to this book-on-tape selection. Please begin now. The Case of the French Vineyard. The dinner at the mansion rented by Pierre Gibrault was superb. While the roast was being served, Gibrault arose, deftly unscrewed the cork from a chilled bottle of red table wine, and poured a little into the glass of Dr. Haledjian. Haledjian sipped and politely nodded approval.

Appendix H Task Instructions
H-33
As Gibrault poured for his other guests, Jim Morgan, seated by Haledjian, whispered, “What do you think?” “About the wine?” said Haledjian. “It’s excellent!” “You know, of course, why we were invited?” “I expect Gibrault needs money,” replied the sleuth. “He was in my office last week,” said Morgan, “to get a list of people who might be interested in investing in a French vineyard. “Gibrault claims to be a wine exporter from Bordeaux, but I haven’t had time to check him out,” continued Morgan. “He assured me the vineyard up for sale has the richest soil in France. It produces the very best grapes. He wants to make red sparkling Burgundy to sell in America at top prices.” “How much cash does he need in a hurry?” asked Haledjian. “The vineyard’s owner wants the equivalent of ten million American dollars, and he wants it by Tuesday or no sale,” said Morgan. “I put your name on the guest list because I thought you might help me get a quick appraisal of Gibrault.” “I have,” replied Haledjian. “Don’t invest a penny!” Why not? Book-on-Tape Listen 9 Your task is to listen to this book-on-tape selection. Please begin now. The Case of the Cave Paintings. “By Jove! This time I’m going to make us both rich!” exclaimed Bertie Tilford, the unemployed Englishman with more get-quick-rich plans than tail feathers on a turkey farm. He paused dramatically, eyeing Dr. Haledjian. “You’ve heard of the caveman paintings in the Cave of Font de Gaume, France?” he resumed. “Well, my associate, Sebastian Delsolo, has found the greatest ever example of prehistoric art in a cave on a farm in Spain. “Of course,” went on Bertie, “I can’t divulge the exact location yet. But we can buy the farm with the cave for a mite, dear boy. The farmer suspects nothing. Think of the fortune from tourists!” Bertie passed three photos to Haledjian. “Behold! Sebastian pushed past subterranean water channels as far down as 3,000 feet to photograph these drawings!” The first photo was of a woolly rhinoceros, the second of hunters attacking a dinosaur, the third of a charging mammoth. “The cave artist worked by light from a stone lamp filled with fat and fitted with a wick of moss,” explained Bertie. “He used pieces of red and yellow ochre for drawing and ground them and mixed them with animal fat for painting.” “How much to buy the farm?” asked Haledjian darkly. “In American, $50,000,” said Berite. “But you can have a third share of everything for a mere $10,000.” “A third of nothing, you mean,” corrected Haledjian. “I won’t give you a nickel!” Why not? Book-on-Tape Listen 10 Your task is to listen to this book-on-tape selection. Please begin now. The Case of the Bumped Head. The express train running between New York and Los Angeles had to back up outside Chicago. Alas, the engineer stopped the train too suddenly while in reverse. Passengers tumbled like tenpins, incurring several suits against the railroad.

Appendix H Task Instructions
H-34
“The stop happened at 9 p.m.,” said Mills, the railroad’s insurance man, while discussing the incident with Dr. Haledjian. Mills related the biggest headache, Ted Sheldon, a passenger who was suing for $100 million. “At 8 p.m.,” said Mills, “Sheldon had the porter make up his berth in the last car. He claims he had just retired for the night when the stop occurred. He says he was so forcefully jerked that his head struck the wall behind his pillows.”
“Because of terrific head pains, he says, he left the train at Chicago,” concluded Mills. He showed Haledjian a doctor’s affidavit that Sheldon had suffered a skull fracture. “You think Sheldon hurt his head somewhere else?” asked the sleuth. “If I can’t disprove his story about his hitting his head in the Pullman berth, the company is going to have to settle.” “You don’t have to worry,” said Haledjian. Why not? Book-on-Tape Listen 11 Your task is to listen to this book-on-tape selection. Please begin now. The Case of Freddie the Forger. “Somebody tipped Freddie the Forger,” Inspector Winters told Dr. Haledjian. “Freddie cleared out of his hotel room an hour before we raided it.” The inspector handed Haledjian a cardboard onto which a torn sheet of paper showing dates and places had been pasted together. “We found the pieces in Freddie’s wastepaper basket,” the inspector said. “So at least we know where he’s going.” Haledjian read the penciled notes: Paris, Aug. 14 . . . Naples, Sept. 12 . . . Athens, Sept. 21 . . . London, Oct. 3 . . . Palestine, Oct. 15 . . . Moscow, Dec. 24. “Looks like an itinerary.” agreed Haledjian. “But is it Freddie’s?” “Toby Kirk, Freddie’s New York girl, insists it’s his writing. She said she was in his hotel and overheard him making a long-distance telephone call.” “He talked to Paris and got a hotel reservation for August 15. She didn’t overhear much, but she thinks he then made a plane reservation for a flight that left New York at 2 p.m., August 14.” “Freddie’s a smart operator,” continued the inspector. “He always dreams up a new disguise. Toby Kirk says when he was in New York he bought a 10-gallon hat.” “I put Diehl, my best man, on the case. Diehl leaves for Paris tonight. If Freddie shows up in Paris wearing a fez, Diehl will spot him and bring him back.” “Unfortunately,” said Haledjian, “Diehl will be flying in the wrong direction to capture Freddie.” How come? Book-on-Tape Listen 12 Your task is to listen to this book-on-tape selection. Please begin now. The Case of the Indian Trader. Dr. Haledjian and the rest of the saddle-sore dudes on the deluxe tour of western sites entered the adobe museum and stared at an empty green-tinted glass bottle. Its label read: Doc Henry’s Secret Elixir. The tour’s bandy-legged little guide recounted the reason for the bottle’s enshrinement. “Beautiful Jenny Fox was saved by 77 of them bottles back in ’83,” he began.

Appendix H Task Instructions
H-35
“Ol’ Doc Henry was an Injun trader – never sold a drop of his elixir to a white man, only to them Injuns. ‘Course, Doc kept the ingredients a secret. But on his deathbed, he’s supposed to have admitted it weren’t nothin’ but sugar water. “Well, one night some crazy drunk Injuns kidnapped young Jenny. It was Doc Henry who volunteered to go after her. “He set off alone with a wagonload of tradin’ goods and 80 bottles of his elixir hung from the beams. For five days of sub-freezin’ weather he palavered with them savages. “But Doc brings Jenny home safe. He’d had to trade all his bottles but three for her, and all his other stuff in the bargain. “Doc,” concluded the guide, “was a hero. Imagine goin’ up into them hills alone and tradin’ a pack of crazy-drunk redskins out of a beautiful girl!” “Doc was a hero,” corrected Haledjian. “He was an old rascal who was partly responsible for Jenny’s kidnapping! Infact he was selling the alcohol that got the Indians crazy drunk in the first place.” How did Haledjian know? Book-on-Tape Listen 13 Your task is to listen to this book-on-tape selection. Please begin now. The Case of the Lost City. “I’m really onto something big this time,” said Gavin Fordham, the irrepressible Englishman with more get-rich-quick schemes than horsehair in a mattress factory. He fished a letter from his pocket and pressed it to Dr. Haledjian. “Run your eyes on this, old boy!” The letter, addressed to Bertie, was signed “Baron Stramm.” Haledjian read: “Am positive I have located the lost city of Heliopaulis which was buried by the eruption of Mount Vitras in 147 A.D. Can you rush me $300,000 to begin excavations?” “Baron Stramm,” explained Bertie, “came to see me before departing on his search for Heliopaulis last year. He said if he ever found the city, he’d let me in on the ground floor, so to speak. A half share of everything, but only if I backed him.” Bertie grinned smugly. “Can you imagine what a discovery like Heliopaulis will be worth?” “Of course,” said Haledjian. “You’d like to raise some of the $300,000 from me?” “A pittance, my dear chap. A mere bagatelle,” said Bertie. “I’m doing you a favor. Let me have $100,000 and I’ll make your fortune! I guarantee it” “Well, I don’t know anything about your Baron Stramm,” said Haledjian, “or the lost city of Heliopaulis for that matter. But the man who wrote that letter is obviously not an archaeologist. So no money today for your swindler, my boy!” Why not?

Appendix H Task Instructions
H-36
Task 10: Just Driving Practice and Criterion Task: Just Driving (Practice) Your task is to just drive. Please begin now. <Pause for 2 minutes and continue with> We are done. Thank you. Just Driving 1 Your task is to just drive. Please begin now. <Pause for 2 minutes and continue with> We are done. Thank you.

Appendix H Task Instructions
H-37
Task 11: Biographical Q&A Practice and Criterion Task: Biographical Q&A (Practice) Your task is to answer the following questions. Please begin now.
• What is your name? <Pause for 4 seconds for participant to respond then ask next question>
• What is your current address? <Pause for 4 seconds> • What is your home telephone number? <Pause for 4 seconds> • How many years have you been driving? <Pause for 4 seconds> • What year, make, and model of vehicle do you normally drive? <Pause for 4
seconds> • How long have you been driving this vehicle? <Pause for 4 seconds> • About how many miles did you drive last year? <Pause for 4 seconds> • If you own a cell phone, how often do you use it while driving? <Pause for 4
seconds> • How often do you eat food or drink beverages while driving? <Pause for 4 seconds> • Have you ever had something drop or shift around while driving and you tried to
catch it or pick it up? <Pause for 4 seconds> • What’s the most common source of distraction for you while driving? <Pause for 4
seconds> • What do you think is the most common source of distraction for other drivers while
driving? <Pause for 4 seconds> • How can you tell if another driver might be distracted? <Pause for 4 seconds>
We are done. Thank you. Biographical Q&A 1 Your task is to answer the following questions. Please begin now.
• What is your name? <Pause for 4 seconds for participant to respond then ask next question>
• What is your current address? <Pause for 4 seconds> • What is your home telephone number? <Pause for 4 seconds> • How many years have you been driving? <Pause for 4 seconds> • What year, make, and model of vehicle do you normally drive? <Pause for 4
seconds> • How long have you been driving this vehicle? <Pause for 4 seconds> • About how many miles did you drive last year? <Pause for 4 seconds> • If you own a cell phone, how often do you use it while driving? <Pause for 4
seconds> • How often do you eat food or drink beverages while driving? <Pause for 4 seconds> • Have you ever had something drop or shift around while driving and you tried to
catch it or pick it up? <Pause for 4 seconds> • What’s the most common source of distraction for you while driving? <Pause for 4
seconds>

Appendix H Task Instructions
H-38
• What do you think is the most common source of distraction for other drivers while driving? <Pause for 4 seconds>
• How can you tell if another driver might be distracted? <Pause for 4 seconds> We are done. Thank you.

Appendix H Task Instructions
H-39
Task 12: Route Instructions Practice and Criterion Task: Route Instructions 10 (Practice) Your task is to listen to some route instructions for a set of errands we need to run today and repeat them back to me. Please begin now. Today we need to take the dog to the vet, stop at the pet store, pick up some dry cleaning, and pick up a friend from work. First, to take the vets, take a right on Main Street and a right on 6th Avenue. The Glenco Animal Hospital has a blue-an- white sign above it. Please repeat. <Pause for 10 seconds for participant to repeat the directions> Next, we need to go to the pet store. Take a right on Gilmore and a left on Claremont. The Woof and Chirp pet store will be right there. Please repeat. <Pause for 10 seconds> Next, we need to pick up the dry cleaning. Take a left on Cornell and then another left on Kirby. The Quick and Neat dry cleaner’s is the yellow building. Please repeat. <Pause for 10 seconds> Our last stop is to pick up a friend from work. Make a left onto Birch Street and then a right onto College Street, our friend will be waiting for us on the corner. Please repeat. <Pause for 10 seconds> We are done. Thank you. Route Instructions 1 Your task is to listen to some route instructions for a set of errands we need to run today and repeat them back to me. Please begin now. We need to deliver some daisies to a day care center, some roses to a Dental Center, some tulips to Monroe Elementary School, and some lilies to a hospital. To reach our first stop, take a left on Third and a right on Clark, you’ll see the day care center has a dinosaur in front of it. Please repeat. <Pause for 10 seconds for participant to repeat the directions> Alright, then the next stop we will make is the dental center. Take a left on Aspen and a left on Swanson. The Oldman Dental Center parking lot is on the corner. Please repeat. <Pause for 10 seconds> Our next stop is Monroe Elementary School. Go right on Milwaukee and left on Chester. You’ll see the school parking lot behind the chain link fence. Please repeat. <Pause for 10 seconds> Our final stop is the hospital. Go right on Garfield and then right again on Spicer. You’ll see the hospital right there. Please repeat. <Pause for 10 seconds> We are done. Thank you. Route Instructions 2 Your task is to listen to some route instructions for a set of errands we need to run today and repeat them back to me. Please begin now. Today we need to drop off a package at the post office, get an oil change, pick up some groceries, and stop at a bakery. First make a right at 14th and a right on Parker. The Post Office is on the corner. Please repeat. <Pause for 10 seconds for participant to repeat the directions>

Appendix H Task Instructions
H-40
Next we will go to get an oil change. Make a left on Whitney, and then go right on Latham. The garage for an oil change is Jiffy Lube. Please repeat. <Pause for 10 seconds> Our next stop is to pick up some groceries. Go left on Fisher and then right on Lincoln. The A&P grocery store is straight ahead. Please repeat. <Pause for 10 seconds> Our final stop is a bakery. Go right on Ryan and then right again on Lowery. You’ll see the Ever-Fresh Bakery has a neon sign in the window. Please repeat. <Pause for 10 seconds> We are done. Thank you. Route Instructions 3 Your task is to listen to some route instructions for a set of errands we need to run today and repeat them back to me. Please begin now. We need to stop at a bookstore, pick up a movie at Blockbuster, stop at 7-Eleven for a Slurpee, and then pick up some sandwiches to take home. For our first stop at the bookstore make a left on Bishop, then make a left on Somerset. You’ll see the Book Worm Bookstore right there. Please repeat. <Pause for 10 seconds for participant to repeat the directions> Next, we will go to Blockbuster. Make a left on Burkhart and then another left on Decker. The Blockbuster will be right there by the Honey-Baked Ham place. Please repeat. <Pause for 10 seconds> The next stop we will make is at 7-Eleven. Make a left on Bradley and then take a right on Blue Hill. The 7-Eleven is on the corner. Please repeat. <Pause for 10 seconds> Our last errand is to pick up some sandwiches. Take a right on Faircrest and then turn left on Eastwood. You’ll see the Dagwood Sandwich Shop about the middle of the block. Please repeat. <Pause for 10 seconds> We are done. Thank you. Route Instructions 4 Your task is to listen to some route instructions for a set of errands we need to run today and repeat them back to me. Please begin now. We need to drop off a child at school, pick up some xeroxing at the copy center, mail a letter, and head for the office. For our first stop, make a left on Canyon and then make a right on Jefferson. You’ll see the school right there. Please repeat. <Pause for 10 seconds for participant to repeat the directions> Our next stop is the copy center. Make a left on Cornwell and then a right on Whittier. The copy center is right on the corner. Please repeat. <Pause for 10 seconds> Next, we will stop to mail a letter. Make a right on Norton and then a left on Hoover. The mailbox is at the end of the block. Please repeat. <Pause for 10 seconds> Our last destination is the office. Make a right on Newport and then a right on Peachtree. The office is in the Victorian house. Please repeat. <Pause for 10 seconds> We are done. Thank you.

Appendix H Task Instructions
H-41
Route Instructions 5
Your task is to listen to some route instructions for a set of errands we need to run today and repeat them back to me. Please begin now. We need to pick up a friend, take her to the doctor, and then to the pharmacy, and finally to her parents home. For our first stop, make a left on Hickory and a right on Neff. Our friend’s house is the one with the awning. Please repeat. <Pause for 10 seconds for participant to repeat the directions> Alright then, the next stop is at her doctor’s office. Make a right on Bedford and then go left Berkshire. Her doctor’s office is the tall building. Please repeat. <Pause for 10 seconds> Next, we’ll stop at the pharmacy. Turn right on Grove and then turn left on Kelley. The Crestview Pharmacy will be on the corner. Please repeat. <Pause for 10 seconds> Finally, we’ll drive our friend to her parent’s home. Go left on Holden, then right on Avon. Her folk’s home has the picket fence in front. Please repeat. <Pause for 10 seconds> We are done. Thank you. Route Instructions 6 Your task is to listen to some route instructions for a set of errands we need to run today and repeat them back to me. Please begin now. We need to go to the gym, pick up some batteries at RadioShack, buy a new music CD, and then go to lunch. For our first stop at the gym, make a left on Harris and then make a right on Pacific. You will see the gym right there. Please repeat. <Pause for 10 seconds for participant to repeat the directions> Alright then, the next stop is at RadioShack. Go right on Crawford and then right again on Wellington. RadioShack is on the corner. Please repeat. <Pause for 10 seconds> Next, we’ll go buy a music CD. Go left on Dexter and then left on Central. The Blue Note Music Store is the blue building. Please repeat. <Pause for 10 seconds> Our last stop is to get lunch at a cafe. Make a left on Magnolia and then a right on Lafayette. Marello’s Café has tables and chairs out front. Please repeat. <Pause for 10 seconds> We are done. Thank you. Route Instructions 7 Your task is to listen to some route instructions for a set of errands we need to run today and repeat them back to me. Please begin now. We need to go to the bank, get the car washed, go to dinner, and then go to a movie. For our first stop at the bank, make a right on Wheeler and then a left on Howard. You’ll see the First Third Bank building has marble pillars. Please repeat. <Pause for 10 seconds for participant to repeat the directions> The next stop is the car wash. Take a left on Curry and then a right on Fort. Joe’s Car Wash has four tall flagpoles in front. Please repeat. <Pause for 10 seconds>

Appendix H Task Instructions
H-42
Next, we’ll stop for dinner. Turn right on Wharton and then left on Everest. Luigi’s Restaurant is at the end of the street. Please repeat. <Pause for 10 seconds> Our last stop is the movie theater. Go right on Brock and then left on Upton. The Megaplex Movie Theater will be right there. Please repeat. <Pause for 10 seconds> We are done. Thank you. Route Instructions 8 Your task is to listen to some route instructions for a set of errands we need to run today and repeat them back to me. Please begin now. We need to go to the museum, an art gallery, a gift shop, and finally a coffee shop. For our first stop at the museum, make a right on Lancaster and then another right on Freemont. You’ll see the museum has two stone lions in front. Please repeat. <Pause for 10 seconds for participant to repeat the directions> The next stop is the art gallery. Take a left on Belmont and then go right on Davis. The Fischer King Art Gallery has a large mobile on the front lawn. Please repeat. <Pause for 10 seconds> Next, we’ll go to the gift shop. Go right on Newton and then left on Williams. The Hallmark Gift Shop is in the middle of the block. Please repeat. <Pause for 10 seconds> Our last stop is the coffee shop. Turn right on Prospect then make a left on Rosewood. The coffee shop is called Common Grounds. Please repeat. <Pause for 10 seconds> We are done. Thank you. Route Instructions 9 Your task is to listen to some route instructions for a set of errands we need to run today and repeat them back to me. Please begin now. We need to go to the library, shopping mall, the gas station, and on to a computer class. For our first stop at the library, make a left on McCormick and then a right on Ruby Road. You’ll see the library right there. Please repeat. <Pause for 10 seconds for participant to repeat the directions> The next stop we will make is at the shopping mall. Make a right on Provincial and a left on Lawton. The shopping mall is on the corner. Please repeat. <Pause for 10 seconds> Next, we need to go to the gas station. Turn right on Dundee then turn left on Covington. The Pegasus Gas Station will be in the middle of the block. Please repeat. <Pause for 10 seconds> Finally, we need to get to class. Go left on Canterbury then take a left on Elston. The Ellis Classroom Center is the four-story brick building across from the pond. Please repeat. <Pause for 10 seconds> We are done. Thank you.

Appendix H Task Instructions
H-43
Task 13: Sports Broadcast Practice and Criterion Task: Sports Broadcast 1 (Practice) Your task is to listen to this sports broadcast and find out who the Orioles played and who won. Please begin now.
• The Cubs continued their 9-game win streak by blowing away the Padres 7-1 in San Diego.
• On the opposite side of the country, Boston put away the Angels 4-2 at home. The BoSox are now just one game back of the division leading Yankees.
• Last night the A’s rallied in the 8th to avoid a sweep by the Indians in Oakland. The final score was 6-4 after Ellis hit a double and sent Long and Myers home.
• Bonds returned last night with a bang, but could not put a stop to the Phillies in the Giants’ 6-8 loss. Bonds’ solo homer in the 5th inning leaves him 2 shy of becoming the 4th man to hit 600 in their careers.
• The Rangers slugged their way to a 17-6 thrashing of the Yankees. Texas had an amazing 6 doubles in the 2nd inning, a feat that last occurred in the American League in 1982.
• The Tigers finished a three-game sweep against the Royals in Kansas City with a score of 5-2.
• The Cards finally snapped a-4 game losing skid against the Marlins with a score of 3-1.
• Moyer spearheaded the Mariners’ 2-hit shutout over the Twins with a final score of 4-0.
• The Reds edged Montreal 2-1. The only runs were scored in the 3rd inning. • In Pirates-Mets action last night, Pittsburgh cleaned up with a 7-2 win. • The Orioles pounded the Devil Rays in a 13-0 blowout. Baltimore scored 6 runs in
the first inning at Tropicana Field. • The White Sox blew their lead in the 9th and fell to Toronto in the 10th. The outcome
was 3-2. • The Astros completed their comeback in the 11th, defeating the Dodgers 7-6. Los
Angeles committed three errors in the final inning to seal their fate. Sports Broadcast 2 Your task is to listen to this sports broadcast and find out who the Phillies played and who won. Please begin now.
• The Blue Jays piled up 20 runs last night against the Devil Rays, the most at the SkyDome in 24 years.
• The Pirates hit five homers to end a six-game skid against the Cards. Ramirez had two runs in the 8-0 blowout.
• The Twins finally founds some power to beat the Orioles 7-3. • The Rockies rocked Maddux in their second-straight win over the Braves. Maddux
gave up 13 hits in the Braves 6-3 loss.

Appendix H Task Instructions
H-44
• The Tigers survived three homeruns by the Mariners at home yesterday. The final score was 6-5.
• The Brewers handed the Expos their seventh-straight loss in a 10-3 rout. Hernandez’s 3 run homer powered the Brewers to victory.
• Keeping their post-season hopes alive, the Giants swept the season series last night 3-1 from the freefalling Mets.
• The Indians beat the error-prone White Sox 8-4 with an 8-run 5th. • The Reds pounded the Dodgers 9-3 for their sixth-straight win. • The Rangers won their first extra inning game of the season with a 3 run 12th to top
the A’s last night 7-4. • Phillies scored three in the bottom of the 9th to beat the Diamondbacks 4-3. The loss
drops the D-Backs into a tie for first. • The Yankees continued to thrive at Fenway, crushing the Red Sox 20-10. Ventura
and Vander Wal each drove in 4 runs. • In west coast action, the San Diego Padres took one back from the Astros with a late
rally. The final score was 3-2. Sports Broadcast 3 Your task is to listen to this sports broadcast and find out who the Pirates played and who won. Please begin now.
• The Phillies won in 11, as the Marlins ran out of options 7-6. • The Cubs ended their 6-game win streak by blowing away the Padres 7-1 in San
Diego. • At a home game Boston put away the Angels 4-2. It was an important win for the
Boston to keep pace with division-leading Yankees. • Last night the A’s rallied in the 8th and beat the Indians in Oakland with a final score
was 6-4. • Bonds returned last night with a bang, but could not put a stop to the Diamondbacks
in the Giants’ 6-8 loss. Bonds’ solo homer in the 5th was his career 596th. • The Rangers slugged their way to a 17-6 thrashing of the Yankees. Texas had an
amazing 6 doubles in the 2nd- a feat that last occurred in the AL in 1982. • The Tigers finished a three-game sweep against the Royals in Kansas City with a
score of 5-2. • The Cards finally snapped a 4-game losing skid against the Marlins with a score of 3-
1. • Moyer spearheaded the Mariners 2-hit shutout over the Twins with final score of 4-0. • The Reds edged Montreal 2-1. The only runs were scored in the 3rd inning. • In Pirates-Mets action last night, the Pittsburgh Pirates cleaned up with a 7-2 win over
the Mets. • The Orioles pounded the Rays in a 13-0 blowout. Baltimore scored 6 runs in the first
inning at Tropicana Field. • The White Sox blew their lead in the 9th and fell to Toronto in the 10th. The outcome
was 3-2.

Appendix H Task Instructions
H-45
Sports Broadcast 4 Your task is to listen to this sports broadcast and find out who the Yankees played and who won. Please begin now.
• The Pirates hit five homers to end a six-game skid against the Cards. Ramirez had two runs in the 8-0 blowout.
• The Devil Rays finally found some power to beat the Orioles 7-3. • The Rockies rocked Maddux in their second-straight win over the Braves. Maddux
gave up 13 hits in the Braves 6-3 loss. • The Tigers survived three homeruns by the Mariners at home yesterday. The final
score was 6-5. • The Brewers handed the Dodgers their seventh-straight loss in a 10-3 rout.
Hernandez’ 3 run homer powered the Brewers to victory. • Giants swept the season series last night 3-1 from the freefalling Mets. • The Indians beat the sloppy White Sox 8-4 with an 8 run 5th. • The Twins pounded the Rangers 9-3 for their sixth-straight win. • The Expos won their first extra-inning game of the season, defeating the Cubs 7-4. • A’s scored three in the bottom of the 9th to beat the White Sox 4-3. • The Yankees continued to thrive at Fenway, crushing the Red Sox 20-10. Ventura
and Vander Wal each drove in 4 runs. • The Padres took one back from the Philles with a late rally. The final score was 3-2. • The Blue Jays piled up 20 runs last night versus the Royals, the most at the SkyDome
in 24 years. Sports Broadcast 5 Your task is to listen to this sports broadcast and find out who the Angels played and who won. Please begin now.
• Tempers flared yesterday as the Expos failed to sweep the Phillies. The Phillies pulled out a win in the 8th with 2 home runs for a 10-8 victory.
• A six-run 4th inning sparked the Orioles rout of the White Sox 10-4. • The Red Sox ended a four game skid with a 23-hit parade versus the Twins. The final
score was 15-7. • The Mariners used an 8-run 5th inning to down the Devil Rays 11-5. The D’Rays
grounded into a record-tying 6 double plays. • Reds turned on the power in last night’s 8-6 win over the Braves. • The Marlins smacked the struggling Cubs 11-1. • The Indians out-slugged the Tigers in a record-tying 12-home-run salute. The
outcome was 17-9. • The D-backs tackled the Giants 6-3 to gain some ground on the Dodgers. • The Blue Jays’ six-game skid ended at Yankee Stadium with an 8-3 win. The Yanks
committed five errors in the game. • The Royals survived a base-running blunder to trip the A’s 4-3. • The Astros handed the Mets a club-record 15th-straight road loss. • The Rangers used an 8-run 5th inning to defeat the Angels 11-5.

Appendix H Task Instructions
H-46
• Brewers got big homers in a 9-3 rout of the Rockies last night. • The Padres rallied late again, with key hits and smart base running to cage the
Dodgers 6-5. Sports Broadcast 6 Your task is to listen to this sports broadcast and find out who the Indians played and who won. Please begin now.
• The Rangers made it look easy with an 8-run 5th to down the Angels 11-5. • A six run 4th inning sparked the Orioles rout of the White Sox 10-4. • The Devil Rays put the squeeze on the Red Sox in the 9th, scoring 5 runs to win it 8-3. • Reds turned on the power in last night’s 8-6 win over the Cubs. • The Marlins smacked the struggling Brewers 11-1. • The Mariners out-slugged the Tigers in a record-tying 12-home-run salute. The
outcome was 17-9. • The D-backs tackled the Giants 6-3 to gain some ground on the Dodgers. • The Blue Jays’ six-game skid ended at Yankee Stadium with an 8-3 win. • The Royals survived a base-running blunder to trip the A’s 4-3. • The Cardinals handed the Dodgers a club-record 10th-straight road loss. • Pirates got big homers in a 9-3 rout of the Padres last night. • The Indians ended a four-game skid with a 23-hit parade versus the Twins. The final
score was 15-7. • The Braves rallied late again to cage the Astros 6-5. • Tempers flared yesterday as the Expos failed to sweep the Phillies. The Phillies
pulled out a win in the 8th with 2 home runs for a 10-8 victory.
Sports Broadcast 7 Your task is to listen to this sports broadcast and find out who the Blue Jays played and who won. Please begin now.
• In baseball action today, the Cubs and White Sox squared-off at Comisky Park with the Cubs taking their cross-town rivals 7-4.
• The Cincinnati Reds dropped the Indians 6-5 at home. The win puts Cincinnati just a half a game out of first place in their division.
• A four-run 6th inning lifted the Houston Astros 7-3 over the visiting Kansas City Royals.
• The Tigers lost to the Twins last night in Minneapolis 9-3. The loss is Detroit’s third in the last four games.
• The Rockies held the Dodgers hitless through five, but an error-filled sixth inning lead to a 4-2 loss in Denver last night.
• The Seattle Mariners met the Anaheim Angels today for a double-header. It was Seattle in the first game 5-2. The second game is now underway and in the bottom of the 5th Seattle is leading 3-2.
• In the Bronx, the Mets faced the Yankees in the second of their three games to decide bragging rights in New York. The Yankees took the Mets 6-2.

Appendix H Task Instructions
H-47
• Out west, in the Battle of the Bay, the San Francisco Giants defeated the Oakland A’s by a score of 5-1.
• While down in Florida, the Marlins squeaked by the Tampa Bay Devil Rays 2-1. That game, played in Miami, was delayed by rain for nearly an hour and a half.
• The Orioles rallied late in the game to take the Diamondbacks 8-6 in 10 innings. • And a late rally by the Blue Jays ended their three-game losing streak with a 5-3
victory over the visiting Montreal Expos. • The Cards lost to the Padres 4-3. • And finally, the Brewers lost to the Pirates by the score of 12-8.
Sports Broadcast 8 Your task is to listen to this sports broadcast and find out who the Cardinals played and who won. Please begin now.
• The Tigers continued their 6-game winning streak by beating the Orioles 10-5 in Baltimore.
• Oakland completed a three-game sweep of the Anaheim Angels with a 7-2 victory. Oakland has now won 6 of its last 8 games.
• The Mariners blew a two-run lead in the bottom of the 8th to lose 9-8 to the Royals. For the Royals, it was there third win in a row.
• The Expos lost to the Mets 8-3. The game was marred by a bench-clearing brawl in the 5th after Montreal pitcher Dan Smith struck Timo Perez with an errant pitch. The game was delayed for a short time while order was restored. No one was ejected but fines are expected after the League reviews tapes of the game.
• In American League action, Cleveland topped the Yankees at home by a score of 12-7.
• In Boston the Red Sox outscored the White Sox 6-3. • And Tampa Bay edged the Twins by the score of 2-1. The only scoring took place in
the third inning. • The Brewers faced the red-hot Atlanta Braves in Milwaukee today for a double-
header. In the first game Atlanta leads by three after 5 innings. The second game is scheduled to start at 7 tonight.
• On the west coast, San Diego lost to San Francisco 11-3 as Barry Bonds hit three-run homers in the 3rd and the 8th innings.
• In St. Louis, the Cardinals dumped the Cubs 8-6 despite three homers by Sammy Sosa. Mark McGuire contributed two homes for the Cards.
• The Marlins are in the midst of a seven-game west coast tour. Today they lost to the Dodgers 5-3. Their next game will be in Seattle the day after tomorrow.
• An finally, the Astros overcame a 4-run deficit to beat the Philadelphia Phillies 7-5 in Houston.
Sports Broadcast 9 Your task is to listen to this sports broadcast and find out who the Reds played and who won. Please begin now.

Appendix H Task Instructions
H-48
• Sheffield returned last night with a bang, but could not put a stop to the Diamondbacks in the Braves 6-8 loss. Sheffield’s solo homer in the 5th was his 26th this season.
• The Angels hammered their way to a 10-4 thrashing of the Indians. Anaheim had an amazing 6 triples in the 4th - a feat that last occurred in the American League in 1999.
• The Rockies continued their streak by destroying the Astros 8-2 in Houston. • Last night the Blue Jays rallied in the 8th to avoid a sweep by the Orioles in
Baltimore. The final score was 5-3. • On the opposite side of the country, Cubs put away the Dodgers 2-1 in LA. • The Red Sox rocked Minnesota in their second straight win over the Twins, beating
them 5-2. • In Yankees-Rangers action last night, Texas cleaned up with a 7-5 win. • The Pirates edged Montreal 2-1. The only runs were scored in the 6th inning. • Alomar spearheaded the White Sox 2-hit shutout over the Devil Rays with final score
of 1-0. • The Cardinals survived eight homeruns by the Padres at home yesterday. The final
score was 11-9. • The Mets finished a three-game sweep against the Reds in New York with a score of
6-4. • The Phillies blew a huge lead and fell to Milwaukee in 10 innings. The outcome was
7-6. • The Tigers hit four homers to end a ten-game skid against the Royals. Torres had
three RBIs in the 9-2 blowout.

Appendix H Task Instructions
H-49
Task 14: Radio Tune “Hard” Practice and Criterion Task: Radio Tune Hard 3 (Practice) Your task is to turn on the radio, switch to the FM band, and tune to 101.9 FM. Please begin now. Radio Tune Hard 1 Your task is to turn on the radio, switch to the FM band, and tune to 107.5 FM. Please begin now. Radio Tune Hard 2 Your task is to turn on the radio, switch to the FM band, and tune to 93.1 FM. Please begin now.

Appendix H Task Instructions
H-50
Task 16: CD Track 7 Practice and Criterion Task: CD 1 (Practice) Your task is to play track 7 of the black CD. Please begin now. CD 2 Your task is to play track 7 of the red CD. Please begin now. CD 3 Your task is to play track 7 of the silver CD. Please begin now. CD 4 Your task is to play track 7 of the purple CD. Please begin now.

Appendix H Task Instructions
H-51
Task 17: Route Tracing Practice and Criterion Task: Route Tracing 1 (Practice) Your task is to trace a route from start to finish through the printed maze. Please begin now. Route Tracing 1 Your task is to trace a route from start to finish through the printed maze. Please begin now.

Appendix H Task Instructions
H-52
Task 18: Delta Flightline Practice and Criterion Task: Delta Flightline 1 (Practice) Your task is to call Delta Flightline to locate a flight departing from Albuquerque around 9 a.m., heading to Cincinnati. Repeat aloud the arrival time in Cincinnati. Please begin now. Delta Flightline 2 Your task is to call Delta Flightline to locate a flight departing from Atlanta around 8 a.m., heading to Boston. Repeat aloud the arrival time in Boston. Please begin now. Delta Flightline 3 Your task is to call Delta Flightline to locate a flight departing from Atlanta around 8 p.m., heading to Memphis. Repeat aloud the arrival time in Memphis. Please begin now. Delta Flightline 4 Your task is to call Delta Flightline to locate a flight departing from Atlanta around 9 a.m., heading to Phoenix. Repeat aloud the arrival time in Phoenix. Please begin now. Delta Flightline 5 Your task is to call Delta Flightline to locate a flight departing from Cincinnati around 9 p.m., heading to Albuquerque. Repeat aloud the arrival time in Albuquerque. Please begin now. Delta Flightline 6 Your task is to call Delta Flightline to locate a flight departing from Cincinnati around 7 a.m., heading to Detroit. Repeat aloud the arrival time in Detroit. Please begin now. Delta Flightline 7 Your task is to call Delta Flightline to locate a flight departing from Cincinnati around 9 p.m., heading to New Orleans. Repeat aloud the arrival time in New Orleans. Please begin now. Delta Flightline 8 Your task is to call Delta Flightline to locate a flight departing from Detroit around 7 a.m., heading to Cincinnati. Repeat aloud the arrival time in Cincinnati. Please begin now. Delta Flightline 9 Your task is to call Delta Flightline to locate a flight departing from Kansas City around 8 a.m., heading to Salt Lake City. Repeat aloud the arrival time in Salt Lake City. Please begin now. Delta Flightline 10 Your task is to call Delta Flightline to locate a flight departing from Los Angeles around 8 a.m., heading to Orlando. Repeat aloud the arrival time in Orlando. Please begin now.

Appendix H Task Instructions
H-53
Delta Flightline 11 Your task is to call Delta Flightline to locate a flight departing from Las Vegas around 7 a.m., heading to Cincinnati. Repeat aloud the arrival time in Cincinnati. Please begin now. Delta Flightline 12 Your task is to call Delta Flightline to locate a flight departing from New Orleans around 7 a.m., heading to Cincinnati. Repeat aloud the arrival time in Cincinnati. Please begin now. Delta Flightline 13 Your task is to call Delta Flightline to locate a flight departing from Orlando around 5 p.m., heading to Los Angeles. Repeat aloud the arrival time in Los Angeles. Please begin now. Delta Flightline 14 Your task is to call Delta Flightline to locate a flight departing from Phoenix around 3 p.m., heading to Atlanta. Repeat aloud the arrival time in Atlanta. Please begin now. Delta Flightline 15 Your task is to call Delta Flightline to locate a flight departing from Salt Lake City around 7 p.m., heading to Denver. Repeat aloud the arrival time in Denver. Please begin now. Delta Flightline 16 Your task is to call Delta Flightline to locate a flight departing from Seattle around 1 p.m., heading to Atlanta. Repeat aloud the arrival time in Atlanta. Please begin now. Delta Flightline 17 Your task is to call Delta Flightline to locate a flight departing from Tucson around 8 a.m., heading to Salt Lake City. Repeat aloud the arrival time in Salt Lake City. Please begin now.

Appendix H Task Instructions
H-54
Task 19: Book-on-Tape Paraphrase Practice and Criterion Task: Book-on-Tape Paraphrase 1 (Practice) Your task is to summarize in your own words the selection you just heard. Please begin now. Book-on-Tape Paraphrase 1 Your task is to summarize in your own words the selection you just heard. Please begin now.

Appendix H Task Instructions
H-55
Task 22: Destination Entry Practice and Criterion Task: Destination Entry 1 (Practice) Your task is to enter the printed address into the navigation system using the scrolling-list function. Please begin now. Destination Entry 1 Your task is to enter the printed address into the navigation system using the scrolling-list function. Please begin now.

Appendix H Task Instructions
H-56
Task 24: Read Text “Easy” Practice and Criterion Task: Read Text Easy 1 (Practice) Your task is to read the printed text and say then out loud the missing word. Please begin now. Read Text Easy 1 Your task is to read the printed text and say then out loud the missing word. Please begin now.

Appendix H Task Instructions
H-57
Task 25: Read Text “Hard” Practice and Criterion Task: Read Text Hard 1 (Practice) Your task is to read the printed text and say then out loud the missing word. Please begin now. Read Text Hard 1 Your task is to read the printed text and say then out loud the missing word. Please begin now.

Appendix H Task Instructions
H-58
Task 28: Read Map “Easy” Practice and Criterion Task: Read Map Easy 1 (Practice) Your task is to use the paper map to determine the relative orientation between Hawthorn and Afton Springs. Please begin now. Practice and Criterion Task: Read Map Easy 11 (Practice) Your task is to use the paper map to determine the relative orientation between Plumeria Creek and Arden Hills. Please begin now. Read Map Easy 2 Your task is to use the paper map to determine the relative orientation between Dewberry and San Pedro. Please begin now. Read Map Easy 12 Your task is to use the paper map to determine the relative orientation between Astoria and Guildford. Please begin now. Read Map Easy 3 Your task is to use the paper map to determine the relative orientation between Lake Hurst and Ralston City. Please begin now. Read Map Easy 13 Your task is to use the paper map to determine the relative orientation between Medley Gardens and Malaga. Please begin now. Read Map Easy 4 Your task is to use the paper map to determine the relative orientation between Burberry and Woolworth. Please begin now. Read Map Easy 14 Your task is to use the paper map to determine the relative orientation between Kingston and O’Connor’s. Please begin now. Read Map Easy 5 Your task is to use the paper map to determine the relative orientation between Edinburgh and St. Andrews. Please begin now. Read Map Easy 15 Your task is to use the paper map to determine the relative orientation between Wimberly and Moray House. Please begin now. Read Map Easy 6 Your task is to use the paper map to determine the relative orientation between Freemont and Newport. Please begin now.

Appendix H Task Instructions
H-59
Read Map Easy 16 Your task is to use the paper map to determine the relative orientation between New Castle and Whipple Place. Please begin now. Read Map Easy 7 Your task is to use the paper map to determine the relative orientation between Griffin and Palmetto. Please begin now. Read Map Easy 17 Your task is to use the paper map to determine the relative orientation between Turnberry and Acorn. Please begin now.

Appendix H Task Instructions
H-60
Task 29: Read Map “Hard” Practice and Criterion Task: Read Map Hard 1 (Practice) Your task is to use the paper map to determine the relative orientation between Sheridan Valley and Warm Springs. Please begin now. Practice and Criterion Task: Read Map Hard 11 (Practice) Your task is to use the paper map to determine the relative orientation between Meridian and Driscoll. Please begin now. Read Map Hard 2 Your task is to use the paper map to determine the relative orientation between Beach Haven and Patna Hills. Please begin now. Read Map Hard 12 Your task is to use the paper map to determine the relative orientation between Franklin Manor and Claysburg. Please begin now. Read Map Hard 3 Your task is to use the paper map to determine the relative orientation between Galena and Wildwood. Please begin now. Read Map Hard 13 Your task is to use the paper map to determine the relative orientation between Dover and Middleburg. Please begin now. Read Map Hard 4 Your task is to use the paper map to determine the relative orientation between Hollylocks and Compton. Please begin now. Read Map Hard 14 Your task is to use the paper map to determine the relative orientation between Glasgow and Stafford. Please begin now. Read Map Hard 5 Your task is to use the paper map to determine the relative orientation between Hanover and Granada. Please begin now. Read Map Hard 15 Your task is to use the paper map to determine the relative orientation between Bremen and Point Pleasant. Please begin now. Read Map Hard 6 Your task is to use the paper map to determine the relative orientation between Colombo and Wyndham. Please begin now.

Appendix H Task Instructions
H-61
Read Map Hard 16 Your task is to use the paper map to determine the relative orientation between Fern Valley and Blue Ridge. Please begin now. Read Map Hard 7 Your task is to use the paper map to determine the relative orientation between Huntington and Canterbury. Please begin now. Read Map Hard 17 Your task is to use the paper map to determine the relative orientation between Carson Hill and Lakewood. Please begin now.

I-1
I Appendix I. Data Collection Forms
This appendix contains copies of the printed Data Collection Forms developed for the CAMP DWM Project, Task 2. The material is presented as it was presented in Task 2.
These paper-pencil forms were used throughout the project, from pre-qualifying and interviewing individuals considered as participants in the study, through having participants judge their comfort and confidence for performing tasks while driving, to rating the tasks completed during the study. The forms were either completed by the study participants or the study coordinator.

Appendix I Data Collection Forms
I-2
DWM Task 2
Paper Pencil Forms
Driver Workload Metrics CAMP
IVI Light Vehicle Enabling Research Program

Subject # _______ Date___________
Expt ___________
I-3
List of Forms This appendix contains the following forms that were used throughout the study:
• Informed Consent Document • Subject Information Letter • Initial Questionnaire • In-Vehicle Activities Questionnaire • Comfort & Confidence Questionnaire for Tasks Performed While Driving • Overall Workload • Ratings of Multitasking Difficulty • Ratings of Situational Awareness • Structured Debriefing After On-Road Data Collection • Rating Scale for Alertness • Evaluation of Physical State

Subject # _______ Date___________
Expt ___________
I-4
Informed Consent I, , agree to participate in a research aimed at identifying and measuring driver workload and distraction.
1. You are being asked to volunteer as a participant in a research project whose purpose and description are contained in the Information Letter that you would have received in the mail and reviewed it prior to your arrival today. As a test participant, you will be asked to take part in two full days of research activities. These activities consist of the following:
a. Training Session. This familiarizes you with the vehicle systems with which
you will be working, and trains you on the tasks that you will be asked to perform.
b. Skill Assessments. These consist of computerized and paper and pencil tests
that analyze skills useful for driving.
c. Laboratory-Based Testing Of In-Vehicle Devices and Tasks. In this segment, you will be asked to perform the tasks learnt during the Training Session in the laboratory. This will include using a simple driving simulator, and using a special apparatus for viewing the devices while you use them.
2. There are some risks and discomforts to which you expose yourself in volunteering
for this research.
a. It is possible that you may experience some fatigue by the end of the study days that are each designed to be approximately 8 hours long. To help alleviate this, you will be provided with a lunch break, as well as mid-morning and mid-afternoon breaks. You will also be asked to evaluate your level of alertness regularly during the course of the study days so that we can provide additional breaks if needed.
b. While you are performing tasks in the laboratory, cameras will be used to
videotape your task behavior. This may initially cause you to feel self-conscious; however any feelings of this type will diminish rapidly as you become familiar with the tasks and the testing method.
c. Use of a driving simulator can lead some people to experience mild levels of
discomfort similar to motion sickness. To minimize the possibility of these effects, you will be given a break before and after each simulator session. The experimenter will inform you of the symptoms which can indicate that you are starting to experience this type of simulator discomfort, and will be monitoring for these symptoms throughout your use of the simulator. In addition, the experimenter will be asking you questions at regular intervals

Subject # _______ Date___________
Expt ___________
I-5
that have been developed to identify any physical discomfort that you are experiencing. If discomfort is reported by you, or noticed by the experimenter, the experimenter will give you a break and end the simulator session at that time.
d. Risks that are normally present in working at a computer-based workstation
equipped with headphones or similar equipment, such as discomfort from wearing headphones, falling out of a chair, and the like. To help ensure minimal risk to you, the following precautions have been taken:
i. The test area is equipped with a fire extinguisher, first-aid kit, a
defibrillator, and a cellular phone, which may be used in an emergency.
ii. If an emergency does occur, the experimenters will arrange medical
transportation to a nearby hospital emergency room. You will be required to undergo examination by medical personnel in the emergency room. Experimenters are trained in First Aid and CPR, and will be present with you in the test facility at all times.
iii. All data collection equipment is mounted such that, to the greatest
extent possible, it does not pose a hazard to test participants in any foreseeable case.
iv. The test equipment, which includes headphones and a special set of
goggles that are worn like a pair of spectacles, will have been cleansed and disinfected thoroughly before you are asked to wear them, and fresh (unused) nose pieces and temple pieces for the goggles will have been attached.
3. The purpose of our testing is not to evaluate you or your skills. The data gathered in
this study will be treated with anonymity and if you agree to participate in this study, your name will not be voluntarily released to anyone who does not work on this project. Only a number will identify your data and the Principal Investigator will keep your name separate from the data. Your name will not appear in any reports or papers written about the project. The data collected and recorded in this study will be analyzed along with data gathered from other test participants. The researchers or their parent organizations may publicly release this in final reports or other publications or media for educational, outreach, and research purposes. However, your name and personal identifying information will not be included in any of these public releases. The video data collected and recorded in this study includes your video likeness. The researchers or their parent organizations may publicly release this video data in continuous video or still formats, either separately or in association with the

Subject # _______ Date___________
Expt ___________
I-6
appropriate data. However, you name and other personal identifying information will not be included in any of these public releases. Please note that, should you be involved in an event during testing which results in legal action, the researchers or their respective organizations may be required to release personal identifying information and associated test data, in response to a court action. You will be asked to sign an information disclosure statement. By signing the information disclosure statement, you agree that the research team, and its authorized contractors and agents, will have the right to use the engineering data and the video data for educational, outreach, and research purposes, in perpetuity, including dissemination or publication of your likeness in continuous video or still photo format, but that neither the research team nor its authorized contractors or agents shall release your name or other personal identifying information; and you understand that, in the event of court action, the research team may not be able to prevent release of your name or other personal information.
4. You will be paid $320 for participation in this study. The study will be conducted
over a period of two days, about 8 hours each day. Payment will be made by check and mailed out to you by MORPACE after the completion of your study on the second day.
5. There are no direct benefits to you from this research. However, by participating in
this study, you are lending your experience as a driver to research aimed at understanding how to identify and limit driver distraction and overload. It is intended to ultimately improve traffic safety. You will not be informed of the results of this study.
6. By agreeing to participate, you certify that you possess a valid, unrestricted (except
for corrective eye glasses), U.S. photo drivers license, have a minimum of 2 years driving experience, are 20 years of age or older, have normal hearing and vision (with correction allowed), are able to drive an automatic transmission vehicle without special equipment, are able to give informed consent and are not under the influence of alcohol, drugs, or any other substances (e.g., antihistamines) which may impair your ability to drive.
7. You also certify that you do not have a history of heart condition or prior heart attack,
lingering effects of brain damage from stroke, tumor, head injury, or infection, epileptic seizures in the past 12 months, shortness of breath or chronic medical therapy for uncontrolled respiratory disorders, a history of motion sickness, a history of inner ear problems, dizziness, vertigo, or balance problems, diabetes for which insulin is required, glaucoma or macular degeneration, chronic migraine or tension headaches, neurological conditions, are pregnant or possibly pregnant, or have any other medical conditions that may affect your ability to drive.

Subject # _______ Date___________
Expt ___________
I-7
8. Additionally, you have not used alcohol, drugs, or any other substances (e.g., antihistamines) that will impair your ability to drive for a period of no less than 24 hours prior to participation.
9. Further, you certify that you have a good driving record (and understand that it will
be verified by the State of Michigan). This means that you must not have had history a combined total of five or more moving violations or at-fault accidents within the past 36 months, or a combined total of four or more moving violations or at-faults accidents within the past 24 months, or a combined total of three or more moving violations or at-fault accidents within the past 12 months. In addition, they must not have been convicted within the past 36 months of any of the following motor vehicle violations: driving while operator’s license is suspended, revoked, or denied; vehicular manslaughter, negligent homicide, felonious driving, or felony with a vehicle; operating a vehicle while impaired, under the influence of alcohol or illegal drugs, or refusing an alcohol test; failure to stop or identify after a crash (includes leaving the scene of a crash; hit and run, giving false information to a law enforcement officer); eluding or attempting to elude a law enforcement officer; traffic violation resulting in death, catastrophic injury, or serious injury; careless or reckless driving; or any other violations warranting suspension or revocation of license. In addition, your signature indicates that you do not have a history of heart condition or prior heart attack, lingering effects of brain damage from stroke, tumor, head injury, or infection, epileptic seizures in the past 12 months, shortness of breath or chronic medical therapy for uncontrolled respiratory disorders, a history of motion sickness, a history of inner ear problems, dizziness, vertigo, or balance problems, diabetes for which insulin is required, chronic migraine or tension headaches, any other neurological conditions, any medical conditions which may affect your ability to drive, or are pregnant (or possibly pregnant). You certify that you not have used alcohol, drugs, or any other substances (e.g., antihistamines) which will impair your ability to drive for a period of no less than 24 hours prior to participation. In addition, you certify that you are able to drive without sunglasses during daytime conditions, do not wear automatically-tinting corrective lenses, are willing to refrain from wearing eye makeup on the days of the study, and are willing to wear a baseball-style cap on which a small eye-view monitoring device is mounted. This device is very lightweight.
10. The experimenters will answer any questions you might have about this project and
you should not sign this informed consent form until you are satisfied that you understand all of the previous descriptions and conditions. You may contact the principal investigators at the following address and telephone number:
Linda S.Angell, Ph.D.

Subject # _______ Date___________
Expt ___________
I-8
Louis Tijerina, Ph.D. CAMP 39303 Country Club Drive, Suite B-30 Farmington Hills, Michigan 48331 (248) 848-9595 ext. 12 and 13
11. If information becomes available which might reasonably be expected to affect your
willingness to continue participating in this study, this information will be provided to you.
12. Participation in this study is voluntary. You may withdraw from this study at any
time, and for any reason, without penalty. Should you withdraw, you will be paid for the portion of the study you either completed or started.
13. By signing this form you certify that, to the best of your knowledge, you have no
physical ailments or conditions which could either be further aggravated or adversely affected by participation in this study.

Subject # _______ Date___________
Expt ___________
I-9
I have read this form and understand the scope of this research program and I have no other questions at this time. I understand that I am free to ask questions at any time. I hereby give my consent to participate, but I understand that I may stop at anytime, if I choose to do so. Signature:_____________________________________ Date:___________________ Please fill in the following: Name:________________________________________ Address:______________________________________ City, State, and Zip:_____________________________ Telephone:____________________________________ Researcher Name:______________________________ Date:___________________ Witness:______________________________________ Date:___________________ Information Disclosure Statement: I, __________________________, grant permission, in perpetuity, to the researchers and their parent organizations, to use, publish, or otherwise disseminate engineering data and videotape data (including continuous video and still photo formats derived from the video recording) collected about me in this study for educational, outreach, and research purposes. I understand that such use may involve widespread distribution to the public and may involve dissemination of my likeness in videotape or still photo formats, but will not result in release of my name or other identifying personal information by the researchers or their parent organizations or their authorized contractors or agents. I understand, however, that in case of a crash or other event resulting in legal action, the research team may be required by subpoena or other court action to release identifying personal information. Signature:_____________________________________ Date:___________________ Researcher Name:______________________________ Date:___________________ Witness:______________________________________ Date:___________________

Subject # _______ Date___________
Expt ___________
I-10
Subject Information Letter Dear Participant, You are being asked to participate in research that will examine people’s behavior while they drive and perform various in-vehicle tasks at the same time (such as tuning the radio, using a cell phone, conversing with a passenger, and some tasks with new devices). The data from this study will help to identify driver distraction, and how to measure it. Our goal is to develop a method that can be used by automotive manufacturers to evaluate and limit the workloads associated with advanced information systems. Our hope is that these methods will be a means through which some distraction-related crashes can be prevented. As a participant, you will be asked to take part in two full days of research activities. These activities consist of the following:
• Training Session. This familiarizes you with the vehicle systems with which you will be working, and trains you on the tasks that you will be asked to perform.
• Skill Assessments. These consist of computerized and paper and pencil tests that
analyze skills useful for driving.
• Laboratory-Based Testing Of In-Vehicle Devices and Tasks. In this segment, you will be asked to perform the tasks learnt during the Training Session in the laboratory. This will include using a simple driving simulator, and using a special apparatus for viewing the devices while you use them.
To participate, you must have a valid, unrestricted (except for corrective lenses or eye glasses), U.S. photo drivers license, have a minimum of 2 years driving experience, be 20 years of age or older, have normal hearing and vision (with correction allowed), be able to drive an automatic transmission vehicle without special equipment, be able to give informed consent, and not be under the influence of alcohol, drugs, or any other substances (e.g., antihistamines) which may impair your ability to drive. In addition, you must have a good driving record (as verified by the State of Michigan). This means that you must not have had a history that includes a combined total of five or more moving violations or at-fault accidents within the past 36 months, or a combined total of four or more moving violations or at-faults accidents within the past 24 months, or a combined total of three or more moving violations or at-fault accidents within the past 12 months. In addition, you must not have been convicted within the past 36 months of any of the following motor vehicle violations: driving while operator’s license is suspended, revoked, or denied; vehicular manslaughter, negligent homicide, felonious driving, or felony with vehicle; operating a vehicle while impaired, under the influence of alcohol or illegal drugs, or refusing an alcohol test; failure to stop or identify after a crash (includes leaving the scene of a crash; hit and run, giving false information to a law enforcement officer); eluding or attempting to elude a law enforcement officer; traffic violation resulting in death,
Subject # _______ Date___________
Expt ___________
I-11
catastrophic injury, or serious injury; careless or reckless driving; or any other violations warranting suspension or revocation of license. In addition you must not have a history of heart condition or prior heart attack, lingering effects of brain damage from stroke, tumor, head injury, or infection, epileptic seizures in the past 12 months, shortness of breath or chronic medical therapy for uncontrolled respiratory disorders, a history of motion sickness, a history of inner ear problems, dizziness, vertigo, or balance problems, diabetes for which insulin is required, glaucoma or macular degeneration, chronic migraine or tension headaches, any other neurological conditions or medical conditions which may affect your ability to drive, or be pregnant. You must not have used alcohol, drugs, or any other substances (e.g., antihistamines) which will impair your ability to drive for a period of no less than 24 hours prior to participation. In addition, you must be able to drive without sunglasses during daytime conditions, must not wear automatically-tinting corrective lenses, must be willing to refrain from wearing eye makeup on the days of the study, and must be willing to wear a baseball-style cap on which a small eye-view monitoring device is mounted. This device is very lightweight. There are some risks and discomforts to which you expose yourself in volunteering for this research.
a. It is possible that you may experience some fatigue by the end of the study days that are each designed to be approximately 8 hours long. To help alleviate this, you will be provided with a lunch break, as well as mid-morning and mid-afternoon breaks. You will also be asked to evaluate your level of alertness regularly during the course of the study days so that we can provide additional breaks if needed.
b. While you are performing tasks in the laboratory, cameras will be used to videotape
your task behavior. This may initially cause you to feel self-conscious; however any feelings of this type will diminish rapidly as you become familiar with the tasks and the testing method.
c. Use of a driving simulator can lead some people to experience mild levels of
discomfort similar to motion sickness. To minimize the possibility of these effects, you will be given a break before and after each simulator session. The experimenter will inform you of the symptoms which can indicate that you are starting to experience this type of simulator discomfort, and will be monitoring for these symptoms throughout your use of the simulator. In addition, the experimenter will be asking you questions at regular intervals that have been developed to identify any physical discomfort that you are experiencing. If discomfort is reported by you, or noticed by the experimenter, the experimenter will give you a break and/or end the simulator session at that time.
d. Risks that are normally present in working at a computer-based workstation equipped
with headphones or similar equipment. To help ensure minimal risk to you, the following precautions have been taken:

Subject # _______ Date___________
Expt ___________
I-12
i. The test area is equipped with a fire extinguisher, first-aid kit, a defibrillator, and a cellular phone, which may be used in an emergency.
ii. If an emergency does occur, the experimenters will arrange medical transportation
to a nearby hospital emergency room. You will be required to undergo examination by medical personnel in the emergency room. Experimenters are trained in First Aid and CPR, and will be present with you in the test facility at all times.
iii. All data collection equipment is mounted such that, to the greatest extent possible,
it does not pose a hazard to test participants in any foreseeable case. iv. The test equipment, which includes headphones and a special set of goggles
(which are worn on the head like a pair of spectacle), will have been cleansed and disinfected thoroughly before you are asked to wear them, and fresh (unused) nose-pieces and temple pieces for the goggles will have been attached.
Benefits: There are no direct benefits to you from this research other than compensation for your time and effort. However, by participating in this study, you are lending your experience as a driver to research aimed at understanding how to identify and limit driver workload. The work is intended to lead to device improvements so that they do not overload drivers or interfere excessively with driving performance. You will not be informed of the results of this study. Payment: You will be paid $320 for participation in this study. The study will be conducted over a period of two days, about 8 hours each day. Payment will be made by check and mailed out to you by MORPACE after the completion of your study on the second day. Withdrawal: Participation in this study is voluntary. You may withdraw from this study at any time, and for any reason, without penalty. Should you withdraw, you will be paid for the portion of the study you either completed or started. Confidentiality: The data gathered in this study will be treated with anonymity. The purpose of our testing is not to evaluate you or your skills. If you agree to participate in this study, your name will not be voluntarily released to anyone who does not work on this project. Only a number will identify your driving data. The Principal Investigator will keep your name separate from the data. Your name will not appear in any reports or papers written about the project. The data collected and recorded in this study will be analyzed along with data gathered from other test participants. The researchers or their parent organizations may publicly release this in final reports or other publications or media for educational, outreach, and research purposes. However, your name and personal identifying information will not be included in any of these public releases. The video data collected and recorded in this study includes your video likeness. The researchers or their parent organization may publicly release this video data (in continuous video or still formats), either separately or in association with the appropriate data. However,

Subject # _______ Date___________
Expt ___________
I-13
your name and other personal identifying information (except your video likeness) will not be included in any of these public releases. Please note that, should you be involved in an event during testing which results in legal action, the researchers or their respective organization may be required to release personal identifying information and associated test data, in response to a court action. You will be asked to sign an information disclosure statement. By signing the information disclosure statement, you agree that the research team, and its authorized contractors and agents, will have the right to use the engineering data and the video data for educational, outreach, and research purposes, in perpetuity, including dissemination or publication of your likeness in continuous video or still photo format, but that neither the research teach nor its authorized contractors or agents shall release your name or other personal identifying information; and you understand that, in the event of court action, the research team may not be able to prevent release of your name or other personal information. If you are willing to volunteer, you will be required to read and sign the Informed Consent Form before you can actually participate in the study. Thank you for considering this research opportunity, we look forward to meeting with you!

Subject # _______ Date___________
Expt ___________
I-14
Initial Questionnaire 1. Education
A. Some high school B. Completed high school C. Some post-secondary school D. Some trade school/college E. Trade school/college diploma F. Undergraduate degree G. Master’s degree H. Ph.D. degree I. Other ________________________
2. Occupation
A. Clerical B. Professional C. Owner/manager D. Laborer E. Self employed F. Other ________________________
3. Employment status
A. Currently employed full time B. Currently employed part time C. Unemployed D. Retired E. Other ________________________
4. Household income
A. $0 -$25,000 B. $25,000-$50,000 C. $50,000-$75,000 D. $75,000-$100,000 E. $100,000-$125,000 F. >$125,000
5. Please indicate your spiritual/religious background or affiliation, if any: _______________________________________________________________ 6. Are you experienced with any of the following computer systems (circle all that apply)?
A. IBM compatible (Windows 95/98/NT/2000) B. Macintosh/Apple C. Other PC System

Subject # _______ Date___________
Expt ___________
I-15
7. How often do you use computer systems each week (circle one)?
A. One or more times a day B. One or more times a week C. One or more times a month D. A few times a year E. Rarely, if ever F. Do not know how to use computers G. Do not have access to computers
8. Do you own a cell phone (circle one)?
A. Yes B. No
9. How often do you use a cell phone (circle one)?
A. Daily B. Weekly C. Monthly D. A few times a year E. Rarely if ever
10. Does your phone have a hands-free capability for listening (circle one)?
A. Yes B. No
11. Does your phone have a hands-free capability for dialing – using your voice (circle one)?
A. Yes B. No
12. Please refer to the list below and on the following pages. Do you have any experience using any of the following systems within a vehicle while driving (Circle all that apply)? If you circled a system, please indicate how knowledgeable you feel about the system.
How knowledgeable are you about these systems?
Devices Not at All Slightly Quite Very Extremely Navigation Systems
1. Alpine NVE-N871A 1 2 3 4 5 2. Blaupunkt Travel Pilot DX-N 1 2 3 4 5 3. Blaupunkt Travel Pilot RNS-150 1 2 3 4 5 4. BMW Navigation System 1 2 3 4 5 5. Cadillac Navigation System 1 2 3 4 5 6. Clarion AutoPC 310c 1 2 3 4 5 7. Denso NAVIRA DV-D30S Plus 1 2 3 4 5

Subject # _______ Date___________
Expt ___________
I-16
How knowledgeable are you about these systems?
Devices Not at All Slightly Quite Very Extremely 8. DestinAtor by PowerLOC
Technologies 1 2 3 4 5
9. Fujitsu Ten Eclipse 1 2 3 4 5 10. Garmin StreetPilot III 1 2 3 4 5 11. Hertz NeverLost 1 2 3 4 5 12. Honda Acura Navigation System 1 2 3 4 5 13. Infinity Navigation System 1 2 3 4 5 14. Kenwood KNA-DV2100 1 2 3 4 5 15. Lexus Navigation System 1 2 3 4 5 16. Magellan Pathmaster 1 2 3 4 5 17. Mercedes Benz COMAND 1 2 3 4 5 18. Mercedes ML Navigation 19. Nissan Pathfinder Navigation
System 1 2 3 4 5
20. Philips Carin 522 GPS 1 2 3 4 5 21. Pioneer AVIC-9DVD 1 2 3 4 5 22. Pioneer AVIC-505 with voice
recognition 1 2 3 4 5
23. Pronounced Technologies AudioNav AN221
1 2 3 4 5
24. Rand McNally TripLink 1 2 3 4 5 25. TravRoute Co-Pilot 2001 1 2 3 4 5 26. Horizon (Visteon) NavMate 1 2 3 4 5 27. Dayton MR 6000 1 2 3 4 5 28. Volvo Navigation System 1 2 3 4 5 29. Xanavi BIRDVIEW XN-770A 1 2 3 4 5
Voice Communication (cell phones) 30. Ericsson R280LX Cellular
Telephone 1 2 3 4 5
31. Ericsson R380s Smartphone 1 2 3 4 5 32. Motorola V Series 120c Phone 1 2 3 4 5 33. Motorola StarTAC ST7760 Phone 1 2 3 4 5 34. Nokia 282 Analog Cell Phone 1 2 3 4 5 35. QualComm QCP-820
Cellularphone 1 2 3 4 5
36. Other cell phone 1 2 3 4 5

Subject # _______ Date___________
Expt ___________
I-17
Text Communication (E-mail & Text Messaging)
37. Motorola Timeport P935 Pager 1 2 3 4 5 38. Motient eLink Wireless E-mail 1 2 3 4 5 39. Motorola T900 pager and e-mail 1 2 3 4 5 40. Productivity & Mobile PC 1 2 3 4 5 41. Cellport 3000 1 2 3 4 5 42. Delphi Communiport 1 2 3 4 5 43. Ericsson Mobile Companion
MC218 1 2 3 4 5
44. Mobile Aria 1 2 3 4 5 45. Motient MobileMAX2 1 2 3 4 5 46. Nokia 9290 Communicator 1 2 3 4 5 47. Palm m500 Handheld 1 2 3 4 5 48. QualComm MVPc 1 2 3 4 5 49. Revolve Roadwriter 1 2 3 4 5 50. Terion Mobile Messenger 1 2 3 4 5 51. Valde Vehicle PC 1 2 3 4 5
Multi-Function (Integrated) Devices 52. (Delphi Automotive Systems) 1 2 3 4 5 53. Harmony Generation 1 (Johnson
Controls) 1 2 3 4 5
54. iRadio Telematics System 1 2 3 4 5 55. Mercedes-Benz TeleAid 1 2 3 4 5 56. OnStar, GM 1 2 3 4 5

Subject # _______ Date___________
Expt ___________
I-18
In-Vehicle Activities Questionnaire
Please indicate whether you do these activities while you drive:
In-Vehicle Activity
Do you do this while driving?
(Yes or No)
If yes, how often do you do it while driving?
(Never - Occasionally - Weekly - Daily - More)
Selecting coins from a coin holder Insert a cassette Adjust your heating, ventilation, and air conditioning system
Simple radio tuning, using the tune knob
Manually dial a cell phone Travel computations (e.g., figuring out how far it is to your destination)
Determining what direction you will be going after a turn
Voice-dial a cell phone Listen to a book-on-tape Tell a passenger about a news story, or other topic of interest
Participate in simple dialog with a passenger
Try to recall route instructions given to you verbally
Listen to sports broadcast to see who a favorite team played and who won
Perform a sequence of operations on your radio (turn it on, switch AM/FM band, tune to station)
Select and insert a CD in the CD player
Look at a map to find a route from a point of origin to a destination
Call for airline flight information using a cell phone with voice capability
Enter a destination in a navigation system
Read simple messages

Subject # _______ Date___________
Expt ___________
I-19
Reading longer messages Figure out positions of destinations on a simple map
Figure out positions of destinations on a detailed map
How would you rate your ability to multitask? (Please circle a rating). 1 2 3 4 5 6 7
Poor Average Outstanding How often do you find yourself trying to do multiple tasks at once? (e.g., talking on the phone while using the computer, or eating while driving) (Please circle a rating).
1 2 3 4 5 6 7
Almost Never Occasionally Very Frequently How do you feel when you are in a situation where you must multitask? (Please mark an option). ___Frustrated ___Anxious ___Stimulated ___Other _______________ When you are in a situation in which you must multitask, which tends to be most true of you? (Please mark an option).
___ My performance on both tasks is often as good as if I did them one at a time.
___ My performance on one or the other task tends to suffer somewhat when I am doing two tasks together (as compared to when I do them one at a time). Thank you for your answers!

Subject # _______ Date___________
Expt ___________
I-20
Comfort and Confidence Questionnaire
for Tasks Performed while Driving Please review the list of tasks on the next 6 pages that drivers sometimes do while driving. Rate each task on the four scales that follow. Degree of Comfort for Self The first rating that you will give is how comfortable you would be doing this task when driving under normal conditions. Here is the rating scale that you will use to judge your comfort level with doing the task while driving:
So when you use this scale to rate your level of comfort with doing a task while driving, a rating of “seven” means that you would be completely comfortable, a rating of “one” will mean that you would be completely uncomfortable, and a midpoint-rating of “four” means that you would be neither comfortable nor uncomfortable. Degree of Confidence for Self Second, rate the confidence you have in your ability to do this task and continue to drive safely, i.e., keep in your lane, not follow too closely, and be aware of changes in traffic such as the car ahead of you stopping suddenly or a pedestrian stepping into the roadway. Here is the rating scale you will use to judge your confidence in whether you can successfully drive while doing the task. By “successfully drive,” we mean that you can monitor the road and the traffic for important events or changes, and also maintain appropriate lane position, speed, and headway while doing the task:
1 2 3 4 5 6 7
Degree of Confidence
No confidence that you can do all of this and the task
Uncertain Complete confidence that
you can do all of this and the task
1 2 3 4 5 6 7
Degree of Comfort
Completely Uncomfortable
Neither Comfortable Nor Uncomfortable
Completely Comfortable

Subject # _______ Date___________
Expt ___________
I-21
So when you use this scale to rate your level of confidence in whether you can successfully drive and do the task, a rating of “seven” will mean that you are completely confident that you could successfully drive and do the task, a rating of “one” will mean that you are completely confident that you could NOT successfully drive and do the task, and a midpoint-rating of “four” would mean that are uncertain. Degree of Comfort with Other Driver Third, rate how comfortable you would be with the ability of a driver in a car near you doing the task while continuing to drive safely. Here is the rating scale you will use to judge your comfort level with another driver doing a task while driving:
So when you use this scale to rate your level of comfort with another driver doing a task while driving, a rating of “seven” means that you would be completely comfortable with another driver doing this task, a rating of “one” will mean that you would be completely uncomfortable, and a midpoint-rating of “four” means that you would be neither comfortable nor uncomfortable. Degree of Confidence with Other Driver Fourth, rate how confident you would be with a driver in a car near you doing the task while continuing to drive safely. Here is the rating scale you will use to judge your confidence in whether another driver can successfully drive while doing the task. By “successfully drive,” we mean that the driver can monitor the road and traffic for important events or changes, and also maintain appropriate lane position, speed, and headway while doing the task:
1 2 3 4 5 6 7
Degree of Confidence with Other Driver
No confidence that you can do all of this and the task
Uncertain Complete confidence that
you can do all of this and the task
1 2 3 4 5 6 7
Degree of Comfort with Other Driver
Completely Uncomfortable
Neither Comfortable Nor Uncomfortable
Completely Comfortable

Subject # _______ Date___________
Expt ___________
I-22
So when you use this scale to rate your level of confidence with another driver doing a task while driving, a rating of “seven” will mean that you are completely confident that the other driver could successfully drive and do the task, a rating of “one” will mean that you are completely confident that the other driver could NOT successfully drive and do the task, and a midpoint-rating of “four” would mean that you are uncertain of the other driver’s performance. Sample question: Imagine that you were driving by yourself and were to undertake the task of using a paper map to plan a route to a destination.
a. How comfortable would you be of using a paper map to plan a route to a destination during normal driving?
b. How confident would you be that you could successfully maintain lane position, speed, and headway – and also detect changes in traffic while using a paper map to plan a route to a destination?
1 2 3 4 5 6 7
Degree of Confidence
No confidence that you can do all of this and the task
Uncertain Complete confidence that you
can do all of this and the task
1 2 3 4 5 6 7
Degree of Comfort
Completely Uncomfortable
Neither Comfortable Nor Uncomfortable
Completely Comfortable

Subject # _______ Date___________
Expt ___________
I-23
c. Now – suppose a driver in the vehicle next to you or behind you were to undertake the task of using a paper map to plan a route to a destination during normal driving?
d. How confident would you be that the driver could successfully maintain lane position, speed, and headway – and also detect changes in the traffic while using a paper map to plan a route to a destination
Okay, do you have any questions about the kind of evaluations we will be asking you for?
1 2 3 4 5 6 7
Degree of Confidence with Other Driver
No confidence that you can do all of this and the task
Uncertain Complete confidence that
you can do all of this and the task
1 2 3 4 5 6 7
Degree of Comfort with Other Driver
Completely Uncomfortable
Neither Comfortable Nor Uncomfortable
Completely Comfortable

Subject # ____ Date ____________ Experimenter Initials ______
I-24
Degree
of Comfort for Self
Degree of Confidence
for Self
Degree of Comfort
with Other Driver
Degree of Confidence with Other
Driver
Task
1 2 3 4 5 6 7
1 Changing FM radio frequency from 100.1 FM to 104.3 FM
2 Turn on the radio, select band, and tune to specific frequency
3 Call home by manually dialing the phone number using the cell phone
4 Call home by voice-dialing the phone number using the cell phone
5 Adjust the heating and ventilation system in the vehicle
6 Select coins from a coin holder for a specific amount
7 Insert cassette tape to a cassette player 8 Determine direction of travel after each
turn on a route (routing orientation)
9 Listen to & repeat route instructions from origin to destination
10 Listen to book-on-tape 11 Retell a book-on-tape passage 12 Listen to a sports broadcast for a game
and remember the outcome of a team
13 Make travel computations such as total miles traveled or money spent on tolls
14 Answer questions such as your name or what type of car you drive
15 Set cruise control 16 Select a CD from a holder and insert it in
a CD player
17 Determine the direction from one city to another on a map
18 Write a short note such as a phone number or address
19 Enter a destination in a navigation system 20 Read a short note and answer a question
about its contents
21 Have a conversation with a passenger

Subject # ____ Date ____________ Experimenter Initials ______
I-25
22 Listen to instructions on how to get to a friends house and repeat them
23 Call an airline’s automated information service to find out when a plane is landing
24 Answer a ringing cell phone Thank you. Do you have any comments or questions about this list of tasks?

Subject # ____ Date ____________ Experimenter Initials ______
I-26
Overall Workload Please put a mark on the scale at the point that best corresponds to how you rate your workload when performing each task. Select coins from holder
Insert cassette
Adjust your heating, ventilation, and air conditioning system
Tune radio using tone knob
Manually dial cell phone
Do travel computations
Determine what direction you will be going after a turn
Very Low Very High
Very Low Very High
Very Low Very High
Very Low Very High
Very Low Very High
Very Low Very High
Very Low Very High

Subject # ____ Date ____________ Experimenter Initials ______
I-27
Voice-dial cell phone
Listen to book-on-tape
Retell a story
Participate in simple dialogue
Recall route instructions told to you
Listen to sports broadcast for a “favorite” team
Turn on radio, switch AM/FM band, & manually tune to a given station using the tune knob
Select & insert CD into player
Very Low Very High
Very Low Very High
Very Low Very High
Very Low Very High
Very Low Very High
Very Low Very High
Very Low Very High
Very Low Very High

Subject # ____ Date ____________ Experimenter Initials ______
I-28
Trace a path through a maze
Call Delta Flightline for flight information
Enter an address into a navigation system
Read simple text
Read longer text
Figure out relative positions of destination on a simple map
Figure out relative positions of destinations on a complex, cluttered map
Very Low Very High
Very Low Very High
Very Low Very High
Very Low Very High
Very Low Very High
Very Low Very High
Very Low Very High

Subject # ____ Date ____________ Experimenter Initials ______
I-29
Ratings of Multitasking Difficulty You have completed a variety of tasks and now that you are familiar with them, we would like you to make some judgments about them. First, we would like you to reflect on how difficult each of the tasks is to perform while driving. We would like you to consider that while you drive you need to maintain your lane position, your speed, and your headway so that they are appropriate and you also need to detect changes in the surrounding traffic and roadway area. Given that you have to do all of that while driving, we want to know how difficult you feel it is to do each of these tasks while driving. To do this comparison, we would like you to compare each task in the list below to a “reference task.” The task that we want you to use as a standard for comparison is the radio tuning task which consisted of turning on the radio, switching to the FM band, and tuning to a specific frequency. Please think about how difficult it is to do this standard reference task while driving and assign this difficulty level a value of “100 difficulty points.” Then consider each other task in the list below in terms of its difficulty to do while driving and compare that level of difficulty-while-driving to that of the reference task. When you do this comparison, we want you to respond by answering two questions: 1. Is it more or less difficult to combine a comparison task with driving (e.g., calling
home by manually dialing the phone) than it is to combine the standard Radio Tuning task with driving, or is it about the same?
For this question, you can write an “M” (for more difficult to do while driving than the reference task), “L” (for less), or “S” (for the same) in the space provided.
2. By how much is the comparison task more or less difficult to combine with driving? For this question, assume the Radio Tuning task has the value of “100 difficulty points” that represent how difficult it is to do while driving. Ask yourself: “How much harder or easier is the comparison task than the standard reference task to do while driving?”
For example, if you were asked to evaluate the task of reading a paper map, you might decide that it is twice as hard to combine with driving as radio tuning. In this case, you would give it the value of 200 points. If you thought it was 4 times as hard, you would give it a value of 400 points. On the other hand, if a task is only one-half as hard to combine with driving as radio-tuning, you should give it the value of 50 points. If a task were only 1/10th as hard to do while driving as radio tuning, you should give it a value of 10 points.
Okay, if you are ready to try making these judgments, please proceed to the sample questions below. Since these are just examples for you to work with, the tasks are ones that you did not do today, but which are likely to be familiar to you.

Subject # ____ Date ____________ Experimenter Initials ______
I-30
Examples for Practice
Standard Task to Which All Others Should Be Compared
Think about how hard it is to do this radio tuning task while driving (maintaining lane position, speed, and headway, and detecting objects/events on or near the roadway). Then compare each of the following tasks to that difficulty level:
Difficulty of Task While Driving TASK More, Less, or Same? Value? Using a power window switch to lower the car’s window
Using a paper map to determine where you should turn next in order to reach your destination
If you have any questions about this procedure, please ask your experimenter. If not, then please proceed now to fill out the remainder of the questionnaire. As you work, please remember that if you experienced difficulty doing a task while driving, it is very likely that other drivers will too. If something felt difficult to do while driving, try to describe it that way. Please do not assume that difficulty is due to your skills or abilities, it is most likely due to the task. And it is the task’s difficulty that we are trying to learn about.
Tune Radio (Turn On, Switch to FM, Tune to Frequency) = 100 points

Subject # ____ Date ____________ Experimenter Initials ______
I-31
Ratings of Multitasking Difficulty
Standard Task to Which All Others Should Be Compared
Think about how hard it is to do this radio tuning task while driving (maintaining lane position, speed, and headway – and detecting objects/events on or near the roadway). Then compare each of the following tasks to that difficulty level:
Difficulty of Task While Driving TASK More, Less, or Same? Value? Select coins in a specific amount from the cup-holder
Insert a cassette tape in the tape player Adjust the heating, ventilation, and air conditioning system
Change to a different radio station on the same FM band (radio is already turned on and set to the FM band)
Place a call to your home by manually dialing the phone
Perform travel computations (such as distance to be traveled, fuel needed, etc.)
Determine the direction you will be traveling after a series of turns on the route to your destination (Routing Orientation Task)
Place a call to you home by voice-dialing the phone
Listen to a book-on-tape selection Summarize a book-on-tape selection for a passenger
Carry on a light question-and-answer conversation with a passenger
Listen to your passenger give you route instructions for a set of errands and then repeat them back
Listen to a sports broadcast to learn about a specific game
Insert specific CD and select track 7 Trace a route from start to finish through a maze Voice-dial Delta Flightline to locate a flight’s arrival time at destination
Enter a destination into a navigation system
Tune Radio (Turn On, Switch to FM, Tune to Frequency) = 100 points

Subject # ____ Date ____________ Experimenter Initials ______
I-32
Read a short paragraph and say the missing word Read a long paragraph and say the missing word Determine the relative orientation between two locations on a simple map
Determine the relative orientation between two locations on a cluttered map

Subject # ____ Date ____________ Experimenter Initials ______
I-33
Ratings of Situational Awareness We would like you to compare each task to the standard radio tuning task, as described before, in terms of how aware you felt you were of visual events on the road when you were driving. That is, were you more aware of traffic and roadway events when you were performing this task during driving as opposed to when you were driving and performing the radio tuning task? Or were you less aware? Or did you have about the same awareness as when tuning the radio? When you do this comparison, we want you to respond by answering two questions: 1. Were you more or less aware of the roadway traffic and events during performance
of the comparison task (e.g., reading a paper map) versus during the radio tuning task – or about the same? For this question, you can write an “M” (for more), “L” (for less), or “S” (for the same) in the space provided.
2. By how much were you more or less aware of the roadway situation for the
comparison task as compared with radio tuning? For this question, assume the radio tuning task has the value of “100 situation awareness points.” Ask yourself: “How much more or less aware of roadway situations was I while doing the comparison task while driving than I was while doing the standard reference task while driving?” For example, if your awareness of roadway traffic and events dropped to only about half of the awareness you had while doing the radio tuning task, then you would give it the value of 50 situation awareness points. On the other hand, if a simple task allows you to be almost twice as aware of the roadway situation while driving as the radio-tuning task, then you should give it the value of 200 situation awareness points.
Okay, if you are ready to try making these judgments, please proceed to the next page.

Subject # ____ Date ____________ Experimenter Initials ______
I-34
Ratings of Situational Awareness
Standard Task to Which All Others Should Be Compared
Compare your level of roadway awareness for each of the following tasks (done while driving) to the level you experienced while driving and doing the radio task:
Situational Awareness While Driving TASK More, Less, or Same? Value? Select coins in a specific amount from the cup-holder
Insert a cassette tape in the tape player Adjust the heating, ventilation, and air conditioning system
Change to a different radio station on the same FM band (radio is already turned on and set to the FM band)
Place a call to your home by manually dialing the phone
Perform travel computations (such as distance to be traveled, fuel needed, etc.)
Determine the direction you will be traveling after a series of turns on the route to your destination (Routing Orientation Task)
Place a call to you home by voice-dialing the phone
Listen to a book-on-tape selection Summarize a book-on-tape selection for a passenger
Carry on a light question-&-answer conversation with a passenger
Listen to your passenger give you route instructions for a set of errands and then repeat them back
Listen to a sports broadcast to learn about a specific game
Insert specific CD and select track 7 Trace a route from start to finish through a maze Voice-dial Delta Flightline to locate a flight’s arrival time at destination
Enter a destination into a navigation system
Tune Radio (Turn On, Switch to FM, Tune to Frequency) = 100 points

Subject # ____ Date ____________ Experimenter Initials ______
I-35
Situational Awareness While Driving TASK More, Less, or Same? Value? Read a short paragraph and say the missing word Read a long paragraph and say the missing word Determine the relative orientation between two locations on a simple map
Determine the relative orientation between two locations on a cluttered map

Subject # ____ Date ____________ Experimenter Initials ______
I-36
Structured Debriefing after On-Road Data Collection Before we get started today, I am going to be asking you some questions about tasks that you do as you drive. Next, I would like to have you think about some of the tasks that you may sometimes do in your vehicle. For each task that we ask about below, I would like you to rate your level of confidence about detecting all of the events that occurred. To do this, please use a 7-point scale.
TASK
How confident are you that you detected all of the
events that occurred during performance of the
following tasks? Select coins in a specific amount from the cup-holder Insert a cassette tape in the tape player Adjust the heating, ventilation, and air conditioning system Change to a different radio station on the same FM band (radio is already turned on and set to the FM band)
Place a call to your home by manually dialing the phone Perform travel computations (such as distance to be traveled, fuel needed, etc.)
Determine the direction you will be traveling after a series of turns on the route to your destination (Routing Orientation Task)
Place a call to you home by voice-dialing the phone Listen to a book-on-tape selection Summarize a book-on-tape selection for a passenger Carry on a light question-&-answer conversation with a passenger
Listen to your passenger give you route instructions for a set of errands and then repeat them back
Listen to a sports broadcast to learn about a specific game
1 2 3 4 5 6 7
Degree of Confidence
No confidence that you can do all of this and the task
Uncertain Complete confidence that
you can do all of this and the task

Subject # ____ Date ____________ Experimenter Initials ______
I-37
Evaluating Conditions of Task Engagement Next, we would like you to consider how comfortable you are doing various tasks you’ve done today while you are driving. As you answer, I want you to imagine that we are not here with you – and that you are driving by yourself. I want you to respond on the basis of what you would be willing to do, on average, when you are driving. Then, I am also going to ask you about how comfortable you would be if a driver in a car adjacent to you or behind you were doing each of these tasks. In fact, I would like you to evaluate two things: 1. How comfortable you would be doing this task if you were to undertake under
driving conditions like these we are in right now, and 2. How confident you are that you could successfully maintain appropriate lane position,
speed, and headway while doing the task, in addition to detecting changes in the traffic. In each case, I would like you to make your judgments using a scale from 1 to 7.
Here is the rating scale you will use to judge your comfort level with doing a task while driving:
So when you use this scale to rate your level of comfort with doing a task while driving, a rating of “seven” means that you would be completely comfortable, a rating of “one” will mean that you would be completely uncomfortable, and a midpoint-rating of “four” means that you would be neither comfortable nor uncomfortable. Here is the rating scale you will use to judge your confidence in whether you can successfully drive while doing the task. By “successfully drive,” we mean that you can monitor the road and traffic for important events or changes, and also maintain appropriate lane position, speed, and headway while doing the task: So when you use this scale to rate your level of confidence in whether you can successfully drive and do the task, a rating of “seven” will mean that you are completely confident that you could successfully drive and do the task, a rating of “one” will mean that you are completely confident that you could NOT successfully drive and do the task, and a midpoint-rating of “four” would mean that you are uncertain.
1 2 3 4 5 6 7
Degree of Comfort
Completely Uncomfortable
Neither Comfortable Nor Uncomfortable
Completely Comfortable

Subject # ____ Date ____________ Experimenter Initials ______
I-38
Experimenter’s Note: Notice the current road situation and record the level of demand from road/traffic and note whether it is light, moderate, heavy (CIRCLE RESPONSE):
Heavy Speeds >55 mph, Traffic Density high, Short Headways Moderate Speeds = 55 mph, Medium Traffic Density, Moderate Headways Light Speeds < 55 mph, Low Traffic Density, Long Headways
Example Question: Imagine that you were driving by yourself and were to undertake the task of using a paper map to plan a route to a destination: 1. How comfortable would you be with doing this task? _____ 2. How confident would you be that you could successfully maintain lane position,
speed, headway, and detect changes in the traffic while doing this task now? _____ Suppose a driver in the vehicle next to you or behind you were to undertake the task of using a paper map to plan a route to a destination: 3. How comfortable would you be with that? _____ 4. How confident would you be that the driver could successfully maintain lane
position, speed, headway, and detect changes in the traffic while doing this task now? _____
1 2 3 4 5 6 7
Degree of Confidence
No confidence that you can do all of this and the task
Uncertain Complete confidence that
you can do all of this and the task

Subject # ____ Date ____________ Experimenter Initials ______
I-39
TASK 7 Point Rating
Traffic Level
Select coins in a specific amount How comfortable would you be doing this task now? How confident would you be that you could maintain appropriate lane position, speed, and headway while also detecting roadway events?
Would you do this task NOW? YES - NO
How comfortable would you be with a nearby driver doing this task now?
How confident would you be that the nearby driver could maintain appropriate lane position, speed, and headway while also detecting roadway events?
1
Would you recommend that the other driver do this task NOW?
YES - NO
Insert cassette tape How comfortable would you be doing this task now? How confident would you be that you could maintain appropriate lane position, speed, and headway while also detecting roadway events?
Would you do this task NOW? YES - NO
How comfortable would you be with a nearby driver doing this task now?
How confident would you be that the nearby driver could maintain appropriate lane position, speed, and headway while also detecting roadway events?
2
Would you recommend that the other driver do this task NOW?
YES - NO
Adjust heating and ventilation system How comfortable would you be doing this task now? How confident would you be that you could maintain appropriate lane position, speed, and headway while also detecting roadway events?
Would you do this task NOW? YES - NO
How comfortable would you be with a nearby driver doing this task now?
How confident would you be that the nearby driver could maintain appropriate lane position, speed, and headway while also detecting roadway events?
3
Would you recommend that the other driver do this task NOW?
YES - NO

Subject # ____ Date ____________ Experimenter Initials ______
I-40
TASK 7 Point Rating
Traffic Level
Radio tuning from 100.1 to 104.3 FM How comfortable would you be doing this task now? How confident would you be that you could maintain appropriate lane position, speed, and headway while also detecting roadway events?
Would you do this task NOW? YES - NO
How comfortable would you be with a nearby driver doing this task now?
How confident would you be that the nearby driver could maintain appropriate lane position, speed, and headway while also detecting roadway events?
4
Would you recommend that the other driver do this task NOW?
YES - NO
Call home by manually dialing the phone How comfortable would you be doing this task now? How confident would you be that you could maintain appropriate lane position, speed, and headway while also detecting roadway events?
Would you do this task NOW? YES - NO
How comfortable would you be with a nearby driver doing this task now?
How confident would you be that the nearby driver could maintain appropriate lane position, speed, and headway while also detecting roadway events?
5
Would you recommend that the other driver do this task NOW?
YES - NO
Travel computations How comfortable would you be doing this task now? How confident would you be that you could maintain appropriate lane position, speed, and headway while also detecting roadway events?
Would you do this task NOW? YES - NO
How comfortable would you be with a nearby driver doing this task now?
How confident would you be that the nearby driver could maintain appropriate lane position, speed, and headway while also detecting roadway events?
6
Would you recommend that the other driver do this task NOW?
YES - NO

Subject # ____ Date ____________ Experimenter Initials ______
I-41
TASK 7 Point Rating
Traffic Level
Determine the direction of travel after each turn (Routing Orientation) How comfortable would you be doing this task now? How confident would you be that you could maintain appropriate lane position, speed, and headway while also detecting roadway events?
Would you do this task NOW? YES - NO
How comfortable would you be with a nearby driver doing this task now?
How confident would you be that the nearby driver could maintain appropriate lane position, speed, and headway while also detecting roadway events?
7
Would you recommend that the other driver do this task NOW?
YES - NO
Call home by voice-dialing How comfortable would you be doing this task now? How confident would you be that you could maintain appropriate lane position, speed, and headway while also detecting roadway events?
Would you do this task NOW? YES - NO
How comfortable would you be with a nearby driver doing this task now?
How confident would you be that the nearby driver could maintain appropriate lane position, speed, and headway while also detecting roadway events?
8
Would you recommend that the other driver do this task NOW?
YES - NO
Listen to book-on-tape How comfortable would you be doing this task now? How confident would you be that you could maintain appropriate lane position, speed, and headway while also detecting roadway events?
Would you do this task NOW? YES - NO
How comfortable would you be with a nearby driver doing this task now?
How confident would you be that the nearby driver could maintain appropriate lane position, speed, and headway while also detecting roadway events?
9
Would you recommend that the other driver do this task NOW?
YES - NO

Subject # ____ Date ____________ Experimenter Initials ______
I-42
TASK 7 Point Rating
Traffic Level
Retell a book-on-tape passage How comfortable would you be doing this task now? How confident would you be that you could maintain appropriate lane position, speed, and headway while also detecting roadway events?
Would you do this task NOW? YES - NO
How comfortable would you be with a nearby driver doing this task now?
How confident would you be that the nearby driver could maintain appropriate lane position, speed, and headway while also detecting roadway events?
10
Would you recommend that the other driver do this task NOW?
YES - NO
Biographical Q & A How comfortable would you be doing this task now? How confident would you be that you could maintain appropriate lane position, speed, and headway while also detecting roadway events?
Would you do this task NOW? YES - NO
How comfortable would you be with a nearby driver doing this task now?
How confident would you be that the nearby driver could maintain appropriate lane position, speed, and headway while also detecting roadway events?
11
Would you recommend that the other driver do this task NOW?
YES - NO
Listen to & repeat route instructions How comfortable would you be doing this task now? How confident would you be that you could maintain appropriate lane position, speed, and headway while also detecting roadway events?
Would you do this task NOW? YES - NO
How comfortable would you be with a nearby driver doing this task now?
How confident would you be that the nearby driver could maintain appropriate lane position, speed, and headway while also detecting roadway events?
12
Would you recommend that the other driver do this task NOW?
YES - NO

Subject # ____ Date ____________ Experimenter Initials ______
I-43
TASK 7 Point Rating
Traffic Level
Listen to a sports broadcast for a game How comfortable would you be doing this task now? How confident would you be that you could maintain appropriate lane position, speed, and headway while also detecting roadway events?
Would you do this task NOW? YES - NO
How comfortable would you be with a nearby driver doing this task now?
How confident would you be that the nearby driver could maintain appropriate lane position, speed, and headway while also detecting roadway events?
13
Would you recommend that the other driver do this task NOW?
YES - NO
Turn on radio, select band, and tune to specific frequency How comfortable would you be doing this task now? How confident would you be that you could maintain appropriate lane position, speed, and headway while also detecting roadway events?
Would you do this task NOW? YES - NO
How comfortable would you be with a nearby driver doing this task now?
How confident would you be that the nearby driver could maintain appropriate lane position, speed, and headway while also detecting roadway events?
14
Would you recommend that the other driver do this task NOW?
YES - NO
Thank you. Do you have any comments or questions about what you have experienced over the last two days?

Subject # ____ Date ____________ Experimenter Initials ______
I-44
Rating Scale For Alertness At each of our breaks, you will be asked to evaluate your level of alertness at that point in time. To make your judgments, we ask that you use and remember the following scale below. It is a 9-point scale, on which “1” represents extremely alert, “9” represents extremely tired, and “5” is the midpoint between alertness and sleepiness or fatigue.
Alertness Scale
Alertness Level Definition of Alertness Level
1 Extremely Alert (and feeling fresh physically) 2 3 Alert (and feeling physically well) 4 5 Neither alert nor sleepy (and feeling physically okay) 6 7 Sleepy – but no difficulties remaining awake (some physical tiredness)8 9 Extremely sleepy/fighting sleep (extremely exhausted physically)
Evaluation of Physical State At our breaks, we will also ask you to quickly reflect on how you are feeling physically. We would like you to report any of the following sensations, if you should experience them at any point. Please answer in yes or no to the following questions with regards to your current physical state.
Physical State Scale
Are you currently experiencing any of the following: Yes No
Dizziness? Uneasiness? Discomfort?
Disorientation? Nausea?
Other Unpleasant Feeling?

J-1
J Appendix J. Screening Questionnaire
This appendix contains the Screening Questionnaire developed for the CAMP DWM Project, Task 2.
The Screening Questionnaire was used to screen prospective candidates for participation in the study. It was administered through a structured telephone interview. The materials are presented as they were reported in Task 2.

Appendix J Screening Questionnaire
J-2
DWM Task 2
Screening Questionnaire for Prospective Test Participants
Driver Workload Metrics CAMP
IVI Light Vehicle Enabling Research Program

Appendix J Screening Questionnaire
J-3
Screening Questionnaire for Prospective Test Participants
PARTICIPATION DAY & DATE: ________________________ at 7:00 AM NAME: __________________________________________________ HOME PHONE: ( )______ ________ ADDRESS:_______________________________________________ BUS. PHONE: ( ) ______ ________ CITY: ________________________ STATE: ____________________ FAX NUMBER: ( )________________ ZIP: _________________________ AGE: ______________________ AGE: __ __ 21-75 GENDER: (1) MALE (2) FEMALE
INTRO. (ASK TO SPEAK TO MALE OR FEMALE HEAD OF THE HOUSEHOLD)
Hello, my name is INTERVIEWER and I’m calling from MORPACE International, a consumer research company located in Farmington Hills. This is not a sales call. We are not engaged in sales, advertising or publicity of any kind. May I speak to a head of household? ( ) Yes, on the phone ( ) Yes, person is coming to the phone – (RE-INTRODUCE YOURSELF) ( ) Person not available (ARRANGE FOR CALLBACK) INFO. Your responses are voluntary and all responses are confidential. We are conducting an important research project in the near future and would like to ask you a few questions. Part of our research involves examining people’s behavior while they drive and perform various in-vehicle tasks at the same time (for example, using radio, using cell phone, adjusting controls, etc.) All information collected today will be kept confidential and we will not keep any record of your responses with which your name is associated. This call may be monitored for quality control purposes. Based on your responses and availability, should you qualify, your participation will involve a 2 consecutive day project at a research location. You would be paid for your participation. (IF ASK: $400). Do you think you would be interested? ( ) Yes ( ) No (THANK & TERMINATE) ( ) Don’t knowithRefused (THANK & TERMINATE)

Appendix J Screening Questionnaire
J-4
GENDER. (RECORD GENDER. CHECK QUOTAS.) ( ) Male ( ) Female ( ) Don’t knowithRefused (THANK & TERMINATE)

Appendix J Screening Questionnaire
J-5
AGE. For statistical purposes, what is your age? (SPECIFY 2-DIGITS) __ __ (IF REFUSE, AS:) Into which of the following categories does your age fall? ( ) 20 years or under (THANK & TERMINATE) ( ) 21 to 29 ( ) 30 to 39 ( ) 40 to 49 ( ) 50 to 59 ( ) 60 to 69 ( ) 70 to 75 ( ) 75-79 (WAIT LIST) ( ) 80 years or over (THANK & TERMINATE) ( ) Don’t knowithRefused (THANK & TERMINATE) OCC. Do you, or your spouse/partner, work for any of the following: ( ) Yes (THANK & TERMINATE) ( ) No to all ( ) Don’t knowithRefused (THANK & TERMINATE) a: Advertising agency or public relations firm b: an automotive manufacturer or parts supplier? (OEM or Tier 1 supplier)? c: a marketing research firm d: the media – television, radio, newspaper or magazine e: the legal profession - lawyer & law firm, paralegal, law clerk, etc. ENGLISH. Are you a native English speaker? ( ) Yes ( ) No (THANK & TERMINATE) ( ) Don’t knowithRefused (THANK & TERMINATE) RESIDENT. Are you a resident of Michigan? ( ) Yes ( ) No (THANK & TERMINATE) ( ) Don’t knowithRefused (THANK & TERMINATE) LICENSE. Do you have a current and valid Michigan driver’s license with your photo on it? ( ) Yes ( ) No (THANK & TERMINATE) ( ) Don’t knowithRefused (THANK & TERMINATE) RESTRICT. Are there any restrictions on your driver’s license? (INTERVIEWER PROBE CAREFULLY, I.E., DAY ONLY, TO/FROM WORK, ETC.) ( ) Yes (THANK & TERMINATE) ( ) No ( ) Don’t knowithRefused (THANK & TERMINATE)

Appendix J Screening Questionnaire
J-6
TRANSP. Should you qualify, do you have transportation to the study? ( ) Yes ( ) No (THANK & TERMINATE) ( ) Don’t knowithRefused (THANK & TERMINATE) VEHICLE. What is the make and model of the vehicle you drive most often? MAKE: ___________________ MODEL:___________________ ( ) Don’t knowithRefused (THANK & TERMINATE) YEAR. What model year is it? (SPECIFY 4-DIGIT #) __ __ __ __ ( ) Don’t knowithRefused (THANK & TERMINATE) EXPER. How many years have you been driving? (2-DIGIT RESPONSE:) __ __ ( ) If less than 2 years or Don’t knowithRefused (THANK & TERMINATE) TRANSM. Are you able to drive a car equipped with an automatic transmission without the assistance of
devices or special equipment? ( ) Yes ( ) No (THANK & TERMINATE) ( ) Don’t knowithrefused (THANK & TERMINATE) MILES. Approximately how many miles do you personally drive in a year? (INTERVIEWER: PROBE FOR “BEST GUESS”) (SPECIFY 6-DIGIT NUMBER:) __ __ __ __ __ __ ( ) If less than 3,000 miles or Don’t knowithrefused (THANK & TERMINATE)
RECORD. Have you experienced any of the following? ( ) Yes to any (THANK & TERMINATE) ( ) No to all ( ) Don’t knowithRefused (THANK & TERMINATE)
a: A combined total equaling five (5) or more moving violations or at-fault accidents within the past 36 months?
b: A combined total equaling four (4) or more moving violations or at-fault accidents
within the past 24 months?

Appendix J Screening Questionnaire
J-7
c: A combined total equaling three (3) or more moving violations or at-fault accidents within the past 12 months?

Appendix J Screening Questionnaire
J-8
CONVICT. Have you been convicted of any of the following in the past 36 months? ( ) Yes to any (THANK & TERMINATE) ( ) No to all ( ) Don’t knowithRefused (THANK & TERMINATE) a: Driving while your operator’s license is suspended, revoked, or denied. b: Vehicular manslaughter, negligent homicide, felonious driving or felony with a vehicle. c: Operating a vehicle while impaired, under the influence of alcohol or illegal drugs, or
refusing a sobriety test. d: Failure to stop or identify under a crash (includes leaving the scene of a crash; hit and run;
giving false information to an officer). e: Eluding or attempting to elude a law enforcement officer. f: Traffic violation resulting in death or serious injury. g: Any other significant violation warranting suspension of license.
AIDS. Do you use any corrective devices to hear or to see? ( ) Yes, to see only – (ASK QLENSES) ( ) Yes, to hear only – (THANK & TERMINATE) ( ) Yes to both hear and see - (THANK & TERMINATE) ( ) No – (GO_TO QGLAUC) ( ) Don’t knowithRefused (THANK & TERMINATE) LENSES. Do you wear contact lenses or glasses? ( ) Contact lenses – (ASK QLENSCON) ( ) Glasses – (ASK QLENSGL) ( ) Both – (ASK QLENSCON AND QLENSGL) ( ) Don’t knowithRefused (THANK & TERMINATE) LENSCON. Do you wear tinted contact lenses? ( ) Yes - (GO_TO QLENSCON1) ( ) No - (GO_TO QLENSCON2) ( ) Sometimes - (GO_TO QLENSCON1) ( ) Don’t knowithRefused - (THANK & TERMINATE) LENSCON1. Would you be willing to wear glasses to the study instead of your tinted contact lenses?

Appendix J Screening Questionnaire
J-9
( ) Yes - (GO_TO QLENSGL) ( ) No - (THANK & TERMINATE) ( ) Don’t knowithRefused - (THANK & TERMINATE)

Appendix J Screening Questionnaire
J-10
LENSCON2. Would you be willing to bring with you your glasses and change into them if necessary? ( ) Yes - (LENSGL) ( ) No - (THANK & TERMINATE) ( ) Don’t knowithRefused - (THANK & TERMINATE) (ASK LENSGL: ONLY IF LENSES = GLASSES OR BOTH; CONTACTS ONLY, GO_TO QGLAUC) LENSGL. Do your lenses tint automatically in bright light? ( ) Yes - (ASK QLENSGL1) ( ) No - (GO_TO QGLAUC) ( ) Don’t knowithRefused - (THANK & TERMINATE) LENSGL1. Do the glasses you normally wear for driving tint automatically? ( ) Yes - (GO_TO QLENSGL2) ( ) No - (GO_TO QGLAUC) ( ) Don’t knowithRefused - (THANK & TERMINATE) LENSGL2. Would you be willing and able to bring prescription non-tinting glasses and use them
instead of your tinting glasses? ( ) Yes ( ) No - (THANK & TERMINATE) ( ) Don’t knowithRefused - (THANK & TERMINATE) GLAUC. Have you ever been diagnosed with glaucoma or macular degeneration? ( ) Yes - (THANK & TERMINATE) ( ) No ( ) Don’t knowithRefused - (THANK & TERMINATE) MED. Are you currently taking any drugs, medicines, or substances that may impair your ability to drive?
Please be aware that certain cold medicines, cough medicines, and antihistamines may affect alertness and the ability to drive. Similarly, antidepressants, tranquilizers, medications intended to control emotion, mood, and/or other psychological states, certain pain medications, and many other medicines may affect alertness and the ability to drive. If you take medicines that have such an effect – and especially if any of the medicines you are taking bear a warning that they may cause drowsiness or affect your ability to operate machinery – please answer “Yes” to the question. Are you taking any such substances?
( ) Yes - (THANK & TERMINATE) ( ) No ( ) Don’t knowithRefused - (THANK & TERMINATE)

Appendix J Screening Questionnaire
J-11
ALCOHOL. Do you drink alcoholic beverages on a regular basis, that is, at least 4 times a week or more?
( ) Yes - (THANK & TERMINATE) ( ) No ( ) Don’t knowithRefused - (THANK & TERMINATE) HEART. Do you have: - symptomatic heart disease with chest pain - shortness of breath - light-headedness, which you experience at rest or when walking one block or less - rhythm disturbances associated with light-headedness or fainting - a condition, which may require defibrillation
- or have you ever experienced a heart attack ( ) Yes to any - (THANK & TERMINATE) ( ) No ( ) Don’t knowithRefused - (THANK & TERMINATE) SEIZURE. Have you ever been diagnosed with seizures or epilepsy? ( ) Yes - (ASK QSEIZ2) ( ) No - (GO_TO QALLERGY) ( ) Don’t knowithRefused - (THANK & TERMINATE) SEIZ2. When was your last seizure? ( ) Within the past 12 months - (THANK & TERMINATE) ( ) Over one year ago ( ) Don’t knowithRefused - (THANK & TERMINATE) SEIZ3. How frequently do you have seizures and what type are they? (SPECIFY:) _________________ (GO_TO QALLERGY) ( ) Don’t knowithRefused - (THANK & TERMINATE) ALLERGY. Do you have allergies? ( ) Yes - (ASK QALLER2)
( ) No - (GO_TO QRESP) ( ) Don’t knowithRefused - (THANK & TERMINATE)
ALLER2. Do you frequently take antihistamines or other medicines to control allergic symptoms? ( ) Yes (ASK QALLER3)
( ) No (GO_TO QRESP) ( ) Don’t knowithRefused (THANK & TERMINATE)

Appendix J Screening Questionnaire
J-12
ALLER3. Does this medication cause drowsiness? ( ) Yes (THANK & TERMINATE)
( ) No (GO_TO QRESP) ( ) Don’t knowithRefused (THANK & TERMINATE)
RESP. Do you suffer from a respiratory disorder such as asthma or chronic bronchitis? If yes, please describe.
( ) Yes (ASK QRESP2) ( ) No (GO_TO QBRAIN) ( ) Don’t knowithRefused (THANK & TERMINATE)
RESP2. Please describe the disorder. (SPECIFY:) ___________________(GO_TO QRESP3) ( ) Don’t knowithRefused (THANK & TERMINATE)
RESP3. Does this disorder result in obvious or continuous shortness of breath? ( ) Yes (THANK & TERMINATE)
( ) No (GO_TO QRESP4) ( ) Don’t knowithRefused (THANK & TERMINATE)
RESP4. Do you require chronic medical therapy such as theophyllin, inhalers, or oxygen therapy? ( ) Yes (THANK & TERMINATE)
( ) No (GO_TO QBRAIN) ( ) Don’t knowithRefused (THANK & TERMINATE)
BRAIN. Have you ever suffered brain damage from a stroke, tumor, head injury, or infection? ( ) Yes (THANK & TERMINATE) ( ) No (GO_TO QVISION) ( ) Don’t knowithRefused (THANK & TERMINATE) VISION. Do you have visual loss, blurring, or double vision; weakness, numbness, severe tremors or funny
feelings in the arms, legs, or face; trouble swallowing, slurred speech; loss of coordination or loss of control; trouble walking, trouble thinking, remembering, talking, or understanding?
( ) Yes (THANK & TERMINATE) ( ) No ( ) Don’t knowithRefused (THANK & TERMINATE) MEMORY. Do you have any unusual memory problems or problems concentrating? ( ) Yes (THANK & TERMINATE) ( ) No ( ) Don’t knowithRefused (THANK & TERMINATE)

Appendix J Screening Questionnaire
J-13
MOOD. Have you ever been diagnosed as having a mood problem or a psychiatric disorder? These would include such things as bipolar illness, severe depression, schizophrenia, borderline personality disorder, severe anxiety, panic attacks, obsessive-compulsive disorder, substance abuse, substance dependency, claustrophobia, or any other psychological problems that sometimes interfere with your daily living or which require medication?
( ) Yes (THANK & TERMINATE) ( ) No ( ) Don’t knowithRefused (THANK & TERMINATE) NEURO. Do you have any neurological conditions for which you are under doctor’s care at the current
time? ( ) Yes (ASK QNEURO2) ( ) No (GO_TO QPAIN) ( ) Don’t knowithRefused (THANK & TERMINATE) NEURO2. Does this condition represent risk for driving? ( ) Yes (THANK & TERMINATE) ( ) No ( ) Don’t knowithRefused (THANK & TERMINATE) PAIN. Do you have any chronic pain condition? ( ) Yes (ASK QPAIN2) ( ) No (GO_TO QMOTION) ( ) Don’t knowithRefused (THANK & TERMINATE) PAIN2. Do you take any medication for this condition, which may cause drowsiness or impairment? ( ) Yes (THANK & TERMINATE) ( ) No ( ) Don’t knowithRefused (THANK & TERMINATE) MOTION. Do you ever suffer from motion sickness? ( ) Yes (ASK QMOTION2) ( ) No (GO_TO QEAR) ( ) Don’t knowithRefused (THANK & TERMINATE) MOTION2. On what mode of transportation (e.g., reading in a car, rough sea, back seat, etc.) do you suffer
from motion sickness? (SPECIFY:) ________________________________________ (GO_TO QMOTION3) MOTION3. And under what conditions? ( ) Mild conditions only ( ) Mild to moderate conditions (THANK & TERMINATE) ( ) Don’t knowithRefused (THANK & TERMINATE)

Appendix J Screening Questionnaire
J-14
MOTION3. What symptoms do you experience? (SPECIFY:) _______________ (GO_TO QMOTION4) ( ) Don’t knowithRefused (THANK & TERMINATE) MOTION4. Are these symptoms severe? ( ) Yes (THANK & TERMINATE) ( ) No (GO_TO QMOTION5) ( ) Don’t knowithRefused (THANK & TERMINATE) MOTION5. How old were you when this first occurred? How often does it now occur? (SPECIFY AGE):___________ HOW OFTEN:__________________ (GO_TO QEAR) ( ) If sickness occurs often or Don’t knowithRefused (THANK & TERMINATE) EAR. Do you suffer from inner ear, dizziness, vertigo, balance problems, or Meniere’s disease? ( ) Yes (ASK QEAR2) ( ) No (GO TO QNARC) ( ) Don’t knowithRefused (THANK & TERMINATE) EAR2. Have you had symptoms within the last year? ( ) Yes (THANK & TERMINATE) ( ) No ( ) Don’t knowithRefused (THANK & TERMINATE) NARC. Have you ever been diagnosed with narcolepsy or any other sleep disorder that causes extreme
drowsiness during the day? ( ) Yes (THANK & TERMINATE) ( ) No ( ) Don’t knowithRefused (THANK & TERMINATE) SLEEP. Do you frequently suffer sleep loss for non-medical reasons (e.g., work schedules, child care,
etc.)? ( ) Yes (THANK & TERMINATE) ( ) No ( ) Don’t knowithRefused (CONTINUE) DIABET. Do you suffer from diabetes? ( ) Yes (ASK QDIABET2) ( ) No (ASK QHYPOGLY) ( ) Don’t knowithRefused (THANK & TERMINATE)

Appendix J Screening Questionnaire
J-15
DIABET2. Are you required to take insulin? ( ) Yes (THANK & TERMINATE) ( ) No (ASK QHYPOGLY) ( ) Don’t knowithRefused (THANK & TERMINATE) HYPOGLY. Have you had symptomatic hypoglycemia in the past 3 months? ( ) Yes (THANK & TERMINATE) ( ) No ( ) Don’t knowithRefused (THANK & TERMINATE) MIGRAINE. Do you have migraine, cluster, or tension headaches? ( ) Yes (ASK QMIGRAIN2) ( ) No (GO_TO QPREGNANT) ( ) Don’t knowithRefused (THANK & TERMINATE) MIGRAIN2. About how often do you get these headaches per month? (DO NOT READ) ( ) Less than one time per month (GO_TO QMIGRAIN3) ( ) One to two times per month (GO_TO QMIGRAIN3) ( ) More than 2 times per month (THANK & TERMINATE) ( ) Don’t knowithRefused (THANK & TERMINATE) MIGRAIN3. Do you take any narcotic medications or medications which contain narcotic components? ( ) Yes (THANK & TERMINATE) ( ) No (CONTINUE) ( ) Don’t knowithRefused (THANK & TERMINATE) (ASK IF GENDER=FEMALE AND AGE<60; OTHERS GO_TO QRX) PREGNANT. Are you pregnant, or is there a possibility that you are pregnant? ( ) Yes (THANK & TERMINATE) ( ) No ( ) Don’t knowithRefused (THANK & TERMINATE) RX. Are you currently taking any medication not previously mentioned? ( ) Yes ( ) No (GO_TO QGLARE) ( ) Don’t knowithRefused (THANK & TERMINATE) RX2. Does this medication adversely affect your driving? ( ) Yes (THANK & TERMINATE) ( ) No ( ) Don’t knowithRefused (CONTINUE)

Appendix J Screening Questionnaire
J-16
GLARE. Do you routinely require sunglasses to drive – and/or do you consider yourself especially sensitive to bright light or glare?
( ) Yes ( ) No ( ) Don’t knowithRefused (THANK & TERMINATE)
GLARE2. Are you willing and able to drive without sunglasses? ( ) Yes (CONTINUE) ( ) No (THANK & TERMINATE) ( ) Don’t knowithRefused (THANK & TERMINATE)
COLOR. Do you have any form of color-blindness? ( ) Yes (THANK & TERMINATE) ( ) No (CONTINUE) ( ) Don’t knowithRefused (THANK & TERMINATE)
INFO. Based on the information you have given me, I would like to invite you to participate in an important consumer research study on driving behavior. You will be asked to test some in-vehicle devices and tasks using a simple driving simulator and a parked vehicle. You will also drive a real vehicle on a test track, at speeds ranging from 30 to 65 mph. During your drive, two people, a front-seat passenger, who is a specially trained driver, and an experimenter, who will sit in the backseat, will accompany you. This project will be held at the Ford (Michigan) Romeo Proving Grounds. DATA. The data gathered in this study will be treated with anonymity. We are not testing you or your skills. Only a number will identify your driving data. Your name will not appear in any reports or papers written about the project. The engineering data collected and recorded will be analyzed along with data gathered from other test participants. The researchers or their parent organizations may publicly release this in final reports or other publications or media for educational, outreach, and research purposes. However, your name and personal identifying information will not be included in any of these public releases. VIDEO. Video data will also be collected and recorded, including your video likeness. This video data may be publicly released; however, your name and other personal identifying information (except your video likeness) will not be included in any of these public releases. Are you willing and able to sign a waiver that allows the researchers or their parent organizations the right to use such video and engineering data in perpetuity for research, education, or outreach purposes?
( ) Yes (CONTINUE) ( ) No (THANK & TERMINATE) ( ) Don’t knowithRefused (THANK & TERMINATE)

Appendix J Screening Questionnaire
J-17

Appendix J Screening Questionnaire
J-18
AVAIL. The study will take place through the months of August through September. However, you will only need to participate on two consecutive days, from approximately 7:00 AM to 4:00 PM each day. As a token of our appreciation, you will be mailed $400 at the close of the session on the second day. Are you able to attend on two consecutive weekdays given sufficient advance notice?
( ) Yes (CONTINUE) ( ) No (THANK & TERMINATE) ( ) Don’t knowithRefused (THANK & TERMINATE) Your feedback could directly affect what automobile manufacturers produce in the future. I would
like to emphasize that this project is being held for the purposes of research only. There will be absolutely no sales promotion of any kind as a result of your participation.
RECRUIT. We have the following days/dates and times available. DAYS/DATES at TIMES. Will you be
able to attend on ( ) Will attend
( ) Will not attend - (ASK:) For our records, may I please ask why not ( ) Time/Date - (THANK & TERMINATE) ( ) Hold for cancellation - ( ) Location - (THANK & TERMINATE) ( ) Not enough money - (THANK & TERMINATE) ( ) Not interested - (THANK & TERMINATE) ( ) Other - (THANK & TERMINATE) ( ) None/No Answer - (THANK & TERMINATE) ( ) Quotas filled - (THANK & TERMINATE) ( ) Don’t knowithRefused - (THANK & TERMINATE) HEALTH. To assure safety for all participants in this research, it is important that everyone is in good health
and is free from pre-existing health conditions that may elevate risk of operating a motor vehicle. Do you have any other issues of comfort or health of which we should be aware?
( ) Yes (PLEASE EXPLAIN – GO TO QHEALTH2) ( ) No (GO_TO QMAKEUP IF GENDER= FEMALE, GO_TO QCHECK IF GENDER= MALE) ( ) Don’t knowithRefused (THANK & TERMINATE)
HEALTH2. Please explain. (INTERVIEWER DETERMINES IF PERSON SHOULD BE TERMINATED FOR HEALTH ISSUES RELATING TO VEHICLE SAFETY.)
(SPECIFY:) ____________________________________________________
(ASK IF GENDER= FEMALE; MALES SKIP)
MAKEUP. The study will involve reporting to the site without any EYE MAKEUP on -- and will also involve wearing a baseball cap to which a small eye-view monitor is mounted. Are you willing to do this? (INTERVIEWER NOTE: THIS IS IMPORTANT TO STRESS!)

Appendix J Screening Questionnaire
J-19
( ) Yes
( ) No (THANK & TERMINATE)
( ) Don’t knowithRefused (THANK & TERMINATE)
(IF QMIGRAINE=1, ASK; OTHERS SKIP) ACHE. Should you have a migraine headache within 48 hours prior to your study date, it will not be possible
for you to participate. If this happens, please contact us and we will be more than happy to re-schedule you.
CHECK. Because this study involves driving a vehicle, we will need your permission to check your driving
record through the Secretary of State’s Direct Access website. Do we have your permission? ( ) Yes
( ) No (THANK & TERMINATE)
( ) Don’t knowithRefused (THANK & TERMINATE)
DRIVERL. What is your driver’s license number? (SPECIFY:) ___________________________________
( ) Don’t knowithRefused (THANK & TERMINATE)
CONFIRM. Thank you for your cooperation. Your participation is of vital importance. I'd like to verify the spelling
of your name and address, as we will be sending a letter of confirmation, a map to the facility, along with some materials we would like you to review and fill out prior to your appointment.
NAME. Could you please give me the spelling of your first and last name? _____________________ ADDRESS. What is your address? Is there an apartment number? _______________________________ CITY. Your City is… ___________________ Your State is… __________________ ZIP. The Zip is… _____________________ DAYPHONE. Someone from our office will be contacting you before your appointment time to confirm your
attendance. What is the phone number, including area code, to best call you during the day?

Appendix J Screening Questionnaire
J-20
(INTERVIEWER: IF NONE, ENTER “NONE”) (__ __ __ ) - __ __ __ - __ __ __ __ HOMEPHO. And what would be the best phone number to reach you during the evening? (ORIGINAL # = HOMEPHO) (INTERVIEWER: ENTER PHONE # ABOVE OR CORRECT AS RESPONDENT INDICATES) (__ __ __ ) - __ __ __ - __ __ __ __

Appendix J Screening Questionnaire
J-21
CLOSE. I am sure you will find it an interesting experience. Due to the limited amount of time and space at the evaluation site, only invited guests will be allowed to participate. Please do not bring children; we do not provide baby-sitting services. Be sure to bring your invitation, valid Michigan driver's license, the materials that you reviewed and filled out, glasses or contact lenses if you wear them, and a hearing aid if necessary. You will need to bring your glasses with you to each study session.
Finally, we ask that you get a good night’s sleep the night before your appointment - we would like
you to be as fresh as possible for your training and drive tests. You must let your experimenter know if you experience significant sleep loss prior to your participation. Also, you must not be under the influence of alcohol to take part in the study, and must have abstained from drinking alcohol for no less than 12 hours prior to participating in this study. However it is preferred that you abstain from alcohol for 24 hours prior to your participation in the days of the study, particularly if you have been drinking to excess.
CLOSE_2. Thanks again, (MR./MRS./MS.) NAME, we look forward to seeing you on DAY, DATE AND TIME
OF SCHEDULED APPOINTMENT (QUESTION QEXPER, QTRANSM, QRECORD THROUGH QGLARE, USE THE FOLLOWING TERMINATE SCRIPT:) TERM_2. “I am not able to schedule you for this study because of ____ (i.e., susceptibility to motion
sickness). Understand that we do this with your best interest in mind. We appreciate your willingness of volunteer.”
(QUESTION GENDER, AGE, OCC, ENGLISH, RESIDENT, LICENSE, RESTRICT) TERM_1. “I am not able to schedule you for this study because quotas are filled in your category. Should
we have a cancellation, may I call you back?”

K-1
K Appendix K. Paper Stimulus Material
This appendix contains the Paper Stimulus Material that was developed for the CAMP DWM Project, Task 2 study trials. The material is presented as it was used in Task 2.
Six tasks involved the use of paper stimulus material: Route Tracing, Destination Entry, Ready Text Easy, Ready Text Hard, Read Map Easy, and Read Map Hard.

K-2
DWM Task 2
Paper Stimulus Material
Driver Workload Metrics CAMP
IVI Light Vehicle Enabling Research Program

Appendix K Paper Stimulus Materials
K-3
Introduction This appendix contains the paper stimulus material that was used in during trials in the study. Six tasks involved the use of paper stimulus material. These were:
• Route Tracing • Destination Entry • Read Text Easy • Read Text Hard • Read Map Easy • Read Map Hard
Eight mazes were prepared for the Route Tracing task. Two mazes were designated for the practice trials, while the remaining mazes were available for test trials. Seven pairs of addresses were used for the Destination Entry task. One pair was assigned for practice trials and the remaining pairs were available for trials. The Read Text Easy and the Read Text Hard tasks used similar material. One pair of texts was assigned as practice and six additional pairs were available for task trials. The Read Map Easy and the Read Map Hard tasks were also similar to each other except for the Read Map Easy task had eight callouts as compared to 22 callouts for the Read Map Hard task. One map was assigned for practice while the remaining six maps were used for task trials. The materials shown below are not the actual size and were reformatted to fit within the space available.

Appendix K Paper Stimulus Materials
K-4
Route Tracing Maze 1 and Maze 2 were used only during task training for practice. Mazes 3, 4, 5, 6, 7, and 8 were balanced across all trials in replication 1; however the maze used in replication 1 was also used in replication 2. Route Tracing 1 (Practice)
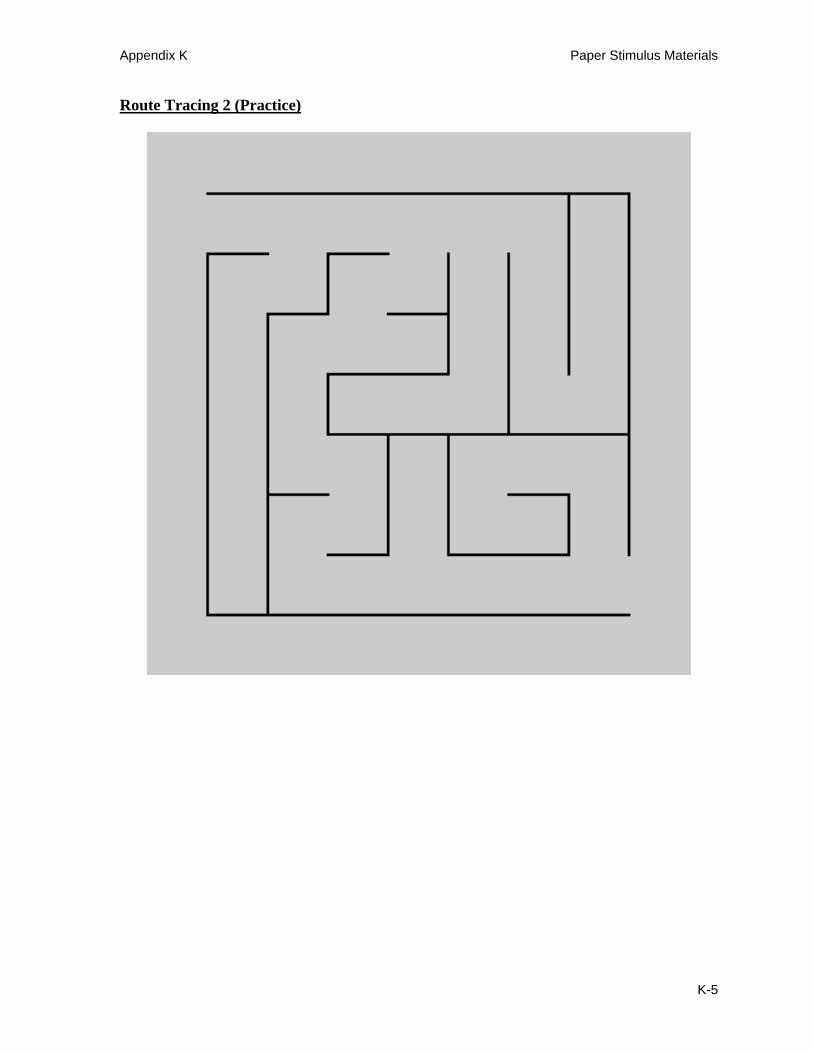
Appendix K Paper Stimulus Materials
K-5
Route Tracing 2 (Practice)

Appendix K Paper Stimulus Materials
K-6
Route Tracing 3

Appendix K Paper Stimulus Materials
K-7
Route Tracing 4

Appendix K Paper Stimulus Materials
K-8
Route Tracing 5

Appendix K Paper Stimulus Materials
K-9
Route Tracing 6

Appendix K Paper Stimulus Materials
K-10
Route Tracing 7

Appendix K Paper Stimulus Materials
K-11
Route Tracing 8

Appendix K Paper Stimulus Materials
K-12
Destination Entry Destination entries AP1 and AP2 were used only during task training for practice. A certain methodology was used for assigning addresses to trials. The addresses were used in pairs, such as A11 and A12 would be used for the replication 1 and replication 2 respectively, for the same trial. There were six such unique pairs and the pairs of addresses were balanced across all trials. Destination Entry AP1 2653 Ferndale Ave Hamburg, NY Destination Entry A11 9841 Amanda Ln Algonquin, IL
Destination Entry AP2 5904 Heckert Rd Bakerstown, PA Destination Entry A12 3245 Althea Dr Algonquin, IL
Destination Entry A21 1365 Gateway Dr Fargo, ND Destination Entry A31 3637 Water St Jackson, WI
Destination Entry A22 2976 Madison Av NW Fargo, ND Destination Entry A32 1977 Sherman Rd Jackson, WI
Destination Entry A41 1547 Lago Vista Ln Katy, TX Destination Entry A51 8476 Fairbrook Ln La Porte, TX
Destination Entry A42 6368 Magnolia St Katy, TX Destination Entry A52 1258 Garfield St La Porte, TX
Destination Entry A61 7069 Fahey Dr Indianapolis, IN
Destination Entry A62 1401 Gabriel Rd Indianapolis, IN

Appendix K Paper Stimulus Materials
K-13
Read Text “Easy” Read Text “Easy” entries RE-P1 and RE-P2 were used only during task training for practice. A certain methodology was used for assigning read text “easy” passages to trials. The passages were used in pairs, such as RE-11 and RE-12 would be used for the replication 1 and replication 2 respectively, for the same trial. There were six such unique pairs and the pairs of addresses were balanced across all trials. Read Text “Easy” RE-P1 I learned in school that when the snow in our country melts, the water flows into the river. The river, in turn, ________ into the Great Lakes, the world’s biggest lakes. Read Text “Easy” RE-P2 Ancient Greek myth tells the story of King Midas who counted his gold each day to see how much he had. Each day, after he had ________ it, he wished for even more. Read Text “Easy” RE-11 Many insects go through several growth stages. For example, the caterpillar spins a cocoon around itself. It sheds its skin four times. Then it changes from an insect that crawls to an insect that ________. Read Text “Easy” RE-12 Bottlenose dolphins are playful animals. This dolphin can often be seen leaping out of the water. It may curve to a height at least twice its own length before striking the ________ again. Read Text “Easy” RE-21 Ice cream has delighted people for hundreds of years. This favorite dessert is one that uses milk or cream that is sweetened and flavored. Then, finally, it is iced or ________.
Appendix K Paper Stimulus Materials
K-14
Read Text “Easy” RE-22 Any animal that bites or scratches may be sick or carry diseases. There may be germs in its mouth or on its claws that could get ________ you and make you sick. Read Text “Easy” RE-31 The skeleton is the system of bones that supports the body. Some parts of the skeleton protect our internal organs. Other parts help us move about. The rib cage ________ the heart and lungs. Read Text “Easy” RE-32 A washing machine works by mixing dirty clothes up with soapy water. A drum inside the machine turns to slosh the clothes in the water. Then clean ________ rinses away the soap and dirt. Read Text “Easy” RE-41 Bats are different from all other mammals in one way: they can fly. Unlike bird’s feathers, bats have double layers of skin stretched over thin bones that they use as ________ to fly. Read Text “Easy” RE-42 Proverbs are old sayings that express ideas or advice about how to act in daily life. The proverb “haste makes waste” means, don’t go too ________ or you may ruin your work. Read Text “Easy” RE-51 Mammals are warm-blooded animals with hair that make milk to feed their young. Cows, dogs, elephants, and humans are all mammals. Although porpoises and whales live in the ________, they are also mammals. Read Text “Easy” RE-52 Hawaii is a chain of mountains standing in the sea. They were formed from the lava of an underwater volcano. These ________ are called islands because of the deep water all around them.

Appendix K Paper Stimulus Materials
K-15
Read Text “Easy” RE-61 The proverb “don’t put all your eggs in one basket” means, don’t invest in only one thing because it might go bad. It is generally safer to invest in ________ things. Read Text “Easy” RE-62 “Beauty and the Beast” is about a young woman who is taken to live with an ugly monster. She eventually falls in love with ________, because he is kind to her.
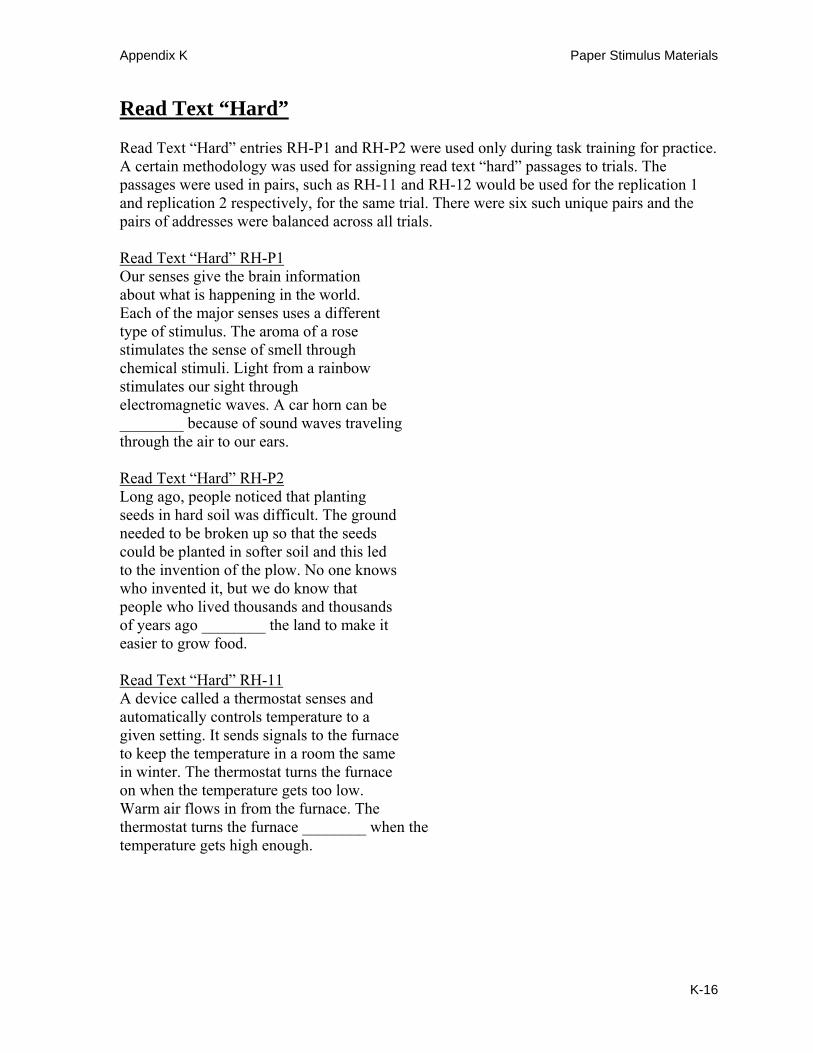
Appendix K Paper Stimulus Materials
K-16
Read Text “Hard” Read Text “Hard” entries RH-P1 and RH-P2 were used only during task training for practice. A certain methodology was used for assigning read text “hard” passages to trials. The passages were used in pairs, such as RH-11 and RH-12 would be used for the replication 1 and replication 2 respectively, for the same trial. There were six such unique pairs and the pairs of addresses were balanced across all trials. Read Text “Hard” RH-P1 Our senses give the brain information about what is happening in the world. Each of the major senses uses a different type of stimulus. The aroma of a rose stimulates the sense of smell through chemical stimuli. Light from a rainbow stimulates our sight through electromagnetic waves. A car horn can be ________ because of sound waves traveling through the air to our ears. Read Text “Hard” RH-P2 Long ago, people noticed that planting seeds in hard soil was difficult. The ground needed to be broken up so that the seeds could be planted in softer soil and this led to the invention of the plow. No one knows who invented it, but we do know that people who lived thousands and thousands of years ago ________ the land to make it easier to grow food. Read Text “Hard” RH-11 A device called a thermostat senses and automatically controls temperature to a given setting. It sends signals to the furnace to keep the temperature in a room the same in winter. The thermostat turns the furnace on when the temperature gets too low. Warm air flows in from the furnace. The thermostat turns the furnace ________ when the temperature gets high enough.

Appendix K Paper Stimulus Materials
K-17
Read Text “Hard” RH-12 Matter is the “stuff” of the universe that occupies space and has the familiar states of solid, liquid, and gas. Solids have definite size and shape. Liquids take on shape of their containers and gases have no definite shape and spread out indefinitely. By freezing, thawing, and boiling away, water can change from a solid to a ________ to a gas. Read Text “Hard” RH-21 The telegraph, invented by Samuel Morse, was the first device that used electricity to send messages over long distances. The first telegraph used a key that sent electrical impulses along a wire. The impulses could be heard on the other end of the wire as a series of clicking sounds. The Morse code was developed to use the ________ to spell out messages. Read Text “Hard” RH-22 Some animal species, like woodchucks and bears, spend their entire winter sleeping or dormant and are said to be in hibernation. The word, “hibernate” is derived from a Latin word that means, “winter quarters.” In winter, Roman soldiers usually did not fight. They were inactive and stayed close to their encampments. It is this period of inactivity during the ________ to which the word ”hibernate” refers. Read Text “Hard” RH-31 Some of the stress management techniques are simple and can be used almost anywhere and any time. Some of these techniques focus on breathing while still other techniques focus on relieving muscle tension. Stress can cause a person to take shallow breaths. So one effective stress reduction method is to ________ deeply in and out to a slow count of 10.
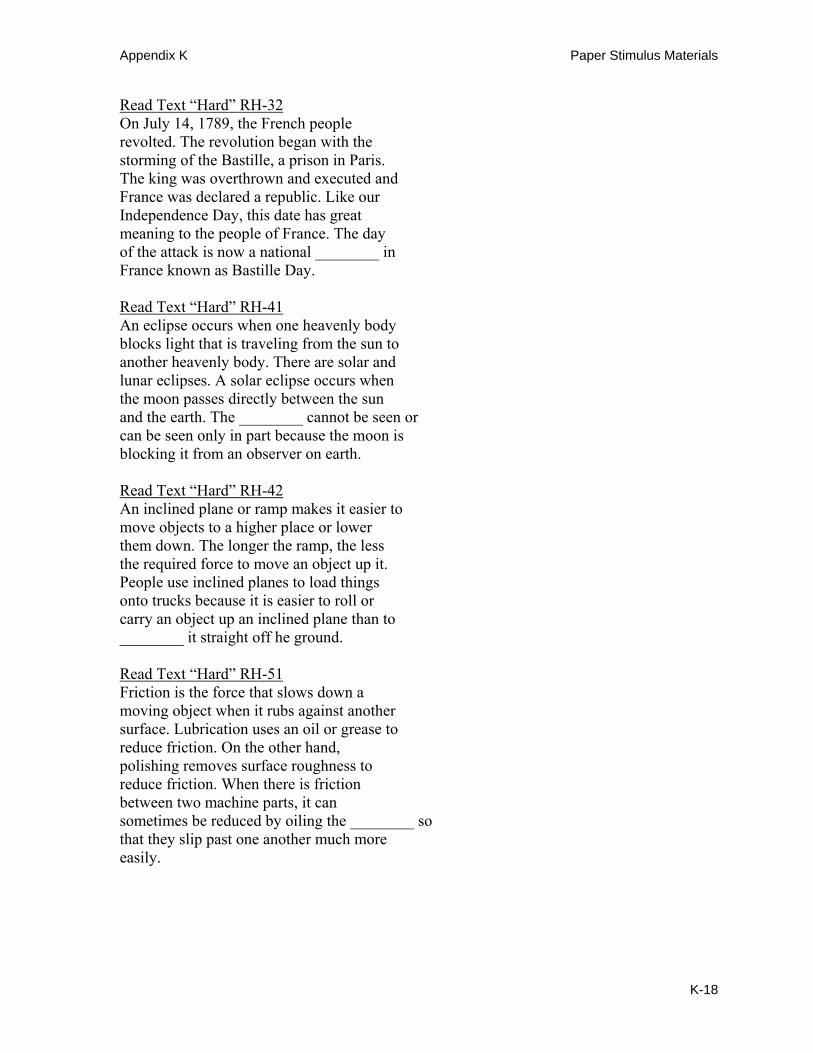
Appendix K Paper Stimulus Materials
K-18
Read Text “Hard” RH-32 On July 14, 1789, the French people revolted. The revolution began with the storming of the Bastille, a prison in Paris. The king was overthrown and executed and France was declared a republic. Like our Independence Day, this date has great meaning to the people of France. The day of the attack is now a national ________ in France known as Bastille Day. Read Text “Hard” RH-41 An eclipse occurs when one heavenly body blocks light that is traveling from the sun to another heavenly body. There are solar and lunar eclipses. A solar eclipse occurs when the moon passes directly between the sun and the earth. The ________ cannot be seen or can be seen only in part because the moon is blocking it from an observer on earth. Read Text “Hard” RH-42 An inclined plane or ramp makes it easier to move objects to a higher place or lower them down. The longer the ramp, the less the required force to move an object up it. People use inclined planes to load things onto trucks because it is easier to roll or carry an object up an inclined plane than to ________ it straight off he ground. Read Text “Hard” RH-51 Friction is the force that slows down a moving object when it rubs against another surface. Lubrication uses an oil or grease to reduce friction. On the other hand, polishing removes surface roughness to reduce friction. When there is friction between two machine parts, it can sometimes be reduced by oiling the ________ so that they slip past one another much more easily.

Appendix K Paper Stimulus Materials
K-19
Read Text “Hard” RH-52 Pollution is caused when substances that are harmful to life are released into the environment. Chemicals buried in the earth can leach out into the soil and create land pollution. Smoke from factories and exhaust fumes from automobiles and trucks can release harmful gases and particles into the air. Trash dumped in the ocean or chemicals dumped in lakes pollute the ________. Read Text “Hard” RH-61 Joan of Arc was a young French girl who lived in the Middle Ages and became one of the national heroines of France. Joan heard voices that she thought were from God or certain saints that inspired her to lead the French in battle against the English invaders. Joan was eventually captured by the English, was tried for witchcraft and was ________ at the stake. Read Text “Hard” RH-62 There are cold-blooded and warm-blooded animals. Fish and reptiles are examples of cold-blooded animals. A cold-blooded animal’s body temperature changes according to the temperature of its surroundings. Thus, if a cold-blooded animal lives in a cold place, its body will be cold. If it lives in a warm place, its body will be warm. Cold-blooded animals often sun themselves to ________ their bodies.

Appendix K Paper Stimulus Materials
K-20
Read Map “Easy” Read Map “Easy” entry 28-1 was used only during task training for practice. A certain methodology was used for assigning read text “easy” passages to trials. Audio recordings were made for the participant to identify two sets of locations on each map. The same map was used in replication and 1 and 2 with one set of locations being used in replication 1 and the other in replication 2. Read Map “Easy” Practice Map 28-1

Appendix K Paper Stimulus Materials
K-21
Read Map “Easy” 28-2
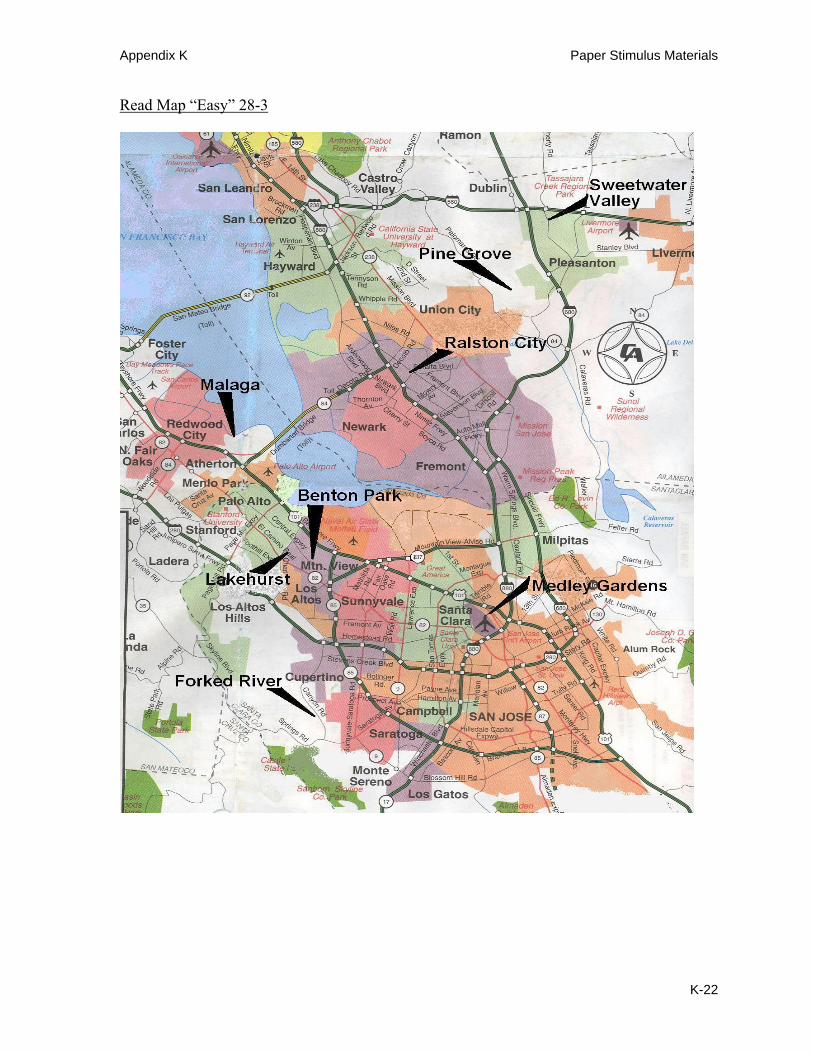
Appendix K Paper Stimulus Materials
K-22
Read Map “Easy” 28-3

Appendix K Paper Stimulus Materials
K-23
Read Map “Easy” 28-4

Appendix K Paper Stimulus Materials
K-24
Read Map “Easy” 28-5

Appendix K Paper Stimulus Materials
K-25
Read Map “Easy” 28-6

Appendix K Paper Stimulus Materials
K-26
Read Map “Easy” 28-7

Appendix K Paper Stimulus Materials
K-27
Read Map “Hard” Read Map “Hard” entry 29-1 was used only during task training for practice. A certain methodology was used for assigning read text “easy” passages to trials. Audio recordings were made for the participant to identify two sets of locations on each map. The same map was used in replication and 1 and 2 with one set of locations being used in replication 1 and the other in replication 2. Read Map “Hard” Practice Map 29-1

Appendix K Paper Stimulus Materials
K-28
Read Map “Hard” 29-2

Appendix K Paper Stimulus Materials
K-29
Read Map “Hard” 29-3

Appendix K Paper Stimulus Materials
K-30
Read Map “Hard” 29-4

Appendix K Paper Stimulus Materials
K-31
Read Map “Hard” 29-5

Appendix K Paper Stimulus Materials
K-32
Read Map “Hard” 29-6

Appendix K Paper Stimulus Materials
K-33
Read Map “Hard” 29-7

L-1
LLEEAADDSSUUBBJJEECCTT FFOOLLLLOOWW
L Appendix L. Lead Car Vehicle Inspection Records and Instructions
This appendix contains the instructions for performing regularly scheduled lead car vehicle inspections and operations. The following instructions are included:
Lead Car Daily Vehicle Inspection Record
Lead Car Weekly Vehicle Inspection Record
Lead Car Start-Up
Lead Car Communications Check
Computer Shutdown
Object and Event Detection (OED) - Lead Vehicle General Instructions
Lead Car Deceleration OED - Lead Vehicle Actions
Center High Mounted Stage Light OED and Follow Vehicle Turn Signal Lead Vehicle Information
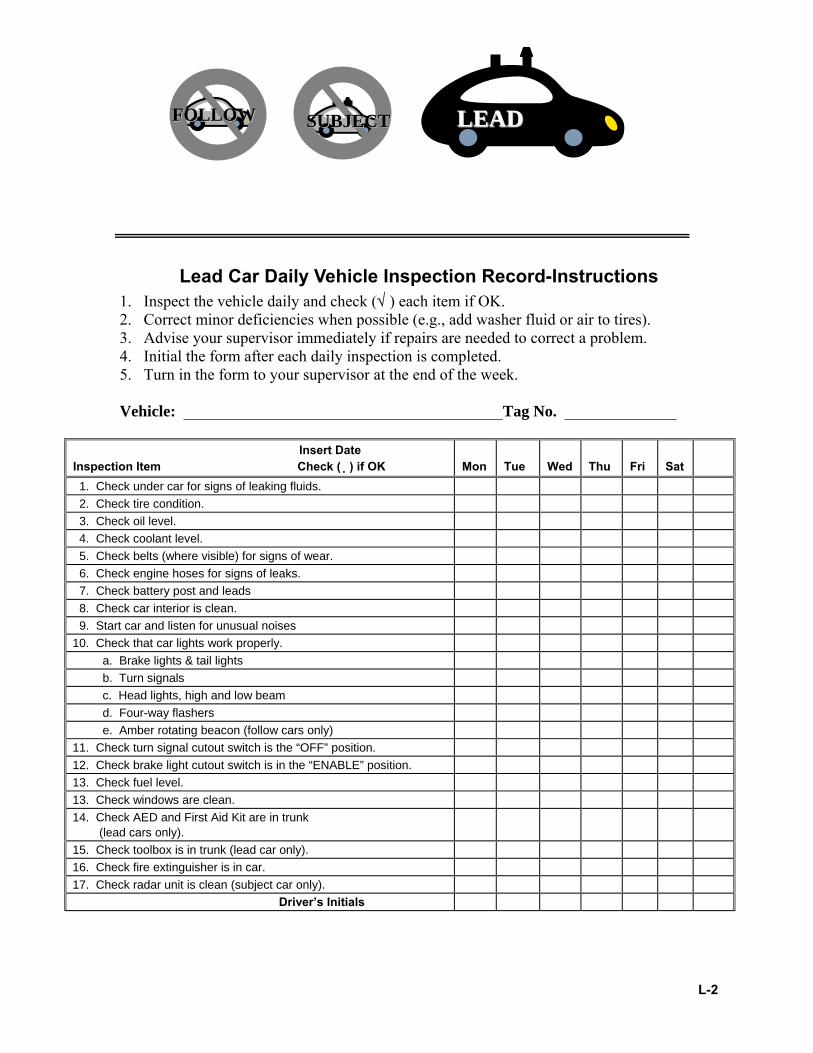
L-2
LLEEAADDSSUUBBJJEECCTT FFOOLLLLOOWW
Lead Car Daily Vehicle Inspection Record-Instructions 1. Inspect the vehicle daily and check (√ ) each item if OK. 2. Correct minor deficiencies when possible (e.g., add washer fluid or air to tires). 3. Advise your supervisor immediately if repairs are needed to correct a problem. 4. Initial the form after each daily inspection is completed. 5. Turn in the form to your supervisor at the end of the week. Vehicle: ________________________________________Tag No. ______________
Insert Date Inspection Item Check () if OK
Mon
Tue
Wed
Thu
Fri
Sat
1. Check under car for signs of leaking fluids. 2. Check tire condition. 3. Check oil level. 4. Check coolant level. 5. Check belts (where visible) for signs of wear. 6. Check engine hoses for signs of leaks. 7. Check battery post and leads 8. Check car interior is clean. 9. Start car and listen for unusual noises 10. Check that car lights work properly. a. Brake lights & tail lights b. Turn signals c. Head lights, high and low beam d. Four-way flashers e. Amber rotating beacon (follow cars only) 11. Check turn signal cutout switch is the “OFF” position. 12. Check brake light cutout switch is in the “ENABLE” position. 13. Check fuel level. 13. Check windows are clean. 14. Check AED and First Aid Kit are in trunk (lead cars only).
15. Check toolbox is in trunk (lead car only). 16. Check fire extinguisher is in car. 17. Check radar unit is clean (subject car only). Driver’s Initials

L-3
LLEEAADDSSUUBBJJEECCTT FFOOLLLLOOWW
Insert Date Inspection Item Check () if OK
Mon
Tue
Wed
Thu
Fri
Sat
Comments

L-4
LLEEAADDSSUUBBJJEECCTT FFOOLLLLOOWW
Lead Car Weekly Vehicle Inspection Record -Instructions
1. Inspect the vehicle on Monday morning each week and check () each item if OK. 2. Correct minor deficiencies when possible (e.g., add air to tires or tighten lug nuts). 3. Advise your supervisor immediately if repairs are needed to correct a problem. 4. Initial the form after the inspection is completed. 5. Turn in the form to your supervisor. Vehicle: _______________________________________ Tag No. ______________ Inspection Date: _______________________Odometer Reading: ______________________ Inspection Item
Check ( ) if OK
1. Check tire pressure with pressure gauge (including spare tire). 2. Check tires for excessive or uneven wear. 3. Torque the lug nuts. 4. Check power steering and brake fluid levels. 5. Vacuum car interior 6. Check if car needs washed. 7. Check level of Transmission fluid – replace if needed with Nissan Type J Driver’s Initials
Comments:

L-5
LLEEAADDSSUUBBJJEECCTT FFOOLLLLOOWW
Lead Car Start-up Instructions
1. Locate the correct laptop computer for this lead car. The correct computer will have a ________ label on it.(P1-Lead, P2-Lead, P3-Lead)
2. Place the computer on its stand located in the front passenger’s space. Ensure that it is securely fastened to the stand.
3. Refer to the following picture.
4. Connect the 7 computer wires to their correct locations:
a. Connect the power cord to the laptop
b. Connect the USB plug to the USB port
c. Connect the PS/2 mouse cable to the mouse port
d. Connect the serial connector to the serial port
e. Connect the monitor plug
f. Connect the parallel port plug to the parallel port
g. Connect the antenna plug to the wireless LAN card on the right hand side of the laptop.

L-6
LLEEAADDSSUUBBJJEECCTT FFOOLLLLOOWW
5. Insert the main power plug into the cigarette lighter as seen in the following picture. This
will provide AC and DC power to all of the equipment.
6. Start the car’s engine.
7. Turn the computer ON and ensure that it completes its start-up and boot procedure.
a. Hit the “ENTER” key when you see the password box.
b. Double click the “CAMP L_F” icon (yellow triangle) when it appears on the screen.
8. Fold the computer screen backwards against the dashboard.
9. Check all systems and verify that they have power and are working correctly. (i.e., red light on inverter, GPS screen lights up)
A.1 CAUTION The wireless LAN connector is very easy to break so be very careful when
you make this connection!
Figure 76: Main Power Connector

L-7
LLEEAADDSSUUBBJJEECCTT FFOOLLLLOOWW
10. Verify that BOTH rear turn signals are working.
a. If both turn signals are NOT working, find the larger of the two black boxes below the dash and pull the “TS Cut Off” switch to the ON position, i.e., pull the switch toward the driver. This box is located at the bottom of the center stack and will resemble the following picture.
Figure 5: Lead Car Display & Controls b. Re-verify that both turn signal indicators are working
11. Verify that both rear brake lights are working
a. If brake lights are NOT working, locate the small black box on top of the dash. It will look like the following figure:
Tail Signal Cut-Off Switch – ON is Towards Driver Change Left Change Right Light Light Left Acknowledge Right Acknowledge Button Button

L-8
LLEEAADDSSUUBBJJEECCTT FFOOLLLLOOWW
Figure 6: Lead Car Brake Light Switch
b. Move the toggle switch to the “ENABLE” (ON) position and then re-check the brake
lights to ensure they are working.
12. To turn the brake lights off if instructed to do so during data collection:
a. Flip the switch to the “DISABLE” (OFF) position, then
b. Count 4 seconds before tapping the brake pedal.
13. To shut all systems OFF on your return to CAMP, or if directed to do so you must do the
following:
a. Hit the “CTRL + F1” keys to exit and power off the laptop.
b. Wait until the software turns the computer OFF. Occasionally the machine may not power off, if the machine has not powered off after 5 minutes, turn it off manually by pushing the power ON slider on the left side of the machine.
CAUTION: If you step on the brake first or while you are flipping the switch, you will have NO brake
Light! li ht f t l t t d

L-9
LLEEAADDSSUUBBJJEECCTT FFOOLLLLOOWW
c. Then carefully unplug each of the connectors/cords on the back of the computer, taking special care when unplugging the wireless LAN connector.
d. Unplug the main power supply from the cigarette lighter.
14. Place the computer in its secure location until it is needed again.
15. Continue on to Lead Car Communications Check

L-10
LLEEAADDSSUUBBJJEECCTT FFOOLLLLOOWW
Lead Car Communications Check 1. Note the following:
a. The BLACK Q45 is the subject car for platoon #1. All 3 cars in platoon #1 will ONLY use radio channels #1- #4.
b. The PEWTER Q45 is the subject car for platoon #2. All 3 cars in platoon #2 will ONLY use radio channels #5 - #8.
c. The GREEN Q45 is the subject car for platoon #3. All 3 cars in platoon #3 will ONLY use radio channels #9 -#12.
2. Plug the headset into the radio BEFORE you turn the radio on.
3. Turn the radio on.
4. Verify that you are on the first channel assigned to your platoon.
a. Platoon #1 will be on channel 1;
b. Platoon #2 will be on channel 5;
c. Platoon #3 will be on channel 9.
5. Verify that the radio’s tonal feedback is set to OFF. If you heard your radio make any beeps when you turned it on, do the following: a. Turn your radio OFF.
b. Press and hold the MONITOR down while you then
c. Turn the radio ON
6. Verify that the “AUTO POWER OFF” function is disabled.
a. Press the “MENU” button 6 times to find the “AUTO POWER OFF” function.
Note
1. Instructions for the lead/follow cars will ONLY come from the experimenter.
2. Instructions to the subject will ONLY come from the safety observer.
3. For OED events, as needed, ONLY the experimenter will control Communications
4. Only the experimenter can Abort an OED test event.

L-11
LLEEAADDSSUUBBJJEECCTT FFOOLLLLOOWW
b. Ensure that the display shows only a dash, e. g. “ – .” A single dash mark indicates the “AUTO POWER OFF” function is disabled.
7. Verify that your radio’s “SENSITIVITY” function is set to “LOW.”
c. Press the “MENU” button 5 times to enter this function.
d. Use the UP/DOWN arrow keys to select option #1. Option #1 sets the “SENSITIVITY” function to low.
8. Verify that the “SCAN” function is off.
a. Examine the radio’s display
b. If the display shows the word “SCAN”
- Press the “SCAN” button on the radio
- Re-examine the display to ensure that the word “SCAN” has disappeared.
9. Press and HOLD the “LOCK” button on the radio until a “lock” appears in the display. This function locks the radio to prevent inadvertent or unintended changes-activation of radio functions.
10. Use your radio and headset to perform a communications check with the Experimenter, Follow car driver and the safety observer.
11. Ensure Lead car driver (you) can be heard by and can receive radio confirmation
from:
a. Experimenter
b. Safety Observer
c. Follow Car Driver
CAUTION
You must start ALL ready communications with the word “TALK,” i.e., “TALK, This is the lead car…” This allows the radio to recognize the rest of your sentence. If you do not start each communication with “TALK” the radio will miss the first
one or two words in your broadcast!

L-12
LLEEAADDSSUUBBJJEECCTT FFOOLLLLOOWW
12. Ensure that all in-vehicle entertainment systems and cell phones are turned OFF while testing is in progress.

L-13
LLEEAADDSSUUBBJJEECCTT FFOOLLLLOOWW
Changing Radio Channels 1. If team radio communications are being stepped on, i.e., interfered with by other users on
the same frequency/channel, contact the Experimenter and inform them of the situation.
2. If needed, the Experimenter will announce to the lead and follow car drivers “We are changing channels. Go to Channel xx.” “Acknowledge” (asking YOU to respond)!
3. Reply “Acknowledge” or “I COPY.”
4. Listen for “Acknowledge” or “I COPY” from the follow driver.
5. When both drivers acknowledge the statement, Tune to the new channel and let the Experimenter contact you there.
6. When asked, reply to the Experimenter “This is the lead car on channel xx. Do you copy?”
7. Listen for a “YES” or “I COPY” from the Experimenter.
8. Also, listen for “YES” or “I COPY” from the follow driver, and
9. Listen for “YES” or “I COPY” from the observer.
10. When the Experimenter is sure that all drivers and the observer have acknowledged and communicated to them, they will direct you to proceed with the tasks.
Note
1 Getting stepped on or interfered with by other users on the same channel is very common. So you may have to change channels several times each day.
2 Radio channels are assigned as follows:
a. Platoon #1 (Black Q45) will use channels #1-#4;
b. Platoon #2 (Pewter Q45) will use channels #5-#8; and
c. Platoon #3 (Green Q45) will use channels #9-#12.
3 If your communications are still being stepped on, you can use channels #13 or #14 instead of one of your assigned channels.

L-14
LLEEAADDSSUUBBJJEECCTT FFOOLLLLOOWW
Computer Shut Down To shut all systems OFF on your return to CAMP, or if directed to do so you must do the following:
1. Use the computer’s software to close all programs and shut down Windows.
2. Wait until the software turns the computer OFF.
3. Carefully unplug each of the connectors/cords on the back of the computer, taking special care when unplugging the wireless LAN connector.
4. Unplug the main power supply from the cigarette lighter.
5. Place the computer in its secure location until it is needed again.

L-15
LLEEAADDSSUUBBJJEECCTT FFOOLLLLOOWW
Object and Event Detection
Lead Vehicle General Instructions
1. Please turn off the entertainment system and cell phones, while testing.
2. In the Subject car, once the DAQ is successfully booted and running in automatic mode, the software will set up and run each event.
3. Please study the following picture
CAUTION
• The Lead Car Driver has a primary responsibility to ensure safe driving conditions during experimental tasks and at all other times.
• Please stay alert.
• Watch for any abnormal or unusual situation from traffic passing the platoon or for future hazards from the road ahead that may impact safe driving.
• Report these hazards to the experimenter using the radio.
Figure 79: Lead Car Control Box

L-16
LLEEAADDSSUUBBJJEECCTT FFOOLLLLOOWW
4. Note the following on the black control box in your car:
a. There are two indicator lights for Lead Vehicle lane busts, i.e.,
- CNG LF (left) and
- CNG RT (right).
b. There are two acknowledge buttons, i.e.,
- LF ACK (acknowledge follow vehicle left bust)
- RT ACK (acknowledge follow vehicle right bust).
c. As object and event detection (OED) tasks are scheduled to run by the computer, you will:
- Hear an audible beep
- See one of these lights illuminate, giving you necessary instructions on how to proceed.
d. For some OED events like lead car decelerations, you will also see a “headway” display in the small computer screen attached to the dash.
5. Detailed instructions for each OED event are provided below.

L-17
LLEEAADDSSUUBBJJEECCTT FFOOLLLLOOWW
Lead Car Deceleration (LVDECEL) OED –
Lead Vehicle Actions
1. Listen for a beep from the DAQ AND look at your small CRT display (shown in the following picture).
2. If you see a “Lead Car Deceleration” message in your small CRT display note that:
a. This tells you there is a deceleration event in process.
CAUTION Because of the short headway between the lead and subject cars and reduced
reaction times, the experimenter, observer, and you must fully attend to this
event’s activities to maintain safe driving during the deceleration OED!
Most of this event’s activity will involve the Subject vehicle and the Lead vehicle
(YOUR CAR).
During this event the Lead Car Driver must do their best to ensure that safe
driving conditions will prevail throughout the event.
Figure 80: Small CRT Display

L-18
LLEEAADDSSUUBBJJEECCTT FFOOLLLLOOWW
b. Visually examine the traffic behind and ahead of the platoon.
c. ASK the Follow Car driver and the Experimenter using the radio “OK to DECEL?”
d. Listen for the Follow vehicle driver to respond, “OK to DECEL”
i. If the Follow vehicle driver says “NO” or “WAIT,” WAIT for the condition to clear.
ii. Proceed to the next event if the Experimenter cancels this OED task.
iii. After the traffic scenario improves, the Follow vehicle driver will say, “OK to DECEL”
iv. Disable your rear brake lights
- Locate the small black box on top of your dash.
- Flip the switch to the “DISABLE” (OFF) position.
v. Tap the brakes to disengage the cruise control, and your car will decelerate closing the gap between it and the Subject vehicle.
vi. When the Participant taps their brake, the Follow vehicle driver will say, “Go, Go, Go.”
vii. Hit “RESUME” on the cruise control to return to normal driving
viii. Turn on your rear brake lights
- Locate the small black box on top of your dash.
- Flip the switch to the “ENABLE” (ON) position.
WARNING
When you tap the brakes to disengage the cruise control, your car will decelerate closing the gap between it and the Subject Car.
The Participant WILL HAVE TO NOTICE THE DECREASING HEADWAY AND BRAKE.
The safety observer WILL BRAKE THE CAR, using the passenger side brake pedal, if the Participant fails to brake appropriately.

L-19
LLEEAADDSSUUBBJJEECCTT FFOOLLLLOOWW
Center High Mounted Stop Light (CHMSL) OED AND Follow Vehicle Turn Signal (FVTS) -
Lead Vehicle Information
1. Maintain your vigilance related to unusual driving conditions from traffic or road
conditions beside and in front of the platoon of cars.
2. Notify the Experimenter with your radio if any driving condition becomes unsafe or has
the potential to be unsafe.
3. Monitor all radio communications.
Note This event will be set up and run automatically by the DAQ software.
Both the Lead and Follow vehicles will probably not know that this event is happening.
When started the computer will turn on either:
- The Lead car’s CHMSL will turn on and then off, or
- The Follow car’s FVTS on and then off.

M-1
SSUUBBJJEECCTTFFOOLLLLOOWW LLEEAADD
M Appendix M. Subject Car Vehicle Inspection Records and Instructions
This appendix contains the instructions for performing regularly scheduled subject car vehicle inspections and operations. The following instructions are included:
Subject Car Daily Vehicle Inspection Record
Subject Car Weekly Vehicle Inspection Record
Subject Car Start-Up
Experimenter’s Radio Communications Check
Object and Event Detection (OED) - Experimenter General Instructions
Center High Mounted Stop Light OED - Experimenter Actions
Lead Car Deceleration OED - Experimenter Actions
Safety Observer Instructions

M-2
SSUUBBJJEECCTTFFOOLLLLOOWW LLEEAADD
Subject Car Daily Vehicle Inspection Record-Instructions 6. Inspect the vehicle daily and check (√ ) each item if OK. 7. Correct minor deficiencies when possible (e.g., add washer fluid or air to tires). 8. Advise your supervisor immediately if repairs are needed to correct a problem. 9. Initial the form after each daily inspection is completed. 10. Turn in the form to your supervisor at the end of the week. Vehicle: ________________________________________Tag No. ______________
Insert Date →
Inspection Item Check (√ ) if OK Mon
Tue
Wed
Thu
Fri
Sat
Sun
1. Check under car for signs of leaking fluids. 2. Check tire condition. 3. Check oil level. 4. Check coolant level. 5. Check belts (where visible) for signs of wear. 6. Check engine hoses for signs of leaks. 7. Check battery post and leads 8. Check car interior is clean. 9. Start car and listen for unusual noises 10. Check that car lights work properly. a. Brake lights & tail lights b. Turn signals c. Head lights, high and low beam d. Four-way flashers e. Amber rotating beacon (follow cars only) 11. Check turn signal cutout switch is the “OFF” position. 12. Check brake light cutout switch is in the “ENABLE” position.
13. Check fuel level. 13. Check windows are clean. 14. Check AED and first aid kit are in trunk (lead cars only).
15. Check toolbox is in trunk (lead car only). 16. Check fire extinguisher is in car. 17. Check radar unit is clean (subject car only). Driver’s Initials Comments

M-3
SSUUBBJJEECCTTFFOOLLLLOOWW LLEEAADD
Subject Car Weekly Vehicle Inspection Record -Instructions 6. Inspect the vehicle on Fri each week and check ( √ ) each item if OK.
7. Correct minor deficiencies when possible (e.g., add air to tires or tighten lug nuts).
8. Advise your supervisor immediately if repairs are needed to correct a problem.
9. Initial the form after the inspection is completed.
10. Turn in the form to your supervisor.
Vehicle: _______________________________________ Tag No. ______________ Inspection Date: _________________Odometer Reading: ______________________ Inspection Item
Check (√ ) if OK
1. Check tire pressure with pressure gauge (including spare tire). 2. Check tires for excessive or uneven wear. 3. Torque the lug nuts. 4. Check power steering and brake fluid levels. 5. Vacuum car interior 6. Check if car needs washed. 7. Check level of Transmission fluid- replace with Nissan Type J if needed Driver’s Initials → Comments:
M-4
SSUUBBJJEECCTTFFOOLLLLOOWW LLEEAADD
Experimenter’s Preliminary Instructions
1. For the ON-ROAD segment of the study you will need to drive the participant to the
testing point on Day 1 after completing the training section.
2. For the TEST-TRACK segment of the study you will need to train the participant prior to beginning vehicle orientation after lunch on Day 1.
3. Make sure to take with you the MP3 player with the tasks loaded, the experimenter’s and the safety observer’s experimental plan.
4. Find the two drivers and safety observer assigned to your platoon.
4.1. Distribute one copy of the experimental plan to the safety observer.
5. Briefly meet with both drivers and the safety observer after reviewing the test plan to answer questions or discuss today’s activities.
6. Send your platoon’s drivers and the safety observer to their workstations to do the start-up procedures and communications check.
7. Go to Start-up procedure.

M-5
SSUUBBJJEECCTTFFOOLLLLOOWW LLEEAADD
Subject Car Start-Up Procedure
1. Start the car to ensure that the batteries are being charged.
2. Open both the left and the right Rear doors and ensure both side window sunscreens are pulled and latched across the windows.
2.1. Ensure that the RED toggle switch located under the lower monitor is in the OFF position.
Figure 9: Picture of Red Video Sync Cut-Out Switch in OFF Position
3. Locate the Roush Box. It will look like Figure 2, below.
3.1. Turn the POWER on by flipping the switch up
3.2. Turn the INVERTER on by flipping the switch up.
4. Close the left rear door and open the right front door, i.e., the safety observer’s door.
WARNING The following steps must be done BEFORE the computers in the trunk are turned on.
Figure 82: Power and Inverter

M-6
SSUUBBJJEECCTTFFOOLLLLOOWW LLEEAADD
5. Find the DMI unit, located on the safety observer’s clipboard. It will look like the box in the lower half of the following figure.
5.1. Locate the RED button on the bottom left corner of the DMI box.
5.2. Push the button to turn the power ON
CAUTION
The power on the DMI box MUST be turned on before the computers are turned on. It is critical that you only press the LEFT RED button as
indicated. DO NOT PRESS the YELLOW, GREEN, BLUE, or right-hand Red button.
power button
Figure 3: DMI Unit and Event Marker Buttons

M-7
SSUUBBJJEECCTTFFOOLLLLOOWW LLEEAADD
6. Close the safety observer’s door and open the right rear, or experimenter’s door. You will see the following equipment, as shown in the figure below.
Video Monitors
Video Quad Splitters
GPS Unit
Trunk HVAC Factory HVAC/Radio Computer Monitor
Lane Tracker Video Titlers
Figure 4: Experimenter Workstation Equipment
Figure 5: Experimenter Workstation Fault Indicators – below keyboard near lower right corner of computer
monitor

M-8
SSUUBBJJEECCTTFFOOLLLLOOWW LLEEAADD
7. Turn the video monitors ON by using their remote control.
8. Turn the GPS unit ON (use its pushbutton ON/OFF button found in back of the unit)
9. Ensure that the following equipment is ON by looking for the appropriate RED indicator light or function screens that are now illuminated:
9.1. GPS unit, screen is illuminated
9.2. Both video monitors, Red ON light illuminated
9.3. DMI screen is illuminated
9.4. Safe Tracker (lane tracking) screen is illuminated
9.5. Ensure that the lower video monitor shows all four camera views, for now the upper monitor will show BLUE screen.
9.6. Locate the Auxiliary Air Conditioner Control Knob found near the top of the instrument stack.
9.6.1. Set it to low by turning the knob 1 notch clockwise
Figure 6: Auxiliary A/C Control Panel
9.6.2. Watch the thermometer during data collection to ensure that the trunk temperature stays < 90o F!
9.7. Both titlers have RED light on
9.8. Lower Quad split has the GREEN light on, upper Quad split will light up when RED toggle is flipped to ON after DAQ computer completes boot sequence.
Thermometer AC Control Fan Control (not functional)

M-9
SSUUBBJJEECCTTFFOOLLLLOOWW LLEEAADD
9.9. Push the button on the KVM (keyboard video mouse) to ensure the #1 GREEN LED is on.
9.10. Turn on both microphones
9.11. Turn on the Computer monitor and ensure that it has GREEN or AMBER light by power the switch.
10. If and only if the proceeding steps have all been completed
10.1. Close the experimenter’s door and
10.2. Open trunk
10.3. Continue to next steps
11. Visually locate the 4 hard drive slots in the tan computer, found under the SCXI chassis on the bottom, left of the trunk. They will look like the hard drives in the following picture.
11.1. Verify that the correct hard drives are installed in the appropriate slots, by doing the following:
11.1.1. Install the system hard drive (NO label or BLANK); ensure that it is placed in Slot #1 found on the far left in the group of four.
11.1.2. Install the data collection hard drive (labeled ENG); ensure that is in the second slot or just to the right of the system disk slot.
11.1.3. Install the video recording hard drives; ensure that they are in the third (labeled V-1) and fourth (labeled V-2) or the two right-hand slots.

M-10
SSUUBBJJEECCTTFFOOLLLLOOWW LLEEAADD
Figure 7: View with ONE Hard Drive and Three Empty Slots
12. Locate the SCXI Chassis found in the upper left side of the trunk.
12.1. Turn the SCXI Chassis power ON, switch located in upper left of rack face, GREEN light will illuminate. The approximate location is shown in the next figure.
Figure 8: Approximate Location of SCXI ON Switch
Note
Each harddrive will have an alpha-numeric code telling you what it is used for and where it must be located.
Slot #1 Slot #2 Slot #3 Slot #4 BLANK ENG V-1 V-2
On/Off S i h

M-11
SSUUBBJJEECCTTFFOOLLLLOOWW LLEEAADD
13. If the power does not come on, check the electrical surge protector to ensure that it’s switch is in the ON or Reset position.
Figure 9: Electrical Surge Suppressor/Power Strip
13.1. Turn the TAN computer ON (the computer with the 4 hard drives) by pressing the large RED button in upper left, just above the hard disks.
13.2. Verify that the A/C is working by using your hand to feel for cold air blowing into the trunk.
13.3. Close trunk lid securely and return to the Experimenter Station.
Figure 10: KVM Switch
Note It may take up to 5 minutes for the DAQ computer to
finish booting.

M-12
SSUUBBJJEECCTTFFOOLLLLOOWW LLEEAADD
14. To get the login window,
14.1. Press CTRL + ALT + DEL, and
14.2. Username is Administrator and there is NO password.
15. Once the DAQ computer has fully booted to the desktop flip the RED toggle switch under the lower video monitor and verify the top video monitor has camera views showing.
16. Double click the “Load All” icon to bring up the main DAQ display. Details on how to use this interface will be provided during training.
17. Note that the main interface enables the following function keys through the mouse and cursor or by pressing the same key on the keyboard.
17.1. F1 = ABORT; call off the task
17.2. F2 = CANCEL OED
17.3. F3 = SPEED PROMPT; prompting the driver to speed up
17.4. F4 = LANE PROMPT; prompting the driver to watch lane position
17.5. F5 = MISSED OED; unable to complete OED during the task
17.6. F6 = FULLY SUCCESSFUL; task completed fully
17.7. F7 = PARTIALLY SUCCESSFUL; task completed partially
17.8. F8 = NOT SUCCESSFUL, task incomplete
17.9. F9 = INTERRUPTED
17.10. F10 = TRAFFIC; non-platoon vehicle cut-in during a task
17.11. F11 = HWITHSW PROBLEM; hardware and software problems
17.12. F12 = EXPERIMENTER ERROR

M-13
SSUUBBJJEECCTTFFOOLLLLOOWW LLEEAADD
Figure 11: Main DAQ Interface Display

M-14
SSUUBBJJEECCTTFFOOLLLLOOWW LLEEAADD
Experimenter’s Radio Communications Check 1. Note the following:
1.1. The BLACK Q45 is the subject car for platoon #1.
1.1.1. All three cars in platoon #1 will ONLY use radio channels #1 through #4.
1.2. The PEWTER Q45 is the subject car for platoon #2.
1.2.1. All three cars in platoon #2 will ONLY use radio channels #5 through #8.
1.3. The GREEN Q45 is the subject car for platoon #3.
1.3.1. All three cars in platoon #3 will ONLY use radio channels #9 through #12.
2. Verify that the radio’s tonal feedback is set to OFF.
2.1. If you heard your radio make any beeps when you turned it on, do the following:
2.1.1. Turn your radio OFF.
2.1.2. Press and hold the MONITOR down while you then
2.1.3. Turn the radio ON
3. Verify that the “AUTO POWER OFF” function is disabled.
3.1. Press the “MENU” button 6 times to find the “AUTO POWER OFF” function.
3.2. Ensure that the display shows only a dash, e. g. “ – .” A single dash mark indicates the “AUTO POWER OFF” function is disabled.
4. Verify that your radio’s “SENSITIVITY” function is set to “LOW.”
4.1. Press the “MENU” button 5 times to enter this function.
4.2. Use the UP/DOWN arrow keys to select option #1. Option #1 sets the “SENSITIVITY” function to low.
5. Verify that the “SCAN” function is off.
5.1. Examine the radio’s display
5.2. If the display shows the word “SCAN”
5.2.1. Press the “SCAN” button on the radio
5.2.2. Re-examine the display to ensure that the word “SCAN” has disappeared.
6. Press and HOLD the “LOCK” button on the radio until a “lock” appears in the display. This function locks the radio to prevent inadvertent or unintended changes-activation of radio functions.

M-15
SSUUBBJJEECCTTFFOOLLLLOOWW LLEEAADD
7. Use your radio and headset to perform a communications check with both drivers and the safety observer in your platoon.
7.1. Lead car driver
7.1.1. Can be heard by and receive radio confirmation from:
7.1.1.1. Experimenter
7.1.1.2. Observer
7.1.1.3. Follow Car Driver
7.2. Follow car driver
7.2.1. Can be heard by and receive radio confirmation from:
7.2.1.1. Experimenter
7.2.1.2. Observer
7.2.1.3. Lead Car Driver
7.3. Safety Observer
7.3.1. Can be heard by and receive radio confirmation from:
7.3.1.1. Experimenter
7.3.1.2. Follow Car Driver
7.3.1.3. Lead Car Driver
CAUTION You must start ALL radio communications with the word “TALK,” i.e., “TALK, This is
the lead car….” This allows the radio to recognize the rest of your sentence. If you do not start each communication with “TALK” the radio will miss the first one or two
words in your broadcast!

M-16
SSUUBBJJEECCTTFFOOLLLLOOWW LLEEAADD
7.4. Experimenter
7.4.1. Can be heard by and receive radio confirmation from:
7.4.1.1. Safety Observer
7.4.1.2. Follow Car Driver
7.4.1.3. Lead Car Driver
8. Ensure that all 3 in-vehicle entertainment systems are turned OFF.
CHANGING RADIO CHANNELS
9. If team radio communications are being stepped on, i.e., interfered with by other users on the same frequency/channel.
9.1. Contact the lead and follow car drivers
9.2. Announce “We are changing channels. Go to Channel xx.” “Acknowledge” (ask them to respond, in this order)!
9.2.1. Listen for “YES” or “I COPY” from the lead driver,
9.2.2. Listen for “YES” or “I COPY” from the follow driver, and
9.2.3. Listen for “YES” or “I COPY” from the observer.
9.3. When all 3 acknowledge the statement, Tune to the new channel as assigned to your platoon and
9.3.1. STATE “This is the experimenter on channel xx. Do you copy?” (ask them to respond, in this order)!
9.3.2. Listen for “YES” or “I COPY” from the lead driver,
9.3.3. Listen for “YES” or “I COPY” from the follow driver, and
9.3.4. Listen for “YES” or “I COPY” from the observer.
Note 1. Instructions for the lead/follow cars will ONLY come from the experimenter. 2. Instructions to the participant will ONLY come from the observer. 3. For each OED event the experimenter ONLY will control communications 4. Only the experimenter can Abort an OED test event.

M-17
SSUUBBJJEECCTTFFOOLLLLOOWW LLEEAADD
9.4. When all 3 acknowledge, proceed with the tasks.
Note Getting stepped on or interfered with by other users on the same channel is
very common. So you may have to change channels several times each day.
Radio channels are assigned as follows:
Platoon #1 (Black Q45) will use channels #1-#4;
Platoon #2 (Pewter Q45) will use channels #5-#8; and
Platoon #3 (Green Q45) will use channels #9-#12.
If your communications are still being stepped on, you can use channels #13 or #14 instead of one of your assigned channels.

M-18
SSUUBBJJEECCTTFFOOLLLLOOWW LLEEAADD
Object and Event Detection
Experimenter General Instructions
1. Continually monitor the temperature in the trunk.
1.1. If the temperature in the trunk is > 90o F, do the following:
1.1.1. Cancel or Abort any current OED events;
1.1.2. Instruct the lead and follow car drivers to:
1.1.2.1. Exit the highway at the next off-ramp
1.1.2.2. Pull over and stop when it is safe for all 3 cars to do so.
1.1.3. Open the trunk and do the following:
1.1.3.1. Turn off the computer
1.1.3.2. Turn off the SCXI
1.1.3.3. Lower the trunk lid so that there is a crack to allow the heat to dissipate.
1.1.3.4. DO NOT expose the computers to direct sunlight.
1.1.3.5. Ensure that the trunk air conditioning is still running.
1.1.3.6. Turn off all instrumentation inside the car except,
1.1.3.7. DO NOT turn off the air conditioning.
1.1.3.8. Turn off the power inverter switches.
1.1.4. When trunk temperature is < 90o F,
1.1.4.1. Return to Page 4, Subject Car Start-up Procedure
1.1.4.2. Complete ALL steps in Subject Car Start-up Procedure.
1.2. Resume data collection.

M-19
SSUUBBJJEECCTTFFOOLLLLOOWW LLEEAADD
2. Once the DAQ is successfully booted and running in automatic mode, the software schedules and sets up each event, with input from the experimenter.
3. Before starting any data collection with the DAQ, ensure and verify that you have flipped the START/STOP BUTTON on the main interface to the START position, as shown in Figure 12
Figure 12: Start/Stop Button on Interface
4. The experimenter will use the daily sheet containing the list of events, their condition, replication, and sequential trial number to:
4.1. Track each event as it moves through its stages;
4.2. Verbally request each task or event, as needed, via the radio;
4.3. Monitor team communications related to the task;

M-20
SSUUBBJJEECCTTFFOOLLLLOOWW LLEEAADD
4.4. If the Participant refuses to do a task or balks,
4.4.1. Have the safety observer use the “THEY BALK” button to mark the event or;
4.4.2. Ensure that this is done by the safety observer and if not, make a manual paper-pencil notation for future reference (the experimenter does not have access to the safety observer function buttons on the DMI).
4.4.3. Verbally cancel or abort the OED event, if needed.
4.5. Manually record each event that is missed or aborted;
4.6. Manually reschedule the event using the VI software now displayed on the computer monitor.
4.6.1. Set the Auto/manual control on the display to “MANUAL.”
4.6.2. Next, reset the event, repetition, and condition knobs to ensure that the rescheduled event has the same attributes as the missed event.
4.6.3. Click on the “Trigger Event” button in the display.
4.6.4. Click on the “Trigger Condition” button to start execution. This starts the automatic activation of the event by the computer.
4.6.5. Monitor the task through its completion using the appropriate OED procedure.

M-21
SSUUBBJJEECCTTFFOOLLLLOOWW LLEEAADD
Center High Mounted Stop Light (CHMSL) OED - Experimenter Actions
1. Monitor the CHMSL to ensure that the light shines in the appropriate car, as it was
supposed to do.
1.1. If for some reason that the event is stopped or blocked, or if the wait period is longer than the remaining time allocated by the computer:
1.1.1. Place an event marker using the “CANCEL OED” function button.
1.1.2. Manually record it so that it can be re-run later if the task permits
1.1.3. If the OED is possible, reschedule the event using the manual mode toggle switch displayed on the interface on the computer monitor.
1.1.4. Next, reset the event, repetition, and condition knobs to ensure that the rescheduled event has the same attributes as the missed event.
1.1.5. Click on the “Trigger Event” button in the display.
1.1.6. Click on the “Trigger Condition” button to start execution of the OED at the beginning of the task. This starts the automatic activation of the event by the computer.
1.2. Monitor the task through its completion using the appropriate OED procedure.
Note The following OED event instructions are provided in case something does happen to cause the event to be cancelled. Since this OED occurs regardless of traffic situations,
cancellation of the OED is not likely to happen.

M-22
SSUUBBJJEECCTTFFOOLLLLOOWW LLEEAADD
Lead Car Deceleration (LVDECEL) OED – Experimenter Actions
5. After a DECEL request is sent, listen for the Lead car driver to say the following:
5.1. “Lead to Follow; OK to DECEL?”
5.2. If the Follow car driver says, “OK to DECEL,” the DECEL will begin
5.2.1. If the follow car driver says NO or WAIT, wait for the condition to clear:
5.2.1.1. If the WAIT condition lasts for more than 1 minute, or if the wait period is longer than the remaining time allocated by the computer:
5.2.1.2. Declare this OED event as a missed event, Announce that “We are aborting this event. Return to normal platoon driving.”
5.2.2. Place an event marker using the “CANCEL OED” function button.
5.2.3. Manually record it so that it can be re-run later if the task permits
5.2.4. If the OED is possible, reschedule the event using the manual mode toggle switch displayed on the interface on the computer monitor.
5.2.5. Next, reset the event, repetition, and condition knobs to ensure that the rescheduled event has the same attributes as the missed event.
5.2.6. Click on the “Trigger Event” button in the display.
5.2.7. Click on the “Trigger Condition” button to start execution. This starts the automatic activation of the event by the computer.
CAUTION
Because of the short headway between the lead and subject cars and reduced reaction times, the experimenter, observer, and both drivers must fully attend to
this event’s activities to maintain safe driving during the deceleration OED!

M-23
SSUUBBJJEECCTTFFOOLLLLOOWW LLEEAADD
6. Monitor the task through its completion using the DECEL procedure.
7. When the lead car taps the brakes it will decelerate closing the gap between it and the Subject vehicle.
8. The Participant WILL HAVE TO NOTICE THE DECREASING HEADWAY AND TAP THE BRAKE.
9. The safety observer MUST USE THE BRAKE if the participant does not respond.
10. When the participant notices the lead car slowing down, they will tap their brakes and the experimenter, safety observer, and the lead car driver will hear the follow car driver say, “Go, Go, Go.”
11. At this point the lead car driver will resume cruise control speed of 55 mph.
Note
Lead Vehicle Driver will driving at 55 MPH:
Be alerted to this event visually and audibly;
Will disable rear brake lights;
Ask Follow car driver permission to start DECEL
Follow Vehicle Driver:
Will approve of the DECEL event
Monitor traffic to ensure the DECEL is safely completed
Let the Lead car driver know when the subject vehicle brakes turn on.
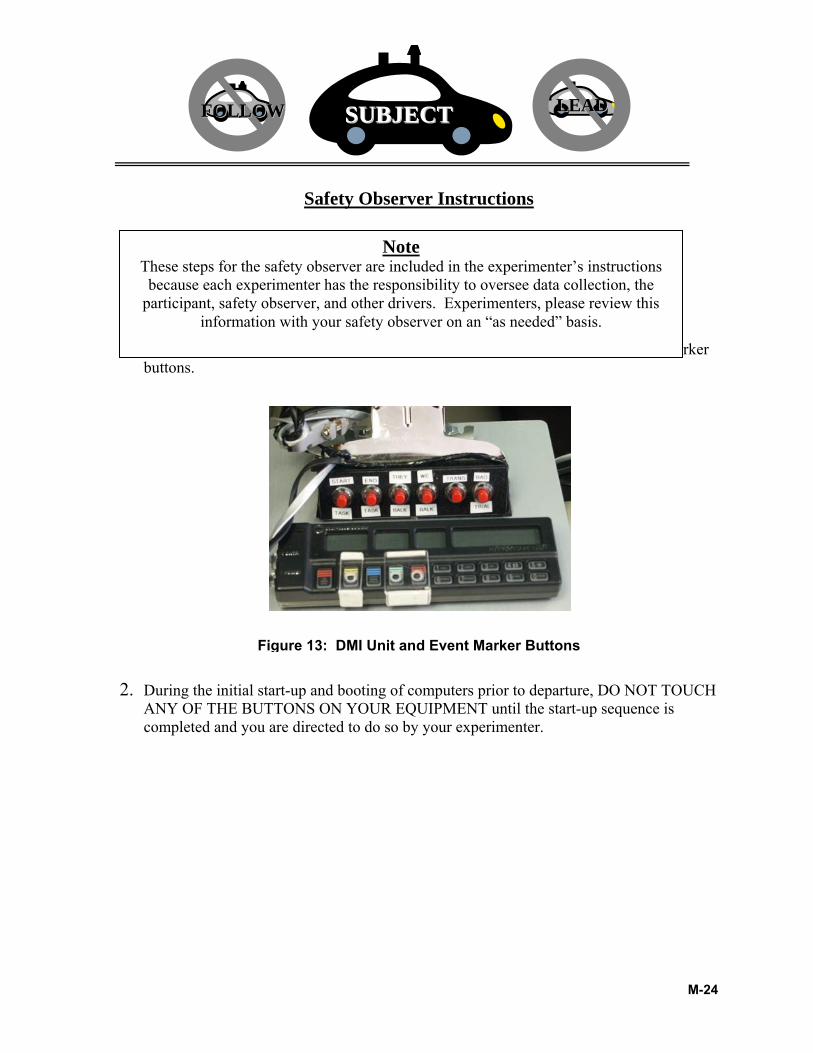
M-24
SSUUBBJJEECCTTFFOOLLLLOOWW LLEEAADD
Safety Observer Instructions 1. Safety observers please examine the following picture of the DMI unit and event marker
buttons.
2. During the initial start-up and booting of computers prior to departure, DO NOT TOUCH
ANY OF THE BUTTONS ON YOUR EQUIPMENT until the start-up sequence is completed and you are directed to do so by your experimenter.
Note These steps for the safety observer are included in the experimenter’s instructions
because each experimenter has the responsibility to oversee data collection, the participant, safety observer, and other drivers. Experimenters, please review this
information with your safety observer on an “as needed” basis.
Figure 13: DMI Unit and Event Marker Buttons

M-25
SSUUBBJJEECCTTFFOOLLLLOOWW LLEEAADD
Safety Observer’s Radio Communications Check 3. Note the following:
3.1. The BLACK Q45 is the subject car for platoon #1.
3.1.1. All three cars in platoon #1 will ONLY use radio channels #1 through #4.
3.2. The PEWTER Q45 is the subject car for platoon #2.
3.2.1. All three cars in platoon #2 will ONLY use radio channels #5 through #8.
3.3. The GREEN Q45 is the subject car for platoon #3.
3.3.1. All three cars in platoon #3 will ONLY use radio channels #9 through #12.
10. Verify that the radio’s tonal feedback is set to OFF.
10.1. If you heard your radio make any beeps when you turned it on, do the following:
10.1.1. Turn your radio OFF.
10.1.2. Press and hold the MONITOR down while you then
10.1.3. Turn the radio ON
11. Verify that the “AUTO POWER OFF” function is disabled.
11.1. Press the “MENU” button 6 times to find the “AUTO POWER OFF” function.
11.2. Ensure that the display shows only a dash, e. g. “ – .” A single dash mark indicates the “AUTO POWER OFF” function is disabled.
12. Verify that your radio’s “SENSITIVITY” function is set to “LOW.”
12.1. Press the “MENU” button 5 times to enter this function.
12.2. Use the UP/DOWN arrow keys to select option #1. Option #1 sets the “SENSITIVITY” function to low.
13. Verify that the “SCAN” function is off.
13.1. Examine the radio’s display
13.2. If the display shows the word “SCAN”
13.2.1. Press the “SCAN” button on the radio
13.2.2. Re-examine the display to ensure that the word “SCAN” has disappeared.
14. Press and HOLD the “LOCK” button on the radio until a “lock” appears in the display. This function locks the radio to prevent inadvertent or unintended changes-activation of radio functions.
M-26
SSUUBBJJEECCTTFFOOLLLLOOWW LLEEAADD
15. Use your radio and headset to perform a communications check with both drivers and the
safety observer in your platoon.
15.1. Lead car driver
15.1.1. Can be heard by and receive radio confirmation from:
15.1.1.1. Experimenter
15.1.1.2. Safety Observer
15.1.1.3. Follow Car Driver
15.2. Follow car driver
15.2.1. Can be heard by and receive radio confirmation from:
15.2.1.1. Experimenter
15.2.1.2. Safety Observer
15.2.1.3. Lead Car Driver
15.3. Experimenter
15.3.1. Can be heard by and receive radio confirmation from:
15.3.1.1. Safety Observer
15.3.1.2. Follow Car Driver
15.3.1.3. Lead Car Driver
15.4. Safety Observer
15.4.1. Can be heard by and receive radio confirmation from:
15.4.1.1. Experimenter
15.4.1.2. Follow Car Driver
CAUTION You must start ALL radio communications with the word “TALK,” i.e., “TALK, This is the lead car…” This allows the radio to recognize the rest of your sentence. If you do not start each communication with “TALK” the radio will miss the first one or two
words in your broadcast.

M-27
SSUUBBJJEECCTTFFOOLLLLOOWW LLEEAADD
15.4.1.3. Lead Car Driver
CHANGING RADIO CHANNELS
16. If team radio communications are being stepped on, i.e., interfered with by other users on the same frequency/channel.
16.1. Contact the experimenter and follow the instructions on changing channels.
WARNING: As a safety observer, your primary task is to ensure that our test participant is driving this car in a safe and controlled manner. Speak directly to the subject
and tell them to “slow down, speed up, pay attention,” etc. In more threatening scenarios, use your horn, use your brake, or maybe even grab the steering
wheel to restore safe driving conditions. SAFETY IS YOUR JOB!

M-28
SSUUBBJJEECCTTFFOOLLLLOOWW LLEEAADD
Safety Observer Operation Instructions 1. The safety observer will also be using the event marker buttons at the beginning and end
of each task as well as to note special circumstances affecting that task:
1.1. The experimenter will schedule a task and play a specific MP3 file associated with that task.
1.1.1. Each MP3 task request will end with the words “BEGIN NOW.”
1.1.2. When you hear this, press the “START TASK” event recorder button, i.e., the first button on the left of the event recorder buttons.
1.2. When the participant completes the task, they will say “DONE” or “FINISHED.” When you hear this, press the “END TASK” button, i.e., the second button from the left.
2. Error Conditions – from time to time there could be three main error conditions associated with each task.
2.1.1. If the participant refuses to do a task, press the third or “THEY BALK” button on the event recorder.
2.1.2. Then follow the experimenter’s instructions to do the next task or re-try this one.
2.1.3. If either the experimenter or you call the task off for any reason press the fourth or “WE BALK” button.
2.1.4. Then follow the experimenter’s instructions to do the next task or re-try this one.

M-29
SSUUBBJJEECCTTFFOOLLLLOOWW LLEEAADD
3. Bad Trials – are situations where some unexpected activity occurs that prevents the task or completing the task as designed. For example, the participant might drop the cell phone during a visual-manual cell phone dialing task or another vehicle suddenly might intrude causing a negative safety concerns, etc. In these cases:
3.1. Press the “BAD TRIAL” button, e.g., the last button on the right side of the event recording buttons.
3.1.1. Then follow the experimenter’s instructions to do the next task or re-try this one.
Remember Safety is your first responsibility!
N-1
FFOOLLLLOOWW SSUUBBJJEECCTT LLEEAADD
N Appendix N. Follow Car Vehicle Inspection Records and Instructions
This appendix contains the instructions for performing regularly scheduled lead car vehicle inspections and operations. The following instructions are included:
Follow Car Daily Vehicle Inspection Record
Follow Car Weekly Vehicle Inspection Record
Follow Car Start-up
Follow Car Communications Check
Object and Event Detection (OED) - Follow Vehicle General Instructions
Lead Car Deceleration OED - Follow Vehicle Actions
Center High Mounted Stage Light OED and Follow Vehicle Turn Signal - Lead Vehicle Information

N-2
FFOOLLLLOOWW SSUUBBJJEECCTT LLEEAADD
Follow Car Daily Vehicle Inspection Record-Instructions
11. Inspect the vehicle daily and check (√ ) each item if OK.
12. Correct minor deficiencies when possible (e.g., add washer fluid or air to tires).
13. Advise your supervisor immediately if repairs are needed to correct a problem.
14. Initial the form after each daily inspection is completed.
15. Turn in the form to your supervisor at the end of the week.
Vehicle: ________________________________________Tag No. ______________
Insert Date →
Inspection Item Check (√ ) if OK
Mon
Tue
Wed
Thu
Fri
Sat
Sun
1. Check under car for signs of leaking fluids. 2. Check tire condition. 3. Check oil level. 4. Check coolant level. 5. Check belts (where visible) for signs of wear. 6. Check engine hoses for signs of leaks. 7. Check battery post and leads 8. Check car interior is clean. 9. Start car and listen for unusual noises 10. Check that car lights work properly. a. Brake lights & tail lights b. Turn signals c. Head lights, high and low beam d. Four-way flashers e. Amber rotating beacon (follow cars only) 11. Check turn signal cutout switch is the “OFF” position.
12. Check brake light cutout switch is in the “ENABLE” position.
13. Check fuel level.

N-3
FFOOLLLLOOWW SSUUBBJJEECCTT LLEEAADD
13. Check windows are clean. 14. Check AED and First Aid Kit are in trunk (lead cars only).
15. Check toolbox is in trunk (lead car only). 16. Check fire extinguisher is in car. 17. Check radar unit is clean (subject car only). Driver’s Initials Comments
N-4
FFOOLLLLOOWW SSUUBBJJEECCTT LLEEAADD
Follow Car Weekly Vehicle Inspection Record -Instructions
11. Inspect the vehicle on Friday each week and check ( ) each item if OK.
12. Correct minor deficiencies when possible (e.g., add air to tires or tighten lug nuts).
13. Advise your supervisor immediately if repairs are needed to correct a problem.
14. Initial the form after the inspection is completed.
15. Turn in the form to your supervisor.
Vehicle: _______________________________________ Tag No. ______________
Inspection Date: _______________________Odometer Reading: ______________________
Inspection Item
Check (√ ) if OK
1. Check tire pressure with pressure gauge (including spare tire). 2. Check tires for excessive or uneven wear. 3. Torque the lug nuts. 4. Check power steering and brake fluid levels. 5. Vacuum car interior 6. Check if car needs washed. 7. Check level of transmission fluid- replace with Nissan Type J if needed Driver’s Initials →
Comments:

N-5
FFOOLLLLOOWW SSUUBBJJEECCTT LLEEAADD
Follow Car Start-Up Instructions
1. Find the computer stand and place it on the connection found on the passenger side floorboard.
2. Locate the correct laptop computer for this Follow car. The correct computer will have a ___ label on it. (P1-Follow, P2-Follow, P3-Follow)
3. Place the computer on its stand located in the front passenger’s space. Ensure that it is securely fastened to the stand.
4. Refer to the following picture before doing the next step.
5. Connect the 4 computer wires to their correct locations:
5.1. Connect the power cord to the laptop
5.2. Connect the serial connector to the serial port
5.3. Connect the parallel port plug to the parallel port
5.4. Connect the antenna plug to the wireless LAN card on the right hand side of the laptop
Figure 1: View of Laptop Connectors

N-6
FFOOLLLLOOWW SSUUBBJJEECCTT LLEEAADD
6. Insert the main power plug into the cigarette lighter as seen in the next picture. This will provide AC and DC power to all of the equipment.
7. Start the car’s engine.
8. Turn the computer ON and ensure that it completes its start-up and boot procedure.
8.1. Hit “ENTER” key when you see the password box,
8.2. Double click the “CAMP L_F” icon (yellow triangle) when it appears on the screen.
9. Fold computer screen backwards against dashboard.
10. Check all systems and verify that they have power and are working correctly.
CAUTION
The wireless LAN connector is very easy to break so be very careful when you make this connection.
Figure 2: Main Power Connection

N-7
FFOOLLLLOOWW SSUUBBJJEECCTT LLEEAADD
11. Verify that BOTH front turn signals are working.
11.1. If both front turn signals are NOT working, find the big black box on top of the dash and push the “TS Cut Off” switch to the OFF position, i.e., push the switch away from the driver. The big box will resemble the following drawing;
11.2. Re-verify that both front turn signal indicators are working
12. Open the trunk
12.1. Find the beacon and place it on the rear of the car. For a Lumina place the light on the trunk’s lid, for an Altima place the light on the roof.
12.2. Plug the beacon’s 12V plug into it’s 12V socket inside the trunk
12.3. Verify that the beacon is working and close the trunk.
13. To shut all systems OFF on your return to CAMP, or if directed to do so you must do the following:
13.1. Hit the “CTRL + F1” keys on the laptop to exit and power off.
Figure 3: Follow Vehicle Controls and Display
OK to Change Button
Lead Car Left
Lane bust light
Follow Car Left Lane bust light
Follow Car Left
Acknowledge Button
TS Cut-Off Switch, ON is Toward Driver Lead Car Right Lane bust light Follow Car Right Lane bust light F ll C Ri ht

N-8
FFOOLLLLOOWW SSUUBBJJEECCTT LLEEAADD
13.2. Wait until the software turns the computer OFF. Occasionally the machine may not power off. So if the machine has not powered off after 5 minutes, turn it off manually by pushing the power ON slider on the left side of the machine.

N-9
FFOOLLLLOOWW SSUUBBJJEECCTT LLEEAADD
13.3. Then carefully unplug each of the connectors/cords on the back of the computer, taking special care when unplugging the wireless LAN connector.
13.4. Unplug the main power supply from the cigarette lighter.
13.5. Place the computer in its secure location until it is needed again.
14. Open the trunk and disconnect the beacon.
15. Place the beacon inside the trunk and close the lid.

N-10
FFOOLLLLOOWW SSUUBBJJEECCTT LLEEAADD
Communications Check
17. Note the following:
17.1. The BLACK Q45 is the subject car for platoon #1.
17.1.1. All 3 cars in platoon #1 will ONLY use radio channels #1- #4.
17.2. The PEWTER Q45 is the subject car for platoon #2.
17.2.1. All 3 cars in platoon #2 will ONLY use radio channels #5 - #8.
17.3. The GREEN Q45 is the subject car for platoon #3.
17.3.1. All 3 cars in platoon #3 will ONLY use radio channels #9 -#12.
18. Plug the headset into the radio BEFORE you turn the radio on.
19. Turn the radio on.
20. Verify that you are on the first channel assigned to your platoon.
20.1. Platoon #1 will be on channel 1;
20.2. Platoon #2 will be on channel 5;
20.3. Platoon #3 will be on channel 9.
Note
5. Instructions for the lead/follow cars will ONLY come from the experimenter.
6. Instructions to the subject will ONLY come from the observer.
7. For OED events, as needed, ONLY the experimenter will control Communications
8. Only the experimenter can abort an OED test event.

N-11
FFOOLLLLOOWW SSUUBBJJEECCTT LLEEAADD
21. Verify that the radio’s tonal feedback is set to OFF.
21.1. If you heard your radio make any beeps when you turned it on, do the following:
21.1.1. Turn your radio OFF.
21.1.2. Press and hold the MONITOR down while you then
21.1.3. Turn the radio ON
22. Verify that the “AUTO POWER OFF” function is disabled.
22.1. Press the “MENU” button 6 times to find the “AUTO POWER OFF” function.
22.2. Ensure that the display shows only a dash, e. g. “ – .” A single dash mark indicates the “AUTO POWER OFF” function is disabled.
23. Verify that your radio’s “SENSITIVITY” function is set to “LOW.”
23.1. Press the “MENU” button 5 times to enter this function.
23.2. Use the UP/DOWN arrow keys to select option #1. Option #1 sets the “SENSITIVITY” function to low.
24. Verify that the “SCAN” function is off.
24.1. Examine the radio’s display
24.2. If the display shows the word “SCAN”
24.2.1. Press the “SCAN” button on the radio
24.2.2. Re-examine the display to ensure that the word “SCAN” has disappeared.
25. Press and HOLD the “LOCK” button on the radio until a “lock” appears in the display. This function locks the radio to prevent inadvertent or unintended changes-activation of radio functions.
26. Use your radio and headset to perform a communications check with the Experimenter, Follow car driver and the safety observer.
CAUTION You must start ALL ready communications with the word “TALK,” i.e.,
“TALK, This is the lead car…” This allows the radio to recognize the rest of your sentence. If you do not start each communication with “TALK”
the radio will miss the first one or two words in your broadcast!

N-12
FFOOLLLLOOWW SSUUBBJJEECCTT LLEEAADD
26.1. Ensure Lead Car driver (you)
26.1.1. Can be heard by and receive radio confirmation from:
26.1.1.1. Experimenter
26.1.1.2. Safety Observer
26.1.1.3. Follow Car Driver
27. Ensure that all in-vehicle entertainment systems and cell phones are turned OFF while testing is in progress.
Changing Radio Channels
28. If team radio communications are being stepped on, i.e., interfered with by other users on the same frequency/channel
28.1. Contact the Experimenter and inform them of the situation.
28.2. If needed, the Experimenter will announce to the lead and follow car drivers “We are changing channels. Go to Channel xx.”
28.3. Reply when asked, “Acknowledge” or “I COPY.”
28.4. Listen for “Acknowledge” or “I COPY” from the follow driver.
28.5. When both drivers acknowledge the statement, Tune to the new channel and let the Experimenter contact you there.
28.6. When asked, reply to the Experimenter “This is the lead car on channel xx. Do you copy?”

N-13
FFOOLLLLOOWW SSUUBBJJEECCTT LLEEAADD
28.7. Listen for a “YES” or “I COPY” from the Experimenter.
28.8. Also, listen for “YES” or “I COPY” from the follow driver, and
28.9. Listen for “YES” or “I COPY” from the observer.
28.10. When the Experimenter is sure that all drivers and the observer have acknowledged and communicated to her-him, she-he will direct you to proceed with the tasks.
Note
Getting stepped on or interfered with by other users on the same channel is very
common. So you may change channels several times.
Radio channels are assigned as follows:
Platoon #1 (BLACK Q45) will use channels #1-#4;
Platoon #2 (PEWTER Q45) will use channels #5-#8; and
Platoon #3 (GREEN Q45) will use channels #9-#12.
If your communications are still being stepped on, you can use channels #13 or #14
instead of one of your assigned channels.

N-14
FFOOLLLLOOWW SSUUBBJJEECCTT LLEEAADD
Object and Event Detection
Follow Vehicle General Instructions 1. Turn off the entertainment system and cell phones, while testing.
2. In the Subject car, once the DAQ is successfully booted and running in automatic mode, the software will set up and run each event.
3. Please study the following picture and find each light or button on the big black box attached to the dashboard in your car.
CAUTION
The Follow Car Driver has a primary responsibility to ensure safe driving conditions during experimental tasks and at all other times.
Please stay alert.
Watch for any abnormal or unusual situation from traffic passing from the rear of the platoon that may impact safe driving.
Report these events to the experimenter using the radio.

N-15
FFOOLLLLOOWW SSUUBBJJEECCTT LLEEAADD
Figure 4: Follow Car Buttons and Lights

N-16
FFOOLLLLOOWW SSUUBBJJEECCTT LLEEAADD
4. Find each of the following items on the black control box in your car:
4.1. There are two indicator lights for Lead Vehicle lane busts, i.e.,
4.1.1. Lead LF (left) and
4.1.2. Lead RT (right).
4.2. There are two indicator lights for Follow Vehicle (your car) lane busts, i.e.,
4.2.1. FOL LF (left) and
4.2.2. FOL RT (right)
4.3. There are three acknowledge buttons, i.e.,
4.3.1. “OK TO CNG” – OK for the lead car to change
4.3.2. LF ACK (acknowledge follow vehicle left bust)
4.3.3. RT ACK (acknowledge follow vehicle right bust)
4.4. As object and event detection (OED) tasks are scheduled to run by the computer, you will hear an audible beep and one of these lights will illuminate, giving you necessary instructions on how to proceed.
5. Detailed instructions for each OED event are provided below.

N-17
FFOOLLLLOOWW SSUUBBJJEECCTT LLEEAADD
Lead Car Deceleration (LVDECEL) OED – Follow Vehicle Actions
12. Visually examine the traffic behind and beside the platoon when you hear the Lead car driver announce that “Lead to Follow; OK to DECEL?.”
13. Respond by saying, “OK to DECEL” if the traffic scenario is safe for the event to occur.
14. If there is an unsafe driving condition now, or about to occur,
14.1. Respond by saying, “NOT SAFE FOR DECEL” or “WAIT”
14.2. Wait for the condition to clear and then respond by saying, “OK to DECEL”
15. The LVDECEL will begin the moment “OK to DECEL” command is given by you.
16. Watch for the Subject vehicle brake lights to turn ON and then respond, “Go, Go, Go” for the Lead vehicle driver to resume normal driving.
CAUTION
Because of the short headway between the lead and subject cars and reduced reaction times, the experimenter, observer, and both drivers must fully attend to this event’s activities to maintain safe driving during the deceleration OED!
Most of this event’s activity will only involve the Participant and Lead vehicles.
During this event the Follow Car Driver must do their best to ensure that safe driving conditions will prevail throughout the event.

N-18
FFOOLLLLOOWW SSUUBBJJEECCTT LLEEAADD
END LVDECEL OED
WARNING
When the lead car taps the brakes it will decelerate closing the gap between it and the Subject vehicle.
The Participant WILL HAVE TO NOTICE THE DECREASING HEADWAY AND TAP THE BRAKE.
The safety observer MUST USE THE BRAKE if the participant does not respond.

N-19
FFOOLLLLOOWW SSUUBBJJEECCTT LLEEAADD
Center High Mounted Stop Light (CHMSL) OED and Follow Vehicle Turn Signal (FVTS) - Follow Vehicle Information
4. Maintain your vigilance related to unusual driving conditions from traffic to the rear or
beside the platoon of cars.
5. Notify the Experimenter with your radio if any driving condition becomes unsafe or has
the potential to be unsafe.
6. Monitor all radio communications.
Note
This event will be set up and run automatically by the DAQ software.
Both the Lead and Follow vehicles will probably not know that this event is happening.
When started the computer will turn on either:
The Lead car’s CHMSL will turn on and then off, or
The Follow car’s FVTS on and then off.

O-1
O Appendix O. Analytic Surrogates Support Material
This appendix includes the following:
• Section 1 – Physical and Cognitive Activity Verb Lists
o Table 1 – Verb list for physical activities
o Table 2 – Verb list for cognitive activities
• Section 2 – Physical and Cognitive Activity Time Tables
o Table 3 – Physical activity timing key
o Table 4 – Cognitive activity timing key
• Section 3 – Example Models – Text Versions
o Task: #X – Note event info from radio broadcast
o Task: #XX – Use a map to find an alternate route
o Task #XXX: Obtain driving directions using TELL ME (1-800-555-TELL) and write down the first route instruction
• Section 4 – Example Models – Spreadsheet Versions
o Task: #X – Note event info from radio broadcast
o Task: #XX – Use a map to find an alternate route
o Task #XXX: Obtain driving directions using TELL ME (1-800-555-TELL) and write down the first route instruction
• Section 5 – Spreadsheet Tools User Manual
o Spreadsheet Tools User Manual

Appendix O Analytic Surrogates Support Materials
O-2
Section 1: Physical Activity Verb List
Cognitive Activity Verb List

Appendix O Analytic Surrogates Support Materials
O-3
Table 1. Verb List for Physical Actions (based loosely on MTM-1 conventions) Reach:
• Definition: To transport the hand or fingers to a destination. • Distinction: Reach is distinct from Move in that the primary objective is transport of
the hand or fingers from an initial state to a device or an object rather changing the location of the object.
• Example: To Reach for a cell phone in the center console cup holder.
Move: • Definition: To transport an object to a destination. • Distinction: Move is distinct from Reach in that the primary objective is transport of
an object rather than to transport the hand. • Example: Move a cell phone to the ear.
Turn: • Definition: To rotate the empty or loaded hand about the long axis of the forearm. • Example: Turn a key already inserted into the vehicle ignition.
Press-Momentary (apply pressure): • Definition: To apply muscular force to overcome object resistance, accompanied by
little or no motion. • Distinction: This is a momentary pushbutton activation and a Release step is implicit
rather than a separate later step. • Example: Press a key on a keyboard (e.g. typing).
Press-Hold (apply pressure for some duration): • Definition: To apply muscular force to overcome object resistance, accompanied by
little or no motion for some period of time. • Distinction: This is a prolonged application of pressure and does require an explicit
Release step at some later point in time. • Example: To hold down a scroll button to move through a list on a display screen.
Grasp: • Definition: To lay hold of or clasp by means of the fingers or arms. • Distinction: Grasp is distinct from Move in that an object must first be grasped
before it can be picked up. • Example: Grasp the volume control knob on a car radio.
Position: • Definition: To bring one object into an exact predetermined relationship with another
object. • Example: Position (locate) a key into the vehicle ignition.
Release: • Definition: To un-grasp or relinquish hold of an object, usually by opening the
fingers. • Example: Release the cell phone onto the center console cup holder.

Appendix O Analytic Surrogates Support Materials
O-4
Table 1. Verb List for Physical Actions (continued)
Look:
• Definition: Move the gaze (i.e., the cone of fine resolution vision) from one location to another known location (target or destination).
• Clarification: Look is distinct from Search in that the destination location is known when looking but is not known initially in Search. Look is also used for a unique or prominent location or feature such as a large isolated radio button.
• Example: Look to the Message Center Display or a radio-tuning knob.

Appendix O Analytic Surrogates Support Materials
O-5
Table 2. Verb List for Cognitive Activities (based on literature review) Read-Text:
• Definition: To interpret the meaning of visually displayed alphanumeric material such as numbers, words, and text.
• Example: Read an email or printed text.
Read-Iconographic: • Definition: To interpret the meaning of visually displayed iconographic information
such as signs, symbols and indicator lights. • Example: Examining an Instrument Panel Telltale Indicator for oil pressure.
Listen: • Definition: To interpret the meaning of auditorily presented verbal material such as
numbers, words, and text. • Example: Listen for the desired function in a telephony display.
Speak: • Definition: To utter words or articulate sounds with the voice. • Example: To say aloud a response to a biographical question.
Write: • Definition: To form alphanumeric characters with a pen, pencil, or other hand-held
instrument. • Example: Write a letter on the PDA screen.
Check: • Definition: Visually evaluate the state of a display. • Example: Check a speedometer to see if you are traveling “around” the speed limit.
Compare: • Definition: Examine similarities and differences between two or more objects or
events including the translation of a concept into the object or event to be compared to.
• Distinction: This operation includes any mental processing needed to translate feelings, concepts, icons etc. into homogeneous forms that can be directly compared.
• Example: Comparing cold feet to the position of HVAC control knob icons
Search-visual:
• Definition: To visually scan for one or more target items among a set of non-target items.
• Distinction: A search is a look to an unknown target, which requires scanning of an area to locate a target, which is not distinct or prominent.
• Example: Locating a Point of Interest in a list or a button in a group of buttons.

Appendix O Analytic Surrogates Support Materials
O-6
Table 2. Verb List for Cognitive Activities (continued)
Select:
• Definition: Select from among two or more alternatives. • Example: Select the third preset button on the car radio.
Track: • Definition: Continuously monitor a moving target and adjust a control to maintain
target-versus-signal error within acceptable limits. • Example: Track the lane width while driving.
Calculate mentally: • Definition: To carry out arithmetic processes (addition, subtraction, multiplication,
division) without pencil and paper, i.e., “in the head.” • Example: To add the toll amounts that will be required for a trip.
Spatial Calculate: • Definition: To carry out spatial based calculation without pencil paper. • Example: Determining the relative size of groups of objects.
Rotate mentally: • Definition: To mentally revolve or turn about an axis or direction. • Example: To rotate an upside down letter in a word of text to read the word.
Adjust: • Definition: To mentally plan a transformation of an object from a start state to an
end state. • Example: Determining movement required to set a control to a desired position.
Recall-STM: • Definition: Retrieve information from working memory. • Example: To Recall the outcome of a game after hearing a sports broadcast.
Recall-LTM: • Definition: Retrieve information from long-term memory. • Distinction: This Recall is used when a search must be made of long-term memory
to produce the required information. • Example: To Recall the name of a co-worker at a previous job.
Feedback-Auditory: • Definition: To perceive a non-verbal auditory feedback from a control. • Example: To hear a cell phone beep resulting from a button press.
Feedback-Tactile: • Definition: To perceive a tactile feedback from a control. • Example: To feel the detent click between positions of an HVAC control knob.
Retain: • Definition: Retain information in working memory.

Appendix O Analytic Surrogates Support Materials
O-7
• Example: To remember the series of directions to get to a destination.
Table 2. Verb List for Cognitive Activities (continued)
Wait:
• Definition: To Wait for a system response before beginning the next step in a sequence that is externally paced.
• Example: To Wait for a phone to display test indicating it is ready for a call.
Determine:
• Definition: A GOMS-like “bypass” step that takes the place of a complex mental process that may include multiple cognitive steps like Read, Calculate and Adjust but that cannot be fully modeled with this vocabulary, not a commonly used task step.
• Example: Determining the missing word in a passage of text, which includes Compare, Recall and Read but is not fully explained by these steps alone.

Appendix O Analytic Surrogates Support Materials
O-8
Section 2: Physical Activity Time Tables
Cognitive Activity Time Tables

Appendix O Analytic Surrogates Support Materials
O-9
Table 3 - Count Task Steps Heuristic – Physical Activity Timing Key:
Activity Case Completion Time Estimates Let y = Activity Time Estimate
A: Reach to object in fixed location or in other hand or on which other hand rests
y = -0.0002x2 + 0.0236x + 0.0988 R2 = 0.9878
B: Reach to a single object in a location that may vary slightly from cycle to cycle
y = -0.0003x2 + 0.0355x + 0.0806 R2 = 0.9959
C: Reach to object jumbled with other objects in a group so that search and select occur
y = -0.0003x2 + 0.0364x + 0.1279 R2 = 0.9884
D: Reach to a very small object or where accurate grasp is required
y = -0.0003x2 + 0.0364x + 0.1279 R2 = 0.9884
Reach
E: Reach to an indefinite location to get hand in position for body balance, or next motion, or out of the way
y = -0.0002x2 + 0.0314x + 0.0873 R2 = 0.9931
A: Move object to other hand or against stop y = -0.0002x2 + 0.0352x + 0.0699
R2 = 0.9982 B: Move object to approximate or indefinite location y = -0.0004x2 + 0.0372x + 0.0914
R2 = 0.9935 Move
C: Move object to exact location y = -0.0003x2 + 0.0406x + 0.1054 R2 = 0.9949
Turn Turn: Assume negligible resistance and x degrees of rotation y = 0.0016x + 0.0537 R2 = 0.9998
Momentary (e.g., keying time for a simple pushbutton) from (Munger, Smith, and Payne, 1962) y = 0.63 Press-
Momentary Keystroke random words (not prose), single key stroke time from (Card, Moran, and Newell, 1983) y = 0.25
Press-Hold Hold (determined by design requirement) y = [design HOLD duration Release Release: Normal release by opening fingers y = 0.07
Loose: (approximate, no pressure needed) (Distance to engage is < 1 inch for all cases) y = 0.20
Close: (light pressure needed) y = 0.58 Position
Exact: (tight fit, heavy pressure needed) y = 1.55
A: Any size object by itself, easily grasped y = 0.07 B: Object very small or lying close against a flat surface y =0 .13 C1: Diameter > 0.5 inches; interference with grasp on bottom and one side of nearly cylindrical object y = 0.26
C2: ¼ inch < Diameter < ½ inch; same interference as C1 y = 0.31 C3: Diameter < ¼ inches; same interference as C1 y = 0.39 Re-grasp or change hands without loss of control y = 0.20 4A: Select 1"x1"x1" or larger object jumbled with others y = 0.26 4B: Select ¼"x ¼ "x 1/8 " to 1"x1"x1" object, jumbled y = 0.33
Grasp
4C: Select smaller than: ¼"x ¼ "x 1/8 ,” jumbled y = 0.46
Look Look: T=distance in inches from look location to the next; D= viewing distance in inches perpendicular to the line of travel y = 0.55*(T / D)

Appendix O Analytic Surrogates Support Materials
O-10
Table 4 - Count Task Steps Heuristic – Cognitive Activity Timing Key: (Page 1)
Activity Input Description Completion Time Estimates Let y = Activity Time Estimate
Text: For connected prose, assume 214 words/minute reading rate or 9th grade reading level (from Crowder, 1982)
y = 0.28x For x = number of words Read-Text
Label: For a single word in isolation, assume single word or label read in a single saccade of 0.288 s duration (from Card, 1983) y = 0.288
Read-Icon Icon: Assume an icon is read in a single saccade of 0.288 s y = 0.288
Maximum transmission rate for speech is 250 words/minute (from Deatherage, 1972)
y = 0.24x for x = number of words heard Listen
Relaxed transmission rate for speech is 150 words/minute (from Ericsson and Simon, 1984)
y = 0.40x for x = number of words heard
Maximum transmission rate for speech is 250 words/minute (from Deatherage, 1972)
y = 0.24x for x = number of words heard Speak
Relaxed transmission rate for speech is 150 words/minute (from Ericsson and Simon, 1984)
y = 0.40x for x = number of words heard
Write Write: The maximum writing rate of 100 characters per minute is equal to 0.6 s per character. (from Devoe (1967) as cited in Seibel, 1972)
y = 0.6x for x = number of characters written
Read-Label: Use Read-Label activity time for a check glance. y = 0.288
Check Feedback-Visual: Estimate with simple reaction time of 200 msec (from Frost, 1972, Fig 6-60) y = 0.200
Easy: Trabasso (cited in Freedle and Carroll, 1972) reported a time of .45 sec. for verifying stored information mentally and .08 sec. to compare that information to other objects
y = 0.53
Compare Hard: Trabasso (cited in Freedle and Carroll, 1972) reported a longer time of 1.24 sec. for verifying stored information mentally and .27 sec. to compare that information to other objects
y = 1.51
Track User Enter: Either track until target is at “rest” or until target is lost User determined
Calculate mentally
Default: Based on the common occurrence of mental operation times in the area of 1.2 seconds and the reported J2365 “mental” time this step is assigned a fixed value of 1.2 seconds.
y = 1.2
Calculate spatially
Default: Based on the common occurrence of mental operation times in the area of 1.2 seconds and the reported J2365 “mental” time this step is assigned a fixed value of 1.2 seconds.
y = 1.2
Rotate mentally
Rotate Mentally: Shepard and Metzler (cited in Wickens and Hollands, 1999) reported mental rotation rates for rotations in the picture plane of approximately 60 degrees per second.
Y = 0.0167x for x = degrees of mental rotation

Appendix O Analytic Surrogates Support Materials
O-11
Table 4 - Count Task Steps Heuristic – Cognitive Activity Timing Key: (Page 2)
Activity Input Description Completion Time Estimates Let y = Activity Time Estimate
Recall-STM Default: Card, Moran, and Newell (1983) present mental times ranging from .62 – seconds to 1.35 seconds, with the latter including a choose operation. Recall-STM is assigned a time of .62 sec here based on the quicker operation above.
y = 0.62
Recall-LTM Default: A value of 1.35 is assigned for Recall-LTM as it is logical that it takes a longer period and may involve a selection or choose operation as the mental operation in Card, Moran and Newell (1983)
y = 1.35
Reported standard mental times range from 0.62 sec. to 1.2 sec. Familiar: this simple mental adjustment uses the quicker reported mental time of 0.62 sec.
y = 0.62 Adjust
Complex: this more difficult version of mental adjustment uses the longer mental time of 1.2 sec. y = 1.2
Feedback-Auditory
Feedback-Auditory: Estimate with simple reaction time of 160 msec to moderate-intensity auditory stimulus from Frost (1972). y = 0.16
Feedback-Tactile
Feedback-Tactile: Estimate with simple reaction time of 150 msec to moderate-intensity tactile stimulus from Frost (1972). y = 0.15
Retain (In WM)
Default A study by Trabbaso (cited in Freedle and Carroll, 1972) offers a time range of .56 – 1.28 seconds for storing information in memory (and includes some mental transformation). Assuming that some mental operation is required in conjunction with the retention phase this activity is assigned a fixed time of 1.2 sec.
y = 1.2
Select (Decide on an option)
Decide: Use Hick's law with n+1 alternatives. The logic of adding 1 is it deals with the additional alternative of whether to select or not. Multiplier of 0.15 is from Card, Moran and Newell (1983). Bits (log to base 2) are used in calculation and calculated as log(x)/log(2). See table on page 3.
y = 0.15 * [log(x+1)/log(2)] for x = number of alternatives See table on page 4
Wait Wait: Defined by system response time or else unconstrained Mean system response time
Default: Step is a combination of at least 4 mental operations, thus uses 4*(J2365 “mental” time of 1.2 s)+ (reaction time of .2 s) = 5 s. y = 5.0
User Enter: Enter estimate of time for the specific situation. User specified value Problem Solving Aloud: Ericsson and Simon (1984) reported average rate of 40 – 72 words per minute for spoken problem solving. An average of this range yields 1.165 sec per word for problem solving out loud activities
y = 1.165x for x = number of words spoken aloud
Think Aloud: Ericsson and Simon (1984) reported average rate of 50 – 110 words per minute for thinking aloud. An average of this range yields a rate of .875 sec per word for thinking out loud activities
y = 0.875x for x = number of words spoken aloud
Determine
Complete Fragment: Kintsch (1974) reported values of 4 sec. for completing either a simple or complex sentence fragment. y = 4.0

Appendix O Analytic Surrogates Support Materials
O-12
Table 4 - Count Task Steps Heuristic – Cognitive Activity Timing Key: (Page 3)
Activity Input Description Completion Time Estimates Let y = Activity Time Estimate
Scattered List - Present: Assume a search though an unfamiliar scattered list of N clearly legible printed targets in which 5 targets can be identified with a single glance of duration 1.5 sec. In each successive glance several targets are re-examined and on average a person will search half the targets before finding the intended target. If searching for multiple targets (i.e., multiple separate search steps) a person will have to search a set equal to the total number of targets minus the number previously found.
y = 1.5 * (K/2) where K = N – 5 + 1
Scattered List - Missing: Same search as above but a person will have to search the entire list to determine that a target is not present.
y = 1.5 * K where K = N – 5 + 1
Menu-Present: Assume a linear search through an unfamiliar menu of N items and each word takes one saccade of T=0.288 s duration. The target is present in the menu and the person on average searches through N/2 items before finding the target
y= T * (N/2) where N = number of items
Menu-Missing: If the target is absent from the display (e.g., a page prior to the target page in a multi-page listing). y= T * N
where N = number of items
Cluttered Field-Present: Assume the following: The average time for a single information-gathering saccade is 0.288 s The saccade spans a 1-degree cone of foveal vision. The person tends to examine a cluttered visual display of area A (in squared units of degrees subtended at the eye) with non-overlapping saccades. The probability of the target being in a given sub-area of A is distributed evenly across the entire display The target is detected if it is examined with foveal vision The search process stops once target is detected. On average, the person scans half the display area before finding the target Target is present in field
y = 0.288 * (A / 2) where A = search area in degrees-squared
Search-Visual
Cluttered Field-Missing: Assume as above except: Target is absent from field
y = 0.288 * A where A = search area in degrees-squared

Appendix O Analytic Surrogates Support Materials
O-13
Table 4 - Count Task Steps Heuristic – Cognitive Activity Timing Key: (Page 4) “Select” Value Table: To assign a time to a “Select” step used in a Count Task Steps Heuristic model, find the appropriate number of options listed as “x” in the table below. The value of the log function for that number of choices is listed next to “x.”
x log(x+1)/log(2) x log(x+1)/log(2) x log(x+1)/log(2) x log(x+1)/log(2)
1 1.00000 26 4.75489 51 5.70044 76 6.26679 2 1.58496 27 4.80735 52 5.72792 77 6.28540 3 2.00000 28 4.85798 53 5.75489 78 6.30378 4 2.32193 29 4.90689 54 5.78136 79 6.32193 5 2.58496 30 4.95420 55 5.80735 80 6.33985 6 2.80735 31 5.00000 56 5.83289 81 6.35755 7 3.00000 32 5.04439 57 5.85798 82 6.37504 8 3.16993 33 5.08746 58 5.88264 83 6.39232 9 3.32193 34 5.12928 59 5.90689 84 6.40939 10 3.45943 35 5.16993 60 5.93074 85 6.42626 11 3.58496 36 5.20945 61 5.95420 86 6.44294 12 3.70044 37 5.24793 62 5.97728 87 6.45943 13 3.80735 38 5.28540 63 6.00000 88 6.47573 14 3.90689 39 5.32193 64 6.02237 89 6.49185 15 4.00000 40 5.35755 65 6.04439 90 6.50779 16 4.08746 41 5.39232 66 6.06609 91 6.52356 17 4.16993 42 5.42626 67 6.08746 92 6.53916 18 4.24793 43 5.45943 68 6.10852 93 6.55459 19 4.32193 44 5.49185 69 6.12928 94 6.56986 20 4.39232 45 5.52356 70 6.14975 95 6.58496 21 4.45943 46 5.55459 71 6.16993 96 6.59991 22 4.52356 47 5.58496 72 6.18982 97 6.61471 23 4.58496 48 5.61471 73 6.20945 98 6.62936 24 4.64386 49 5.64386 74 6.22882 99 6.64386 25 4.70044 50 5.67243 75 6.24793 100 6.65821

Appendix O Analytic Surrogates Support Materials
O-14
Section 3: Example Models – Text Version

Appendix O Analytic Surrogates Support Materials
O-15
Task: #X – Note Event Info From Radio Broadcast
Method:
In this task a Ssubject will turn on a radio, set it to a desired channel by use of radio preset buttons and listen to a radio program. The intent of listening to the program is to get information on an upcoming event and write it down for later reference. A click type ballpoint pen and small notepad are located in the center armrest of the vehicle. The subject must open the armrest and retrieve the items, then write down the information and finally return the items to the armrest and close it.
It is assumed that the subject will hold the notepad on the steering wheel with the left hand while steering and write with the right hand. Note that, this is only one strategy for completing this task, others are not modeled here.
Note also that while the agreed upon task end is the subject speaking the word “done” after writing down the information, there are additional steps in the model. It is logically necessary that the subject cannot continue to hold the pen and notepad. Therefore the steps to replace these items in the center armrest are included after the end of the task in this model and a notation of such is made at the end of the model.
Underlying Critical Assumptions:
• Driver is comfortably seated in-vehicle or in a like environment and can easily reach/see vehicle controls and task devices/materials.
• Driver is engaged in steady-state car following (i.e., manually controlling speed and lane position with 2 hands on steering wheel, looking straight ahead) or similar task.
• Driver is experienced and familiar with the vehicle, equipment and tasks. • Driver is in good health with no fatigue, discomfort, handicaps (mental or physical), or
ailments (mental or physical) that would affect driving or typical in-vehicle tasks. • Task begins at the end of “Please begin now” in MP3 task request recording. • Tasks are completed successfully with no errors and the subject never has to back up
and repeat a step.
Start of Task (initial conditions):
• Ballpoint pen is in the center armrest. • Pen is closed and requires the top button to be clicked to expose the writing tip. • A small notebook is open to a blank page and laying in the center armrest. • Center armrest is closed. • Radio is turned off. • When radio is powered on, it will be set to a station other than the desired one. • Task motivation (like an MP3 request) requires here that the subject retain information
on the target event as well as the radio station and/or program that will yield the information.
Goal State (ending conditions):
• Subject says “done.” • Subject has written down the location and time of an event. • Subject has placed the pen and notepad back in the armrest compartment. • Subject has closed the armrest.
Task Steps Performed by Driver:

Appendix O Analytic Surrogates Support Materials
O-16
• Look from road scene ahead to the radio • Release right hand from steering wheel • Reach right hand to the radio • Press-Momentary the radio “On” button (note no explicit Release step required)
o Recall the radio program of interest o Recall the radio station playing the program o Recall the radio preset for this station o Search-Visual for the desired preset button from among 5 choices
• Reach right hand to the desired preset button • Press-Momentary the radio preset button
o Wait for station to begin playing o Listen to radio program o Compare current program to desired program (assumed positive result) o Recall event of interest o Listen to radio program for desired event information to be played
• Move right hand to center arm rest (assumed very familiar and Look not needed) • Position right hand to open arm rest • Grasp arm rest release handle • Press-Hold release handle • Move arm rest lid up to vertical position • Release arm rest release handle (explicit Release as required by the previous Press-
Hold) • Reach arm over lid and to interior compartment • Look to arm rest compartment (notepad is a prominent item, no Search-Visual needed)
o Adjust position of hand to pick up notepad (concurrent with next step) • Position right hand to pick up notepad • Grasp notepad
o Adjust notepad to position into left hand (concurrent with next step) • Move notepad to left hand on steering wheel • Look back to arm rest compartment • Reach right hand back to arm rest interior compartment
o Search-Visually to locate pen in compartment o Adjust hand to retrieve pen (concurrent with next step)
• Position right hand to pick up pen • Grasp pen with right hand • Reach thumb to click button on end of pen to expose writing tip • Move thumb down and back to click pen open
o Adjust pen position in hand to writing position (concurrent with next step) • Position pen in hand to write • Move right hand to notepad on steering wheel
o Adjust hand position to be able to write on notepad (concurrent with next step) • Position pen to write on notepad
o Listen for desired event location o Retain event location o Write event location (Recall step not needed as Subject writes immediately) o Listen for event time o Retain event time o Write event time (Recall step not needed as Subject writes immediately) o Recall auditorily presented event information o Compare written information with event information from memory (assumed
positive comparison) o Adjust pen in hand to close it (concurrent with next step)
• Position pen in right hand to close it • Reach thumb to click button on end of pen to retract writing tip

Appendix O Analytic Surrogates Support Materials
O-17
• Move thumb down and back to click pen closed • Look to arm rest compartment • Move right hand to interior compartment of arm rest
o Adjust hand position to place pen in compartment (concurrent with next step) • Position hand over compartment • Release pen into the compartment • Reach right hand back to steering wheel
o Adjust hand position to grasp notepad (concurrent with next step) • Position hand to take notepad from left hand • Grasp notepad with right hand • Release notepad from left hand • Look to arm rest compartment • Move notepad from left hand to interior compartment of arm rest
o Adjust notepad position to place in compartment (concurrent with next step) • Position right hand to place notepad in interior compartment • Release notepad into interior compartment
o Adjust hand position to close lid (concurrent with next step) • Move right hand to top of arm rest lid • Position right hand to close lid • Grasp top of arm rest lid • Move lid to closed position • Release arm rest lid
o Speak “done”

Appendix O Analytic Surrogates Support Materials
O-18
Task: #XX – Use a Map to Find an Alternate Route
Method:
In this task, a subject is on the way to a known location via a familiar metro interstate system. A changeable message sign along the side of the route states that one of the connecting freeways on the planned route is closed. The subject must then pull a spiral-bound mini map book out of the driver-side door pocket of the vehicle, open the book to the city map and then plan a new route to the location taking into account the freeway closure.
It is assumed here that subjects are familiar enough with the area that they can retain the alternate route in memory and do not need to write anything down.
Since the subject cannot logically continue to hold the map, the steps to replace it in the side-door pocket are included after the agreed-upon end of this task. A note is made to this effect at the end of the model.
Underlying Critical Assumptions:
• Driver is comfortably seated in-vehicle or in a like environment and can easily reach/see vehicle controls and task devices/material.
• Driver is engaged in steady-state car following (i.e., manually controlling speed and lane position with two hands on steering wheel, looking straight ahead) or similar task.
• Driver is experienced and familiar with the vehicle, equipment, and tasks. • Driver is in good health with no fatigue, discomfort, handicaps (mental or physical) or
ailments (mental or physical) that would affect driving or typical in-vehicle tasks. • Task begins at the end of “Please begin now” in MP3 task request recording. • Tasks are completed successfully with no errors and the subject never has to back up
and repeat a step.
Start of Task (initial conditions):
• Spiral-bound mini map book is closed and located in the driver’s side-door pocket. • A tab is placed on the page for the local map that will be needed. • Task begins with driver seeing a changeable message sign on the roadside.
Goal State (ending conditions):
• Subject has selected a suitable alternate route and retained it in memory. • Subject has closed and replaced the mini map book in the side-door pocket.
Task Steps Performed by Driver:
• Look from road scene ahead to Roadside Changeable Message Sign o Read message on sign o Compare affected freeway route to planned freeway route o Select choice of needing new route o Select need for local map of potential routes
• Release left hand from steering wheel • Reach left hand down to driver’s side door pocket (assume very familiar, no Look
required) o Adjust hand position to grasp map book (concurrent with next step)
• Position left hand to grasp mini map book • Grasp the map book with the left hand

Appendix O Analytic Surrogates Support Materials
O-19
• Move map book to position near the steering wheel o Adjust position of map book so can hold it and steer (concurrent with next step)
• Position map book so that can hold book and steer with left hand • Reach right hand to open map book • Grasp tabbed local map page • Move right hand to open map book to desired local map • Look to local map
o Recall-STM planned route o Recall-STM roadway closures o Compare affected route with closures o Select section of route needing modification o Search-Visually local map for route around closure to destination o Determine alternate routes to get to destination from current location o Compare various alternate routes o Select best route o Retain best route information
• Reach right hand to close map book • Position map book with left hand to return to pocket
o Adjust map book position to return to pocket (concurrent with next step) • Move map book to driver’s side door pocket
o Adjust map book position to insert into pocket (concurrent with next step) • Position map book into top of pocket • Move map book fully into pocket • Release map book from left hand
Note:
• This model does not attempt to represent the processes involved in determining the path to the start of the new route or any actions associated with the new route after its selection as the best alternative.
• The Determine step above is a complex process of Read-Iconographic, Recall-STM, Recall-LTM, Calculate-Mentally, Rotate, Compare and possibly other steps based on personal preferences for mileage, time of route, preferred street type, knowledge of traffic patterns, and roadway quality among others.

Appendix O Analytic Surrogates Support Materials
O-20
Task #XXX: Obtain driving directions using TELL ME (1-800-555-TELL) and write down the first route instruction
The task will involve calling TELL ME using a hands-free cell phone and obtaining driving directions between two locations. The origin will be the intersection of Orchard Lake Road and West Maple Road in West Bloomfield, Michigan, and the destination will be the intersection of Civic Center Road and Telegraph Road in Southfield, Michigan.
Method: Your task will involve picking up the cell phone and speaking “Dial” and then “TELL ME.” That will connect you to the automated call center and it will provide you a list of choices in the main menu. Choose TRAVEL after listening to all the options. In the TRAVEL sub-menu choose DRIVING DIRECTIONS as the next option. The system will then prompt you for the origin city, street name, and will ask you to choose either an intersection or an address. As you are provided an intersection information, choose the intersection option and speak the information and the system will then ask you similar questions for your destination address. Have paper and pen handy to write down the first route instructions. Once the information has been accepted the system will read out your first route information, which you will have to write down and give to the experimenter, at which point you may end the call by saying “End call.”
Underlying Critical Assumptions:
• The driver is well oriented with the TELL ME task and has practiced this task before. • The origin and destination addresses are available on a 3x5 inch card placed in the cup-
holder.
Start of Task (initial conditions):
• The phone is ready for voice recognition at the beginning of task and is hands free. • The driver is maintaining specified speed limit and lane position as required prior to the
beginning of the task. • A notepad is placed in the cup-holder along with a pencil. • For our purposes the start of the task is the point at which the Subject hears the phrase
“Please begin now” at the end of the MP3 task request.
Goal State (ending conditions):
• The address has been successfully entered into the driving directions menu and the first route instruction has been read.
• The driver has written down the first route instruction on a paper. • The driver says “End call” to cancel the voice recognition system. • For our purposes the end of the task is when the Subject has completed the task and
speaks the word “done.”

Appendix O Analytic Surrogates Support Materials
O-21
Task Steps Performed by Driver:
o Speak “Dial” o Speak “TELL ME” o Wait for system to connect to the “TELL ME” system o Listen to the main menu for options o Speak “Travel” o Listen to the Travel sub-menu options o Speak “Driving Directions”
• Position the address card so that you can read it comfortably • Look at the address card
o Read the origin city and state o Retain the origin city and state o Listen for cue to enter origin information o Recall origin city and state o Speak origin city and state
• Look at the address card o Read first and second street names o Speak first street name o Speak “Intersection” o Speak second street name o Listen to the system repeat the origin address o Check if origin address is accurately entered
• Look at the address card o Read the destination city and state o Retain the destination city and state o Listen for cue to enter destination information o Recall destination city and state o Speak destination city and state
• Look at the address card o Read first and second street names o Speak first street name o Speak “Intersection” o Speak second street name o Listen to the system repeat the destination address o Check if destination address is accurately entered o Wait while the system prepares the routing information o Adjust the notepad and pencil to write down the route information
• Look at the cup-holder to locate notepad • Reach for notepad • Grasp notepad • Move the notepad • Position notepad to be able to write on it • Look at cup-holder to locate pencil • Reach for pencil • Grasp pencil

Appendix O Analytic Surrogates Support Materials
O-22
• Move the pencil to the notepad • Press-Hold pencil against paper to write
o Listen to the system provide the first route instruction o Retain the route information o Write the route information
• Release pencil from paper o Recall-STM the routing information o Compare if information on paper matches information in mental memory o Speak “End call” to finish the call o Speak “Done”
• Move the pencil to the cup holder • Release the pencil into the cup holder • Move the paper to give it to the experimenter • Release the paper into experimenter’s hand
Note:
• Note that the few steps are after the agreed-upon end of the task but are included here as it is logical that the Subject cannot continue to hold the pencil and paper indefinitely. It should also be noted that the agreed upon end of task is artificial and by choice of the analysts, therefore the entire task should be modeled and the end point then agreed to for later analysis.
• Note that this is only one strategy for this task. • This is why thoroughly detailing your chosen method and the strategy that you think a
Subject will use to perform this task is so critical to completing the methods section.

Appendix O Analytic Surrogates Support Materials
O-23
Section 4: Example Models – Spreadsheet Version

Appendix O Analytic Surrogates Support Materials
O-24
Task #X – Note Event Info From Radio Broadcast
Task Steps Time Values
Inpu
t Mod
ality
Mem
ory
Type
Out
put M
odal
ity
Cog
nitiv
e Pr
oces
sing
Physical Action Verb
Con
curre
nt
Cognitive Action Verb
Qualifier
Cas
e
PA
T
CA
T
Vis
ual
Aud
itory
Ver
bal
Spat
ial
Aud
itory
Man
ual
Enco
ding
Cen
tral
Pro
cess
ing
Res
pond
ing
Look 0 from road scene ahead to the radio Look 0.5 1 0 0 1 0 1 0 0 1 Release 0 right hand from steering wheel Release 0.1 0 0 0 1 0 1 0 0 1 Reach 0 right hand to radio A 0.2 1 0 0 1 0 1 0 0 1 Press-Momentary 0 the radio "On" button
Press-Momentary 0.6 1 0 0 1 0 1 0 0 1
0 Recall-STM the radio program of interest Default 0.6 0 0 1 0 1 0 0 1 0 0 Recall-STM the radio station playing the program Default 0.6 0 0 1 0 1 0 0 1 0 0 Recall-STM the radio preset for this station Default 0.6 0 0 1 0 1 0 0 1 0
0 Search-Visual
for the desired preset button from among 5 choices Menu - present 0.7 1 0 0 1 0 1 0 1 0
Reach 0 right hand to desired preset button A 0.2 1 0 0 1 0 1 0 0 1 Press-Momentary 0 the radio preset button
Press-Momentary 0.6 1 0 0 1 0 1 0 0 1
0 Wait for the station to begin playing Default 1 0 1 1 0 0 0 1 0 0
0 Listen to the radio program Listen - Relaxed 4 0 1 1 0 0 0 1 0 0
0 Compare current program to desired program Compare-Hard 1.5 0 1 1 0 1 0 0 1 0 0 Recall-STM event of interest Default 0.6 0 0 1 0 1 0 0 1 0
0 Listen to the radio program for desired event information to be played
Listen - Relaxed 40 0 1 1 0 0 0 1 0 0
Reach 0 right hand to center arm rest A 0.5 1 0 0 1 0 1 0 0 1 Position 0 right hand to open arm rest Loose 0.2 1 0 0 1 0 1 0 1 1 Grasp 0 arm rest release handle A 0.1 1 0 0 1 0 1 0 0 1 Press-Hold 0 release handle Press-Hold 0.1 1 0 0 1 0 1 0 0 1

Appendix O Analytic Surrogates Support Materials
O-25
Move 0 arm rest lid up to vertical position A 0.3 1 0 0 1 0 1 0 0 1 Release 0 arm rest release handle Release 0.1 0 0 0 1 0 1 0 0 1 Reach 0 arm over lid and to interior compartment E 0.4 1 0 0 1 0 1 0 0 1 Look 0 to arm rest compartment Look 0.7 1 0 0 1 0 1 0 0 1 1 Adjust position of hand to pick up notepad Simple 0.6 1 0 0 1 0 1 0 1 0 Position 0 right hand to pick up notepad Loose 0.2 1 0 0 1 0 1 0 1 1 Grasp 0 notepad A 0.1 1 0 0 1 0 1 0 0 1 1 Adjust notepad to position in left hand Simple 0.6 1 0 0 1 0 1 0 1 0 Move 0 notepad to left hand on steering wheel A 0.7 1 0 0 1 0 1 0 0 1 Look 0 back to arm rest compartment Look 0.7 1 0 0 1 0 1 0 0 1
Reach 0 right hand back to arm rest interior compartment E 0.6 1 0 0 1 0 1 0 0 1
0 Search-Visual to locate pen in compartment
Cluttered Field - present 1.4 1 0 0 1 0 1 0 1 0
1 Adjust hand to retrieve pen Simple 0.6 1 0 0 1 0 1 0 1 0 Position 0 right hand to pick up pen Loose 0.2 1 0 0 1 0 1 0 1 1 Grasp 0 pen with right hand A 0.1 1 0 0 1 0 1 0 0 1
Reach 0 thumb to click button on end of pen to expose writing tip A 0.1 1 0 0 1 0 1 0 0 1
Move 0 thumb down and back to click pen open A 0.1 1 0 0 1 0 1 0 0 1 1 Adjust pen position in hand to writing position Simple 0.6 0 0 0 1 0 1 0 1 0 Position 0 pen in hand to write Loose 0.2 1 0 0 1 0 1 0 1 1 Move 0 right hand to notepad on steering wheel A 0.4 1 0 0 1 0 1 0 0 1 1 Adjust hand position to be able to write on notepad Simple 0.6 1 0 0 1 0 1 0 1 0 Position 0 pen to write on notepad Close 0.6 1 0 0 1 0 1 0 1 1
0 Listen for desired event location Listen - Relaxed 4 0 1 1 0 0 0 1 0 0
0 Retain event location Default 1.2 0 1 1 0 1 0 0 1 0 0 Write event location Write 7.2 1 1 1 1 0 1 0 1 1
0 Listen for event time Listen - Relaxed 2.4 0 1 1 0 0 0 1 0 0
0 Retain event time Default 1.2 0 1 1 0 1 0 0 1 0 0 Write event time Write 6 1 1 1 1 0 1 0 1 1 0 Recall-STM auditorily presented event information Default 0.6 0 0 1 0 1 0 0 1 0
0 Compare written information with event information from memory Compare-Hard 1.5 0 1 1 0 1 0 0 1 0
0 Adjust pen in hand to close it Simple 0.6 0 0 0 1 0 1 0 1 0 Position 0 pen in right hand to close it Loose 0.2 1 0 0 1 0 1 0 1 1
Reach 0 thumb to click button on end of pen to retract writing tip A 0.1 1 0 0 1 0 1 0 0 1

Appendix O Analytic Surrogates Support Materials
O-26
Move 0 thumb down and back to click pen closed A 0.1 1 0 0 1 0 1 0 0 1 Look 0 to arm rest compartment Look 0.4 1 0 0 1 0 1 0 0 1
Move 0 right hand to interior compartment of arm rest B 0.5 1 0 0 1 0 1 0 0 1
1 Adjust hand position to place pen in compartment Simple 0.6 1 0 0 1 0 1 0 0 1 Position 0 hand over compartment Loose 0.2 1 0 0 1 0 1 0 1 1 Release 0 pen into the compartment Release 0.1 0 0 0 1 0 1 0 0 1 Reach 0 right hand back to steering wheel A 0.5 1 0 0 1 0 1 0 0 1 1 Adjust hand position to grasp notepad Simple 0.6 1 0 0 1 0 1 0 1 0 Position 0 hand to take notepad from left hand Loose 0.2 1 0 0 1 0 1 0 1 1 Grasp 0 notepad with right hand A 0.1 1 0 0 1 0 1 0 0 1 Release 0 notepad from left hand Release 0.1 0 0 0 1 0 1 0 0 1 Look 0 to arm rest compartment Look 0.7 1 0 0 1 0 1 0 0 1
Move 0 notepad from left hand to interior compartment of arm rest A 0.8 1 0 0 1 0 1 0 0 1
1 Adjust notepad position to place in compartment Simple 0.6 1 0 0 1 0 1 0 1 0
Position 0 right hand to place notepad in interior compartment Loose 0.2 1 0 0 1 0 1 0 1 1
Release 0 notepad into interior compartment Release 0.1 0 0 0 1 0 1 0 0 1 1 Adjust hand position to close lid Simple 0.6 1 0 0 1 0 1 0 1 0 Move 0 right hand to top of arm rest lid A 0.3 1 0 0 1 0 1 0 0 1 Position 0 right hand to close lid Loose 0.2 1 0 0 1 0 1 0 1 1 Grasp 0 top of arm rest lid A 0.1 1 0 0 1 0 1 0 0 1 Move 0 lid to closed position A 0.3 1 0 0 1 0 1 0 0 1 Release 0 arm rest lid Release 0.1 0 0 0 1 0 1 0 0 1 0 Speak "done" to signal goal state achievement Speak - Max 0.2 0 0 1 0 1 0 0 0 1
Total PAV Total CAV Total PAV + CAV Total PAT Total CAT
Total PAT + CAT Mean PAT
Mean CAT
Mean Step Time
Mean CAT NC
Total PAT + CAT NC
Mean Step Time NC
46 29 75 13.9 81 95 0.30262 2.78 1.2605 2.8172 95.6203
1.274937391

Appendix O Analytic Surrogates Support Materials
O-27
Task #XX – Use a Map to Find an Alternate Route
Task Steps Time Values
Inpu
t Mod
ality
Mem
ory
Type
Out
put M
odal
ity
Cog
nitiv
e Pr
oces
sing
Physical Action Verb
Con
curre
nt
Cognitive Action Verb
Qualifier
Cas
e
PA
T
CA
T
Vis
ual
Aud
itory
Ver
bal
Spat
ial
Aud
itory
Man
ual
Enco
ding
Cen
tral
Pro
cess
ing
Res
pond
ing
Look 0 from road scene ahead to Roadside Changeable Message Sign Look 0.6 1 0 0 1 0 1 0 0 1
0 Read-Text message on sign Text 2.2 1 0 1 0 0 0 1 0 0
0 Compare affected freeway route to planned freeway route Compare-Hard 1.5 0 0 1 1 0 0 0 1 0
0 Select choice of needing a new route Decide 0.3 0 0 1 1 0 0 0 1 0 0 Select need for local map of potential routes Decide 0.3 0 0 0 1 0 0 0 1 0 Release 0 left hand from steering wheel Release 0.1 1 0 0 1 0 1 0 0 1 Reach 0 left hand down to driver's side door pocket A 0.5 0 0 0 1 0 1 0 0 1 1 Adjust hand position to grasp map book Simple 0.6 0 0 0 1 0 0 0 1 0 Position 0 left hand to grasp mini map book Loose 0.2 0 0 0 1 0 1 0 0 1 Grasp 0 the map book with the left hand B 0.1 0 0 0 1 0 1 0 0 1
Move 0 map book to position near the steering wheel A 0.7 1 0 0 1 0 1 0 0 1
1 Adjust position of map book so can hold it and steer Simple 0.6 0 0 0 1 0 0 0 1 0
Position 0 the map book so can hold it and steer with the left hand Loose 0.2 1 0 0 1 0 1 0 0 1
Reach 0 right hand to open map book B 0.3 1 0 0 1 0 1 0 0 1 Grasp 0 tabbed local map page A 0.1 1 0 0 1 0 1 0 0 1
Move 0 right hand to open map book to desired local map A 0.3 1 0 0 1 0 1 0 0 1
Look 0 to local map Look 0.3 1 0 0 1 0 1 0 0 1

Appendix O Analytic Surrogates Support Materials
O-28
0 Recall-STM planned route Default 0.6 0 0 1 1 0 0 0 1 0 0 Recall-STM roadway closures Default 0.6 0 0 1 1 0 0 0 1 0 0 Compare affected route with closures Compare-Hard 1.5 0 0 1 1 0 0 0 1 0 0 Select section of route needing modification Decide 1.2 0 0 1 1 0 0 0 1 0
0 Search-Visual
local map for route around closure to destination
Cluttered Field - present 2.9 1 0 1 1 0 1 1 1 0
0 Determine alternate routes to get to destination from current location Default 5 1 0 1 1 0 1 1 1 0
0 Compare various alternate routes Compare-Hard 1.5 1 0 1 1 0 0 0 1 0 0 Select best route Decide 0.6 1 0 1 1 0 0 0 1 0 0 Retain best route information Default 1.2 0 0 1 1 0 0 0 1 0 Reach 0 right hand to close map book A 0.3 1 0 0 1 0 1 0 0 1 1 Adjust map book position to return to pocket Simple 0.6 0 0 0 1 0 0 0 1 0 Position 0 map book with left hand to return to pocket Loose 0.2 1 0 0 1 0 1 0 0 1 Move 0 map book to driver's-side door pocket A 0.7 1 0 0 1 0 1 0 0 1 1 Adjust map book position to insert in pocket Simple 0.6 0 0 0 1 0 0 0 1 0 Position 0 map book into top of pocket Close 0.2 1 0 0 1 0 1 0 0 1 Move 0 map book fully into pocket A 0.3 1 0 0 1 0 1 0 0 1 Release 0 map book from left hand Release 0.1 0 0 0 1 0 1 0 0 1
Total PAV Total CAV Total PAV + CAV
Total PAT Total CAT
Total PAT + CAT Mean PAT
Mean CAT
Mean Step Time
Mean CAT NC
Total PAT + CAT NC
Mean Step Time NC
17 17 34 5 21 26 0.29435 1.262 0.7784 1.2906 26.944 0.792470634

Appendix O Analytic Surrogates Support Materials
O-29
Task #XXX – Obtain driving directions using TELL ME (1-800-555-TELL) and write down the first route instruction
Task Steps Time Values
Inpu
t Mod
ality
Mem
ory
Type
Out
put M
odal
ity
Cog
nitiv
e Pr
oces
sing
Physical Action Verb
Con
curre
nt
Cognitive Action Verb
Qualifier
Cas
e
PA
T
CA
T
Vis
ual
Aud
itory
Ver
bal
Spat
ial
Aud
itory
Man
ual
Enco
ding
Cen
tral
Pro
cess
ing
Res
pond
ing
0 Speak "Dial" Speak - Max 0.2 0 0 1 0 1 0 0 0 1 0 Speak "Tell Me" Speak - Max 0.5 0 0 1 0 1 0 0 0 1
0 Wait for the phone to connect to the "TELL ME" system Default 1 0 1 0 0 0 0 1 0 0
0 Listen to the main menu for options Listen - Relaxed 2.4 0 1 0 1 0 0 1 0 0
0 Speak "Travel" Speak - Max 0.2 0 0 1 0 1 0 0 0 1
0 Listen to the Travel sub-menu options Listen - Relaxed 2.8 0 1 0 1 0 0 1 0 0
0 Speak "Driving Directions" Speak - Relaxed 0.8 0 0 1 0 1 0 0 0 1
Position 0 the address card so that you can read it comfortably Close 0.6 1 0 0 1 0 0 1 0 0
Look 0 at the address card Look 1.1 1 0 0 1 0 0 1 0 0 0 Read-Text the origin city and state Text 0.6 1 0 0 1 0 0 1 0 0 0 Retain the origin city and state Default 1.2 0 0 0 1 0 0 1 0 0
0 Listen to the cue to enter origin information Listen - Relaxed 2 0 1 0 1 0 0 1 0 0
0 Recall-STM the origin city and state Default 0.6 0 0 0 1 0 0 0 1 0
0 Speak the origin city and state Speak - Relaxed 0.8 0 0 1 0 1 0 0 0 1
Look 0 at the address card Look 1.1 1 0 0 1 0 0 1 0 0 0 Read-Text first and second street names Text 1.4 1 0 0 1 0 0 1 0 0

Appendix O Analytic Surrogates Support Materials
O-30
0 Speak the first street name Speak - Relaxed 0.8 0 0 1 0 1 0 0 0 1
0 Speak "Intersection" Speak - Relaxed 0.4 0 0 1 0 1 0 0 0 1
0 Speak second street name Speak - Relaxed 0.8 0 0 1 0 1 0 0 0 1
0 Listen to the system repeat the origin address Listen - Relaxed 2 0 1 0 1 0 0 1 0 0
0 Check if origin address is accurately entered Read-Label 0.3 0 1 1 0 0 0 1 0 0 Look 0 at the address card Look 1.1 1 0 0 1 0 0 1 0 0 0 Read-Text the destination city and state Text 0.6 1 0 0 1 0 0 1 0 0 0 Retain the destination city and state Default 1.2 0 0 0 1 0 0 1 0 0
0 Listen for cue to enter destination information Listen - Relaxed 2 0 1 0 1 0 0 1 0 0
0 Recall-STM destination city and state Default 0.6 0 0 1 0 0 0 0 1 0
0 Speak destination city and state Speak - Relaxed 0.8 0 0 1 0 1 0 0 0 1
Look 0 at the address card Look 1.1 1 0 0 1 0 0 1 0 0 0 Read-Text first and second street names Text 1.4 1 0 0 1 0 0 1 0 0
0 Speak first street name Speak - Relaxed 0.8 0 0 1 0 1 0 0 0 1
0 Speak "Intersection" Speak - Relaxed 0.4 0 0 1 0 1 0 0 0 1
0 Speak second street name Speak - Relaxed 0.8 0 0 1 0 1 0 0 0 1
0 Listen to the system repeat the destination address Listen - Relaxed 2 0 1 0 1 0 0 1 0 0
0 Check if destination address is accurately entered Read-Label 0.3 0 1 1 0 0 0 1 0 0
0 Wait while the system prepares the routing information Default 1 0 1 0 0 0 0 0 0 1
0 Adjust the notepad and pencil to write down the route information Simple 0.6 1 0 0 0 0 1 0 0 1
Look 0 at the cup holder to locate notepad Look 1.1 1 0 0 1 0 0 1 0 0 Reach 0 for the notepad A 0.6 0 0 0 1 0 1 0 0 1 Grasp 0 the notepad A 0.1 0 0 0 1 0 1 0 0 1 Move 0 the notepad A 0.5 1 0 0 0 0 1 0 0 1 Position 0 the notepad to be able to write on it Close 0.6 1 0 0 1 0 0 1 0 0 Look 0 at the cup holder to locate pencil Look 1.1 1 0 0 1 0 0 1 0 0 Reach 0 for the pencil A 0.6 0 0 0 1 0 1 0 0 1 Move 0 the pencil to the notepad A 0.5 1 0 0 0 0 1 0 0 1

Appendix O Analytic Surrogates Support Materials
O-31
Press-Hold 0 pencil against paper to write Press-Hold 0.3 1 0 0 0 0 1 0 0 1
0 Listen to the system provide the first route instruction Listen - Relaxed 2 0 1 0 1 0 0 1 0 0
0 Retain the route information Default 1.2 0 0 0 1 0 0 1 0 0 0 Write the route information Write 18 0 0 1 0 0 1 0 0 1 Release 0 pencil from paper Release 0.1 0 0 0 0 0 1 0 0 1 0 Recall-STM the routing information Default 0.6 0 0 1 0 0 0 0 1 0
0 Compare if information on paper matches information in mental memory
Compare-Simple 0.5 0 0 0 1 0 0 0 1 0
0 Speak "End call" to finish the call Speak - Relaxed 0.8 0 0 1 0 1 0 0 0 1
0 Speak "Done" Speak - Max 0.2 0 0 1 0 1 0 0 0 1 Move 0 the pencil to the cup holder A 0.5 1 0 0 0 0 1 0 0 1 Release 0 the pencil into the cup holder Release 0.1 0 0 0 0 0 1 0 0 1 Move 0 the paper to give it to the experimenter A 0.8 1 0 0 0 0 1 0 0 1 Release 0 the paper into experimenter's hand Release 0.1 0 0 0 0 0 1 0 0 1
Total PAV Total CAV Total PAV + CAV
Total PAT Total CAT
Total PAT + CAT Mean PAT
Mean CAT
Mean Step Time
Mean CAT NC
Total PAT + CAT NC
Mean Step Time NC
19 38 57 11.6 55 66 0.60947 1.44 1.1629 1.4396 66.286 1.16291225

Appendix O Analytic Surrogates Support Materials
O-32
Section 5: Spreadsheet Tools User Manual

Appendix O Analytic Surrogates Support Materials
O-33
DWM Task Step Analysis Spreadsheet Operators Manual: We have assembled a spreadsheet with a number of data entry forms to aid in construction of Task Step Inventory Models. These forms also generate a basis for future models so some timing and MRT information is also requested in the model step generation.
Macro #1 Begin Module:
This first macro will allow you to create uniform spreadsheets for each model and enter all relevant task step information into the model. This interface also prompts for the entry of the Modified MRT type resource vector for each step. The macro is in prototype stage but works well for the creation of models if the instructions below are followed.
1. To start, change the XXX in the filename of the spreadsheet called “TaskStepModeling-XXX.xls” to your initials.
2. Open the file, enable macros at the pop up prompt, go to the Tools menu, select Macros and then Run Macro. In the pop up window select “BeginModule” from the Macros window and then click the Run button.
3. The form will open and you can now either work on a current sheet or add a new one. Add a new sheet for each task that you model, if you want to continue work on a previously created sheet click the “Select Sheet” button, otherwise click the “Add Sheet” button.
4. Next a text box will appear; either type in your new sheet name or select one of the existing sheet names depending on which button you previously clicked, after a name is entered, click the “Add” or “Select” button again with the name highlighted. You will now see the initial interface page as shown below in Figure 1.
Figure 11 - Macro #1 Main Screen

Appendix O Analytic Surrogates Support Materials
O-34
Figure 12 - Macro#1 Data Entry Screen
5. To start building your model, click the “Enter Data” button and a number of items
will appear in the Select Inputs box as shown in Figure 2. a. To start select either a Physical or Cognitive Action Verb from these pull-
down menu boxes. Remember that one row in the spreadsheet is one step in the model so you can select either a Physical or Cognitive Verb.
b. If you selected a Cognitive verb, click the Yes radio button if it is concurrent with the NEXT Physical Step in the model. No is selected for you by default, so if there is no concurrency, you need take no action.
c. The next step is to type your Object and Qualifying Phrases in that text box to describe the Action you selected for the current step.
d. To complete a task step, classify the step for Input Modality, Memory Type, Output Modality and Processing Type by selecting 0 or 1 from their respective pull-down boxes. These are the dimensions as described in Wicken’s Modified Multiple Resource Theory. An entry of 1 indicates that is the type of processing, memory, input or output that the step requires, 0 means it is not, if you are not sure leave the boxes blank.
e. Now press the “Enter” button to add this step to the spreadsheet, it will be placed after the last step in the model.
6. If you want to insert a task step ahead of a previously entered step press the “Insert Row” button from the main form as seen in Figure 1.
a. Type in the row number you want to inset a row ahead of in the text box that appears.
b. Now you can enter your step information in the other boxes as in step 5 above. c. When you are done entering step information you will notice that the “Enter”
button is gone, insert the step information into the spreadsheet by clicking the “Insert Row” button again.
7. To delete a row in the model, select the “Delete Row” button from the main form, as seen in Figure 1, and enter the row number to be deleted into the box that appears.

Appendix O Analytic Surrogates Support Materials
O-35
8. The “Calculate” button is not yet fully functional so no action is needed on your part at this time with that button.
9. To edit a row you previously entered, click the “Edit Row” button from the main form as seen in Figure 1. Enter the number of the row to edit in the text box and click the “Pull Data” button, now you can edit your entries, an example can be seen in Figure 3. When you are done making changes, click the “Edit” button again and the changes will be entered.
Figure 13 - Macro #1 Data Editing Screen
10. To copy single or multiple rows exactly, click the “Insert Rows” button. Three text
boxes will appear, enter the first row in the range to copy, the last row in the range to copy and the row you want the copied rows inserted ahead of. Note that any number of rows can be copied, if copying only one row, enter that row number into both the “Copy From” and “To Row” text boxes. The Insert Row screen can be seen in Figure 4 below.
Some notes on the interface:
1. When the form is open you cannot access the spreadsheet but can use the scroll buttons on the right hand side and the bottom of the form to look at different rows in the data.

Appendix O Analytic Surrogates Support Materials
O-36
Figure 14 - Macro #1 Insert Rows Screen
2. The “Add/Select” button in the main form will bring up two buttons so that you can
choose to add a sheet or select an existing sheet to work on at any time. Please add a new sheet (not a new file) for each task and name it with the task number and name.
3. When you click the exit button, the form will save and close the current spreadsheet.
If you want to close the macro without closing the spreadsheet you can click the “X” box in the far upper left of the form.
Macro #2 Activity Times This macro was created to aid in the task of assigning time values to the individual task steps. Due to the number of different formulas and constants the macro is required to ensure accurate timing assignments. Use the Physical and Cognitive Activity Timing Keys (found at the end of this manual) for instruction on what value to enter in the text box when prompted for an entry.
The general function of this macro is similar to the first macro described above. Many of the features of the first macro are not needed with this tool however. To enter step times and calculate the basic summary statistics with this tool, follow the steps below, an example of the interface is provided in Figure 5.
1. Open the spreadsheet as before and select Macros from the Tools menu. 2. In the pop-up choose “TimeActivities” and click the run button. 3. The main user form will appear, click the “Select” button and choose the model sheet
to work on from the pull-down menu, then click “Select” again. 4. Next, click the “Edit Row” button and type the number of the row to edit in the text
box that appears, then click “Pull Data.” 5. Now the Activity Verb and Qualifying Phrase associated with that step appears along
with a pull-down box labeled “Case.” Select the appropriate case of the step’s Activity Verb from the menu.

Appendix O Analytic Surrogates Support Materials
O-37
6. Now, depending on whether the step has a fixed or variable duration one of two things will happen.
a. If the step is a fixed duration then a pop up will notify the user of the fixed value that will be entered. The user must click the “OK” button and then click “Enter Data” on the user form.
b. If the step is variable however another text box labeled “Input Value” will appear. The user must enter a value in this box and then click the “Enter Data” button. The values to enter can be found in the Physical and Cognitive Activity Timing Keys.
7. Steps 4 – 6 should be repeated until times are assigned to each step in the model. 8. To generate the summaries, once all step times have been entered into the model,
click the “Calculate” button. This will generate step counts, step times, sums of counts and times as well as means for all measures. These values will be placed at the bottom of the spreadsheet and in a summary sheet at the end as well.
Figure 15 - Macro #2 Enter Times Screen
Macro #3 MRT Model Analysis
This last macro requires no entries by the user beyond selecting the sheet to operate on. It is required that the first two macros be run prior to Macro #3 and an example of the interface can be found in Figure 6 below.
1. Open the spreadsheet as before and select Macros from the Tools menu. 2. In the pop-up choose “MRTModelAnalysis” and click the run button. 3. The main user form will appear, click the “Select” button and choose the model sheet
to work on from the pull-down menu, then click “Select” again. 4. Once the sheet has been selected, click the “Calculate” button and MRT scores for
each step and for the model as a whole will be entered on the model sheet and on the summary sheet at the end of the workbook.

Appendix O Analytic Surrogates Support Materials
O-38
Figure 16 - Macro #3 MRT Analysis
When models are constructed with these three tools in sequence a number of potential metrics are obtained. A complete list of these measures is provided at the end of this document, however the key metrics are also summarized below.
1. Total Step Count
This measure of a simple count of all the physical and cognitive steps in the model. This measure can vary greatly between individual modelers based on their assumptions and style, however a comparison of the rank order of the task between modelers can prove to be a more stable metric.
2. Total Activity Time This is the sum of all physical and cognitive activity times for each individual step in the model. One exception occurs when a cognitive task is marked as concurrent with the next physical step. There is evidence in literature that even if a cognitive activity is concurrent with a physical activity there is still a “start up” time, a portion of the cognitive activity that must occur prior to the start of the physical activity that results, in particular see Kochar, D. S. (1985). Therefore to accommodate varied task difficulty and a wider range of performers this start up time is set at 500 msec. in the case of a concurrent task step, 500 msec. is added to the sum rather than the full cognitive activity time.
3. Total DTCP and Time Weighted DTCP The Dual Task Conflict Potential is similar in calculation to Wicken’s Modified Multiple Resource Theory Total Interference Potential. The Time Weighted DTCP is simply DTCP multiplied by the step time.

Appendix O Analytic Surrogates Support Materials
O-39
Task Steps Inventory – Physical Activity Timing Key: Activity Case Variable to Enter
A: Reach to object in fixed location or in other hand or on which other hand rests B: Reach to a single object in a location that may vary slightly from cycle to cycle C: Reach to object jumbled with other objects in a group so that search and select occur D: Reach to a very small object or where accurate grasp is required
Reach
E: Reach to an indefinite location to get hand in position for body balance, or next motion, or out of the way
Reach distance in inches
A: Move object to other hand or against stop B: Move object to approximate or indefinite location Move C: Move object to exact location
Move distance in inches
Turn Turn: Assume negligible resistance Degrees of rotation
Momentary (e.g., keying time for a simple pushbutton) Press-Momentary Keystroke random words (not prose), single key stroke time None
Press-Hold Hold (determined by design requirement) Design HOLD duration
A: Any size object by itself, easily grasped B: Object very small or lying close against a flat surface C1: Diameter > 0.5 inches; interference with grasp on bottom and one side of nearly cylindrical object C2: ¼ inch < Diameter < ½ inch; same interference as C1 C3: Diameter < ¼ inches; same interference as C1 Re-grasp or change hands without loss of control 4A: Select 1"x1"x1" or larger object jumbled with others 4B: Select ¼"x ¼ "x 1/8 " to 1"x1"x1" object, jumbled
Grasp
4C: Select smaller than: ¼"x ¼ "x 1/8 ", jumbled
None
Loose: (approximate, no pressure needed) (Distance to engage is < 1 inch) Close: (light pressure needed) (Distance to engage is < 1 inch)
Position
Exact: (tight fit, heavy pressure needed) (Distance to engage is < 1 inch)
None
Release Release: Normal release by opening fingers None
Look Look: T=distance in inches from look location to the next; D= viewing distance in inches perpendicular to the line of travel T.
(T / D)

Appendix O Analytic Surrogates Support Materials
O-40
Task Steps Inventory – Cognitive Activity Timing Key: (Page 1) Activity Input Description Variable to Enter
Text: For connected prose, assume 214 words/minute reading rate or 9th grade reading level Number of words
Read-Text Label: For a single word in isolation, assume single word or label read in a single saccade of 0.288 s duration None
Read-Icon Icon: Assume an icon is read in a single saccade of 0.288 s None
Listen Listen: Maximum transmission rate for speech is 250 words/minute, Relaxed transmission rate for speech is 150 words/minute
Number of words heard
Speak Speak: Maximum transmission rate for speech is 250 words/minute, Relaxed transmission rate for speech is 150 words/minute
Number of words spoken
Write Write: The maximum writing rate of 100 characters per minute is equal to 0.6 s per character. Number of characters written
Read-Label: Use Read-Label activity time for a check glance. Check Feedback-Visual: Estimate with simple reaction time of 200 msec None
Easy: Faster reported operations for object processing and comparisons equals .53 sec. Compare Hard: Longer reported operations for object processing and comparisons equals 1.5 sec.
None
Track User Enter: Either track until target is at “rest” or until target is lost User Enter Calculate mentally
Default: Reported standard mental of 1.2 sec. None
Calculate spatially
Default: Reported standard mental of 1.2 sec. None
Rotate mentally
Rotate Mentally: Reported mental rotation rates for rotations in the picture plane of approximately 60 degrees per second. Degrees of mental rotation
Adjust
Reported standard mental times range from 0.62 sec. to 1.2 sec. Familiar: this simple mental adjustment uses the quicker reported mental time of 0.62 sec. Complex: this more difficult version of mental adjustment uses the longer mental time of 1.2 sec.
None
Recall-STM Default: Reported simple mental operations for standard mentals is a fixed .62 sec. None
Recall-LTM Default: Reported complex mental operations for standard mentals is a fixed 1.35 sec. None
Feedback-Auditory
Feedback-Auditory: Estimate with simple reaction time of 160 msec to moderate-intensity auditory stimulus. None

Appendix O Analytic Surrogates Support Materials
O-41
Count Task Steps Heuristic – Cognitive Activity Timing Key: (Page 2) Activity Input Description Variable to Enter Feedback-Tactile
Feedback-Tactile: Estimate with simple reaction time of 150 msec to moderate-intensity tactile stimulus. None
Retain (In WM)
Default: Reported standard mental of 1.2 sec. None
Scattered List - Present: Assume a search though an unfamiliar scattered list of N clearly legible printed targets in which 5 targets can be identified with a single glance of duration 1.5 sec. In each successive glance several targets are re-examined and on average a person will search half the targets before finding the intended target. If searching for multiple targets (i.e., multiple separate search steps) a person will have to search a set equal to the total number of targets minus the number previously found.
Number of targets – number previously found
Scattered List - Missing: Same search as above but a person will have to search the entire list to determine that a target is not present. Number of targets in the list
Menu-Present: Assume a linear search through an unfamiliar menu of N items and each word takes one saccade of T=0.288 s duration. The target is present in the menu and the person on average searches through N/2 items before finding the target, then mean search time is y= T (N/2) s. Menu-Missing: If the target is absent from the display (e.g., a page prior to the target page in a multi-page listing), use y=TN.
Number of items in the menu
Cluttered Field-Present: Assume the following: The average time for a single information-gathering saccade is 0.288 s The saccade spans a 1-degree cone of foveal vision. The person tends to examine a cluttered visual display of area A (in squared units of degrees subtended at the eye) with non-overlapping saccades. The probability of the target being in a given sub-area of A is distributed evenly across the entire display The target is detected if it is examined with foveal vision The search process stops once target is detected. On average, the person scans half the display area before finding the target Target is present in field
Search-Visual
Cluttered Field-Missing: Assume as above except: Target is absent from field
Display area in degrees-squared.
Select (Decide on an option)
Decide: Use Hick's law with n+1 alternatives. The logic of adding 1 is it deals with the additional alternative of whether to select or not. Bits (log to base 2) are used in calculation and calculated as log(x)/log(2). See table on page 3.
[log(x+1)/log(2)] for x = number of alternatives See table on page 3

Appendix O Analytic Surrogates Support Materials
O-42
Count Task Steps Heuristic – Cognitive Activity Timing Key: (Page 3) Activity Input Description Variable to Enter Wait Wait: Defined by system response time or else unconstrained Mean system response time
Default: Step is a combination of at least 4 mental operations, thus uses 4*(J2365 “mental” time of 1.2 s)+ (reaction time of .2 s) = 5 s. None
User Enter: Enter estimate of time for the specific situation. User specified value Problem Solving Aloud: Reported average rate of 1.165 sec per word for problem solving out loud activities Number of words spoken
Think Aloud: Reported average rate of .875 sec per word for thinking out loud activities Number of words spoken
Determine
Complete Fragment: Reported values for completing either a simple or complex sentence fragment fixed at 4 sec. None
Cognitive Activity Time - “Select” Value Table To assign a time to a “Select” step used in a Count Task Steps Heuristic model, find the appropriate number of options listed as x in the table below. The value of the log function for that number of choices is listed next to x, enter this value in the Activity macro.
x log(x+1)/log(2) x log(x+1)/log(2) x log(x+1)/log(2) x log(x+1)/log(2)
1 1.00000 26 4.75489 51 5.70044 76 6.26679 2 1.58496 27 4.80735 52 5.72792 77 6.28540 3 2.00000 28 4.85798 53 5.75489 78 6.30378 4 2.32193 29 4.90689 54 5.78136 79 6.32193 5 2.58496 30 4.95420 55 5.80735 80 6.33985 6 2.80735 31 5.00000 56 5.83289 81 6.35755 7 3.00000 32 5.04439 57 5.85798 82 6.37504 8 3.16993 33 5.08746 58 5.88264 83 6.39232 9 3.32193 34 5.12928 59 5.90689 84 6.40939 10 3.45943 35 5.16993 60 5.93074 85 6.42626 11 3.58496 36 5.20945 61 5.95420 86 6.44294 12 3.70044 37 5.24793 62 5.97728 87 6.45943 13 3.80735 38 5.28540 63 6.00000 88 6.47573 14 3.90689 39 5.32193 64 6.02237 89 6.49185 15 4.00000 40 5.35755 65 6.04439 90 6.50779 16 4.08746 41 5.39232 66 6.06609 91 6.52356 17 4.16993 42 5.42626 67 6.08746 92 6.53916 18 4.24793 43 5.45943 68 6.10852 93 6.55459 19 4.32193 44 5.49185 69 6.12928 94 6.56986 20 4.39232 45 5.52356 70 6.14975 95 6.58496 21 4.45943 46 5.55459 71 6.16993 96 6.59991 22 4.52356 47 5.58496 72 6.18982 97 6.61471 23 4.58496 48 5.61471 73 6.20945 98 6.62936 24 4.64386 49 5.64386 74 6.22882 99 6.64386 25 4.70044 50 5.67243 75 6.24793 100 6.65821

Appendix O Analytic Surrogates Support Materials
O-43
Variables Calculated by the Spreadsheet Tools To examine a number of metrics of potential interest that can be obtained from the Task Steps Inventory Models, the spreadsheet tools calculate the variables listed below automatically based on modeler input.
1. Total Step Count
This is the sum of the number of Physical Activity Verbs and Cognitive Activity Verbs or physical and cognitive steps in the task step model.
2. Total Step Count Rank This is the rank of the raw values for the above count.
3. Total Activity Time This is the sum of all the Physical Activity Times and Cognitive Activity Times in the task step models. This sum can be smaller than the simple sum of all the step times due to the handling of concurrent tasks in the models.
4. Total Activity Time Rank Again, this is the rank of the raw time totals defined above.
5. Mean Step Time The Total Activity Time divided by the Total Step Count; note that due to the modeling of concurrent steps, the sum used here is smaller than the sum of all steps.
6. Mean Step Time NC This is the sum of all physical and cognitive activity times in the model divided by the number of steps in the model, this measure is not affected by the handling of concurrent steps in the model.
7. Total DTCP This is the sum of the Dual Task Conflict Potential assigned to each step of the model. The DTCP is calculated by multiplying the MRT style resource vector for the driving task with the resource vector for the secondary task, in this case each step of the model. The resultant matrix is then multiplied by the Wickens and Sarno Conflict Matrix. The sum of all elements in this final matrix divided by the sum of all elements in the Conflict Matrix is the DTCP.
8. DTCP Rank This is the rank of the total DTCP values as detailed above.
9. Total Time*DTCP This value is calculated by multiplying the step time by the DTCP for each individual step in the model and summing for the entire model. Note that this measure uses the step time and does not take into account concurrency in the way that the activity time measures do.
10. Total Time*DTCP Rank Simple rank of the above time weighted DTCP.

Appendix O Analytic Surrogates Support Materials
O-44
11. Total Normalized Time*DTCP – 1 This is the first of four attempts to normalize the step time to prevent it from overwhelming DTCP. In this value, step time is divided by the Total Activity Time for the model then multiplied by DTCP.
12. Total Normalized Time*DTCP – 2 Same as above except that Total Activity Time NC is used; this value is the sum of each step time in the model without considering concurrency.
13. Total Normalized Time*DTCP – 3 In this value the step time is divided by the Mean Step Time (explained above) and then multiplied by the step DTCP.
14. Total Normalized Time*DTCP – 4 Same as number 13 above except that Mean Step Time NC (detailed above) is used as the divisor prior to multiplication with DTCP.

P-1
P Appendix P. Procedures for Manual Reduction of Driver Eyeglance Data from Video Recordings
One of the most important areas of data analysis for driver workload involves the evaluation of the driver’s eyeglance locations. This is one of the most direct measures of the driver and is not subject to the variability caused by vehicle dynamics and lags. The initial intention of the CAMP technical team was to collect this data in an automated fashion using a head and eye tracking system that would identify the location and timing of gazes and include them in the data at the time of collection. Unfortunately, this was not possible due to time constraints and technical difficulties with the implementation of the data collection system. As a result in order to obtain the eyeglance data after collection of other data was complete a manual scoring of the videos was required.
The manual scoring procedure involves viewing the in-vehicle videos and assessing the location of gaze for the entire duration. There are a number of difficulties with accomplishing this task. First the videos cannot be viewed at normal playback speed due to the numerous and rapid transitions between locations. Advancing through frames one at a time is an extremely tedious task taking 30 or more times longer than playing the video at normal speed. At a 30-to-1 reduction rate it would take some 2.5 to 3 man years to complete the reduction alone. Recording of the location information and paring it with the data already collected also requires manipulation of multiple computer programs (such as Windows Media Player and Microsoft Excel) and results in a substantial human error rate. To overcome these efficiency and accuracy difficulties the CAMP team reviewed a number of options. Management, staffing and housing of the large number of analysts at CAMP was not feasible. Therefore, a number of outside vendors familiar with this type of work were contacted. Two organizations were eventually involved in the reduction activities. The University of Iowa and TNO Human Factors in Holland both performed excellent work.
A program called The Observer 5.0 produced by Noldus Information Technologies was identified as being suitable for scoring of videos into data files. The program was used by the two data reduction vendors to open, and control videos while scoring them into a number of location conditions. By importing data from the study into The Observer the analysts were able to move quickly past parts of the video that were not of interest. This and other efficiencies such as automatic file naming and manipulation greatly improved the reduction efficiency.
Due to concerns about error rates a method called mediation was developed in which two separate analysts fully evaluated each video. The two versions were then compared based on a one tenth of a second or three frame accuracy rule and any discrepancies were resolved by a third independent analyst. The two separate reductions were accomplished at the two independent vendor locations. The mediation procedures were completed at the University of Iowa by an analyst who did not do the original scoring. In addition a number of constraints were placed on the total number of hours and time between breaks for the analysts.
The analysis achieved a reduction rate between nine and twelve times longer than the video play duration. Mediation time is a function of the number of discrepancies encountered between the two versions of the data. This varies based on light conditions, facial geometries, obstructions (glasses, hands, paper materials, on screen data), postures, and other factors but was in general about five to seven times slower than normal video time. These rates eventually allowed for 36 participants data to be processed including an even distribution between three age groups (young, middle and older), both genders, and two venues (test track and on road).

Appendix P Eyeglance Data Reduction
P-2
P.1 Eyeglance Location Details For the purposes of this study data was classified into nine physical visual locations. These included: (1) forward roadway, (2) center rearview mirror, (3) looking up (visor area), (4) left mirror area, (5) right mirror area, (6) instrument cluster (steering wheel and speedometer area), (7) center console, (8) head down and (9) other or unknown locations. An addition to the physical locations a context coding was added indicating whether the glance was or was not task related. The zone definitions below represent the areas included in each glance locations. A diagram of the locations is also included below.
P.1.1 Forward (road scene) This location included all glances associated with scanning and transitions within the forward road scene. This location was bounded by the limits of the windshield. It did not include the center rearview mirror or distinct glances above the level of the bottom of the rearview mirror. It also did not include the steering wheel or dash area. Glances used to track signs or roadway structures (such as bridges) as they disappeared from view beyond the upper limit set by the bottom of the rearview mirror were also not included here, nor were glances used to track objects to the left or right included once the glance location moved beyond the bounds identified above (bounds of windshield to either side – and level corresponding to bottom of rearview mirror).
o Note: The majority of all glances during driving were to this location.
P.1.2 Center rear-view mirror This location was defined by glances to the center rear-view mirror area. This location represents monitoring of OED events and situational awareness information gathering.
o Note: The vast majority of all glances away from the forward road scene were to this location.
P.1.3 Up (including visor and road scene) This location included all glances that were distinctly above the level of objects of collision concern in the forward roadway. The approximate cutoff level was glances above the bottom of the center rearview mirror but not toward the center rearview mirror. These glances were usually defined by a transition to a glance that looked upward. Up glances also occurred when a driver was tracking an outside object above the vehicle, for example a bridge or overhead sign. This region was bounded by the cutoff level (bottom of the center rearview mirror) and included all upward glances including head turning above the level of the side windows. Specifically, this included the CD wallet located on the driver’s sun visor.
P.1.4 Left (including outside mirror) This location included primarily glances to the left outside mirror. Also included are the surrounding areas to the left of the left A-pillar. Head turns to the left are also included in this location and were likely made to gather situational awareness information from the surrounding road scene. In addition, many times the head-turn involved looks to the mirror – and it was not always possible with leftward head turn to discriminate other leftward gaze locations from mirror glances. (This was due in part to camera location, which was such that the eyes were not visible or were only partially visible when the head turn was significantly to the left). This region was bounded by the A-pillar on the right and the extent of the left window up and down. It also included all turns to the left regardless of how far even beyond the extent to which the eyes could still be seen. Along with the other mirrors this location included scanning for OED events and situational awareness information gathering.
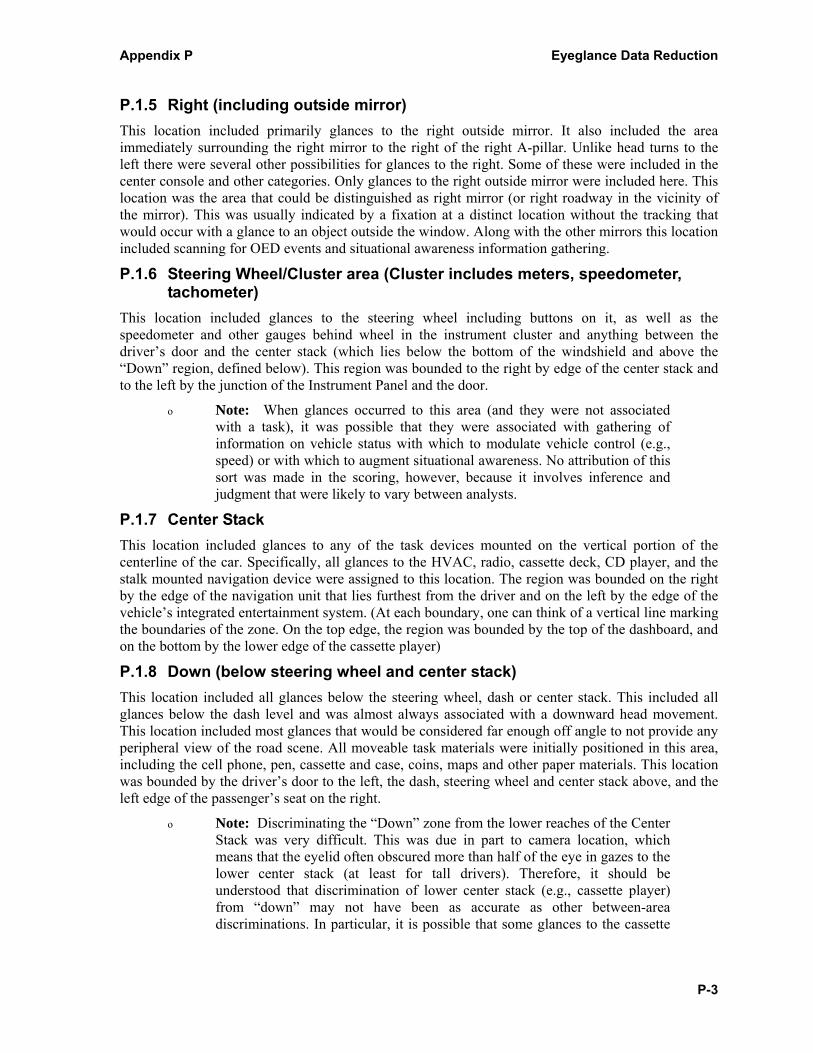
Appendix P Eyeglance Data Reduction
P-3
P.1.5 Right (including outside mirror) This location included primarily glances to the right outside mirror. It also included the area immediately surrounding the right mirror to the right of the right A-pillar. Unlike head turns to the left there were several other possibilities for glances to the right. Some of these were included in the center console and other categories. Only glances to the right outside mirror were included here. This location was the area that could be distinguished as right mirror (or right roadway in the vicinity of the mirror). This was usually indicated by a fixation at a distinct location without the tracking that would occur with a glance to an object outside the window. Along with the other mirrors this location included scanning for OED events and situational awareness information gathering.
P.1.6 Steering Wheel/Cluster area (Cluster includes meters, speedometer, tachometer)
This location included glances to the steering wheel including buttons on it, as well as the speedometer and other gauges behind wheel in the instrument cluster and anything between the driver’s door and the center stack (which lies below the bottom of the windshield and above the “Down” region, defined below). This region was bounded to the right by edge of the center stack and to the left by the junction of the Instrument Panel and the door.
o Note: When glances occurred to this area (and they were not associated with a task), it was possible that they were associated with gathering of information on vehicle status with which to modulate vehicle control (e.g., speed) or with which to augment situational awareness. No attribution of this sort was made in the scoring, however, because it involves inference and judgment that were likely to vary between analysts.
P.1.7 Center Stack This location included glances to any of the task devices mounted on the vertical portion of the centerline of the car. Specifically, all glances to the HVAC, radio, cassette deck, CD player, and the stalk mounted navigation device were assigned to this location. The region was bounded on the right by the edge of the navigation unit that lies furthest from the driver and on the left by the edge of the vehicle’s integrated entertainment system. (At each boundary, one can think of a vertical line marking the boundaries of the zone. On the top edge, the region was bounded by the top of the dashboard, and on the bottom by the lower edge of the cassette player)
P.1.8 Down (below steering wheel and center stack) This location included all glances below the steering wheel, dash or center stack. This included all glances below the dash level and was almost always associated with a downward head movement. This location included most glances that would be considered far enough off angle to not provide any peripheral view of the road scene. All moveable task materials were initially positioned in this area, including the cell phone, pen, cassette and case, coins, maps and other paper materials. This location was bounded by the driver’s door to the left, the dash, steering wheel and center stack above, and the left edge of the passenger’s seat on the right.
o Note: Discriminating the “Down” zone from the lower reaches of the Center Stack was very difficult. This was due in part to camera location, which means that the eyelid often obscured more than half of the eye in gazes to the lower center stack (at least for tall drivers). Therefore, it should be understood that discrimination of lower center stack (e.g., cassette player) from “down” may not have been as accurate as other between-area discriminations. In particular, it is possible that some glances to the cassette

Appendix P Eyeglance Data Reduction
P-4
were misattributed to “down.” This was not a problem however as the more important attribute was the distinction of being task-related.
P.1.9 Other This location included all glances that were not to one of the above eight zones. These rare glances included direct glances to the driver’s door and the front or back seat experimenter.
P.2 Treatment of Task-related Glance Coding CAMP was interested in capturing both physical location and task-related data for glances and this required the use of an additional code. For each location the analyst classified the glance as task related or not task related.
There are a number of other events that occurred in the data set with some regularity that should be addressed. Transitions are the frames that occur between locations. By convention the transition frames associated with leaving an area were included in the previous glance. A new glance location began on the frame when the eyes fixated on the subsequent location and ended when the eyes fixated on a new location.
1. Obscurations of the eye. If the eyes were obscured or obstructed (by the eyelid, or by task materials, or by the hand, etc.) and this obscuration lasted more than 10 frames, it was marked using the “Other” code. The ten-frame cutoff came from an engineering estimate of the minimum duration of a transition away, a glance to another location and a transition back to the zone where the obstruction occurred.
2. Blinks (10 frames or fewer in length). Blinks were not coded separately, but were attributed to the locus being fixated at the time the blink began. It was decided that data associated with each glance location would not be significantly affected by blinks. If the blink occurred during a transition the rules about scoring the transition were unchanged. A glance to the new location was scored as beginning at the new location when the eyes were open and fixed in the new location.
3. Other eye-obstructing behaviors. Yawns, squints, longer eye rests, and drowsiness were treated similarly to blinks. They were not separately coded and were assigned the code that was associated with the location being fixated at the time they began. If task material or other objects in front of the camera obscured the eyes for short periods of time (less than 10 frames) it was acceptable to infer the location being fixated was the same as when the obscuration began, since it was unlikely that an additional glance outside of this area had occurred.
It is important to note that there were many types of missing data for various reasons. There were cases where a video signal was dropped by the hardware. There were cases where video froze for a number of frames and restarted later. There were cases where the eyes could not be seen due to time codes overlaid on the screen. There were cases where the participant obscured their own face with a hand or task materials for long (more than 10 frames) time. In all these cases and others the data was classified as missing and locus of gaze could not be inferred. This missing data could not be coded and was marked as missing. (Note: Large sections of data like whole videos that were missing were handled prior to scoring.)
Figure P-1 is a composite of images that is intended to roughly graphically indicate the above-defined nine physical eyeglance zones.

Appendix P Eyeglance Data Reduction
P-5
Figure P-1. Composite Image of Vehicle Interior Showing Viewing Locations
Below are a few screen captures of video taken from the study data set. These are included to show approximate video quality and layout. Figure P-2 shows an older driver with glasses demonstrating some glare problems. His hand in the lower right quadrant is retrieving coins for the coins task. Near the driver’s forehead is the video frame number used for sequencing video data to other vehicle data. Figure P-3 shows a younger driver viewing the inside rearview mirror. Figure P-4 and Figure P-5 show the same driver viewing the outside rearview mirror and forward road scene respectively. This is an example of a fairly high-quality video based on lighting, contrast, eye visibility and video camera angle.

Appendix P Eyeglance Data Reduction
P-6
Figure P-2: Older Driver with Glasses Doing "Coins" Task
Figure P-3: Younger Driver Looking at Inside Rearview Mirror

Appendix P Eyeglance Data Reduction
P-7
Figure P-4: Younger Driver Looking at Outside Left Mirror
Figure P-5: Younger Driver Looking Forward

Appendix P Eyeglance Data Reduction
P-8
P.3 Mediation Process Details The following is a summary of the mediation process performed by the University of Iowa in order to improve accuracy of the manual reduction of eyeglance data. The mediation process consisted of five steps:
1. Generate time-event view plots and inter-rater reliability analyses using Noldus’s The Observer software.
2. Create the initial version of the “final” mediation .odf file.
3. Identify the nature of the disagreements generated by The Observer and list any additional disagreements not captured by The Observer.
4. Mediate the disagreements by reviewing the digital video data (i.e., recoding).
5. Run final reliability analyses and summarize the findings. These steps are described in details below. In general, our mediation time amounted to approximately 2 minutes per disagreement.
Step 1: Generate time-event view plots and inter-rater reliability analyses using Noldus’s The Observer (version 5) software
• Populate The Observer with the latest version of the University of Iowa and TNO’s coded .odf files.
• Generate a time-event view plot using The Observer. We used the following criteria for the graph:
o Data output: hours (hh:mm:ss) with 2 decimals.
o Layout: time-event plot, subject, behavioral class, observation, one sheet per sheet.
o Resulting file was saved under the Analysis/Time-Event View/Results directory (e.g., Q001-051903-008-RP-TB-Time.oar).
• Generate an inter-rater reliability analysis using The Observer. We used the following criteria for the analyses:
o Methods: frequency/sequence-based with a tolerance window of 00.00.00.100 (hh:mm:ss:ddd), start times for the synchronization of comparison, and all time-based intersection of records were included in the comparison.
o Data output: time format was in minutes (mm:ss) with two decimals.
o Resulting file was saved under the Analysis/Reliability Analysis/Results directory (e.g., Q001-051903-008-RP-TB-Reli.oar).
• Import the results from each driver’s inter-rater reliability analyses into an Excel document (e.g., Q001-Disagree Lists.xls).
o The statistical measures were summarized onto the first worksheet of the “disagree list” excel document.
o The Observer’s “list of comparisons” was cut and paste into the separate worksheets of the “Disagree List” Excel document and formatted using a CAMP-generated Excel macro (e.g., mediationmacro.xls). Only the disagreements generated by The Observer remained.

Appendix P Eyeglance Data Reduction
P-9
Step 2: Create the initial version of the final .odf’ mediation file. • Identify which one of the two agency files to use as the Final .odf mediation file. This
process was achieved by looking at the time-event view plot and selecting the file that had the least amount of lag. In case where lag was minimal, we chose the file that had the least amount of coding error, had been coded by the most senior analyst, or in cases where both files appeared equally good, we randomly alternated between both agencies.
• Clean the final file by examining the raw data files using the time-event view plot. This process consisted in looking at each individual gaze and filtering (i.e., cutting and pasting into the text-version of the final file) the most accurate gazes when they differed from the ones contained in the initial final .odf file. By most accurate gazes, we mean the gazes with the least amount of time lag and the gazes with the most conventional time duration.
• Integrate both analysts’ comments (i.e., comments pertaining to a specific gaze) into the final file. As much as possible, analysts used standard terminology in writing their comments, as summarized in the attached document (i.e., comment terminology.xls).
• Document any anomalies (i.e., with the original data and with the coding data) at the beginning of the file, at the start of a given task, and the anomaly’s exact location, if appropriate.
Step 3: Identify the nature of the disagreements generated by The Observer and list any additional disagreements not captured by The Observer.
• Review each disagreement generated by The Observer by looking at the time-event view plot to determine the nature of the disagreement. The nature of the disagreements included: coding time lag, missed gaze, extra gaze, different gaze location, different gaze duration, task versus non-task, mislabeled task, and entire task (or segment of a task) not coded.
• Identify and list any disagreements not captured by the Observer by looking at the time-event view plot. Differing gaze durations were not always captured by the Observer, and in general, anytime a gaze differed in its duration by more than 0.2 sec, we listed it as a disagreement to be mediated.
Step 4: Mediate the disagreements by reviewing the digital video data (i.e., recoding). • Review each disagreement by using the Observation Mode of The Observer. That is,
play the video data and determine what any individual final coding should be. Mediation activities included: deleting extra gazes, coding new gazes, changing gazes’ location, and refining the start and end time of gazes.
• When in doubt as to which final coding to use, the analyst referred to the “Mediation-Resolving coding disagreements” document for a set of mediation rules (see attached).
• Document any anomalies at the file’s beginning, start of a task, and at specific locations within a task.
• Save the resulting final .odf mediated file under the Observation / Data files directory (e.g., Q001-051903-008-FINAL.odf)
• Generate a time-event view plot of the final .odf mediated file, along with the original two coded .odf files.

Appendix P Eyeglance Data Reduction
P-10
Step 5: Run final reliability analyses and summarize the findings. • Summarize in an excel document the statistical measures for all the mediated files.
These measures included: number of agreements, number of disagreements, inter-rater reliability between the two coded files, as well as inter-rater reliability between each agency’s coded file and the final mediated file.

Q-1
Q Summary Statistics for Selected Metrics
Q.1 Purpose In this appendix, a comprehensive summary of various descriptive statistics, i.e., mean value, median value, etc., for each task is presented for three venues—laboratory, road, and track.
Q.2 Metrics Summarized The metrics summarized for the three venues were those determined to be repeatable. For each venue, a separate sheet is used for each metric, e.g., Task Duration, SDLP, etc. for road data, OWL Rating, SA Rating, etc. for laboratory data. The road and track summaries include data for various eye-glance related metrics. Laboratory data summaries include data for metrics that were used during laboratory testing. A separate sheet is used for each laboratory metric. A total of 11 descriptors were prepared for each metric. These are described below in Table 0-1:
Table Q-1. Descriptive Statistics for Each Metric
Measure Description
N Total number of test participants in sample
N* Number of “zero” entries in sample
Mean Sample mean value
Median Sample median value
TrMean Truncated mean, determined after removing 5% of sample from each end (low and high) end
StDev Standard deviation of sample
SE Mean Standard error of mean for sample
Minimum Lowest (smallest) observation in sample
Maximum Highest (largest) observation in sample
Q1 First quartile observation
Q3 Third quartile observation

Appendix Q Summary Statistics
Q-2
Descriptive statistics for laboratory metrics are presented below.
Table Q-2. Descriptive Statistics for Overall Workload Rating
TaskName N N* Mean Median TrMean StDev SE Mean Minimum Maximum Q1 Q3Coins 46 4 38.42 38.75 38.10 21.80 3.210 5.00 82.50 20.00 55.63
Cassette 46 4 29.89 20.00 28.69 21.22 3.130 5.00 82.50 10.00 46.25HVAC 46 4 32.45 23.75 31.19 23.97 3.530 5.00 87.50 11.88 50.00
Radio Easy 46 4 32.34 23.75 31.43 22.26 3.280 5.00 82.50 15.00 45.00Manual Dial 46 4 53.04 52.50 53.10 17.34 2.560 20.00 85.00 41.88 65.63
Travel Computation 46 4 51.03 50.00 51.31 23.57 3.480 5.00 95.00 35.00 70.63Route Orientation 46 4 40.49 38.75 40.18 22.68 3.340 2.50 87.50 21.88 60.63
Voice Dial 46 4 38.70 40.00 38.15 19.67 2.900 7.50 82.50 21.88 52.50Book-on-Tape Listen 46 4 46.09 45.00 46.07 19.13 2.820 5.00 92.50 36.88 60.63
Just Drive 0 50 * * * * * * * * *Biographic QA 45 5 36.06 40.00 35.37 22.19 3.310 5.00 87.50 13.75 53.75
Route Instructions 46 4 54.18 55.00 53.93 16.81 2.480 22.50 90.00 41.88 67.50Sports 46 4 46.25 48.75 46.13 22.73 3.350 7.50 92.50 26.88 70.00
Radio Hard 46 4 37.28 32.50 36.67 22.83 3.370 5.00 85.00 15.00 55.00CD Track7 46 4 34.62 31.25 33.81 21.35 3.150 5.00 85.00 15.00 50.63
Route Tracing 46 4 53.32 56.25 53.57 23.68 3.490 5.00 92.50 34.38 73.13Delta 46 4 54.62 57.50 54.64 19.38 2.860 15.00 100.00 43.75 65.63
Book-on-Tape Summary 46 4 51.58 50.00 51.61 20.26 2.990 10.00 95.00 40.00 65.00Destination Entry 46 4 57.93 56.25 58.15 20.53 3.030 10.00 100.00 45.00 72.50
Read Easy 46 4 50.60 48.75 50.30 17.56 2.590 15.00 90.00 37.50 63.13Read Hard 46 4 60.11 58.75 60.12 16.71 2.460 17.50 92.50 49.38 70.63Map Easy 46 4 48.59 53.75 48.69 23.12 3.410 5.00 90.00 25.00 68.13Map Hard 44 6 61.08 65.00 61.25 20.93 3.160 20.00 100.00 45.00 74.38
Overall Workload Rating
Table Q-3. Descriptive Statistics for Situational Awareness Rating

Appendix Q Summary Statistics
Q-3
TaskName N N* Mean Median TrMean StDev SE Mean Minimum Maximum Q1 Q3Coins 47 3 104.36 100.00 98.37 51.96 7.580 30.00 400.00 90.00 100.00
Cassette 47 3 104.77 100.00 102.88 30.72 4.480 50.00 200.00 99.00 100.00HVAC 47 3 99.85 100.00 97.51 27.65 4.030 50.00 200.00 98.00 100.00
Radio Easy 47 3 107.98 100.00 102.79 50.84 7.420 5.00 400.00 100.00 105.00Manual Dial 47 3 107.40 90.00 97.50 76.20 11.100 25.00 400.00 65.00 120.00
Travel Computation 46 4 101.85 92.50 98.57 48.80 7.200 20.00 300.00 80.00 120.00Route Orientation 47 3 98.72 100.00 97.67 40.69 5.940 20.00 200.00 80.00 110.00
Voice Dial 47 3 111.23 100.00 104.37 56.53 8.250 40.00 400.00 90.00 110.00Book-on-Tape Listen 47 3 109.90 100.00 102.90 71.70 10.500 1.00 400.00 75.00 125.00
Just Drive 0 50 * * * * * * * * *Biographic QA 47 3 103.89 100.00 100.65 40.66 5.930 25.00 300.00 95.00 100.00
Route Instructions 47 3 115.80 90.00 106.60 83.20 12.100 20.00 500.00 75.00 125.00Sports 47 3 142.20 100.00 110.70 187.70 27.400 1.00 1000.00 70.00 110.00
Radio Hard 0 50 * * * * * * * * *CD Track7 47 3 99.68 100.00 98.49 23.78 3.470 50.00 200.00 100.00 100.00
Route Tracing 47 3 144.80 80.00 94.80 298.60 43.600 10.00 2000.00 50.00 125.00Delta 47 3 117.10 90.00 104.80 96.50 14.100 20.00 600.00 75.00 135.00
Book-on-Tape Summary 46 4 114.70 100.00 104.90 91.20 13.400 1.00 500.00 58.80 142.50Destination Entry 47 3 243.00 80.00 127.00 734.00 107.000 0.00 5000.00 50.00 175.00
Read Easy 47 3 112.00 100.00 100.50 98.10 14.300 20.00 700.00 70.00 125.00Read Hard 47 3 115.00 80.00 99.80 118.40 17.300 5.00 700.00 50.00 150.00Map Easy 47 3 119.10 100.00 100.00 110.40 16.100 50.00 700.00 75.00 125.00Map Hard 46 4 112.50 82.50 94.10 124.70 18.400 10.00 800.00 50.00 110.00
Situational Awareness Rating
Table Q-4. Descriptive Statistics for Multi-tasking Difficulty Rating
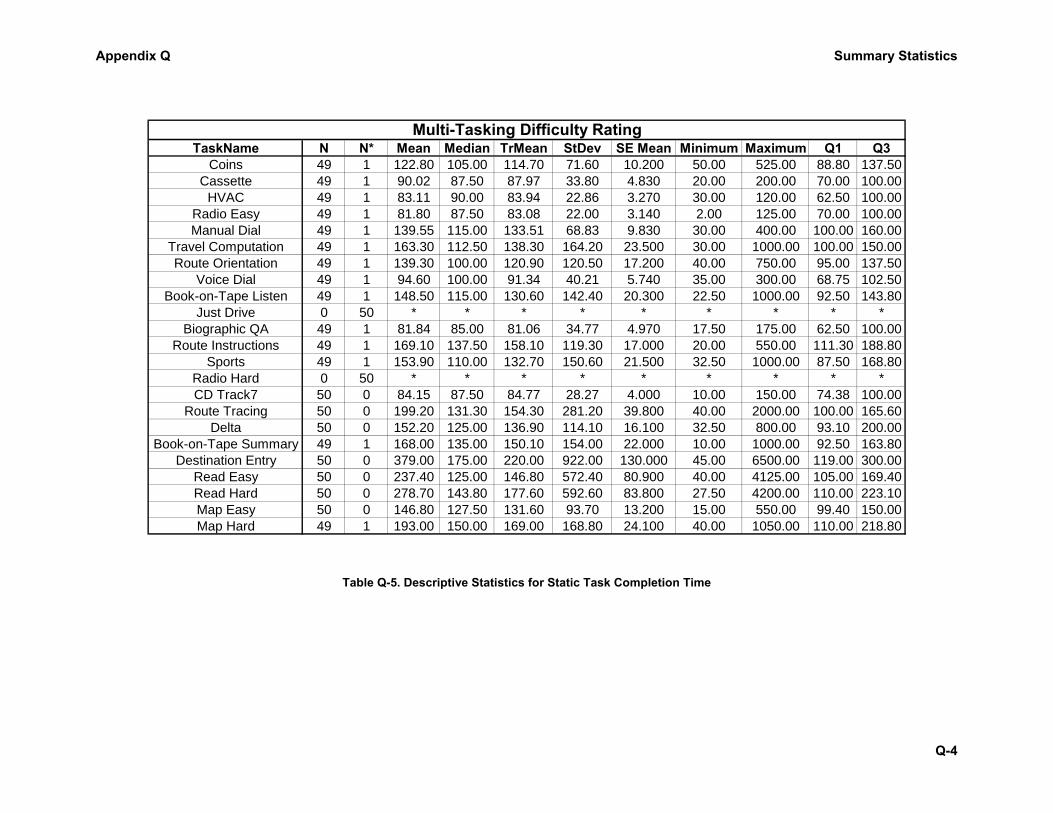
Appendix Q Summary Statistics
Q-4
TaskName N N* Mean Median TrMean StDev SE Mean Minimum Maximum Q1 Q3Coins 49 1 122.80 105.00 114.70 71.60 10.200 50.00 525.00 88.80 137.50
Cassette 49 1 90.02 87.50 87.97 33.80 4.830 20.00 200.00 70.00 100.00HVAC 49 1 83.11 90.00 83.94 22.86 3.270 30.00 120.00 62.50 100.00
Radio Easy 49 1 81.80 87.50 83.08 22.00 3.140 2.00 125.00 70.00 100.00Manual Dial 49 1 139.55 115.00 133.51 68.83 9.830 30.00 400.00 100.00 160.00
Travel Computation 49 1 163.30 112.50 138.30 164.20 23.500 30.00 1000.00 100.00 150.00Route Orientation 49 1 139.30 100.00 120.90 120.50 17.200 40.00 750.00 95.00 137.50
Voice Dial 49 1 94.60 100.00 91.34 40.21 5.740 35.00 300.00 68.75 102.50Book-on-Tape Listen 49 1 148.50 115.00 130.60 142.40 20.300 22.50 1000.00 92.50 143.80
Just Drive 0 50 * * * * * * * * *Biographic QA 49 1 81.84 85.00 81.06 34.77 4.970 17.50 175.00 62.50 100.00
Route Instructions 49 1 169.10 137.50 158.10 119.30 17.000 20.00 550.00 111.30 188.80Sports 49 1 153.90 110.00 132.70 150.60 21.500 32.50 1000.00 87.50 168.80
Radio Hard 0 50 * * * * * * * * *CD Track7 50 0 84.15 87.50 84.77 28.27 4.000 10.00 150.00 74.38 100.00
Route Tracing 50 0 199.20 131.30 154.30 281.20 39.800 40.00 2000.00 100.00 165.60Delta 50 0 152.20 125.00 136.90 114.10 16.100 32.50 800.00 93.10 200.00
Book-on-Tape Summary 49 1 168.00 135.00 150.10 154.00 22.000 10.00 1000.00 92.50 163.80Destination Entry 50 0 379.00 175.00 220.00 922.00 130.000 45.00 6500.00 119.00 300.00
Read Easy 50 0 237.40 125.00 146.80 572.40 80.900 40.00 4125.00 105.00 169.40Read Hard 50 0 278.70 143.80 177.60 592.60 83.800 27.50 4200.00 110.00 223.10Map Easy 50 0 146.80 127.50 131.60 93.70 13.200 15.00 550.00 99.40 150.00Map Hard 49 1 193.00 150.00 169.00 168.80 24.100 40.00 1050.00 110.00 218.80
Multi-Tasking Difficulty Rating
Table Q-5. Descriptive Statistics for Static Task Completion Time

Appendix Q Summary Statistics
Q-5
TaskName N N* Mean Median TrMean StDev SE Mean Minimum Maximum Q1 Q3Coins 50 0 9.68 8.44 9.40 5.10 0.721 1.63 22.45 5.72 13.53
Cassette 50 0 11.15 10.12 10.70 4.01 0.566 6.12 23.80 8.44 12.40HVAC 50 0 8.00 7.05 7.58 3.57 0.504 3.85 22.80 5.74 8.85
Radio Easy 50 0 5.97 5.29 5.51 2.88 0.408 2.63 17.70 4.50 6.24Manual Dial 50 0 16.65 14.56 15.89 7.28 1.030 7.58 45.71 11.68 21.74
Travel Computation 0 50 * * * * * * * * *Route Orientation 0 50 * * * * * * * * *
Voice Dial 50 0 33.98 31.57 32.41 11.46 1.620 18.37 78.29 26.65 37.79Book-on-Tape Listen 0 50 * * * * * * * * *
Just Drive 0 50 * * * * * * * * *Biographic QA 0 50 * * * * * * * * *
Route Instructions 0 50 * * * * * * * * *Sports 0 50 * * * * * * * * *
Radio Hard 50 0 9.70 8.98 9.34 3.55 0.502 4.21 20.89 7.26 11.10CD Track7 50 0 14.67 14.18 14.28 3.56 0.503 10.03 33.26 12.62 15.63
Route Tracing 50 0 14.14 13.31 13.73 5.09 0.720 6.65 28.78 10.75 16.30Delta 0 50 * * * * * * * * *
Book-on-Tape Summary 0 50 * * * * * * * * *Destination Entry 49 1 64.14 59.14 62.20 26.71 3.820 28.25 155.19 47.04 75.25
Read Easy 50 0 14.23 13.35 13.69 5.34 0.756 7.03 32.86 10.51 17.21Read Hard 50 0 19.26 18.93 18.78 7.02 0.992 8.66 42.20 13.50 23.09Map Easy 50 0 10.43 9.90 10.16 3.56 0.504 4.75 21.10 8.14 12.11Map Hard 49 1 14.62 14.08 14.44 5.80 0.829 5.52 27.35 10.12 18.28
Static Task Time
Table Q-6. Descriptive Statistics for Total Shutter Open Time Data Collected During Occlusion Testing

Appendix Q Summary Statistics
Q-6
TaskName N N* Mean Median TrMean StDev SE Mean Minimum Maximum Q1 Q3Coins 49 1 6.98 6.50 6.85 2.67 0.382 3.00 14.96 5.25 8.38
Cassette 49 1 6.37 6.08 6.30 1.68 0.240 3.57 11.53 5.21 7.47HVAC 49 1 5.55 5.10 5.33 2.38 0.340 3.00 13.50 3.75 6.38
Radio Easy 49 1 4.66 4.24 4.51 1.81 0.259 2.25 11.25 3.14 5.92Manual Dial 49 1 11.66 10.50 11.28 4.56 0.651 6.00 32.25 8.46 13.79
Travel Computation 0 50 * * * * * * * * *Route Orientation 0 50 * * * * * * * * *
Voice Dial 49 1 16.66 14.53 16.08 5.77 0.824 10.67 37.79 12.75 18.76Book-on-Tape Listen 0 50 * * * * * * * * *
Just Drive 0 50 * * * * * * * * *Biographic QA 0 50 * * * * * * * * *
Route Instructions 0 50 * * * * * * * * *Sports 0 50 * * * * * * * * *
Radio Hard 49 1 7.30 6.51 7.02 2.95 0.421 3.65 21.75 5.72 8.92CD Track7 49 1 8.34 8.14 8.26 1.78 0.255 5.25 13.60 7.04 9.07
Route Tracing 49 1 11.55 10.61 11.13 4.57 0.653 5.59 30.75 9.09 13.08Delta 0 50 * * * * * * * * *
Book-on-Tape Summary 0 50 * * * * * * * * *Destination Entry 49 1 48.53 43.73 46.60 22.99 3.280 21.75 139.50 30.08 56.84
Read Easy 49 1 9.59 8.25 9.11 4.20 0.600 5.63 27.63 6.77 11.31Read Hard 47 3 13.22 13.32 13.12 3.62 0.528 5.32 25.70 11.17 14.97Map Easy 48 2 8.06 6.86 7.55 4.26 0.615 3.71 30.65 5.56 8.90Map Hard 47 3 13.41 12.71 12.60 7.54 1.100 5.24 41.25 8.12 17.36
Total Shutter Open Time
Table Q-7. Descriptive Statistics Calculated for R Metric
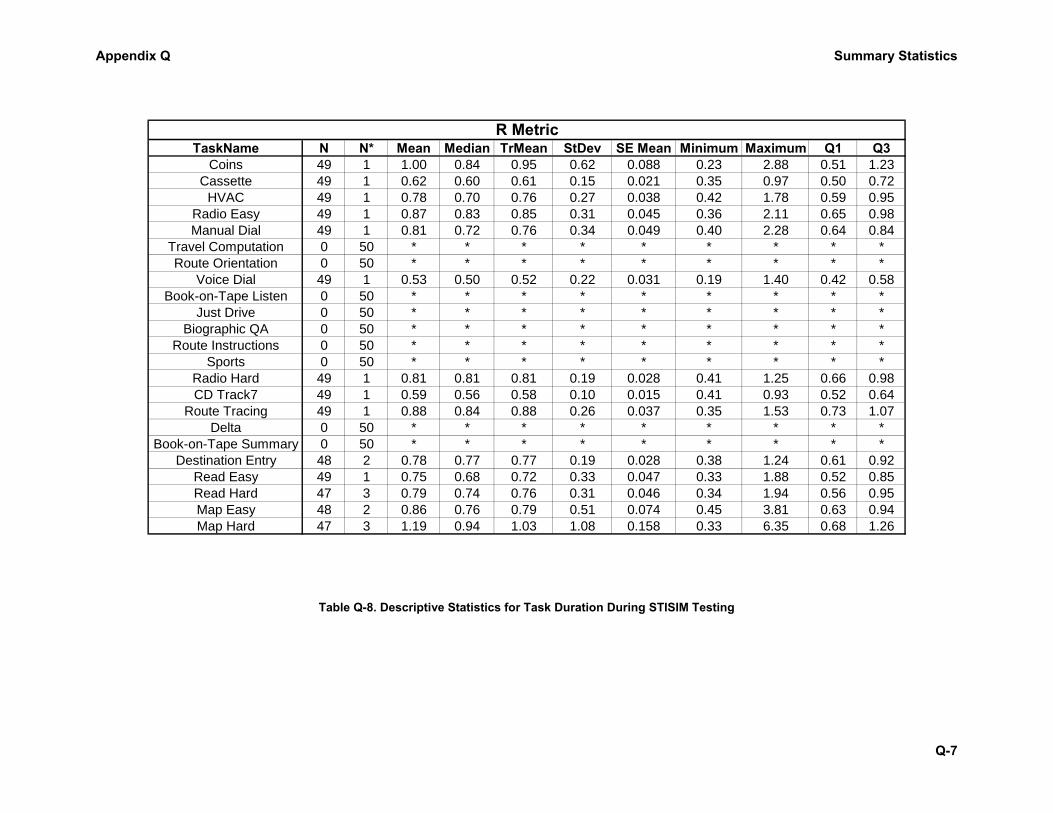
Appendix Q Summary Statistics
Q-7
TaskName N N* Mean Median TrMean StDev SE Mean Minimum Maximum Q1 Q3Coins 49 1 1.00 0.84 0.95 0.62 0.088 0.23 2.88 0.51 1.23
Cassette 49 1 0.62 0.60 0.61 0.15 0.021 0.35 0.97 0.50 0.72HVAC 49 1 0.78 0.70 0.76 0.27 0.038 0.42 1.78 0.59 0.95
Radio Easy 49 1 0.87 0.83 0.85 0.31 0.045 0.36 2.11 0.65 0.98Manual Dial 49 1 0.81 0.72 0.76 0.34 0.049 0.40 2.28 0.64 0.84
Travel Computation 0 50 * * * * * * * * *Route Orientation 0 50 * * * * * * * * *
Voice Dial 49 1 0.53 0.50 0.52 0.22 0.031 0.19 1.40 0.42 0.58Book-on-Tape Listen 0 50 * * * * * * * * *
Just Drive 0 50 * * * * * * * * *Biographic QA 0 50 * * * * * * * * *
Route Instructions 0 50 * * * * * * * * *Sports 0 50 * * * * * * * * *
Radio Hard 49 1 0.81 0.81 0.81 0.19 0.028 0.41 1.25 0.66 0.98CD Track7 49 1 0.59 0.56 0.58 0.10 0.015 0.41 0.93 0.52 0.64
Route Tracing 49 1 0.88 0.84 0.88 0.26 0.037 0.35 1.53 0.73 1.07Delta 0 50 * * * * * * * * *
Book-on-Tape Summary 0 50 * * * * * * * * *Destination Entry 48 2 0.78 0.77 0.77 0.19 0.028 0.38 1.24 0.61 0.92
Read Easy 49 1 0.75 0.68 0.72 0.33 0.047 0.33 1.88 0.52 0.85Read Hard 47 3 0.79 0.74 0.76 0.31 0.046 0.34 1.94 0.56 0.95Map Easy 48 2 0.86 0.76 0.79 0.51 0.074 0.45 3.81 0.63 0.94Map Hard 47 3 1.19 0.94 1.03 1.08 0.158 0.33 6.35 0.68 1.26
R Metric
Table Q-8. Descriptive Statistics for Task Duration During STISIM Testing

Appendix Q Summary Statistics
Q-8
TaskName N N* Mean Median TrMean StDev SE Mean Minimum Maximum Q1 Q3Coins 50 0 17.57 16.08 16.79 10.52 1.490 3.20 45.80 10.14 21.49
Cassette 48 2 17.42 15.23 16.75 6.87 0.992 9.15 42.65 13.00 18.83HVAC 50 0 11.55 9.28 10.86 6.47 0.915 4.20 30.60 7.38 13.56
Radio Easy 49 1 11.09 8.25 10.23 7.73 1.100 3.10 42.80 6.58 12.50Manual Dial 49 1 28.60 23.10 27.00 16.59 2.370 11.55 101.40 17.88 38.17
Travel Computation 49 1 109.21 109.35 109.27 2.75 0.390 102.70 114.80 107.43 111.25Route Orientation 50 0 125.45 125.20 125.40 4.81 0.680 112.95 138.15 121.79 129.04
Voice Dial 49 1 39.78 34.45 38.51 13.93 1.990 24.60 88.60 29.00 48.53Book-on-Tape Listen 50 0 118.94 119.65 119.32 5.23 0.740 105.80 128.30 117.81 122.05
Just Drive 50 0 111.44 110.35 110.80 3.58 0.510 109.30 130.65 109.90 110.83Biographic QA 49 1 126.19 125.95 126.01 1.45 0.210 125.00 135.50 125.60 126.43
Route Instructions 50 0 104.83 104.32 105.06 4.15 0.590 90.70 112.05 102.78 108.10Sports 49 1 109.79 107.55 109.58 7.15 1.020 95.65 132.10 105.50 114.95
Radio Hard 50 0 19.04 15.20 17.55 11.70 1.650 5.10 56.50 12.18 21.46CD Track7 48 2 18.63 17.40 18.13 5.58 0.806 11.45 42.10 14.63 20.76
Route Tracing 47 3 42.66 36.30 39.90 26.92 3.930 13.90 132.80 24.25 55.35Delta 47 3 120.83 119.60 120.56 24.74 3.610 58.60 193.60 104.30 134.25
Book-on-Tape Summary 49 1 33.88 30.70 33.32 14.58 2.080 10.60 70.90 22.88 43.28Destination Entry 48 2 135.30 104.00 128.50 78.30 11.300 53.80 411.20 75.40 163.70
Read Easy 50 0 23.42 19.48 21.80 12.66 1.790 8.25 77.40 14.95 27.99Read Hard 50 0 35.43 29.78 33.42 18.44 2.610 13.15 89.45 21.90 43.29Map Easy 50 0 19.22 16.55 18.07 9.57 1.350 7.50 54.40 13.30 22.28Map Hard 49 1 32.29 27.65 30.53 18.76 2.680 9.60 110.80 20.35 42.00
STISIM Task Duration
Table Q-9. Descriptive Statistics for Standard Deviation of Lane Position During STISIM Testing

Appendix Q Summary Statistics
Q-9
TaskName N N* Mean Median TrMean StDev SE Mean Minimum Maximum Q1 Q3Coins 50 0 1.19 1.14 1.13 0.62 0.088 0.14 3.34 0.80 1.38
Cassette 48 2 1.15 1.04 1.14 0.52 0.075 0.33 2.45 0.78 1.46HVAC 50 0 1.01 0.80 0.93 0.70 0.099 0.14 3.84 0.48 1.41
Radio Easy 49 1 0.85 0.71 0.83 0.48 0.068 0.08 2.18 0.57 1.14Manual Dial 49 1 1.35 1.18 1.30 0.68 0.097 0.40 3.41 0.85 1.63
Travel Computation 49 1 0.88 0.83 0.87 0.28 0.039 0.44 1.59 0.72 0.96Route Orientation 50 0 0.94 0.87 0.91 0.34 0.048 0.43 2.25 0.69 1.12
Voice Dial 49 1 1.03 0.95 1.00 0.41 0.059 0.44 2.29 0.73 1.22Book-on-Tape Listen 50 0 0.90 0.83 0.87 0.30 0.043 0.43 1.93 0.68 1.06
Just Drive 50 0 0.88 0.88 0.87 0.26 0.037 0.38 1.48 0.68 1.06Biographic QA 49 1 0.88 0.87 0.87 0.25 0.036 0.47 1.49 0.67 1.04
Route Instructions 50 0 0.82 0.77 0.81 0.24 0.034 0.42 1.33 0.63 0.98Sports 49 1 0.85 0.87 0.85 0.23 0.033 0.40 1.32 0.66 0.97
Radio Hard 50 0 1.06 0.96 1.02 0.53 0.075 0.30 2.73 0.70 1.45CD Track7 48 2 1.17 1.11 1.14 0.53 0.076 0.39 2.90 0.79 1.42
Route Tracing 47 3 2.33 1.82 2.11 1.86 0.271 0.50 12.46 1.32 2.71Delta 47 3 0.97 0.90 0.95 0.31 0.046 0.51 2.08 0.79 1.07
Book-on-Tape Summary 49 1 0.68 0.66 0.68 0.22 0.031 0.26 1.22 0.52 0.87Destination Entry 48 2 1.87 1.61 1.79 0.87 0.126 0.76 5.15 1.30 2.13
Read Easy 50 0 1.28 1.13 1.21 0.65 0.092 0.22 3.89 0.81 1.58Read Hard 50 0 1.29 1.21 1.26 0.44 0.063 0.48 2.52 0.98 1.49Map Easy 50 0 1.23 1.12 1.17 0.61 0.086 0.28 3.41 0.87 1.37Map Hard 49 1 1.50 1.29 1.44 0.75 0.108 0.47 4.82 1.05 1.87
STISIM Standard Deviation of Lane Position
Table Q-10. Descriptive Statistics for Speed Difference During STISIM Testing

Appendix Q Summary Statistics
Q-10
TaskName N N* Mean Median TrMean StDev SE Mean Minimum Maximum Q1 Q3Coins 50 0 11.09 8.08 9.72 10.79 1.530 0.85 45.18 2.85 18.61
Cassette 48 2 10.46 9.39 9.82 7.94 1.150 1.07 35.97 4.17 13.92HVAC 50 0 6.78 4.88 6.23 5.84 0.826 0.13 25.02 2.14 9.43
Radio Easy 49 1 8.35 5.79 7.83 7.50 1.070 0.42 30.65 2.22 12.28Manual Dial 49 1 15.04 10.98 13.59 14.29 2.040 0.67 66.22 5.59 22.36
Travel Computation 49 1 18.21 16.91 17.25 12.14 1.730 3.44 65.19 8.85 23.25Route Orientation 50 0 20.14 17.98 19.35 12.57 1.780 2.80 49.74 8.94 29.43
Voice Dial 49 1 18.18 14.49 17.16 13.21 1.890 2.42 67.66 9.01 26.04Book-on-Tape Listen 50 0 18.11 14.36 16.85 12.76 1.800 2.24 59.98 8.52 25.01
Just Drive 50 0 14.58 11.59 13.52 9.67 1.370 3.54 53.56 6.99 20.20Biographic QA 49 1 18.62 16.59 17.38 12.37 1.770 3.20 66.29 9.35 24.29
Route Instructions 50 0 18.25 14.26 16.64 13.13 1.860 0.19 68.44 9.96 22.67Sports 49 1 18.47 14.19 17.60 12.35 1.760 4.39 60.20 9.28 24.22
Radio Hard 50 0 12.13 8.49 11.00 11.18 1.580 0.05 40.66 2.52 20.34CD Track7 48 2 12.67 10.52 12.33 7.91 1.140 1.35 32.58 7.25 18.08
Route Tracing 47 3 19.69 15.93 18.78 13.44 1.960 0.75 58.34 11.41 25.71Delta 47 3 22.43 20.69 21.93 13.46 1.960 2.04 52.32 12.29 28.67
Book-on-Tape Summary 49 1 12.71 9.99 12.10 9.66 1.380 0.82 39.64 5.21 20.02Destination Entry 48 2 31.99 25.61 30.56 20.82 3.000 5.91 105.75 16.24 43.23
Read Easy 50 0 12.70 9.29 11.21 12.04 1.700 0.74 70.37 5.52 14.96Read Hard 50 0 15.49 13.33 14.91 9.06 1.280 2.07 38.88 8.94 21.28Map Easy 50 0 11.71 10.25 10.87 8.66 1.220 0.81 36.68 5.50 16.10Map Hard 49 1 16.36 12.66 14.92 13.87 1.980 2.00 72.34 7.63 20.95
STISIM Speed Difference
Table Q-11. Descriptive Statistics for Percent Missed Detections During Peripheral Detection Task Alone

Appendix Q Summary Statistics
Q-11
TaskName N N* Mean Median TrMean StDev SE Mean Minimum Maximum Q1 Q3Coins 50 0 16.48 0.00 12.29 26.34 3.730 0.00 100.00 0.00 25.00
Cassette 50 0 11.92 0.00 7.10 25.09 3.550 0.00 100.00 0.00 16.67HVAC 50 0 15.00 0.00 10.23 29.45 4.160 0.00 100.00 0.00 25.00
Radio Easy 49 1 11.73 0.00 8.33 28.00 4.000 0.00 100.00 0.00 0.00Manual Dial 49 1 20.06 0.00 17.96 26.62 3.800 0.00 100.00 0.00 35.42
Travel Computation 50 0 5.83 2.95 4.60 7.79 1.100 0.00 37.50 0.00 6.73Route Orientation 50 0 7.83 3.74 5.97 11.89 1.680 0.00 43.75 0.00 8.45
Voice Dial 50 0 13.69 6.70 10.14 20.74 2.930 0.00 100.00 0.00 20.00Book-on-Tape Listen 50 0 1.38 0.00 0.43 5.51 0.779 0.00 38.16 0.00 0.00
Just Drive 50 0 0.67 0.00 0.10 3.04 0.429 0.00 20.59 0.00 0.00Biographic QA 50 0 3.56 0.00 2.15 7.47 1.060 0.00 44.08 0.00 4.76
Route Instructions 49 1 6.54 2.78 5.06 11.45 1.640 0.00 49.55 0.00 6.47Sports 50 0 2.68 0.00 1.21 6.69 0.947 0.00 31.68 0.00 2.82
Radio Hard 50 0 9.62 0.00 5.81 20.76 2.940 0.00 100.00 0.00 10.63CD Track7 50 0 10.50 0.00 6.06 22.69 3.210 0.00 100.00 0.00 13.54
Route Tracing 50 0 26.45 25.00 24.00 25.77 3.640 0.00 100.00 0.00 43.13Delta 50 0 11.58 6.46 9.23 15.00 2.120 0.00 67.95 1.88 14.97
Book-on-Tape Summary 50 0 5.42 0.00 2.56 13.21 1.870 0.00 62.50 0.00 3.81Destination Entry 50 0 18.25 7.95 14.96 23.94 3.390 0.00 97.06 0.00 27.71
Read Easy 50 0 8.07 0.00 5.19 16.77 2.370 0.00 75.00 0.00 4.17Read Hard 49 1 4.73 0.00 3.63 8.92 1.270 0.00 37.50 0.00 9.82Map Easy 50 0 14.83 0.00 11.17 25.30 3.580 0.00 100.00 0.00 18.75Map Hard 49 1 16.77 0.00 14.19 25.31 3.620 0.00 100.00 0.00 29.17
Peripheral Detection Task Alone Percent Missed Detections
Table Q-12. Descriptive Statistics for Mean Response Time During Peripheral Detection Task Alone

Appendix Q Summary Statistics
Q-12
TaskName N N* Mean Median TrMean StDev SE Mean Minimum Maximum Q1 Q3Coins 48 2 0.66 0.65 0.66 0.18 0.026 0.30 1.28 0.52 0.77
Cassette 48 2 0.69 0.70 0.68 0.20 0.028 0.41 1.33 0.52 0.81HVAC 46 4 0.85 0.81 0.85 0.26 0.038 0.50 1.41 0.62 1.11
Radio Easy 46 4 0.61 0.58 0.60 0.21 0.031 0.22 1.13 0.45 0.72Manual Dial 48 2 0.75 0.73 0.74 0.18 0.025 0.46 1.18 0.63 0.85
Travel Computation 50 0 0.52 0.51 0.52 0.09 0.013 0.32 0.98 0.48 0.56Route Orientation 50 0 0.55 0.53 0.54 0.12 0.018 0.35 0.96 0.45 0.63
Voice Dial 49 1 0.61 0.62 0.61 0.11 0.016 0.37 0.94 0.54 0.69Book-on-Tape Listen 50 0 0.45 0.44 0.44 0.10 0.014 0.31 0.90 0.39 0.48
Just Drive 50 0 0.37 0.36 0.37 0.06 0.009 0.26 0.58 0.32 0.40Biographic QA 50 0 0.51 0.50 0.51 0.10 0.014 0.33 0.97 0.46 0.54
Route Instructions 49 1 0.55 0.54 0.54 0.10 0.015 0.33 0.81 0.45 0.62Sports 50 0 0.48 0.44 0.46 0.12 0.018 0.31 1.00 0.41 0.52
Radio Hard 49 1 0.66 0.60 0.64 0.20 0.029 0.40 1.42 0.51 0.76CD Track7 49 1 0.64 0.57 0.63 0.19 0.028 0.41 1.21 0.49 0.75
Route Tracing 49 1 0.70 0.68 0.69 0.21 0.030 0.26 1.12 0.56 0.82Delta 50 0 0.59 0.57 0.58 0.10 0.015 0.43 0.94 0.52 0.64
Book-on-Tape Summary 50 0 0.58 0.52 0.56 0.18 0.025 0.33 1.24 0.47 0.69Destination Entry 50 0 0.72 0.72 0.72 0.14 0.019 0.47 1.05 0.63 0.80
Read Easy 50 0 0.60 0.57 0.58 0.16 0.023 0.35 1.32 0.50 0.67Read Hard 49 1 0.59 0.54 0.57 0.18 0.026 0.38 1.26 0.45 0.65Map Easy 49 1 0.68 0.67 0.67 0.18 0.026 0.35 1.16 0.53 0.81Map Hard 48 2 0.63 0.60 0.62 0.22 0.032 0.31 1.53 0.50 0.68
Peripheral Detection Task Alone Mean Response Time
Table Q-13. Descriptive Statistics for Median Response Time During Peripheral Detection Task Alone

Appendix Q Summary Statistics
Q-13
TaskName N N* Mean Median TrMean StDev SE Mean Minimum Maximum Q1 Q3Coins 48 2 0.65 0.66 0.64 0.18 0.026 0.30 1.28 0.52 0.76
Cassette 48 2 0.68 0.68 0.67 0.20 0.029 0.40 1.33 0.51 0.81HVAC 46 4 0.85 0.82 0.85 0.26 0.038 0.50 1.41 0.62 1.11
Radio Easy 46 4 0.61 0.59 0.60 0.21 0.031 0.22 1.13 0.45 0.72Manual Dial 48 2 0.73 0.70 0.72 0.19 0.027 0.43 1.18 0.58 0.86
Travel Computation 50 0 0.48 0.47 0.47 0.09 0.012 0.32 0.93 0.43 0.49Route Orientation 50 0 0.50 0.47 0.49 0.12 0.017 0.32 0.92 0.42 0.56
Voice Dial 49 1 0.57 0.56 0.57 0.13 0.018 0.36 0.96 0.49 0.66Book-on-Tape Listen 50 0 0.43 0.41 0.41 0.10 0.014 0.31 0.88 0.38 0.45
Just Drive 50 0 0.35 0.35 0.35 0.05 0.007 0.26 0.51 0.31 0.38Biographic QA 50 0 0.47 0.45 0.46 0.09 0.013 0.32 0.90 0.42 0.51
Route Instructions 49 1 0.50 0.48 0.49 0.09 0.012 0.32 0.73 0.43 0.55Sports 50 0 0.44 0.41 0.43 0.13 0.018 0.29 1.11 0.38 0.45
Radio Hard 49 1 0.65 0.60 0.63 0.21 0.031 0.39 1.42 0.50 0.75CD Track7 49 1 0.63 0.56 0.61 0.20 0.028 0.41 1.21 0.47 0.75
Route Tracing 49 1 0.68 0.65 0.67 0.22 0.031 0.26 1.12 0.53 0.82Delta 50 0 0.53 0.50 0.52 0.11 0.015 0.38 0.92 0.46 0.57
Book-on-Tape Summary 50 0 0.56 0.50 0.53 0.17 0.024 0.32 1.24 0.44 0.64Destination Entry 50 0 0.67 0.65 0.66 0.15 0.022 0.44 1.11 0.56 0.73
Read Easy 50 0 0.58 0.54 0.57 0.17 0.023 0.35 1.32 0.48 0.65Read Hard 49 1 0.55 0.51 0.53 0.17 0.025 0.36 1.27 0.46 0.60Map Easy 49 1 0.67 0.67 0.66 0.19 0.027 0.35 1.16 0.51 0.78Map Hard 48 2 0.62 0.56 0.60 0.22 0.032 0.31 1.53 0.50 0.67
Peripheral Detection Task Alone Median Response Time
Table Q-14. Descriptive Statistics for Percent Missed Detections During Peripheral Detection Task in STISIM

Appendix Q Summary Statistics
Q-14
TaskName N N* Mean Median TrMean StDev SE Mean Minimum Maximum Q1 Q3Coins 50 0 24.40 11.25 21.19 30.21 4.270 0.00 100.00 0.00 50.00
Cassette 48 2 19.15 0.00 16.34 27.80 4.010 0.00 100.00 0.00 25.00HVAC 50 0 43.67 50.00 42.80 38.75 5.480 0.00 100.00 0.00 77.08
Radio Easy 49 1 27.30 16.67 25.28 34.05 4.860 0.00 100.00 0.00 50.00Manual Dial 48 2 33.88 28.39 32.41 28.14 4.060 0.00 100.00 12.50 47.92
Travel Computation 48 2 16.11 9.13 13.51 20.67 2.980 0.00 92.31 2.99 22.94Route Orientation 50 0 14.20 6.69 10.96 20.25 2.860 0.00 88.56 2.33 16.78
Voice Dial 49 1 22.04 12.50 19.56 26.42 3.770 0.00 100.00 0.00 29.29Book-on-Tape Listen 48 2 5.97 1.14 3.46 13.96 2.010 0.00 68.42 0.00 5.27
Just Drive 50 0 1.24 0.00 0.53 3.68 0.521 0.00 23.22 0.00 0.00Biographic QA 49 1 9.34 4.76 6.94 16.25 2.320 0.00 87.87 0.00 9.92
Route Instructions 50 0 12.16 6.46 10.16 14.75 2.090 0.00 58.93 0.00 19.92Sports 48 2 7.62 2.78 5.28 14.29 2.060 0.00 66.67 0.00 8.82
Radio Hard 50 0 26.38 20.83 23.35 29.09 4.110 0.00 100.00 0.00 50.00CD Track7 48 2 20.64 16.67 17.97 27.10 3.910 0.00 100.00 0.00 31.67
Route Tracing 47 3 36.90 31.25 35.68 25.29 3.690 0.00 100.00 20.00 50.00Delta 47 3 19.89 12.16 17.82 21.17 3.090 0.00 92.50 5.61 30.77
Book-on-Tape Summary 49 1 11.88 0.00 9.79 19.00 2.710 0.00 75.00 0.00 16.90Destination Entry 48 2 42.37 36.44 41.49 24.56 3.550 2.82 100.00 25.22 58.20
Read Easy 50 0 31.58 25.00 29.45 28.23 3.990 0.00 100.00 7.50 50.00Read Hard 50 0 31.36 25.00 29.10 26.55 3.750 0.00 100.00 12.08 50.00Map Easy 50 0 26.22 16.67 22.98 30.25 4.280 0.00 100.00 0.00 43.39Map Hard 49 1 37.14 25.00 36.00 30.87 4.410 0.00 100.00 14.58 56.94
Peripheral Detection Task in STISIM Percent Missed Detections
Table Q-15. Descriptive Statistics for Mean Response Time During Peripheral Detection Task in STISIM

Appendix Q Summary Statistics
Q-15
TaskName N N* Mean Median TrMean StDev SE Mean Minimum Maximum Q1 Q3Coins 48 2 0.78 0.76 0.77 0.20 0.029 0.49 1.33 0.63 0.88
Cassette 46 4 0.82 0.78 0.80 0.25 0.037 0.48 1.52 0.60 1.00HVAC 41 9 0.94 0.89 0.93 0.29 0.046 0.53 1.76 0.77 1.15
Radio Easy 43 7 0.86 0.81 0.85 0.33 0.051 0.30 1.71 0.65 1.08Manual Dial 45 5 0.89 0.87 0.88 0.23 0.034 0.50 1.76 0.75 1.03
Travel Computation 48 2 0.65 0.62 0.63 0.13 0.019 0.48 1.27 0.56 0.70Route Orientation 50 0 0.68 0.64 0.67 0.13 0.018 0.46 1.13 0.60 0.76
Voice Dial 47 3 0.79 0.78 0.77 0.18 0.026 0.44 1.52 0.68 0.84Book-on-Tape Listen 48 2 0.59 0.57 0.58 0.09 0.013 0.44 0.83 0.53 0.64
Just Drive 50 0 0.51 0.50 0.51 0.07 0.010 0.40 0.67 0.45 0.55Biographic QA 49 1 0.66 0.65 0.65 0.14 0.020 0.44 1.32 0.58 0.71
Route Instructions 50 0 0.67 0.66 0.66 0.13 0.018 0.45 1.14 0.59 0.73Sports 48 2 0.61 0.59 0.60 0.11 0.016 0.41 1.09 0.55 0.65
Radio Hard 48 2 0.84 0.81 0.83 0.31 0.044 0.36 1.56 0.56 1.05CD Track7 46 4 0.81 0.76 0.79 0.23 0.033 0.51 1.63 0.68 0.85
Route Tracing 45 5 0.82 0.79 0.81 0.24 0.036 0.35 1.58 0.66 0.99Delta 47 3 0.74 0.72 0.74 0.14 0.020 0.47 1.11 0.65 0.85
Book-on-Tape Summary 49 1 0.72 0.68 0.71 0.16 0.023 0.42 1.18 0.60 0.81Destination Entry 45 5 0.84 0.84 0.84 0.15 0.022 0.59 1.24 0.73 0.90
Read Easy 48 2 0.85 0.81 0.84 0.24 0.035 0.51 1.53 0.65 0.99Read Hard 48 2 0.81 0.75 0.79 0.25 0.036 0.48 1.78 0.68 0.91Map Easy 47 3 0.82 0.76 0.80 0.27 0.039 0.38 1.63 0.64 0.91Map Hard 47 3 0.77 0.76 0.76 0.20 0.029 0.39 1.26 0.61 0.89
Peripheral Detection Task in STISIM Mean Response Time
Table Q-16. Descriptive Statistics for Median Response Time During Peripheral Detection Task in STISIM

Appendix Q Summary Statistics
Q-16
TaskName N N* Mean Median TrMean StDev SE Mean Minimum Maximum Q1 Q3Coins 48 2 0.76 0.70 0.75 0.21 0.030 0.49 1.33 0.60 0.87
Cassette 46 4 0.81 0.77 0.79 0.25 0.037 0.48 1.52 0.58 0.96HVAC 41 9 0.95 0.89 0.93 0.30 0.046 0.53 1.76 0.77 1.15
Radio Easy 43 7 0.85 0.82 0.84 0.33 0.051 0.30 1.71 0.58 1.08Manual Dial 45 5 0.88 0.85 0.87 0.25 0.037 0.50 1.76 0.70 1.04
Travel Computation 48 2 0.61 0.57 0.59 0.14 0.020 0.44 1.27 0.53 0.66Route Orientation 50 0 0.61 0.58 0.60 0.13 0.019 0.43 1.12 0.52 0.67
Voice Dial 47 3 0.75 0.71 0.74 0.19 0.028 0.44 1.52 0.65 0.81Book-on-Tape Listen 48 2 0.55 0.53 0.54 0.07 0.011 0.43 0.75 0.50 0.60
Just Drive 50 0 0.47 0.46 0.47 0.06 0.008 0.38 0.67 0.44 0.51Biographic QA 49 1 0.61 0.58 0.59 0.14 0.020 0.42 1.32 0.52 0.64
Route Instructions 50 0 0.62 0.59 0.61 0.12 0.017 0.42 1.18 0.56 0.67Sports 48 2 0.56 0.54 0.55 0.11 0.016 0.42 1.11 0.50 0.60
Radio Hard 48 2 0.82 0.78 0.81 0.31 0.045 0.36 1.56 0.56 1.02CD Track7 46 4 0.78 0.76 0.76 0.25 0.036 0.40 1.63 0.63 0.89
Route Tracing 45 5 0.77 0.74 0.76 0.26 0.038 0.35 1.58 0.61 0.90Delta 47 3 0.68 0.66 0.68 0.14 0.021 0.44 1.07 0.59 0.80
Book-on-Tape Summary 49 1 0.69 0.65 0.69 0.17 0.025 0.42 1.18 0.57 0.79Destination Entry 45 5 0.78 0.76 0.77 0.16 0.024 0.50 1.23 0.68 0.81
Read Easy 48 2 0.84 0.81 0.83 0.25 0.036 0.51 1.53 0.64 1.01Read Hard 48 2 0.78 0.71 0.76 0.27 0.039 0.44 1.78 0.57 0.88Map Easy 47 3 0.80 0.75 0.78 0.27 0.040 0.38 1.63 0.59 0.89Map Hard 47 3 0.75 0.72 0.74 0.21 0.030 0.39 1.26 0.57 0.85
Peripheral Detection Task in STISIM Median Response Time
Table Q-17. Descriptive Statistics for Percent Missed Detections During Sternberg Testing

Appendix Q Summary Statistics
Q-17
TaskName N Mean Median TrMean StDev SE Mean Minimum Maximum Q1 Q3Coins 50 37.45 33.33 36.16 27.56 3.90 0.000 100.00 12.50 54.69
Cassette 50 25.08 18.75 22.54 24.36 3.45 0.000 100.00 4.69 37.50HVAC 50 60.25 62.50 61.65 28.97 4.10 0.000 100.00 37.50 87.50
Radio Easy 50 39.54 37.50 38.12 28.55 4.04 0.000 100.00 17.19 62.50Manual Dial 50 40.84 35.94 40.31 24.55 3.47 0.000 93.75 21.88 60.16
Travel Computation 50 28.46 25.30 27.19 18.27 2.58 0.000 74.48 16.03 35.51Route Orientation 50 27.69 20.50 25.98 20.45 2.89 2.810 83.54 14.59 42.95
Voice Dial 50 37.3 33.33 35.85 22.70 3.21 4.580 100.00 18.75 52.50Book-on-Tape Listen 50 16.65 15.16 15.42 14.53 2.05 0.000 60.94 4.69 24.83
Just Drive 50 7.495 6.25 7.06 6.56 0.93 0.000 25.22 1.79 11.38Biographic QA 50 22.55 19.58 21.16 15.95 2.26 0.000 75.35 11.20 31.47
Route Instructions 50 28.49 22.27 27.13 21.01 2.97 1.790 75.60 10.78 42.50Sports 50 21.86 17.75 20.43 15.84 2.24 1.250 68.35 9.88 31.61
Radio Hard 50 43.81 37.50 42.83 25.76 3.64 0.000 100.00 25.00 56.25CD Track7 50 34.59 31.25 33.65 23.05 3.26 0.000 93.75 12.50 50.00
Route Tracing 50 44.96 41.67 44.33 23.78 3.36 0.000 100.00 26.93 63.02Delta 50 39.43 38.29 38.32 21.34 3.02 0.000 100.00 25.30 48.38
Book-on-Tape Summary 50 45.29 38.02 44.70 29.31 4.14 0.000 100.00 24.48 69.27Destination Entry 50 58.21 58.32 58.41 23.99 3.39 6.250 100.00 39.18 75.31
Read Easy 50 33.4 31.25 31.92 23.97 3.39 0.000 100.00 12.50 50.00Read Hard 50 35.08 32.60 33.78 21.98 3.11 0.000 100.00 18.23 50.00Map Easy 50 44.24 38.54 43.74 24.24 3.43 0.000 100.00 25.00 62.50Map Hard 50 45.53 43.75 45.39 25.90 3.66 0.000 100.00 27.34 68.75
Sternberg Percent Missed Detections
Table Q-18. Descriptive Statistics for Percent All Errors During Sternberg Testing

Appendix Q Summary Statistics
Q-18
TaskName N Mean Median TrMean StDev SE Mean Minimum Maximum Q1 Q3Coins 50 48.41 50.00 48.48 27.48 3.89 0.000 100.00 29.69 75.00
Cassette 50 33.21 25.00 31.49 26.20 3.71 0.000 100.00 12.50 50.00HVAC 50 66.21 75.00 68.42 27.48 3.89 0.000 100.00 50.00 87.50
Radio Easy 50 48.75 50.00 48.58 28.68 4.06 0.000 100.00 25.00 75.00Manual Dial 50 48.49 47.92 48.71 27.24 3.85 0.000 93.75 29.69 71.88
Travel Computation 50 41.92 43.03 41.59 18.01 2.55 8.040 81.32 29.71 51.86Route Orientation 50 38.81 33.10 37.90 21.25 3.01 2.810 94.27 24.48 46.97
Voice Dial 50 45.8 39.06 44.57 22.07 3.12 15.420 100.00 25.94 62.50Book-on-Tape Listen 50 28.55 27.93 27.62 16.64 2.35 3.130 76.56 16.10 40.94
Just Drive 50 16.17 13.25 14.85 12.76 1.80 0.000 62.50 6.60 21.55Biographic QA 50 34.4 33.02 33.77 17.40 2.46 1.390 89.24 22.71 49.17
Route Instructions 50 40.06 38.59 39.37 20.69 2.93 5.360 83.56 22.74 49.72Sports 50 32.4 29.50 30.90 17.31 2.45 2.810 80.23 20.76 40.59
Radio Hard 50 51.24 50.00 50.99 24.56 3.47 0.000 100.00 35.94 62.50CD Track7 50 42.89 37.50 42.20 23.13 3.27 0.000 93.75 25.00 60.94
Route Tracing 50 49.68 50.00 49.50 23.71 3.35 0.000 100.00 31.25 68.75Delta 50 51.61 51.91 51.25 19.73 2.79 4.690 100.00 39.78 62.59
Book-on-Tape Summary 50 54.17 50.73 54.39 28.99 4.10 4.170 100.00 36.98 78.91Destination Entry 50 64.43 64.75 64.93 21.42 3.03 17.880 100.00 48.50 78.34
Read Easy 50 40.89 41.04 39.98 23.58 3.33 0.000 100.00 25.00 53.28Read Hard 50 44.97 44.79 44.14 20.41 2.89 12.500 100.00 28.91 56.77Map Easy 50 50.55 50.00 50.20 23.39 3.31 6.250 100.00 34.06 69.27Map Hard 50 53.96 54.17 53.79 22.95 3.25 0.000 100.00 32.81 71.61
Sternberg Percent All Errors
Table Q-19. Descriptive Statistics for Combined Decrement Score During Sternberg Testing

Appendix Q Summary Statistics
Q-19
TaskName N Mean Median TrMean StDev SE Mean Minimum Maximum Q1 Q3Coins 50 0.4916 0.50 0.49 0.28 0.04 0.000 1.00 0.31 0.75
Cassette 50 0.3421 0.25 0.33 0.26 0.04 0.000 1.00 0.13 0.50HVAC 50 0.7821 0.88 0.80 0.33 0.05 0.000 1.25 0.61 1.02
Radio Easy 50 0.5025 0.50 0.50 0.28 0.04 0.000 1.00 0.25 0.75Manual Dial 50 0.5399 0.49 0.54 0.32 0.05 0.000 1.25 0.31 0.81
Travel Computation 50 0.7217 0.76 0.72 0.30 0.04 0.080 1.31 0.53 0.92Route Orientation 50 0.6006 0.57 0.59 0.33 0.05 0.028 1.44 0.36 0.79
Voice Dial 50 0.493 0.42 0.47 0.27 0.04 0.154 1.50 0.30 0.63Book-on-Tape Listen 50 0.3805 0.33 0.37 0.24 0.03 0.043 1.14 0.19 0.54
Just Drive 50 0.1617 0.13 0.15 0.13 0.02 0.000 0.63 0.07 0.22Biographic QA 50 0.3465 0.33 0.34 0.17 0.02 0.014 0.89 0.23 0.49
Route Instructions 50 0.6481 0.60 0.64 0.34 0.05 0.138 1.32 0.35 0.90Sports 50 0.409 0.39 0.40 0.22 0.03 0.028 0.93 0.24 0.52
Radio Hard 50 0.5424 0.50 0.54 0.26 0.04 0.000 1.06 0.38 0.69CD Track7 50 0.4389 0.39 0.43 0.24 0.03 0.000 0.97 0.25 0.63
Route Tracing 50 0.5018 0.50 0.50 0.24 0.03 0.000 1.00 0.31 0.69Delta 50 0.6111 0.61 0.59 0.27 0.04 0.047 1.50 0.44 0.71
Book-on-Tape Summary 50 0.7092 0.72 0.71 0.35 0.05 0.042 1.38 0.45 0.98Destination Entry 50 0.6943 0.71 0.69 0.26 0.04 0.231 1.32 0.50 0.85
Read Easy 50 0.4564 0.49 0.45 0.27 0.04 0.000 1.10 0.25 0.63Read Hard 50 0.4972 0.48 0.49 0.23 0.03 0.125 1.13 0.33 0.63Map Easy 50 0.528 0.50 0.52 0.24 0.03 0.063 1.00 0.37 0.75Map Hard 50 0.5596 0.55 0.55 0.25 0.04 0.000 1.13 0.36 0.72
Sternberg Combined Decrement Score

Appendix Q Summary Statistics
Q-20
Descriptive statistics for road metrics are presented below.
Table Q-20. Descriptive Statistics for Task Duration During Road Testing
TaskName N N* Mean Median TrMean StDev SE Mean Minimum Maximum Q1 Q3Coins 101 0 17.68 16.44 17.26 6.89 0.686 5.03 47.33 13.13 21.63
Cassette 101 0 14.71 13.77 14.48 3.71 0.369 7.94 26.90 11.81 16.98HVAC 101 0 10.94 10.40 10.65 3.59 0.358 5.79 26.90 8.27 12.48
Radio Easy 101 0 10.45 9.15 9.86 5.40 0.538 3.91 40.54 7.19 11.74Manual Dial 101 0 26.78 25.36 25.87 10.74 1.070 12.30 66.87 19.13 31.58
Travel Computation 101 0 111.37 109.36 109.60 12.85 1.280 93.97 211.79 108.10 110.47Route Orientation 101 0 126.11 126.10 125.76 4.55 0.450 118.28 162.64 123.73 127.56
Voice Dial 100 1 49.83 45.76 48.43 16.07 1.610 25.00 134.52 40.16 57.70Book-on-Tape Listen 101 0 120.50 121.51 120.72 5.48 0.550 92.51 140.01 118.16 123.40
Just Drive 101 0 112.82 113.75 113.09 3.28 0.330 101.20 121.15 112.79 114.04Biographic QA 96 5 126.57 126.11 126.21 4.10 0.420 121.56 165.36 125.85 126.62
Route Instructions 96 5 106.79 106.39 106.59 5.95 0.610 72.12 143.20 105.01 108.11Sports 95 6 109.85 110.80 110.86 12.33 1.270 2.90 127.40 107.62 113.34
Radio Hard 101 0 15.39 13.73 14.85 6.29 0.626 6.57 48.79 11.17 18.91CD Track7 80 21 16.76 15.60 16.40 3.96 0.442 9.97 33.67 14.35 19.19
Route Tracing 0 101 * * * * * * * * *Delta 0 101 * * * * * * * * *
Book-on-Tape Summary 100 1 38.29 34.42 37.35 17.11 1.710 12.48 94.76 24.91 48.28Destination Entry 0 101 * * * * * * * * *
Read Easy 0 101 * * * * * * * * *Read Hard 0 101 * * * * * * * * *Map Easy 0 101 * * * * * * * * *Map Hard 0 101 * * * * * * * * *
Task Duration for Road Data
Table Q-21. Descriptive Statistics for Standard Deviation of Lane Position During Road Testing

Appendix Q Summary Statistics
Q-21
TaskName N N* Mean Median TrMean StDev SE Mean Minimum Maximum Q1 Q3Coins 93 8 0.60 0.57 0.58 0.20 0.021 0.25 1.41 0.47 0.69
Cassette 95 6 0.61 0.57 0.60 0.19 0.020 0.25 1.21 0.49 0.71HVAC 94 7 0.49 0.45 0.48 0.24 0.025 0.14 1.54 0.31 0.63
Radio Easy 91 10 0.44 0.43 0.43 0.18 0.019 0.11 1.38 0.33 0.53Manual Dial 94 7 0.64 0.64 0.64 0.17 0.017 0.32 1.07 0.51 0.75
Travel Computation 93 8 0.68 0.66 0.67 0.15 0.016 0.40 1.16 0.59 0.75Route Orientation 90 11 0.67 0.63 0.66 0.14 0.015 0.39 1.17 0.58 0.74
Voice Dial 90 11 0.66 0.65 0.65 0.18 0.020 0.29 1.26 0.51 0.76Book-on-Tape Listen 87 14 0.68 0.67 0.68 0.16 0.017 0.35 1.15 0.56 0.77
Just Drive 96 5 0.67 0.64 0.67 0.16 0.016 0.34 1.25 0.57 0.78Biographic QA 79 22 0.68 0.66 0.67 0.16 0.018 0.34 1.38 0.57 0.75
Route Instructions 78 23 0.63 0.62 0.62 0.17 0.019 0.38 1.13 0.51 0.73Sports 81 20 0.66 0.63 0.65 0.18 0.020 0.34 1.37 0.53 0.78
Radio Hard 95 6 0.53 0.49 0.51 0.21 0.022 0.22 1.13 0.39 0.65CD Track7 67 34 0.58 0.55 0.56 0.24 0.030 0.13 1.53 0.43 0.70
Route Tracing 0 101 * * * * * * * * *Delta 0 101 * * * * * * * * *
Book-on-Tape Summary 89 12 0.56 0.52 0.55 0.17 0.018 0.23 1.25 0.44 0.65Destination Entry 0 101 * * * * * * * * *
Read Easy 0 101 * * * * * * * * *Read Hard 0 101 * * * * * * * * *Map Easy 0 101 * * * * * * * * *Map Hard 0 101 * * * * * * * * *
Standard Deviation of Lane Position for Road Data
Table Q-22. Descriptive Statistics for Speed Difference During Road Testing

Appendix Q Summary Statistics
Q-22
TaskName N N* Mean Median TrMean StDev SE Mean Minimum Maximum Q1 Q3Coins 101 0 4.95 4.52 4.84 2.13 0.212 1.15 13.08 3.44 6.20
Cassette 101 0 4.76 4.41 4.69 1.67 0.167 1.48 9.22 3.52 5.70HVAC 100 1 3.68 3.21 3.55 1.76 0.176 0.90 12.64 2.53 4.55
Radio Easy 101 0 3.45 3.03 3.33 1.83 0.182 0.89 9.33 2.15 4.38Manual Dial 100 1 6.01 5.61 5.93 2.06 0.206 2.49 11.89 4.55 7.35
Travel Computation 79 22 11.28 10.67 10.97 4.74 0.533 4.54 23.39 7.77 13.12Route Orientation 73 28 9.57 8.89 9.35 3.29 0.385 4.68 23.11 7.06 11.61
Voice Dial 100 1 7.47 7.11 7.37 2.26 0.226 3.91 14.99 5.96 8.56Book-on-Tape Listen 79 22 10.67 10.20 10.37 4.11 0.462 4.22 23.87 8.03 12.04
Just Drive 101 0 7.67 7.31 7.54 1.99 0.198 4.35 14.72 6.20 8.78Biographic QA 64 37 10.43 9.96 10.28 3.82 0.478 4.43 20.03 7.19 13.41
Route Instructions 63 38 10.22 9.30 10.03 4.03 0.508 4.03 20.46 7.00 12.42Sports 67 34 9.36 8.64 9.27 3.32 0.406 3.77 17.27 6.80 11.80
Radio Hard 101 0 4.42 3.85 4.29 1.84 0.183 1.43 11.44 3.08 5.15CD Track7 80 21 4.61 4.17 4.50 1.79 0.201 1.81 11.05 3.17 5.78
Route Tracing 0 101 * * * * * * * * *Delta 0 101 * * * * * * * * *
Book-on-Tape Summary 100 1 5.81 5.53 5.69 1.69 0.169 3.11 12.05 4.53 6.88Destination Entry 0 101 * * * * * * * * *
Read Easy 0 101 * * * * * * * * *Read Hard 0 101 * * * * * * * * *Map Easy 0 101 * * * * * * * * *Map Hard 0 101 * * * * * * * * *
Speed Difference for Road Data
Table Q-23. Descriptive Statistics for Response Time for Lead Vehicle Deceleration Detections During Road Testing

Appendix Q Summary Statistics
Q-23
TaskName N N* Mean Median TrMean StDev SE Mean Minimum Maximum Q1 Q3Coins 56 45 5.11 4.74 4.94 2.55 0.341 0.03 14.10 3.40 6.32
Cassette 60 41 5.00 5.13 4.92 2.47 0.319 0.00 16.23 3.73 6.23HVAC 54 47 5.58 5.12 5.28 2.84 0.387 0.43 17.13 3.86 6.76
Radio Easy 53 48 4.99 4.77 4.95 2.20 0.302 0.00 10.93 3.37 6.48Manual Dial 65 36 6.07 5.60 5.56 4.63 0.574 0.85 35.70 3.45 7.42
Travel Computation 83 18 5.58 4.25 4.86 5.35 0.587 0.48 44.90 3.27 6.27Route Orientation 85 16 5.48 4.95 5.19 3.03 0.329 1.30 18.93 3.48 6.76
Voice Dial 65 36 4.93 4.73 4.75 2.36 0.293 0.00 14.73 3.65 5.95Book-on-Tape Listen 81 20 5.62 4.87 5.17 3.98 0.442 0.57 24.03 3.07 6.58
Just Drive 80 21 4.50 4.03 4.28 2.55 0.285 0.90 17.33 2.68 5.32Biographic QA 79 22 4.81 4.48 4.58 2.61 0.294 0.00 16.40 3.10 5.57
Route Instructions 74 27 5.25 4.88 5.12 2.19 0.255 1.27 13.75 3.76 6.41Sports 77 24 5.23 4.87 5.07 2.58 0.294 0.00 14.10 3.67 6.30
Radio Hard 64 37 5.72 5.48 5.49 3.13 0.391 0.00 18.43 3.56 7.02CD Track7 41 60 4.84 4.47 4.59 2.48 0.388 0.63 15.67 3.30 5.73
Route Tracing 0 101 * * * * * * * * *Delta 0 101 * * * * * * * * *
Book-on-Tape Summary 0 101 * * * * * * * * *Destination Entry 0 101 * * * * * * * * *
Read Easy 0 101 * * * * * * * * *Read Hard 0 101 * * * * * * * * *Map Easy 0 101 * * * * * * * * *Map Hard 0 101 * * * * * * * * *
Lead Vehicle Deceleration Detection Response Time for Road Data
Table Q-24. Descriptive Statistics for CHMSL Detection Response Time During Road Testing

Appendix Q Summary Statistics
Q-24
TaskName N N* Mean Median TrMean StDev SE Mean Minimum Maximum Q1 Q3Coins 71 30 2.27 2.20 2.21 0.90 0.107 0.43 7.62 1.83 2.48
Cassette 86 15 2.36 2.23 2.32 0.73 0.079 1.23 4.53 1.83 2.70HVAC 62 39 2.50 2.30 2.33 1.43 0.182 1.00 12.57 1.87 2.63
Radio Easy 76 25 2.29 2.18 2.20 0.84 0.097 1.32 7.63 1.80 2.58Manual Dial 75 26 2.34 2.13 2.30 0.76 0.088 0.80 4.70 1.83 2.77
Travel Computation 90 11 2.16 2.00 2.06 0.92 0.097 1.03 9.08 1.78 2.34Route Orientation 89 12 2.26 2.00 2.02 2.09 0.221 1.10 21.07 1.68 2.24
Voice Dial 71 30 2.33 2.10 2.19 1.19 0.141 1.40 11.30 1.87 2.50Book-on-Tape Listen 91 10 2.29 1.98 2.01 2.30 0.241 1.20 23.33 1.70 2.23
Just Drive 92 9 2.05 1.92 1.99 0.67 0.070 1.10 5.83 1.63 2.26Biographic QA 89 12 2.04 1.95 1.98 0.54 0.057 1.20 4.60 1.73 2.23
Route Instructions 90 11 2.06 1.93 1.99 0.67 0.070 1.12 6.07 1.70 2.26Sports 87 14 1.97 1.87 1.93 0.54 0.057 1.03 4.48 1.63 2.17
Radio Hard 73 28 2.29 2.13 2.15 1.21 0.141 1.18 11.50 1.73 2.50CD Track7 65 36 2.26 2.13 2.20 0.69 0.085 1.23 4.97 1.78 2.57
Route Tracing 0 101 * * * * * * * * *Delta 0 101 * * * * * * * * *
Book-on-Tape Summary 82 19 2.22 1.93 2.01 1.47 0.163 0.30 13.53 1.67 2.23Destination Entry 0 101 * * * * * * * * *
Read Easy 0 101 * * * * * * * * *Read Hard 0 101 * * * * * * * * *Map Easy 0 101 * * * * * * * * *Map Hard 0 101 * * * * * * * * *
CHMSL Detection Response Time for Road Data
Table Q-25. Descriptive Statistics for CHMSL Percent Missed Detections During Road Testing

Appendix Q Summary Statistics
Q-25
TaskName N N* Mean Median TrMean StDev SE Mean Minimum Maximum Q1 Q3Coins 92 9 35.33 0 33.54 40.96 4.27 0 100 0 50
Cassette 96 5 21.35 0 18.02 33.83 3.45 0 100 0 50HVAC 93 8 41.94 0.5 40.96 45.02 4.67 0 100 0 100
Radio Easy 96 5 32.81 0 30.81 40.28 4.11 0 100 0 50Manual Dial 93 8 31.18 0 28.92 39.64 4.11 0 100 0 50
Travel Computation 98 3 17.35 0 13.64 31.38 3.17 0 100 0 50Route Orientation 98 3 16.84 0 13.07 32.06 3.24 0 100 0 12.5
Voice Dial 82 19 23.78 0 20.95 36.2 4 0 100 0 50Book-on-Tape Listen 97 4 14.95 0 10.92 29.02 2.95 0 100 0 0
Just Drive 96 5 9.38 0 5.23 24.4 2.49 0 100 0 0Biographic QA 93 8 15.05 0 11.45 27.37 2.84 0 100 0 50
Route Instructions 94 7 12.23 0 8.33 26.12 2.69 0 100 0 0Sports 92 9 14.13 0 9.76 28.06 2.93 0 100 0 0
Radio Hard 96 5 33.85 0 31.98 41.99 4.29 0 100 0 50CD Track7 76 25 26.32 0 23.53 36.94 4.24 0 100 0 50
Route Tracing 0 101 * * * * * * * * *Delta 0 101 * * * * * * * * *
Book-on-Tape Summary 94 7 18.62 0 14.88 35.15 3.63 0 100 0 12.5Destination Entry 0 101 * * * * * * * * *
Read Easy 0 101 * * * * * * * * *Read Hard 0 101 * * * * * * * * *Map Easy 0 101 * * * * * * * * *Map Hard 0 101 * * * * * * * * *
CHMSL Percent Missed Detections for Road Data
Table Q-26. Descriptive Statistics for FVTS Detection Response Time During Road Testing

Appendix Q Summary Statistics
Q-26
TaskName N N* Mean Median TrMean StDev SE Mean Minimum Maximum Q1 Q3Coins 32 69 3.83 2.42 2.78 57.00 0.876 0.43 23.77 1.76 17.00
Cassette 51 50 2.48 2.30 2.45 5.00 0.141 0.70 4.63 1.70 0.00HVAC 17 84 2.04 1.73 2.00 21.00 0.151 1.30 3.33 1.54 17.00
Radio Easy 37 64 2.37 2.05 2.16 51.00 0.271 0.37 10.97 1.59 67.00Manual Dial 34 67 2.76 2.52 2.55 32.00 0.263 1.13 10.03 1.93 21.00
Travel Computation 48 53 2.59 2.43 2.43 47.00 0.209 1.07 10.83 1.70 58.00Route Orientation 59 42 2.62 2.22 2.36 93.00 0.273 0.33 16.63 1.68 0.00
Voice Dial 43 58 2.51 2.40 2.42 59.00 0.161 0.97 5.83 1.63 0.00Book-on-Tape Listen 68 33 2.81 2.52 2.56 22.00 0.269 1.00 19.13 1.78 92.00
Just Drive 64 37 2.99 2.42 2.52 6.00 0.338 1.13 19.30 1.86 17.00Biographic QA 64 37 2.33 2.26 2.30 49.00 0.106 0.83 4.78 1.80 79.00
Route Instructions 47 54 2.63 2.07 2.24 4.00 0.409 0.97 20.83 1.77 67.00Sports 66 35 2.56 2.33 2.43 12.00 0.149 1.30 9.23 1.76 83.00
Radio Hard 40 61 2.98 2.42 2.47 97.00 0.537 1.10 23.33 1.81 92.00CD Track7 46 55 2.44 2.46 2.42 61.00 0.127 1.30 4.10 1.56 4.00
Route Tracing 0 101 * * * * * * * * *Delta 0 101 * * * * * * * * *
Book-on-Tape Summary 32 69 2.66 2.38 2.60 10.00 0.214 0.07 6.17 1.91 92.00Destination Entry 0 101 * * * * * * * * *
Read Easy 0 101 * * * * * * * * *Read Hard 0 101 * * * * * * * * *Map Easy 0 101 * * * * * * * * *Map Hard 0 101 * * * * * * * * *
FVTS Detection Response Time for Road Data
Table Q-27. Descriptive Statistics for FVTS Percent Missed Detections During Road Testing

Appendix Q Summary Statistics
Q-27
TaskName N N* Mean Median TrMean StDev SE Mean Minimum Maximum Q1 Q3Coins 96 5 78.13 100 81.4 33.88 3.46 0 100 50 100
Cassette 8 56.45 50 57.23 43.75 4.54 0 100 0 100HVAC 17 87.5 100 91.45 26.75 2.92 0 100 100 100
Radio Easy 6 71.05 100 73.53 39.67 4.07 0 100 50 100Manual Dial 14 70.69 100 72.78 40.02 4.29 0 100 50 100
Travel Computation 4 64.43 100 66.09 40.16 4.08 0 100 50 100Route Orientation 2 56.06 50 56.74 41.2 4.14 0 100 0 100
Voice Dial 13 59.66 100 60.63 44.76 4.77 0 100 0 100Book-on-Tape Listen 4 48.97 50 48.85 39.51 4.01 0 100 0 100
Just Drive 11 43.89 50 43.12 41.62 4.39 0 100 0 100Biographic QA 9 47.28 50 46.95 40.85 4.26 0 100 0 100
Route Instructions 8 63.98 50 65.66 39.95 4.14 0 100 50 100Sports 8 43.01 50 42.17 42.09 4.36 0 100 0 100
Radio Hard 7 69.15 100 71.43 39.56 4.08 0 100 50 100CD Track7 24 50 50 50 45.16 5.15 0 100 0 100
Route Tracing 101 * * * * * * * * *Delta 101 * * * * * * * * *
Book-on-Tape Summary 10 74.73 100 77.78 37.55 3.94 0 100 50 100Destination Entry 101 * * * * * * * * *
Read Easy 101 * * * * * * * * *Read Hard 101 * * * * * * * * *Map Easy 101 * * * * * * * * *Map Hard 101 * * * * * * * * *
FVTS Percent Missed Detections for Road Data
Table Q-28. Descriptive Statistics for Average Single Glance Duration to the Roadway During Road Testing

Appendix Q Summary Statistics
Q-28
TaskName N N* Mean Median TrMean StDev SE Mean Minimum Maximum Q1 Q3Coins 18 83 1.57 1.54 1.51 0.60 0.149 0.83 3.32 1.07 1.80
Cassette 18 83 1.73 1.76 1.70 0.50 0.128 0.80 3.02 1.18 2.00HVAC 17 84 0.95 0.75 0.87 0.50 0.127 0.45 2.56 0.62 1.20
Radio Easy 18 83 0.71 0.66 0.70 0.20 0.049 0.36 1.25 0.57 0.81Manual Dial 18 83 0.93 0.91 0.94 0.21 0.051 0.48 1.25 0.79 1.14
Travel Computation 18 83 5.79 4.64 5.38 3.80 0.901 1.09 17.18 3.42 6.50Route Orientation 17 84 6.85 4.35 6.02 6.00 1.520 1.78 24.34 3.30 8.00
Voice Dial 17 84 2.80 2.66 2.74 1.30 0.324 1.11 5.41 1.67 3.30Book-on-Tape Listen 16 85 6.62 4.17 5.38 6.00 1.700 1.21 29.25 3.65 5.00
Just Drive 18 83 3.60 2.93 3.40 2.20 0.521 1.40 9.07 2.50 3.40Biographic QA 16 85 4.30 3.72 3.91 2.70 0.676 1.22 12.78 2.94 4.40
Route Instructions 14 87 7.71 5.04 6.17 7.00 2.080 1.09 32.80 3.83 9.00Sports 15 86 4.20 3.84 4.14 1.70 0.456 1.42 7.72 2.72 5.30
Radio Hard 18 83 0.76 0.70 0.72 0.24 0.058 0.52 1.58 0.57 0.84CD Track7 10 91 1.04 1.03 1.03 0.24 0.078 0.69 1.41 0.80 1.26
Route Tracing 0 101 * * * * * * *Delta 0 101 * * * * * * *
Book-on-Tape Summary 15 86 5.91 5.90 5.84 2.80 0.744 1.96 10.78 3.08 8.40Destination Entry 0 101 * * * * * * *
Read Easy 0 101 * * * * * * *Read Hard 0 101 * * * * * * *Map Easy 0 101 * * * * * * *Map Hard 0 101 * * * * * * *
Average Single Eye-Glance Duration to the Road for Road Data
Table Q-29. Descriptive Statistics for Average Number of Glances Per Second to the Roadway During Road Testing

Appendix Q Summary Statistics
Q-29
TaskName N N* Mean Median TrMean StDev SE Mean Minimum Maximum Q1 Q3Coins 18 83 0.47 0.45 0.47 0.10 0.024 0.27 0.65 0.41 0.55
Cassette 18 83 0.44 0.42 0.43 0.10 0.024 0.27 0.65 0.37 0.53HVAC 17 84 0.58 0.59 0.58 0.15 0.037 0.30 0.80 0.44 0.71
Radio Easy 18 83 0.63 0.66 0.64 0.11 0.026 0.41 0.75 0.56 0.73Manual Dial 18 83 0.55 0.55 0.55 0.07 0.016 0.43 0.65 0.50 0.61
Travel Computation 18 83 0.21 0.20 0.20 0.11 0.026 0.06 0.58 0.15 0.27Route Orientation 17 84 0.21 0.21 0.20 0.10 0.023 0.05 0.45 0.15 0.26
Voice Dial 17 84 0.34 0.29 0.33 0.13 0.033 0.18 0.62 0.25 0.43Book-on-Tape Listen 16 85 0.22 0.22 0.21 0.11 0.027 0.04 0.55 0.18 0.24
Just Drive 18 83 0.29 0.28 0.28 0.10 0.023 0.11 0.50 0.25 0.32Biographic QA 16 85 0.25 0.23 0.24 0.12 0.029 0.09 0.56 0.20 0.28
Route Instructions 14 87 0.19 0.18 0.17 0.13 0.035 0.04 0.59 0.11 0.22Sports 15 86 0.24 0.22 0.23 0.10 0.027 0.15 0.51 0.16 0.29
Radio Hard 18 83 0.59 0.62 0.60 0.11 0.025 0.37 0.73 0.53 0.68CD Track7 10 91 0.53 0.51 0.53 0.05 0.016 0.47 0.61 0.49 0.58
Route Tracing 0 101 * * * * * * * * *Delta 0 101 * * * * * * * * *
Book-on-Tape Summary 15 86 0.21 0.18 0.20 0.10 0.025 0.11 0.43 0.13 0.28Destination Entry 0 101 * * * * * * * * *
Read Easy 0 101 * * * * * * * * *Read Hard 0 101 * * * * * * * * *Map Easy 0 101 * * * * * * * * *Map Hard 0 101 * * * * * * * * *
Average Number of Eye-Glances Per Second to the Road for Road Data
Table Q-30. Descriptive Statistics for Average Number of Glances to the Task During Road Testing

Appendix Q Summary Statistics
Q-30
TaskName N N* Mean Median TrMean StDev SE Mean Minimum Maximum Q1 Q3Coins 18 83 7.65 6.00 7.29 3.49 0.823 4.00 17.00 5.69 8.08
Cassette 18 83 4.75 4.00 4.57 1.77 0.417 3.00 9.33 3.50 5.63HVAC 17 84 5.35 5.00 5.30 2.05 0.496 2.50 9.00 3.58 7.00
Radio Easy 18 83 5.62 5.13 5.32 2.71 0.639 3.00 13.00 3.38 7.13Manual Dial 18 83 13.39 14.20 13.29 4.31 1.020 6.33 22.00 10.43 15.88
Travel Computation 2 99 1.00 1.00 1.00 0.00 0.000 1.00 1.00 * *Route Orientation 1 100 2.00 2.00 2.00 * * 2.00 2.00 * *
Voice Dial 17 84 8.88 7.00 8.23 5.03 1.220 5.00 22.50 6.00 9.83Book-on-Tape Listen 0 101 * * * * * * * * *
Just Drive 0 101 * * * * * * * * *Biographic QA 0 101 * * * * * * * * *
Route Instructions 1 100 1.00 1.00 1.00 * * 1.00 1.00 * *Sports 0 101 * * * * * * * * *
Radio Hard 18 83 8.90 8.63 8.85 3.32 0.782 3.50 15.20 6.31 11.04CD Track7 10 91 6.42 6.00 6.06 1.86 0.588 4.67 11.00 4.94 7.13
Route Tracing 0 101 * * * * * * * * *Delta 0 101 * * * * * * * * *
Book-on-Tape Summary 0 101 * * * * * * * * *Destination Entry 0 101 * * * * * * * * *
Read Easy 0 101 * * * * * * * * *Read Hard 0 101 * * * * * * * * *Map Easy 0 101 * * * * * * * * *Map Hard 0 101 * * * * * * * * *
Average Number of Eye-Glances to the Task for Road Data
Table Q-31. Descriptive Statistics for Average Duration of Glances to the Task During Road Testing

Appendix Q Summary Statistics
Q-31
TaskName N N* Mean Median TrMean StDev SE Mean Minimum Maximum Q1 Q3Coins 18 83 6.04 5.10 5.61 3.09 0.729 3.20 15.80 3.98 7.10
Cassette 18 83 3.92 3.44 3.80 1.69 0.397 1.79 7.94 2.90 4.52HVAC 17 84 5.57 5.13 5.52 2.39 0.580 2.83 9.03 3.16 7.71
Radio Easy 18 83 5.98 5.51 5.85 2.61 0.614 2.57 11.49 3.87 7.44Manual Dial 18 83 12.46 11.62 12.23 4.08 0.962 7.21 21.44 9.24 15.83
Travel Computation 2 99 0.64 0.64 0.64 0.32 0.225 0.42 0.87 * *Route Orientation 1 100 1.20 1.20 1.20 * * 1.20 1.20 * *
Voice Dial 17 84 7.26 6.03 6.88 3.49 0.846 3.67 16.55 4.75 8.38Book-on-Tape Listen 0 101 * * * * * * * * *
Just Drive 0 101 * * * * * * * * *Biographic QA 0 101 * * * * * * * * *
Route Instructions 1 100 0.40 0.40 0.40 * * 0.40 0.40 * *Sports 0 101 * * * * * * * * *
Radio Hard 18 83 9.40 9.89 9.39 3.18 0.749 3.87 15.08 6.72 11.48CD Track7 10 91 6.70 6.58 6.36 2.22 0.701 4.15 11.98 5.02 7.37
Route Tracing 0 101 * * * * * * * * *Delta 0 101 * * * * * * * * *
Book-on-Tape Summary 0 101 * * * * * * * * *Destination Entry 0 101 * * * * * * * * *
Read Easy 0 101 * * * * * * * * *Read Hard 0 101 * * * * * * * * *Map Easy 0 101 * * * * * * * * *Map Hard 0 101 * * * * * * * * *
Average Duration of Eye-Glances to the Task for Road Data
Table Q-32. Descriptive Statistics for Average Single Glance Duration Task Related During Road Testing

Appendix Q Summary Statistics
Q-32
TaskName N N* Mean Median TrMean StDev SE Mean Minimum Maximum Q1 Q3Coins 18 83 0.80 0.78 0.78 0.19 0.044 0.53 1.35 0.67 0.89
Cassette 18 83 0.82 0.81 0.82 0.14 0.033 0.55 1.12 0.76 0.86HVAC 17 84 1.09 0.96 1.03 0.44 0.106 0.63 2.45 0.80 1.24
Radio Easy 18 83 1.13 0.99 1.09 0.39 0.092 0.77 2.19 0.89 1.20Manual Dial 18 83 0.96 0.94 0.95 0.22 0.052 0.66 1.45 0.77 1.08
Travel Computation 2 99 0.64 0.64 0.64 0.32 0.225 0.42 0.87 * *Route Orientation 1 100 0.60 0.60 0.60 * * 0.60 0.60 * *
Voice Dial 17 84 0.85 0.79 0.83 0.20 0.048 0.59 1.37 0.70 0.97Book-on-Tape Listen 0 101 * * * * * * * * *
Just Drive 0 101 * * * * * * * * *Biographic QA 0 101 * * * * * * * * *
Route Instructions 1 100 0.40 0.40 0.40 * * 0.40 0.40 * *Sports 0 101 * * * * * * * * *
Radio Hard 18 83 1.10 1.03 1.06 0.31 0.074 0.70 2.06 0.92 1.14CD Track7 10 91 1.04 1.02 1.04 0.13 0.040 0.86 1.22 0.92 1.17
Route Tracing 0 101 * * * * * * * * *Delta 0 101 * * * * * * * * *
Book-on-Tape Summary 0 101 * * * * * * * * *Destination Entry 0 101 * * * * * * * * *
Read Easy 0 101 * * * * * * * * *Read Hard 0 101 * * * * * * * * *Map Easy 0 101 * * * * * * * * *Map Hard 0 101 * * * * * * * * *
Average Single Eye-Glance Duration Task Related for Road Data
Table Q-33. Descriptive Statistics for Average Number of Glances Per Second Task Related During Road Testing

Appendix Q Summary Statistics
Q-33
TaskName N N* Mean Median TrMean StDev SE Mean Minimum Maximum Q1 Q3Coins 18 83 0.38 0.38 0.38 0.10 0.024 0.21 0.59 0.32 0.43
Cassette 18 83 0.30 0.30 0.30 0.07 0.016 0.17 0.46 0.25 0.33HVAC 17 84 0.46 0.49 0.47 0.14 0.034 0.14 0.64 0.34 0.59
Radio Easy 18 83 0.49 0.49 0.49 0.10 0.023 0.31 0.63 0.42 0.57Manual Dial 18 83 0.47 0.49 0.47 0.07 0.016 0.35 0.60 0.40 0.52
Travel Computation 2 99 0.01 0.01 0.01 0.00 0.000 0.01 0.01 * *Route Orientation 1 100 0.02 0.02 0.02 * * 0.02 0.02 * *
Voice Dial 17 84 0.18 0.16 0.17 0.07 0.017 0.06 0.32 0.13 0.23Book-on-Tape Listen 0 101 * * * * * * * * *
Just Drive 0 101 * * * * * * * * *Biographic QA 0 101 * * * * * * * * *
Route Instructions 1 100 0.01 0092771 0.01 * * 0.01 0.01 * *Sports 0 101 * * * * * * * * *
Radio Hard 18 83 0.50 0.50 0.50 0.09 0.022 0.29 0.62 0.45 0.57CD Track7 10 91 0.36 0.35 0.35 0.05 0.017 0.29 0.45 0.31 0.40
Route Tracing 0 101 * * * * * * * * *Delta 0 101 * * * * * * * * *
Book-on-Tape Summary 0 101 * * * * * * * * *Destination Entry 0 101 * * * * * * * * *
Read Easy 0 101 * * * * * * * * *Read Hard 0 101 * * * * * * * * *Map Easy 0 101 * * * * * * * * *Map Hard 0 101 * * * * * * * * *
Average Number of Eye-Glances Per Second Task Related for Road Data

Appendix Q Summary Statistics
Q-34
Descriptive statistics for track metrics are presented below.
Table Q-34. Descriptive Statistics for Task Duration During Track Testing
TaskName N N* Mean Median TrMean StDev SE Mean Minimum Maximum Q1 Q3Coins 62 2 17.57 15.83 16.82 7.89 1.000 6.40 49.90 12.05 20.71
Cassette 62 2 15.92 14.96 15.56 4.78 0.607 9.24 31.72 12.28 18.22HVAC 64 0 11.44 11.11 11.32 3.15 0.394 5.47 23.53 9.07 13.48
Radio Easy 61 3 11.43 9.97 10.85 5.80 0.743 4.57 31.98 7.20 13.50Manual Dial 59 5 24.43 22.02 23.98 6.91 0.900 13.53 45.50 19.37 29.65
Travel Computation 64 0 108.34 108.45 108.32 1.43 0.180 104.65 112.60 107.29 109.14Route Orientation 63 1 121.66 124.90 122.53 10.12 1.280 81.20 141.38 122.00 126.80
Voice Dial 61 3 46.88 43.44 45.97 12.48 1.600 31.57 82.36 37.47 54.17Book-on-Tape Listen 62 2 117.84 118.48 118.28 4.96 0.630 96.50 124.92 116.01 120.44
Just Drive 64 0 113.55 113.57 113.53 2.48 0.310 102.40 126.84 113.37 113.74Biographic QA 62 2 126.43 125.83 125.92 3.51 0.450 123.57 152.40 125.66 126.05
Route Instructions 62 2 106.11 106.59 106.46 3.68 0.470 81.95 113.87 105.56 107.58Sports 62 2 108.62 108.50 108.96 4.66 0.590 86.07 116.95 107.07 111.68
Radio Hard 63 1 16.70 15.18 16.19 6.59 0.830 7.47 43.57 11.75 20.30CD Track7 61 3 18.37 17.00 17.87 4.99 0.639 12.28 43.60 15.45 20.45
Route Tracing 62 2 26.93 25.91 26.80 8.85 1.120 11.53 43.60 19.28 35.25Delta 49 15 131.92 127.50 130.80 23.09 3.300 90.47 197.91 116.42 141.38
Book-on-Tape Summary 61 3 37.37 34.71 36.58 15.77 2.020 12.33 84.50 25.80 48.06Destination Entry 54 10 104.49 93.73 100.08 42.80 5.820 54.36 238.70 74.53 131.36
Read Easy 63 1 21.27 19.51 20.85 6.75 0.850 10.50 44.48 16.99 24.66Read Hard 61 3 30.85 28.20 30.36 10.16 1.300 13.48 67.62 23.66 37.86Map Easy 64 0 17.36 15.56 16.92 5.64 0.705 10.13 33.84 13.37 20.22Map Hard 63 1 25.20 22.28 24.06 10.51 1.320 14.07 60.52 17.80 28.90
Task Duration for Track Data
Table Q-35. Descriptive Statistics for Standard Deviation of Lane Position During Track Testing

Appendix Q Summary Statistics
Q-35
TaskName N N* Mean Median TrMean StDev SE Mean Minimum Maximum Q1 Q3Coins 59 5 0.65 0.63 0.63 0.28 0.036 0.17 1.47 0.46 0.76
Cassette 58 6 0.61 0.58 0.59 0.23 0.030 0.25 1.30 0.42 0.71HVAC 62 2 0.55 0.49 0.53 0.23 0.030 0.28 1.67 0.38 0.66
Radio Easy 60 4 0.52 0.50 0.51 0.21 0.027 0.13 1.10 0.37 0.65Manual Dial 55 9 0.68 0.63 0.66 0.22 0.029 0.38 1.45 0.56 0.78
Travel Computation 60 4 0.71 0.70 0.69 0.21 0.027 0.33 1.57 0.54 0.81Route Orientation 58 6 0.71 0.71 0.69 0.20 0.027 0.36 1.61 0.57 0.80
Voice Dial 55 9 0.64 0.60 0.62 0.22 0.030 0.31 1.58 0.50 0.71Book-on-Tape Listen 56 8 0.73 0.70 0.72 0.21 0.028 0.35 1.31 0.57 0.86
Just Drive 59 5 0.73 0.72 0.72 0.17 0.022 0.37 1.32 0.60 0.84Biographic QA 58 6 0.72 0.68 0.71 0.18 0.024 0.43 1.31 0.58 0.84
Route Instructions 57 7 0.68 0.65 0.67 0.20 0.027 0.36 1.29 0.52 0.80Sports 58 6 0.70 0.68 0.69 0.20 0.026 0.39 1.28 0.54 0.84
Radio Hard 61 3 0.59 0.57 0.58 0.19 0.024 0.26 1.17 0.43 0.68CD Track7 57 7 0.63 0.59 0.62 0.19 0.026 0.34 1.26 0.49 0.74
Route Tracing 59 5 0.82 0.77 0.81 0.27 0.035 0.27 1.44 0.64 0.97Delta 45 19 0.74 0.74 0.73 0.21 0.031 0.43 1.23 0.61 0.83
Book-on-Tape Summary 58 6 0.51 0.50 0.51 0.13 0.017 0.30 0.90 0.42 0.58Destination Entry 49 15 0.84 0.79 0.83 0.21 0.031 0.56 1.51 0.64 0.99
Read Easy 61 3 0.62 0.64 0.61 0.17 0.021 0.30 1.09 0.49 0.71Read Hard 57 7 0.64 0.62 0.64 0.17 0.023 0.17 1.36 0.53 0.73Map Easy 61 3 0.65 0.61 0.63 0.21 0.027 0.33 1.26 0.49 0.74Map Hard 61 3 0.74 0.68 0.71 0.27 0.034 0.26 2.02 0.58 0.84
Standard Deviation of Lane Position for Track Data
Table Q-36. Descriptive Statistics for Speed Difference During Track Testing

Appendix Q Summary Statistics
Q-36
TaskName N N* Mean Median TrMean StDev SE Mean Minimum Maximum Q1 Q3Coins 55 9 4.52 3.91 4.24 2.58 0.348 1.15 14.83 2.67 5.81
Cassette 56 8 4.34 4.30 4.29 1.55 0.207 1.45 8.01 3.39 5.32HVAC 62 2 3.84 3.40 3.72 1.89 0.240 1.19 9.36 2.66 4.41
Radio Easy 57 7 3.73 3.08 3.59 2.00 0.265 0.23 10.14 2.18 5.05Manual Dial 56 8 5.67 5.27 5.48 2.31 0.308 2.49 15.13 4.01 6.74
Travel Computation 55 9 6.90 6.51 6.74 1.85 0.250 4.58 13.44 5.60 7.84Route Orientation 54 10 7.28 7.18 7.16 1.85 0.252 3.99 14.08 6.03 8.22
Voice Dial 51 13 6.82 6.52 6.73 2.23 0.313 3.00 13.28 5.48 7.83Book-on-Tape Listen 58 6 7.19 6.43 6.97 2.51 0.330 3.53 16.49 5.70 7.94
Just Drive 59 5 6.74 6.33 6.66 1.69 0.220 3.17 12.09 5.48 7.84Biographic QA 54 10 7.21 6.66 7.04 1.90 0.258 4.75 14.59 5.88 8.26
Route Instructions 56 8 7.26 6.96 7.12 1.83 0.244 4.45 12.85 5.86 7.98Sports 56 8 6.95 6.61 6.67 2.27 0.303 3.73 17.03 5.49 7.94
Radio Hard 60 4 4.34 3.90 4.19 2.18 0.282 0.51 11.86 2.97 5.28CD Track7 55 9 4.79 4.41 4.73 1.81 0.244 1.37 10.28 3.60 5.92
Route Tracing 57 7 6.14 5.50 6.02 2.82 0.373 1.71 13.08 4.03 8.69Delta 39 25 6.74 6.53 6.63 1.47 0.236 4.30 11.39 5.68 7.56
Book-on-Tape Summary 54 10 5.27 5.02 5.21 1.73 0.236 1.82 10.69 3.96 6.39Destination Entry 40 24 8.47 8.17 8.27 2.76 0.436 5.05 15.51 6.10 9.33
Read Easy 61 3 5.13 4.75 5.04 2.03 0.259 1.29 10.15 3.55 6.45Read Hard 56 8 5.73 5.33 5.59 1.89 0.252 2.36 12.34 4.82 6.50Map Easy 56 8 4.53 4.57 4.49 1.57 0.210 1.18 8.47 3.37 5.45Map Hard 57 7 5.63 5.38 5.63 1.90 0.252 0.57 9.61 4.26 6.69
Speed Difference for Track Data
Table Q-37. Descriptive Statistics for Response Time for Lead Vehicle Deceleration Detections During Track Testing

Appendix Q Summary Statistics
Q-37
TaskName N N* Mean Median TrMean StDev SE Mean Minimum Maximum Q1 Q3Coins 24 40 5.94 5.32 5.53 59.00 0.604 3.63 17.20 4.02 92.00
Cassette 35 29 4.63 4.57 4.61 57.00 0.331 0.00 9.20 3.33 0.00HVAC 17 47 6.24 5.87 6.23 24.00 0.491 2.80 9.83 4.82 75.00
Radio Easy 16 48 5.93 6.03 5.91 17.00 0.579 2.30 9.90 4.11 50.00Manual Dial 39 25 5.94 5.87 5.78 26.00 0.372 2.03 12.73 4.10 67.00
Travel Computation 46 18 5.60 5.37 5.50 72.00 0.291 2.63 10.43 4.16 25.00Route Orientation 43 21 5.32 4.93 5.20 96.00 0.335 1.33 12.52 3.77 83.00
Voice Dial 36 28 5.85 5.21 5.60 61.00 0.410 2.47 14.83 4.19 50.00Book-on-Tape Listen 44 20 5.84 5.35 5.73 71.00 0.373 2.17 12.13 4.08 0.00
Just Drive 46 18 5.26 5.37 5.21 19.00 0.253 1.47 10.20 4.20 75.00Biographic QA 42 22 5.41 5.18 5.29 41.00 0.330 2.13 11.43 3.80 42.00
Route Instructions 38 26 5.79 5.33 5.45 35.00 0.509 1.33 21.37 4.11 50.00Sports 45 19 5.97 5.17 5.61 49.00 0.484 2.90 22.23 4.23 33.00
Radio Hard 34 30 5.42 5.30 5.37 0.00 0.343 0.50 10.37 4.00 42.00CD Track7 32 32 5.49 5.43 5.45 36.00 0.342 1.80 10.40 4.21 42.00
Route Tracing 37 27 6.67 6.25 6.57 86.00 0.474 0.50 15.57 4.65 0.00Delta 25 39 4.73 4.28 4.66 11.00 0.442 0.90 10.10 3.12 34.00
Book-on-Tape Summary 39 25 4.42 4.30 4.40 86.00 0.302 0.30 8.38 2.83 67.00Destination Entry 25 39 6.62 5.87 6.56 23.00 0.545 2.30 12.53 4.39 25.00
Read Easy 31 33 5.78 5.50 5.73 84.00 0.410 2.17 10.53 3.50 67.00Read Hard 40 24 5.76 5.38 5.65 5.00 0.317 2.37 11.77 4.30 8.00Map Easy 35 29 5.46 5.03 5.33 88.00 0.522 0.00 13.37 3.80 33.00Map Hard 29 35 6.83 7.13 6.80 29.00 0.507 1.50 12.90 4.73 17.00
Lead Vehicle Deceleration Detection Response Time for Track Data
Table Q-38. Descriptive Statistics for CHMSL Detection Response Time During Track Testing

Appendix Q Summary Statistics
Q-38
TaskName N N* Mean Median TrMean StDev SE Mean Minimum Maximum Q1 Q3Coins 45 19 2.39 2.30 2.36 0.78 0.116 1.03 4.33 1.73 2.94
Cassette 44 20 2.30 2.21 2.25 0.75 0.113 1.10 4.73 1.78 2.73HVAC 45 19 2.69 2.57 2.51 1.29 0.193 0.87 8.33 1.87 2.98
Radio Easy 41 23 2.38 2.30 2.36 0.74 0.115 1.27 4.10 1.77 2.95Manual Dial 43 21 2.30 2.20 2.29 0.65 0.099 1.17 3.53 1.80 2.87
Travel Computation 57 7 2.19 2.03 2.07 0.86 0.114 1.38 6.53 1.68 2.35Route Orientation 52 12 2.13 1.90 2.01 0.85 0.118 1.22 6.20 1.65 2.41
Voice Dial 43 21 2.42 2.35 2.39 0.68 0.104 1.00 4.73 2.00 2.80Book-on-Tape Listen 53 11 2.16 2.10 2.11 0.63 0.087 1.00 4.08 1.68 2.45
Just Drive 58 6 2.08 1.88 2.04 0.61 0.080 1.13 3.97 1.63 2.45Biographic QA 48 16 1.97 1.94 1.96 0.45 0.065 1.23 3.23 1.62 2.30
Route Instructions 53 11 2.05 1.95 2.01 0.51 0.070 1.30 3.53 1.71 2.28Sports 51 13 2.25 1.92 1.97 1.89 0.264 1.23 14.93 1.67 2.20
Radio Hard 44 20 2.77 2.15 2.37 2.59 0.390 1.03 18.00 1.73 2.95CD Track7 50 14 2.19 2.10 2.17 0.54 0.077 1.10 3.77 1.90 2.54
Route Tracing 44 20 2.96 2.47 2.60 2.57 0.387 1.27 18.87 2.03 3.15Delta 38 26 2.30 2.24 2.27 0.60 0.097 1.37 3.70 1.83 2.55
Book-on-Tape Summary 50 14 2.07 1.96 2.01 0.64 0.090 1.03 5.13 1.70 2.24Destination Entry 40 24 2.72 2.47 2.65 0.91 0.144 1.52 5.20 1.98 3.18
Read Easy 45 19 2.19 2.12 2.16 0.60 0.089 1.13 3.70 1.76 2.53Read Hard 50 14 2.26 2.22 2.22 0.72 0.102 1.10 3.98 1.56 2.67Map Easy 42 22 2.24 2.30 2.20 0.66 0.101 1.23 4.30 1.72 2.68Map Hard 48 16 2.61 2.53 2.58 0.84 0.121 1.40 5.10 1.85 3.14
CHMSL Detection Response Time for Track Data
Table Q-39. Descriptive Statistics for CHMSL Percent Missed Detections During Track Testing

Appendix Q Summary Statistics
Q-39
TaskName N N* Mean Median TrMean StDev SE Mean Minimum Maximum Q1 Q3Coins 55 9 26.36 0 23.47 39.5 5.33 0 100 0 50
Cassette 57 7 27.19 0 24.51 42.33 5.61 0 100 0 50HVAC 59 5 34.75 0 33.02 41.79 5.44 0 100 0 50
Radio easy 54 10 33.33 0 31.25 42.34 5.76 0 100 0 62.5Manual Dial 53 11 30.19 0 27.66 39.64 5.44 0 100 0 50
Travel Computation 60 4 12.5 0 8.33 27.04 3.49 0 100 0 0Route Orientation 58 6 16.38 0 12.5 32.96 4.33 0 100 0 0
Voice Dial 53 11 22.64 0 19.15 39.91 5.48 0 100 0 50Book-on-Tape Listen 58 6 11.21 0 6.73 29.68 3.9 0 100 0 0
Just Drive 61 3 10.66 0 6.36 26 3.33 0 100 0 0Biographic Q&A 57 7 20.18 0 16.67 37.63 4.98 0 100 0 25
Route Instructions 57 7 9.65 0 4.9 27.45 3.64 0 100 0 0Sports 54 10 8.33 0 3.13 25.23 3.43 0 100 0 0
Radio Hard 60 4 34.17 0 32.41 43.66 5.64 0 100 0 100CD Track7 57 7 15.79 0 11.76 34.28 4.54 0 100 0 0
Route Tracing 59 5 33.05 0 31.13 43.16 5.62 0 100 0 100Delta 42 22 9.52 0 5.26 29.71 4.58 0 100 0 0
Book-on-Tape Summary 58 6 19.83 0 16.35 36.2 4.75 0 100 0 50Destination Entry 51 13 27.45 0 24.44 41.61 5.83 0 100 0 50
Read Easy 58 6 30.17 0 27.88 41.82 5.49 0 100 0 50Read Hard 56 8 18.75 0 15 33.79 4.52 0 100 0 50Map Easy 54 10 33.33 0 31.25 41.21 5.61 0 100 0 50Map Hard 59 5 32.2 0 30.19 39.13 5.09 0 100 0 50
CHMSL Percent Missed Detections for Track Data
Table Q-40. Descriptive Statistics for FVTS Detection Response Time During Track Testing

Appendix Q Summary Statistics
Q-40
TaskName N N* Mean Median TrMean StDev SE Mean Minimum Maximum Q1 Q3Coins 16 48 2.78 2.47 2.50 1.77 0.442 0.97 8.57 1.62 3.21
Cassette 20 44 2.34 2.37 2.31 0.69 0.154 1.17 3.90 1.77 2.83HVAC 6 58 2.04 1.89 2.04 0.70 0.287 1.33 3.03 1.42 2.72
Radio Easy 19 45 2.14 1.92 2.11 1.01 0.232 0.90 3.90 1.20 3.10Manual Dial 19 45 2.67 2.33 2.51 1.36 0.312 1.13 6.97 1.73 3.22
Travel Computation 24 40 3.03 2.58 2.55 2.78 0.568 1.15 15.37 1.58 3.48Route Orientation 26 38 2.44 2.18 2.37 0.90 0.177 1.33 5.30 1.93 2.60
Voice Dial 20 44 2.97 3.13 2.97 0.93 0.208 1.52 4.27 1.95 3.82Book-on-Tape Listen 31 33 2.77 2.53 2.70 1.13 0.202 0.90 6.67 2.03 3.60
Just Drive 41 23 2.66 2.67 2.63 1.01 0.158 0.90 4.70 1.72 3.31Biographic QA 29 35 2.39 2.27 2.38 0.88 0.163 1.13 3.87 1.63 3.35
Route Instructions 25 39 2.54 2.37 2.52 0.89 0.178 1.32 4.30 1.75 3.33Sports 24 40 2.47 2.35 2.47 0.93 0.190 1.17 3.85 1.52 3.43
Radio Hard 18 46 2.42 2.20 2.37 0.91 0.214 1.33 4.23 1.67 3.18CD Track7 18 46 2.43 2.30 2.32 1.15 0.271 1.00 5.63 1.49 2.96
Route Tracing 20 44 3.22 2.72 2.84 2.46 0.551 0.98 12.37 1.79 3.68Delta 10 54 2.47 2.28 2.39 1.02 0.322 1.17 4.33 1.62 3.32
Book-on-Tape Summary 20 44 2.19 1.93 2.12 0.89 0.198 1.00 4.73 1.60 2.72Destination Entry 15 49 2.41 2.30 2.39 0.77 0.200 1.23 3.93 1.77 3.17
Read Easy 22 42 1.92 1.92 1.87 0.69 0.147 1.03 3.67 1.23 2.37Read Hard 19 45 2.26 1.97 2.24 0.93 0.213 1.07 3.90 1.53 3.13Map Easy 20 44 1.83 1.70 1.84 0.78 0.175 0.03 3.53 1.35 2.32Map Hard 14 50 2.13 1.97 2.07 0.99 0.264 1.00 3.90 1.18 2.88
FVTS Detection Response Time for Track Data
Table Q-41. Descriptive Statistics for FVTS Percent Missed Detections During Track Testing

Appendix Q Summary Statistics
Q-41
Task Name N N* Mean Median TrMean StDev SE Mean Minimum Maximum Q1 Q3Coins 58 6 79.31 100 82.69 36.32 4.77 0 100 50 100
Cassette 53 11 69.81 100 72.34 41.99 5.77 0 100 50 100HVAC 61 3 90.98 100 95.45 28.15 3.6 0 100 100 100
Radio easy 58 6 76.72 100 79.81 36.53 4.8 0 100 50 100Manual Dial 53 11 71.7 100 74.47 41.03 5.64 0 100 50 100
Travel Computation 60 4 69.17 100 71.3 41.26 5.33 0 100 50 100Route Orientation 62 2 66.13 100 67.86 43.21 5.49 0 100 0 100
Voice Dial 47 17 61.7 100 62.79 46.87 6.84 0 100 0 100Book-on-Tape Listen 59 5 57.63 50 58.49 44.35 5.77 0 100 0 100
Just Drive 60 4 48.33 50 48.15 41.14 5.31 0 100 0 100Biographic Q&A 56 8 54.46 50 55 46.98 6.28 0 100 0 100
Route Instructions 55 9 67.27 100 69.39 39.93 5.38 0 100 50 100Sports 59 5 64.41 100 66.04 45.53 5.93 0 100 0 100
Radio Hard 61 3 77.87 100 80.91 37.11 4.75 0 100 50 100CD Track7 55 9 75.45 100 78.57 38.34 5.17 0 100 50 100
Route Tracing 53 11 70.75 100 73.4 40.94 5.62 0 100 50 100Delta 39 25 78.21 100 81.43 39.39 6.31 0 100 50 100
Book-on-Tape Summary 56 8 73.21 100 76 39.27 5.25 0 100 50 100Destination Entry 51 13 78.43 100 82.22 36.41 5.1 0 100 50 100
Read Easy 57 7 71.05 100 73.53 40.03 5.3 0 100 50 100Read Hard 55 9 73.64 100 76.53 39.5 5.33 0 100 50 100Map Easy 60 4 74.17 100 76.85 39.59 5.11 0 100 50 100Map Hard 57 7 82.46 100 86.27 33.4 4.42 0 100 75 100
FVTS Percent Missed Detections for Track Data
Table Q-42. Descriptive Statistics for Average Single Glance Duration to the Roadway During Track Testing

Appendix Q Summary Statistics
Q-42
TaskName N N* Mean Median TrMean StDev SE Mean Minimum Maximum Q1 Q3Coins 17 47 1.39 1.39 1.37 0.55 0.133 0.52 2.45 0.93 1.69
Cassette 17 47 1.53 1.19 1.47 0.87 0.211 0.61 3.30 0.83 2.07HVAC 18 46 0.76 0.67 0.74 0.31 0.072 0.41 1.44 0.54 0.93
Radio Easy 16 48 0.71 0.73 0.71 0.20 0.050 0.34 1.07 0.59 0.84Manual Dial 17 47 0.82 0.78 0.80 0.23 0.056 0.50 1.41 0.64 0.95
Travel Computation 18 46 9.29 4.21 8.23 9.60 2.260 0.92 34.66 3.26 14.98Route Orientation 17 47 9.99 3.97 9.15 9.39 2.280 0.87 31.64 3.25 15.56
Voice Dial 16 48 3.11 2.83 3.09 1.47 0.368 0.78 5.70 2.11 4.16Book-on-Tape Listen 17 47 14.61 4.10 9.90 27.29 6.620 1.06 98.89 2.80 10.51
Just Drive 18 46 7.38 3.21 4.67 12.82 3.020 0.72 57.37 2.52 7.40Biographic QA 17 47 11.58 3.66 9.25 14.61 3.540 0.81 57.38 2.46 19.23
Route Instructions 17 47 16.31 4.76 13.75 19.65 4.770 0.98 69.98 3.25 27.31Sports 16 48 14.07 4.41 10.78 19.69 4.920 0.93 73.31 2.81 16.85
Radio Hard 17 47 0.66 0.65 0.65 0.18 0.044 0.36 1.01 0.51 0.80CD Track7 16 48 0.86 0.79 0.85 0.29 0.073 0.38 1.34 0.60 1.16
Route Tracing 17 47 0.92 1.05 0.93 0.32 0.078 0.40 1.41 0.60 1.16Delta 10 54 4.94 3.72 4.30 3.35 1.060 1.78 13.17 2.71 6.26
Book-on-Tape Summary 17 47 9.88 7.69 9.18 8.43 2.040 1.23 29.06 2.68 14.49Destination Entry 14 50 0.63 0.59 0.62 0.18 0.049 0.36 0.97 0.49 0.78
Read Easy 17 47 0.77 0.79 0.74 0.32 0.078 0.31 1.67 0.53 0.87Read Hard 15 49 0.76 0.68 0.75 0.27 0.070 0.37 1.34 0.54 0.94Map Easy 18 46 0.90 0.77 0.87 0.34 0.080 0.54 1.85 0.66 1.10Map Hard 17 47 0.88 0.84 0.84 0.39 0.096 0.40 2.02 0.59 1.11
Average Single Eye-Glance Duration to the Track for Track Data
Table Q-43. Descriptive Statistics for Average Number of Glances Per Second to the Roadway During Track Testing

Appendix Q Summary Statistics
Q-43
TaskName N N* Mean Median TrMean StDev SE Mean Minimum Maximum Q1 Q3Coins 17 47 0.50 0.50 0.49 0.14 0.035 0.34 0.78 0.36 0.58
Cassette 17 47 0.51 0.49 0.50 0.16 0.039 0.25 0.78 0.37 0.64HVAC 18 46 0.60 0.61 0.59 0.14 0.033 0.37 0.87 0.48 0.73
Radio Easy 16 48 0.58 0.56 0.57 0.12 0.030 0.44 0.89 0.49 0.62Manual Dial 17 47 0.60 0.62 0.60 0.12 0.029 0.43 0.81 0.49 0.70
Travel Computation 18 46 0.22 0.22 0.20 0.15 0.035 0.05 0.69 0.08 0.27Route Orientation 17 47 0.21 0.23 0.18 0.16 0.040 0.03 0.71 0.09 0.27
Voice Dial 16 48 0.32 0.28 0.30 0.15 0.038 0.15 0.73 0.22 0.36Book-on-Tape Listen 17 47 0.23 0.25 0.22 0.16 0.038 0.02 0.65 0.10 0.31
Just Drive 18 46 0.27 0.27 0.26 0.17 0.041 0.02 0.78 0.15 0.34Biographic QA 17 47 0.24 0.25 0.22 0.19 0.045 0.03 0.77 0.07 0.34
Route Instructions 17 47 0.20 0.20 0.18 0.17 0.042 0.02 0.68 0.05 0.28Sports 16 48 0.21 0.21 0.19 0.17 0.043 0.02 0.70 0.07 0.30
Radio Hard 17 47 0.62 0.64 0.62 0.13 0.032 0.40 0.85 0.50 0.71CD Track7 16 48 0.58 0.57 0.58 0.15 0.037 0.37 0.94 0.47 0.66
Route Tracing 17 47 0.52 0.50 0.51 0.11 0.026 0.38 0.74 0.41 0.60Delta 10 54 0.24 0.24 0.23 0.11 0.035 0.07 0.44 0.15 0.30
Book-on-Tape Summary 17 47 0.22 0.17 0.20 0.19 0.045 0.04 0.67 0.08 0.32Destination Entry 14 50 0.56 0.56 0.56 0.09 0.025 0.38 0.73 0.51 0.62
Read Easy 17 47 0.55 0.54 0.55 0.15 0.037 0.27 0.83 0.44 0.67Read Hard 15 49 0.51 0.55 0.52 0.15 0.038 0.21 0.71 0.42 0.62Map Easy 18 46 0.50 0.51 0.51 0.15 0.036 0.16 0.71 0.40 0.64Map Hard 17 47 0.47 0.48 0.48 0.15 0.036 0.16 0.70 0.36 0.58
Average Number of Eye-Glances Per Second to the Track for Track Data
Table Q-44. Descriptive Statistics for Average Number of Glances to the Task During Track Testing

Appendix Q Summary Statistics
Q-44
TaskName N N* Mean Median TrMean StDev SE Mean Minimum Maximum Q1 Q3Coins 17 47 7.30 6.60 6.75 3.62 0.879 3.75 19.00 5.08 8.00
Cassette 17 47 5.68 5.00 5.53 2.02 0.489 3.50 10.00 4.20 6.25HVAC 18 46 5.61 4.90 5.61 1.64 0.386 3.25 8.00 4.36 7.53
Radio Easy 16 48 4.62 4.68 4.60 1.85 0.463 2.00 7.50 2.64 6.09Manual Dial 17 47 11.34 10.50 11.31 2.88 0.698 6.20 17.00 9.75 13.25
Travel Computation 3 61 2.17 1.50 2.17 1.61 0.928 1.00 4.00 1.00 4.00Route Orientation 0 64 * * * * * * * * *
Voice Dial 16 48 6.99 6.40 6.61 3.14 0.785 3.40 16.00 4.63 8.85Book-on-Tape Listen 0 64 * * * * * * * * *
Just Drive 0 64 * * * * * * * * *Biographic QA 2 62 1.00 1.00 1.00 0.00 0.000 1.00 1.00 * *
Route Instructions 2 62 1.00 1.00 1.00 0.00 0.000 1.00 1.00 * *Sports 0 64 * * * * * * * * *
Radio Hard 17 47 7.73 7.00 7.28 2.67 0.647 5.17 17.00 6.37 8.15CD Track7 16 48 9.10 9.15 8.99 2.47 0.616 5.80 14.00 6.88 10.75
Route Tracing 17 47 11.44 11.00 11.39 3.10 0.753 5.60 18.00 9.00 14.25Delta 10 54 7.21 6.50 7.01 2.75 0.870 4.00 12.00 5.38 8.75
Book-on-Tape Summary 1 63 1.00 1.00 1.00 * * 1.00 1.00 * *Destination Entry 14 50 50.31 45.60 49.56 15.13 4.040 32.40 77.33 38.27 62.03
Read Easy 17 47 10.05 8.80 9.96 4.75 1.150 3.00 18.33 6.63 13.40Read Hard 15 49 13.74 13.20 13.38 6.25 1.610 4.00 28.20 8.67 18.60Map Easy 18 46 6.66 6.10 6.56 3.00 0.707 2.00 13.00 4.94 9.21Map Hard 17 47 10.72 9.33 10.44 5.45 1.320 1.60 24.00 8.00 13.50
Average Number of Eye-Glances to the Task for Track Data
Table Q-45. Descriptive Statistics for Average Duration of Glances to the Task During Track Testing

Appendix Q Summary Statistics
Q-45
TaskName N N* Mean Median TrMean StDev SE Mean Minimum Maximum Q1 Q3Coins 17 47 6.72 5.64 6.00 4.46 1.080 3.23 20.90 3.89 8.16
Cassette 17 47 4.71 4.43 4.63 1.71 0.414 2.44 8.30 3.49 5.28HVAC 18 46 6.25 6.14 6.13 1.99 0.470 3.25 11.13 4.93 7.27
Radio Easy 16 48 5.71 6.20 5.64 2.23 0.557 2.16 10.28 3.68 7.27Manual Dial 17 47 10.96 10.32 10.70 3.80 0.922 6.46 19.42 7.84 13.66
Travel Computation 3 61 1.56 0.68 1.56 1.65 0.954 0.53 3.47 0.53 3.47Route Orientation 0 64 * * * * * * * * *
Voice Dial 16 48 6.25 6.01 5.75 3.35 0.837 2.83 16.70 3.67 7.31Book-on-Tape Listen 0 64 * * * * * * * * *
Just Drive 0 64 * * * * * * * * *Biographic QA 2 62 0.38 0.38 0.38 0.17 0.117 0.27 0.50 * *
Route Instructions 2 62 0.50 0.50 0.50 0.00000 0 0.000 0.50 0.50 * *Sports 0 64 * * * * * * * * *
Radio Hard 17 47 8.96 7.78 8.59 4.14 1.000 4.72 18.70 5.98 13.14CD Track7 16 48 9.76 9.49 8.90 5.81 1.450 3.77 27.80 5.73 11.77
Route Tracing 17 47 12.90 12.58 12.93 2.83 0.687 7.68 17.65 10.54 15.30Delta 10 54 6.29 5.54 5.67 2.62 0.830 4.38 13.17 4.64 7.15
Book-on-Tape Summary 1 63 0.70 0.70 0.70 * * 0.70 0.70 * *Destination Entry 14 50 57.59 56.85 56.53 17.98 4.800 33.54 94.40 42.30 69.26
Read Easy 17 47 10.72 10.20 10.52 5.44 1.320 2.49 21.96 6.53 15.11Read Hard 15 49 15.28 15.30 14.78 7.88 2.040 3.11 33.83 10.28 22.59Map Easy 18 46 6.59 7.02 6.58 3.16 0.744 1.37 11.99 3.93 9.06Map Hard 17 47 12.66 11.47 12.22 7.35 1.780 0.87 31.09 8.68 15.35
Average Duration of Eye-Glances to the Task for Track Data
Table Q-46. Descriptive Statistics for Average Single Glance Duration Task Related During Track Testing

Appendix Q Summary Statistics
Q-46
TaskName N N* Mean Median TrMean StDev SE Mean Minimum Maximum Q1 Q3Coins 17 47 0.90 0.88 0.88 0.25 0.061 0.52 1.52 0.72 1.09
Cassette 17 47 0.85 0.85 0.85 0.13 0.031 0.64 1.06 0.73 0.96HVAC 18 46 1.15 1.10 1.14 0.28 0.065 0.76 1.71 0.90 1.37
Radio Easy 16 48 1.28 1.28 1.28 0.30 0.075 0.84 1.82 1.02 1.53Manual Dial 17 47 0.97 0.92 0.96 0.22 0.053 0.69 1.44 0.80 1.13
Travel Computation 3 61 0.61 0.53 0.61 0.23 0.133 0.43 0.87 0.43 0.87Route Orientation 0 64 * * * * * * * * *
Voice Dial 16 48 0.89 0.91 0.89 0.14 0.035 0.66 1.10 0.77 1.03Book-on-Tape Listen 0 64 * * * * * * * * *
Just Drive 0 64 * * * * * * * * *Biographic QA 2 62 0.38 0.38 0.38 0.17 0.117 0.27 0.50 * *
Route Instructions 2 62 0.50 0.50 0.50 0.00000 0 0.000 0.50 0.50 * *Sports 0 64 * * * * * * * * *
Radio Hard 17 47 1.16 1.05 1.13 0.41 0.099 0.77 2.01 0.85 1.37CD Track7 16 48 1.03 0.93 0.99 0.36 0.091 0.54 1.99 0.82 1.21
Route Tracing 17 47 1.19 1.20 1.18 0.26 0.064 0.74 1.91 1.03 1.31Delta 10 54 0.90 0.90 0.90 0.18 0.058 0.58 1.17 0.75 1.03
Book-on-Tape Summary 1 63 0.70 0.70 0.70 * * 0.70 0.70 * *Destination Entry 14 50 1.15 1.10 1.12 0.25 0.067 0.87 1.80 0.99 1.31
Read Easy 17 47 1.03 0.99 1.02 0.18 0.044 0.75 1.45 0.92 1.21Read Hard 15 49 1.04 1.05 1.03 0.22 0.057 0.70 1.50 0.94 1.20Map Easy 18 46 0.96 0.94 0.95 0.22 0.051 0.68 1.48 0.78 1.14Map Hard 17 47 1.10 1.08 1.11 0.28 0.069 0.47 1.63 0.94 1.29
Average Single Eye-Glance Duration Task Related for Track Data
Table Q-47. Descriptive Statistics for Average Number of Glances Per Second Task Related During Track Testing

Appendix Q Summary Statistics
Q-47
TaskName N N* Mean Median TrMean StDev SE Mean Minimum Maximum Q1 Q3Coins 17 47 0.39 0.38 0.39 0.09 0.022 0.29 0.58 0.32 0.43
Cassette 17 47 0.35 0.36 0.34 0.10 0.023 0.18 0.58 0.27 0.40HVAC 18 46 0.49 0.50 0.49 0.13 0.030 0.27 0.76 0.41 0.57
Radio Easy 16 48 0.42 0.40 0.41 0.09 0.022 0.26 0.64 0.38 0.46Manual Dial 17 47 0.48 0.49 0.48 0.07 0.018 0.33 0.64 0.43 0.52
Travel Computation 3 61 0.02 0.01 0.02 0.01485 0 0.009 0.01 0.04 0.01 0.04Route Orientation 0 64 * * * * * * * * *
Voice Dial 16 48 0.15 0.16 0.15 0.05 0.014 0.09 0.27 0.11 0.20Book-on-Tape Listen 0 64 * * * * * * * * *
Just Drive 0 64 * * * * * * * * *Biographic QA 2 62 0.01 0.01 0.01 0.00000 0 0.000 0.01 0.01 * *
Route Instructions 2 62 0.01 0.01 0.01 0.00021 0 0.000 0.01 0.01 * *Sports 0 64 * * * * * * * * *
Radio Hard 17 47 0.49 0.49 0.49 0.11 0.027 0.33 0.67 0.38 0.58CD Track7 16 48 0.46 0.45 0.46 0.09 0.023 0.32 0.59 0.37 0.55
Route Tracing 17 47 0.43 0.43 0.43 0.09 0.022 0.29 0.60 0.36 0.49Delta 10 54 0.05 0.05 0.05 0.01613 0 0.005 0.02 0.08 0.04 0.06
Book-on-Tape Summary 1 63 0.02 0.02 0.02 * * 0.02 0.02 * *Destination Entry 14 50 0.53 0.54 0.53 0.09 0.024 0.38 0.69 0.47 0.59
Read Easy 17 47 0.44 0.48 0.44 0.14 0.033 0.17 0.65 0.33 0.52Read Hard 15 49 0.43 0.40 0.43 0.14 0.036 0.18 0.65 0.37 0.56Map Easy 18 46 0.38 0.41 0.39 0.12 0.029 0.12 0.60 0.32 0.46Map Hard 17 47 0.39 0.41 0.40 0.13 0.031 0.12 0.56 0.33 0.48
Average Number of Eye-Glances Per Second Task Related for Track Data

R-1
R Appendix R. Sternberg Surrogate
R.1 Sternberg – Verbal and Spatial R.1.1 Task Effects The Sternberg methodology (Sternberg, 1966) was developed to study human short-term memory. This methodology was adapted and applied as a laboratory surrogate method for the DWM project, as a way to identify tasks that not only imposed visual workload, but also imposed workload on short-term or working memory. The concept behind it was to provide a surrogate test that was somewhat like a peripheral detection task, but had a memory-loading component included as a means of evaluating combined visual and cognitive loads of in-vehicle tasks.
In the traditional Sternberg laboratory technique, each research participant is given a “memory set” of items to remember, and is asked to commit the items to memory. Typically, the size of the memory set varies from one to seven. In the traditional Sternberg method, these items are often numerals such as in the set (2, 4, 7). After the research participants memorizes the set, they view a series of items, presented one-at-a-time on a screen. When an item appears, the participant must determine whether it was in the memorized set of items and respond accordingly (yes or no), usually by pushing a button labeled with the corresponding response.
In the DWM project adaptation of this methodology, several unique changes that we made:
• The nature of the items in the memory set were one of two types:
o The Verbal Stimuli memory set consisted of highway route number signs. The signs were classified as verbal because they contained symbols that are processed like verbal material and were expected to load in the participant’s “verbal” working memory. This set of stimulus materials was intended to have some relevance to the driving task and was designed to resemble highway markers like those drivers might have to remember when taking a specific route on a trip. Figure R-1 depicts a set of the verbal stimuli. It was hypothesized that performance on the Sternberg task with verbal stimuli might degrade more when in-vehicle tasks were concurrently performed that also required verbal working memory (i.e., Book-on-Tape Summary).
o The Spatial Stimuli memory set consisted of highway junction signs. These signs were classified as spatial because their spatial configuration had to be memorized and were hypothesized to load in the participant’s “spatial” working memory. This set of stimulus materials was intended to have some relevance to the driving task and was designed to resemble intersections where a driver might need to remember specific turns such as those made on a route or trip. Figure R-1 also depicts an illustrative set of these Spatial Stimuli. It was also hypothesized that performance on the Sternberg task with spatial stimuli may degrade more when in-vehicle tasks were concurrently performed that also required spatial working memory (i.e., map tasks or route instructions).

Appendix R Sternberg Surrogate
R-2
• There were always three items (signs) in the memory set and its size did not vary. These three items were randomly selected from a pool of eight items. In any given memory set, only verbal or only spatial items appeared. Stimulus types were not mixed within a memory set, however, stimulus types were alternated between trials. For example, on one trial a verbal-memory set would be presented, followed by a spatial-memory set. This pattern would be repeated until the desired number of trials had been conducted.
• The response buttons the participant used to respond to the stimuli were on the steering wheel in the test buck. The participant could access these buttons using his/her thumbs.
• Participants were asked to perform the Sternberg task at the same time that they were doing an in-vehicle task of interest in the study (e.g., tuning the radio, manually dialing the phone, etc.). This was implemented as follows: participants viewed and memorized the memory set prior to hearing the instruction to begin an in-vehicle task. Once the participant indicated that the memory set had been committed to memory, the in-vehicle task trial began along with the Sternberg memory probes.
o Note: This may be the first such application of the Sternberg methodology. Traditionally, it is used as a stand-alone task to which all of a participant’s attention is directed.
• The Sternberg memory probes consisted of single items presented randomly every 2 to 10 sec during task performance. These probes were randomly selected from the same pool of eight items that produced the memory sets. Participants were to respond Yes by pushing the Yes button on the steering wheel whenever the probe was part of the memory set they memorized, and No by pushing the No button on the steering wheel whenever the probe was not part of the memory set they had memorized. Figure R-2 shows a sample memory set with a positive probe. Figure R-3 shows the same sample memory set with a negative probe for the spatial stimulus type.

Appendix R Sternberg Surrogate
R-3
•
Verbal
Stimuli
Spatial
Stimuli
Verbal
Stimuli
Spatial
Stimuli
Figure R-1. Sample Set of Sternberg Stimuli
•
Sample Memory Set
Positive Probe
Response: “Yes”
Sample Memory Set
Positive Probe
Response: “Yes”
Figure R-2. Sample Memory Set and Positive Probe for the Spatial Stimulus Type

Appendix R Sternberg Surrogate
R-4
•
Sample Memory Set
Negative Probe
Response: “No”
Sample Memory Set
Negative Probe
Response: “No”
Figure R-3. Sample Memory Set and Negative Probe for the Spatial Stimulus Type
A key concept behind this application of the Sternberg methodology relates to the fact that it was administered while a second (in-vehicle) task was being done. The idea was that performance on the Sternberg task might suffer and reflect conflicts introduced by the in-vehicle task on demands for driver resources. However, the participants were not given strict instructions on how to allocate attention between the two tasks (Sternberg and in-vehicle task). Participants were not instructed on how to allocate resources between the tasks because it seemed more natural to allow them to decide for themselves how to allocate attention between driving-like demands (e.g., the Sternberg road and intersection marking signs) and in-vehicle tasks demands, since this is what drivers do on the road and is the subject of study in this experiment. To have instructed participants on how to allocate resources to one or the other set of task demands, would have altered the very processes being studied and assessed using the surrogate method. However, it is essential to understand that because there was not a common instructional set on which task (Sternberg or in-vehicle task) was to receive the most attention, interpretation of the results becomes much more complex. It may be that it is not performance on the Sternberg task that degrades or reflects conflicts, but performance on the in-vehicle task (dialing the phone, tuning the radio, etc.) or both. So the metrics required careful analysis and interpretation.
Prior to formal analyses, the data were pre-processed to identify and count missing cases, and to examine Task Status codes. These codes reflected the extent to which performance of the in-vehicle tasks (done while Sternberg was also being performed) was successful. (As a reminder, in-

Appendix R Sternberg Surrogate
R-5
vehicle tasks included radio tuning, destination entry, manual dial, etc.) The coding scheme was simple, and an in-vehicle task performance was coded:
• F if its completion was fully successful,
• P if its completion was partially successful, or
• N if it was not successfully completed.
Additional codes were used to designate data associated with E (experimenter error), B (balk), and HW/SW (hardware/software) errors.
In the analysis of task status codes, an interesting finding emerged. The distribution of P and N coded outcomes was not uniform across tasks. Normally, these are expected to be distributed without systematic variation across tasks, if due to random error. Figure R-4 shows the distribution of P and N trials for in-vehicle tasks done during the Sternberg test.
•
Distribution Of Partially Successful and Unsuccessful Trials For 'In-Vehicle' Tasks Done During Sternberg Test
050
100150200250
Just
Sternb
ergHVAC
Radio
Easy
Radio
HardCD Trac
k 7Cas
sette
Coins
Manua
l Dial
Dest E
ntry
Read E
asy
Read H
ardMap
Easy
Map H
ardRou
te Trac
ingVoic
e Dial
Delta F
lightl
ineSpo
rtsBOT Li
sten
BOT Summ
Bio Q & A
Route
Instru
cRou
te Orie
ntTrav
el Com
p
Tasks
Cou
nt O
f Tria
ls W
ith
Giv
en O
utco
me
Partially Successful
Not Successful
Figure R-4. Distribution of Partially Successful and Unsuccessful Trials for In-Vehicle Tasks During Sternberg Test
Figure R-5 shows the distribution of Fully Successful Trials for in-vehicle tasks done during the Sternberg test. It is interesting to not that the very large variation by task in both figures is not what would have been expected on the basis of single task performance (that is, had only the in-vehicle task been performed). Although it certainly makes sense that the longer tasks, consisting of multiple subparts, would produce more partially successful outcomes, the magnitude of differences, the distribution of Not Successful varying by task in a way that appears to suggest something about the task itself (its difficulty or its loading) when done in combination with the Sternberg task, and the variation by task in the Fully Successful distribution, all suggest that something more is going on here. One possibility is that when the Sternberg test and the in-vehicle tasks are performed concurrently, there is sometimes degradation of both tasks (perhaps when resource conflicts arise). This suggests that at least one metric be developed to examine combined decrements to both tasks in the formal analyses to be performed.

Appendix R Sternberg Surrogate
R-6
•
Distribution Of Fully Successful Trials For 'In-Vehicle' Tasks Done During Sternberg Test
0100200300400500
Just
Sternb
ergHVAC
Radio
Easy
Radio
HardCD Trac
k 7Cas
sette
Coins
Manua
l Dial
Des
t Entr
yRea
d Eas
yRea
d Hard
Map E
asy
Map H
ard
Route
Tracing
Voice D
ial
Delta F
lightl
ineSpo
rtsBOT Li
sten
BOT Sum
mBio
Q & A
Route
Instru
cRou
te Orie
ntTrav
el Com
p
TasksC
ount
Of T
rials
(Ful
ly
Succ
essf
ul)
Fully Successful
Figure R-5. Distribution of Fully Successful Trials for In-Vehicle Tasks Done During Sternberg Test
Several categories of metrics were prepared for analysis. Most of them examined performance on the Sternberg task itself. These were:
• Proportion Missed Detections
o A missed detection occurred when a participant did not see or detect a Sternberg probe when one was presented (or at least did not respond to it in any way).
o Proportion Missed = # Probes not detected / # Presented
• Proportion Errors, Given a Detection
o An error occurred in responding to a Sternberg probe, even though the probe was detected and responded to. In other words, a probe was seen but responded to incorrectly.
o Proportion Errors, Given a Detection = (1 - #Correct) / #Probes Detected
• Proportion Error Overall
o This measure included both trial outcomes (above), missed detections, and incorrect responses to Sternberg probes.
o Proportion Error Overall = (# Probes Not Detected + # Incorrect) / #Presented
• Response Times. Time to respond to the probe was measured for three categories of outcome:
o For Correct Responses (Correct RT)

Appendix R Sternberg Surrogate
R-7
o For Incorrect Responses (Incorrect RT)
o For All Responses (Overall RT)
Additional metrics were developed to examine the performance on BOTH the Sternberg and in-vehicle task combined. These were exploratory in nature:
• Combined Dual Task Performance Decrement Score Version 1
[Combined Decrement Score = (Proportion Missed Detections on Sternberg Task) + (Proportion Decrement on In-Vehicle Task Performance)]
To provide a value for the proportion decrement on the in-vehicle task, the Task Status codes were assigned decrement values, as follows:
F = 0.00 (Fully successful outcomes received no decrement) P = 0.50 (Partially successful tasks received 0.50 decrement) N = 1.00 (Not successful tasks received 1.00 decrement)
• Combined Dual Task Performance Decrement Score Version 2. Same as above, but it is based only on fully successful and partially successful tasks. Data from not successful tasks were excluded for consistency with analyses on all other data sets, which also excluded data from not successful trials.
The data (on all metrics, with the exception of the two exploratory metrics) were analyzed using Linear Mixed Models (Verbeke and Molenberghs, 1997). This relatively new maximum-likelihood technique is ideally suited for an unbalanced design with multiple variance components. Subjects were treated as a random effect and the effects, identified in Table R-1 and Table R-2, were treated as fixed effects in the analysis.
o Note: The exploratory metrics, or combined decrement scores, combine some of the factors that are separately analyzed in the Linear Mixed Model analysis, and thus could not computationally be included in the same Linear Mixed Model analysis as was applied to the other fixed effects. Therefore, the Combined Decrement Score, Version 1, was analyzed separately and its results are summarized in the last column of Table R-2.
Several analytic approaches were tried, including analyzing subsets of the data separately, analyzing just the Sternberg factors (and omitting the individual difference variables age and gender), and analyzing all task status outcomes (versus only the fully and partially successful task outcomes, as was done for all other surrogate and driving measures). Results from two of these approaches are reported below.

Appendix R Sternberg Surrogate
R-8
R.1.1.1 Overall Analysis Including All Factors and All Task Outcomes The analysis that provided the clearest picture of findings was the most comprehensive Linear Mixed Model analysis. It was performed on data that was averaged across the two repetitions of each task and its accompanying Sternberg test performance, but it should be noted that there were significant differences between the repetitions of the Sternberg test that indicated some learning was occurring over the two trials. The average may thus be a reasonable way to view performance that was neither completely naïve nor most practiced of the two trials. The overall analysis reported here was a linear mixed model analysis that included the between-subject factors of Age Group (20s, 30s, 40s, 50s, 60s, 70s), and Gender (male, female). It also included the within-subject factors of Stimulus Type (verbal, spatial), Task (23 levels, including all in-vehicle tasks and “Just Sternberg”), Expected Response (yes-response, no-response), and Task Status of Concurrently Performed In-Vehicle Task (fully, partially, not successful, experimenter error, balk, hardware/software error).
o Note: As was done for all other data analysis in the study, an analysis was also performed on the fully and partially successful trials only, meaning that data associated with in-vehicle tasks that were not successfully completed (as well as data associated with experimenter errors, balks, and hardware/software errors) were removed prior to analysis after having been identified and counted. (See section R.1.1.2.) Its results did differ in some ways from the overall analysis.
The significant effects emerging from the overall linear mixed model analysis are summarized in Table R-1.
Table R-1. Summary of Significant Effects from Linear Mixed Model Analysis on Sternberg Metrics
(Overall Analysis Including All Factors, even Age and Gender, and All Task Status Outcomes)
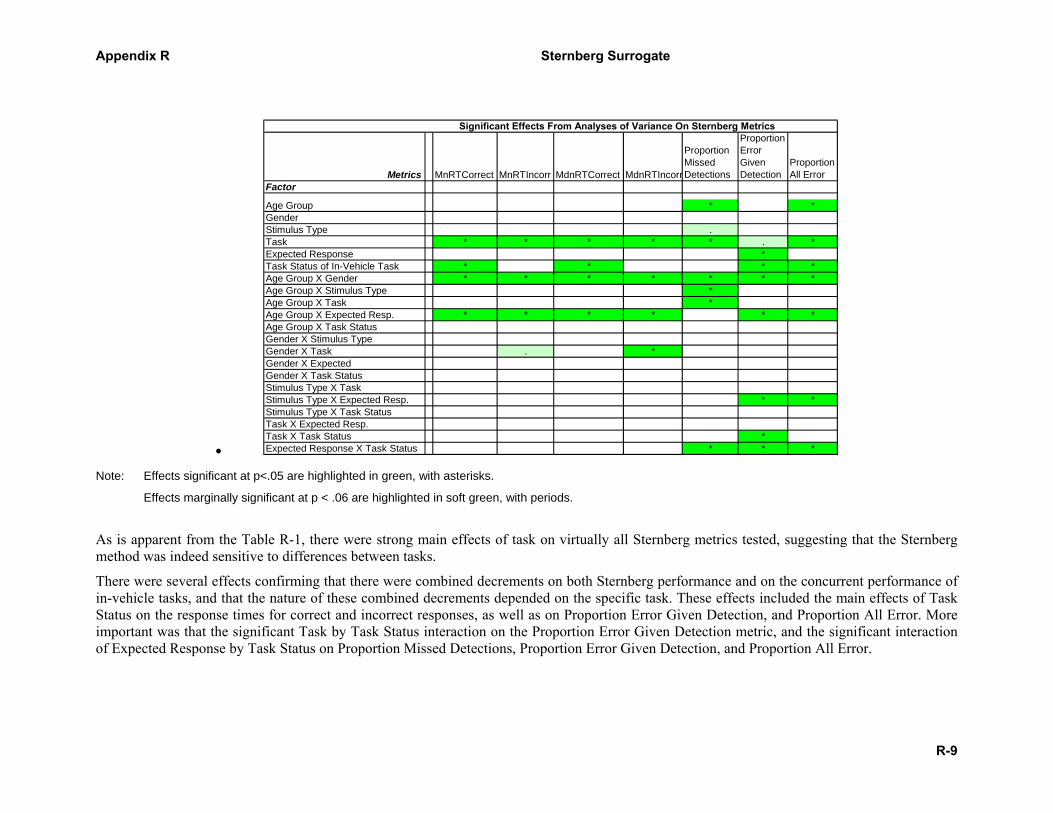
Appendix R Sternberg Surrogate
R-9
•
Significant Effects From Analyses of Variance On Sternberg Metrics
Metrics MnRTCorrect MnRTIncorr MdnRTCorrect MdnRTIncorr
Proportion Missed Detections
Proportion Error Given Detection
Proportion All Error
Factor
Age Group * *GenderStimulus Type .Task * * * * * . *Expected Response *Task Status of In-Vehicle Task * * * *Age Group X Gender * * * * * * *Age Group X Stimulus Type *Age Group X Task *Age Group X Expected Resp. * * * * * *Age Group X Task StatusGender X Stimulus TypeGender X Task . *Gender X ExpectedGender X Task StatusStimulus Type X TaskStimulus Type X Expected Resp. * *Stimulus Type X Task StatusTask X Expected Resp.Task X Task Status *Expected Response X Task Status * * *
Note: Effects significant at p<.05 are highlighted in green, with asterisks.
Effects marginally significant at p < .06 are highlighted in soft green, with periods.
As is apparent from the Table R-1, there were strong main effects of task on virtually all Sternberg metrics tested, suggesting that the Sternberg method was indeed sensitive to differences between tasks.
There were several effects confirming that there were combined decrements on both Sternberg performance and on the concurrent performance of in-vehicle tasks, and that the nature of these combined decrements depended on the specific task. These effects included the main effects of Task Status on the response times for correct and incorrect responses, as well as on Proportion Error Given Detection, and Proportion All Error. More important was that the significant Task by Task Status interaction on the Proportion Error Given Detection metric, and the significant interaction of Expected Response by Task Status on Proportion Missed Detections, Proportion Error Given Detection, and Proportion All Error.

Appendix R Sternberg Surrogate
R-10
The Expected Response by Task Status interaction showed that a higher proportion of Sternberg errors occurred when the in-vehicle task was only partially successfully completed (see Figure R-6). This indicates that resource conflicts were reflected in combined performance decrements due perhaps to resource conflicts (e.g., in the case of Task Status interaction).
•
Expected Response X Task Status Interaction
0
0.05
0.1
0.15
0.2
0.25
F P
Task Status
Mea
n Pr
opor
tion
Erro
rs G
iven
Det
ectio
n
12
Figure R-6. The Significant Interaction of Expected Response by Task Status
o Note: In the legend, “1,” shown by the blue bars, represents “Yes” trials, and “2,” shown by the maroon bars represents “No” trials on the Expected Response factor.
Stimulus Type (verbal versus spatial) had no significant main effect in the analysis of variance, nor did it interact significantly with Task. This was surprising and contrary to our initial hypotheses in which we expected the nature of the stimulus to be affected differentially by the resources demanded by the in-vehicle task based on theories in the literature about working memory resources of two types (verbal and spatial). However,

Appendix R Sternberg Surrogate
R-11
there were no reliable differences between Stimulus Types or the effects that in-vehicle tasks had on Sternberg performance during them. There was a significant interaction of Stimulus Type by Expected Response (yes, no) on Proportion Errors Given Detection and on Proportion All Errors. It showed that a higher proportion of errors were made on spatial stimuli when the expected response was “no.” However, this did not have particular relevance for in-vehicle task effects.
There was no main effect of Expected Response (yes, no). This confirms that, the Sternberg task performance in this study was similar to Sternberg task performance in the literature on human memory. In the literature, a key finding of the Sternberg methodology is that response times (on correct trials) do not differ significantly for yes and no trials. That finding held for these data as well in the overall analysis of response time metrics. However, what is also interesting is that when the variable of Age is included as a factor, as it was in the overall analysis, it becomes clear that there are significant differences between Yes and No trials for certain ages. This interaction of Age Group by Expected Response on the Response Time metrics indicates that something unusual is happening in stimulus encoding, memory search, or response preparation processes—something different than typically happens in the traditional Sternberg human memory paradigm, perhaps due to resource limits or other factors as in the case of interactions with Age Group.
Finally, there were multiple significant effects related to Age Group and Gender, and their interactions with other variables. These included a significant main effect of Age Group on two metrics (Proportion Missed Detections and Proportion All Error), no main effect of Gender, but a significant interaction of Age Group by Gender on all metrics. There was also a Gender by Task interaction for response times associated with incorrect Sternberg responses. But of greatest relevance for Task effects is the Age Group by Task interaction that was significant for Proportion Missed Sternberg Detections.
R.1.1.2 Analysis of Fully and Partially Successful Trials Only An alternative analysis was performed in which only fully successful and partially successful trials were included. This was done to match the analyses done in all other parts of the project. This analysis also eliminated the variables of age and gender. Many of the results remain the same, but a few differences emerged due to the elimination of not successful trials and to the elimination of Age and Gender, which are explained more fully below.
Table R-2. Summary of Significant Effects From Linear Mixed Model Analysis on Sternberg Metrics (Fully and Partially Successful Trials Only)

Appendix R Sternberg Surrogate
R-12
Metric MnRTCorrect MnRTIncorr MdnRTCorrect MdnRTIncorr
Proportion Missed Detections
Proportion Error Given Detection
Proportion All Error
Combined Decrement Score, V1
Factor
Stimulus Type * * * * *Task * * * * * * * *Rep Number * * * * * *Expected Response * * * * * * *Task Status of In-Vehicle Task * * * * NAStimulus Type X Task *Stimulus Type x Rep Number *Stimulus Type X Expected Resp. * * NAStimulus Type X Task Status * *Task X Rep NumberTask X Expected Resp. *Task X Task Status * * * NARep Num X ExpectedRep Num X Task Status * NAExpected Response X Task Status * * NA
Significant Effects From Linear Mixed Model Analyses On Sternberg Metrics (Based On Fully & Partially Successful Trials ONLY)
Stim Type X Task X Rep Num X Expected X Task Status
o Note 1: Effects significant at p<.05 are highlighted in green with asterisks.
o Note 2: NA designates effects that could not be tested for the Combined Decrement Score due to the fact that Task Status Outcomes are incorporated in its computation. The Combined Decrement Score was analyzed separately from all other metrics in the table.
Significant effects from this analysis that were similar to the previous analysis were as follows:
• Task The strong main effect of Task was significant on all metrics tested in this analysis (replicating the effect from the prior analysis, but for all eight measures rather than just six, including the Combined Decrement Score, Version 1).

Appendix R Sternberg Surrogate
R-13
• Task Status There were again significant effects of Task Status in this analysis (even though it included only two task status outcomes, fully, and partially successful), though the details of these effects were different. There was a significant main effect found on the metrics of Mean RT Correct, Median RT Correct, Proportion Missed Detections, and Proportion All Errors. This main effect indicated that response times were longer, missed detections higher, and errors higher for partially successful than fully successful trials. More importantly, there was a significant Task by Task Status interaction on the metrics of Proportion Missed Detections, Proportion Errors Given a Detection, and Proportion All Errors. This interaction indicates that performance effects on both Sternberg and the in-vehicle tasks depended on the nature of the specific task with the combined decrements being larger for just some tasks. Finally, there were significant interactions of Stimulus Type by Task Status for the metrics of Mean RT Correct and Median RT Correct, and also a significant interaction of Rep Number by Task Status for Median RT Correct.
Significant effects from this analysis that were different from the previous analysis were as follows:
• Expected Response In the prior analysis there was not a main effect of expected response (and there should not have been, if the Sternberg results from this project replicated those in the literature). However, when analysis is done on Partially and Fully Successful trials, and when the Age and Gender factors are not explicitly analyzed, the effect of Expected Outcome was significant across all eight metrics. (The Expected factor refers to whether the presented probe on a trial was the same or different from one in the memory set, referring to whether participants’ answers were expected to be yes-or-no on a trial). Generally, in the Sternberg paradigm, Response Times to yes and no trials are similarly fast. However, when only partially and fully successful trials were considered (and age and gender were not), yes and no trials were significantly different in this experiment, with no trials producing significantly longer response times. Based on the prior Sternberg literature, this would typically be interpreted to mean that something different had occurred during stimulus encoding, a memory search, or response preparation processes than typically is observed in traditional Sternberg human memory studies. This was perhaps due to resource limits, or other factors, and was perhaps contributed to by the effects of Age Group, since the prior analysis indicates a significant interaction of Age Group by Expected on six of the Sternberg metrics. It may be concluded that the apparent effect of Expected Response is really attributable to interactions with age that affect task performance (e.g., via changes in working memory function), and is further exacerbated by errors that occur during task performance as shown in the Expected by Task Status interaction that was significant in the prior, Overall, analysis and graphed in Figure R-6.

Appendix R Sternberg Surrogate
R-14
• Repetition Number Not included in the prior analysis, this factor was significant as a main effect in this analysis, and indicated that learning occurred from the first to second occurrence of the Sternberg test for each task on multiple measures (all but those associated with response times on incorrect trials). In particular: (a) Response times for correct trials became faster from the first to second trial; (b) The number of missed detections of Sternberg stimuli decreased from the first to the second trial; and (c) The number of errors decreased from the first to the second trial. As discussed previously, using a mean to represent both trials (as neither the most naïve performance, nor the most practiced) may make sense in future analyses.
• Stimulus Type In this analysis, a significant main effect of Stimulus Type (verbal or spatial) emerged on five of the Sternberg metrics (Mean RT Correct, Median RT Correct, Proportion Missed Detections, Proportion Errors Given Detection, and Proportion All Error), whereas it was not significant in the overall analysis. This indicated that spatial stimuli were more difficult to respond to in the Sternberg task (took longer, more errors). Further, there were a few significant interactions involving Stimulus Type. These included: Stimulus Type by Rep on the metric of Proportion Error Given Detection (showing a larger decrease in errors for spatial stimuli from Rep 1 to Rep 2), Stimulus Type by Expected Response on the metrics of Proportion Error Given Detection, and Proportion All Error (also found in the prior overall analysis, and showing that a higher proportion of errors were made on spatial stimuli when the expected response was no), and a Stimulus Type by Task interaction on the metric of Proportion All Error. This last one has possible relevance to the hypothesized effects of stimulus type on performance. It is graphically depicted in Figure R-7. The interaction was due to a few tasks in which verbal stimuli led to as many or more errors as the spatial stimuli. Tasks on which verbal stimuli led to more errors than spatial stimuli are circled in the figure. These tasks all were ones hypothesized in advance to place a load on verbal working memory, thus providing some empirical support for the notion that the Sternberg test would help identify tasks that differentially load verbal or spatial working memory. Tasks hypothesized to load spatial working memory (e.g., route instructions) produced effects that were in a direction consistent with the hypothesis (spatial stimuli produced more errors) but because the spatial stimuli produced more errors in general, and because the effect was very, very small for Route Instructions, this cannot be cited as persuasive evidence in support of the hypothesis about Sternberg’s usefulness in identifying the nature of tasks’ working memory loads.

Appendix R Sternberg Surrogate
R-15
•
Stimulus Type X Task Interaction
0
0.1
0.2
0.3
0.4
0.5
0.6
0.7
0.8
Coi
ns
Cas
sette
HVA
C
Rad
io E
asy
Man
ual D
ial H
ome
Trav
el C
ompu
tatio
ns
Rou
te O
rient
atio
n
Voic
e D
ial H
ome
BOT
List
en
Biog
raph
ical
Q&A
Rou
te In
stru
ctio
ns
Spor
ts B
road
cast
Rad
io H
ard
CD
Tra
ck 7
Maz
e Tr
acin
g
Del
ta V
oice
dial
BOT
Sum
m
Des
tinat
ion
Entry
Lis
t
Rea
d Te
xt E
asy
Rea
d Te
xt H
ard
Map
Eas
y
Map
Har
d
Just
Tas
k
1.00 2.00 3.00 4.00 5.00 6.00 7.00 8.00 9.0011.0012.0013.0014.0016.0017.0018.0019.0022.0024.0025.0028.0029.0030.00
Task
Percent All Error12
Figure R-7. The Significant Interaction of Stimulus Type by Task
o Note: In the legend, “1,” shown by the blue bars, represents Spatial Stimuli, and “2,” shown by the maroon bars, represents Verbal Stimuli on the Stimulus Type factor. Circles identify tasks for which verbal stimuli led to more errors than spatial stimuli, in contrast to the trend for other tasks.
o
R.1.1.3 Graphical Exploration of Major Sternberg Findings Further exploration of the findings within the Sternberg data is best done graphically, beginning with the main effect of Task. Figure R-8 shows the main effect of task for the Sternberg metric of Proportion Missed Detections. In this chart, the data has been averaged across verbal and spatial stimulus types. Lighter blue bars show the status of the concurrently-performed in-vehicle tasks that were fully successful, and darker maroon bars show Sternberg results for partially successful in-vehicle tasks. The Just task represents doing Just Sternberg by itself (no in-vehicle task concurrently done). As is apparent, there is considerable variation in proportion of missed Sternberg probes across the tasks.

Appendix R Sternberg Surrogate
R-16
•
Proportion Missed Detections (Averaged Across Verbal & Spatial Stimulus Types)
0
0.1
0.2
0.3
0.4
0.5
0.6
0.7
0.8
0.9
Just
Tas
k
HV
AC
Rad
io E
asy
Rad
io H
ard
CD
Tra
ck 7
Cas
sette
Coi
ns
Man
ual D
ial H
ome
Des
tinat
ion
Ent
ry L
ist
Rea
d Te
xt E
asy
Rea
d Te
xt H
ard
Map
Eas
y
Map
Har
d
Maz
e Tr
acin
g
Voi
ce D
ial H
ome
Del
ta V
oice
dial
Spo
rts B
road
cast
BO
T Li
sten
BO
T S
umm
Bio
grap
hica
l Q&
A
Rou
te In
stru
ctio
ns
Rou
te O
rient
atio
n
Trav
el C
ompu
tatio
ns
1 2 3 4 5 6 7 8 9 10 11 12 13 14 15 16 17 18 19 20 21 22 23
Tasks
Mea
n Pr
opor
tion
Mis
sed
Det
ectio
ns
FP
Figure R-8. Proportion Missed Detections (Averaged Across Verbal and Spatial Stimulus Types) for Sternberg Test
Figure R-9 shows performance on the Sternberg test in terms of the metric called Proportion Errors Given Detection. This metric shows responses that participants made to Sternberg probes that were incorrect. Again, bars of different colors represent fully and partially successful outcomes on the concurrently-performed in-vehicle task. Some tasks show a much higher proportion of Sternberg errors than others, and some tasks show very different patterns of fully or partially successful completion, which gives rise to the Task by Task Status interaction that was significant for this metric.

Appendix R Sternberg Surrogate
R-17
•
Mean Proportion Errors Given Detection For Sternberg Test
0
0.05
0.1
0.15
0.2
0.25
0.3
0.35
0.4
0.45
Just
Tas
k
HV
AC
Rad
io E
asy
Rad
io H
ard
CD
Tra
ck 7
Cas
sette
Coi
ns
Man
ual D
ial H
ome
Des
tinat
ion
Ent
ry L
ist
Rea
d Te
xt E
asy
Rea
d Te
xt H
ard
Map
Eas
y
Map
Har
d
Maz
e Tr
acin
g
Voi
ce D
ial H
ome
Del
ta V
oice
dial
Spo
rts B
road
cast
BO
T Li
sten
BO
T S
umm
Bio
grap
hica
l Q&
A
Rou
te In
stru
ctio
ns
Rou
te O
rient
atio
n
Trav
el C
ompu
tatio
ns
1 2 3 4 5 6 7 8 9 10 11 12 13 14 15 16 17 18 19 20 21 22 23
Tasks
Mea
n Pr
opor
tion
Erro
r
FP
Figure R-9. Proportion Errors Given Detection in the Sternberg Task
Proportion Overall Error is depicted in Figure R-10, a measure combining missed detections and errors. Notice that when the Sternberg task is performed alone (Just Task), its Proportion Overall Error is much lower than when it is performed together with an in-vehicle task. And, the extent to which errors occurred on the Sternberg task depended on the particular task with which it was combined. Some tasks produced a higher proportion of overall errors than others.
Response Time for Correct Responses is shown in Figure R-11. The variation between tasks was smaller in magnitude, but still significant.
Response Time for Incorrect Responses is shown in Figure R-12. The variation between tasks was larger in magnitude on this metric.

Appendix R Sternberg Surrogate
R-18
•
Proportion Overall Error on Sternberg
0
0.1
0.2
0.3
0.4
0.5
0.6
0.7
0.8
0.9
Just
Tas
k
HV
AC
Rad
io E
asy
Rad
io H
ard
CD
Tra
ck 7
Cas
sette
Coi
ns
Man
ual D
ial H
ome
Des
tinat
ion
Ent
ry L
ist
Rea
d Te
xt E
asy
Rea
d Te
xt H
ard
Map
Eas
y
Map
Har
d
Maz
e Tr
acin
g
Voi
ce D
ial H
ome
Del
ta V
oice
dial
Spo
rts B
road
cast
BO
T Li
sten
BO
T S
umm
Bio
grap
hica
l Q&
A
Rou
te In
stru
ctio
ns
Rou
te O
rient
atio
n
Trav
el C
ompu
tatio
ns
1 2 3 4 5 6 7 8 9 10 11 12 13 14 15 16 17 18 19 20 21 22 23
Tasks
Prop
ortio
n O
vera
ll Er
ror
FP
Figure R-10. Proportion Overall Error in the Sternberg Task

Appendix R Sternberg Surrogate
R-19
•
Response Time For Correct Responses
0
0.2
0.4
0.6
0.8
1
1.2
1.4
1.6
Just
Tas
k
HV
AC
Rad
io E
asy
Rad
io H
ard
CD
Tra
ck 7
Cas
sette
Coi
ns
Man
ual D
ial H
ome
Des
tinat
ion
Ent
ry L
ist
Rea
d Te
xt E
asy
Rea
d Te
xt H
ard
Map
Eas
y
Map
Har
d
Maz
e Tr
acin
g
Voic
e D
ial H
ome
Del
ta V
oice
dial
Spo
rts B
road
cast
BO
T Li
sten
BO
T S
umm
Biog
raph
ical
Q&
A
Rou
te In
stru
ctio
ns
Rou
te O
rient
atio
n
Trav
el C
ompu
tatio
ns
1 2 3 4 5 6 7 8 9 10 11 12 13 14 15 16 17 18 19 20 21 22 23
Tasks
Mea
n R
T fo
r Cor
rect
Res
pons
es (s
ec)
FP
Figure R-11. Sternberg Response Time for Correct Responses

Appendix R Sternberg Surrogate
R-20
Mean RT for Incorrect Responses To Sternberg Probes
0.8
0.9
1
1.1
1.2
1.3
1.4
1.5
1.6
Just
Tas
k
HVA
C
Rad
io E
asy
Rad
io H
ard
CD
Tra
ck 7
Cas
sette
Coi
ns
Man
ual D
ial H
ome
Des
tinat
ion
Entry
Lis
t
Rea
d Te
xt E
asy
Rea
d Te
xt H
ard
Map
Eas
y
Map
Har
d
Maz
e Tr
acin
g
Voic
e D
ial H
ome
Del
ta V
oice
dial
Spor
ts B
road
cast
BOT
List
en
BOT
Sum
m
Biog
raph
ical
Q&A
Rou
te In
stru
ctio
ns
Rou
te O
rient
atio
n
Trav
el C
ompu
tatio
ns
1 2 3 4 5 6 7 8 9 10 11 12 13 14 15 16 17 18 19 20 21 22 23
Tasks
Mea
n R
T to
Inco
rrec
t Res
pons
es (s
ec)
FP
Figure R-12. Sternberg Response Time for Incorrect Responses
Combined Dual Task Decrement Score (Version 1) is shown in Figure R-13. As can be seen, this measure also is sensitive to differences between tasks. However, the tasks scoring most highly on this measure are those hypothesized to involve some amount of working memory load and/or some amount of visual load. These include Book-On-Tape Summary, HVAC (which requires remembering a series of settings and mapping them to controls that appear in a different order on the control head), Route Instructions, Route Orientation, Travel Computation, Destination Entry, and Delta Flightline. Along the top of Figure R-13, to provide some comparison, are superimposed the Percent Missed CHMSLs for the Test Track for each task as well as the Percent Missed FVTS events. There appears to be some relationship to event detection, but not a perfect relationship.
Figure R-14 shows a different version of a Combined Decrement Score that is based on the Fully and Partially successful trials only (with not-successful trials excluded). The pattern of results is similar, with the same tasks scoring highly on the Decrement Score. Because this version of

Appendix R Sternberg Surrogate
R-21
the Combined Decrement Score is consistent with the treatment of the data in all other analyses, insofar as not successful trials are excluded in all other analyses, it is the version that is recommended for additional analysis.

Appendix R Sternberg Surrogate
R-22
Figure R-13. Combined Dual Task Decrement Score for Sternberg and In-Vehicle Task
•
Combined Decrement Score Variation
00.10.20.30.40.50.60.70.80.9
Bio
grap
hicQ
AB
ookO
nTap
eLis
ten
Boo
kOnT
apeS
umm
arC
asse
tteC
DTr
ack
7C
oins
Del
taD
estE
ntry
HV
AC
Just
Ste
rnM
anua
lDia
lM
apE
asy
Map
Har
dR
oute
Trac
ing
Rad
ioE
asy
Rad
ioH
ard
Rea
dEas
yR
eadH
ard
Rou
teIn
stru
ctR
oute
Orie
ntS
ports
Trav
elC
omp
Voi
ceD
ial
1 2 3 4 5 6 7 8 9 10 11 12 13 14 15 16 17 18 19 20 21 22 23
Tasks
Mea
n C
ombi
ned
Dec
rem
ent S
core
Figure R-14. Variation on Combined Decrement Score for Sternberg and In-Vehicle Task Performance
R.1.2 Repeatability To examine the repeatability of the Sternberg measures, a correlation between split-halves of the data sample was done (using the same previously described split of the data). The results of these correlations are shown in Table R-3. Positive correlations over +0.707 are highlighted in green.
Table R-3. Summary of Split-Half Correlations for Sternberg Measures

Appendix R Sternberg Surrogate
R-23
•
Sternberg Metric
Split-Half Reliability, Pearson r (without "Just Sternberg Task")
Split Group R2 SteYx
P-Value Significance Level
Proportion Missed Detections 0.969 0.940 2.828 0.000
Proportion Error, Given Detect 0.170 0.029 5.327 0.448
Proportion All Errors 0.944 0.891 3.523 0.000
RT to Correct Responses Mean 0.791 0.625 0.036 0.000 Median 0.822 0.672 0.037 0.000
RT to Incorrect Responses Mean 0.028 0.001 0.088 0.903 Median 0.041 0.002 0.088 0.856
RT to All Responses Mean 0.767 0.588 0.038 0.000 Median 0.798 0.636 0.039 0.000
Combined Decrement Score 0.941 0.886 0.041 0.000 All of the metrics proved reliable based on the criterion established for the project (r greater than +0.707), with the exception of those based on response times to incorrect responses.
The measure accounting for the most variance (or associated with the highest R2 value) was Proportion Missed Detections. It was followed next by Proportion All Errors and the Combined Decrement Score (Version 1).

Appendix R Sternberg Surrogate
R-24
R.1.3 Predictive Validity: Correlation to Driving Performance Measures (Including Eyeglance) In order for a surrogate test to be useful during product development as a technique for identifying tasks that may need to be re-designed due to levels of workload that they demand, it should have some validity for predicting driving performance on the road. Therefore, the Sternberg measures were correlated with driving performance data and eye-glance data from the road to assess their predictive validity. The correlations for the driving performance data from the road are shown in Table R-4. As the green highlighted cells show, the Sternberg metrics are positively related to event detection on the road, showing strong positive correlations with the miss rates for LVD, CHMSL, and FVTS events). The Combined Decrement Score predicted only Percent Miss Rates for FVTS events.
Table R-4. Summary of Correlations between Sternberg Metrics and Road Data
•
Sternberg Metric Mdn Task Dur Mdn SDLP Mdn Speed Diff Pct Cross Trials Pct LV Decel Miss Rate Pct CHMSL Miss Rate Pct FVTS Miss Rate
Proportion Missed Detections -0.731 -0.701 -0.648 -0.385 0.735 0.834 0.889
Proportion All Errors -0.669 -0.660 -0.569 -0.349 0.714 0.799 0.894
RT to Correct Responses Mean -0.781 -0.583 -0.663 -0.548 0.708 0.879 0.753 Median -0.818 -0.603 -0.699 -0.574 0.717 0.889 0.747
RT to All Responses Mean -0.768 -0.615 -0.666 -0.524 0.748 0.891 0.745 Median -0.805 -0.631 -0.699 -0.552 0.754 0.902 0.745
Combined Decrement Score -0.244 -0.360 -0.121 -0.005 0.385 0.404 0.757
Highlights + correlations >.707 Highlights - correls < -.707Highlights + correlations >.665, p<.05 Highlights - correls < -..665
Metric from Driving Performance On ROAD
Sternberg measures were also correlated with driving performance data and eyeglance data from the test track to assess their predictive validity. The correlations for the driving performance data from the test track are shown in Table R-5. As these green highlighted cells show, the Sternberg metrics are positively related to event detection on the test track but there are fewer strong relationships. None of the correlations with Percent LVD Miss Rates met the criterion of being greater than +0.707. However, for Percent CHMSL Miss Rate, the Sternberg response time measures still showed strong positive correlations with the track data, and for Percent FVTS Miss Rate, the Sternberg Metrics of Proportion Missed Detections and Proportion all Errors, as well as the Response Time measures, still showed strong positive correlations with the track data.
When the correlations are computed on subsets of tasks, auditory-vocal tasks versus visual-manual, it becomes apparent that each subset is contributing to the correlations in Table R-4 and Table R-5, but with different patterns. Auditory-vocal tasks produce strong positive correlations between Response Time measures and Speed Difference (on the road, it is between Median RT Correct and Median Speed Diff, and Median RT All and Speed Diff). (On the track, it is between Mean and Median RT Incorrect and Median Speed Diff and Median SDLP). In terms of Event Detection, the correlations for auditory-vocal tasks on the road are between Percent CHMSL Miss Rate and Mean RT Correct, and for Percent

Appendix R Sternberg Surrogate
R-25
FVTS Missed, with Percent Missed Sternberg Detections, Percent All Error, Mean RT All, Combined Decrement, and Percent Error Given Detection. On the track, the patterns were similar, for Percent LVD Miss Rate, one correlation with Mean RT All, for Percent CHMSL Miss Rate, with Median RT Correct, and for Percent FVTS Miss Rate, three correlations (with Percent Missed Sternberg Detections, Percent All Error, and Combined Decrement Score). Thus, tasks other than the auditory-vocal tasks are contributing most heavily to the patterns in Tables R-4 and R-5 for Percent CHMSL Miss Rate, and Percent LVD Miss Rate. The relationship between Percent FVTS Miss Rate and Sternberg measures has contributions from both the auditory-vocal tasks and other task types.
Table R-5. Summary of Correlations between Sternberg Metrics and Track Data
•
Mdn Task Dur Mdn SDLP Mdn Speed Diff Pct Cross Trials PctLVDecelMissRate PctCHMSLMissRate PctFVTSMissRateSternberg Metric
Proportion Missed Detections -0.534 -0.256 -0.305 0.361 0.530 0.683 0.846
Proportion All Errors -0.461 -0.251 -0.265 0.306 0.495 0.607 0.858
RT To Correct Responses Mean -0.661 -0.202 -0.402 0.326 0.551 0.774 0.749 Median -0.713 -0.247 -0.454 0.304 0.575 0.798 0.748
RT To All Responses Mean -0.663 -0.235 -0.440 0.293 0.599 0.746 0.790 Median -0.709 -0.272 -0.483 0.278 0.616 0.771 0.788
Combined Decrement Score -0.122 -0.251 -0.003 0.306 0.226 0.228 0.697
Highlights + correlations >.707 Highlights - correls < -.707Highlights + correlations >.665, p<.05 Highlights - correls < -..665
Metric from Driving Performance On TRACK
The correlations between Sternberg metrics and eye-glance data from the road are shown in Table R-6. Note that in this table, glance metrics are listed down the left side of the table, due to their number, and Sternberg metrics are listed across the top of the table. The Sternberg response time metrics for correct responses (mean and median RT for Correct Responses, as well as Mean and Median RT for All Responses) correlated positively with a number of glance metrics. Among them were the total glance rate per second (across the whole task and all locations), and the glance rate to the road. In addition, they correlated strongly with all metrics related to glances to task-related areas (maximum duration, mean number of glances, mean total glance time on task-related areas, mean glance rate, and mean percent of task duration spent looking at task-related areas), and to glance measures in the NR or Not-Road category of locations. The Sternberg measure of Percent Missed Detections correlated positively with the Mean Standard Deviation of Task-Related Glance Durations. In addition, there were a large number of strong negative correlations (e.g., between measures related to glances at mirrors and the Sternberg metrics). Thus, several Sternberg measures had predictive validity for eyeglance measures, but the strongest were the Response Time measures for Correct Responses and All Responses.

Appendix R Sternberg Surrogate
R-26
Table R-6. Sternberg Metrics Related to Eyeglance Metrics from the Road

Appendix R Sternberg Surrogate
R-27
Eye MetricPctMiss PctAllErr MeanRTCor MdnRTCor MeanRTAll MdnRTAll CombDecr MeanRTIncor MdnRTIncor PctEGD
MeanTskglncs -0.777 -0.740 -0.754 -0.785 -0.747 -0.779 -0.437 -0.385 -0.411 -0.091MeanTaskdur -0.731 -0.669 -0.781 -0.818 -0.768 -0.805 -0.244 -0.399 -0.428 0.069MeanmeanTdur -0.414 -0.336 -0.605 -0.637 -0.609 -0.639 0.171 -0.412 -0.434 0.347MeanmedTdur -0.192 -0.138 -0.390 -0.415 -0.372 -0.395 0.219 -0.269 -0.281 0.258MeansdTdur -0.435 -0.354 -0.624 -0.658 -0.630 -0.660 0.172 -0.418 -0.441 0.357MeanTglsprs 0.578 0.510 0.761 0.781 0.777 0.796 0.052 0.591 0.614 -0.193MeanglncesRD -0.776 -0.738 -0.757 -0.789 -0.750 -0.782 -0.430 -0.385 -0.411 -0.085MeanduratRD -0.717 -0.651 -0.780 -0.817 -0.767 -0.804 -0.211 -0.406 -0.435 0.095MeanmeanRDdr -0.463 -0.384 -0.640 -0.672 -0.644 -0.674 0.127 -0.439 -0.462 0.325MeanmedRDdur -0.447 -0.373 -0.618 -0.649 -0.625 -0.653 0.099 -0.431 -0.455 0.304MeansdRDdur -0.447 -0.366 -0.636 -0.667 -0.648 -0.676 0.160 -0.450 -0.472 0.358MeangrateRD 0.590 0.523 0.763 0.783 0.781 0.799 0.067 0.603 0.625 -0.187MeanpctdurRD -0.597 -0.532 -0.754 -0.769 -0.778 -0.792 -0.105 -0.657 -0.678 0.161MeanglncesSA -0.793 -0.745 -0.831 -0.862 -0.817 -0.849 -0.378 -0.443 -0.470 -0.058MeanduratSA -0.802 -0.756 -0.842 -0.871 -0.825 -0.857 -0.385 -0.456 -0.481 -0.078MeanmeanSAdr -0.590 -0.535 -0.759 -0.789 -0.732 -0.764 -0.144 -0.456 -0.478 0.096MeanmedSAdur -0.556 -0.500 -0.753 -0.783 -0.724 -0.755 -0.109 -0.470 -0.491 0.109MeansdSAdur -0.280 -0.263 -0.214 -0.248 -0.186 -0.220 -0.077 0.058 0.043 -0.037MeangrateSA -0.823 -0.801 -0.872 -0.882 -0.862 -0.875 -0.528 -0.482 -0.501 -0.189MeanpctdurSA -0.820 -0.792 -0.896 -0.913 -0.878 -0.898 -0.461 -0.520 -0.540 -0.164MeanglncesTR 0.465 0.376 0.720 0.744 0.630 0.663 -0.357 0.233 0.250 -0.261MeanduratTR 0.537 0.443 0.771 0.794 0.703 0.734 -0.316 0.377 0.395 -0.287MeanmeanTRdr 0.684 0.600 0.798 0.832 0.808 0.839 -0.205 0.664 0.681 -0.388MeanmedTRdur 0.634 0.554 0.791 0.827 0.792 0.826 -0.259 0.635 0.652 -0.361MeansdTRdur 0.724 0.661 0.718 0.763 0.779 0.816 0.215 0.670 0.689 -0.271MeangrateTR 0.668 0.581 0.889 0.917 0.878 0.907 -0.272 0.501 0.524 -0.425MeanpctdurTR 0.685 0.602 0.863 0.886 0.867 0.891 -0.211 0.609 0.630 -0.391MeanduratNA -0.110 -0.069 -0.362 -0.374 -0.340 -0.355 0.190 -0.051 -0.065 0.218MeanmeanNAdr 0.064 0.079 -0.021 -0.037 0.071 0.047 0.139 0.462 0.454 0.083MeanmedNAdur 0.084 0.094 0.005 -0.010 0.097 0.073 0.131 0.474 0.468 0.073MeansdNAdur 0.213 0.192 0.128 0.148 0.142 0.157 0.037 0.110 0.110 -0.185MeangrateNA 0.557 0.524 0.662 0.675 0.686 0.697 0.189 0.607 0.626 -0.013MeanpctdurNA 0.583 0.547 0.646 0.658 0.689 0.697 0.229 0.651 0.669 -0.025MeanglncesMR -0.782 -0.731 -0.820 -0.851 -0.807 -0.839 -0.361 -0.429 -0.456 -0.031MeanduratMR -0.790 -0.741 -0.829 -0.860 -0.814 -0.846 -0.366 -0.442 -0.468 -0.047MeanmeanMRdr -0.605 -0.548 -0.751 -0.780 -0.732 -0.762 -0.160 -0.495 -0.516 0.126MeanmedMRdur -0.590 -0.534 -0.752 -0.779 -0.732 -0.761 -0.148 -0.517 -0.536 0.130MeansdMRdur -0.727 -0.686 -0.593 -0.616 -0.612 -0.632 -0.370 -0.332 -0.353 -0.041MeangrateMR -0.776 -0.756 -0.832 -0.834 -0.826 -0.832 -0.531 -0.438 -0.455 -0.191MeanpctdurMR -0.805 -0.774 -0.889 -0.903 -0.874 -0.891 -0.453 -0.513 -0.533 -0.140MeanglncesNR -0.776 -0.740 -0.746 -0.777 -0.742 -0.773 -0.440 -0.386 -0.411 -0.093MeanduratNR -0.729 -0.705 -0.665 -0.698 -0.654 -0.687 -0.459 -0.279 -0.303 -0.143MeanmeanNRdr 0.601 0.544 0.704 0.710 0.749 0.753 0.167 0.753 0.770 -0.154MeanmedNRdur 0.574 0.519 0.714 0.723 0.752 0.759 0.135 0.723 0.741 -0.151MeansdNRdur 0.664 0.602 0.740 0.754 0.783 0.793 0.198 0.753 0.771 -0.165MeangrateNR 0.571 0.503 0.761 0.781 0.774 0.794 0.046 0.578 0.601 -0.197MeanpctdurNR 0.605 0.540 0.759 0.773 0.783 0.796 0.116 0.659 0.680 -0.162MinTdur -0.099 -0.056 -0.146 -0.162 -0.195 -0.208 -0.018 -0.096 -0.115 0.317MinRDdur -0.399 -0.354 -0.315 -0.327 -0.322 -0.336 -0.246 -0.180 -0.204 0.090MinSAdur 0.445 0.442 0.194 0.187 0.271 0.257 0.474 0.276 0.280 0.201MinTRdur -0.362 -0.278 -0.580 -0.652 -0.548 -0.619 0.542 -0.002 -0.031 0.563MinNAdur -0.285 -0.257 -0.519 -0.533 -0.474 -0.491 -0.066 -0.246 -0.256 -0.063MinMRdur 0.480 0.484 0.306 0.304 0.358 0.352 0.427 0.171 0.179 0.262MinNRdur 0.456 0.471 0.126 0.115 0.177 0.164 0.579 0.117 0.120 0.257MaxTdur -0.518 -0.437 -0.620 -0.658 -0.627 -0.663 0.003 -0.336 -0.366 0.292MaxRDdur -0.518 -0.437 -0.620 -0.658 -0.627 -0.663 0.003 -0.336 -0.366 0.292MaxSAdur -0.648 -0.595 -0.638 -0.654 -0.642 -0.658 -0.276 -0.384 -0.409 0.048MaxTRdur 0.680 0.593 0.762 0.783 0.750 0.773 -0.133 0.627 0.643 -0.457
Correlations With Eye Data From RoadCorrect Responses All Responses Incorrect Responses

Appendix R Sternberg Surrogate
R-28
The correlations between Sternberg metrics and eye data from the test track are shown in Table R-7. The pattern of correlations was similar to those from the road data, but fewer of them were as strong as those observed on the road. The Sternberg metrics still having predictive validity for the test track as well were Mean and Median RT for Correct responses and Mean and Median RT for all responses, which correlated strongly with Total Glance Rate Per Second, Glance Rate to the Road. In addition, they correlated strongly with the measures of eyeglances made to task-related areas (Duration of Task-Related Glances, Glance Rate to Task-Related Areas, Percent of Task Duration spent looking at Task-Related Areas, and Maximum Duration of Task-Related glances) and to Glance Rate to Not-Road areas and Percent of Task Duration spent looking at not-road areas.
When the correlations are again computed on subsets of tasks, auditory-vocal tasks versus visual-manual, it becomes apparent that each subset is quite different with respect to the relationships present between eyeglance metrics and Sternberg measures. For the auditory-vocal tasks, there were few correlations with eyeglance measures. For both the road and the track data, the measure of Percent of Task Duration Spent Looking at the Road was strongly correlated with Percent Missed Sternberg Detections and Percent All Errors. These would be consistent with the hypothesis that the Sternberg task is sensitive to cognitive loading. For the track data, there were also a few additional correlations between glance rate to the NA (not able to be scored) area and Percent Missed Sternberg Detections, as well as Percent All Error. Glances to the not road area and total glance time on not road areas correlated with RT to Incorrect Sternberg responses. However, the majority of the correlations shown in Table R-6 and Table R-7 between Sternberg measures and eyeglance metrics, especially those related to task-related glances and the not road category of glances, are influenced most heavily by the subset of visual-manual tasks.

Appendix R Sternberg Surrogate
R-29
Table R-7 . Sternberg Metrics Related to Eyeglance Metrics from the Test Track

Appendix R Sternberg Surrogate
R-30
Eye MetricPctMiss PctAllErr MeanRTCor MdnRTCor MeanRTAll MdnRTAll CombDecr MeanRTIncor MdnRTIncor PctEGD
MeanTskglncs -0.161 -0.134 -0.200 -0.257 -0.245 -0.291 -0.041 -0.219 -0.235 0.248MeanTaskdur -0.534 -0.461 -0.661 -0.713 -0.663 -0.709 -0.122 -0.384 -0.411 0.375MeanmeanTdur -0.587 -0.523 -0.719 -0.741 -0.710 -0.731 -0.112 -0.428 -0.449 0.191MeanmedTdur -0.535 -0.486 -0.650 -0.666 -0.640 -0.656 -0.123 -0.415 -0.432 0.106MeansdTdur -0.615 -0.539 -0.787 -0.816 -0.774 -0.803 -0.081 -0.426 -0.450 0.283MeanTglsprs 0.584 0.504 0.804 0.827 0.803 0.825 0.083 0.517 0.540 -0.336MeanglncesRD -0.206 -0.175 -0.250 -0.308 -0.293 -0.339 -0.059 -0.246 -0.263 0.252MeanduratRD -0.623 -0.543 -0.764 -0.807 -0.751 -0.791 -0.158 -0.419 -0.447 0.371MeanmeanRDdr -0.614 -0.544 -0.766 -0.791 -0.758 -0.783 -0.108 -0.457 -0.480 0.241MeanmedRDdur -0.586 -0.518 -0.734 -0.758 -0.732 -0.754 -0.087 -0.454 -0.477 0.233MeansdRDdur -0.610 -0.533 -0.793 -0.821 -0.782 -0.809 -0.091 -0.446 -0.471 0.302MeangrateRD 0.581 0.501 0.797 0.821 0.796 0.819 0.082 0.513 0.536 -0.339MeanpctdurRD -0.623 -0.547 -0.835 -0.851 -0.843 -0.858 -0.142 -0.613 -0.636 0.336MeanglncesSA -0.705 -0.647 -0.786 -0.825 -0.788 -0.823 -0.300 -0.474 -0.499 0.218MeanduratSA -0.738 -0.686 -0.816 -0.851 -0.818 -0.850 -0.340 -0.498 -0.523 0.166MeanmeanSAdr -0.867 -0.836 -0.910 -0.918 -0.910 -0.919 -0.469 -0.602 -0.621 -0.035MeanmedSAdur -0.865 -0.839 -0.909 -0.913 -0.906 -0.912 -0.473 -0.588 -0.606 -0.077MeansdSAdur -0.796 -0.777 -0.760 -0.758 -0.786 -0.782 -0.556 -0.491 -0.505 0.005MeangrateSA -0.748 -0.743 -0.614 -0.598 -0.635 -0.620 -0.594 -0.394 -0.400 -0.067MeanpctdurSA -0.888 -0.871 -0.845 -0.842 -0.866 -0.863 -0.609 -0.585 -0.598 -0.062MeanglncesTR 0.513 0.479 0.622 0.576 0.526 0.498 0.174 0.107 0.113 -0.041MeanduratTR 0.530 0.495 0.630 0.584 0.537 0.509 0.188 0.127 0.133 -0.057MeanmeanTRdr 0.651 0.566 0.800 0.820 0.826 0.844 0.062 0.496 0.516 -0.386MeanmedTRdur 0.628 0.550 0.792 0.814 0.828 0.847 0.063 0.555 0.575 -0.351MeansdTRdur 0.542 0.453 0.543 0.541 0.514 0.515 0.111 -0.063 -0.051 -0.414MeangrateTR 0.496 0.381 0.850 0.877 0.850 0.876 -0.123 0.421 0.444 -0.534MeanpctdurTR 0.548 0.439 0.872 0.891 0.875 0.894 -0.063 0.485 0.507 -0.522MeanglncesNA -0.104 -0.030 -0.228 -0.264 -0.176 -0.213 0.115 0.061 0.041 0.527MeanduratNA 0.057 0.076 0.104 0.093 0.166 0.152 0.146 0.354 0.354 0.062MeanmeanNAdr 0.020 0.028 0.112 0.107 0.165 0.158 0.125 0.316 0.321 -0.069MeanmedNAdur 0.004 0.015 0.096 0.090 0.150 0.142 0.126 0.309 0.314 -0.052MeansdNAdur 0.187 0.167 0.336 0.346 0.369 0.375 0.066 0.437 0.447 -0.178MeangrateNA 0.490 0.439 0.592 0.630 0.630 0.660 0.122 0.518 0.538 -0.267MeanpctdurNA 0.298 0.262 0.454 0.474 0.493 0.508 0.078 0.509 0.524 -0.247MeanglncesMR -0.684 -0.624 -0.764 -0.805 -0.767 -0.804 -0.279 -0.460 -0.486 0.242MeanduratMR -0.723 -0.668 -0.800 -0.837 -0.803 -0.837 -0.324 -0.489 -0.514 0.187MeanmeanMRdr -0.837 -0.816 -0.891 -0.902 -0.906 -0.916 -0.471 -0.667 -0.685 -0.073MeanmedMRdur -0.826 -0.812 -0.879 -0.887 -0.896 -0.903 -0.474 -0.660 -0.676 -0.128MeansdMRdur -0.788 -0.768 -0.834 -0.836 -0.853 -0.855 -0.513 -0.528 -0.544 -0.001MeangrateMR -0.651 -0.662 -0.421 -0.394 -0.451 -0.427 -0.604 -0.316 -0.317 -0.138MeanpctdurMR -0.886 -0.878 -0.788 -0.779 -0.820 -0.810 -0.650 -0.599 -0.610 -0.107MeanglncesNR -0.109 -0.087 -0.142 -0.198 -0.192 -0.236 -0.021 -0.193 -0.208 0.232MeanduratNR 0.216 0.206 0.243 0.196 0.185 0.151 0.109 0.044 0.041 0.104MeanmeanNRdr 0.414 0.371 0.590 0.594 0.630 0.632 0.175 0.622 0.638 -0.259MeanmedNRdur 0.471 0.425 0.600 0.603 0.639 0.640 0.229 0.619 0.636 -0.254MeansdNRdur 0.309 0.276 0.557 0.566 0.588 0.594 0.059 0.572 0.586 -0.216MeangrateNR 0.601 0.520 0.810 0.835 0.808 0.832 0.089 0.518 0.541 -0.340MeanpctdurNR 0.631 0.555 0.839 0.856 0.846 0.862 0.145 0.616 0.639 -0.337MinTdur -0.323 -0.304 -0.222 -0.223 -0.220 -0.222 -0.223 -0.163 -0.174 -0.018MinRDdur -0.323 -0.304 -0.222 -0.223 -0.220 -0.222 -0.223 -0.163 -0.174 -0.018MinSAdur -0.071 -0.061 -0.134 -0.113 -0.140 -0.120 0.036 -0.282 -0.275 -0.066MinTRdur -0.232 -0.143 -0.696 -0.699 -0.720 -0.722 0.338 -0.476 -0.483 0.436MinNAdur -0.667 -0.623 -0.737 -0.755 -0.735 -0.752 -0.278 -0.551 -0.565 0.021MinMRdur -0.164 -0.156 -0.150 -0.123 -0.162 -0.136 -0.017 -0.338 -0.331 -0.112MinNRdur -0.192 -0.144 -0.285 -0.294 -0.307 -0.312 0.132 -0.446 -0.449 0.193MaxTdur -0.715 -0.637 -0.787 -0.817 -0.763 -0.792 -0.241 -0.378 -0.404 0.259MaxRDdur -0.712 -0.637 -0.817 -0.847 -0.801 -0.830 -0.235 -0.447 -0.474 0.268
Correlations With Eye Data From Test TrackCorrect Responses All Responses Incorrect Responses

Appendix R Sternberg Surrogate
R-31
R.1.4 Predictive Validity by Task Type To examine whether the Sternberg method had the same effects for each task type (visual-manual, auditory-vocal, and combination) as were seen in the correlations done on the full set of tasks above, separate correlations were done on each subset of tasks. The results are reported first for these task-type level correlations between the Sternberg data the Test Track data, and then secondly for the Road Data.
R.1.4.1 Sternberg Data versus Test Track Data by Task Type
Visual-Manual Tasks
Table R-8 shows the correlations between the Sternberg data and the test track data for the visual-manual subset of tasks. As can be seen by the highlighted cells, the Sternberg metrics of Percent Miss, Percent All Error, and the Combined Decrement score retained predictive validity for Percent FVTS Miss Rate performance during visual-manual tasks done on the test track.
There were also a few significant positive correlations between Sternberg metrics and glance metrics, as well as some significant negative correlations between Sternberg metrics and glance metrics. Auditory-Vocal Tasks
Table R-9 shows the correlations between the Sternberg data and the test track data for the auditory-vocal subset of tasks. Toward the top of the table, the green highlighted cells indicate that on the test track, Percent Lead Vehicle Deceleration Miss Rate was predicted by the Sternberg metric of Mean RT All, the Percent CHMSL Miss Rate was predicted by the Sternberg metric of Median RT Correct, and the Percent FVTS Miss Rate was predicted by two Sternberg metrics, Percent Miss and Percent All Error. In addition, there were numerous significant positive and negative correlations between the Sternberg metrics and glance metrics—far more extensive than the relationships observed for the visual-manual task set. Combination and Just Tasks
Table R-10 shows the correlations for the combination tasks as well as for the Just tasks (Just Sternberg with Just Driving). Interestingly, for this subset of tasks, the Sternberg metrics had predictive validity for Percent LVD Miss Rate and Percent FVTS Miss Rate, but not for Percent CHMSL Miss Rate. There were also strong positive correlations with Speed Diff.
In addition, there were again numerous significant positive and negative correlations with glance metrics, though a different pattern than for auditory-vocal tasks.

Appendix R Sternberg Surrogate
R-32
Table R-8. Sternberg Metrics for Visual-Manual Tasks Only, as Correlated With Track

Appendix R Sternberg Surrogate
R-33
Perf. Metric PctMiss PctAllErr MeanRTCor MdnRTCor MeanRTAll MdnRTAll CombDecr MeanRTIncor MdnRTIncor PctEGDMdnSDLP 0.176 0.161 0.411 0.381 0.179 0.151 0.079 -0.306 -0.307 0.191MdnSpeedDiff 0.298 0.275 0.560 0.524 0.369 0.334 0.232 -0.082 -0.084 0.245PctCrossTrials 0.472 0.467 0.343 0.285 0.134 0.082 0.372 -0.336 -0.341 0.475PctLVDecelMissRate 0.204 0.212 -0.205 -0.194 -0.036 -0.026 0.204 0.161 0.162 -0.103PctCHMSLMissRate 0.468 0.429 0.220 0.231 0.210 0.216 0.436 0.123 0.124 -0.234PctFVTSMissRate 0.771 0.804 0.136 0.124 0.280 0.271 0.801 0.166 0.168 0.335MeanTskglncs 0.445 0.430 0.582 0.531 0.377 0.330 0.363 -0.088 -0.093 0.332MeanTaskdur 0.429 0.417 0.562 0.513 0.357 0.311 0.346 -0.116 -0.120 0.329MeanmeanTdur -0.377 -0.351 -0.220 -0.195 -0.157 -0.133 -0.332 -0.082 -0.076 -0.318MeanmedTdur 0.071 0.088 -0.377 -0.359 -0.274 -0.255 0.046 -0.125 -0.119 -0.192MeansdTdur -0.404 -0.380 -0.150 -0.123 -0.086 -0.061 -0.347 -0.007 -0.001 -0.312MeanTglsprs 0.310 0.282 0.233 0.212 0.229 0.209 0.312 0.316 0.309 0.233MeanglncesRD 0.446 0.431 0.584 0.534 0.380 0.332 0.365 -0.087 -0.092 0.336MeanduratRD 0.331 0.324 0.482 0.432 0.246 0.200 0.248 -0.295 -0.299 0.342MeanmeanRDdr -0.552 -0.534 -0.559 -0.548 -0.619 -0.606 -0.543 -0.765 -0.761 -0.251MeanmedRDdur -0.504 -0.486 -0.553 -0.546 -0.621 -0.612 -0.500 -0.764 -0.761 -0.291MeansdRDdur -0.605 -0.590 -0.556 -0.541 -0.599 -0.581 -0.585 -0.726 -0.722 -0.282MeangrateRD 0.277 0.257 0.166 0.152 0.192 0.178 0.298 0.316 0.310 0.224MeanpctdurRD -0.513 -0.497 -0.560 -0.555 -0.634 -0.626 -0.501 -0.779 -0.778 -0.100MeanglncesSA 0.286 0.267 0.610 0.570 0.391 0.352 0.211 -0.078 -0.082 0.294MeanduratSA 0.232 0.209 0.549 0.508 0.323 0.284 0.149 -0.129 -0.133 0.252MeanmeanSAdr -0.771 -0.816 -0.669 -0.661 -0.700 -0.688 -0.804 -0.416 -0.415 -0.576MeanmedSAdur -0.776 -0.822 -0.714 -0.702 -0.726 -0.709 -0.808 -0.377 -0.375 -0.656MeansdSAdur -0.640 -0.679 -0.518 -0.510 -0.598 -0.588 -0.751 -0.260 -0.260 -0.317MeangrateSA -0.592 -0.587 -0.369 -0.346 -0.382 -0.360 -0.607 -0.081 -0.081 -0.014MeanpctdurSA -0.751 -0.762 -0.533 -0.517 -0.582 -0.565 -0.789 -0.265 -0.266 -0.191MeanglncesTR 0.469 0.455 0.576 0.525 0.373 0.324 0.387 -0.096 -0.101 0.347MeanduratTR 0.491 0.478 0.579 0.528 0.385 0.336 0.407 -0.062 -0.066 0.347MeanmeanTRdr 0.560 0.569 0.385 0.373 0.453 0.441 0.523 0.651 0.648 0.276MeanmedTRdur 0.469 0.481 0.339 0.334 0.441 0.435 0.441 0.719 0.718 0.215MeansdTRdur 0.733 0.762 0.569 0.550 0.518 0.498 0.669 0.247 0.248 0.563MeangrateTR 0.624 0.611 0.505 0.470 0.468 0.434 0.626 0.280 0.274 0.420MeanpctdurTR 0.684 0.680 0.598 0.570 0.601 0.573 0.662 0.554 0.549 0.382MeanglncesNA -0.015 -0.050 0.010 0.028 0.069 0.085 -0.046 0.306 0.309 -0.394MeanduratNA -0.066 -0.071 0.088 0.118 0.185 0.211 -0.050 0.354 0.359 -0.280MeanmeanNAdr -0.141 -0.130 0.134 0.167 0.245 0.274 -0.091 0.405 0.410 -0.229MeanmedNAdur -0.156 -0.142 0.143 0.177 0.257 0.286 -0.100 0.414 0.419 -0.221MeansdNAdur -0.078 -0.068 0.100 0.130 0.214 0.241 -0.044 0.394 0.400 -0.210MeangrateNA -0.095 -0.103 -0.415 -0.383 -0.250 -0.221 -0.092 0.208 0.210 -0.401MeanpctdurNA -0.063 -0.074 0.011 0.044 0.125 0.153 -0.054 0.355 0.360 -0.365MeanglncesMR 0.279 0.260 0.614 0.574 0.398 0.358 0.210 -0.079 -0.083 0.268MeanduratMR 0.233 0.210 0.563 0.523 0.338 0.298 0.156 -0.132 -0.136 0.230MeanmeanMRdr -0.622 -0.680 -0.477 -0.479 -0.606 -0.604 -0.694 -0.605 -0.605 -0.502MeanmedMRdur -0.607 -0.669 -0.498 -0.499 -0.628 -0.625 -0.687 -0.605 -0.604 -0.578MeansdMRdur -0.552 -0.602 -0.536 -0.535 -0.631 -0.626 -0.685 -0.294 -0.295 -0.391MeangrateMR -0.680 -0.682 -0.364 -0.342 -0.395 -0.375 -0.675 -0.171 -0.172 -0.131MeanpctdurMR -0.793 -0.811 -0.505 -0.489 -0.579 -0.562 -0.821 -0.369 -0.369 -0.279MeanglncesNR 0.447 0.430 0.574 0.523 0.367 0.319 0.362 -0.096 -0.100 0.324MeanduratNR 0.465 0.451 0.590 0.541 0.401 0.354 0.384 -0.028 -0.032 0.314MeanmeanNRdr 0.116 0.121 0.271 0.285 0.380 0.390 0.149 0.587 0.589 -0.114MeanmedNRdur 0.337 0.333 0.343 0.345 0.453 0.452 0.344 0.698 0.698 -0.038MeansdNRdur -0.081 -0.061 0.234 0.258 0.337 0.356 -0.020 0.480 0.484 -0.115MeangrateNR 0.346 0.310 0.214 0.193 0.224 0.203 0.342 0.331 0.325 0.209MeanpctdurNR 0.503 0.487 0.560 0.556 0.640 0.634 0.497 0.788 0.787 0.101MinTdur 0.000 0.000 0.000 0.000 0.000 0.000 0.000 0.000 0.000 0.000MinRDdur 0.000 0.000 0.000 0.000 0.000 0.000 0.000 0.000 0.000 0.000MinSAdur -0.151 -0.111 -0.663 -0.669 -0.673 -0.669 -0.157 -0.514 -0.513 0.040MinTRdur -0.191 -0.173 -0.603 -0.616 -0.534 -0.540 -0.179 -0.274 -0.276 -0.049MinNAdur 0.025 0.093 -0.142 -0.135 -0.195 -0.188 0.036 -0.513 -0.509 0.300MinMRdur -0.396 -0.376 -0.809 -0.813 -0.839 -0.833 -0.398 -0.687 -0.685 -0.229MinNRdur 0.103 0.155 -0.091 -0.090 -0.152 -0.152 0.134 -0.539 -0.538 0.333MaxTdur -0.310 -0.297 0.002 0.035 0.090 0.120 -0.271 0.198 0.205 -0.266MaxRDdur -0.691 -0.711 -0.458 -0.447 -0.509 -0.496 -0.699 -0.541 -0.538 -0.502
Visual Manual TasksOnly: Sternberg Data Correlated with Test Track Performance Data

Appendix R Sternberg Surrogate
R-34

Appendix R Sternberg Surrogate
R-35
Table R-9. Sternberg Metrics for Auditory-Vocal Tasks Only, as Correlated With Track

Appendix R Sternberg Surrogate
R-36
Metric PctMiss PctAllErr MeanRTCor MdnRTCor MeanRTAll MdnRTAll CombDecr MeanRTIncor MdnRTIncor PctEGDMdnSDLP -0.863 -0.817 -0.543 -0.627 -0.507 -0.629 -0.430 0.808 0.781 -0.286MdnSpeedDiff -0.693 -0.660 -0.604 -0.717 -0.523 -0.695 -0.268 0.849 0.835 -0.266PctCrossTrials -0.448 -0.488 -0.661 -0.639 -0.692 -0.673 -0.425 0.479 0.475 -0.572PctLVDecelMissRate 0.636 0.684 0.618 0.575 0.722 0.668 0.626 -0.255 -0.222 0.704PctCHMSLMissRate 0.508 0.509 0.800 0.789 0.697 0.695 0.099 -0.228 -0.239 0.480PctFVTSMissRate 0.803 0.806 0.392 0.392 0.483 0.481 0.904 -0.429 -0.379 0.559MeanTskglncs -0.902 -0.864 -0.481 -0.544 -0.487 -0.577 -0.665 0.785 0.749 -0.365MeanTaskdur -0.896 -0.859 -0.594 -0.674 -0.565 -0.684 -0.561 0.848 0.818 -0.378MeanmeanTdur -0.405 -0.451 -0.683 -0.616 -0.665 -0.582 -0.409 -0.194 -0.205 -0.705MeanmedTdur -0.283 -0.332 -0.551 -0.475 -0.544 -0.448 -0.317 -0.372 -0.384 -0.627MeansdTdur -0.340 -0.352 -0.742 -0.777 -0.632 -0.700 -0.151 0.572 0.592 -0.414MeanTglsprs -0.378 -0.361 0.208 0.248 0.079 0.152 -0.626 0.041 0.002 -0.107MeanglncesRD -0.904 -0.866 -0.484 -0.547 -0.490 -0.580 -0.664 0.783 0.747 -0.367MeanduratRD -0.895 -0.858 -0.611 -0.692 -0.578 -0.698 -0.547 0.846 0.818 -0.384MeanmeanRDdr -0.493 -0.531 -0.781 -0.747 -0.737 -0.705 -0.430 0.038 0.029 -0.714MeanmedRDdur -0.315 -0.360 -0.574 -0.537 -0.551 -0.511 -0.351 -0.184 -0.197 -0.612MeansdRDdur -0.408 -0.426 -0.780 -0.780 -0.701 -0.716 -0.280 0.549 0.567 -0.507MeangrateRD -0.177 -0.170 0.360 0.420 0.214 0.318 -0.515 -0.170 -0.205 -0.026MeanpctdurRD 0.769 0.725 0.224 0.273 0.267 0.331 0.668 -0.717 -0.681 0.211MeanglncesSA -0.909 -0.878 -0.501 -0.564 -0.517 -0.607 -0.684 0.760 0.720 -0.405MeanduratSA -0.899 -0.867 -0.492 -0.556 -0.508 -0.601 -0.679 0.791 0.753 -0.390MeanmeanSAdr -0.893 -0.870 -0.793 -0.834 -0.746 -0.813 -0.579 0.837 0.823 -0.526MeanmedSAdur -0.865 -0.848 -0.823 -0.855 -0.775 -0.828 -0.562 0.810 0.799 -0.551MeansdSAdur -0.445 -0.411 -0.031 -0.057 -0.083 -0.111 -0.534 0.684 0.668 -0.051MeangrateSA -0.509 -0.515 0.036 0.070 -0.119 -0.061 -0.755 0.042 -0.012 -0.321MeanpctdurSA -0.781 -0.764 -0.242 -0.260 -0.341 -0.361 -0.800 0.534 0.485 -0.371MeanglncesNA -0.219 -0.122 0.168 0.034 0.273 0.091 0.139 0.746 0.753 0.490MeanduratNA 0.017 0.042 -0.287 -0.366 -0.116 -0.242 0.313 0.261 0.288 0.073MeanmeanNAdr 0.054 0.062 -0.324 -0.376 -0.167 -0.255 0.276 0.116 0.143 -0.022MeanmedNAdur 0.055 0.064 -0.325 -0.376 -0.167 -0.254 0.278 0.113 0.140 -0.022MeansdNAdur 0.185 0.151 0.093 0.029 0.043 -0.057 0.189 0.076 0.061 0.061MeangrateNA 0.969 0.975 0.883 0.898 0.883 0.917 0.721 -0.631 -0.600 0.743MeanpctdurNA 0.365 0.374 -0.041 -0.091 0.113 0.032 0.518 -0.079 -0.044 0.218MeanglncesMR -0.904 -0.874 -0.494 -0.557 -0.512 -0.603 -0.689 0.746 0.706 -0.409MeanduratMR -0.891 -0.860 -0.479 -0.544 -0.496 -0.591 -0.680 0.782 0.743 -0.386MeanmeanMRdr -0.854 -0.839 -0.815 -0.852 -0.769 -0.831 -0.580 0.837 0.826 -0.553MeanmedMRdur -0.802 -0.800 -0.853 -0.872 -0.812 -0.850 -0.562 0.773 0.766 -0.601MeansdMRdur -0.475 -0.443 -0.268 -0.301 -0.263 -0.308 -0.457 0.817 0.817 -0.132MeangrateMR -0.239 -0.260 0.235 0.285 0.063 0.145 -0.616 -0.232 -0.284 -0.221MeanpctdurMR -0.660 -0.650 -0.095 -0.106 -0.219 -0.227 -0.778 0.394 0.341 -0.315MeanglncesNR -0.899 -0.861 -0.474 -0.537 -0.480 -0.571 -0.665 0.776 0.740 -0.361MeanduratNR -0.881 -0.841 -0.475 -0.547 -0.473 -0.577 -0.628 0.822 0.788 -0.334MeanmeanNRdr -0.083 -0.068 -0.412 -0.486 -0.251 -0.372 0.218 0.287 0.308 -0.061MeanmedNRdur -0.069 -0.055 -0.410 -0.465 -0.248 -0.340 0.193 0.224 0.248 -0.078MeansdNRdur -0.112 -0.118 -0.020 -0.113 -0.054 -0.195 0.032 0.399 0.377 0.039MeangrateNR -0.149 -0.141 0.400 0.450 0.256 0.345 -0.490 -0.181 -0.218 0.007MeanpctdurNR -0.592 -0.553 0.036 0.000 -0.046 -0.086 -0.627 0.503 0.462 -0.087MinTdur -0.487 -0.499 -0.216 -0.162 -0.292 -0.212 -0.452 -0.313 -0.356 -0.422MinRDdur -0.487 -0.499 -0.216 -0.162 -0.292 -0.212 -0.452 -0.313 -0.356 -0.422MinSAdur 0.072 0.088 0.046 -0.014 0.117 0.026 0.393 -0.253 -0.260 0.165MinNAdur -0.757 -0.770 -0.860 -0.909 -0.815 -0.902 -0.393 0.489 0.465 -0.635MinMRdur 0.093 0.147 0.167 0.092 0.278 0.172 0.557 -0.122 -0.115 0.410MinNRdur 0.072 0.088 0.046 -0.014 0.117 0.026 0.393 -0.253 -0.260 0.165MaxTdur -0.930 -0.898 -0.677 -0.693 -0.650 -0.674 -0.679 0.669 0.648 -0.510MaxRDdur -0.930 -0.898 -0.677 -0.693 -0.650 -0.674 -0.679 0.669 0.648 -0.510MaxSAdur -0.530 -0.460 -0.014 -0.096 0.004 -0.105 -0.099 0.430 0.403 0.143MaxNAdur 0.076 0.075 -0.197 -0.306 -0.092 -0.264 0.347 0.231 0.237 0.064MaxMRdur -0.530 -0.460 -0.014 -0.096 0.004 -0.105 -0.099 0.430 0.403 0.143MaxNRdur 0.072 0.072 -0.196 -0.306 -0.090 -0.262 0.351 0.234 0.240 0.069
Highlights + correlations >.707 Highlights - correls < -.707Highlights + correlations >.665, p<.05 Highlights - correls < -..665
Auditory-Vocal Tasks Only: Sternberg Data Correlated with Test Track Performance

Appendix R Sternberg Surrogate
R-37
•

Appendix R Sternberg Surrogate
R-38
Table R-10. Sternberg Metrics for Combination and Just Tasks, as Correlated With Track

Appendix R Sternberg Surrogate
R-39
Metric PctMiss PctAllErr MeanRTCor MdnRTCor MeanRTAll MdnRTAll CombDecr MeanRTIncor MdnRTIncor PctEGDMdnSDLP -0.354 -0.272 -0.338 -0.413 -0.228 -0.296 -0.167 -0.194 -0.208 0.273MdnSpeedDiff_al 0.999 0.999 0.999 0.993 0.997 1.000 0.990 0.993 0.995 0.832PctCrossTrials -0.002 0.084 0.015 -0.066 0.130 0.059 0.191 0.164 0.150 0.595PctLVDecelMissR 0.640 0.703 0.653 0.589 0.735 0.685 0.776 0.758 0.749 0.972PctCHMSLMissR 0.419 0.339 0.403 0.476 0.295 0.362 0.236 0.262 0.276 -0.205PctFVTSMissRate 0.842 0.885 0.851 0.806 0.906 0.873 0.930 0.920 0.914 0.998MeanTskglncs -0.426 -0.346 -0.410 -0.483 -0.303 -0.370 -0.243 -0.269 -0.283 0.198MeanTaskdur -0.249 -0.165 -0.233 -0.311 -0.119 -0.190 -0.058 -0.085 -0.099 0.377MeanmeanTdur -0.962 -0.935 -0.957 -0.977 -0.917 -0.943 -0.891 -0.903 -0.909 -0.609MeanmedTdur -1.000 -0.995 -0.999 -0.999 -0.989 -0.997 -0.978 -0.983 -0.985 -0.792MeansdTdur -0.792 -0.736 -0.781 -0.829 -0.704 -0.753 -0.659 -0.679 -0.690 -0.271MeanTglsprs 0.165 0.080 0.148 0.228 0.034 0.104 -0.028 -0.001 0.013 -0.456MeanglncesRD -0.471 -0.393 -0.456 -0.526 -0.351 -0.416 -0.292 -0.318 -0.331 0.148MeanduratRD -0.230 -0.145 -0.213 -0.291 -0.100 -0.170 -0.038 -0.065 -0.079 0.396MeanmeanRDdr -0.898 -0.857 -0.891 -0.925 -0.833 -0.870 -0.797 -0.813 -0.821 -0.459MeanmedRDdur -0.931 -0.896 -0.925 -0.952 -0.875 -0.907 -0.843 -0.857 -0.865 -0.530MeansdRDdur -0.553 -0.479 -0.538 -0.605 -0.438 -0.501 -0.382 -0.407 -0.420 0.053MeangrateRD 0.060 -0.026 0.043 0.123 -0.072 -0.001 -0.134 -0.107 -0.093 -0.547MeanpctdurRD -0.305 -0.222 -0.289 -0.365 -0.177 -0.246 -0.116 -0.142 -0.156 0.323MeanglncesSA -0.788 -0.732 -0.777 -0.826 -0.700 -0.749 -0.655 -0.675 -0.685 -0.266MeanduratSA -0.874 -0.829 -0.866 -0.903 -0.802 -0.843 -0.764 -0.781 -0.790 -0.412MeanmeanSAdr -1.000 -0.998 -1.000 -0.996 -0.995 -0.999 -0.986 -0.990 -0.992 -0.819MeanmedSAdur -0.989 -0.998 -0.991 -0.977 -1.000 -0.996 -0.999 -1.000 -1.000 -0.882MeansdSAdur -0.984 -0.965 -0.981 -0.993 -0.952 -0.971 -0.931 -0.941 -0.945 -0.684MeangrateSA -1.000 -0.998 -1.000 -0.997 -0.993 -0.999 -0.984 -0.989 -0.991 -0.813MeanpctdurSA -1.000 -0.997 -1.000 -0.997 -0.992 -0.999 -0.983 -0.987 -0.990 -0.807MeanglncesNA 0.453 0.528 0.468 0.395 0.566 0.506 0.616 0.595 0.583 0.895MeanduratNA 0.546 0.616 0.561 0.492 0.652 0.596 0.697 0.678 0.667 0.938MeanmeanNAdr 0.381 0.300 0.365 0.439 0.256 0.324 0.196 0.222 0.236 -0.245MeanmedNAdur 0.324 0.241 0.307 0.383 0.196 0.265 0.135 0.162 0.176 -0.304MeansdNAdur 0.596 0.525 0.583 0.647 0.486 0.546 0.431 0.455 0.468 0.000MeangrateNA 0.985 0.996 0.988 0.973 0.999 0.994 1.000 1.000 1.000 0.892MeanpctdurNA 0.982 0.963 0.979 0.992 0.949 0.969 0.928 0.938 0.943 0.677MeanglncesMR -0.729 -0.668 -0.718 -0.772 -0.633 -0.686 -0.584 -0.606 -0.617 -0.178MeanduratMR -0.842 -0.793 -0.833 -0.875 -0.764 -0.808 -0.723 -0.741 -0.750 -0.355MeanmeanMRdr -0.991 -0.999 -0.993 -0.981 -1.000 -0.997 -0.998 -0.999 -1.000 -0.875MeanmedMRdur -0.958 -0.979 -0.963 -0.938 -0.988 -0.974 -0.995 -0.992 -0.991 -0.940MeansdMRdur -0.998 -0.988 -0.996 -1.000 -0.980 -0.992 -0.966 -0.973 -0.976 -0.761MeangrateMR -0.992 -0.999 -0.994 -0.981 -1.000 -0.998 -0.998 -0.999 -1.000 -0.873MeanpctdurMR -0.997 -1.000 -0.998 -0.990 -0.998 -1.000 -0.993 -0.996 -0.997 -0.845MeanglncesNR -0.415 -0.335 -0.399 -0.472 -0.291 -0.358 -0.232 -0.258 -0.272 0.210MeanduratNR -0.432 -0.353 -0.417 -0.489 -0.310 -0.377 -0.251 -0.277 -0.290 0.190MeanmeanNRdr 0.336 0.254 0.320 0.395 0.209 0.278 0.148 0.175 0.189 -0.292MeanmedNRdur 0.049 -0.037 0.032 0.112 -0.083 -0.012 -0.145 -0.118 -0.104 -0.556MeansdNRdur 0.914 0.875 0.907 0.938 0.852 0.887 0.818 0.833 0.841 0.491MeangrateNR 0.382 0.301 0.366 0.440 0.257 0.325 0.197 0.223 0.237 -0.244MeanpctdurNR 0.405 0.325 0.390 0.463 0.281 0.349 0.222 0.248 0.262 -0.220MinSAdur -1.000 -0.995 -1.000 -0.999 -0.989 -0.997 -0.979 -0.984 -0.986 -0.795MinNAdur -0.993 -0.999 -0.995 -0.983 -1.000 -0.998 -0.997 -0.999 -0.999 -0.868MinMRdur -1.000 -0.995 -1.000 -0.999 -0.989 -0.997 -0.979 -0.984 -0.986 -0.795MinNRdur -1.000 -0.995 -1.000 -0.999 -0.989 -0.997 -0.979 -0.984 -0.986 -0.795MaxTdur -0.577 -0.504 -0.563 -0.628 -0.464 -0.526 -0.408 -0.433 -0.446 0.024MaxRDdur -0.577 -0.504 -0.563 -0.628 -0.464 -0.526 -0.408 -0.433 -0.446 0.024MaxSAdur -0.992 -0.999 -0.994 -0.982 -1.000 -0.998 -0.998 -0.999 -1.000 -0.871MaxNAdur 0.951 0.921 0.946 0.969 0.902 0.931 0.874 0.887 0.893 0.580MaxMRdur -0.992 -0.999 -0.994 -0.982 -1.000 -0.998 -0.998 -0.999 -1.000 -0.871MaxNRdur 0.264 0.180 0.248 0.325 0.135 0.205 0.073 0.100 0.114 -0.363
Highlights + correlations >.707 Highlights - correls < -.707Highlights + correlations >.665, p<.05 Highlights - correls < -..665
Combination Tasks & Just Sternberg Data Correlated With Test Track Performance Data
Note: Correlations for task-related glance metrics could not be computed due to insufficient observations and have been deleted from matrix. Remaining correlations in matrix with values of +/ 1 0 are due to

Appendix R Sternberg Surrogate
R-40

Appendix R Sternberg Surrogate
R-41
R.1.4.2 Sternberg Data versus On-road Data by Task Type
Visual-Manual Tasks
Table R-11 shows the correlations between the Sternberg data and the test track data for the visual-manual subset of tasks. As can be seen by the highlighted cells, the Sternberg metrics of Percent Miss, Percent All Error, and Combined Decrement score had predictive validity for Percent FVTS Miss Rate performance during visual-manual tasks done on the road, just as they did on the test track (Table R-8). However, in addition, in the road data, they also predicted Percent CHMSL Miss Rate. There were also a few significant positive correlations between Sternberg metrics and glance metrics, as well as some significant negative correlations between Sternberg metrics and glance metrics. Auditory-Vocal Tasks
Table R-12 shows the correlations between the Sternberg data the road data for the auditory-vocal subset of tasks. Toward the top of the table, the green highlighted cells indicate that on the road, a variety of Sternberg metrics were positively correlated with Percent CHMSL Miss Rate and Percent FVTS Miss Rate. However, none of the Sternberg metrics predicted Percent LVD Miss Rate on the road (unlike on the track, where Mean RT All was correlated with it). In addition, there were again numerous significant positive and negative correlations between the Sternberg metrics and glance metrics (as in the track data, these were far more extensive than the relationships observed for the visual-manual task set). Most interesting among these was a high-positive correlation with MeanPctDurRd (or the Percent of Time During Task Spent Looking at the Road, which the eye-glance analysis revealed as a distinguishing metric of auditory-vocal tasks). Combination and Just Tasks
Because there was only one combination task run in the on-road venue, it was not possible to do a separate set of correlations.

Appendix R Sternberg Surrogate
R-42
Table R-11. Sternberg Metrics for Visual-Manual Tasks Only, With Road Data

Appendix R Sternberg Surrogate
R-43
•
Metric PctMiss PctAllErr MeanRTCor MdnRTCorMeanRTAll MdnRTAll CombDecr MeanRTIncor MdnRTIncor PctEGDMdnSDLP -0.497 -0.499 0.026 0.035 -0.159 -0.151 -0.432 -0.540 -0.540 0.164MdnSpeedDiff -0.425 -0.431 0.113 0.121 -0.091 -0.084 -0.367 -0.473 -0.472 0.190PctCrossTrials -0.279 -0.264 0.222 0.228 0.004 0.011 -0.222 -0.513 -0.513 0.336PctLVDecelMissRate_ 0.604 0.641 0.296 0.287 0.430 0.424 0.551 0.560 0.560 0.270PctCHMSLMissRate 0.947 0.969 0.532 0.517 0.613 0.604 0.914 0.454 0.453 0.417PctFVTSMissRate 0.831 0.862 0.595 0.585 0.610 0.605 0.840 0.193 0.193 0.339MeanTskglncs -0.043 -0.055 0.397 0.398 0.208 0.212 -0.035 -0.025 -0.025 0.419MeanTaskdur -0.218 -0.220 0.233 0.237 0.023 0.028 -0.187 -0.334 -0.334 0.335MeanmeanTdur -0.506 -0.482 -0.459 -0.450 -0.512 -0.508 -0.432 -0.852 -0.851 -0.367MeansdTdur -0.524 -0.496 -0.360 -0.350 -0.451 -0.446 -0.444 -0.865 -0.864 -0.267MeanTglsprs 0.596 0.581 0.491 0.482 0.550 0.545 0.518 0.861 0.860 0.340MeanglncesRD -0.024 -0.037 0.410 0.411 0.224 0.227 -0.017 -0.005 -0.006 0.424MeanduratRD -0.444 -0.427 -0.022 -0.015 -0.231 -0.224 -0.386 -0.698 -0.698 0.173MeanmeanRDdr -0.581 -0.558 -0.472 -0.462 -0.544 -0.539 -0.508 -0.877 -0.876 -0.339MeanmedRDdur -0.589 -0.572 -0.588 -0.579 -0.613 -0.609 -0.525 -0.823 -0.822 -0.462MeansdRDdur -0.550 -0.525 -0.336 -0.326 -0.434 -0.428 -0.467 -0.862 -0.861 -0.205MeangrateRD 0.622 0.610 0.488 0.479 0.564 0.559 0.546 0.877 0.876 0.314MeanpctdurRD -0.610 -0.587 -0.456 -0.446 -0.532 -0.527 -0.535 -0.870 -0.869 -0.277MeanglncesSA -0.553 -0.565 0.086 0.095 -0.071 -0.062 -0.543 -0.073 -0.072 0.314MeanduratSA -0.413 -0.418 0.206 0.214 0.075 0.082 -0.385 -0.055 -0.054 0.466MeanmeanSAdr 0.492 0.527 0.356 0.348 0.430 0.425 0.543 -0.046 -0.045 0.640MeanmedSAdur 0.481 0.525 0.269 0.260 0.346 0.340 0.522 -0.112 -0.110 0.613MeanpctdurSA -0.337 -0.344 -0.200 -0.195 -0.044 -0.042 -0.318 0.217 0.219 0.104MeanglncesTR 0.080 0.072 0.505 0.506 0.308 0.311 0.083 0.033 0.033 0.451MeanduratTR 0.194 0.173 0.512 0.509 0.364 0.366 0.177 0.254 0.253 0.419MeanmeanTRdr 0.588 0.557 0.299 0.289 0.455 0.449 0.516 0.906 0.905 0.147MeanmedTRdur 0.476 0.461 0.251 0.242 0.389 0.383 0.391 0.875 0.874 0.224MeansdTRdur 0.761 0.714 0.432 0.421 0.611 0.604 0.727 0.896 0.895 0.033MeangrateTR 0.703 0.699 0.655 0.645 0.638 0.634 0.642 0.695 0.694 0.377MeanpctdurTR 0.641 0.624 0.510 0.500 0.553 0.548 0.566 0.819 0.817 0.283MeangrateNA 0.237 0.264 0.253 0.253 0.333 0.333 0.187 0.568 0.569 0.148MeanpctdurNA 0.312 0.324 0.259 0.259 0.411 0.410 0.286 0.639 0.640 0.103MeanglncesMR -0.611 -0.633 -0.049 -0.040 -0.190 -0.182 -0.610 -0.082 -0.082 0.171MeanduratMR -0.482 -0.497 0.073 0.081 -0.041 -0.035 -0.457 -0.093 -0.092 0.346MeanmeanMRdr 0.302 0.343 0.289 0.284 0.327 0.324 0.359 -0.177 -0.176 0.651MeanmedMRdur 0.288 0.340 0.239 0.234 0.280 0.277 0.334 -0.195 -0.194 0.671MeanglncesNR -0.070 -0.082 0.399 0.401 0.201 0.206 -0.060 -0.044 -0.045 0.408MeanduratNR 0.118 0.093 0.485 0.484 0.332 0.335 0.110 0.210 0.209 0.395MeanmeanNRdr 0.690 0.664 0.476 0.466 0.586 0.580 0.627 0.897 0.896 0.173MeansdNRdur 0.694 0.645 0.373 0.363 0.543 0.537 0.650 0.896 0.896 -0.010MeangrateNR 0.565 0.549 0.512 0.504 0.550 0.546 0.489 0.845 0.844 0.355MeanpctdurNR 0.631 0.606 0.479 0.469 0.555 0.550 0.560 0.876 0.875 0.253MaxTdur -0.252 -0.182 -0.386 -0.388 -0.466 -0.468 -0.242 -0.807 -0.806 0.230MaxRDdur -0.252 -0.182 -0.386 -0.388 -0.466 -0.468 -0.242 -0.807 -0.806 0.230MaxTRdur 0.499 0.453 0.360 0.352 0.363 0.359 0.439 0.641 0.639 -0.075
Highlights + correlations >.707 Highlights - correls < -.707Highlights + correlations >.665, p<.05 Highlights - correls < -..665
Visual-Manual Tasks Only: Sternberg Data Correlated With Road Performance Data

Appendix R Sternberg Surrogate
R-44
Table R-12. Sternberg Metrics for Auditory-Vocal Tasks Only, With Road Data
•
Metric PctMiss PctAllErr MeanRTCor MdnRTCor MeanRTAll MdnRTAll CombDecr MeanRTIncor MdnRTIncor PctEGDMdnSDLP -0.901 -0.846 -0.497 -0.557 -0.467 -0.552 -0.525 0.761 0.735 -0.284MdnSpeedDiff -0.798 -0.724 -0.396 -0.470 -0.326 -0.428 -0.358 0.756 0.741 -0.111PctCrossTrials -0.217 -0.252 -0.735 -0.746 -0.654 -0.690 0.015 0.344 0.364 -0.436PctLVDecelMissRate -0.038 -0.029 -0.233 -0.239 -0.115 -0.107 0.102 -0.689 -0.644 -0.127PctCHMSLMissRate 0.697 0.708 0.837 0.848 0.774 0.803 0.495 -0.364 -0.350 0.667PctFVTSMissRate 0.908 0.933 0.720 0.703 0.805 0.786 0.915 -0.546 -0.504 0.784MeanTskglncs -0.917 -0.892 -0.581 -0.641 -0.593 -0.681 -0.702 0.826 0.791 -0.460MeanTaskdur -0.878 -0.841 -0.588 -0.675 -0.555 -0.685 -0.520 0.832 0.803 -0.363MeanmeanTdur 0.301 0.316 0.138 0.086 0.240 0.160 0.557 -0.355 -0.345 0.280MeansdTdur 0.272 0.312 0.149 0.072 0.287 0.173 0.670 -0.174 -0.155 0.418MeanTglsprs -0.613 -0.632 -0.336 -0.296 -0.456 -0.397 -0.841 0.453 0.421 -0.518MeanglncesRD -0.914 -0.890 -0.579 -0.639 -0.590 -0.680 -0.700 0.828 0.793 -0.457MeanduratRD -0.859 -0.821 -0.579 -0.670 -0.539 -0.675 -0.484 0.828 0.799 -0.340MeanmeanRDdr 0.215 0.237 0.089 0.024 0.197 0.099 0.532 -0.253 -0.246 0.270MeanmedRDdur 0.223 0.197 0.089 0.065 0.098 0.056 0.301 -0.500 -0.514 0.022MeansdRDdur 0.341 0.393 0.273 0.190 0.409 0.290 0.775 -0.147 -0.124 0.564MeangrateRD -0.487 -0.514 -0.233 -0.180 -0.370 -0.290 -0.803 0.337 0.307 -0.475MeanpctdurRD 0.901 0.892 0.618 0.623 0.665 0.673 0.808 -0.716 -0.685 0.575MeanglncesSA -0.919 -0.894 -0.577 -0.636 -0.590 -0.677 -0.708 0.817 0.781 -0.461MeanduratSA -0.936 -0.910 -0.608 -0.666 -0.613 -0.700 -0.693 0.813 0.779 -0.471MeanmeanSAdr -0.894 -0.853 -0.736 -0.786 -0.662 -0.739 -0.457 0.754 0.741 -0.422MeanmedSAdur -0.832 -0.795 -0.780 -0.833 -0.685 -0.768 -0.349 0.713 0.706 -0.417MeanpctdurSA -0.923 -0.912 -0.623 -0.635 -0.664 -0.683 -0.815 0.731 0.698 -0.573MeangrateNA 0.830 0.795 0.575 0.661 0.528 0.657 0.500 -0.738 -0.709 0.364MeanpctdurNA 0.813 0.774 0.512 0.598 0.470 0.597 0.481 -0.676 -0.644 0.326MeanglncesMR -0.906 -0.879 -0.548 -0.607 -0.562 -0.648 -0.709 0.823 0.788 -0.438MeanduratMR -0.922 -0.892 -0.569 -0.628 -0.574 -0.661 -0.691 0.822 0.788 -0.437MeanmeanMRdr -0.855 -0.801 -0.647 -0.708 -0.562 -0.652 -0.411 0.803 0.794 -0.311MeanmedMRdur -0.808 -0.754 -0.662 -0.727 -0.565 -0.662 -0.293 0.781 0.776 -0.278MeanglncesNR -0.902 -0.872 -0.552 -0.617 -0.557 -0.653 -0.673 0.840 0.806 -0.417MeanduratNR -0.919 -0.890 -0.604 -0.666 -0.601 -0.692 -0.681 0.839 0.807 -0.453MeanmeanNRdr -0.885 -0.860 -0.790 -0.815 -0.728 -0.769 -0.582 0.667 0.654 -0.548MeansdNRdur -0.702 -0.662 -0.469 -0.480 -0.432 -0.445 -0.591 0.687 0.682 -0.315MeangrateNR -0.677 -0.670 -0.307 -0.305 -0.395 -0.387 -0.771 0.640 0.610 -0.385MeanpctdurNR -0.881 -0.861 -0.582 -0.604 -0.606 -0.638 -0.753 0.796 0.769 -0.488MaxTdur -0.441 -0.396 -0.091 -0.216 -0.067 -0.247 -0.073 0.535 0.504 0.075MaxRDdur -0.441 -0.396 -0.091 -0.216 -0.067 -0.247 -0.073 0.535 0.504 0.075
Highlights + correlations >.707 Highlights - correls < -.707Highlights + correlations >.665, p<.05 Highlights - correls < -..665
Auditory-Vocal Tasks Only: Sternberg Data Correlated With Road Performance Data

Appendix R Sternberg Surrogate
R-45
R.1.4.3 Summary of Sternberg Effects by Task Type The analyses above demonstrated that Sternberg metrics retained predictive validity for event detection for each type of task—visual-manual, auditory-vocal, and combination.
The relationships between Sternberg and the auditory-vocal and mixed-mode (combination tasks plus just driving), appeared more extensive than those between Sternberg metrics and the visual-manual tasks. Perhaps this is because the Sternberg method is sensitive to working memory load, and the auditory-vocal and combination tasks were designed to impose more of this type of load than the visual-manual tasks. It should also be noted that the Sternberg metrics were highly correlated with Percent CHMSL and Percent FVTS Miss Rates, but only in one instance related to Percent LVD Miss Rate. Nonetheless, these analyses indicate that, in terms of predictive validity, one or more Sternberg metrics can serve as surrogate indicators for CHMSL and FVTS event detection metrics (and selected glance metrics) for visual-manual, auditory-vocal, and combination task types.

Appendix R Sternberg Surrogate
R-46
R.1.5 Summary of Sternberg Results While doing the Sternberg test, performance decrements on in-vehicle tasks were observed along with performance decrements on the Sternberg test itself, and the degree to which performance suffered on the in-vehicle task seems to have depended on the task. Performance degraded on some tasks more than others. This was confirmed by formal statistical analysis.
Performance on the Sternberg test held information about the resource demands of in-vehicle tasks, as did metrics based on the combined performance on Sternberg and in-vehicle tasks.
Verbal and spatial Sternberg stimuli yielded similar patterns of results, though the spatial Sternberg stimuli were more difficult (taking longer to respond to, on average, and producing more errors). However, there were some slight departures from this pattern for a few tasks that imposed a load on verbal working memory. These differences by task did not conform to the hypothesized differences that were expected; that is, the spatial stimuli did not interfere uniquely or more with tasks hypothesized to require more spatial working memory.
Split-Half Reliability Analyses of Sternberg Measures revealed that the most reliable measures were:
• Proportion Missed Detections
• Proportion All Errors
• RT to Correct Responses (Mean and Median)
• RT to All Responses, regardless of accuracy of response (Mean and Median)
• Combined Decrement Score (a new measure that combined performance on Sternberg task with performance on in-vehicle task).
Sternberg metrics were predictive of “missed detections of events” in driving performance, and were also predictive of eye-glance measures (such as total glance rate, glance rate to the road), metrics related to glances at task-related areas (such as glance rate to task-related areas, duration of task-related glances, percent duration spent looking at Task-Related areas, as well as maximum duration of glances to Task-Related areas), and metrics related to glances at not-road areas (such as glance rate to areas other than the road, and percent of task duration spent looking at areas other than the road), and for auditory-vocal tasks, with percent of task duration spent looking at the road. Analyses of the predictive validity of Sternberg measures, in which Sternberg measures were correlated with driving performance measures on-the-road, indicated that the highest predictive validity for the road data was for event detection and eye-glance measures, where all reliable Sternberg measures demonstrated some level of predictive validity. For the track data, only Proportion Missed Detections and Proportion All Error, and the RT measures demonstrated predictive validity for the driving performance data—and it was again for event detection (Percent CHMSL Miss Rate and Percent FVTS Miss Rate)—with the RT measures demonstrating predictive validity for selected eye-glance measures.
The new Sternberg Combined Decrement Score appeared to be sensitive not only to tasks that were high in visual demand but also tasks that appeared to be especially loading on working memory. However, there appeared to be few driving performance measures especially sensitive to

Appendix R Sternberg Surrogate
R-47
this latter type of resource. The combined decrement score did emerge in the predictive validity analyses, as having predictive validity for driving performance on the metric of Percent Follow Vehicle Turn Signal Miss Rate. This finding suggests that further study of the effects that working memory loads and cognitive demands may have on the driving performance may be worthwhile.
To conclude, the data demonstrated that the Sternberg test indeed functioned as we had hoped it would: as a surrogate test that was somewhat like a peripheral detection task, but had a memory-loading component, and perhaps provided a means of evaluating combined visual and cognitive loads of in-vehicle tasks. Surprisingly, the Sternberg method also proved to be an effective surrogate for predicting event detection in these data.
R.2 Appendix References Sternberg, S. High-speed scanning in human memory. Science, 1966, 153, 652-654.
Verbeke, G. and Molenberghs, G. (1997), Linear Mixed Models in Practice: A SAS-Oriented Approach, New York: Springer-Verlag.

S-1
S Appendix S. Star Charts – Task Effects on Driving Performance Metrics
S.1 Purpose Star charts (also called radar charts) were developed to allow a task’s effects on multiple dimensions of driving performance to be simultaneously illustrated in away that is easily grasped and compared with the effects of other tasks on the same set of dimensions. It was furthermore a technique that was applicable to data from both the test track and on road testing segments of the CAMP Driver Workload Metrics (DWM) project. The star charts may serve as a decision support tool during evaluations of task workload effects on driving performance.
S.2 Methodology Four categories of driving performance measures were covered in the DWM project, namely, lateral control, longitudinal control, event detection, and eye-glance measures. Ten driving performance metrics were chosen from the aforementioned categories, on the basis of repeatability and discriminability analyses reported in Chapter 3 and 4. These ten metrics emerged as important for one or more of the following: distinguishing between task types, distinguishing multitasking from just driving, and/or distinguishing high- from low-workload tasks within a task type. In this appendix, they were applied to individual tasks in order to examine the extent to which patterns of interference with driving performance are specific to tasks (versus shared among tasks of similar types).
The particular metrics chosen included the following. From the category of lateral control measures, Median Standard Deviation of Lane Position and Percent Lane Exceedance Cross Trials were chosen. From the category of longitudinal control metrics, Median Speed Difference was chosen. The event detection metrics included Percent Miss Rate for Lead Vehicle Decelerations, Percent Miss Rate for CHMSLs, and Percent Miss Rate for Follow Vehicle Turn Signal Events. The eyeglance measures included Mean Glance Duration to the Road, Mean Number of Glances to Task-Related Locations, Mean Number of Glances to the Mirrors, and Mean Total Glance Rate.
Each performance metric identified above is illustrated on a radial in the star chart, and its scale is normalized (it depicts scores that have first been converted to standard z-scores). The use of a standardized z-score scale for every radial places all measures on the same scale, and allows straightforward comparisons of effects to determine on which radials scores are high (e.g., relative to some desired criterion level, for example). It also permits an examination of whether the overall area of a task on the chart (which represents the extent of its effects on all measures) is larger than some desired criterion. (Criterion values can themselves be illustrated on each radial by plotting them, and creating a reference annulus, or “comparison star” pattern on each chart, but that has not been done here). Most importantly, star charts allow a task’s effects on multiple dimensions to be simultaneously illustrated in a way that is apparent in the size and shape of the “star” pattern on the chart.
In addition, tasks may be compared to each other. It can be worthwhile to compare a task to the task of Just Drive. It can be of interest to compare a task to others of its type (e.g., other visual-manual tasks, for example). It can be meaningful to identify unique aspects of a task’s effects that differ from other tasks. In these charts, it can also be informative to compare tasks to the mean of the task set (which is represented by the “zero”

Appendix S Star Charts
S-2
line, or ring. on each plot). However, if this is done, it should be kept in mind that this mean is specific to this set of tasks (and not likely to be the same for a different set of tasks).
The star charts were constructed by taking the task-level scores on a metric (e.g. mean glance duration to the road for each task in the set) and converting each of them to a z-score, using standard statistical formulas. This was accomplished through the following procedure. For a given metric that was to be depicted on a star chart radial, the mean and standard deviation across the sample of task scores on that metric were computed. Then, from each task score in the task set, the mean was subtracted from it, and the resulting difference was divided by the standard deviation. This yields, for each task, a new score (a z-score), expressed in standard-deviation units. The resulting (new) set of z-scores on that metric always has a mean of zero and a standard deviation of 1.0. This process was repeated for each metric that was to be displayed as a radial on the star charts.
Once the z-scores were computed for all tasks on all metrics, the star charts were plotted (ordering radials identically on all plots). This was done in Microsoft Excel. Each plot was charted on the same scale (e.g., from -3, -2, -1, 0, +1, +2, +3, +4) to allow comparisons across tasks to be made.
Star charts were prepared for all tasks performed during on-road and test track testing. However, the data from the test track and road venues were analyzed separately. The values shown on each star chart are thus based on z-scores, which were calculated from the venue in which the data was collected.
S.3 Results The star charts for each task performed on the track are presented first, followed by the star charts for tasks done on the road.
S.3.1 Comparing Stars from Different Venues Generally (but not always), each task’s star looks similar in shape whether based on track data or road data, though there are some changes from track to road in magnitude on some metrics for certain tasks. This is seen most easily by visually inspecting the star charts. For example, the star chart for the Radio (Easy) task done on Track looks similar to that for the road. On the other hand, the stars for Manual Dial, while having some similarities between the venues on some metrics also show differences on some metrics (e.g., more task-related glances to the phone were made on the road).
S.3.2 Comparing Stars for Tasks of Similar Types (Visual-Manual or Auditory-Vocal) There are some commonalities among tasks within a type. For example, the star charts for visual-manual tasks tend to have most of their area between the radials spanned by glance rate and the event detection metrics (lower right third of circle). The auditory-vocal tasks, on the other hand, tend to have most of their area around the radials associated with Duration of Glances to the Road, Number of Glances to Mirrors, and Median Speed Difference (the upper left-third of the circle).

Appendix S Star Charts
S-3
S.3.3 Unique Patterns Specific to Tasks However, even though there are common patterns among types of tasks, there are also task-specific attributes in the star charts. For example, the star chart for Book-on-Tape Summarize is different from Book-on-Tape Listen. These two tasks represent two different types of language-processing demands (listening to versus generating speech). Their effects on driving performance are distinct and this is apparent in their star charts. This not only demonstrates the value of the star charts (in simultaneously depicting effects on multiple metrics), but also indicates that task workload can be very specific in its effects on driving performance.
S.3.4 Track Metrics
Coins - Track Metrics
-3-2-101234
Median SDLP
Median Speed Difference
Percent Cross Trials
Percent LVD Miss Rate
Percent CHMSL Miss Rate
Percent FVTS Miss Rate
Mean Glance Rate
Glance Duration to Road
Mean Glances Task Related
Mean Glances Mirrors
Figure S-1. Coins Task Effects for Track Metrics

Appendix S Star Charts
S-4
Cassette - Track Metrics
-3-2-101234
Median SDLP
Median Speed Difference
Percent Cross Trials
Percent LVD Miss Rate
Percent CHMSL Miss Rate
Percent FVTS Miss Rate
Mean Glance Rate
Glance Duration to Road
Mean Glances Task Related
Mean Glances Mirrors
Figure S-2. Cassette Task Effects for Track Metrics

Appendix S Star Charts
S-5
HVAC - Track Metrics
-3-2-101234
Median SDLP
Median Speed Difference
Percent Cross Trials
Percent LVD Miss Rate
Percent CHMSL Miss Rate
Percent FVTS Miss Rate
Mean Glance Rate
Glance Duration to Road
Mean Glances Task Related
Mean Glances Mirrors
Figure S-3. HVAC Task Effects for Track Metrics

Appendix S Star Charts
S-6
Radio Easy - Track Metrics
-3-2-101234
Median SDLP
Median Speed Difference
Percent Cross Trials
Percent LVD Miss Rate
Percent CHMSL Miss Rate
Percent FVTS Miss Rate
Mean Glance Rate
Glance Duration to Road
Mean Glances Task Related
Mean Glances Mirrors
Figure S-4. Radio Easy Task Effects for Track Metrics

Appendix S Star Charts
S-7
Manual Dial - Track Metrics
-3-2-101234
Median SDLP
Median Speed Difference
Percent Cross Trials
Percent LVD Miss Rate
Percent CHMSL Miss Rate
Percent FVTS Miss Rate
Mean Glance Rate
Glance Duration to Road
Mean Glances Task Related
Mean Glances Mirrors
Figure S-5. Manual Dial Task Effects for Track Metrics

Appendix S Star Charts
S-8
Travel Computations - Track Metrics
-3-2-101234
Median SDLP
Median Speed Difference
Percent Cross Trials
Percent LVD Miss Rate
Percent CHMSL Miss Rate
Percent FVTS Miss Rate
Mean Glance Rate
Glance Duration to Road
Mean Glances Task Related
Mean Glances Mirrors
Figure S-6. Travel Computation Task Effects for Track Metrics

Appendix S Star Charts
S-9
Route Orientation - Track Metrics
-3-2-101234
Median SDLP
Median Speed Difference
Percent Cross Trials
Percent LVD Miss Rate
Percent CHMSL Miss Rate
Percent FVTS Miss Rate
Mean Glance Rate
Glance Duration to Road
Mean Glances Task Related
Mean Glances Mirrors
Figure S-7. Route Orientation Task Effects for Track Metrics

Appendix S Star Charts
S-10
Voice Dial - Track Metrics
-3-2-101234
Median SDLP
Median Speed Difference
Percent Cross Trials
Percent LVD Miss Rate
Percent CHMSL Miss Rate
Percent FVTS Miss Rate
Mean Glance Rate
Glance Duration to Road
Mean Glances Task Related
Mean Glances Mirrors
Figure S-8. Voice-Dial Task Effects for Track Metrics

Appendix S Star Charts
S-11
Book on Tape Listen - Track Metrics
-3-2-101234
Median SDLP
Median Speed Difference
Percent Cross Trials
Percent LVD Miss Rate
Percent CHMSL Miss Rate
Percent FVTS Miss Rate
Mean Glance Rate
Glance Duration to Road
Mean Glances Task Related
Mean Glances Mirrors
Figure S-9. Book-on-Tape Listen Task Effects for Track Metrics

Appendix S Star Charts
S-12
Just Drive - Track Metrics
-3-2-101234
Median SDLP
Median Speed Difference
Percent Cross Trials
Percent LVD Miss Rate
Percent CHMSL Miss Rate
Percent FVTS Miss Rate
Mean Glance Rate
Glance Duration to Road
Mean Glances Task Related
Mean Glances Mirrors
Figure S-10. Just Drive Task Effects for Track Metrics

Appendix S Star Charts
S-13
Bio QA - Track Metrics
-3-2-101234
Median SDLP
Median Speed Difference
Percent Cross Trials
Percent LVD Miss Rate
Percent CHMSL Miss Rate
Percent FVTS Miss Rate
Mean Glance Rate
Glance Duration to Road
Mean Glances Task Related
Mean Glances Mirrors
Figure S-11. Bio QA Task Effects for Track Metrics

Appendix S Star Charts
S-14
Route Instructions - Track Metrics
-3-2-101234
Median SDLP
Median Speed Difference
Percent Cross Trials
Percent LVD Miss Rate
Percent CHMSL Miss Rate
Percent FVTS Miss Rate
Mean Glance Rate
Glance Duration to Road
Mean Glances Task Related
Mean Glances Mirrors
Figure S-12. Route Instructions Task Effects for Track Metrics

Appendix S Star Charts
S-15
Sports - Track Metrics
-3-2-101234
Median SDLP
Median Speed Difference
Percent Cross Trials
Percent LVD Miss Rate
Percent CHMSL Miss Rate
Percent FVTS Miss Rate
Mean Glance Rate
Glance Duration to Road
Mean Glances Task Related
Mean Glances Mirrors
Figure S-13. Sports Task Effects for Track Metrics

Appendix S Star Charts
S-16
Radio Hard - Track Metrics
-3-2-101234
Median SDLP
Median Speed Difference
Percent Cross Trials
Percent LVD Miss Rate
Percent CHMSL Miss Rate
Percent FVTS Miss Rate
Mean Glance Rate
Glance Duration to Road
Mean Glances Task Related
Mean Glances Mirrors
Figure S-14. Radio Hard Task Effects for Track Metrics

Appendix S Star Charts
S-17
CD Track 7 - Track Metrics
-3-2-101234
Median SDLP
Median Speed Difference
Percent Cross Trials
Percent LVD Miss Rate
Percent CHMSL Miss Rate
Percent FVTS Miss Rate
Mean Glance Rate
Glance Duration to Road
Mean Glances Task Related
Mean Glances Mirrors
Figure S-15. CD Track 7 Task Effects for Track Metrics

Appendix S Star Charts
S-18
Route Tracing - Track Metrics
-3-2-101234
Median SDLP
Median Speed Difference
Percent Cross Trials
Percent LVD Miss Rate
Percent CHMSL Miss Rate
Percent FVTS Miss Rate
Mean Glance Rate
Glance Duration to Road
Mean Glances Task Related
Mean Glances Mirrors
Figure S-16. Route Tracing Task Effects for Track Metrics

Appendix S Star Charts
S-19
Delta - Track Metrics
-3-2-101234
Median SDLP
Median Speed Difference
Percent Cross Trials
Percent LVD Miss Rate
Percent CHMSL Miss Rate
Percent FVTS Miss Rate
Mean Glance Rate
Glance Duration to Road
Mean Glances Task Related
Mean Glances Mirrors
Figure S-17. Delta Task Effects for Track Metrics

Appendix S Star Charts
S-20
Book on Tape Summary - Track Metrics
-3-2-101234
Median SDLP
Median Speed Difference
Percent Cross Trials
Percent LVD Miss Rate
Percent CHMSL Miss Rate
Percent FVTS Miss Rate
Mean Glance Rate
Glance Duration to Road
Mean Glances Task Related
Mean Glances Mirrors
Figure S-18. Book on Tape Summary Task Effects for Track Metrics

Appendix S Star Charts
S-21
Destination Entry - Track Metrics
-3-2-101234
Median SDLP
Median Speed Difference
Percent Cross Trials
Percent LVD Miss Rate
Percent CHMSL Miss Rate
Percent FVTS Miss Rate
Mean Glance Rate
Glance Duration to Road
Mean Glances Task Related
Mean Glances Mirrors
Figure S-19. Destination Entry Task Effects for Track Metrics

Appendix S Star Charts
S-22
Read Easy - Track Metrics
-3-2-101234
Median SDLP
Median Speed Difference
Percent Cross Trials
Percent LVD Miss Rate
Percent CHMSL Miss Rate
Percent FVTS Miss Rate
Mean Glance Rate
Glance Duration to Road
Mean Glances Task Related
Mean Glances Mirrors
Figure S-20. Read Easy Task Effects for Track Metrics

Appendix S Star Charts
S-23
Read Hard - Track Metrics
-3-2-101234
Median SDLP
Median Speed Difference
Percent Cross Trials
Percent LVD Miss Rate
Percent CHMSL Miss Rate
Percent FVTS Miss Rate
Mean Glance Rate
Glance Duration to Road
Mean Glances Task Related
Mean Glances Mirrors
Figure S-21. Read Hard Task Effects for Track Metrics
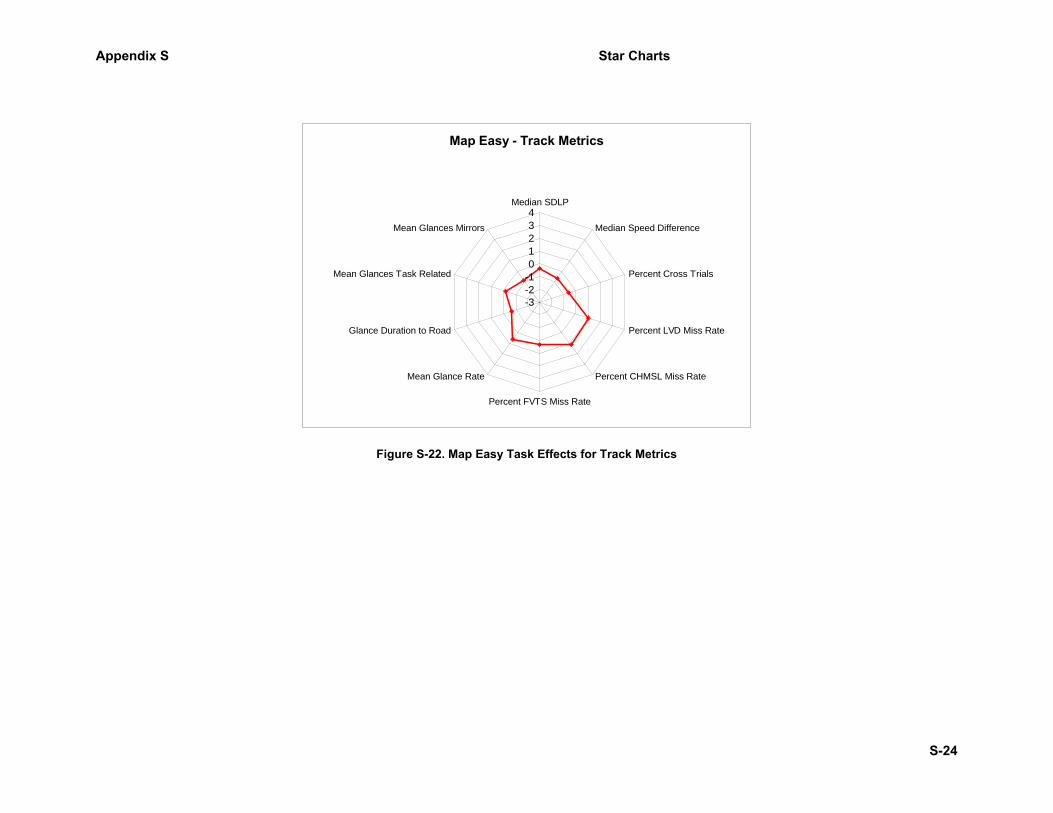
Appendix S Star Charts
S-24
Map Easy - Track Metrics
-3-2-101234
Median SDLP
Median Speed Difference
Percent Cross Trials
Percent LVD Miss Rate
Percent CHMSL Miss Rate
Percent FVTS Miss Rate
Mean Glance Rate
Glance Duration to Road
Mean Glances Task Related
Mean Glances Mirrors
Figure S-22. Map Easy Task Effects for Track Metrics

Appendix S Star Charts
S-25
Map Hard - Track Metrics
-3-2-101234
Median SDLP
Median Speed Difference
Percent Cross Trials
Percent LVD Miss Rate
Percent CHMSL Miss Rate
Percent FVTS Miss Rate
Mean Glance Rate
Glance Duration to Road
Mean Glances Task Related
Mean Glances Mirrors
Figure S-23. Map Hard Task Effects for Track Metrics
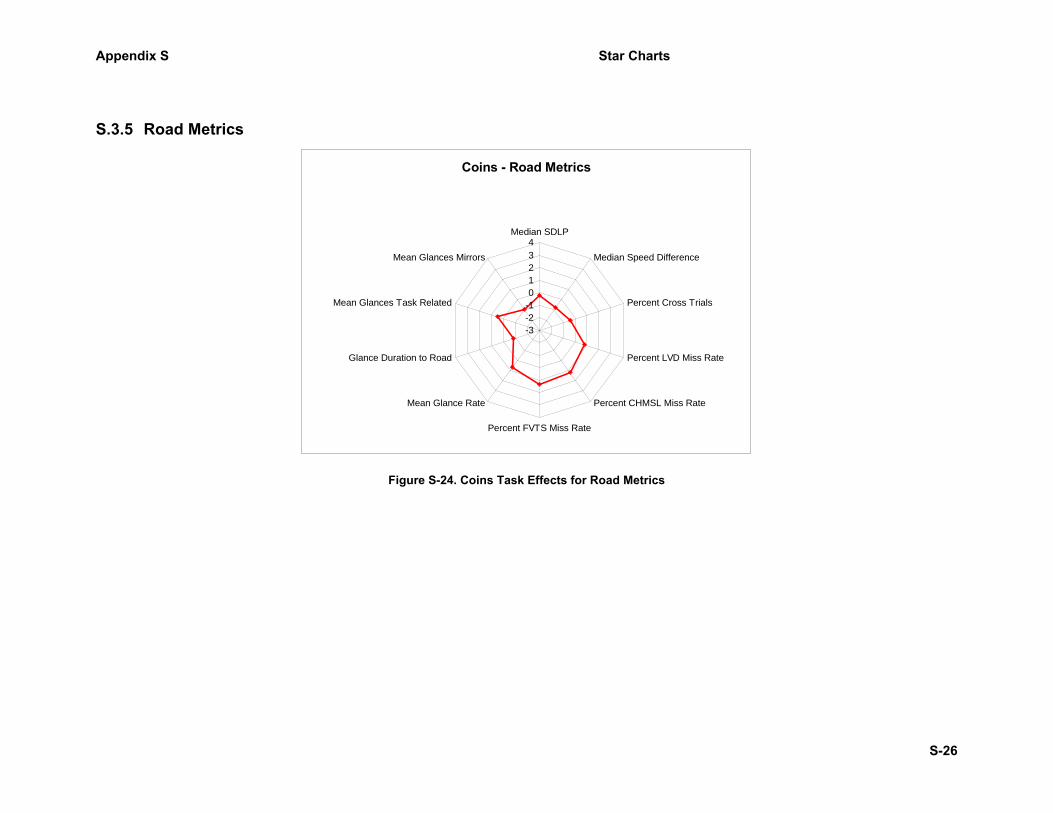
Appendix S Star Charts
S-26
S.3.5 Road Metrics
Coins - Road Metrics
-3-2-101234
Median SDLP
Median Speed Difference
Percent Cross Trials
Percent LVD Miss Rate
Percent CHMSL Miss Rate
Percent FVTS Miss Rate
Mean Glance Rate
Glance Duration to Road
Mean Glances Task Related
Mean Glances Mirrors
Figure S-24. Coins Task Effects for Road Metrics

Appendix S Star Charts
S-27
Cassette - Road Metrics
-3-2-101234
Median SDLP
Median Speed Difference
Percent Cross Trials
Percent LVD Miss Rate
Percent CHMSL Miss Rate
Percent FVTS Miss Rate
Mean Glance Rate
Glance Duration to Road
Mean Glances Task Related
Mean Glances Mirrors
Figure S-25. Cassette Task Effects for Road Metrics

Appendix S Star Charts
S-28
HVAC - Road Metrics
-3-2-101234
Median SDLP
Median Speed Difference
Percent Cross Trials
Percent LVD Miss Rate
Percent CHMSL Miss Rate
Percent FVTS Miss Rate
Mean Glance Rate
Glance Duration to Road
Mean Glances Task Related
Mean Glances Mirrors
Figure S-26. HVAC Task Effects for Road Metrics

Appendix S Star Charts
S-29
Radio Easy - Road Metrics
-3-2-101234
Median SDLP
Median Speed Difference
Percent Cross Trials
Percent LVD Miss Rate
Percent CHMSL Miss Rate
Percent FVTS Miss Rate
Mean Glance Rate
Glance Duration to Road
Mean Glances Task Related
Mean Glances Mirrors
Figure S-27. Radio Easy Task Effects for Road Metrics

Appendix S Star Charts
S-30
Manual Dial - Road Metrics
-3-2-101234
Median SDLP
Median Speed Difference
Percent Cross Trials
Percent LVD Miss Rate
Percent CHMSL Miss Rate
Percent FVTS Miss Rate
Mean Glance Rate
Glance Duration to Road
Mean Glances Task Related
Mean Glances Mirrors
Figure S-28. Manual Dial Task Effects for Road Metrics

Appendix S Star Charts
S-31
Travel Computations - Road Metrics
-3-2-101234
Median SDLP
Median Speed Difference
Percent Cross Trials
Percent LVD Miss Rate
Percent CHMSL Miss Rate
Percent FVTS Miss Rate
Mean Glance Rate
Glance Duration to Road
Mean Glances Task Related
Mean Glances Mirrors
Figure S-29. Travel Computations Task Effects for Road Metrics

Appendix S Star Charts
S-32
Route Orientation - Road Metrics
-3-2-101234
Median SDLP
Median Speed Difference
Percent Cross Trials
Percent LVD Miss Rate
Percent CHMSL Miss Rate
Percent FVTS Miss Rate
Mean Glance Rate
Glance Duration to Road
Mean Glances Task Related
Mean Glances Mirrors
Figure S-30. Route Orientation Task Effects for Road Metrics

Appendix S Star Charts
S-33
Voice Dial - Road Metrics
-3-2-101234
Median SDLP
Median Speed Difference
Percent Cross Trials
Percent LVD Miss Rate
Percent CHMSL Miss Rate
Percent FVTS Miss Rate
Mean Glance Rate
Glance Duration to Road
Mean Glances Task Related
Mean Glances Mirrors
Figure S-31. Voice-Dial Task Effects for Road Metrics

Appendix S Star Charts
S-34
Book on Tape Listen - Road Metrics
-3-2-101234
Median SDLP
Median Speed Difference
Percent Cross Trials
Percent LVD Miss Rate
Percent CHMSL Miss Rate
Percent FVTS Miss Rate
Mean Glance Rate
Glance Duration to Road
Mean Glances Task Related
Mean Glances Mirrors
Figure S-32. Book-on-Tape Listen Task Effects for Road Metrics
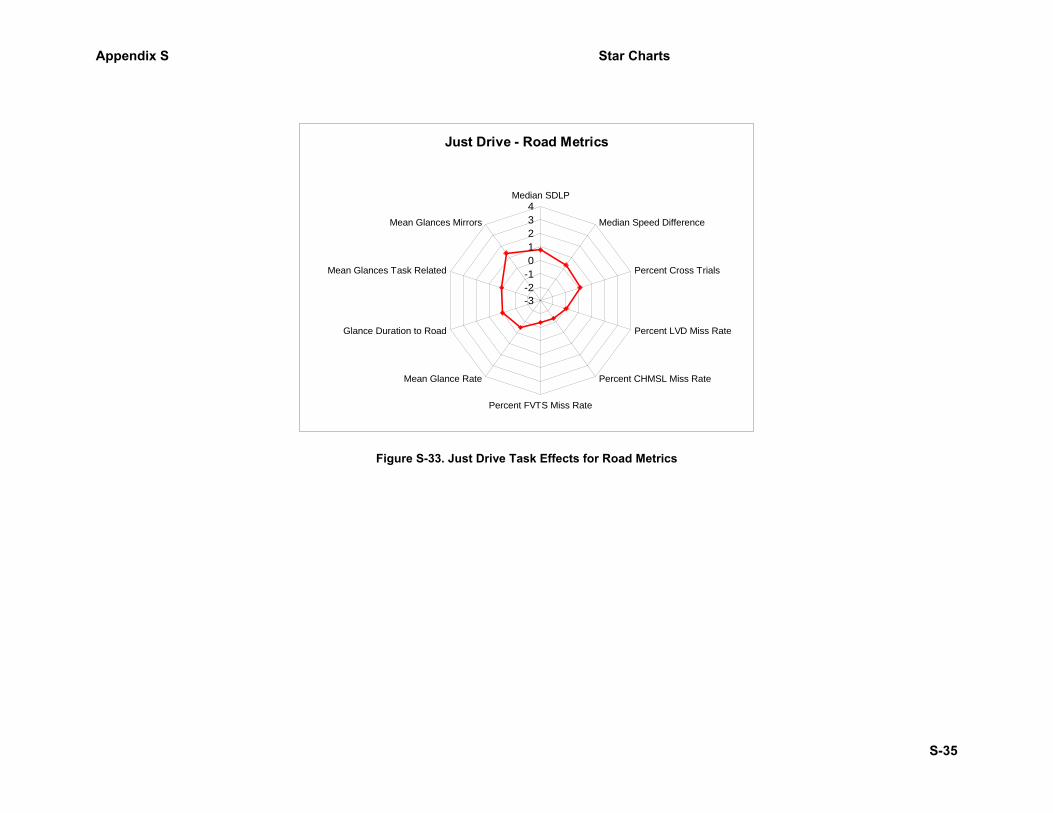
Appendix S Star Charts
S-35
Just Drive - Road Metrics
-3-2-101234
Median SDLP
Median Speed Difference
Percent Cross Trials
Percent LVD Miss Rate
Percent CHMSL Miss Rate
Percent FVTS Miss Rate
Mean Glance Rate
Glance Duration to Road
Mean Glances Task Related
Mean Glances Mirrors
Figure S-33. Just Drive Task Effects for Road Metrics

Appendix S Star Charts
S-36
Bio QA - Road Metrics
-3-2-101234
Median SDLP
Median Speed Difference
Percent Cross Trials
Percent LVD Miss Rate
Percent CHMSL Miss Rate
Percent FVTS Miss Rate
Mean Glance Rate
Glance Duration to Road
Mean Glances Task Related
Mean Glances Mirrors
Figure S-34. Bio QA Task Effects for Road Metrics

Appendix S Star Charts
S-37
Route Instructions - Road Metrics
-3-2-101234
Median SDLP
Median Speed Difference
Percent Cross Trials
Percent LVD Miss Rate
Percent CHMSL Miss Rate
Percent FVTS Miss Rate
Mean Glance Rate
Glance Duration to Road
Mean Glances Task Related
Mean Glances Mirrors
Figure S-35. Route Instructions Task Effects for Road Metrics

Appendix S Star Charts
S-38
Sports - Road Metrics
-3-2-101234
Median SDLP
Median Speed Difference
Percent Cross Trials
Percent LVD Miss Rate
Percent CHMSL Miss Rate
Percent FVTS Miss Rate
Mean Glance Rate
Glance Duration to Road
Mean Glances Task Related
Mean Glances Mirrors
Figure S-36. Sports Task Effects for Road Metrics

Appendix S Star Charts
S-39
Radio Hard - Road Metrics
-3-2-101234
Median SDLP
Median Speed Difference
Percent Cross Trials
Percent LVD Miss Rate
Percent CHMSL Miss Rate
Percent FVTS Miss Rate
Mean Glance Rate
Glance Duration to Road
Mean Glances Task Related
Mean Glances Mirrors
Figure S-37. Radio Hard Task Effects for Road Metrics

Appendix S Star Charts
S-40
CD Track 7 - Road Metrics
-3-2-101234
Median SDLP
Median Speed Difference
Percent Cross Trials
Percent LVD Miss Rate
Percent CHMSL Miss Rate
Percent FVTS Miss Rate
Mean Glance Rate
Glance Duration to Road
Mean Glances Task Related
Mean Glances Mirrors
Figure S-38. CD Track 7 Task Effects for Road Metrics

Appendix S Star Charts
S-41
Book on Tape Summary - Road Metrics
-3-2-101234
Median SDLP
Median Speed Difference
Percent Cross Trials
Percent LVD Miss Rate
Percent CHMSL Miss Rate
Percent FVTS Miss Rate
Mean Glance Rate
Glance Duration to Road
Mean Glances Task Related
Mean Glances Mirrors
Figure S-39. Book-on-Tape Summary Task Effects for Road Metrics

T-1
T Appendix T. CAMP DWM Multivariate Analyses
T.1 Conceptual Explanation of Principal Component Analysis The preceding chapters of this report provide results of univariate analyses that are, in a sense, individual tiles in a broader mosaic. While these findings are significant in and of themselves, they are only two-dimensional snapshots that provide brief glimpses of the underlying inter-relationships and structure in the data. It is this structure, present in the hidden relationships among variables that must be examined to comprehend the abstract concept of driver workload and distraction. Driver workload can be understood within the context of a multifaceted or multi-dimensional phenomenon where the observed effects from multitasking on driving are not uniform across all tasks.
To understand workload in this multidimensional space, an approach must be used that is common to all variables and can provide a weight for each variable with respect to how it contributes to workload based on the underlying structure of variation in the data and its relationship to other variables in the data. A well-known multivariate statistical technique called Principal Component Analysis (PCA) will do this. It has been successfully applied by Young and Angell (2003) to the identification of dimensions underlying driving performance during the concurrent completion of visual-manual tasks. However, the CAMP Driver Workload Metrics (DWM) data set offered a broader set of tasks and conditions under which to examine underlying components of driver workload and its effects on driving performance, and so was believed to be ideal for the extension of PCA work on driver workload.
This chapter describes an integrated framework and approach for applying Principal Component Analysis to a data set with a large number of metrics. PCA was applied to the set of complex data from this project at the level of individual research participants. It uncovered a number of thorny technical issues related to sparseness of eye data and event detection data. Some of these problems were associated with the fact that eye-glance data were reduced for only 18 of the 101 participants in the study, due to the rigor required to meet standards of reliability in frame-by-frame manual scoring of the video data; some of the problems were related to differences in glance patterns between task types; and still others were related to loss of event detection data. Unfortunately, because of missing data from all of these issues, it was determined that the PCA solutions were unstable and could not be used. Nonetheless, the framework and methods used are of sufficient interest that they are described fully here (for possible consideration and use by others). If used by others, they need to be applied on data sets that have addressed the issues of missing data that were a challenge in this data set. Several suggestions related to addressing these data issues are described later in this section.
T.1.1 Background on Principal Component Analysis (PCA) Principal Component Analysis was first developed by Pearson (1901) and later by Hotelling (1933). Its recent use and application has been growing steadily, along with related methods (cf., Jolliffe, 2002; Stone, 2004).
Conceptually, PCA is analogous but not identical to more familiar methods like bivariate linear regression where a line is fitted to the data in a two-dimensional space, explaining the variance or the strength of the correlation between the two variables. The PCA process linearly transforms an original set of variables into a smaller uncorrelated subset while still explaining most of the information in the first set. If the variables in the

Appendix T Multivariate Analyses
T-2
original set are correlated, like the CAMP DWM variables, the PCA transformation creates a relatively small subset so that the derived variables are orthogonal. The newly created variables, called Principal Components, are fewer in number but account for, or explain, the variation of the data to the maximum possible extent.
PCA has several other significant points. First, it is not tied to any underlying statistical model and analysts do not have to worry about meeting stringent assumptions such as multivariate normality. Next, PCA focuses on explaining total variation in observed variables on the basis of the maximum variance properties of principal components (Dunteman, 1989).
By transforming the original variables to a smaller number of uncorrelated variables, PCA reduces the number of variables to a smaller set of uncorrelated, representative components. So within PCA,
Straight lines are sought that best fit the clouds of points in the vector spaces (of variables and cases), according to the least squares criterion. This in turn yields the principal components (factors) that result into the maximum sums of squares for the orthogonal projections. Consequently, a lower dimensional vector subspace is recovered, that represents the original vector space. (Statistica Electronic Manual, 2004).
The purpose of the multivariate analysis of the data from the DWM study was to extract the underlying structure in a set of data obtained from multiple measures of driving performance that were highly inter-correlated, or, to put it differently, to find underlying components that gave rise to the variation in driving performance during multitasking so that a more powerful explanatory framework for driver-workload effects could be explored and offered. Multivariate analysis was appropriate for this data set because:
• There was extensive multi-colinearity in the data set (multiple and extensive correlations between variables in the data set)
• The construct we were trying to understand (driver workload-caused distraction or interference with driving) was believed to be multidimensional in nature, meaning that it was thought to be:
o Represented in the data by simultaneous effects on multiple variables
o Reflective of allocations of driver resources across input modalities, output modalities, working memory, and central attention
o Reflective of allocations of driver resources across multiple activities and allocations of attention across spatial areas of interest (central forward road, peripheral areas including mirrors, and inside-vehicle)
o Reflective of adaptive driver strategies that were responsive to demands and dynamically varying across time
The construct of interest (a transient mental state) had no direct measure that was available at the time the study was initiated, so the existence of the state had to be inferred from patterns observed across multiple measures of performance (much like a disease state might have to be inferred from patterns among observed symptoms before it is possible to determine its underlying cause). PCA is a tool that helps identify such patterns across multiple measures.

Appendix T Multivariate Analyses
T-3
It was desirable that the underlying dimensions of performance that were extracted would have the property of being orthogonal, or independent, and non-overlapping, so that they could be meaningfully applied in characterizing the effects of tasks on driving performance (and PCA yields orthogonal dimensions without assuming any underlying statistical model of the data).
In applying this methodology, however, there was an explicit recognition that it was exploratory in nature, and that the underlying dimensions it identified would need to be attributed with meaning and interpreted through subjective analysis. It is worthwhile to reiterate that this is exploratory work and that the nature of the dimensions would change if the input to the analysis were different. Similarly, the interpretations of the underlying dimensions may be refined as a deeper understanding of the data set is acquired over time (for example, by examining the data at a lower level, at the level of time histories).
Below is a simple conceptual example that avoids calculation details that are usually beyond the interest of most readers. However, to more fully understand PCA, it is often necessary to read a summary such as that given in Dunteman (1989) or the in-depth description, including computational details, available in Jolliffe (2002). If data in study that had two variables, length and width, were plotted on a scatter plot, it would resemble Figure T-1.
Principal C
omponent 1
Principal C
omponent 1
.
.
.
.
.
.
..
.. .
.
.
.
.
.
....
.
.
.
.
...
. .
.
Principal Component 2
Principal Component 2
Principal C
omponent 1
Principal C
omponent 1
.
.
.
.
.
.
..
.. .
.
.
.
.
.
....
.
.
.
.
...
. .
.
Principal Component 2
Principal Component 2

Appendix T Multivariate Analyses
T-4
Figure T-1. Example of a PCA Scatter Plot
By definition, at the beginning of an analysis in which correlations are used as input, such as those described here, the PCA assigns each variable a variance that equals 1.0. The total variance is equal to the number of variables in the to-be-analyzed data set. In this example, the total variance is two (1+1=2). Because there are two variables, this PCA can have two resulting components, because one component can be retained for each variable in the analysis. Principal Component 1 explains the largest amount of variance in the original data and, therefore, runs along the main axis of the ellipse from one end to the other. Component 1’s variance is calculated by summing the squared observation (data point) distances from the center of the data along the direction of the principal component.
Each of the two extracted principal components is individually orthogonal and comprised of a new combination of the two original variables. PCA explains the total amount of variance through the extracted principal components. The largest principal component, Principal Component 1, explains the largest proportion of the variation, ~60 percent in this example. The remaining 40 percent of the variance is accounted for or explained by Principal Component 2. In the mathematics of PCA, the variance explained by a Principal Component is called an Eigenvalue. Each Eigenvalue can be displayed as a percentage of the total variance and if all Eigenvalues are summed, they will account for a full 100 percent of the variance in the data.
Because mathematically, a principal component is a linear combination of the variables that are most correlated with it, given a set of variables one can identify those variables that have the highest absolute values of the principal component coordinates for the given principal components. Principal component coordinates are also referred to as loadings and are the correlations between a specific variable and the principal components (though this can depend upon the normalization used in the software). Loadings have three important uses in a PCA.
• They help eliminate or reduce the number of dimensions through an iterative method.
• They are used to assign meaning to specific principal components.
• When a principal component’s latent vector of weights, which are related to its loadings, are multiplied by each task’s standardized scores on its variables and then summed over the multiplications, a principal component score can be obtained and plotted to aid in visual interpretation and assignment of meaning. In terms of the DWM data, these can then be used to make comparisons between the workload demands imposed by different tasks.
T.2 An Illustrative Example – Steps Used for DWM PCAs Given the preceding discussion, the CAMP technical team decided to use PCA as an exploratory step that would help uncover significant correlates of “workload” and capture some of the hidden structure within the DWM variables. All of the PCA analyses were applied to data from the on-road venue only.
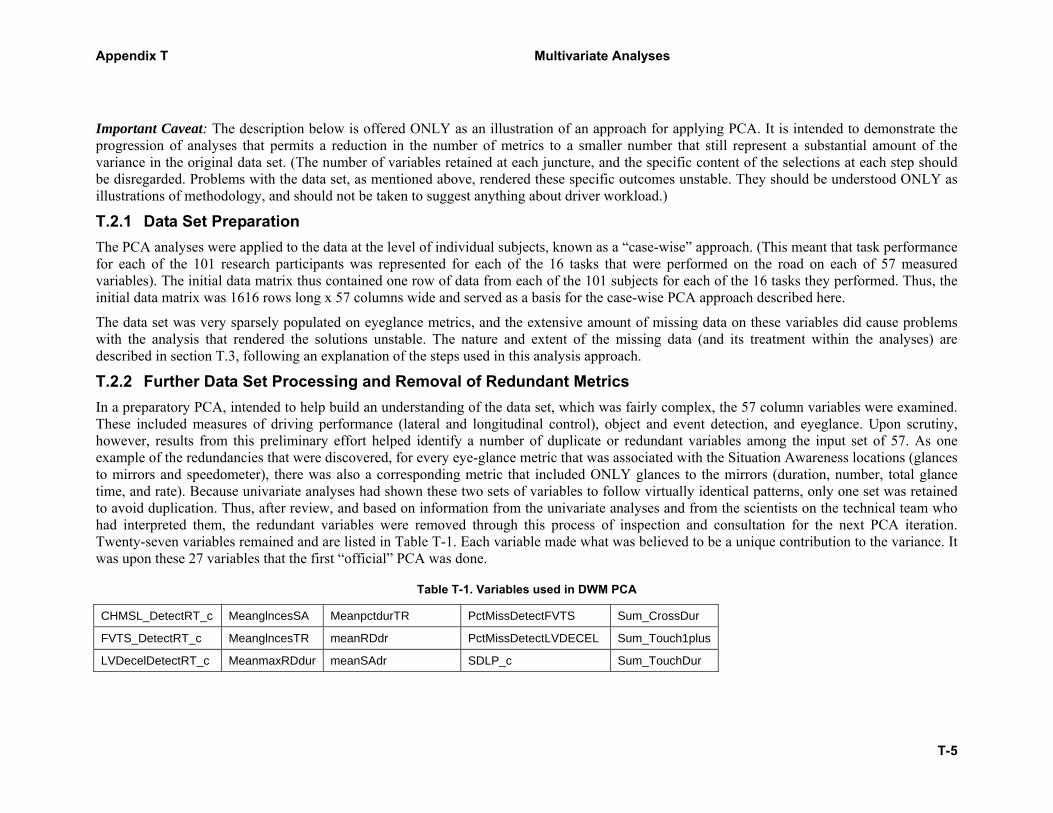
Appendix T Multivariate Analyses
T-5
Important Caveat: The description below is offered ONLY as an illustration of an approach for applying PCA. It is intended to demonstrate the progression of analyses that permits a reduction in the number of metrics to a smaller number that still represent a substantial amount of the variance in the original data set. (The number of variables retained at each juncture, and the specific content of the selections at each step should be disregarded. Problems with the data set, as mentioned above, rendered these specific outcomes unstable. They should be understood ONLY as illustrations of methodology, and should not be taken to suggest anything about driver workload.)
T.2.1 Data Set Preparation The PCA analyses were applied to the data at the level of individual subjects, known as a “case-wise” approach. (This meant that task performance for each of the 101 research participants was represented for each of the 16 tasks that were performed on the road on each of 57 measured variables). The initial data matrix thus contained one row of data from each of the 101 subjects for each of the 16 tasks they performed. Thus, the initial data matrix was 1616 rows long x 57 columns wide and served as a basis for the case-wise PCA approach described here.
The data set was very sparsely populated on eyeglance metrics, and the extensive amount of missing data on these variables did cause problems with the analysis that rendered the solutions unstable. The nature and extent of the missing data (and its treatment within the analyses) are described in section T.3, following an explanation of the steps used in this analysis approach.
T.2.2 Further Data Set Processing and Removal of Redundant Metrics In a preparatory PCA, intended to help build an understanding of the data set, which was fairly complex, the 57 column variables were examined. These included measures of driving performance (lateral and longitudinal control), object and event detection, and eyeglance. Upon scrutiny, however, results from this preliminary effort helped identify a number of duplicate or redundant variables among the input set of 57. As one example of the redundancies that were discovered, for every eye-glance metric that was associated with the Situation Awareness locations (glances to mirrors and speedometer), there was also a corresponding metric that included ONLY glances to the mirrors (duration, number, total glance time, and rate). Because univariate analyses had shown these two sets of variables to follow virtually identical patterns, only one set was retained to avoid duplication. Thus, after review, and based on information from the univariate analyses and from the scientists on the technical team who had interpreted them, the redundant variables were removed through this process of inspection and consultation for the next PCA iteration. Twenty-seven variables remained and are listed in Table T-1. Each variable made what was believed to be a unique contribution to the variance. It was upon these 27 variables that the first “official” PCA was done.
Table T-1. Variables used in DWM PCA
CHMSL_DetectRT_c MeanglncesSA MeanpctdurTR PctMissDetectFVTS Sum_CrossDur
FVTS_DetectRT_c MeanglncesTR meanRDdr PctMissDetectLVDECEL Sum_Touch1plus
LVDecelDetectRT_c MeanmaxRDdur meanSAdr SDLP_c Sum_TouchDur

Appendix T Multivariate Analyses
T-6
Mean_Range MeanmaxTRdur MeanSpeedChg SpeedDiff_c
Mean_RR MeanpctdurRD meanTRdr Sum_BothCnt
MeanglncesRD MeanpctdurSA PctMissDetectCHMSL Sum_Cross1plus
T.2.3 Step 1: Doing the First Official PCA PCA was conducted on the 27 variables above with the goals of :
• reducing the number of dimensions to aid in interpretation;
• explaining the maximum amount of variance; and
• identifying meaningful correlates of workload within the data.
For brevity in the text that follows, Principal Components are referred to as Factors, but the reader should take care not to confuse the Principal Components with factors from Factor Analysis. They are different.

Appendix T Multivariate Analyses
T-7
Table T-2 presents the resulting Eigenvalues, percent of explained variance, cumulative Eigenvalue, and cumulative percent of explained variance from this analysis. Recall that Eigenvalues are simply a statistic of explained variance.
Table T-2. PCA Factors and Eigenvalues – for Illustration Only
Factor Eigenvalue % Total variance
Cumulative Eigenvalue
Cumulative %
1 3.696643 13.69127 3.69664 13.6913
2 2.911159 10.78207 6.60780 24.4733
3 2.420858 8.96614 9.02866 33.4395
4 1.893995 7.01480 10.92266 40.4543
5 1.602813 5.93635 12.52547 46.3906
6 1.444592 5.35034 13.97006 51.7410
7 1.199534 4.44272 15.16960 56.1837
8 1.098108 4.06707 16.26770 60.2508
9 1.046479 3.87585 17.31418 64.1266
10 0.997263 3.69357 18.31144 67.8202
11 0.972500 3.60185 19.28395 71.4220
12 0.943091 3.49293 20.22704 74.9149
13 0.932718 3.45451 21.15975 78.3695
14 0.891203 3.30075 22.05096 81.6702
15 0.793718 2.93970 22.84468 84.6099
16 0.734080 2.71881 23.57876 87.3287
17 0.721951 2.67389 24.30071 90.0026
18 0.606706 2.24706 24.90741 92.2497
19 0.506915 1.87746 25.41433 94.1271
20 0.475174 1.75990 25.88950 95.8870

Appendix T Multivariate Analyses
T-8
Factor Eigenvalue % Total variance
Cumulative Eigenvalue
Cumulative %
21 0.412967 1.52951 26.30247 97.4166
22 0.214588 0.79477 26.51706 98.2113
23 0.192672 0.71360 26.70973 98.9249
24 0.116635 0.43198 26.82637 99.3569
25 0.078985 0.29254 26.90535 99.6494
26 0.069979 0.25918 26.97533 99.9086
27 0.024671 0.09137 27.00000 100.0000

Appendix T Multivariate Analyses
T-9
Since there were 27 original variables, there were 27 extracted principal components. The 27 principal components accounted for all of the variance and each individual principal component explained a percentage of that total. Principal components are ordered in terms of the amount of variance they each explain. To illustrate, Factor 1 with an Eigenvalue of 3.696643 explained 13.69 percent of the total variance. By contrast, Factor 27 with an Eigenvalue of 0.024671 explained just 0.09 percent of the variance.
The next steps taken represented a progression through which the dimensionality of the data set was reduced using a process called “backward elimination.” An overview is shown in Figure T-2, and each step is explained in the text.
•
Figure 8-2. Overview of Steps Taken to Reduce Dimensionality of Data Through Backward Elimination
T.2.4 Step 2: Reducing Dimensionality Through Backwards Elimination The goal of PCA is to reduce dimensionality, or the number of variables and factors, while maximizing the explained variance, and creating a meaningful interpretation of underlying constructs in the data (workload). This is accomplished through an examination of each factor’s Eigenvalue and its variables’ factor loadings.

Appendix T Multivariate Analyses
T-10
Given this, the first consideration is how many factors should be retained? The majority of experts suggest a conservative approach, retaining only those factors that have Eigenvalues greater than 1.0. That would mean that this analysis should rely on a 9-factor or 9-dimensional solution. In Table T-2, Factors 1 through 9 account for roughly 64 percent of the variance. A more liberal approach, proposed by Jolliffe ( 2002), is to retain all factors with Eigenvalues that are greater than 0.7 if they are meaningful. In this example, 17 factors explain 90 percent of the variance. A third approach suggested by Cattell (1966) is to use a scree plot of the Eigenvalues to help determine how many factors were significant. Scree plots are a simple line plot of the Eigenvalues. Cattell’s view is that one should only retain the number of factors to the left of a point in the scree plot where the slope of the line suddenly changes or levels off. A scree plot for the first analysis of the DWM data is presented in Figure T-2.
•
Eigenvalues of Frist DWM PCA correlation matrix
0 1 2 3 4 5 6 7 8 9 10 11 12 13 14 15 16 17 18 19 20 21
Number of Eigenvalues
0.0
0.5
1.0
1.5
2.0
2.5
3.0
3.5
4.0
4.5
Val
ue
Figure T-2. Scree Plot of First DWM PCA Analysis – Illustrative Only
Visually, there is a general change in the slope between six or seven principal components. Cattell’s interpretation of the scree would retain six, that is, the point at the “elbow” would be excluded. However, retaining seven factors would result in explaining 56 percent of the total variation. These three different rules of thumb create three different solutions—but which one is best? The answer is that it depends on the goals of the analysis and the meaning that results. In this case, a 17-factor solution reduces the dimensionality from the original 27 variables, explains fully 90 percent of the variance, but is almost impossible to understand intuitively.

Appendix T Multivariate Analyses
T-11
Because a primary goal of PCA is extracting meaningful solutions through the reduction of dimensions, it can be done iteratively, at least for 2 or 3 iterations (Thompson, 2004). So in step 2, 17 factors, meaning 17 variables (Jolliffe’s criterion of retaining factors with Eigenvalues greater 0.7), were retained and used as the input for the second PCA.
The PCA literature provides several methods on how to select significant variables that should be retained for further analysis in an iterative PCA. In his review, Jolliffe notes that no one of the five or six most common methods is clearly superior to any other and no one technique is substantially inferior either. However, based on his proper use of Monte Carlo simulation and bootstrapping, Jolliffe does imply that using a backward elimination approach based on the variables’ factor loading, is an approach that seems to retain more significant variables than the other approaches. Dunteman refers to this as discarding principal components.
o Note: It should also be noted that the backward elimination process uses the internal structure of the data to drive the selection of variables, but it can also be used jointly with external criteria when it is important to include certain variables based on prior knowledge, precedent, etc. Though this option was not explored, it is one that could have been applied after completing the backward elimination process.
Table T-3 presents the factor loadings for the original 27 variables, but only factors 1, 25, 26, and 27 are shown for simplicity and explanation. Since principal component loadings are nothing more than correlations between a variable and that factor, 17 factors were retained and factors 18 through 27 were discarded as follows:
• First go to the column for Factor 27 and look for the loading in that column, which has the largest absolute value. It is highlighted in red and is 0.115233. Now move horizontally to the left in the same row and locate the variable associated with this number. It is also in red and is MeanglncesSA. Delete this variable and delete the Factor 27 column.
• Next go to Factor 26 and find the loading with the highest absolute value. It is in red and is -0.189151. Slide to the left and see that the variable here is MeanmaxRdDur. Delete it and the Factor 26 column.
• Now look at the Factor 25 column and do the same thing. This will delete meanTRdur. Stop at factor 17. This will give the 17 variables to be input into the second PCA.
The underlying reason for doing this is that deleting variables with high weights on small components removes redundancies in the variables with high weights. As Dunteman indicates, “components with small variances are unimportant and therefore variables that load highly on them are likewise unimportant.”
Table T-3. Discarding Variables – Illustration of Process
Variable Factor 1 Factor 25 Factor 26 Factor 27
CHMSL_DetectRT_c -0.008180 … -0.000301 -0.000777 0.000070

Appendix T Multivariate Analyses
T-12
Variable Factor 1 Factor 25 Factor 26 Factor 27
FVTS_DetectRT_c -0.003866 … 0.000188 -0.000325 -0.000071
LVDecelDetectRT_c -0.049632 … 0.000620 -0.003904 0.000472
Mean_Range -0.134207 … 0.001188 0.001423 0.001296
Mean_RR -0.258097 … 0.004508 -0.000835 -0.002286
MeanglncesRD 0.586009 … -0.021647 0.046483 -0.096000
MeanglncesSA 0.610717 … -0.003999 0.027710 0.115233
MeanglncesTR -0.040971 … 0.057573 -0.008770 0.023682
MeanmaxRDdur 0.590915 … 0.011624 -0.189151 -0.002050
MeanmaxTRdur -0.530363 … -0.189222 -0.020055 0.008835
MeanpctdurRD 0.833592 … 0.014451 0.023535 -0.019075
MeanpctdurSA 0.484945 … 0.026137 -0.080078 -0.020533
MeanpctdurTR -0.600966 … -0.000467 -0.002545 -0.026971
meanRDdr 0.493740 … -0.015403 0.150125 0.000148
meanSAdr 0.432709 … -0.013242 0.025970 0.001223
MeanSpeedChg 0.158140 … -0.004426 -0.006418 -0.000479
meanTRdr -0.511934 … 0.194177 0.022403 -0.002307
PctMissDetectCHMSL -0.193640 … 0.000729 -0.001524 -0.001878
PctMissDetectFVTS -0.165847 … -0.002800 0.000884 -0.000642
PctMissDetectLVDECEL -0.134604 … 0.002314 -0.001226 0.000005
SDLP_c 0.183818 … 0.002905 -0.000014 0.000240
SpeedDiff_c 0.297464 … -0.000426 0.002454 -0.000927
Sum_BothCnt 0.095267 … 0.005692 0.001204 -0.000523
Sum_Cross1plus 0.136296 … -0.010203 -0.003224 0.000948
Sum_CrossDur 0.063783 … -0.000155 0.001677 -0.000025

Appendix T Multivariate Analyses
T-13
Variable Factor 1 Factor 25 Factor 26 Factor 27
Sum_Touch1plus 0.116787 … 0.005011 0.003847 -0.000187
Sum_TouchDur 0.029736 … -0.003187 -0.002567 0.000162
This backward elimination process identified the important variables for the next step. These variables are presented in Table T-4 for illustrative purposes only, to show what was accomplished through the reduction process.
Table T-4. Variables Remaining for Second PCA – Illustrative Only
o Note: Selection of these variables was unstable and influenced by missing data and zero’s in data set.
CHMSL_DetectRT_c MeanmaxTRdur PctMissDetectFVTS
FVTS_DetectRT_c meanRDdr SDLP_c
LVDecelDetectRT_c meanSAdr Sum_Cross1plus
Mean_RR MeanSpeedChg Sum_CrossDur
MeanglncesRD PctMissDetectLVDECEL Sum_TouchDur
MeanglncesTR PctMissDetectCHMSL
T.2.5 Step 3: Doing the Second DWM PCA The variables listed in Table T-4 were retained for use in the iterative second DWM PCA. The correlation matrix between these variables (with the correlation in each cell of the matrix having been based on the 16 tasks measured on that variable on the road) served as input to the PCA. Again, the discarding of all but these 17 variables was necessary to achieve an understandable meaning through the twin goals of reducing dimensions (and variables) while maximizing explained variance. This phase used the exact process and steps elaborated in the preceding section.3
3 An understanding of this process, at least at a conceptual level, is critical to understanding subsequent analyses. Readers wishing additional explanatory material (beyond what can be provided here) are referred to Dunteman (1989), who provides a succinct description on p. 50 - 54 or to Jolliffe (1972 and 2002), who provides a more in-depth treatment.

Appendix T Multivariate Analyses
T-14
Table T-5 presents the Eigenvalues and percent explained variance for the second PCA. The table only has 15 factors because these are the factors that had Eigenvalues greater than the Jolliffe criterion of 0.70. However, these 15 factors explain ~93 percent of the variance.
Table T-5. Eigenvalues from Second PCA – Illustrative Only
Eigenvalue % Total variance
Cumulative Eigenvalue
Cumulative %
1 1.726599 10.15647 1.72660 10.15647
2 1.464539 8.61493 3.19114 18.77140
3 1.362133 8.01255 4.55327 26.78395
4 1.207379 7.10223 5.76065 33.88618
5 1.079741 6.35142 6.84039 40.23760
6 1.014172 5.96572 7.85456 46.20332
7 0.989627 5.82133 8.84419 52.02465
8 0.985267 5.79569 9.82946 57.82034
9 0.952991 5.60583 10.78245 63.42617
10 0.908385 5.34344 11.69083 68.76961
11 0.901967 5.30569 12.59280 74.07530
12 0.873452 5.13795 13.46625 79.21325
13 0.824791 4.85171 14.29104 84.06496
14 0.803531 4.72665 15.09457 88.79161
15 0.716948 4.21734 15.81152 93.00895
Also note that retaining only six factors explains ~46 percent of the variance. The six-factor solution is based on the following scree plot, Figure T-3, and the conservative criterion that only factors whose Eigenvalues are >1.0 are retained. Figure T-3 shows that the slope of the scree plot effectively changes at the sixth factor. It should, however, also be noted that interpreting scree plots is almost always very subjective – and the thresholds of 1.0 and 0.7 are only rules-of-thumb. These heuristics provide a supportable way of reducing the dimensionality of the data. However, there are other ways of making such a reduction as well. For example, an alternative strategy might have been to retain more variables, but replace

Appendix T Multivariate Analyses
T-15
subsets of those that co-vary together by composite indices based on their underlying Principal Components. While it cannot be argued that the approach applied here is the “best” way, none of the other possibilities are demonstrably superior. Rather, it is often a matter of preference and goals in exploring the data.
•
Plot of Eigenvalues
0 1 2 3 4 5 6 7 8 9 10 11 12 13 14 15 16 17 18
Number of Eigenvalues
0.0
0.2
0.4
0.6
0.8
1.0
1.2
1.4
1.6
1.8
2.0
Val
ue
Figure T-3. Scree Plot from the Second PCA – Illustrative Only
At this point, understand that the trade-off was to retain fewer factors to aid interpretation and assign meaning or to retain many more factors to maximize explained variance. An arbitrary decision was made to retain and use seven factors that would explain the majority of the variance, approximately 52 percent. Discarding the unwanted principal components, as explained earlier, seven variables were identified and are listed in Table T-6 only for the purposes of illustration. These seven “best predictor” variables were then used as the basis for all of the following PCAs.

Appendix T Multivariate Analyses
T-16
Please keep in mind that a different set of variables (and a different number of variables) may well have emerged from this process had the underlying issues and implications of missing data been understood in advance of the analysis.
Table T-6. Seven Variables Identified for Use in Final PCAs – Illustrative Only
o Note: Selection of these variables was unstable, and influenced by missing data and zero’s in the data.
Variable DescriptionmeanRDdr Mean duration of glances to the Road
MeanmaxTRdur Mean of Maximum Glance Durations To TaskSpeedDiff_c Diff. between max and min speed during task
PctMissDetectLVDECEL % Missed Lead Vehicle Decel EventsPctMissDetectCHMSL % Missed CHMSL Events
PctMissDetectFVTS % Missed Follow Vehicle Turn Signal EventsFVTS_DetectRT_c Response Time to Follow Veh. Turn Sig. Evts
T.2.6 Step 4: Identifying the Underlying Dimensions of Multitasking Effects on Driving Performance through PCA
The final series of PCAs were based on this subset of seven best predictor variables from the larger set that was collected in the CAMP DWM study. An overall PCA was done on the visual-manual tasks and the auditory-vocal tasks. Exploratory PCAs were also run on each individual task. The 16 tasks are presented by name and task-type in Table T-7.
Table T-7. Tasks Used in On-Road Data Collection
Task Name Type
Biographic Q&A Auditory-vocal
Book-On-Tape Listen Auditory-vocal
Book-On-Tape Summary Auditory-vocal
Cassette Visual-manual
CD/Track 7 Visual-manual
Coins Visual-manual

Appendix T Multivariate Analyses
T-17
Task Name Type
HVAC Visual-manual
Just Drive Just drive
Manual Dial Visual-manual
Radio-Easy Visual-manual
Radio-Hard Visual-manual
Route Instruct Auditory-vocal
Route Orient Auditory-vocal
Sports Auditory-vocal
Travel Comp Auditory-vocal
Voice Dial Mixed Mode
The Voice-Dial task was seen as combining both an auditory-vocal component and a visual-manual aspect because subjects had to pick and open the phone before using voice recognition to dial. Just Drive was a two minute period during which subjects were not asked to do additional tasks, they just drove, although, they did detect events that occurred while driving, such as CHMSL, LVD, and FVTS.

Appendix T Multivariate Analyses
T-18
T.2.7 Step 5: Doing the Overall PCA, All Variables and All Tasks The first of the final PCAs was an Overall PCA. Input to this PCA consisted of inter-correlations among the seven best predictor variables that were extracted through the iterative process previously described. The 7 X 7 correlation matrix is shown in Table T-8. Each cell of the matrix represents the correlation between the row and column metrics, based on all 16 on-road tasks. Again, this is provided as an illustration only. The values it contains were adversely affected by the missing data problems and the procedures applied to treat them.
Table T-8. 7 X 7 Illustrative Correlation Matrix That Served as Input for the Overall PCA
7x7 Correlation Matrix Overall PCA meanRDdr MeanmaxTRdur SpeedDiff_c PctMissDetectLVDECEL PctMissDetectCHMSL PctMissDetectFVTS FVTS_DetectRT_cmeanRDdr 1.000000 -0.131417 0.091630 -0.003852 -0.021196 0.049532 0.002082MeanmaxTRdur -0.131417 1.000000 -0.043346 -0.001749 0.023774 0.013504 -0.000502SpeedDiff_c 0.091630 -0.043346 1.000000 -0.142229 -0.080455 -0.047844 0.037639PctMissDetectLVDECEL -0.003852 -0.001749 -0.142229 1.000000 0.082544 0.016959 -0.019441PctMissDetectCHMSL -0.021196 0.023774 -0.080455 0.082544 1.000000 0.238293 -0.001365PctMissDetectFVTS 0.049532 0.013504 -0.047844 0.016959 0.238293 1.000000 0.023153FVTS_DetectRT_c 0.002082 -0.000502 0.037639 -0.019441 -0.001365 0.023153 1.000000
o Note: The values of the correlations are so low because of the effect that the means-substitution process had on the many cells of missing data—it drove the correlations toward zero. This is discussed in section T.3.
T.2.8 Step 6: PCA on Subset of Visual-Manual Tasks A PCA was conducted on just the subset of visual-manual tasks, using the same set of variables used for the Overall PCA, to explore underlying dimensions of performance that were unique to the demands of visual-manual tasks.
T.2.9 Step 7: PCA on Subset of Auditory-Vocal Tasks A PCA was conducted on just the subset of auditory-vocal tasks, using the same set of variables used for the Overall PCA, to explore underlying dimensions unique to the demands of auditory-vocal tasks.
T.2.10 Step 8: Interpretation of Underlying Principal Components Interpretation of principal components and their implications for workload-induced interference with driving was the final step in the process.
Appendix T Multivariate Analyses
T-19
T.3 Issues With the Data – Rendering Solutions Unstable Three fairly serious issues with the data were identified.4 These three issues caused problems with the analysis. Although there is no single correct way of doing the multivariate analysis, these problems invalidated the results that had been generated and meant that they were not usable. There was, unfortunately, no way of retrieving a “more valid” analysis in the short time available under the terms of the contract. Therefore, we have described the analysis framework in previous sections to illustrate the potential of a multivariate approach. In this section, issues associated with treatment of missing data, as well as technical issues associated specifically with eye data and task types are addressed, since they must be overcome in conducting multivariate analyses on this type of data.
The data problems were:
1. Eye data were not available for 83 subjects. Eye data were reduced for only 18 of the 101 on-road participants (due to the rigor that was required to meet scoring standards). The consequence was that there were missing values for 83 subjects in the matrix.
2. For auditory-vocal tasks and the Just Drive task, glances are not made to task-related areas, and though this is important information, the statistical software treats it like missing data. Basically, the issue here is that on metrics like “number of glances to task-related areas,” drivers made virtually no glances during auditory-vocal tasks (they are able to keep their eyes on the road during these tasks). This is important information, but is coded in the data with empty cells under metrics such as “number of glances to task-related areas,” “durations” for those glances, “rates” for those glances, and “total glance time” for those glances. As a result, the statistical software treats these cells as if they were missing data rather than carrying information.
o Note: This is really a data coding issue, and in future applications, it may be possible to overcome this problem with a clever coding scheme that fills the cells with an appropriate and meaningful numerical code so that they are not treated as empty, but does so in a way that preserves the information that auditory-vocal tasks do not take the eyes off the road. Simply filling the cells with a value of zero may not be appropriate.
There may be other instances of missing eyeglance data that are similar to this, but not associated with auditory-vocal tasks in the data set. For example, if a driver does not glance at the mirror location during a task, then all of the metrics associated with the mirror location (number of glances, duration, rate, and total glance time to the mirror) will be empty for that driver on that task. Yet if this reduction in mirror scanning is the result of task load, it will happen for multiple subjects in the sample, and there will be multiple cells of missing data for that task. However, these empty cells are, in fact, carrying important information, if only it could be coded in a way that would allow it to be treated as information rather than missing data by the analysis package. This challenge is one that is inherent to analyzing eye data of the type available from this study.
4 We are grateful to Ian Jolliffe for his reviews of our work and his assistance in understanding and analyzing these issues and their implications for the work we had done. Many of the insights on the next few pages were gained though interactions with him.

Appendix T Multivariate Analyses
T-20
3. Loss of Data on Event Detection Response Times for FVTS and CHMSL. Response time (RT) variables are measures of the time it took for drivers to respond to a CHMSL event or FVTS event that appeared on the vehicle in front of them or behind them, respectively, (with the FVTS event visible to them in their left-outside rearview-mirror). Channels recording these times, as well as related data channels, also served to capture "correct detections" of these events. During the multivariate analysis, it was discovered that there were values of "zero" in the data for these response time metrics, and there should NOT have been any zero values. (Zero values are distinct from missing values, which were denoted by the value -9999.) Troubleshooting procedures were initiated and it was determined that this problem had its source in the original extraction of data from the engineering files recorded in the vehicles. Unfortunately, out of the more than 100 channels of data extracted, two were misread. They were misread in a way that erroneously produced zero values for some proportion of the data. These errors affected 9 percent of the data for FVTS RTs, 9 percent for FVTS Miss Rate, 4 percent for CHMSL RTs, and 4 percent for CHMSL Miss Rate. These data would have needed to be deleted from the data set to obtain a correct multivariate analysis, and further loss of data would have simply further exacerbated the sparseness of the data set as a whole. Furthermore, the presence of zero values in the data set (prior to their discovery) may have introduced some additional error into the multiplicative operations involved in PCA.
T.4 Treatment of Missing Values in the PCA Analysis When there are large quantities of missing data in a set of data, it complicates the application of PCA considerably. Missing data have to be dealt with somehow in order for the analysis to be run, and none of the alternatives is very satisfactory when many data are missing.
There are four options available for handling missing data, but only three are generally available to practitioners in the field. The common options are to specify whether missing data are: (a) deleted on a case-wise basis, (b) deleted on pair-wise basis, or (c) replaced with values through a process of means-substitution. Case-wise deletion means that in the original data, if any one cell has missing data, that whole row of data with all of the other variables is deleted before calculating correlations. Pair-wise deletion specifies that only the missing cell is deleted and the calculations proceed using the remaining good variables. This process is more accurate and was initially applied without complete success on the DWM data set. The means-substitution option utilizes one or more rules to populate empty cells of a data matrix with replacement values based on means, and ultimately had to be used.
Because of the limited eye data available, and the large number of eye metrics in the data set, the magnitude of missing data was so extensive that the matrix could not be processed using pair-wise deletion (e.g., the matrix returned error messages indicating it was ill-conditioned and still had a determinant of zero), so means-substitution had to be applied in exploratory runs of PCA. However, it subsequently became apparent that this method of treating missing data had altered the data in a way that made the solutions unstable.
To provide some detail about the implications of these types of procedures, which are sometimes applied by default in statistical packages during the execution of an analysis, consider the following:

Appendix T Multivariate Analyses
T-21
1. Listwise/Casewise Deletion. This method only uses rows, which contain values in all columns (i.e., for all variables) and deletes all other rows of data. In one of our data matrices with only 7 variables, there were only 36 rows with complete data on all 7 variables. This option, then, left very few data points (36 out of 1616 for 7 variables, none at all with 17 variables), so results were unstable.
2. Pairwise Deletion. For a given pair of variables, this method uses data for which values are available for that pair. This varies between 46 and 1469 out of the 1616 rows in the data matrix. In this dataset, some of the correlations were based on very few pairs, others on many more (between 1573 and 7 in the 17 variable case; 1469 to 46 for 7 variables). Thus the different correlations were based on different data with different precisions. Depending on the pattern of missing data, those based on small numbers of pairs may have been biased.
3. Mean Substitution. This method substitutes means in cells with missing data. Exact algorithms for applying means can differ between statistical packages. If a great deal of data is missing, this will bias correlations towards zero. Consider a scatter plot of two correlated variables. Substituting means for many data points implies adding many points at the origin (for centered data), which clearly downgrades the strength of relationships. This downgrading is not uniform. Clearly, application of this method to our data set, which had extensive missing data, had impact on the strength of interrelationships between variables—the very thing we wanted to use the PCA to explore.
4. More Sophisticated Approaches. There are more sophisticated approaches using regression to predict unobserved variables from observed ones on the same case, but they are not available in general statistical software. They could not be applied under the timing of this project.
Thus, there were simply too many missing data values for any of the available approaches to give reliable, stable PCA solutions. Unfortunately, this was learned after the full series of PCA analyses had been conducted. But these lessons are offered as insights that can benefit others undertaking analyses of similarly difficult data sets.
A PCA of means over tasks of variables (hence a 16 x 7, rather than 16 x 16 x 7 data matrix) would be a possibility for yielding solutions on the data set that are more reliable and stable. Although some may feel that such an approach discards a lot of information on cases, in reality that information is so sparse that trying to include it introduces instability.
Further, one published prior application of PCA to driving performance data that explored driver workload distraction (Young and Angell, 2002) was done at a task level. Task means were first obtained across individual research participants, and then the task means were used as input to the PCA. This lends support to the notion that a task-level PCA on this data set, within the context of the framework described here, may be fruitful.
It should be noted that for some multivariate methods, such as multiple regression, it is deemed advisable to have at least five times as many data points as variables entered into an analysis. This is not necessarily required for PCA, though a majority of the technical team felt it advisable to apply this rule anyway as an extra measure of caution (and with the hope of providing robustness to the solution). Given the significant data sparseness that lay at the level of individual subjects, this turned out to be a problem rather than a benefit. It added instability rather than robustness, due to the nature of the data set.
As an alternative, a possible strategy to make case-based PCA feasible (versus task-based) would have been to include the proportion of missing data as a criterion in the variable selection algorithm, avoiding inclusion of variables with high proportions.

Appendix T Multivariate Analyses
T-22
T.5 Concluding Comments Principal Component Analysis has the capability to identify specific underlying patterns of interference between multitasking and driving performance associated with distraction effects. Its successful application to this data set can occur as the issues surrounding missing data are addressed, and/or analyses are applied at a different level than the case-wise approach tried in this initial exploratory effort.
T.6 Appendix References Cattell, R. B. (1966). “The scree test for the number of factors.” Multivariate Behavioral Research, 1:245-276.
Dunteman, G. H. (1989). Principal Components Analysis. Newbury Park, CA: Sage University Press.
Jolliffe, I. T. (1972). Discarding variables in a principal component analysis, I: Artificial data. Applied Statistics: 21: 160-173.
Jolliffe, I. T. (2002). Principal Component Analysis, Second Edition. New York: Springer-Verlag.
Stone, J. V. Independent Component Analysis: A Tutorial Introduction.
STATISTICA 6 Electronic Manual (2004). Tulsa, OK: StatSoft, Inc.
Thompson, B. (2004). Exploratory and Confirmatory Factor Analysis. Washington, D.C.: American Psychological Association.
Young, R.A., & Angell, L.S. (2003). The dimensions of driver performance during secondary manual tasks. Proceedings of “Driving Assessment 2003: The Second International Driving Symposium on Human Factors in Driver Assessment, Training and Vehicle Design,” Park City, Utah, July, 2003.


DOT HS 810 635November 2006