
Low voltage ride through (LVRT) ability of DFIG based wind energy conversion system-I
Upload
independentCategory
view
2download
0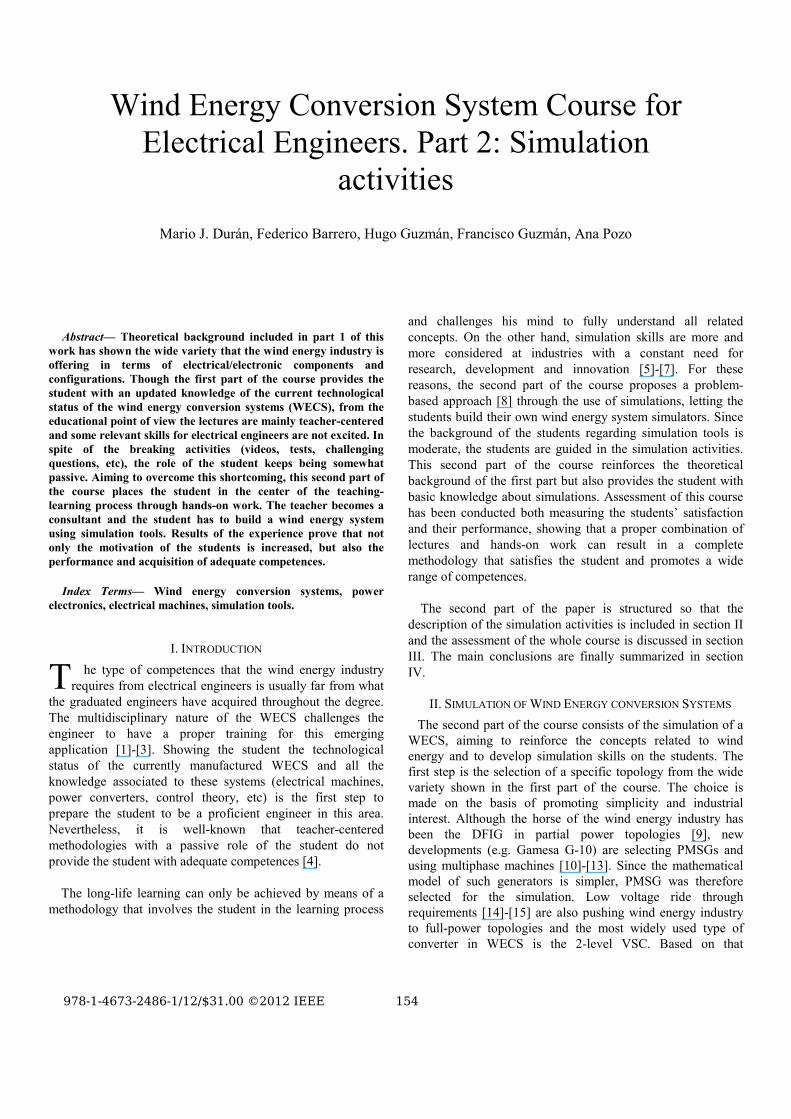
Abstract— Theoretical background included in part 1 of this
work has shown the wide variety that the wind energy industry is
offering in terms of electrical/electronic components and
configurations. Though the first part of the course provides the
student with an updated knowledge of the current technological
status of the wind energy conversion systems (WECS), from the
educational point of view the lectures are mainly teacher-centered
and some relevant skills for electrical engineers are not excited. In
spite of the breaking activities (videos, tests, challenging
questions, etc), the role of the student keeps being somewhat
passive. Aiming to overcome this shortcoming, this second part of
the course places the student in the center of the teaching-
learning process through hands-on work. The teacher becomes a
consultant and the student has to build a wind energy system
using simulation tools. Results of the experience prove that not
only the motivation of the students is increased, but also the
performance and acquisition of adequate competences.
Index Terms— Wind energy conversion systems, power
electronics, electrical machines, simulation tools.
I. INTRODUCTION
he type of competences that the wind energy industry
requires from electrical engineers is usually far from what
the graduated engineers have acquired throughout the degree.
The multidisciplinary nature of the WECS challenges the
engineer to have a proper training for this emerging
application [1]-[3]. Showing the student the technological
status of the currently manufactured WECS and all the
knowledge associated to these systems (electrical machines,
power converters, control theory, etc) is the first step to
prepare the student to be a proficient engineer in this area.
Nevertheless, it is well-known that teacher-centered
methodologies with a passive role of the student do not
provide the student with adequate competences [4].
The long-life learning can only be achieved by means of a
methodology that involves the student in the learning process
and challenges his mind to fully understand all related
concepts. On the other hand, simulation skills are more and
more considered at industries with a constant need for
research, development and innovation [5]-[7]. For these
reasons, the second part of the course proposes a problem-
based approach [8] through the use of simulations, letting the
students build their own wind energy system simulators. Since
the background of the students regarding simulation tools is
moderate, the students are guided in the simulation activities.
This second part of the course reinforces the theoretical
background of the first part but also provides the student with
basic knowledge about simulations. Assessment of this course
has been conducted both measuring the students’ satisfaction
and their performance, showing that a proper combination of
lectures and hands-on work can result in a complete
methodology that satisfies the student and promotes a wide
range of competences.
The second part of the paper is structured so that the
description of the simulation activities is included in section II
and the assessment of the whole course is discussed in section
III. The main conclusions are finally summarized in section
IV.
II. SIMULATION OF WIND ENERGY CONVERSION SYSTEMS
The second part of the course consists of the simulation of a
WECS, aiming to reinforce the concepts related to wind
energy and to develop simulation skills on the students. The
first step is the selection of a specific topology from the wide
variety shown in the first part of the course. The choice is
made on the basis of promoting simplicity and industrial
interest. Although the horse of the wind energy industry has
been the DFIG in partial power topologies [9], new
developments (e.g. Gamesa G-10) are selecting PMSGs and
using multiphase machines [10]-[13]. Since the mathematical
model of such generators is simpler, PMSG was therefore
selected for the simulation. Low voltage ride through
requirements [14]-[15] are also pushing wind energy industry
to full-power topologies and the most widely used type of
converter in WECS is the 2-level VSC. Based on that
Wind Energy Conversion System Course for
Electrical Engineers. Part 2: Simulation
activities
Mario J. Durán, Federico Barrero, Hugo Guzmán, Francisco Guzmán, Ana Pozo
T
978-1-4673-2486-1/12/$31.00 ©2012 IEEE 154

premises, the final topology selected to challenge the students
is shown in Fig. 1. Although the gearbox is optional depending
on the number of poles of the PMSG, it is included in the
simulation for the sake of completeness. The generator-side
analysis has been included in the lab sessions. Simulation of
the PWM and voltage oriented control (VOC) of the grid-side
converter (theoretically explained in Part 1) is somewhat
similar to PWM and FOC of the generator side, which
simplifies the teaching practice.
The content of this second part of the course is organized
following an inclusive strategy. Each element of the WECS
shown in Fig. 1 is simulated as an input/output box which is
connected to the previous elements in the simulation. During
the different stages of the course the student simultaneously
develops simulation skills and enhances WECS understanding.
The simulation of the different elements (table I of part 1) is
briefly described below:
1. Matlab/Simulink intro: .m files are executed from
Simulink using Matlab and S-function blocks and .mdl files
send simulation data to Matlab using to file and to workspace
blocks. Bidirectional connection Simulink-Matlab and Matlab-
simulink is thus exemplified to introduce the software. Later
on in the course the students can understand the benefits of this
procedure, which include running cascade simulations in loops
and easy and flexible representations of the results.
2. Wind Simulation: since the course is oriented to
electric/electronics engineering students, the simulation of the
wind is built from the empiric relations of (1) that provide the
wind power and low-speed shaft torque. The use of functions
is reinforced by simulating (1) through Matlab functions. At
the end of the simulation, the students are asked to obtain the
power/torque curves as in Fig. 2. Tip speed ratio, maximum
power point tracking (MPPT) and pitch control, explained in
part 1, are reviewed and discussed.
),(2
1 3 λβρ pwsam CVAP =
w
tt
w
t
V
R
V
V ωλ ==
1
4.18
14.2
1
2.13002.058.0151
73.0),(λββ
λλβ
−
−−−= eCp
(1)
0 1 2 3 4 5 6 7 8 90
1
2
3
4
5
6
7
8
9
10x 10
5 WIND TORQUE CURVE
λ
Tw
(N
m)
β = 0
β = 3
β = 6
β = 9
MPPT
Fig. 2. Wind torque as a function of the tip speed ratio and
pitch.
3. Gearbox simulation: the gearbox is considered to be
lossless for the sake of simplicity. The rotational speed of the
low-speed shaft in the blades is transformed to provide the
high-speed at the generator shaft using (2). High speed,
medium speed and low speed (gearless) concepts are reviewed
and Matlab plotting options are further explored.
blades
gb
turbinek
ωω1
= blades
gbturbine T
kT
1= (2)
4. Mechanical system simulation: the rotational equation of
the wind generator (3) is implemented next. The students
implement a differential equation in Simulink for the first time,
writing the equation in state-space form to avoid derivative
blocks that are known to cause simulation divergence. The
inertia shown in (3) collects the whole power train but it is
intentionally lowered for simulation purposes.
( )eturbine
turbine TTJdt
d−=
1ω (3)
Fig. 1. Full-power WECS simulated in the second part of the course.
155
5. PMSG model and control: although the design of the
simulation has been made step-by-step to help the students’
implementation, the permanent magnet generator model and
control are both included in the same stage because the
generator without control easily leads to simulation
divergence. The PMSG is implemented in Simulink using (4),
where P is the number of pairs of poles, Ld is the direct
inductance, Lq is the quadrature inductance, R is the stator
resistance, λm is the PM flux and ωelec is the electrical speed of
the generator.
The students are asked to implement the state-space
equations of (4) in Simulink using the parameter of a 2MW
PMSG well-defined in [16].
( )
( )
( )( )qdqdqme
melecqddelecq
q
q
dqqelecd
d
d
iiLLiPT
RiiLuLdt
di
RiiLuLdt
di
−−=
−−−=
−+=
λ
λωω
ω
2
3
1
1
(4)
The field oriented control (FOC), previously reviewed in
part 1, is also implemented in Simulink using equation (5),
which includes the PI controllers (for outer speed and inner
current control loops) and the decoupling terms (ed and eq) that
are added as feedforward signals. The zero d-current (ZDC)
criterion is applied for convenience. The inverter is considered
as ideal (vd=vd* and vq=vq
*) until the next stage.
( ) ( )( )∫ −⋅+−⋅= tintpnq nnknnkitt
***
[ ] ( )[ ]dddifddpfd eiikiikv +−⋅+−⋅= ∫ ***
[ ] ( )[ ]qqitqptq eiikiikv
qq+−⋅+−⋅= ∫ *** (5)
elecqqd iLe ω−= elecddelecmq iLe ωωλ +=
Implementation of (4) and (5), together with the Clarke and
Park transformations, allows the simulation of the wind
generator in a controlled manner. At this stage, the students are
asked to:
� Start the wind generator.
� Simulate sudden wind gusts (Fig. 3).
� Include noise in the current measurements and
evaluate the impact on the control performance.
� Modify the pitch angle during the simulation.
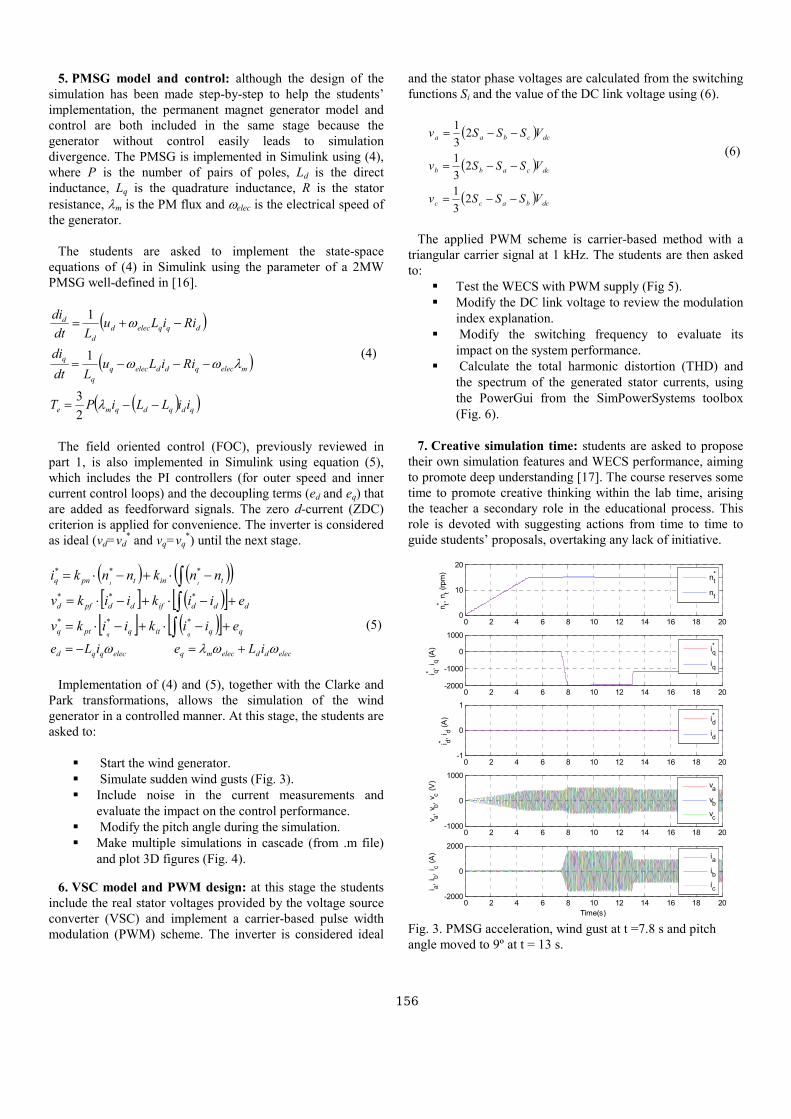
� Make multiple simulations in cascade (from .m file)
and plot 3D figures (Fig. 4).
6. VSC model and PWM design: at this stage the students
include the real stator voltages provided by the voltage source
converter (VSC) and implement a carrier-based pulse width
modulation (PWM) scheme. The inverter is considered ideal
and the stator phase voltages are calculated from the switching
functions Si and the value of the DC link voltage using (6).
( )
( )
( ) dcbacc
dccabb
dccbaa
VSSSv
VSSSv
VSSSv
−−=
−−=
−−=
23
1
23
1
23
1
(6)
The applied PWM scheme is carrier-based method with a
triangular carrier signal at 1 kHz. The students are then asked
to:
� Test the WECS with PWM supply (Fig 5).
� Modify the DC link voltage to review the modulation
index explanation.
� Modify the switching frequency to evaluate its
impact on the system performance.
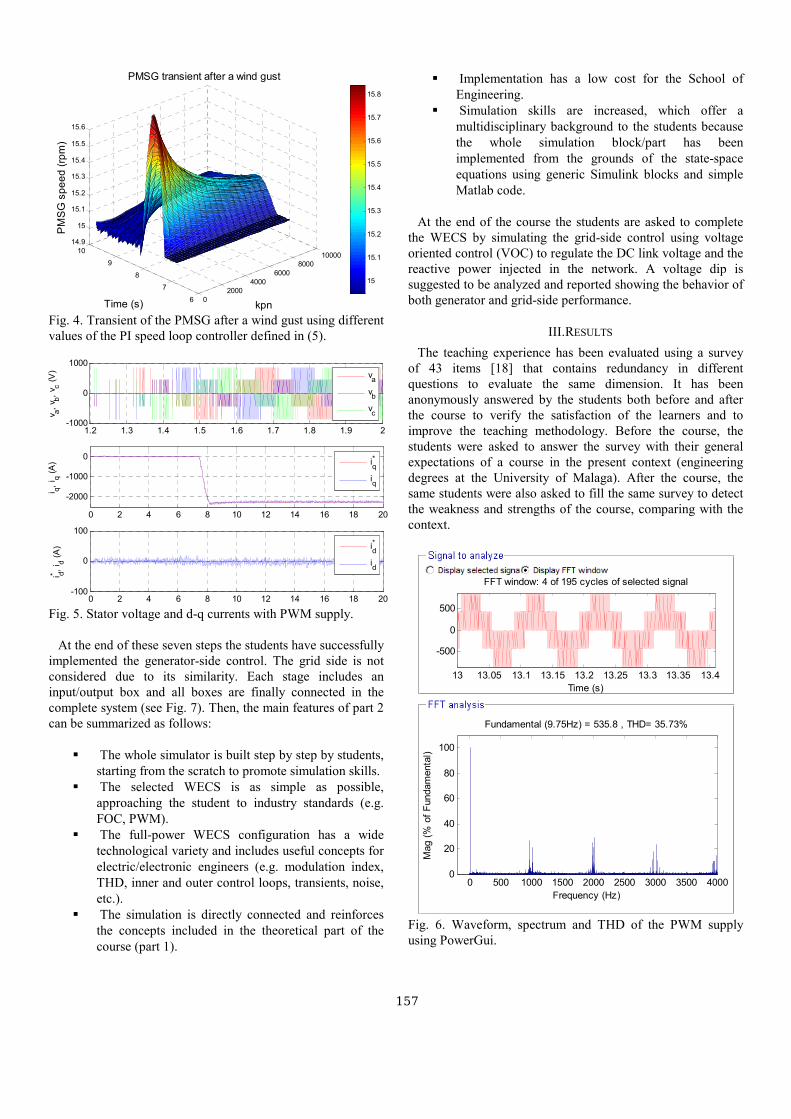
� Calculate the total harmonic distortion (THD) and
the spectrum of the generated stator currents, using
the PowerGui from the SimPowerSystems toolbox
(Fig. 6).
7. Creative simulation time: students are asked to propose
their own simulation features and WECS performance, aiming
to promote deep understanding [17]. The course reserves some
time to promote creative thinking within the lab time, arising
the teacher a secondary role in the educational process. This
role is devoted with suggesting actions from time to time to
guide students’ proposals, overtaking any lack of initiative.
0 2 4 6 8 10 12 14 16 18 200
10
20
nt* ,
nt (
rpm
)
nt*
nt
0 2 4 6 8 10 12 14 16 18 20-2000
-1000
0
1000
i q*,
i q (
A)
iq*
iq
0 2 4 6 8 10 12 14 16 18 20-1
0
1
i d*,
i d (
A)
id*
id
0 2 4 6 8 10 12 14 16 18 20-1000
0
1000
v a,
v b,
v c (
V)
va
vb
vc
0 2 4 6 8 10 12 14 16 18 20-2000
0
2000
Time(s)
i a,
i b,
i c (
A)
ia
ib
ic
Fig. 3. PMSG acceleration, wind gust at t =7.8 s and pitch
angle moved to 9º at t = 13 s.
156
0
2000
4000
6000
8000
10000
6
7
8
9
10
14.9
15
15.1
15.2
15.3
15.4
15.5
15.6
kpn
PMSG transient after a wind gust
Time (s)
PM
SG
sp
ee
d (
rpm
)
15
15.1
15.2
15.3
15.4
15.5
15.6
15.7
15.8
Fig. 4. Transient of the PMSG after a wind gust using different
values of the PI speed loop controller defined in (5).
1.2 1.3 1.4 1.5 1.6 1.7 1.8 1.9 2-1000
0
1000
v a,
v b,
v c (
V)
va
vb
vc
0 2 4 6 8 10 12 14 16 18 20
-2000
-1000
0
i q*,
i q (
A)
iq*
iq
0 2 4 6 8 10 12 14 16 18 20-100
0
100
i d*,
i d (
A)
id*
id
Fig. 5. Stator voltage and d-q currents with PWM supply.
At the end of these seven steps the students have successfully
implemented the generator-side control. The grid side is not
considered due to its similarity. Each stage includes an
input/output box and all boxes are finally connected in the
complete system (see Fig. 7). Then, the main features of part 2
can be summarized as follows:
� The whole simulator is built step by step by students,
starting from the scratch to promote simulation skills.
� The selected WECS is as simple as possible,
approaching the student to industry standards (e.g.
FOC, PWM).
� The full-power WECS configuration has a wide
technological variety and includes useful concepts for
electric/electronic engineers (e.g. modulation index,
THD, inner and outer control loops, transients, noise,
etc.).
� The simulation is directly connected and reinforces
the concepts included in the theoretical part of the
course (part 1).
� Implementation has a low cost for the School of
Engineering.
� Simulation skills are increased, which offer a
multidisciplinary background to the students because
the whole simulation block/part has been
implemented from the grounds of the state-space
equations using generic Simulink blocks and simple
Matlab code.
At the end of the course the students are asked to complete
the WECS by simulating the grid-side control using voltage
oriented control (VOC) to regulate the DC link voltage and the
reactive power injected in the network. A voltage dip is
suggested to be analyzed and reported showing the behavior of
both generator and grid-side performance.
III. RESULTS
The teaching experience has been evaluated using a survey
of 43 items [18] that contains redundancy in different
questions to evaluate the same dimension. It has been
anonymously answered by the students both before and after
the course to verify the satisfaction of the learners and to
improve the teaching methodology. Before the course, the
students were asked to answer the survey with their general
expectations of a course in the present context (engineering
degrees at the University of Malaga). After the course, the
same students were also asked to fill the same survey to detect
the weakness and strengths of the course, comparing with the
context.
13 13.05 13.1 13.15 13.2 13.25 13.3 13.35 13.4
-500
0
500
FFT window: 4 of 195 cycles of selected signal
Time (s)
0 500 1000 1500 2000 2500 3000 3500 40000
20
40
60
80
100
Frequency (Hz)
Fundamental (9.75Hz) = 535.8 , THD= 35.73%
Mag (
% o
f F
undam
enta
l)
Fig. 6. Waveform, spectrum and THD of the PWM supply
using PowerGui.
157

----------------------------- WIND EQUATIONS ----------------------- ----------------------------- GEARBOX -----------------------
-------------------------------- MECHANICAL SYSTEM ------------------------------
--------------------------- ELECTRICAL GENERATOR --------------------------
------------------------------------------------------------- PERMANENT MAGNET SYNCHORONOUS GENERATOR ----------------------------------------------------------
SPEED LOOP Q-CURRENT LOOP D-CURRENT LOOP
CHAPTER 7: SIMULATION OF THE POWER CONVERTER MODULATION (Example 7_1)
------------------ VOLTAGE SOURCE INVERTER -------------
WIND SPEED
TURBINE SPEED
WIND TORQUE
WIND POWER
-------------- VOLTAGE MONITORING --------
id *
0
WIND POWER
Vw (m/s)
SPEED
REFERENCE
PWM MODULATED VSI
Vphar
Vphbr
Vphcr
vpha
vphb
vphc
PITCH
PID
PID
PID
PHASE CURRENTS
Manual Switch
MECHANICAL SYSTEM
[welec ]
[id ]
[Te ]
[iq ]
[nt_ref][id_ref ]
[wt ]
[vd_ref ]
[vq_ref ][iq_ref ]
[w]
[T ][va ]
[Tw]
[vc ]
[vb ][Pm]
[Vw]
-1
GEARBOX
[vb _r]
[idm ]
[iq _ref]
[iqm ]
[wt ]
[Tw]
[nt ]
[va _r]
[ed ]
[Te ]
[eq ]
[welec ]
[vq ]
[vd ]
[vc _r]
[T ]
[w]
ELECTRICAL GENERATOR
vd
vq
welec
id
iq
Te
Fig. 7. Scheme of the different subsystems simulated by students to build the generator-side control of the WECS.
The results of the different dimensions (understanding,
motivation, etc) for the pre and post evaluation are reported in
Table I and Fig. 8. It is considered the feedback from the
different editions of the course with 52 students on average.
The mean values of the scores are included in the form
before/after.
Since the two parts of the course are quite of a different
nature, the survey was also answered at the end of each part to
verify the students’ perception of the lectures and simulation
tasks (Fig. 8).
TABLE I
SURVEY TO VERIFY STUDENTS’ SATISFACTION
Dimension Pre/post
score
Dimension Pre/post
score
Course assessment 2.9 / 4.5 Satisfaction 3.3 / 4.5
Lecturer
Assessment
2.9 / 4.6 Motivation 2.5 / 4.5
Content 2.8 / 4.1 Material 3 / 4.2
Interactivity 2.6 / 3.8 Methodology 3 / 4.4
Understanding 2.8 / 4.1 Application 2.7 / 4.4
Results show that all dimensions have been improved, being
especially remarkable the increase of the motivation (80%)
and application sense (63%). The general course assessment
also shows a clear improvement (55%). In relation to the
partial scores, differences in the survey answers are small, and
both parts of the course are satisfactory for the students.
An objective assessment of the first part of the course was
also conducted using a test with 72 multiple-choice questions
[18] asking for general concepts of the different chapters
previously listed in Table I of part 1. Results of Fig. 9 show
that the test was correctly answered in a percentage higher than
80% on average for all chapters of the course, showing that the
main concepts were correctly understood.
In the second part of the course, all students were able to
build the complete simulation although some of them required
more help depending on the previous background. It is also
noticeable that optional subjects on electrical machines (EM)
and power electronics (PE) at the University of Málaga have
increased the number of students by 33 and 50% respectively
in the course 2011/2012.
158

0 1 2 3 4 5
Course
Lecturer
Content
Interactivity
Understand
Satisfaction
Motivation
Material
Method.
Application
Before the course After the course
0 1 2 3 4 5
Course Part 1 Course Part 2
0 1 2 3 4 5
Course
Lecturer
Content
Interactivity
Understand
Satisfaction
Motivation
Material
Method.
Application
Before the course After the course
0 1 2 3 4 5
Course Part 1 Course Part 2
Fig. 8. Satisfaction of the students attending the course.
0 20 40 60 80 100
WE situation
FAQS
EM & PE
Topologies
Regulation
Partial-Power
Full-Power
Trends
Fig. 9. Objective assessment through multiple choice tests
(Part 1).
IV. CONCLUSIONS
After initial skepticism and problems, principally due to the
power grid stability, renewable energies are now widely seen
as a real alternative to conventional energy sources. Wind
energy systems are nowadays the most popular choice among
all renewable energies. A high diversity of electrical machines,
power converters, control strategies and topologies are
involved into a modern wind generator. In this paper, a wind
generator has been placed into the centre of interest of a course
about electrical machines and power converters to increase
motivation of the students with a high industry-oriented end-
application. An educational methodology that combines
valuable state-of-the-art information about the technology and
hands-on simulation work is proposed. The experience has
been tested comparing with the contextual educational
environment (engineering degrees at the University of Malaga,
Spain). Obtained results prove that the proposed pedagogical
scheme satisfies the students and promotes a wide variety of
competences. The proposal can be easily extended thanks to its
flexible and low-cost procedures.
ACKNOWLEDGEMENT
The authors gratefully acknowledge the Spanish
Government and the European Union (FEDER funds) for the
economical support provided within the National Research,
Development and Innovation Plan, DPI2011-25396.
REFERENCES
[1] N. Mohan, A.K. Jain, P. Jose, R. Ayyanar, “Teaching utility applications of power electronics in a first course on power systems,” IEEE Transactions on Education, vol. 19, no. 1, pp. 40–47, 2004.
[2] J.J. Rodriguez-Andina, L. Gomes, S. Bogosyan, “Current Trends in Industrial Electronics Education,” IEEE Transactions on Education, vol. 57, no. 10, pp. 3245–3252, 2010.
[3] M. Chunting, Z.J. Shen, T. Ceccarelli, “Continuing education in power electronics,” IEEE Transactions on Education, vol. 48, no. 1, pp. 183–190, 2005.
[4] S.L. Toral, F. Barrero, M.R. Martinez-Torres, S. Gallardo, M. Duran, “Modeling Learner Satisfaction in an Electronic Instrumentation and Measurement Course Using Structural Equation Models,” IEEE Transactions on Education, vol. 52, no. 1, pp. 190–199, 2009.
[5] M.J. Durán, S. Gallardo, S.L. Toral, M.R. Martínez-Torres, F. Barrero, “A learning methodology using Matlab/Simulink for undergraduate electrical engineering courses attending to learner satisfaction outcomes,” International Journal of Technology and Design Education, Vol. 17, no. 1, pp. 55-73, 2007.
[6] L. Shuhui, R. Challoo, “Restructuring an electric Machinery course with an integrative approach and computer-assisted teaching methodology,” IEEE Transactions on Education, vol. 49, no. 1, pp. 16–28, 2006.
[7] J.R. Arribas, C. Veganzaones, F. Blázquez, C.A. Platero, D. Ramirez, S. Martínez, J.A. Sánchez, N.H. Martínez “Computer-based simulation and scaled laboratory bench for teaching and training of engineers on the control of doubly-fed induction generators,” IEEE Transactions on Power Systems, vol. 26, no. 3, pp. 1534–1543, 2011.
[8] D. Santos-Martin, J. Alonso-Martínez, J. E. Carrasco, S. Arnaltes, “Problem-based learning in wind energy using virtual and real stups,” IEEE Transactions on Education, in press, 2012.
[9] B. Andresen, J. Birk, “A high power density converter system for the Gamesa G10x 4,5 MW wind turbine,” in Proc. EPE, pp. 1-8, 2007.
[10] M.J. Duran, S. Kouro, B. Wu, E. Levi, F. Barrero, S. Alepuz, “Six-phase PMSG wind energy conversion system based on medium-voltage multilevel converter,” in Proc. EPE, pp. 1-10, 2011.
[11] M.J. Duran, F. Salas, M.R. Arahal, “Bifurcation analysis of five–phase
induction motor drives with third harmonic injection,” IEEE Trans. on
Industrial Electronics, vol. 55, no. 5, pp. 2006−2014, 2008. [12] M.J. Durán, J. Prieto, F. Barrero, S. Toral, “Predictive Current Control
of Dual Three–phase Drives using Restrained Search Techniques,” IEEE Trans. on Industrial Electronics, vol. 58, no. 8, pp. 3253–3263, 2011.
[13] M.J. Durán, J. Prieto, F. Barrero, S. Toral, “Reduction of Common-Mode Voltage in Five–phase Induction Motor Drives Using Predictive Control Techniques,” IEEE Trans. on Industry Applications, (accepted for publication), 2012.
[14] C. Jauch, J. Matevosyan, T. Ackerman, S. Bolik, “International comparison of requirements for connection of wind turbines to power systems,” Wind Energy, vol. 8, no. 3, pp. 295-306, 2005.
[15] Red Eléctrica de España. P.O. 12.3: Requisitos de Respuesta frente a Huecos de Tensión de las Instalaciones de Producción en Régimen Especial [Online]. Available: http://www.ree.es/operacion/pdf/po/ PO_resol_12.3_Respuesta_huecos_eolica.pdf.
[16] B. Wu, Y. Lang, N. Zargari, S. Kouro, “Power conversion and control of wind energy systems,” Wiley, 2011.
[17] J. Biggs and C. Tang, Teaching for Quality Learning at University, 3rd ed. Maidenhead, U.K.: Open Univ. Press, 2007.
[18] http://epropias.cv.uma.es/course/view.php?id=551&edit=off&sesskey=J5y18Avsrz
159
Powered by TCPDF (www.tcpdf.org)
Copyright © 2022 FDOKUMEN