Low voltage ride through (LVRT) ability of DFIG based wind energy conversion system-I
81
After preparation of the financial statements, one may be interested in knowing the position of an enterprise from different points of view. This can be done by analyzing the financial statement with the help of different tools of analysis such as ratio analysis, funds flow analysis, cash flow analysis, comparative statement analysis, etc. Here I have done financial analysis by ratios. In this process, a meaningful relationship is established between two or more accounting figures for comparison. Financial ratios are widely used for modeling purposes both by practitioners and researchers. The firm involves many interested parties, like the owners, management, personnel, customers, suppliers, competitors, regulatory agencies, and academics, each having their views in applying financial statement analysis in their evaluations. Practitioners use financial ratios, for instance, to forecast the future success of companies, while the researchers' main interest has been to develop models exploiting these ratios. Many distinct areas of research involving financial ratios can be discerned. Historically one can observe several major themes in the financial analysis literature. There is overlapping in the observable 1
-
Upload
sims-indore -
Category
Documents
-
view
5 -
download
0
Transcript of Low voltage ride through (LVRT) ability of DFIG based wind energy conversion system-I
After preparation of the financial
statements, one may be interested in knowing the position of
an enterprise from different points of view. This can be
done by analyzing the financial statement with the help of
different tools of analysis such as ratio analysis, funds
flow analysis, cash flow analysis, comparative statement
analysis, etc. Here I have done financial analysis by
ratios. In this process, a meaningful relationship is
established between two or more accounting figures for
comparison.
Financial ratios are widely used for
modeling purposes both by practitioners and researchers. The
firm involves many interested parties, like the owners,
management, personnel, customers, suppliers, competitors,
regulatory agencies, and academics, each having their views
in applying financial statement analysis in their
evaluations. Practitioners use financial ratios, for
instance, to forecast the future success of companies, while
the researchers' main interest has been to develop models
exploiting these ratios. Many distinct areas of research
involving financial ratios can be discerned. Historically
one can observe several major themes in the financial
analysis literature. There is overlapping in the observable
1

themes, and they do not necessarily coincide with what
theoretically might be the best founded areas.
Financial statements are those statements
which provide information about profitability and financial
position of a business. It includes two statements, i.e.,
profit & loss a/c or income statement and balance sheet or
position statement.
The income statement presents the summary of
the income earned and the expenses incurred during a
financial year. Position statement presents the financial
position of the business at the end of the year.
Before understanding the meaning of analysis
of financial statements, it is necessary to understand the
meaning of „analysis‟ and „financial statements‟.
Analysis means establishing a meaningful
relationship between various items of the two financial
statements with each other in such a way that a conclusion
is drawn. By financial statements, we mean two statements-
(1) Profit & loss A/C.2
(2) Balance sheet.
These are prepared at the end of a given period of time.
They are indicators of profitability and financial soundness
of the business concern.
Thus, analysis of financial statements means establishing
meaningful relationship between various items of the two
financial statements, i.e., income statement and position
statement.
Parties interested in analysis of financial statements:
Analysis of financial statement has become very significant
due to widespread interest of various parties in the
financial result of a business unit.
The various persons interested in the analysis of financial
statements are:-
Short- term creditors:
They are interested in knowing whether the amounts
owing to them will be paid as and when fall due for
payment or not.
Long –term creditors:
3

They are interested in knowing whether the principal
amount and interest thereon will be paid on time
or not.
Shareholders:
They are interested in profitability, return and
capital appreciation.
Management:
The management is interested in the financial
position and performance of the enterprise as a whole
and of its various divisions.
Trade unions:
They are interested in financial statements for
negotiating the wages or salaries or bonus agreement with
management.
Taxation authorities:
These authorities are interested in financial
statements for determining the tax liability.
Researchers:
4

They are interested in the financial statements in
undertaking research in business affairs and practices.
Employees:
They are interested as it enables them to justify
their demands for bonus and increase in remuneration.
You have seen that different parties are interested in the
results reported in the financial statements. These results
are reported by analyzing financial statements through the
use of ratio analysis.
BANK PROFILE:
1. STATE BANK OF INDIA
Type - Public (BSE, NSE:SBI) & (LSE: SBID)
Founded- Calcutta, 1806 (as Bank of Calcutta)
Headquarters- Corporate Centre
Mumbai 400 021 India
Key people- Shri Pratip Chaudhuri, Chairman
State Bank of India (SBI) is the
largest bank in India. It is also, measured by the number of
5
branch offices and employees, the second largest bank in the
world. The bank traces its ancestry back through the
Imperial Bank of India to the founding in 1806 of the Bank
of Calcutta, making it the oldest commercial bank in the
Indian Subcontinent. The Government of India nationalized
the Imperial Bank of India in 1955, with the Reserve Bank of
India taking a 60% stake, and renamed it the State Bank of
India. In 2008, the Government took over the stake held by
the Reserve Bank of India.
SBI provides a range of banking products through its vast
network in India and overseas, including products aimed at
NRIs. With an asset base of $126 billion and its reach, it
is a regional banking behemoth.
The State Bank Group, with over 16000
branches, has the largest branch network in India. It has a
market share among Indian commercial banks of about 20% in
deposits and advances.
International presence:6

The bank has 52 branches, agencies
or offices in 32 countries. It has branches of the parent in
Colombo, Dhakka, Frankfurt, Hong Kong, Johannesburg, London
and environs, Los Angeles, Male in the Maldives, Muscat, New
York, Osaka, Sydney, and Tokyo. It has offshore banking
units in the Bahamas, Bahrain, and Singapore, and
representative offices in Bhutan and Cape Town. SBI operates
several foreign subsidiaries or affiliates. In 1990 it
established an offshore bank, State Bank of India
(Mauritius). It has two subsidiaries in North America, State
Bank of India (California), and State Bank of India
(Canada). In 1982, the bank established its California
subsidiary, which now has seven branches. The Canadian
subsidiary was also established in 1982 and also has seven
branches, four in the greater Toronto area, and three in
7

British Columbia. In Nigeria, it operates as INMB Bank. This
bank was established in 1981 as the Indo-Nigerian Merchant
Bank and received permission in 2002 to commence retail
banking. It now has five branches in Nigeria. In Nepal SBI
owns 50% of Nepal SBI Bank, which has branches throughout
the country. In Moscow SBI owns 60% of Commercial Bank of
India, with Canara Bank owning the rest. In Indonesia it
owns 76% of PT Bank Indo Monex. State Bank of India already
has a branch in Shanghai and plans to open one up in
Tianjin.
BANK PROFILE:
BOARD OF
DIRECTORS
1 Shri Pratip Chaudhuri (Chairman)
2 Hemant G Contractor (MD)
3 A Krishna Kumar
4 Diwakar Gupta
5 Ashok Jhunjhunwala
6 Dileep C Choksi
7 S Venkatachalam
8

8 D Sundaram
9 G D Nadaf
10 Rajiv Kumar
11 Rashpal Malhotra
12 Shashi Kant Sharma
13 Shashi Kant Sharma
9
2. INDUSTRIAL CREDIT & INVESTMENT CORPORATION OF INDIA
(ICICI BANK):-
ICICI was formed in 1955 at the
initiative of the World Bank, the government of India and
Indian industry representatives. The principal objective was
to create a development financial institution for providing
medium-term and long-term project financing to Indian
businesses. Until the late 1980s, ICICI primarily focused
its activities on project finance, providing long-term funds
to a variety of industrial projects. With the liberalization
of the financial sector in India in the 1990s, ICICI
transformed its business from a development financial
institution offering only project finance to a diversified
financial services provider that, along with its
subsidiaries and other group companies, offered a wide
variety of products and services. As India’s economy became
more market-oriented and integrated with the world economy,
ICICI capitalized on the new opportunities to provide a
wider range of financial products and services to a broader
spectrum of clients.
ICICI Bank was incorporated in 1994 as a part of the ICICI
group. ICICI Bank’s initial equity capital was contributed
75.0% by ICICI and 25.0% by SCICI Limited, a diversified
10

finance and shipping finance lender of which ICICI owned
19.9% at December 1996. Pursuant to the merger of SCICI into
ICICI, ICICI Bank became a wholly-owned subsidiary of ICICI.
ICICI’s holding in ICICI Bank reduced due to additional
capital raising by ICICI Bank and sale of shares by ICICI,
pursuant to the requirement stipulated by the Reserve Bank
of India that ICICI dilute its ownership of ICICI Bank.
Effective March 10, 2001, ICICI Bank acquired Bank of
Madura, an old private sector bank, in an all-stock merger.
The issue of universal banking, which in
the Indian context means the conversion of long term lending
institutions such as ICICI into commercial banks, had been
discussed at length over the past several years. Conversion
into a bank offered ICICI the ability to accept low-cost
demand deposits and offer a wider range of products and
services, and greater opportunities for earning non fund
based income in the form of banking fees and commissions.
ICICI Bank also considered various strategic alternatives in
the context of the emerging competitive scenario in the
Indian banking industry. ICICI Bank identified a large
capital base and size and scale of operations as key success
factors in the Indian banking industry. In view of the
benefits of transformation into a bank and the Reserve Bank
11
of India’s pronouncements on universal banking, ICICI and
ICICI Bank decided to merge.
At the time of the merger, both ICICI
Bank and ICICI were publicly listed in India and on the New
York Stock Exchange. The amalgamation was approved by each
of the boards of directors of ICICI, ICICI Personal
Financial Services, ICICI Capital Services and ICICI Bank at
their respective board meetings held on October 25, 2001.
The amalgamation was approved by ICICI Bank’s and ICICI’s
shareholders at their extraordinary general meetings held on
January 25, 2002 and January 30, 2002, respectively. The
amalgamation was sanctioned by the High Court of Gujarat at
Ahmadabad on March 7, 2002 and by the High Court of
Judicature at Bombay on April 11, 2002.
The amalgamation became effective on May
3, 2002. The date of the amalgamation for accounting
purposes under Indian GAAP was March 30, 2002.
The Sangli Bank Limited, an unlisted private sector bank
merged with ICICI Bank with effect from April 19, 2007. On
the date of acquisition, Sangli Bank had over 190 branches
and extension counters, total assets of Rs. 17.6billion (US$
440 million), total deposits of Rs. 13.2 billion (US$ 330
million), total loans of Rs. 2.0 billion(US$50million).
12

BOARD OF DIRECTORS
1 K V Kamath (Chairman)
2 Chanda Kochhar(MD & CEO)
3 N S Kannan
4 K Ramkumar
5 Rajiv Sabharwal
6 Sridar lyengar
7 Homi Khusrokhan
8 Anup K Pujari
9 M S Ramachandran
10 Tushaar Shah
11 V Sridar
13
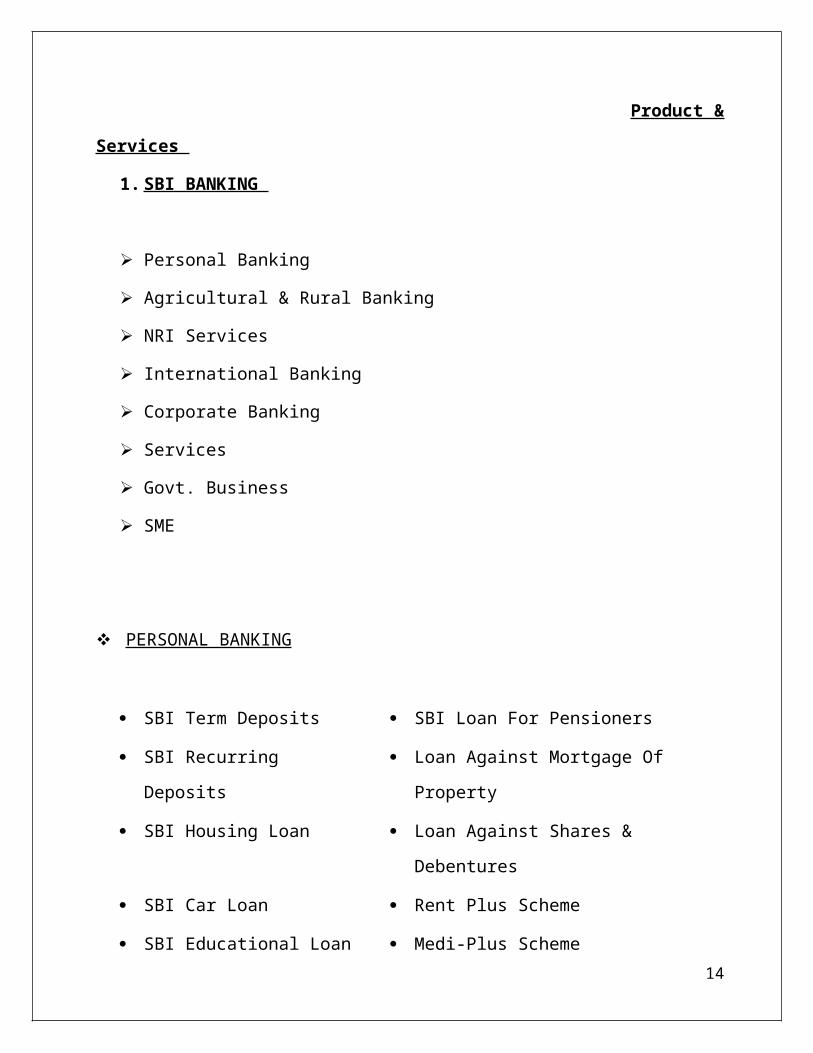
Product &
Services
1. SBI BANKING
Personal Banking
Agricultural & Rural Banking
NRI Services
International Banking
Corporate Banking
Services
Govt. Business
SME
PERSONAL BANKING
SBI Term Deposits SBI Loan For Pensioners
SBI Recurring
Deposits
Loan Against Mortgage Of
Property
SBI Housing Loan Loan Against Shares &
Debentures
SBI Car Loan Rent Plus Scheme
SBI Educational Loan Medi-Plus Scheme 14

SBI Personal Loan Rates Of Interest
AGRICULTURAL & RURAL BANKING
State Bank of India Caters to the needs of
agriculturists and landless agricultural laborers through a
network of 6600 rural and semi-urban branches. There are 972
specialized branches which have been set up in different
parts of the country exclusively for the development of
agriculture through credit deployment .These branches
include 427 Agricultural Development Branches (ADBs) and 547
branches with Development Banking Department (DBDs) which
cater to agriculturists and 2 Agricultural Business Branches
at Chennai and Hyderabad catering to the needs of hi tech
commercial agricultural projects.
Our branches have covered a whole gamut of agricultural
activities like crop production, horticulture , plantation
crops, farm mechanization, land development and reclamation,
digging of wells, tube wells and irrigation projects,
forestry, construction of cold storages and godowns,15

processing of agri-products, finance to agri-input dealers,
allied activities like dairy , fisheries, poultry, sheep-
goat, piggery and rearing of silk worms.
The branch also has farmer's meet in
villages to explain to farmers about various schemes offered
by the bank. To give special focus to agriculture lending
Bank has set up agri business unit. Bank has also agri
specialists in various disciplines to handle projects/ guide
farmers in their agri 25 ventures. Advances are given for
very small activity covering poorest of the poor to hi-tech
activities involving large fund outlays.
We are the leaders in agri finance in the country with a
portfolio of Rs. 18,000 cars in agri advances to around 50
lac farmers.
NRI SERVICES
World Class Services from a Bank you can
Trust Indians everywhere should become enlightened16

International citizens. Wherever you are, whichever country
you live, enrich that nation, not only in financial terms,
but also with your sweat knowledge and dignity since that is
the tradition of the country from where you came. At the
same time, remember we have a common umbilical connectivity
to our motherland, India.
INTERNATIONAL BANKING
International banking services of State
Bank of India are delivered for the benefit of its Indian
customers, non-resident Indians, foreign entities and banks
through a network of 84 offices/branches in 32 countries as
on 31 March 2008, spread over all time zones. The network is
augmented by a cluster of Overseas and NRI branches within
India and correspondent links with over 522 banks, the world
over. Bank's Joint Ventures and Subsidiaries abroad further
underline the Bank's international presence.
The services include corporate lending, loan syndications,
merchant banking, handling Letters of Credit and Guarantees,
short-term financing, collection of clean and documentary
credits and remittances.
The Bank has carved a niche for itself in the Euro land with
branches located in Antwerp, Paris and Frankfurt. Indian
17
banks and corporate are able to avail single-window Euro
services from the Bank's Frankfurt branch.
CORPORATE BANKING
SBI is a one shop providing financial
products / services of a wide range for large, medium and
small customers both domestic and international.
Working Capital Financing
Assistance extended both as Fund based and Non-Fund
based facilities to Corporate, Partnership firms,
Proprietary concerns
Working Capital finance extended to all segments of
industries and services sector such as IT Term Loans to
support capital expenditures for setting up new
ventures as also for expansion, renovation etc.
18

Deferred Payment Guarantees to support purchase of
capital equipments. Corporate Loans For a variety of
business related purposes to corporate. Export Credit
To Corporate / Non Corporate Strategic Business Units
(i) Corporate Accounts Group (CAG) (ii)Project Finance
(iii) Lease Finance
An exclusive unit providing one s shopping to Corporate
A dedicated set up specialized in financing of
infrastructure and other large projects
Exclusive set up for handling large ticket leases.
Pricing
SBI's Prime Lending Rates (PLR) is among the lowest
Presently Bank has two PLR's
SBAR for loans payable on demand and up to one year
for loans payable beyond one year.
SERVICES
Listed on the left are Services, SBI offers to its
customers.
19

DOMESTIC TREASURY
INTERNET BANKING
E-PAY
E-RAIL
RBIEFT
SAFE DEPOSIT LOCKER
GIFT CHEQUES
SBI VISHWA YATRA FOREIGN TRAVEL CARD
BROKING SERVICES
REVISED SERVICE CHARGES
ATM SERVICES
GOVERNMENT BUSINESS
State Bank of India's linkage with
Government business is widespread. No wonder that out of
9315 branches in India, about 7000 branches are conducting
Government Business. The large network of our branches
provides easy access to the common man to deposit the
following Government dues and pension payments.
20

SME (small scale industries)
State Bank of India has been playing a vital role in the
development of small scale industries since 1956.The Bank
has financed over 8 lakhs SSI units in the country. It has
55 specialized SSI branches, 99 branches in industrial
estates and more than 400 branches with SIB divisions.
The Bank finances for Small Business activities which are of
special significance to a large number of people as many of
these activities can be started with relatively lower
investment and with no special skills on the part of the
entrepreneurs.
21
ICICI BANKING
PERSONAL BANKING
DEPOSITS
Safety, Flexibility, Liquidity, Returns!
ICICI Bank offers a wide Variety of Deposit Products to suit
your banking requirements.
LOANS
Simplified Documentation, Quick Processing, Hassle Free!!!
INVESTMENT22

Exclusive, Economical, Expert Advice!!!
ICICI Bank’s power-packed, feature-rich investment options
for meeting all your investment needs.
CARDS
World Class Service and Acceptanc!!!
A truly world class service as ICICI Bank cards have both
national and international acceptation.
INSURANCE
Secure, Reliable, convenient!!!
Convenience has always been synonymous with ICICI Bank and
keeping in line we offer the facility of buying insurance
policy online.
ONLINE SERVICES
Banking at your fingertips!!!
Why be inline when you can be online for paying your bills,
mobile bills, prepaid mobile recharge, shopping, credit
card, insurance premium and lots more.
23

INTERNATIONAL BANKING
In 2001, we identified international banking as a key
opportunity, aiming to cater to the cross-border needs of
clients and leveraging our domestic banking strengths to
offer products internationally. We have made significant
progress in the international business since we set up our
first overseas branch in Singapore in 2003. ICICI Bank
currently has subsidiaries in the United Kingdom, Russia and
Canada, branches in Singapore, Bahrain, Hong Kong, Sri
Lanka, Dubai International Finance Centre, Qatar Financial
Centre and the United States and representative offices in
the United Arab Emirates, China, South Africa, Bangladesh,
Thailand, Malaysia and Indonesia. The Bank‟s wholly owned
subsidiary ICICI Bank UK PLC has nine branches in the United
Kingdom and a branch each in Belgium and Germany. ICICI Bank
Canada has eight branches including three in Toronto. ICICI
Bank Eurasia LLC has six branches including three branches
in Moscow and one in St. Petersburg. Our international
strategy is focused on building a retail deposit franchise,
diverse wholesale funding sources and strong syndication
capabilities to support our corporate and investment banking
business; achieving the status of a non-resident Indian
24

(NRI) community bank in key markets; and expanding private
banking operations for India-centric asset classes. During
fiscal 2008, we focused on deepening our presence in
existing overseas locations and expanding our operations in
key markets. In line with our strategy to establish a
presence in large markets with significant savings pools, we
entered into Germany through a branch established by ICICI
Bank UK PLC. We have been able to successfully leverage our
technology advantage to create a growing international
deposit base. Total deposits of ICICI Bank UK PLC and ICICI
Bank Canada increased by 76.0% from Rs. 191.28billion at
March 31, 2007 to Rs. 335.86 billion at March 31, 2008. We
also received approval for and commenced branch operations
in the United States.
We have established a strong franchise among NRIs by
offering a comprehensive product suite, technology enabled
access, a wide distribution network in India and alliances
with local banks in various markets. Currently, we have over
500,000 NRI customers. We have undertaken significant brand-
building initiatives in international markets and have
emerged as a well-recognised financial services brand for
NRIs. We continue to maintain a market share of 25% in
inward remittances to India. During fiscal 2008, we launched
innovative products like instant money transfer and enhanced
25

our focus on customer relationship management and process
automation. Additionally, we also undertook the development
of low cost remittance products in non-India geographies
with correspondent tie-ups for disbursements in over 100
such geographies.
Through our international private banking services, we offer
various products to mass affluent and high net worth clients
based on their financial needs and risk appetite. The
offerings range from simple deposits and loans to more
sophisticated structured products, private equity and
products giving exposure to the real estate sector in India.
CORPORATE BANKING
26
Our corporate banking strategy is based on providing
comprehensive and customised financial solutions to our
corporate customers. We offer a complete range of corporate
banking products including rupee and foreign currency debt,
working capital credit, structured financing, syndication
and transaction banking products and services. Our corporate
and investment banking franchise is built around a core
relationship team that has strong relationships with almost
all of the country‟s corporate houses. The relationship team
is product agnostic and is responsible for managing banking
relationships with clients. We have also put in place
product specific teams with a view to focus on specific
areas of expertise in designing financial solutions for
clients. Through our relationship teams working in tandem
with product solution teams, we have deepened our client
relationships across our product portfolio or esulting in
significant growth in income and wallet share among all our
top corporate clients, as compared to the previous year.
We have created an integrated Global Investment Banking
Group, which is responsible for working with the
relationship team in India and our international
subsidiaries and branches, for origination, structuring and
execution of investment banking mandates on a global basis.
27
We have also restructured our delivery team for transaction
banking products by creating dedicated sales teams for trade
services and transaction banking products. This has been
done with the intent to increase our market share from
transaction banking products, which will translate into
recurring fee income for the Bank. We have also focused on
increasing market share in trade finance by leveraging and
further strengthening correspondent banking relationships.
SME BANKING
During fiscal 2008, our small enterprises customer base
increased by 26% to about 1.1 million accounts. We have
introduced our service offerings in over 400 new branches,
increasing our coverage to over 1,000 branches. During the
year, we have focused on product specialisation including
investment banking for SMEs. We have continued to focus on
shaping the small and medium enterprises sphere in India
through initiatives such as the Emerging India Awards”, the
SME CEO Knowledge Series - a platform to mentor and assist
SME entrepreneurs, and the “SME Dialogue” - a weekly feature
in a leading financial newspaper sharing SME best practices
28

and success stories. During the year, we have launched
several new products and services like the SME toolkit – an
online business
and advisory resource for SMEs.
RURAL BANKING AND AGRI-BUSINESS
We believe the rural economy has high growth potential and
offers large credit growth opportunities. Towards this end,
29

our suite of products and services is targeted to address
the needs of both the farm and non-farm sectors. Our retail
product suite encompasses loans for crop production,
purchase of farm equipment; commodity based finance as well
as various savings, investment and insurance products. We
also offer micro-finance and jewel loans. We have also
focused on enhancing credit to farmers by leveraging on
corporate partnerships. For example, we have partnered with
various dairies to provide financing to farmers for purchase
of milch cattle. We also provide credit and banking services
to SMEs active in the agricultural value chain. To enhance
our service quality and product delivery capabilities we
have developed a large network of rural branches which is
further augmented by non-branch channels. Rural banking in
India is still at a nascent stage and the deployment of
technology channels and modern banking methods for rural
lending continues to be an evolving process. In line with
our learning from our rural banking operations, we undertook
a comprehensive review of and realigned our channel
architecture, credit underwriting processes and account
management systems. We have put in place a robust risk
management structure to Mitigate and manage credit,
operational and fraud risks. Through this, we aim to create
a strong foundation for scaling up of our rural business.
30

Shobhana, V.K. and Shanthi, G. (2008) assess the operational
efficiency of foreign banks in India using the data for the
period 1996-97 to 2004-05. Analysis of clearance is used to
find that there is no significant relationship between
operational efficiency and variables such as size of assets,
branch network and staff strength, 31 foreign banks were
selected for the study. It is concluded that state bank of
Mauritius achieved the highest productivity whereas the
operational efficiency of common international bank was the
lowest.
Aggarwal, A.K., Singh, D. and Chaturvedi, N. (2007-08)
analyzed the performance of the banking sector and
considered as a proxy for the economy as a whole, due to
banks wide spectrum of exposures The paper argues that to
survive and thrive in the long run, banks need to pursuer31
strategies that enable them to develop resources that are
inimitable, rare, durable and superior to competitors, while
consolidation and convergence are no doubt necessary to
survive, they are by no means sufficient. The most important
point is that mergers and acquisitions in the banking sector
must be market led rather than prompted by government or
regulator. We are sure that our banking institutions, as in
the post, shall rise to the occasion and show the required
flexibility to absorb and adopt. The institutional changes
to consolidate their position in the world market.
Kamakodi, N. (2007) examines how computerization has
influenced the banking habits and preference of Indian
customers and which factors influence these preferences.
Changing of residence, salary account and non-availability
of the technology based services were given as the three
main reasons for changing the bank.
Srivastava, R.M. (2006) concluded that in post
nationalization period witnessed an unprecedented expansion
of banking industry in India. However accompanied32
inefficiency and poor financial health to overcome this
problem and improve he efficiency of banks, various tectonic
measures were taken since 1991. This has resulted in
improvement in productivity, profitability and strengthening
of financial position of the banks so much that they are
outshining those of advanced notions .However banks have
still o go a long way to sustain their Competitive success.
Indian Commercial Banks also need to enhance their system
and procedure to international standards and also
simultaneously fortify their financial position.
Singh, I. & Kumar, P. (2006) analyzed that deposits is a
major determinant of spread followed by borrowings and
labor. The study again concluded that average technical and
allocate efficiency are the highest in foreign banks while
of PSBs is although lower than FBs but much better than
private sector banks.
Singla & Arora (2005) studied the comparative performance of
Canara Bank and Indian Bank that both the banks have
improved their financial performance during the study period
where Canara Bank has an upper hand in growth of deposit,
advances and average working funds. In case of productivity
33

it is rising in both the banks but remained much higher in
Canara Bank.
Aggarwal, M. (2005) highlights the performance of three
sectors of banks (i.e. public, private and foreign) in the
pre liberalization period and the post- liberalization
periods in terms of growth rate of their interest income as
a %age working funds, non-interest income as a %age working
funds, operational expenses as a %age operational income,
cost of deposits, spread as a %age working funds,
operational productivity etc. The data were collected for
the period of 21 years starting from 1980 to 2001 the study
of paper reveals that the operational productivity of all
the sectors is better in post liberalization period.
Arora, U. and Verma, R. (2005) studied the performance
evolution of public sector banks in the post reforms period
on the basis of four parameters that are financial
parameters, operational parameters, profitability parameters
and productivity parameters and during this period the
performance of public sector banks is quite satisfactory.
Bhattacharya, (1997) has found public sector banks with the
highest efficiency among the three categories of bank groups
as foreign and private sector banks have much lower
efficiencies. However PSBs started showing a decline in
34

efficiency after 1987, private banks witnessed no change and
foreign banks disclosed sharp rise in efficiency.
Narayanasami, T.S. (2005) stated that rural lending is
relatively less risky and more profitable for all classes of
commercial banks. Credit plays a catalytic role at the right
time in accelerating economic development. Economic reforms
have brought about irreversible changes in several sectors
of the economy. Indian banking is also in a better position
with respect to technology, capital adequacy and credit
management, risk bearing capacity, international
competitiveness and contribution to the national economy.
B. Janki, (2002), analyzed in his article that how
technology is effecting employee’s productivity. There is no
doubt, in India particularly PSBs will need to use
technology to improve operating efficiency and customer
services. Harnessing employee technology synergy is crucial
for unleashing productivity and reaching out to the huge
base of retail customers, who are also dispersed in rural
and semi-urban areas. Banks can use technology to address
customer needs and improve their interaction with customer
keeping in touch through telephone and Internet. The focus
on technology will increase like never before to add value
35

to customer service, develop new products, strengthen risk
management, and asset liability management and improve
profitability. However technology is only an enabling tool
and whether banks actually what they want to achieve will be
determined by the drive and motivation of their work force
and response of the staff. Garg, M. (1994) studied that
Indian scheduled commercial banks have achieved remarkable
progress in last two decades under study, particularly in
branch expansion in rural areas, deposits mobilization and
credit deployment to priority sector and small borrowers but
their profits have not kept pace their growth and hence,
their share in profits have come down, whereas foreign banks
with a much smaller geographical spread and resources base,
earn almost as much by way of profits as the 20 nationalized
banks put together. There is a lot of difference in the
pattern of advances and investments and even lending rates
of Indian and foreign banks.
Ram, T.T (2002) said that business is being completely
reinvented because transaction costs are much lower on the
Internet than in traditional channels. The banks are rapidly
shifting their business functions & customers relationships
on to the Web.
36
T. Padamasai (2000) studied that productivity and
profitability of five big banks increased throughout the
post-reforms period in terms of selected ratios of each
parameter, but on account of efficiency, the performance of
the top five banks is very dismissal as inefficiency has
increased during the study period. He suggested that if the
government sells its share in the profit making banks, it
would be able to bail out the weak banks.
Satyamurty, (1994) clarified the concepts of profits,
profitability & productivity applicable to the banking
industry organized by the bank managements that the pressure
on the profitability is more due to the factors beyond their
control.
37

I took this research topic because it will be helpful in
investment decisions in the case of investors and lending
decisions in the case of bankers.
Apart from that it discloses the position of business with
different viewpoint. It discloses the position of business
with liquidity viewpoint, solvency view point, profitability
viewpoint etc. with the help of such a study, we can draw
conclusion regarding the financial health of business
enterprise.
I am also using ratio analysis, comparison of profitability
and financial soundness can be made between one industry and
another. Similarly comparison of current year figures can
also be made with those of previous years with the help of
ratio analysis and if some weak points are located, remedial
measures are taken to correct them.
38
The objective of financial reporting
analysis is to know that the financial policies adopted
by the management are efficient or not.
The purpose of financial analysis is to assess the
financial potential of business.
The purpose of financial reporting analysis is to help
the management to make the comparative study of the
profitability of various firms engaged in similar
business. Such comparison also helps the management to
study the position of their firm in respect of sales
expenses, profitability, return on investment and using
capital etc.
39

Financial analysis helps in ascertaining whether
adequate profits are being earned on the capital
invested in the business or not. It also helps in
knowing the capacity to pay the interest and dividend.
The research methodology adopted for carrying out the study
is:-
THE STUDY:
40
In this project Descriptive research methodologies are
followed.
At the first stage theoretical study is attempted.
At the second stage Historical study is attempted.
At the Third stage Comparative study of RATIO ANALYSIS
of financial report is undertaken.
THE SAMPLE:
To prepare this Project we will take one public sector &one
private sector banks of India. Those two banks are as
follows:
1. STATE BANK OF INDIA (SBI)
2. INDUSTRIAL CREDIT & INVESTMENT CORPORATION OF INDIA
(ICICI)
PERIODS: The time period of the study is 2011-2012.
THE TOOLS:
Tools for data collection:
Secondary data is used which is collected from magazines and
websites.
Tools for data analysis:
41

Ratio analysis
42

BALANCESHEET OF SBI
2011-12
……in Rs. Cr……….
Capital and Liabilities
Total Share Capital 671.04
Equity Share Capital 671.04
Share Application Money 0.00
Preference Share Capital 0.00
Reserves 83,280.16
Revaluation Reserves 0.00
Net Worth 83,951.20
Deposits 1,043,647
.36
Borrowings 127,005.5
7
Total Debt 1,170,652
.93
Other Liabilities & Provisions 80,915.09
Total Liabilities 1,335,519
43

.22
Assets
Cash & Balances with RBI 54,075.94
Balance with Banks, Money at Call 43,087.23
Advances 867,578.8
9
Investments 321,197.6
1
Gross Block 14,792.33
Accumulated Depreciation 9,658.46
Net Block 5,133.87
Capital Work In Progress 332.68
Other Assets 53,113.02
Total Assets 1,335,519
44

.24
Contingent Liabilities 698,064.7
4
Bills for collection 201,500.4
4
Book Value (Rs) 1,251.05
BALANCE SHEET OF
ICICI 2011-12
Capital & Liabilities
………in Rs Cr………..
45

Total Share Capital 1,152.77
Equity Share Capital 1,152.77
Share Application Money 2.39
Preference Share Capital 0.00
Reserves 59,250.09
Revaluation Reserves 0.00
Net Worth 60,405.25
Deposits 255,499.96
Borrowings 140,164.91
Total Debt 395,664.87
Other Liabilities &
Provisions
17,576.98
Total Liabilities 473,647.10
Asset
Cash & Balances with RBI 20,416.29
Balance with Banks, Money
at Call
15,768.02
Advances 253,727.66
Investments 159,560.04
Gross Block 9,424.39
Accumulated Depreciation 4,809.70
46

Net Block 4,614.69
Capital Work In Progress 0.00
Other Assets 19,515.39
Total Assets 473,647.09
Contingent Liabilities 858,566.64
Bills for collection 64,457.72
Book Value (Rs) 524.01
47

PROFITABILITY RATIO
A class of financial metrics that are used to assess a
business's ability to generate earnings as compared to its
expenses and other relevant costs incurred during a specific
period of time. For most of these ratios, having a higher
value relative to a competitor's ratio or the same ratio
from a previous period is indicative that the company is
doing well.
Some examples of profitability ratios are profit margin,
return on assets and return on equity. It is important to
note that a little bit of background knowledge is necessary
in order to make relevant comparisons when analyzing these
ratios. For instances, some industries experience
seasonality in their operations. The retail industry, for
example, typically experiences higher revenues and earnings
for the Christmas season. Therefore, it would not be too
useful to compare a retailer's fourth-quarter profit margin
with its first-quarter profit margin. On the other hand,
comparing a retailer's fourth-quarter profit margin with the48
profit margin from the same period a year before would be
far more informative.
RETURN ON NETWORTH
Return on Net worth (RONW) is used in finance as a measure
of a company’s profitability. It reveals how much profit a
company generates with the money that the equity
shareholders have invested. Therefore, it is also called
„Return on Equity‟ (ROE).
It is expressed as:-
RONW = NET INCOME
X 100
SHA
REHOLDER EQUITY
The numerator is equal to a fiscal year’s net income (after
payment of preference share dividends but before payment of
equity share dividends).The denominator excludes preference
shares and considers only the equity shareholding. So, RONW
measures how much return the company management can generate49

for its equity shareholders. RONW is a measure for judging
the returns that a shareholder gets on his investment as a
shareholder, equity represents your money and so it makes
good sense to know how well management is doing with it.
LIQUIDITY RATIO
A class of financial metrics that is used to determine a
company's ability to pay off its short terms debts
obligations. Generally, the higher the value of the ratio,
the larger the margin of safety that the company possesses
to cover short-term debts. Common liquidity ratios include
the current ratio, the quick ratio and the operating cash
flow ratio. Different analysts consider different assets to
be relevant in calculating liquidity. Some analysts will
calculate only the sum of cash and equivalents divided by
current liabilities because they feel that they are the most
liquid assets, and would be the most likely to be used to
cover short-term debts in an emergency. A company's ability
to turn short-term assets into cash to cover debts is of the
utmost importance when creditors are seeking payment.
Bankruptcy analysts and mortgage originators frequently use
50

the liquidity ratios to determine whether a company will be
able to continue as a going concern.
PAYOUT RATIOS
The amount of earnings paid out in dividends to
shareholders. Investors can use the payout ratio to
determine what companies are doing with their earnings.
Calculated as :
Payout Ratio : Dividend
per share
E
arnings per share
51

For example, a very low payout ratio indicates that a
company is primarily focused on retaining its earnings
rather than paying out dividends. The payout ratio also
indicates how well earnings support the dividend payments:
the lower the ratio, the more secure the dividend because
smaller dividends are easier to pay out than larger
dividends.
NET PROFIT MARGIN
52

For a business to survive in the long term it must generate
profit. Therefore the net profit margin ratio is one of the
key performance indicators for your business.
The net profit margin ratio indicates profit levels of a
business after all costs have been taken into account. It is
worth analyzing the ratio over time. A variation in the
ratio from year to year may be due to abnormal conditions or
expenses. Variations may also indicate cost blowouts which
need to be addressed. A decline in the ratio over time may
indicate a margin squeeze suggesting that productivity
improvements may need to be initiated. In some cases, the
costs of such improvements may lead to a further drop in the
ratio or even losses before increased profitability is
achieved.
The calculation used to obtain the ratio is:
Net Profit margin = Net
Profit X 100
Sales
53

Sr No. Name of Bank Ratio
1 SBI 9.73
2 ICICI 16.14
54

SBI ICICI
024681012141618
COMPARISION OF RATIO
NET PROFIT MARGIN
INTERPRETATION:
This ratio is key performance indicators for business. Key
performance means the profit level of company; from above
graph we can say that performance of ICICI is better than
SBI. So profit level of ICICI is at first rank than come
SBI.
DEBT-EQUITY RATIO:
A measure of a company's financial leverage calculated by
dividing its total liabilities by stockholders equity.
55
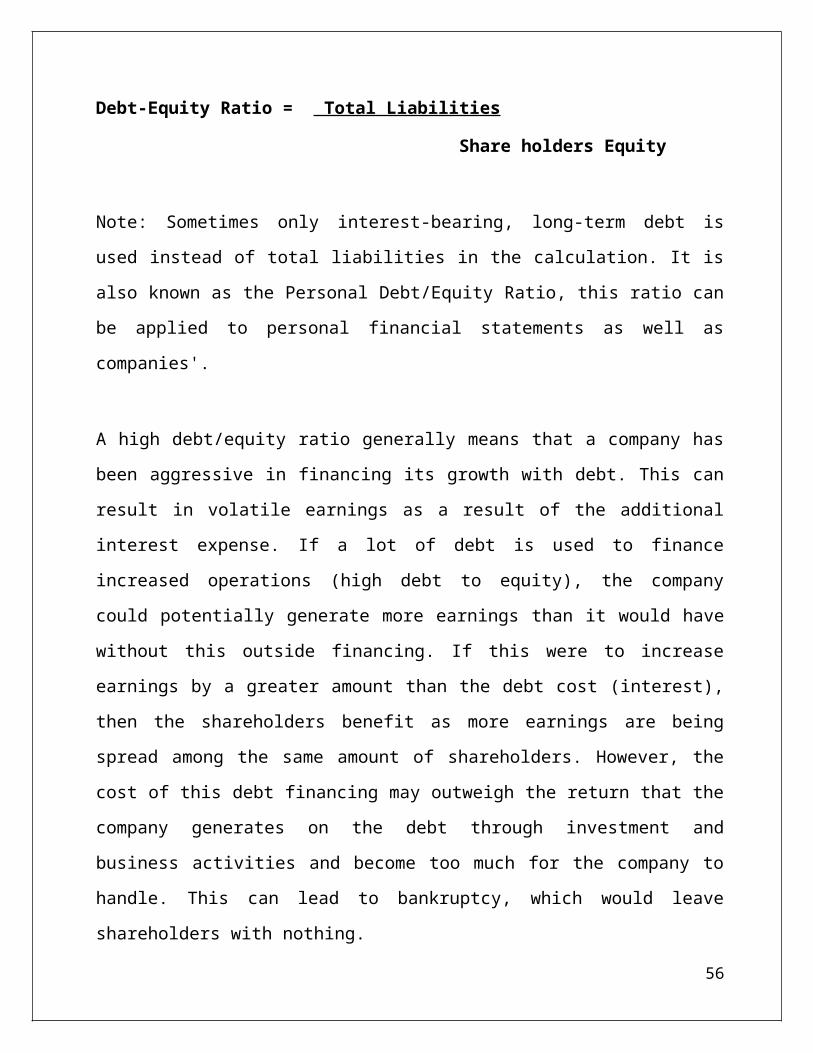
Debt-Equity Ratio = Total Liabilities
Share holders Equity
Note: Sometimes only interest-bearing, long-term debt is
used instead of total liabilities in the calculation. It is
also known as the Personal Debt/Equity Ratio, this ratio can
be applied to personal financial statements as well as
companies'.
A high debt/equity ratio generally means that a company has
been aggressive in financing its growth with debt. This can
result in volatile earnings as a result of the additional
interest expense. If a lot of debt is used to finance
increased operations (high debt to equity), the company
could potentially generate more earnings than it would have
without this outside financing. If this were to increase
earnings by a greater amount than the debt cost (interest),
then the shareholders benefit as more earnings are being
spread among the same amount of shareholders. However, the
cost of this debt financing may outweigh the return that the
company generates on the debt through investment and
business activities and become too much for the company to
handle. This can lead to bankruptcy, which would leave
shareholders with nothing.
56

The debt/equity ratio also depends on the industry in which
the company operates. For
example, capital-intensive industries such as auto
manufacturing tend to have a debt/equity ratio above 2,
while personal computer companies have a debt/equity of
under 0.5.
Sr No. Name of Bank Ratio
1 SBI 12.43
2 ICICI 4.23
57

SBI ICICI0
2
4
6
8
10
12
14
DEBT-EQUITY RATIO
DEBT-EQUITY RATIO
INTERPRETATION
This ratio indicates what proportion of equity and debt the
company is using to finance its assets. From above diagram
we can say that SBI has a high debt-equity ratio means it is
aggressive in financing its growth with debt. Than after
ICICI has a low debt-equity ratio as comparison with SBI.
ASSET TURNOVER RATIO:
Measure of the productivity of a firm, it indicates the
amount of sales generated by each dollar spent on fixed
assets, and the amount of fixed assets required to generate
a specific level of revenue. Changes in the ratio over time
58
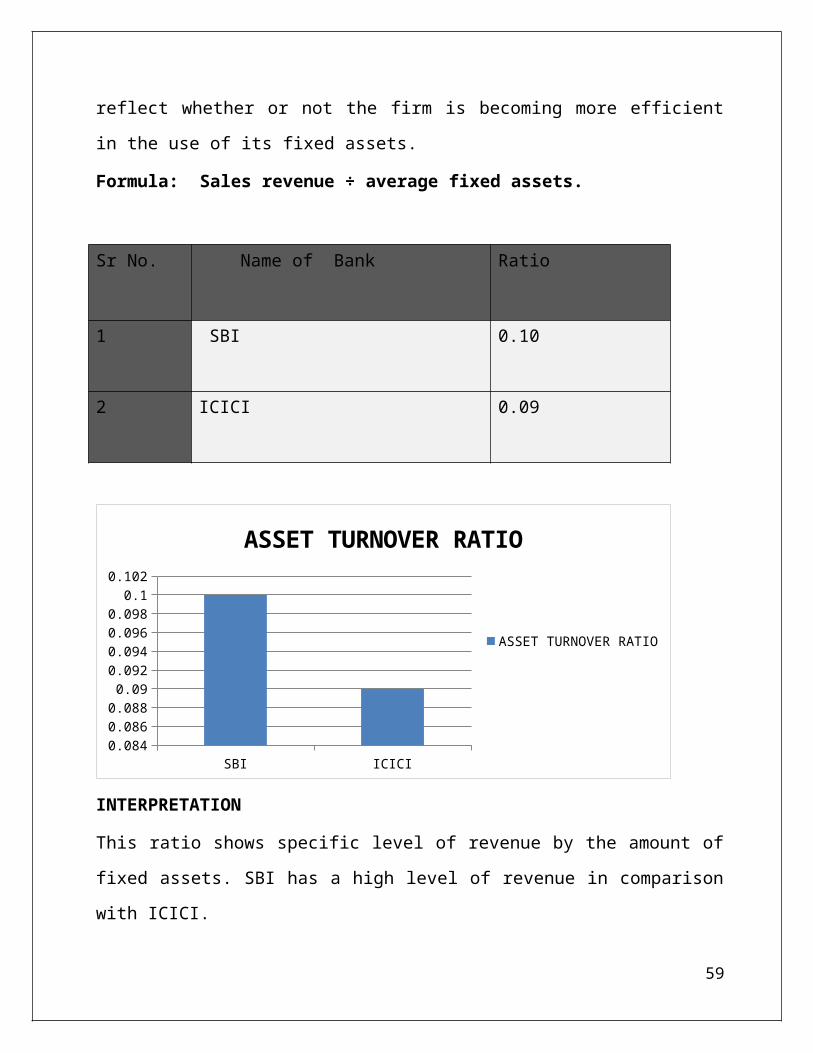
reflect whether or not the firm is becoming more efficient
in the use of its fixed assets.
Formula: Sales revenue ÷ average fixed assets.
Sr No. Name of Bank Ratio
1 SBI 0.10
2 ICICI 0.09
SBI ICICI0.0840.0860.0880.090.0920.0940.0960.0980.1
0.102
ASSET TURNOVER RATIO
ASSET TURNOVER RATIO
INTERPRETATION
This ratio shows specific level of revenue by the amount of
fixed assets. SBI has a high level of revenue in comparison
with ICICI.
59

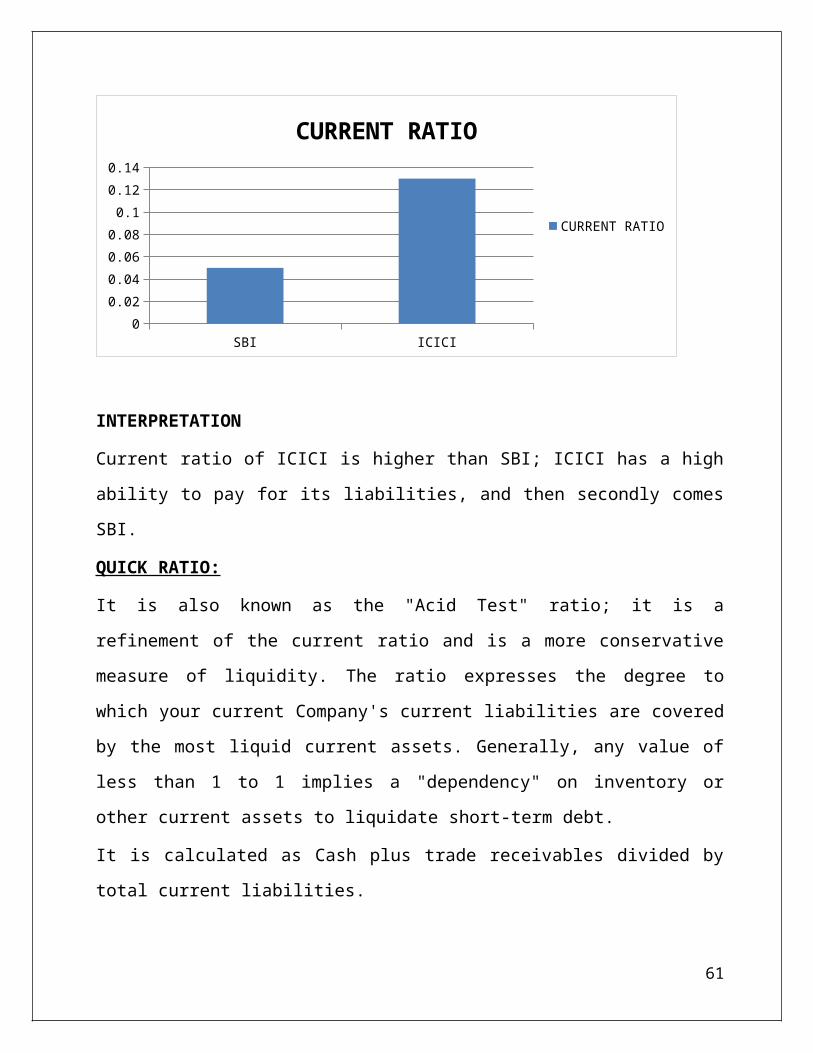
CURRENT RATIO:
This ratio is a rough indication of a firm's ability to
service its current obligations.
Generally, the higher the current ratio, the greater the
"cushion" between current obligations and your Company's
ability to pay them. The composition and quality of current
assets is a critical factor in the analysis of your
Company's liquidity. It is calculated as Total current
assets divided by total current liabilities.
Sr No. Name of Bank Ratio
1 SBI 0.05
2 ICICI 0.13
60
SBI ICICI0
0.020.040.060.080.10.120.14
CURRENT RATIO
CURRENT RATIO
INTERPRETATION
Current ratio of ICICI is higher than SBI; ICICI has a high
ability to pay for its liabilities, and then secondly comes
SBI.
QUICK RATIO:
It is also known as the "Acid Test" ratio; it is a
refinement of the current ratio and is a more conservative
measure of liquidity. The ratio expresses the degree to
which your current Company's current liabilities are covered
by the most liquid current assets. Generally, any value of
less than 1 to 1 implies a "dependency" on inventory or
other current assets to liquidate short-term debt.
It is calculated as Cash plus trade receivables divided by
total current liabilities.
61

Sr No. Name of Bank Ratio
1 SBI 12.05
2 ICICI 16.71
SBI ICICI024681012141618
QUICK RATIO
QUICK RATIO
INTERPRETATION:
ICICI has a high quick ratio means it has enough current
assets to cover its current liabilities, while SBI has a low
quick ratio.
EARNING RETANTION RATIO:
The percent of earnings credited to retained earnings. In
other words, the proportion of net income that is not paid
out as dividends.
62

Calculated as= Net income-Dividends
Net income
It can also be calculated as one minus the dividend payout
ratio.
Sr No. Name of Bank Ratio
1 SBI 77.45
2 ICICI 67.19
SBI ICICI60
65
70
75
80
EARNING RETANTION RATIO
EARNING RETANTION RATIO
INTERPRETATION:
Earning retention ratio is the opposite of the dividend
payout ratio. SBI has a high earning retention ratio, so the
Investors who are seeking high current income and limited
capital growth should be invest in SBI. ICICI has a low
63

earning retention ratio, so the investors who are seeking
capital growth should be invest in ICICI BANK.
CAPITAL ADEQUECY RATIO:
This ratio is used to protect depositors and promote the
stability and efficiency of financial system around the
world. Two types of capital are measured: tier one capital,
which can absorb losses without a bank being required to
cease trading, and tier two capital, which can absorb losses
in the event of a winding-up and so provides a lesser degree
of protection to depositors.
It is calculated as:
Sr No. Name of Bank Ratio
1 SBI 13.86
2 ICICI 18.52
64

SBI ICICI0
5
10
15
20
CAPITAL ADEQUECY RATIO
CAPITAL ADEQUECY RATIO
INTERPRETATION:
ICICI has high Capital Adequacy Ratio than SBI. It means
stability and efficiency of financial system of ICICI is
better than SBI.
65

DIVIDEND PAYOUT RATIO:
Dividend payout ratio is the fraction of net income a firm
pays to its stockholders in dividends:
Dividend Payout Ratio= Dividend
Net income for the
same period
The part of the earnings not paid to investors is left for
investment to provide for future
earnings growth. Investors seeking high current income and
limited capital growth prefer
companies with high Dividend payout ratio. However investors
seeking capital growth may prefer lower payout ratio because
capital gains are taxed at a lower rate. High growth firms
in early life generally have low or zero payout ratios. As
they mature, they tend to return more of the earnings back
to investors. Note that dividend payout ratio is a
reciprocate ratio to dividend cover,
66
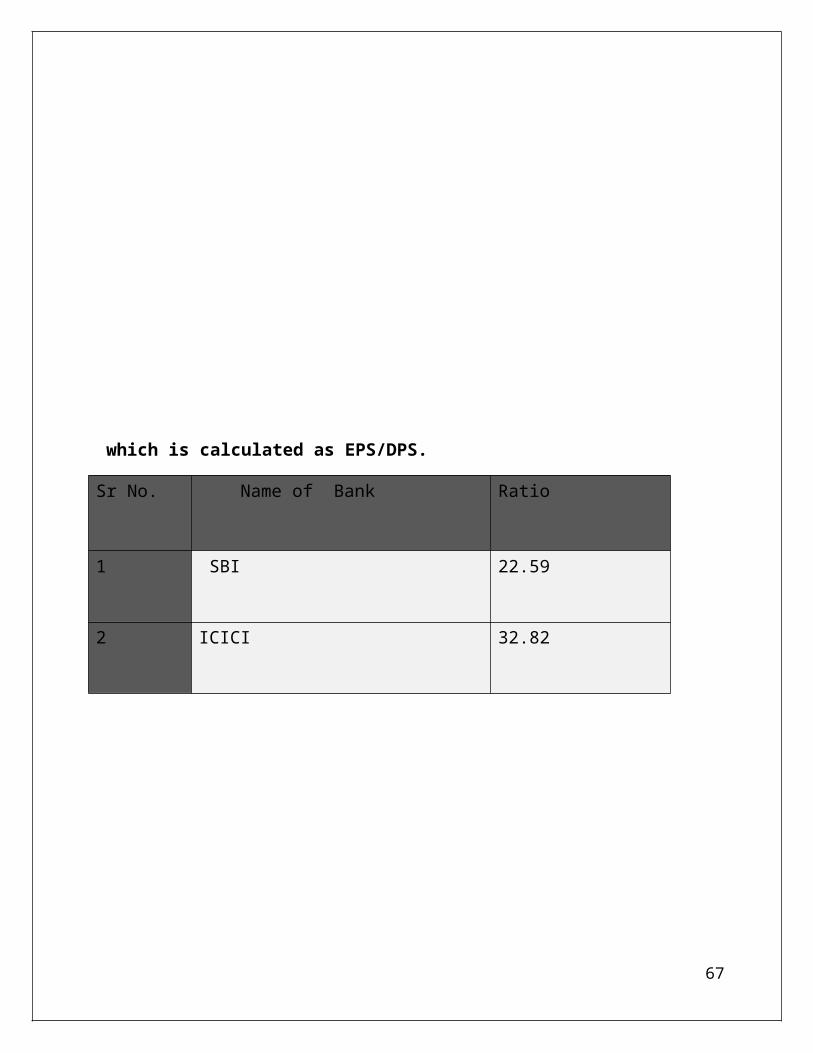
which is calculated as EPS/DPS.
Sr No. Name of Bank Ratio
1 SBI 22.59
2 ICICI 32.82
67

SBI ICICI0
5
10
15
20
25
30
35
DIVIDEND PAYOUT RATIO
DIVIDEND PAYOUT RATIO
INTERPRETATION:
ICICI has a high dividend payout ratio, so the Investors who
are seeking high current income and limited capital growth
should be invest in ICICI bank.SBI has a low dividend payout
ratio, so investors who are seeking capital growth should be
invest in SBI because capital gains are taxed at a lower
rate.
DIVIDEND PER SHARE:
The sum of declared dividends for every ordinary share
issued. Dividend per share (DPS) is the total dividends paid
out over an entire year (including interim dividends but not
68

including special dividends) divided by the number of
outstanding ordinary shares issued
D – Sum of dividends over a period
SD- Special onetime dividends
S- Share outstanding for the period
Sr No. Name of Bank Ratio
1 SBI 35
2 ICICI 16.50
SBI ICICI010203040
DIVIDEND PER SHARE
DIVIDEND PER SHARE
INTERPRETATION:
SBI has a Dividend per share and the company which has high
dividend per share is better. so SBI is better than ICICI.
69

OPERATING PROFIT PER SHARE:
It is calculated as : operating Profit/ Total no. of
shares
Sr No. Name of Bank Ratio
1 SBI 289.44
2 ICICI 76.15
SBI ICICI0
50
100
150
200
250
300
350
OPERATING PROFIT PER SHARE
OPERATING PROFIT PER SHARE
INTERPRETATION:70

SBI has high operating profit per share in comparison of
ICICI.
71
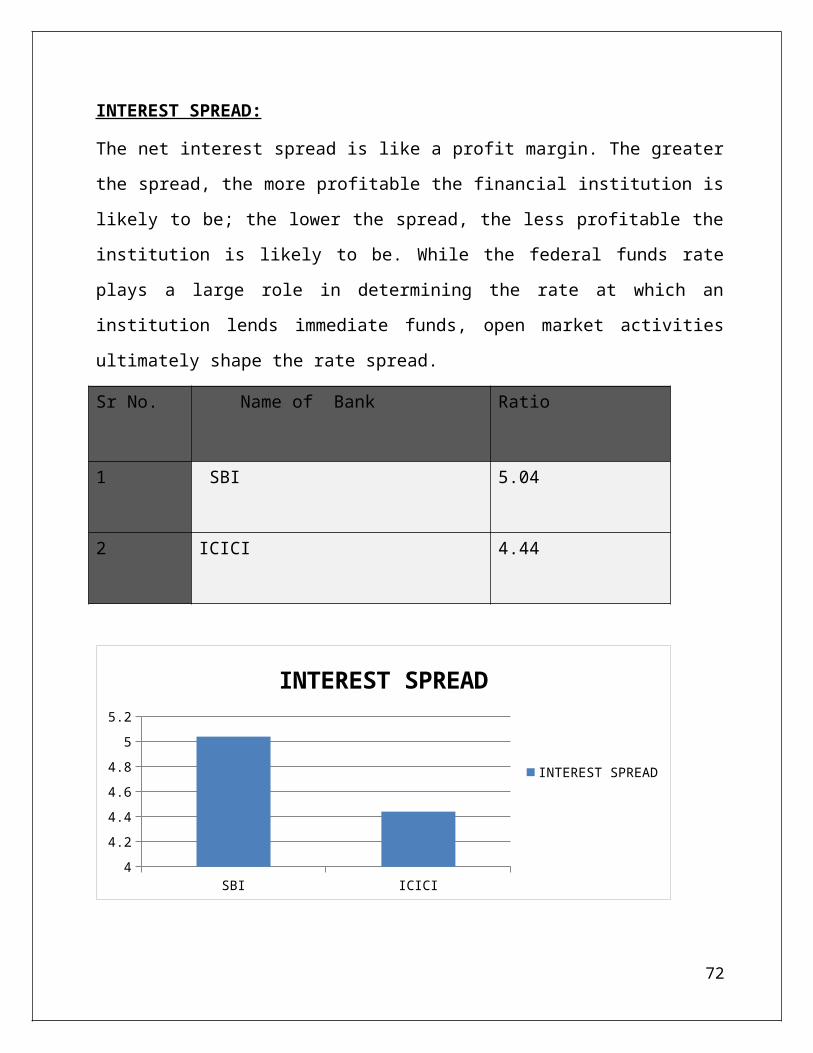
INTEREST SPREAD:
The net interest spread is like a profit margin. The greater
the spread, the more profitable the financial institution is
likely to be; the lower the spread, the less profitable the
institution is likely to be. While the federal funds rate
plays a large role in determining the rate at which an
institution lends immediate funds, open market activities
ultimately shape the rate spread.
Sr No. Name of Bank Ratio
1 SBI 5.04
2 ICICI 4.44
SBI ICICI4
4.24.44.64.85
5.2
INTEREST SPREAD
INTEREST SPREAD
72
INTERPRETATION:
The net interest spread is like a profit margin. The greater
the spread, the more profitable the financial institution so
in the above graph ICICI has high Interest Spread than SBI.
It means ICICI is more profitable than SBI.
Ratio analysis is an important and age-old technique of
financial analysis. The following are some of the advantages
of ratio analysis:
Simplifies financial statements: It simplifies the
comprehension of financial statements. Ratios tell the
whole story of changes in the financial condition of
the business.
Facilitates inter-firm comparison: It provides data for
inter-firm comparison. Ratios highlight the factors
associated with successful and unsuccessful firm. They
also reveal Strong firms and weak firms overvalued and
undervalued firms.
Helps in planning: It helps in planning and
forecasting. Ratios can assist management, in its basic
functions of forecasting. Planning, co-ordination,
control and communications
Makes inter-firm comparison possible: Ratios analysis
also makes possible comparison of the performance of73

different divisions of the firm. The ratios are helpful
in deciding about their efficiency or otherwise in the
past and likely performance in the future.
Help in investment decisions: It helps in investment
decisions in the case of investors and lending decisions in
the case of bankers etc
The ratios analysis is one of the most powerful tools of
financial management. Though ratios are simple to calculate
and easy to understand, they suffer from serious
limitations.
Limitations of financial statements: Ratios are
based only on the information which has been
74

recorded in the financial statements. Financial
statements themselves are subject to several
limitations. Thus ratios derived, there from, are
also subject to those limitations.
For example, non-financial changes though important
for the business are not relevant by the
financial statements. Financial statements are
affected to a very great extent by accounting
conventions and concepts. Personal judgment plays a
great part in determining the figures for financial
statements.
Comparative study required: Ratios are useful in
judging the efficiency of the business only when
they are compared with past results of the
business. However, such a comparison only provide
glimpse of the past performance and forecasts for
future may not prove correct since several other
factors like market conditions, management
policies, etc. may affect the future operations.
Problems of price level changes: A change in price
level can affect the validity of ratios calculated
for different time periods. In such a case the
75

ratio analysis may not clearly indicate the trend
in solvency and profitability of the company. The
financial statements, therefore, be adjusted
keeping in view the price level changes if a
meaningful comparison is to be made through
accounting ratios.
Lack of adequate standard: No fixed standard can be
laid down for ideal ratios. There are no well
accepted standards or rule of thumb for all ratios
which can be accepted as norm. It renders
interpretation of the ratios difficult.
5. Limited use of single ratios: A single ratio,
usually, does not convey much of a sense. To make a
better interpretation, a number of ratios have to
be calculated which is likely to confuse the
analyst than help him in making any good decision.
6. Personal bias: Ratios are only means of
financial analysis and not an end in itself. Ratios
have to interpret and different people may
interpret the same ratio in different way.
76

Ratio analysis is an important technique of financial
analysis. It is a means for judging the financial health of
a business enterprise. It determines and interprets the
liquidity, solvency, profitability, etc. of a business
enterprise.
It becomes simple to understand various figures in the
financial statements through the use of different
ratios. Financial ratios simplify, sumarise, and
77

systemise the accounting figures presented in financial
statements.
With the help of raito analysis, comparision of
profitability and financial soundness can be made
between one industry and another. Similarly comparision
of current year figures can also be made with those of
previous years with the help of ratio analysis and if
some weak points are located, remidial masures are
taken to correct them.
If accounting ratios are calculated for a number of
years, they will reveal the trend of costs, sales,
profits and other important facts. Such trends are
useful for planning.
Financial ratios, based on a desired level of
activities, can be set as standards for judging actual
performance of a business. For example, if owners of a
business aim at earning profit @ 25% on the capital
which is the prevailing rate of return in the industry
then this rate of 25% becomes the standard. The rate of
profit of each year is compared with this standard and
the actual performance of the business can be judged
easily.
Ratio analysis discloses the position of business with
different viewpoint. It discloses the position of
78

business with liquidity viewpoint, solvency view point,
profitability viewpoint, etc. with the help of such a
study, we can draw conclusion regardings the financial
health of business enterprise.
Ratios make the related information comparable. A
single figure by itself has no meaning, but when
expressed in terms of a related figure, it yields
significant interferences. Thus, ratios are relative
figures reflecting the relationship between related
variables. Their use as tools of financial analysis
involves their comparison as single ratios, like
absolute figures, are not of much use.
Ratio analysis has a major significance in analyzing
the financial performance of a company over a period of
time. Decisions affecting product prices, per unit
costs, volume or efficiency have an impact on the
profit margin or turnover ratios of a company.
Financial ratios are essentially concerned with the
identification of significant accounting data
relationships, which give the decision-maker insights
into the financial performance of a company.
79

The analysis of financial statements is a process of
evaluating the relationship between component parts of
financial statements to obtain a better understanding
of the firm’s position and performance.
The first task of financial analyst is to select the
information relevant to the decision under
consideration from the total information contained in
the financial statements. The second step is to arrange
the information in a way to highlight significant
relationships. The final step is interpretation and
drawing of inferences and conclusions. In brief,
financial analysis is the process of selection,
relation and evaluation.
Ratio analysis in view of its several limitations
should be considered only as a tool for analysis rather
than as an end in itself. The reliability and
significance attached to ratios will largely hinge upon
the quality of data on which they are based. They are
as good or as bad as the data itself. Nevertheless,
they are an important tool of financial analysis.
Books:
80
“Basic Financial Management”- M Y Khan P K Jain
“Financial Management”- Prasanna Chandra
Ross Peter S., Commercial Bank Management, Irwin
McGraw-Hill, Boston, International Edition, 1999.
JOURNALS:-
Indian Journal of finance, January,2012
Journal of finance and accountancy, Volume 6.
Journal of accountancy, March, 2012.
Website/URL:- Web sites/ URL
www.statebankofindia.com
www.icicibank.com
www.rbi.org.in
www.moneycontrol.com
81