
Modeling and simulation of the fixed-speed WECS (wind energy conversion system): Application to the...
10
Modeling and simulation of the fixed-speed WECS (wind energy conversion system): Application to the Algerian Sahara area Djohra Saheb-Koussa a, * , Mourad Haddadi b , Maiouf Belhamel a , Seddik Hadji c , Said Nouredine a a Centre de Développement des Energies Renouvelables, Route de l’observatoire, BP.62, Bouzareah, Alger 16340, Algeria b Laboratoire de Dispositif de Communication et de Conversion Photovoltaïque E. N. P,10 Avenue Hassen Badi, El Harrach, Alger, Algeria c Laboratoire des Technologies Industrielle et de l’information, Université A. Mira de Bejaia, Targa Ouzemour, Bejaia 06000, Algeria article info Article history: Received 25 October 2009 Received in revised form 22 June 2010 Accepted 24 June 2010 Available online 3 August 2010 Keywords: Modeling Simulation Fixed-speed wind generator MATLAB-SIMULINK HOMER Isolated site abstarct The present paper aims at modeling and simulating a WTIG (wind turbine and an induction generator) system as an electricity source in the southern parts of Algeria. System simulation has been done using a program developed employing the MATLAB-SIMULINK software package. The power delivered by the WTIG system and the related C p quality have been sampled at 1 h time intervals and then statistically compared with those given by the manufacturer. The obtained results have then been validated by the HOMER software confirming the effectiveness of the developed program while deriving a slightly lower estimation of per kWh energy cost than the rate applied by the local Electricity Board which shows evidence of the incentives to investing in this sector as an alternative to the domestically available natural gas (whose prices are subsidized). A significant decrease in the pollutant emissions is also pre- dicted as a consequence of the wind energy electrical power injection into grid. Ó 2010 Elsevier Ltd. All rights reserved. 1. Introduction WECS (Wind energy conversion system) is rapidly becoming a mature industry as performance of related systems WECS are greatly improved along with the steadily decreasing costs of large- scale industrial production. Such systems include a WTIG (wind turbine and an induction generator). Measures taken by govern- ments and other agencies to subsidize the costs of electricity generation installations and regulations in several countries [1] concerning the purchase of electricity produced by grid-con- nected systems are promoting public awareness and widespread use of environment friendly wind electricity. According to the WWEA (World Wind Energy Association), 19,696 GW of wind power capacity were added in 2007. By the end of December 2007, the global installed capacity reached 93,849 GW [2]. West Denmark, the North of Germany, and Galicia in Spain are examples of areas that have relatively high wind penetration levels. In Denmark, more than 20% of the electricity supply is coming from wind power [3]. Lund and Matheisen [4] demonstrated that a “100% renewable energy supply based on domestic resources is physically possible” in the case of Denmark. As identified in Ref. [5], to implement a sustainable energy development strategy, three major technological changes are required. These are the demand-side management, generation-side efficiency improvements and the utilization of renewable energy sources. Unlike fossil fuels, renewable resources in general and wind in particular are sustainable local sources of energy. Har- vesting wind power is, in fact, in line with a long-term develop- ment strategy, the Algerian future vision aiming at sustainable development of this technology [6]. Yet, there are no utility-scale WT (wind turbines) connected to the grid in spite of existing publications suggesting a strong potential for wind power gener- ation in Algeria [7,8]. To convert wind power into electricity, many types of generator concepts have been used and proposed [9,10]. The main wind turbine generators can be grouped into two classes: variable and fixedspeed [11e 17]. The main difference resides in the electrical system complexity which is higher in the case of variable-speed WT than in that of fixed-speed WT. The fixed-speed WT has the advantage of being simple, robust and reliable, well-proven and the costs of its electrical parts are low [18]. Today, the V47-660 kW (fixed-speed WT) model is still a popular turbine that exploits reliably and efficiently the wind power, wherever it is erected. A turbine of this type operates currently in many different locations such as New Zealand, * Corresponding author. Tel.: þ213 (21) 90 15 03; fax: þ213 (21) 90 16 54. E-mail address: [email protected] (D. Saheb-Koussa). Contents lists available at ScienceDirect Energy journal homepage: www.elsevier.com/locate/energy 0360-5442/$ e see front matter Ó 2010 Elsevier Ltd. All rights reserved. doi:10.1016/j.energy.2010.06.032 Energy 35 (2010) 4116e4125
-
Upload
independent -
Category
Documents
-
view
5 -
download
0
Transcript of Modeling and simulation of the fixed-speed WECS (wind energy conversion system): Application to the...
lable at ScienceDirect
Energy 35 (2010) 4116e4125
Contents lists avai
Energy
journal homepage: www.elsevier .com/locate/energy
Modeling and simulation of the fixed-speed WECS (wind energyconversion system): Application to the Algerian Sahara area
Djohra Saheb-Koussa a,*, Mourad Haddadi b, Maiouf Belhamel a, Seddik Hadji c, Said Nouredine a
aCentre de Développement des Energies Renouvelables, Route de l’observatoire, BP.62, Bouzareah, Alger 16340, Algeriab Laboratoire de Dispositif de Communication et de Conversion Photovoltaïque E. N. P, 10 Avenue Hassen Badi, El Harrach, Alger, Algeriac Laboratoire des Technologies Industrielle et de l’information, Université A. Mira de Bejaia, Targa Ouzemour, Bejaia 06000, Algeria
a r t i c l e i n f o
Article history:Received 25 October 2009Received in revised form22 June 2010Accepted 24 June 2010Available online 3 August 2010
Keywords:ModelingSimulationFixed-speed wind generatorMATLAB-SIMULINKHOMERIsolated site
* Corresponding author. Tel.: þ213 (21) 90 15 03; fE-mail address: [email protected] (D. Saheb-Kouss
0360-5442/$ e see front matter � 2010 Elsevier Ltd.doi:10.1016/j.energy.2010.06.032
a b s t a r c t
The present paper aims at modeling and simulating a WTIG (wind turbine and an induction generator)system as an electricity source in the southern parts of Algeria. System simulation has been done usinga program developed employing the MATLAB-SIMULINK software package. The power delivered by theWTIG system and the related Cp quality have been sampled at 1 h time intervals and then statisticallycompared with those given by the manufacturer. The obtained results have then been validated by theHOMER software confirming the effectiveness of the developed program while deriving a slightly lowerestimation of per kWh energy cost than the rate applied by the local Electricity Board which showsevidence of the incentives to investing in this sector as an alternative to the domestically availablenatural gas (whose prices are subsidized). A significant decrease in the pollutant emissions is also pre-dicted as a consequence of the wind energy electrical power injection into grid.
� 2010 Elsevier Ltd. All rights reserved.
1. Introduction
WECS (Wind energy conversion system) is rapidly becominga mature industry as performance of related systems WECS aregreatly improved along with the steadily decreasing costs of large-scale industrial production. Such systems include a WTIG (windturbine and an induction generator). Measures taken by govern-ments and other agencies to subsidize the costs of electricitygeneration installations and regulations in several countries [1]concerning the purchase of electricity produced by grid-con-nected systems are promoting public awareness and widespreaduse of environment friendly wind electricity.
According to the WWEA (World Wind Energy Association),19,696 GWof wind power capacity were added in 2007. By the endof December 2007, the global installed capacity reached 93,849 GW[2]. West Denmark, the North of Germany, and Galicia in Spain areexamples of areas that have relatively high wind penetration levels.In Denmark, more than 20% of the electricity supply is coming fromwind power [3]. Lund andMatheisen [4] demonstrated that a “100%renewable energy supply based on domestic resources is physicallypossible” in the case of Denmark.
ax: þ213 (21) 90 16 54.a).
All rights reserved.
As identified in Ref. [5], to implement a sustainable energydevelopment strategy, three major technological changes arerequired. These are the demand-side management, generation-sideefficiency improvements and the utilization of renewable energysources. Unlike fossil fuels, renewable resources in general andwind in particular are sustainable local sources of energy. Har-vesting wind power is, in fact, in line with a long-term develop-ment strategy, the Algerian future vision aiming at sustainabledevelopment of this technology [6]. Yet, there are no utility-scaleWT (wind turbines) connected to the grid in spite of existingpublications suggesting a strong potential for wind power gener-ation in Algeria [7,8].
To convert wind power into electricity, many types of generatorconcepts have been used and proposed [9,10]. The main windturbine generators can be grouped into two classes: variable andfixedspeed [11e17]. The main difference resides in the electricalsystem complexity which is higher in the case of variable-speedWT than in that of fixed-speed WT. The fixed-speed WT has theadvantage of being simple, robust and reliable, well-proven and thecosts of its electrical parts are low [18].
Today, the V47-660 kW (fixed-speed WT) model is stilla popular turbine that exploits reliably and efficiently the windpower, wherever it is erected. A turbine of this type operatescurrently in many different locations such as New Zealand,

Nomenclature
A voltage amplitude (V)Ap active power (kW)Cp power coefficient which represents the rotor efficiency
of the turbine (captured power/wind power)f frequency (Hz)fv viscous friction coefficient (N m s)Ird, Irq rotorecurrent components along the deq axes (A)Isd, Isq statorecurrent components along the deq axes (A)J moment of inertia (kg m2)Lr rotor inductance (H)Ls stator inductance (H)Lsr mutual inductance (H)P pole-pairs numberRr rotor resistance (U)Rs stator resistance (U)Rt wind turbine rotor radius (m)Rp reactive power (kVA)S sweep area of the blades (m2)t time (s)Tam generator torque (Nm)Tt mechanical torque (Nm)T’t torque developed by the wind turbinev wind speed (m/s)Va,b,c three-phase voltage (V)Vrd, Vrq rotor voltage components along the deq axes (V)Vsd, Vsq stator voltage components along the deq axes (V)
Greek symbolsb blade angle (�)4r (deq) rotor fluxes along the deq axes (Wb);
4s (d-q) stator fluxes along the deq axes (Wb)l tip speed ratioUas generator speed (rad/s)Ut turbine angular speed (rad/s)ur rotor angular speed (rad/s)us angular frequency (rad/s)r air density (kg/m3)
abbreviationsAC alternating currentAM asynchronous machineCOE cost of energy ($/kWh)DT drive TrainEIA energy information administrationFIT feed-in tariffLNG liquefied natural gasMAE mean absolute errorMBE mean bias errorIPT inverse Park transformsNPC net present cost ($)OGJ oil and gas journalPT park transformRB related blockRMSE root mean square errorTCF trillion cubic feetTPG three-phase grid blockWECS wind energy conversion systemWT wind turbine under the action of the wind, back on the
shaft of the asynchronous machine (Nm)WWEA World Wind Energy AssociationWTIG wind turbine and the induction generator
D. Saheb-Koussa et al. / Energy 35 (2010) 4116e4125 4117
California, Spain, Germany and South Korea e and in many otherplaces where a demand for profitable wind power [19] exists.
This work focuses on fixed-speed wind generator modelingincluding their dynamic behavior when connected to powersystems (see Fig. 1). This paper presents an equivalent model ofeach of the different parts constituting the grid-connected WTIG.The wind generator modeled and simulated are the V47-660 kWmodel described below. The MATLAB-SIMULINK environment formodel development main feature is its high flexibility [20e25].The developed sub models have been used for the whole systemsimulation and the derived responses compared with thoseexperimental found in Ref. [19]. After that, system behavior hasbeen analyzed using hourly wind speed recorded data on anisolated site in Adrar in the south of Algeria (Latitude 27�82N,longitude 0�18W and altitude 263.3 m). The obtained MATLAB-SIMULINK results have, at a second stage, been validated usingHOMER software and a statistical analysis performed on the
Fig. 1. System blo
results. HOMER software which allows analysis and model opti-mization has been used to size such a system in the case of theAdrar site.
2. Dynamic model
A complete model representing the WTIG has been establishedfor simulation on MATLAB-SIMULINK. This is composed of (seeFig. 2) the WT (wind turbine), the RB (related block), the DT (drivetrain) system, the AM (asynchronous machine), the TPG (three-phase grid) model, the PT (Park transform), and the IPT (inversePark transform) modules. These subsystems are described in thissection. The related schematic diagram may vary from one windgenerator to another due to different generator types (asynchro-nous, synchronous) especially the circuitry connecting the windgenerator to the TPG which can have two different forms (direct orindirect grid connection).
ck diagram.

Fig. 2. Model of the WTIG system.
D. Saheb-Koussa et al. / Energy 35 (2010) 4116e41254118
In the studied case, the generator has been connected directly tothe three-phase AC (alternating current) grid. The resultingconfiguration is simple and, according to the literature [1,9], iswidely used in practice.
2.1. WT dynamics model
The mechanical power extracted from the wind is given by thefollowing relation [26,27]:
Pt ¼ 12r:Cpðl;bÞ:S:v3; S ¼ p:R2t (1)
The power coefficient depends on the tip speed ratio (l), and theblade angle (b). In the case of turbines without pitch control, theblade angle is constant, and Cp values depend only on those of l, thetip speed ratio being expressed as follows:
l ¼ UtRtv
(2)
Also, the mechanical torque produced by the wind is expressedby relation (3):
Tt ¼ PtUt
(3)
Table 1RMSE, MBE and MAE comparison between simulated and experimental P(v) andCp(v).
Parameters P(v) Cp (v)
RMSE (%) 0.2133 0.2215MBE (%) 0.0577 0.0012MAE (%) 0.0289 0.0432
The VESTAS 47-660 wind generator experimental power outputdata given by the manufacturer (see Table 1) as well as the Cp curve[19], have been approximated by using a simple polynomial inter-polation and the obtained correlations are expressed as follows:
PðvÞ ¼4240� 4727v� 2194v2 � 562v3 þ 88:5v4 � 8:91v5
þ 0:585v6 � 0:0249v7 þ 6:64:10�4v8 ð4Þ
CPðvÞ ¼1:1072� 1:2698v� 0:4931v2 � 0:00084v3 þ 0:0781v4
� 4:27:10�4v5 þ 1:37:10�5v6 � 2:44:10�7v7
þ 1:83:10�9v8 ð5Þ
Therefore, the operation of the wind turbine system (see Fig. 2) issimulated using the WT block which evaluates the mechanicaltorque (Tt) that requires the turbine angular speed Ut and the windspeed (v) as inputs.
2.2. DT dynamics model
The DT block allows the simulation of the DTcomponent [25,28](see Fig. 2) which is used to evaluate the generator speed (Uam), andrequires as inputs in the generator torque (Tam) and the torquedeveloped by the WT, under the action of the wind, back on theshaft of the AM (T’t).
The dynamic behavior of the mechanical system is determinedby using the classical rotational dynamics equations. The inertia isconsidered as concentrated in one lumped mass including thecontribution of blades, generator shafts and gear box. The dynamicmotion equation of the mechanical system has the followingexpression:

D. Saheb-Koussa et al. / Energy 35 (2010) 4116e4125 4119
JdUam þ fvUam ¼ T 0t � Tam (6)
dtThe torque developed by theWT, under the action of thewind, backon the shaft of the AM and generator speed (T’t and Uam) and themechanical torque and turbine speed (Tt andUt) supplied to theWTblock simulation, have been linked by means of the gear box whoseratio is k (k ¼ 50.5) for the Vestas 660-47 wind generator. Thisarrangement has been accomplished within the RB SIMULINKsimulation block shown in Fig. 2.
2.3. AM dynamics model
The AM block simulates the electrical power generation of thesystem and returns the generator torque Tam, the active and reactivepower of the generator. The generator speedUas and voltage Vd,q arethe required input parameters, obtained by using the Park transformblock PT (see Fig. 2) of the three-phase system into the two-phasesystem [14].
2.3.1. Electric and magnetic equationsThe voltage equations representing an induction machine
[25,29] in an arbitrary reference frame can be written, in terms ofthe phase currents [29].
In the presented model, the stator and rotor voltages along thed and q axes are given by Ref. [29].
Using these equations, a model for wound rotor generators isdeveloped. This latter has short circuited windings and, asa consequence, rotor voltages equal to zero (Vdr ¼ 0 and Vqr ¼ 0) inthis case. Furthermore, the representative wound rotor generatorequations are:8>><>>:
s4ds ¼ Vds � RsIds þ us$4qss4qs ¼ Vqs � Rs$Iqs � us$4dss4dr ¼ �Rr$Idr þ ðus � urÞ$4qrs4qr ¼ �Rr$Iqr � ðus � urÞsr$4dr
(7)
where8>><>>:
4ds ¼ Ls$Ids þ Lsr$Idr4qs ¼ Ls$Iqs þ LsrIqr4dr ¼ Lr$Idr þ Lsr$Ids4qr ¼ Lr$Iqr þ Lsr$Iqs
(8)
2.3.2. Evaluation of the electromagnetic torqueThe electromagnetic torque has been calculated by using Eq.
(19), proposed by Refs. [25,29].
Tam ¼�32
�P$Lsr
�Isq$Irq � Isd$Irq
�(9)
2.4. Evaluation of real and reactive power
The active (P) and reactive (Q) power have been calculated bya subsystem within the AM SIMULINK block (see Fig. 2) whichrequires the voltages Vd,q as inputs. The related equations in thisblock are represented by the sets of Eqs. (10) and (11).
�P ¼ VdsIds þ VqsIqsQ ¼ VqsIds � VdsIqs
�(10)
�Pr ¼ ��
VdrIdr þ VqrIqr�
Qr ¼ ��VqrIdr þ VdrIqr
�� (11)
Using these equations, a model for wound rotor generators can bedeveloped. This type of generator has short circuitedwindings, thus
the corresponding rotor voltages are equal to zero (Vdr ¼ 0, Vqr ¼ 0).Taking into account these conditions, Eq. (11) give Pr¼ 0 and Qr¼ 0.
2.5. Three-phase power network model
In this study, the three-phase power network (block TPG inFig. 2) has been assumed as impedance free and is represented bythe voltage Eq. (12),
Va ¼ A sinð2$p$f $tÞVb ¼ A sin
�2$p$f $t � 2
3p�
Vc ¼ A sin�2$p$f $t � 4
3p� (12)
whereA and f are respectively the voltage amplitude and the frequency
(f ¼ 50 Hz in most parts of the world, 60 Hz in America).
3. Results and discussion
3.1. Potential wind energy resources of Adrar
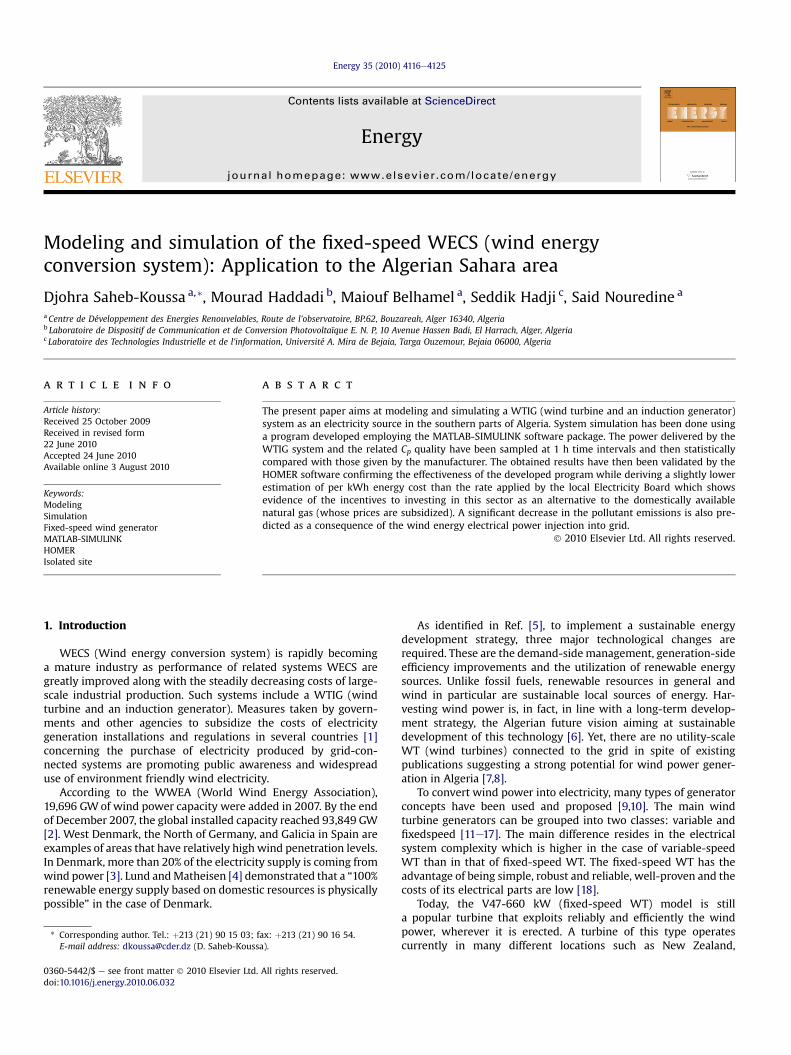
In this study, in order to determine the WTIG system behavior,the hourly wind speed data recorded over one year obtained fromONM-Adrar (south of Algeria) have been used. The correspondingwind speed evolution is shown in Fig. 3.
3.2. Model validation
TheWTIGelectrical systembehaviorhasbeen simulatedbyusingthe developed SIMULINK program. The output power and Cp havethen been determined and a polynomial fit obtained. A comparisonwith the results derived using the NACA63.600 and FFA-W3 airfoildata [19] has subsequently beenperformed. The obtained results areillustrated in Fig. 4.
To test the accuracy of the obtained results, the RMSE (rootmean square error), the MBE (mean bias error) and the MAE (meanabsolute error) algorithms have been employed as statistical anal-ysis tools. The respective evaluation expressions are given by thefollowing:
8>>>>>>>><>>>>>>>>:
RMSE ¼"�1
N
�PN1
�XðiÞ�XcðiÞ
XcðiÞ2#1=2
MAE ¼ 1NPN1
XðiÞ�XcðiÞXcðiÞ
MBE ¼ 1
NPN1
�XðiÞ�XcðiÞ
XcðiÞ
9>>>>>>>>=>>>>>>>>;
(13)
where Xc(i) is the calculated power or Cp for each wind speed V(i), X(i) is the experimental power or Cp for each wind speed V(i).
The derived results are presented in Table 1.The results presented in Fig. 4 show that those related to the
wind generator power P(v) output and Cp(v), obtained by runningthe developed simulation program, are in a close agreement withthose supplied by the manufacturer. This agreement is againobserved through the small deviations (see Table 1) which statis-tically confirm the significant accuracy of the developed program.
3.3. Model behavior in Adrar site
To show the WPIG system behavior under real conditions, oneyear hourly wind speed data recorded on the Adrar site are used asinput. The related simulation results are presented in Fig. 5 whichillustrates the time variations of the AM speed, the WT speed, theactive power, the reactive power and the AM torque.
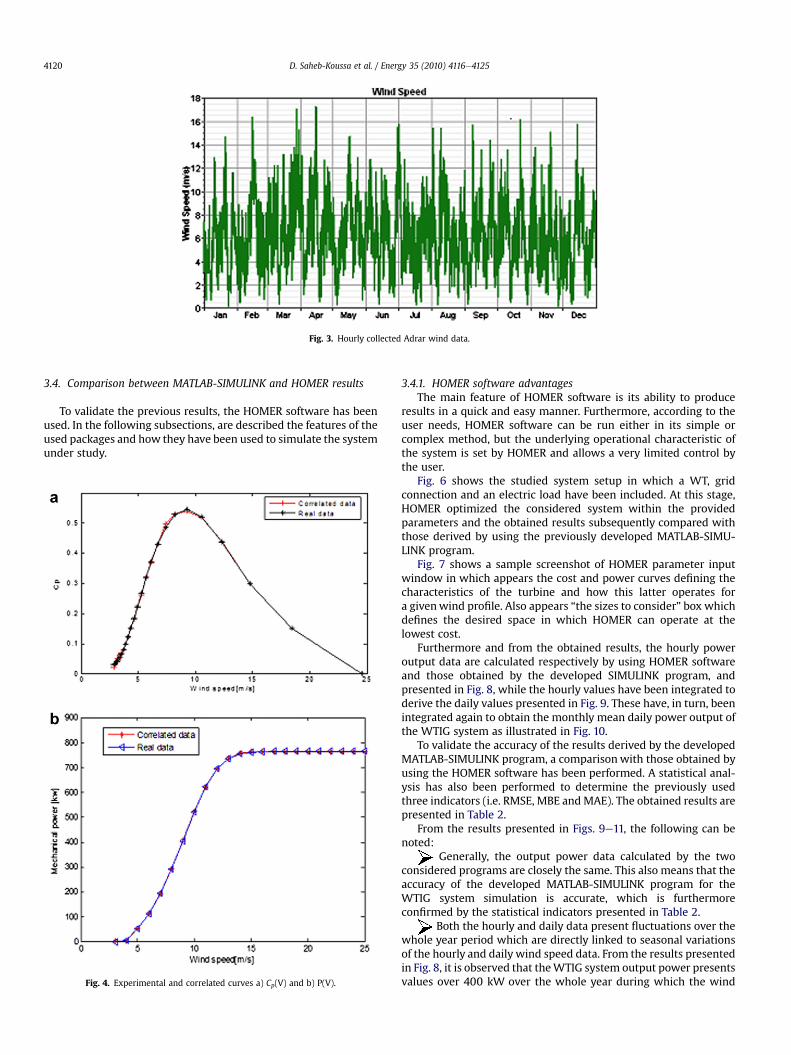
Fig. 3. Hourly collected Adrar wind data.
D. Saheb-Koussa et al. / Energy 35 (2010) 4116e41254120
3.4. Comparison between MATLAB-SIMULINK and HOMER results
To validate the previous results, the HOMER software has beenused. In the following subsections, are described the features of theused packages and how they have been used to simulate the systemunder study.
Fig. 4. Experimental and correlated curves a) Cp(V) and b) P(V).
3.4.1. HOMER software advantagesThe main feature of HOMER software is its ability to produce
results in a quick and easy manner. Furthermore, according to theuser needs, HOMER software can be run either in its simple orcomplex method, but the underlying operational characteristic ofthe system is set by HOMER and allows a very limited control bythe user.
Fig. 6 shows the studied system setup in which a WT, gridconnection and an electric load have been included. At this stage,HOMER optimized the considered system within the providedparameters and the obtained results subsequently compared withthose derived by using the previously developed MATLAB-SIMU-LINK program.
Fig. 7 shows a sample screenshot of HOMER parameter inputwindow in which appears the cost and power curves defining thecharacteristics of the turbine and how this latter operates fora givenwind profile. Also appears “the sizes to consider” box whichdefines the desired space in which HOMER can operate at thelowest cost.
Furthermore and from the obtained results, the hourly poweroutput data are calculated respectively by using HOMER softwareand those obtained by the developed SIMULINK program, andpresented in Fig. 8, while the hourly values have been integrated toderive the daily values presented in Fig. 9. These have, in turn, beenintegrated again to obtain the monthly mean daily power output ofthe WTIG system as illustrated in Fig. 10.
To validate the accuracy of the results derived by the developedMATLAB-SIMULINK program, a comparison with those obtained byusing the HOMER software has been performed. A statistical anal-ysis has also been performed to determine the previously usedthree indicators (i.e. RMSE, MBE andMAE). The obtained results arepresented in Table 2.
From the results presented in Figs. 9e11, the following can benoted:
Generally, the output power data calculated by the twoconsidered programs are closely the same. This also means that theaccuracy of the developed MATLAB-SIMULINK program for theWTIG system simulation is accurate, which is furthermoreconfirmed by the statistical indicators presented in Table 2.
Both the hourly and daily data present fluctuations over thewhole year period which are directly linked to seasonal variationsof the hourly and daily wind speed data. From the results presentedin Fig. 8, it is observed that theWTIG system output power presentsvalues over 400 kW over the whole year during which the wind

Fig. 5. Simulation results of the WPIG system.
D. Saheb-Koussa et al. / Energy 35 (2010) 4116e4125 4121
potential is generally important. So, from the results presented inFig. 9 representing the daily power production, the highest poweroutput values observed are those obtained during February, April,May, June, July, August, October and December while the maximumoccurs in April. This can be explained by the fact that this period ischaracterized by the ‘sand wind period’ in which the wind speedrises to its maximum values, especially during April. This is alsoobserved from the results presented in Fig. 10 in which Aprilpresents the highest density of hours characterized by the highestoutput power.
3.4.2. Discussion, results optimizationHOMER simulates system configurations on the basis of all the
combinations of the components specified in the previoussubsections. HOMER then discards, from the results, all non-feasible system configurations, those among which do notadequately meet the load, the available resource, or specifiedconstraints.
In the overall optimization results table, are given all the systemconfigurations that HOMER found to be feasible. These are listedfrom top to bottom from the most cost-effective to the least cost-effective. The cost effectiveness of a system configuration is deter-mined on the basis of its NPC (net present cost); displayed in the“Total NPC” column in the results table (see Fig. 11).
3.4.3. Refining system design and adding variables sensitivityIn the categorized optimization results tables, HOMER displays
only the most cost-effective configuration of each system design.Exploiting the warnings, the quantity of certain components can beadjusted; sensitivity variables added and the model run again onthe optimal configurations. Sensitivity results can also be displayedin graphs and tables.
HOMER is an iterative process which can start with roughestimates of values for inputs, check the results, estimate refinedvalues and repeat the process to find reasonable values for theinputs.

Fig. 6. HOMER sample model. Fig. 8. Hourly based electric power production.
D. Saheb-Koussa et al. / Energy 35 (2010) 4116e41254122
3.5. Input summary
3.5.1. AC load, primary loadThe data source is considered to be synthetic because a 15% daily
noise and a 20% hourly noise have been allowed. The scaled annualaverage load is 13,093 kWh/day and the scaled peak load is1061 kW, with a load factor of 0.514.
3.5.2. Wind economic data and wind resourceThe cost of the energy produced, related to the wind turbine
type studied in this work is given in Table 3 together with
Fig. 7. HOMER par
replacement, operational and maintenance costs. The capital cost isthe initial purchase price ($698,699), the replacement cost is thecost of replacing theWT at the end of its lifetime ($69,869), and theoperating and maintenance cost is the annual cost of operating andmaintaining the turbine ($698).
The sizes of the considered wind generator are (0, 1, 2, 3, 4, 5, 6,7)*660 kW with a lifetime of 20 years and a hub height of 100 m(see Fig. 7). The zero is included to consider systems without WTs.The wind resource used in MATLAB-SIMULINK simulation is againemployed.
ameter input.
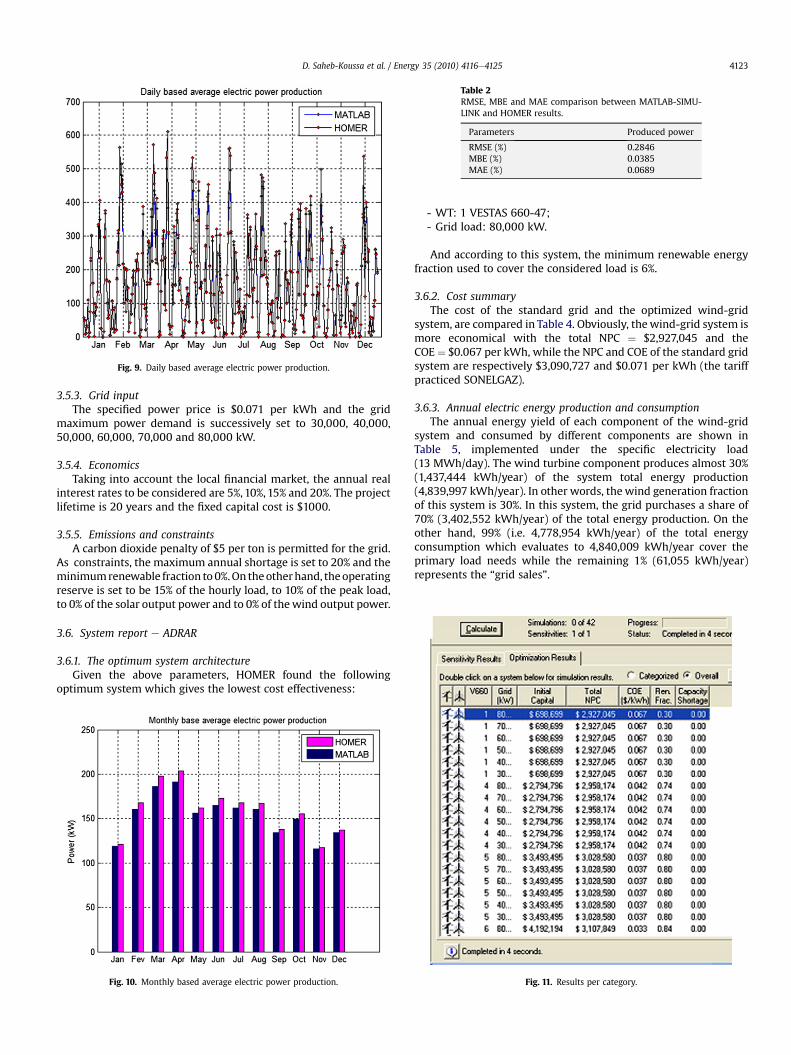
Fig. 9. Daily based average electric power production.
Table 2RMSE, MBE and MAE comparison between MATLAB-SIMU-LINK and HOMER results.
Parameters Produced power
RMSE (%) 0.2846MBE (%) 0.0385MAE (%) 0.0689
D. Saheb-Koussa et al. / Energy 35 (2010) 4116e4125 4123
3.5.3. Grid inputThe specified power price is $0.071 per kWh and the grid
maximum power demand is successively set to 30,000, 40,000,50,000, 60,000, 70,000 and 80,000 kW.
3.5.4. EconomicsTaking into account the local financial market, the annual real
interest rates to be considered are 5%, 10%, 15% and 20%. The projectlifetime is 20 years and the fixed capital cost is $1000.
3.5.5. Emissions and constraintsA carbon dioxide penalty of $5 per ton is permitted for the grid.
As constraints, the maximum annual shortage is set to 20% and theminimumrenewable fraction to0%.On theotherhand, theoperatingreserve is set to be 15% of the hourly load, to 10% of the peak load,to 0% of the solar output power and to 0% of thewind output power.
3.6. System report e ADRAR
3.6.1. The optimum system architectureGiven the above parameters, HOMER found the following
optimum system which gives the lowest cost effectiveness:
Fig. 10. Monthly based average electric power production.
- WT: 1 VESTAS 660-47;- Grid load: 80,000 kW.
And according to this system, the minimum renewable energyfraction used to cover the considered load is 6%.
3.6.2. Cost summaryThe cost of the standard grid and the optimized wind-grid
system, are compared in Table 4. Obviously, thewind-grid system ismore economical with the total NPC ¼ $2,927,045 and theCOE ¼ $0.067 per kWh, while the NPC and COE of the standard gridsystem are respectively $3,090,727 and $0.071 per kWh (the tariffpracticed SONELGAZ).
3.6.3. Annual electric energy production and consumptionThe annual energy yield of each component of the wind-grid
system and consumed by different components are shown inTable 5, implemented under the specific electricity load(13 MWh/day). The wind turbine component produces almost 30%(1,437,444 kWh/year) of the system total energy production(4,839,997 kWh/year). In other words, the wind generation fractionof this system is 30%. In this system, the grid purchases a share of70% (3,402,552 kWh/year) of the total energy production. On theother hand, 99% (i.e. 4,778,954 kWh/year) of the total energyconsumption which evaluates to 4,840,009 kWh/year cover theprimary load needs while the remaining 1% (61,055 kWh/year)represents the “grid sales”.
Fig. 11. Results per category.

Table 4Cost comparison between standard grid and Wind-grid system.
Types of costs Standard grid Wind-grid system
NPC ($) 3, 090,727 927,045COE ($/kWh) 0.071 0.067
Table 5Annual electric energy production and consumption.
Component Production(kWh/y)
Fraction Load Consumption(kWh/y)
Fraction
Wind turbine 1,437,444 30% AC primaryload
4,778,954 99%
Grid purchases 3,402,552 70% Grid sales 61,055 1%Total 4,839,997 100% Total 4,840,009 100%
Table 3Wind turbine economic data.
Quantity Capital ($) Replacement ($) O&M ($/year)
1 698,699 698,699 698
Table 7Emission of pollutants.
Polluant Emissions withRenewable energy(kg/year)
Emissions without Renewableenergy (kg/year)
Carbon dioxide 2,111,826 3, 020,294Carbon monoxide 0 0Unburned hydrocarbons 0 0Particulate matter 0 0Sulfur dioxide 9156 13,094Nitrogen oxides 4478 6404
D. Saheb-Koussa et al. / Energy 35 (2010) 4116e41254124
Table 6 shows the cost summary of each component of wind-grid system. In the optimized wind-grid system, the grid compo-nent costs present a far higher level ($239,379/year) than the windsystem ($3088/year). This is caused by the renewable energycomponents which do not need any additional cost for energyresource while the grid component does.
3.6.4. EmissionsTable 7 shows the emission of the standard grid system and the
wind-grid system. As the main greenhouse gas, the emission ofcarbon dioxide from standard grid is 3,020,294 kg/year while theoptimized system exhausts only 2,111,286 kg/year, which meansa 31% reduction.
Meanwhile, the sulfur dioxide and nitrogen oxide emissions ofthe wind-grid system are equal to less than 69% of a standard gridsystem.
3.7. Towards a wind power FIT (feed-in tariff) in Algeria
As demonstrated by Huang and Wu in Ref. [30], long-termpolicies are required to help new renewable technologies, such asWTs, to gradually replace some of the conventional fossil fuels, suchas gas turbines. One of the most important tools to promoteinvestment in the renewable energy sector is the establishment oflong-term power purchase agreements [30]. Under the FIT scheme,renewable energy facilities receive a fixed rate per unit of electricityinjected in the grid for a guaranteed contract period [31]. The FIThas proved to be the most effective policy in promoting invest-ments in renewable energy because it reduces regulatory andmarket risks [31].
Table 6Cost breakdown.
Component ($) Initial Capital($)
AnnualizedCapital ($/yr)
AnnualizedReplacement ($/yr
VESTAS 660e47 698,699 76,974 46,113Grid 0 0 0Total 698,69 76,974 46,113
In addition, Butler and Neuhoff in Ref. [32] concluded that theFIT policy generated sufficient competition among turbineproducers and constructors. In Ref. [33], the authors presented aneconomically efficient FIT structure for renewable energydevelopment.
In Algeria, the average rate of electricity is directly related tothat of the natural gas and, according to the Annual Reports whichare based on the price of $1.5 per MMBtu of the domestic naturalgas, the average COE amounts to DZD5.3 per kWh, which corre-sponds to $0.071 per kWh. However, international prices fornatural gas are much higher than domestic ones. For example, inthe United States, according to the EIA (energy informationadministration), the average Henry Hub pot price is expected tobe about $11.53 per MMBtu in 2008 and $11.29 per MMBtu in2009 [34]. Assuming a fuel price of $10 per MMBtu, the cost ofelectricity is $0.111 or DZD8.286 per kWh. Any savings ondomestically consumed natural gas can be exported or used inother industrial activities.
By 2020, Algeria, which aims at economy diversification awayfrom the oil sector, natural gas sector contribution to the grossdomestic production is expected to increase up to 5% to compen-sate for the expected decrease in the oil sector [35]. AlthoughAlgeria is expected to reach its peak for conventional oil produc-tion by 2012, its production of natural gas increased from 1.2million in 2005e2.18 million bbl/day in 2008 [36]. Despite thehuge expansion of natural gas-based industries such as petro-chemicals, power generation, and LNG (liquefied natural gas), andaccording to OGJ (Oil and Gas Journal), Algeria had a reserve of159 Tcf (trillion cubic feet) of proven natural gas reserves (theeighth-largest natural gas reserves in the world) in January 2009.Hassi R’Mel, the Algerian largest gas field discovered in 1956, holdsproven reserves of about 85 Tcf. Hassi R’Mel accounts for abouta quarter of the Algerian total dry natural gas production. Theremainder of the Algerian natural gas reserves come from associ-ated (that occur alongside crude oil reserves) and non-associatedfields in the South and South-East regions of the country [37].According to the EIA, there are speculations stating that natural gassupplies by Algeria may be over committed due to its long-termLNG export obligations [37].
Therefore, given the high international natural gas prices, thecountry’s long-term LNG export obligations, and the expansion ofnatural gas-based industries, a value of about $0.06 per kWh isrecommended for the wind power FIT [38].
)AnnualO&M ($/yr)
AnnualFuel ($/yr)
Salvage($/yr)
Total Annualized($/yr)
698 0 �39,999 83,088239,379 0 0 239,379239,379 0 �39,999 322,467

D. Saheb-Koussa et al. / Energy 35 (2010) 4116e4125 4125
4. Conclusion
This paper proposes a method for modeling a fixed-speed windgenerator. This method allows significant time savings at both themodeling and debugging stage. The models built for system simu-lation employ the different sub models of the WTIG componentswhile the MATLAB-SIMULINK software package has been used forthe whole system simulation. The derived results for the calculatedpower and Cp quality have then been compared with those corre-sponding to the experimental equivalent data, using statisticalanalysis. The evaluated statistical indicators of accuracy are in favorof the presented method, hence the validation of the developedsimulation program. Consequently, the usefulness of this latterprogram has been verified through a performance analysis carriedout using hourly recorded wind speed data on an isolated site.The above mentioned MATLAB-SIMULINK program has then beenupdated and used to simulate the electric operation of the WTIGsystem on the basis of these hourly recorded data.
In view of validating the obtained results, HOMER software hasbeen run in the same conditions and a statistical analysis per-formed on both results. The derived accuracy indicators are clearlyin favor of the simulation results obtained by using the developedMATLAB-SIMULINK program.
On the economic side, the estimated COE (cost of energy) is$0.067 per kWh, a figure slightly lower than the rate of $0.071 perkWh practiced by the local electricity board. Furthermore andregarding the environment, the emission of pollutants decreaseswith the renewable energy injection into grid.
Also, the proposedmethod allows evaluating the behavior of theWTIG system for an isolated site over one year and under differentseasonal climate considerations, which also constitutes a helpfulreference for wind energy planers as well as a useful tool fordecision making regarding the employment of renewable energysystems. Finally, the authors recommend that the Public Authorityfor Electricity Board in Algeria adopt FIT policies for wind power tofacilitate private investment and sustainable development in thissector.
References
[1] Union for Coordination of Transmission of Electricity. Wind Power in the UCTEinterconnected System. See also, http://www.entsoe.eu/_library/publications/ce/otherreports/Wind_Power_20041125.pdf; November 2004.
[2] Hirsch RL, Bezdec R, Wendling R. Peaking of world oil production: impacts,mitigation and risk management. DOE report; See also, http://www.net1.doe.gov/publications/others/pdf/OilPeakingNETL.pdf; 2005.
[3] Wind turbines generate more than 1% of the global electricity. World WindEnergy Association (WWEA). See also, http://www.wwindea.org/home/images/stories/pr_statistics2007_210208_red.pdf; 21 February 2008.
[4] Lund H, Mathiesen BV. Energy system analysis of 100% renewable energysystems e The case of Denmark in years 2030 and 2050. Energy2009;34:524e31.
[5] Lund H. Renewable energy strategies for sustainable development. Energy2007;32:912e9.
[6] Derriche M. Enjeux, Défis et perspectives. Expériences Algériennes en énergiesRenouvelables.
[7] Office National de la Météorologie. Atlas climatologique National. Recueil dedonnées période (1975e1984)
[8] Hamouche R. Atlas vent de l’Algérie. Edition O.P.U. Alger: Office National de laMétéorologie; 1990.
[9] Spooner E, Williamson AC. Direct coupled permanent magnet generators forwind turbine applications. IEE Proceedings Electric Power Applications1996;143(1):1e8.
[10] Dubois MR, Polinder H, Ferreira JA. Comparison of generators topologies fordirect edrive wind turbines. ECM 92, Manchester UK; 1992. p. 761e5.
[11] Fernandez LM, Garcia CA, Jurado F. Comparative study on the performance ofcontrol systems of doubly fed induction generator (DFIG) wind turbinesoperating with power regulation. Energy 2008;33(9):1438e52.
[12] Lin Whei-Min, Hong Chih-Ming, Cheng Fu-Sheng. On-line designed hybridcontroller with adaptive observer for variableespeed wind generationsystem. Energy 2010;35(7):3022e30.
[13] Lin Whei-Min, Hong Chih-Ming. Intelligent approach to maximum powerpoint tracking control strategy for variable-speed wind turbine generationsystem. Energy 2010;35(6):2440e7.
[14] Ackerman T. Wind power in power systems. Royal Institute of technologyStockholm. Sweden. John Wiley and Sons, Ltd; 2005.
[15] Gracia MG, Comech MP, Salla J, Lombart A. Modeling wind farms for griddisturbance studies. Renewable Energy 2008;33:2109e21.
[16] Petru T, Thirnger T. Modeling of wind turbines for power system studies.IEEE Transactions on Energy Conversion 2002;17(4):1132e9.
[17] Abdin ES, Xu W. Control design and dynamic performance analysis of a windturbine-induction generator unit. IEEE Transactions on Energy Conversion2000;15(1):91e6.
[18] Saccomando G, Svensson J, Sannino A. Improving voltage disturbance rejec-tion for variable-wind speed wind turbine. IEEE Transactions on EnergyConversion 2002;17(3):422e8.
[19] The Cres Wind Farm. 3.01 MW Demonstration wind farm in Greece. Variouswind energy technologies in complex Terrain topography. See also, http://www.creswindfarm.gr/site1/Articles/V47_US.pdf.
[20] Ong CM. Dynamic simulation of electric Machinery using MatlabeSimulink.Upper Saddle River, New Jersey: Prentice-Hall PTR; 1998.
[21] Miao Z, Fan L. The art of modeling and simulation of induction generator inwind generation applications using high-order model. Simulation ModelingPractice and Theory 2008;16:1239e53.
[22] Zubia I, Ostolaza X, Susperregui A, Tapia G. Complete wind farm electro-magnetic transient modeling for grid integration studies. Energy Conversionand Management 2009;50(3):600e10.
[23] Martins M, Perdana A, Ledesma P, Agneholm E, Carlson O. Validation of fixedspeed wind turbine dynamics models with measured data. Renewable Energy2007;38(8):1301e16.
[24] Doumbia ML, Traoré AA. Cage induction machine modeling and simulationusing MATLAB -SIMULINK [(Modélisation et simulation d’une machineasynchrone à cage à l’aide du logiciel MATLAB-SIMULINK)]. Bamako: MSAS.See also, http://www.msas.maliwatch.org/msas2002/pdf/msas_pp038_45.pdf; 2002.
[25] Derriche S, Djebrani H, Djemai DJ. Grid Connected Wind generatorModeling and simulation using MATLAB-SIMULINK (Modélisation et simu-lation d’un générateur éolien connecté au réseau à l’aide du logicielMATLAB-SIMULINK). Electrical Engineering Project Report: 2008 (Mémoired’ingénieur d’Etat en Electrotechnique: Université Mouloud Mammeri deTizi-Ouzou Algérie, Département Genie électrique et informatique). 2008(in Algeria). See also, http://www.ummto.dz/
[26] Anderson PM, Bose A. Stability simulation of wind turbine systems. IEEETransactions on Power Apparatus and Systems 1983;102(12):3791e5.
[27] Laverdure N, Bacha S, Roye D, Raison B, and Dumas F. Elements of modeling ofwind power systems with energy management: two structures in compar-ison. In: IEEE 28th Annual Conference of the Industrial Electronics Society vol.2; 2002, p. 1083e8.
[28] Krichen L, Francois B, Ouali A. fuzzy logic supervisor for active and reactivepower control of fixed speed wind energy conversion system. Electric PowerSystem Research 2008;78:418e24.
[29] Poitiers F. A’onous Generator Study and Control for the wind energy use(Etude et commande de génératrice asynchrone pour l’utilisation de l’énergieéolienne), PhD thesis. University of Nantes, France, order No: 3563, December2003 (Thèse de doctorat de l’université de Nantes, France, Nod’ordre 3563,Décembre 2003).
[30] Huang YYH, Wu JH. A transition toward a market expansion phase: policiesfor promoting wind power in Taiwan. Energy 2009;34:437e47.
[31] Sawin J, Flavin C. National policy instruments: policy lessons for theadvancement and diffusion of renewable energy technologies around theworld, thematic background paper. In: The international conference forrenewable energies, Bonn, Germany; 2004.
[32] Lucy B, Neuhoff K. Comparison of feed in tariff, quota and auction mechanismsto support wind power development. Cambridge University, Department ofApplied Economics; 2004.
[33] Lesser JA, Su X. Design of an economically efficient feed-in tariff structure forrenewable energy development. Energy Policy 2008;36:981e90.
[34] Short term energy outlook e July 08, energy information administration (EIA),Washington, DC. .See also, www.eia.doe.gov/emeu/steo/pub/jul08.pdf;; July2008.
[35] News Reginal. World future energy summit. Sustainable Energy 2010;1(2):13e5.
[36] Energy Information Administration. see also, http://www.eia.doe.gov/cabs/Algeria/NaturalGas.html.
[37] Algeria Oil e production. see also, http://www.indexmundi.com/algeria/oil_production.html.
[38] Albadi MH, El Saadany EF, Albadi HA. Wind to power a new city in Oman.Energy 2009;34(10):1579e86.