2007 African Fixed Income Guidebook
177
© 2006, FTRY - Design, Internal and External Communications Division (ADB/SEGL3)/YAL AFRICAN DEVELOPMENT BANK GROUP MAY 2007 AFRICAN DEVELOPMENT BANK GROUP F O N D S A F R I C A I N D E D É V E L O P P E M E N T A F R I C A N D E V E L O P M E N T F U N D B A N Q U E A F R I C A I N E D E D É V E L O P P E M E N T African Fixed Income Guidebook AFRICAN DEVELOPMENT BANK GROUP Temporary Relocation Agency: Angle de l’avenue du Ghana et des rues Pierre de Coubertin, Hedi Nouira BP 323 1002 Tunis Belvédère TUNISIA Tel: +216 71 333 511 Fax: +216 71 351 933 Email: [email protected] Internet: www.afdb.org F O N D S A F R I C A I N D E D É V E L O P P E M E N T A F R I C A N D E V E L O P M E N T F U N D B A N Q U E A F R I C A I N E D E D É V E L O P P E M E N T MAY 2007 African Fixed Income Guidebook CONTACT: Group Treasurer Tel: +216 7110 2028 Fax: +216 7110 3716
-
Upload
khangminh22 -
Category
Documents
-
view
1 -
download
0
Transcript of 2007 African Fixed Income Guidebook

© 2
00
6,
FTR
Y -
Des
ign,
Int
erna
l an
d E
xter
nal
Com
mun
icat
ions
Div
isio
n (A
DB
/SE
GL3
)/YA
L
AFRIC
AN D
EVELOPM
ENT B
ANK G
RO
UP
MAY
2007
AFRICAN DEVELOPMENT BANK GROUP
F O N D S A F R I C A I N D E D É V E L O P P E M E N
T
A F R IC
A N D E V E L O P M E N T F U N D
B A
N Q
U E A
F R I C A I N E D E D É V E L O P P E M E N T
F O N D S A F R IC A I N D E D É V E L O P P E M E N
T
A F R I C
A N D E V E L O P M E N T F U N D
B A
N Q
U E A
F R IC A I N E D E D É V E L O P P E M E N T
African
Fixed
Inco
me G
uid
ebo
ok
AFRICAN DEVELOPMENT BANK GROUP
Temporary Relocation Agency:
Angle de l’avenue du Ghana et des rues Pierre de Coubertin, Hedi NouiraBP 3231002 Tunis BelvédèreTUNISIA
Tel: +216 71 333 511Fax: +216 71 351 933Email: [email protected]: www.afdb.org
F O N D S A F R I C A I N D E D É V E L O P P E M E N
T
A F R IC
A N D E V E L O P M E N T F U N D
B A
N Q
U E A
F R I C A I N E D E D É V E L O P P E M E N T
F O N D S A F R IC A I N D E D É V E L O P P E M E N
T
A F R I C
A N D E V E L O P M E N T F U N D
B A
N Q
U E A
F R IC A I N E D E D É V E L O P P E M E N T
MAY 2007
African Fixed Income Guidebook
FONDS AFRICAIN DE DÉVELO
PPEMENT
AFRI
CAN D
EVELOPMENT FUND
BANQUE
AFRICAINE
DE DÉVELOPPEMENT
FONDS AFRICAIN DE DÉVELO
PPEMENT
AFRI
CAN D
EVELOPMENT FUND
BANQUE
AFRICAINE
DE DÉVELOPPEMENT
CONTACT:Group Treasurer Tel: +216 7110 2028Fax: +216 7110 3716
AFRICA FIXED INCOME GUIDEBOOK
Algeria · Angola
Benin · Botswana · Burkina Faso · Burundi
Cameroon · Cape Verde · Central African Republic · Chad · Comoros · Congo
Democratic Republic of Congo · Cote D’Ivoire · Djibouti
Egypt · Equatorial Guinea · Eritrea · Ethiopia
Gabon · The Gambia · Ghana · Guinea · Guinea-Bissau
Kenya
Lesotho · Liberia · Libya
Madagascar · Malawi · Mali · Mauritania · Maritius ·Morocco · Mozambique
Namibia · Niger · Nigeria
Rwanda
Sao Tome and Principe · Senegal · Seychelles ·Sierra Leone · Somalia · South Africa · Sudan · Swaziland
Tanzania · Togo · Tunisia
Uganda
Zambia · Zimbabwe
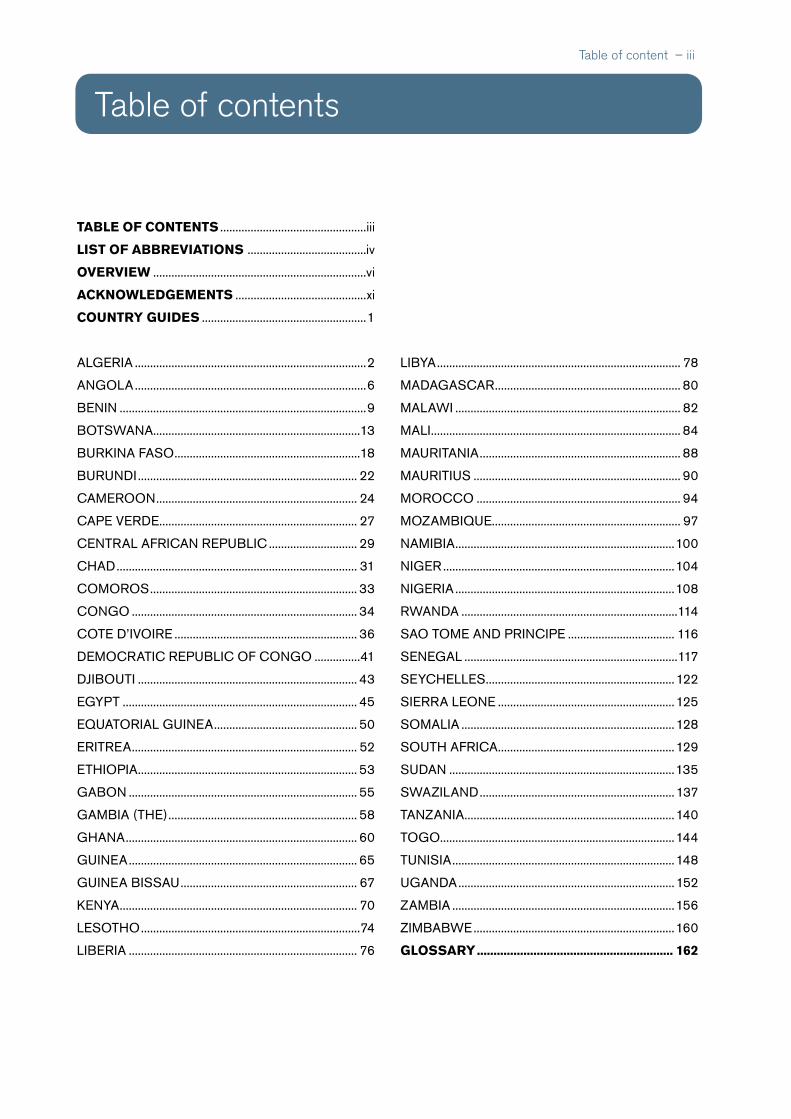
Table of contents
TABLE OF CONTENTS ................................................iii
LIST OF ABBREVIATIONS .......................................iv
OVERVIEW ......................................................................vi
ACKNOWLEDGEMENTS ...........................................xi
COUNTRY GUIDES ......................................................1
ALGERIA ............................................................................2
ANGOLA ............................................................................6
BENIN .................................................................................9
BOTSWANA....................................................................13
BURKINA FASO .............................................................18
BURUNDI ........................................................................ 22
CAMEROON .................................................................. 24
CAPE VERDE ................................................................. 27
CENTRAL AFRICAN REPUBLIC ............................. 29
CHAD ............................................................................... 31
COMOROS .................................................................... 33
CONGO .......................................................................... 34
COTE D’IVOIRE ............................................................ 36
DEMOCRATIC REPUBLIC OF CONGO ...............41
DJIBOUTI ........................................................................ 43
EGYPT ............................................................................. 45
EQUATORIAL GUINEA ............................................... 50
ERITREA .......................................................................... 52
ETHIOPIA ........................................................................ 53
GABON ........................................................................... 55
GAMBIA (THE) .............................................................. 58
GHANA ............................................................................ 60
GUINEA ........................................................................... 65
GUINEA BISSAU .......................................................... 67
KENYA .............................................................................. 70
LESOTHO ........................................................................74
LIBERIA ........................................................................... 76
LIBYA ................................................................................ 78
MADAGASCAR ............................................................. 80
MALAWI .......................................................................... 82
MALI .................................................................................. 84
MAURITANIA .................................................................. 88
MAURITIUS .................................................................... 90
MOROCCO ................................................................... 94
MOZAMBIQUE.............................................................. 97
NAMIBIA ........................................................................100
NIGER ............................................................................104
NIGERIA ........................................................................108
RWANDA .......................................................................114
SAO TOME AND PRINCIPE ................................... 116
SENEGAL ......................................................................117
SEYCHELLES ..............................................................122
SIERRA LEONE ..........................................................125
SOMALIA ......................................................................128
SOUTH AFRICA ..........................................................129
SUDAN ..........................................................................135
SWAZILAND ................................................................137
TANZANIA .....................................................................140
TOGO.............................................................................144
TUNISIA .........................................................................148
UGANDA .......................................................................152
ZAMBIA .........................................................................156
ZIMBABWE ..................................................................160
GLOSSARY ........................................................... 162
Table of content – iii
iv –
List of Abbreviations
AfDB African Development BankADF African Development FundAGOA African Growth and Opportunity ActAOA Angola KwanzaAvg AverageBCEAO Banque Centrale des États de l’Afrique de l’OuestBEAC Banque des Etats de l’Afrique CentraleBESA Bond Exchange of South AfricaBIF Burundi FrancBOAD Banque Ouest Africaine de Développement BOBC Bank of Botswana CertificateBOS Bank of SudanBOT Bank of TanzaniaBPS Basis PointsBRVM Bourse Régionale des Valeurs MobilièresBSE Botswana Stock ExchangeBVMAC Bourse des Valeurs Mobilières d’Afrique Centrale BWP Botswana PulaCAR Central African RepublicCBN Central Bank of NigeriaCDF Congolese FrancCEMAC Communauté Économique et Monétaire de l’Afrique CentraleCFA Franc de la Communauté Financière de l’AfriqueCIMA Conférence Internationale des Marches d’AssuranceCIPRES Conférence Interafricaine de la Prevoyance SocialeCOBAC Commission Bancaire de l’Afrique CentraleCOMESA Common Market of Eastern and Southern AfricaCOSOB Commission d’Organisation et de Surveillance des Opérations de BourseCOSUMAF Commission de Surveillance du Marché Financier de l’Afrique CentraleCMA Common Monetary AreaCPI Consumer Price IndexCREPMF Conseil Régional de l’Epargne Publique et des Marchés FinanciersCSD Central Securities DepositoryCVE Cape Verde EscudoDC/BR Dépositaire Central/Banque de RèglementDFI Development Finance InstitutionDJF Djibouti FrancDPCF Debt Participation Capital FundDRC Democratic Republic of CongoDSE Dar es Salaam Stock ExchangeDZD Algerian DinarEASRA East African Securities Regulatory AuthoritiesEGP Egyptian PoundEPZ Export Processing ZoneERN Eritrean NakfaESAF Enhanced Structural Adjustment FacilityETB Ethiopian BirrEUR EuroFI Financial InstitutionFMC Financial Markets CommissionFMO The Netherlands Development Finance CompanyFTA Free Trade Agreement
iv – List of Abbreviations

– v List of Abbreviations – v
FX Foreign ExchangeGDP Gross Domestic ProductGHC Ghanaian CediGNF Guinean FrancHIPC Heavily Indebted Poor CountryHDI Human Development Index IDA International Development AssociationIFC International Finance CorporationIMF International Monetary FundIRS Internally Registered StockJPY Japanese YenJSE Johannesburg Stock ExchangeKES Kenyan ShillingLLDC Landlocked Developing CountryLRD Liberian DollarLSL Lesotho LotiLYD Libyan DinarMAD Moroccan DirhamMDB Multilateral Development BankMDRI Multilateral Debt Relief InitiativeMGA Malagasy AriaryMRO Mauritanian OuguiyaMUR Mauritian RupeeMWK Malawi KwachaMZM Mozambique MeticalNGN Nigerian NairaNGO Non-Governmental OrganizationNSX Namibian Stock ExchangeOHADA L’Organisation pour l’Harmonisation en Afrique du Droit des AffairesOTC Over-The-CounterPRGF Poverty Reduction and Growth FacilityTB Treasury BillTBC Titulos do Banco CentralTCMF Titulos Consolidatos de Mobilisação Financiera TZS Tanzanian ShillingNDF Non-Deliverable ForwardRMC Regional Member CountryRWF Rwandan FrancSAFEX South African Futures ExchangeSCR Seychelles RupeeSDD Sudanese DinarSDR Special Drawing RightSIDS Small Island Developing StateSGI Sociétés de Gestion et d’intermédiation SGVB Société de Gestion de la Bourse des ValeursSLL Sierra Leonean LeoneSTD Sao Tome & Principe DobraSVT Spécialistes en Valeur de TrésorSZL Swaziland LilangeniTND Tunisian DinarUEMOA Union Économique et Monétaire Ouest AfricaineUN United NationsUGX Uganda ShillingUSD United States DollarUSE Uganda Stock ExchangeWAEMU West African Economic and Monetary UnionWAMU West African Monetary UnionXAF CFA Franc (Central African Region)XOF CFA Franc (West African Region)ZWD Zimbabwe DollarZMK Zambian Kwacha
vi –
Overview
Introduction
This Guidebook presents the state and profile of fixed
income markets in Africa, providing coverage on all
53 countries in the Continent as of the first quarter
of 2007. By this time, comprehensive economic data
were generally available up to the end of 2006 for all
countries.
In this overview, we present the economic rationale
for fixed income markets, survey the existence of such
markets in Africa, assess their state of development
and finally, determine the framework that needs to be
in place in these African capital markets in order to
strengthen them and bring them on par with other
developed markets in the world.
While the Guidebook’s coverage is focused
predominantly on African Fixed Income Markets, it also
addresses other related markets like the stock market,
foreign exchange market and, where applicable, the
derivatives markets.
I. FIXED INCOME INSTRUMENTS AND MARKETS
Fixed income instruments are debt securities that
constitute a contractual obligation on the part of the
borrower/issuer to make fixed payments of principal
and/or interest to the lender/investor. In financial
markets, fixed income instruments are traded either in
the money market or bond market. The money market
is the market for short-term instruments with a maturity
of less than one year. Bond market instruments
are fixed income instruments with maturities
exceeding one year. Both Money Market and Bond
Market instruments may be issued by supranational
institutions, governments and their agencies as well
as by private sector firms.
a. The Money Market
The most common money market instruments include
securities such as Treasury Bills, Commercial Paper,
Bankers Acceptances, and Repurchase Agreements
(Repos).
The Money Market is an important segment of the
financial market. Its main role is to allow participants
in financial markets to adjust their short-term liquidity
positions quickly. Participants with surplus funds are
able to enhance their income by lending these funds
for short periods, while institutions short of funds are
able to borrow to manage deficits. A well-developed
money market reduces liquidity risks for bondholders
by providing immediate access to the cash market.
It also facilitates the emergence of a sovereign yield
curve as money market benchmarks potentially lead
to the development of the long-term yield curve.
b. The Bond Market
The bond market is the market for trading long-dated
fixed income securities. In well-developed capital
markets, maturities of bonds generally range from
one year to 30 years, going as far as 50 years and
Perpetual Bonds.
The conventional bond instrument has a fixed
coupon payable on every interest payment date while
the principal repayment is made at maturity. However,
there are numerous variations on the plain vanilla bond.
Some of these include Floating Rate Notes (FRNs),
Index-linked Bonds, Callable Bonds and Convertible
Bonds. The Financial and Economic Importance of
Bond Markets is based on the advantages that active
bond markets bring to financial markets and, indeed,
the economy as a whole.
At the macro-economic level, local fixed income
markets play a critical role, as they perform important
economic functions, including, but not limited to the
following:
• Mobilizing stable, long-term financing for productive
investments;
vi – Overview
– vii Overview – vii
• Facilitating efficient resource allocation, by
providing market-determined interest rates that
reflect the true cost of capital;
• Complementing the equity market as an alternative
source of long-term finance for productive
investment;
• Broadening the financial system and enhancing the
realization of the greater function of the financial
sector as a whole;
• Serving as an important market instrument that
augments the effectiveness of monetary policies;
• Enabling the Government to engage in better
public debt management and also, decreasing
their overall foreign currency exposure;
• Laying the building blocks for the creation of Fixed
Income Derivatives Markets, thus providing the
markets with risk management vehicles.
Furthermore, fixed income market instruments, from
a micro perspective, are attractive to borrowers and
investors for the following reasons:
• In comparison to equity markets, fixed income
securities are considered less risky due to a
debt instrument’s priority position over an equity
security in a period of liquidation.
• Bonds are indispensable to meeting the investment
needs of households, given their relative certainty
of income generated from regular cash flows. They
also increase the chances of mobilizing savings;
• Debt financing is advantageous to borrowers as
it creates an interest tax shield, due to the tax
deductibility of interest payments;
• Fixed income markets enable borrowers to fix
their cost of funding over the life of the instrument,
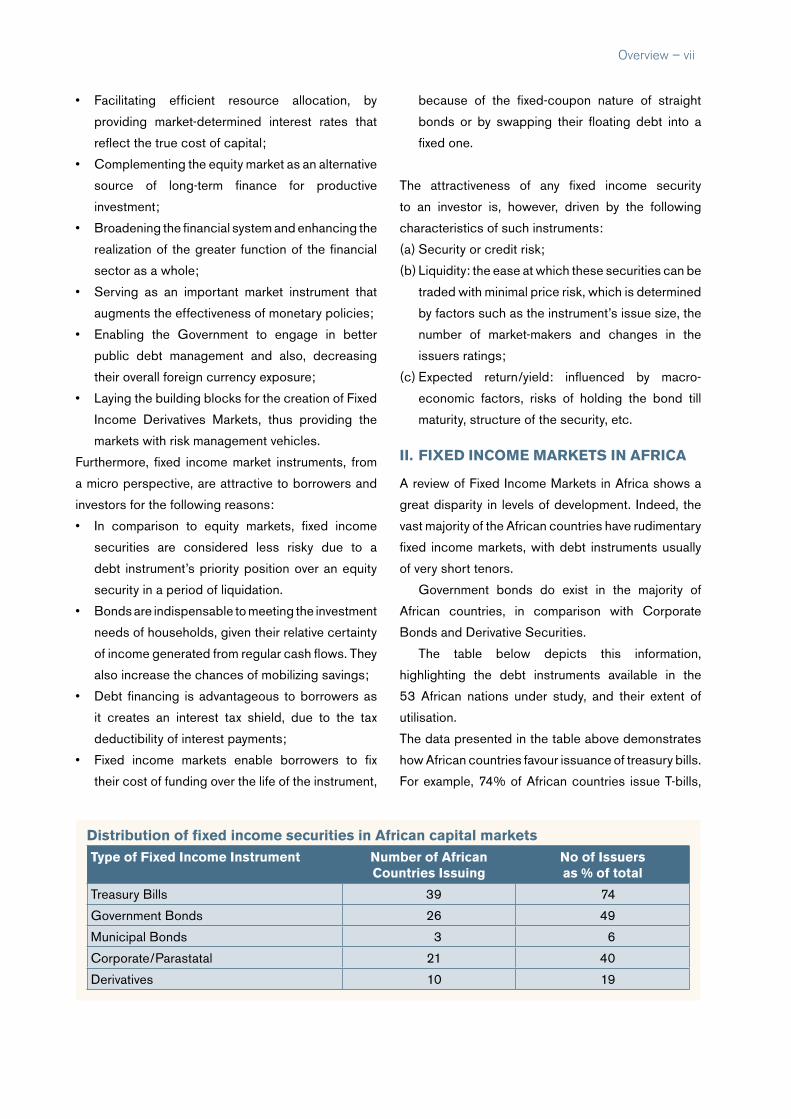
Distribution of fixed income securities in African capital marketsType of Fixed Income Instrument Number of African
Countries IssuingNo of Issuers as % of total
Treasury Bills 39 74
Government Bonds 26 49
Municipal Bonds 3 6
Corporate/Parastatal 21 40
Derivatives 10 19
because of the fixed-coupon nature of straight
bonds or by swapping their floating debt into a
fixed one.
The attractiveness of any fixed income security
to an investor is, however, driven by the following
characteristics of such instruments:
(a) Security or credit risk;
(b) Liquidity: the ease at which these securities can be
traded with minimal price risk, which is determined
by factors such as the instrument’s issue size, the
number of market-makers and changes in the
issuers ratings;
(c) Expected return/yield: influenced by macro-
economic factors, risks of holding the bond till
maturity, structure of the security, etc.
II. FIXED INCOME MARKETS IN AFRICA
A review of Fixed Income Markets in Africa shows a
great disparity in levels of development. Indeed, the
vast majority of the African countries have rudimentary
fixed income markets, with debt instruments usually
of very short tenors.
Government bonds do exist in the majority of
African countries, in comparison with Corporate
Bonds and Derivative Securities.
The table below depicts this information,
highlighting the debt instruments available in the
53 African nations under study, and their extent of
utilisation.
The data presented in the table above demonstrates
how African countries favour issuance of treasury bills.
For example, 74% of African countries issue T-bills,
viii –
while only 49% issue the longer-dated government
securities.
III. DERIVATIVE MARKETS
Derivative markets are markets for trading instruments
whose values are derived from underlying assets.
The most popular plain vanilla derivatives are futures,
options and swaps.
Derivative instruments can be used either as
investment vehicles or for risk management purposes.
Options, Futures, and Swaps enable market
participants to reduce the price and interest rate
risk associated with exchange rates, stocks, bonds,
and commodities. For example, a crude oil futures
or option contract enables an oil producer to hedge
against fluctuations in prices and, hence, protect
against the risk of losses.
Following at least two decades of market
liberalization and reform, the vast majority of African
countries have eliminated price controls in favour
of free markets. Such liberalization has exposed
domestic economies to price risk associated with
commodities, interest rates and exchange rate
fluctuations. The establishment of Stock Exchanges,
while surely accruing enormous benefits, have also
increased the risks associated with tradable financial
assets that have significant wealth effect implications.
The absence of derivatives markets makes it difficult
for participants to hedge these risks.
With the exception of South Africa, Derivative
Markets are mainly focused on foreign exchange
derivative contracts. This should not be the case, as
participants in African financial markets are exposed
to the same types of market risks faced by their
counterparts in more advanced emerging markets.
Some reasons for the lack of markets for derivative
products include the following:
1. The under development or, sometimes, the absence
of markets for the underlying instruments;
2. The underdevelopment, by international financial
market standards, of the money markets and
pricing benchmarks;
3. Lack of liquidity in the underlying assets;
4. The dearth in expertise and knowledge in the
utilization and pricing of these underlying
instruments;
5. Absence of enabling legal frameworks to allow for
efficient operations. For example, some securities
laws do not recognize derivatives as securities
and legal prohibitions against short-selling exist in
nearly all African markets.
As is the case with fixed income markets, derivative
market activity can only be promoted with a carefully
planned strategy to remove the constraints and
deficiencies in the development of the markets for
the underlying securities. In addition, such planning
should include putting in place appropriate legal
frameworks and training of market participants.
IV. KEY ISSUES FOR IMPLEMENTING A SUCCESSFUL BOND MARKET IN AFRICA
The role and importance of the Bond Market
in economic growth and development is well
documented in the economic and financial literature
and from empirical evidence in developed and
developing countries. A combination of factors fuels
the development of efficient bond markets: a sound
macroeconomic framework, in which the bond market
provides interaction between suitable issuers of
securities and willing investors in an environment of
competent intermediaries, effective infrastructure, and
good flow of information facilitating this interaction.
Building a well-functioning bond market requires
attention to all these issues as discussed below.
Macroeconomic Stability
A sound and sustainable macroeconomic framework
is a prerequisite for the adequate development of
debt capital markets. To attract private long term
capital, fiscal and monetary disciplines, as well as
control of inflation are of essence. Until recently, many
African countries continued to experience high rates
of inflation. This phenomenon, coupled with adverse
socio-economic environments, makes investors
viii – Overview
– ix
in many countries favor short-term money market
instruments.
Issuer base
The government is usually the prime issuer in a
bond market. The existence of a Government yield
curve provides several benefits: first, it serves as a
reference for the pricing of non-government issues like
corporations, local authorities, financial institutions,
infrastructure projects; second, it has a decisive
impact on the efficient conduct of monetary policy
and affects the degree to which other segments of
the financial market (forward and futures markets
and other hedging instruments) can be developed to
facilitate risk management functions. A planned debt
issuance program will establish benchmark securities
consistently across the maturity spectrum and enable
sufficient planning and an orderly rebalancing of
portfolios by portfolio managers. Other issuers like
supranationals could also complement government
issuance program.
Investor base
An efficient bond market also needs a diversified
investor base, involving local and foreign participants
with a pool of investable funds. Typical institutional
investors comprise of pension funds, insurance
companies, assets management firms. These
investors have long term liabilities that need assets
to match asset and liability strategies. Care should
be taken to ensure that instrument limited mandates
or restrictive investment legislation do not curtail their
full participation in all segments of bond markets.
Intermediaries
Bond markets also need financial intermediaries and
inter-dealer broker network to support the market,
promote liquidity in the secondary market and develop
instruments that satisfy the needs of both issuers and
investors. The Government should also promote a
primary dealer system with adequate capitalization.
Dealing capacity also requires well-capitalized
dealers to underwrite bond issues and to deal in the
secondary market. This should be augmented with
appropriate dealer financing mechanisms such as
repurchase agreements. An efficient fixed income
market also relies on strong skills at the level of
issuers, dealers and traders. Financial expertise in
Africa has been lacking in this regard.
Infrastructure and Information
Adequate infrastructure, such as legal and regulatory
framework, market-wide trading and settlement
systems and securities depositories, is equally
important. The legal and regulatory framework will
facilitate the development and strengthening of the
market as well as provide investor’s protection.
Ratings
Debt markets fail to function adequately in an
environment in which credit risk cannot be assessed.
A complete credit rating framework should be
implemented.
Public awareness
Investor education and awareness is needed to create
a market for debt instruments. This can be done through
technical assistance, capacity building and financial
training to Central Banks, Financial Institutions and
other relevant organizations responsible for capital
market oversight and operations.
V. CONCLUSION
The compilation of this Guidebook was very
rewarding but challenging. It required several logistic
compromises, including settling for partially complete
statistical/economic data in some cases.
As a Multinational Development Bank, the African
Development Bank has been actively supporting the
development of bond markets in the region through
various means including loans especially for reforms of
financial sector, technical assistance to governments
and regulators, and bond issuance in various African
currencies.
While the recent thrust placed on developing bond
markets in the region is very encouraging, the process
Overview – ix
x – x – Overview
is somewhat challenging. It requires time, patience
and a great deal of support from the governments and
institutions involved in the process.
All stakeholders must l work together to achieve this,
because the strengthening of local bond markets is
about assisting the development of a vibrant private
sector that creates growth, jobs and opportunities,
and thus ultimately reduces poverty in Africa.
Thierry De Longuemar
Vice President, Finance
Stefan Nalletamby
Group Treasurer
The Bank stands ready to partner with our member
countries and the private sector to further develop
domestic bond markets in the region. We will pursue
our efforts to increase the awareness of African capital
markets in the rest of the world, and it is our hope
that this Guidebook, as a first of its kind in Africa, will
benefit all incumbent and potential participants in the
African Fixed Income Markets.

Acknowledgements
The African Development Bank wishes to thank the following individuals and financial institutions for their
contribution to country information in the production of the “African Fixed Income Guidebook”. Information for
the Guidebook has also been compiled from a variety of additional sources, including all the central banks of
the continent, and we acknowledge making use of economic and financial reports from the listed organizations
and sources.
Acknowledgements – xi
We would like to express our sincere appreciation and acknowledgement to the Bank’s management and
staff for their input in varying capacities. We are grateful to the AFDB’s Country Economists, Operations and
Finance Experts for their advice and reviews in putting this book together. In particular, we wish to thank the
dedicated team, the African Capital Markets Guidebook Working Group in the Treasury Department, Lydie
Boka Mene,Yusuf Hassan,Yaw Kuffour, Samuel Mivedor, Hassatou N’Sele and Adaobi Osakwe, who put in a
great deal of effort to ensure the successful completion of this guidebook.
JEFF GABLE, Emerging Europe, Middle East and Africa Strategist
(Botswana, Egypt, Ghana, Mauritius, South Africa, Tanzania)
KOCEILA MAAMES, Senior Market Economist, Africa and the Middle East
(Algeria, Comoros, Djibouti, Egypt, Libya, Madagascar, Morocco, Tunisia)
MAROUAN SELMI, Relationship Manager, Corporate & Investment Banking
(Algeria, CFA Zone (West Africa), Egypt, Kenya, Morocco, Nigeria, South Africa, Tanzania, Uganda)
HENRI FLINT, Africa Strategist: Global Markets Research
(Ghana, Nigeria, Zambia, Mauritius)
ADE ADEBAJO, Director, Africa Fixed Income
(Botswana, CFA zone (Central Africa), Gambia (The), Ghana, Kenya, Nigeria, Sierra Leone, Tanzania,
Uganda, Zambia, Zimbabwe)
• African Economic Outlook, AfDB/OECD, 2006
• Bloomberg
• Encyclopedia of the Nations (http://www.nationsencyclopedia.com/Africa/)
• First Initiative (http://www.firstinitiative.org/Projects/index.cfm )
• Fitch Ratings
• IMF Country Reports, Letters of Intent, Article IV Consultations (http://www.imf.org )
• Moody’s ratings
• Sound Practice in Government Debt Management, Graeme Wheeler, World Bank, 2004
• South Africa Financial Sector Forum
(http://www.finforum.co.za/financial_sector_africa_region.htm#country%20specifics )
• Standard Bank of South Africa – Economics Division
(http://www.ed.standardbank.co.za/srchResearch.asp )
• Economics Intelligence Unit (EIU)
xii – Acknowledgements

Country Guides
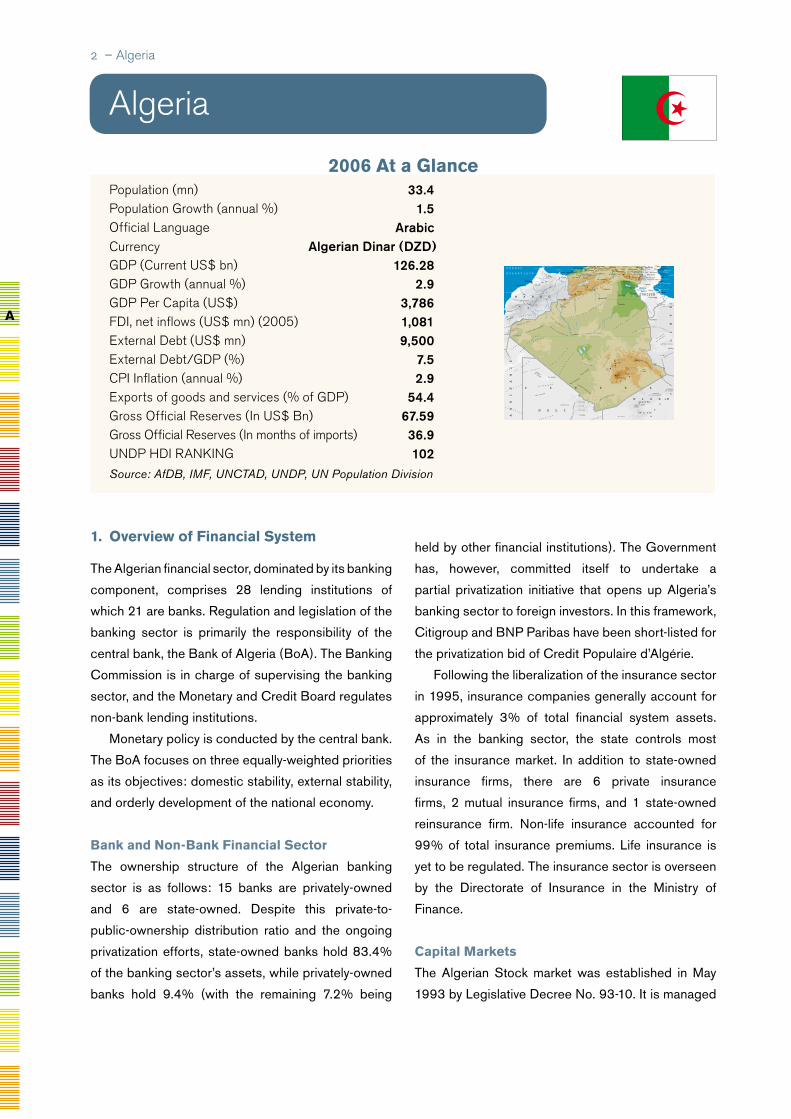
� – Algeria
Population (mn) 33.4Population Growth (annual %) 1.5Official Language ArabicCurrency Algerian Dinar (DZD)GDP (Current US$ bn) 126.28GDP Growth (annual %) 2.9GDP Per Capita (US$) 3,786FDI, net inflows (US$ mn) (2005) 1,081 External Debt (US$ mn) 9,500External Debt/GDP (%) 7.5CPI Inflation (annual %) 2.9Exports of goods and services (% of GDP) 54.4Gross Official Reserves (In US$ Bn) 67.59Gross Official Reserves (In months of imports) 36.9UNDP HDI RaNkING 102Source: AfDB, IMF, UNCTAD, UNDP, UN Population Division
1. overview of Financial system
The Algerian financial sector, dominated by its banking
component, comprises 28 lending institutions of
which 21 are banks. Regulation and legislation of the
banking sector is primarily the responsibility of the
central bank, the Bank of Algeria (BoA). The Banking
Commission is in charge of supervising the banking
sector, and the Monetary and Credit Board regulates
non-bank lending institutions.
Monetary policy is conducted by the central bank.
The BoA focuses on three equally-weighted priorities
as its objectives: domestic stability, external stability,
and orderly development of the national economy.
Bank and non-Bank Financial sector
The ownership structure of the Algerian banking
sector is as follows: 15 banks are privately-owned
and 6 are state-owned. Despite this private-to-
public-ownership distribution ratio and the ongoing
privatization efforts, state-owned banks hold 83.4%
of the banking sector’s assets, while privately-owned
banks hold 9.4% (with the remaining 7.2% being
held by other financial institutions). The Government
has, however, committed itself to undertake a
partial privatization initiative that opens up Algeria’s
banking sector to foreign investors. In this framework,
Citigroup and BNP Paribas have been short-listed for
the privatization bid of Credit Populaire d’Algérie.
Following the liberalization of the insurance sector
in 1995, insurance companies generally account for
approximately 3% of total financial system assets.
As in the banking sector, the state controls most
of the insurance market. In addition to state-owned
insurance firms, there are 6 private insurance
firms, 2 mutual insurance firms, and 1 state-owned
reinsurance firm. Non-life insurance accounted for
99% of total insurance premiums. Life insurance is
yet to be regulated. The insurance sector is overseen
by the Directorate of Insurance in the Ministry of
Finance.
Capital Markets
The Algerian Stock market was established in May
1993 by Legislative Decree No. 93-10. It is managed
algeria
A
GEOATLAS - Copyright1998 Graphi-Ogre0 km 100 200 300 400 km
Cap Beddouza
Cap SparterCap des�
Trois Fourches
Cap Falcon
Cap Bougar'oûn Cap de Fer
Cap Rosa Cap Bon
Ile de la Galite
Ile de Pantelleria�Italie
Ile de�Lampedusa�
Italie
Ile de Jerba
ILES KERKENNA
Rass Kaboudia
Rass Ben SekaaGolfe de�Tunis
Golfe de�Hammamet
Golfe de�Gabès
Détroit de Gibraltar
O C E A N �
A T L A N T I Q U E
M E R M E D I T E R R A N E E
Touggourt
Boufarik
Aïn El Beïda
Sidi Bou ZidKasserine
Kairouan
Zaghouan
SilianaEl Kef
JendoubaBéja
Bizerte
Nabeul
SousseMonastir
Mahdia
Sfax
Ben Arous
Ariana
Gafsa
Tozeur
KebiliGabès
Médenine
Tataouine
BouïraEch Cheliff GuelmaStif
M'sila��
Lemdiyya
Tissemsilt
Ilizi
Tindouf
Tihert
NaamaEl Beyyadh
Ghardaïa
Laghouat
Wargla
El Wad��
El Djelfa�� Beskra�
�
Bordj�Bou Arreridj��
Batna
KhenchlaTbessa
Oum El�Bouagui
Souq AhrasMila
Qacentina
El TarfAnnabaSkikda
JijelBejaïa
Tizi-Ouzou
Boumerdès
Aïn Defla
El Boulaida
Tipaza
GhilizaneAïn Témouchent
Mestghanem
Mouaskar Sidi Bel Abbès
Wahran��
Tilimsen Saïda
Béchar
Adrar
Tamenghest
Casablanca
Fès
Meknès
Marrakech
Oujda
Agadir
Kidal
J$dºN$lºt
Ghad$mis
Gh$t
Awb$r=
Tunis
El Djazaïr�Alger
Rabat
OuedMia
O ued cheliff
O.e
lK
orima
Oued
enNam
ous
OuedMoulouya
Oue
d Za
OuedG
uir
O u
ed
Z ousfa
na
Ou
edSao
ura
O.Dadès
Oued
D râa
O uedDrâa
O uedSous
O ued Tensift
O.Ou
mer
Rbia
O. G
rou
O ued
S
ebou
J. Tidirhine�2456 m
Irhil M'goun�4071 m
J. Toubkal�4165 m
Djebel Aïssa�2235 m
1989 m
Djebel Ksel�2008 m
Djebel Refaa�2170 m
2328 m
2154 m Azao�2158 m
Djebel Telertheba�2420 m
Djebel Serkout�2252 m
Tahat�2908 m
Taourirt�2050 m
2355 m
Aheggar�2305 m
Garet el Djenoun�2327 m
1712 m Jebel Chambi�1544 m
945 m
40 m23 m
Bagzane�2022 m
Gréboun�1944 m
Djebel Antar�1960 m
T A M E SN A
A D R A R �
D E S �
I F Ô G H A S
VALLEE
DU
TILEM
S
T I M E T R I N E
A Z A OU
ÂD
ERG A TO U ILA
E L K N Â C H Î C H
¡AMÂDA�EL ¡ARICHA EL MAHIA
EL
HA
N
K
E LM R E Y
YE
IJ
ÂF
EN
E
TIGUES
MAT
Y
ET
TI
KÂ
GH
E–
H A M A D A �
D E T I N D O U F
HAMADA
DU DR
A'AA N
TI-ATLA J B E L B A N
H AU
T
AT
LA S
MOY E
NA T
LAS
HAMMADADUGUIR
RI F
HA
UT S
P L A T E A U X
M tsD E
SK S
O U R
D JEBELA M
O UR M ts D
ESO U
LAD N A
ÏL
A T L A S T E L L I E N
Corniche
sdesDahra
A TLA S TELLIEN
M fD E L'A U RES Mts DES�NEMENTCHA
AT
LA
S
SA
HA
RI
EN
GR
AN
D
ER
G
OR
IE
NT
AL
P LA T E
A UD U T IN
G H E R T
P L A T E A U D U T A D E M A ÏT
T I D I K E L T
G R A N DE
RG
OC
CID
EN
TA
'ERG
ER
RAOUIK
AHAL
T A B E L B A L A
H A M A D A TO U N A S SIN
E
MC
H E R R A H
'E
R
G
IG
U
ÎD
I
E R GC H E C H
ER
G
C
HE
C
H
'ERG A Z
ENN EZ A
L
'ERG N -
A TA RA M
AS E D J R A D
MOUYDIR
T A S S I L I - N-
AJ
JER
TA
NE
ZR
O
U
FT
TA N N EZRO U FTN -A HN ET
TASS
ILID U
HO G G A R
ERG�D'ADMER
H O GG
A
JEFFARA
RMEL
EL
ABIO
D
P L A T E A U D UT IN G H E R T
JEFFARA
MESACH
MELLET
D ES E
R T�
D E O
U BA R
I
¡AM*DAT ZEGHER
PLA TEAUDE
M ARZ ª
Q
JA B A L N A F ª S A H
PLATEA
UD U
MA N G U ÉN I
PLATEAU�DU DJADO
TENERE�DU TAFASSÂSSET
T
E
N
E
R
E
MONTS�TAMGAK
T A L A K
M A S S I F �
D E L ' A Ï R
S A H A R A
M A L I
MA
UR
IT
AN
IE
LI
BY
E
M A R O C
PENINSULE IBERIQUE�Europe
TUNISIE
N I G E R
ALGERIE
2006 At a Glance
Algeria – �
by the Société de Gestion de la Bourse des Valeurs
(SGBV) and is supervised by the Stock Exchange
and Surveillance Commission. Two companies are
currently listed on the Exchange, trading on which
is virtually non-existent, despite the independent
authority of the Surveillance Commission to develop
the market, including the licensing of brokers and the
creation of a central depository.
The bond market is regulated by the Commission
d’Organisation et de Surveillance des Opérations de
Bourse (COSOB), which sets the operating rules
of the Stock Exchange. The regulatory framework
was put in place by COSOB in the early ‘90s and
is regularly updated. The role of the COSOB is
supervisory in nature. It focuses on the protection
of public savings invested in securities, market
surveillance, and transparency. Any entity planning
to raise funds through the Stock Exchange needs to
comply with the regulations of the Algerian “Code de
Commerce”.
Primary and secondary market transactions are
conducted by 13 authorized Spécialistes en Valeur de
Trésor (SVT). As of 2005, corporate bond issuance
represented about 33% of the total Algerian bond
market.
2. Fixed income Markets
Government securities
In October 1995, the Algerian Treasury created a
primary market for government securities. The local
commercial banks and insurance companies were
authorized to participate in this market. The first
operations were launched through monthly auctions
under the supervision of the BoA. The securities
issued were short-term bills and long-term treasury
bonds. SVT’s are the primary dealers. Unlike
corporate bonds, government bonds are not listed on
the Algerian Stock Exchange.
Domestic debt instruments mainly include treasury
bills and bonds (82% of outstanding government debt)
issued with maturities ranging from 3- to 6-months
(Bons du Trésor Cessibles), while bonds (Bons
du Trésor Assimilables) are issued with maturities
of 1, 2 ,3, 5, 7, 10, and 15 years maturities. Other
government-issued instruments are Caisse Nationale
des Retraites (CNR) bonds and Caisse Nationale
d’Assurance Sociale (CNAS) bonds. Issuance of
these securities, organized regularly by the Treasury,
is done through Dutch auctions. The current size of
the Treasury market is USD 4.2 bn.
non-Central Government issuance
Until 2003, Sonatrach, the national oil company,
used to be the only corporate issuer in the domestic
bond market. Since then, nine corporate bonds have
been issued by seven public companies. In 2004,
several other state-owned enterprises issued debt.
Among these were Air Algérie (close to DZD 30 bn
issued with coupons ranging between 2.3% and
6% for maturities between 1 and 6 years), Sonélgaz
(DZD 10 bn issued in May 2005, paying a coupon
of 3.5% for 7-year maturity), and Algérie Telecom
(two tranches totaling DZD 6.5 bn, with a coupon
of 2.75% for 2-year and 3% for 3-year maturity).
Most of these issues have been managed by either
Banque Nationale d’Algérie or Banque Extérieure
d’Algérie.
In January 2006, Cevital, a family-owned agro-
food group, became the first private company to
access the domestic bond market, raising DZD 90
bn (two tranches paying a coupon of 3.75% for 5-
year maturity and 4% for 6-year maturity).
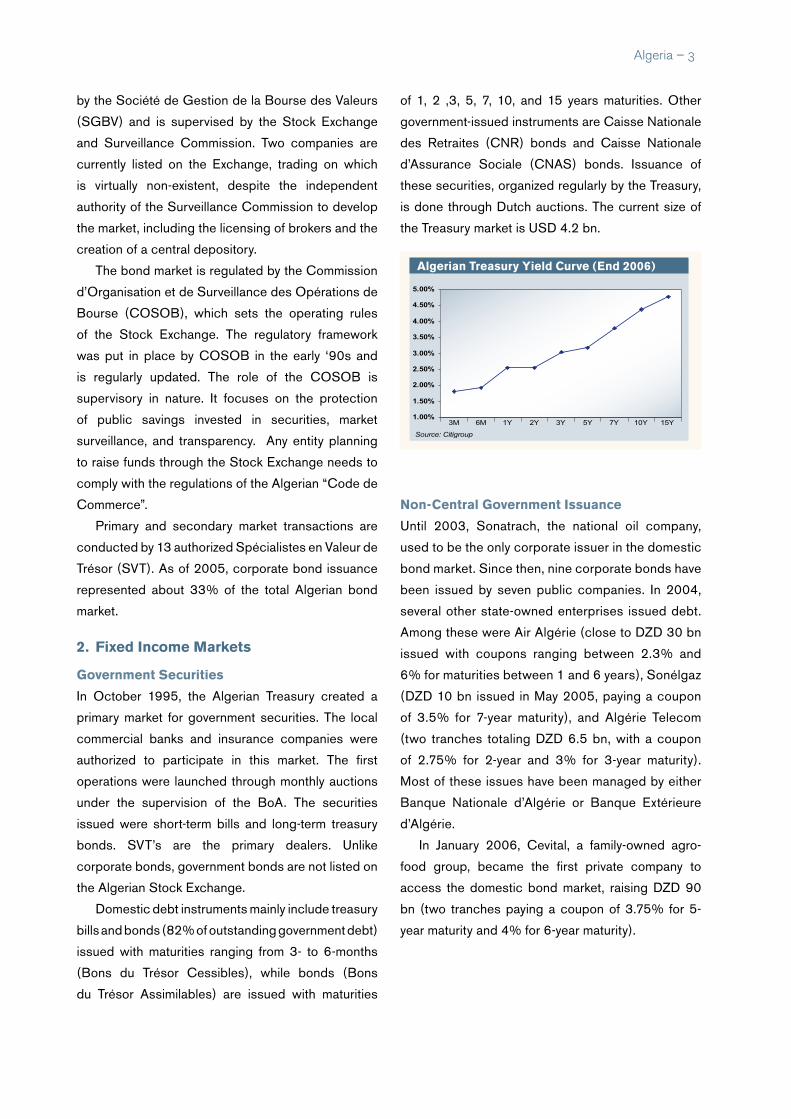
Algerian treasury yield Curve (end 2006)
1.00%
Source: Citigroup
1.50%
2.00%
2.50%
3.00%
3.50%
4.00%
4.50%
5.00%
3M 6M 1Y 2Y 3Y 5Y 7Y 10Y 15Y

� – Algeria
A
secondary Market
A secondary market for government securities
was created in March 1998, when ten SVTs were
authorized to conduct transactions in the primary
and secondary markets. Secondary market trading
of corporate bonds is carried out over-the-counter.
Secondary market liquidity is relatively low.
Clearing and settlement
In 2004, Algérie Clearing, a joint stock company,
was officially established as the central depository
for all securities in Algeria. Algérie Clearing monitors
a computerized settlement and delivery system. The
day count is 360 for treasury bills and 365 for bonds.
Settlement is T+2.
3. Foreign exchange
Officially, the Algerian Dinar (DZD) exchange rate follows
a managed floating regime, based on a composite of
currencies, believed to be based on Algerian Direction
of Trade (DOT). Historically, it reached a high at DZD
57.7 / 1 USD in 2002, but weakened to DZD 77.40
Company tranche tenor (yrs) Amount Coupon (%) yield (%)SRH 1 3 19.5 4 3.72
2 5 16 4.5 4.16SONATRACH 5 70 4 2.99Air Algerie 1 2.5 25 3 2.07
2 5 37 3.75 2.36Air Algerie 1 3 106 3 1.48
2 5 45 3.75 2.26
Air Algerie 6 200
3.75 (2005–2006)
4.5 (2007-2008)
6 (2009-010)
4.75
Air Algerie 6 173 4 4.211 5 113 3 2.4
Sonalgaz 2 6 56 3.25 2.453 7 113 3.5 2.86
ENTP 5 71 2.75 2.28Algerie Telecom Spa 1 2 47 2.75 2.79
2 3 44 3 3.09ENAFOR 1 5 57 3 2.98
2 6 55 3.5 3.48Cevital 1 5 41 3.75 3.67
2 6 29 4 3.8Sonelgaz 1 9 84.5 4.65 4.65
2 11 79.5 4.85 4.85ALC 1 5 36 3.85 3.9
2 6 15 4 4
Algerie Telecom Spa 5 282
4 –Year 1
4 – Year 2
4.5 – Year 3
4.5 – Year 4
7.9 – Year 5
4.81
some recent Algerian Corporate Bond offerings (2005 to date)
dZd Per unit of usd (year end)
50
60
70
80
2000 2001 2002 2003 2004 2005 2006
Source: Bloomberg
Algeria – �
/ 1 USD in 2003. However, the DZD has since been
steadily appreciating. As at end-2006, it reached DZD
70.11 / 1 USD. The DZD is not fully convertible.
4. Participation of Foreign investors and issuers
Only domestic financial institutions (banks and
insurance companies) are allowed to bid for
government debt instruments. By regulation, the bond
market is not accessible to foreign investors.
5. investment taxation
Income from government securities is subject to
a 10% withholding tax. For treasury bills, the 10%
flat tax is withheld on maturity date while for coupon-
paying bonds the tax is paid on the date of the coupon
payment. Five-year government bonds and held-to-
maturity corporate bonds are tax-exempt.
6. Key Contacts
• Banque Centrale d’Algérie
38, Avénue Franklin Roosevelt,
Villa Jolie Algiers, Algeria
Tel: +213-21-692222
Fax: +213-21-692200
E-mail: [email protected]
Web: www.bank-of-algeria.dz
• Commision d’Organisation et de Surveillance
des Operations de Bourse (COSOB)
17 Campagne CHKIKEN, 16045,
Bal d’Hydra, Alger, Algeria
Tel: +213-21-591015
Fax: +213-21-591019
E-mail : [email protected]
Web: www.cosob.com.dz
• Bourse d’Alger, Algiers Stock Exchange
27, Bd Colonel Amirouche, Algeria
Tel: +213-21-429686
Fax: +213-21-429685
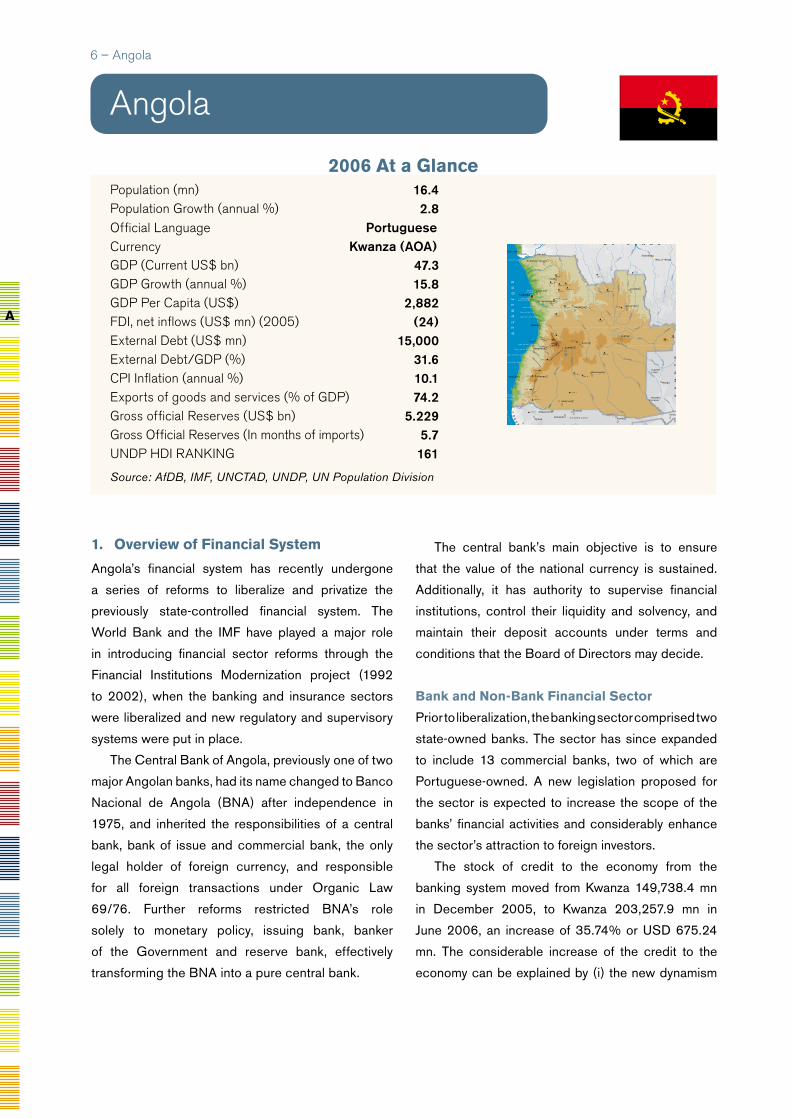
Population (mn) 16.4Population Growth (annual %) 2.8Official Language PortugueseCurrency Kwanza (AOA)GDP (Current US$ bn) 47.3GDP Growth (annual %) 15.8GDP Per Capita (US$) 2,882FDI, net inflows (US$ mn) (2005) (24) External Debt (US$ mn) 15,000External Debt/GDP (%) 31.6CPI Inflation (annual %) 10.1Exports of goods and services (% of GDP) 74.2Gross official Reserves (US$ bn) 5.229Gross Official Reserves (In months of imports) 5.7UNDP HDI RaNkING 161
Source: AfDB, IMF, UNCTAD, UNDP, UN Population Division
1. overview of Financial system
Angola’s financial system has recently undergone
a series of reforms to liberalize and privatize the
previously state-controlled financial system. The
World Bank and the IMF have played a major role
in introducing financial sector reforms through the
Financial Institutions Modernization project (1992
to 2002), when the banking and insurance sectors
were liberalized and new regulatory and supervisory
systems were put in place.
The Central Bank of Angola, previously one of two
major Angolan banks, had its name changed to Banco
Nacional de Angola (BNA) after independence in
1975, and inherited the responsibilities of a central
bank, bank of issue and commercial bank, the only
legal holder of foreign currency, and responsible
for all foreign transactions under Organic Law
69/76. Further reforms restricted BNA’s role
solely to monetary policy, issuing bank, banker
of the Government and reserve bank, effectively
transforming the BNA into a pure central bank.
The central bank’s main objective is to ensure
that the value of the national currency is sustained.
Additionally, it has authority to supervise financial
institutions, control their liquidity and solvency, and
maintain their deposit accounts under terms and
conditions that the Board of Directors may decide.
Bank and non-Bank Financial sector
Prior to liberalization, the banking sector comprised two
state-owned banks. The sector has since expanded
to include 13 commercial banks, two of which are
Portuguese-owned. A new legislation proposed for
the sector is expected to increase the scope of the
banks’ financial activities and considerably enhance
the sector’s attraction to foreign investors.
The stock of credit to the economy from the
banking system moved from Kwanza 149,738.4 mn
in December 2005, to Kwanza 203,257.9 mn in
June 2006, an increase of 35.74% or USD 675.24
mn. The considerable increase of the credit to the
economy can be explained by (i) the new dynamism
angola
GEOATLAS - Copyright1998 Graphi-Ogre0 km 100 200 300 400 km
OC
EA
N�
AT
LA
NT
IQ
UE
Ponta do Padrão
Ponta das�Palmeirinhas
Cabo Lêdo
Cabo de São Braz
Cabo de São José
Cabo de Santa Maria
Cabo de Santa Marta
Ponta da Marca
Cap Fria
Ponta das Salinas
Cabo das três Pontas
Baía�do Bengo
Baía�dos Tigres
SK
EL
ETO
N
CO
AS
T
Kinkala
Djambala
Sibiti
MadingouDolisie
Pointe-Noire
Franceville
Mouila
Tchibanga
Kananga
Mbuji-Mayi
Mongu
Lubango��
Cabinda
M'banza Congo��
Uíge��
Lucapa��Caxito�
�
N'dalatando��
Malanje��
Saurimo��
Sumbe��
Huambo��
Kuito��
Luena��
Menongue��
Ondjiva��
Benguela��
Namibe��
Rundu��
Enana��
Oshakati
Ombalantu
Tsumeb
Otjiwarongo
Opuwa
Katima Mulilo��
Kasane
Maun
Bandundu
Matadi
Brazzaville
Kinshasa
Luanda
Boma
Lobito
N yang
a
K ouilou
N iari
Kw a
Fim i
LukenieKasai
Lui
Wam
ba
Ua
mba
Kweng
e
Kwilu
Cuilo
Loange
Luangue
Kasai
Cass
ai
Cassai
Lulua
Lulua
Sankuru Lubefu
Luilu
Lubilash
Lukenie
Léfini
Alim
a
Tshuapa
Lom
ela
Mom
boyo
Z
am bèze
Zam
bèze
Z am b
èz
e
Luena
Lungué-Bungo
Lungwe
bungu
Luanguinga
Lu
anginga
Kw
ando
Kwando
Cuando
Cuito
Cuito
O kavango
Cubang
o
C ubango
Cubango
Kune ne
Cunene
Cunene
Coroca
C apo
rolo
C ubal
Catum bela
Cuvo
Cuanza
Cuanza
Lucala
M 'Bridg e
Inkisi
Chica
pa
Chium
be
C uango
Cuango
CuangoLokoro
Z aïre
Zaïre
�Lac�
Mai-Ndombe
Etosha Pan
1265 m
1260 m1325 m
1250 m1244 m
1725m
1450m
1612 m
1450 m
1554 m
1610 m
1490 m
1852 m
Serra�de Môco�2620 m
2555 m
2478 m
2275 m
1780 m
1637 m
1700 m
1375 m
1340 m
2340 m
2090 m
972 m
1333 m
1451 m
1375 m
1383 m
1478 m
1285 m
798 m
857m
DEPRESSION�
DE MABABEDELTA DE�
L'OKAVANGO
D E S E R T �D U �
K A L A H A R I
COLLINES�TSODILO
DESERT
DU
NAMIB
O V A M B O L A N D
K A UK A U
V EL D
KAOKO VELD
SERRADACHELA
SERRADA
NEVE
SERRADO
CHILEN G
U E
SERRADOHUMBE
SERRA�CAMBONDA
PLAINE�LIUWA
PLAINES�SILOWANA
PLATEAUX
B AT E K
E
MAYOMBE
N A M I B I E B O T S W A N A
ZA
MB
IE
ANGOLA
R E P U B L I Q U E �
D E M O C R A T I Q U E �
D U C O N G O
C O N G O
G A B O N
A
� – Angola
2006 At a Glance

that liberalization has created in the sector, and (ii)
emerging confidence of the banking institutions in the
broader economy.
The insurance sector has also received extensive
assistance from the World Bank. A new insurance
agency, the AAA Financial Services, was created in
2003. The state-owned ENSA was restructured into
three firms in the same year; a holding company, an
insurance company (SARL), and a reinsurance firm
(Ango-Re). The insurance system is supervised by
the Insurance Supervision Institute, which is located
in the Ministry of Finance.
Angola is now viewed as a prime emerging African
market on the continent, resulting in heightened
interest from foreign banks aiming to enter the
Angolan markets. Several Portuguese and South
African banks are opening new branches in Angola.
As of June 2005, total assets of the banking sector
reached USD 4.6 bn (USD 3 bn in deposits), up from
USD 3.5 bn in 2004.
Capital Markets
There is presently no stock exchange in Angola.
However, a Financial Markets Law has been passed
which envisages the early establishment of the
Angolan Stock Exchange (Bolsa de Valores). The
exchange, once it has opened, is expected to generate
about USD 1 bn in tax revenue per year and would
commence with an initial offering of ten companies
with a combined market capitalization around USD
5.5 bn. When operational, foreign and local investors
will have equal access to the listed shares.
2. Fixed income Markets
Government securities
The central bank has developed a market for short-
term bonds, called Titulos do Banco Central (TBC),
with maturities ranging from 91 to 182 days. It has also
developed a market for long-term bonds (Obrigacoes
do Tesour) that have a maturity range from 1 to 7.5
years. In December 2002, to effectively influence
money supply and finance the budget deficit, the
Government of Angola approved the issuance of
the TBC by the Ministry of Finance. It earmarked
USD 1 bn for bonds to pay its debt to private local
companies, some of which have been able to sell the
bonds directly to local banks or use them as collateral
for credit. The size of TBC issues range between AOA
100,000 and AOA 50 mn and are issued weekly.
The nominal yields on the short-maturity TBCs
declined during the first semester of 2005, from
46.44% in December of 2004 to 32.03% in June
2005.
secondary Market
Most of the government bonds are bought and
held by local banks in Angola, and as a result it has
hindered the development of an active secondary
bond market.
3. Foreign exchange
The Angolan Kwanza (AOA) is a managed floating
currency. Since September 1990, the AOA has
experienced a series of foreign exchange policy
changes, including devaluation in 1996 and the fixing
of the official rate to the USD. Since June 1998, the
AOA official exchange rate has followed a crawling
peg regime with a rate determined on a weekly
basis, without pre-commitment to any specifically
announced path.
In 2003, the central bank implemented an
exchange rate stabilization program using foreign
exchange reserves to buy Kwanza out of circulation.
Since then, the Kwanza has been remarkably stable,
averaging AOA 83.72 / 1 USD in 2004 and AOA 87.1
/ 1 USD in 2005. For most of 2006, the currency
traded within a narrow range of AOA 83.39 / 1 USD
and AOA 80.36 / 1 USD. This is largely due to the
government’s policy of intervention aided by the
recent surge in export earnings as a result of high oil
prices.
The foreign exchange market is driven largely by
the inter-bank market whose participants are the banks
and the central bank. The central bank publishes a
daily reference rate, for accounting and statistical
purposes, computed as a weighted average rate
of the rates dealt with by the banks during the day.
Banks are authorized to deal among themselves and
Angola – �

with their customers at freely negotiated rates.
The central bank nominates currency dealers who
are authorized to buy and sell foreign currency.
4. Participation of Foreign investors and issuers
Capital and money market transactions, capital
repatriation and personal capital movements
are subject to strict controls. Very often, these
transactions require approval and/or licensing by the
central bank.
It is, however, envisioned that the creation of a
stock exchange in the near future will grant foreign
investors equal access to listed securities.
Currently, dividends earned in Angola can only
be remitted abroad by foreign investors if the amount
of investment in the Angolan host company exceeds
USD 250,000.
5. investment taxation
Capital gains and personal income tax rates are 35%
and 15%, respectively.
6. Key Contacts
• Banco Nacional de Angola
151, Av. 4 de Fevereiro, No. 151, Luanda, Angola
Tel: +244-222-399125
Fax: +244-222-390579, 394986
Web: www.bna.ao
� – Angola
B
AoA Per unit of usd (year end)
0
20
40
60
80
100
2001 2002 2003 2004 2005 2006
Source: Bloomberg

Population (mn) 8.7Population Growth (annual %) 3.1Official Language FrenchCurrency CFA France (XOF)
GDP (Current US$ bn) 4.7GDP Growth (annual %) 4.5GDP Per Capita (US$) 538FDI, net inflows (US$ mn) (2005) 21 External Debt (US$ mn) 1,074External Debt/GDP (%) 22.9CPI Inflation (annual %) 2.4Exports of goods and services (% of GDP) 18.5Gross official reserves (US $ bn) 0.8Gross official reserves (in months of imports) 9.0UNDP HDI RaNkING 163Source: AfDB, IMF, UNCTAD, UNDP, UN Population Division
1. overview of Financial system
Benin is a member of the West African Economic
and Monetary Union (UEMOA) established in
January 1994, and comprising eight West African
countries (Benin, Burkina Faso, Côte d’Ivoire, Mali,
Niger, Senegal, Togo, and Guinea Bissau) which are
members of the Franc Zone and use the CFA Franc
(XOF) issued by the Central Bank (BCEAO). The
UEMOA financial markets are administered through
the following institutions:
• The Conference of Heads of State, which decides
on the accession of new members.
• The Council of Ministers, which defines, among
others, the monetary and credit policy of the Union
to safeguard the value of the CFA Franc.
• The UEMOA Commission, as delegated by the
Council of Ministers, is in charge of the day-to-day
administration of the Union.
• The Central Bank of West African States (BCEAO)
is the central bank and controls the Banking
Benin
sovereign ratingsLongterm
Local Currency
Foreign Currency
s&P B B
Fitch B B
Commission (Commission Bancaire) responsible
for overseeing and supervising banks and financial
institutions. The BCEAO also controls the
Savings and Financial Markets Regional Council
(CREPMF). The capital of BCEAO, currently
called up in the amount of XOF 134 bn, is entirely
subscribed by the member States and shared
equally among them.
• Micro-finance institutions are governed by a
separate law, the PARMEC (Projet d’Appui à
la Réglementation des Mutuelles d’Epargne et
de Crédit) Law, which regulates micro-finance
activities in all WAEMU countries.
Benin is also a signatory to the OHADA Treaty,
which harmonizes business law in 16 countries in Sub-
Sahara Africa, including all the UEMOA countries.
The main objective of the monetary policy as
defined by the UEMOA and implemented by the
BCEAO, is to ensure price stability and safeguard the
GEOATLAS - Copyright1998 Graphi-Ogre0 km 100 200 300 400 km
São Tomé
Príncipe
Ile de BioGuinée Equatoria
Cap St-Paul
Cap des�Trois Pointes
BOUCH
ESD U N IG ER
CO TE D ES ESCLA V ES
COTE
D EL'O R
G O L F E D E G U I N E E
B A I E D U B E N I N
O C E A N �
A T L A N T I Q U E �
�
BouakéBondoukou
Divo
DimbokroAbengourou
Agboville
Aboisso
Atakpamé
Sokodé
Lama-Kara
DapangoBolgatanga
Tamale
Sunyani
Kumasi
Sekondi-TakoradiCape Coast
Koforidua
Ho
Umuahia
AsabaEnugu
Lokoja
Benin City��
Kano
Katsina
Birnin Kebbi
Kaduna
Sokoto
Minna
Makurdi
Llorin
Oshogbo
IbadanAbeokuta
Lagos
Akure
Awka
Owerri
Port HarcourtUyo
Calabar
Parakou
Natitingou
Abomey
Cotonou
Lokossa
Maradi
Dosso
Bobo Dioulasso
OuahigouyaDori
DiapagaFada�NgourmaKoudougou
São Tomé
Yamoussoukro
Abidjan
Lomé
Malabo
Abuja
Accra
Porto Novo
Niamey
Ouagadougou
Ba nd
ama
Nzi
Nzi
Kom
oé
KomoéLéra
ba
Bia
Tano
Pra
Benue
Dak
a
Oti
Oti
Mékrou
Alibori
Mono
Ouém
é Niger
Kaduna
Ka
duna
M ariga
Sokoto
Sokoto
G agere
M
ad
a
Rima
Maradi
Lac Volta
Volta
Noire
Volta B lanch e
Niger
Lac�Kainji
Pico de São Tomé�2024 m
549 m
641 m
844 m
Mont Agou�986 m
Afadjoto 885 m
863 m
Djébobo�876 m
Akwawa�788 m
Kwamisa�767 m
Pico de Santa Isabel�3008 m
COLLINES�OBAN
PLATEAU�JOS
CHAINEDEL'ATACORA
Mts KOUFFÉ
PLA TEA U KW A HU
CHAIN
EAKW
APIN
S A O T O M E - �E T - P R I N C I P E
N I G E R I A
G H A N AC O T E �
D ' I V O I R E
M A L I N I G E R
B U R K I N A F A S O
TOGO
B E N I N
Benin – �
2006 At a Glance
domestic and foreign value of the CFA Franc through
appropriate coverage of currency issue by foreign
exchange reserves.
Bank and non-Bank Financial sector
As of December 2006, there were 93 banks and 22
financial institutions operating in the UEMOA zone,
with 12 banks and two financial institutions located
in Benin. The total balance sheets of the financial
system in Benin amounted to XOF 724 bn at the end of
2005, with the banks accounting for more than 99%,
representing 34% of GDP. The resources of banks
and financial institutions amount to XOF 650 bn,
including XOF 61 bn as net equity capital. Branches
and subsidiaries of foreign or regional banks play a
relatively important role in financial intermediation in
UEMOA. In fact, eight groups (including Société
Générale, BNP Paribas, Crédit Lyonnais, Citibank,
Bank of Africa, Ecobank, and Financial B.C.)
dominate the UEMOA banking system with relatively
wide national networks.
The insurance sector in Benin is regulated and
supervised by the Inter-African Conference of
Insurance Markets (CIMA) established on 10 July
1992 in Yaounde (Republic of Cameroon). It includes
the following countries: Benin, Burkina Faso,
Cameroon, Central African Republic, the Comoros,
Côte d’lvoire, Gabon, Equatorial Guinea, Guinea
Bissau, Mali, Niger, Senegal, Chad and Togo. The
CIMA Treaty came into effect on 15 February 1995.
The regulatory body of the CIMA is the Regional
Commission of Insurance Control (CRCA), whereas
the Council of Ministers is its highest body. The total
portfolio of the UEMOA CIMA zone is dominated by
the sector of non-life insurance. Compared to GDP of
2005, the turnover of the insurance sector in Benin
represents 0.9%, well below the average ratio in
Africa of 4.8%. At the end of 2005, five life insurance
and five non-life insurance companies were operating
in the country, with a total turnover of XOF 20 bn;
life insurance products represented 20% and vehicle
insurance 60% of the turnover.
The micro-finance sector in Benin has more than 85
micro-finance programmes or networks, represented
by over 600 retail micro-finance institutions including
savings and loan associations or credit unions.
Capital Markets
The Regional Stock Exchange (BRVM), the stock
market for the UEMOA region, started operating in
September 1998. It is located in Abidjan and has
a branch in each capital city of the other member
States of the Union. Its main role is to pool and
process stock market orders transmitted by brokerage
companies (Société de Gestion et d’Intermédiation-
SGI) authorized to negotiate securities quoted on
the BRVM. As of December 2006, 19 SGIs were
registered in the Union with three located in Benin.
The BRVM is regulated by the CREPMF whose
responsibilities include the promulgation of policies
and procedures to regulate the BRVM, and the
promotion of a regional bond market. In order to list on
the BRVM, all bond issues must be guaranteed by an
approved financial institution, a development financial
institution, a guarantee fund, or the Parent Company.
At the end of December 2006, the capitalization of
the equity market was XOF 2067 bn whereas the
bond market capitalization stood at XOF 489 bn, with
XOF 260 bn being government bonds, representing
1.07% of the GDP of the Union. By end-December
2006, 61 securities were listed, including 40 shares
and 21 bonds, compared to 57 securities comprising
39 shares and 18 bonds by end-December 2005.
Bank of Africa Benin (BOAB) is the sole company of
Benin listed on the stock exchange as at December
2006.
2. Fixed income Markets
The benchmark issuer in the UEMOA zone is the
West African Development Bank (BOAD), a regional
multilateral bank. Since 1999, BOAD accounts for
close to 22% of all the public debt issues in the market,
i.e. XOF 102 bn. In the absence of a government yield
curve, BOAD bonds are used as benchmarks.
B
10 – Benin
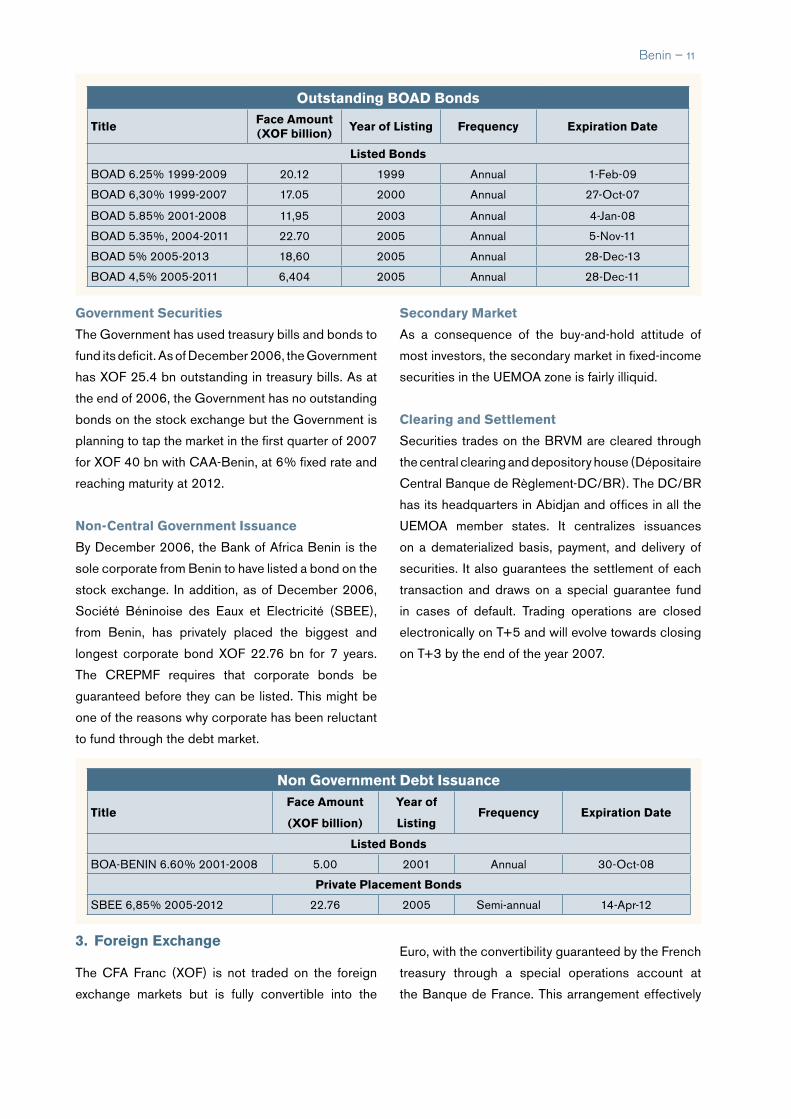
Government securities
The Government has used treasury bills and bonds to
fund its deficit. As of December 2006, the Government
has XOF 25.4 bn outstanding in treasury bills. As at
the end of 2006, the Government has no outstanding
bonds on the stock exchange but the Government is
planning to tap the market in the first quarter of 2007
for XOF 40 bn with CAA-Benin, at 6% fixed rate and
reaching maturity at 2012.
non-Central Government issuance
By December 2006, the Bank of Africa Benin is the
sole corporate from Benin to have listed a bond on the
stock exchange. In addition, as of December 2006,
Société Béninoise des Eaux et Electricité (SBEE),
from Benin, has privately placed the biggest and
longest corporate bond XOF 22.76 bn for 7 years.
The CREPMF requires that corporate bonds be
guaranteed before they can be listed. This might be
one of the reasons why corporate has been reluctant
to fund through the debt market.
secondary Market
As a consequence of the buy-and-hold attitude of
most investors, the secondary market in fixed-income
securities in the UEMOA zone is fairly illiquid.
Clearing and settlement
Securities trades on the BRVM are cleared through
the central clearing and depository house (Dépositaire
Central Banque de Règlement-DC/BR). The DC/BR
has its headquarters in Abidjan and offices in all the
UEMOA member states. It centralizes issuances
on a dematerialized basis, payment, and delivery of
securities. It also guarantees the settlement of each
transaction and draws on a special guarantee fund
in cases of default. Trading operations are closed
electronically on T+5 and will evolve towards closing
on T+3 by the end of the year 2007.
outstanding BoAd Bonds
titleFace Amount (XoF billion)
year of Listing Frequency expiration date
Listed Bonds
BOAD 6.25% 1999-2009 20.12 1999 Annual 1-Feb-09
BOAD 6,30% 1999-2007 17.05 2000 Annual 27-Oct-07
BOAD 5.85% 2001-2008 11,95 2003 Annual 4-Jan-08
BOAD 5.35%, 2004-2011 22.70 2005 Annual 5-Nov-11
BOAD 5% 2005-2013 18,60 2005 Annual 28-Dec-13
BOAD 4,5% 2005-2011 6,404 2005 Annual 28-Dec-11
non Government debt issuance
titleFace Amount
(XoF billion)
year of
ListingFrequency expiration date
Listed Bonds
BOA-BENIN 6.60% 2001-2008 5.00 2001 Annual 30-Oct-08
Private Placement Bonds
SBEE 6,85% 2005-2012 22.76 2005 Semi-annual 14-Apr-12
Benin – 11
3. Foreign exchange
The CFA Franc (XOF) is not traded on the foreign
exchange markets but is fully convertible into the
Euro, with the convertibility guaranteed by the French
treasury through a special operations account at
the Banque de France. This arrangement effectively

offers practically unlimited overdraft facilities and
allows the CFA states to avoid short-run balance
of payments constraints. In return, the BCEAO is
required to deposit 65% of its foreign exchange
reserves at the central bank of France. Buying and
selling rates of Euro are fixed at XOF 655.957/ 1 EUR,
and the rates of other currencies are determined on
the basis of the Euro rate on the foreign exchange
market. Payments and transfers of capital within the
UEMOA zone and France are unrestricted as are
current account transactions. The main restrictions
concern the outflow of capital to countries outside
the WAEMU, which is subject to verification based
on the submission of supporting documentation.
4. derivatives
The derivative market is in its infancy. Foreign
exchange forwards exist with moderate liquidity and
tenors extending up to 3-6 months.
5. Participation of Foreign investors and issuers
The banking sector has a high level of foreign
ownership, particularly by French financial institutions.
XoF per unit of usd (year end)
450
500
550
600
650
700
750
800
2000 2001 2002 2003 2004 2005 2006
Source: Bloomberg
Foreign investors can purchase securities listed
on BRVM. For instance, an international non-
governmental organization, Shelter Afrique, based in
Nairobi (Kenya), has issued bonds and listed them on
the BRVM.
6. investment taxation
Government securities are tax-exempt as opposed
to non-governmental securities that are subject to a
withholding tax (Impôt sur le Revenue des Valeurs
Mobilières-IRVM) applicable to income derived from
these securities. The tax rates are the following:
6% for interest income from bonds redeemable in
less than five years, 10% for dividends paid out by
listed stocks and 12-18% for income from any other
security.
7. Key Contacts
• Banque Centrale des Etats de
l’Afrique de l’Ouest
Avenue Jean Paul I, Cotonou, Benin
Tel: +229-2131-2466,
Fax: +229-2131-2465
Web: www.bceao.int
• Bourse Régionale des Valeurs Mobiliéres
18, Avenue Joseph Anoma, Rue des
Banques, Abidjan, Côte d’Ivoire
Tel: +225-2032-6685
Fax: +225-2032-4777
E-mail: [email protected]
Web: www.brvm.org
non CFA domiciled issuers
titleFace Amount (XoF billion)
year of Listing Frequency expiration date
Listed BondsSHELTER-Afrique 6.25% 2003-2010 3.50 2003 Semi-annual 20-Feb-10
Private Placement BondsSHELTER-Afrique 6% 2004-2009 2.50 2004 Semi-annual 26-Nov-09
B
1� – Benin

Botswana – 1�
Population (mn) 1.8Population Growth (annual %) -0.3Official Language EnglishCurrency Pula (BWP)GDP (Current US$ bn) 10.05GDP Growth (annual %) 4.2GDP Per Capita (US$) 5,711FDI, net inflows (US$ mn) (2005) 346.1External Debt (US$ mn) 1.1External Debt/GDP (%) 11.4CPI Inflation (annual %) 11.6Exports of goods and services (% of GDP) 52.7Gross Official Reserves (US $ bn) 7.093Gross Official Reserves in months of imports 22.9UNDP HDI RaNkING 131
Source: AfDB, IMF, UNCTAD, UNDP, UN Population Division
1. overview of Financial system
The Bank of Botswana (BOB) was established as
the central bank in 1975 after the country decided
to leave the Rand monetary area, and the Botswana
Pula (BWP) was launched in 1976 to replace the
South African Rand as the national currency. The
Bank of Botswana supervises credit institutions and
is responsible for maintaining monetary stability,
promoting a stable and sound financial system, and
ensuring public confidence in the national currency.
It acts as the adviser of the government on economic
and financial issues. The objective of the monetary
policy is to achieve and maintain low and sustainable
inflation rates. The BOB chiefly uses open market
operations to influence interest rates and liquidity.
Historically, the financial sector in Botswana has been
dominated by commercial banks, which have played a
major role in contributing towards the development of
the economy. However, funds raised on the domestic
bond market now constitute almost 47% of total bank
lending, compared to 0% in the mid-1990s.
Botswana
Bank and non-bank Financial sector
In carrying out its mission of supervision of credit
institutions, the BOB enacts management rules and
sets prudential standards. There are five commercial
banks currently operating in the country, in addition to
two merchant banks, controlling assets of BWP 29. 2
bn (BWP 17.7 bn in 2005).
The rapid growth of the domestic fund management
industry has led to the introduction in 2006 of
legislation to establish a regulatory authority for non-
bank financial institutions. The non-bank financial
sector is active, with over 100 private pension funds
and 32 insurance companies. The insurance sector
is regulated by the Registrar of Insurance, operating
under the Ministry of Finance and Development
Planning.
Private pension funds have been rapidly growing in
recent years and the size of their assets is comparable
to those of commercial banks. As of December 2006,
total pension funds assets amounted to BWP 29.01
GEOATLAS - Copyright1998 Graphi-Ogre0 km 100 200 300 400 km
OCEAN�INDIEN
Pietersburg
Nelspruit
Johannesburg
Mmabatho
Kimberley
Mongu
Livingstone
Rundu��
Tsumeb
Gobabis
Katima Mulilo��
Mariental
Keetmanshoop
Molepolole
Kasane
Maun
GhanziFrancistown
Serowe
Mochudi
Kanye
Tshabong
Marondera
MazoweChinhoyi
Gweru
MasvingoBulawayo
Gwanda
Gaborone
Mbabane
Pretoria
Lusaka
Harare
Maputo
Makgadikgadi
Lac Kariba
Lac de�Cahora Bassa
Lac�Sainte�Lucia
Hunyani
Z ambèze
Z am bèze
Z
am bèze
Kw
ando
Kwando
Cuando
Cuito
O kavango
Cubang
o
C ubango
Gwai
Umniat
i
Sabi
Lundi
Mtilik
we
Lim popo
Limpopo
Marico
Krokodil
Mokolo
Mogalakw
ena
O lifants
G root-Letaba
Krokodil
Kom ati
V aalV aal
V
aa
l
Hartbees
O range
Fish Kainab M
olopo
M olopo
M olop
oA uob
Auob
Olifants
N osop
Nossob
Nossob
Black N ossob
W
itNo
ssob
Shash e Nuanetsi
Harts
Riet M odder
Kafue
Pongolo
1489 m
1070 m
1375 m
D
R
A
KE
NS
BE
R
GW A TERBERG
E
W I T W A T E R S R A N T
KAAP
PLA
TO
LANGEBERGE
B OPH
U TH A
TSW
A NA
MO
NT
SL
EB
OM
BO
E SC A R P EM E N T D U Z A M B EZ E
M tsM A V U RA DON A
COLLINES�
MATOPOS
DEPRESSION�
DE MABABEDELTA DE�
L'OKAVANGO
COLLINES AHA
D E S E R T �
D U �
K A L A H A R I
COLLINES�TSODILO
GROOT�
KARASBERGE
K A UK A U
V EL D
PLAINES�SILOWANA
N A M I B I E
A F R I Q U E D U S U D
Z I M B A B W E
Z A M B I EA N G O L A
SWAZILAND
LESOTHO
MO
ZA
MB
IQ
UE
BOTSWANA
sovereign ratings
Long term
Local Currency
Foreign Currency
s&P A+ A
Moody’s A1 A2
2006 At a Glance
B
bn (BWP 23.2 bn in 2005). This growth has led to a
significant increase in excess liquidity in the domestic
financial system which is regularly absorbed by the
central bank through its open market operations.
Approximately 67% of pension funds assets are
invested in equities, 24% in bonds (11% in domestic
bonds and 13% in offshore bonds). Pension funds
are one of the major participants in the fixed-income
market and can invest 70% of their assets offshore.
Capital Markets
The sector is supervised by the BSE Committee in
conjunction with the Ministry of Finance’s Banking
and Capital Markets Unit.
The legal framework of Botswana’s capital
markets is largely defined by the Botswana Stock
Exchange (BSE) Act, which incorporates compliance
with the Companies Act. The BSE was established
in 1989 and began formal operations in 1995. It is
responsible for regulating and operating the equity
and fixed-income markets and has sole jurisdiction
in approving securities for listing on the exchange.
There are a variety of market indices, and the most
widely followed is the Domestic Companies Index
(DCI) which tracks movements in share prices on
the BSE using a weighted average of all domestic
companies listed on the exchange. The market
capitalization stood at BWP 592 bn in April 2007,
with the domestic sector market capitalization of
BWP 30 bn (USD 5 bn) and a foreign sector market
capitalization of BWP 562 bn (USD 94 bn). In effect,
Anglo (a South African conglomerate) accounts for
BWP 486 bn (USD 81 bn).
A total of 19 domestic companies and 12 foreign
companies are listed on the BSE together with two
government bonds, seven quasi-government bonds
and 20 corporate bond issues. Since 1997, the BSE
has allowed dual listing with other stock exchanges
and, at the end of 2006, 12 foreign companies had
dual listing. Market participants in both the primary
and secondary market include domestic and
foreign companies, commercial banks, corporates,
parastatals and institutional investors (pension funds,
insurance companies and mutual funds). The local
non-bank investor base (asset management, life and
general insurance companies) is deep and diversified.
Three registered brokerage companies are operating
on the BSE and all commercial and merchant banks
in Botswana are primary dealers.
The Government is committed to fashioning
Botswana into a financial services hub. Significant
progress has been made in Botswana’s capital market
resulting from the implementation of a financial sector
development strategy. However, further growth and
improvements in efficiency of the capital market
are needed to support the national diversification
objective, as well as to enable domestic savers and
foreign investors to participate in the envisaged
privatization of parastatals.
2. Fixed income Markets
At the end of 2006, the nominal value of listed bonds
listed on BSE was BWP 4.0 bn, compared to BWP
3.8 bn in 2005.
Government securities
There is a primary dealership system in government
bonds for both the primary and secondary market.
Government debt instruments consist of Bank of
Botswana Certificates (BOBC) and government
bonds. While BOBCs are used for open market
operations, the government bonds have been launched
to help develop the domestic capital markets by
adding to the choice of available financial instruments
and establishing a relatively risk-free yield curve to
serve as a benchmark for other bond issues.
Government securities are sold by multiple price
auctions with successful bidders (bids above the
established minimum bid price) required to pay their
respective bid prices. Following are the main features
of the securities.
• Bank of Botswana Certificates have maturities
of 14-, 91- and 364-days. They are highly liquid,
with total issuance of BWP 3.76 bn for the 14-day,
BWP 8.34 bn for 91-day and BWP 3.86 bn for the
1� – Botswana
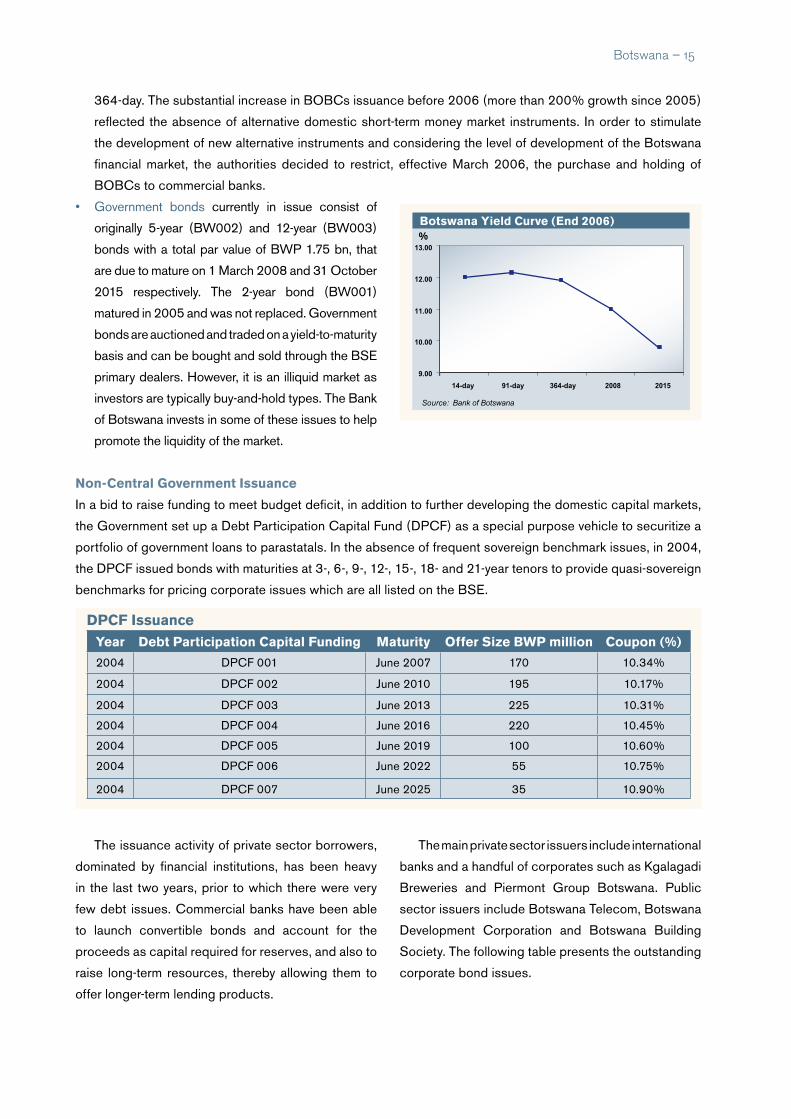
364-day. The substantial increase in BOBCs issuance before 2006 (more than 200% growth since 2005)
reflected the absence of alternative domestic short-term money market instruments. In order to stimulate
the development of new alternative instruments and considering the level of development of the Botswana
financial market, the authorities decided to restrict, effective March 2006, the purchase and holding of
BOBCs to commercial banks.
non-Central Government issuance
In a bid to raise funding to meet budget deficit, in addition to further developing the domestic capital markets,
the Government set up a Debt Participation Capital Fund (DPCF) as a special purpose vehicle to securitize a
portfolio of government loans to parastatals. In the absence of frequent sovereign benchmark issues, in 2004,
the DPCF issued bonds with maturities at 3-, 6-, 9-, 12-, 15-, 18- and 21-year tenors to provide quasi-sovereign
benchmarks for pricing corporate issues which are all listed on the BSE.
Botswana – 1�
dPCF issuanceyear debt Participation Capital Funding Maturity offer size BWP million Coupon (%)
2004 DPCF 001 June 2007 170 10.34%
2004 DPCF 002 June 2010 195 10.17%
2004 DPCF 003 June 2013 225 10.31%
2004 DPCF 004 June 2016 220 10.45%
2004 DPCF 005 June 2019 100 10.60%
2004 DPCF 006 June 2022 55 10.75%
2004 DPCF 007 June 2025 35 10.90%
Botswana yield Curve (end 2006)
9.00
10.00
11.00
12.00
13.00
14-day 91-day 364-day 2008 2015
%
Source: Bank of Botswana
%
The issuance activity of private sector borrowers,
dominated by financial institutions, has been heavy
in the last two years, prior to which there were very
few debt issues. Commercial banks have been able
to launch convertible bonds and account for the
proceeds as capital required for reserves, and also to
raise long-term resources, thereby allowing them to
offer longer-term lending products.
The main private sector issuers include international
banks and a handful of corporates such as Kgalagadi
Breweries and Piermont Group Botswana. Public
sector issuers include Botswana Telecom, Botswana
Development Corporation and Botswana Building
Society. The following table presents the outstanding
corporate bond issues.
• Government bonds currently in issue consist of
originally 5-year (BW002) and 12-year (BW003)
bonds with a total par value of BWP 1.75 bn, that
are due to mature on 1 March 2008 and 31 October
2015 respectively. The 2-year bond (BW001)
matured in 2005 and was not replaced. Government
bonds are auctioned and traded on a yield-to-maturity
basis and can be bought and sold through the BSE
primary dealers. However, it is an illiquid market as
investors are typically buy-and-hold types. The Bank
of Botswana invests in some of these issues to help
promote the liquidity of the market.
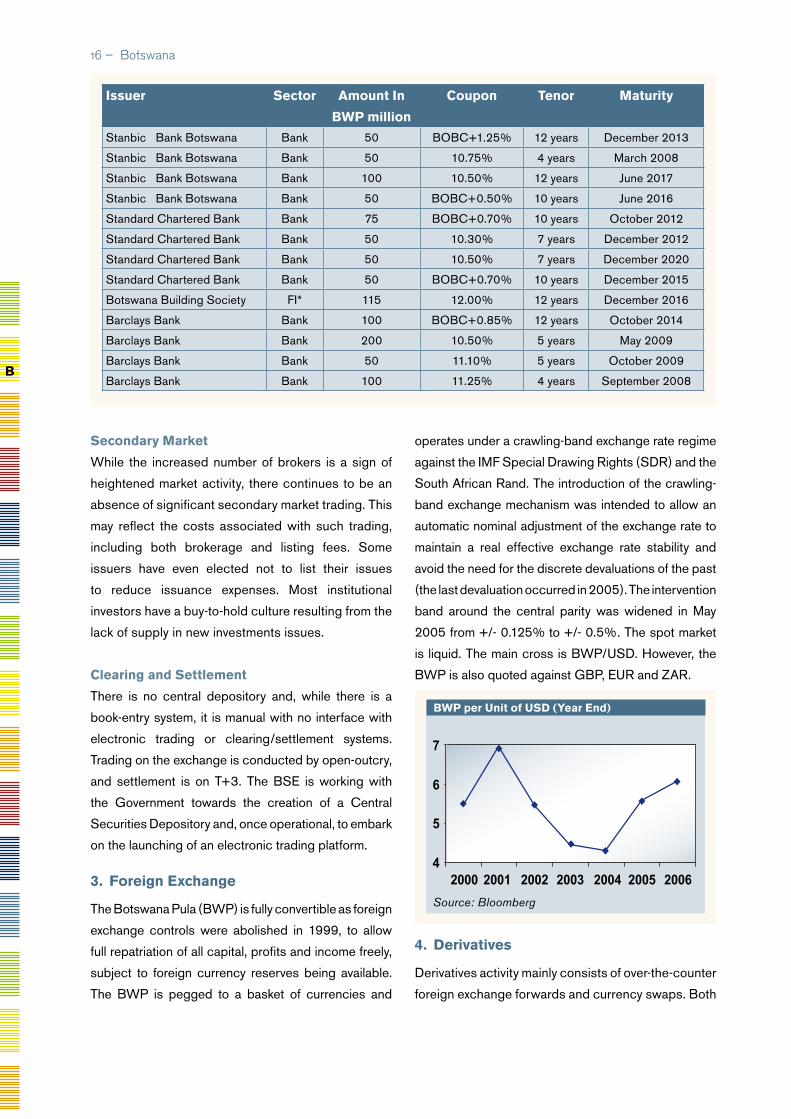
B
secondary Market
While the increased number of brokers is a sign of
heightened market activity, there continues to be an
absence of significant secondary market trading. This
may reflect the costs associated with such trading,
including both brokerage and listing fees. Some
issuers have even elected not to list their issues
to reduce issuance expenses. Most institutional
investors have a buy-to-hold culture resulting from the
lack of supply in new investments issues.
Clearing and settlement
There is no central depository and, while there is a
book-entry system, it is manual with no interface with
electronic trading or clearing/settlement systems.
Trading on the exchange is conducted by open-outcry,
and settlement is on T+3. The BSE is working with
the Government towards the creation of a Central
Securities Depository and, once operational, to embark
on the launching of an electronic trading platform.
3. Foreign exchange
The Botswana Pula (BWP) is fully convertible as foreign
exchange controls were abolished in 1999, to allow
full repatriation of all capital, profits and income freely,
subject to foreign currency reserves being available.
The BWP is pegged to a basket of currencies and
operates under a crawling-band exchange rate regime
against the IMF Special Drawing Rights (SDR) and the
South African Rand. The introduction of the crawling-
band exchange mechanism was intended to allow an
automatic nominal adjustment of the exchange rate to
maintain a real effective exchange rate stability and
avoid the need for the discrete devaluations of the past
(the last devaluation occurred in 2005). The intervention
band around the central parity was widened in May
2005 from +/- 0.125% to +/- 0.5%. The spot market
is liquid. The main cross is BWP/USD. However, the
BWP is also quoted against GBP, EUR and ZAR.
4. derivatives
Derivatives activity mainly consists of over-the-counter
foreign exchange forwards and currency swaps. Both
issuer sector Amount in
BWP million
Coupon tenor Maturity
Stanbic Bank Botswana Bank 50 BOBC+1.25% 12 years December 2013
Stanbic Bank Botswana Bank 50 10.75% 4 years March 2008
Stanbic Bank Botswana Bank 100 10.50% 12 years June 2017
Stanbic Bank Botswana Bank 50 BOBC+0.50% 10 years June 2016
Standard Chartered Bank Bank 75 BOBC+0.70% 10 years October 2012
Standard Chartered Bank Bank 50 10.30% 7 years December 2012
Standard Chartered Bank Bank 50 10.50% 7 years December 2020
Standard Chartered Bank Bank 50 BOBC+0.70% 10 years December 2015
Botswana Building Society FI* 115 12.00% 12 years December 2016
Barclays Bank Bank 100 BOBC+0.85% 12 years October 2014
Barclays Bank Bank 200 10.50% 5 years May 2009
Barclays Bank Bank 50 11.10% 5 years October 2009
Barclays Bank Bank 100 11.25% 4 years September 2008
1� – Botswana
BWP per unit of usd (year end)
2000 2001 2002 2003 2004 2005 20064
5
6
7
Source: Bloomberg

– 1�
forwards and currency swaps markets are liquid, with
tenors up to 3-months and 6-months respectively.
Currency swaps are mostly against the USD but can
be against any of the major international currencies.
5. Participation of Foreign investors and issuers
Only Botswana-registered companies and resident
individuals are allowed to invest in treasury bills.
However, there are no restrictions on foreign holdings of
government bonds. The 2-year BW001 issued in 2003
proved quite attractive to international investors, although
the May 2005 devaluation which occurred shortly before
its maturity had an adverse impact on the confidence of
foreign investors. Since then, foreign holdings of the
remaining two government bonds have been negligible.
A Europula bond market has been developing
since 2005 after the first international issues in BWP
were made by supranational issuers such as the EIB,
the AfDB and KfW. These issues have helped meet
increasing international investor demand for debt in
higher-yielding currencies.
6. investment taxation
There is a 15% withholding tax on dividend income
and interest for non-residents, and a 25% capital
gains tax. Securities issued by domestic public
companies are exempt from capital gains tax.
Botswana has double taxation treaties with France,
Mauritius, Russia, South Africa, Seychelles, Sweden
and the United Kingdom.
7. Key Contacts
• Bank of Botswana
1863 Khama Crescent, Gaborone, Botswana
Tel: +267-360600
Fax: +267-372 984/301100
Web: www.bankofbotswana.bw
• Botswana Stock Exchange
Unit 11, Millennium Office Park, Kgale
Mews, Gaborone, Botswana
Tel: +267-3180201, Fax: +267-3180175
Web: www.bse.co.bw
AFriCAn deveLoPMent BAnK BotsWAnA
PuLA 300 MiLLion Bond issue
The Bank launched its first Botswana Pula
Eurobond in 7 December 2005 in the Euro-
Pula market following the receipt of necessary
approvals from the Government of Botswana.
The bond has a maturity of one year and a coupon
of 10%, and is the first true Eurobond in Pula.
The transaction was a resounding success
with the original size of BWP 250 million increased
to BWP 300 million on the back of strong investor
demand primarily from European institutional
investors. It succeeded in deepening the Botswana
capital market by attracting international investors
to Pula denominated fixed income products. This
issue is the first transaction that has been settled
and redeemed in Botswana Pula. Consistent with
its strategy of developing the local capital markets
of Africa, the AfDB worked closely with the two
main securities clearing houses, Clearstream and
Euroclear, for the Pula to obtain settlement status.
Botswana – 1�
issuer dateeuropula Market
Amount in BWP million Coupon tenor
EIB 2005 500 10% 5-year
AfDB 2006 300 10% 1-year
KfW 2006 300 10% 2-year
EIB 2007 320 10.1875% 1-year
Population (mn) 13.6Population Growth (annual %) 3.0Official Language (s) FrenchCurrency CFA Franc (XOF)GDP (Current US$ bn) 6.0GDP Growth (annual %) 5.5GDP Per Capita (US$) 440FDI, net inflows (US$ mn) (2005) 19.5External Debt (US$ mn) 1,060External Debt/GDP (%) 17.7CPI Inflation (annual %) 2.8Exports of goods and services (% of GDP) 11.4Gross Official Reserves (US$ bn) 0.5Gross Official Reserves (in months of imports) 5.3UNDP HDI RaNkING 174Source: AfDB, IMF, UNCTAD, UNDP, UN Population Division
1. overview of Financial system
Burkina Faso is a member of the West African Economic
and Monetary Union (UEMOA) established in January
1994, and comprising eight West African countries
(Benin, Burkina Faso, Côte d’Ivoire, Mali, Niger, Senegal,
Togo, and Guinea Bissau) which are members of the
Franc Zone and use the CFA Franc (XOF) issued by the
Central Bank (BCEAO). The UEMOA financial markets
are administered through the following institutions:
• The Conference of Heads of State, which decides
on the accession of new members.
• The Council of Ministers, which defines, among
others, the monetary and credit policy of the Union
to safeguard the value of the CFA Franc.
• The UEMOA Commission, as delegated by the
Council of Ministers, is in charge of the day-to-day
administration of the Union.
• The Central Bank of West African States (BCEAO)
is the central bank and controls the Banking
Commission (Commission Bancaire) responsible
for overseeing and supervising banks and financial
Burkina Faso
GEOATLAS - Copyright1998 Graphi-Ogre0 km 100 200 300 400 km
Cap St-Paul
Cap des�Trois Pointes
Cap des�Palmes
CO TE D ES ESCLA V ES
COTE
D EL'O R
C O T ED E L 'I V O I R E
GOLFE DE GUINEE
B A I E D U B E N I N
O C E A N A T L A N T I Q U E
KorhogoOdienné
SéguélaBouaké
Bondoukou
San-Pédro
Bouaflé
Divo
Dimbokro Abengourou
Agboville
Daloa
Man
Aboisso
Harper
Barclayville
Zwedru
GaouaBanfora
OrodaraDiébougou
Bobo Dioulasso
Nouna
Dédougou Réo
Léo Pô
MangaTenkodogo
Bogandé
KoupélaZorgo
Ziniaré
Kombissiri
KayaYakoTougan
Ouahigouya
Djibo
Kongoussi
Boulsa
Dori
Gorom-�Gorom
DiapagaFada�NgourmaKoudougou
Atakpamé
Sokodé
Lama-Kara
Dapango
Néma
Bolgatanga
Tamale
Sunyani
Kumasi
Sekondi-TakoradiCape Coast
Koforidua
Ho
Benin City��
Birnin Kebbi
Sokoto
Llorin
Oshogbo
IbadanAbeokuta
Lagos
Akure
Parakou
Natitingou
Abomey
Cotonou
Lokossa
Tahoua
Dosso
Tillaberi
Sikasso
Ségou
Mopti
Tombouctou
Yamoussoukro
Abidjan
Lomé
Accra
Porto Novo
Niamey
OuagadougouBamako
Lac Volta
Lac�Kainji
Nuon
Cavally
D ube
Sassa
n dra
Sassandra
Bandamarouge
Ba nd
ama
Bandam
aBlanc
Nzi
Kom
oé
Komoé
Léra
ba
Bia
Tano
Pra
Dak
a
Oti
Oti
Mékrou
Alibori
Mono
Ouém
é Niger
Sokoto
Bagoé
Bani
Ba
ni
Volta
Noire
Volta B lanch e
N ig
er
Nige
r
N iger
N iger
641 m
1208 m
1002 m
Mont Kopé�424 m
Mount�Nimba�1752 m
684 m
Hombori�Tondo�1155 m
1257 m
CHAINEDEL'ATACORA
PLA TEA U KW A HU
CHAIN
EAKW
APIN
Mts
D UTOU RA
GOURMA
I R Î G U I
¡ Ô Ø
A D E R
S
A
HE
L
BURKINA FASO
N I G E R I A
B E N I NG H A N A
COTE D'IVOIRE
T O G O
LIBERIA
GUINEE
M A L I
N I G E R
M A U R I T A N I E
sovereign ratings
Longterm
Local Currency
Foreign Currency
s&P B B
institutions. The BCEAO also controls the
Savings and Financial Markets Regional Council
(CREPMF). The capital of BCEAO, currently
called up in the amount of XOF 134 bn, is entirely
subscribed by the member States and shared
equally among them.
• Micro-finance institutions are governed by a
separate law, the PARMEC (Projet d’Appui à
la Réglementation des Mutuelles d’Epargne et
de Crédit) Law, which regulates micro-finance
activities in all WAEMU countries.
Burkina Faso is also a signatory to the OHADA
Treaty, which harmonizes business law in 16 countries
in Sub-Sahara Africa, including all the UEMOA
countries.
The main objective of the monetary policy as
defined by the UEMOA and implemented by the
BCEAO, is to ensure price stability and safeguard the
domestic and foreign value of the CFA Franc through
appropriate coverage of currency issue by foreign
exchange reserves.
1� – Burkina Faso
B
2006 At a Glance
Burkina Faso – 1�
Bank and non-Bank Financial sector
As of December 2006, there were 93 banks and 22
financial institutions operating in the UEMOA zone,
with 11 banks and five financial institutions located
in Burkina Faso. The total balance sheets of the
financial system in Burkina Faso, amounted to XOF
733 bn at the end of 2005, with the banks accounting
for more than 96%, representing close to 27% of the
country’s GDP. The resources of banks and financial
institutions amount to XOF 651 bn, including XOF 73
bn as net equity capital. Branches and subsidiaries
of foreign or regional banks play a relatively important
role in financial intermediation in UEMOA. In fact, eight
groups (including Société Générale, BNP Paribas,
Credit Lyonnais, Citibank, Bank of Africa, Ecobank,
and Financial B.C.) dominate the UEMOA banking
system with relatively wide national networks.
The insurance sector in Burkina Faso is regulated
and supervised by the Inter-African Conference of
Insurance Markets (CIMA) established on 10 July
1992 in Yaounde (Republic of Cameroon). It includes
the following countries: Benin, Burkina Faso,
Cameroon, Central African Republic, the Comoros,
Côte d’Ivoire, Gabon, Equatorial Guinea, Guinea
Bissau, Mali, Niger, Senegal, Chad and Togo. The
CIMA Treaty came into effect on 15 February 1995.
The regulatory body of the CIMA is the Regional
Commission of Insurance Control (CRCA), whereas
the Council of Ministers is its highest body. The total
portfolio of the UEMOA CIMA zone is dominated by
the sector of non-life insurance. Compared to GDP of
2005, the turnover of the insurance sector in Burkina
Faso represents 0.7%, well below the average ratio in
Africa of 4.8%. At the end of 2005, three life insurance
and five non-life insurance companies were operating
in the country, with a total turnover of XOF 19.5 bn.
The micro-finance sector in Burkina Faso plays an
important role in the economy. As of December 2006,
more than 600.000 persons have benefited from the
service of eight main micro-finance networks. The
credit to the economy from these networks is around
XOF 31.5 bn.
Capital Markets
The Regional Stock Exchange (BRVM), the stock
market for the UEMOA region, started operating in
September 1998. It is located in Abidjan and has
a branch in each capital city of the other member
States of the Union. Its main role is to pool and
process stock market orders transmitted by brokerage
companies (Société de Gestion et d’Intermédiation-
SGI) authorized to negotiate securities quoted on
the BRVM. As of December 2006, 19 SGIs were
registered in the Union. As of the same date, there
was only one SGI (SBIF) in Burkina Faso that
is licensed to trade on the BRVM. The BRVM is
regulated by the CREPMF whose responsibilities
include the promulgation of policies and procedures
to regulate the BRVM, and the promotion of a regional
bond market. In order to list on the BRVM, all bond
issues must be guaranteed by an approved financial
institution, a development financial institution, a
guarantee fund, or the Parent Company. At the end
of December 2006, the capitalization of the equity
market was XOF 2,067 bn whereas the bond market
capitalization stood at XOF 489 bn, with XOF 260
bn being government bonds, representing 1.07% of
the GDP of the Union. By end-December 2006, 61
securities were listed, including 40 shares and 21
bonds, compared to 57 securities comprising 39
shares and 18 bonds by end-December 2005. As at
December 2006, there is no company from Burkina
Faso trading on the stock exchange.
2. Fixed income Markets
The benchmark issuer in the UEMOA zone is the
West African Development Bank (BOAD), a regional
multilateral bank. Since 1999, BOAD accounts for
close to 22% of all the public debt issues in the market,
i.e. XOF 102 bn. In the absence of a government yield
curve, BOAD bonds are used as benchmarks.

�0 – Burkina Faso
non Government debt issuance
titleFace Amount (XoF billion)
year of Listing
Frequency expiration date
Listed Bonds
CELTEL BURKINA FASO 7.15% 2003-2009 3.00 2003 Annual 22-Aug-09
ONATEL 6.65% 2006-2011 16.00 2005 Annual 6-Jun-11
Private Placement Bonds
TELECEL FASO 7.25% 2004-2009 7.00 2004 Annual 12-Juil-09
Government treasury Bond
titleFace Amount (XoF billion)
year of Listing
Frequency expiration date
Listed Bonds
TRESOR PUBLIC DU BF 7% 2003-2007 25.00 2003 Annual 17-Mar-07
outstanding BoAd Bonds
titleFace Amount (XoF billion)
year of Listing
Frequency expiration date
Listed Bonds
BOAD 6,25% 1999-2009 20.12 1999 Annual 1-Feb-09
BOAD 6,30% 1999-2007 17.05 2000 Annual 27-Oct-07
BOAD 5.85% 2001-2008 11,95 2003 Annual 4-Jan-08
BOAD 5.35% 2004-2011 22.70 2005 Annual 5-Nov-11
BOAD 5% 2005-2013 18,60 2005 Annual 28-Dec-13
BOAD 4,5%, 2005-2011 6,404 2005 Annual 28-Dec-11
Government securities
The Government of Burkina Faso has used treasury
bills and bonds to fund it deficit. As of December
2006, the Government has XOF 20.5 bn outstanding
in treasury bills and XOF 8.3 billion outstanding on a
bond issued in Mars 2003.
non-Central Government issuance
By December 2006, three companies, all in the
telecommunication sector, have raised financial
resources on the public debt market. However, only
two of the outstanding bonds are listed on the stock
exchange. The CREPMF requires that corporate
bonds be guaranteed before they can be listed. This
requirement can explain the limited use of the capital
market by corporate in the UEMOA zone in general and
in Burkina Faso in particular.
B
secondary Market
As a consequence of the buy-and-hold attitude of
most investors, the secondary market in fixed-income
securities in the UEMOA zone is fairly illiquid.
Clearing and settlement
Securities trades on the BRVM are cleared through
the central clearing and depository house (Dépositaire
Central Banque de Règlement-DC/BR). The DC/BR has
its headquarters in Abidjan and offices in all the UEMOA
member states. It centralizes issuances on a dematerialized
basis, payment, and delivery of securities. It also guarantees
the settlement of each transaction and draws on a special
guarantee fund in cases of default. Trading operations
are closed electronically on T+5 and will evolve towards
closing on T+3 by the end of the year 2007.
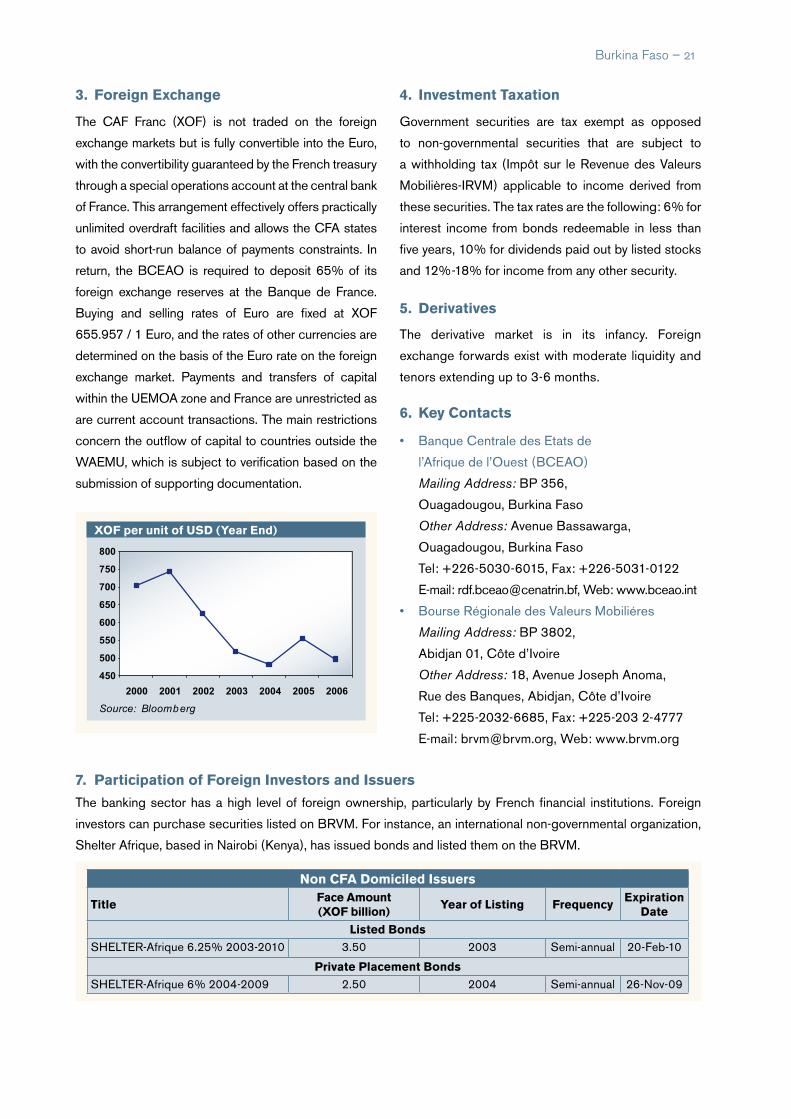
Burkina Faso – �1
XoF per unit of usd (year end)
450
500
550
600
650
700
750
800
2000 2001 2002 2003 2004 2005 2006
Source: Bloomberg
non CFA domiciled issuers
titleFace Amount (XoF billion)
year of Listing Frequencyexpiration
date
Listed BondsSHELTER-Afrique 6.25% 2003-2010 3.50 2003 Semi-annual 20-Feb-10
Private Placement BondsSHELTER-Afrique 6% 2004-2009 2.50 2004 Semi-annual 26-Nov-09
3. Foreign exchange
The CAF Franc (XOF) is not traded on the foreign
exchange markets but is fully convertible into the Euro,
with the convertibility guaranteed by the French treasury
through a special operations account at the central bank
of France. This arrangement effectively offers practically
unlimited overdraft facilities and allows the CFA states
to avoid short-run balance of payments constraints. In
return, the BCEAO is required to deposit 65% of its
foreign exchange reserves at the Banque de France.
Buying and selling rates of Euro are fixed at XOF
655.957 / 1 Euro, and the rates of other currencies are
determined on the basis of the Euro rate on the foreign
exchange market. Payments and transfers of capital
within the UEMOA zone and France are unrestricted as
are current account transactions. The main restrictions
concern the outflow of capital to countries outside the
WAEMU, which is subject to verification based on the
submission of supporting documentation.
5. derivatives
The derivative market is in its infancy. Foreign
exchange forwards exist with moderate liquidity and
tenors extending up to 3-6 months.
6. Key Contacts
• Banque Centrale des Etats de
l’Afrique de l’Ouest (BCEAO)
Mailing Address: BP 356,
Ouagadougou, Burkina Faso
Other Address: Avenue Bassawarga,
Ouagadougou, Burkina Faso
Tel: +226-5030-6015, Fax: +226-5031-0122
E-mail: [email protected], Web: www.bceao.int
• Bourse Régionale des Valeurs Mobiliéres
Mailing Address: BP 3802,
Abidjan 01, Côte d’Ivoire
Other Address: 18, Avenue Joseph Anoma,
Rue des Banques, Abidjan, Côte d’Ivoire
Tel: +225-2032-6685, Fax: +225-203 2-4777
E-mail: [email protected], Web: www.brvm.org
4. investment taxation
Government securities are tax exempt as opposed
to non-governmental securities that are subject to
a withholding tax (Impôt sur le Revenue des Valeurs
Mobilières-IRVM) applicable to income derived from
these securities. The tax rates are the following: 6% for
interest income from bonds redeemable in less than
five years, 10% for dividends paid out by listed stocks
and 12%-18% for income from any other security.
7. Participation of Foreign investors and issuers
The banking sector has a high level of foreign ownership, particularly by French financial institutions. Foreign
investors can purchase securities listed on BRVM. For instance, an international non-governmental organization,
Shelter Afrique, based in Nairobi (Kenya), has issued bonds and listed them on the BRVM.

Population (mn) 7.8Population Growth (annual %) 3.7Official Language (s) Kirundi/FrenchCurrency Burundi Franc (BIF)GDP (Current US$ bn) .927GDP Growth (annual %) 6.1GDP Per Capita (US$) 118FDI, net inflows (US$ mn) (2005) -1.0 External Debt (US$ mn) 1,500External Debt/GDP (%) 152.7CPI Inflation (annual %) 5Exports of goods and services (% of GDP) 11.9Gross Official Reserves (US$ bn) .086Gross Official Reserves (in months of imports) 3.3UNDP HDI RaNkING 169Source: AfDB, IMF, UNCTAD, UNDP, UN Population Division
1. overview of Financial system
The Banque de la République du Burundi (BRB) is
the central bank and supervises the banking sector. In
recent years, BRB has taken steps towards enforcing
prudential requirements in the financial system.
Bank and non-Bank Financial sector
As of January 2007, the banking sector comprised
of seven commercial banks. The Credit Bank of
Bujumbura and the Commercial Bank of Burundi are
the two largest banks and are majority-owned by the
State.
The insurance sector is regulated by the Insurance
Regulation and Control Agency which falls under
the Ministry of Finance. There are private or partially
state-owned insurance companies operating in the
country.
Capital Markets
There are no stock or bond markets in Burundi.
Capital is raised from commercial banks.
2. Fixed income Markets
Government securities
The BRB issues 91-day treasury bills. No government
bonds are issued.
non-Central Government issuance
There are no corporate issues in the fixed income market.
3. Foreign exchange
The Burundi Franc is pegged to the value of a
composite of currencies, consisting of Burundi’s
major trading partners. The central bank is committed
to pursuing the liberalisation of the exchange system.
In late 2004, the central bank abolished the mandatory
nature of its auction reference price for commercial
transactions.
The determination of the official exchange rate was
also changed, from the weekly auction to the daily
average of market rates. The surrender requirement
(50% on coffee, tea, and cotton exports) was
abolished in March 2005.
Burundi
�� – Burundi
B
2006 At a Glance
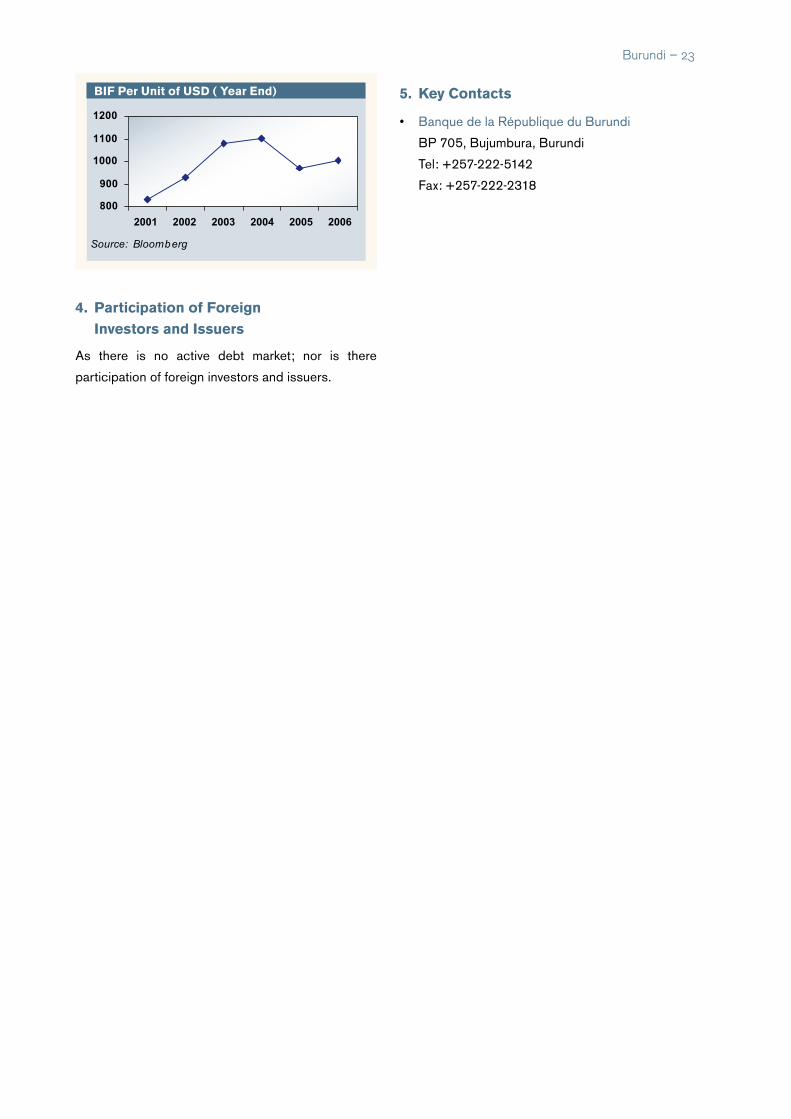
BiF Per unit of usd ( year end)
4. Participation of Foreign investors and issuers
As there is no active debt market; nor is there
participation of foreign investors and issuers.
Burundi – ��
800
900
1000
1100
1200
Source: Bloomberg
2001 2002 2003 2004 2005 2006
5. Key Contacts
• Banque de la République du Burundi
BP 705, Bujumbura, Burundi
Tel: +257-222-5142
Fax: +257-222-2318

Population (mn) 16.6Population Growth (annual %) 1.7Official Language (s) French/EnglishCurrency CFA Franc (XAF)GDP (Current US$ bn) 18.0GDP Growth (annual %) 3.5GDP Per Capita (US$) 1,085FDI, net inflows (US$ mn) (2005) 18.0 External Debt (US$ mn) 0.6External Debt/GDP (%) 3.2CPI Inflation (annual %) 3.0Exports of goods and services (% of GDP) 22.5Gross Official Reserves (US$ bn) 1.3Gross Official Reserves (in months of imports) 4.8UNDP HDI RaNkING 144Source: AfDB, IMF, UNCTAD, UNDP, UN Population Division
1. overview of Financial system
Cameroon is a member of the Central African
Economic and Monetary Community (Communauté
Economique et Monétaire de l’Afrique Centrale
- CEMAC), which is composed of six member
countries: Cameroon, Central African Republic,
Chad, Republic of Congo, Equatorial Guinea and
Gabon. The CEMAC is composed of the following
four institutions:
1. Central African Economic Union (Union
Economique de l’Afrique Centrale –UEAC-)
2. Central African Monetary Union ( Union
Monétaire de l’Afrique Centrale- UMAC-)
3. Community Parliament
4. CEMAC court of justice
The UMAC, headquartered in Yaoundé, is responsible
for the monetary policy of its member countries. It
also involved, with the UEAC, in the coordination
of economic policy to ensure consistency between
national budget policies and the common monetary
policy. The UMAC is administered through:
• The Conference of Heads of States, created
through the Agreement establishing the
CEMAC, the supreme authority of the UMAC;
• The Council of Ministers;
• The central bank, Bank of Central African States
(Banque des Etats de l’Afrique Centrale -BEAC-
), the common independent central bank;
• The Banking Commisssion, ( Commission
Bancaire de l’Afrique Centrale (COBAC),
harmonises and controls banking activities;
• The stock market, Bourse des valeurs mobilières.
The BEAC was established in 1972, the successor
to the Banque Centrale de l’Afrique Equatoriale et
du Cameroon (established in 1955). It formulates
and implements the monetary policy of its member
countries, and also preserves the stability of the
common currency the CFA Franc (Franc de la
Coopération Financiére en Afrique Centrale), which is
pegged to the Euro. The French treasury guarantees
the convertibility, though not the exchange rate, of the
CFA Franc. BEAC uses both reserve requirements
Cameroon
GEOATLAS - Copyright1998 Graphi-Ogre0 km 100 200 300 400 km
OCEAN�ATLANTIQUE
Cap San Juan
Pointe Epote
Ile de Corisco
Príncipe
Ile de Bioko�Guinée Equatoriale
BA IEDU BIA FRA
GOLFE DE GUINEE
ImpfondoOuesso
Oyem
Makokou
Maroua
Garoua
Ngaoundéré
Bamenda
Bafoussam
BueaDouala
Bertoua
Ebolowa
Sibut
Kaga�Bandoro
Bossangoa
Bimbo
Mbaiki
BozoumBouar
Berbérati
Nola
Dutse Damaturu
JalingoYola
Umuahia
AsabaEnugu
Lokoja
Maiduguri
Bauchi
Kano
Katsina
Kaduna
Minna
Jos
Makurdi
Awka
Owerri
Port Harcourt UyoCalabar
Diffa
Zinder
MaradiBol Ati
Mao
Mongo
Laï
Bongor
Moundou
Sarh
Doba
Yokadouma
Dschang
Foumban
Kumba Nkongsamba
Edéa
Kribi
YaoundéMalabo
Bangui
Abuja
N'Djamena
Lac�Tchad
Ngadda
Yedseram
Benue
Ka
duna
M ariga
Sokoto
G agere
M
ad
a
Rima
Maradi
KatsinaAla
Donga
G on g
ola
Bénoué
Faro
Faro
Ka
bia
M
béré
V ina
Log
oneO
rie
ntal
Logone
Chari
BahrErguig
Gribingui
Bam
ingui
ChariBahr
Salam
at
M
andoul
Batha
Ouham
Ouham
Fala
Sanaga
M bam
Nou
n
Djére
m
Lo
m
N yo ng
Dja
Kadeï
Kadeï
Boumbé
II
Boumbé
I
Mambéré
Lobaye
Mpoko
Oubangui
Ko
m
adugu Yob
e
Kom
adugu G
ana
Bunga
Jam
aare
Hadejia
Niger
N tem Kom
M bini
Avina
D ioua
Utam
boni
Mam bili S
angha
Sangha
N goko
Oubangui
Oubangui
Lulonga
Giri
704 m
750 m
Monte Mitra�1200 m
929 m
1923 m
2019 m
1500 m
Dimlang�2042 m Hoséré�
Vokré�2049 m
Zaranda Hill�1454 m
Sara Peak�1690 m
1500 m
2396 m
2679 m
2346 m
Ngol-Kedju�Hill�
2000 m
Mont�Cameroun �
4100 m
1345 m
Pico de�Santa Isabel�3008 m
Mont Ngaoui�1410 m
Tchabal�Mbabo�2460 m
Tchabal�Gangdaba�
1960 m
Mont Guédi�1506 m
Massif de Guéra�1613 m
MINKEBE
M fD EL'A D
A M A O U A
MtsMANDARA
MtsALA
NTI
KA
Mts�GOTEL
Mts SHEBSHI
COLLINES�OBAN
PLATEAU�JOS
M
ASSIFDUYADÉ
MA
NG
A
C O N G OG A B O N
GUINEE�EQUATORIALE
N I G E R I A
REPUBLIQUE�CENTRAFRICAINE
T C H A D
N I G E R CAMEROUN
sovereign ratings
Longterm
Local Currency
Foreign Currency
Fitch B- B
s&P B B
C
�� – Cameroon
2006 At a Glance

and the discount window to implement its policy. The
financing of the economy of the CEMAC region has
increased by 9.2% from XAF 1,850 billion in 2005 to
2,019 billion in 2006. The target inflation rate for the
region has been set at a maximum of 3%.
There are 29 banks operating in the CEMAC region
(Cameroon: 10; Central African Republic: 3; Chad:
5; Congo: 4; Equatorial Guinea: 2 ; Gabon: 5), with
total assets of XAF 659 billion as of February 2007.
Bank and non-Bank Financial sector
The financial sector comprises 10 commercial banks,
11 non-banking financial establishments, some 652
micro-finance institutions and an increasing number
of foreign exchange bureau. The banks operate in the
country within the regulatory framework of the central
bank’s Banking Commission: the COBAC that has
laid out stringent prudential rules. Despite the current
excess liquidity of the banking system, granting of
credit, excluding bad loans, is far below the minimum
annual increase of 30% needed to satisfy the country’s
financing requirements. The financing deficit of the
economy stems from the narrowness of the market
and the high proportion of bad debts as well as the
difficulties banks have had to realize guarantees, and
cause the enforcement of court decisions in litigation
cases. Banking activity is also marked by a high level
of conservatism.
The COBAC survey of 2000 identified the exis-
tence of 652 micro-finance institutions in the coun-
try. At the time, the micro-finance sector represent-
ed about 7% of the potential market and it granted
credits representing 4.3% of total loans made by the
banking sector. These figures have increased con-
siderably in recent years (the present number is esti-
mated at more than 1,000), though accurate statistics
are not available.
The insurance sector is regulated and supervised
by a regional body, the Interprofessional Committee
of the Insurance Market (Conférence Internationale
des Marchés d’Assurances-CIMA) established on
July 10, 1992 in Yaounde (Republic of Cameroon)
and includes the following countries: Benin, Burkina,
Cameroon, Central Africa, the Comoros, Ivory Coast,
Gabon, Equatorial Guinea, Guinea Bissau, Mali,
Niger, Senegal, Chad and Togo. The CIMA Treaty
came into effect on February 15, 1995. The regulatory
body of the CIMA is the Regional Commission of
Insurance Control (CRCA) whereas the Council
of Ministers is the supreme body. Since the reform
of insurance laws in 1998, CIMA has revoked the
licenses of four insurance companies, privatized one
state-owned insurance company and liquidated the
only reinsurance company in Cameroon. Despite a
recent strong growth in the life insurance segment,
the insurance industry in Cameroon is dominated by
non-life insurance sector.
Capital Markets
The capital markets sector is still in its infancy. The
main regulator is the Financial Markets Committee
(Commission des Marchés Financiers-CMF), which
is a regional body that was legally established in
1999 and whose objectives are to protect investors’
savings and monitor the financial markets of the XAF
zone. CMF has sole authority to approve securities
for listing on the exchange.
As is the case for the CFA West Africa zone
which has a common stock exchange (the Bourse
Régionale des Valeurs Moblières - BRVM), the
Central African Region also sought to establish
a common stock exchange. However, initial plans
were temporarily shelved, as no agreement could be
reached between the member countries regarding a
host country. Cameroon decided to create its own
exchange, the Douala Stock Exchange (DSX), whilst
a separate stock exchange was established in Gabon,
the Central African Stock Exchange (BVMAC). The
Douala Stock Exchange, was inaugurated in April
2003, and only two bonds are listed so far.
2. Fixed income Markets
Government securities
Cameroon does not issue treasury bills. However, in
2007 the authorities established the legal framework
for issuing both treasury bills and treasury bonds.
Cameroon – ��
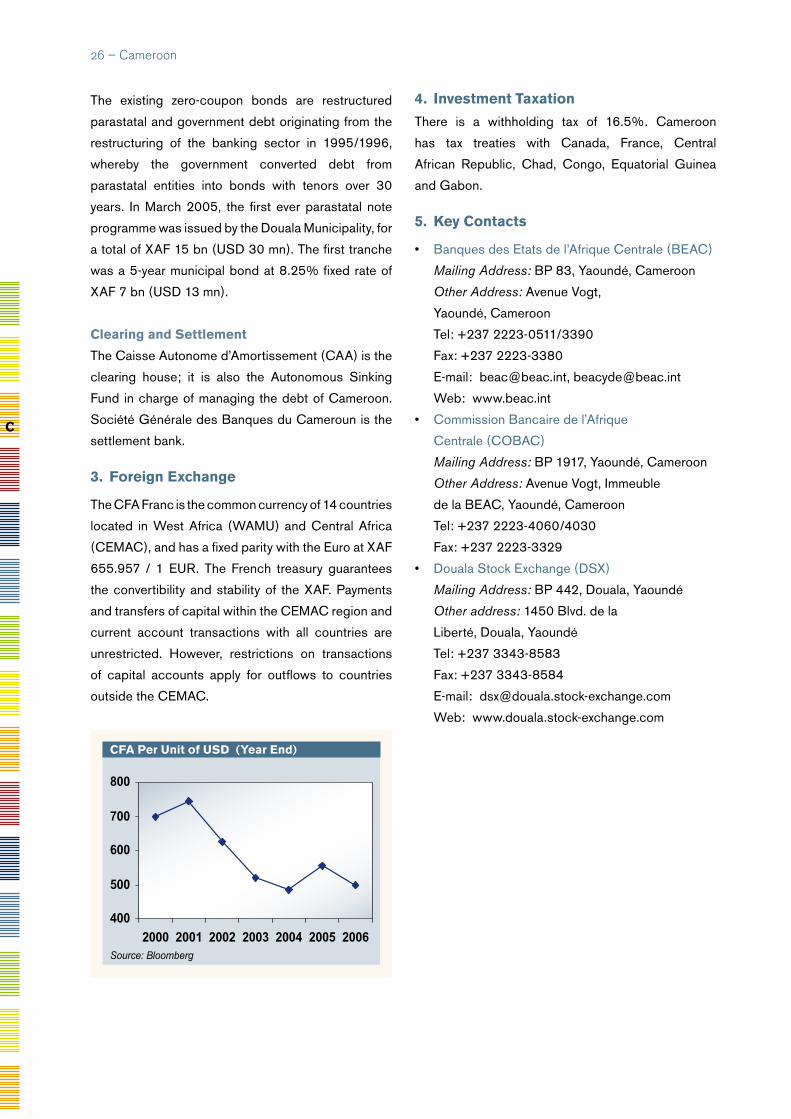
The existing zero-coupon bonds are restructured
parastatal and government debt originating from the
restructuring of the banking sector in 1995/1996,
whereby the government converted debt from
parastatal entities into bonds with tenors over 30
years. In March 2005, the first ever parastatal note
programme was issued by the Douala Municipality, for
a total of XAF 15 bn (USD 30 mn). The first tranche
was a 5-year municipal bond at 8.25% fixed rate of
XAF 7 bn (USD 13 mn).
4. investment taxation
There is a withholding tax of 16.5%. Cameroon
has tax treaties with Canada, France, Central
African Republic, Chad, Congo, Equatorial Guinea
and Gabon.
5. Key Contacts
• Banques des Etats de l’Afrique Centrale (BEAC)
Mailing Address: BP 83, Yaoundé, Cameroon
Other Address: Avenue Vogt,
Yaoundé, Cameroon
Tel: +237 2223-0511/3390
Fax: +237 2223-3380
E-mail: [email protected], [email protected]
Web: www.beac.int
• Commission Bancaire de l’Afrique
Centrale (COBAC)
Mailing Address: BP 1917, Yaoundé, Cameroon
Other Address: Avenue Vogt, Immeuble
de la BEAC, Yaoundé, Cameroon
Tel: +237 2223-4060/4030
Fax: +237 2223-3329
• Douala Stock Exchange (DSX)
Mailing Address: BP 442, Douala, Yaoundé
Other address: 1450 Blvd. de la
Liberté, Douala, Yaoundé
Tel: +237 3343-8583
Fax: +237 3343-8584
E-mail: [email protected]
Web: www.douala.stock-exchange.com
C
�� – Cameroon
CFA Per unit of usd (year end)
400
500
600
700
800
2000 2001 2002 2003 2004 2005 2006Source: Bloomberg
Clearing and settlement
The Caisse Autonome d’Amortissement (CAA) is the
clearing house; it is also the Autonomous Sinking
Fund in charge of managing the debt of Cameroon.
Société Générale des Banques du Cameroun is the
settlement bank.
3. Foreign exchange
The CFA Franc is the common currency of 14 countries
located in West Africa (WAMU) and Central Africa
(CEMAC), and has a fixed parity with the Euro at XAF
655.957 / 1 EUR. The French treasury guarantees
the convertibility and stability of the XAF. Payments
and transfers of capital within the CEMAC region and
current account transactions with all countries are
unrestricted. However, restrictions on transactions
of capital accounts apply for outflows to countries
outside the CEMAC.
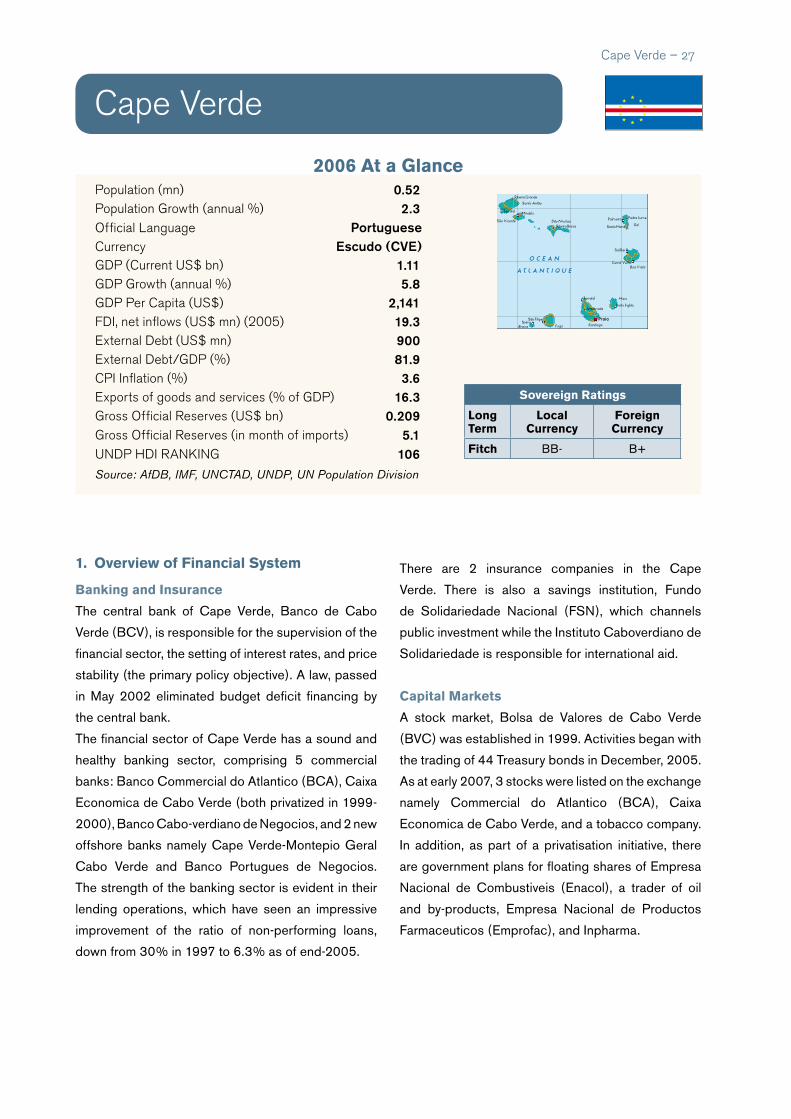
Cape Verde – ��
Population (mn) 0.52Population Growth (annual %) 2.3Official Language PortugueseCurrency Escudo (CVE)GDP (Current US$ bn) 1.11GDP Growth (annual %) 5.8GDP Per Capita (US$) 2,141FDI, net inflows (US$ mn) (2005) 19.3External Debt (US$ mn) 900External Debt/GDP (%) 81.9CPI Inflation (%) 3.6Exports of goods and services (% of GDP) 16.3Gross Official Reserves (US$ bn) 0.209Gross Official Reserves (in month of imports) 5.1UNDP HDI RaNkING 106Source: AfDB, IMF, UNCTAD, UNDP, UN Population Division
1. overview of Financial system
Banking and insurance
The central bank of Cape Verde, Banco de Cabo
Verde (BCV), is responsible for the supervision of the
financial sector, the setting of interest rates, and price
stability (the primary policy objective). A law, passed
in May 2002 eliminated budget deficit financing by
the central bank.
The financial sector of Cape Verde has a sound and
healthy banking sector, comprising 5 commercial
banks: Banco Commercial do Atlantico (BCA), Caixa
Economica de Cabo Verde (both privatized in 1999-
2000), Banco Cabo-verdiano de Negocios, and 2 new
offshore banks namely Cape Verde-Montepio Geral
Cabo Verde and Banco Portugues de Negocios.
The strength of the banking sector is evident in their
lending operations, which have seen an impressive
improvement of the ratio of non-performing loans,
down from 30% in 1997 to 6.3% as of end-2005.
Cape Verde
sovereign ratings
Longterm
Local Currency
Foreign Currency
Fitch BB- B+
There are 2 insurance companies in the Cape
Verde. There is also a savings institution, Fundo
de Solidariedade Nacional (FSN), which channels
public investment while the Instituto Caboverdiano de
Solidariedade is responsible for international aid.
Capital Markets
A stock market, Bolsa de Valores de Cabo Verde
(BVC) was established in 1999. Activities began with
the trading of 44 Treasury bonds in December, 2005.
As at early 2007, 3 stocks were listed on the exchange
namely Commercial do Atlantico (BCA), Caixa
Economica de Cabo Verde, and a tobacco company.
In addition, as part of a privatisation initiative, there
are government plans for floating shares of Empresa
Nacional de Combustiveis (Enacol), a trader of oil
and by-products, Empresa Nacional de Productos
Farmaceuticos (Emprofac), and Inpharma.
2006 At a Glance

�� – Cape Verde
C
Cape Verde has a relatively active treasury bond
market, comprising of government bonds with
maturities extending up to 2014. No coroporate debt
exists in the market.
2. Fixed income Markets
Government securities
Treasury bonds are issued by the government
of Cape Verde. Outstanding government bonds
amounted to CVE 20.5 bn (USD 245 bn) at year end
2006. Securities are cleared through an electronic
securities clearing and settlement platform.
3. Foreign exchange
The Cape Verde Escudo is pegged to the Euro.
The parity is EUR 1=CVE 110.2651. Current
account transactions, investment in securities and
foreign lending and borrowing pertaining to current
transactions have been liberalized. However, foreign
investors have important guarantees such as privately
managed foreign currency accounts that can be
credited only in foreign currency from abroad or from
other foreign accounts in Cape Verde.
Cape verde treasury Bond yield Curve (end 2006)
4.875
5.375
5.875
2-yr 3-yr 4-yr 5-yr 6-yr 8-y 10-yr
Source: Bolsa de Valores de Cabo Verde
%
Cve per unit of usd (year-end)
4
54
104
154
2001 2002 2003 2004 2005 2006
Source: Bloomberg
4. Key Contacts• Banco de Cabo Verde
Mailing Address: CP 101, Praia, Cape Verde
Other Address: Av. Amilcar Cabral,
117 Praia, Cape Verde
Tel: +238-261-5526/5530
Fax: +238-261-1914/4447
E-mail: [email protected]
Web: www.bcv.cv
Corporate issuers
Plans are in place for corporate bonds issuance by
the end of 2007. These securities will be listed on the
Stock Exchange.
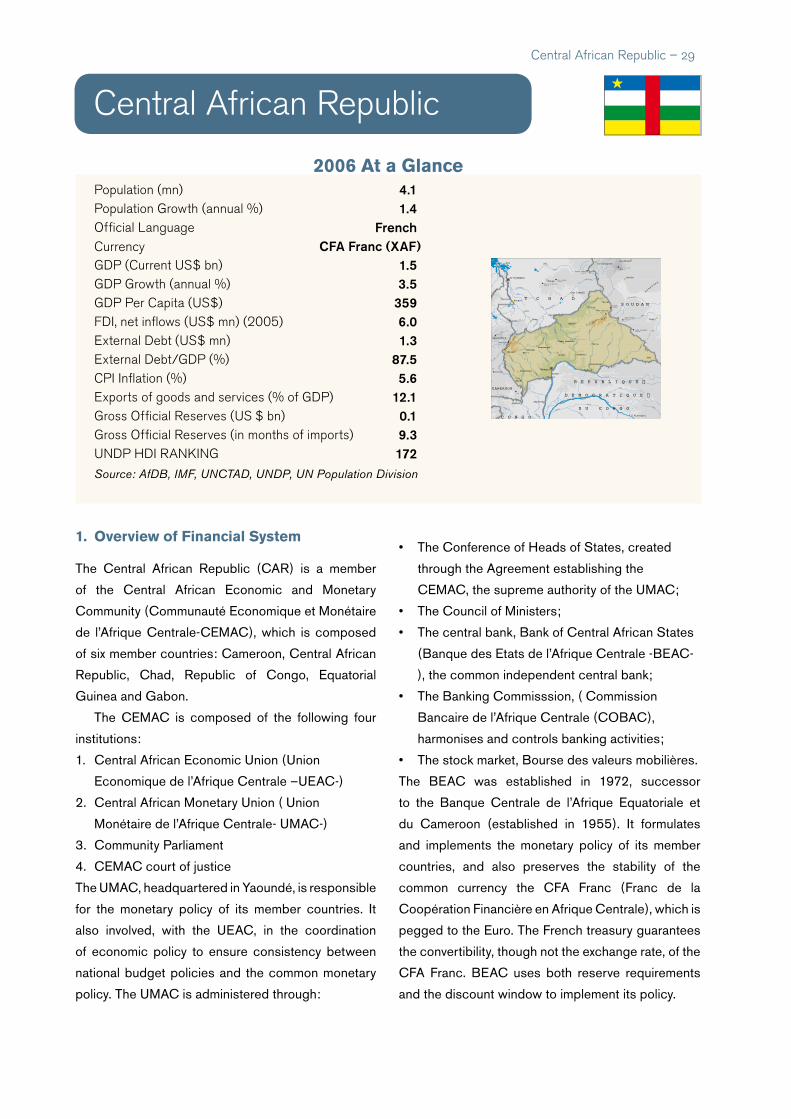
Central African Republic – ��
Population (mn) 4.1Population Growth (annual %) 1.4Official Language FrenchCurrency CFA Franc (XAF)GDP (Current US$ bn) 1.5GDP Growth (annual %) 3.5GDP Per Capita (US$) 359FDI, net inflows (US$ mn) (2005) 6.0 External Debt (US$ mn) 1.3External Debt/GDP (%) 87.5CPI Inflation (%) 5.6Exports of goods and services (% of GDP) 12.1Gross Official Reserves (US $ bn) 0.1Gross Official Reserves (in months of imports) 9.3UNDP HDI RaNkING 172Source: AfDB, IMF, UNCTAD, UNDP, UN Population Division
1. overview of Financial system
The Central African Republic (CAR) is a member
of the Central African Economic and Monetary
Community (Communauté Economique et Monétaire
de l’Afrique Centrale-CEMAC), which is composed
of six member countries: Cameroon, Central African
Republic, Chad, Republic of Congo, Equatorial
Guinea and Gabon.
The CEMAC is composed of the following four
institutions:
1. Central African Economic Union (Union
Economique de l’Afrique Centrale –UEAC-)
2. Central African Monetary Union ( Union
Monétaire de l’Afrique Centrale- UMAC-)
3. Community Parliament
4. CEMAC court of justice
The UMAC, headquartered in Yaoundé, is responsible
for the monetary policy of its member countries. It
also involved, with the UEAC, in the coordination
of economic policy to ensure consistency between
national budget policies and the common monetary
policy. The UMAC is administered through:
Central african Republic
• The Conference of Heads of States, created
through the Agreement establishing the
CEMAC, the supreme authority of the UMAC;
• The Council of Ministers;
• The central bank, Bank of Central African States
(Banque des Etats de l’Afrique Centrale -BEAC-
), the common independent central bank;
• The Banking Commisssion, ( Commission
Bancaire de l’Afrique Centrale (COBAC),
harmonises and controls banking activities;
• The stock market, Bourse des valeurs mobilières.
The BEAC was established in 1972, successor
to the Banque Centrale de l’Afrique Equatoriale et
du Cameroon (established in 1955). It formulates
and implements the monetary policy of its member
countries, and also preserves the stability of the
common currency the CFA Franc (Franc de la
Coopération Financière en Afrique Centrale), which is
pegged to the Euro. The French treasury guarantees
the convertibility, though not the exchange rate, of the
CFA Franc. BEAC uses both reserve requirements
and the discount window to implement its policy.
GEOATLAS - Copyright1998 Graphi-Ogre0 km 100 200 300 400 km
Bangui
N'Djamena
ImpfondoOuesso
Owando
Kisangani
Mbandaka
Maroua
Ngaoundéré
Bertoua
Al-F$shirAl-Junaynah
Nyala
Uwayl
BambariSibut
Birao
Bria
Obo
Bangassou
Mobaye
Ndélé
Kaga Bandoro
Bossangoa
Bimbo
Mbaiki
BozoumBouar
Berbérati
Nola
Bol Ati
Am Timan��
Mongo
Laï
Bongor
Moundou
Sarh
Doba
Lac�Tchad
Ba!ral-'A rab
Bénoué
Ka
bia
M
béré
V ina
Log
oneO
rie
ntal
Logone
Chari
BahrErguig
Gribingui
Bam
ingui
Koukourou
A oukalé
Bahr
Oul
ou
O ua ndjaChari
BahrAzoum
BahrSal
am
at
M
andoul
Batha
Ouham
Ouham
Fala
Lo
m
Kadeï
Kadeï
Boumbé
II
Boumbé
I
Mambéré
Lobaye
Mpoko
Oubangui
O ubangui Kotto
Kotto
Bongou
U ele
M bomou
M
ba
ri
Chinko
Ouara
Rubi
Kyom
Boro
DiouaMam bili
Likouala
Sangha
Sangha
N goko
Likoualaa ux
Herbes
Oubangui
Oubangui
Lulonga
Lopori
Maringa
RukiBusira
Aruw im iLindi
Z aïre
Giri
Zaïre
750 m
Jabal Marrah�3088 m
Jabal Manda�1227 m
929 m
1923 m
Mont Ngaoui�1410 m
Jabal Bolanda�1039 m
Tinga�1282 m
Mont Toussoro�1330 m
Hadjer Kamaran�1040 m
Mont Guédi�1506 m
Massif de Guéra�1613 m
MtsMANDARA
KOR D
OFA
N
M A S SIF
D ES B O N G
M
ASSIFDUYADÉ
R E P U B L I Q U E �
D E M O C R A T I Q U E �
D U C O N G O
C O N G O
S O U D A N
CAMEROUN
T C H A D
REPUBLIQUE CENTRAFRICAINE
2006 At a Glance
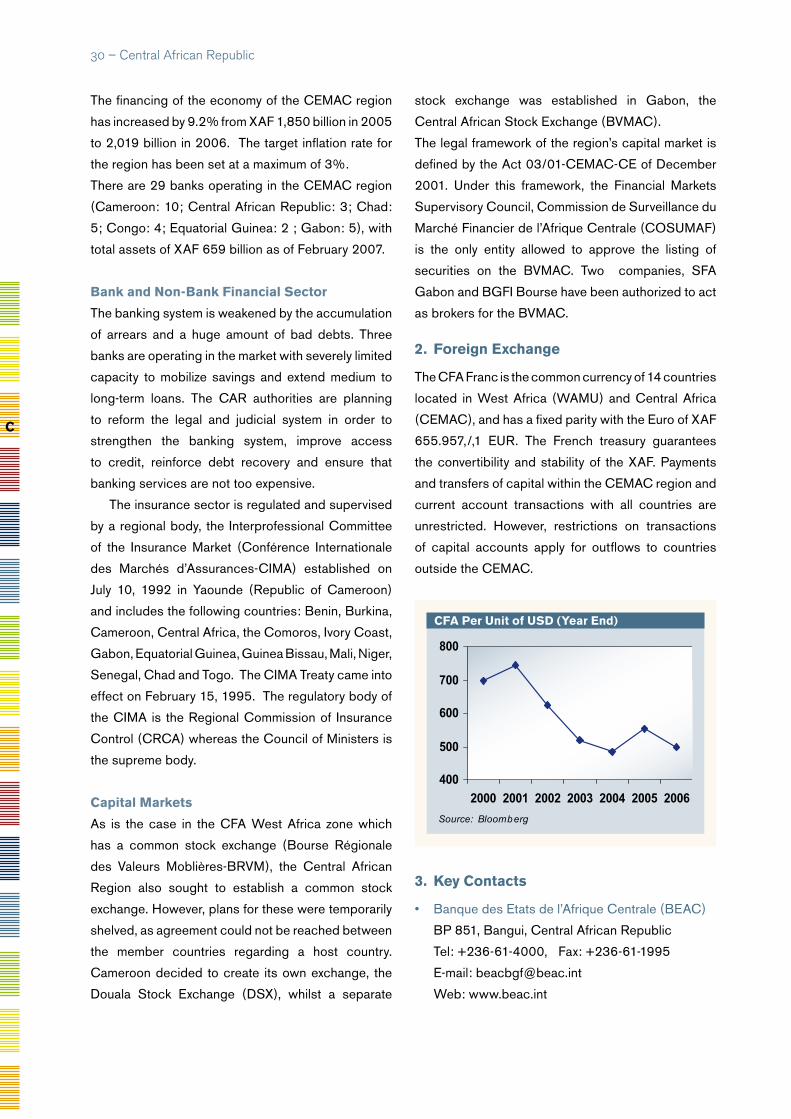
�0 – Central African Republic
C
The financing of the economy of the CEMAC region
has increased by 9.2% from XAF 1,850 billion in 2005
to 2,019 billion in 2006. The target inflation rate for
the region has been set at a maximum of 3%.
There are 29 banks operating in the CEMAC region
(Cameroon: 10; Central African Republic: 3; Chad:
5; Congo: 4; Equatorial Guinea: 2 ; Gabon: 5), with
total assets of XAF 659 billion as of February 2007.
Bank and non-Bank Financial sector
The banking system is weakened by the accumulation
of arrears and a huge amount of bad debts. Three
banks are operating in the market with severely limited
capacity to mobilize savings and extend medium to
long-term loans. The CAR authorities are planning
to reform the legal and judicial system in order to
strengthen the banking system, improve access
to credit, reinforce debt recovery and ensure that
banking services are not too expensive.
The insurance sector is regulated and supervised
by a regional body, the Interprofessional Committee
of the Insurance Market (Conférence Internationale
des Marchés d’Assurances-CIMA) established on
July 10, 1992 in Yaounde (Republic of Cameroon)
and includes the following countries: Benin, Burkina,
Cameroon, Central Africa, the Comoros, Ivory Coast,
Gabon, Equatorial Guinea, Guinea Bissau, Mali, Niger,
Senegal, Chad and Togo. The CIMA Treaty came into
effect on February 15, 1995. The regulatory body of
the CIMA is the Regional Commission of Insurance
Control (CRCA) whereas the Council of Ministers is
the supreme body.
Capital Markets
As is the case in the CFA West Africa zone which
has a common stock exchange (Bourse Régionale
des Valeurs Moblières-BRVM), the Central African
Region also sought to establish a common stock
exchange. However, plans for these were temporarily
shelved, as agreement could not be reached between
the member countries regarding a host country.
Cameroon decided to create its own exchange, the
Douala Stock Exchange (DSX), whilst a separate
stock exchange was established in Gabon, the
Central African Stock Exchange (BVMAC).
The legal framework of the region’s capital market is
defined by the Act 03/01-CEMAC-CE of December
2001. Under this framework, the Financial Markets
Supervisory Council, Commission de Surveillance du
Marché Financier de l’Afrique Centrale (COSUMAF)
is the only entity allowed to approve the listing of
securities on the BVMAC. Two companies, SFA
Gabon and BGFI Bourse have been authorized to act
as brokers for the BVMAC.
2. Foreign exchange
The CFA Franc is the common currency of 14 countries
located in West Africa (WAMU) and Central Africa
(CEMAC), and has a fixed parity with the Euro of XAF
655.957,/,1 EUR. The French treasury guarantees
the convertibility and stability of the XAF. Payments
and transfers of capital within the CEMAC region and
current account transactions with all countries are
unrestricted. However, restrictions on transactions
of capital accounts apply for outflows to countries
outside the CEMAC.
3. Key Contacts
• Banque des Etats de l’Afrique Centrale (BEAC)
BP 851, Bangui, Central African Republic
Tel: +236-61-4000, Fax: +236-61-1995
E-mail: [email protected]
Web: www.beac.int
CFA Per unit of usd (year end)
400
500
600
700
800
2000 2001 2002 2003 2004 2005 2006
Source: Bloomberg
Chad – �1
Population (mn) 10Population Growth (annual %) 2.9Official Language (s) French/ArabicCurrency CFA Franc (XAF)GDP (Current US$ bn) 6.8GDP Growth (annual %) 1.3GDP Per Capita (US$) 679FDI, net inflows (US$ mn) (2005) 705External Debt (US$ mn) 1.6External Debt/GDP (%) 22.9CPI Inflation (annual %) 6.3Exports of goods and services (% of GDP) 53.4Gross official reserves (US $ bn) 0.3Gross official reserves (in months of imports) 3.6UNDP HDI RaNkING 171Source: AfDB, IMF, UNCTAD, UNDP, UN Population Division
1. overview of Financial system
Chad is a member of the Central African Economic
and Monetary Community (Communauté Economique
et Monétaire de l’Afrique Centrale-CEMAC), which
is composed of six member countries: Cameroon,
Central African Republic, Chad, Republic of Congo,
Equatorial Guinea and Gabon. The CEMAC is
composed of the following four institutions:
1. Central African Economic Union (Union
Economique de l’Afrique Centrale –UEAC-)
2. Central African Monetary Union ( Union
Monétaire de l’Afrique Centrale- UMAC-)
3. Community Parliament
4. CEMAC court of justice
The UMAC, headquartered in Yaoundé, is responsible
for the monetary policy of its member countries. It
also involved, with the UEAC, in the coordination
of economic policy to ensure consistency between
national budget policies and the common monetary
policy. The UMAC is administered through:
• The Conference of Heads of States, created
through the Agreement establishing the
CEMAC, the supreme authority of the UMAC;
Chad
GEOATLAS - Copyright1998 Graphi-Ogre0 km 100 200 300 400 km
Maroua
Garoua
Ngaoundéré
Al-Junaynah
BambariSibut
Birao
Bria
Ndélé
Kaga Bandoro
Bossangoa
BozoumBouar
Damaturu
JalingoYola
Maiduguri
Diffa
Faya
Bol Ati
Biltine
Mao
Abéché
Am Timan��
Mongo
Laï
Bongor
Moundou
Sarh
Doba
Pala
Koumra
N'Djamena
Ngadda
Yedseram
D onga
G on g
ola
Bénoué
Faro
Faro
Ka
bia
M
béré
V ina
Log
oneO
rie
ntal
Logone
Chari
BahrErguig
Gribingui
Bam
ingui
Koukourou
A oukalé
Bahr
Oul
ou
O ua ndjaChari
BahrAzoum
BahrSal
am
at
M
andoul
Batha
Ouham
Ouham
FalaM bam Djére
m
Lo
m
M ambéré
Kotto
Bongou
M
ba
ri
Chinko
Ko
m
adugu Yob
e
Kom
adugu G
ana
Lac�Tchad
573 m
Jabal Kuluha�936 m
Jabal Mun�1309 m
Jabal Gurgei�2396 m
Jabal Marrah�3088 m
Jabal Kodo�1441 m
Jabal Tungsunga�1045 m
929 m
1923 m
2019 m
1500 m
Dimlang�2042 m Hoséré�
Vokré�2049 m
1500 m
Mont Ngaoui�1410 m
Tchabal�Mbabo�2460 m
Tchabal�Gangdaba�
1960 m
Tinga�1282 m
Mont Toussoro�1330 m
Bette�2266 m
Emi Koussi�3415 m
Hadjer Mornou�1310 m
Hadjer Niéré�1320 m
Hadjer Kamaran�1040 m
Mont Guédi�1506 m
Massif de Guéra�1613 m
Tarso Ahon�3225 m
Tarso Tieroko�2910 m
Ehi Soni �2500 m
Ehi Timi Ouli�2500 m
Pic Tousside�3315 m
Tarso Ouri�3150 m
Tarso Emissi�2650 m
M fD EL'A D
A M A O U A
MtsMAND
A RA
MtsALA
NTI
KA
Mts�GOTEL
Mts SHEBSHI
MESACH
MELLET
PLATEA
U DEM A RZ ª Q
D E S E R T D E �
M O U R Z O U K JABA
LBI
NG H
U NA YMA H
D E S E R T D E R E B IA N A
SA
R+ R
T I B A S T I
JABAL Bª SUNBUL
PLATEAU�DE TEIGA
M A S SIF
D ES B O N G
M
ASSIFDUYADÉ
ZAG
A O U A
EN
N E D I
D EPR ES S IO N D U M O U R D
B OD
ÉL
É
ER GD U D JO
U R AB
B
OR
KO
U
T I B E S T I
PLATEA U
DU M A N G U ÉN I
PLATEAU�DU TCHIGAÏ
PLATEAU�DU DJADO
TÉNÉRÉ�DU TAFASSÂSSET
TÉ
N
É
R
É
GRA
ND
ER
GD
EB I L
MA
MASSIF�DE TERMIT
MA
NG
A
D E S E R T �
D E L I B Y E
TCHAD
N I G E R I A
SO
UD
AN
R E P U B L I Q U E �C E N T R A F R I C A I N EC A M E R O U N
L I B Y EALGERIE
N I G E R
• The Council of Ministers;
• The central bank, Bank of Central African States
(Banque des Etats de l’Afrique Centrale -BEAC-
), the common independent central bank;
• The Banking Commisssion, ( Commission
Bancaire de l’Afrique Centrale (COBAC),
harmonises and controls banking activities;
• The stock market, Bourse des valeurs mobilières.
The BEAC was established in 1972, the successor
to the Banque Centrale de l’Afrique Equatoriale et
du Cameroon (established in 1955). It formulates
and implements the monetary policy of its member
countries, and also preserves the stability of the
common currency of the member states, the CFA
Franc, which is pegged to the Euro. The French treasury
guarantees the convertibility, but not the exchange
rate, of the CFA Franc (Franc de la Coopération
Financière). BEAC uses both reserve requirements
and the discount window to implement its policy. The
financing of the economy of the CEMAC region has
increased by 9.2% from XAF 1,850 billion in 2005 to
2,019 billion in 2006. The target inflation rate for the
region has been set at a maximum of 3%.
2006 At a Glance
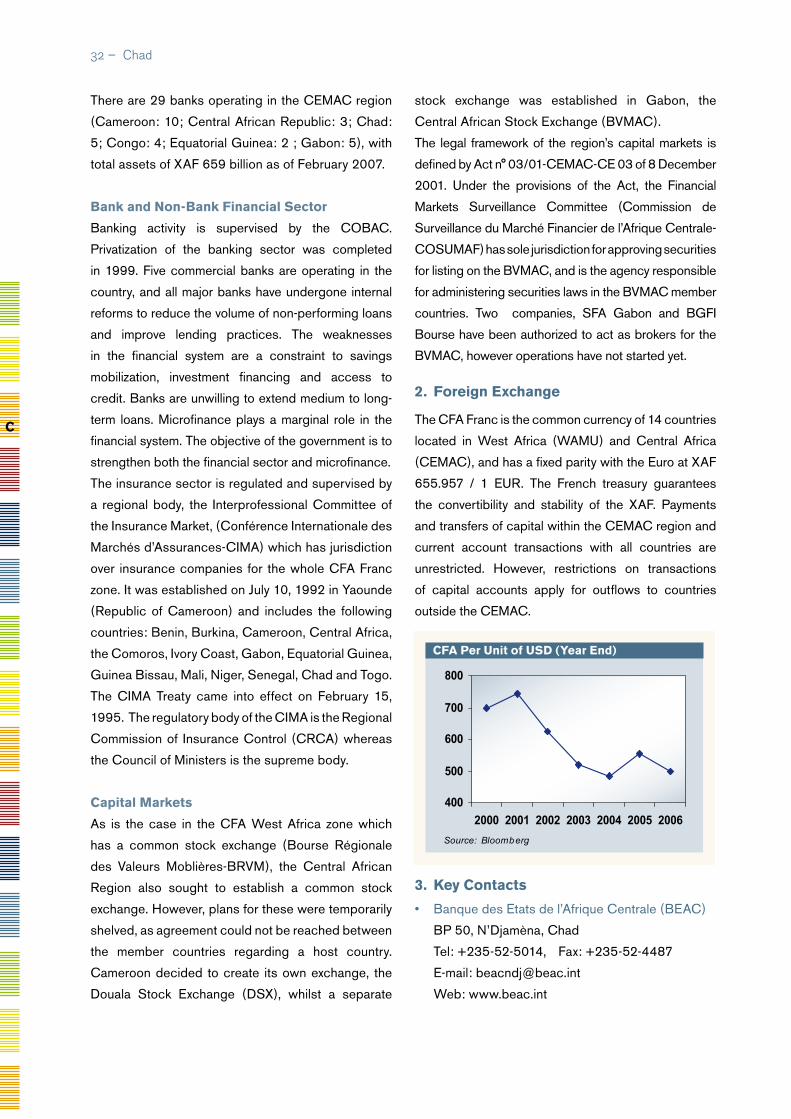
�� – Chad
There are 29 banks operating in the CEMAC region
(Cameroon: 10; Central African Republic: 3; Chad:
5; Congo: 4; Equatorial Guinea: 2 ; Gabon: 5), with
total assets of XAF 659 billion as of February 2007.
Bank and non-Bank Financial sector
Banking activity is supervised by the COBAC.
Privatization of the banking sector was completed
in 1999. Five commercial banks are operating in the
country, and all major banks have undergone internal
reforms to reduce the volume of non-performing loans
and improve lending practices. The weaknesses
in the financial system are a constraint to savings
mobilization, investment financing and access to
credit. Banks are unwilling to extend medium to long-
term loans. Microfinance plays a marginal role in the
financial system. The objective of the government is to
strengthen both the financial sector and microfinance.
The insurance sector is regulated and supervised by
a regional body, the Interprofessional Committee of
the Insurance Market, (Conférence Internationale des
Marchés d’Assurances-CIMA) which has jurisdiction
over insurance companies for the whole CFA Franc
zone. It was established on July 10, 1992 in Yaounde
(Republic of Cameroon) and includes the following
countries: Benin, Burkina, Cameroon, Central Africa,
the Comoros, Ivory Coast, Gabon, Equatorial Guinea,
Guinea Bissau, Mali, Niger, Senegal, Chad and Togo.
The CIMA Treaty came into effect on February 15,
1995. The regulatory body of the CIMA is the Regional
Commission of Insurance Control (CRCA) whereas
the Council of Ministers is the supreme body.
Capital Markets
As is the case in the CFA West Africa zone which
has a common stock exchange (Bourse Régionale
des Valeurs Moblières-BRVM), the Central African
Region also sought to establish a common stock
exchange. However, plans for these were temporarily
shelved, as agreement could not be reached between
the member countries regarding a host country.
Cameroon decided to create its own exchange, the
Douala Stock Exchange (DSX), whilst a separate
stock exchange was established in Gabon, the
Central African Stock Exchange (BVMAC).
The legal framework of the region’s capital markets is
defined by Act n° 03/01-CEMAC-CE 03 of 8 December
2001. Under the provisions of the Act, the Financial
Markets Surveillance Committee (Commission de
Surveillance du Marché Financier de l’Afrique Centrale-
COSUMAF) has sole jurisdiction for approving securities
for listing on the BVMAC, and is the agency responsible
for administering securities laws in the BVMAC member
countries. Two companies, SFA Gabon and BGFI
Bourse have been authorized to act as brokers for the
BVMAC, however operations have not started yet.
2. Foreign exchange
The CFA Franc is the common currency of 14 countries
located in West Africa (WAMU) and Central Africa
(CEMAC), and has a fixed parity with the Euro at XAF
655.957 / 1 EUR. The French treasury guarantees
the convertibility and stability of the XAF. Payments
and transfers of capital within the CEMAC region and
current account transactions with all countries are
unrestricted. However, restrictions on transactions
of capital accounts apply for outflows to countries
outside the CEMAC.
3. Key Contacts
• Banque des Etats de l’Afrique Centrale (BEAC)
BP 50, N’Djamèna, Chad
Tel: +235-52-5014, Fax: +235-52-4487
E-mail: [email protected]
Web: www.beac.int
C
CFA Per unit of usd (year end)
400
500
600
700
800
2000 2001 2002 2003 2004 2005 2006
Source: Bloomberg

Comoros
Population (mn) 0.82Population Growth (annual %) 2.6Official Language (s) French/ArabicCurrency Comorian Franc (KMF)GDP (Current US$ bn) 0.402GDP Growth (annual %) 1.2GDP Per Capita (US$) 491FDI, net inflows (US$ mn) (2005) 1 External Debt (US$ mn) 300External Debt/GDP (%) 68.3CPI Inflation (annual %) 3.8Exports of goods and services (% of GDP) 10.5Gross official reserves (US $ bn) 0.09Gross official reserves (in months of imports) 11.2UNDP HDI RaNkING 132Source: AfDB, IMF, UNCTAD, UNDP, UN Population Division
1. overview of Financial systemThe financial system of the country is small and
concentrated in the banking sector, comprising
Banque des Comoros (the central bank), 1 commercial
bank (Banque pour l’Industrie et le Commerce des
Comores) and 1 development bank (Banque de
Développement des Comores). The government has
stated that it intends to increase competition in the
banking sector. Exim Bank Tanzania plans to open a
subsidiary while a Kuwaiti investor has shown a keen
interest in opening a Merchant Bank in Comoros.
Neither of these two banks is yet operational. Another
commercial bank, the Banque de la Reunion, was
licensed in 2002 to operate in Comoros, but it has yet
to start operations. Micro-finance institutions generally
account for about 20% of lending in the banking
sector. The Central Bank of the Comoros regulates
and supervises the entire financial sector. Comoros
has a small insurance sector but no capital markets.
2. Foreign exchange
The Comorian Franc (KMF) is pegged to the Euro at
KMF 491.96775 / 1 EUR. Exchange rates are officially
quoted on the basis of the fixed rate of the Comorian
Franc for the Euro and the Paris exchange rate for other
currencies. The Comoros has an arrangement with the
French treasury through an Operations Account. With the
exception of transactions relating to gold, the country’s
exchange control measures do not apply to France or to
other countries whose banks of issue are linked to the
French Treasury by an Operations Account (i.e. WAEMU
and CEMAC). Forward cover against exchange rate
risk is authorized by the central bank and is provided to
traders for up to three months by a commercial bank that
is authorized to conduct such transactions.
3. Key Contacts
• Banque Centrale de Comores
B.P. 405, Moroni, Comoros
Tel: +269-73-0243, 72-1002
Fax: +269-73-0349
E-mail: [email protected]
KMF Per unit of usd (year end)
300
400
500
600
2000 2001 2002 2003 2004 2005 2006Source: Bloomberg
Comoros – ��
2006 At a Glance
1. overview of Financial systemCongo is a member of the Central African Economic
and Monetary Community (Communauté Economique
et Monétaire de l’Afrique Centrale-CEMAC), which
is composed of six member countries: Cameroon,
Central African Republic, Chad, Republic of Congo,
Equatorial Guinea and Gabon. The CEMAC is
composed of the following four institutions:
1. Central African Economic Union (Union
Economique de l’Afrique Centrale –UEAC-)
2. Central African Monetary Union ( Union
Monétaire de l’Afrique Centrale- UMAC-)
3. Community Parliament
4. CEMAC court of justice
The UMAC, headquartered in Yaoundé, is responsible
for the monetary policy of its member countries. It
also involved, with the UEAC, in the coordination
of economic policy to ensure consistency between
national budget policies and the common monetary
policy. The UMAC is administered through:
• The Conference of Heads of States, created
through the Agreement establishing the
CEMAC, the supreme authority of the UMAC;
Population (mn) 4.1Population Growth (annual %) 2.9Official Language FrenchCurrency CFA Franc (XAF)GDP (Current US$ bn) 7.4GDP Growth (annual %) 6.8GDP Per Capita (US$) 1,790FDI, net inflows (US$ mn) (2005) 402.0 External Debt (US$ mn) 6.1External Debt/GDP (%) 83.3CPI Inflation (annual %) 4.0Exports of goods and services (% of GDP) 92.2Gross official reserves (US $ bn) 1.2Gross official reserves (in months of imports) 6.1UNDP HDI RaNkING 140
Congo
• The Council of Ministers;
• The central bank, Bank of Central African States
(Banque des Etats de l’Afrique Centrale -BEAC-
), the common independent central bank;
• The Banking Commisssion, ( Commission
Bancaire de l’Afrique Centrale (COBAC),
harmonises and controls banking activities;
• The stock market, Bourse des valeurs mobilières.
The BEAC was established in 1972, the successor
to the Banque Centrale de l’Afrique Equatoriale et du
Cameroon (established in 1955).
It formulates and implements the monetary policy of
its member countries, and also preserves the stability
of the common currency of the member states, the
CFA Franc (Franc de la Cooperation Financiere en
Afrique Centrale), which is pegged to the Euro. The
French treasury guarantees the convertibility (though
not the exchange rate) of the CFA Franc. BEAC uses
both reserve requirements and the discount window
to implement its policy.
The financing of the economy of the CEMAC region
has increased by 9.2% from XAF 1,850 billion in 2005

Congo – ��
to 2,019 billion in 2006. The target inflation rate for
the region has been set at a maximum of 3%.
There are 29 banks operating in the CEMAC
region (Cameroon: 10; Central African Republic: 3;
Chad: 5; Congo: 4; Equatorial Guinea: 2 ; Gabon:
5), with total assets of XAF 659 billion as of February
2007.
Bank and non-Bank Financial sector
Banking activity is supervised by the Commission
Bancaire de l’Afrique Centrale (COBAC), the regional
banking commission for CEMAC countries.
There are four banks operating in Congo. The
microfinance sector comprises about 49 microfinance
institutions which meet the needs of a growing
number of micro-enterprises.
The insurance sector, like the banking sector,
is regulated and supervised by a regional body,
the Interprofessional Committee of the Insurance
Market (Conférence Internationale des Marchés
d’Assurances-CIMA) which has jurisdiction over
insurance companies for the whole CFA Franc zone.
It was established on July 10, 1992 in Yaounde
(Republic of Cameroon) and includes the following
countries: Benin, Burkina, Cameroon, Central Africa,
the Comoros, Ivory Coast, Gabon, Equatorial Guinea,
Guinea Bissau, Mali, Niger, Senegal, Chad and Togo.
The CIMA Treaty came into effect on February 15,
1995. The regulatory body of the CIMA is the Regional
Commission of Insurance Control (CRCA) whereas
the Council of Ministers is the supreme body.
Capital Markets
As in the case of the CFA West Africa zone which has
a common stock exchange (Bourse Régionale des
Valeurs Moblières-BRVM), the Central African Region
also sought to establish a common stock exchange.
However, plans for these were temporarily shelved, as
agreement could not be reached between the member
countries on a host country. Cameroon decided to create
its own exchange, the Douala Stock Exchange (DSX),
whilst a separate stock exchange was established in
Gabon, the Central African Stock Exchange (BVMAC).
The legal framework of the region’s capital
markets is defined by Act n° 03/01-CEMAC-CE 03
of 8 December 2001. Under the provisions of the
Act, the Financial Markets Surveillance Committee
(Commission de Surveillance du Marché Financier de
l’Afrique Centrale-COSUMAF) has sole jurisdiction in
approving securities for listing on the BVMAC. It is the
agency responsible for administering securities laws
in the BVMAC member countries. Two companies,
SFA Gabon and BGFI Bourse have been authorized
to act as brokers for the BVMAC.
2. Foreign exchange
The CFA Franc is the common currency of 14 countries
located in West Africa (WAMU) and Central Africa
(CEMAC), and has a fixed parity with the Euro at XAF
655.957 / 1 EUR. The French treasury guarantees
the convertibility and stability of the XAF. Payments
and transfers of capital within the CEMAC region and
current account transactions with all countries are
unrestricted. However, restrictions on transactions
of capital accounts apply for outflows to countries
outside the CEMAC.
3. Key Contacts
• Banque des Etats de l’Afrique Centrale (BEAC)
B.P. 126, Brazzavile, Congo
Tel: +242-281-1073
Fax: +242-281-1094
E-mail: [email protected]
Web: www.beac.int
CFA Per unit of usd (year end)
400
500
600
700
800
2000 2001 2002 2003 2004 2005 2006
Source: Bloomberg
1. overview of Financial system
Côte d’Ivoire is a member of the West African
Economic and Monetary Union (UEMOA) established
in January 1994, and comprising eight West African
countries (Benin, Burkina Faso, Côte d’Ivoire, Mali,
Niger, Senegal, Togo, and Guinea Bissau) which are
members of the Franc Zone and use the CFA Franc
(XOF) issued by the Central Bank (BCEAO). The
UEMOA financial markets are administered through
the following institutions:
• The Conference of Heads of State, which decides
on the accession of new members.
• The Council of Ministers, which defines, among
others, the monetary and credit policy of the Union
to safeguard the value of the CFA Franc.
• The UEMOA Commission, as delegated by the
Council of Ministers, is in charge of the day-to-day
administration of the Union.
• The Central Bank of West African States (BCEAO)
is the central bank and controls the Banking
Commission (Commission Bancaire) responsible
for overseeing and supervising banks and financial
institutions. The BCEAO also controls the
Savings and Financial Markets Regional Council
(CREPMF). The capital of BCEAO, currently
called up in the amount of XOF 134 bn, is entirely
subscribed by the member States and shared
equally among them.
• Micro-finance institutions are governed by a
separate law, the PARMEC (Projet d’Appui à
la Réglementation des Mutuelles d’Epargne et
de Crédit) Law, which regulates micro-finance
activities in all WAEMU countries.
Côte d’Ivoire is also a signatory to the OHADA
Treaty, which harmonizes business law in 16 countries
in Sub-Sahara Africa, including all the UEMOA
countries.
The main objective of the monetary policy as
defined by the UEMOA and implemented by the
BCEAO, is to ensure price stability and safeguard the
Cote d’Ivoire
Population (mn) 18.5Population Growth (annual %) 1.6Official Language FrenchCurrency CFA France (XOF)GDP (Current US$ bn) 17.3GDP Growth (annual %) 1.4GDP Per Capita (US$) 936FDI, net inflows (US$ mn) (2005) 192 External Debt (US$ mn) 13,000External Debt/GDP (%) 75.3CPI Inflation (annual %) 2.4Exports of goods and services (% of GDP) 52.5Gross Official Reserves (US$ bn) 1.5Gross Official Reserves (in months of imports) 3.6UNDP HDI RaNkING 164Source: AfDB, IMF, UNCTAD, UNDP, UN Population Division
GEOATLAS - Copyright1998 Graphi-Ogre0 km 100 200 300 400 km
Cap St-Paul
Cap des�Trois Pointes
Cap des�Palmes
Cap Mesurado
Baie du Sino
Baie du Cestos
C OTE
D EL'O R
C O T ED E L 'I V O I R E
COTEDES
GR A IN E S
O C E A N �
A T L A N T I Q U E
Tabou
Tengréla
M'bahiakro
FerkessédougouBoundiali
ToubaMankono
Dabakala
Katiola
BéoumiSakassou
Bouna
Tanda
DaoukroBokanda
Bongouanou
Agnibilékrou
Grand-�Bassam
Adiaké
Sassandra
Dabou
Jacqueville
Adzopé
AlépéGrand-�Lahou
Tiassalé
Tiébissou
ToumodiSinfraOumé
Lakota
Guiglo
Gagnoa
Vavoua
Issia
Danané
Duékoué
Soubré
Monrovia
Yamoussoukro
AbidjanLomé
Accra
BamakoOuagadougou
Korhogo
Odienné
Séguéla
BouakéBondoukou
San-Pédro
Bouaflé
Divo
Dimbokro
Abengourou
Agboville
Daloa
Man
Aboisso
Harper
Voinjama
Barclayville
Greenville
RobertsportTubmanburg
Bensonville Kakata
Gbarnga
Buchanan
Sanniquellie
River Cess
Zwedru
Atakpamé
Sokodé
Lama-Kara
Dapango
Nzérékoré
Kankan
Faranah
Labé
Mamou Bolgatanga
Tamale
Sunyani
Kumasi
Sekondi-TakoradiCape Coast
Koforidua
Ho
Natitingou
Lokossa
Tillaberi
Kayes
Sikasso
Ségou
Mopti
Makeni
KenemaBo
Bobo Dioulasso
Gorom-Gorom
Fada�NgourmaKoudougou
Lac Volta
Sén
égal
Falém
é
Bakoy
Bafing
Bafing
G am bie
Ga m
bie
Tinkisso
Kouya
Milo D
ionM ong o
Rokel
Bagbe
Moa
Meli
M
oro
Man
o
M
ano
Lofa
SaintPa
ul
C esto
s
Nuon
Cavally
D ube
Sassa
n dra
Sassandra
Bandamarouge
Ba nd
ama
Nzi
Bandam
aBlanc
Nzi
Kom
oé
Komoé
Léra
ba
Bia
Tano
Pra
Dak
a
Oti
Oti
Mono
Bagoé
Bani
Ba
ni
N iger
Volta
Noire
Volta B lanch e
N ig
er
N iger
844 m
Mont Agou�986 m
Afadjoto�885 m
863 m
Djébobo�876 m
Akwawa�788 m
Kwamisa�767 m
1208 m
1002 m
Mont Kopé�424 m
Mount�Nimba�1752 m
Sankanbiaiwa�1709 m
Mt�Wutevem�1380 m
Bintimani�1945 m
Mount�Kavendou�1421 m
1538 m
1117 m
1108 m
1257 m
Pic de Tio�1443 m
PLA TEA U KW A HU
CHAIN
EAKW
APIN
Mts
D UTOU RA
Mts�PUTU
Mts BO
NGMts
KPO
Mts�LOMA
Mf�DU TAMGUÉ
FOUTA�DJALON
KAARTA
BENIN
G H A N A
T O G O
L I B E R I A
SIERRA�LEONE
G U I N E E
SENEGAL
M A L IN I G E R
B U R K I N A F A S O
COTE D'IVOIRE
�� – Cote d’Ivoire
C
2006 At a Glance
domestic and foreign value of the CFA Franc through
appropriate coverage of currency issue by foreign
exchange reserves.
Bank and non-Bank Financial sector
As of December 2006, there were 93 banks and 22
financial institutions operating in the UEMOA zone,
with 16 banks and two financial institutions located in
Côte d’Ivoire. The total balance sheets of the financial
system in Côte d’Ivoire, amounted to XOF 2001 bn at
the end of 2005, with the banks accounting for 98%,
representing 26% of the country’s GDP. Despite
the difficult social-political situation, Côte d’Ivoire
still accounts for the biggest portion (30%) of the
UEMOA financial system. The resources of banks
and financial institutions amount to XOF 1,883 bn,
including XOF 233 bn as net equity capital. Branches
and subsidiaries of foreign or regional banks play a
relatively important role in financial intermediation
in UEMOA. In fact, eight groups (including Société
Générale, BNP Paribas, Crédit Lyonnais, Citibank,
Bank of Africa, Ecobank, and Financial B.C.)
dominate the UEMOA banking system with relatively
wide national networks.
The insurance sector in Côte d’Ivoire is regulated
and supervised by the Inter-African Conference of
Insurance Markets (CIMA) established on 10 July
1992 in Yaounde (Republic of Cameroon). It includes
the following countries: Benin, Burkina Faso,
Cameroon, Central African Republic, the Comoros,
Côte d’Ivoire, Gabon, Equatorial Guinea, Guinea
Bissau, Mali, Niger, Senegal, Chad and Togo. The
CIMA Treaty came into effect on 15 February 1995.
The regulatory body of the CIMA is the Regional
Commission of Insurance Control (CRCA), whereas
the Council of Ministers is its highest body. The total
portfolio of the UEMOA CIMA zone is dominated by
the secor of non-life insurance. Compared to GDP
of 2005, the turnover of the insurance sector in Ivory
Coast represents 1.51%, well below the average
ratio in Africa of 4.8%. At the end of 2005, 10 life
insurance and 20 non-life insurance companies were
operating in the country, with a total turnover of XOF
130 bn; life insurance products represented 39%
and vehicle insurance 24% of the turnover.
Capital Markets
The Regional Stock Exchange (BRVM), the stock
market for the UEMOA region, started operating in
September 1998. It is located in Abidjan and has
a branch in each capital city of the other member
States of the Union. Its main role is to pool and
process stock market orders transmitted by brokerage
companies (Société de Gestion et d’Intermédiation-
SGI) authorized to negotiate securities quoted on
the BRVM. As of December 2006, 19 SGIs were
registered in the Union with nine located in Côte
d’Ivoire. The BRVM is regulated by the CREPMF
whose responsibilities include the promulgation
of policies and procedures to regulate the BRVM,
and the promotion of a regional bond market. In
order to list on the BRVM, all bond issues must be
guaranteed by an approved financial institution, a
development financial institution, a guarantee fund, or
the Parent Company. At the end of December 2006,
the capitalization of the equity market was XOF 2067
bn whereas the bond market capitalization stood at
XOF 489 bn, with XOF 260 bn being government
bonds, representing 1.07% of the GDP of the Union.
By end-December 2006, 61 securities were listed,
including 40 shares and 21 bonds, compared to 57
securities comprising 39 shares and 18 bonds by
end-December 2005. Out of the 40 companies that
are listed on the Exchange in December 2006, all but
four were Ivorian institutions.
2. Fixed income Markets
The benchmark issuer in the UEMOA zone is the
West African Development Bank (BOAD), a regional
multilateral bank. Since 1999, BOAD accounts for
close to 22% of all the public debt issues in the market,
i.e. XOF 102 bn. In the absence of a government yield
curve, BOAD bonds are used as benchmarks.
Cote d’Ivoire – ��

outstanding BoAd Bonds
titleFace Amount (XoF billion)
year of Listing
Frequency expiration date
Listed Bonds
BOAD 6,25% 1999-2009 20.12 1999 Annual 1-Feb-2009
BOAD 6,30% 1999-2007 17.05 2000 Annual 27-Oct-07
BOAD 5.85% 2001-2008 11,95 2003 Annual 4-Jan-08
BOAD 5.35%, 2004-2011 22.70 2005 Annual 5-Nov-11
BOAD 5% 2005-2013 18,60 2005 Annual 28-Dec-13
BOAD 4,5%, 2005-2011 6,404 2005 Annual 28-Dec-11
Cote d’ivoire Government treasury Bond
titleFace Amount (XoF billion)
year of Listing
Frequency expiration date
Listed Bonds
TRESOR PUBLIC DE CI 6,50% 2005-2008 86.13 2005 Annual 15-Jul-08
TRESOR PUBLIC DE CI 6,50% 2006-2009 84,20 2006 Annual 17-Jul-09
Government securities
The Ivorian Government has in the past mainly funded
itself by borrowing from the central bank. In 2006,
however, the Government opted for the bond market to
fund its deficit. Out of the total amount of outstanding
public bonds listed on the BRVM by the end of 2006,
Côte d’Ivoire accounts for XOF 170 bn, representing
Cote d’ivoire - non-government debt issuance
titleFace Amount (XoF billion)
year of Listing
Frequency expiration date
Listed Bonds
SAGA-CI 7.5% 2002-2007 3.00 2002 Annual 3-Mar-03
Private Placement Bonds
SMB 7.5% 2003-2008 5.00 2004 Semi-annual 11-Dec-08
NESTLE SA 6.50% 2004-2009 10.00 2004 Annual 26-Jan-09
SIFCA 6.50% 2005-2011 11.00 2005 Semi-annual 3-Mar-11
SAFCA 7% 2005-2010 3.00 2005 Semi-annual 17-Oct-10
�� – Cote d’Ivoire
C
non-Central Government issuance
The CREPMF requires that corporate bonds be
guaranteed before they can be listed. This might be
one of the reasons why most of the corporate issues
42% of total bond market capitalization and 65.4%
of all outstanding government bonds in the market.
Compared to the country’s GDP at the same period,
sovereign bonds has a ratio of 3%. Institutional investors
were the main buyers, representing over 80% of the
total allocation, with more than half of the bond holders
originating from the sub-region.
are privately placed and remain unlisted. Overall, the
use of the debt capital market by Ivorian corporate is
rather limited.
secondary Market
As a consequence of the buy-and-hold attitude of
most investors, the secondary market in fixed-income
securities in the UEMOA zone is fairly illiquid.
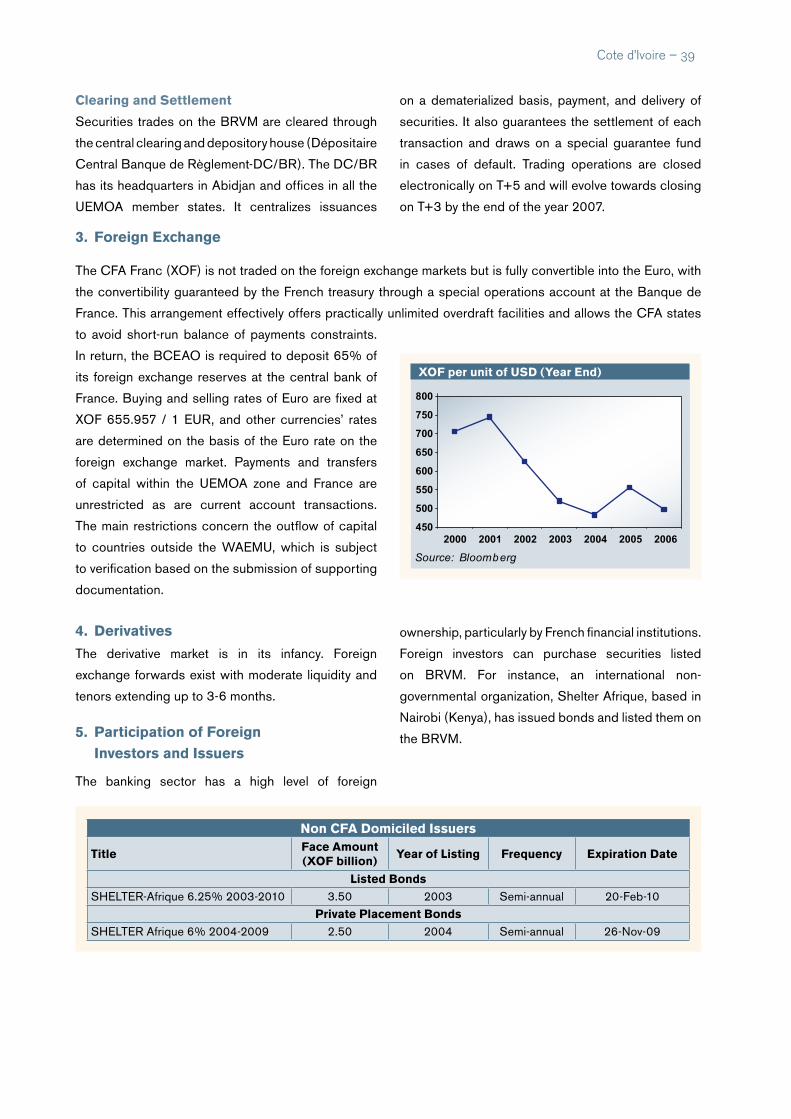
3. Foreign exchange
The CFA Franc (XOF) is not traded on the foreign exchange markets but is fully convertible into the Euro, with
the convertibility guaranteed by the French treasury through a special operations account at the Banque de
France. This arrangement effectively offers practically unlimited overdraft facilities and allows the CFA states
to avoid short-run balance of payments constraints.
In return, the BCEAO is required to deposit 65% of
its foreign exchange reserves at the central bank of
France. Buying and selling rates of Euro are fixed at
XOF 655.957 / 1 EUR, and other currencies’ rates
are determined on the basis of the Euro rate on the
foreign exchange market. Payments and transfers
of capital within the UEMOA zone and France are
unrestricted as are current account transactions.
The main restrictions concern the outflow of capital
to countries outside the WAEMU, which is subject
to verification based on the submission of supporting
documentation.
XoF per unit of usd (year end)
450
500
550
600
650
700
750
800
2000 2001 2002 2003 2004 2005 2006
Source: Bloomberg
Cote d’Ivoire – ��
Clearing and settlement
Securities trades on the BRVM are cleared through
the central clearing and depository house (Dépositaire
Central Banque de Règlement-DC/BR). The DC/BR
has its headquarters in Abidjan and offices in all the
UEMOA member states. It centralizes issuances
4. derivatives
The derivative market is in its infancy. Foreign
exchange forwards exist with moderate liquidity and
tenors extending up to 3-6 months.
5. Participation of Foreign investors and issuers
The banking sector has a high level of foreign
non CFA domiciled issuers
titleFace Amount (XoF billion)
year of Listing Frequency expiration date
Listed BondsSHELTER-Afrique 6.25% 2003-2010 3.50 2003 Semi-annual 20-Feb-10
Private Placement BondsSHELTER Afrique 6% 2004-2009 2.50 2004 Semi-annual 26-Nov-09
on a dematerialized basis, payment, and delivery of
securities. It also guarantees the settlement of each
transaction and draws on a special guarantee fund
in cases of default. Trading operations are closed
electronically on T+5 and will evolve towards closing
on T+3 by the end of the year 2007.
ownership, particularly by French financial institutions.
Foreign investors can purchase securities listed
on BRVM. For instance, an international non-
governmental organization, Shelter Afrique, based in
Nairobi (Kenya), has issued bonds and listed them on
the BRVM.
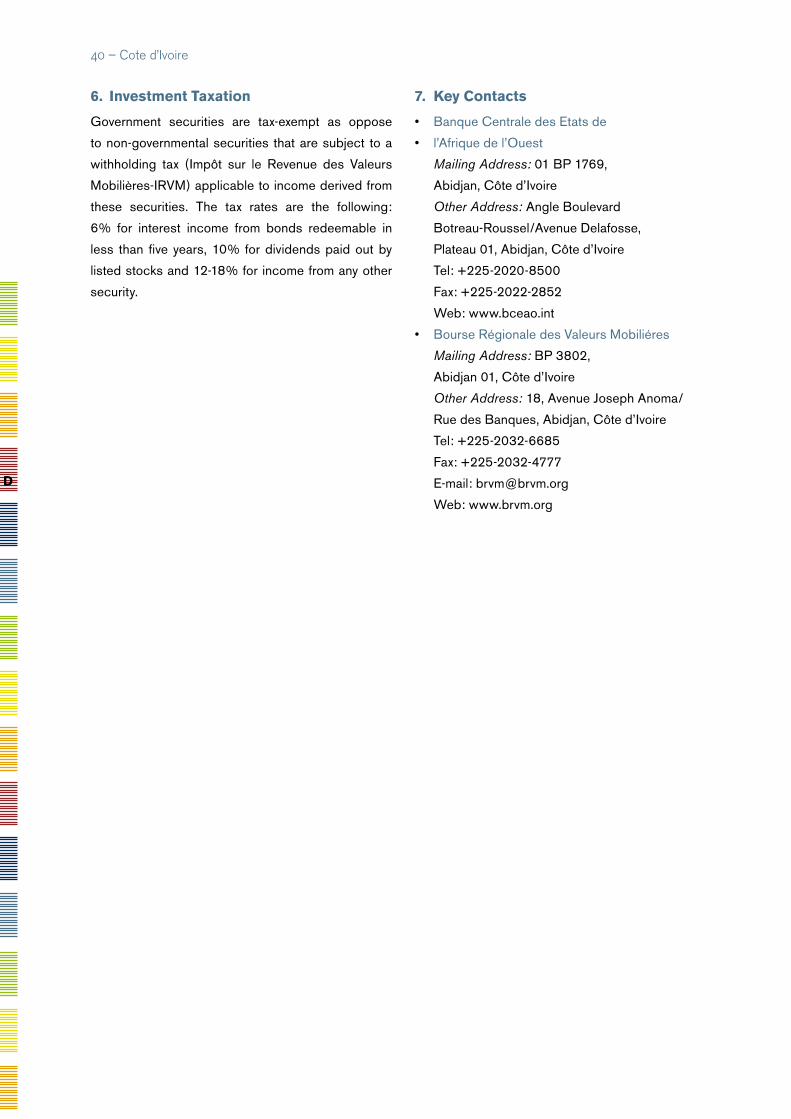
6. investment taxation
Government securities are tax-exempt as oppose
to non-governmental securities that are subject to a
withholding tax (Impôt sur le Revenue des Valeurs
Mobilières-IRVM) applicable to income derived from
these securities. The tax rates are the following:
6% for interest income from bonds redeemable in
less than five years, 10% for dividends paid out by
listed stocks and 12-18% for income from any other
security.
�0 – Cote d’Ivoire
7. Key Contacts
• Banque Centrale des Etats de
• l’Afrique de l’Ouest
Mailing Address: 01 BP 1769,
Abidjan, Côte d’Ivoire
Other Address: Angle Boulevard
Botreau-Roussel/Avenue Delafosse,
Plateau 01, Abidjan, Côte d’Ivoire
Tel: +225-2020-8500
Fax: +225-2022-2852
Web: www.bceao.int
• Bourse Régionale des Valeurs Mobiliéres
Mailing Address: BP 3802,
Abidjan 01, Côte d’Ivoire
Other Address: 18, Avenue Joseph Anoma/
Rue des Banques, Abidjan, Côte d’Ivoire
Tel: +225-2032-6685
Fax: +225-2032-4777
E-mail: [email protected]
Web: www.brvm.org
d
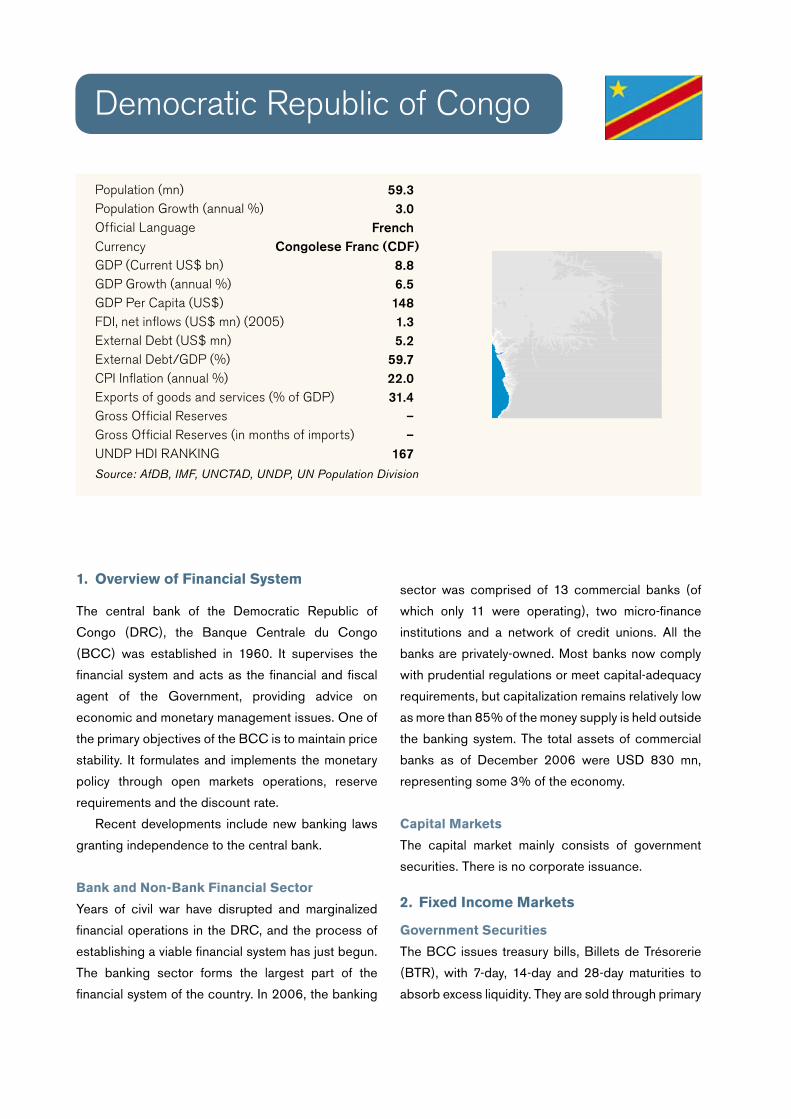
– �1
Population (mn) 59.3Population Growth (annual %) 3.0Official Language FrenchCurrency Congolese Franc (CDF)GDP (Current US$ bn) 8.8GDP Growth (annual %) 6.5GDP Per Capita (US$) 148FDI, net inflows (US$ mn) (2005) 1.3 External Debt (US$ mn) 5.2External Debt/GDP (%) 59.7CPI Inflation (annual %) 22.0Exports of goods and services (% of GDP) 31.4Gross Official Reserves –Gross Official Reserves (in months of imports) –UNDP HDI RaNkING 167Source: AfDB, IMF, UNCTAD, UNDP, UN Population Division
1. overview of Financial system
The central bank of the Democratic Republic of
Congo (DRC), the Banque Centrale du Congo
(BCC) was established in 1960. It supervises the
financial system and acts as the financial and fiscal
agent of the Government, providing advice on
economic and monetary management issues. One of
the primary objectives of the BCC is to maintain price
stability. It formulates and implements the monetary
policy through open markets operations, reserve
requirements and the discount rate.
Recent developments include new banking laws
granting independence to the central bank.
Bank and non-Bank Financial sector
Years of civil war have disrupted and marginalized
financial operations in the DRC, and the process of
establishing a viable financial system has just begun.
The banking sector forms the largest part of the
financial system of the country. In 2006, the banking
sector was comprised of 13 commercial banks (of
which only 11 were operating), two micro-finance
institutions and a network of credit unions. All the
banks are privately-owned. Most banks now comply
with prudential regulations or meet capital-adequacy
requirements, but capitalization remains relatively low
as more than 85% of the money supply is held outside
the banking system. The total assets of commercial
banks as of December 2006 were USD 830 mn,
representing some 3% of the economy.
Capital Markets
The capital market mainly consists of government
securities. There is no corporate issuance.
2. Fixed income Markets
Government securities
The BCC issues treasury bills, Billets de Trésorerie
(BTR), with 7-day, 14-day and 28-day maturities to
absorb excess liquidity. They are sold through primary
Democratic Republic of Congo

dealers who are essentially banks. They are issued
weekly, and freely tradable through the banking
system. The rates are set by the BCC based on the
year-to-date inflation levels plus a premium. The day-
count basis convention used for BTRs is actual /
365.
A total amount of CDF 351 bn (USD 702 mn) was
issued in 2006.
secondary Market
BTRs are marketable securities and could theoretically
be traded over-the-counter by commercial banks, but
investors typically hold them to maturity. In effect, their
short tenors and high yield, compared to inflation,
make BTRs an interesting instrument to hold until
maturity.
Clearing and settlement
Each bank holds a securities account with the central
bank and a special clearing and settlement session
is organized every Wednesday to pay the BTRs
presented on collection by banks and to issue new
ones for purchases presented by banks.
3. Foreign exchange
A new currency, the Congolese Franc (CDF), was
introduced in 1998. The currency had to be gradually
devalued following a 500% hyperinflation in 1999 and
a sharp decline of exports. A new floating exchange
rate system was established in May 2001 to respond
to the increasing difference between the official
exchange rate and the black market one, 44% in 1998
to 545% in 2001. Following gains in lowering the
inflation rate, the Congolese Franc has found some
stability in recent years. There are no restrictions on
current account transactions.
4. Participation of Foreign investors and issuers
Foreign investors can purchase treasury bills.
5. investment taxationTaxes are not levied on treasury bills.
6. Key Contacts• Banque Centrale du Congo
Mailing Address: B.P. 2697, Kinshasa,
Democratic Republic of Congo
Other Address: Boulevard Colonnel Tshashi
563, Kinshasa, Democratic Republic of Congo
Tel: +243-122-0704
Fax: +243-880-5152
E-mail: [email protected]
Web: www.bcc.cd
CdF Per unit of usd (year end)
200
300
400
500
600
2001 2002 2003 2004 2005 2006Source: Bloomberg
d
�� – Democratic Republic of Congo

Djibouti – ��
Population (mn) 0.81Population Growth (annual %) 1.7Official Language FrenchCurrency Djiboutian Franc (DJF)GDP (Current US$ bn) 0.76GDP Growth (annual %) 4.2GDP Per Capita (US$) 943FDI, net inflows (US$ mn) (2005) 23 External Debt (US$ mn) 0.4External Debt/GDP (%) 59CPI Inflation (annual %) 3.0Exports of goods and services (% of GDP) 36.3Gross Official Reserves (bnUS$) 0.103Gross Official Reserves (in months of import) 3.7UNDP HDI RaNkING 148Source: AfDB, IMF, UNCTAD, UNDP, UN Population Division
1. overview of Financial system
The financial system of Djibouti consists primarily
of a small banking sector. The financial sector is
supervised and regulated by the Banque Centrale de
Djibouti, the central bank. Djibouti is a member of the
regional Free Trade Area of the Common Market for
Eastern and Southern Africa (COMESA).
Bank and non-Bank Financial sector
The banking sector is comprised of 3 commercial
banks (two of which are owned by French banks) and
the Commercial Bank of Ethiopia, providing deposits
and international transactions services to Ethiopian
customers engaged in imports/exports, given that
Djibouti provides port facilities for Ethiopea. In
addition, the Development Fund for Djibouti (FDD),
established in 2001, is mandated to extend loans
for rural and tourist development, but it is not fully
operational. As of end-2005, the two French-owned
banks, namely the Banque pour le Commerce et
l’Industrie-Mer Rouge (51% owned by Banque
Nationale de Paris) and the Banque Indosuez-Mer
Rouge (owned by Groupe Indosuez of France),
together accounted for almost 95% of deposits and
a credit-extension share of more than 85%.
The pension system is based on a pay-as-you-go
system that was created by the French administration
before Djibouti’s independence, and is comprised
of the following three pension funds: the Caisse
Nationale de Retraite for civil servants, the Organisme
de Protection Sociale for private sector employees
and public enterprises, and the Caisse Militaire de
Retraite for military personnel.
Djibouti
2006 At a Glance
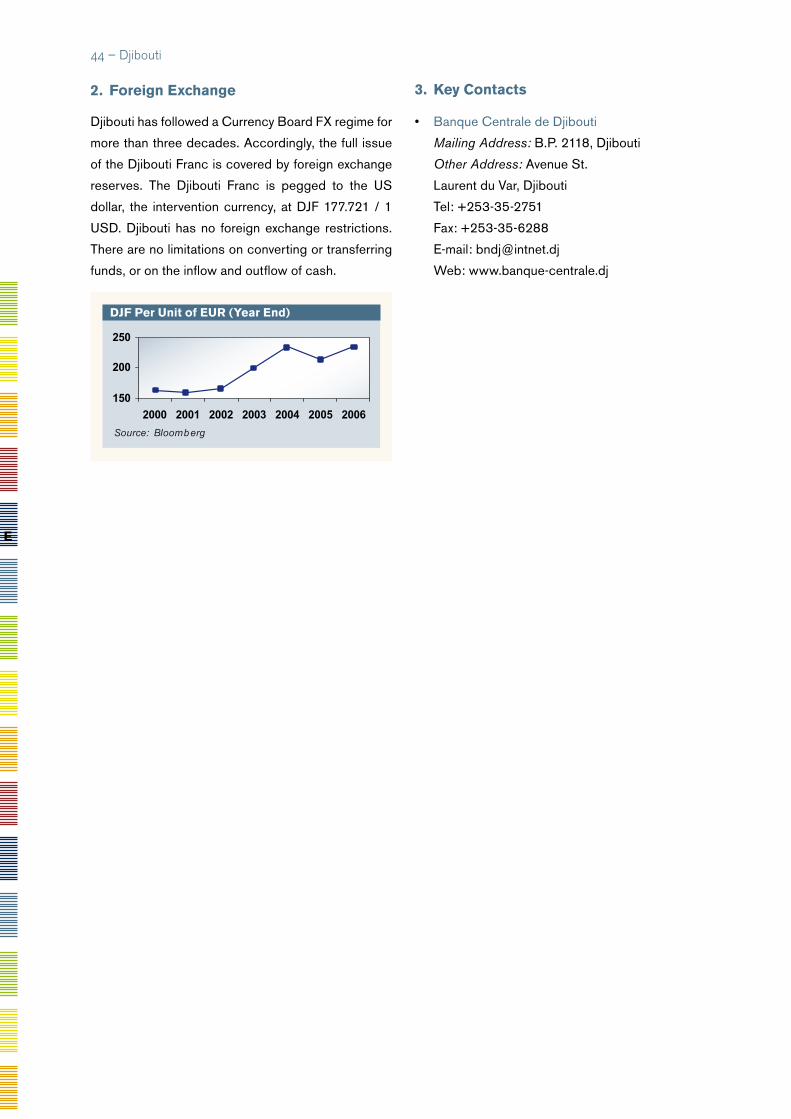
�� – Djibouti
2. Foreign exchange
Djibouti has followed a Currency Board FX regime for
more than three decades. Accordingly, the full issue
of the Djibouti Franc is covered by foreign exchange
reserves. The Djibouti Franc is pegged to the US
dollar, the intervention currency, at DJF 177.721 / 1
USD. Djibouti has no foreign exchange restrictions.
There are no limitations on converting or transferring
funds, or on the inflow and outflow of cash.
dJF Per unit of eur (year end)
150
200
250
2000 2001 2002 2003 2004 2005 2006
Source: Bloomberg
3. Key Contacts
• Banque Centrale de Djibouti
Mailing Address: B.P. 2118, Djibouti
Other Address: Avenue St.
Laurent du Var, Djibouti
Tel: +253-35-2751
Fax: +253-35-6288
E-mail: [email protected]
Web: www.banque-centrale.dj
e
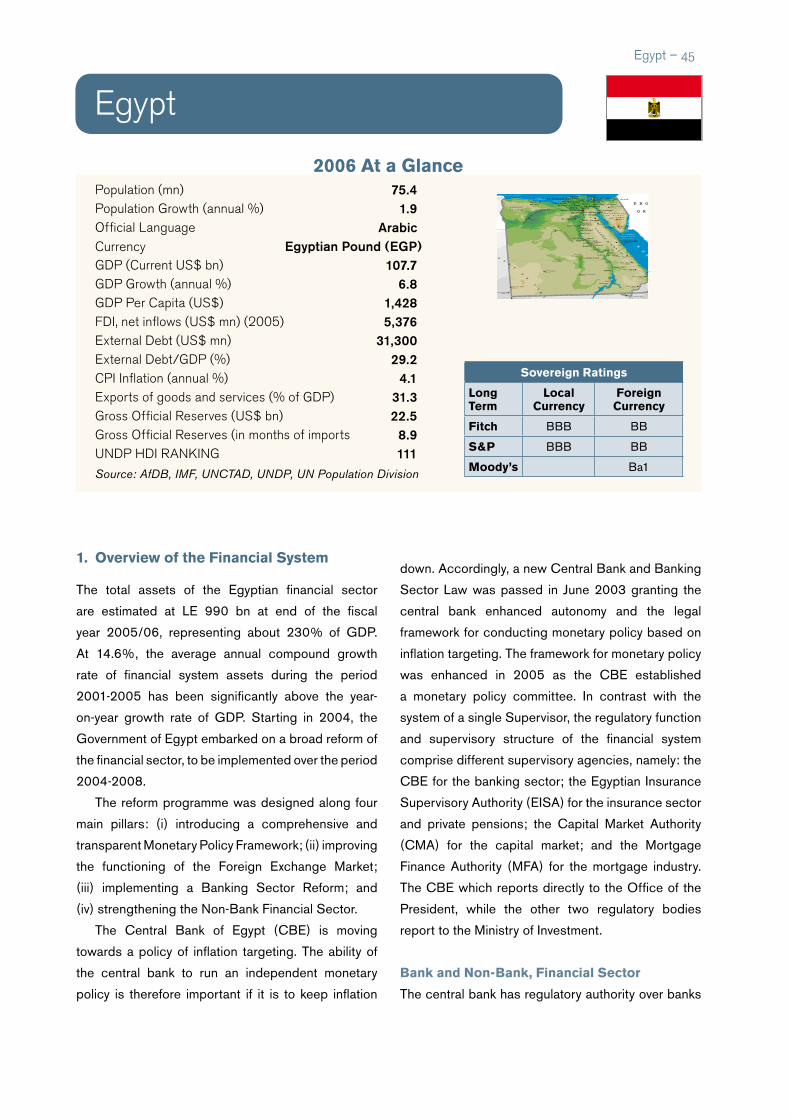
Population (mn) 75.4Population Growth (annual %) 1.9Official Language ArabicCurrency Egyptian Pound (EGP)GDP (Current US$ bn) 107.7GDP Growth (annual %) 6.8GDP Per Capita (US$) 1,428FDI, net inflows (US$ mn) (2005) 5,376 External Debt (US$ mn) 31,300External Debt/GDP (%) 29.2CPI Inflation (annual %) 4.1Exports of goods and services (% of GDP) 31.3Gross Official Reserves (US$ bn) 22.5Gross Official Reserves (in months of imports 8.9UNDP HDI RaNkING 111Source: AfDB, IMF, UNCTAD, UNDP, UN Population Division
1. overview of the Financial system
The total assets of the Egyptian financial sector
are estimated at LE 990 bn at end of the fiscal
year 2005/06, representing about 230% of GDP.
At 14.6%, the average annual compound growth
rate of financial system assets during the period
2001-2005 has been significantly above the year-
on-year growth rate of GDP. Starting in 2004, the
Government of Egypt embarked on a broad reform of
the financial sector, to be implemented over the period
2004-2008.
The reform programme was designed along four
main pillars: (i) introducing a comprehensive and
transparent Monetary Policy Framework; (ii) improving
the functioning of the Foreign Exchange Market;
(iii) implementing a Banking Sector Reform; and
(iv) strengthening the Non-Bank Financial Sector.
The Central Bank of Egypt (CBE) is moving
towards a policy of inflation targeting. The ability of
the central bank to run an independent monetary
policy is therefore important if it is to keep inflation
down. Accordingly, a new Central Bank and Banking
Sector Law was passed in June 2003 granting the
central bank enhanced autonomy and the legal
framework for conducting monetary policy based on
inflation targeting. The framework for monetary policy
was enhanced in 2005 as the CBE established
a monetary policy committee. In contrast with the
system of a single Supervisor, the regulatory function
and supervisory structure of the financial system
comprise different supervisory agencies, namely: the
CBE for the banking sector; the Egyptian Insurance
Supervisory Authority (EISA) for the insurance sector
and private pensions; the Capital Market Authority
(CMA) for the capital market; and the Mortgage
Finance Authority (MFA) for the mortgage industry.
The CBE which reports directly to the Office of the
President, while the other two regulatory bodies
report to the Ministry of Investment.
Bank and non-Bank, Financial sector
The central bank has regulatory authority over banks
Egypt
Egypt – ��
GEOATLAS - Copyright1998 Graphi-Ogre0 km 100 200 300 400 km
Ra's al- Muraysah
Ra's�al- Kan$'is
Golfe des�Arabes
Ra's Muhammad
Ra's Ban$s
Ra's�al-¡ad$ribah
Jaz=irat Sh$kir
Jaza'ir Jiftºn
G
olfe
de
Suez
Golfe
d'Aqaba
MER
RO
U
GE
M E R M E D I T E R R A N E E
Al-Ghurdaqah
Al-Kh$rijah
Asw$n
Qin$
Sawh$j
Asyºt
Al-Miny$
Ban= SuwayfAl-Fayyºm
Al-J=zah
Benh$Shib=n Al-Kawm Az-Zaq$z=q
–an—$
A—-Tºr
Al-'Arish
Al-Ism$'=l=yah
As-Suways
Damanhºr Al-Man�ºrah
Bºr Sa'=d��
Dumy$t
Kafr Ash-ShaykhAl-Iskandar=yah
Marsa �Ma—rº!
Bºr Sºd$n
Dunqulah
Al-Q$hirah�Le Caire
–im$
Kawm Umbº
Idfº
Isn$
Al-Uq�urArmantQº�
Jirj$
Akhm=m–ah—$Al-Bad$r=
Abº Tij��
Manfalºt Abnºb
Mallaw=
Sam$lºt
Ban= Maz$rMagh$ghahAl-Fashn
Sinnºris
Shubr$ al-KhaymahAshmºnMinºf
Zift$
Rash=dFuwah
Kafr�ad-Daww$i
Lac�Nasser
N il
N
ilNil
Nil
Nil
Abº Ball$s�467 m
Jabal Sharshar�230 m
Jabal Adar Gwagwa�1606 m
Jabal Mishbih�1351 m
Jabal al-Far$'id�1366 m
Jabal ¡am$—ah�1977 m
Jabal Nuqru� �1505 m
Jabal as-Sib$'= �1477 m
Jabal Sh$'ib �al-Ban$t �2187 m
1218 m
290 m
133 m
1261 m
Jabal Yu'alliq�1094 m
Jabal Mºs$�2285 m
1626 m
Jabal Bº Ban=�1104 m
Jabal Kissº�1712 m
Burj at-Tuyºr�430 m
Jabal Bartazuga�610 m
Jabal Is�1851 m
Jabal Asoteriba�2216 m
Jabal Erba�2217 m
Jabal Oda�2259 m
Jabal Arkanº�1435 m
DE
SE
RT
DE
L
IB
YE
DEPRE
SSIOND E
Q A TTA RA
PLATEAU�
DE LIBYE
OASIS�DE DAKHLA
OASIS�D'AL-KH*RIJAH
GHURD ABª MU¡ARRIK
DESER
TD' A
RABI E
P E N I N S U L E �D U S I N A Ï
JA BAL A L-'A JM A H
D E S E R T �
D E N U B I ED E S E R T �
D E L I B Y E
EGYPTE
S O U D A N
LI
BY
E
P R O C H E - �
O R I E N T �
Asie
sovereign ratings
Longterm
Local Currency
Foreign Currency
Fitch BBB BB
s&P BBB BB
Moody’s Ba1
2006 At a Glance

been growing steadily since the inclusion of Egypt
in the Morgan Stanley Capital International (MSCI)
emerging market and world indices in 2001.
The Government of Egypt has estimated that a total
of 5.3 million housing units will need to be constructed
between 2005 and 2017, of which an estimated
3.7 million units for low-income households. The
development of a market-based residential mortgage
finance sector is necessary to shift the burden of
housing finance from the government budget to
the financial markets. An enabling environment has
been created by the establishment in July 2004 of
a new Mortgage Finance Authority (MFA) which has
a mandate to regulate and supervise the mortgage
market, along with the establishment of an Egyptian
Liquidity Facility (ELF). The latter will serve as a
market-based mechanism for extending mortgage
refinancing loans of medium-term duration to eligible
residential mortgage lenders in the primary market.
Furthermore, a Guarantee and Subsidy Fund (GSF)
is being established, pursuant to the provisions of the
Mortgage Law, as a market-oriented and financially
sustainable institution for administering housing
subsidies to the poorer sections of the population.
Micro-finance programmes have existed in Egypt
since the mid-1960s. Most micro-lending services
are delivered through governmental and non-
governmental organizations. The demand is largely
unmet. It is estimated that the country’s micro-finance
industry currently reaches only about 5% of the more
than two million potential borrowers.
2. Fixed income MarketsThe Capital Markets Authority (CMA) is the regulatory
body responsible for approving the issuance of
securities. The first bond issued by the government of
Egypt was in May 1995. A Primary Dealers System of
debt management introduced by the Government in
July 2004 authorizes a number of financial institutions,
including banks and bond dealers, registered with the
Ministry of Finance (13 to date), to underwrite primary
issues of government securities and actively trade them
in the secondary market through sale, purchase and
re-purchase agreements of the securities. This system
has fostered the establishment of a proper yield curve
reflecting actual supply and demand for government
debt. There are no limitations on the participation of
foreign investors in Egyptian bond markets. The debt
segment of the capital market has a market capitalization
of EGP 52 bn (end of year 2005) which constitutes 10%
of GDP, with a total of 58 outstanding issues, composed
of 35 government bonds and 23 corporate bonds.
Government securities
The Central Bank of Egypt started issuing T-bills in
1991. The continued increase in the Government’s
funding needs (infrastructure spending, budget
deficits) has led to a rapid growth in the domestic
bond market. In January 2006, total outstanding T-
bills amounted to almost EGP 125 bn, 20% of GDP,
of which 364-day T-bills accounted for 80%. The
Government also issues and lists bonds on the Cairo
Stock Exchange, maturing between three and twenty
years, with either fixed or floating rate coupons. The
2025 T-bond (EGP 1 bn issued in 2005 and currently
yielding around 11.5%) remains the longest tenor
in the market. In 2001, the first Egyptian sovereign
bond issue denominated in a foreign currency was
launched for an amount of USD 1.5 bn. The Central
Bank auctions T-bills/bonds on behalf of the Ministry
of Finance and the results are approved by the Ministry
and announced on Reuters’ page CBEY. T-bills have
three types of auctions: Thursdays for 364-day,
Sundays for 91-day, and Mondays for 182-day bills.
All T-bills are settled on the following Thursday.
operating in Egypt; it also acts as the exclusive
note issuer and has responsibility for the conduct
of monetary policy. The banking sector dominates
the financial sector, accounting for over 80% of the
sector’s total assets. As of 31 December 2006, the
banking sector had total deposits of EGP 569 bn
with a loan to deposit ratio of 57%. It comprises 43
licensed banks, down from 57 in 2004. The sector
will further consolidate as, in conformity with the new
Banking Law, the CBE has significantly increased the
minimum capital requirements for banks from EGP
100 mn to EGP 500 mn for domestic banks, and from
USD 15 mn to USD 50 mn for branches of foreign
banks. The objective of the CBE is to further reduce the
number of operating banks to 34 by the end of 2007.
Following the privatization of the Bank of Alexandria
(one of the main measures of the on-going reform of
the financial sector), three state-owned commercial
banks - the National Bank of Egypt (NBE), Banque
Misr (BM), and Banque du Caire (BdC) - account
for about 48% of total deposits. In the near future, as
part of the banking sector reform, Banque du Caire
and Banque Misr are planned to be merged, thereby
creating the country’s largest banking institution, at
par with the National Bank of Egypt by assets, but
well ahead in terms of number of branches.
The Insurance sector is regulated and supervised
by the Egyptian Insurance Supervisory Authority
(EISA). EISA has the authority to license and de-
license insurance undertakings, the approval of
directors and senior management of insurance
companies, and the supervision of their activities.
Foreign investors can acquire 100% of the shares
of an Egyptian insurance company. The Egyptian
insurance industry is still small and its contribution to
the financial sector and the economy is well below
its potential, given the size of the Egyptian economy
and its level of development. For instance, the total
assets of the insurance industry as at end of June
2005 were EGP 20 bn, representing only 3.9% of
GDP. While there are 20 insurance companies in
Egypt, the sector is dominated by three state-owned
insurance companies: Misr Insurance Company, Al
Chark Insurance Company and the National Insurance
Company, which together control over 75% of the
insurance business, while the state-owned Egyptian
Reinsurance Company is the only company providing
reinsurance services.
Egypt has both mandatory and supplementary
pension programmes. The mandatory programme
has two pension systems managing five defined
benefit schemes. The supplementary system or
private pension funds are supervised by EISA. As of
June 30 2005, there were 618 private pension funds
with reserves equivalent to EGP 14.5 bn, with 95%
of their assets invested in government bonds (67.4%)
and bank deposits (27.6%).
Capital Markets
The Alexandria stock exchange was established in
1883 while the Cairo stock exchange was established
in 1903. The two exchanges merged later to form the
Cairo and Alexandria Stock Exchanges (CASE). The
Capital Market Law No. 95 of 1992 established the
Capital Market Authority (CMA) as an autonomous
regulatory agency and provides for the free entry
of foreign financial services companies. As of 31
December 2006, the market capitalization was
USD 93.6 bn with 595 companies listed. The stock
market offers a variety of products including equities
(common and preferred stocks) and certificates on
the CASE 30 and GDR (Global Depository Receipt)
that allow Egyptian companies to access international
markets. The performance of the stock exchange is
tracked by two main indices:
• CASE 30 Price Index, which includes the top-30
companies in terms of liquidity and activity. It was
launched on January 2, 1998 with a base value of
1000 points and was valued at around 7000 by
end of the year 2006; and
• Dow Jones CASE Egypt Titans 20 Index,
introduced in April 2006; it represents blue-chip
stocks traded on the CASE which are selected
based on rankings by float-adjusted market
capitalization, sales/revenue and net profit.
The foreign investors’ share of the market has
�� – Egypt
e

Egypt – ��
been growing steadily since the inclusion of Egypt
in the Morgan Stanley Capital International (MSCI)
emerging market and world indices in 2001.
The Government of Egypt has estimated that a total
of 5.3 million housing units will need to be constructed
between 2005 and 2017, of which an estimated
3.7 million units for low-income households. The
development of a market-based residential mortgage
finance sector is necessary to shift the burden of
housing finance from the government budget to
the financial markets. An enabling environment has
been created by the establishment in July 2004 of
a new Mortgage Finance Authority (MFA) which has
a mandate to regulate and supervise the mortgage
market, along with the establishment of an Egyptian
Liquidity Facility (ELF). The latter will serve as a
market-based mechanism for extending mortgage
refinancing loans of medium-term duration to eligible
residential mortgage lenders in the primary market.
Furthermore, a Guarantee and Subsidy Fund (GSF)
is being established, pursuant to the provisions of the
Mortgage Law, as a market-oriented and financially
sustainable institution for administering housing
subsidies to the poorer sections of the population.
Micro-finance programmes have existed in Egypt
since the mid-1960s. Most micro-lending services
are delivered through governmental and non-
governmental organizations. The demand is largely
unmet. It is estimated that the country’s micro-finance
industry currently reaches only about 5% of the more
than two million potential borrowers.
2. Fixed income MarketsThe Capital Markets Authority (CMA) is the regulatory
body responsible for approving the issuance of
securities. The first bond issued by the government of
Egypt was in May 1995. A Primary Dealers System of
debt management introduced by the Government in
July 2004 authorizes a number of financial institutions,
including banks and bond dealers, registered with the
Ministry of Finance (13 to date), to underwrite primary
issues of government securities and actively trade them
in the secondary market through sale, purchase and
re-purchase agreements of the securities. This system
has fostered the establishment of a proper yield curve
reflecting actual supply and demand for government
debt. There are no limitations on the participation of
foreign investors in Egyptian bond markets. The debt
segment of the capital market has a market capitalization
of EGP 52 bn (end of year 2005) which constitutes 10%
of GDP, with a total of 58 outstanding issues, composed
of 35 government bonds and 23 corporate bonds.
Government securities
The Central Bank of Egypt started issuing T-bills in
1991. The continued increase in the Government’s
funding needs (infrastructure spending, budget
deficits) has led to a rapid growth in the domestic
bond market. In January 2006, total outstanding T-
bills amounted to almost EGP 125 bn, 20% of GDP,
of which 364-day T-bills accounted for 80%. The
Government also issues and lists bonds on the Cairo
Stock Exchange, maturing between three and twenty
years, with either fixed or floating rate coupons. The
2025 T-bond (EGP 1 bn issued in 2005 and currently
yielding around 11.5%) remains the longest tenor
in the market. In 2001, the first Egyptian sovereign
bond issue denominated in a foreign currency was
launched for an amount of USD 1.5 bn. The Central
Bank auctions T-bills/bonds on behalf of the Ministry
of Finance and the results are approved by the Ministry
and announced on Reuters’ page CBEY. T-bills have
three types of auctions: Thursdays for 364-day,
Sundays for 91-day, and Mondays for 182-day bills.
All T-bills are settled on the following Thursday.
Government of egypt yield Curve (dec 2006)
9.5
9.7
9.9
10.1
10.3
10.5
10.7
10.9
11.1
Source: Central Bank of Egypt
%
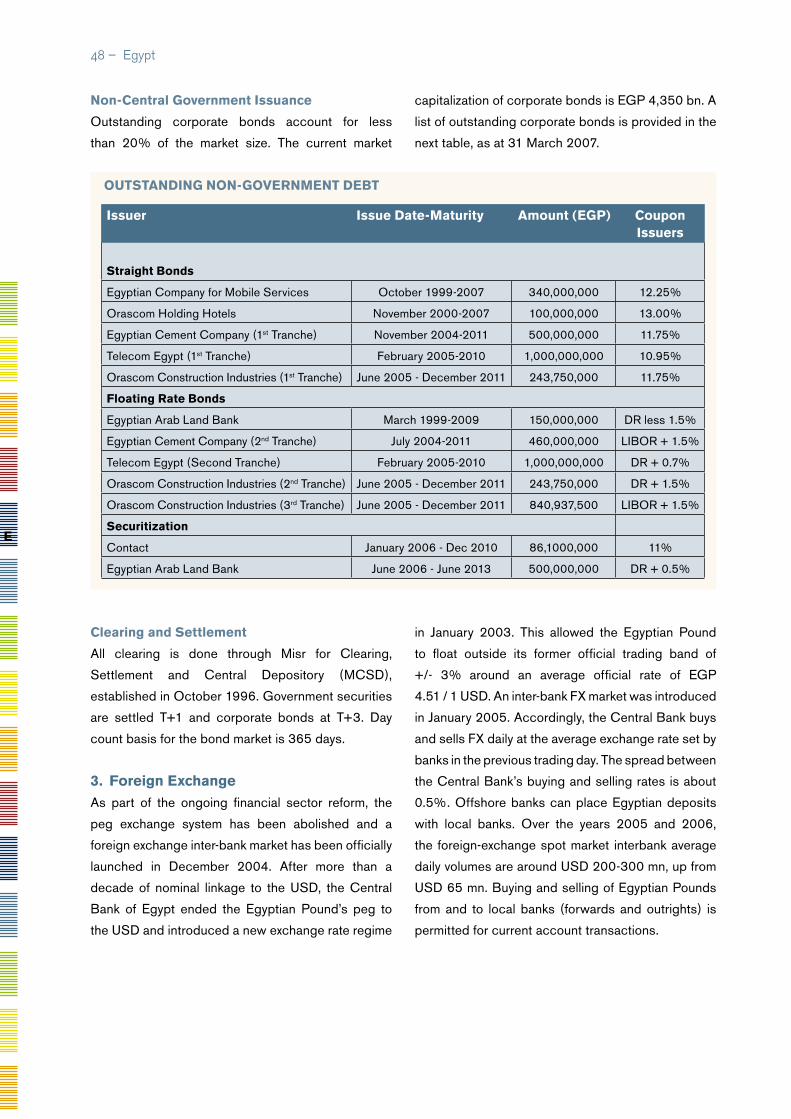
non-Central Government issuance
Outstanding corporate bonds account for less
than 20% of the market size. The current market
capitalization of corporate bonds is EGP 4,350 bn. A
list of outstanding corporate bonds is provided in the
next table, as at 31 March 2007.
issuer issue date-Maturity Amount (eGP) Coupon issuers
straight Bonds
Egyptian Company for Mobile Services October 1999-2007 340,000,000 12.25%
Orascom Holding Hotels November 2000-2007 100,000,000 13.00%
Egyptian Cement Company (1st Tranche) November 2004-2011 500,000,000 11.75%
Telecom Egypt (1st Tranche) February 2005-2010 1,000,000,000 10.95%
Orascom Construction Industries (1st Tranche) June 2005 - December 2011 243,750,000 11.75%
Floating rate Bonds
Egyptian Arab Land Bank March 1999-2009 150,000,000 DR less 1.5%
Egyptian Cement Company (2nd Tranche) July 2004-2011 460,000,000 LIBOR + 1.5%
Telecom Egypt (Second Tranche) February 2005-2010 1,000,000,000 DR + 0.7%
Orascom Construction Industries (2nd Tranche) June 2005 - December 2011 243,750,000 DR + 1.5%
Orascom Construction Industries (3rd Tranche) June 2005 - December 2011 840,937,500 LIBOR + 1.5%
securitization
Contact January 2006 - Dec 2010 86,1000,000 11%
Egyptian Arab Land Bank June 2006 - June 2013 500,000,000 DR + 0.5%
�� – Egypt
e
Clearing and settlement
All clearing is done through Misr for Clearing,
Settlement and Central Depository (MCSD),
established in October 1996. Government securities
are settled T+1 and corporate bonds at T+3. Day
count basis for the bond market is 365 days.
3. Foreign exchangeAs part of the ongoing financial sector reform, the
peg exchange system has been abolished and a
foreign exchange inter-bank market has been officially
launched in December 2004. After more than a
decade of nominal linkage to the USD, the Central
Bank of Egypt ended the Egyptian Pound’s peg to
the USD and introduced a new exchange rate regime
in January 2003. This allowed the Egyptian Pound
to float outside its former official trading band of
+/- 3% around an average official rate of EGP
4.51 / 1 USD. An inter-bank FX market was introduced
in January 2005. Accordingly, the Central Bank buys
and sells FX daily at the average exchange rate set by
banks in the previous trading day. The spread between
the Central Bank’s buying and selling rates is about
0.5%. Offshore banks can place Egyptian deposits
with local banks. Over the years 2005 and 2006,
the foreign-exchange spot market interbank average
daily volumes are around USD 200-300 mn, up from
USD 65 mn. Buying and selling of Egyptian Pounds
from and to local banks (forwards and outrights) is
permitted for current account transactions.
outstAndinG non-GovernMent deBt
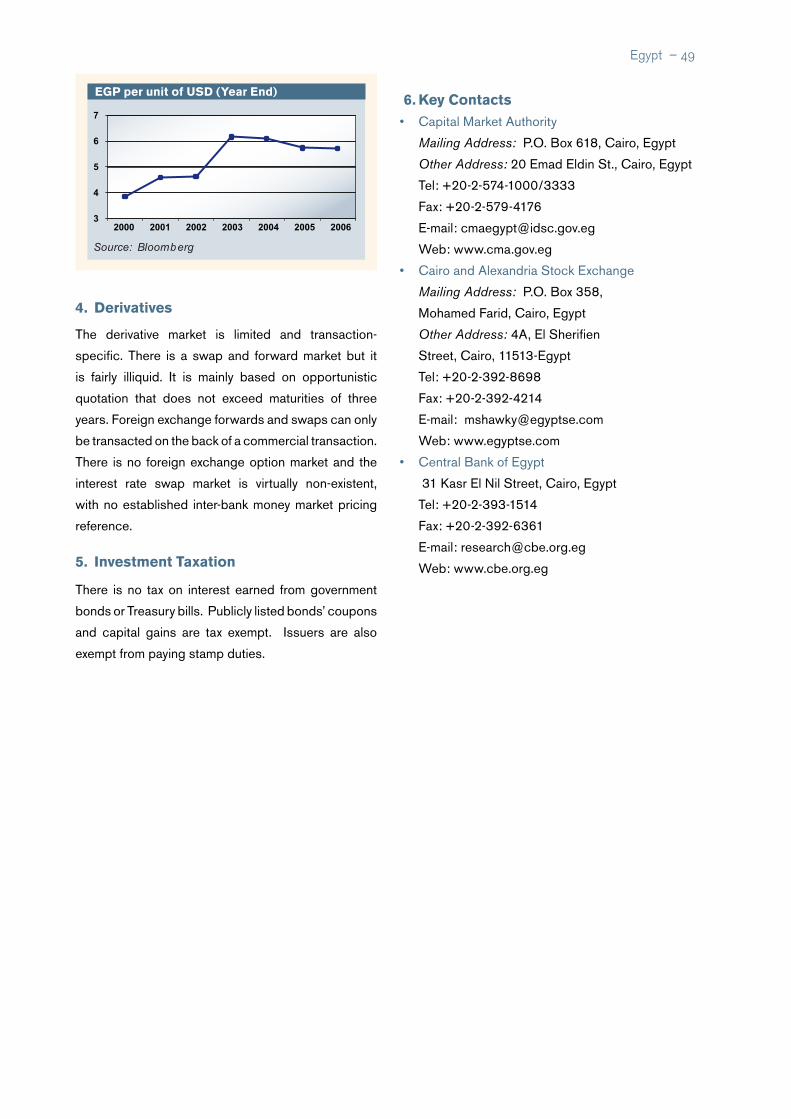
4. derivatives
The derivative market is limited and transaction-
specific. There is a swap and forward market but it
is fairly illiquid. It is mainly based on opportunistic
quotation that does not exceed maturities of three
years. Foreign exchange forwards and swaps can only
be transacted on the back of a commercial transaction.
There is no foreign exchange option market and the
interest rate swap market is virtually non-existent,
with no established inter-bank money market pricing
reference.
5. investment taxation
There is no tax on interest earned from government
bonds or Treasury bills. Publicly listed bonds’ coupons
and capital gains are tax exempt. Issuers are also
exempt from paying stamp duties.
6. Key Contacts• Capital Market Authority
Mailing Address: P.O. Box 618, Cairo, Egypt
Other Address: 20 Emad Eldin St., Cairo, Egypt
Tel: +20-2-574-1000/3333
Fax: +20-2-579-4176
E-mail: [email protected]
Web: www.cma.gov.eg
• Cairo and Alexandria Stock Exchange
Mailing Address: P.O. Box 358,
Mohamed Farid, Cairo, Egypt
Other Address: 4A, El Sherifien
Street, Cairo, 11513-Egypt
Tel: +20-2-392-8698
Fax: +20-2-392-4214
E-mail: [email protected]
Web: www.egyptse.com
• Central Bank of Egypt
31 Kasr El Nil Street, Cairo, Egypt
Tel: +20-2-393-1514
Fax: +20-2-392-6361
E-mail: [email protected]
Web: www.cbe.org.eg
Egypt – ��
eGP per unit of usd (year end)
3
4
5
6
7
2000 2001 2002 2003 2004 2005 2006
Source: Bloomberg
Equatorial Guinea
�0 – Equatorial Guinea
CEMAC, the supreme authority of the UMAC;
• The Council of Ministers;
• The central bank, Bank of Central African States
(Banque des Etats de l’Afrique Centrale -BEAC-
), the common independent central bank;
• The Banking Commisssion, ( Commission
Bancaire de l’Afrique Centrale (COBAC),
harmonises and controls banking activities;
• The stock market, Bourse des valeurs mobilières.
The BEAC was established in 1972, the successor
to the Banque Centrale de l’Afrique Equatoriale et du
Cameroon (established in 1955). It formulates and
implements the monetary policy of its member countries,
and also preserves the stability of the common currency
of the member states, the CFA Franc (franc de la
Cooperation Financiére en Afrique Centrale), which is
pegged to the Euro. The French treasury guarantees the
convertibility (though not the exchange rate) of the CFA
Franc. BEAC uses both reserve requirements and the
discount window to implement its policy.
The financing of the economy of the CEMAC
region has increased by 9.2% from XAF 1,850 billion
Population (mn) 0.5Population Growth (annual %) 2.3Official Language (s) Spanish/FrenchCurrency CFA Franc (XAF)GDP (Current US$ bn) 9.3GDP Growth (annual %) 0.4GDP Per Capita (US$) 18,057FDI, net inflows (US$ mn) (2005) 1,860External Debt (US$ mn) 200External Debt/GDP (%) 2.7CPI Inflation (annual %) 5.2Exports of goods & services (% of GDP) 96.2Gross Official Reserves (US$ bn) 2.530Gross Official Reserves (In months of imports) 15.3UNDP HDI RaNkING 120Source: AfDB, IMF, UNCTAD, UNDP, UN Population Division
1. overview of Financial system
Equatorial Guinea is a member of the Central African
Economic and Monetary Community (Communauté
Economique et Monétaire de l’Afrique Centrale-
EMAC), which is composed of six member countries:
Cameroon, Central African Republic, Chad, Republic
of Congo, Equatorial Guinea and Gabon. The CEMAC
is composed of the following four institutions:
1. Central African Economic Union (Union
Economique de l’Afrique Centrale –UEAC-)
2. Central African Monetary Union ( Union
Monétaire de l’Afrique Centrale- UMAC-)
3. Community Parliament
4. CEMAC court of justice
The UMAC, headquartered in Yaoundé, is responsible
for the monetary policy of its member countries. It
also involved, with the UEAC, in the coordination
of economic policy to ensure consistency between
national budget policies and the common monetary
policy. The UMAC is administered through:
• The Conference of Heads of States, created
through the Agreement establishing the
e
2006 At a Glance

Equatorial Guinea – �1
in 2005 to 2,019 billion in 2006. The target inflation
rate for the region has been set at a maximum of
3%.
There are 29 banks operating in the CEMAC region
(Cameroon: 10; Central African Republic: 3; Chad:
5; Congo: 4; Equatorial Guinea: 2 ; Gabon: 5), with
total assets of XAF 659 billion as of February 2007.
Bank and non-Bank Financial sector
The banking sector consists of three main banks, all of
which are primarily foreign-owned. The Government
maintains a minority stake in two banks. A fourth
bank had its license approved in 2004 and began
operations in 2005. Banking activity is supervised by
the COBAC.
The insurance sector is regulated and supervised
by a regional body, the Interprofessional Committee of
the Insurance Market (Conférence Internationale des
Marchés d’Assurances-CIMA). It was established on
July 10, 1992 in Yaounde (Republic of Cameroon)
and includes the following countries: Benin, Burkina,
Cameroon, Central Africa, the Comoros, Ivory Coast,
Gabon, Equatorial Guinea, Guinea Bissau, Mali, Niger,
Senegal, Chad and Togo. The CIMA Treaty came into
effect on February 15, 1995. The regulatory body of
the CIMA is the Regional Commission of Insurance
Control (CRCA) whereas the Council of Ministers is
the supreme body.
Capital Markets
As with the CFA West Africa zone which has a common
stock exchange, the Bourse Régionale des Valeurs
Moblières (BRVM), the Central African Region sought
to have a common stock exchange. However, plans
for these were temporarily shelved, as an agreement
between the member countries on a host country
could not be reached. Cameroon decided to create
its own exchange (Douala Stock Exchange- DSX-),
whilst a separate stock exchange was established in
Gabon (Central African Stock Exchange - BVMAC-)
The legal framework of the region’s capital markets
is defined by Act n° 03/01-EMAC-CE 03 of 8
December 2001. Under the provisions of the Act,
the Financial Markets Surveillance Committee
(Commission de Surveillance du Marché Financier de
l’Afrique Centrale-COSUMAF) has sole jurisdiction in
approving securities for listing on the BVMAC. It is the
agency responsible for administering securities laws
in the BVMAC member countries.Two companies,
SFA Gabon and BGFI Bourse have been authorized
to act as brokers for the BVMAC.
2. Foreign exchange
The CFA Franc is the common currency of 14 countries
located in West Africa (WAMU) and Central Africa
(CEMAC), and has a fixed parity with the Euro at XAF
655.957 / 1 EUR. The French treasury guarantees
the convertibility and stability of the XAF. Payments
and transfers of capital within the CEMAC region and
current account transactions with all countries are
unrestricted. However, restrictions on transactions
of capital accounts apply for outflows to countries
outside the CEMAC.
3. Key Contacts
• Banco de los Estados de Africa Central (BEAC)
Apartado 501, Malabo, Equatorial Guinea
Tel: +240-09-2010/11
Fax: +240-09-2006
E-mail: [email protected]
Web: www.beac.int
CFA Per unit of usd (year end)
400
500
600
700
800
2000 2001 2002 2003 2004 2005 2006Source: Bloomberg

�� – Eritrea
Population (mn) 4.56Population Growth (annual %) 3.5Official Language TigrinyaCurrency Nakfa (ERN)GDP (Current US$ bn) 1.085GDP Growth (annual %) 1.5GDP Per Capita (US$) 238FDI, net inflows (US$ mn) (2005) 11 External Debt (US$ mn) 600External Debt/GDP (%) 57.7CPI Inflation (annual %) 10.9Exports of goods and services (% of GDP) 6.8Gross Official Reserves (In months of imports) 0.6Gross Official Reserves (in $bn) 0.024UNDP HDI RaNkING 157Source: AfDB, IMF, UNCTAD, UNDP, UN Population Division
1. overview of Financial systemThe financial system of the country consists of the National
Bank of Eritrea (NBE) which is the central bank, the
Commercial Bank of Eritrea, the Housing and Commerce
Bank of Eritrea (HCBE), the Agricultural and Industrial
Bank of Eritrea, the Eritrean Investment and Development
Bank, and the National Insurance Corporation of Eritrea.
The banks are all majority-owned by the government,
while 60% of the National Insurance Corporation of
Eritrea (NICE) was sold in 2004 to Eritrean investors as
part of a privatisation initiative. Created in 1991, NICE
has 57% of its business in the auto-insurance sub-sector.
While the Commercial Bank of Eritrea has correspondent
banking relations with many international banks, no
foreign financial institutions operate in Eritrea.
2. Fixed income Markets
Government securities
Treasury bills are issued by the central bank although
there is no organized capital market.
3. Foreign exchange Market
The Eritrean Nakfa (ERN) is a managed floating
currency. A dual exchange rate system exists in
the country and there is a substantial difference
between the official and parallel market rates. Official
transactions and other priority needs are conducted
in the official market, while the vast majority of private
transactions, including bona fide current transactions,
are channeled through the parallel market.
4. Key Contacts
• National Bank of Eritrea
Mailing Address: P.O. Box 849, Asmara, Eritrea
Square, Asmara, Eritrea
Tel: +291-1-123033/123036
Fax: +291-1-122091
E-mail: [email protected]
Eritrea
GEOATLAS - Copyright1998 Graphi-Ogre0 km 100 200 300 400 km
Ra's�abº Shajarah
Ra's Kasr
Ile Erua
Ile Haleb
Ras Maskan
Ras Bir
Ras Khaanziir
Mukawwar
MER
RO
UG
E
Canalde M itsiw a
Détroitde B$b
elM andeb
G o l f e d ' A d e n
Golfe de
Tadjour
a
IlesDahlac
Asayita
Mekele
Dire Dawa�� Harer
Asosa
Bahir Dar��
Jijiga
Gambela
Baki
Hargeysa Burco
Rabak��
Al- Qaø$rif
Sinjah��
Ad-Damazin��
Wad Madan=��
Kassal$
Bºr Sºd$n
Ad-D$mir
Nakfa
Akordat
BarentuMendefera
Adi Keyih
Aseb
Mitsiwa
Keren
Asmera�Asmara
Djibouti
Adis Abeba�Addis Abeba
Lac�Tana
Lac�Ziway
Nahr
a
d-D indar
Nahr
ar-Ranad
'A—barah'
'A—ba
rah'
Tekeze
A tbara
Jem a
Awash
Shebe
le
Fafen
Ramis
Erer
Sobat
Baro
Omo
Didesa
N ilBleu
N ilBleu
NilB
leu
NilBle
u
N il
NilBlanc
116 m
155 m
Ras Dashen Terara�4620 m
Moussa Ali�2063 m
Guna�4231 m
Abune Yosef�4190 m
Talo�4413 m
2438 m
Amba Farit�3975 m
Gara Muleta�3381 m
Enghershatu�2575 m
Jabal Hamoyet�2780 m
Fangaga�2589 m
D E S E R T �
D E N U B I E
AL-BU
–*N
AH
AL-JA
Z+R
AH D
ESERT
DANAKIL
C H OKE
P L A T E A U �
E T H I O P I E N
M ON T
S A HM A R
O G A
D
EN
M O N TS O G O
P L A I N E �S A R A R
E T H I O P I E
S O U D A N
P E N I N S U L E ��
A R A B I Q U E ��
Asia
S O M A L I E
DJIBOUTI
ERYTHREE
ern Per unit of usd (year end)
5
10
15
20
2000 2001 2002 2003 2004 2005 2006Source: Bloomberg
e
2006 At a Glance

Ethiopia – ��
Population (mn) 79.2Population Growth (annual %) 2.4Official Language AmharicCurrency Birr (ETB)GDP (Current US$ bn) 13.3GDP Growth (annual %) 5.4GDP Per Capita (US$) 168FDI, net inflows (US$ mn) (2005) 205 External Debt (US$ mn) 7,100External Debt/GDP (%) 53.6CPI Inflation (annual %) 10.5Exports of goods and services (% of GDP) 15.1Gross Official Reserves (US$ bn) 1.04Import Cover (months) 3UNDP HDI RaNkING 170Source: AfDB, IMF, UNCTAD, UNDP, UN Population Division
1. overview of Financial system
The National Bank of Ethiopia (NBE), the central
bank of the country, was established in 1963,
through the Monetary and Banking Proclamation
206, as an autonomous and legal entity. Prior to this
proclamation, the bank carried out both commercial
and central banking activities. The NBE is responsible
for formulating monetary policy and supervising the
entire financial system.
Bank and non-Bank Financial sector
The financial sector left behind by the socialist-
oriented government comprised only three banks:
The National Bank of Ethiopia, the Commercial Bank
of Ethiopia (CBE) and the Agricultural and Industrial
Development Bank.
The Monetary and Banking Proclamation No.
83/1994 and the Licensing and Supervision of
Banking Business No. 84/1994 laid down the legal
basis for investment in the banking sector. It is only
since 1994, when the central bank was established,
that the Government has permitted activities and
services of private banks and insurance companies.
These services are strictly limited to domestic entities
as foreign firms are prohibited from investing in the
banking and insurance sectors. The presence of
private banks and insurance firms in the financial
sector has grown and, by end 2006, there were nine
private banks and two smaller state-owned banks
operating alongside the CBE. The state-owned
CBE has a market share of more than 70% of the
commercial bank system.
Following the change in the political environment
in 1991, new laws were proclaimed for the insurance
sector, and private insurance companies were allowed
to operate again, resulting in the creation of nine fully
operational private insurance companies.
Capital Markets
Ethiopia does not have a stock exchange. The
Government issues treasury bills for its money market
operations.
Ethiopia
GEOATLAS - Copyright1998 Graphi-Ogre0 km 100 200 300 400 km
O C E A N �
I N D I E N
Ile Erua
Ile Haleb
Ras Maskan
Ras Bir
Ras Khaanziir
Cap Sura
Ras Adado
Raasiga Caluula
Ras el Cheil
Canalde M itsiw a
Détroitde B$b
elM andeb
Go
lf
e
d'
Ad
en
Golfe de
Tadjour
a
IlesDahlac
M E R �R O U G E
Asayita
Mekele
Dire Dawa�� Harer
Asosa
Bahir Dar��
Jijiga
Gambela
Awasa
Beled �Weyne
Baki
Hargeysa Burco
Laas Caanood
Ceerigaabo
Boosaaso
Garoowe
Gaalkacyo
Dhuusa Mareeb
Xuddur
Garbahaarrey BaydhaboJowhar
Juba Kapoeta
Bor
Malak$l��
Rabak��
Al- Qaø$rif
Sinjah��
Ad-Damazin��
Wad Madan=��
Kassal$
Moyo
AruaGulu
Kitgum
Kotido
Akordat
BarentuMendefera
Adi Keyih
Aseb
Mitsiwa
Keren
Fiche
Dese
Gonder
Debre Markos
Jima
Nekemte
Asela
Nazret
Debre ZeyitAkaki Beseka
Goba
Asmera�Asmara
Djibouti
Adis Abeba�Addis Abeba
Al-Khar—ºm�Khartoum
Akºbº
A kobo
Nahr
a
d-D indar
Nahr
ar-Ranad
'A—barah'
'A—ba
rah'
Tekese
A tbara
Jem a
Awash
D aw
a
D aua
Genale
Wabe
Gestro
Jubba
G
enale
Welm el
Shebe
le
Shebele
Shabeelle
Fafen
Ramis
Erer
Sobat
Baro
G ilo
Kan
gen
Omo
G ojeb
Omo
Didesa
Nil
Albe
rt
N ilBleu
N ilBleu
NilB
leu
NilBle
u
NilBlanc
N il
N i
lBla
nc
Nil
Blanc
Nil
Blanc
Lac�Turkana
Lac�Chew Bahir
Lac�Chamo
Lac�Abaya
Lac�Tana
Lac�Awasa
Lac�Shala
Lac�Ziway
116 m
155 m
Jabal Kathangor�1063 m
Nelichu�1740 m
Naita�2139 m
3150 m Ras Dashen Terara�4620 m
1200 m
Moussa Ali�2063 m
Guna�4231 m
Abune Yosef�4190 m
Talo�4413 m
Gorochan�3276 m
Chalchis Terara�3112 m
Gurage�3719 m
Mai Gudo�3100 m
Guge�4200 m
Badda�Rogghie�3550 m
Tulu Welel�3301 m
2438 m
Amba Farit�3975 m
Ayelu�2010 m
Gara Muleta�3381 m
Monte Bahaia�2200 m
Mount Kulal�2293 m
Kinyeti�3187 m
Shimber�Berris�
2407 m
Gugu�3623 m
Agal Terara�3339 m
2146 m
Duro�2743 m
2486 m
Batu�4307 m
DESERT CHALBI
PLAINE�
LOTIKIPI
Mts�
DIDINGA
AL-BU
–*N
AH
AL-JA
Z+R
AH
MONTS�NUBA
DESERT
DANAKIL
C H OKE
P L A T E A U �
E T H I O P I E N
M ON T
S A HM A R
O G A
D
EN
MENDEBO
AUDO
RANGE
M O N TS O G O
P L A I N E �S A R A R
P L A T E A U �D U S A W L
V A LLEED E N O G
AL
SO
UD
AN
S O M A L I E
DJIBOUTI
K E N Y AO U G A N D A
P E N I N S U L E �A R A B I Q U E �
Asie
E R Y T H R E E
ETHIOPIE
2006 At a Glance
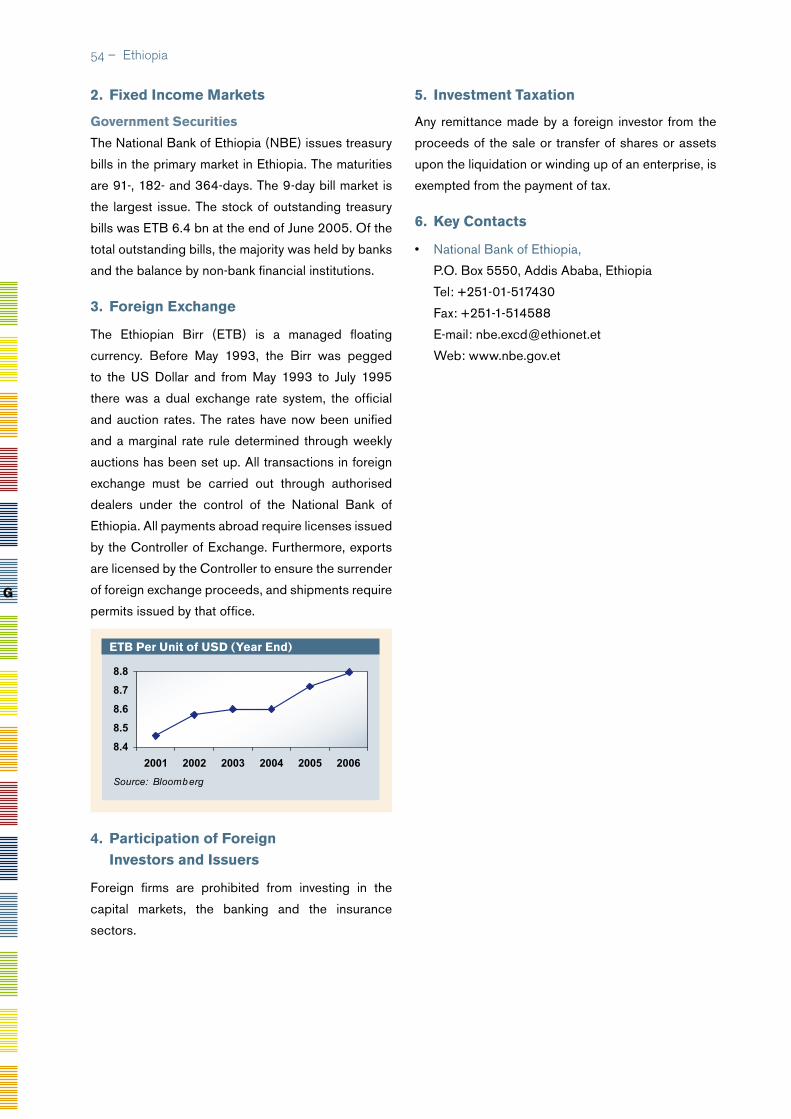
2. Fixed income Markets
Government securities
The National Bank of Ethiopia (NBE) issues treasury
bills in the primary market in Ethiopia. The maturities
are 91-, 182- and 364-days. The 9-day bill market is
the largest issue. The stock of outstanding treasury
bills was ETB 6.4 bn at the end of June 2005. Of the
total outstanding bills, the majority was held by banks
and the balance by non-bank financial institutions.
3. Foreign exchange
The Ethiopian Birr (ETB) is a managed floating
currency. Before May 1993, the Birr was pegged
to the US Dollar and from May 1993 to July 1995
there was a dual exchange rate system, the official
and auction rates. The rates have now been unified
and a marginal rate rule determined through weekly
auctions has been set up. All transactions in foreign
exchange must be carried out through authorised
dealers under the control of the National Bank of
Ethiopia. All payments abroad require licenses issued
by the Controller of Exchange. Furthermore, exports
are licensed by the Controller to ensure the surrender
of foreign exchange proceeds, and shipments require
permits issued by that office.
4. Participation of Foreign investors and issuers
Foreign firms are prohibited from investing in the
capital markets, the banking and the insurance
sectors.
5. investment taxation
Any remittance made by a foreign investor from the
proceeds of the sale or transfer of shares or assets
upon the liquidation or winding up of an enterprise, is
exempted from the payment of tax.
6. Key Contacts
• National Bank of Ethiopia,
P.O. Box 5550, Addis Ababa, Ethiopia
Tel: +251-01-517430
Fax: +251-1-514588
E-mail: [email protected]
Web: www.nbe.gov.et
etB Per unit of usd (year end)
8.4
8.5
8.6
8.7
8.8
2001 2002 2003 2004 2005 2006
Source: Bloomberg
�� – Ethiopia
G
Gabon – ��
Population (mn) 1.4Population Growth (annual %) 1.6Official Language FrenchCurrency CFA Franc (XAF)GDP (Current US$ bn) 9.5GDP Growth (annual %) 2.1GDP Per Capita (US$) 6,750FDI, net inflows (US$ mn) (2005) 300.0 External Debt (US$ mn) 2.2External Debt /GDP (%) 23.0CPI Inflation (annual %) 1.9Exports of goods and services (% of GDP) 69.7Gross Official Reserves (US$ bn) 0.87Gross Official Reserves (in months of imports) 6.8UNDP HDI RaNkING 124Source: AfDB, IMF, UNCTAD, UNDP, UN Population Division
1. overview of Financial system
Gabon is a member of the Central African Economic
and Monetary Community (Communauté Economique
et Monétaire de l’Afrique Centrale-CEMAC), which
is composed of six member countries: Cameroon,
Central African Republic, Chad, Republic of Congo,
Equatorial Guinea and Gabon. The CEMAC is
composed of the following four institutions:
1. Central African Economic Union (Union
Economique de l’Afrique Centrale –UEAC-)
2. Central African Monetary Union ( Union
Monétaire de l’Afrique Centrale- UMAC-)
3. Community Parliament
4. CEMAC court of justice
The UMAC, headquartered in Yaoundé, is responsible
for the monetary policy of its member countries. It
also involved, with the UEAC, in the coordination
of economic policy to ensure consistency between
national budget policies and the common monetary
policy. The UMAC is administered through:
• The Conference of Heads of States, created
through the Agreement establishing the
Gabon
GEOATLAS - Copyright1998 Graphi-Ogre0 km 100 200 300 400 km
O C E A N �
A T L A N T I Q U E
Cap San Juan
Pointe Epote
Pointe Pongara
Cap Lopez
São Tomé
Ile de Corisco
Ponta do Padrão
Lagune Nkomi
Lagune Iguéla
Lac Mandjé
Lagune Banio
Baía�do Bengo
Príncipe
Ile de Bioko�Guinée Equatoriale
BA IE D U BIA FR AYaoundé
Malabo
LibrevilleSão Tomé
Brazzaville
Kinshasa
Bangui
MinvoulBitam
MitzicCocobeach
NtoumKango
Mékambo
Ovan
Booué
N'djolé
OkondjaOnga
Akiéni
N'gouoni
LéconiBongovilleMoanda
Bakoumba
Boumango
LastourvilleIboundji
Pana
Fougamou
Mandji Mimongo
Mbigou
MalingaNdendé
Omboué
Gamba
Moabi
Mabanda
Mayumba
Ndindi
Kinkala
ImpfondoOuesso
Ewo
Owando
Djambala
Sibiti
MadingouDolisie
Pointe-Noire
Oyem
Makokou
Lambaréné
Franceville
Koulamoutou
Mouila
Port Gentil
Tchibanga
Cabinda
M'banza Congo��
Uíge��
Bafoussam
BueaDouala
Bertoua
Ebolowa
Bimbo
Mbaiki
Berbérati
Nola
UmuahiaOwerri
Port HarcourtUyo
Calabar
Mbandaka
Bandundu
�Lac�
Mai-Ndombe
Sanaga
Nou
n
Djérem
Lo
m
N yo ng
Dja
Kadeï
Kadeï
Boumbé
II
Boumbé
I
Mambéré
Lobaye
Mpoko
Oubangui
O ubangui
N tem Kom
M bini
Avina
D ioua
Ivin
do
Utam
boni
Ogoou
é
O goo
ué
Ngou
nié
N yang
a
N yanga
K ouilou
N iari
Kw a
Fim i
Lukenie
Kasai
Wam
ba
Kweng
e
Kwilu
Loange
Luangue
Léfini
Alim
a
Likouala
Mam bili
Likouala
Sangha
Sangha
N goko
Likoualaa ux
Herbes
Oubangui
Oubangui
Lulonga
Ruki
M 'Bridg e
Inkisi
Chica
pa
C uango
Cuango
Lokoro
Z aïre
Zaïre
Z aïre
Giri
798 m
857m
903 m
1020 m
Pico de�São Tomé�2024 m
704 m
Mts de�Bélinga�1024 m
750 m
Mont Pelé�834 m
1500 m
2396 m
2679 m
Mont�Cameroun �
4100 m
1345 m
Pico de�Santa Isabel�3008 m
PLATEAUX
B AT É K
É
MAYOMBE
Mts DOUDOU
Mf. DU CHAILLU
M ts . D ECRIST A
L
MINKEBE
Mts�MOKEKOU
COLLINES�OBAN
R E P U B L I Q U E �D E M O C R A T I Q U E �
D U C O N G O
A N G O L A
C O N G O
GUINEE�EQUATORIALE
SAO TOME-�ET-PRINCIPE
REPUBLIQUE�CENTRAFRICAINE
C A M E R O U N
NIGERIA
GABON
CEMAC, the supreme authority of the UMAC;
• The Council of Ministers;
• The central bank, Bank of Central African States
(Banque des Etats de l’Afrique Centrale -BEAC-
), the common independent central bank;
• The Banking Commisssion, ( Commission
Bancaire de l’Afrique Centrale (COBAC),
harmonises and controls banking activities;
• The stock market, Bourse des valeurs mobilières.
The BEAC was established in 1972, the successor
to the Banque Centrale de l’Afrique Equatoriale et
du Cameroon (established in 1955). It formulates
and implements the monetary policy of its member
countries, and also preserves the stability of the
common currency of the membeer states, the CFA
Franc (franc de la Cooperation Financiére en Afrique
Centrale), which is pegged to the Euro. The French
treasury guarantees the convertibility (not the
exchange rate) of the CFA Franc. BEAC uses both
reserve requirements and the discount window to
implement its policy. The financing of the economy of
the CEMAC region has increased by 9.2% from XAF
2006 At a Glance

1,850 billion in 2005 to 2,019 billion in 2006. The
target inflation rate for the region has been set at a
maximum of 3%.
There are 29 banks operating in the CEMAC region
(Cameroon: 10; Central African Republic: 3; Chad:
5; Congo: 4; Equatorial Guinea: 2 ; Gabon: 5),
with total assets of XAF 659 billion as of February
2007.
Bank and non-Bank Financial sector
A total of six banks operate in the country, together with
six finance companies, two securities firm and more
than 20 micro-finance institutions. Banking activity is
supervised by the COBAC. Gabon’s banking sector
accounts for 90% of total financial sector assets, and
is dominated by three banks controlling 75% of the
market.
The insurance sector is regulated and supervised
by a regional body, the Interprofessional Committee of
the Insurance Market (Conférence Internationale des
Marchés d’Assurances-CIMA). It was established on
July 10, 1992 in Yaounde (Republic of Cameroon)
and includes the following countries: Benin, Burkina,
Cameroon, Central Africa, the Comoros, Ivory Coast,
Gabon, Equatorial Guinea, Guinea Bissau, Mali, Niger,
Senegal, Chad and Togo. The CIMA Treaty came into
effect on February 15, 1995. The regulatory body of
the CIMA is the Regional Commission of Insurance
Control (CRCA) whereas the Council of Ministers is
the supreme body.
The insurance industry represents a very small
part of the financial sector and has a low penetration
rate. Similarly, micro-finance institutions have a small
outreach.
Capital Markets
As is the case in the CFA West Africa zone which
has a common stock exchange (Bourse Régionale
des Valeurs Moblières-BRVM), the Central African
Region also sought to establish a common stock
exchange. However, plans for these were temporarily
shelved, as agreement could not be reached between
CFA Per unit of usd (year end)
400
500
600
700
800
2000 2001 2002 2003 2004 2005 2006
Source: Bloomberg
the member countries on a host country. Cameroon
decided to create its own exchange, the Douala Stock
Exchange (DSX), whilst a separate stock exchange
was established in Gabon, the Central African Stock
Exchange (BVMAC)
The legal framework of the region’s capital
markets is defined by Act n° 03/01-EMAC-CE 03
of 8 December 2001. Under the provisions of the
Act, the Financial Markets Surveillance Committee
(Commission de Surveillance du Marché Financier de
l’Afrique Centrale-COSUMAF) has sole jurisdiction
for approving securities for listing on the BVMAC.
It plays a regulatory and supervisory role to protect
investors and ensure that the market operates
properly. Two companies, SFA Gabon and BGFI
Bourse have been authorized to act as brokers for the
BVMAC. However operations have not yet started on
the stock exchange.
2. Foreign exchange
The CFA Franc is the common currency of 14 countries
located in West Africa (WAMU) and Central Africa
(CEMAC), and has a fixed parity with the Euro at XAF
655.957 / 1 EUR. The French treasury guarantees
the convertibility and stability of the XAF. Payments
and transfers of capital within the CEMAC region and
current account transactions with all countries are
unrestricted. However, restrictions on transactions
of capital accounts apply for outflows to countries
outside the CEMAC.
�� – Gabon
G
Gabon – ��
3. Key Contacts
• Banque des Etats de l’Afrique Centrale (BEAC)
Mailing Address: B.P. 112, Libreville, Gabon
Other Address: Boulevard de
l’Indépendance, Libreville, Gabon
Tel: +241-176-0206
Fax: +241-174-4563
E-mail: [email protected]
Web: www.beac.int
• Bourse des Valeurs Mobilières de l’Afrique
Centrale (BVMAC), Place de l’Indépendence
B.P. 2165, Libreville, Gabon
Web: www.bvm-ac.com
• Commission de Surveillance du Marché
Financier de l’Afrique Centrale (COSUMAF)
B.P. 1724, Libreville, Gabon
Tel: +241-747591
Fax: +241-747588
E-mail: [email protected]
Web: www.cosumaf.org
�� – The Gambia
Population (mn) 1.6Population Growth (annual %) 2.5Official Language EnglishCurrency Dalasi (GMD)GDP (Current US$ bn) 0.52GDP Growth (annual %) 4.5GDP Per Capita (US$) 334FDI, net inflows (US$ mn) (2005) 24.0 External Debt (US$ mn) 0.6External Debt/GDP (%) 123CPI Inflation (annual %) 2.0Exports of goods and services (% of GDP) 50.6Gross Official Reserves (US$ bn) 0.1Gross Official Reserves (in months of imports) 3.9UNDP HDI RaNkING 155Source: AfDB, IMF, UNCTAD, UNDP, UN Population Division
1. overview of Financial system
The financial system comprises the central bank,
banks, insurance companies, foreign exchange
bureaus, village savings and credit associations,
credit companies, a post office savings bank, and
a number of savings and credit groups. The Central
Bank of the Gambia (CBG) was established in 1971
and its role is to maintain price and exchange rates
stability, underpinned by a sound and stable financial
system. It monitors, regulates and supervises the
commercial banks, and since 1997 also the insurance
companies. The CBG plans and executes operations
in the money market to ensure that interest rates are in
line with its policies. It uses open market operations,
interest rates, reserve requirements, and the discount
and rediscount window to conduct its monetary
policy. The objective of the open market operations
is to absorb the excess liquidity, achieve positive real
interest rates and contribute to price stability.
The Gambia has recently made efforts to regulate
financial transactions and to reduce money
laundering, passing the Money Laundering Bill in
The Gambia
June 2003. The new law requires financial institutions
in The Gambia to follow stricter reporting practices
that are considered beneficial to increasing foreign
institutions’ interest and confidence in investing in the
country.
Bank and non-Bank Financial sector
The banking industry dominates the Gambian financial
system and comprises eight banks, including an
Islamic development bank. The banking sector as a
whole is healthy.
The insurance sector in The Gambia is small in terms
of assets. As of December 2006, 11 insurance
companies were operating in the country, with
eight focusing on non-life insurance.Micro-finance
is becoming more prevalent, with about 20 micro-
finance institutions operating in the country. Recently,
two commercial banks have entered the micro-
finance industry. The CBG has put in place prudential
guidelines based on the principles of reducing barriers
to the entry of new non-bank financial institutions in
the sector, regulating the service providers through
sovereign ratings
Longterm
Local Currency
Foreign Currency
Fitch CCC CCC
G
2006 At a Glance
The Gambia – ��
licensing, financial reporting and accountability, and
making the mobilization of savings mandatory.
Capital Markets
The capital markets only consist of government
securities. The CBG issues government securities on
behalf of the Government. There is no stock exchange
although a few local equities are traded over-the-
counter. The Trust Bank of Gambia for example is
listed on the Ghana Stock Exchange.
2. Fixed income Markets
Government securities
The main securities trades are treasury bills, central
bank bills and treasury bonds.
• Treasury bills are primarily used to conduct open
market operations. They are issued with maturities
of 91-days, 182-days and 364-days. They are
issued on a weekly basis (Wednesday) or as may
be determined by the CBG, which publishes a
tentative issuance calendar.
• Treasury bonds (Gambian Government Stock)
are normally issued every three years for 3-year
maturity (although the last one which matured in
May 2005 was not re-issued).
Since 2002, a weekly auction of treasury and central
bank bills has replaced the fortnightly auction system.
The central bank determines which bids to accept
at a meeting held after the closing time for receipt
of bids. It will sell the bills through multiple-price
auctions where successful competitive bidders are
awarded treasury bills at a yield that equals the price
bid they submit, and those with non-competitive bids
are awarded the securities at the weighted average
clearing price.
secondary Market
There are six approved primary dealers in government
bills auctions. The secondary trading of treasury bills
is undertaken on a small scale.
Clearing and settlement
Treasury bills and central bank bills are issued using a
manual book-entry system with settlement on T+3.
3. Foreign exchange
The Gambian Dalasi (GMD) is a free-floating
currency. The central bank intervenes by buying and
selling foreign exchange in order, inter alia, to stabilize
the exchange rate and achieve the desired level of
international reserves to anchor the domestic currency.
Revaluations to the USD are done on a weekly basis.
Some restrictions exist on capital accounts.
4. investment taxation
There are no withholding taxes for either residents or
non-residents. Treasury bills are not taxable; however,
there is a 3% fee for rediscounting them before
maturity. Tax treaties exist with Norway, Sweden,
Taiwan and the United Kingdom.
5. Key Contacts
• The Central Bank of the Gambia
No. 1/2 Ecowas Avenue, Banjul, The Gambia
Tel: +220-4-228103/227633
Fax: +220-4-226969
E-mail: [email protected]
Web: http://www.gambank.gm
GMd per unit of usd (year end)
1517192123252729
2000 2001 2002 2003 2004 2005 2006Source: Bloomberg

Population (mn) 22.5Population Growth (annual %) 2Official Language EnglishCurrency Cedi (GHC)GDP (Current US$ bn) 12.24GDP Growth (annual %) 6.1GDP Per Capita (US$) 543FDI, net inflows (US$ mn) (2005) 156 External Debt (US$ mn) 9,200External Debt/GDP (%) 75.4CPI Inflation (annual %) 10.9Exports of goods and services (% of GDP) 39.4Gross Official Reserves (US$ bn) 1.91Gross Official Reserves (in months of imports) 4.5UNDP HDI RaNkING 136Source: AfDB, IMF, UNCTAD, UNDP, UN Population Division
1. overview of Financial system
The Bank of Ghana (BoG), the nation’s central bank,
was formally established by the Bank of Ghana
Ordinance No. 34 on 4 March 1957, just two days
before the declaration of political independence.
The bank has full autonomy over monetary policy. In
addition to the other main functions of a central bank,
the Bank of Ghana’s Monetary Policy Committee
(MPC), established in 2002, is responsible for
setting monetary policy. The overriding goal of
monetary policy in Ghana is price stability. Within the
Bank of Ghana’s monetary management framework,
there exist three basic targets: the ultimate or final
target (inflation), the intermediate target (money
supply) and the operating target (reserve money).
Over the past seven years, the Government has been
implementing a series of positive economic reforms.
This period has been well supported by stronger
foreign exchange inflows from buoyant cocoa and
gold exports, increased remittances from expatriates
(50% of GDP) and heightened donor support that
has resulted in external debt relief. The BoG has
been pivotal in the move to maintain a stable macro-
economic environment, a noticeable impact in the
economy being the reducing rate of inflation. The rate
of inflation had fallen, from 40% in 2005 to 10% at
the end of 2006, with an ongoing target to achieve
single-digit inflation by 2007. As a result of these
economic reforms, Ghana has increasingly been cited
by the international community as one of the best and
most conducive sub-Saharan African countries (not
including South Africa) to conduct business in.
Bank and non-Bank Financial sector
Ghana’s financial system is dominated by the banking
sector, with 20 commercial banks and only one
merchant bank. Five of the 20 banks are foreign-
owned. In addition, there are also three state-owned
development banks and over 100 rural banks serving
the micro-finance sector.
The banking sector is highly concentrated, with
the largest state-owned commercial bank, Ghana
Ghana
GEOATLAS - Copyright1998 Graphi-Ogre0 km 100 200 300 400 km
Cap St-Paul
Cap des�Trois Pointes
Cap des�Palmes
CO TE D ES ESCLA V ES
COTE
D EL'O R
C O T ED E L 'I V O I R E
GOLFE DE GUINEE
B A I E D U B E N I N
O C E A N A T L A N T I Q U E
KorhogoOdienné
SéguélaBouaké
Bondoukou
San-Pédro
Bouaflé
Divo
Dimbokro Abengourou
Agboville
Daloa
Man
Aboisso
Harper
Barclayville
Zwedru
Bobo Dioulasso
OuahigouyaDori
Diapaga
Fada�NgourmaKoudougou
Atakpamé
Sokodé
Lama-Kara
Dapaong
Néma
Bolgatanga
Tamale
Sunyani
Kumasi
Sekondi-TakoradiCape Coast
Koforidua
Ho
Benin City��
Birnin Kebbi
Sokoto
Llorin
Oshogbo
IbadanAbeokuta
Lagos
Akure
Parakou
Natitingou
Abomey
Cotonou
Lokossa
Tahoua
Dosso
Tillaberi
Sikasso
Ségou
Mopti
Tombouctou
Gao
Yamoussoukro
Abidjan
Lomé
Accra
Porto Novo
Niamey
OuagadougouBamako
Wa��
Ejura��
Mampong��
Obuasi��
Tema��
Nsawam��
Oda��
Lac Volta
Lac�Kainji
Nuon
Cavally
D ube
Sassa
n dra
Sassandra
Bandamarouge
Ba nd
ama
Bandam
aBlanc
Nzi
Kom
oé
Komoé
Léra
ba
Bia
Tano
Pra
Dak
a
Oti
Oti
Mékrou
Alibori
Mono
Ouém
é Niger
Sokoto
Bagoé
Bani
Ba
ni
Volta
Noire
Volta B lanch e
N ig
er
Nige
r
N iger
N iger
681 m
1208 m
1002 m
Mont Kopé�424 m
Mount�Nimba�1752 m
684 m
Hombori�Tondo�1155 m
1257 m844 m
Mont Agou�986 m
Afadjoto 885 m
863 m
Djébobo�876 m
Akwawa�788 m
Kwamisa�767 m
CHAINEDEL'ATACORA
PLA TEA U KW A HU
CHAIN
EAKW
APIN
Mts
D UTOU RA
GOURMA
I R Î G U I
¡ Ô Ø
A D E R
S A H A R A
SA
HE
L
GHANA
N I G E R I A
B E N I N
COTE D'IVOIRE
T O G O
LIBERIA
GUINEE
M A L I
M A U R I T A N I E
N I G E R
B U R K I N A F A S O
sovereign ratings
Longterm
Local Currency
Foreign Currency
Fitch B+ B+
s & P B+ B+
�0 – Ghana
G
2006 At a Glance
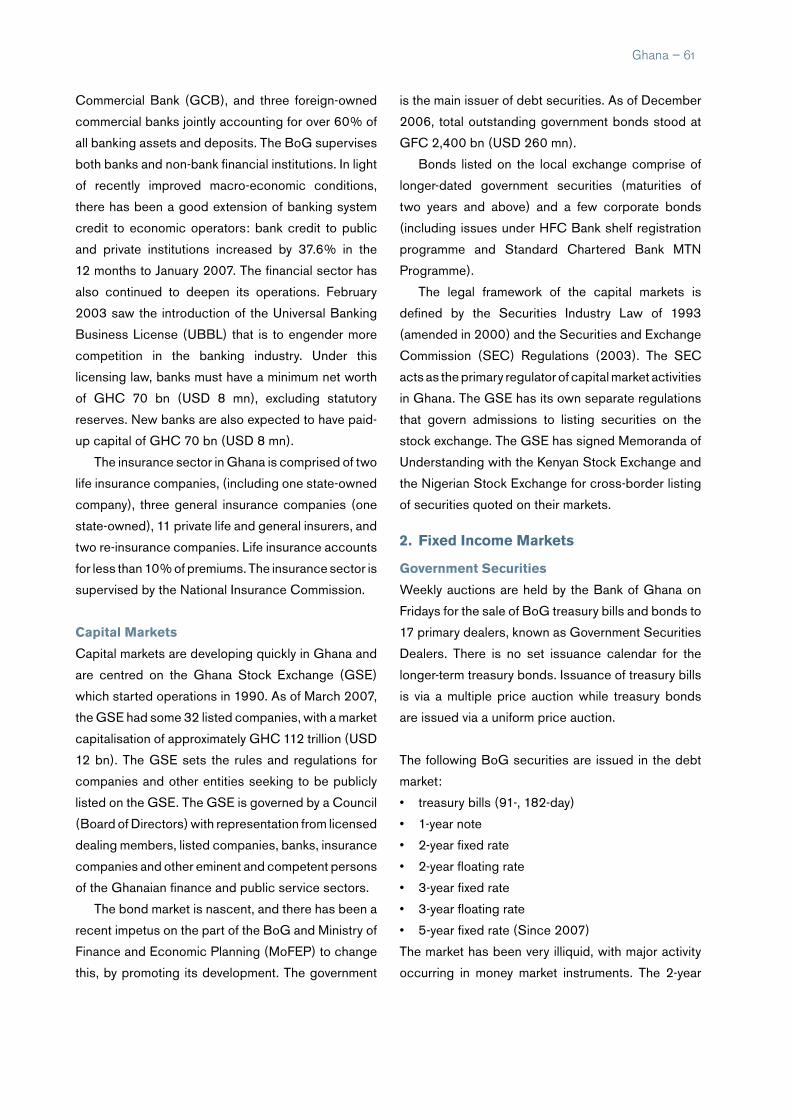
Ghana – �1
Commercial Bank (GCB), and three foreign-owned
commercial banks jointly accounting for over 60% of
all banking assets and deposits. The BoG supervises
both banks and non-bank financial institutions. In light
of recently improved macro-economic conditions,
there has been a good extension of banking system
credit to economic operators: bank credit to public
and private institutions increased by 37.6% in the
12 months to January 2007. The financial sector has
also continued to deepen its operations. February
2003 saw the introduction of the Universal Banking
Business License (UBBL) that is to engender more
competition in the banking industry. Under this
licensing law, banks must have a minimum net worth
of GHC 70 bn (USD 8 mn), excluding statutory
reserves. New banks are also expected to have paid-
up capital of GHC 70 bn (USD 8 mn).
The insurance sector in Ghana is comprised of two
life insurance companies, (including one state-owned
company), three general insurance companies (one
state-owned), 11 private life and general insurers, and
two re-insurance companies. Life insurance accounts
for less than 10% of premiums. The insurance sector is
supervised by the National Insurance Commission.
Capital Markets
Capital markets are developing quickly in Ghana and
are centred on the Ghana Stock Exchange (GSE)
which started operations in 1990. As of March 2007,
the GSE had some 32 listed companies, with a market
capitalisation of approximately GHC 112 trillion (USD
12 bn). The GSE sets the rules and regulations for
companies and other entities seeking to be publicly
listed on the GSE. The GSE is governed by a Council
(Board of Directors) with representation from licensed
dealing members, listed companies, banks, insurance
companies and other eminent and competent persons
of the Ghanaian finance and public service sectors.
The bond market is nascent, and there has been a
recent impetus on the part of the BoG and Ministry of
Finance and Economic Planning (MoFEP) to change
this, by promoting its development. The government
is the main issuer of debt securities. As of December
2006, total outstanding government bonds stood at
GFC 2,400 bn (USD 260 mn).
Bonds listed on the local exchange comprise of
longer-dated government securities (maturities of
two years and above) and a few corporate bonds
(including issues under HFC Bank shelf registration
programme and Standard Chartered Bank MTN
Programme).
The legal framework of the capital markets is
defined by the Securities Industry Law of 1993
(amended in 2000) and the Securities and Exchange
Commission (SEC) Regulations (2003). The SEC
acts as the primary regulator of capital market activities
in Ghana. The GSE has its own separate regulations
that govern admissions to listing securities on the
stock exchange. The GSE has signed Memoranda of
Understanding with the Kenyan Stock Exchange and
the Nigerian Stock Exchange for cross-border listing
of securities quoted on their markets.
2. Fixed income Markets
Government securities
Weekly auctions are held by the Bank of Ghana on
Fridays for the sale of BoG treasury bills and bonds to
17 primary dealers, known as Government Securities
Dealers. There is no set issuance calendar for the
longer-term treasury bonds. Issuance of treasury bills
is via a multiple price auction while treasury bonds
are issued via a uniform price auction.
The following BoG securities are issued in the debt
market:
• treasury bills (91-, 182-day)
• 1-year note
• 2-year fixed rate
• 2-year floating rate
• 3-year fixed rate
• 3-year floating rate
• 5-year fixed rate (Since 2007)
The market has been very illiquid, with major activity
occurring in money market instruments. The 2-year

floating rate note has an interest rate that is tied to the
91-day T-bill rate, while the 3-year floating note has
an interest rate as a spread over the 182-day T-bill
rate. These notes are an offspring of the Government
of Ghana Index-Linked Bonds (GGILBs) that were
introduced in 2001 as part of the aim to convert
short-term liabilities into longer-term obligations. The
GGILBs are being phased out by the new 2- and 3-
year fixed and floating rate notes.
The 5-year bond was issued for the first time in
early 2007, and is the government’s longest dated
non-Central Government issuance
Corporate bond issuance in Ghana is gaining ground, although issuers still remain limited in number. Pending the
amendment of the existing Act that restricts borrowings by municipalities, municipal bonds are also scheduled
to be launched in the near future to create access to cheaper and long-term funding for municipal authorities.
The table below gives details of the outstanding corporate securities in the bond market.
Bank of Ghana (BoG) yield Curve (March 2007)
9
10
11
12
13
14
15
91-days 182-days 1-yr 2-yr 3-yr 5-yr
Source: Bank of Ghana
%
�� – Ghana
G
Company name issue year industry Amount (mn) tenor Coupon (%)
Barclays Bank of Ghana 2006 Banking GHC 100,000 10 14%
Standard Chartered Bank Ghana 2005 Banking GHC 35,000 3 TB +2.00%
Standard Chartered Bank Ghana 2005 Banking GHC 91,500 Undated TB +3.00%
Home Finance Company Ltd. (Tranche H)(2) 2004 Mortgage Finance USD 2.50 5 5.00
CorPorAte Bonds
security. This issuance is part of the Government’s
plan to extend the government yield curve to provide
longer-dated securities in the market.
With reduced inflation, interest rates on treasury
securities are now following suit, coming down
significantly to match inflation expectations. There
has also been a significant decline in yields on 2- and
3-year bonds since the BoG cut its prime rate by 200
basis points to 12.5 percent at the end of 2006.
secondary Market
Secondary market trading of government securities
used to take place only over-the-counter through a
network of primary dealers. However, in 2006, the
Government, aware of the shortcomings of an illiquid
bond market, listed all outstanding 2- and 3-year BoG
bonds on the GSE, both floating- and fixed-rate issues.
The new 5-year bond was also listed on the Exchange,
all in a bid to enhance the secondary trading of these
bonds, to ensure liquidity. This has been viewed as a
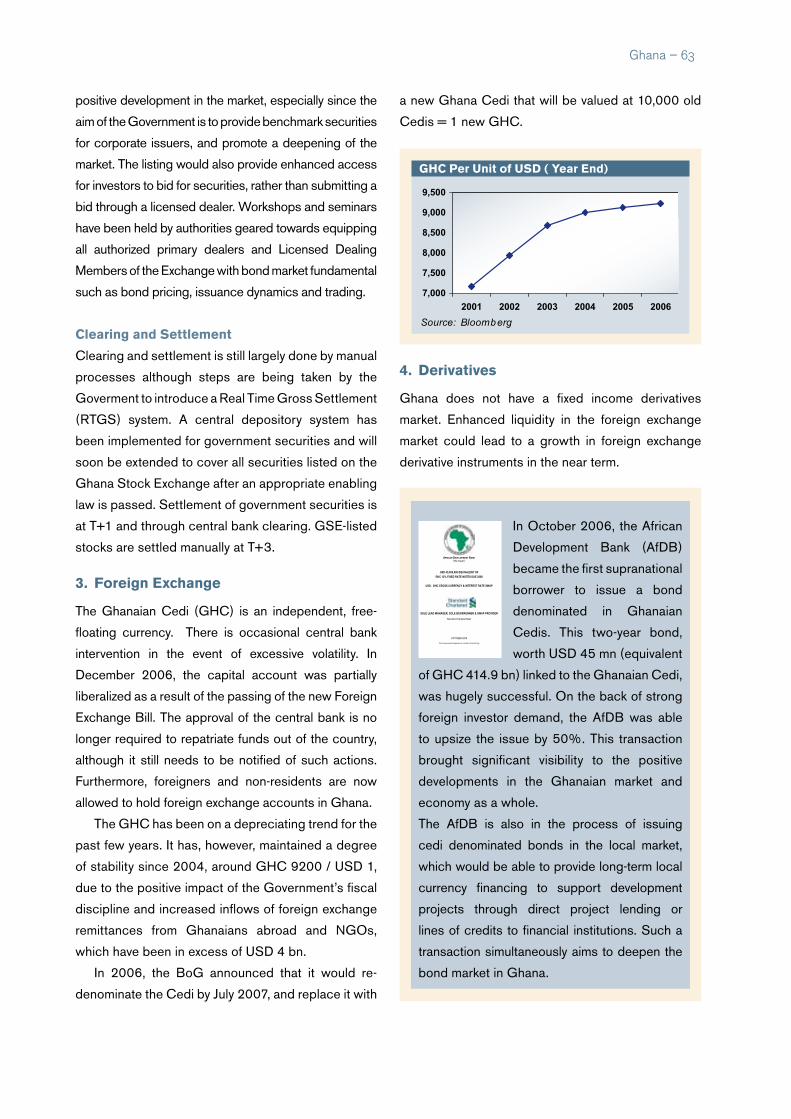
Ghana – ��
positive development in the market, especially since the
aim of the Government is to provide benchmark securities
for corporate issuers, and promote a deepening of the
market. The listing would also provide enhanced access
for investors to bid for securities, rather than submitting a
bid through a licensed dealer. Workshops and seminars
have been held by authorities geared towards equipping
all authorized primary dealers and Licensed Dealing
Members of the Exchange with bond market fundamental
such as bond pricing, issuance dynamics and trading.
Clearing and settlement
Clearing and settlement is still largely done by manual
processes although steps are being taken by the
Goverment to introduce a Real Time Gross Settlement
(RTGS) system. A central depository system has
been implemented for government securities and will
soon be extended to cover all securities listed on the
Ghana Stock Exchange after an appropriate enabling
law is passed. Settlement of government securities is
at T+1 and through central bank clearing. GSE-listed
stocks are settled manually at T+3.
3. Foreign exchange
The Ghanaian Cedi (GHC) is an independent, free-
floating currency. There is occasional central bank
intervention in the event of excessive volatility. In
December 2006, the capital account was partially
liberalized as a result of the passing of the new Foreign
Exchange Bill. The approval of the central bank is no
longer required to repatriate funds out of the country,
although it still needs to be notified of such actions.
Furthermore, foreigners and non-residents are now
allowed to hold foreign exchange accounts in Ghana.
The GHC has been on a depreciating trend for the
past few years. It has, however, maintained a degree
of stability since 2004, around GHC 9200 / USD 1,
due to the positive impact of the Government’s fiscal
discipline and increased inflows of foreign exchange
remittances from Ghanaians abroad and NGOs,
which have been in excess of USD 4 bn.
In 2006, the BoG announced that it would re-
denominate the Cedi by July 2007, and replace it with
a new Ghana Cedi that will be valued at 10,000 old
Cedis = 1 new GHC.
4. derivatives
Ghana does not have a fixed income derivatives
market. Enhanced liquidity in the foreign exchange
market could lead to a growth in foreign exchange
derivative instruments in the near term.
GHC Per unit of usd ( year end)
7,000
7,500
8,000
8,500
9,000
9,500
2001 2002 2003 2004 2005 2006
Source: Bloomberg
In October 2006, the African
Development Bank (AfDB)
became the first supranational
borrower to issue a bond
denominated in Ghanaian
Cedis. This two-year bond,
worth USD 45 mn (equivalent
of GHC 414.9 bn) linked to the Ghanaian Cedi,
was hugely successful. On the back of strong
foreign investor demand, the AfDB was able
to upsize the issue by 50%. This transaction
brought significant visibility to the positive
developments in the Ghanaian market and
economy as a whole.
The AfDB is also in the process of issuing
cedi denominated bonds in the local market,
which would be able to provide long-term local
currency financing to support development
projects through direct project lending or
lines of credits to financial institutions. Such a
transaction simultaneously aims to deepen the
bond market in Ghana.
AFRICAN DEVELOPMENT BANK(“the Issuer”)
USD 45,000,000 EQUIVALENT OF
GHC 12% FIXED RATE NOTES DUE 2008
USD - GHC CROSS CURRENCY & INTEREST RATE SWAP
SOLE LEAD MANAGER, SOLE BOOKRUNNER & SWAP PROVIDER
Standard Chartered Bank
OCTOBER 2006
This announcement appears as a matter of record only

5. Participation of Foreign investors and issuers
Current regulations allow foreigners to invest in
securities listed on the Ghana Stock Exchange
without exchange control restrictions.
In December 2006, the new Foreign Exchange
Act 2006 (Act 723) came into effect, allowing non-
residents and foreign investors to bid for securities
issued by the Government of Ghana. Foreign
investors and non-residents are allowed to invest in
capital market instruments of a tenor of three years
and above. To facilitate this, non-residents are also
allowed to maintain foreign currency accounts with
local banks, which can be credited with transfers
in foreign currency from abroad or other foreign
currency accounts. This development resulted in a
strong foreign investor participation level in the BoGs
new 5-year bond issue in January 2007.
6. investment taxation
A withholding tax rate of 10% is applicable to interest
income. Dividends are subject to a withholding and
final tax of 10%. A temporary exemption on capital
gains on securities listed on the Ghana Stock
Exchange is also in force, which is expected to last
until 2010. Ghana has double tax treaties with the
United Kingdom, France, South Africa and Italy. Other
tax obligations include: corporate tax at 25%, tax on
dividends at 7.5%, capital gains tax at 10% and VAT
at 15% (not levied on non-Ghanaian investors).
Venture capital companies receive a 5-year tax
holiday. Financial institutions investing in venture
capital subsidiaries may deduct 100% of their equity
investment from their taxable income for the year of
investment.
7. Key Contacts• Bank of Ghana
One Thorpe Road, P.O. Box
GP 2674, Accra, Ghana
Tel: +233-21-666174-6/666361-
5/ 666902-8/666921-5
Fax: +233-21-662996
E-mail: [email protected]
Web: www.bog.gov.gh
• Ghana Stock Exchange
Mailing Address: P.O. Box 1849, Accra, Ghana
Other Address: 4th Floor,
Cedi House, Accra, Ghana
Tel: +233-21-669908/14/35, 664715
Fax: +233-21-669913
E-mail: [email protected]
Web: www.gse.com.gh
• Securities and Exchange Commission
Mailing Address: Private Mail Bag,
Ministries Post Office, Accra, Ghana
Other Address: 1st Floor, State Enterprises
Commercial Building, Accra, Ghana
Tel: +233-21-669019, 7010476
Fax: + 233-21-7010477, 669588
E-mail: [email protected]
Web: www.secghana.org
• Ghana National Insurance Commission
Insurance Place, Independence
Avenue, Accra, Ghana
Office, Accra, Ghana
Postal Address: Box CT 3456, Accra
Tel: +233-21-238300-1
Fax: + 233-21-237248
E-mail: [email protected]
Web: www.nicgh.org
�� – Ghana
G

Guinea – ��
Population (mn) 9.6Population Growth (annual %) 2.1Official Language FrenchCurrency Guinean Franc (GNF) GDP (Current US$ bn) 3.0GDP Growth (annual %) 5.0GDP Per Capita (US$) 313FDI, net inflows (US$ mn) (2005) 102External Debt (US$ mn) 3,200External Debt/GDP (%) 105.6CPI Inflation (annual %) 25Exports of goods and services (% of GDP) 30.6Gross Official Reserves (US $ bn) 0.1Gross Official Reserves (in months of imports) 1.4UNDP HDI RaNkING 160Source: AfDB, IMF, UNCTAD, UNDP, UN Population Division
Guinea
1. overview of Financial system
Bank and non-Bank Financial sector
The financial system in Guinea is dominated by
the banking sector. In December 2006, seven
commercial banks were operating in the country.
Banking services are largely concentrated in the
capital, Conakry. Branches and subsidiaries of
foreign or regional banks play a relatively important
role in financial intermediation in Guinea. The Central
Bank of Guinea supervises the banking sector.
The micro-finance sector in Guinea has been
growing rapidly and at present five institutions are
operating in the country. The sector is led by Crédit
Rural de Guinée and Crédit Mutuel de Guinée, both
created by the Government with assistance from
the European Union and the French Agency for
Development. The sector is regulated by the Central
Bank of Guinea.
Four insurance companies comprise the insurance
sector in Guinea.
Guinea is a signatory to the OHADA Treaty, which
harmonizes business law in 16 countries in Sub-
Sahara Africa.
The main objective of the monetary policy as
defined and implemented by CBG, is to ensure price
stability and safeguard the domestic and foreign value
of the Guinean Franc (GNF).
2. Fixed income Markets
Government securities
The money market consists of treasury bills of 28- to
182-days, offered through an auction mechanism.
The Government has mainly used these instruments
to finance its deficit which has been increasing over
the past years. In the past, the Government has also
issued long-term bonds.
GEOATLAS - Copyright1998 Graphi-Ogre0 km 100 200 300 400 km
Cap des�Palmes
Cap Mesurado
Ile SherbroPointe Manna
Cap ShillingBaie�Yawri
Iles Turtle
Iles Tristao
Ile de Jeta
Cap Roxo
Cap Ste-Marie
Cap Vert
Orango�Grande
Baie du Sino
Baie du Cestos
C O T ED E L 'I V O I R E
COTEDES
GR A IN E S
ARCHIPEL DES BIJAGÓS
CanaldeG êba
PETITECO
TE
O C E A N �
A T L A N T I Q U E �
�
KorhogoOdienné
SéguélaBouaké
San-Pédro
Bouaflé
Divo
Dimbokro
Agboville
Daloa
Man
Harper
Voinjama
Barclayville
Greenville
RobertsportTubmanburg
Bensonville Kakata
Gbarnga
Buchanan
Sanniquellie
River Cess
Zwedru
Bobo�Dioulasso
Nzérékoré
Kankan
Faranah
Labé
Boké
Mamou
Kindia
Fatick
Diourbel
Thiès
Kaolack
Tambacounda
ZiguinchorKolda
Louga
Saint Louis
'Ayoûn�el 'Atroûs
KiffaNéma
Sélibaby
Kaédi
Aleg
Rosso
Kayes
Sikasso
Ségou
Mopti
Makeni
KenemaBo
Yomou
Beyla
Kérouané
MacentaGuéckédou
Kissidougou
Kouroussa Mandiana
Siguiri
Dabola
DinguirayeTougué
Koundara
Gaoual
Boffa
Fria
Pita
Dalaba
Forécariah
Coyah
Dubréka
Télimélé
Kambia
Monrovia
Yamoussoukro
Abidjan
Conakry
Dakar
Banjul
BissauBamako
Freetown
Sénégal
Sén
égalFerlo
Falém
é
Bakoy
Bafing
Bafing
G am bie
Ga m
bie
Geb
a
C
orubal
Corubal
Konkouré
Tinkisso
Kouya
Milo D
ion
M ong o
Rokel
Bagbe
Moa
Meli
M
oro
Man
o
M
ano
Lofa
SaintPa
ul
C estos
Nuon
Cavally
D ube
Sassa
n dra
Sassandra
Bandamarouge
Ba nd
ama
Nzi
Bandam
aBlanc
Nzi
Komoé
Léra
ba
Bagoé
Bani
Ba
ni
N iger
Little
Sca
rcies
N iger
Mount�Nimba�1752 m
Sankanbiaiwa�1709 m
Mt�Wuteve�1380 m
Bintimani�1945 m
1115 m
Mount�Kavendou�1421 m
1245 m
1538 m
581 m
262 m
1250 m
1117 m
1108 m
1257 m
Pic de Tio�1443 m
Mts
DUTOU RA
Mts�PUTU
Mts BO
NGMts
KPO
Mts�LOMA
Mf�DU TAMGUÉ
FOUTA�DJALON
KAARTA
BAMBOUK
I R Î G U I
¡ Ô Ø
AFOLLÉ
EL
'AÇÂBA
C O T E D ' I V O I R E
L I B E R I A
S I E R R A �
L E O N E
G U I N E E �B I S S A U
S E N E G A L
M A L I
M A U R I T A N I E
G A M B I E
B U R K I N A �F A S O
G U I N E E
2006 At a Glance
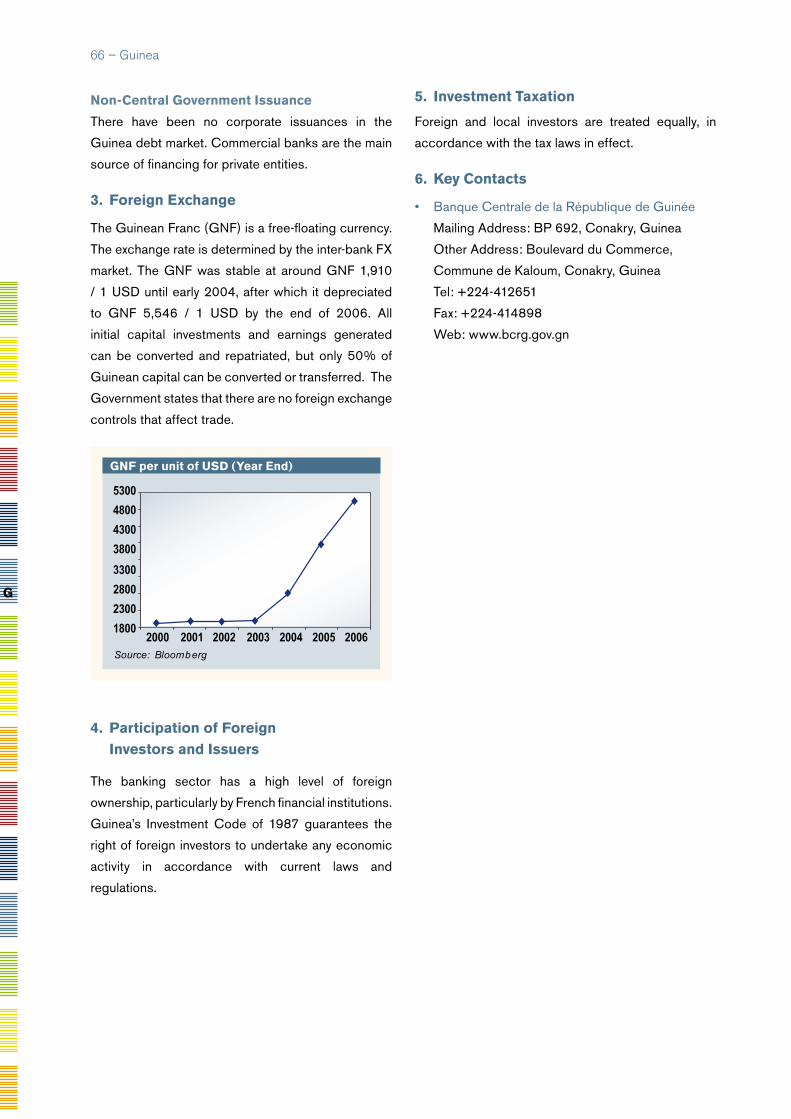
GnF per unit of usd (year end)
2000 2001 2002 2003 2004 2005 20061800
2300
2800
3300
3800
4300
4800
5300
Source: Bloomberg
non-Central Government issuance
There have been no corporate issuances in the
Guinea debt market. Commercial banks are the main
source of financing for private entities.
3. Foreign exchange
The Guinean Franc (GNF) is a free-floating currency.
The exchange rate is determined by the inter-bank FX
market. The GNF was stable at around GNF 1,910
/ 1 USD until early 2004, after which it depreciated
to GNF 5,546 / 1 USD by the end of 2006. All
initial capital investments and earnings generated
can be converted and repatriated, but only 50% of
Guinean capital can be converted or transferred. The
Government states that there are no foreign exchange
controls that affect trade.
5. investment taxation
Foreign and local investors are treated equally, in
accordance with the tax laws in effect.
6. Key Contacts
• Banque Centrale de la République de Guinée
Mailing Address: BP 692, Conakry, Guinea
Other Address: Boulevard du Commerce,
Commune de Kaloum, Conakry, Guinea
Tel: +224-412651
Fax: +224-414898
Web: www.bcrg.gov.gn
�� – Guinea
G
4. Participation of Foreign investors and issuers
The banking sector has a high level of foreign
ownership, particularly by French financial institutions.
Guinea’s Investment Code of 1987 guarantees the
right of foreign investors to undertake any economic
activity in accordance with current laws and
regulations.
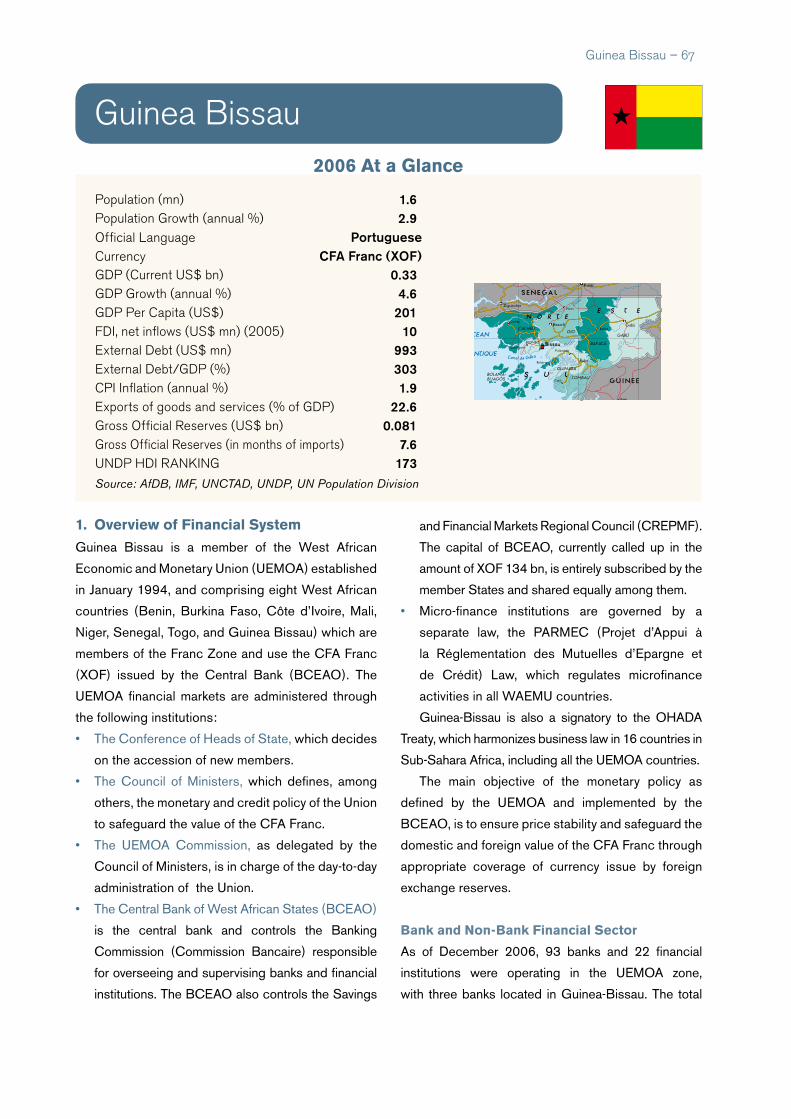
Guinea Bissau – ��
Population (mn) 1.6Population Growth (annual %) 2.9Official Language PortugueseCurrency CFA Franc (XOF)GDP (Current US$ bn) 0.33GDP Growth (annual %) 4.6GDP Per Capita (US$) 201FDI, net inflows (US$ mn) (2005) 10 External Debt (US$ mn) 993External Debt/GDP (%) 303CPI Inflation (annual %) 1.9Exports of goods and services (% of GDP) 22.6Gross Official Reserves (US$ bn) 0.081Gross Official Reserves (in months of imports) 7.6UNDP HDI RaNkING 173Source: AfDB, IMF, UNCTAD, UNDP, UN Population Division
Guinea Bissau
1. overview of Financial system
Guinea Bissau is a member of the West African
Economic and Monetary Union (UEMOA) established
in January 1994, and comprising eight West African
countries (Benin, Burkina Faso, Côte d’Ivoire, Mali,
Niger, Senegal, Togo, and Guinea Bissau) which are
members of the Franc Zone and use the CFA Franc
(XOF) issued by the Central Bank (BCEAO). The
UEMOA financial markets are administered through
the following institutions:
• The Conference of Heads of State, which decides
on the accession of new members.
• The Council of Ministers, which defines, among
others, the monetary and credit policy of the Union
to safeguard the value of the CFA Franc.
• The UEMOA Commission, as delegated by the
Council of Ministers, is in charge of the day-to-day
administration of the Union.
• The Central Bank of West African States (BCEAO)
is the central bank and controls the Banking
Commission (Commission Bancaire) responsible
for overseeing and supervising banks and financial
institutions. The BCEAO also controls the Savings
and Financial Markets Regional Council (CREPMF).
The capital of BCEAO, currently called up in the
amount of XOF 134 bn, is entirely subscribed by the
member States and shared equally among them.
• Micro-finance institutions are governed by a
separate law, the PARMEC (Projet d’Appui à
la Réglementation des Mutuelles d’Epargne et
de Crédit) Law, which regulates microfinance
activities in all WAEMU countries.
Guinea-Bissau is also a signatory to the OHADA
Treaty, which harmonizes business law in 16 countries in
Sub-Sahara Africa, including all the UEMOA countries.
The main objective of the monetary policy as
defined by the UEMOA and implemented by the
BCEAO, is to ensure price stability and safeguard the
domestic and foreign value of the CFA Franc through
appropriate coverage of currency issue by foreign
exchange reserves.
Bank and non-Bank Financial sector
As of December 2006, 93 banks and 22 financial
institutions were operating in the UEMOA zone,
with three banks located in Guinea-Bissau. The total
2006 At a Glance
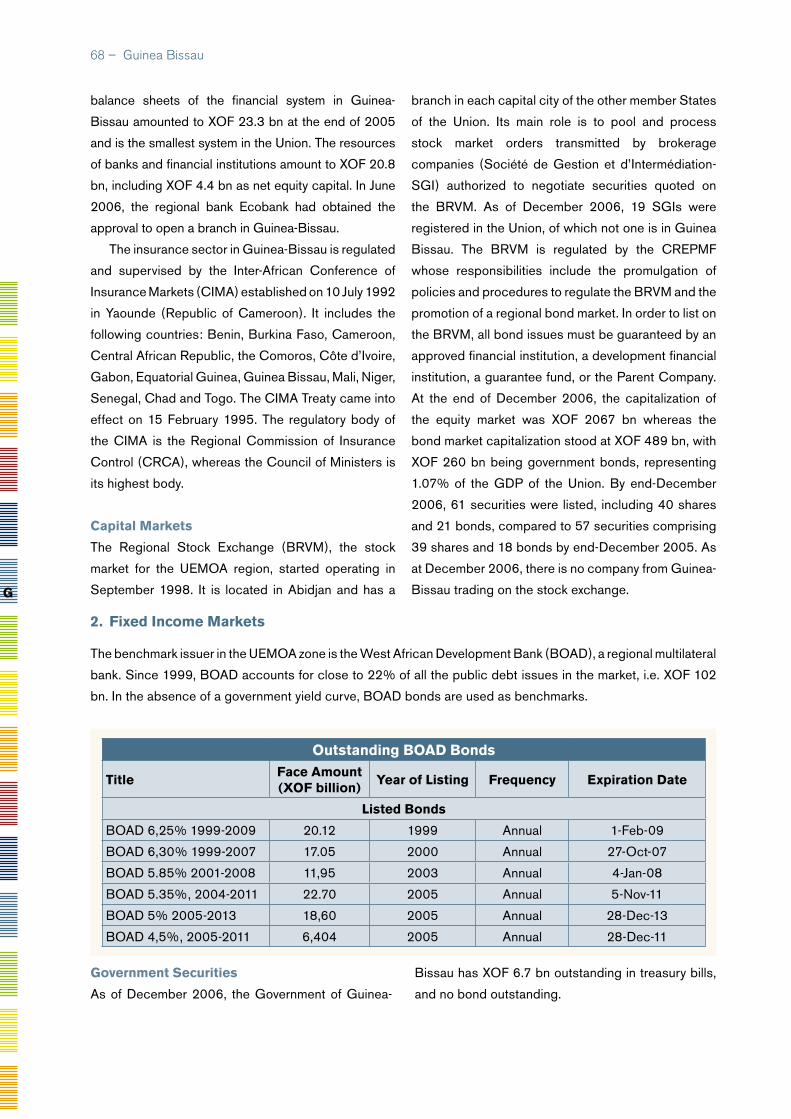
�� – Guinea Bissau
outstanding BoAd Bonds
titleFace Amount (XoF billion)
year of Listing Frequency expiration date
Listed Bonds
BOAD 6,25% 1999-2009 20.12 1999 Annual 1-Feb-09
BOAD 6,30% 1999-2007 17.05 2000 Annual 27-Oct-07
BOAD 5.85% 2001-2008 11,95 2003 Annual 4-Jan-08
BOAD 5.35%, 2004-2011 22.70 2005 Annual 5-Nov-11
BOAD 5% 2005-2013 18,60 2005 Annual 28-Dec-13
BOAD 4,5%, 2005-2011 6,404 2005 Annual 28-Dec-11
balance sheets of the financial system in Guinea-
Bissau amounted to XOF 23.3 bn at the end of 2005
and is the smallest system in the Union. The resources
of banks and financial institutions amount to XOF 20.8
bn, including XOF 4.4 bn as net equity capital. In June
2006, the regional bank Ecobank had obtained the
approval to open a branch in Guinea-Bissau.
The insurance sector in Guinea-Bissau is regulated
and supervised by the Inter-African Conference of
Insurance Markets (CIMA) established on 10 July 1992
in Yaounde (Republic of Cameroon). It includes the
following countries: Benin, Burkina Faso, Cameroon,
Central African Republic, the Comoros, Côte d’Ivoire,
Gabon, Equatorial Guinea, Guinea Bissau, Mali, Niger,
Senegal, Chad and Togo. The CIMA Treaty came into
effect on 15 February 1995. The regulatory body of
the CIMA is the Regional Commission of Insurance
Control (CRCA), whereas the Council of Ministers is
its highest body.
Capital Markets
The Regional Stock Exchange (BRVM), the stock
market for the UEMOA region, started operating in
September 1998. It is located in Abidjan and has a
branch in each capital city of the other member States
of the Union. Its main role is to pool and process
stock market orders transmitted by brokerage
companies (Société de Gestion et d’Intermédiation-
SGI) authorized to negotiate securities quoted on
the BRVM. As of December 2006, 19 SGIs were
registered in the Union, of which not one is in Guinea
Bissau. The BRVM is regulated by the CREPMF
whose responsibilities include the promulgation of
policies and procedures to regulate the BRVM and the
promotion of a regional bond market. In order to list on
the BRVM, all bond issues must be guaranteed by an
approved financial institution, a development financial
institution, a guarantee fund, or the Parent Company.
At the end of December 2006, the capitalization of
the equity market was XOF 2067 bn whereas the
bond market capitalization stood at XOF 489 bn, with
XOF 260 bn being government bonds, representing
1.07% of the GDP of the Union. By end-December
2006, 61 securities were listed, including 40 shares
and 21 bonds, compared to 57 securities comprising
39 shares and 18 bonds by end-December 2005. As
at December 2006, there is no company from Guinea-
Bissau trading on the stock exchange.G
Government securities
As of December 2006, the Government of Guinea-
Bissau has XOF 6.7 bn outstanding in treasury bills,
and no bond outstanding.
2. Fixed income Markets
The benchmark issuer in the UEMOA zone is the West African Development Bank (BOAD), a regional multilateral
bank. Since 1999, BOAD accounts for close to 22% of all the public debt issues in the market, i.e. XOF 102
bn. In the absence of a government yield curve, BOAD bonds are used as benchmarks.
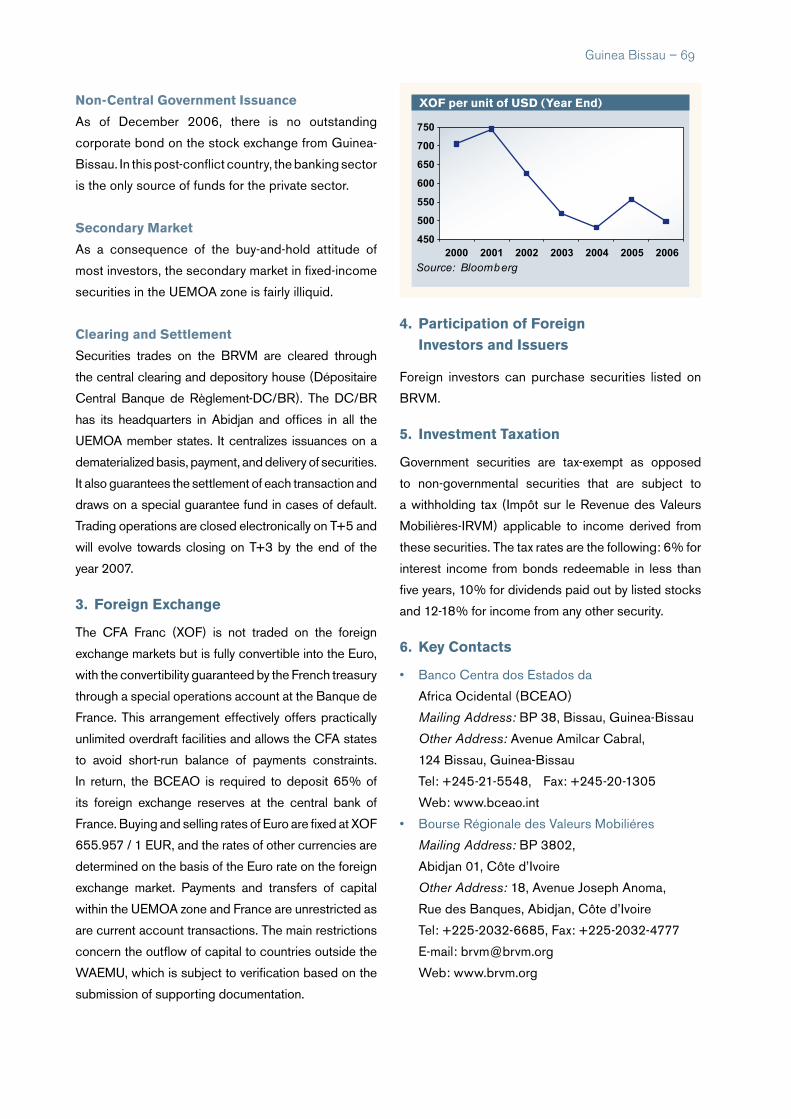
Guinea Bissau – ��
XoF per unit of usd (year end)
450
500
550
600
650
700
750
2000 2001 2002 2003 2004 2005 2006
Source: Bloomberg
non-Central Government issuance
As of December 2006, there is no outstanding
corporate bond on the stock exchange from Guinea-
Bissau. In this post-conflict country, the banking sector
is the only source of funds for the private sector.
secondary Market
As a consequence of the buy-and-hold attitude of
most investors, the secondary market in fixed-income
securities in the UEMOA zone is fairly illiquid.
Clearing and settlement
Securities trades on the BRVM are cleared through
the central clearing and depository house (Dépositaire
Central Banque de Règlement-DC/BR). The DC/BR
has its headquarters in Abidjan and offices in all the
UEMOA member states. It centralizes issuances on a
dematerialized basis, payment, and delivery of securities.
It also guarantees the settlement of each transaction and
draws on a special guarantee fund in cases of default.
Trading operations are closed electronically on T+5 and
will evolve towards closing on T+3 by the end of the
year 2007.
3. Foreign exchange
The CFA Franc (XOF) is not traded on the foreign
exchange markets but is fully convertible into the Euro,
with the convertibility guaranteed by the French treasury
through a special operations account at the Banque de
France. This arrangement effectively offers practically
unlimited overdraft facilities and allows the CFA states
to avoid short-run balance of payments constraints.
In return, the BCEAO is required to deposit 65% of
its foreign exchange reserves at the central bank of
France. Buying and selling rates of Euro are fixed at XOF
655.957 / 1 EUR, and the rates of other currencies are
determined on the basis of the Euro rate on the foreign
exchange market. Payments and transfers of capital
within the UEMOA zone and France are unrestricted as
are current account transactions. The main restrictions
concern the outflow of capital to countries outside the
WAEMU, which is subject to verification based on the
submission of supporting documentation.
4. Participation of Foreign investors and issuers
Foreign investors can purchase securities listed on
BRVM.
5. investment taxation
Government securities are tax-exempt as opposed
to non-governmental securities that are subject to
a withholding tax (Impôt sur le Revenue des Valeurs
Mobilières-IRVM) applicable to income derived from
these securities. The tax rates are the following: 6% for
interest income from bonds redeemable in less than
five years, 10% for dividends paid out by listed stocks
and 12-18% for income from any other security.
6. Key Contacts
• Banco Centra dos Estados da
Africa Ocidental (BCEAO)
Mailing Address: BP 38, Bissau, Guinea-Bissau
Other Address: Avenue Amilcar Cabral,
124 Bissau, Guinea-Bissau
Tel: +245-21-5548, Fax: +245-20-1305
Web: www.bceao.int
• Bourse Régionale des Valeurs Mobiliéres
Mailing Address: BP 3802,
Abidjan 01, Côte d’Ivoire
Other Address: 18, Avenue Joseph Anoma,
Rue des Banques, Abidjan, Côte d’Ivoire
Tel: +225-2032-6685, Fax: +225-2032-4777
E-mail: [email protected]
Web: www.brvm.org
K
Population (mn) 35.1Population Growth (annual %) 2.5Official Language (s) English/KiswahiliCurrency Kenyan Shilling (KES)GDP (Current US$ bn) 23.71GDP Growth (annual %) 5.0GDP Per Capita (US$) 675FDI, net inflows (US$ mn) (2005) 21.2External Debt (US$ mn) 5,300External Debt/GDP (%) 22.3CPI Inflation (annual %) 14.5Exports of goods and services (% of GDP) 25.1Gross official reserves (bn US$) 2.24Gross Official reserves (In months of imports) 3.6UNDP HDI RaNkING 152Source: AfDB, IMF, UNCTAD, UNDP, UN Population Division
1. overview of the Financial system
The banking system of the country is regulated and
supervised by the Central Bank of Kenya (CBK).
The primary objective of the CBK is to achieve and
maintain price stability, with an inflation target of 5
per cent, excluding food and fuel. Money supply is
managed by targeting reserve money through open-
market operations, discount-window operations,
reserve requirements and foreign exchange
operations. The Capital Markets Authority (CMA),
which comes under the Capital Markets Authority
Act, regulates the capital markets. While the CMA
has the jurisdiction of being the primary regulator
of the Kenyan capital market, the Nairobi Stock
Exchange, with its own set of listing regulations, is
responsible for approving the listing of new issues.
The Office of the Commissioner of Insurance is the
regulatory authority of the insurance sector. A new
law was passed in 2006 which is expected to modify
the regulation of the insurance industry.
Bank and non-Bank Financial sector
There are 44 banks, 5 of which control 70% of the
banking sector’s total assets. There are 15 micro-
finance institutions, 1 non-bank financial institution, 2
building societies, and 2 mortgage-finance companies.
Reforms were introduced in 2003 to improve
governance in the banking industry, by enabling the
central bank to access information on banks’ interest
and other charges. In 2004, the government introduced
a comprehensive Financial Sector Reform Strategy
that calls for changes to the Banking Act, including
the transfer of operational and licensing powers from
the Minister of Finance to the Central Bank. The
government influences the sector through state-owned
banks, including the large, state-controlled Kenya
Commercial Bank and the National Bank of Kenya.
Kenya has some 40 insurance companies, providing
both life- and general insurance services.
Capital Markets
The Nairobi Stock Exchange (NSE), established
in 1954, lists 54 companies and, as of 10 January
2007, had a total market capitalization of KES 841
bn. Companies listed on the NSE include shares
and bonds of both local and multinational corporate
kenya
GEOATLAS - Copyright1998 Graphi-Ogre0 km 100 200 300 400 km
O C E A N �
I N D I E N
Ile Zanzibar
Ile Manda
Ile Pate
Ile Pemba
Détroitde
Zanzibar
DétroitdePemba
Baie Ungama
Ras Ngomeni
Nebbi Moroto
KapchorwaMbale
KumiSoroti
Lira
Apac
KamuliTororo
IgangaJinjaMukono
Masindi
Luwero
Hoima
Mubende
Mpigi
Masaka
Rakai
BundibugyoFort Portal
Kasese
MbararaBushenyi
Rukungiri
Kabale
Bukavu
Goma
Wete
Chake Chake��
ZanzibarMahonda
Koani
Kigoma
Bukoba
Mwanza
Shinyanga
Musoma
MoshiArusha
Tanga
Singida
Tabora
KibahaMorogoro
Nyeri
Kakamega
KisumuNakuru
EmbuGarissa
Mombasa
Bu'aale
Kismaayo
Garbahaarrey
Juba Kapoeta
Moyo
Arua Gulu
Kitgum
Kotido
Kigali
Bujumbura
Kampala
Dar Es Salaam
Dodoma
NairobiThika
Kitale
Eldoret
Kericho
Akobo
Daw
a
D aua
Genale
Wabe
Gestro
Jubba
Genale
Welm el
Achw
a
Kan
gen
Omo
Nil
Albe
rt
Nil
Blanc
Katonga
Ka
gera
Ro
vubo
Ruvu
bu
M ala
garasi
Moyo w
osi
Igo
m be
U galla
Rungwa
W am i
Pangani
G alana
Athi
Tana
Ta na
Lach Dera
Lak
D era
Lach Biss igh
Lak Bor
Jubba
Wem
bere
Turkwel
Ituri
Kafo
N ilVictoria
Lac�Turkana
Lac�Chew Bahir
Lac�Chamo
Lac�Abaya
Lac�Kivu
Lac�Tanganyika
Lac�Albert
Lac�Victoria
Lac�Eyasi
Lac�Manyara
Lac�Natron
Lac�Edward
Lac Kyoga
Volcan�Karisimbi�4507 m
Margherita�Peak�
5109 m
Mt.�Elgon�4321 m
3370 m
Ketingwan�2501 m
Ng'iro�2752 m
Bokkol�2534 m
Poro�2583 m
Chepkotet�2352 m
Hanang�3417 m
Loolmalassin�3648 m
Mt�Meru�
4565 m
Kilimanjaro�5895 m
2210 m
Kasigau�1641 m
Mumoni�1747 m
Oldoinyo�Orok�2524 mGelai�
2942 m
Osupugo�2642 m
Kifinyaga�5199 m3999 m
Nelichu�1740 m
Naita�2139 m
Guge�4200 m
Bagage�1189 mHuri�
1252 m
Mount Kulal�2293 m
2149 m
Pelekech�1794 m
Songot�1755 m
Jabal Lotuke�2963 m
Kinyeti�3187 m
Zulia�2149 m
COLLINES�
MLALA
PLAINE DU�
SERENGETI
STEPPE�
MASAI�
�
CRATERE DU�NGORONGORO
KI
LIM
AN
JA
RO
Mts�
USAMBARA
RUWENZORI
RI
FT
VA
LL
EY
COLLINES�CHERANGANY
P L A I N E S �D E B U N
PLATEAU DE YATTA
ABERDARE
MONTS BLEUS
DESERT CHALBI
PLAINE�
LOTIKIPI
Mts�
DIDINGA
AUDO
RANGE
KENYA
O U G A N D A
T A N Z A N I E
BURUNDI
RWANDA
REPUBLIQUE�
DEMOCRATIQUE�
DU CONGO
E T H I O P I ES O U D A N
SO
MA
LI
E
�0 – Kenya
sovereign ratings
Longterm
Local Currency
Foreign Currency
s & P BB- BB+
2006 At a Glance
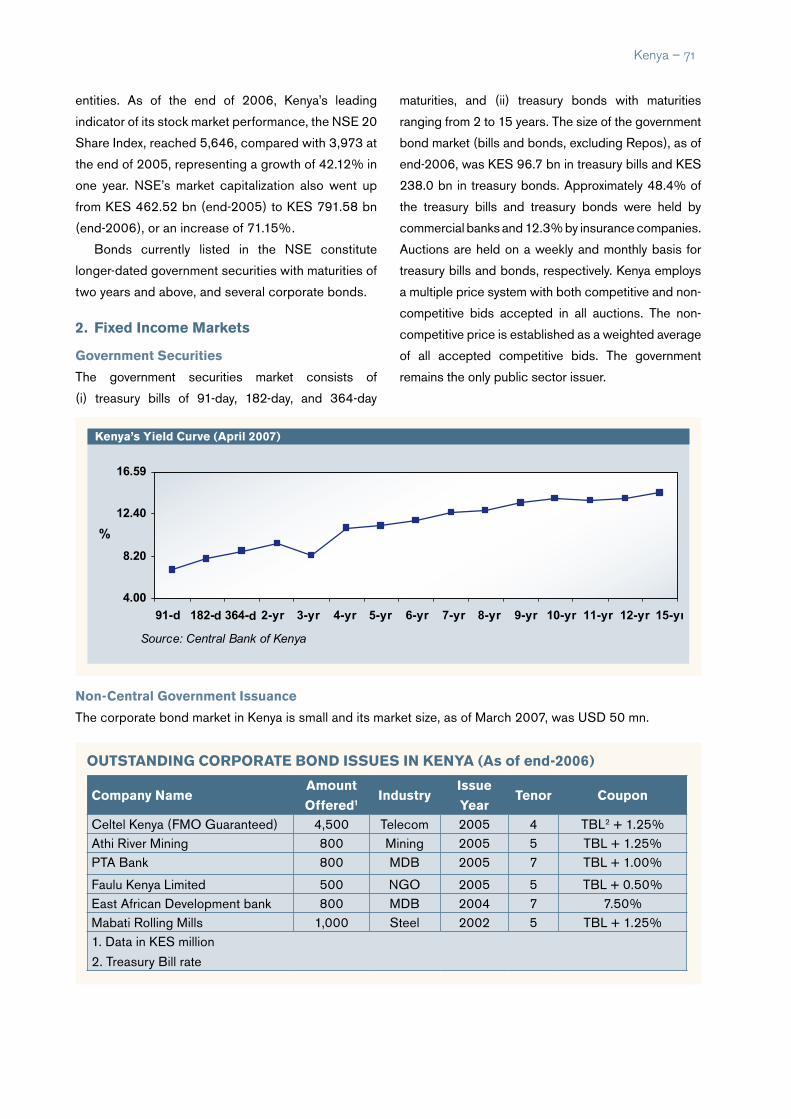
Kenya’s yield Curve (April 2007)
4.00
8.20
12.40
16.59
91-d 182-d 364-d 2-yr 3-yr 4-yr 5-yr 6-yr 7-yr 8-yr 9-yr 10-yr 11-yr 12-yr 15-yr
Source: Central Bank of Kenya
%
entities. As of the end of 2006, Kenya’s leading
indicator of its stock market performance, the NSE 20
Share Index, reached 5,646, compared with 3,973 at
the end of 2005, representing a growth of 42.12% in
one year. NSE’s market capitalization also went up
from KES 462.52 bn (end-2005) to KES 791.58 bn
(end-2006), or an increase of 71.15%.
Bonds currently listed in the NSE constitute
longer-dated government securities with maturities of
two years and above, and several corporate bonds.
2. Fixed income Markets
Government securities
The government securities market consists of
(i) treasury bills of 91-day, 182-day, and 364-day
maturities, and (ii) treasury bonds with maturities
ranging from 2 to 15 years. The size of the government
bond market (bills and bonds, excluding Repos), as of
end-2006, was KES 96.7 bn in treasury bills and KES
238.0 bn in treasury bonds. Approximately 48.4% of
the treasury bills and treasury bonds were held by
commercial banks and 12.3% by insurance companies.
Auctions are held on a weekly and monthly basis for
treasury bills and bonds, respectively. Kenya employs
a multiple price system with both competitive and non-
competitive bids accepted in all auctions. The non-
competitive price is established as a weighted average
of all accepted competitive bids. The government
remains the only public sector issuer.
Kenya – �1
outstAndinG CorPorAte Bond issues in KenyA (As of end-2006)
Company nameAmount
offered1industry
issue
yeartenor Coupon
Celtel Kenya (FMO Guaranteed) 4,500 Telecom 2005 4 TBL2 + 1.25%Athi River Mining 800 Mining 2005 5 TBL + 1.25%PTA Bank 800 MDB 2005 7 TBL + 1.00%
Faulu Kenya Limited 500 NGO 2005 5 TBL + 0.50%East African Development bank 800 MDB 2004 7 7.50%Mabati Rolling Mills 1,000 Steel 2002 5 TBL + 1.25%1. Data in KES million
2. Treasury Bill rate
non-Central Government issuance
The corporate bond market in Kenya is small and its market size, as of March 2007, was USD 50 mn.
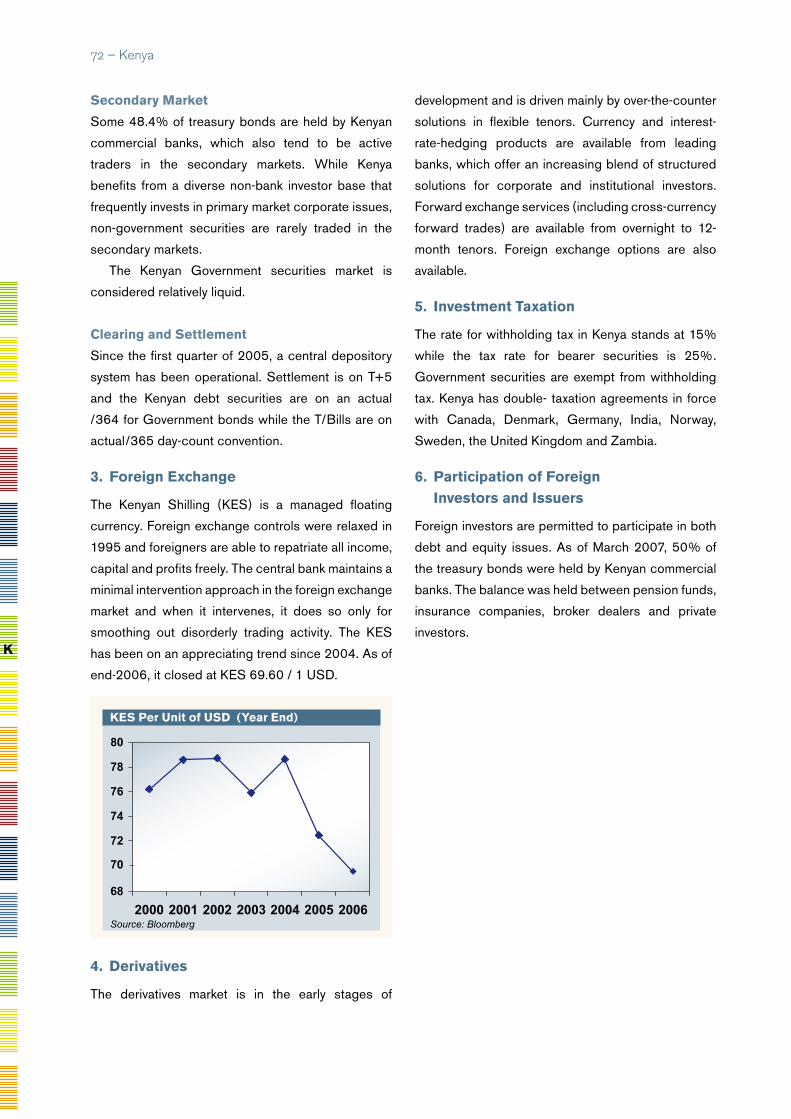
Kes Per unit of usd (year end)
68
70
72
74
76
78
80
2000 2001 2002 2003 2004 2005 2006Source: Bloomberg
secondary Market
Some 48.4% of treasury bonds are held by Kenyan
commercial banks, which also tend to be active
traders in the secondary markets. While Kenya
benefits from a diverse non-bank investor base that
frequently invests in primary market corporate issues,
non-government securities are rarely traded in the
secondary markets.
The Kenyan Government securities market is
considered relatively liquid.
Clearing and settlement
Since the first quarter of 2005, a central depository
system has been operational. Settlement is on T+5
and the Kenyan debt securities are on an actual
/364 for Government bonds while the T/Bills are on
actual/365 day-count convention.
3. Foreign exchange
The Kenyan Shilling (KES) is a managed floating
currency. Foreign exchange controls were relaxed in
1995 and foreigners are able to repatriate all income,
capital and profits freely. The central bank maintains a
minimal intervention approach in the foreign exchange
market and when it intervenes, it does so only for
smoothing out disorderly trading activity. The KES
has been on an appreciating trend since 2004. As of
end-2006, it closed at KES 69.60 / 1 USD.
4. derivatives
The derivatives market is in the early stages of
development and is driven mainly by over-the-counter
solutions in flexible tenors. Currency and interest-
rate-hedging products are available from leading
banks, which offer an increasing blend of structured
solutions for corporate and institutional investors.
Forward exchange services (including cross-currency
forward trades) are available from overnight to 12-
month tenors. Foreign exchange options are also
available.
5. investment taxation
The rate for withholding tax in Kenya stands at 15%
while the tax rate for bearer securities is 25%.
Government securities are exempt from withholding
tax. Kenya has double- taxation agreements in force
with Canada, Denmark, Germany, India, Norway,
Sweden, the United Kingdom and Zambia.
6. Participation of Foreign investors and issuers
Foreign investors are permitted to participate in both
debt and equity issues. As of March 2007, 50% of
the treasury bonds were held by Kenyan commercial
banks. The balance was held between pension funds,
insurance companies, broker dealers and private
investors.
�� – Kenya
K
7. Key Contacts
• Capital Markets Authority
Re-Insurance Plaza, 5th Floor, Taifa
Road, P.O. Box 74800-00200,
City Square, Nairobi, Kenya
Tel: +254-20-226225/221910,
Fax: +254-20-228254
E-mail: [email protected]
Web: www.cma.or.ke
• Central Bank of Kenya
Haile Selassie Avenue, P.O. Box
60000-0200, Nairobi, Kenya
Tel: +254-20-2861000/2860000
Fax: +254-20-340192
E-mail: [email protected]
Web: www.centralbank.go.ke
Kenya – ��
• Nairobi Stock Exchange
1st Floor, Nation Centre Kimathi Street,
P.O. Box 43633-00100, Nairobi, Kenya
Tel: +254-20-230692
Fax: +254-20-224200
E-mail: [email protected]
Web: www.nse.co.ke
Population (mn) 1.8Population Growth (annual %) -0.2Official Language (s) English/SesothoCurrency Loti (LSL)GDP (Current US$ bn) 1.4GDP Growth (annual %) 1.6GDP Per Capita (US$) 806FDI, net inflows (US$ mn) (2005) 47 External Debt (US$ mn) 700External Debt/GDP (%) 46.6CPI Inflation (annual %) 4.5Exports of goods and services (% of GDP) 41.8Gross Official Reserves (US$ bn) 0.591Gross Official Reserves (in month of imports) 5.3UNDP HDI RaNkING 149Source: AfDB, IMF, UNCTAD, UNDP, UN Population Division
1. overview of Financial system
The Central Bank of Lesotho, (CBL), known until 1982
as the Lesotho Monetary Authority, is charged with
the principal objective to achieve and maintain price
stability in the financial system. Lesotho is a member
of the Common Monetary Area (CMA) through a
trilateral Agreement between South Africa, Swaziland
and recently Namibia. The CMA replaced the Rand
Monetary Area in 1986, accommodating changes in
the position of Swaziland. While South Africa
effectively formulates the monetary policy for the
entire region, each member has its own central bank,
is responsible for its own monetary policy, and controls
its financial institutions. However, management
of the Rand currency and the gold and foreign
exchange reserves of the Rand area remains the sole
responsibility of South Africa. The Central Bank of
Lesotho Act of 2000 conferred a considerable degree
of autonomy to the CBL. Monetary developments have
reflected those in South Africa. The discount rate has
remained steady since August 2004, market yields
on treasury bills have moved downward, influenced
by the fall in the government borrowing requirement,
and interest rate spreads relative to South Africa have
narrowed.
Lesotho’s debt indicators have improved markedly.
With the strengthening of its fiscal position, the
Government reduced the stock of outstanding
treasury bills from 17% of GDP in 2002/03 to 8%
in 2005. Lesotho’s external public debt as a share of
GDP has also been steadily declining.
Bank and non-Bank Financial sector
The commercial banking sector is dominated by
Lesotho Bank and the South African-owned Standard
Bank (which acquired Barclays Bank’s interests in
Lesotho). The Lesotho Building Finance Corporation
merged with Lesotho Bank in April 1993 to facilitate
an increased scale of domestic mortgage lending. The
CBL regulates all financial institutions in the nation;
it established the Financial Institutions Supervision
Technical Committee (FISTC), comprising of the
Lesotho
sovereign ratings
Long term
Local Currency
Foreign Currency
Fitch BB+ BB–
�� – Lesotho
L
2006 At a Glance

governor and other senior management, in order to
develop and consistently review its programme to
establish an efficient financial system.
Capital Markets
The CMA agreement provides Lesotho’s banking
institutions with access to the South African capital
market. Public and private sector institutions of
Lesotho, which are subject to relevant financial
laws and policies applicable to counterparts, have
the full right to access the South African capital
market. There is no stock exchange in Lesotho, as
companies are able to list on the Johannesburg
Stock Exchange. There is also no formal debt
market for the issuance of treasury bonds, as
the Government only issues treasury bills for its
monetary operations.
2. Fixed income Markets
Government securities
In 1992, the Central Bank of Lesotho introduced an
English Auction System (EAS) for issuance of treasury
bills to the public. A monthly auction was introduced
in 2001 to drain excess liquidity from the highly liquid
banking sector. It is aimed at encouraging local banks
to invest their excess reserves in the country to build
up foreign reserves. The Dutch Auction System is
currently being proposed as a replacement of the
EAS as it was often difficult for first-time investors to
relate the price of the security to the rate of interest
that would accrue on their investment (i.e. purchasing
at a discount). Market-determined interest rates on
treasury bills are set at a level slightly higher than
similar instruments in South Africa. The CBL strives
to educate and sensitise the general public about its
operations in the capital markets.
3. Foreign exchange
In 1980, the Lesotho Monetary Authority (now the
Central Bank of Lesotho) began issuing the Loti (LSL)
as the national currency. The South African Rand serves
as legal tender in all countries of the Common Monetary
Area (CMA), except for Swaziland. Each member state
has the right to issue its own currency which serves as
legal tender in the issuing country only.
Under the CMA agreement, the LSL is pegged at
par to the South African Rand. There are no exchange
controls between members of the CMA. Exchange
controls for external transactions are similar to those in
the Republic of South Africa. However, these controls
and regulations are implemented by the CBL.
4. Participation of Foreign investors and issuers
There is no participation of foreign investors in
government treasury offerings.
5. investment taxation
Dividends payable to non-resident shareholders are
subject to a withholding tax of 25% and are charged
to the non-resident shareholders.
6. Key Contacts
• Central Bank of Lesotho
Mailing Address: P.O. Box 1184,
MASERU 100, Kingdom of Lesotho
Other Address: Corner Airport and Moshoeshoe
Roads, Maseru Central, Lesotho
Tel: +266)-22314281/22324281
Fax: +266-22310051/22310679
E-mail: [email protected]
Web: www.centralbank.org.ls
LsL Per unit of usd ( year end)
5
10
15
2001 2002 2003 2004 2005 2006
Source: Bloomberg
Lesotho – ��
�� – Liberia
Population (mn) 3.4Population Growth (annual %) 2.2Official Language EnglishCurrency Liberian Dollar (LRD)GDP (Current US$ bn) 0.66GDP Growth (annual %) 7.7GDP Per Capita (US$) 197FDI, net inflows (US$ mn) (2005) 194External Debt (US$ mn) 3,800External Debt/GDP (%) -CPI Inflation (annual %) 8Exports of goods and services (% of GDP) -Gross Official reserves (in US$ bn) 0.046Gross Official Reserves (in month of imports) -UNDP HDI RaNkING -Source: AfDB, IMF, UNCTAD, UNDP, UN Population Division
Liberia
1. overview of Financial system
As the internal strife in Liberia which crippled the
growth of its financial system is over, the banking
sector is beginning to revive. The formal financial sector
is centered on banking, of which 5 banks are mostly
majority-owned by foreign companies. The Central
Bank of Liberia (which replaced the National of Liberia
in 1999) regulates and supervises the banking sector.
Its key objectives include the safety and soundness
of the Liberian banking system and the adoption and
implementation of strategies for distressed banks
resolution.
The only local bank, the Liberian Bank for Development
and Investment (LBDI), is state owned. Foreign banks
comprise the following: Ecobank Liberia Limited
(a West African regional bank based in Togo with
branches throughout West Africa). First International
Bank Liberia Limited, Global Bank Liberia Limited,
and International Bank (Liberia).
The central bank is now working on plans and fresh
initiatives to address the banking sector’s non-
performing loans. This is approached via efforts to
restructure under-capitalized banks. Furthermore, in
2006, authorities have signaled that there will be no
licenses issued to new banks until the non-performing
loans problem is worked on. Good progress has
already been made in this regard, as the ratio of
non-performing loans to total advances has been
estimated to have come down from 62% in 2003 to
18.4% of total advances in 2005.
In view of the asset quality situation, an additional
weakness in the Liberian banking system is that 80%
of the revenues of banks are generated predominantly
from “fees” rather than “interest income”.
The challenges to the Central Bank of Liberia also
includes the weakness of the depositor confidence
in the banking system as 80% of the money supply
is held outside the banks and 50% of public cash is
held in US dollars.
2. Foreign exchange
The Liberian dollar (LRD) is a freely floating currency.
However, the USD is also a legal tender in Liberia
and is used alongside the Liberian dollar. But, the two
GEOATLAS - Copyright1998 Graphi-Ogre0 km 100 200 300 400 km
Cap des�Palmes
Cap Mesurado
Ile SherbroPointe Manna
Cap ShillingBaie�Yawri
Iles Turtle
Iles Tristao
Ile de Jeta
Cap Roxo
Cap Ste-Marie
Orango�Grande
Baie du Sino
Baie du Cestos
C O T ED E L 'I V O I R E
COTEDES
GR A IN E S
ARCHIPEL DES BIJAGÓS
CanaldeG êba
O C E A N �
A T L A N T I Q U E �
�
KorhogoOdienné
SéguélaBouaké
San-Pédro
Bouaflé
Divo
Dimbokro
Agboville
Daloa
Man
Harper
Voinjama
Barclayville
Greenville
RobertsportTubmanburg
Bensonville Kakata
Gbarnga
Buchanan
Sanniquellie
River Cess
Zwedru
Bobo�Dioulasso
Nzérékoré
Kankan
Faranah
Labé
Boké
Mamou
Kindia
Tambacounda
Ziguinchor
Kolda
Sikasso
Ségou
Makeni
KenemaBo
Monrovia
Yamoussoukro
Abidjan
Conakry
Banjul
BissauBamako
Freetown
Sén
égal
Falémé
Bakoy
Bafing
Bafing
G am bie
Ga m
bie
Geb
a
C
orubal
Corubal
Konkouré
Tinkisso
Kouya
Milo D
ion
M ong o
Rokel
Bagbe
Moa
Meli
M
oro
Man
o
M
ano
Lofa
SaintPa
ul
C estos
Nuon
Cavally
D ube
Sassa
n dra
Sassandra
Bandamarouge
Ba nd
ama
Nzi
Bandam
aBlanc
Nzi
Komoé
Léra
ba
Bagoé
Bani
Ba
ni
N iger
Little
Sca
rcies
N iger
Mount�Nimba�1752 m
Sankanbiaiwa�1709 m
Mt�Wuteve�1380 m
Bintimani�1945 m
1115 m
Mount�Kavendou�1421 m
1245 m
1538 m
581 m
262 m
1250 m
1117 m
1108 m
1257 m
Pic de Tio�1443 m
Mts
DUTOU RA
Mts�PUTU
Mts BO
NGMts
KPO
Mts�LOMA
Mf�DU TAMGUÉ
FOUTA�DJALON
BAMBOUK
C O T E D ' I V O I R E
G U I N E E
S I E R R A �
L E O N E
G U I N E E �B I S S A U
M A L IG A M B I E
B U R K I N A �F A S O
L I B E R I A
L
2006 At a Glance

Liberia – ��
currencies are held for different purposes. While the
Liberian dollar is held for small purchases, especially
in the rural areas, and is used by the Government
for payment of civil servants’ salaries, the US dollar
is the medium of exchange in trade and financial
transactions. Except in 2004 when it strengthened
to LRD 47.00/1USD, the LRD exchange rate versus
the USD generally held around LRD 60/1USD. In
the first quarter of 2007, it has however weakened to
LRD 61.50/1 USD. The Liberian dollar’s depreciation
in recent years is attributed to the rebound in imports
of goods and services.
3. Key Contacts• Central Bank of Liberia
PO Box 2048, Corner of Warren and
Carey Street, Monrovia, Liberia
Tel: +231-226-991/225-685/229-728
Fax: +231-226-114
Web: www.cbl.org.lr
Lrd per unit of usd (year end.)
40
60
80
2000 2001 2002 2003 2004 2005
Source: Bloomberg

Population (mn) 6.0Population Growth (annual %) 1.9Official Language ArabicCurrency Libyan Dinar (LYD)GDP (Current US$ bn) 50.36GDP Growth (annual %) 5.0GDP Per Capita (US$) 8,438FDI, net inflows (US$ mn) (2005) 261External Debt (US$ mn) 5,600External Debt/GDP (%) 11.1CPI Inflation (annual %) 3.4Exports of goods and services (% of GDP) 83.1Gross Official reserves (bn US$) 47.15Gross Official reserves (In months of imports) 43.8UNDP HDI RaNkING 64Source: AfDB, IMF, UNCTAD, UNDP, UN Population Division
1. overview of Financial system
The country has 9 major financial institutions, namely
the Central Bank of Libya, Libyan Arab Foreign Bank
(LAFB), National Commercial Bank, Republic Bank,
the Sahara Bank, Agriculture Bank, Umma Bank,
Savings and Real Estate Investment Bank, and Unity
Bank. The Central Bank of Libya supervises the
banking system, and regulates credit and interest.
Bank and non-Bank Financial sector
Bahrain-based Arab Banking Corporation (ABC), an
offshore bank, has the Central Bank of Libya as one of
its major shareholders and an overseas arm (LAFB)
to handle international banking activity. Foreign
investment is performed by the Libyan Arab Foreign
Investment Company (LAFICO), with 90% of its
foreign holdings of USD 7 bn based in Europe while
its subsidiary, the Libyan Arab African Investment
Company (LAAICO), was set up for investment in
African projects. Since 1970, the Libyan financial
sector has been dominated by highly centralized
and state-controlled bank ownership. However, the
Libya
government has recently introduced laws enabling
more financial liberalization and banking privatization,
albeit in a cautious fashion. To date, this initiative has
been very slow to take effect. The foreign banks that
have opened representative offices in Libya include
the Arab Banking Corporation (ABC), Bank Valetta
of Malta, and Suez Bank of Egypt.
2. Fixed income Markets
There is no securities market in Libya. However, in
recent years, Libya has been promoting ambitious
plans to create and develop a capital market. In
addition, since 2005, the establishment of a Libyan
Stock Exchange has been under discussion.
3. Foreign exchange
The Libyan Dinar (LYD) underwent two major
devaluations, in January 2002 (51%) and in June
2003 (15%). Since 2003, the LYD has been pegged
to the IMF’s Special Drawing Rights (SDR), a basket
of currencies consisting of USD, EUR, JPY and GBP.
GEOATLAS - Copyright1998 Graphi-Ogre0 km 100 200 300 400 km
Ile de Jerba
Ra's al-Hil$l
Ra's at-T=n
Ra's al- Muraysah
Ra's�al- Kan$'is
Golfe de�Gabès
Golfe de�la Grande Syrte
M E R M E D I T E R R A N E E
Tozeur
KebiliGabès
Médenine
Tataouine
El Wad��
Marsa �Ma—rº!
–ar$bulus�Tripoli
Ilizi
Bangh$z=
Al-Bayd$'Darnah
–ubruqMisr$tah
Ajd$biy$Surt
Ban= Wal=dMizdah
Ghary$nYafranJ$dºN$lºt
Ghad$mis
Ad=r=
Gh$t
Awb$r=
Sabh$
Wadd$n
Marzºq
Al-Jawf
2154 m Azao�2158 m
Djebel Telertheba�2420 m
1189 m
945 m
1200 m
573 m
133 m47 m
40 m
Jabal Bº Ban=�1104 m
Jabal Kissº�1712 m
Gréboun�1944 m
Jabal Arkanº�1435 m
Bette�2266 m
Emi Koussi�3415 m
Tarso Ahon�3225 m
Ehi Timi Ouli�2500 m
Pic Tousside�3315 m
Tarso Ouri�3150 m
GRAND
E RG
ORI E
NT A
L
P LA T E
A UD U T IN
G H E R T
T A S S I L I - N-
AJ
JER
ERG�D'ADMER
HO
G
G
A
JEFFARA
RMEL
EL
ABIO
D
P L A T E A U D UT IN G H E R T
JEFFARA
MESACH
MELLET
D ES E
R T�
D E O
U BA R
I
¡AM*DAT ZEGHER
PLA TEAU D E
M ARZ
ª
O A SIS D E SABH*
D E S E R T D E �
M A R Z ª Q JABAL
BIN
GH U
NAY
M
AH
AL-H
A
RªJAL-A S W A D
JABAL AS-SAWD*
JABAL�WADD*N
H A M A D A A L H A M R *
JA B A L N A F ª S A H
A L-JA
BAL A
L-AKHØ A
R
SAR+R KALANSHIYª�
AR-RAML+ AL-KAB+R
D E S E R T D E R E B IA N A
SA
R+ R
T I B A S T I
DE
SE
R
T
D
E
LI
BY
JABAL Bª SUNBUL
DEPRESS IO
ND E
Q ATTA RA
PLATEAU�
DE LIBYE
D E S E R T �
D E L I B Y E
T I B E S T I
PLATEA U
DU M A N G U ÉN I
PLATEAU�DU TCHIGAÏ
PLATEAU�DU DJADO
TÉNÉRÉ�DU TAFASSÂSSET
MASSIF�DE L'AÏR
T É N É R É
LIBYE
SOUDAN
AL
GE
RI
E
T U N I S I E
EG
YP
TE
T C H A D
N I G E R
�� – Libya
L
2006 At a Glance

The peg is LYD 2.80 / 1 SDR, allowing maximum
margins of +/- 7.5% around the peg rate. The LYD
has been generally stable within a range of LYD 1.22
– 1.42 / 1 SDR.
The central bank uses its considerable foreign
exchange reserves to ensure exchange rate stability
versus the USD. Commercial banks are allowed
to sell foreign currencies at the official rate for
transactions related to imports of essential goods
or medical treatment abroad, but fees are levied
on outward foreign exchange transfers. The LYD is
extremely illiquid. In order to conduct FX transactions,
presentation of commercial papers and/or the purpose
or the source of funds will have to be provided.
Lyd Per unit of usd (year end)
0
0.5
1
1.5
2000 2001 2002 2003 2004 2005 2006
Source: Bloomberg
4. Key Contacts
• Central Bank of Libya
P.O. Box 1103, Tripoli, Libya
Tel: +218-21-3333591-99
Fax: +218-21-4441488
E-mail: [email protected]
Web: www.cbl.gov.ly
Libya – ��

Population (mn) 19.1Population Growth (annual %) 2.6Official Language Malagasy/FrenchCurrency (Since 2005) Malagasy Ariary (MGA)GDP (Current US$ bn) 5.5GDP Growth (annual %) 4.8GDP Per Capita (US$) 288FDI, net inflows (US$ mn) (2005) 48 External Debt (US$ mn) 1.7External Debt/GDP (%) 31.5CPI Inflation (annual %) 11.4Exports of goods and services (% of GDP) 26.0Gross Official Reserves (US$ bn) 0.49Gross Official Reserves(months of imports) 3.7UNDP HDI RaNkING 143Source: AfDB, IMF, UNCTAD, UNDP, UN Population Division
1. overview of Financial system
The central bank of Madagascar, Banque Centrale
de Madagascar (BCM), was established in 1973 and
replaced the Institut d’Emission Malgache. Although
it is an independent institution, it extends statutory
loans to the Government (10% of the previous fiscal
year tax revenue). The BCM is the banker of the
Government and its advisor on all issues pertaining
to banking laws and regulations. It supervises the
banking industry and acts as the lender of last resort
to banks. It is responsible for ensuring the smooth
functioning of the financial system and setting the
Madagascan monetary policy.
The overriding objective of the Madagascan central
bank is to control inflation and keep the currency
stable externally. In implementing the monetary
policy and stabilizing prices, BCM uses reserve
requirements, open market operations, interest rates
and bank liquidity to both manage the monetary
base (operating target), and the M3 monetary base
(intermediate operating target).
Reforms have been implemented in recent
years to liberalize and enhance the efficiency of the
financial system, through the privatization of state-
owned banks, the independence of the BCM, and
the creation of an inter-bank currency market in
1994. In addition to these reforms, measures were
taken to enhance the regulation and supervision of
banking activities, namely: Law No. 95-030 of 22
February 1996 on the activities and control of credit
establishments, and Law No.96-020 of 4 September
1996 to regulate the activities and organization of
Savings and Loans institutions, the creation of the
Bank and Financial Supervision Commission, and the
introduction of prudential standards.
Bank and non-Bank Financial sector
Madagascar’s financial system is dominated by the
banking sector, which underwent a series of reforms
in the 1990s. There are eight commercial banks
operating in the country, with the four largest banks
(89% market share), each controlling more than 15%
of the market. Their lending is, however, largely limited
to large companies. There are also savings and loans
Madagascar
GEOATLAS - Copyright1998 Graphi-Ogre0 km 100 200 300 400 km
Baie d'Ambaro
Baie d'Ampasindava
Helodranon'i�Mahajamba
Baie�
d'Atongil
Baie de�Bombetoka
Baie de �Narinda
Cap�St-André
Cap�Saint-�
Vincent
Cap�Ste-Marie
Grande�Comore
Anjouan
Iles Glorieuses France
I. Mitsio
I. Bé
Iles Radama
Moheli
Mayotte France
Pointe�Itaperina
Cap Bellone
Ste-Marie
Cap Masoala
Cap Est
Cap d'Ambre
Cap St-Sébastien
O C E A N �
I N D I E N
CANAL
DU
MOZAM
BIQUE
AR C H IPEL
D ESC O M O R ES
IL E SM A S C
A R EIG
N E S
Antsiranana
Mahajanga
Toamasina
Fianarantsoa
Toliara
Antananarivo
Port Louis
Moroni
Faradofay
Morondava
Antalaha
Vohimarina
Antsirabe
Dzaoudzi
St-Denis
Mahavavy
B em arivo
So
fia
Sofia
Mah aja
mba
Betsiboka
Ikopa
Mabavavy
Manambolo
Tsiribihina
M ahajilo
M a nia
M angoky
M atsiatra
M ananantana na
Ihosy
O nilahy
Imaloto
Mangoky
Men
arandra Mandrare
M ananara
Iana
ivo
M ango
ro
Lac�Alaotra
Lac�Ihotry
Lac�Kinkony
Maromokotro�2876 m
1734 m
Kartala�2361 m
Piton de la Fournaise�2631 m
Piton de la�Petite Rivière Noire�
828 m
Piton des Neiges�3069 m
Bezavona�1479 m
Manakalampona�1393 m
1301 m
Antolana�1204 m
Ankaroaka�1445 m
Vazobe�1779 m
2052 m
720 m
Kinangaly�1319 m
1034 m
1321 m
Pic Boby�2658 m
1824 m
1637 m
Tsiafajavona�2642 m
934 m
1303 m
Vatoloha�1565 m
1315 m
Montagne d'Ambre�1475 m
PLA
TEAU
DUBEMARAHA
MASSIF DU�
TSARATANANA
A N K A RA T
RA
MASSIFDU
MA K
AY
Mf.DEL'ISALO
M f.DE L'
IV AKO A N Y
CHAINES
ANOSYEN
NES
MADAGASCAR
COMORES
MAURICE
REUNION�France
sovereign ratings
Longterm
Local Currency
Foreign Currency
s&P B B
�0 – Madagascar
M
2006 At a Glance
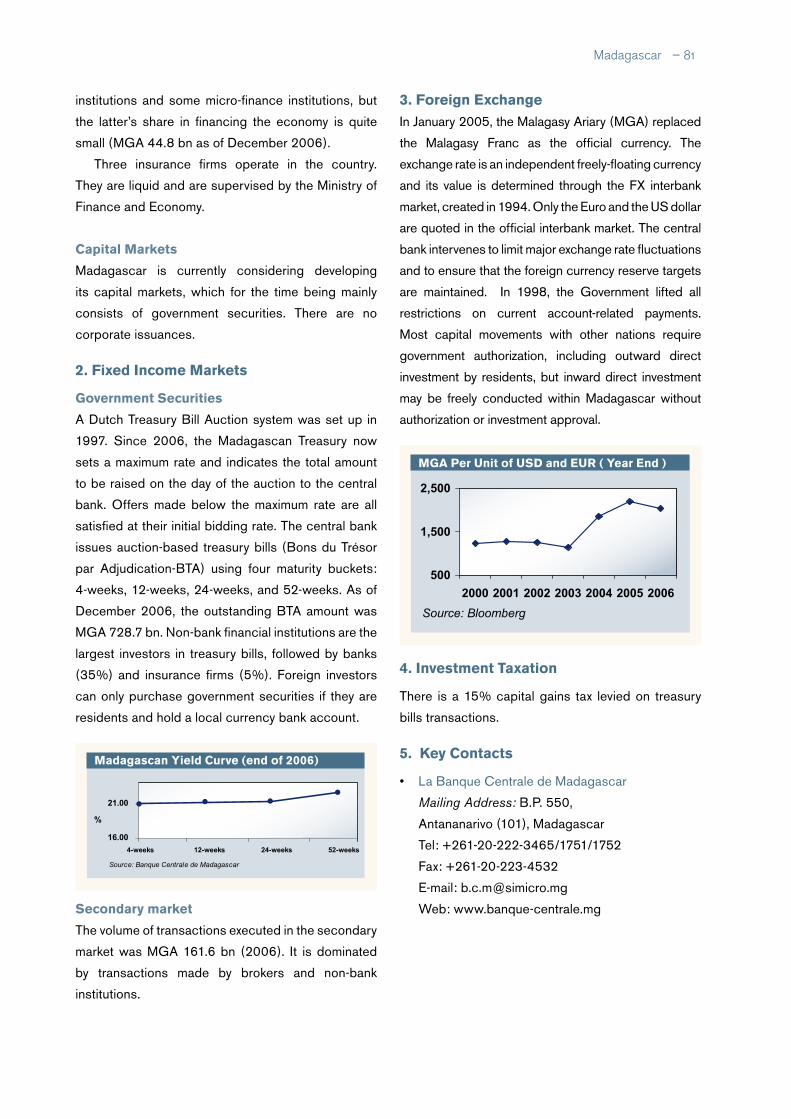
institutions and some micro-finance institutions, but
the latter’s share in financing the economy is quite
small (MGA 44.8 bn as of December 2006).
Three insurance firms operate in the country.
They are liquid and are supervised by the Ministry of
Finance and Economy.
Capital Markets
Madagascar is currently considering developing
its capital markets, which for the time being mainly
consists of government securities. There are no
corporate issuances.
2. Fixed income Markets
Government securities
A Dutch Treasury Bill Auction system was set up in
1997. Since 2006, the Madagascan Treasury now
sets a maximum rate and indicates the total amount
to be raised on the day of the auction to the central
bank. Offers made below the maximum rate are all
satisfied at their initial bidding rate. The central bank
issues auction-based treasury bills (Bons du Trésor
par Adjudication-BTA) using four maturity buckets:
4-weeks, 12-weeks, 24-weeks, and 52-weeks. As of
December 2006, the outstanding BTA amount was
MGA 728.7 bn. Non-bank financial institutions are the
largest investors in treasury bills, followed by banks
(35%) and insurance firms (5%). Foreign investors
can only purchase government securities if they are
residents and hold a local currency bank account.
secondary market
The volume of transactions executed in the secondary
market was MGA 161.6 bn (2006). It is dominated
by transactions made by brokers and non-bank
institutions.
3. Foreign exchangeIn January 2005, the Malagasy Ariary (MGA) replaced
the Malagasy Franc as the official currency. The
exchange rate is an independent freely-floating currency
and its value is determined through the FX interbank
market, created in 1994. Only the Euro and the US dollar
are quoted in the official interbank market. The central
bank intervenes to limit major exchange rate fluctuations
and to ensure that the foreign currency reserve targets
are maintained. In 1998, the Government lifted all
restrictions on current account-related payments.
Most capital movements with other nations require
government authorization, including outward direct
investment by residents, but inward direct investment
may be freely conducted within Madagascar without
authorization or investment approval.
4. investment taxation
There is a 15% capital gains tax levied on treasury
bills transactions.
5. Key Contacts
• La Banque Centrale de Madagascar
Mailing Address: B.P. 550,
Antananarivo (101), Madagascar
Tel: +261-20-222-3465/1751/1752
Fax: +261-20-223-4532
E-mail: [email protected]
Web: www.banque-centrale.mg
Madagascan yield Curve (end of 2006)
16.00
21.00
4-weeks 12-weeks 24-weeks 52-weeks
Source: Banque Centrale de Madagascar
%
Madagascar – �1
MGA Per unit of usd and eur ( year end )
500
1,500
2,500
2000 2001 2002 2003 2004 2005 2006
Source: Bloomberg
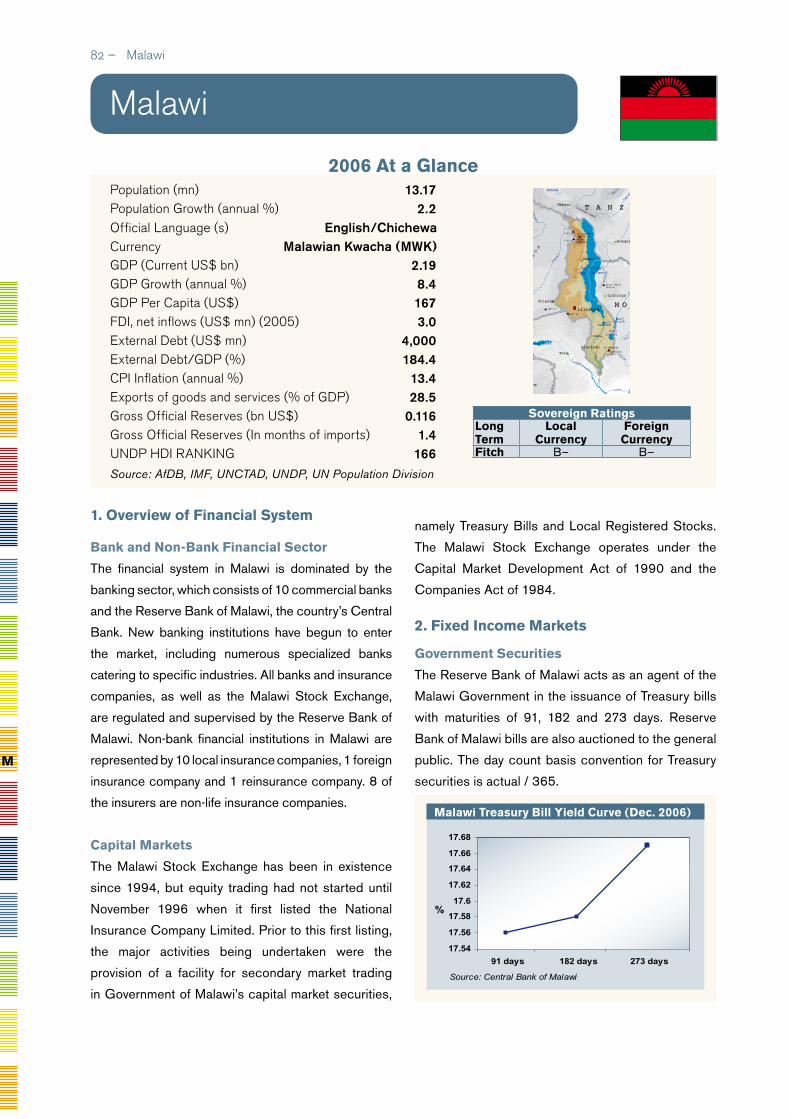
Malawi treasury Bill yield Curve (dec. 2006)
17.54
17.56
17.58
17.6
17.62
17.64
17.66
17.68
91 days 182 days 273 days
Source: Central Bank of Malawi
%
�� – Malawi
Population (mn) 13.17Population Growth (annual %) 2.2Official Language (s) English/ChichewaCurrency Malawian Kwacha (MWK)GDP (Current US$ bn) 2.19GDP Growth (annual %) 8.4GDP Per Capita (US$) 167FDI, net inflows (US$ mn) (2005) 3.0 External Debt (US$ mn) 4,000External Debt/GDP (%) 184.4CPI Inflation (annual %) 13.4Exports of goods and services (% of GDP) 28.5Gross Official Reserves (bn US$) 0.116Gross Official Reserves (In months of imports) 1.4UNDP HDI RaNkING 166Source: AfDB, IMF, UNCTAD, UNDP, UN Population Division
1. overview of Financial system
Bank and non-Bank Financial sector
The financial system in Malawi is dominated by the
banking sector, which consists of 10 commercial banks
and the Reserve Bank of Malawi, the country’s Central
Bank. New banking institutions have begun to enter
the market, including numerous specialized banks
catering to specific industries. All banks and insurance
companies, as well as the Malawi Stock Exchange,
are regulated and supervised by the Reserve Bank of
Malawi. Non-bank financial institutions in Malawi are
represented by 10 local insurance companies, 1 foreign
insurance company and 1 reinsurance company. 8 of
the insurers are non-life insurance companies.
Capital Markets
The Malawi Stock Exchange has been in existence
since 1994, but equity trading had not started until
November 1996 when it first listed the National
Insurance Company Limited. Prior to this first listing,
the major activities being undertaken were the
provision of a facility for secondary market trading
in Government of Malawi’s capital market securities,
namely Treasury Bills and Local Registered Stocks.
The Malawi Stock Exchange operates under the
Capital Market Development Act of 1990 and the
Companies Act of 1984.
2. Fixed income Markets
Government securities
The Reserve Bank of Malawi acts as an agent of the
Malawi Government in the issuance of Treasury bills
with maturities of 91, 182 and 273 days. Reserve
Bank of Malawi bills are also auctioned to the general
public. The day count basis convention for Treasury
securities is actual / 365.
Malawi
GEOATLAS - Copyright1998 Graphi-Ogre0 km 100 200 300 400 km
O C E A N �
I N D I E N
Baía�de Fernão Veloso
Cap Delgado
Ile Metundo
Ile Mafia
Ile Zanzibar
Ile Vamizi
Ile Rongui
DétroitdeMafia
Détro
itde
Zanzibar
ZombaLusaka
Harare
Dar Es Salaam
Dodoma
Lilongwe
Lubumbashi
Kabwe
Kasama
Mansa
Chipata
Ndola
Marondera
MazoweChinhoyi
MutareGweru
Chimoio
Quelimane
Tete
Nampula
PembaLichinga
Zanzibar
Mahonda
Koani
Sumbawanga
Mbeya
Iringa
KibahaMorogoro
Lindi
MtwaraSongea
Mzuzu
Blantyre
Lukug a
Luvua
U galla
Rungwa
Njo
m
be
Kilo
mbe
ro
Luw egu
Mbara
ngandu
M bw em
kuru
W am i
Ruvu m
a
Rovu m a
Messinge
Luge
nda M e
ssa l
o
Lúrio
Lúrio
LigonhaLicungo
C uácua
Chire
Shire
Hunyani
Z ambèze
Gwai
Umniat
i
Luangw
a
Lunsem fw a
Luan
gwa
K afue
Luapula
Luapula
Ch
ambeshi
Chambeshi
Lufub
u
Z
am bèze
G
reat
Ru
ah
a
G reat Ruaha
Little
Ruaha
Lac �Tshangalele
Lac�Mweru
Lac�Bangweulu
Lac�Tanganyika
Lac�Rukwa
Lac Nyasa�-Lac Malawi-
Lac�Chilwa
Lac�Malombe
Lac�Chiuta
Lac Kariba
Lac de Cahora Bassa
2207 m
Nganda�2606 m
2148 m
1660 m
2164 m
Sapitwa�3002 m
Serra Jéci�1836 m
2646 m
Lugunga�2356 m
NYIKA�PLATEAU
PLANALTO�DO MAVIA
Mt MULANJE
ESC A R P EM E N T D U Z A M B EZ E
M tsM A V U RA DON A
Mts
IN
YAN
GA
MONTS
MUCHINGA
ESCA RP
EMEN
T DES
MUCHINGA
KIPENGERE RANGE
COLLINES�
MLALA
M ts.M
ALIMBA
MARUNGU
Mts. MULUM
BE
MONTS
MITUMBA
Z I M B A B W E
Z A M B I E
REPUBLIQUE�DEMOCRATIQUE�DU CONGO
T A N Z A N I E
M O Z A M B I Q U E
MALAWIsovereign ratingsLongterm
Local Currency
Foreign Currency
Fitch B– B–
M
2006 At a Glance
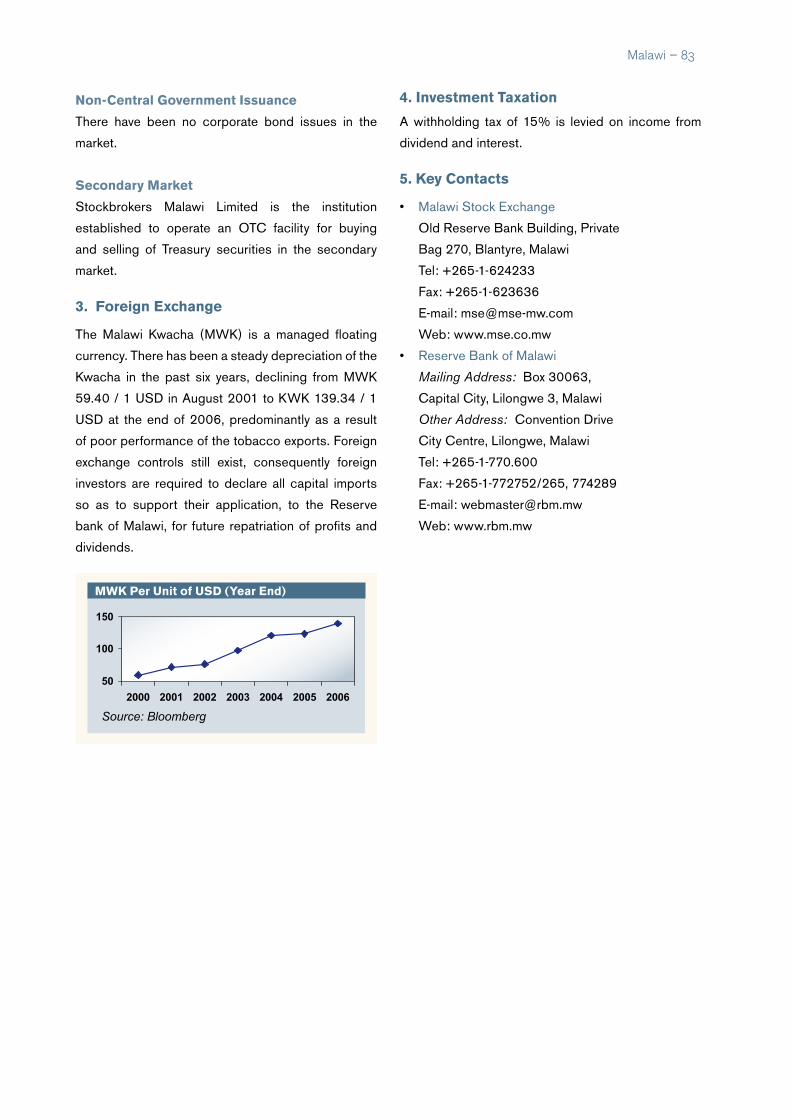
Malawi – ��
non-Central Government issuance
There have been no corporate bond issues in the
market.
secondary Market
Stockbrokers Malawi Limited is the institution
established to operate an OTC facility for buying
and selling of Treasury securities in the secondary
market.
3. Foreign exchange
The Malawi Kwacha (MWK) is a managed floating
currency. There has been a steady depreciation of the
Kwacha in the past six years, declining from MWK
59.40 / 1 USD in August 2001 to KWK 139.34 / 1
USD at the end of 2006, predominantly as a result
of poor performance of the tobacco exports. Foreign
exchange controls still exist, consequently foreign
investors are required to declare all capital imports
so as to support their application, to the Reserve
bank of Malawi, for future repatriation of profits and
dividends.
4. investment taxation
A withholding tax of 15% is levied on income from
dividend and interest.
5. Key Contacts
• Malawi Stock Exchange
Old Reserve Bank Building, Private
Bag 270, Blantyre, Malawi
Tel: +265-1-624233
Fax: +265-1-623636
E-mail: [email protected]
Web: www.mse.co.mw
• Reserve Bank of Malawi
Mailing Address: Box 30063,
Capital City, Lilongwe 3, Malawi
Other Address: Convention Drive
City Centre, Lilongwe, Malawi
Tel: +265-1-770.600
Fax: +265-1-772752/265, 774289
E-mail: [email protected]
Web: www.rbm.mw
MWK Per unit of usd (year end)
50
100
150
2000 2001 2002 2003 2004 2005 2006
Source: Bloomberg

�� – Mali
Population (mn) 13.9Population Growth (annual %) 2.9Official Language FrenchCurrency CFA Franc (XOF)GDP (Current US$ bn) 6.1GDP Growth (annual %) 5.0GDP Per Capita (US$) 436FDI, net inflows (US$ mn) (2005) 159External Debt (US$ mn) 1,411External Debt/GDP (%) 23.3CPI Inflation (annual %) 2.1Exports of goods and services (% of GDP) 24.5Gross Official Reserves (US $ bn) 0.9Gross Official Reserves (in months of imports 8.7UNDP HDI RaNkING 175Source: AfDB, IMF, UNCTAD, UNDP, UN Population Division
1. overview of Financial system
Mali is a member of the West African Economic and
Monetary Union (UEMOA) established in January
1994, and comprising eight West African countries
(Benin, Burkina Faso, Côte d’Ivoire, Mali, Niger,
Senegal, Togo, and Guinea Bissau) which are
members of the Franc Zone and use the CFA Franc
(XOF) issued by the Central Bank (BCEAO). The
UEMOA financial markets are administered through
the following institutions:
• The Conference of Heads of State, which decides
on the accession of new members.
• The Council of Ministers, which defines, among
others, the monetary and credit policy of the Union
to safeguard the value of the CFA Franc.
• The UEMOA Commission, as delegated by the
Council of Ministers, is in charge of the day-to-day
administration of the Union.
• The Central Bank of West African States (BCEAO)
is the central bank and controls the Banking
Commission (Commission Bancaire) responsible
Mali
GEOATLAS - Copyright1998 Graphi-Ogre0 km 100 200 300 400 km
OCEAN�ATLANTIQUE
Conakry
Niamey
Ouagadougou
Bamako
Freetown
Tamenghest
KorhogoOdienné
SéguélaBouaké
Bondoukou
Man
Voinjama
Sanniquellie
Bobo Dioulasso
OuahigouyaDori
DiapagaFada�NgourmaKoudougou
Atakpamé
Sokodé
Lama-Kara
Dapango
Nzérékoré
Kankan
Faranah
Labé
Mamou
Kindia
Tambacounda
'Ayoûn�el 'Atroûs
KiffaNéma
Sélibaby
Kaédi
Aleg
Tidjikja
Atâr
Akjoujt
Fdérik
Bolgatanga
Tamale
Sunyani
Lokoja
Birnin Kebbi
Sokoto
Minna
Llorin
OshogboIbadan
Natitingou
Tahoua
Dosso
TillaberiKayes
Sikasso
Ségou
Mopti
Tombouctou
Gao
Kidal
Makeni
KenemaBo
Tessalit��
Abeïbara��
Ti-n-Essako��
Bourem��
Ménaka��Ansongo�
�
Gourma-Rharous��Goundam
Niafounké
Douentza
Bandiagara
KoroBankas
Djénné
TénenkouNiono
Ké Macina��
Barouéli
Bla
SanTominian
Kadiolo
KolondiébaYanfolila
Bougouni
YorossoKoutialaDioïla
Kangaba
Koulikoro
BanambaKolokani
Mourdiah
NaraNioro du Sahel��
Diéma
Bafoulabé
Kita
Keniéba
O
uedalKhatt
Sén
égal
Ferlo
Falém
é
Bakoy
Bafing
Bafing
G am bie
Ga m
bie
Corubal
Konkouré
Tinkisso
Kouya
Milo D
ion
M ong o
Rokel
Bagbe
Moa
Meli
Sassa
n dra
Bandamarouge
Bandam
aBlanc
Nzi
Kom
oé
Komoé
Léra
ba
Dak
a
Oti
Oti
Mékrou
Alibori
Mono
Ouém
é Niger K
aduna
M ariga
Sokoto
Sokoto
Rima
Bagoé
Bani
Ba
ni
N iger
Little
Sca
rcies
Volta
Noire
Volta B lanch e
N ig
er
Nige
r
N iger
N iger
Lac Volta
Lac�Kainji
Tahat�2908 m
2355 m
Garet el Djenoun�2327 m
696 m
810 m
684 m
Hombori�Tondo�1155 m
CHAINEDEL'ATACORA
Mts
DUTOU RA
Mts�LOMA
Mf�DU TAMGUÉ
FOUTA�DJALON
KAARTA
BAMBOUK
GOURMA
T A M E SN A
A D R A R �
D E S �
I F Ô G H A S
VALLEE
DU
TILEM
S
T I M É T R I N E
A Z A OU
ÂD
ERG A TO U ILA
E L K H N Â C H Î CH
¡AMÂDA�EL ¡ARICHA EL MAHIA
EL
HA
N
K
I R Î G U I
E LM R E Y
YÉ
A O U K Â R
¡ Ô Ø
AFOLLÉ
TAGÂNT
EL
'AÇÂBA
A K C H Â R IJ
ÂF
EN
E
OU
AR
ÂN
E
M A Q – E Ï REL HAMMÂMI
AZEFFÂL
TIGUES
MAT
Y
ET
TI
KÂ
GH
E–
T IRE S
ZE M
MO U R
T I D I K E L T
'ERG
I GUÎDI
E R GC H E C H
ER
G
CH
EC
H
'ERG A Z
ENN EZ A
L
'ERG N -
ATA RA M
AS E D J R A D
MOUYDIR
TA
NE
ZR
O
U
FT
TA N N EZRO U FTN -A HN ET
TASS
ILITA -
N -AHA G G A R
T A L A K
A D ER
H O G G A R
S A H A R A
S A H E L
S O U D A N
N I G E R I A
B E N I N
G H A N A
C O T E �D ' I V O I R E
T O G O
L I B E R I A
S I E R R A �L E O N E
G U I N E E
SENEGAL
M A U R I T A N I E
SAHARA�
OCCIDENTAL
A L G E R I E
N I G E R
B U R K I N A F A S O
M A L I
sovereign ratingsLong term
Local Currency
Foreign Currency
s&P B BFitch B B
for overseeing and supervising banks and financial
institutions. The BCEAO also controls the
Savings and Financial Markets Regional Council
(CREPMF). The capital of BCEAO, currently
called up in the amount of XOF 134 bn, is entirely
subscribed by the member States and shared
equally among them.
• Micro-finance institutions are governed by a
separate law, the PARMEC (Projet d’Appui à
la Réglementation des Mutuelles d’Epargne et
de Crédit) Law, which regulates micro-finance
activities in all WAEMU countries.
Mali is also a signatory to the OHADA Treaty,
which harmonizes business law in 16 countries in Sub-
Sahara Africa, including all the UEMOA countries.
The main objective of the monetary policy as
defined by the UEMOA and implemented by the
BCEAO, is to ensure price stability and safeguard the
domestic and foreign value of the CFA Franc through
appropriate coverage of currency issue by foreign
exchange reserves.
M
2006 At a Glance

Mali – ��
Bank and non-Bank Financial sector
As of December 2006, there were 93 banks and 22
financial institutions operating in the UEMOA zone,
with 12 banks, including an active housing finance
bank (Banque de l’Habitat du Mali) and four financial
institutions located in Mali. The total balance sheets
of the financial system in Mali amounted to XOF 949
bn at the end of 2005, with banks accounting for
more than 98%, representing 36% of the country’s
GDP. In the Union, the financial sector of Mali is the
third in size after the Ivorian and Senegalese markets;
it represents 14% of the total balance sheets of the
UEMOA financial system. The resources of banks and
financial institutions amount to XOF 826 bn, including
XOF 90 billion as net equity capital. Branches and
subsidiaries of foreign or regional banks play a
relatively important role in financial intermediation
in UEMOA. In fact, eight groups (including Société
Générale, BNP Paribas, Credit Lyonnais, Citibank,
Bank of Africa, Ecobank, and Financial B.C.)
dominate the UEMOA banking system with relatively
wide national networks.
The insurance sector in Mali is regulated and
supervised by the Inter-African Conference of
Insurance Markets (CIMA) established on 10 July
1992 in Yaounde (Cameroon). It includes the
following countries: Benin, Burkina Faso, Cameroon,
Central African Republic, the Comoros, Côte d’Ivoire,
Gabon, Equatorial Guinea, Guinea Bissau, Mali, Niger,
Senegal, Chad and Togo. The CIMA Treaty came into
effect on 15 February 1995. The regulatory body of
the CIMA is the Regional Commission of Insurance
Control (CRCA) whereas the Council of Ministers is
its highest body. The total portfolio of the UEMOA
CIMA zone is dominated by the sector of non-life
insurance. Compared to GDP of 2005, the turnover
of the insurance sector in Mali represents 0.5%, well
below the average ratio in Africa of 4.8%. At the end
of 2005, one life insurance and five non-life insurance
companies were operating in the country with a
total turnover of XOF 15 bn; life insurance products
represented 10% and vehicle insurance 36% of the
turnover.
Mali’s financial system includes a growing micro-
finance industry comprised of more than 300
institutions serving rural communities.
Capital Markets
The Regional Stock Exchange (BRVM), the stock
market for the UEMOA region, started operating in
September 1998. It is located in Abidjan and has a
branch in each capital city of the other member States
of the Union. Its main role is to pool and process
stock market orders transmitted by brokerage
companies (Société de Gestion et d’Intermédiation-
SGI) authorized to negotiate securities quoted on
the BRVM. As of December 2006, 19 SGIs were
registered in the Union. SGI Mali, the sole brokerage
company in Mali as of December 2006, provides
brokerage services for the BRVM. The BRVM is
regulated by the CREPMF whose responsibilities
include the promulgation of policies and procedures
to regulate the BRVM and the promotion of a regional
bond market. In order to list on the BRVM, all bond
issues must be guaranteed by an approved financial
institution, a development financial institution, a
guarantee fund, or the Parent Company. At the end
of December 2006, the capitalization of the equity
market was XOF 2,067 bn whereas the bond market
capitalization stood at XOF 489 bn, with XOF 260
bn being government bonds, representing 1.07% of
the GDP of the Union. By end-December 2006, 61
securities were listed, including 40 shares and 21
bonds, compared to 57 securities comprising 39
shares and 18 bonds by end-December 2005. As
of December 2006, none of the listed companies
originates from Mali.
2. Fixed income Markets
The benchmark issuer in the UEMOA zone is the
West African Development Bank (BOAD), a regional
multilateral bank. Since 1999, BOAD accounts for
close to 22% of all the public debt issues in the market,
i.e. XOF 102 bn. In the absence of a government yield
curve, BOAD bonds are used as benchmarks.

�� – Mali
outstanding BoAd Bonds
titleFace Amount (XoF billion)
year of Listing
Frequency expiration date
Listed Bonds
BOAD 6.25% 1999-2009 20.12 1999 Annual 1-Feb-09
BOAD 6,30% 1999-2007 17.05 2000 Annual 27-Oct-07
BOAD 5.85% 2001-2008 11,95 2003 Annual 4-Jan-08
BOAD 5.35% 2004-2011 22.70 2005 Annual 5-Nov-11
BOAD 5% 2005-2013 18,60 2005 Annual 28-Dec-13
BOAD 4,5% 2005-2011 6,404 2005 Annual 28-Dec-11
non Government debt issuance
titleFace Amount (XoF billion)
year of Listing
Frequency expiration date
Listed Bonds
BHM 7.50% 2002-2007 9.40 2003 Annual 20-Jan-07
BNDA DU MALI 6.50% 2004-2009 3.50 2004 Annual 20-Apr-09
Government securities
The Government has used treasury bills to fund
it deficit and is yet to issue a bond on the BRVM
since 1998. However, as of December 2006, the
Government has no outstanding treasury bills, which
contrasts with 2005 when the Government was very
active in the treasury bill market, issuing a total amount
of XOF 85 bn.
secondary Market
As a consequence of the buy-and-hold attitude of
most investors, the secondary market in fixed-income
securities in the UEMOA zone is fairly illiquid.
Clearing and settlement
Securities trades on the BRVM are cleared through
the central clearing and depository house (Dépositaire
Central Banque de Règlement-DC/BR). The DC/BR
has its headquarters in Abidjan and offices in all the
UEMOA member states. It centralizes issuances
on a dematerialized basis, payment, and delivery of
securities. It also guarantees the settlement of each
transaction and draws on a special guarantee fund
in cases of default. Trading operations are closed
electronically on T+5 and will evolve towards closing
on T+3 by the end of the year 2007.
3. Foreign exchange
The CFA Franc (XOF) is not traded on the foreign
exchange markets but is fully convertible into the
Euro, with the convertibility guaranteed by the French
treasury through a special operations account at
the Banque de France. This arrangement effectively
offers practically unlimited overdraft facilities and
allows the CFA states to avoid short-run balance
M
non-Central Government issuance
The CREPMF requires that corporate bonds be guaranteed before they can be listed on the BRVM. This
requirement can explained the limited amount of resources raised by corporate through public debt issuances,
in EMOA in general and in Mali in particular. At the end of the year 2006, there is only one outstanding corporate
bond from Mali.

Mali – ��
XoF per unit of usd (year end)
450
500
550
600
650
700
750
800
2000 2001 2002 2003 2004 2005 2006
Source: Bloomberg
non CFA domiciled issuers
titleFace Amount (XoF billion)
year of Listing
Frequency expiration date
Listed BondsSHELTER-Afrique 6.25% 2003-2010 3.50 2003 Semi-annual 20-Feb-10
Private Placement BondsSHELTER-Afrique 6% 2004-2009 2.50 2004 Semi-annual 26-Nov-09
of payments constraints. In return, the BCEAO is
required to deposit 65% of its foreign exchange
reserves at the central bank of France. Buying and
selling rates of Euro are fixed at XOF 655.957/1 EUR,
and the rates of other currencies are determined on
the basis of the Euro rate on the foreign exchange
market. Payments and transfers of capital within the
UEMOA zone and France are unrestricted as are
current account transactions. The main restrictions
concern the outflow of capital to countries outside
the WAEMU, which is subject to verification based
on the submission of supporting documentation.
5. Participation of Foreign investors and issuers
The banking sector has a high level of foreign ownership, particularly by French financial institutions. Foreign
investors can purchase securities listed on BRVM. For instance, an international non-governmental organization,
Shelter Afrique, based in Nairobi (Kenya), has issued bonds and listed them on the BRVM.
4. derivatives
The derivative market is in its infancy. Foreign
exchange forwards exist with moderate liquidity and
tenors extending up to 3-6 months.
6. investment taxation
Government securities are tax-exempt as opposed
to non-governmental securities that are subject to a
withholding tax (Impôt sur le Revenue des Valeurs
Mobilières-IRVM) applicable to income derived from
these securities. The tax rates are the following:
6% for interest income from bonds redeemable in
less than five years, 10% for dividends paid out by
listed stocks and 12-18% for income from any other
security.
7. Key Contacts
• Banque Centrale des Etats de
l'Afrique de l'Ouest (BCEAO)
Mailing Address: BP 206, Bamako, Mali
Other Address: Avenue Moussa Travele,
Bamako, Mali
Tel: +223-22254/223756/223757
Fax: +223-224786
Web: www.bceao.int
• Bourse Régionale des Valeurs Mobiliéres
Mailing Address: BP 3802,
Abidjan 01, Côte d’Ivoire
Other Address: 18, Avenue Joseph Anoma,
Rue des Banques, Abidjan, Côte d’Ivoire
Tel: +225-2032-6685
Fax: +225-2032-4777
E-mail: [email protected]
Web: www.brvm.org
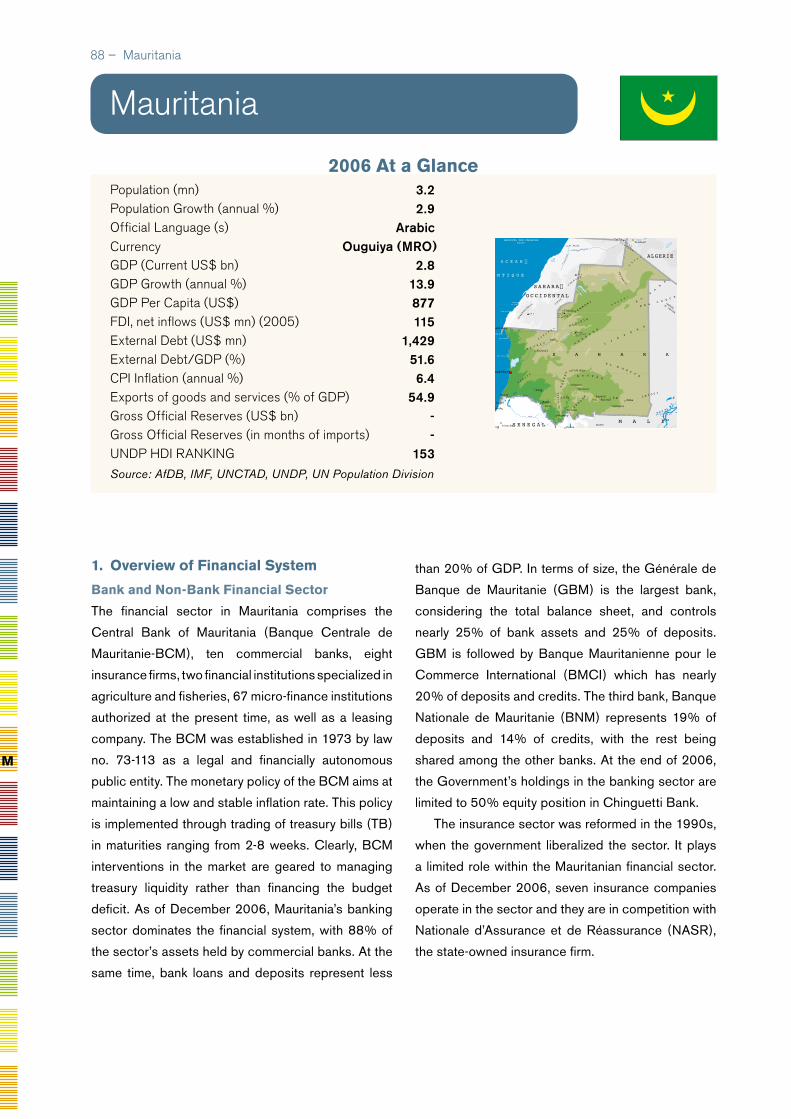
�� – Mauritania
Population (mn) 3.2Population Growth (annual %) 2.9Official Language (s) ArabicCurrency Ouguiya (MRO)GDP (Current US$ bn) 2.8GDP Growth (annual %) 13.9GDP Per Capita (US$) 877FDI, net inflows (US$ mn) (2005) 115 External Debt (US$ mn) 1,429External Debt/GDP (%) 51.6CPI Inflation (annual %) 6.4Exports of goods and services (% of GDP) 54.9Gross Official Reserves (US$ bn) -Gross Official Reserves (in months of imports) -UNDP HDI RaNkING 153Source: AfDB, IMF, UNCTAD, UNDP, UN Population Division
1. overview of Financial system
Bank and non-Bank Financial sector
The financial sector in Mauritania comprises the
Central Bank of Mauritania (Banque Centrale de
Mauritanie-BCM), ten commercial banks, eight
insurance firms, two financial institutions specialized in
agriculture and fisheries, 67 micro-finance institutions
authorized at the present time, as well as a leasing
company. The BCM was established in 1973 by law
no. 73-113 as a legal and financially autonomous
public entity. The monetary policy of the BCM aims at
maintaining a low and stable inflation rate. This policy
is implemented through trading of treasury bills (TB)
in maturities ranging from 2-8 weeks. Clearly, BCM
interventions in the market are geared to managing
treasury liquidity rather than financing the budget
deficit. As of December 2006, Mauritania’s banking
sector dominates the financial system, with 88% of
the sector’s assets held by commercial banks. At the
same time, bank loans and deposits represent less
than 20% of GDP. In terms of size, the Générale de
Banque de Mauritanie (GBM) is the largest bank,
considering the total balance sheet, and controls
nearly 25% of bank assets and 25% of deposits.
GBM is followed by Banque Mauritanienne pour le
Commerce International (BMCI) which has nearly
20% of deposits and credits. The third bank, Banque
Nationale de Mauritanie (BNM) represents 19% of
deposits and 14% of credits, with the rest being
shared among the other banks. At the end of 2006,
the Government’s holdings in the banking sector are
limited to 50% equity position in Chinguetti Bank.
The insurance sector was reformed in the 1990s,
when the government liberalized the sector. It plays
a limited role within the Mauritanian financial sector.
As of December 2006, seven insurance companies
operate in the sector and they are in competition with
Nationale d’Assurance et de Réassurance (NASR),
the state-owned insurance firm.
Mauritania
GEOATLAS - Copyright1998 Graphi-Ogre0 km 100 200 300 400 km
Cap Vert
Râs Timirist
Râs Nouâdhibou
Cap Barbas
Cap Juby
Golfe�de Cintra
Râs Agâdîr
O C E A N �
A T L A N T I Q U E
GomeraHierro
Gran Canaria
ARCHIPEL DES CANARIES�Espagne
Dakar
Nouakchott
Tindouf
Fatick Diourbel
Thiès
Louga
Saint Louis
'Ayoûn�el 'Atroûs
KiffaNéma
Sélibaby
Kaédi
Aleg
Rosso
Tidjikja
Atâr
Akjoujt
Nouâdhibou
Fdérik
Kayes Mopti
Timbedgha
Tamchaket
Boûmdeïd
Kankossa
Mbout
El Aaiún
Las Palmas de �Gran Canaria
O ued D râa
As Saqu ia alH am ra
O
uedalKhatt
Sénégal
FerloN iger
Kediet�ej Jill�915 m
Guelb�er Rîchât�485 m
701 m
518 m
Pico de�Teide�3715 m
1949 m
KAARTA
¡AMÂDA�EL ¡ARICHA
EL
HA
N
K
I R Î G U I
E LM
RE
YY
ÉA O U K Â R
¡ Ô Ø
AFOLLÉ
TAGÂNT
EL
'AÇÂBA
TRÂRZA
A K C H Â R IJ
ÂF
EN
E
OU
AR
ÂN
E
M A Q – E Ï REL HAMMÂMI
AZEFFÂL
TIGUES
MAT
Y
ET
TI
KÂ
GH
E–
ADRARSOUT
TOU F
T IRE S
ZE M
MO U R
HAMADA�
DE TINDOUF
E R GC H E C H
S A H A R A
MAURITANIE
S E N E G A LM A L I
S A H A R A �
O C C I D E N T A L
M A R O C
ALGERIE
M
2006 At a Glance

Mauritania – ��
2. Fixed income MarketsGovernment securities
There is a money market that consists of treasury
bills of 8- to 24-weeks, offered through an auction
mechanism.
non-Central Government issuance
There have been no corporate issuances in the
Mauritanian debt market.
3. Foreign exchange
The Mauritanian Ouguiya (MRO) is a managed
floating currency. Since May 2003, the Ouguiya has
experienced big swings, between MRO 253 and
MRO 280 per USD. Mauritania has a free exchange
regime. In practice, the transfer of capital is handled
by banks. Since the sector was liberalized, banks
do not need authorization from the central bank to
transfer funds abroad.
Mro per unit of usd (year end)
240
250
260
270
280
2000 2001 2002 2003 2004 2005 2006
Source: Bloomberg
4. Participation of Foreign investors and issuers
Mauritania’s economy has become quite liberalized
and is very conducive to foreign investments,
specifically in the financial and banking sector.
5. investment taxation
Domestic and foreign investors are treated equally.
6. Key Contacts
• Banque Centrale de Mauritanie
B.P. 623 Nouakchott, Mauritanie
Tel: +222-252206, 252888
Fax: +222-252759
E-mail: [email protected]
Web: www.bcm.mr

�0 – Mauritius
Population (mn) 1.26Population Growth (annual %) 0.9Official Language (s) English/FrenchCurrency Mauritius Rupee (MUR)GDP (Current US$ bn) 6.4GDP Growth (annual %) 3.9GDP Per Capita (US$) 5,115FDI, net inflows (US$ mn) (2005) 24 External Debt (US$ mn) 900External Debt/GDP (%) 14CPI Inflation (annual %) 8.9Exports of goods and services (% of GDP) 61.8Gross Official Reserves (US$ bn) 1.4Gross Official Reserves (in months of imports) 5.0UNDP HDI RaNkING 63Source: AfDB, IMF, UNCTAD, UNDP, UN Population Division
1. overview of the financial system
The Bank of Mauritius (BAM) was established
in September 1967 as the central bank of the
country. BAM is responsible for the formulation and
execution of monetary policy consistent with stable
price conditions. In its conduct of monetary policy,
of which the aim is to maintain price stability, M2
money supply is the intermediate target of monetary
policy. Apart from formulating and conducting
monetary policy, the main functions of the central
bank are the following: issuer of currency, banker
to the Government and to banks, provider of an
efficient payment, settlement and clearing system,
management of the public debt, management of
foreign exchange reserves, regulator and supervisor
of banks, and adviser to the Government on financial
matters. The financial sector plays a meaningful
role in facilitating Mauritius’ economic development
by contributing about 19% of GDP over the past
year.
Bank and non-Bank Financial sector
The Bank of Mauritius regulates and supervises the
Banking industry. There are currently 19 registered
banks and 13 registered non-bank deposit-taking
institutions operating in Mauritius, with some 173
branches. The banking industry is very developed
and efficient but witnesses a considerable degree
of concentration of ownership. Total assets of
commercial banks as at 30 June 2006 amounted
to MUR. 491 bn, which represents an increase of
17.7% over the previous year. Total deposits stood at
MUR. 344 bn, including MUR. 208 bn held in foreign
currencies. The two largest banks in Mauritius,
Mauritius Commercial Bank and State Bank of
Mauritius, control approximately 70% of all banking
assets.
Insurance regulation and supervision is entrusted
to the Financial Services Commission (FSC). Some
22 insurance companies operate in the country.
Life insurance has been favoured by generous tax
incentives and has also benefited from the growth of
Mauritius
sovereign ratings
Long term
Local Currency
Foreign Currency
Moody’s Baa1 Baa2
M
2006 At a Glance
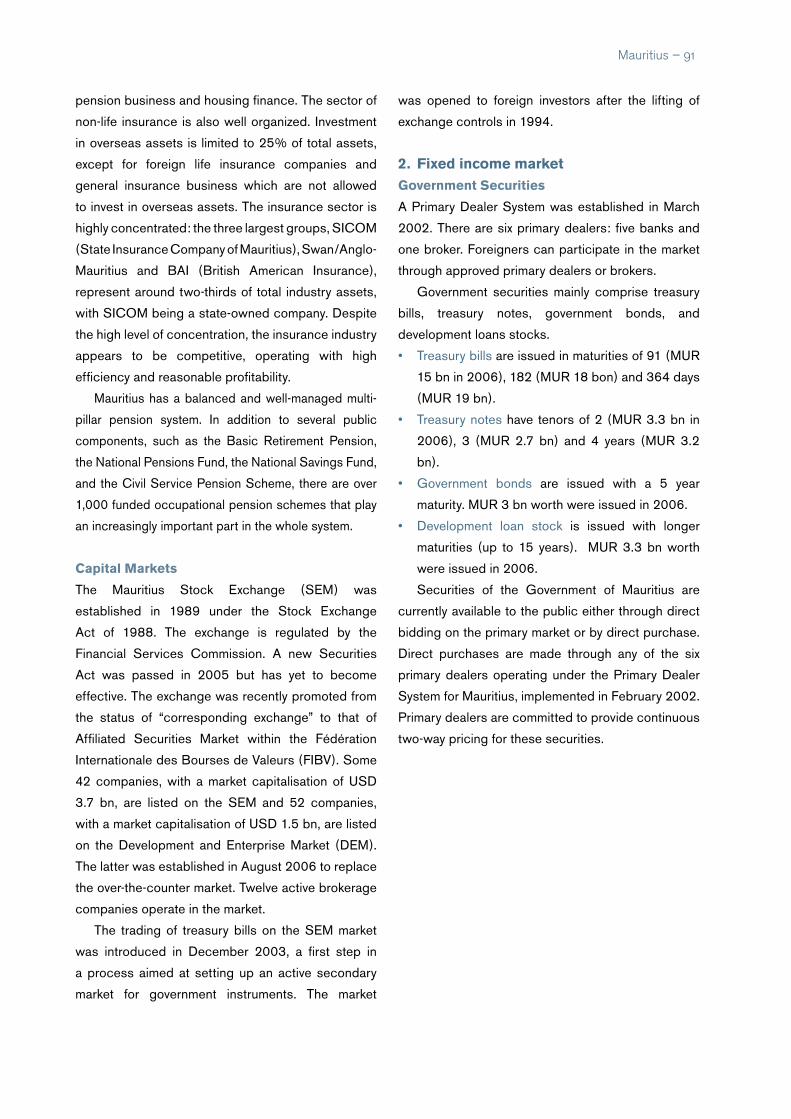
Mauritius – �1
pension business and housing finance. The sector of
non-life insurance is also well organized. Investment
in overseas assets is limited to 25% of total assets,
except for foreign life insurance companies and
general insurance business which are not allowed
to invest in overseas assets. The insurance sector is
highly concentrated: the three largest groups, SICOM
(State Insurance Company of Mauritius), Swan/Anglo-
Mauritius and BAI (British American Insurance),
represent around two-thirds of total industry assets,
with SICOM being a state-owned company. Despite
the high level of concentration, the insurance industry
appears to be competitive, operating with high
efficiency and reasonable profitability.
Mauritius has a balanced and well-managed multi-
pillar pension system. In addition to several public
components, such as the Basic Retirement Pension,
the National Pensions Fund, the National Savings Fund,
and the Civil Service Pension Scheme, there are over
1,000 funded occupational pension schemes that play
an increasingly important part in the whole system.
Capital Markets
The Mauritius Stock Exchange (SEM) was
established in 1989 under the Stock Exchange
Act of 1988. The exchange is regulated by the
Financial Services Commission. A new Securities
Act was passed in 2005 but has yet to become
effective. The exchange was recently promoted from
the status of “corresponding exchange” to that of
Affiliated Securities Market within the Fédération
Internationale des Bourses de Valeurs (FIBV). Some
42 companies, with a market capitalisation of USD
3.7 bn, are listed on the SEM and 52 companies,
with a market capitalisation of USD 1.5 bn, are listed
on the Development and Enterprise Market (DEM).
The latter was established in August 2006 to replace
the over-the-counter market. Twelve active brokerage
companies operate in the market.
The trading of treasury bills on the SEM market
was introduced in December 2003, a first step in
a process aimed at setting up an active secondary
market for government instruments. The market
was opened to foreign investors after the lifting of
exchange controls in 1994.
2. Fixed income marketGovernment securities
A Primary Dealer System was established in March
2002. There are six primary dealers: five banks and
one broker. Foreigners can participate in the market
through approved primary dealers or brokers.
Government securities mainly comprise treasury
bills, treasury notes, government bonds, and
development loans stocks.
• Treasury bills are issued in maturities of 91 (MUR
15 bn in 2006), 182 (MUR 18 bon) and 364 days
(MUR 19 bn).
• Treasury notes have tenors of 2 (MUR 3.3 bn in
2006), 3 (MUR 2.7 bn) and 4 years (MUR 3.2
bn).
• Government bonds are issued with a 5 year
maturity. MUR 3 bn worth were issued in 2006.
• Development loan stock is issued with longer
maturities (up to 15 years). MUR 3.3 bn worth
were issued in 2006.
Securities of the Government of Mauritius are
currently available to the public either through direct
bidding on the primary market or by direct purchase.
Direct purchases are made through any of the six
primary dealers operating under the Primary Dealer
System for Mauritius, implemented in February 2002.
Primary dealers are committed to provide continuous
two-way pricing for these securities.
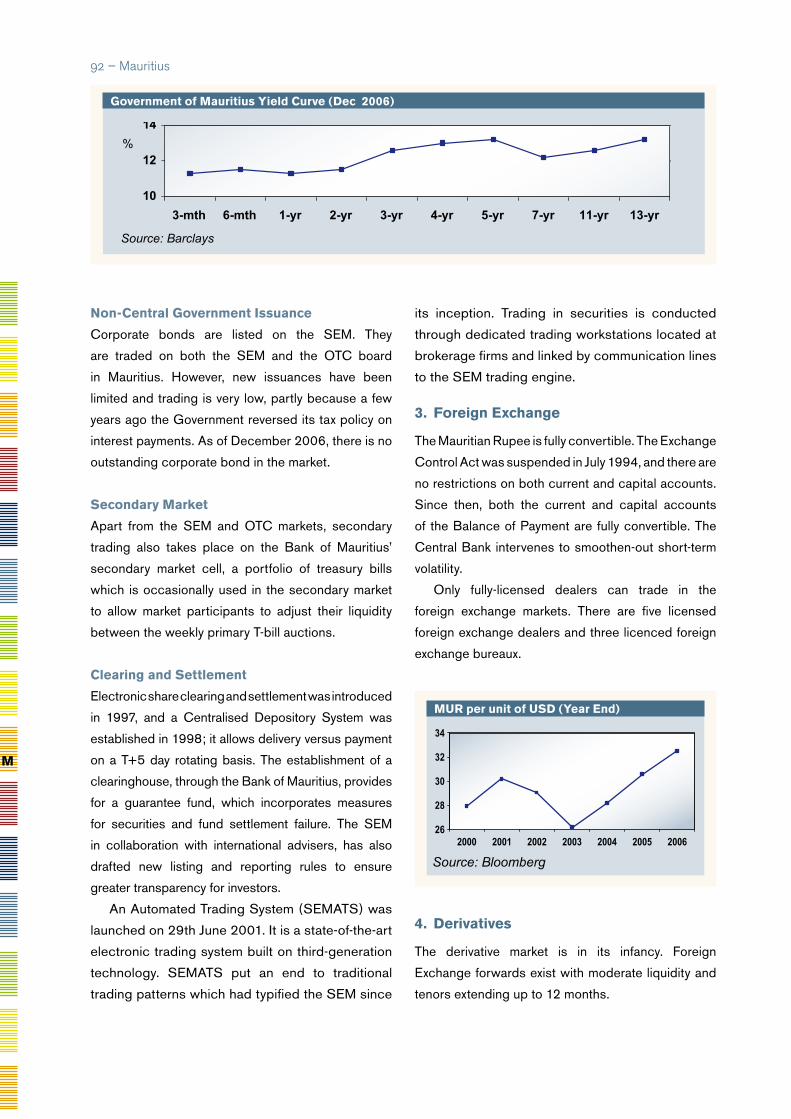
non-Central Government issuance
Corporate bonds are listed on the SEM. They
are traded on both the SEM and the OTC board
in Mauritius. However, new issuances have been
limited and trading is very low, partly because a few
years ago the Government reversed its tax policy on
interest payments. As of December 2006, there is no
outstanding corporate bond in the market.
secondary Market
Apart from the SEM and OTC markets, secondary
trading also takes place on the Bank of Mauritius’
secondary market cell, a portfolio of treasury bills
which is occasionally used in the secondary market
to allow market participants to adjust their liquidity
between the weekly primary T-bill auctions.
Clearing and settlement
Electronic share clearing and settlement was introduced
in 1997, and a Centralised Depository System was
established in 1998; it allows delivery versus payment
on a T+5 day rotating basis. The establishment of a
clearinghouse, through the Bank of Mauritius, provides
for a guarantee fund, which incorporates measures
for securities and fund settlement failure. The SEM
in collaboration with international advisers, has also
drafted new listing and reporting rules to ensure
greater transparency for investors.
An Automated Trading System (SEMATS) was
launched on 29th June 2001. It is a state-of-the-art
electronic trading system built on third-generation
technology. SEMATS put an end to traditional
trading patterns which had typified the SEM since
its inception. Trading in securities is conducted
through dedicated trading workstations located at
brokerage firms and linked by communication lines
to the SEM trading engine.
3. Foreign exchange
The Mauritian Rupee is fully convertible. The Exchange
Control Act was suspended in July 1994, and there are
no restrictions on both current and capital accounts.
Since then, both the current and capital accounts
of the Balance of Payment are fully convertible. The
Central Bank intervenes to smoothen-out short-term
volatility.
Only fully-licensed dealers can trade in the
foreign exchange markets. There are five licensed
foreign exchange dealers and three licenced foreign
exchange bureaux.
4. derivatives
The derivative market is in its infancy. Foreign
Exchange forwards exist with moderate liquidity and
tenors extending up to 12 months.
Mur per unit of usd (year end)
26
28
30
32
34
2000 2001 2002 2003 2004 2005 2006
Source: Bloomberg
�� – Mauritius
Government of Mauritius yield Curve (dec 2006)
10
12
14
3-mth
Source: Barclays
6-mth 1-yr 2-yr 3-yr 4-yr 5-yr 7-yr 11-yr 13-yr
%
M
Mauritius – ��
5. investment taxation
There is no capital gains tax and no withholding tax
on dividends from companies whose shares are listed
on the official stock exchange. A 15% withholding
tax exists for bond market investors. Non-residents
are subject to income tax. However, interest income
can be subject to double taxation agreements. Since
the Exchange Control Act was suspended in 1994,
there are no longer restrictions on the repatriation of
capital, profits or dividends.
6. Key Contacts
• Bank of Mauritius
Sir William Newton Street, Port Louis, Mauritius
Tel: +230-2084164
Fax: +230-2089204
E-mail: [email protected]
Web: http://bom.intnet.mu
• The Financial Services Commission
4th Floor, Harbour Front Building,
President John Kennedy Street,
Port Louis, Mauritius
Tel: +230-2107000
Fax: +230-2087172
Web: www.gov.mu/portal/sites/
ncb/fsc/homeframe.html
• The Stock Exchange of Mauritius
4th Floor, One Cathedral Square Building, 16,
Jules Koenig Street, Port Louis, Mauritius
Tel: +230-2129541
Fax: +230-2088409
E-mail: [email protected]
Web: www.semdex.co
�� – Morocco
Population (mn) 31.94Population Growth (annual %) 1.5Official Language ArabicCurrency Dirham (MAD)GDP (Current US$ bn) 64.91GDP Growth (annual %) 7.3GDP Per Capita (US$) 2,032FDI, net inflows (US$ mn) (2005) 2,933 External Debt (US$ mn) 15,000External Debt/GDP (%) 23.1CPI Inflation (annual %) 3.3Exports of goods and services (% of GDP) 32.7Gross Official Reserves (bn US$) 18.57Gross Official Reserves (In months of imports) 9.4UNDP HDI RaNkING 123Source: AfDB, IMF, UNCTAD, UNDP, UN Population Division
1. overview of Financial system
Morocco has a relatively well-developed financial
system and has been implementing reforms to
liberalize the system. There are 17 commercial banks,
44 financing companies including 5 government-
owned specialized financial institutions, 30 credit
agencies, 17 insurance companies, and 12 leasing
companies. The Moroccan financial system has a stock
exchange, the Casablanca Stock Exchange (CSE),
with a modern infrastructure. It is regulated by the
“Le Conseil Déontologique des Valeurs Mobilières”,
while the Association Professionelle des Societés
de Bourse formulates the rules and procedures for
trading. There are also 2 offshore banks and 11 micro-
finance institutions in Tangier. The Ministry of Finance
approves the licenses of commercial banks after assent
by the Credit Institutions Committee. Bank al-Maghrib,
the central bank, supervises credit institutions, while
the CSE is the stock market watchdog; the insurance
sector is supervised by the Ministry of Finance.
Bank and non-Bank Financial sector
Most commercial banks are partially owned by
European firms. By law, commercial banks and
financial institutions must be at least 51% Moroccan-
owned. The specialized banks are all state-owned
and they control approximately 43% of the banking
sector’s assets. An important non-bank financial
institution is the public CDG-Caisse des Dépôts et
de Gestion (Deposit and Management Fund), which
accounts for over 6% of the financial sector. This
Fund manages the assets of various institutions in the
country, such as the National Social Security Fund
and the National Savings Bank. Given its status as a
Fund rather than a bank, the CDG is not supervised
by any government agency, but is audited by the
National Audit Office.
The insurance market has expanded rapidly since
the late nineties with premiums of about 3% of GDP,
well below the 8% world average. The assets of
the insurance companies represent about 17% of
GDP. As is the case in most developing economies,
the sector is mainly engaged in non-life activities,
although life insurance is growing rapidly with the
development of policy issuance through associations
between banks and insurance.
Morocco
sovereign ratings
Long term
Local Currency
Foreign Currency
s&P BBB BB+
Fitch BBB BB+
M
2006 At a Glance
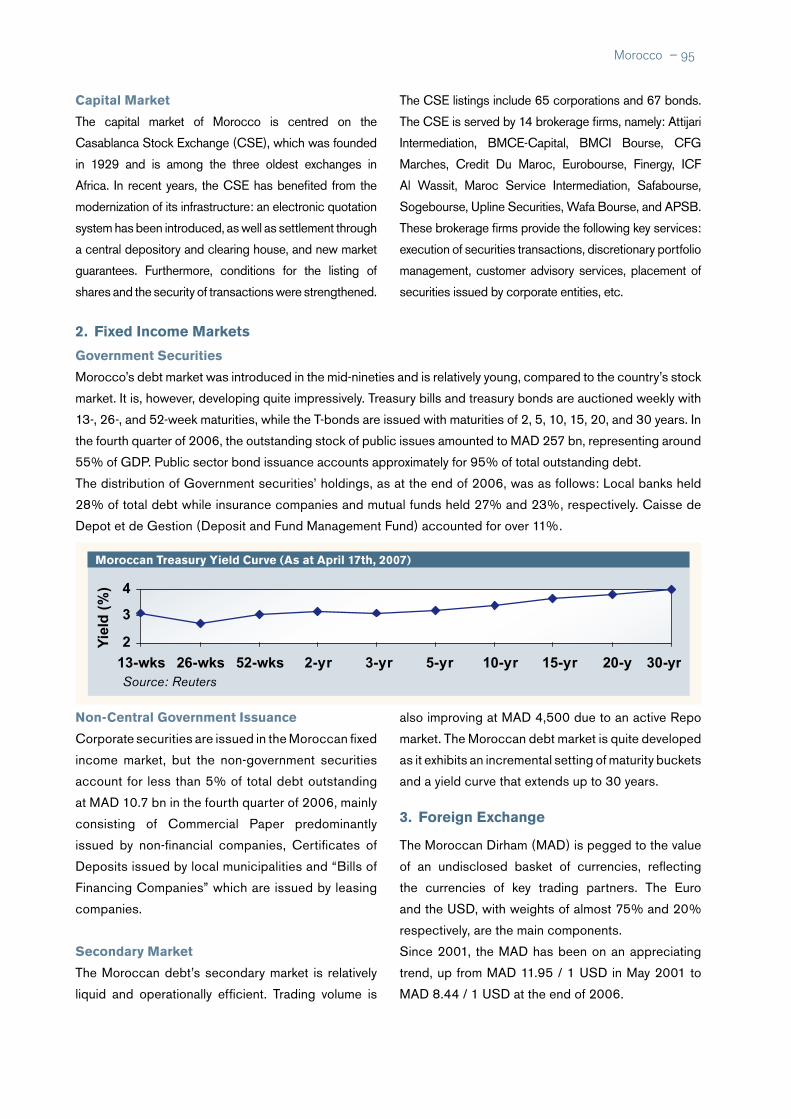
Morocco – ��
Capital Market
The capital market of Morocco is centred on the
Casablanca Stock Exchange (CSE), which was founded
in 1929 and is among the three oldest exchanges in
Africa. In recent years, the CSE has benefited from the
modernization of its infrastructure: an electronic quotation
system has been introduced, as well as settlement through
a central depository and clearing house, and new market
guarantees. Furthermore, conditions for the listing of
shares and the security of transactions were strengthened.
The CSE listings include 65 corporations and 67 bonds.
The CSE is served by 14 brokerage firms, namely: Attijari
Intermediation, BMCE-Capital, BMCI Bourse, CFG
Marches, Credit Du Maroc, Eurobourse, Finergy, ICF
Al Wassit, Maroc Service Intermediation, Safabourse,
Sogebourse, Upline Securities, Wafa Bourse, and APSB.
These brokerage firms provide the following key services:
execution of securities transactions, discretionary portfolio
management, customer advisory services, placement of
securities issued by corporate entities, etc.
2. Fixed income Markets
Government securities
Morocco’s debt market was introduced in the mid-nineties and is relatively young, compared to the country’s stock
market. It is, however, developing quite impressively. Treasury bills and treasury bonds are auctioned weekly with
13-, 26-, and 52-week maturities, while the T-bonds are issued with maturities of 2, 5, 10, 15, 20, and 30 years. In
the fourth quarter of 2006, the outstanding stock of public issues amounted to MAD 257 bn, representing around
55% of GDP. Public sector bond issuance accounts approximately for 95% of total outstanding debt.
The distribution of Government securities’ holdings, as at the end of 2006, was as follows: Local banks held
28% of total debt while insurance companies and mutual funds held 27% and 23%, respectively. Caisse de
Depot et de Gestion (Deposit and Fund Management Fund) accounted for over 11%.
Moroccan treasury yield Curve (As at April 17th, 2007)
2
3
4
13-wks 26-wks 52-wks 2-yr 3-yr 5-yr 10-yr 15-yr 20-y 30-yr
Yie
ld (
%)
Source: Reuters
non-Central Government issuance
Corporate securities are issued in the Moroccan fixed
income market, but the non-government securities
account for less than 5% of total debt outstanding
at MAD 10.7 bn in the fourth quarter of 2006, mainly
consisting of Commercial Paper predominantly
issued by non-financial companies, Certificates of
Deposits issued by local municipalities and “Bills of
Financing Companies” which are issued by leasing
companies.
secondary Market
The Moroccan debt’s secondary market is relatively
liquid and operationally efficient. Trading volume is
also improving at MAD 4,500 due to an active Repo
market. The Moroccan debt market is quite developed
as it exhibits an incremental setting of maturity buckets
and a yield curve that extends up to 30 years.
3. Foreign exchange
The Moroccan Dirham (MAD) is pegged to the value
of an undisclosed basket of currencies, reflecting
the currencies of key trading partners. The Euro
and the USD, with weights of almost 75% and 20%
respectively, are the main components.
Since 2001, the MAD has been on an appreciating
trend, up from MAD 11.95 / 1 USD in May 2001 to
MAD 8.44 / 1 USD at the end of 2006.
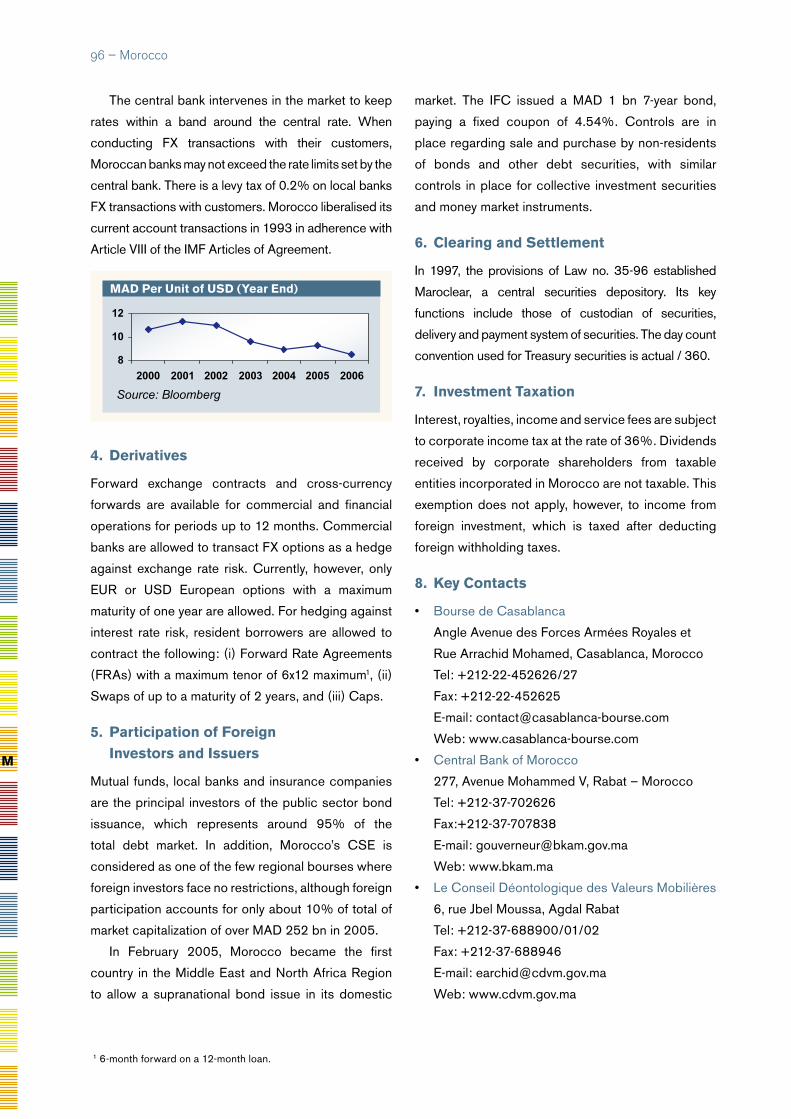
�� – Morocco
The central bank intervenes in the market to keep
rates within a band around the central rate. When
conducting FX transactions with their customers,
Moroccan banks may not exceed the rate limits set by the
central bank. There is a levy tax of 0.2% on local banks
FX transactions with customers. Morocco liberalised its
current account transactions in 1993 in adherence with
Article VIII of the IMF Articles of Agreement.
4. derivatives
Forward exchange contracts and cross-currency
forwards are available for commercial and financial
operations for periods up to 12 months. Commercial
banks are allowed to transact FX options as a hedge
against exchange rate risk. Currently, however, only
EUR or USD European options with a maximum
maturity of one year are allowed. For hedging against
interest rate risk, resident borrowers are allowed to
contract the following: (i) Forward Rate Agreements
(FRAs) with a maximum tenor of 6x12 maximum1, (ii)
Swaps of up to a maturity of 2 years, and (iii) Caps.
5. Participation of Foreign investors and issuers
Mutual funds, local banks and insurance companies
are the principal investors of the public sector bond
issuance, which represents around 95% of the
total debt market. In addition, Morocco’s CSE is
considered as one of the few regional bourses where
foreign investors face no restrictions, although foreign
participation accounts for only about 10% of total of
market capitalization of over MAD 252 bn in 2005.
In February 2005, Morocco became the first
country in the Middle East and North Africa Region
to allow a supranational bond issue in its domestic
1 6-month forward on a 12-month loan.
market. The IFC issued a MAD 1 bn 7-year bond,
paying a fixed coupon of 4.54%. Controls are in
place regarding sale and purchase by non-residents
of bonds and other debt securities, with similar
controls in place for collective investment securities
and money market instruments.
6. Clearing and settlement
In 1997, the provisions of Law no. 35-96 established
Maroclear, a central securities depository. Its key
functions include those of custodian of securities,
delivery and payment system of securities. The day count
convention used for Treasury securities is actual / 360.
7. investment taxation
Interest, royalties, income and service fees are subject
to corporate income tax at the rate of 36%. Dividends
received by corporate shareholders from taxable
entities incorporated in Morocco are not taxable. This
exemption does not apply, however, to income from
foreign investment, which is taxed after deducting
foreign withholding taxes.
8. Key Contacts
• Bourse de Casablanca
Angle Avenue des Forces Armées Royales et
Rue Arrachid Mohamed, Casablanca, Morocco
Tel: +212-22-452626/27
Fax: +212-22-452625
E-mail: [email protected]
Web: www.casablanca-bourse.com
• Central Bank of Morocco
277, Avenue Mohammed V, Rabat – Morocco
Tel: +212-37-702626
Fax:+212-37-707838
E-mail: [email protected]
Web: www.bkam.ma
• Le Conseil Déontologique des Valeurs Mobilières
6, rue Jbel Moussa, Agdal Rabat
Tel: +212-37-688900/01/02
Fax: +212-37-688946
E-mail: [email protected]
Web: www.cdvm.gov.ma
MAd Per unit of usd (year end)
8
10
12
2000 2001 2002 2003 2004 2005 2006
Source: Bloomberg
M
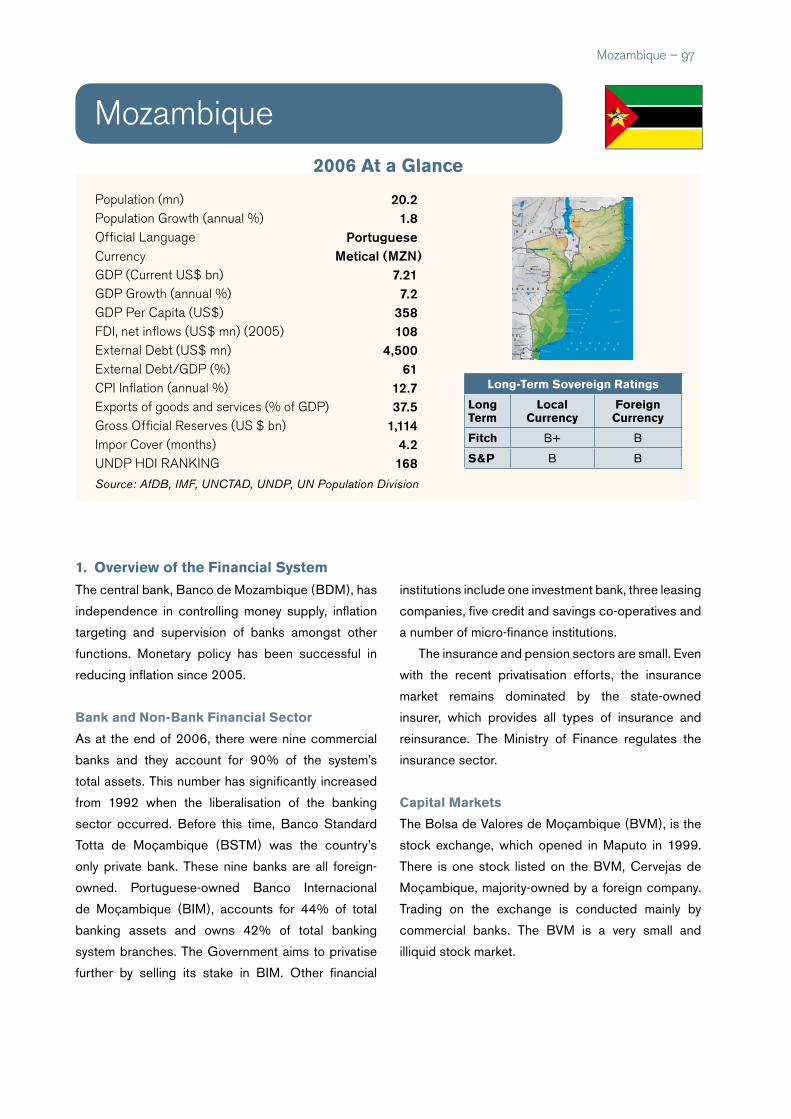
Mozambique – ��
Population (mn) 20.2Population Growth (annual %) 1.8Official Language PortugueseCurrency Metical (MZN)GDP (Current US$ bn) 7.21GDP Growth (annual %) 7.2GDP Per Capita (US$) 358FDI, net inflows (US$ mn) (2005) 108 External Debt (US$ mn) 4,500External Debt/GDP (%) 61CPI Inflation (annual %) 12.7Exports of goods and services (% of GDP) 37.5Gross Official Reserves (US $ bn) 1,114Impor Cover (months) 4.2UNDP HDI RaNkING 168Source: AfDB, IMF, UNCTAD, UNDP, UN Population Division
Mozambique
1. overview of the Financial system
The central bank, Banco de Mozambique (BDM), has
independence in controlling money supply, inflation
targeting and supervision of banks amongst other
functions. Monetary policy has been successful in
reducing inflation since 2005.
Bank and non-Bank Financial sector
As at the end of 2006, there were nine commercial
banks and they account for 90% of the system’s
total assets. This number has significantly increased
from 1992 when the liberalisation of the banking
sector occurred. Before this time, Banco Standard
Totta de Moçambique (BSTM) was the country’s
only private bank. These nine banks are all foreign-
owned. Portuguese-owned Banco Internacional
de Moçambique (BIM), accounts for 44% of total
banking assets and owns 42% of total banking
system branches. The Government aims to privatise
further by selling its stake in BIM. Other financial
institutions include one investment bank, three leasing
companies, five credit and savings co-operatives and
a number of micro-finance institutions.
The insurance and pension sectors are small. Even
with the recent privatisation efforts, the insurance
market remains dominated by the state-owned
insurer, which provides all types of insurance and
reinsurance. The Ministry of Finance regulates the
insurance sector.
Capital Markets
The Bolsa de Valores de Moçambique (BVM), is the
stock exchange, which opened in Maputo in 1999.
There is one stock listed on the BVM, Cervejas de
Moçambique, majority-owned by a foreign company.
Trading on the exchange is conducted mainly by
commercial banks. The BVM is a very small and
illiquid stock market.
GEOATLAS - Copyright1998 Graphi-Ogre0 km 100 200 300 400 km
O C E A N �
I N D I E N
CA
NA
LD
U
MO
ZA
MB
IQ
UE
Ile de Bazaruto
Ponta da Barra
Pointe St-Sébastien
Bassas da India�France
Ile Europa�FrancePonta da Barra Falsa
Baie�de Inhambane
Baie �de Sofala
Baía de �Fernão Veloso
Cap Delgado
Ile Metundo
Ile Mafia
Ile Vamizi
Ile Rongui
Baie de�Lourenço Marques
Nacala
Pietersburg
Nelspruit
Lubumbashi
Kabwe
Kasama
Mansa
Chipata
Ndola
Marondera
MazoweChinhoyi
MutareGweru
MasvingoBulawayo
Gwanda
Inhambane
Xai-Xai
Chimoio
Beira
Quelimane
Tete
Nampula
PembaLichinga
Sumbawanga
Mbeya
Lindi
Mtwara
Songea
Blantyre
Mzuzu
Mbabane
Lusaka
Harare
Maputo
Lilongwe
Kilo
mbe
ro
Luw egu
Mbara
ngandu
M bw em
kuru
Ruvu m
a
Rovu m a
Messinge
Luge
nda M e
ssa l
o
Lúrio
Lúrio
LigonhaLicungo
C uácua
Chire
Shire
Hunyani
Z ambèze
Gwai
Umniat
i
Save
Sabi
Lundi
Mtilik
we
Changa
ne
Lim
popo
Lim popo
Limpopo
Mokolo
Mogalakw
ena
O lifants
G root-Letaba
Krokodil
Kom ati Incom
áti
V aal
Shash e Nuanetsi
Luangw
a
Lunsem fw a
Luan
gwa
K afue
Luapula
Luapula
Ch
ambeshi
Chambeshi
Lufub
u
Pongolo
Z
am bèze
G reat Ruaha
Little
Ruaha
Lac �Tshangalele
Lac�Mweru
Lac�Bangweulu
Lac�Rukwa
Lac Nyasa�-Lac Malawi-
Lac�Chilwa
Lac�Malombe
Lac�Chiuta
Lac Kariba
Lac de Cahora Bassa
Witkoppies�2336 m
2275 m
Emlembe�1862 m
Monte Binga�2436 m
Inyangani�2592 m
Nyangui�2230 m
Serra�Gorongosa�1856 m
2207 m
1660 m
Sapitwa�3002 m
Serra�Namúli�2419 m
Serra Jéci�1836 m
798 m
D
R
A
KE
NS
BE
R
G
MO
NT
SL
EB
OM
BO
PLANALTO�DO MAVIA
Mt MULANJE
ESC A R P EM E N T D U Z A M B EZ E
M tsM A V U RA DON A
Mts
IN
YAN
GA
COLLINES�
MATOPOS
MONTS
MU
CHIN
GA
ESCA RP
EMEN
T DES
MUCHINGA
KIPENGERE RANGE
Mts. MULUM
BE
A F R I Q U E �D U S U D
BOTSWANA
Z I M B A B W E
M A L A W IZ A M B I E
SWAZILAND
T A N Z A N I EREPUBLIQUE�
DEMOCRATIQUE�
DU CONGO
MOZAMBIQUE
Long-term sovereign ratings
Longterm
Local Currency
Foreign Currency
Fitch B+ B
s&P B B
2006 At a Glance

�� – Mozambique
Bond descriptionstock
Admitted toquotation
volumeAmount
(MZM billion)
Tesouro-2001/I – 1ª Série 2.338.000 176.720 17,672
Tesouro-2002 – 2ª Série 1.000.000 2.925 0,293
Tesouro-2004 2.500.000 50 0,005
Tesouro-2005 – 1ª Série 4.960.000 1.049.175 104,918
Tesouro-2005 – 2ª Série 300.000 - -
Tesouro-2005 – 3ª Série 16.673.180 108.430 10.843
BIM 2003 650.000 - -
BIM 2003 Subordinadas 850.000 - -
TDM 2004 1.250.000 750 0,064
Cimentos de Moçambique/2004 1.983.333 222.850 17,828
MCEL 2005 3.360.000 10.000 1,000
2. Fixed income MarketsGovernment securities
Government bonds have been in existence
since 1999. In the first phase, the bonds will be
reimbursed in three years at varied interest rates
and also adjusted to the re-discount rate of the
central bank. Longer-term and floating-rate bonds
are also available, with coupons linked to prevailing
rates for treasury bills.
Treasury bills have maturities of 91-, 182- and 364-
days, as displayed in the graph below.
The following government and corporate bonds are
listed on the exchange.
MZM Per unit of usd ( until July 2006 )
20,000
22,000
24,000
26,000
28,000
2001 2002 2003 2004 2005 2006
Source: Bloomberg
3. Foreign exchange
The Mozambican Metical (MZM) is an independent,
freely floating currency. Access to foreign exchange
is greatly liberalized by the passage in 1996 of a
new Exchange Control Regulation Law. Foreign
exchange retention accounts are permitted for
100% of foreign exchange earnings, without formal
justification. Investment registration and repatriation
application procedures must be adhered to in order
to repay foreign loans and repatriate invested capital,
profits, and dividends in excess of USD 5,000. Debt
servicing requires an approval letter from the central
bank at the time of the loan.
The Mozambican Metical was redenominated in July
2006, taking three zeros off the existing currency
value versus the U.S. dollar. The Mozambican “New
Metical” (MZN) is MZM/1,000.
The MZM has been on a depreciating trend since
December 2004, reaching MZM 26,170/1 USD at
the end of December 2006. As at the end of the
first quarter of 2007, the currency stood at MZN
26.479 /1 USD.
4. investment taxation
The following taxes are applicable to investment
income: corporate capital gains tax rate of 32%,
withholding tax dividends of 20%, withholding tax
interest of 20%, and personal capital gains tax of
32%.
M
Mozambique – ��
5. Key contacts
• Banco de Moçambique
Av. 25 de Setembro 1695, P.O. Box
423, Maputo, Mozambique
Tel: +258-1-318000/9
Fax: +258-1-323712
E-mail: [email protected]
Web: www.bancomoc.mz
• Bolsa de Valores de Moçambique
Avenida 25 de Setembro No. 1230,
5th Floor, Maputo, Mozambique
E-mail: [email protected], [email protected]
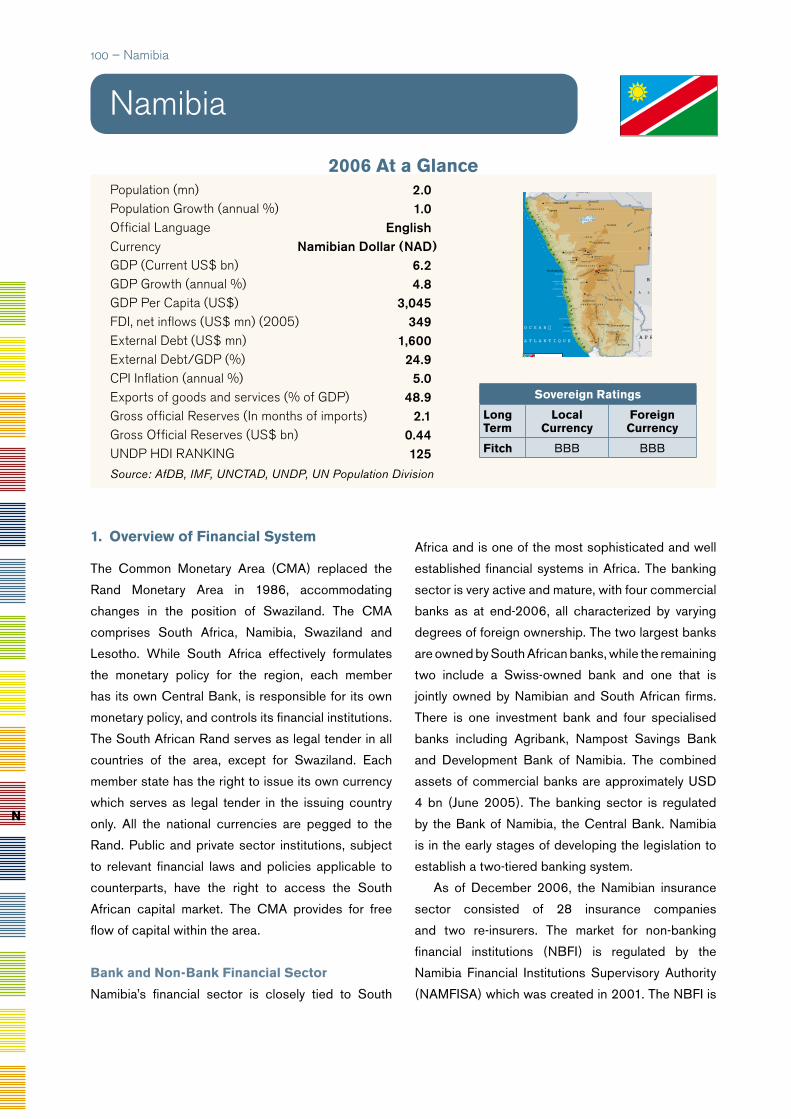
100 – Namibia
n
Population (mn) 2.0Population Growth (annual %) 1.0Official Language EnglishCurrency Namibian Dollar (NAD)GDP (Current US$ bn) 6.2GDP Growth (annual %) 4.8GDP Per Capita (US$) 3,045FDI, net inflows (US$ mn) (2005) 349 External Debt (US$ mn) 1,600External Debt/GDP (%) 24.9CPI Inflation (annual %) 5.0Exports of goods and services (% of GDP) 48.9Gross official Reserves (In months of imports) 2.1Gross Official Reserves (US$ bn) 0.44UNDP HDI RaNkING 125Source: AfDB, IMF, UNCTAD, UNDP, UN Population Division
Namibia
sovereign ratings
Longterm
Local Currency
Foreign Currency
Fitch BBB BBB
GEOATLAS - Copyright1998 Graphi-Ogre0 km 100 200 300 400 km
O C E A N �
A T L A N T I Q U E
Ponta da�Marca
Cap Fria
Ilhea Point
Diaz Point
Baía�dos Tigres
Walvis Bay
Sandwich Bay
Conception Bay
Meobbaai
Hottentotbaai
Elizabeth Bay
SK
EL
ET
O
N
CO
AS
T
Mmabatho
Kimberley
Mongu
Livingston
Ondjiva��
Rundu��
Enana��
Oshakati
Ombalantu
Tsumeb
Otjiwarongo
Gobabis
Opuwa
Katima Mulilo��
Swakopmund
Mariental
Keetmanshoop
Molepolole
Kasane
Maun
Ghanzi
Mochudi
Kanye
Tshabong
Gaborone
Windhoek
Karibib
Outjo
Omaruru
Walvis Bay��
Rehoboth
Maltahöhe
Karasburg
BethanienLüderitz
Z
am bèze
Kw
ando
Kwando
Cuando
Cuito
O kavango
Cubang
o
C ubango
Marico
V
aa
l
Hartbees
O range
Fish Kainab M
olopo
M olopo
M olop
oA uob
Auob
Olifants
N osop
Nossob
Nossob
Black N ossob
Kune ne
Cunene
Coroca
Harts
Riet M odder
Makgadikgadi
Etosha Pan
1700 m
Brandberg�2574 m
Kranzberg�2305 m
Etjo�2085 m Omatako�
2286 m
Ombutosu�1916 m
1966 m
2479 m
1988 m
1014 m
1654 m
Schoffenstein�2202 m
1070 m
1375 m
2393 m
KAAP
PLA
TO
LANGEBERGE
B OPH
U TH A
TSW
A NA
DEPRESSION�
DE MABABEDELTA DE�
L'OKAVANGO
COLLINES AHA
D E S E R T �
D U �
K A L A H A R I
COLLINES�TSODILO
GROOT�
KARASBERGE
HUNSBERGE
DE
SER
TD
UN
AM
IB
HUIB-HO
CHPLA
TEAU
SCHWARZRAND
D A M A R A L A N D
O V A M B O L A N D
K A UK A U
V EL D
KHOM AS
HOCH
LAN D
KAOKO VELD
N A M A Q U A L A N D
DE
SE
RT
DU
NA
MI
B
ERONGO
SERRADACHELA
PLAINES�SILOWANA
NAMIBIE
A N G O L A
B O T S W A N A
ZIMBABWE
Z A M B I E
A F R I Q U E D U S U D
1. overview of Financial system
The Common Monetary Area (CMA) replaced the
Rand Monetary Area in 1986, accommodating
changes in the position of Swaziland. The CMA
comprises South Africa, Namibia, Swaziland and
Lesotho. While South Africa effectively formulates
the monetary policy for the region, each member
has its own Central Bank, is responsible for its own
monetary policy, and controls its financial institutions.
The South African Rand serves as legal tender in all
countries of the area, except for Swaziland. Each
member state has the right to issue its own currency
which serves as legal tender in the issuing country
only. All the national currencies are pegged to the
Rand. Public and private sector institutions, subject
to relevant financial laws and policies applicable to
counterparts, have the right to access the South
African capital market. The CMA provides for free
flow of capital within the area.
Bank and non-Bank Financial sector
Namibia’s financial sector is closely tied to South
Africa and is one of the most sophisticated and well
established financial systems in Africa. The banking
sector is very active and mature, with four commercial
banks as at end-2006, all characterized by varying
degrees of foreign ownership. The two largest banks
are owned by South African banks, while the remaining
two include a Swiss-owned bank and one that is
jointly owned by Namibian and South African firms.
There is one investment bank and four specialised
banks including Agribank, Nampost Savings Bank
and Development Bank of Namibia. The combined
assets of commercial banks are approximately USD
4 bn (June 2005). The banking sector is regulated
by the Bank of Namibia, the Central Bank. Namibia
is in the early stages of developing the legislation to
establish a two-tiered banking system.
As of December 2006, the Namibian insurance
sector consisted of 28 insurance companies
and two re-insurers. The market for non-banking
financial institutions (NBFI) is regulated by the
Namibia Financial Institutions Supervisory Authority
(NAMFISA) which was created in 2001. The NBFI is
2006 At a Glance

Namibia – 101
made up of some 500 pension funds, a number of asset
management and unit trust management companies,
several specialised lending institutions, and a large
number of micro-lending institutions. Most of these
institutions are private, with strong ownership links to
South Africa.
Capital Markets
The Namibian capital market is also closely linked to
South Africa. The Namibian Stock Exchange (NSX),
which opened in 1992, has 28 listed companies,
across various sectors including financial, mining,
industrial retail and fishing. The majority are South
African companies that are cross-listed on the
Johannesburg Stock Exchange. The NSX is regulated
by the Stock Exchange Association and the Executive
Committee of the NSX. This is the custodian of the
licence to operate the stock exchange. It is made up
of 43 associate members (banks, listed companies,
investment institutions, etc) and each year the
members elect an Executive Committee of nine
members plus one outsider, to oversee the activities
of the exchange. The NSX is regulated by the Stock
Exchanges Act of 1985 (amended in 1992) and
overseen by the Registrar of Financial Institutions.
2 Fixed income MarketsGovernment securities
The Bank of Namibia issues treasury bills and Internally Registered Stock (IRS) by open tender. Unlike treasury
bills, IRS are capital market instruments issued for maturities exceeding 12 months. The Republic of Namibia
has also issued government bonds maturing in 2007, 2010, 2015 and 2024. Government papers take up a
large proportion, some 85%, in the long-term securities market in Namibia. This has come about as a result of
a long-standing government policy to fund its deficit in the local market as a way of facilitating the development
of the local financial markets. The first Namibian bonds were issued in 1992 with maturities not exceeding six
years.
By 1998, 13 IRS with various maturities had been issued, but the secondary market remained limited.
The Government decided in 1998 to consolidate the bonds in issue into three categories (GC02, GC05 and
GC10 maturing in 2002, 2005 and 2010 respectively) in order to lengthen their maturity structure, enhance
their liquidity and create local benchmark instruments. The amount outstanding in government IRS has been
increasing steadily since the first stock was issued in 1992. IRS increased from NAD 50 mn in 1992 to NAD
4.1 bn in June 2004.
namibian Government Bond yield Curve (March 2007)
8.48.68.8
99.29.4
3 months
As of March 2007
1 year 3 years 5 years 8 years 17 years
Yie
ld (
%)

10� – Namibia
n
non-Central Government issuance
Government policy to provide guarantees on papers issued by state-owned entities has had some success,
albeit not massive, and at least three quasi-state entities/parastatals have issued notes in the local market. The
amount issued in non-government bonds has been growing steadily from 1996, with a sharp increase recorded
in 2003 at NAD 700 mn from approximately NAD 140 mn the previous year. Another increase was recorded
in 2004 to reach a level of about NAD 750 mn. The non-government paper issues are by far dominated by the
Road Fund Administrator which accounts for more than 50% of the entire issue in this category.
Bonds in the non-government markets are issued through intermediaries such as stockbrokers and/or
issued directly by the parastatals, banks or companies themselves. Settlement and custodian arrangements are
agreed upon by parties and are mostly made through settlement agents as appointed by contracting parties.
The private sector has also issued some bonds in the market. The first corporate bond to be listed on the
Exchange was by Standard Bank Namibia in 2000. The bond was worth NAD 150 mn and is due to mature on
20 November 2011.
secondary Market
IRS are listed on the NSX where secondary market
trading can take place. Interested participants can
buy and/or sell bonds on the NSX through qualified
and registered stockbrokers. Trading in government
stock can also take place over-the-counter (OTC),
that is, legal trading outside the formal market such
as the NSX. Secondary trading activities on the NSX
have been increasing in recent years, and currently
represent some 10% of bonds outstanding.
Clearing and settlement
Treasury bills are issued in a Book Entry System in
which detailed records of ownership are electronically
registered. Settlements by commercial banks are done
through the CRISP system (an electronic payment
system) or clearance vouchers. For institutions and
individuals, settlement can be made in the form of
clearance vouchers or bank cheques.
3. Foreign exchange
Namibia is part of the CMA with South Africa, Swaziland
and Lesotho. The Namibian Dollar (NAD) is pegged at
issuer issue date Maturity Coupon Coupon dates
Road Fund Administration Feb 2003 Nov 2010 15% 15 Jan & 15 Jul
Standard Bank Namibia Nov 2000 Nov 2011 12% 21 May & 21 Nov
Bank Windhoek Feb 2004 Feb 2014 11% 4 Feb & 4 Aug
Source: IJG, NSX & Issuers
par with the South African Rand. The South African
Rand is legal tender in the country. Namibia follows the
exchange rate policy determined by the South African
Reserve Bank. Within the CMA, all member countries
apply the same exchange control regulations. Non-
resident capital flows are generally unrestricted. Capital,
profits and dividends can be repatriated. Exchange
control limitations apply to resident capital flows.
Foreign exchange earnings by Namibian enterprises
have to be brought into the CMA within six months.
The Namibian dollar is convertible regionally only
into the South African Rand, while it is not convertible
internationally. There are virtually no restrictions on
the current account, neither are there any restrictions
on capital from non-residents for equity investments.
Private individuals are allowed to invest up to
NAD 750,000 outside the CMA. Transfer by local
companies outside the CMA for bona fide long-term
investments in specific projects, or for expansion of
existing projects owned and/or controlled by Namibian
residents, are considered on their own merits.
Historically, the NAD has been on a depreciating
trend, but saw some appreciation between December

2001 and the first quarter of 2005, from NAD 12.27 /
1 USD to NAD 5.65 – 6 / 1 USD respectively. It has
since weakened slightly and has been trading around
NAD 7 per USD since December 2006.
4. Participation of Foreign investors and issuers
Non resident capital flows are generally unrestricted.
5. Key Contacts• Bank of Namibia,
Mailing Address: P.O. Box 2882,
Windhoek, Namibia
Other Address: 71 Robert Mugabe
Ave, Windhoek, Namibia
Tel: +264-61-2835111
Fax: +264-61-2835151
Web: www.bon.com.na
• Namibia Stock Exchange,
Mailing Address: P.O.Box 2401,
Windhoek, Namibia
Other Address: Shop 8, Kaiserkrone Centre,
Post Street Mall, Windhoek, Namibia
Tel: +264-61-227647
Fax: +264-61-248531
E-mail: [email protected]
Web: www.nsx.com.na
• Namibia Financial Systems Supervisory Authority,
Mailing Address: P.O. Box 21250,
Windhoek, Namibia
Other Address: 154 Independence Avenue,
Sanlam, Centre, 8th Floor, Windhoek, Namibia
Tel: +264-61-2905000
Fax: +264-61-258957/256303
E-mail: [email protected]
Web: www.namfisa.com.na
Namibia – 10�
nAd Per unit of usd (year end)
6
7
8
9
10
11
2001 2002 2003 2004 2005 2006
Source: Bloomberg

GEOATLAS - Copyright1998 Graphi-Ogre0 km 100 200 300 400 km
Niamey
N'Djamena
Tamenghest
Maroua
Bogandé
Dori
DiapagaFada�Ngourma
DapangoBolgatanga
Dutse DamaturuMaiduguri
Bauchi
Kano
Katsina
Birnin Kebbi
Kaduna
Sokoto
JosNatitingou
Diffa
Zinder
Maradi
Agadez
Tahoua
Dosso
Tillaberi
Gao
Kidal
Bol Ati
Mao
Mongo
Bongor
Bosso��
Tessaoua��
Téra��
Arlit��
Lac�Kainji
Lac�Tchad
Ngadda
Yedseram
Oti
Mékrou
Alibori
Ka
duna
M ariga
Sokoto
Sokoto
G agere
Rima
Maradi
G on g
ola
Logone
Chari
BahrErguig
Batha
Ko
m
adugu Yob
e
Kom
adugu G
ana
Bunga
Jam
aare
Hadejia
N ig
er
Nige
r
Volta
Blanche
Djebel Telertheba�2420 m
Djebel Serkout�2252 m
Tahat�2908 m
Taourirt�2050 m
Bagzane�2022 m
Gréboun�1944 m
Emi Koussi�3415 m
Tarso Ahon�3225 m
Pic Tousside�3315 m
Tarso Ouri�3150 m
MtsMANDARA
CHAINEDEL'ATACORA
T A M E SN A
A D R A R �
D E S �
I F Ô G H A S
VALLEE
DU
TILEM
SI
T I M É T R I N E
'ERG A Z
ENN EZ A
L
TA N EZ ROU FTN -A HN ET
TASS
ILITA -
N -AHA G G A R
ERG�D'ADMER
H O GG
A
B OD
ÉL
É
ER GD U D JO
U R AB
B
OR
KO
U
T I B E S T I
PLATEA U
DU M A N G U ÉN I
PLATEAU�DU TCHIGAÏ
PLATEAU�DU DJADO
TÉNÉRÉ�DU TAFASSÂSSET
TÉ
N
É
R
É
E RG
DU
T ÉNÉ R
É
GRA
ND
ER
GD
EB I L
MA
MONTS�TAMGAK
T A L A K
M A S S I F �
D E L ' A Ï R
A D ER
T É G A M A
DAM
ER
GO U
MASSIF�DE TERMIT
MA
NG
A
S A H A R A
S O U D A N
SA
HE L
NIGER
N I G E R I AB E N I NGHANA
TOGO
M A L I
T C H A D
A L G E R I E
L I B Y E
BURKINA FASO
Population (mn) 14.4Population Growth (annual %) 3.3Official Language FrenchCurrency CFA Franc (XOF)GDP (Current US$ bn) 3.4GDP Growth (annual %) 3.2GDP Per Capita (US$) 236FDI, net inflows (US$ mn) (2005) 12External Debt (US$ mn) 1,759External Debt/GDP (%) 51.7CPI Inflation (annual %) 0.8Exports of goods and services (% of GDP) 20.1Gross Official Reserves (US $ bn) 0.29Gross Official Reserves (in months of imports) 4.3UNDP HDI RaNkING 177Source: AfDB, IMF, UNCTAD, UNDP, UN Population Division
1. overview of Financial system
Niger is a member of the West African Economic
and Monetary Union (UEMOA) established in
January 1994, and comprising eight West African
countries (Benin, Burkina Faso, Côte d’Ivoire, Mali,
Niger, Senegal, Togo, and Guinea Bissau) which are
members of the Franc Zone and use the CFA Franc
(XOF) issued by the Central Bank (BCEAO). The
UEMOA financial markets are administered through
the following institutions:
• The Conference of Heads of State, which decides
on the accession of new members.
• The Council of Ministers, which defines, among
others, the monetary and credit policy of the Union
to safeguard the value of the CFA franc.
• The UEMOA Commission, delegated by the
Council of Ministers, is in charge of the day-to-day
administration of the Union.
• The Central Bank of West African States (BCEAO)
is the central bank and controls the Banking
Commission (Commission Bancaire) responsible
for overseeing and supervising banks and financial
institutions. The BCEAO also controls the
Savings and Financial Markets Regional Council
(CREPMF). The capital of BCEAO, currently
called up in the amount of XOF 134 bn, is entirely
subscribed by the member States and shared
equally among them.
• Micro-finance institutions are governed by a
separate law, the PARMEC (Projet d’Appui à
la Réglementation des Mutuelles d’Epargne et
de Crédit) Law, which regulates micro-finance
activities in all WAEMU countries.
Niger is also a signatory to the OHADA Treaty,
which harmonizes business law in 16 countries in Sub-
Sahara Africa, including all the UEMOA countries.
The main objective of the monetary policy as
defined by the UEMOA and implemented by the
BCEAO, is to ensure price stability and safeguard the
domestic and foreign value of the CAF Franc through
appropriate coverage of currency issue by foreign
exchange reserves.
Niger
n
10� – Niger
2006 At a Glance

Bank and non-Bank Financial sector
As of December 2006, there were 93 banks and 22
financial institutions operating in the UEMOA zone,
with 10 banks and two financial institutions located
in Niger. The total balance sheets of the financial
system in Niger amounted to XOF 235 bn at the end
of 2005 with banks accounting for more than 99%,
representing 15% of the GDP. The resources of banks
and financial institutions amount to XOF 213 bn,
including XOF 25 bn as net equity capital. Branches
and subsidiaries of foreign or regional banks play a
relatively important role in financial intermediation in
UEMOA.
The insurance sector in Niger is regulated
and supervised by the Inter-African Conference
of Insurance Markets (CIMA) established on 10
July 1992 in Yaounde (Cameroon). It includes the
following countries: Benin, Burkina Faso, Cameroon,
Central African Republic, the Comoros, Côte d’Ivoire,
Gabon, Equatorial Guinea, Guinea Bissau, Mali,
Niger, Senegal, Chad and Togo. The CIMA Treaty
came into effect on 15 February 1995. The regulatory
body of the CIMA is the Regional Commission of
Insurance Control (CRCA), whereas the Council of
Ministers is its highest body. The total portfolio of the
UEMOA CIMA zone is dominated by the sector of
non-life insurance. Compared to GDP of 2005, the
turnover of the insurance sector in Niger represents
0.7%, well below the average ratio in Africa of 4.8%.
At the end of 2005, five companies were operating
in the country with a total turnover of XOF 11 bn; life
insurance products represented 10% and vehicle
insurance 45% of the turnover.
Niger’s financial system includes a growing micro-
finance industry comprised of over 160 institutions.
Capital Markets
The Regional Stock Exchange (BRVM), the stock
market for the UEMOA region, started operating in
September 1998. It is located in Abidjan and has
a branch in each capital city of the other member
States of the Union. Its main role is to pool and
process stock market orders transmitted by brokerage
companies (Société de Gestion et d’Intermédiation-
SGI) authorized to negotiate securities quoted on
the BRVM. As of December 2006, 19 SGIs were
registered in the Union. SGI Niger, the sole brokerage
company in Niger as of December 2006, provides
brokerage services for the BRVM. The BRVM is
regulated by the CREPMF whose responsibilities
include the promulgation of policies and procedures
to regulate the BRVM and the promotion of a regional
bond market. In order to list on the BRVM, all bond
issues must be guaranteed by an approved financial
institution, a development financial institution, a
guarantee fund, or the Parent Company. At the end
of December 2006, the capitalization of the equity
market was XOF 2,067 bn whereas the bond market
capitalization stood at XOF 489 bn, with XOF 260
bn being government bonds, representing 1.07% of
the GDP of the Union. By end-December 2006, 61
securities were listed, including 40 shares and 21
bonds, compared to 57 securities comprising 39
shares and 18 bonds by end-December 2005. As
of December 2006, Bank of Africa Niger is the sole
company from Niger listed and traded on the stock
exchange.
Niger – 10�
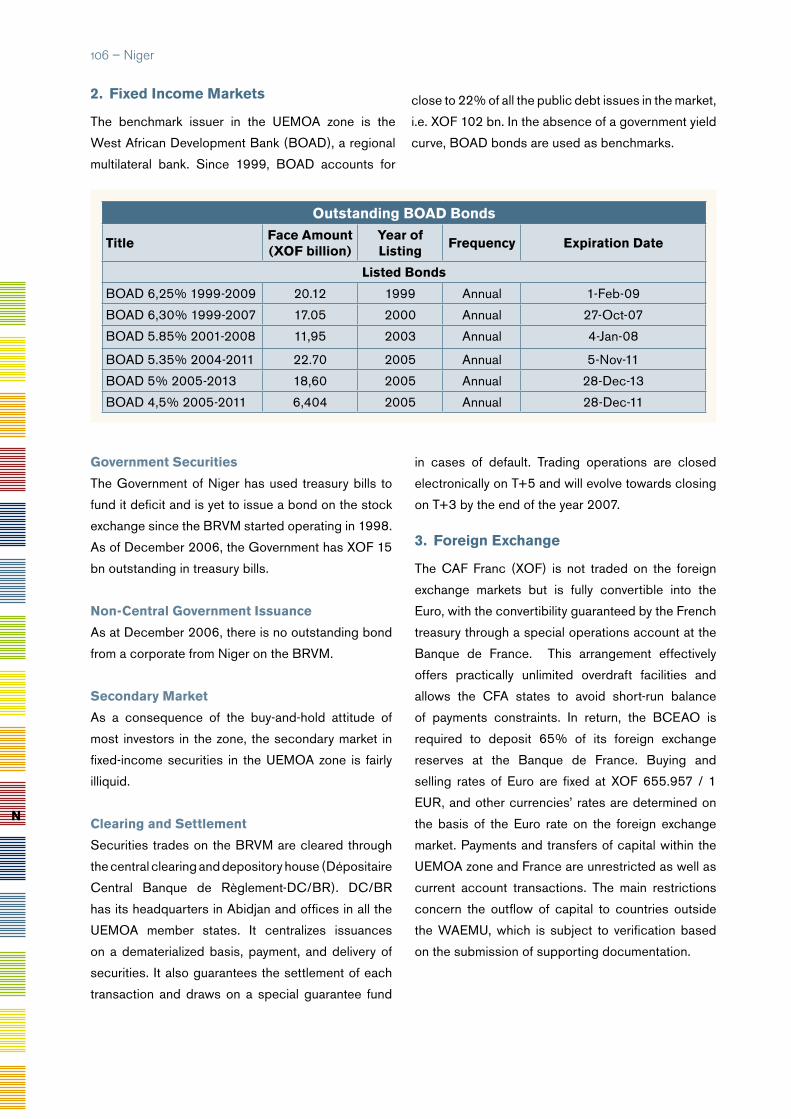
n
2. Fixed income Markets
The benchmark issuer in the UEMOA zone is the
West African Development Bank (BOAD), a regional
multilateral bank. Since 1999, BOAD accounts for
close to 22% of all the public debt issues in the market,
i.e. XOF 102 bn. In the absence of a government yield
curve, BOAD bonds are used as benchmarks.
outstanding BoAd Bonds
titleFace Amount (XoF billion)
year of Listing
Frequency expiration date
Listed Bonds
BOAD 6,25% 1999-2009 20.12 1999 Annual 1-Feb-09
BOAD 6,30% 1999-2007 17.05 2000 Annual 27-Oct-07
BOAD 5.85% 2001-2008 11,95 2003 Annual 4-Jan-08
BOAD 5.35% 2004-2011 22.70 2005 Annual 5-Nov-11
BOAD 5% 2005-2013 18,60 2005 Annual 28-Dec-13
BOAD 4,5% 2005-2011 6,404 2005 Annual 28-Dec-11
Government securities
The Government of Niger has used treasury bills to
fund it deficit and is yet to issue a bond on the stock
exchange since the BRVM started operating in 1998.
As of December 2006, the Government has XOF 15
bn outstanding in treasury bills.
non-Central Government issuance
As at December 2006, there is no outstanding bond
from a corporate from Niger on the BRVM.
secondary Market
As a consequence of the buy-and-hold attitude of
most investors in the zone, the secondary market in
fixed-income securities in the UEMOA zone is fairly
illiquid.
Clearing and settlement
Securities trades on the BRVM are cleared through
the central clearing and depository house (Dépositaire
Central Banque de Règlement-DC/BR). DC/BR
has its headquarters in Abidjan and offices in all the
UEMOA member states. It centralizes issuances
on a dematerialized basis, payment, and delivery of
securities. It also guarantees the settlement of each
transaction and draws on a special guarantee fund
in cases of default. Trading operations are closed
electronically on T+5 and will evolve towards closing
on T+3 by the end of the year 2007.
3. Foreign exchange
The CAF Franc (XOF) is not traded on the foreign
exchange markets but is fully convertible into the
Euro, with the convertibility guaranteed by the French
treasury through a special operations account at the
Banque de France. This arrangement effectively
offers practically unlimited overdraft facilities and
allows the CFA states to avoid short-run balance
of payments constraints. In return, the BCEAO is
required to deposit 65% of its foreign exchange
reserves at the Banque de France. Buying and
selling rates of Euro are fixed at XOF 655.957 / 1
EUR, and other currencies’ rates are determined on
the basis of the Euro rate on the foreign exchange
market. Payments and transfers of capital within the
UEMOA zone and France are unrestricted as well as
current account transactions. The main restrictions
concern the outflow of capital to countries outside
the WAEMU, which is subject to verification based
on the submission of supporting documentation.
10� – Niger

4. derivatives
The derivative market is in its infancy. Foreign
exchange forwards exist with moderate liquidity and
tenors extending up to 3-6 months.
5. Participation of Foreign investors and issuers
The banking sector has a high level of foreign
ownership, particularly by French financial institutions.
Foreign investors can purchase securities listed
on BRVM. For instance, an international non-
governmental organization, Shelter Afrique, based in
Nairobi (Kenya), has issued bonds and listed them on
the BRVM.
6. investment taxation
Government securities are tax-exempt as opposed
to non-governmental securities that are subject to a
withholding tax (Impôt sur le Revenue des Valeurs
Mobilières-IRVM) applicable to income derived from
these securities. The tax rates are the following:
6% for interest income from bonds redeemable in
less than five years, 10% for dividends paid out by
listed stocks and 12-18% for income from any other
security.
7. Key Contacts
• Banque Centrale des Etats de
l’Afrique de l’Ouest (BCEAO)
Mailing Address: BP 487, Niamey, Niger
Other Address: Rue de l’Uranium, Niamey, Niger
Tel: +227-72-2491
Fax: +227-73-4743
Web: www.bceao.int
• Bourse Régionale des Valeurs Mobiliéres
Mailing Address: BP 3802,
Abidjan 01, Côte d’Ivoire
Other Address: 18, Avenue Joseph Anoma/
Rue des Banques, Abidjan, Côte d’Ivoire
Tel: +225-2032-6685
Fax: +225-2032-4777
E-mail: [email protected]
Web: www.brvm.org
Niger – 10�
XoF per unit of usd (year end)
450
500
550
600
650
700
750
2000 2001 2002 2003 2004 2005 2006
Source: Bloomberg
Population (mn) 134.4Population Growth (annual %) 2.1Official Language EnglishCurrency Naira (NGN)GDP (Current US$ bn) 116.4GDP Growth (annual %) 5.3GDP Per Capita (US$) 866FDI, net inflows (US$ mn) (2005) 3,403External Debt (US$ mn) 4,800External Debt/GDP (%) 3.5CPI Inflation (annual %) 8.6Exports of goods and services (% of GDP) 53.7Gross Official Reserves (US$ bn) 37Gross Official Reserves (in months of imports) 11.7UNDP HDI RaNkING 159Source: AfDB, IMF, UNCTAD, UNDP, UN Population Division
1. overview of Financial system
The Central Bank of Nigeria (CBN) is the country’s
autonomous monetary authority. Established in 1958,
the CBN is the banker and financial adviser to the
Federal Government, acts as the lender of last resort
to banks, is responsible for setting monetary policy,
and ensures the smooth functioning of the financial
system. The central bank is guided by various
regulations, including the Central Bank of Nigeria
Act of 1958 as amended in a series of Decrees,
the last one in 1999 being the CBN Decree 1999
Amendment.
For over 20 years, the aim of monetary policy has
been to develop a market-oriented financial system for
effective mobilisation of financial savings and efficient
resource allocation. The main instrument of the
market-based framework is Open Market Operations.
This is complemented by reserve requirements and
discount window operations.
The Apex authority, in late 2006, abolished its
prime rate, the Minimum Rediscount Rate (MRR),
which had been set at 13%. The MRR has now been
replaced with the Monetary Policy Rate (MPR) set at
10%.
All financial sector regulatory agencies in Nigeria
are part of the Financial Services Regulation
Coordinating Committee (FSRCC), which
coordinates supervisory activities across the various
financial sectors.
non-Bank Financial sector
The banking and insurance sectors each have a
separate regulatory authority and supervisory body,
the Central Bank of Nigeria and the National Insurance
Commission (NAICOM) respectively.
Since 2005, these regulators have implemented
sweeping reforms of these financial sectors, aimed
at restoring the health of the financial system. The
CBN enforced a new regulation for banks to increase
their minimum capital base to NGN 25 bn (USD
190 mn), from a previous NGN 2 bn (USD 16 mn).
This sparked a series of mergers and acquisitions as
Nigeria
sovereign ratings
Longterm
Local Currency
Foreign Currency
Fitch BB BB –
s&P BB BB –
GEOATLAS - Copyright1998 Graphi-Ogre0 km 100 200 300 400 km
O C E A N �A T L A N T I Q U E
Pointe Epote
Ile de Bioko�Guinée Equatoriale
BA IE D U BIA FR A
BOUCH
ESD U N IG ER
CO TE D ES ESCLA V ES
G O L F E D E G U I N E E
B A I E D U B E N I N
Maroua
Garoua
Ngaoundéré
Bamenda
Bafoussam
Buea
DoualaBertoua
Ebolowa
Diapaga
Bouar
Dutse Damaturu
JalingoYola
Umuahia
AsabaEnugu
Lokoja
Benin City��
Maiduguri
Bauchi
Kano
Katsina
Birnin Kebbi
Kaduna
Sokoto
Minna
Jos
Makurdi
Llorin
Oshogbo
IbadanAbeokuta
Lagos
Akure
Awka
Owerri
Port HarcourtUyo
Calabar
Parakou
Natitingou
Abomey
Cotonou
Lokossa
Diffa
Zinder
Maradi
Tahoua
Dosso
Tillaberi
Bol
Mao
Bongor
YaoundéMalabo
Abuja
Porto Novo
Niamey
N'Djamena
Firditi
Ondo
Mubi
Jimeta
Warri
Sapele
Uromi
Potiskum
DebaKumo
Gombe
Zaria
Kaura�Namoda
Gusau
Bida
Lafia
Keffi
Idah
Okene
Lafiagi
IkireIfeLleshaIwo
Ede
IkirunInisa
Ila
LloraOyo
Ogbomosho
Shaki
Kishi
Igboho
Ijebu-IgboIjebu-Ode
Shagamu
EpeIkorodu
Mushin
Owo
OkaIkare
Ado-Ekiti
Ikerre
Abakaliki
Eha-Amufu
IhialaOnitsha
Aba
AfikpoUgep
OpoboOron
Lac�Kainji
Lac�Tchad
Ngadda
Yedseram
Benue
Mékrou
Alibori
Ouém
é Niger
Kaduna
Ka
duna
M ariga
Sokoto
Sokoto
G agere
M
ad
a
Rima
Maradi
KatsinaAla
Donga
G on g
ola
Bénoué
Faro
Faro
Ka
bia
M
béré
V ina
Logone
Sanaga
M bam
Nou
n
Djére
m
Lo
m
N yo ng
Dja
Kadeï
Boumbé
II
Boumbé
I
Ko
m
adugu Yob
e
Kom
adugu G
ana
Bunga
Jam
aare
Hadejia
Niger
Niger
N tem Kom
2019 m
1500 m
Dimlang�2042 m Hoséré�
Vokré�2049 m
Zaranda Hill�1454 m
Sara Peak�1690 m
2679 m
Ngol-Kedju�Hill�
2000 m
549 m
Mont�Cameroun �
4100 m
Pico de�Santa Isabel�3008 m
Tchabal�Mbabo�2460 m
M fD EL'A D
A M A O U A
MtsMANDARA
MtsALA
N
TIKA
Mts�GOTEL
Mts SHEBSHI
COLLINES�OBAN
PLATEAU�JOS
CHAINEDEL'ATACO
RA
M
ASSIFDUYA
DÉ
A D ER
T É G A M
DAM
ER
GO
MA
NG
A
GUINEE�EQUATORIALE
GABON CONGO
REPUBLIQUE�
CENTRAFRICAINE
B E N I N
C A M E R O U N
N I G E R
BURKINA�
FASO
TOGO
TC
HA
DNIGERIA
n
10� – Nigeria
2006 At a Glance
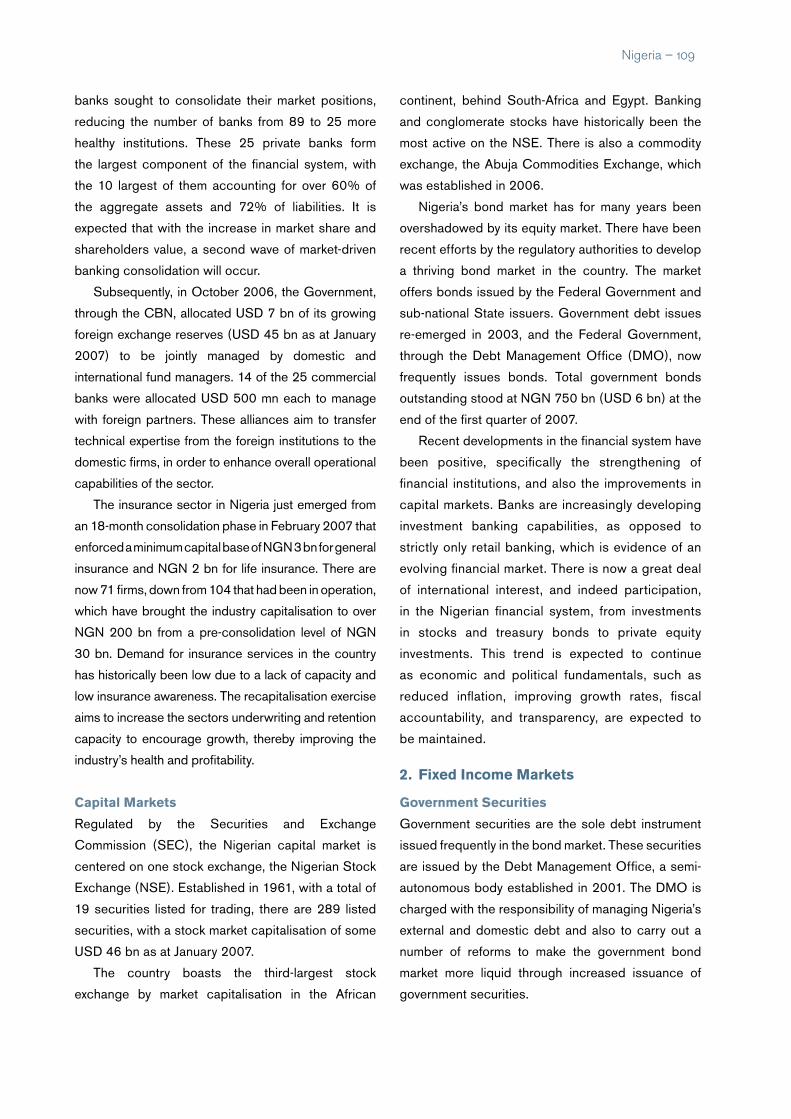
banks sought to consolidate their market positions,
reducing the number of banks from 89 to 25 more
healthy institutions. These 25 private banks form
the largest component of the financial system, with
the 10 largest of them accounting for over 60% of
the aggregate assets and 72% of liabilities. It is
expected that with the increase in market share and
shareholders value, a second wave of market-driven
banking consolidation will occur.
Subsequently, in October 2006, the Government,
through the CBN, allocated USD 7 bn of its growing
foreign exchange reserves (USD 45 bn as at January
2007) to be jointly managed by domestic and
international fund managers. 14 of the 25 commercial
banks were allocated USD 500 mn each to manage
with foreign partners. These alliances aim to transfer
technical expertise from the foreign institutions to the
domestic firms, in order to enhance overall operational
capabilities of the sector.
The insurance sector in Nigeria just emerged from
an 18-month consolidation phase in February 2007 that
enforced a minimum capital base of NGN 3 bn for general
insurance and NGN 2 bn for life insurance. There are
now 71 firms, down from 104 that had been in operation,
which have brought the industry capitalisation to over
NGN 200 bn from a pre-consolidation level of NGN
30 bn. Demand for insurance services in the country
has historically been low due to a lack of capacity and
low insurance awareness. The recapitalisation exercise
aims to increase the sectors underwriting and retention
capacity to encourage growth, thereby improving the
industry’s health and profitability.
Capital Markets
Regulated by the Securities and Exchange
Commission (SEC), the Nigerian capital market is
centered on one stock exchange, the Nigerian Stock
Exchange (NSE). Established in 1961, with a total of
19 securities listed for trading, there are 289 listed
securities, with a stock market capitalisation of some
USD 46 bn as at January 2007.
The country boasts the third-largest stock
exchange by market capitalisation in the African
continent, behind South-Africa and Egypt. Banking
and conglomerate stocks have historically been the
most active on the NSE. There is also a commodity
exchange, the Abuja Commodities Exchange, which
was established in 2006.
Nigeria’s bond market has for many years been
overshadowed by its equity market. There have been
recent efforts by the regulatory authorities to develop
a thriving bond market in the country. The market
offers bonds issued by the Federal Government and
sub-national State issuers. Government debt issues
re-emerged in 2003, and the Federal Government,
through the Debt Management Office (DMO), now
frequently issues bonds. Total government bonds
outstanding stood at NGN 750 bn (USD 6 bn) at the
end of the first quarter of 2007.
Recent developments in the financial system have
been positive, specifically the strengthening of
financial institutions, and also the improvements in
capital markets. Banks are increasingly developing
investment banking capabilities, as opposed to
strictly only retail banking, which is evidence of an
evolving financial market. There is now a great deal
of international interest, and indeed participation,
in the Nigerian financial system, from investments
in stocks and treasury bonds to private equity
investments. This trend is expected to continue
as economic and political fundamentals, such as
reduced inflation, improving growth rates, fiscal
accountability, and transparency, are expected to
be maintained.
2. Fixed income Markets
Government securities
Government securities are the sole debt instrument
issued frequently in the bond market. These securities
are issued by the Debt Management Office, a semi-
autonomous body established in 2001. The DMO is
charged with the responsibility of managing Nigeria’s
external and domestic debt and also to carry out a
number of reforms to make the government bond
market more liquid through increased issuance of
government securities.
Nigeria – 10�

table 1 sPeCiAL GovernMent AuCtionsdate FGn Auction offer size (nGn’ mn) Coupon (%) tenor (yr)
July 2006 3rd FGN Bond 2009 Series 11 20,000 12.5% 3
Sep 2006 3rd FGN Bond 2011 Series 13 20,000 13.6% 5
Primary market bills are issued in 91-, 182-, and 365-
day tenors. In a bid to restructure the debt stock,
the DMO, since 2004, has issued less of the 91-day
bills and more 365-day and longer dated paper. The
restructuring was to guard against the highly uneven
weekly issuance programme that created rollover
and interest rate risks to the Government, to reduce
volatility in the short-term rate market, and to sustain,
revive and develop a deep and liquid secondary
market for Government bonds.
Federal Government of Nigeria (FGN) bonds
outstanding are in fixed and floating 3-, 5-, 7- and 10-
year maturities. Since the establishment of a frequent
benchmark issuance program for the FGN bonds in
2003, the yield curve has been characterised by 3-
, 5- and 7-year fixed rate treasury benchmark issues
only. New fixed rate 10 year bonds are expected to be
launched under this issuance program by December
2007. NGN 445 bn worth of these bonds were issued
in 2006, nearly 10% above the NGN 408 bn scheduled
issuance for the year. Total bond market capitalisation
stood at NGN 621.37 bn (USD 44.8 bn) by the end of
January 2007. FGN bonds are listed on the NSE.
The market is based on a multiple-price system for
treasury bills (auctioned on a weekly basis) and single-
price auction for treasury bonds (offered in accordance
with a set issuance calendar). Government bonds
follow an actual / 365 day count basis.
With lower inflation, rates offered on Government
securities have experienced a significant decline
across the entire yield curve since the beginning of
2006. Over this period, the 3-month treasury bill rate
came down from 12% in 2005 to about 7% in 2007.
The 7-year bond issued in June 2006 yielded 16%,
and in March 2007, a new 7-year yielded 10.75%.
This has been mostly due to reduced inflation levels
(estimated at 9.4% for 2006), and an increased
amount of liquidity in the market.
In 2006, the Government had special auctions
outside of its benchmark programme, to pay
outstanding debts to pension funds and contractors.
These bonds were fully subscribed with 100%
allocation. The details of the auction are presented
in table 1.
n
110 – Nigeria
Federal Government of nigeria (FGn) yield Curve
6
8
10
3-mth 6-mth 1-yr 3-yr 5-yr 7-yr
Source: Central Bank of Nigeria, march 2007
%
Commercial banks, discount houses and non-bank financial institutions are the major investors in FGN
securities. With the enactment of the Pension Reform Act of 2004 that brought about the licensing of 19
specialist firms dedicated to managing the working population’s funds, it is anticipated that there will be a
further increase in the demand for FGN bonds. As at the first quarter of 2007, pension funds assets under
management was estimated at NGN 800 bn (USD 6.2 bn).
non-Central Goverment issuance
Seven of the 36 states of Nigeria have raised funds
from the debt capital market. These state bonds have
the full trust and backing of the Federal Government.
They have all been revenue bonds, with the specific
purpose of raising financing for development projects.
The bonds are all floating rate issues. The details of the
offerings are presented in table 2.
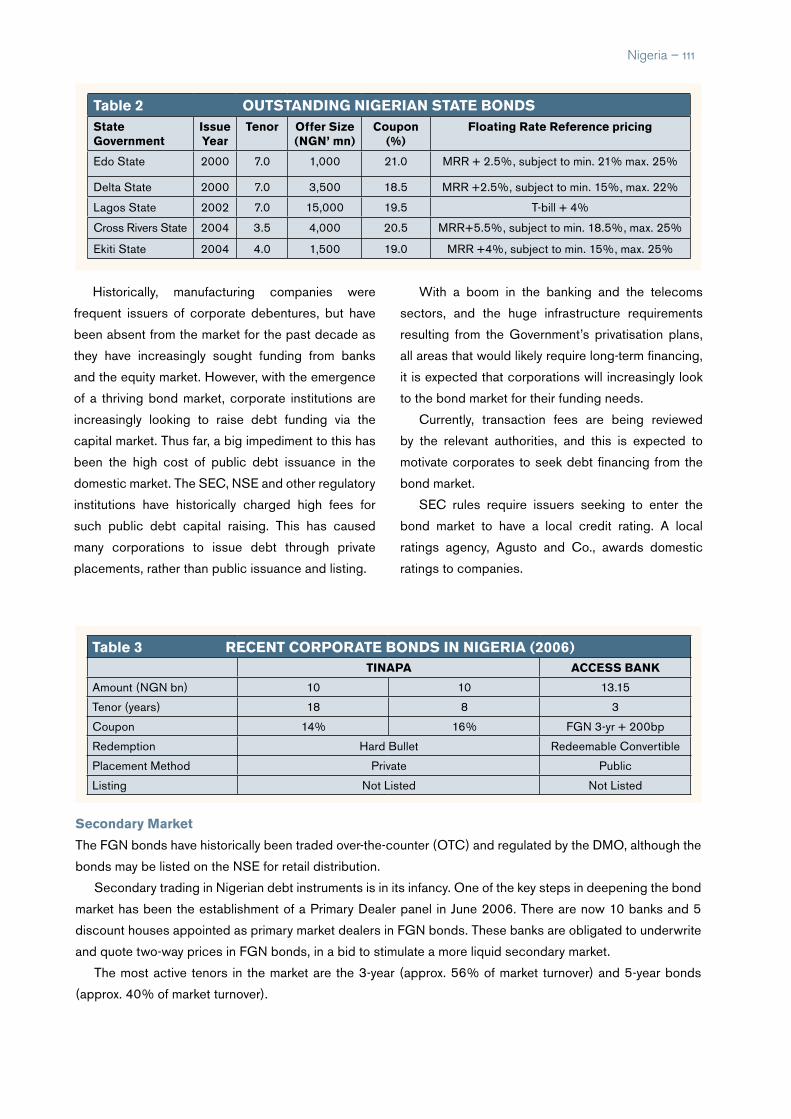
Historically, manufacturing companies were
frequent issuers of corporate debentures, but have
been absent from the market for the past decade as
they have increasingly sought funding from banks
and the equity market. However, with the emergence
of a thriving bond market, corporate institutions are
increasingly looking to raise debt funding via the
capital market. Thus far, a big impediment to this has
been the high cost of public debt issuance in the
domestic market. The SEC, NSE and other regulatory
institutions have historically charged high fees for
such public debt capital raising. This has caused
many corporations to issue debt through private
placements, rather than public issuance and listing.
table 3 reCent CorPorAte Bonds in niGeriA (2006)tinAPA ACCess BAnK
Amount (NGN bn) 10 10 13.15
Tenor (years) 18 8 3
Coupon 14% 16% FGN 3-yr + 200bp
Redemption Hard Bullet Redeemable Convertible
Placement Method Private Public
Listing Not Listed Not Listed
With a boom in the banking and the telecoms
sectors, and the huge infrastructure requirements
resulting from the Government’s privatisation plans,
all areas that would likely require long-term financing,
it is expected that corporations will increasingly look
to the bond market for their funding needs.
Currently, transaction fees are being reviewed
by the relevant authorities, and this is expected to
motivate corporates to seek debt financing from the
bond market.
SEC rules require issuers seeking to enter the
bond market to have a local credit rating. A local
ratings agency, Agusto and Co., awards domestic
ratings to companies.
table 2 outstAndinG niGeriAn stAte Bondsstate Government
issue year
tenor offer size (nGn’ mn)
Coupon (%)
Floating rate reference pricing
Edo State 2000 7.0 1,000 21.0 MRR + 2.5%, subject to min. 21% max. 25%
Delta State 2000 7.0 3,500 18.5 MRR +2.5%, subject to min. 15%, max. 22%
Lagos State 2002 7.0 15,000 19.5 T-bill + 4%
Cross Rivers State 2004 3.5 4,000 20.5 MRR+5.5%, subject to min. 18.5%, max. 25%
Ekiti State 2004 4.0 1,500 19.0 MRR +4%, subject to min. 15%, max. 25%
Nigeria – 111
secondary Market
The FGN bonds have historically been traded over-the-counter (OTC) and regulated by the DMO, although the
bonds may be listed on the NSE for retail distribution.
Secondary trading in Nigerian debt instruments is in its infancy. One of the key steps in deepening the bond
market has been the establishment of a Primary Dealer panel in June 2006. There are now 10 banks and 5
discount houses appointed as primary market dealers in FGN bonds. These banks are obligated to underwrite
and quote two-way prices in FGN bonds, in a bid to stimulate a more liquid secondary market.
The most active tenors in the market are the 3-year (approx. 56% of market turnover) and 5-year bonds
(approx. 40% of market turnover).
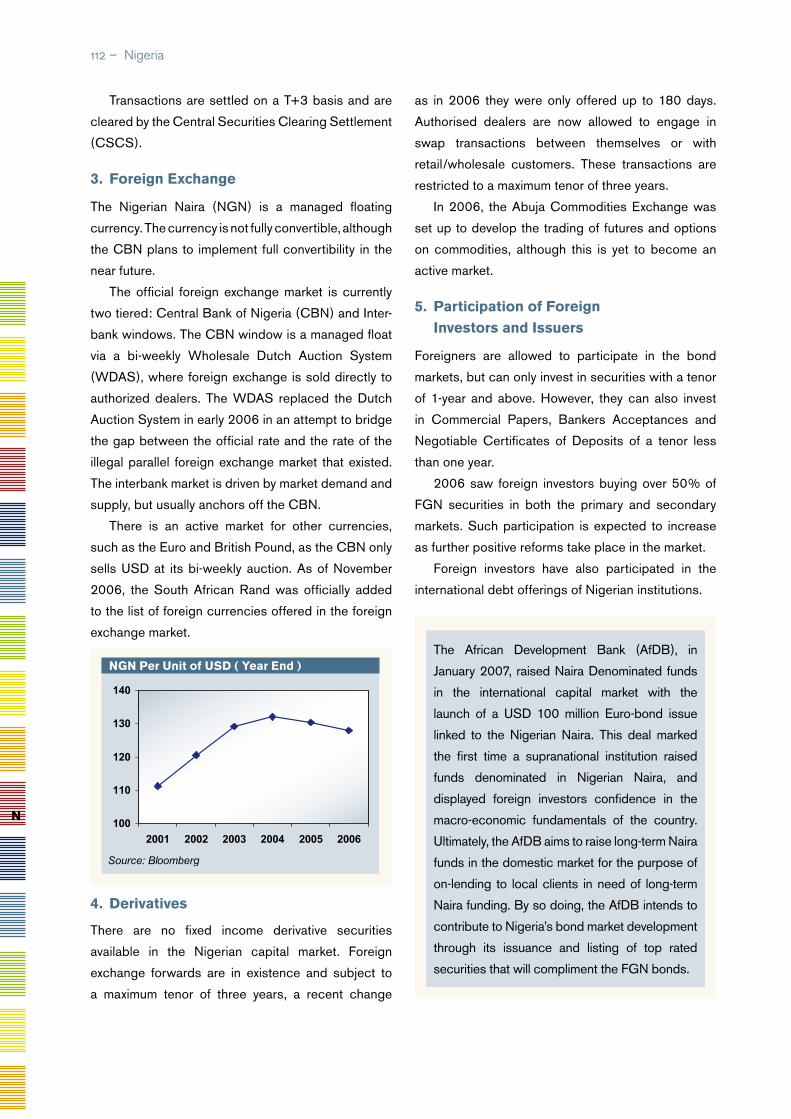
The African Development Bank (AfDB), in
January 2007, raised Naira Denominated funds
in the international capital market with the
launch of a USD 100 million Euro-bond issue
linked to the Nigerian Naira. This deal marked
the first time a supranational institution raised
funds denominated in Nigerian Naira, and
displayed foreign investors confidence in the
macro-economic fundamentals of the country.
Ultimately, the AfDB aims to raise long-term Naira
funds in the domestic market for the purpose of
on-lending to local clients in need of long-term
Naira funding. By so doing, the AfDB intends to
contribute to Nigeria’s bond market development
through its issuance and listing of top rated
securities that will compliment the FGN bonds.
Transactions are settled on a T+3 basis and are
cleared by the Central Securities Clearing Settlement
(CSCS).
3. Foreign exchange
The Nigerian Naira (NGN) is a managed floating
currency. The currency is not fully convertible, although
the CBN plans to implement full convertibility in the
near future.
The official foreign exchange market is currently
two tiered: Central Bank of Nigeria (CBN) and Inter-
bank windows. The CBN window is a managed float
via a bi-weekly Wholesale Dutch Auction System
(WDAS), where foreign exchange is sold directly to
authorized dealers. The WDAS replaced the Dutch
Auction System in early 2006 in an attempt to bridge
the gap between the official rate and the rate of the
illegal parallel foreign exchange market that existed.
The interbank market is driven by market demand and
supply, but usually anchors off the CBN.
There is an active market for other currencies,
such as the Euro and British Pound, as the CBN only
sells USD at its bi-weekly auction. As of November
2006, the South African Rand was officially added
to the list of foreign currencies offered in the foreign
exchange market.
as in 2006 they were only offered up to 180 days.
Authorised dealers are now allowed to engage in
swap transactions between themselves or with
retail/wholesale customers. These transactions are
restricted to a maximum tenor of three years.
In 2006, the Abuja Commodities Exchange was
set up to develop the trading of futures and options
on commodities, although this is yet to become an
active market.
5. Participation of Foreign investors and issuers
Foreigners are allowed to participate in the bond
markets, but can only invest in securities with a tenor
of 1-year and above. However, they can also invest
in Commercial Papers, Bankers Acceptances and
Negotiable Certificates of Deposits of a tenor less
than one year.
2006 saw foreign investors buying over 50% of
FGN securities in both the primary and secondary
markets. Such participation is expected to increase
as further positive reforms take place in the market.
Foreign investors have also participated in the
international debt offerings of Nigerian institutions.
nGn Per unit of usd ( year end )
100
110
120
130
140
2001 2002 2003 2004 2005 2006
Source: Bloomberg
n
11� – Nigeria
4. derivatives
There are no fixed income derivative securities
available in the Nigerian capital market. Foreign
exchange forwards are in existence and subject to
a maximum tenor of three years, a recent change
6. investment taxation
There is no capital gains tax on the sale of investment
in the capital market. Withholding tax on investment
income is currently 10%. Nigeria has tax treaties with
Czechoslovakia, France, Netherlands, Pakistan and
the United Kingdom.
7. Key Contacts
• Central Bank of Nigeria
Mailing Address: P.M.B. 0187, Garki Abuja, Nigeria
Other Address: Zaria Street, Garki, Abuja, Nigeria
Tel: +234-9-2342132-4/234332-6
Fax: +234-9-23435363
E-mail: [email protected]
Web: www.cenbank.org
• The Nigerian Stock ,
Mailing Address: P.O. Box 2457, Lagos, Nigeria
Other Address: Stock Exchange House, 8th, 9th
and 23rd Floor, 2/4 Customs Street, Lagos, Nigeria
Tel: +234-1-2660287
Fax: +234-1-2668724
E-mail: [email protected]
Web: www.nigerianstockexchange.com
• Securities and Exchange Commission
Mailing Address: P.M.B. 315 Garki-Abuja, Nigeria
Other Address: Tower 421, Constitution Avenue,
Central Business District, Abuja, Nigeria
Tel: +234-9-2346272-3
Fax: +234-9-2346276
E-mail: [email protected]
Web: www.secngr.org
Nigeria – 11�

Population (mn) 9.0Population Growth (annual %) 2.1Official Language (s) Kinyarwanda/French/EnglishCurrency Rwanda Franc (RWF)GDP (Current US$ bn) 2.4GDP Growth (annual %) 3.0GDP Per Capita (US$) 255FDI, net inflows (US$ mn) (2005) 8.0 External Debt (US$ mn) 400External Debt/GDP (%) 15.1CPI Inflation (annual %) 9.3Exports of goods and services (% of GDP) 10.5Gross Official Reserves (In months of imports) 11Gross Official Reserves (US$ bn) 0.42UNDP HDI RaNkING 158Source: AfDB, IMF, UNCTAD, UNDP, UN Population Division
1. overview of Financial system
The National Bank of Rwanda (NBR) i.e. the Central
Bank, has the sole responsibility for monetary policy
and its overriding objective is to ensure price stability
within the system. All banks are subject to supervision
and regulation by the NBR under the Banking Law of
1999. Annual inspection of all commercial banks was
started in 2004.
Bank and non-Bank Financial s ector
The Rwandan financial sector is comprised primarily
of a commercial banking and a micro-finance sector.
As at the end of 2006, there were seven commercial
banks operating in Rwanda, five of which were
established at the end of the war. In 2004, the
Government sold 80% of the largest bank, Banque
Commerciale du Rwanda, as well as a majority stake
in a second bank, to foreign investors.
Micro-finance is an important part of the financial
sector, led by the Union des Banques Populaires
du Rwanda, a network of micro-finance institutions
that serve as micro-lenders and micro-banks for
nearly two-thirds of all depositors in the country. This
institution controls over 97% of the micro-finance
sector in Rwanda. The Government plans to submit
a law on micro-finance to parliament by June 2007.
The objective is to streamline the activities of micro-
finance institutions by increasing the minimum capital
required and setting credit exposure limits.
Four locally-owned insurance companies operate
in Rwanda. The largest, Sonarwa, is state-owned,
and concentrates on vehicle insurance. It is slated
for privatization in the near future. Soras, also a
parastatal entity, is the second largest in the industry
with 25% of the market and, like Sonarwa, has the
motor insurance business as its primary focus.
Capital Markets
Preparatory work is underway for the establishment
of a Stock Exchange in Rwanda.
Rwanda
11� – Rwanda
r
2006 At a Glance
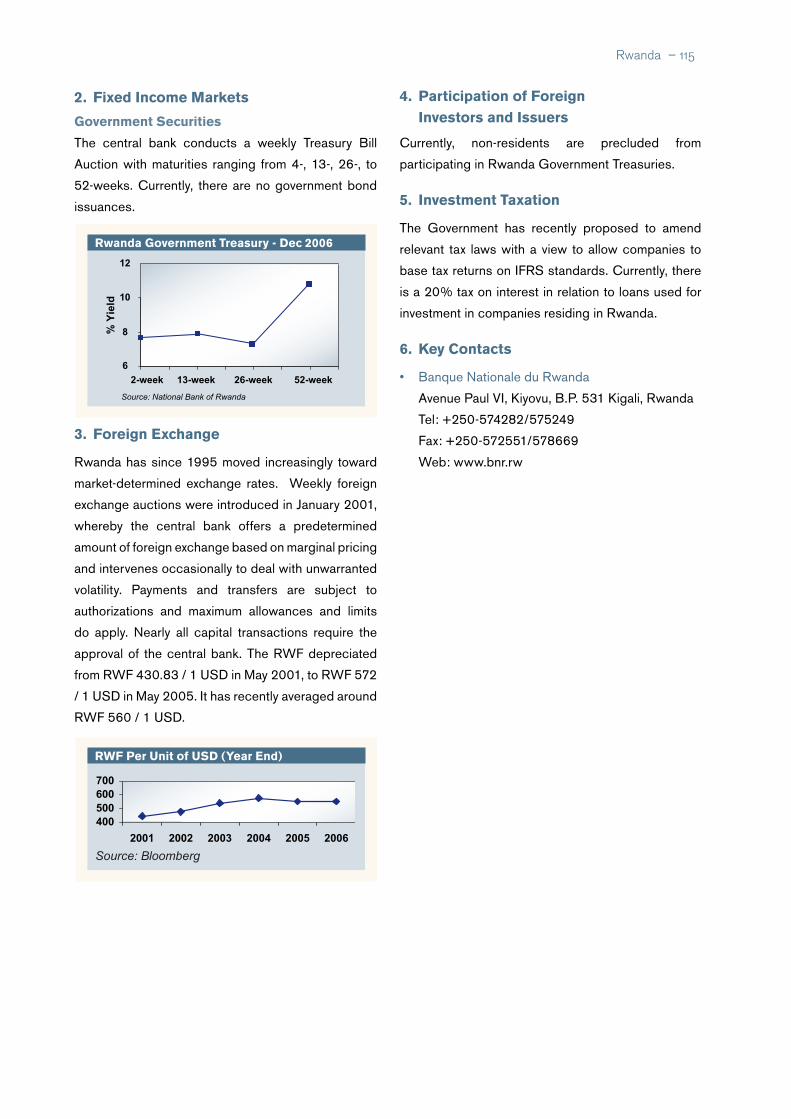
2. Fixed income Markets
Government securities
The central bank conducts a weekly Treasury Bill
Auction with maturities ranging from 4-, 13-, 26-, to
52-weeks. Currently, there are no government bond
issuances.
3. Foreign exchange
Rwanda has since 1995 moved increasingly toward
market-determined exchange rates. Weekly foreign
exchange auctions were introduced in January 2001,
whereby the central bank offers a predetermined
amount of foreign exchange based on marginal pricing
and intervenes occasionally to deal with unwarranted
volatility. Payments and transfers are subject to
authorizations and maximum allowances and limits
do apply. Nearly all capital transactions require the
approval of the central bank. The RWF depreciated
from RWF 430.83 / 1 USD in May 2001, to RWF 572
/ 1 USD in May 2005. It has recently averaged around
RWF 560 / 1 USD.
rWF Per unit of usd (year end)
400500600700
2001 2002 2003 2004 2005 2006
Source: Bloomberg
4. Participation of Foreign investors and issuers
Currently, non-residents are precluded from
participating in Rwanda Government Treasuries.
5. investment taxation
The Government has recently proposed to amend
relevant tax laws with a view to allow companies to
base tax returns on IFRS standards. Currently, there
is a 20% tax on interest in relation to loans used for
investment in companies residing in Rwanda.
6. Key Contacts
• Banque Nationale du Rwanda
Avenue Paul VI, Kiyovu, B.P. 531 Kigali, Rwanda
Tel: +250-574282/575249
Fax: +250-572551/578669
Web: www.bnr.rw
Rwanda – 11�
rwanda Government treasury - dec 2006
6
8
10
2-week 13-week 26-week 52-week
% Y
ield
12
Source: National Bank of Rwanda
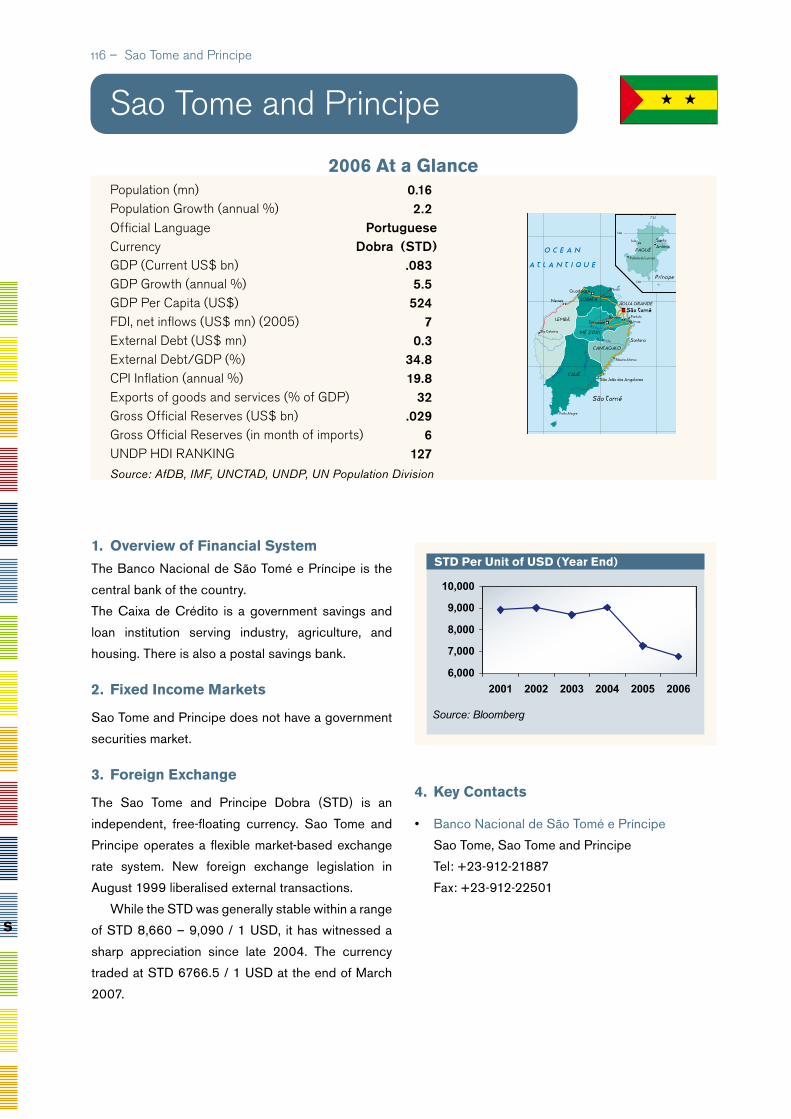
s
Population (mn) 0.16Population Growth (annual %) 2.2Official Language PortugueseCurrency Dobra (STD)GDP (Current US$ bn) .083GDP Growth (annual %) 5.5GDP Per Capita (US$) 524FDI, net inflows (US$ mn) (2005) 7External Debt (US$ mn) 0.3External Debt/GDP (%) 34.8CPI Inflation (annual %) 19.8Exports of goods and services (% of GDP) 32Gross Official Reserves (US$ bn) .029Gross Official Reserves (in month of imports) 6UNDP HDI RaNkING 127Source: AfDB, IMF, UNCTAD, UNDP, UN Population Division
1. overview of Financial system
The Banco Nacional de São Tomé e Príncipe is the
central bank of the country.
The Caixa de Crédito is a government savings and
loan institution serving industry, agriculture, and
housing. There is also a postal savings bank.
2. Fixed income Markets
Sao Tome and Principe does not have a government
securities market.
3. Foreign exchange
The Sao Tome and Principe Dobra (STD) is an
independent, free-floating currency. Sao Tome and
Principe operates a flexible market-based exchange
rate system. New foreign exchange legislation in
August 1999 liberalised external transactions.
While the STD was generally stable within a range
of STD 8,660 – 9,090 / 1 USD, it has witnessed a
sharp appreciation since late 2004. The currency
traded at STD 6766.5 / 1 USD at the end of March
2007.
Sao Tome and Principe
std Per unit of usd (year end)
6,000
7,000
8,000
9,000
10,000
2001 2002 2003 2004 2005 2006
Source: Bloomberg
4. Key Contacts
• Banco Nacional de São Tomé e Príncipe
Sao Tome, Sao Tome and Principe
Tel: +23-912-21887
Fax: +23-912-22501
11� – Sao Tome and Principe
2006 At a Glance

Senegal – 11�
Population (mn) 11.9Population Growth (annual %) 2.4Official Language FrenchCurrency CFA Franc (XOF)GDP (Current US$ bn) 9.3GDP Growth (annual %) 3.0GDP Per Capita (US$) 775FDI, net inflows (US$ mn) (2005) 54 External Debt (US$ mn) 3,700External Debt/GDP (%) 39.8CPI Inflation (annual %) 2.0Exports of goods and services (% of GDP) 27.0Gross Official Reserves (US $ bn) 1.3Gross Official Reserves (in months of imports) 5.1UNDP HDI RaNkING 156Source: AfDB, IMF, UNCTAD, UNDP, UN Population Division
1. overview of Financial system
Senegal is a member of the West African Economic
and Monetary Union (UEMOA) established in
January 1994, and comprising eight West African
countries (Benin, Burkina Faso, Côte d’Ivoire, Mali,
Niger, Senegal, Togo, and Guinea Bissau) which are
members of the Franc Zone and use the CFA Franc
(XOF) issued by the Central Bank (BCEAO). The
UEMOA financial markets are administered through
the following institutions:
• The Conference of Heads of State, which decides
on the accession of new members.
• The Council of Ministers, which defines, among
others, the monetary and credit policy of the Union
to safeguard the value of the CFA Franc.
• The UEMOA Commission, as delegated by the
Council of Ministers, is in charge of the day-to-day
administration of the Union.
• The Central Bank of West African States
(BCEAO) is the central bank and controls the
Banking Commission (Commission Bancaire)
responsible for overseeing and supervising
Senegal
banks and financial institutions. The BCEAO
also controls the Savings and Financial Markets
Regional Council (CREPMF). The capital of
BCEAO, currently called up in the amount of XOF
134 bn, is entirely subscribed by the member
States and shared equally among them.
• Micro-finance institutions are governed by a
separate law, the PARMEC (Projet d’Appui à
la Réglementation des Mutuelles d’Epargne et
de Crédit) Law, which regulates micro-finance
activities in all WAEMU countries.
Senegal is also a signatory to the OHADA Treaty,
which harmonizes business law in 16 countries in Sub-
Sahara Africa, including all the UEMOA countries.
The main objective of the monetary policy as
defined by the UEMOA and implemented by the
BCEAO, is to ensure price stability and safeguard the
domestic and foreign value of the CFA Franc through
appropriate coverage of currency issue by foreign
exchange reserves.
GEOATLAS - Copyright1998 Graphi-Ogre0 km 100 200 300 400 km
Ile Sherbro
Pointe Manna
Cap ShillingBaie�Yawri
Iles Turtle
Iles Tristao
Ile de Jeta
Cap Roxo
Cap Ste-Marie
Cap Vert
Râs Timirist
Orango�Grande
ARCHIPEL DES BIJAGÓS
CanaldeG êba
PETITECO
TE
O C E A N �
A T L A N T I Q U E �
�
Vélingara Médina Gonasse
MbackéRufisque
Ndande
Mbour
Richard-Toll
Odienné
Séguéla
Daloa
Man
Voinjama
Tubmanburg GbarngaSanniquellie
Nzérékoré
Kankan
Faranah
Labé
Boké
Mamou
Kindia
Fatick
Diourbel
Thiès
Kaolack
Tambacounda
ZiguinchorKolda
Louga
Saint Louis
'Ayoûn�el 'Atroûs
KiffaNéma
Sélibaby
Kaédi
Aleg
Rosso
Tidjikja
Akjoujt
Kayes
Makeni
KenemaBo
Bafatá
Conakry
Dakar
Nouakchott
Banjul
BissauBamako
Freetown
Sénégal
Sén
égal
Ferlo
Falém
é
Bakoy
Bafing
Bafing
G am bie
Ga m
bie
Geb
a
C
orubal
Corubal
Konkouré
Tinkisso
Kouya
Milo D
ion
M ong o
Rokel
Bagbe
Moa
Meli
M
oro
Man
o
M
ano
Lofa S
assa
n dra
Bagoé
Bani
N iger
Little
Sca
rcies
N iger
Mount�Nimba�1752 m
Sankanbiaiwa�1709 m
Mt�Wutevem�1380 m
Bintimani�1945 m
1538 m
581 m
Goumbati�417 m
48 m
1250 m
1257 m
Pic de Tio�1443 m
Mts�LOMA
Mf�DU TAMGUÉ
FOUTA�DJALON
KAARTA
BAMBOUK
E LM R E Y
YÉ
A O U K Â R
¡ Ô Ø
AFOLLÉ
TAGÂNT
EL
'AÇÂBA
TRÂRZA
A K C H Â R
SENEGAL
COTE�D'IVOIRE
L I B E R I A
S I E R R A �
L E O N E
G U I N E E �B I S S A U
G U I N E E
M A L I
M A U R I T A N I E
G A M B I E
sovereign ratings
Longterm
Local Currency
Foreign Currency
s&P B B
2006 At a Glance
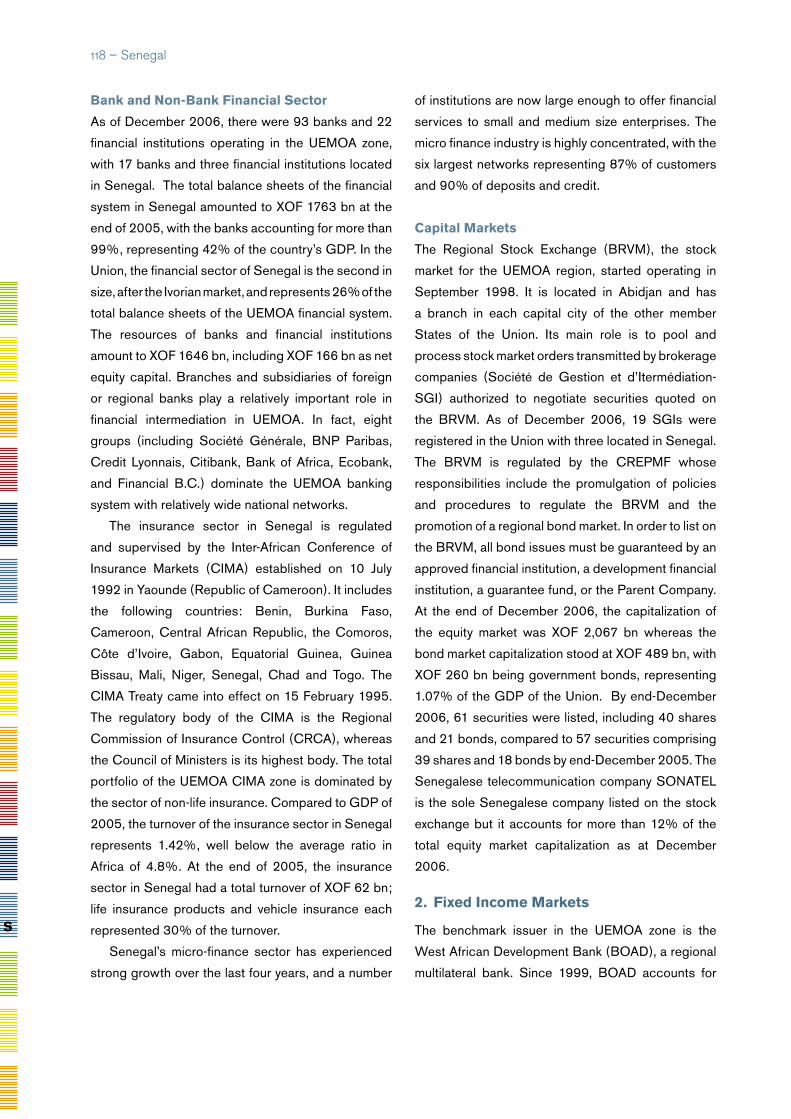
Bank and non-Bank Financial sector
As of December 2006, there were 93 banks and 22
financial institutions operating in the UEMOA zone,
with 17 banks and three financial institutions located
in Senegal. The total balance sheets of the financial
system in Senegal amounted to XOF 1763 bn at the
end of 2005, with the banks accounting for more than
99%, representing 42% of the country’s GDP. In the
Union, the financial sector of Senegal is the second in
size, after the Ivorian market, and represents 26% of the
total balance sheets of the UEMOA financial system.
The resources of banks and financial institutions
amount to XOF 1646 bn, including XOF 166 bn as net
equity capital. Branches and subsidiaries of foreign
or regional banks play a relatively important role in
financial intermediation in UEMOA. In fact, eight
groups (including Société Générale, BNP Paribas,
Credit Lyonnais, Citibank, Bank of Africa, Ecobank,
and Financial B.C.) dominate the UEMOA banking
system with relatively wide national networks.
The insurance sector in Senegal is regulated
and supervised by the Inter-African Conference of
Insurance Markets (CIMA) established on 10 July
1992 in Yaounde (Republic of Cameroon). It includes
the following countries: Benin, Burkina Faso,
Cameroon, Central African Republic, the Comoros,
Côte d’Ivoire, Gabon, Equatorial Guinea, Guinea
Bissau, Mali, Niger, Senegal, Chad and Togo. The
CIMA Treaty came into effect on 15 February 1995.
The regulatory body of the CIMA is the Regional
Commission of Insurance Control (CRCA), whereas
the Council of Ministers is its highest body. The total
portfolio of the UEMOA CIMA zone is dominated by
the sector of non-life insurance. Compared to GDP of
2005, the turnover of the insurance sector in Senegal
represents 1.42%, well below the average ratio in
Africa of 4.8%. At the end of 2005, the insurance
sector in Senegal had a total turnover of XOF 62 bn;
life insurance products and vehicle insurance each
represented 30% of the turnover.
Senegal’s micro-finance sector has experienced
strong growth over the last four years, and a number
of institutions are now large enough to offer financial
services to small and medium size enterprises. The
micro finance industry is highly concentrated, with the
six largest networks representing 87% of customers
and 90% of deposits and credit.
Capital Markets
The Regional Stock Exchange (BRVM), the stock
market for the UEMOA region, started operating in
September 1998. It is located in Abidjan and has
a branch in each capital city of the other member
States of the Union. Its main role is to pool and
process stock market orders transmitted by brokerage
companies (Société de Gestion et d’Itermédiation-
SGI) authorized to negotiate securities quoted on
the BRVM. As of December 2006, 19 SGIs were
registered in the Union with three located in Senegal.
The BRVM is regulated by the CREPMF whose
responsibilities include the promulgation of policies
and procedures to regulate the BRVM and the
promotion of a regional bond market. In order to list on
the BRVM, all bond issues must be guaranteed by an
approved financial institution, a development financial
institution, a guarantee fund, or the Parent Company.
At the end of December 2006, the capitalization of
the equity market was XOF 2,067 bn whereas the
bond market capitalization stood at XOF 489 bn, with
XOF 260 bn being government bonds, representing
1.07% of the GDP of the Union. By end-December
2006, 61 securities were listed, including 40 shares
and 21 bonds, compared to 57 securities comprising
39 shares and 18 bonds by end-December 2005. The
Senegalese telecommunication company SONATEL
is the sole Senegalese company listed on the stock
exchange but it accounts for more than 12% of the
total equity market capitalization as at December
2006.
2. Fixed income Markets
The benchmark issuer in the UEMOA zone is the
West African Development Bank (BOAD), a regional
multilateral bank. Since 1999, BOAD accounts for
11� – Senegal
s

Senegal – 11�
outstanding BoAd Bonds
titleFace Amount (XoF billion)
year of Listing
Frequency expiration date
Listed Bonds
BOAD 6,25% 1999-2009 20.12 1999 Annual 1-Feb-09
BOAD 6,30% 1999-2007 17.05 2000 Annual 27-Oct-07
BOAD 5.85% 2001-2008 11.95 2003 Annual 4-Jan-08
BOAD 5.35% 2004-2011 22.70 2005 Annual 5-Nov-11
BOAD 5% 2005-2013 18,60 2005 Annual 28-Dec-13
BOAD 4,5% 2005-2011 6,404 2005 Annual 28-Dec-11
Government treasury Bond
titleFace Amount (XoF billion)
year of Listing
Frequency expiration date
Listed Bonds
Etat du Senegal 5,5% 2005-2010 45.00 2005 Annual 25-Jul-10
close to 22% of all the public debt issues in the market, i.e. XOF 102 bn. In the absence of a government yield
curve, BOAD bonds are used as benchmarks.
Government securities
The Government has used treasury bills and bonds to
fund its deficit. As of December 2006, the Government
has XOF 51 bn outstanding in treasury bills. Out of
the total amount of outstanding public bonds listed
on the BRVM by the end of 2006, Senegal accounts
for XOF 45 bn, representing 9% of total bond market
capitalization and 17% of all outstanding government
bonds in the market. Compared to the country’s GDP
at the same period, sovereign bonds represent 1%.
non Government debt issuance
titleFace Amount (XoF billion)
year of Listing
Frequency expiration date
Listed Bonds
PAD 6.50% 2004-2011 30.00 2004 Annual 15-Jul-11
Private Placement Bonds
SENELEC 7.5% 2003-2008 15.00 2003 Semi-annual 3-Apr-08
ECOBANK SENEGAL 6% 2006-2011 5.00 2006 Annual 11-Aug-11
CORFITEX 7% 2005-2009 3.80 2005 Annual 15-Sept-09
CSI 6.75% 2005-2010 1.00 2006 Semi-annual 25-Apr-11
non-Central Government issuance
The CREPMF requires that corporate bonds be
guaranteed before they can be listed. This might be
one of the reasons why most of the corporate issues
are privately placed and remain unlisted.
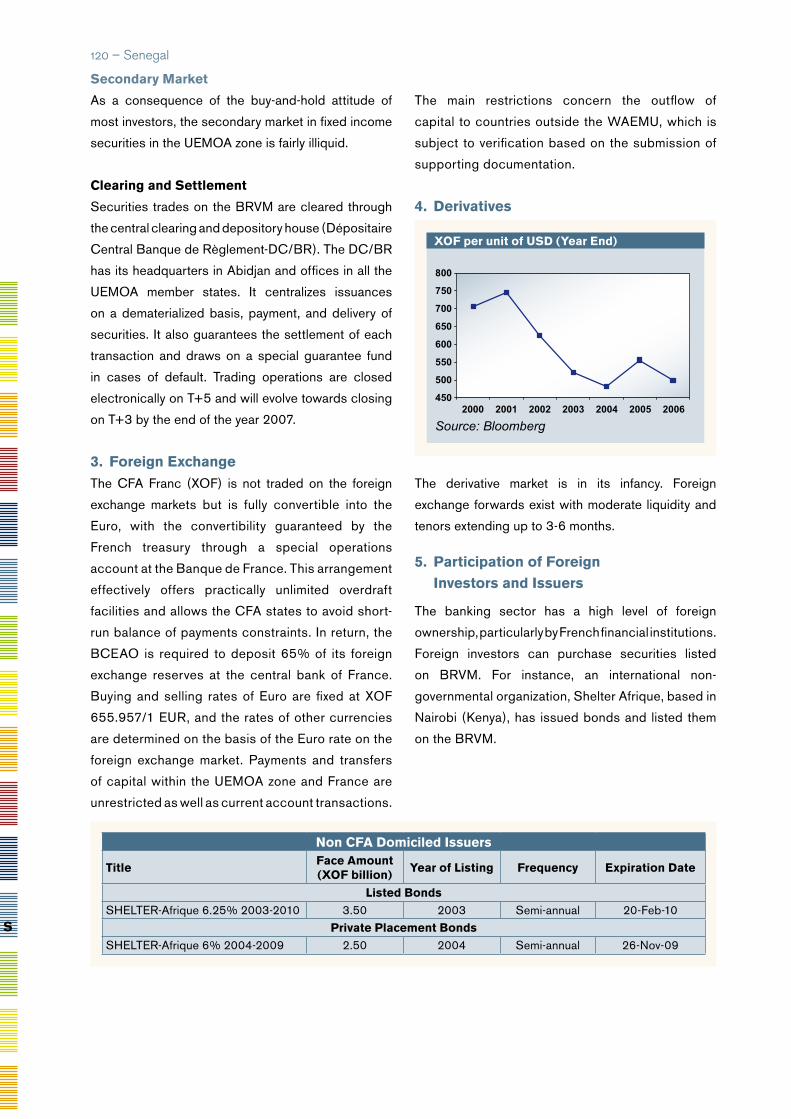
non CFA domiciled issuers
titleFace Amount (XoF billion)
year of Listing Frequency expiration date
Listed BondsSHELTER-Afrique 6.25% 2003-2010 3.50 2003 Semi-annual 20-Feb-10
Private Placement BondsSHELTER-Afrique 6% 2004-2009 2.50 2004 Semi-annual 26-Nov-09
secondary Market
As a consequence of the buy-and-hold attitude of
most investors, the secondary market in fixed income
securities in the UEMOA zone is fairly illiquid.
Clearing and settlement
Securities trades on the BRVM are cleared through
the central clearing and depository house (Dépositaire
Central Banque de Règlement-DC/BR). The DC/BR
has its headquarters in Abidjan and offices in all the
UEMOA member states. It centralizes issuances
on a dematerialized basis, payment, and delivery of
securities. It also guarantees the settlement of each
transaction and draws on a special guarantee fund
in cases of default. Trading operations are closed
electronically on T+5 and will evolve towards closing
on T+3 by the end of the year 2007.
3. Foreign exchange The CFA Franc (XOF) is not traded on the foreign
exchange markets but is fully convertible into the
Euro, with the convertibility guaranteed by the
French treasury through a special operations
account at the Banque de France. This arrangement
effectively offers practically unlimited overdraft
facilities and allows the CFA states to avoid short-
run balance of payments constraints. In return, the
BCEAO is required to deposit 65% of its foreign
exchange reserves at the central bank of France.
Buying and selling rates of Euro are fixed at XOF
655.957/1 EUR, and the rates of other currencies
are determined on the basis of the Euro rate on the
foreign exchange market. Payments and transfers
of capital within the UEMOA zone and France are
unrestricted as well as current account transactions.
The main restrictions concern the outflow of
capital to countries outside the WAEMU, which is
subject to verification based on the submission of
supporting documentation.
4. derivatives
The derivative market is in its infancy. Foreign
exchange forwards exist with moderate liquidity and
tenors extending up to 3-6 months.
5. Participation of Foreign investors and issuers
The banking sector has a high level of foreign
ownership, particularly by French financial institutions.
Foreign investors can purchase securities listed
on BRVM. For instance, an international non-
governmental organization, Shelter Afrique, based in
Nairobi (Kenya), has issued bonds and listed them
on the BRVM.
1�0 – Senegal
XoF per unit of usd (year end)
450
500
550
600
650
700
750
800
2000 2001 2002 2003 2004 2005 2006
Source: Bloomberg
s
– 1�1 Senegal – 1�1
7. Key Contacts
• Banque Centrale des Etats
de l’Afrique de l’Ouest
Mailing Address: BP 3159, Dakar, Senegal
Other Address: Boulevard du Général de
Gaulle/angle Rue 11, Dakar, Senegal
Tel: +221-8231330/8235384
Fax: +221-8235757
E-mail: [email protected]
Web: www.bceao.int
• Bourse Régionale des Valeurs Mobiliéres
Mailing Address: BP 3802,
Abidjan 01, Côte d’Ivoire
Other Address: 18, Avenue Joseph Anoma,
Rue des Banques, Abidjan, Côte d’Ivoire
Tel: +225-2032-6685
Fax: +225-2032-4777
E-mail: [email protected]
Web: www.brvm.org
6. investment taxation
Government securities are tax-exempt as opposed
to non-governmental securities that are subject to a
withholding tax (Impôt sur le Revenue des Valeurs
Mobilières-IRVM) applicable to income derived from
these securities. The tax rates are the following:
6% for interest income from bonds redeemable in
less than five years, 10% for dividends paid out by
listed stocks and 12-18% for income from any other
security.
1�� –
Population (mn) 0.08Population Growth (annual %) 0.9Official Language (s) Creole and FrenchCurrency Seychelles Rupee (SCR)GDP (Current US$ bn) 0.746GDP Growth (annual %) 4.5GDP Per Capita (US$) 9,172FDI, net inflows (US$ mn) (2005) 82.0External Debt (US$ mn) 400External Debt/GDP (%) 58.6CPI Inflation (annual %) -0.4Exports of goods and services (% of GDP) 114Gross Official Reserves (US$ bn) 0.076Gross Official Reserves (In months of imports) 1.6UNDP HDI RaNkING 47Source: AfDB, IMF, UNCTAD, UNDP, UN Population Division
1. overview of Financial system
Following an IMF recommendation in 2002 calling
for the development of a more modern legislation
reflecting international standards and best practice,
the Government in December 2004 enacted the
Central Bank of Seychelles Act and the Financial
Institutions Act (FIA) to create a more independent
central bank, and bring the legal framework in line
with the Basil core principles.
The Central Bank of Seychelles has responsibility
for monetary policy and its primary remit is to achieve
specific monetary and inflation targets. With the
country heavily dependent on imported consumer
goods, the usefulness of monetary policy is limited,
leaving the exchange rate as the main instrument
for curbing inflation. The main laws and regulations
governing the financial sector are: the Central Bank
of Seychelles Act of 1982, amended in 1986, 1999,
2001 and 2004; the Financial Institutions Act of 1984,
amended in 1995 and 2004; the Financial Institutions
Domestic and Non-Domestic Banking Business
Regulations of 1996; the Insurance Act of 1994;
the Seychelles International Business Authority Act,
1994; and the Anti-Money Laundering Act of 1996.
Bank and non-Bank Financial sector
The banking sector is dominated by state and
foreign institutions. The Seychelles Savings Bank
“a commercial bank” is fully state-owned; the state
has a majority share in Nuovobanq (78% state and
22% by Standard Chartered Bank of the UK), and
the three other commercial banks (Banque Française
Commerciale, Habib Bank, and Bank of Baroda) are
branches of foreign banks, headquartered respectively
in Reunion, Pakistan, and India. Barclays Bank has
recently converted from a foreign branch to a foreign
subsidiary. The Development Bank of Seychelles is
55.5% owned by the Government and the remainder
by international institutions and a commercial bank.
The Seychelles Housing Development Corporation is
a parastatal institution and falls under the Ministry of
Finance and the Ministry of Land Use and Habitat.
Seychelles
sovereign ratings
Longterm
Local Currency
Foreign Currency
s&P - B
1�� – Seychelles
s
2006 At a Glance
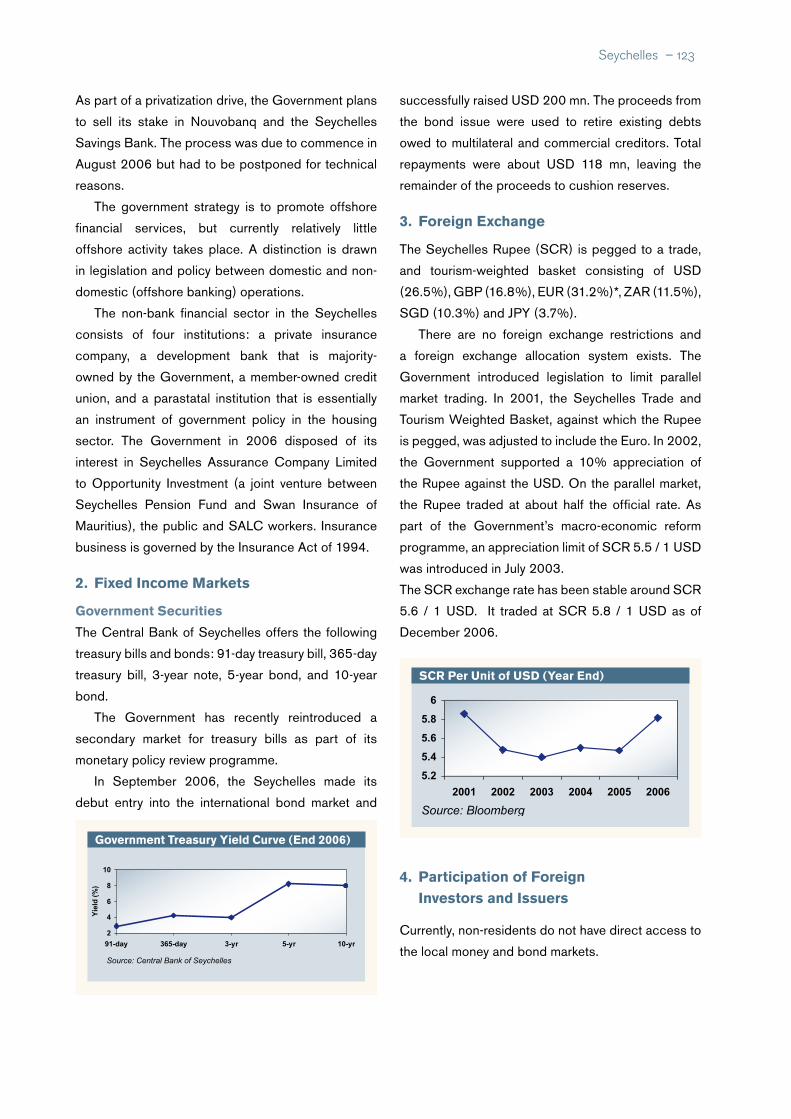
Seychelles – 1��
As part of a privatization drive, the Government plans
to sell its stake in Nouvobanq and the Seychelles
Savings Bank. The process was due to commence in
August 2006 but had to be postponed for technical
reasons.
The government strategy is to promote offshore
financial services, but currently relatively little
offshore activity takes place. A distinction is drawn
in legislation and policy between domestic and non-
domestic (offshore banking) operations.
The non-bank financial sector in the Seychelles
consists of four institutions: a private insurance
company, a development bank that is majority-
owned by the Government, a member-owned credit
union, and a parastatal institution that is essentially
an instrument of government policy in the housing
sector. The Government in 2006 disposed of its
interest in Seychelles Assurance Company Limited
to Opportunity Investment (a joint venture between
Seychelles Pension Fund and Swan Insurance of
Mauritius), the public and SALC workers. Insurance
business is governed by the Insurance Act of 1994.
2. Fixed income Markets
Government securities
The Central Bank of Seychelles offers the following
treasury bills and bonds: 91-day treasury bill, 365-day
treasury bill, 3-year note, 5-year bond, and 10-year
bond.
The Government has recently reintroduced a
secondary market for treasury bills as part of its
monetary policy review programme.
In September 2006, the Seychelles made its
debut entry into the international bond market and
successfully raised USD 200 mn. The proceeds from
the bond issue were used to retire existing debts
owed to multilateral and commercial creditors. Total
repayments were about USD 118 mn, leaving the
remainder of the proceeds to cushion reserves.
3. Foreign exchange
The Seychelles Rupee (SCR) is pegged to a trade,
and tourism-weighted basket consisting of USD
(26.5%), GBP (16.8%), EUR (31.2%)*, ZAR (11.5%),
SGD (10.3%) and JPY (3.7%).
There are no foreign exchange restrictions and
a foreign exchange allocation system exists. The
Government introduced legislation to limit parallel
market trading. In 2001, the Seychelles Trade and
Tourism Weighted Basket, against which the Rupee
is pegged, was adjusted to include the Euro. In 2002,
the Government supported a 10% appreciation of
the Rupee against the USD. On the parallel market,
the Rupee traded at about half the official rate. As
part of the Government’s macro-economic reform
programme, an appreciation limit of SCR 5.5 / 1 USD
was introduced in July 2003.
The SCR exchange rate has been stable around SCR
5.6 / 1 USD. It traded at SCR 5.8 / 1 USD as of
December 2006.
Government treasury yield Curve (end 2006)
2
4
6
8
10
91-day 365-day 3-yr 5-yr 10-yr
Yie
ld (
%)
Source: Central Bank of Seychelles
sCr Per unit of usd (year end)
5.2
5.4
5.6
5.8
6
2001 2002 2003 2004 2005 2006
Source: Bloomberg
4. Participation of Foreign investors and issuers
Currently, non-residents do not have direct access to
the local money and bond markets.

6. Key Contacts
• Central Bank of Seychelles
Mailing Address: P.O. Box 701,
Victoria, Mahé, Seychelles
Other Address: Independence Avenue,
Victoria, Mahé, Seychelles
Tel: +248-225200
Fax: +248-224958
E-mail: [email protected]
Web: www.cbs.sc
5. investment taxation
Resident, non resident and non corporate entities
are liable to pay tax on their income derived from
the Seychelles. The following rates apply: 15% on
dividends paid to non residents; 10% on interest
paid to non-residents other than financial institutions
(for whom a nil rate applies); and 40% on interest
payments by a Seychelles financial institution at
maturity of a bearer security issued by that institution.
However, entities with offshore status or in the
international trade zone do have tax privileges.
1�� – Seychelles
s

Seychelles – 1��
Population (mn) 5.7Population Growth (annual %) 2.7Official Language EnglishCurrency Leone (SLL)GDP (Current US$ bn) 1.5GDP Growth (annual %) 7.4GDP Per Capita (US$) 257FDI, net inflows (US$ mn) (2005) 27.2 External Debt (US$ mn) 0.6External Debt/GDP (%) 44.4CPI Inflation (annual %) 9.5Exports of goods and services (% of GDP) 27.4Gross Official Reserves (US $ billion) 0.17Gross Official Reserves (in month of imports) 5.1UNDP HDI RaNkING 176Source: AfDB, IMF, UNCTAD, UNDP, UN Population Division
1. overview of Financial system
With the return of peace in 2002, a viable financial
sector is beginning to re-emerge in Sierra Leone. The
financial system consists mainly of the banking and
insurance sectors, each having a separate regulatory
authority and supervisory body. The central bank,
the Bank of Sierra Leone (BSL), regulates and
supervises the activities of commercial banks and
other financial institutions to ensure the health of
the financial system. It is the banker and adviser to
the Government on financial and economic matters
and maintains the external and internal value of the
national currency, the Leone.
The BSL implements the monetary policy and its
objective is to achieve a low and stable rate of inflation
consistent with sustained economic growth and
financial stability. In 2006, the central bank’s capacity
for open markets operations was constrained by the
non-availability of government securities, and had to
be supplemented by the sale of foreign currency.
Sierra Leone
GEOATLAS - Copyright1998 Graphi-Ogre0 km 100 200 300 400 km
Cap des�Palmes
Cap Mesurado
Ile SherbroPointe Manna
Cap ShillingBaie�Yawri
Iles Turtle
Iles Tristao
Ile de Jeta
Cap Roxo
Cap Ste-Marie
Cap Vert
Orango�Grande
Baie du Sino
Baie du Cestos
C O T ED E L 'I V O I R E
COTEDES
GR A IN E S
ARCHIPEL DES BIJAGÓS
CanaldeG êba
PETITECO
TE
O C E A N �
A T L A N T I Q U E �
�
KorhogoOdienné
SéguélaBouaké
San-Pédro
Bouaflé
Divo
Dimbokro
Agboville
Daloa
Man
Harper
Voinjama
Barclayville
Greenville
RobertsportTubmanburg
Bensonville Kakata
Gbarnga
Buchanan
Sanniquellie
River Cess
Zwedru
Bobo�Dioulasso
Nzérékoré
Kankan
Faranah
Labé
Boké
Mamou
Kindia
Fatick
Diourbel
Thiès
Kaolack
Tambacounda
ZiguinchorKolda
Louga
Saint Louis
'Ayoûn�el 'Atroûs
KiffaNéma
Sélibaby
Kaédi
Aleg
Rosso
Kayes
Sikasso
Ségou
Mopti
Makeni
KenemaBo
Monrovia
Yamoussoukro
Abidjan
Conakry
Dakar
Banjul
BissauBamako
FreetownPort Loko�
� Magburaka
Kabala
KoinduMoyamba
Gbangbatok
Sénégal
Sén
égal
Ferlo
Falém
é
Bakoy
Bafing
Bafing
G am bie
Ga m
bie
Geb
a
C
orubal
Corubal
Konkouré
Tinkisso
Kouya
Milo D
ion
M ong o
Rokel
Bagbe
Moa
Meli
M
oro
Man
o
M
ano
Lofa
SaintPa
ul
C estos
Nuon
Cavally
D ube
Sassa
n dra
Sassandra
Bandamarouge
Ba nd
ama
Nzi
Bandam
aBlanc
Nzi
Komoé
Léra
ba
Bagoé
Bani
Ba
ni
N iger
Little
Sca
rcies
N iger
Mount�Nimba�1752 m
Sankanbiaiwa�1709 m
Mt�Wuteve�1380 m
Bintimani�1945 m
1115 m
Mount�Kavendou�1421 m
1245 m
1538 m
581 m
262 m
1250 m
1117 m
1108 m
1257 m
Pic de Tio�1443 m
Mts
DUTOU RA
Mts�PUTU
Mts BO
NGMts
KPO
Mts�LOMA
Mf�DU TAMGUÉ
FOUTA�DJALON
KAARTA
BAMBOUK
I R Î G U I
¡ Ô Ø
AFOLLÉ
EL
'AÇÂBA
C O T E D ' I V O I R E
L I B E R I A
G U I N E E
G U I N E E �B I S S A U
S E N E G A L
M A L I
M A U R I T A N I E
G A M B I E
B U R K I N A �F A S O
SIERRA LEONE
non-Bank Financial sector
Eight commercial banks operate in the country, 4
community banks, 2 discount houses and 51 foreign
exchange bureaux; all are under the supervision of
the central bank. Community banks primarily service
the rural areas and provide micro-finance loans.
The minimum capital requirements for all licensed
financial institutions have been increased to ensure
a safer and stable financial system. For example,
the minimum paid-up capital for banks has been
increased from SLL 800 mn to SLL 15 bn on a
graduated basis.
The Sierra Leone Insurance Commission regulates
the insurance sector. There are some nine registered
insurance companies. Supervision of the sector is
carried out by the Commissioner of Insurance within
the Department of Finance.
2006 At a Glance
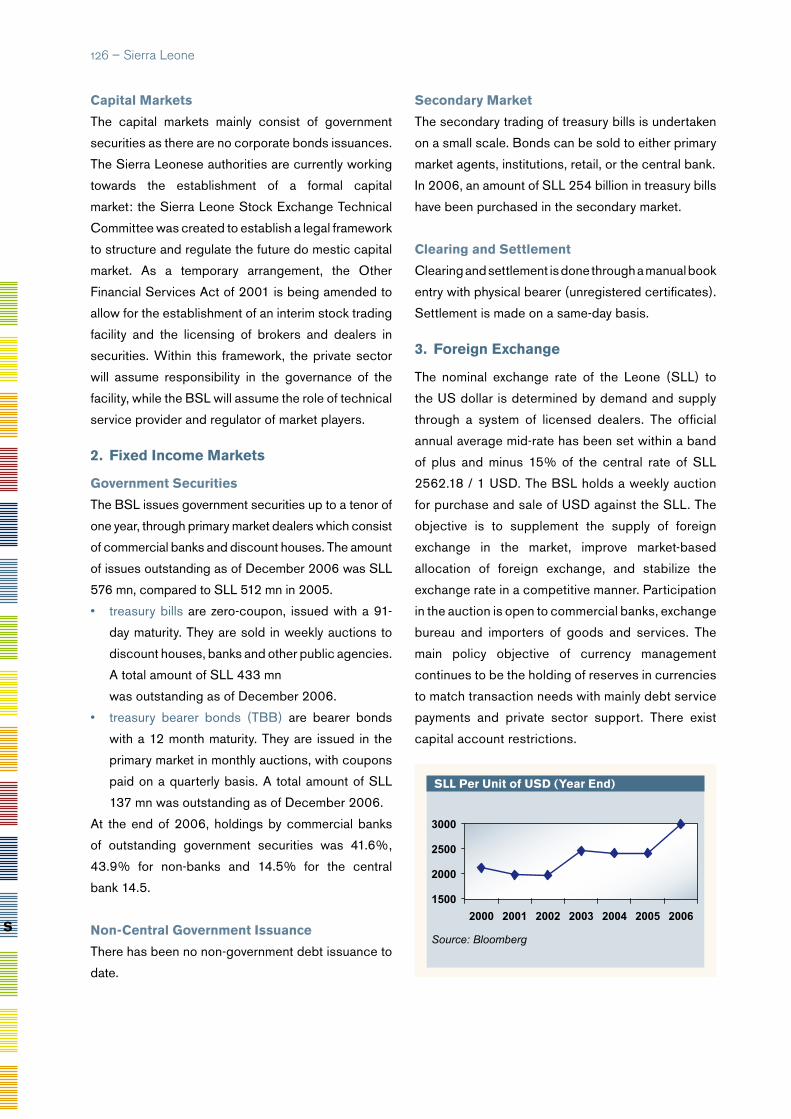
Capital Markets
The capital markets mainly consist of government
securities as there are no corporate bonds issuances.
The Sierra Leonese authorities are currently working
towards the establishment of a formal capital
market: the Sierra Leone Stock Exchange Technical
Committee was created to establish a legal framework
to structure and regulate the future do mestic capital
market. As a temporary arrangement, the Other
Financial Services Act of 2001 is being amended to
allow for the establishment of an interim stock trading
facility and the licensing of brokers and dealers in
securities. Within this framework, the private sector
will assume responsibility in the governance of the
facility, while the BSL will assume the role of technical
service provider and regulator of market players.
2. Fixed income Markets
Government securities
The BSL issues government securities up to a tenor of
one year, through primary market dealers which consist
of commercial banks and discount houses. The amount
of issues outstanding as of December 2006 was SLL
576 mn, compared to SLL 512 mn in 2005.
• treasury bills are zero-coupon, issued with a 91-
day maturity. They are sold in weekly auctions to
discount houses, banks and other public agencies.
A total amount of SLL 433 mn
was outstanding as of December 2006.
• treasury bearer bonds (TBB) are bearer bonds
with a 12 month maturity. They are issued in the
primary market in monthly auctions, with coupons
paid on a quarterly basis. A total amount of SLL
137 mn was outstanding as of December 2006.
At the end of 2006, holdings by commercial banks
of outstanding government securities was 41.6%,
43.9% for non-banks and 14.5% for the central
bank 14.5.
non-Central Government issuance
There has been no non-government debt issuance to
date.
secondary Market
The secondary trading of treasury bills is undertaken
on a small scale. Bonds can be sold to either primary
market agents, institutions, retail, or the central bank.
In 2006, an amount of SLL 254 billion in treasury bills
have been purchased in the secondary market.
Clearing and settlement
Clearing and settlement is done through a manual book
entry with physical bearer (unregistered certificates).
Settlement is made on a same-day basis.
3. Foreign exchange
The nominal exchange rate of the Leone (SLL) to
the US dollar is determined by demand and supply
through a system of licensed dealers. The official
annual average mid-rate has been set within a band
of plus and minus 15% of the central rate of SLL
2562.18 / 1 USD. The BSL holds a weekly auction
for purchase and sale of USD against the SLL. The
objective is to supplement the supply of foreign
exchange in the market, improve market-based
allocation of foreign exchange, and stabilize the
exchange rate in a competitive manner. Participation
in the auction is open to commercial banks, exchange
bureau and importers of goods and services. The
main policy objective of currency management
continues to be the holding of reserves in currencies
to match transaction needs with mainly debt service
payments and private sector support. There exist
capital account restrictions.
1�� – Sierra Leone
sLL Per unit of usd (year end)
Source: Bloomberg
1500
2000
2500
3000
2000 2001 2002 2003 2004 2005 2006s
Sierra Leone – 1��
4. Participation of Foreign investors and issuers
Foreigners are not authorized to invest in government
securities.
5. investment taxation
There is a withholding tax at 15%; tax treaties have
been concluded with Norway, South Africa and the
United Kingdom.
6. Key Contacts
• Bank of Sierra Leone
Siaka Stevens Street, Freetown, Sierra Leone
Tel: +232-22-226501
Fax: +232-22-224764
E-mail: [email protected]
Web: www.bankofsierraleone-centralbank.org
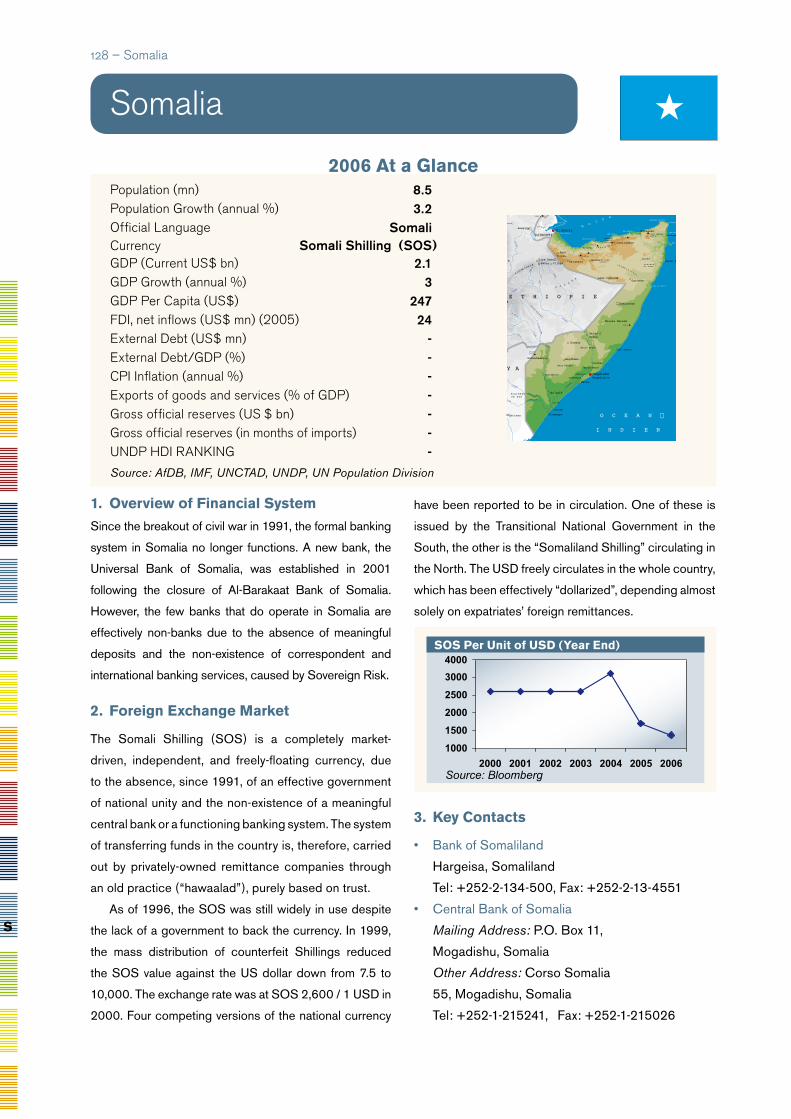
Population (mn) 8.5Population Growth (annual %) 3.2Official Language SomaliCurrency Somali Shilling (SOS)GDP (Current US$ bn) 2.1GDP Growth (annual %) 3GDP Per Capita (US$) 247FDI, net inflows (US$ mn) (2005) 24 External Debt (US$ mn) -External Debt/GDP (%) -CPI Inflation (annual %) -Exports of goods and services (% of GDP) -Gross official reserves (US $ bn) -Gross official reserves (in months of imports) -UNDP HDI RaNkING -
1. overview of Financial system
Since the breakout of civil war in 1991, the formal banking
system in Somalia no longer functions. A new bank, the
Universal Bank of Somalia, was established in 2001
following the closure of Al-Barakaat Bank of Somalia.
However, the few banks that do operate in Somalia are
effectively non-banks due to the absence of meaningful
deposits and the non-existence of correspondent and
international banking services, caused by Sovereign Risk.
2. Foreign exchange Market
The Somali Shilling (SOS) is a completely market-
driven, independent, and freely-floating currency, due
to the absence, since 1991, of an effective government
of national unity and the non-existence of a meaningful
central bank or a functioning banking system. The system
of transferring funds in the country is, therefore, carried
out by privately-owned remittance companies through
an old practice (“hawaalad”), purely based on trust.
As of 1996, the SOS was still widely in use despite
the lack of a government to back the currency. In 1999,
the mass distribution of counterfeit Shillings reduced
the SOS value against the US dollar down from 7.5 to
10,000. The exchange rate was at SOS 2,600 / 1 USD in
2000. Four competing versions of the national currency
Somalia
have been reported to be in circulation. One of these is
issued by the Transitional National Government in the
South, the other is the “Somaliland Shilling” circulating in
the North. The USD freely circulates in the whole country,
which has been effectively “dollarized”, depending almost
solely on expatriates’ foreign remittances.
3. Key Contacts
• Bank of Somaliland
Hargeisa, Somaliland
Tel: +252-2-134-500, Fax: +252-2-13-4551
• Central Bank of Somalia
Mailing Address: P.O. Box 11,
Mogadishu, Somalia
Other Address: Corso Somalia
55, Mogadishu, Somalia
Tel: +252-1-215241, Fax: +252-1-215026
GEOATLAS - Copyright1998 Graphi-Ogre0 km 100 200 300 400 km
O C E A N �
I N D I E N
Ile Manda
Ile Pate
Baie Ungama
Ras Ngomeni
Ile Erua
Ile Haleb
Ras Maskan
Ras Bir
Ras Khaanziir
Cap Sura
Ras Adado
Raasiga CaluulaCaseyr
Ras Binnah
Ras Hafun
Ras el Cheil
Canalde M itsiw a
Détroitde B$b
elM andeb
Go
lf
e
d'
Ad
en
Golfe de
Tadjour
a
M E R �R O U G E
Muqdisho�Mogadiscio
Asmera�Asmara
Djibouti
Adis Abeba�Addis Abeba
Baardheere
Jamaame
Awdheegle
Afgooye
Jilib
Bender Beyla
Buur HakabaWanle Weyne
Buulo Berde
Boorama
Berbera
Qardho
Baargaal
Ceel Dheere
Garissa
Marka
Bu'aale
Kismaayo
Asayita
Mekele
Dire Dawa�� Harer Jijiga
Awasa
Beled �Weyne
Baki
Hargeysa Burco
Laas Caanood
Ceerigaabo
Boosaaso
Garoowe
Gaalkacyo
Dhuusa Mareeb
Xuddur
Garbahaarrey BaydhaboJowhar
Mendefera Adi Keyih
Aseb
Mitsiwa
Mombasa
Lac�Abaya
Lac�Awasa
Lac�Shala
Lac�Ziway
Tekeze
Jem a
Awash
D aw
a
D aua
Genale
Wabe
Gestro
Jubba
G
enale
Welm el
Shebe
le
Shebele
Shabeelle
Fafen
Ramis
Erer
N ilBleu
G alana
Tana
Ta na
Lach Dera
Lak
D era
Lach Biss igh
Lak Bor Shab
eelle
2210 m
116 m
155 m
Ras Dashen Terara�4620 m
Moussa Ali�2063 m
Guna�4231 m
Abune Yosef�4190 m
1988 m2002 m
Monte Bahaia�2200 m
378 m
Finno�784 m
1535 m
1829 mShimber�
Berris�2407 m
Batu�4307 m
P L A I N E S �D E B U N
PLATEAU DE YATTA
DESERT
DANAKIL
P L A T E A U �
E T H I O P I E N
M ON T
S A HM A R
O G A
D
EN
MENDEBO
AUDO
RANGE
M O N TS O G O
P L A I N E �S A R A R
P L A T E A U �D U S A W L
V A LLEED E N O G
AL
SOMALIE
K E N Y A
E T H I O P I E
P E N I N S U L E �A R A B I Q U E �
Asie
DJIBOUTI
ERYTHREE
sos Per unit of usd (year end)
1000
1500
2000
2500
3000
2000 2001 2002 2003 2004 2005 2006Source: Bloomberg
4000
1�� – Somalia
s
2006 At a Glance
Source: AfDB, IMF, UNCTAD, UNDP, UN Population Division
South Africa – 1��
Population (mn) 47.6Population Growth (annual %) 0.3Official Language (s) 11 including English & AfrikaansCurrency Rand (ZAR)GDP (Current US$ bn) 251GDP Growth (annual %) 5.0GDP Per Capita (US$) 5,275FDI, net inflows (US$ mn) (2005) 6,379External Debt (US$ mn) 48,200External Debt/GDP (%) 19.3CPI Inflation (annual %) 4.9Exports of goods and services (% of GDP) 27.7Gross Official Reserves (US$ bn) 23.787Gross Official Reserves (In months of imports) 4.5UNDP HDI RaNkING 121Source: AfDB, IMF, UNCTAD, UNDP, UN Population Division
1. overview of Financial system
South Africa’s financial system is by far the most
advanced in Africa. The system is sound and well
regulated. The sector is one of the largest and
most deregulated within the emerging markets, with
sophisticated banking, bond and insurance markets
accounting for 20% of GDP and 220.000 jobs in
total.
Recent government policy in this sector has
revolved around the implementation of the Financial
Services Charter, which aims to bring development
issues within black communities into the focus of the
financial services industry and the Financial Intelligence
Centre Act, which requires increased reporting from
all financial services companies, and the removal of
certain foreign exchange restrictions with a view to
liberalize the existing exchange-control regime.
The South African Reserve Bank (SARB) is
the central bank of the Republic of South Africa
(RSA). It considers its overarching objective in the
country’s economic system as the achievement and
maintenance of price stability.
South africa
GEOATLAS - Copyright1998 Graphi-Ogre0 km 100 200 300 400 km
O C E A N �
A T L A N T I Q U E
Cap de Bonne-Espérance
Cap des Aiguilles
Cape Seal
Kaap InfanteCap St-Francis
Cap St-Lucia
Baie Algoa
Richard's Bay
Quoin Point
Cap Danger
Ilhea Point
Diaz Point
Cap Columbine
Walvis Bay
Sandwich Bay
Conception Bay
Meobbaai
Hottentotbaai
Elizabeth Bay
Baie de�Ste-Hélène
Saldanhabaai
Baie de�la Table
Valsbaai
WILD COAST
O C E A N �
I N D I E N
Gaborone
Mbabane
Maseru
Pretoria
Windhoek
Maputo
MiddelburgWitbank
Soweto
GermistonCarletonville
VereenigingNigel
Springs
Benoni
PotchefstroomStilfontein
KlerksdorpSasolburg
Bethlehem
KroonstadOdendaalsrus
Welkom
Virginia
Ladysmith
Edendale Durban
Upington
Umtata
East London
Queenstown
Grahamstown
Port Elizabeth
Uitenhage
Oudtshoorn
StrandStellenbosch
Worcester
PaarlBellville
Pietersburg
NelspruitJohannesburgMmabatho
Bloemfontein
Pietermaritzburg
Kimberley
Bisho
Kaapstad
GobabisSwakopmund
Mariental
Keetmanshoop
Molepolole
Ghanzi
Serowe
Mochudi
Kanye
TshabongXai-Xai
Lac�Sainte�Lucia
Save
Lundi
Changa
ne
Lim
popo
Lim popo
Limpopo
Marico
Krokodil
Mokolo
Mogalakw
ena
O lifants
G root-Letaba
Krokodil
Kom ati Incom
ati
V aalV aal
V
aa
l
Goorits
O lifants
Breë
Groot-Berg
Olifa
nts
D oring
Doring
O ngeluks
Sou
t
Vis
Riet
Vis
Buffels
Hartbees
O range
O range
Fish Kainab M
olopo
M olopo
M olop
oA uob
Auob
Olifants
N osop
Nossob
Nossob
Black N ossob
Shash e Nuanetsi
Brak
Harts
Riet
Riet
M odder
C aledon
G root-Kei
G root-V isG root
Pongolo
Orange
2085 m
Kompasberg�2504 m
1614 m
Bontberg�1922 m
1672 m
1350 m
1706 m
2026 m
2076 m
2369 m
Stormberg�2099 m
Benderge�2770 m
2224 m
Makoaneng�3416 m
Thabana-�Ntlenyana�3482 m
Enjesuthi�3446 mMachache�
2886 m
Monts�aux Sources�3299 m
Witkoppies�2336 m
2275 m
Die Berg�2331 m
2126 m2088 m
Pilanesberg�1669 m
Gakarosa�1855 mToto�
1232 m
Emlembe�1862 m
Vaalkop�2168 m
2325 m
1758 m
PETIT K A RRO O
G R AN D
K AR R
O O
DRA
KE N
S
BERG
L A N G E B E R G
W IN TERBERG E
D
R
A
KE
NS
BE
R
GW A TERBERG
E
W I T W A T E R S R A N T
KAAP
PLA
TO
LANGEBERGE
B OPH
U TH A
TSW
A NA
MO
NT
SL
EB
OM
BO
D E S E R T ���
D U ���
K A L A H A R I
GROOT�
KARASBERGE
HUNSBERGE
HUIB-HO
CHPLA
TEAU
SCHWARZRAND
D A M A R A L A N D
KHOM AS
HOCH
LAN D
N A M A Q U A L A N D
DE
SE
RT
DU
NA
MI
B
N A M I B I E
B O T S W A N A
Z I M B A B W E
LE S O T H O
SWAZILAND
M O Z A M B I Q U E
AFRIQUE DU SUD
sovereign ratings
Longterm
Local Currency
Foreign Currency
Fitch A BBB+
s&P A+ BBB+
Bank and non-bank financial sector
The banking sector in South Africa is well developed
but concentrated, with the five largest commercial
banks - Standard Bank of South Africa, Nedbank,
Amalgamated Banks of South Africa (ABSA, now
majority-owned by Barclays Plc), First Rand Bank
and Investec Bank - holding over 86% of the banking
sector’s assets. There are 18 registered banks, two
registered mutual banks, 15 registered branches
of international banks with combined assets of
approximately ZAR 2 trillion. The sector also has some
1,354 micro-finance institutions. Commercial banks
are supervised by the SARB, whereas other financial
institutions and the financial market fall under the
supervision of the Financial Services Board (FSB).
There is a trend towards closer co-operation with the
insurance sector, with alliances developing between
the major banks and insurance companies. Foreign
participation in South Africa’s banking sector is
concentrated in corporate and investment banking.
2006 At a Glance

South Africa’s insurance sector is also well-
capitalized, and includes both short-term insurers
(vehicle, property and travel insurance) and long-term
insurers (health, life and disability insurance). As of
December 2006, there were 107 short-term and 79
long-term insurance firms, as well as 6 reinsurance
firms. The sector is regulated by the FSB, which is
also in charge of supervising capital markets and
pensions.
Capital Markets
Capital markets in South Africa are centered around
the Johannesburg Securities Exchange (JSE), the
largest and most developed exchange in Africa, the
South African Futures Exchange (SAFEX), which
trades agricultural and financial derivatives, and more
recently the Alternative Exchange (Alt X), which serves
as the market for small to medium-sized companies
and runs parallel to the main exchange. The Alt X has
listed 34 companies in a variety of sectors since its
inception in 2003. The main attraction of the Alt X is its
ability to provide small and medium-sized companies
with a platform to access financial resources on very
competitive terms. The Alt X market currently has a
market capitalization of over ZAR 5 bn.
The JSE began to implement changes in January
2002 to improve its global competitiveness. As
part of these reforms, the exchange entered into
an alliance with the LSE and replaced its trading
system with the SETS system hosted by the LSE.
It subsequently dematerialised and migrated to the
STRATE environment with guaranteed T+5 settlement
for all JSE main board trades. The JSE remains highly
concentrated, with just 70 stocks accounting for over
80% of its market capitalization. The market rose by 38
% in 2006 to end the year with a market capitalization
in excess of USD 700 bn. Foreigners invested a net
value of ZAR 73.3 bn in South African securities in
2006. The World Federation of Exchanges in 2006
ranked the JSE as the 16th largest exchange in the
world by capitalization. As at October 2006, there
were 380 companies listed on the JSE.
There also exists a separate bond exchange, the
Bond Exchange of South Africa (BESA), which is an
independent and self-regulatory financial exchange
operating under a licence granted by the securities
market regulator, the FSB. BESA has responsibility
for regulating all bond market activity in instruments
that are listed on the exchange. Securities are issued
by central and local government, parastatals and
major corporations. The securities listed by BESA
include: fixed-interest bearing bonds with a single
redemption date, fixed-interest bonds with multiple
redemption dates, zero-coupon bonds, and variable-
interest rate bonds including inflation-linked. As at
December 2006, 754 bonds issued by 91 sovereign
and corporate entities, with a nominal value of ZAR
737 bn, were listed. Participation by corporates has
increased significantly over the last five years, with
approximately ZAR 210 bn in issue at the end of
2006 covering various structural types. The BESA
has a Guarantee Fund to protect and compensate
participants for any market-movement losses arising
from a trading default. As at 31 December 2006
no claim on the Fund had been lodged with BESA.
BESA currently has 55 firms (three brokers and 52
trading firms) who are authorised to deal in listed
instruments.
While South Africa’s position as having the most
developed financial system in Africa makes it a
potentially attractive target for financial corruption, the
country has taken steps to reduce money laundering
activity. In 2003, South Africa became the first African
member of the Financial Action Task Force and also
joined the Eastern and Southern Africa Anti-Money
Laundering Group.
The Financial Services Board is responsible for
overseeing the regulation of the financial markets
such as the JSE and all financial institutions (insurers,
brokers). This, however, excludes banking institutions,
which fall directly under the responsibility of the South
African Reserve Bank. Key legislation affecting the
securities industry includes:
1�0 – South Africa
s
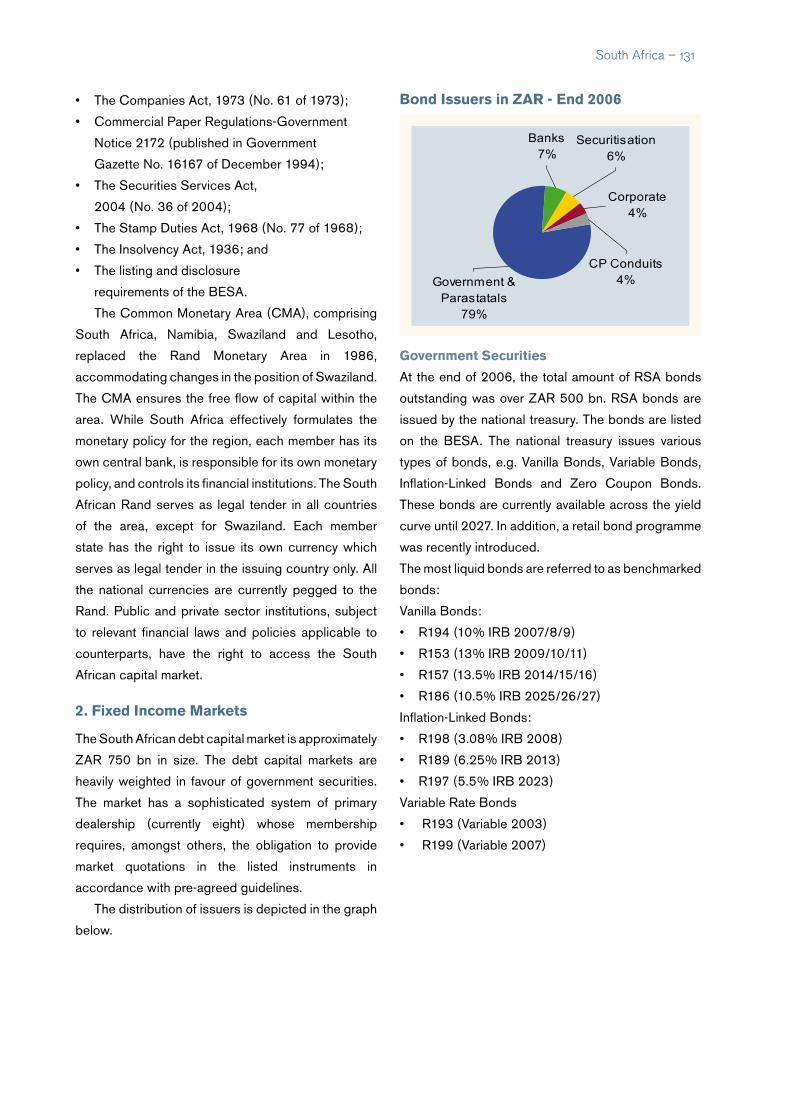
• The Companies Act, 1973 (No. 61 of 1973);
• Commercial Paper Regulations-Government
Notice 2172 (published in Government
Gazette No. 16167 of December 1994);
• The Securities Services Act,
2004 (No. 36 of 2004);
• The Stamp Duties Act, 1968 (No. 77 of 1968);
• The Insolvency Act, 1936; and
• The listing and disclosure
requirements of the BESA.
The Common Monetary Area (CMA), comprising
South Africa, Namibia, Swaziland and Lesotho,
replaced the Rand Monetary Area in 1986,
accommodating changes in the position of Swaziland.
The CMA ensures the free flow of capital within the
area. While South Africa effectively formulates the
monetary policy for the region, each member has its
own central bank, is responsible for its own monetary
policy, and controls its financial institutions. The South
African Rand serves as legal tender in all countries
of the area, except for Swaziland. Each member
state has the right to issue its own currency which
serves as legal tender in the issuing country only. All
the national currencies are currently pegged to the
Rand. Public and private sector institutions, subject
to relevant financial laws and policies applicable to
counterparts, have the right to access the South
African capital market.
2. Fixed income Markets
The South African debt capital market is approximately
ZAR 750 bn in size. The debt capital markets are
heavily weighted in favour of government securities.
The market has a sophisticated system of primary
dealership (currently eight) whose membership
requires, amongst others, the obligation to provide
market quotations in the listed instruments in
accordance with pre-agreed guidelines.
The distribution of issuers is depicted in the graph
below.
Government securities
At the end of 2006, the total amount of RSA bonds
outstanding was over ZAR 500 bn. RSA bonds are
issued by the national treasury. The bonds are listed
on the BESA. The national treasury issues various
types of bonds, e.g. Vanilla Bonds, Variable Bonds,
Inflation-Linked Bonds and Zero Coupon Bonds.
These bonds are currently available across the yield
curve until 2027. In addition, a retail bond programme
was recently introduced.
The most liquid bonds are referred to as benchmarked
bonds:
Vanilla Bonds:
• R194 (10% IRB 2007/8/9)
• R153 (13% IRB 2009/10/11)
• R157 (13.5% IRB 2014/15/16)
• R186 (10.5% IRB 2025/26/27)
Inflation-Linked Bonds:
• R198 (3.08% IRB 2008)
• R189 (6.25% IRB 2013)
• R197 (5.5% IRB 2023)
Variable Rate Bonds
• R193 (Variable 2003)
• R199 (Variable 2007)
Securitisation6%
Corporate4%
CP Conduits4%
Banks7%
Government & Parastatals
79%
South Africa – 1�1
Bond issuers in ZAr - end 2006
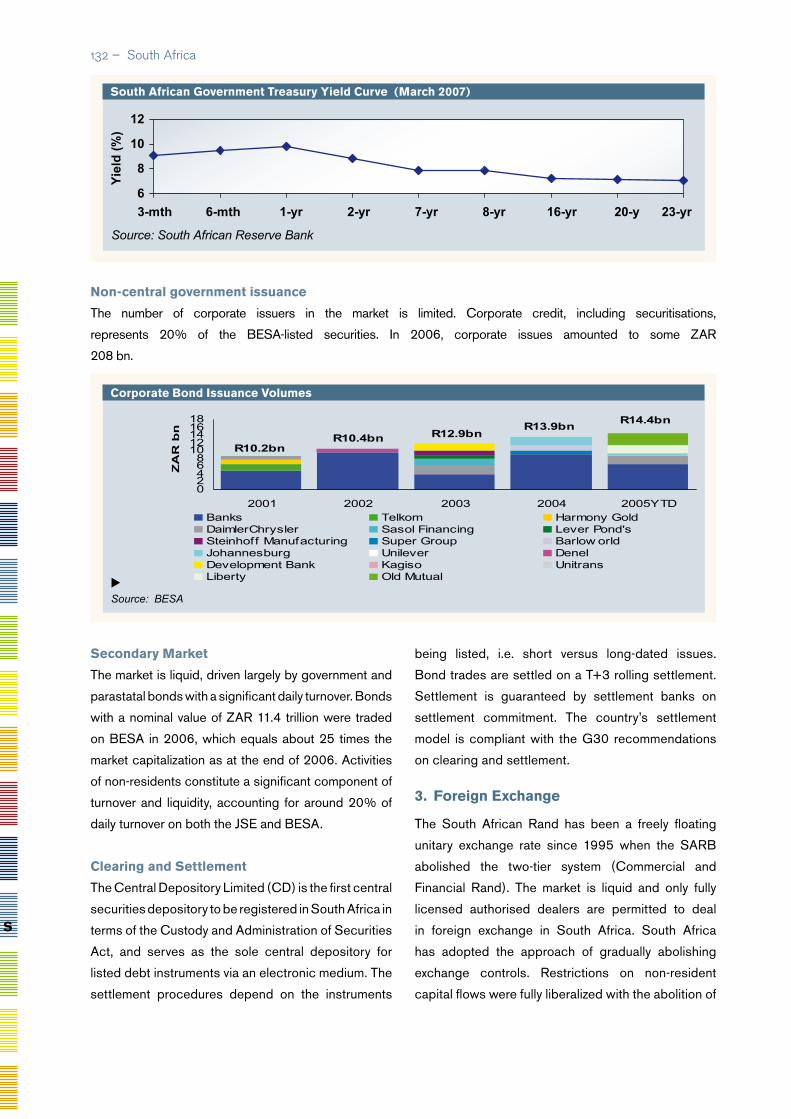
south African Government treasury yield Curve (March 2007)
6
8
10
12
3-mth 6-mth 1-yr 2-yr 7-yr 8-yr 16-yr 20-y 23-yr
Source: South African Reserve Bank
Yie
ld (
%)
non-central government issuance
The number of corporate issuers in the market is limited. Corporate credit, including securitisations,
represents 20% of the BESA-listed securities. In 2006, corporate issues amounted to some ZAR
208 bn.
secondary Market
The market is liquid, driven largely by government and
parastatal bonds with a significant daily turnover. Bonds
with a nominal value of ZAR 11.4 trillion were traded
on BESA in 2006, which equals about 25 times the
market capitalization as at the end of 2006. Activities
of non-residents constitute a significant component of
turnover and liquidity, accounting for around 20% of
daily turnover on both the JSE and BESA.
Clearing and settlement
The Central Depository Limited (CD) is the first central
securities depository to be registered in South Africa in
terms of the Custody and Administration of Securities
Act, and serves as the sole central depository for
listed debt instruments via an electronic medium. The
settlement procedures depend on the instruments
Corporate Bond issuance volumes
02468
1012141618
2001 2002 2003 2004 2005YTD
ZA
R b
n
Banks Telkom Harmony GoldDaimlerChrysler Sasol Financing Lever Pond'sSteinhoff Manufacturing Super Group Barlow orldJohannesburg Unilever DenelDevelopment Bank Kagiso UnitransLiberty Old Mutual
R10.2bnR10.4bn R12.9bn
R13.9bnR14.4bn
Source: BESA
1�� – South Africa
being listed, i.e. short versus long-dated issues.
Bond trades are settled on a T+3 rolling settlement.
Settlement is guaranteed by settlement banks on
settlement commitment. The country’s settlement
model is compliant with the G30 recommendations
on clearing and settlement.
3. Foreign exchange
The South African Rand has been a freely floating
unitary exchange rate since 1995 when the SARB
abolished the two-tier system (Commercial and
Financial Rand). The market is liquid and only fully
licensed authorised dealers are permitted to deal
in foreign exchange in South Africa. South Africa
has adopted the approach of gradually abolishing
exchange controls. Restrictions on non-resident
capital flows were fully liberalized with the abolition of
s
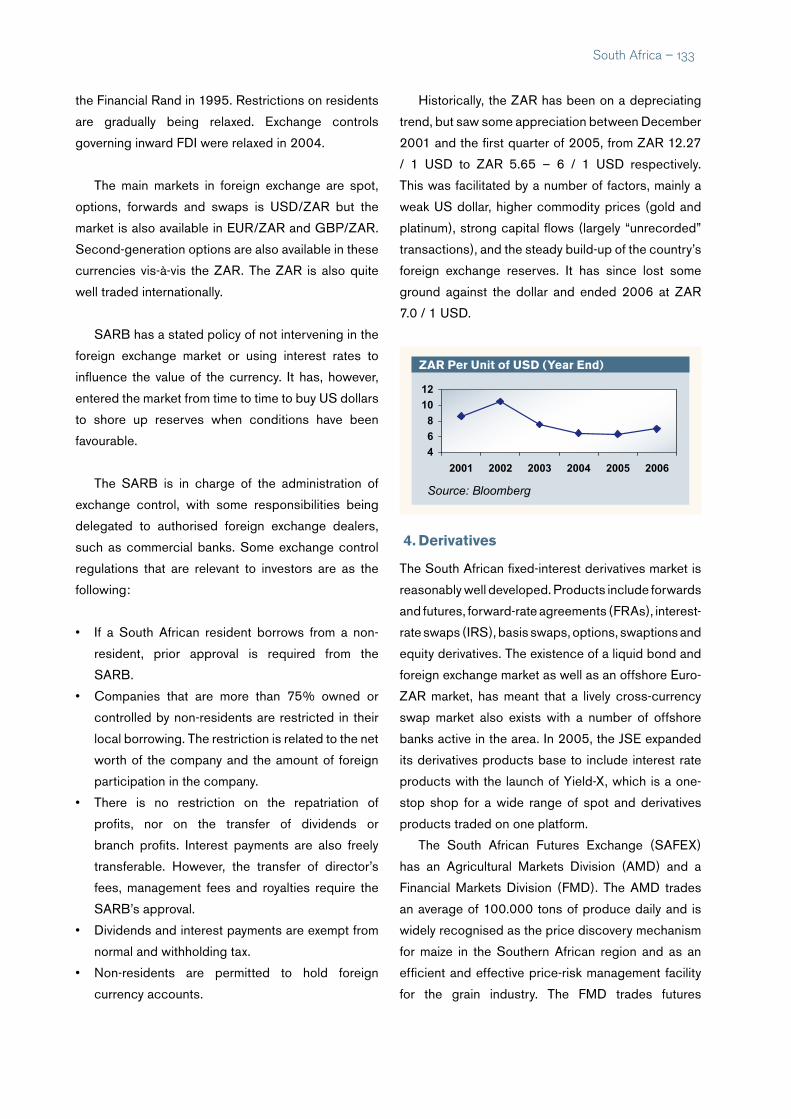
the Financial Rand in 1995. Restrictions on residents
are gradually being relaxed. Exchange controls
governing inward FDI were relaxed in 2004.
The main markets in foreign exchange are spot,
options, forwards and swaps is USD/ZAR but the
market is also available in EUR/ZAR and GBP/ZAR.
Second-generation options are also available in these
currencies vis-à-vis the ZAR. The ZAR is also quite
well traded internationally.
SARB has a stated policy of not intervening in the
foreign exchange market or using interest rates to
influence the value of the currency. It has, however,
entered the market from time to time to buy US dollars
to shore up reserves when conditions have been
favourable.
The SARB is in charge of the administration of
exchange control, with some responsibilities being
delegated to authorised foreign exchange dealers,
such as commercial banks. Some exchange control
regulations that are relevant to investors are as the
following:
• If a South African resident borrows from a non-
resident, prior approval is required from the
SARB.
• Companies that are more than 75% owned or
controlled by non-residents are restricted in their
local borrowing. The restriction is related to the net
worth of the company and the amount of foreign
participation in the company.
• There is no restriction on the repatriation of
profits, nor on the transfer of dividends or
branch profits. Interest payments are also freely
transferable. However, the transfer of director’s
fees, management fees and royalties require the
SARB’s approval.
• Dividends and interest payments are exempt from
normal and withholding tax.
• Non-residents are permitted to hold foreign
currency accounts.
Historically, the ZAR has been on a depreciating
trend, but saw some appreciation between December
2001 and the first quarter of 2005, from ZAR 12.27
/ 1 USD to ZAR 5.65 – 6 / 1 USD respectively.
This was facilitated by a number of factors, mainly a
weak US dollar, higher commodity prices (gold and
platinum), strong capital flows (largely “unrecorded”
transactions), and the steady build-up of the country’s
foreign exchange reserves. It has since lost some
ground against the dollar and ended 2006 at ZAR
7.0 / 1 USD.
4. derivatives
The South African fixed-interest derivatives market is
reasonably well developed. Products include forwards
and futures, forward-rate agreements (FRAs), interest-
rate swaps (IRS), basis swaps, options, swaptions and
equity derivatives. The existence of a liquid bond and
foreign exchange market as well as an offshore Euro-
ZAR market, has meant that a lively cross-currency
swap market also exists with a number of offshore
banks active in the area. In 2005, the JSE expanded
its derivatives products base to include interest rate
products with the launch of Yield-X, which is a one-
stop shop for a wide range of spot and derivatives
products traded on one platform.
The South African Futures Exchange (SAFEX)
has an Agricultural Markets Division (AMD) and a
Financial Markets Division (FMD). The AMD trades
an average of 100.000 tons of produce daily and is
widely recognised as the price discovery mechanism
for maize in the Southern African region and as an
efficient and effective price-risk management facility
for the grain industry. The FMD trades futures
ZAr Per unit of usd (year end)
4
6
8
10
12
2001 2002 2003 2004 2005 2006
Source: Bloomberg
South Africa – 1��

contracts on the JSE Share Indexes. Options on
share index contracts are also available.
A range of interest-rate swaps, forward-rate
agreements and bond options are listed on BESA
and traded by members of the Derivatives Traders’
Association (DTA). Its members use intersect (a
new derivatives capture and confirmation platform
launched in 2005) for their trades in these listed
forward-rate agreements, with some ZAR 2.5 bn
nominal value captured on the platform during the
later part of 2006.
5. Participation of Foreign investors and issuers
There are no restrictions on the participation of foreign
investors in the debt markets, while the market has
recently been opened to foreign issuers under certain
criteria. In October 2006, the Mauritius Commercial
Bank made a debut issue in RSA and raised ZAR 350
mn on BESA (the first regional or international inward-
listed bond in South Africa), which was facilitated by
the further relaxation of exchange control in 2006.
As regards equity, however, investments (especially
in the financial services sector) which would lead to a
majority stake and/or management control of a South
African entity, would normally require prior approval
of SARB.
6. investment taxation
Capital gains tax is levied on non-residents to the
extent that they dispose of certain assets - both
movable and immovable property situated in South
Africa - or have a permanent establishment in the
country and dispose of an asset of that establishment.
The tax is levied on realisation basis, with emigration,
donation and death all counting as realisation.
South Africa has entered into double taxation
agreements with most of its trading partners, including
Austria, Belgium, Canada, Cyprus, Denmark, France,
Germany, India, Ireland, Israel, Italy, Japan, Korea,
Malta, Mauritius, the Netherlands, Norway, Singapore,
Sweden, Switzerland, Taiwan, Thailand, the United
Kingdom and the United States.
Stamp duty at 0.25% is payable on transfer and
issue of shares. Stamp duty is also payable on certain
other agreements, such as leases and mortgage
bonds.
7. Key Contacts
• Bond Exchange of South Africa
Mezzanine Level, 30 Melrose Boulevard,
Melrose Arch, Johannesburg, 2196
Tel: +27 11 215 4000
Web: www.bondexchange.co.za
• Johannesburg Stock Exchange
One Exchange Square, Gwen Lane,
Sandown, 2196 Private Bag X991174,
Sandton, 2146, Republic of South Africa
Tel: +27-11-520 7000
Web: www.jse.co.za
• South African Futures Exchange (SAFEX)
One Exchange Square, Gwen Lane,
Sandown, 2196, RSA
Private Bag X991174, Sandton, 2146, RSA
Tel: +27-11-5207000
Fax: +27-11-5207458
E-mail: [email protected] (Financial Markets)
E-mail: [email protected] (Agricultural Markets)
Web: www.safex.co.za
• South African Reserve Bank
370 Church Street, Pretoria 0002,
P.O. Box 427, Pretoria, 0001, RSA
Tel: +27-12-313-3911
Fax: +27-12-3133197 or 27-12-3133929
Web: www.reservebank.co.za
• The Financial Services Board,
Rigel Park, 446 Rigel Avenue South,
Erasmusrand, Pretoria, RSA
Tel: +27-12-4288000
Fax: +27-12-4280221
E-mail: [email protected]
Web: www.fsb.co.za
1�� – South Africa
s
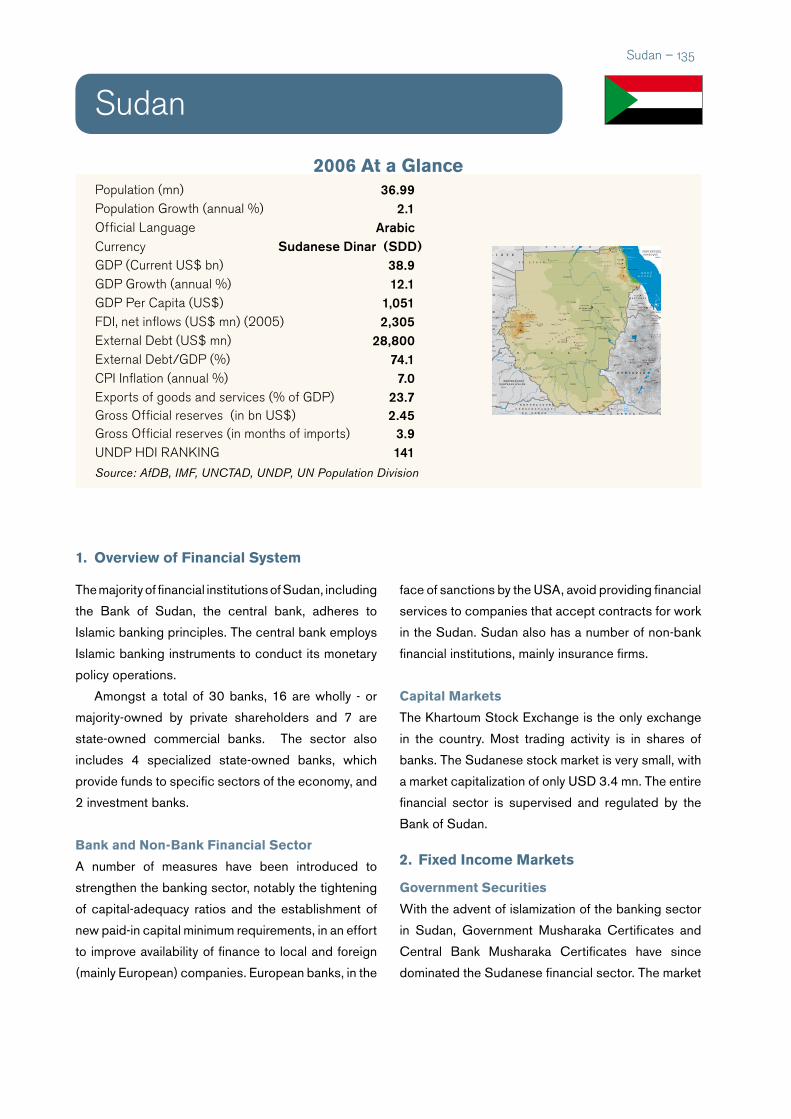
Population (mn) 36.99Population Growth (annual %) 2.1Official Language ArabicCurrency Sudanese Dinar (SDD)GDP (Current US$ bn) 38.9GDP Growth (annual %) 12.1GDP Per Capita (US$) 1,051FDI, net inflows (US$ mn) (2005) 2,305External Debt (US$ mn) 28,800External Debt/GDP (%) 74.1CPI Inflation (annual %) 7.0Exports of goods and services (% of GDP) 23.7Gross Official reserves (in bn US$) 2.45Gross Official reserves (in months of imports) 3.9UNDP HDI RaNkING 141Source: AfDB, IMF, UNCTAD, UNDP, UN Population Division
Sudan
1. overview of Financial system
The majority of financial institutions of Sudan, including
the Bank of Sudan, the central bank, adheres to
Islamic banking principles. The central bank employs
Islamic banking instruments to conduct its monetary
policy operations.
Amongst a total of 30 banks, 16 are wholly - or
majority-owned by private shareholders and 7 are
state-owned commercial banks. The sector also
includes 4 specialized state-owned banks, which
provide funds to specific sectors of the economy, and
2 investment banks.
Bank and non-Bank Financial sector
A number of measures have been introduced to
strengthen the banking sector, notably the tightening
of capital-adequacy ratios and the establishment of
new paid-in capital minimum requirements, in an effort
to improve availability of finance to local and foreign
(mainly European) companies. European banks, in the
face of sanctions by the USA, avoid providing financial
services to companies that accept contracts for work
in the Sudan. Sudan also has a number of non-bank
financial institutions, mainly insurance firms.
Capital Markets
The Khartoum Stock Exchange is the only exchange
in the country. Most trading activity is in shares of
banks. The Sudanese stock market is very small, with
a market capitalization of only USD 3.4 mn. The entire
financial sector is supervised and regulated by the
Bank of Sudan.
2. Fixed income Markets
Government securities
With the advent of islamization of the banking sector
in Sudan, Government Musharaka Certificates and
Central Bank Musharaka Certificates have since
dominated the Sudanese financial sector. The market
GEOATLAS - Copyright1998 Graphi-Ogre0 km 100 200 300 400 km
Ra's al-¡ad$ribah
Ra's�abº Shajarah
Ra's Kasr
Ile Erua
Mukawwar
Canalde M itsiw a
IlesDahlac
M E R �R O U G E
Mekele
Asosa
Bahir Dar��
Gambela
Awasa
Yambio
Bentiu
Al-F$shirAl-Junaynah
Nyala
Uwayl
W$w
W$r$b
Rumbek
Juba Kapoeta
Bor
El Foûlah
Al-Ubayyiø
K$duqli��
Malak$l��
Rabak��
Al- Qaø$rif
Sinjah��
Ad-Damazin��
Wad Madan=��
Kassal$
Bºr Sºd$n
Ad-D$mir
Dunqulah
Bambari
Birao
Bria
Obo
Bangassou
Mobaye
Ndélé
Biltine
Abéché
Am Timan��
Moyo
Kitgum
Nakfa
Akordat
BarentuMendefera
Adi Keyih
Mitsiwa
Keren
Asmera�Asmara
Adis Abeba�Addis Abeba
Al-Khar—ºm�Khartoum
An-Nuhºd
Ad-Duwaym
Kºst=
Sann$r
Al-Khar—ºm Ba!r=
Umm Durm$n
A—barah
W$d= ¡alf$'
Akºbº
A kobo
Ba!ral-'A rab
Nahr
a
d -D indar
Nahr
ar-Ranad
'A—barah'
'A—barah'
Tekeze
A tbara
Jem a
Daw
a
G
enale
Shebele
Koukourou
A oukalé
Bahr
Oul
ou
O ua ndja
BahrAzoum
O ubangui
Kotto
Kotto
Bongou
U ele
M bomou
M
ba
ri
Chinko
Ouara
Jur
Kyom
Sobat
Baro
G ilo
Kan
gen
Omo
G ojeb
Omo
Didesa
Boro
N ilBleu
N ilBleu
NilBle
u
NilBle
u
Nil
Blanc
N il
N il
Nil
N ilB
la
nc
Nil
Blanc
Ba!ral-G
haz$l
Nil
Blanc
Lac�Turkana
Lac�Chew Bahir
Lac�Chamo
Lac�Abaya
Lac�Tana
Lac�Nasser
Lac�Awasa
Lac�Shala
Lac�Ziway
Jabal Adar Gwagwa�1606 m
Jabal Mishbih�1351 m
116 m
Jabal Bº Ban=�1104 m
Jabal Kissº�1712 m
Burj at-Tuyºr�430 m
Jabal Kuluha�936 m
Jabal Mun�1309 m
Jabal Gurgei�2396 m
Jabal Marrah�3088 m
Jabal Kodo�1441 m
Jabal Tungsunga�1045 m
Jabal Manda�1227 m
Jabal Bolanda�1039 m
Jabal Hayb$n�1325 m
Jabal Delami Mayal�1257 m
Jabal Qulºd�1095 m
Jib$l Mandal�1023 m
Jabal ad-Dayr�1412 m
Ras Dashen Terara�4620 m
Guna�4231 m
Abune Yosef�4190 m
Talo�4413 m
Gorochan�3276 m
Chalchis Terara�3112 m
Gurage�3719 m
Mai Gudo�3100 m
Guge�4200 m
Badda�Rogghie�3550 m
Tulu Welel�3301 m
Amba Farit�3975 m
Bagage�1189 mHuri�
1252 m
Pelekech�1794 m
Songot�1755 m
Kinyeti�3187 m
Gugu�3623 m
Batu�4307 m
Jabal Umm �Marahik�789 m
Jabal Muqsam�931 m
Jabal Katul�1028 m
Jabal an-Nuhºd�969 m
Jabal al-Humara�794 m
Tinga�1282 m
Mont Toussoro�1330 m
Jabal Koli�1321 m
Jabal Bartazuga�610 m
Jabal Is�1851 m
Jabal Asoteriba�2216 m
Jabal Erba�2217 m
Jabal Oda�2259 m
Jabal Kaiai�1736 m
1573 m
Enghershatu�2575 m
Jabal Hamoyet�2780 m
Fangaga�2589 m
Jabal Arkanº�1435 m
Hadjer Mornou�1310 m
Hadjer Niéré�1320 m
Hadjer Kamaran�1040 m
PLAINE�
LOTIKIPI
Mts�
DIDINGA
JABAL Bª SUNBUL
D E S E R T �
D E N U B I E
P L A T E A U �D E T E I G A
AL-BU
–*N
AH
AL-JA
Z+R
AH
MONTS�NUBA
K
O
RD
OF
AN
DA
RF
O
UR
D E S E R T �
D E L I B Y E
C H OKE
P L A T E A U �
E T H I O P I E N
MENDEBO
M A S SIF
D ES B O N G
O
ZAG
A O U A
EN
N E D I
D EPR ES S IO N D U M O U R D
D E S E R T �D A N A K I L
S O U D A N
SOUDAN
R E P U B L I Q U E �
D E M O C R A T I Q U E �
D U C O N G O K E N Y A
E T H I O P I E
REPUBLIQUE�CENTRAFRICAINE
E G Y P T E
TC
HA
D
E R Y T H R E E
PENINSULE�ARABIQUE �
AsieL I B Y E
Sudan – 1��
2006 At a Glance
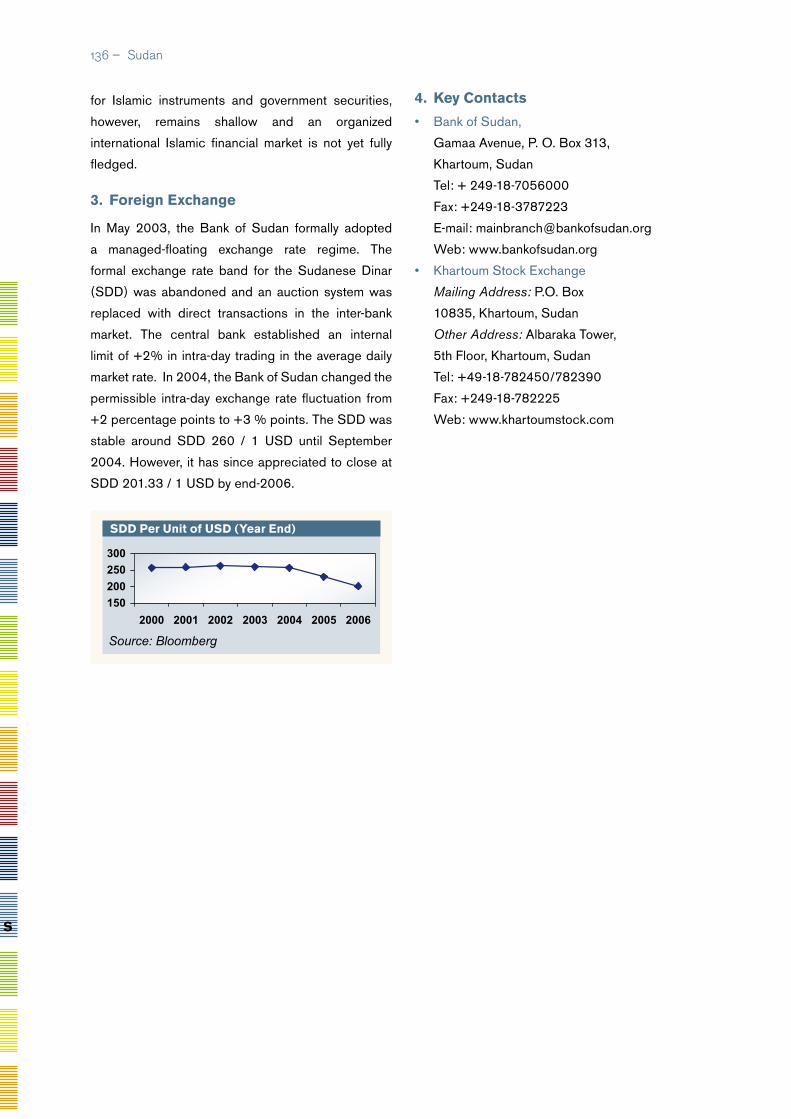
for Islamic instruments and government securities,
however, remains shallow and an organized
international Islamic financial market is not yet fully
fledged.
3. Foreign exchange
In May 2003, the Bank of Sudan formally adopted
a managed-floating exchange rate regime. The
formal exchange rate band for the Sudanese Dinar
(SDD) was abandoned and an auction system was
replaced with direct transactions in the inter-bank
market. The central bank established an internal
limit of +2% in intra-day trading in the average daily
market rate. In 2004, the Bank of Sudan changed the
permissible intra-day exchange rate fluctuation from
+2 percentage points to +3 % points. The SDD was
stable around SDD 260 / 1 USD until September
2004. However, it has since appreciated to close at
SDD 201.33 / 1 USD by end-2006.
sdd Per unit of usd (year end)
150
200
250
300
2000 2001 2002 2003 2004 2005 2006
Source: Bloomberg
4. Key Contacts
• Bank of Sudan,
Gamaa Avenue, P. O. Box 313,
Khartoum, Sudan
Tel: + 249-18-7056000
Fax: +249-18-3787223
E-mail: [email protected]
Web: www.bankofsudan.org
• Khartoum Stock Exchange
Mailing Address: P.O. Box
10835, Khartoum, Sudan
Other Address: Albaraka Tower,
5th Floor, Khartoum, Sudan
Tel: +49-18-782450/782390
Fax: +249-18-782225
Web: www.khartoumstock.com
1�� – Sudan
s

Population (mn) 1.0Population Growth (annual %) -0.3Official Language (s) Siswati/EnglishCurrency Lilangeni (SZL)GDP (Current US$ bn) 2.5GDP Growth (annual %) 1.8GDP Per Capita (US$) 2,461FDI, net inflows (US$ mn) (2005) -13.8External Debt (US$ mn) 0.6External Debt/GDP (%) ) 23.2CPI Inflation (annual %) 5.0Exports of goods and services (% of GDP) 97.8Gross Official Reserves (US$ bn) 0.354International Reserves (months of Imports) 2.0UNDP HDI RANKING 146Source: AfDB, IMF, UNCTAD, UNDP, UN Population Division
1. OverviewofFinancialSystem
The Common Monetary Area (CMA) replaced the
Rand Monetary Area in 1986, accommodating
changes in the position of Swaziland. The CMA
comprises South Africa, Namibia, Swaziland and
Lesotho. While South Africa effectively formulates
the monetary policy for the region, each member
has its own central bank, is responsible for its own
monetary policy, and controls its financial institutions.
The South African Rand serves as legal tender in all
countries of the area, except for Swaziland. Each
member state has the right to issue its own currency
which serves as legal tender in the issuing country
only. All the national currencies are pegged to the
Rand. Public and private sector institutions, subject
to relevant financial laws and policies applicable to
counterparts, have the right to access the South
African capital market. The CMA provides for free
flow of capital within the area.
BankandNon-BankFinancialSector
The financial system is characterized by a sizeable
degree of state-ownership and participation by
neighbouring South African firms. Swaziland has
a relatively developed commercial banking system
that is anchored by four institutions, three private
banks (all owned by South African banks, namely
Nedbank, Standard Bank & First National Bank),
the state-owned Swazibank, and a housing bank.
There are over 178 savings and credit unions which
provide micro-finance services. The banking sector
in Swaziland is regulated by the Central Bank of
Swaziland (CBS), though the micro-finance industry
continues to be essentially unregulated due to the
difficulty of enforcing rules regarding the registration
of money lenders as companies.
As of January 2003, the 12 non-bank financial
institutions of significant size in Swaziland were
dominated by government ownership. The quasi state-
owned (41%) Swaziland Royal Insurance Corporation
commands a monopoly over the insurance sector. An
Insurance Act was passed by parliament in 2005;
however, implementation has been delayed because
Swaziland
Swaziland� – 137
2006AtaGlance
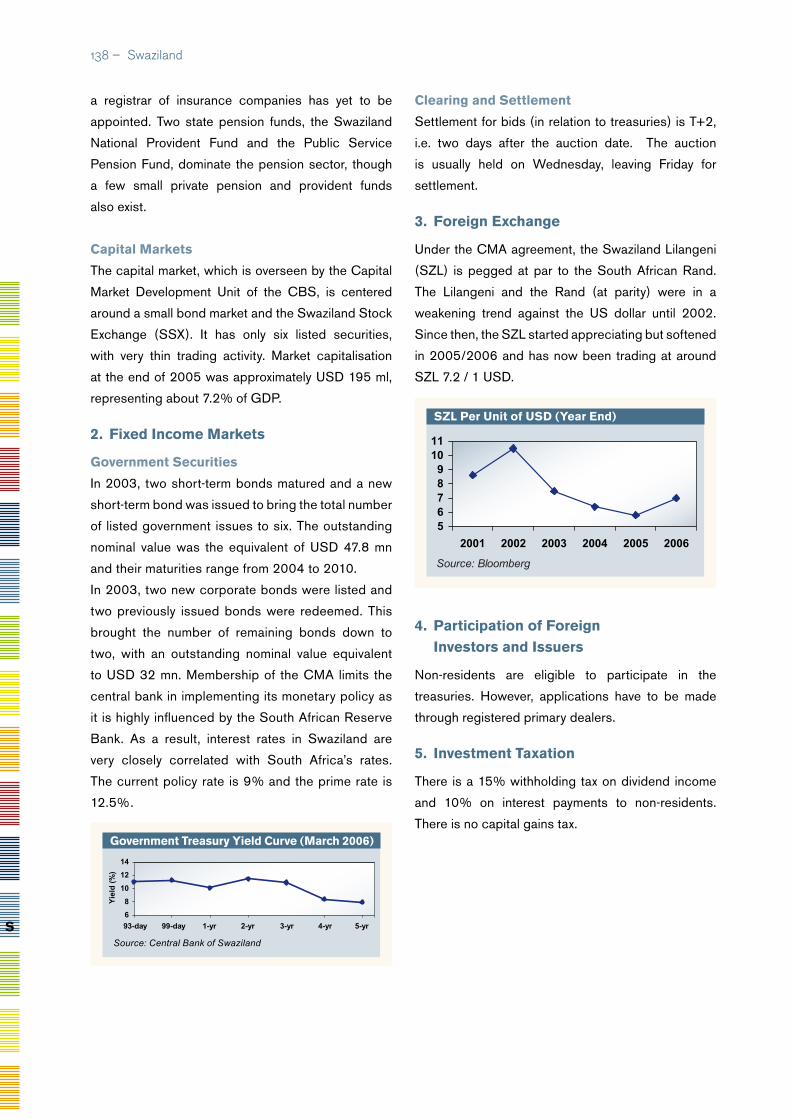
a registrar of insurance companies has yet to be
appointed. Two state pension funds, the Swaziland
National Provident Fund and the Public Service
Pension Fund, dominate the pension sector, though
a few small private pension and provident funds
also exist.
CapitalMarkets
The capital market, which is overseen by the Capital
Market Development Unit of the CBS, is centered
around a small bond market and the Swaziland Stock
Exchange (SSX). It has only six listed securities,
with very thin trading activity. Market capitalisation
at the end of 2005 was approximately USD 195 ml,
representing about 7.2% of GDP.
2. FixedIncomeMarkets
GovernmentSecurities
In 2003, two short-term bonds matured and a new
short-term bond was issued to bring the total number
of listed government issues to six. The outstanding
nominal value was the equivalent of USD 47.8 mn
and their maturities range from 2004 to 2010.
In 2003, two new corporate bonds were listed and
two previously issued bonds were redeemed. This
brought the number of remaining bonds down to
two, with an outstanding nominal value equivalent
to USD 32 mn. Membership of the CMA limits the
central bank in implementing its monetary policy as
it is highly influenced by the South African Reserve
Bank. As a result, interest rates in Swaziland are
very closely correlated with South Africa’s rates.
The current policy rate is 9% and the prime rate is
12.5%.
ClearingandSettlement
Settlement for bids (in relation to treasuries) is T+2,
i.e. two days after the auction date. The auction
is usually held on Wednesday, leaving Friday for
settlement.
3. ForeignExchange
Under the CMA agreement, the Swaziland Lilangeni
(SZL) is pegged at par to the South African Rand.
The Lilangeni and the Rand (at parity) were in a
weakening trend against the US dollar until 2002.
Since then, the SZL started appreciating but softened
in 2005/2006 and has now been trading at around
SZL 7.2 / 1 USD.
4. ParticipationofForeignInvestorsandIssuers
Non-residents are eligible to participate in the
treasuries. However, applications have to be made
through registered primary dealers.
5. InvestmentTaxation
There is a 15% withholding tax on dividend income
and 10% on interest payments to non-residents.
There is no capital gains tax.
SZLPerUnitofUSD(YearEnd)
56789
1011
2001 2002 2003 2004 2005 2006
Source: Bloomberg
S
138 – Swaziland�
GovernmentTreasuryYieldCurve(March2006)
6
8
10
12
14
Yie
ld (
%)
Source: Central Bank of Swaziland

6. KeyContacts
• Central Bank of Swaziland
Mailing Address: P.O. Box 546,
Mbabane, Swaziland
Other Address: Warner Street,
Mbabane, Swaziland
Tel: +268-4043194
Fax: +268-4040038
E-mail: [email protected]
Web: www.centralbank.sz
• Swaziland Stock Exchange
Mailing Address: P.O. Box 546,
Mbabane H100, Swaziland
Other Address: 1st Floor, Imfumbe Building,
Warner Street, Mbabane, Swaziland
Tel: +268-4049491
Fax: +268-4049493
E-mail: [email protected]
Web: www.ssx.org.sz
Swaziland� – 139

Population (mn) 39.03Population Growth (annual %) 1.8Official Language (s) Kiswahili/EnglishCurrency Tanzanian Shilling (TZS)GDP (Current US$ bn) 12.85GDP Growth (annual %) 5.7GDP Per Capita (US$) 329FDI, net inflows (US$ mn) (2005) 473External Debt (US$ mn) 6,200External Debt/GDP (%) 48.1CPI Inflation (annual %) 7.1Exports of goods and services (% of GDP) 23.5Gross Official Reserves (in bn US$) 2.18Gross Official Reserves (in months of imports) 10.1UNDP HDI RANKING 162Source: AfDB, IMF, UNCTAD, UNDP, UN Population Division
1. OverviewofFinancialSystem
The Bank of Tanzania (BOT), the central bank, is the
primary regulatory body of the banking system. Its
key objective and function, as the country’s monetary
authority, has been, since its 1995 Act, the pursuit
of long-term price stability, through management
and regulation of monetary growth. In addition, BOT
undertakes the licensing of banks as well as their
supervision. The financial system in Tanzania remains
dominated by the banking sector. There are several
non-bank financial institutions and pension funds.
Tanzania also has a relatively young stock market,
with less than a dozen listed stocks.
BankandNon-BankFinancialSector
As of December 2006, the financial sector included
22 commercial banks, 5 regional banks, 2 regional
financial institutions, and 5 pension funds, the latter
comprising the National Social Security Fund, the
Parastatal Pensions Fund, the Public Service Pension
Fund, the National Health Insurance Fund, and the
Zanzibar Social Security Fund. Currently, these
pension funds are self-regulated, with the major funds
being state-operated. The creation of a retirement-
benefits regulator is under consideration.
The central bank and the Deposit Insurance Board
provide a deposit insurance facility. Three commercial
banks provide micro-finance services, led by the
National Microfinance Bank. However, the majority of
micro-finance services are provided by savings and
credit cooperatives and foreign NGOs. The BOT
has slated a number of banks for restructuring and
potential privatization.
The insurance and pensions sector, regulated and
supervised by the Insurance Supervisory Department
(ISD) within the Ministry of Finance, comprises 4
life insurance and 12 registered, general insurance
companies, including life and non-life insurance
activities. The sector holds just 3% of the financial
system assets. The insurance sector remains
dominated by the state-owned National Insurance
Tanzania
GEOATLAS - Copyright1998 Graphi-Ogre0 km 100 200 300 400 km
OC
EA
N�
IN
DI
EN
Cap Delgado
Ile Metundo
Ile Mafia
Ile Zanzibar
Ile Manda
Ile Pate
Ile Pemba
Ile Vamizi
Ile Rongui
DétroitdeMafia
Détro
itde
Zanzibar
DétroitdePemba
Baie Ungama
Ras Ngomeni
Kilwa Masoko��
Geita
Ujiji
Tarime
Korogwe
Manyoni
Mpanda
Njombe
Bagamoyo
Kilosa
Kilwa Kivinje��
Mikindani
MukonoMubende
Mpigi
Masaka
Rakai
Kasese
MbararaBushenyi
Rukungiri
Kabale
Bukavu
Goma
Kasama
Mansa
Ndola
Pemba
Wete
Chake Chake��
ZanzibarMahonda
Koani
Kigoma
Bukoba
Mwanza
Shinyanga
Musoma
MoshiArusha
Tanga
Singida
Tabora
Sumbawanga
Mbeya
Iringa
KibahaMorogoro
Lindi
MtwaraSongea
Nyeri
Kakamega
KisumuNakuru
EmbuGarissa
Mombasa
Mzuzu
Kigali
Bujumbura
Kampala
Dar Es Salaam
Dodoma
Nairobi
Luvua
Katong
Ka
gera
Ro
vubo
Ruvu
bu
M ala
garasi
Moyo w
osi
Igo
m be
U galla
Rungwa
Njo
m
be
Kilo
mbe
ro
Luw egu
Mbara
ngandu
M bw en
kuru
W am i
Pangani
G alana
Athi
Tana
Ta na
Ruvu m
a
Rovu m a
Messinge
Luge
nda M e
ssa l
o
Luan
gwa
Luapula
Luapula
Ch
ambeshi
Chambeshi
Lufub
u
Wem
bere
G
reat
Ru
ah
a
G reat Ruaha
Little
Ruaha
Lac�Kivu
Lac�Mweru
Lac�Bangweulu
Lac�Tanganyika
Lac�Victoria
Lac�Eyasi Lac�
Manyara
Lac�Natron
Lac�Edward
Lac�Rukwa
Lac Nyasa�-Lac Malawi-
Nganda�2606 m
2148 m
2164 m
2067 m 2961 m
2646 m
Lugunga�2356 m
Sisaba�2462 m
2460 m
2258 m
Ugoma�2981 m
Masangwe�1637 m
2760 m
Volcan�Karisimbi�4507 m
Ngomba�1954 m
Hanang�3417 m
Loolmalassin�3648 m
Mt�Meru�
4565 m
Kilimanjaro�5895 m
Oldoinyo�Orok�2524 mGelai�
2942 m
Osupugo�2642 m
Kifinyaga�5199 m
MONTS
MU
CHIN
GA
KIPENGERE RANGE
COLLINES�
MLALA
PLAINE DU�
SERENGETI
STEPPE�
MASAI�
�
CRATERE DU�NGORONGORO
KI
LIM
AN
JA
RO
Mts�
USAMBARA
RIFT
VA
LLEY
PLATEAU DE YATTA
ABERDARE
MO
NT
SM
IT
UM
BA
M ts.M
A
LIMBA
MARUNGU
M A L A W I
M O Z A M B I Q U E
Z A M B I E
REPUBLIQUE DEMOCRATIQUE DU CONGO
O U G A N D A
K E N Y A
BURUNDI
RWANDA
SOMALIE
TANZANIE
T
140 – Tanzania
2006AtaGlance

Corporation. In the general insurance sub-sector, the
National Insurance Corporation holds nearly 25% of
premiums and has a near-monopoly market share in
life insurance premiums.
CapitalMarkets
Tanzania’s capital market is centered on the Dar-es-
Salaam Stock Exchange (DSE), which opened in
1996. By the end of 2006, the DSE had a market
capitalization of USD 2.4 bn and eight listed
companies, two of which (Kenya Airways and East
African Breweries) were cross-listed. The agency in
charge of supervising the Tanzanian capital market
is the Capital Markets and Securities Authority
(CMSA).
The Capital Market and Securities Act, introduced
in October 1994, paved the way for the subsequent
introduction of the CMSA. Its responsibilities include
regulating issuance and trade in securities as well as
taking an active role in the development of the market.
The Guidelines for the Issue of Corporate Bonds
and Commercial Paper was issued by the CMSA
in September 1999. The DSE approves the listing
of issues, but usually only subject to prior approval
by the CMSA. The capital market in Tanzania is
characterized by :
• Issuance of corporate bonds and commercial
paper is subject to the approval of CMSA/BOT.
• Commercial banks and other financial
institutions that plan to issue are required
to get central bank approval.
• Although only listed companies may issue
corporate bonds and commercial paper, the
CMSA generally waives this requirement on
the basis of the credit quality of the applicant.
• In order to maintain a certain level of local
ownership, foreign investors are not permitted
to hold government paper, which remains
a major holding for domestic investors.
2. FixedIncomeMarkets
GovernmentSecurities
Treasury bills for maturities of 35, 91, 182 and 364
days, as well as 2, 5, 7 and 10 year maturities for
treasury bonds, are all issued regularly by the BOT
on behalf of the government. The auction is based
on a multiple price system, with treasury bill auctions
being held on a weekly basis. Treasury bond auctions,
usually on a monthly basis, are scheduled in advance
via a quarterly-issue calendar, published by the BOT.
All treasury bonds are listed on the DSE. Although
primary dealers are active in the market, investors are
also permitted to submit bids to the BOT directly.
The yield curve extends to 10 years, and each of
the existing benchmark issues, made up of 2-, 5-,
7- and 10-year bonds, are regularly auctioned by
the BOT.
TanzaniaGovernmentYieldCurve(End2006)
10
15
20
25
Yie
ld
3M 6M 1Y 2Y 5Y 7Y 10Y
Source: Bank of Tanzania
Tanzania – 141
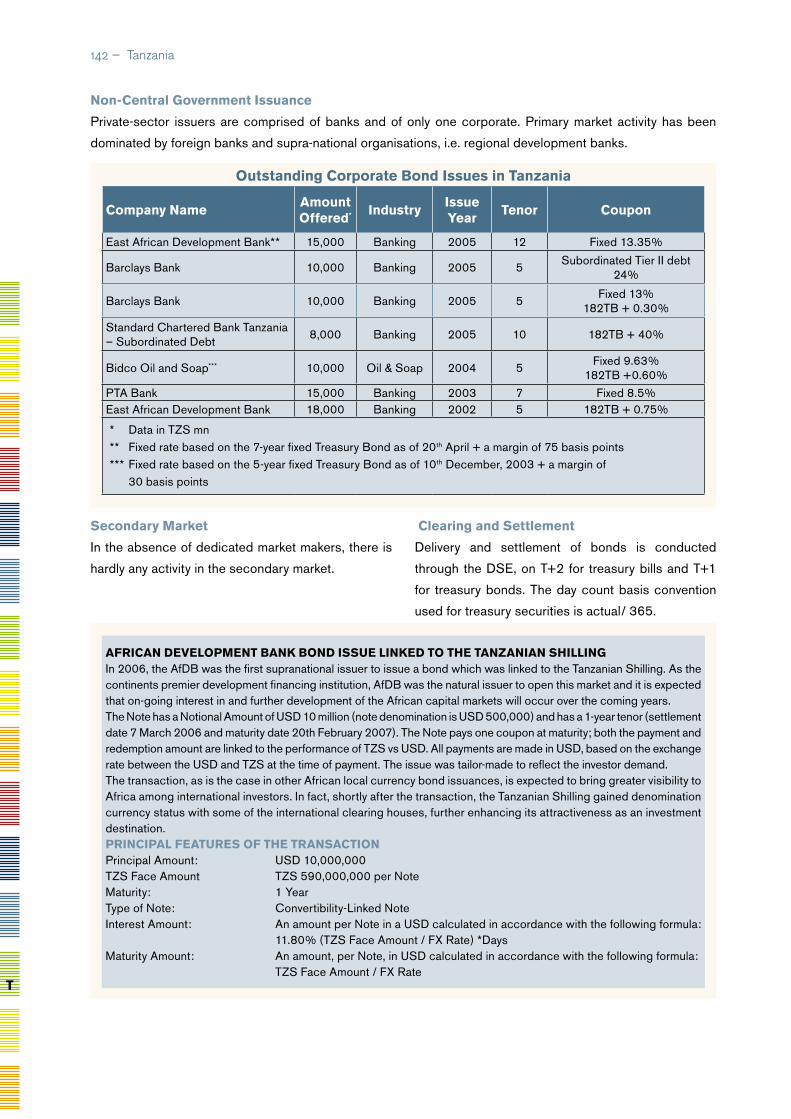
AFrICANDEvELOPMENTBANKBONDISSUELINKEDTOThETANZANIANShILLINGIn 2006, the AfDB was the first supranational issuer to issue a bond which was linked to the Tanzanian Shilling. As the continents premier development financing institution, AfDB was the natural issuer to open this market and it is expected that on-going interest in and further development of the African capital markets will occur over the coming years.The Note has a Notional Amount of USD 10 million (note denomination is USD 500,000) and has a 1-year tenor (settlement date 7 March 2006 and maturity date 20th February 2007). The Note pays one coupon at maturity; both the payment and redemption amount are linked to the performance of TZS vs USD. All payments are made in USD, based on the exchange rate between the USD and TZS at the time of payment. The issue was tailor-made to reflect the investor demand.The transaction, as is the case in other African local currency bond issuances, is expected to bring greater visibility to Africa among international investors. In fact, shortly after the transaction, the Tanzanian Shilling gained denomination currency status with some of the international clearing houses, further enhancing its attractiveness as an investment destination.PrINCIPALFEATUrESOFThETrANSACTIONPrincipal Amount: USD 10,000,000TZS Face Amount TZS 590,000,000 per NoteMaturity: 1 YearType of Note: Convertibility-Linked NoteInterest Amount: An amount per Note in a USD calculated in accordance with the following formula: 11.80% (TZS Face Amount / FX Rate) *Days Maturity Amount: An amount, per Note, in USD calculated in accordance with the following formula: TZS Face Amount / FX Rate
T
142 – Tanzania
CompanyNameAmountOffered* Industry
IssueYear
Tenor Coupon
East African Development Bank** 15,000 Banking 2005 12 Fixed 13.35%
Barclays Bank 10,000 Banking 2005 5Subordinated Tier II debt
24%
Barclays Bank 10,000 Banking 2005 5Fixed 13%
182TB + 0.30%
Standard Chartered Bank Tanzania – Subordinated Debt
8,000 Banking 2005 10 182TB + 40%
Bidco Oil and Soap*** 10,000 Oil & Soap 2004 5Fixed 9.63%
182TB +0.60%PTA Bank 15,000 Banking 2003 7 Fixed 8.5%East African Development Bank 18,000 Banking 2002 5 182TB + 0.75%
* Data in TZS mn** Fixed rate based on the 7-year fixed Treasury Bond as of 20th April + a margin of 75 basis points*** Fixed rate based on the 5-year fixed Treasury Bond as of 10th December, 2003 + a margin of
30 basis points
OutstandingCorporateBondIssuesinTanzania
Non-CentralGovernmentIssuance
Private-sector issuers are comprised of banks and of only one corporate. Primary market activity has been
dominated by foreign banks and supra-national organisations, i.e. regional development banks.
SecondaryMarket
In the absence of dedicated market makers, there is
hardly any activity in the secondary market.
ClearingandSettlement
Delivery and settlement of bonds is conducted
through the DSE, on T+2 for treasury bills and T+1
for treasury bonds. The day count basis convention
used for treasury securities is actual/ 365.
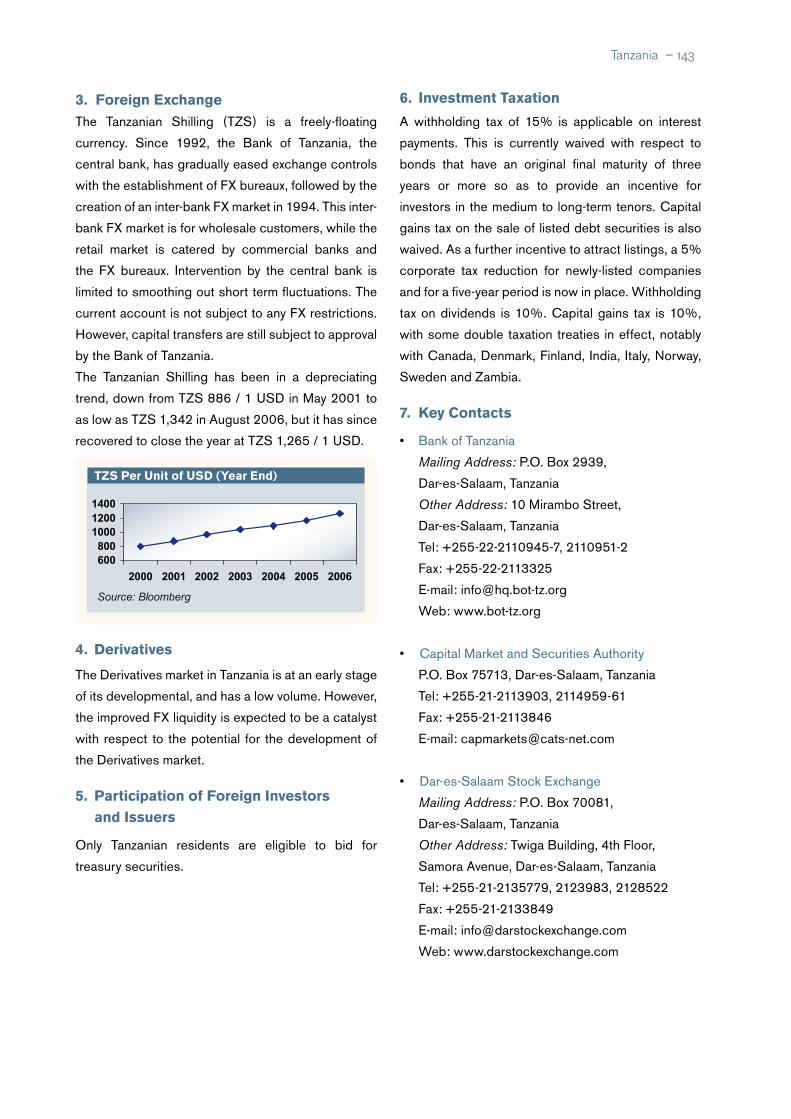
3.ForeignExchangeThe Tanzanian Shilling (TZS) is a freely-floating
currency. Since 1992, the Bank of Tanzania, the
central bank, has gradually eased exchange controls
with the establishment of FX bureaux, followed by the
creation of an inter-bank FX market in 1994. This inter-
bank FX market is for wholesale customers, while the
retail market is catered by commercial banks and
the FX bureaux. Intervention by the central bank is
limited to smoothing out short term fluctuations. The
current account is not subject to any FX restrictions.
However, capital transfers are still subject to approval
by the Bank of Tanzania.
The Tanzanian Shilling has been in a depreciating
trend, down from TZS 886 / 1 USD in May 2001 to
as low as TZS 1,342 in August 2006, but it has since
recovered to close the year at TZS 1,265 / 1 USD.
4. Derivatives
The Derivatives market in Tanzania is at an early stage
of its developmental, and has a low volume. However,
the improved FX liquidity is expected to be a catalyst
with respect to the potential for the development of
the Derivatives market.
5. ParticipationofForeignInvestorsandIssuers
Only Tanzanian residents are eligible to bid for
treasury securities.
6. InvestmentTaxation
A withholding tax of 15% is applicable on interest
payments. This is currently waived with respect to
bonds that have an original final maturity of three
years or more so as to provide an incentive for
investors in the medium to long-term tenors. Capital
gains tax on the sale of listed debt securities is also
waived. As a further incentive to attract listings, a 5%
corporate tax reduction for newly-listed companies
and for a five-year period is now in place. Withholding
tax on dividends is 10%. Capital gains tax is 10%,
with some double taxation treaties in effect, notably
with Canada, Denmark, Finland, India, Italy, Norway,
Sweden and Zambia.
7. KeyContacts
• Bank of Tanzania
Mailing Address: P.O. Box 2939,
Dar-es-Salaam, Tanzania
Other Address: 10 Mirambo Street,
Dar-es-Salaam, Tanzania
Tel: +255-22-2110945-7, 2110951-2
Fax: +255-22-2113325
E-mail: [email protected]
Web: www.bot-tz.org
• Capital Market and Securities Authority
P.O. Box 75713, Dar-es-Salaam, Tanzania
Tel: +255-21-2113903, 2114959-61
Fax: +255-21-2113846
E-mail: [email protected]
• Dar-es-Salaam Stock Exchange
Mailing Address: P.O. Box 70081,
Dar-es-Salaam, Tanzania
Other Address: Twiga Building, 4th Floor,
Samora Avenue, Dar-es-Salaam, Tanzania
Tel: +255-21-2135779, 2123983, 2128522
Fax: +255-21-2133849
E-mail: [email protected]
Web: www.darstockexchange.com
TZSPerUnitofUSD(YearEnd)
600800
100012001400
2000 2001 2002 2003 2004 2005 2006
Source: Bloomberg
Tanzania – 143
Population (mn) 6.3Population Growth (annual %) 2.6Official Language FrenchCurrency CFA Franc (XOF)GDP (Current US$ bn) 2.3GDP Growth (annual %) 1.8GDP Per Capita (US$) 361FDI, net inflows (US$ mn) (2005) 49External Debt (US$ mn) 1,497External Debt/GDP (%) 65.7CPI Inflation (annual %) 2.7Exports of goods and services (% of GDP) 39.1Gross Official Reserves (US $ bn) 0.31Gross Official Reserves (in months of imports) 3.6UNDP HDI RANKING 147Source: AfDB, IMF, UNCTAD, UNDP, UN Population Division
1. OverviewofFinancialSystem
Togo is a member of the West African Economic
and Monetary Union (UEMOA) established in
January 1994, and comprising eight West African
countries (Benin, Burkina Faso, Côte d’Ivoire, Mali,
Niger, Senegal, Togo, and Guinea Bissau) which are
members of the Franc Zone and use the CFA Franc
(XOF) issued by the Central Bank (BCEAO). The
UEMOA financial markets are administered through
the following institutions:
• The Conference of Heads of State, which decides
on the accession of new members.
• The Council of Ministers, which defines, among
others, the monetary and credit policy of the Union
to safeguard the value of the CFA Franc.
• The UEMOA commission, as delegated by the
Council of Minister, is in charge of the day-to-day
administration of the Union.
• The Central Bank of West African States (BCEAO)
is the central bank and controls the Banking
Togo
Commission (Commission Bancaire) responsible
for overseeing and supervising banks and financial
institutions. The BCEAO also controls the
Savings and Financial Markets Regional Council
(CREPMF). The capital of BCEAO, currently
called up in the amount of XOF 134 bn, is entirely
subscribed by the member States and shared
equally among them.
• Micro-finance institutions are governed by a
separate law, the PARMEC (Projet d’Appui à
la Réglementation des Mutuelles d’Epargne et
de Crédit) Law, which regulates micro-finance
activities in all WAEMU countries.
Togo is also a signatory to the OHADA Treaty, which
harmonizes business law in 16 countries in Sub-
Sahara Africa, including all the UEMOA countries.
The main objective of the monetary policy as defined
by the UEMOA and implemented by the BCEAO, is to
ensure price stability and safeguard the domestic and
GEOATLAS - Copyright1998 Graphi-Ogre0 km 100 200 300 400 km
São Tomé
Príncipe
Ile de BioGuinée Equatoria
Cap St-Paul
Cap des�Trois Pointes
BOUCH
ESD U N IG ER
CO TE D ES ESCLA V ES
COTE
D EL'O R
G O L F E D E G U I N E E
B A I E D U B E N I N
O C E A N �
A T L A N T I Q U E �
�
Tchamba
Badou
Palimé
Tsévié
Anécho
BouakéBondoukou
Divo
DimbokroAbengourou
Agboville
Aboisso
Atakpamé
Sokodé
Lama-Kara
DapangoBolgatanga
Tamale
Sunyani
Kumasi
Sekondi-TakoradiCape Coast
Koforidua
Ho
Umuahia
AsabaEnugu
Lokoja
Benin City��
Kano
Katsina
Birnin Kebbi
Kaduna
Sokoto
Minna
Makurdi
Llorin
Oshogbo
IbadanAbeokuta
Lagos
Akure
Awka
Owerri
Port HarcourtUyo
Calabar
Parakou
Natitingou
Abomey
Cotonou
Lokossa
Maradi
Dosso
Bobo Dioulasso
OuahigouyaDori
DiapagaFada�NgourmaKoudougou
São Tomé
Yamoussoukro
Abidjan
Lomé
Malabo
Abuja
Accra
Porto Novo
Niamey
Ouagadougou
Ba nd
a ma
Nzi
Nzi
Kom
oé
Komoé
Léra
ba
Bia
Tano
Pra
Benue
Dak
a
Oti
Oti
Mékrou
Alibori
Mono
Ouém
é Niger
Kaduna
Ka
duna
M ariga
Sokoto
Sokoto
G agere
M
ad
a
Rima
Maradi
Lac Volta
Volta
Noire
Volta B lanch e
Niger
Lac�Kainji
Pico de São Tomé�2024 m
549 m
641 m
844 m
Mont Agou�986 m
Afadjoto 885 m
863 m
Djébobo�876 m
Akwawa�788 m
Kwamisa�767 m
Pico de Santa Isabel�3008 m
COLLINES�OBAN
PLATEAU�JOS
CHAINEDEL'ATACORA
Mts KOUFFÉ
PLA TEA U KW A HU
CHAIN
EAKW
APIN
S A O T O M E - �E T - P R I N C I P E
N I G E R I A
B E N I N
G H A N AC O T E �
D ' I V O I R E
M A L I N I G E R
B U R K I N A F A S O
T O G O
T
144 – Togo
2006AtaGlance
foreign value of the CFA Franc through appropriate
coverage of currency issue by foreign exchange
reserves.
BankandNon-BankFinancialSector
As of December 2006, there were 93 banks and 22
financial institutions operating in the UEMOA zone,
with 10 banks and four financial institutions located in
Togo. The total balance sheets of the financial system
in Togo amounted to XOF 417 bn at the end of 2005,
with banks accounting for some 87%, representing
41% of GDP, testifying to the critical role that this
sector plays in the economy. The resources of banks
and financial institutions amount to XOF 383 bn,
including XOF 61 bn as net equity capital. Branches
and subsidiaries of foreign or regional banks play a
relatively important role in financial intermediation in
UEMOA.
The insurance sector in Togo is regulated and
supervised by the Inter-African Conference of
Insurance Markets (CIMA) established on 10 July
1992 in Yaounde (Cameroon). It includes the
following countries: Benin, Burkina Faso, Cameroon,
Central African Republic, the Comoros, Côte d’Ivoire,
Gabon, Equatorial Guinea, Guinea Bissau, Mali, Niger,
Senegal, Chad and Togo. CIMA provides a unified
supervisory and regulatory regime for insurance
companies of the 14 CFA Franc zone countries.
Under the terms of the CIMA treaty, all 14 countries
are bound to a single set of insurance laws and
regulations. The total portfolio of the UEMOA CIMA
zone is dominated by the sector of non-life insurance.
As at December 2005, insurance penetration
represented 1.44% of GDP, well below the average
ratio in Africa of 4.8%. At the end of 2005, three life
insurance, and seven non-life insurance companies
were operating in the country with a total turnover of
XOF 15 bn; life insurance products represented 20%
and vehicle insurance 31% of turnover.
Togo’s financial system includes a relatively stable
micro-finance sector with 145 licensed retail micro-
finance institutions (MFI). The sector is highly
concentrated: the five most active MFIs provided 84
percent of the outstanding loans and 86 percent of
the outstanding deposits. FUCEC remains a dominant
player in the micro-finance sector in Togo, not only as
a predominant network and an important refinancing
entity to other MFIs. As at December 2006, credit to
the economy from micro-finance institutions accounts
for 11.6% of total credit from the banking sector.
CapitalMarket
The Regional Stock Exchange (BRVM), the stock
market for the UEMOA region, started operating in
September 1998. It is located in Abidjan and has
a branch in each capital city of the other member
States of the Union. Its main role is to pool and
process stock market orders transmitted by brokerage
companies (Société de Gestion et d’Intermédiation-
SGI) authorized to negotiate securities quoted on
the BRVM. As of December 2006, 19 SGIs were
registered in the Union. SGI Togo, the sole SGI in
the country (2006), provides brokerage services for
the BRVM. The BRVM is regulated by the CREPMF
whose responsibilities include the promulgation of
policies and procedures to regulate the BRVM and the
promotion of a regional bond market. In order to list on
the BRVM, all bond issues must be guaranteed by an
approved financial institution, a development financial
institution, a guarantee fund, or the Parent Company.
At the end of December 2006, the capitalization of
the equity market was XOF 2,067 bn whereas the
bond market capitalization stood at XOF 489 bn, with
XOF 260 bn being government bonds, representing
1.07% of the GDP of the Union. By end-December
2006, 61 securities were listed, including 40 shares
and 21 bonds, compared to 57 securities comprising
39 shares and 18 bonds by end-December 2005. As
of December 2006, Ecobank is the sole company
from Togo listed and traded on the stock exchange.
Ecobank is a unique case on the BRVM as it was
cross-listed at the same time on the stock exchanges
of Nigeria and Ghana.
Togo – 145
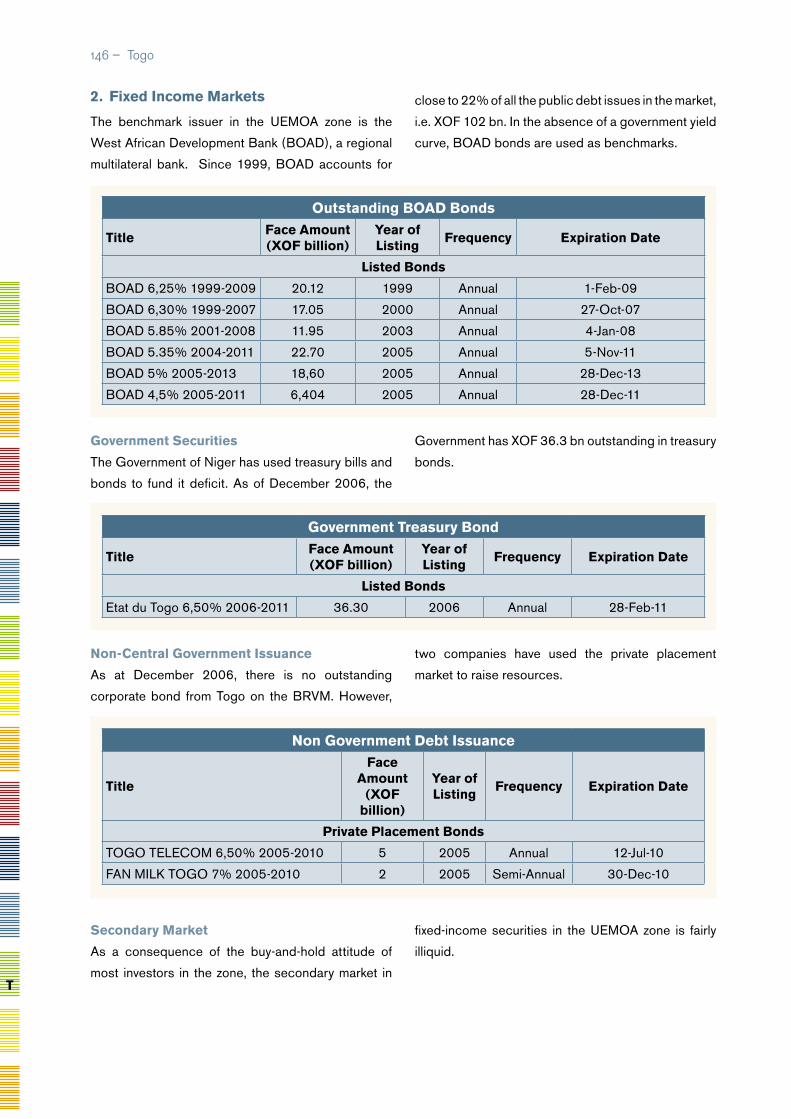
2. FixedIncomeMarkets
The benchmark issuer in the UEMOA zone is the
West African Development Bank (BOAD), a regional
multilateral bank. Since 1999, BOAD accounts for
close to 22% of all the public debt issues in the market,
i.e. XOF 102 bn. In the absence of a government yield
curve, BOAD bonds are used as benchmarks.
OutstandingBOADBonds
TitleFaceAmount(XOFbillion)
YearofListing
Frequency ExpirationDate
ListedBonds
BOAD 6,25% 1999-2009 20.12 1999 Annual 1-Feb-09
BOAD 6,30% 1999-2007 17.05 2000 Annual 27-Oct-07
BOAD 5.85% 2001-2008 11.95 2003 Annual 4-Jan-08
BOAD 5.35% 2004-2011 22.70 2005 Annual 5-Nov-11
BOAD 5% 2005-2013 18,60 2005 Annual 28-Dec-13
BOAD 4,5% 2005-2011 6,404 2005 Annual 28-Dec-11
NonGovernmentDebtIssuance
Title
FaceAmount
(XOFbillion)
YearofListing
Frequency ExpirationDate
PrivatePlacementBonds
TOGO TELECOM 6,50% 2005-2010 5 2005 Annual 12-Jul-10
FAN MILK TOGO 7% 2005-2010 2 2005 Semi-Annual 30-Dec-10
GovernmentTreasuryBond
TitleFaceAmount(XOFbillion)
YearofListing
Frequency ExpirationDate
ListedBonds
Etat du Togo 6,50% 2006-2011 36.30 2006 Annual 28-Feb-11
GovernmentSecurities
The Government of Niger has used treasury bills and
bonds to fund it deficit. As of December 2006, the
Government has XOF 36.3 bn outstanding in treasury
bonds.
Non-CentralGovernmentIssuance
As at December 2006, there is no outstanding
corporate bond from Togo on the BRVM. However,
two companies have used the private placement
market to raise resources.
T
146 – Togo
SecondaryMarket
As a consequence of the buy-and-hold attitude of
most investors in the zone, the secondary market in
fixed-income securities in the UEMOA zone is fairly
illiquid.

ClearingandSettlement
Securities trades on the BRV are cleared through the
central clearing and depository house (Dépositaire
Central Banque de Règlement-DC/BR). DC/BR
has its headquarters in Abidjan and has offices in all
the UEMOA member states. It centralizes issuances
on a dematerialized basis, payment, and delivery of
securities. It also guarantees the settlement of each
transaction and draws on a special guarantee fund
in cases of default. Trading operations are closed
electronically on T+5 and will evolve towards closing
on T+3 by the end of the year 2007.
3. ForeignExchange
The CFA Franc (XOF) is not traded on the foreign
exchange markets but is fully convertible into the Euro,
with the convertibility guaranteed by the French treasury
through a special operations account at the Banque de
France. This arrangement effectively offers practically
unlimited overdraft facilities and allows the CFA states
to avoid short-run balance of payments constraints. In
return, the BCEAO is required to deposit 65% of its
foreign exchange reserves at the central bank of France.
Buying and selling rates of Euro are fixed at XOF 655.957
/ 1 EUR, and other currencies’ rates are determined
on the basis of the Euro rate on the foreign exchange
market. Payments and transfers of capital within the
UEMOA zone and France are unrestricted as well as
and current account transactions. The main restrictions
concern the outflow of capital to countries outside the
WAEMU, which is subject to verification based on the
submission of supporting documentation.
XOFperunitofUSD(EndofYear)
2000 2001 2002 2003 2004 2005 2006450500550600650700750800
Source: Bloomberg
4. Derivatives
The derivative market is in its infancy. Foreign
exchange forwards exist with moderate liquidity and
tenors extending up to 3-6 months.
5. ParticipationofForeignInvestorsandIssuers
The banking sector has a high level of foreign
ownership, particularly by French financial institutions.
Foreign investors can purchase securities listed
on BRVM. For instance, an international non-
governmental organization, Shelter Afrique, based in
Nairobi (Kenya), has issued bonds and listed them on
the BRVM.
6. InvestmentTaxation
Government securities are tax-exempt as oppose
to non-governmental securities that are subject to a
withholding tax (Impôt sur le Revenue des Valeurs
Mobilières-IRVM) applicable to income derived from
these securities. The tax rates are the following:
6% for interest income from bonds redeemable in
less than five years, 10% for dividends paid out by
listed stocks and 12-18% for income from any other
security.
7. KeyContacts
• Banque Centrale des Etats d’Afrique
de l’Ouest (BCEAO)
Mailing Address: BP 120, Lome, Togo
Other Address: Rue Branly, Lome, Togo
Tel: +228-221-5384
Fax: +228-221-7602
Web: www.bceao.int
• Bourse Régionale des Valeurs Mobiliéres
Mailing Address: BP 3802,
Abidjan 01, Côte d’Ivoire
Other Address: 18, Avenue Joseph Anoma/
Rue des Banques, Abidjan, Côte d’Ivoire
Tel: +225-2032-6685
Fax: +225-2032-4777
E-mail: [email protected]
Web: www.brvm.org
Togo – 147

Population (mn) 10.2Population Growth (annual %) 1.1Official Language ArabicCurrency Tunisian Dinar (TND)GDP (Current US$ bn) 30.2GDP Growth (annual %) 5.8GDP Per Capita (US$) 2,962
FDI, net inflows (US$ mn) (2005) 782.4
External Debt (US$ bn) 17.5External Debt/GDP (%) 57.8CPI Inflation (annual %) 4.5Exports of goods and services (% of GDP) 48.2Gross Official Reserves (US$ bn) 5.1Gross Official Reserves (in months of imports) 4.7UNDP HDI RANKING 87Source: AfDB, IMF, UNCTAD, UNDP, UN Population Division
Tunisia
1. OverviewofFinancialSystem
The financial system, while dominated by the banking
industry, also includes a capital markets sector.
The Central Bank of Tunisia, Banque Centrale de
Tunisie (BCT), was established in 1958, and plays
a regulatory and supervisory role over banks and
financial establishments which include enacting
management rules and setting prudential standards.
It acts as the financial and fiscal agent of the
government, and advises on economic and monetary
management issues.
The primary objective of the monetary policy in Tunisia
is to maintain price stability.
The BCT formulates and implements monetary
policies through open market operations and uses
the monetary base as operating target, and inflation
as intermediate operating target.
The capital markets have a marginal role in financing
the economy (7%) compared to the banking industry,
although there have been recent spurts of growth.
The Financial Markets Council, (Conseil du Marché
Financier-CMF), created in 1994, is responsible for
regulating, monitoring and supervising the capital
markets. It oversees and controls the stock market,
24 brokerage companies, mutual funds and the
clearing and settlement house. Twelve banks and one
brokerage company are primary market dealers.
BankandNon-BankFinancialSector
Twenty commercial banks, eight offshore banks
and two merchant banks are operating in the
country. Most commercial banks are also majority
shareholders in leasing companies, and investment
funds. The government maintains a firm control
over the three largest banks (Banque Nationale de
l’Agriculture, Banque de l’Habitat, Société Tunisienne
de Banque).
The banking sector remains dominant, accounting for
over 90% of financing to the economy, but has been
plagued with high levels of non-performing loans.
The authorities are making efforts to strengthen the
sector by improving prudential practices. Reforms
have thus been initiated to ensure the stability of the
banking system, and have led to the improvement of
Sovereignratings
LongTerm
LocalCurrency
ForeignCurrency
Fitch A- BBB
S&P A BBB
Moody’s Baa2 Baa2
GEOATLAS - Copyright1998 Graphi-Ogre0 km 100 200 300 400 km
Cap Bougar'oûn Cap de Fer
Cap Rosa Cap Bon
Ile de la Galite
Ile de Jerba
ILES KERKENNA
Rass Kaboudia
Rass Ben SekaaGolfe de�Tunis
Golfe de�Hammamet
Golfe de�Gabès
Golfe de�la Grande Syrt
M E R �M E D I T E R R A N E E
M E R �M E D I T E R R A N E E
M E R �M E D I T E R R A N E E
Ile de Pantelleria�Italie
Ile de�Lampedusa�
Italie
Menzel Bourguiba
Tunis
El Djazaïr�Alger
–ar$bulus�Tripoli
Sidi Bou ZidKasserine
Kairouan
Zaghouan
SilianaEl Kef
JendoubaBéja
Bizerte
Nabeul
SousseMonastir
Mahdia
Sfax
Ben Arous
Ariana
Gafsa
Tozeur
KebiliGabès
Médenine
Tataouine
Bouïra GuelmaStif
M'sila��
Lemdiyya
Ilizi
Ghardaïa
Laghouat
Wargla
El Wad��
El Djelfa�� Beskra�
�
Bordj�Bou Arreridj��
Batna
KhenchlaTbessa
Oum El�Bouagui
Souk AhrasMila
Qacentina
El TarfAnnabaSkikda
JijelBejaïa
Tizi-Ouzou
Boumerdès
Aïn Defla
El BoulaidaTipaza
Misr$tah
Surt
Ban= Wal=dMizdah
Ghary$nYafranJ$dºN$lºt
Ghad$mis
Ad=r=
Awb$r=
Sabh$
Wadd$n
OuedMia
Djebel Refaa�2170 m
2328 m
1712 m Jebel Chambi�1544 m
1189 m
1200 m
40 m23 m
M ts DES
O ULA
D N AÏL
A TLA S TELLIEN
M fD E L'A U RES Mts DES�NEMENTCHA
A T L AS
S A H A R I EN
GR
AN
D
ER
G
OR
IE
NT
AL
P LA T E
A UD U T IN
G H E R T
JEFFARA
RMEL
EL
ABIO
D
P L A T E A U D UT IN G H E R T
JEFFARA
D ES E
R T�
D E O
U BA R
I
¡AM*DAT ZEGHERO A SIS D E SABH*
AL-H
A
RªJAL-A S W A D
JABAL AS-SAWD*
JABAL�WADD*N
H A M A D A A L H A M R A
JA B A L N A F ª S A H
A L G E R I E
L I B Y E
I T A L I E
S i c i l e �Italie
M A L T E
S a r d a i g n e �Italie
I l e s B a l é a r e s �Espagne
TUNISIE
T
148 – Tunisia
2006AtaGlance
the institutional framework, the adoption of a statutory
and prudential framework that meets with international
banking standards, and a better response to demand
for financing.
The insurance and pension sectors remain very
small. There are 18 local insurance firms and three
offshore insurance firms, and their penetration rate is
quite low (1.8% compared to a world average of 8%).
The insurance sector is expected to provide long-
term resources for private investments. However,
insurance companies have not yet succeeded in
stimulating the development of national savings.
A stronger insurance sector with diversified
product offerings would undoubtedly promote the
development of capital markets by providing long
term resources. Approximately 9.5% of the investors
in bond markets are insurance firms, and 50% are
mutual funds (Organismes de Placement Collectif
en Valeurs Mobilières-OPCVM). There were 45
mutual funds with total assets of USD 2,042 mn as of
31 December 2006.
A Guarantee Fund has been established by a
brokerage firm, Fonds de Garantie de Marché, to
guarantee capital markets transactions in case
of non-payment. It protects stockbrokers against
counterparty risks.
CapitalMarkets
The stock exchange, Bourse des Valeurs Mobilières
de Tunis (BVMT), was established in 1969 and
privatized in 1994. It is regulated and supervised by
the Financial Markets Council. Forty-eight companies,
mostly from the finance industry, were listed on the
BVMT in 2006 with a combined market capitalization of
USD 4,224 mn. Stocks from banks account for more
than 55% of total capitalization. The stock exchange
performance is measured by two indices: the BVMT
index (created in 1990, and currently composed of 32
stocks) and a broader index, the Tunindex (created in
1998 and currently composed of 40 stocks).
During the last decade, the role and efficiency of
capital markets have been improved through various
reforms. The objective of the Tunisian authorities is
to increase by 2009 the capital markets share of
the finance system to 20% and the number of listed
companies to 100.
More than 90% of bonds issued are government
securities. The number of corporate issuers is limited
although fiscal incentives have been offered to induce
listing. Bonds are usually listed on the stock exchange
and therefore regulated and supervised by the CMF.
2. FixedIncomeMarket
GovernmentSecurities
In conducting its monetary policy, the central bank
uses a variety of financial instruments. It auctions
securities every two weeks, using the Dutch auction
system. The day count basis convention used for
treasury securities is actual / 365. Security types are
presented below:
• Treasurybonds(BonsduTrésorAssimilables-
BTA),first launched in 1997 with maturities ranging
from 2-12 years. A total amount of TND 1,010 mn
was issued in 2006.
• Treasurybills(BonsduTrésoràCourtTerme
-BTCT). Maturities can vary from 13, 26 or 52
weeks. A total amount of TND 485 mn was issued
in 2006.
• Azero-coupontreasurybond was launched for
the first time in 2006, with a 10-year maturity. The
issue has been re-opened twice. The amount of
the issue was TND 107 mn.
Foreign investors can only purchase up to 10% of
the estimated semi-annual volume of treasury bonds
issued by the Government. They are not allowed to
invest in T-bills. Repatriation of principal and interest
is only allowed if the purchase was originally made
by converting foreign currency into Tunisian Dinars.
In 2006, foreign-domiciled investment amounted to
0.135% of BTA issuance (0.044% in 2005).
Tunisia – 149

Non-CentralGovernmentIssuance
The share of non-government debt issues remains small compared to total market issuance. Over 42% of
outstanding issues are from banks (TND 299 mn), 45% from leasing companies (TND 315 mn), 7% from the
tourism sector (TND 50 mn), and 1.6% from the factoring sector (TND 11 mn). A total of eight corporate bonds
were launched in 2006, for a total amount of TND 228 mn. Details of these issues are presented in the following
table:
INTErNATIONALISSUANCE
Tunisia has been rated investment grade
since 1994 and was for a long period the only
sovereign in Northern Africa to access the
international capital markets. Tunisia has been
a regular issuer in both Samurai and Yankee
bonds, with maturities ranging from 2-30 years.
Tunisia issues approximately EUR 500 mn per
year. All borrowings in the international capital
markets are conducted by the central bank.
SecondaryMarket
The secondary market is small. About TND 40 mn
Tunisian Dinars in bond issues were traded in the
secondary market in 2006. The primary market
dealers are market makers for BTAs.
ClearingandSettlement
The Société Tunisienne Interprofessionnelle pour
la Compensation et le Dépôt de Valeurs Mobilières
Corporateissuesin2006
Issuer Sector AmountinTND Coupon* Maturity
Attijari Bank** Bank 80 000 000 4.82% 5 years
Amen Bank Bank 40 000 000 TMM+1% 10 years
Unifactor Factoring 10 000 000 6.50% or TMM+1% 5 years
BTKD Bank 40 000 000 6.25% 5 years
Tunisie Leasing Leasing 15 000 000 6.5% or TMM + 1% 5 years
El Wifack Leasing Leasing 5 000 000 6.5% or TMM + 1% 5 years
ATL Leasing 30 000 000 6.5% or TMM + 1% 7 years
El Mouradi Hotel 8 000 000 6.50% 7 years
* TMM is the monthly money market rate** convertible bond
150 – Tunisia
T
TunisiaYieldCurve(End2006)
5.00
5.50
6.00
6.50
7.00
52 Wks 6 Y 7Y 10Y
%
Source: Financial Markets Council
(STICODEVAM) is the clearing and settlement
house, as well as the central depository for
securities. All brokers and banks are members of the
STICODEVAM.
3.ForeignExchange
Starting in 1992, a flexible exchange rate regime
has been established as a key element of the country’s
macro-economic policy. The Tunisian Dinar is pegged
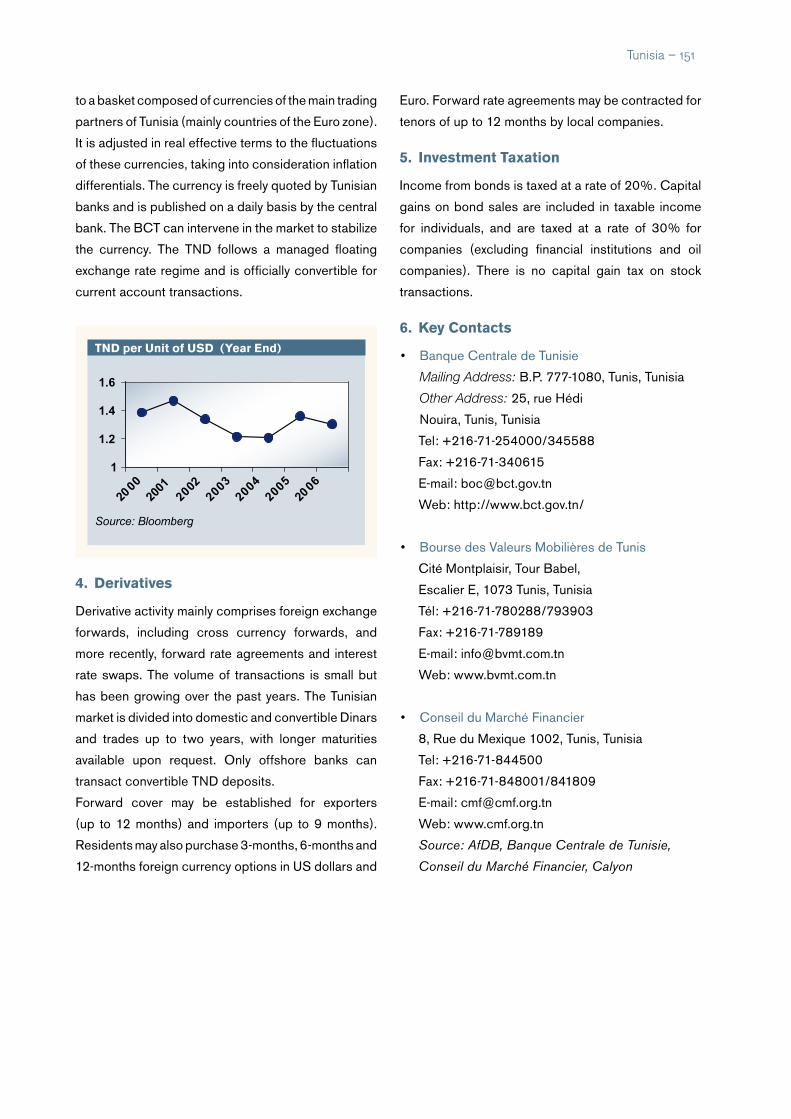
to a basket composed of currencies of the main trading
partners of Tunisia (mainly countries of the Euro zone).
It is adjusted in real effective terms to the fluctuations
of these currencies, taking into consideration inflation
differentials. The currency is freely quoted by Tunisian
banks and is published on a daily basis by the central
bank. The BCT can intervene in the market to stabilize
the currency. The TND follows a managed floating
exchange rate regime and is officially convertible for
current account transactions.
4. Derivatives
Derivative activity mainly comprises foreign exchange
forwards, including cross currency forwards, and
more recently, forward rate agreements and interest
rate swaps. The volume of transactions is small but
has been growing over the past years. The Tunisian
market is divided into domestic and convertible Dinars
and trades up to two years, with longer maturities
available upon request. Only offshore banks can
transact convertible TND deposits.
Forward cover may be established for exporters
(up to 12 months) and importers (up to 9 months).
Residents may also purchase 3-months, 6-months and
12-months foreign currency options in US dollars and
Euro. Forward rate agreements may be contracted for
tenors of up to 12 months by local companies.
5. InvestmentTaxation
Income from bonds is taxed at a rate of 20%. Capital
gains on bond sales are included in taxable income
for individuals, and are taxed at a rate of 30% for
companies (excluding financial institutions and oil
companies). There is no capital gain tax on stock
transactions.
6. KeyContacts
• Banque Centrale de Tunisie
Mailing Address: B.P. 777-1080, Tunis, Tunisia
Other Address: 25, rue Hédi
Nouira, Tunis, Tunisia
Tel: +216-71-254000/345588
Fax: +216-71-340615
E-mail: [email protected]
Web: http://www.bct.gov.tn/
• Bourse des Valeurs Mobilières de Tunis
Cité Montplaisir, Tour Babel,
Escalier E, 1073 Tunis, Tunisia
Tél: +216-71-780288/793903
Fax: +216-71-789189
E-mail: [email protected]
Web: www.bvmt.com.tn
• Conseil du Marché Financier
8, Rue du Mexique 1002, Tunis, Tunisia
Tel: +216-71-844500
Fax: +216-71-848001/841809
E-mail: [email protected]
Web: www.cmf.org.tn
Source: AfDB, Banque Centrale de Tunisie,
Conseil du Marché Financier, Calyon
TNDperUnitofUSD(YearEnd)
1
1.2
Source: Bloomberg
1.4
1.6
2000
2001
20022003
20042005
2006
Tunisia – 151

Population (mn) 29.8Population Growth (annual %) 3.5Official Language (s) EnglishCurrency Ugandan Shilling (UGX)GDP (Current US$ bn) 9.4GDP Growth (annual %) 5.4GDP Per Capita (US$) 315FDI, net inflows (US$ mn) (2005) 473External Debt (US$ mn) 3,900External Debt / GDP (%) 41.7CPI Inflation (annual %) 6.6Exports of goods and services (% of GDP) 13.8Gross Official Reserves (US$ bn) 1.49Gross Official Reserves (in month of imports) 9UNDP HDI RANKING 145Source: AfDB, IMF, UNCTAD, UNDP, UN Population Division
1. OverviewofFinancialSystem
The Bank of Uganda (BoU), the nation’s central
bank, is responsible for the licensing, supervision
and regulation of the banking system. The mission
of the BoU is to foster price stability and a sound
financial system.
BankandNon-BankFinancialSector
Uganda has a financial system dominated by the
banking sector. In 2006, this sector had 13 registered
commercial banks and 2 development banks. The
banking sector is also characterised by a high degree
of foreign ownership. The largest bank, the successor
to the state-owned Uganda Commercial Bank, was
purchased by a South African bank in 2002. 3 other
foreign banks account for approximately 75% of
Uganda’s banking sector assets. A deposit insurance
fund with contributions from the central bank and
commercial banks has recently been created, though
its soundness is largely untested to date.
In 2005, there were also 7 savings and loan institutions
and over 100 micro-finance institutions. Despite their
large number, micro-finance institutions accounted
for only 1% of the financial sector, while other non-
bank financial institutions accounted for 7% (2005).
The insurance sector remains a small part of the
financial system. There were 15 licensed insurance
companies in 2006, all under the supervision of the
Uganda Insurance Commission (UIC), a regulatory
and supervisory authority for the insurance industry
in Uganda.
Some recent developments include the planned
privatization of the National Insurance Company and
the creation by the Uganda Insurers’ Association of a
reinsurance company, Uganda-Re.
CapitalMarkets
The capital market in Uganda is small and centered
around the Uganda Securities Exchange (USE),
which opened in 1988. The sector is supervised
Uganda
GEOATLAS - Copyright1998 Graphi-Ogre0 km 100 200 300 400 km
Nebbi Moroto
KapchorwaMbale
KumiSoroti
Lira
Apac
KamuliTororo
IgangaJinjaMukono
Masindi
Luwero
Hoima
Mubende
Mpigi
Masaka
Rakai
BundibugyoFort Portal
Kasese
MbararaBushenyi
Rukungiri
Kabale
Bukavu
Goma
Kindu
Kisangani
Kigoma
Bukoba
Mwanza
Shinyanga
Musoma
MoshiArusha
Singida
Nyeri
Kakamega
KisumuNakuru
Embu
Gambela
Awasa
Yambio
Uwayl
W$wW$r$b
Rumbek
Juba Kapoeta
Bor
Obo
Moyo
AruaGulu
Kitgum
Kotido
Kigali
Bujumbura
Kampala
Nairobi
Lac�Turkana
Lac�Chew Bahir
Lac�Abaya
Lac�Awasa
Lac�Shala
Lac�Kivu
Lac�Albert
Lac�Victoria
Lac�Eyasi
Lac�Manyara
Lac�Natron
Lac�Edward
Lac Kyoga
Akºbº
A kobo
Ouara
Achw
a
Jur
Kyom
Baro
G ilo
Kan
gen
Omo
G ojeb
Omo
Nil
Albe
rt
Nil
Blanc
Nil
Blanc
Lom
ami
Lindi
Maiko
Lowa
U lindi
Lualaba
Katong
Ka
gera
Ro
vubo
Ruvu
bu
M ala
garasi
Moyo w
osi
Igo
m bePangani
Athi
Wem
bere
Turkwel
Ituri
Kafo
N ilVictoria
Volcan�Karisimbi�4507 m
Margherita�Peak�
5109 m
Mt.�Elgon�4321 m
Mt�Meru�
4565 m
Kilimanjaro�5895 m
Kifinyaga�5199 m
Guge�4200 m
Songot�1755 m
Jabal Lotuke�2963 m
Kinyeti�3187 m
Zulia�2149 m
PLAINE DU�
SERENGETI
STEPPE�
MASAI�
�
CRATERE DU�NGORONGORO
KI
LIM
AN
JA
RO Mts�
USAMBARA
RUWENZORI
RI
FT
VA
LL
EY
COLLINES�CHERANGANY
PLATEAU DE YATTA
ABERDARE
MONTS BLEUS
DESERT CHALBI
PLAINE�
LOTIKIPI
Mts�
DIDINGA
R E P U B L I Q U E �
D E M O C R A T I Q U E �
D U C O N G O
K E N Y A
T A N Z A N I E
BURUNDI
RWANDA
E T H I O P I ES O U D A NREPUBLIQUE�CENTRAFRICAINE
OUGANDA
Sovereignratings
LongTerm
LocalCurrency
ForeignCurrency
Fitch B B
U
152 – Ugand�a
2006AtaGlance

by the Capital Markets Authority of Uganda. The
three regulatory authorities of Kenya, Uganda and
Tanzania signed a Memorandum of Understanding
in 1997 and created an umbrella body known as
the East African Securities Regulatory Authorities
(EASRA). The EASRA seeks to introduce cross-
border listings of securities, harmonize the legal and
regulatory framework and develop capital markets in
the region.
The regulatory framework for capital markets is
defined by the Capital Markets Act (Cap 84) of the
Laws of Uganda, 2000. The regulatory framework
governing capital market activity in Uganda also
comprises of the Capital Markets Regulations
(1999), the Companies Act (cap 110) and the Listing
Rules of the USE. Under these statutes, the Capital
Markets Authority is the primary capital markets
regulator. In recent years, both the Capital Markets
Authority and USE regulations have been updated
to reflect changes in the market environment. In
2003, the USE issued revised Listing Rules for the
Exchange, and the Capital Markets Authority also
issued specific guidelines for corporate bonds.
The securities that are currently traded on the USE
include government bonds, corporate bonds and
ordinary shares. As at the first quarter of 2007, there
were nine companies listed on the Exchange. These
represent both local and cross listings, with a total
market capitalisation of approximately UGX 4,000
bn (USD 2.2 bn). The improvement in trading activity
in recent years has been attributed to the sustained
growth of foreign investor participation in Uganda’s
listed entities.
The USE is open for trading on only three days during
the week, Mondays, Tuesdays and Thursdays.
2. FixedIncomeMarkets
GovernmentSecurities
Treasury bills comprise of 91-, 182-, 273- and
364-day instruments, while issued treasury bonds
are for 2-, 3-, 5- and 10-year maturities. The short-
term securities are used by the central bank to
regulate market movements in exchange rate and
inflation. Primary issues are done through a multiple
price auction system, with bids accepted on both
competitive and non-competitive basis. Treasury
bills are auctioned on a weekly basis, compared to
treasury bonds that are issued monthly, with no set or
pre-determined issuance calendar being in place. As
at December 2006, total outstanding treasury debt
issues amounted to UGX 1,945 bn (USD 1.2 bn).
As at the first quarter of 2007, the ratio of Treasury
bills to Treasury bonds stood at 51:49. The BoU aims
to achieve an optimal debt mix of bills to bonds of
40:60.
A primary dealer system was introduced in January
2004, with the appointment of five commercial banks,
namely Barclays Bank, Standard Chartered Bank,
Stanbic Bank, Bank of Baroda and DFCU Bank.
These firms buy government securities at auction
prices and sell to investors in the market, in a bid to
increase market efficiency by encouraging secondary
market trading of securities.
Treasury bonds were launched for the first time in
Uganda on 14 January 2004, with a 2-year issue.
Following the success of the issue, 3-, 5- and 10-year
bonds were launched in February, March, and May of
2004, respectively. The 2- and 3-year issues proved
the most popular and have each been reopened
several times. Auctions of two new 3- and 2-year
bonds took place in August 2006 and December
2006 respectively.
The central bank aims to issue more long-term
instruments as opposed to short-term securities,
in order to meet demand for securities as the
domestic market expands and more market players
get involved.
Ugand�a – 153
BankofUganda(BoU)YieldCurve(March2007)
9.5
10.5
11.5
12.5
91-days 182-days 364-days 2-yr 3-yr 5-yr 10-yr
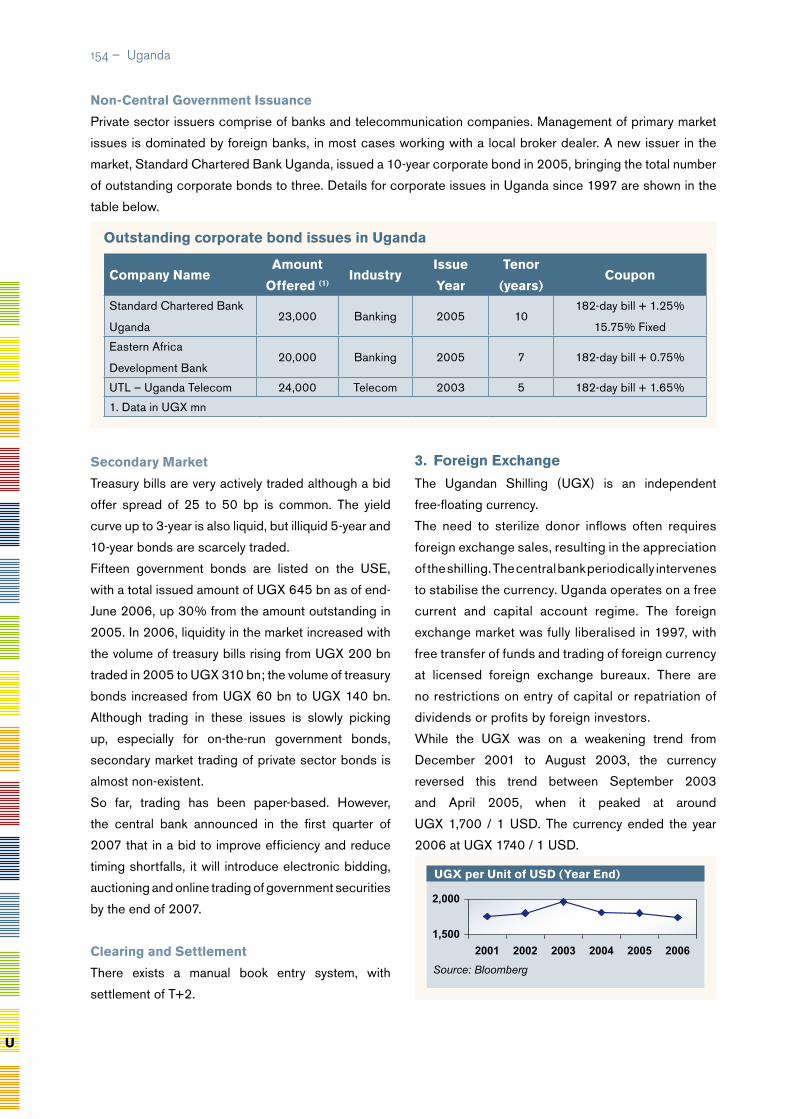
SecondaryMarket
Treasury bills are very actively traded although a bid
offer spread of 25 to 50 bp is common. The yield
curve up to 3-year is also liquid, but illiquid 5-year and
10-year bonds are scarcely traded.
Fifteen government bonds are listed on the USE,
with a total issued amount of UGX 645 bn as of end-
June 2006, up 30% from the amount outstanding in
2005. In 2006, liquidity in the market increased with
the volume of treasury bills rising from UGX 200 bn
traded in 2005 to UGX 310 bn; the volume of treasury
bonds increased from UGX 60 bn to UGX 140 bn.
Although trading in these issues is slowly picking
up, especially for on-the-run government bonds,
secondary market trading of private sector bonds is
almost non-existent.
So far, trading has been paper-based. However,
the central bank announced in the first quarter of
2007 that in a bid to improve efficiency and reduce
timing shortfalls, it will introduce electronic bidding,
auctioning and online trading of government securities
by the end of 2007.
ClearingandSettlement
There exists a manual book entry system, with
settlement of T+2.
Non-CentralGovernmentIssuance
Private sector issuers comprise of banks and telecommunication companies. Management of primary market
issues is dominated by foreign banks, in most cases working with a local broker dealer. A new issuer in the
market, Standard Chartered Bank Uganda, issued a 10-year corporate bond in 2005, bringing the total number
of outstanding corporate bonds to three. Details for corporate issues in Uganda since 1997 are shown in the
table below.
CompanyNameAmount
Offered(1)Industry
Issue
Year
Tenor
(years)Coupon
Standard Chartered Bank
Uganda 23,000 Banking 2005 10
182-day bill + 1.25%
15.75% Fixed
Eastern Africa
Development Bank20,000 Banking 2005 7 182-day bill + 0.75%
UTL – Uganda Telecom 24,000 Telecom 2003 5 182-day bill + 1.65%
1. Data in UGX mn
OutstandingcorporatebondissuesinUganda
U
154 – Ugand�a
UGXperUnitofUSD(YearEnd)
1,500
2,000
2001 2002 2003 2004 2005 2006
Source: Bloomberg
3. ForeignExchange
The Ugandan Shilling (UGX) is an independent
free-floating currency.
The need to sterilize donor inflows often requires
foreign exchange sales, resulting in the appreciation
of the shilling. The central bank periodically intervenes
to stabilise the currency. Uganda operates on a free
current and capital account regime. The foreign
exchange market was fully liberalised in 1997, with
free transfer of funds and trading of foreign currency
at licensed foreign exchange bureaux. There are
no restrictions on entry of capital or repatriation of
dividends or profits by foreign investors.
While the UGX was on a weakening trend from
December 2001 to August 2003, the currency
reversed this trend between September 2003
and April 2005, when it peaked at around
UGX 1,700 / 1 USD. The currency ended the year
2006 at UGX 1740 / 1 USD.
4. Derivatives
There is no formal forward market but corporate
clients can have access to foreign exchange
forward contracts, for tenors up to 365-days from
their banks.
5. ParticipationofForeignInvestorsandIssuers
Foreign investors can participate in bond offerings
by the Bank of Uganda and must submit their
applications through domestic primary dealers. There
are no restrictions on the entry or repatriation of funds
by foreign investors in the Ugandan capital market.
6. InvestmentTaxation
Withholding tax stands at 15% on interest and
dividend income. Uganda has entered into tax treaties
with Denmark, Norway, South Africa, the United
Kingdom and Zambia.
Ugand�a – 155
7. KeyContacts
• Bank of Uganda
Mailing Address: P.O. Box 7120,
Kampala, Uganda
Other Address: 37/43 Kampala Road,
Kampala, Uganda
Tel: +256-41-258441-6/258060-9/259090
Fax: +256-41-230878/233818
E-mail: [email protected]
Web: www.bou.or.ug
• Capital Markets Authority
Mailing Address: P.O. Box 24565
Kampala, Uganda
Other Address: 8th Floor, Jubilee Insurance
Centre, 14 Parliament Avenue,
Kampala, Uganda
Tel: +256-41-342788/342791
Fax: +256-41-342803
E-mail: [email protected]
Web: www.cmauganda.co.ug
• Uganda Securities Exchange Ltd.
Mailing Address: P.O. Box 23552,
Kampala, Uganda
Other Address: Plot 1, Pilkington Road,
Workers’ House 2nd Floor, Northern Wing,
Kampala, Uganda
Tel: +256-41-343297/342818
Fax: +256-41-342841
E-mail: [email protected]
Web: www.use.or.ug
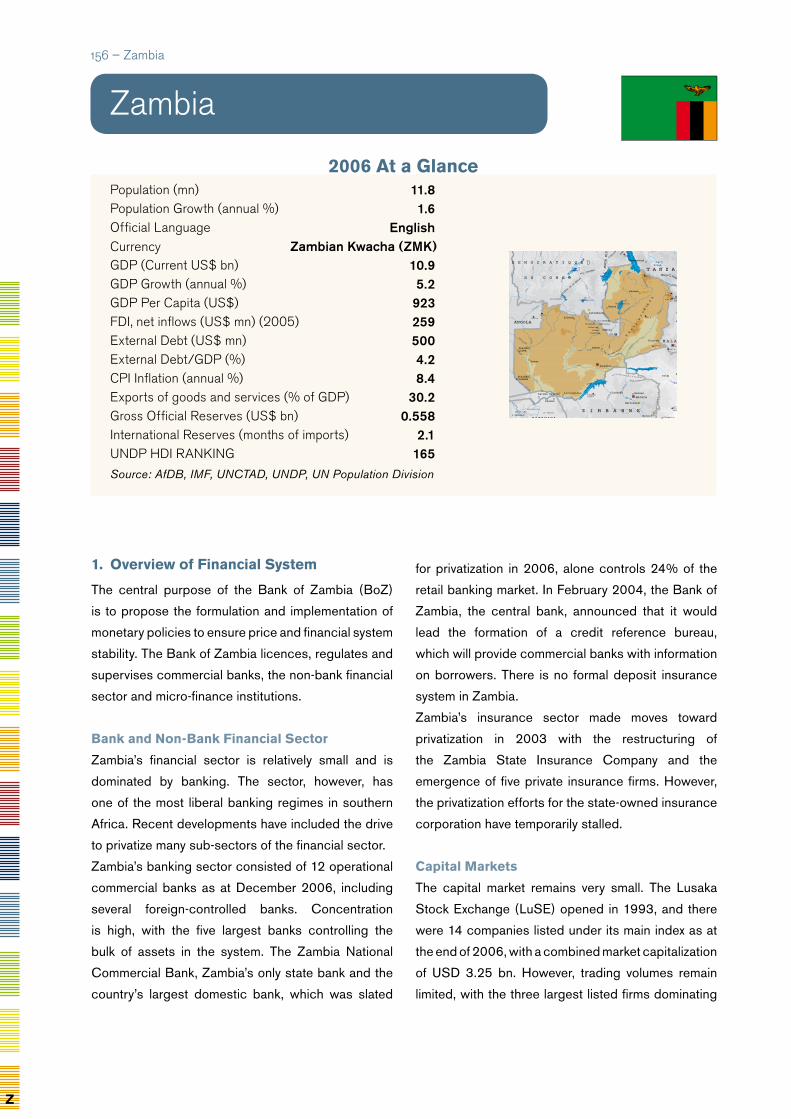
Population (mn) 11.8Population Growth (annual %) 1.6Official Language EnglishCurrency Zambian Kwacha (ZMK)GDP (Current US$ bn) 10.9GDP Growth (annual %) 5.2GDP Per Capita (US$) 923FDI, net inflows (US$ mn) (2005) 259External Debt (US$ mn) 500External Debt/GDP (%) 4.2CPI Inflation (annual %) 8.4Exports of goods and services (% of GDP) 30.2Gross Official Reserves (US$ bn) 0.558International Reserves (months of imports) 2.1UNDP HDI RANKING 165Source: AfDB, IMF, UNCTAD, UNDP, UN Population Division
1. OverviewofFinancialSystem
The central purpose of the Bank of Zambia (BoZ)
is to propose the formulation and implementation of
monetary policies to ensure price and financial system
stability. The Bank of Zambia licences, regulates and
supervises commercial banks, the non-bank financial
sector and micro-finance institutions.
BankandNon-BankFinancialSector
Zambia’s financial sector is relatively small and is
dominated by banking. The sector, however, has
one of the most liberal banking regimes in southern
Africa. Recent developments have included the drive
to privatize many sub-sectors of the financial sector.
Zambia’s banking sector consisted of 12 operational
commercial banks as at December 2006, including
several foreign-controlled banks. Concentration
is high, with the five largest banks controlling the
bulk of assets in the system. The Zambia National
Commercial Bank, Zambia’s only state bank and the
country’s largest domestic bank, which was slated
for privatization in 2006, alone controls 24% of the
retail banking market. In February 2004, the Bank of
Zambia, the central bank, announced that it would
lead the formation of a credit reference bureau,
which will provide commercial banks with information
on borrowers. There is no formal deposit insurance
system in Zambia.
Zambia’s insurance sector made moves toward
privatization in 2003 with the restructuring of
the Zambia State Insurance Company and the
emergence of five private insurance firms. However,
the privatization efforts for the state-owned insurance
corporation have temporarily stalled.
CapitalMarkets
The capital market remains very small. The Lusaka
Stock Exchange (LuSE) opened in 1993, and there
were 14 companies listed under its main index as at
the end of 2006, with a combined market capitalization
of USD 3.25 bn. However, trading volumes remain
limited, with the three largest listed firms dominating
Zambia
GEOATLAS - Copyright1998 Graphi-Ogre0 km 100 200 300 400 km
OCEAN�PACIFIQUE
Lubumbashi
Kabwe
Kasama
Mansa
Chipata
Solwezi
Mongu
LivingstoneKatima Mulilo��
KasaneMarondera
MazoweChinhoyi
MutareGweru
MasvingoBulawayo
Chimoio
Beira
Tete
Lichinga
Sumbawanga
Mbeya
Iringa
Songea
Luanshya
Kalulush
Chingola
Chililabombwe
Mufulira
Kitwe
Mzuzu
Ndola
Blantyre
Lusaka
Harare
Lilongwe
Lac �Upemba
Lac �Delcommune Lac �
Tshangalele
Lac�Mweru
Lac�Bangweulu
Lac�Tanganyika
Lac�Rukwa
Lac Nyasa�-Lac Malawi-
Lac�Chilwa
Lac�Malombe
Lac�Chiuta
Lac Kariba
Lac de Cahora Bassa
C uácua
Cass
ai
Lulua
Luilu
Lubilash
Luvua
Lualaba
Lufira
Rungwa
Njo
m
be
Messinge
Chire
Shire
Hunyani
Z ambèze
Z am bèze
Z
am bèze
Zam
bèze
Z am b
èz
e
Lungwe
bungu
Lu
anginga
Kw
ando
KwandoO kavango
Gwai
Umniat
i
Kafue
Kafue
Lung
a
Luangw
a
Lunsem fw a
Luan
gwa
K afue
Luapula
Luapula
Ch
ambeshi
Chambeshi
Lufub
u
Z
am bèze
G
reat
Ru
ah
a
Monte Binga�2436 m
Tundazi�1433 m
Serra�Gorongosa�1856 m
2207 m
Nganda�2606 m
2148 m
1850 m
1660 m
1891 m
2164 m
2067 m
2460 m
1612 m
1450 m
NYIKA�PLATEAU
Mt MULANJE
ESC A R P EM E N T D U Z A M B EZ E
M tsM A V U RA D ON A
Mts
IN
YAN
GA
DEPRESSION�
DE MABABEDELTA DE�
L'OKAVANGO
PLAINE�LIUWA
PLAINES�SILOWANA
MONTS
MU
CHIN
GA
ESCA RP
EMEN
T DES
MUCHINGA
KIPENGERE RANGE
COLLINES�
MLALA
M ts.M
ALIMBA
MARUNGU
Mts. MULUM
BE
PLATEAU DE LA MANIKA
MONTS MITUMBA
B O T S W A N A
Z A M B I E
Z I M B A B W E
M A L A W I
ANGOLA
R E P U B L I Q U E �
D E M O C R A T I Q U E �
D U C O N G O
T A N Z A N I E
Z
156 – Zambia
2006AtaGlance
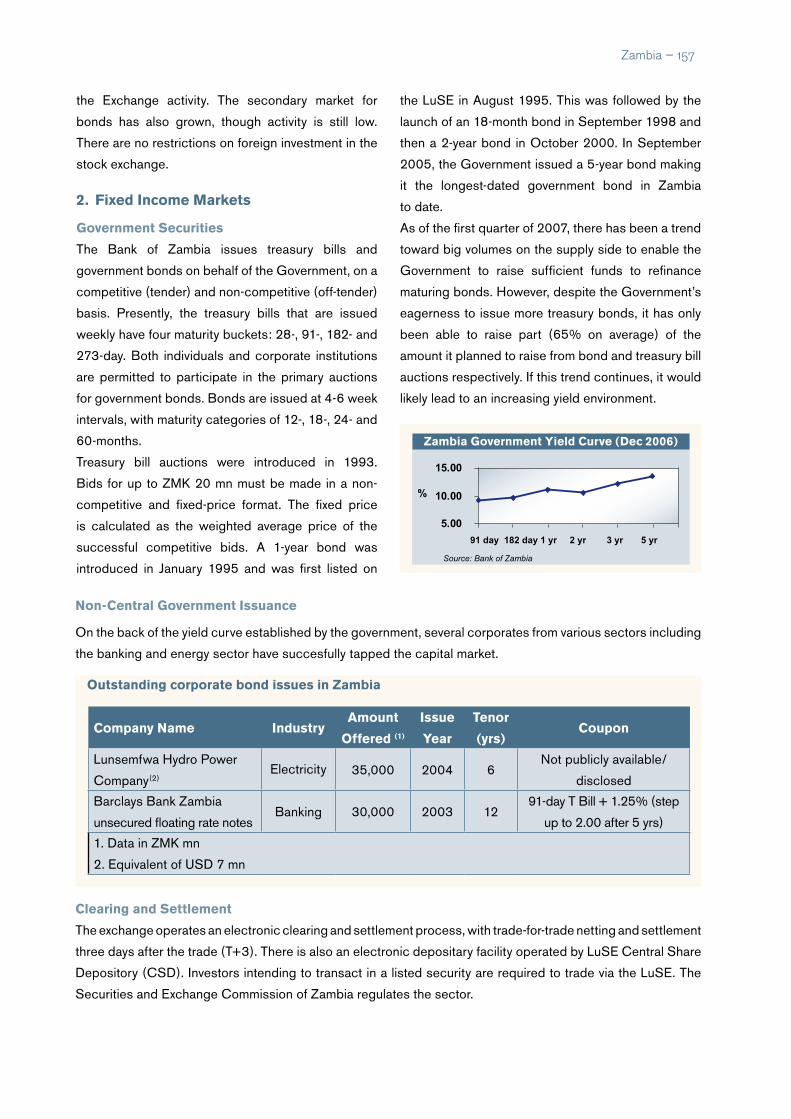
Zambia – 157
the Exchange activity. The secondary market for
bonds has also grown, though activity is still low.
There are no restrictions on foreign investment in the
stock exchange.
2. FixedIncomeMarkets
GovernmentSecurities
The Bank of Zambia issues treasury bills and
government bonds on behalf of the Government, on a
competitive (tender) and non-competitive (off-tender)
basis. Presently, the treasury bills that are issued
weekly have four maturity buckets: 28-, 91-, 182- and
273-day. Both individuals and corporate institutions
are permitted to participate in the primary auctions
for government bonds. Bonds are issued at 4-6 week
intervals, with maturity categories of 12-, 18-, 24- and
60-months.
Treasury bill auctions were introduced in 1993.
Bids for up to ZMK 20 mn must be made in a non-
competitive and fixed-price format. The fixed price
is calculated as the weighted average price of the
successful competitive bids. A 1-year bond was
introduced in January 1995 and was first listed on
the LuSE in August 1995. This was followed by the
launch of an 18-month bond in September 1998 and
then a 2-year bond in October 2000. In September
2005, the Government issued a 5-year bond making
it the longest-dated government bond in Zambia
to date.
As of the first quarter of 2007, there has been a trend
toward big volumes on the supply side to enable the
Government to raise sufficient funds to refinance
maturing bonds. However, despite the Government’s
eagerness to issue more treasury bonds, it has only
been able to raise part (65% on average) of the
amount it planned to raise from bond and treasury bill
auctions respectively. If this trend continues, it would
likely lead to an increasing yield environment.
CompanyName IndustryAmount
Offered(1)
Issue
Year
Tenor
(yrs)Coupon
Lunsemfwa Hydro Power
Company(2)Electricity 35,000 2004 6
Not publicly available/
disclosed
Barclays Bank Zambia
unsecured floating rate notesBanking 30,000 2003 12
91-day T Bill + 1.25% (step
up to 2.00 after 5 yrs)
1. Data in ZMK mn
2. Equivalent of USD 7 mn
OutstandingcorporatebondissuesinZambia
ZambiaGovernmentYieldCurve(Dec2006)
5.00
10.00
15.00
91 day 182 day 1 yr 2 yr 3 yr 5 yr
%
Source: Bank of Zambia
Non-CentralGovernmentIssuance
On the back of the yield curve established by the government, several corporates from various sectors including
the banking and energy sector have succesfully tapped the capital market.
ClearingandSettlement
The exchange operates an electronic clearing and settlement process, with trade-for-trade netting and settlement
three days after the trade (T+3). There is also an electronic depositary facility operated by LuSE Central Share
Depository (CSD). Investors intending to transact in a listed security are required to trade via the LuSE. The
Securities and Exchange Commission of Zambia regulates the sector.

3. ForeignExchange
The Zambian Kwacha (ZMK) is an independent free-
floating currency. Interventions in the foreign exchange
market by the Bank of Zambia are primarily aimed at
smoothing out short-term fluctuations in the market,
and meeting the targets for the programmed gross
international reserves. The successful introduction of
an inter-bank market for foreign exchange in July 2003
was considered an important step towards improving
the efficiency of the markets.
In 2004, the Zambian Kwacha was generally stable
against the US dollar but it appreciated in real
effective terms by about 8%, following, (i) an increase
in copper export earnings, which was boosted by
higher copper prices and metals output, (ii) growth
of non-metal exports that exceeded expectations
and, (iii) a subsequent increase in gross international
reserves.
Exchange rate dynamics in 2005 were largely driven
by reduced debt service and increased balance of
payments support inflows, as Zambia reached the
Enhanced HIPC completion point. The Kwacha
appreciated to ZMK 3,387.55 / 1 USD compared
to its level of ZMK 4,597.43 / 1 USD in December
2004. It continued to appreciate, reaching a level of
ZMK 2,975 / 1 USD in May 2006. The impressive
appreciation of the Kwacha is due to an increased
supply of foreign exchange that is attributed to the
improved performance of the export sector, prudent
fiscal management and lower debt service payments.
It has since softened and traded at ZMK 4,428 / 1
USD as of 31 December 2006.
Z
158 – Zambia
4. Derivatives
There are limited derivative contracts in foreign
exchange and these are mostly short-term in nature
i.e. up to twelve month tenor.
5. ParticipationofForeignInvestorsandIssuers
There are no restrictions on foreign investor
participation in the listed securities on the LuSE and
foreigners may invest on the stock exchange on similar
terms as Zambians. Foreign investors are, however,
required to open a share-dealing account with one
of the authorised brokers before they start dealing in
securities. There is no limit on foreign ownership.
6. InvestmentTaxation
Under the current legislation, the income earned
on Treasury Bills is subject to 15% withholding tax.
However, interest income earned on bonds is not
subject to tax under the same legislation. There is also
no capital gains tax as well as nil property transfer tax
on local shares. Listed companies are taxed at 30%
and there is a 10% withholding tax on dividends.
Zambia has treaties with Canada, Denmark, Finland,
France, Germany, India, Italy, Japan, Kenya, the
Netherlands, and Norway.
ZMKPerUnitofUSD(YearEnd)
3500
4000
4500
5000
2001 2002 2003 2004 2005 2006
Source: Bloomberg

Zambia – 159
7. KeyContacts
• Bank of Zambia
Bank Square
Cairo Road Lusaka, Zambia
Tel: 260-1-228.888/ 228.903-20
Fax: 260-1-221722/237070
E-mail: [email protected]
Web: www.boz.zm
• Lusaka Stock Exchange
3rd Floor Farmers House Building,
Cairo Road, Lusaka, Zambia
Tel: 260-1-228391/228537/228594
Fax: 260-1-225969
E-mail: [email protected]
Web: www.luse.co.zm
• Securities And Exchange Commission
5th Floor, Bank of Zambia Annex, Lusaka, Zambia
Tel: 260-1-226911
Fax: 260-1-225443

Population (mn) 13.1Population Growth (annual %) 0.6Official Language EnglishCurrency Zimbabwe Dollar (ZWD)GDP (Current US$ bn) 7.03GDP Growth (annual %) -5.1GDP Per Capita (US$) 538FDI, net inflows (US$ mn) (2005) 103External Debt (US$ mn) 5.1External Debt/GDP (%) 62CPI Inflation (annual %) 1216Exports of goods and services (% of GDP) 26.1Gross Official Reserves (US$ bn) –Gross Official Reserves (in months of imports) –UNDP HDI RANKING 151Source: AfDB, IMF, UNCTAD, UNDP, UN Population Division
1. OverviewofFinancialSystem
The Central Bank of Zimbabwe is the monetary
authority of the country, responsible for the oversight
of the financial system and for conducting all monetary
policy operations. Zimbabwe has for the past three
years suffered from hyperinflation and in 2006 it had
the highest level of inflation level in the whole of Africa.
In the past ten years, inflation has increased sharply
from an annual rate of 20% in December 1997 to a
peak of 1,594% in February 2007.
BankandNon-BankFinancialSector
Zimbabwe has been increasingly isolated from the
international community and its financial sector has
diminished greatly. The banking sector is comprised
of 17 commercial banks. 3 commercial banks,
including the largest bank, have some degree of
state ownership, and all other commercial banks are
privately owned. 4 of Zimbabwe’s private commercial
banks are foreign-owned. A number of banks have
recently been faced with liquidity crises due to the
worsening economic state of the country.
The insurance sector in Zimbabwe consists of 9
life insurance firms, 26 general insurance firms
and six re-insurers, all under the supervision of the
Zimbabwe Ministry of Finance, Economic Planning
and Development.
In December 2003, the Government submitted to
Parliament the Anti-Money Laundering and Proceeds
from Crime Bill; it would apply to all forms of money
laundering, requiring banks to maintain sufficient
records to reconstruct individual transactions for at
least six years.
Steps towards achieving this have been taken, as in
November 2005, the Central Bank implemented the
Anti-Money Laundering (AML) Solution that aims to
tackle laudering activities like threshold breacheds,
round tripping of funds and dribbling of funds.
CapitalMarkets
Zimbabwe’s capital markets revolves around the
Zimbabwe Stock Exchange (ZSE), which had a
market capitalisation of about USD 20 bn as at the
end of 2006. The stock market has offered investors
the highest returns in Africa in 2005 and for most
of 2006, despite a deep economic recession. This
Zimbabwe
GEOATLAS - Copyright1998 Graphi-Ogre0 km 100 200 300 400 km
Ile de Bazaruto
Ponta da Barra
Pointe St-Sébastien
Ponta da Barra Falsa
Baie�de Inhambane
Baie �de SofalaO C E A N �
I N D I E N
Zvishavane
ChitungwisaChegutu
Kadoma
Redcliff
Kwekwe
Hwange
Pietersburg
Nelspruit
Lubumbashi
Kabwe
Chipata
Ndola
Solwezi
Mongu
LivingstoneKatima Mulilo��
Molepolole
Kasane
Maun
Francistown
Serowe
Mochudi
Kanye
Marondera
MazoweChinhoyi
Mutare
Gweru
MasvingoBulawayo
Gwanda
Inhambane
Xai-Xai
Chimoio
Beira
Tete
Lichinga
Blantyre
Mzuzu
Gaborone
Pretoria
Lusaka
Harare
Lilongwe
Messinge
C uácua
Chire
Shire
Hunyani
Z ambèze
Z am bèze
Z
am bèze
Zam
bèze
Lungwe
bungu
Lu
anginga
Kw
ando
KwandoO kavango
Gwai
Umniat
i
Save
Sabi
Lundi
Mtilik
we
Changa
ne
Lim
popo
Lim popo
Limpopo
Marico
Krokodil
Mokolo
Mogalakw
ena
O lifants
G root-Letaba
KrokodilM olop
o
Shash e Nuanetsi
Kafue
Kafue
Lung
a
Luangw
a
Lunsem fw a
Kafue
Luapula
Z
am bèze
Makgadikgadi
Lac Nyasa�-Lac Malawi-
Lac�Chilwa
Lac�Malombe
Lac�Chiuta
Lac Kariba
Lac de Cahora Bassa
Monte Binga�2436 m
Inyangani�2592 m
Tundazi�1433 m
Nyangui�2230 m
W A TERBERG
E
W I T W A T E R S R A N T
Mt MULANJE
ESC A R P EM E N T D U Z A M B EZ E
M tsM A V U RA DON A
Mts
IN
YAN
GA
COLLINES�
MATOPOS
DEPRESSION�
DE MABABEDELTA DE�
L'OKAVANGO
D E S E R T �
D U �
K A L A H A R I
PLAINE�LIUWA
PLAINES�SILOWANA
MONTS
MUCHINGA
ESCA RP
EMEN
T DES
MUCHINGA
B O T S W A N A
A F R I Q U E D U S U D
M A L A W IZ A M B I E
A N G O L AREPUBLIQUE�DEMOCRATIQUE�DU CONGO
MO
ZA
MB
IQ
UE
ZIMBABWE
Z
160 – Zimbabwe
2006AtaGlance
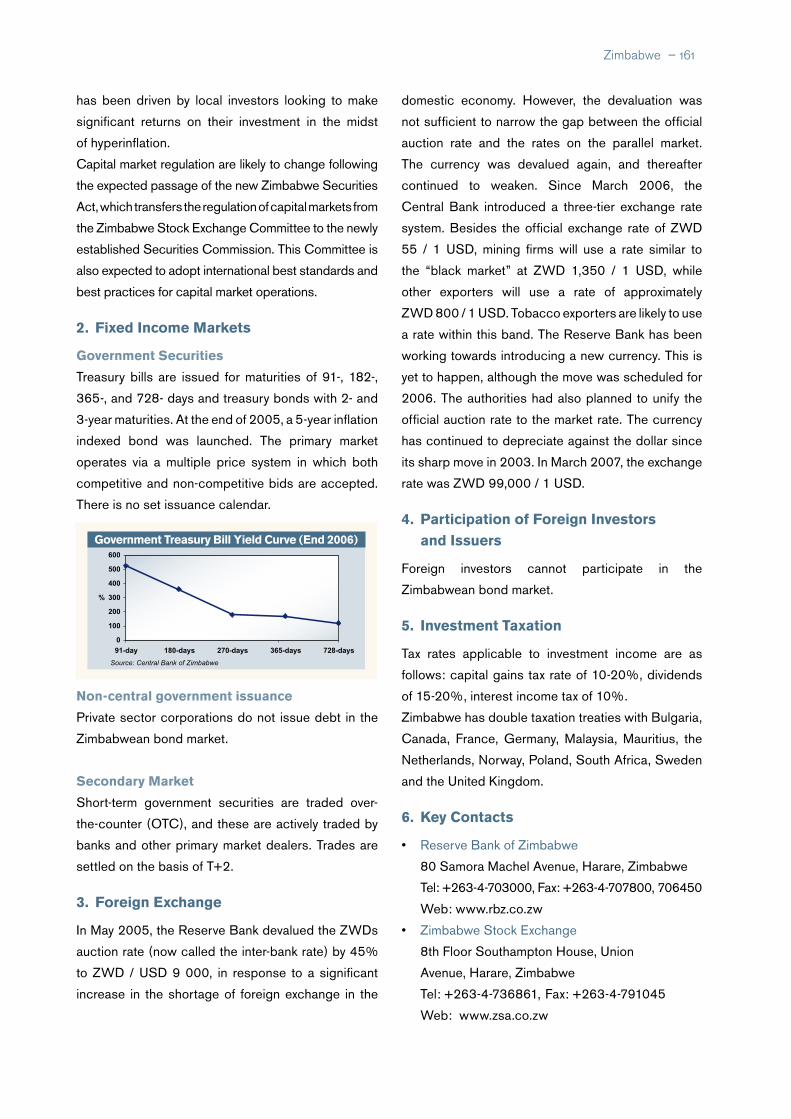
Zimbabwe – 161
has been driven by local investors looking to make
significant returns on their investment in the midst
of hyperinflation.
Capital market regulation are likely to change following
the expected passage of the new Zimbabwe Securities
Act, which transfers the regulation of capital markets from
the Zimbabwe Stock Exchange Committee to the newly
established Securities Commission. This Committee is
also expected to adopt international best standards and
best practices for capital market operations.
2. FixedIncomeMarkets
GovernmentSecurities
Treasury bills are issued for maturities of 91-, 182-,
365-, and 728- days and treasury bonds with 2- and
3-year maturities. At the end of 2005, a 5-year inflation
indexed bond was launched. The primary market
operates via a multiple price system in which both
competitive and non-competitive bids are accepted.
There is no set issuance calendar.
Non-centralgovernmentissuance
Private sector corporations do not issue debt in the
Zimbabwean bond market.
SecondaryMarket
Short-term government securities are traded over-
the-counter (OTC), and these are actively traded by
banks and other primary market dealers. Trades are
settled on the basis of T+2.
3. ForeignExchange
In May 2005, the Reserve Bank devalued the ZWDs
auction rate (now called the inter-bank rate) by 45%
to ZWD / USD 9 000, in response to a significant
increase in the shortage of foreign exchange in the
domestic economy. However, the devaluation was
not sufficient to narrow the gap between the official
auction rate and the rates on the parallel market.
The currency was devalued again, and thereafter
continued to weaken. Since March 2006, the
Central Bank introduced a three-tier exchange rate
system. Besides the official exchange rate of ZWD
55 / 1 USD, mining firms will use a rate similar to
the “black market” at ZWD 1,350 / 1 USD, while
other exporters will use a rate of approximately
ZWD 800 / 1 USD. Tobacco exporters are likely to use
a rate within this band. The Reserve Bank has been
working towards introducing a new currency. This is
yet to happen, although the move was scheduled for
2006. The authorities had also planned to unify the
official auction rate to the market rate. The currency
has continued to depreciate against the dollar since
its sharp move in 2003. In March 2007, the exchange
rate was ZWD 99,000 / 1 USD.
4. ParticipationofForeignInvestorsandIssuers
Foreign investors cannot participate in the
Zimbabwean bond market.
5. InvestmentTaxation
Tax rates applicable to investment income are as
follows: capital gains tax rate of 10-20%, dividends
of 15-20%, interest income tax of 10%.
Zimbabwe has double taxation treaties with Bulgaria,
Canada, France, Germany, Malaysia, Mauritius, the
Netherlands, Norway, Poland, South Africa, Sweden
and the United Kingdom.
6. KeyContacts
• Reserve Bank of Zimbabwe
80 Samora Machel Avenue, Harare, Zimbabwe
Tel: +263-4-703000, Fax: +263-4-707800, 706450
Web: www.rbz.co.zw
• Zimbabwe Stock Exchange
8th Floor Southampton House, Union
Avenue, Harare, Zimbabwe
Tel: +263-4-736861, Fax: +263-4-791045
Web: www.zsa.co.zw
GovernmentTreasuryBillYieldCurve(End2006)
0
100
200
300
400
500
600
91-day 180-days 270-days 365-days 728-days
%
Source: Central Bank of Zimbabwe
Glossary
Bond A bond is a debt security, in which the issuer owes the holders a debt and is
obliged to repay the principal and interest (the coupon). Other stipulations may
also be attached to the bond issue, such as the obligation for the issuer to provide
certain information to the bond holder, or limitations on the behaviour of the issuer.
Bonds are generally issued for a fixed term (the maturity) longer than one year
CallableBond A bond that can be redeemed at the option of the issuer prior to maturity as the
issuer has the right to “call” the bond at fixed prices and call dates. Maturities may
be extended (“extendible) or shortened (“retractable”)
CapitalMarket The market in which corporate equity and longer-term debt securities (those
maturing in more than one year) are issued and traded
Clearing The process of exchanging financial transaction details between an acquirer and
an issuer to facilitate settlement
ConvertibleBond These may be converted into the issuer’s common stock or into equity-like
instruments
Depository A centralized clearinghouse and repository for securities. A location where
securities are actually stored and where the electronic day-to-day movements of
those securities is recorded
Derivative A financial contract from which payoffs over time are derived from the performance
of assets (such as commodities, shares or bonds), interest rates, exchange rates,
or indices (such as a stock market index, consumer price index (CPI) or an index of
weather conditions). The main types of derivatives are futures, forwards, options
and swaps
FixedIncome Debt instruments of companies, government or agencies characterized by a fixed
interest rate and stated maturity date
FloatingrateNote
(FrN)
Bonds which the coupons are a reference rate plus a spread/margin. This rate
is reset on a regular basis and generally constitutes a short-term benchmark rate
such as a Treasury bill rate or LIBOR
ForwardContract A contract on which a seller agrees to deliver a specified cash commodity to a
buyer sometime in the future. In contrast to futures contracts, the terms of forward
contracts are not standardized. Forward contracts are not traded on exchanges
Forwardrate
Agreement
An agreement to borrow or lend at a specified future date at an interest rate that
is fixed today. The borrowing and lending is purely notional as the contract allows
the purchaser to fix interest costs for a specific future period
FuturesContract An agreement to buy or sell a fixed quantity of a specified commodity, currency or
security for delivery at a fixed date in the future at a fixed price. Futures contracts
are standardised agreements traded on Futures Exchanges
GrossDomestic
Product(GDP)
The total market value of all final goods and services produced in a country in a
given year, equal to total consumer, investment and government spending, plus the
value of exports, minus the value of imports
162 – Glossary

Glossary – 163
humanDevelopment
Index(hDI)
Index of 177 countries that measures a country’s achievements in three aspects
of human development:
10. Longevity: measured by life expectancy at birth
11. Knowledge: measured by a combination of the adult literacy rate and the
combined gross primary secondary and tertiary enrolment ratio; and
12. Standardofliving: measured by GDP per capita
Source: UNDP
IndexedBond These are bonds indexed/ linked to non-market indices or assets. Examples
include inflation-indexed bonds whose coupons are linked to various inflation
indices such as the consumer price index and wholesale price index. Commodity-
linked bonds are linked to the value of commodities such as agriculture, petroleum
and minerals
Liquidity The ease at which an asset can be quickly converted into cash without any
significant movements in the price. A market is considered liquid if there are ready
buyers and sellers of securities in large quantities
Moneymarket The market for short-term debt instruments maturing in one year or less. Examples
of money market instruments include Treasury bills, commercial paper, and
certificate of deposits
Option The right (but not the obligation) to buy or sell securities at a given price (exercise
or strike price) before a given date (expiry date)
Settlement Conclusion of a securities transaction when a customer pays a broker/dealer for
securities purchased or delivers securities sold and receives from the broker the
proceeds of a sale
Spottransaction A transaction requiring immediate delivery and full payment
Swap An agreement between parties to exchange future cash flows that are determined
by an underlying such as currency, interest rate, equity and commodity
T+1(2,3,4) Refers to settlement of securities from the trade/ transaction date
T +1 means settlement is one day after the trade date; T+ 2 is two days after the
trade date and so on
TreasuryBill A negotiable debt obligation issued by government and backed by its full faith and
credit, having a maturity of one year or less
TreasuryBond A long-term government obligation having a maturity of more than one year
This publication has been prepared solely for
information purposes only and is based on material
from sources that the ADB believes to be reliable.
Whilst every care has been taken in preparing this
publication, the ADB makes no representations,
warranties or undertakings (express or implied) and
accepts no responsibility or liability as to the accuracy
or completeness of the information contained herein.
All statements, figures, opinions and estimates
contained in this publication may change at any
time after the publication of this Guidebook without
notice. Nothing in this publication shall be construed,
implicitly or explicitly as containing any investment
recommendation or advice, and constituting an
offer of, or an invitation by or on behalf of, ADB to
purchase or sell any securities. If you are in any
doubt about the contents of this publication or the
information to which this publication relates, you
should obtain independent advice in respect of any
information or product detailed herein. The ADB
provides no investment, tax or legal advice and makes
no representation or warranty about the contents
Disclaimer
hereof. No responsibility is assumed by the ADB
for any general, consequential, indirect, incidental,
exemplary or special damages arising from the use
of or reliance on this publication. You are to rely on
your own independent appraisal of and investigations
into (a) the condition, creditworthiness, affairs, status
and nature of any issuer or obligor referred to and
(b) all other matters and things contemplated by this
publication.
Some of the pages in this publication have website
addresses of third parties. These are for your
convenience only. ADB does not endorse and is not
responsible for the content of these websites and
the views and opinions expressed in any referenced
website do not necessarily state or reflect those of
the ADB.
This publication has been sent to you for your
information and may not be reproduced or redistributed
to any other person. By accepting this publication,
you agree to be bound by the foregoing limitations.
Copyright 2007 African Development Bank. All rights reserved.
Design, layout and production: Phoenix Design Aid, Denmark
164 – Disclaimer