Fixed Income Investor Presentation - Assured Guaranty
81
EMBRACE POSSIBILITIES, INVEST IN CERTAINTIES December 31, 2014 Fixed Income Investor Presentation
-
Upload
khangminh22 -
Category
Documents
-
view
2 -
download
0
Transcript of Fixed Income Investor Presentation - Assured Guaranty

EMBRACE POSSIBILITIES, INVEST IN CERTAINTIES
December 31, 2014 Fixed Income Investor Presentation

Table of Contents
1
Page
Forward-Looking Statements and Safe Harbor Disclosure 2
Conventions, Disclaimers and Non-GAAP Financial Measures 3
Corporate Overview 4
Assured Guaranty Ltd. Consolidated Insured Portfolio Overview 29
AGM1 Portfolio Review 43
Municipal Assurance Corp. Portfolio Review 55
Assured Guaranty Corp. Portfolio Review 58
Appendix 71
1. Please see page 3 for a definition of this convention.

Forward-Looking Statements and
Safe Harbor Disclosure
2
• This presentation contains information that includes or is based upon forward-looking statements within the meaning of the Private Securities Litigation Reform Act
of 1995. Forward-looking statements give the expectations or forecasts of future events of Assured Guaranty Ltd. (“AGL” and, together with its subsidiaries,
“Assured Guaranty” or the “Company”). These statements can be identified by the fact that they do not relate strictly to historical or current facts and relate to
future operating or financial performance. Any or all of Assured Guaranty’s forward-looking statements herein are based on current expectations and the current
economic environment and may turn out to be incorrect. Assured Guaranty’s actual results may vary materially. Among factors that could cause actual results to
differ adversely are: (1) rating agency action, including a ratings downgrade, a change in outlook, the placement of ratings on watch for downgrade, or a change in
rating criteria, at any time, of AGL or any of its subsidiaries, and/or of any securities AGL or any of its subsidiaries have issued, and/or of transactions that AGL’s
subsidiaries have insured; (2) reduction in the amount of available insurance opportunities and/or in the demand for Assured Guaranty's insurance; (3)
developments in the world’s financial and capital markets that adversely affect obligors’ payment rates, Assured Guaranty’s loss experience, or its exposure to
refinancing risk in transactions (which could result in substantial liquidity claims on its guarantees); (4) the possibility that budget shortfalls or other factors will
result in credit losses or impairments on obligations of state and local governments that Assured Guaranty insures or reinsures; (5) the failure of Assured Guaranty
to realize loss recoveries that are assumed in its expected loss estimates; (6) deterioration in the financial condition of Assured Guaranty’s reinsurers, the amount
and timing of reinsurance recoverables actually received and the risk that reinsurers may dispute amounts owed to Assured Guaranty under its reinsurance
agreements; (7) increased competition, including from new entrants into the financial guaranty industry; (8) rating agency action on obligors, including sovereign
debtors, resulting in a reduction in the value of securities in Assured Guaranty’s investment portfolio and in collateral posted by and to Assured Guaranty; (9) the
inability of Assured Guaranty to access external sources of capital on acceptable terms; (10) changes in the world’s credit markets, segments thereof, interest
rates or general economic conditions; (11) the impact of market volatility on the mark-to-market of Assured Guaranty’s contracts written in credit default swap form;
(12) changes in applicable accounting policies or practices; (13) changes in applicable laws or regulations, including insurance and tax laws, or other
governmental actions; (14) difficulties with the execution of Assured Guaranty’s business strategy; (15) loss of key personnel; (16) the effects of mergers,
acquisitions and divestitures; (17) natural or man-made catastrophes; (18) other risks and uncertainties that have not been identified at this time; (19)
management’s response to these factors; and (20) other risk factors identified in AGL’s filings with the SEC. The foregoing review of important factors should not
be construed as exhaustive, and should be read in conjunction with the other cautionary statements that are included in the Company’s Form 10-K or Form 10-Q
filings. The Company undertakes no obligation to update publicly or review any forward-looking statement, whether as a result of new information, future
developments or otherwise, except as required by law. Investors are advised, however, to consult any further disclosures the Company makes on related subjects
in the Company’s reports filed with the SEC.
• If one or more of these or other risks or uncertainties materialize, or if the Company’s underlying assumptions prove to be incorrect, actual results may vary
materially from what the Company projected. Any forward-looking statements in this presentation and the Company’s Form 10-K or Form 10-Q filings reflect the
Company’s current views with respect to future events and are subject to these and other risks, uncertainties and assumptions relating to its operations, results of
operations, growth strategy and liquidity.
• For these statements, the Company claims the protection of the safe harbor for forward-looking statements contained in Section 27A of the Securities Act of 1933,
as amended (the “Securities Act”), and Section 21E of the Securities Exchange Act of 1934, as amended (the “Exchange Act”).
Conventions, Disclaimers and
Non-GAAP Financial Measures
3
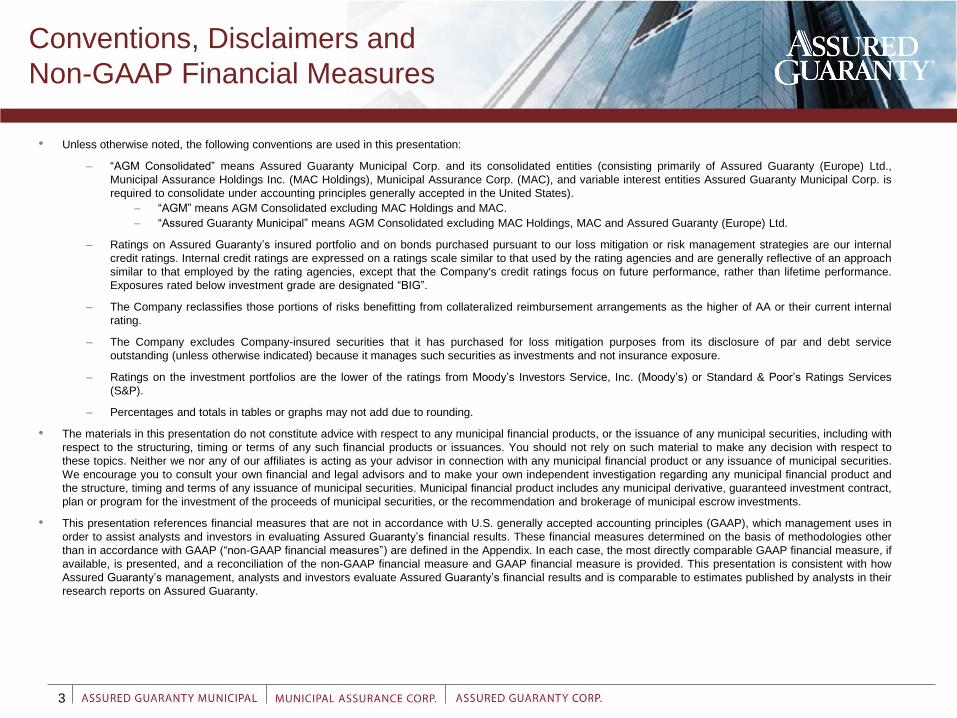
• Unless otherwise noted, the following conventions are used in this presentation:
– “AGM Consolidated” means Assured Guaranty Municipal Corp. and its consolidated entities (consisting primarily of Assured Guaranty (Europe) Ltd.,
Municipal Assurance Holdings Inc. (MAC Holdings), Municipal Assurance Corp. (MAC), and variable interest entities Assured Guaranty Municipal Corp. is
required to consolidate under accounting principles generally accepted in the United States).
– “AGM” means AGM Consolidated excluding MAC Holdings and MAC.
– “Assured Guaranty Municipal” means AGM Consolidated excluding MAC Holdings, MAC and Assured Guaranty (Europe) Ltd.
– Ratings on Assured Guaranty’s insured portfolio and on bonds purchased pursuant to our loss mitigation or risk management strategies are our internal
credit ratings. Internal credit ratings are expressed on a ratings scale similar to that used by the rating agencies and are generally reflective of an approach
similar to that employed by the rating agencies, except that the Company's credit ratings focus on future performance, rather than lifetime performance.
Exposures rated below investment grade are designated “BIG”.
– The Company reclassifies those portions of risks benefitting from collateralized reimbursement arrangements as the higher of AA or their current internal
rating.
– The Company excludes Company-insured securities that it has purchased for loss mitigation purposes from its disclosure of par and debt service
outstanding (unless otherwise indicated) because it manages such securities as investments and not insurance exposure.
– Ratings on the investment portfolios are the lower of the ratings from Moody’s Investors Service, Inc. (Moody’s) or Standard & Poor’s Ratings Services
(S&P).
– Percentages and totals in tables or graphs may not add due to rounding.
• The materials in this presentation do not constitute advice with respect to any municipal financial products, or the issuance of any municipal securities, including with
respect to the structuring, timing or terms of any such financial products or issuances. You should not rely on such material to make any decision with respect to
these topics. Neither we nor any of our affiliates is acting as your advisor in connection with any municipal financial product or any issuance of municipal securities.
We encourage you to consult your own financial and legal advisors and to make your own independent investigation regarding any municipal financial product and
the structure, timing and terms of any issuance of municipal securities. Municipal financial product includes any municipal derivative, guaranteed investment contract,
plan or program for the investment of the proceeds of municipal securities, or the recommendation and brokerage of municipal escrow investments.
• This presentation references financial measures that are not in accordance with U.S. generally accepted accounting principles (GAAP), which management uses in
order to assist analysts and investors in evaluating Assured Guaranty’s financial results. These financial measures determined on the basis of methodologies other
than in accordance with GAAP (“non-GAAP financial measures”) are defined in the Appendix. In each case, the most directly comparable GAAP financial measure, if
available, is presented, and a reconciliation of the non-GAAP financial measure and GAAP financial measure is provided. This presentation is consistent with how
Assured Guaranty’s management, analysts and investors evaluate Assured Guaranty’s financial results and is comparable to estimates published by analysts in their
research reports on Assured Guaranty.

Corporate Overview
5
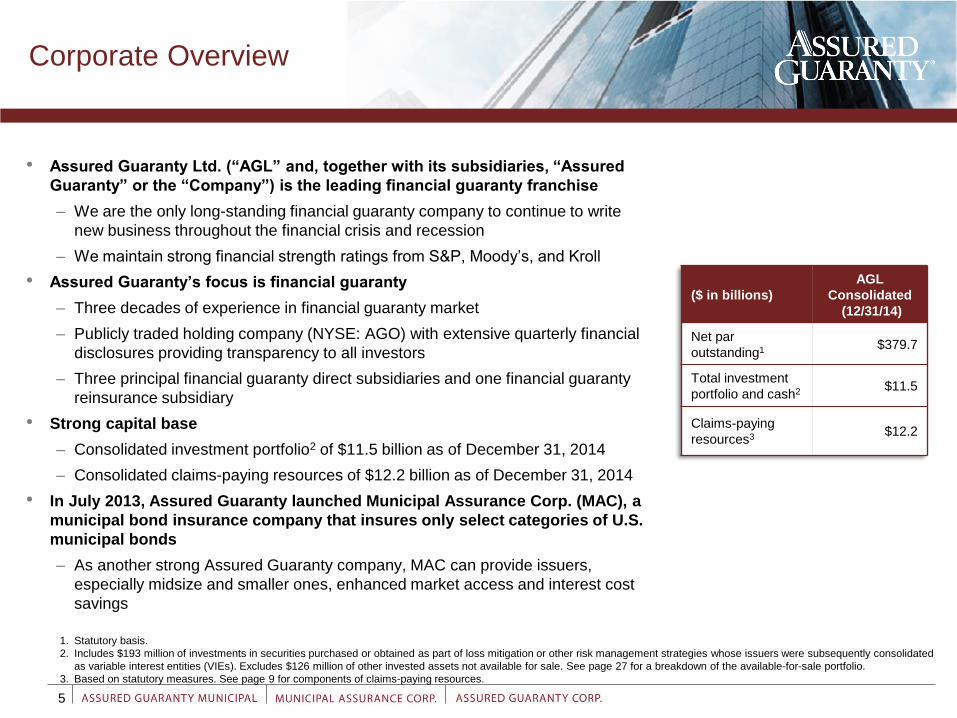
• Assured Guaranty Ltd. (“AGL” and, together with its subsidiaries, “Assured
Guaranty” or the “Company”) is the leading financial guaranty franchise
– We are the only long-standing financial guaranty company to continue to write
new business throughout the financial crisis and recession
– We maintain strong financial strength ratings from S&P, Moody’s, and Kroll
• Assured Guaranty’s focus is financial guaranty
– Three decades of experience in financial guaranty market
– Publicly traded holding company (NYSE: AGO) with extensive quarterly financial
disclosures providing transparency to all investors
– Three principal financial guaranty direct subsidiaries and one financial guaranty
reinsurance subsidiary
• Strong capital base
– Consolidated investment portfolio2 of $11.5 billion as of December 31, 2014
– Consolidated claims-paying resources of $12.2 billion as of December 31, 2014
• In July 2013, Assured Guaranty launched Municipal Assurance Corp. (MAC), a
municipal bond insurance company that insures only select categories of U.S.
municipal bonds
– As another strong Assured Guaranty company, MAC can provide issuers,
especially midsize and smaller ones, enhanced market access and interest cost
savings
Corporate Overview
($ in billions)
AGL
Consolidated
(12/31/14)
Net par
outstanding1 $379.7
Total investment
portfolio and cash2 $11.5
Claims-paying
resources3 $12.2
1. Statutory basis.
2. Includes $193 million of investments in securities purchased or obtained as part of loss mitigation or other risk management strategies whose issuers were subsequently consolidated
as variable interest entities (VIEs). Excludes $126 million of other invested assets not available for sale. See page 27 for a breakdown of the available-for-sale portfolio.
3. Based on statutory measures. See page 9 for components of claims-paying resources.

6
Operating Principles and Investor
and Issuer Benefits
• Underwriting principles and a strong risk management culture designed to protect our
franchise
• Experienced and disciplined management
• Commitment to disclosure and transparency
• Our guaranty benefits investors and issuers because we provide credit selection,
underwriting, surveillance and remediation, in addition to timely payment of scheduled
principal and interest if an underlying transaction defaults
– Bond insurance helps homogenize the market’s view of insured credits, which typically increases market
liquidity. Every day, the municipal market trades an average of $400 million in bonds insured by Assured
Guaranty companies
– Credit enhancement provides protection in an uncertain credit environment

7
Strategic Priorities
• Exercise underwriting and pricing discipline
• Increase penetration in the U.S. public finance market
• Increase new business activity in our structured finance and international segments
• Maintain strong financial strength ratings
• Pursue loss mitigation strategies
• Utilize capital efficiently

8
Assured Guaranty Ltd. Corporate Structure
AG Financial
Products Inc.
Swap Counterparty
NR
Assured Guaranty Ltd.
Hamilton, Bermuda
Publicly traded Holding Company (NYSE: AGO)
A (stable outlook) / Baa2 (stable outlook)
issuer credit ratings
Assured Guaranty Corp. (AGC)
Financial Guaranty Direct
AA (stable outlook) /
A3 (negative outlook)
financial strength ratings
Assured Guaranty (UK) Ltd. (AGUK)
Financial Guaranty Direct
AA (stable outlook) /
A3 (negative outlook)
financial strength ratings
Assured Guaranty Municipal Corp.
(formerly Financial Security Assurance Inc.)
Financial Guaranty Direct
S&P: AA (stable outlook) /
Moody’s: A2 (stable outlook) /
Kroll: AA+ (stable outlook)
financial strength ratings
Assured Guaranty Re Overseas Ltd. (AGRO)
Financial Guaranty Reinsurance
AA (stable outlook) /
Baa1 (negative outlook)
financial strength ratings
Assured Guaranty Overseas
US Holdings Inc.
U.S. Holding Company
NR
Assured Guaranty Re Ltd. (AG Re)
Financial Guaranty Reinsurance
AA (stable outlook) /
Baa1 (negative outlook)
financial strength ratings
Ratings and company names as of March 23, 2015.
S&P / Moody’s (unless otherwise specified)
NR = Not rated
Assured Guaranty (Europe) Ltd. (AGE)
(formerly Financial Security Assurance
(U.K.) Limited)
Financial Guaranty Direct
AA (stable outlook) /
A2 (stable outlook)
financial strength ratings
Municipal Assurance Holdings Inc.
U.S. Holding Company
NR
Assured Guaranty Municipal Holdings Inc.
(formerly Financial Security Assurance
Holdings Ltd.)
U.S. Holding Company
A (stable outlook) / Baa2 (stable outlook)
issuer credit ratings
Assured Guaranty Finance
Overseas Ltd.
European Marketing
NR
Assured Guaranty US Holdings Inc. (“AGUS”)
U.S. Holding Company
A (stable outlook) / Baa2 (stable outlook)
issuer credit ratings
Municipal Assurance Corp. (MAC)
Financial Guaranty Direct
S&P: AA (stable outlook) /
Kroll: AA+ (stable outlook)
financial strength ratings

1. The numbers shown for AGM and AGC include their indirect share of MAC. AGM and AGC own 60.7% and 39.3%, respectively, of the outstanding stock of Municipal Assurance Holdings Inc., which owns
100% of the outstanding common stock of MAC. In the case of AGC, the numbers shown have also been adjusted to include its 100% share of its U.K. insurance subsidiary. Amounts include financial guaranty
insurance and credit derivatives.
2. Reserves are reduced by approximately $0.3 billion for benefit related to representation and warranty recoverables.
3. Represents an aggregate $450 million excess-of-loss reinsurance facility for the benefit of AGM, AGC and MAC, which became effective January 1, 2014. The facility terminates on January 1, 2016, unless
AGM, AGC and MAC choose to extend it.
4. Eliminations are primarily for (i) intercompany surplus notes between AGM and AGC, and between AGM and MAC, (ii) MAC amounts, whose proportionate share are included in AGM and AGC based on
ownership percentages. Net par and net debt service outstanding eliminations relate to second-to-pay policies under which an Assured Guaranty insurance subsidiary guarantees an obligation already insured
by another Assured Guaranty insurance subsidiary, and net par related to intercompany cessions from AGM and AGC to MAC.
5. Represents adjustment for AGM's and AGC's indirect ownership of MAC's total policyholders' surplus, contingency reserve, unearned premium reserve, loss reserves and present value of installment premium.
6. Net par outstanding and net debt service outstanding are presented on a separate company statutory basis. Under statutory accounting, such amounts would be reduced both when an outstanding issue is
legally defeased (i.e., an issuer has legally discharged its obligations with respect to a municipal security by satisfying conditions set forth in defeasance provisions contained in transaction documents and is no
longer responsible for the payment of debt service with respect to such obligations) and when such issue is economically defeased (i.e., transaction documents for a municipal security do not contain
defeasance provisions but the issuer establishes an escrow account with U.S. government securities in amounts sufficient to pay the refunded bonds when due; the refunded bonds are not considered paid and
continue to be outstanding under the transaction documents, and the issuer remains responsible to pay debt service when due to the extent monies on deposit in the escrow account are insufficient for such
purpose).
7. Equity method adjustment is an adjustment made to reflect AGM’s and AGC’s net exposure to MAC, as determined by their indirect equity ownership.
8. Assured Guaranty Re Ltd. (AG Re) numbers represent the Company's estimate of U.S. statutory accounting practices prescribed or permitted by insurance regulatory authorities.
9
Consolidated Claims-Paying Resources and Statutory-Basis Exposures
Four Discrete Operating Companies
With Separate Capital Bases
As of December 31, 2014
($ in millions) AGM AGC MAC AG Re8 Eliminations4 Consolidated
Claims-paying resources
Policyholders' surplus $ 2,267 $ 1,086 $ 612 $ 1,054 $ (877) $ 4,142
Contingency reserve1 1,496 834 300 – (300) 2,330
Qualified statutory capital 3,763 1,920 912 1,054 (1,177) 6,472
Unearned premium reserve1 1,769 650 591 880 (591) 3,299 Loss and loss adjustment expense reserves
1,2 487 93 – 272 – 852
Total policyholders' surplus and reserves 6,019 2,663 1,503 2,206 (1,768) 10,623
Present value of installment premium1 315 224 4 177 (4) 716
Committed Capital Securities 200 200 – – – 400
Excess of loss reinsurance facility3 450 450 450 – (900) 450
Total claims-paying resources
(including proportionate MAC ownership for AGM and AGC) $ 6,984 $ 3,537 $ 1,957 $ 2,383 $ (2,672) $ 12,189
Adjustment for MAC5 954 553 – – (1,507) –
Total claims-paying resources
(excluding proportionate MAC ownership for AGM and AGC) $ 6,030 $ 2,984 $ 1,957 $ 2,383 $ (1,165) $ 12,189
Statutory net par outstanding6 $ 151,320 $ 45,724 $ 82,322 $ 101,983 $ (1,635) $ 379,714
Equity method adjustment7 49,970 32,353 – – (82,323) –
Adjusted statutory net par outstanding1 $ 201,290 $ 78,077 $ 82,322 $ 101,983 $ (83,958) $ 379,714
Net debt service outstanding6 $ 234,490 $ 67,794 $ 123,198 $ 161,445 $ (3,329) $ 583,598
Equity method adjustment7 74,782 48,417 – – (123,199) –
Adjusted net debt service outstanding1 $ 309,272 $ 116,211 $ 123,198 $ 161,445 $ (126,528) $ 583,598

10
Assured Guaranty Operating Platforms
• Assured Guaranty Municipal1, MAC and AGC operate as three separate direct financial
guaranty platforms, with AG Re operating as a reinsurer
– Assured Guaranty Municipal1 focuses exclusively on public finance and global infrastructure transactions
– MAC insures only U.S. municipal bonds, primarily small and medium-size issues in select categories, such
as G.O. and tax-backed bonds and public electric, water, sewer and transportation revenue bonds – a
subset of Assured Guaranty Municipal’s1 focus
– AGC, as the most diversified platform, insures the same categories as Assured Guaranty Municipal1, as
well as selected sectors within the U.S. and international structured finance market
– AG Re, as a reinsurer, provides additional capital and flexibility to Assured Guaranty Municipal1 and AGC
• Assured Guaranty Municipal1, MAC and AGC share Assured Guaranty’s experience,
culture of prudent risk management and business infrastructure
• Assured Guaranty’s financial position and market standing, along with the franchise value
of Assured Guaranty Municipal1, MAC and AGC, are strengthened through this structure
– Greater capacity to write business
– More flexibility in balancing portfolio exposures
– Enhanced operating efficiencies through common infrastructure
1. Please see page 3 for a definition of this convention.
11
Assured Guaranty Operating Platforms (Continued)
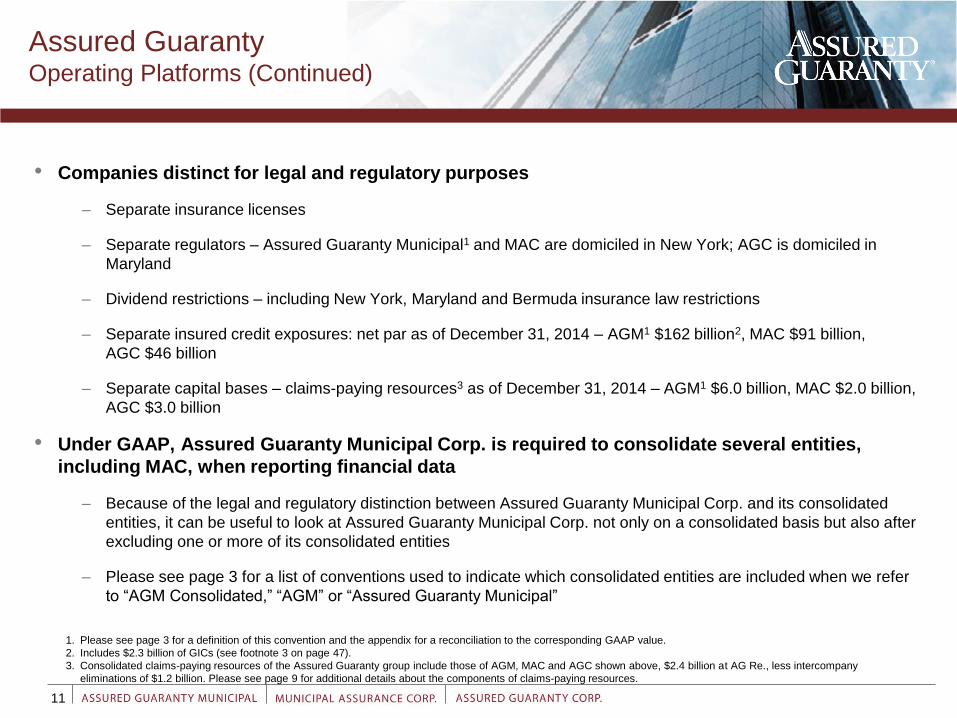
• Companies distinct for legal and regulatory purposes
– Separate insurance licenses
– Separate regulators – Assured Guaranty Municipal1 and MAC are domiciled in New York; AGC is domiciled in
Maryland
– Dividend restrictions – including New York, Maryland and Bermuda insurance law restrictions
– Separate insured credit exposures: net par as of December 31, 2014 – AGM1 $162 billion2, MAC $91 billion,
AGC $46 billion
– Separate capital bases – claims-paying resources3 as of December 31, 2014 – AGM1 $6.0 billion, MAC $2.0 billion,
AGC $3.0 billion
• Under GAAP, Assured Guaranty Municipal Corp. is required to consolidate several entities,
including MAC, when reporting financial data
– Because of the legal and regulatory distinction between Assured Guaranty Municipal Corp. and its consolidated
entities, it can be useful to look at Assured Guaranty Municipal Corp. not only on a consolidated basis but also after
excluding one or more of its consolidated entities
– Please see page 3 for a list of conventions used to indicate which consolidated entities are included when we refer
to “AGM Consolidated,” “AGM” or “Assured Guaranty Municipal”
1. Please see page 3 for a definition of this convention and the appendix for a reconciliation to the corresponding GAAP value.
2. Includes $2.3 billion of GICs (see footnote 3 on page 47).
3. Consolidated claims-paying resources of the Assured Guaranty group include those of AGM, MAC and AGC shown above, $2.4 billion at AG Re., less intercompany
eliminations of $1.2 billion. Please see page 9 for additional details about the components of claims-paying resources.

12
Assured Guaranty Municipal’s1 Commitment
to the Public Finance Market
1. Please see page 3 for a definition of this convention and the appendix for a reconciliation to the corresponding GAAP value.
2. Assured Guaranty Municipal1 stopped writing structured finance transactions in August 2008.
3. Represents the future expected amortization of current net par outstanding as of December 31, 2014. Actual amortization of the existing portfolio will differ from the expected shown here
because, for example, (a) some obligors may call, prepay or defease guaranteed obligations (e.g., in the context of U.S. public finance refundings), and (b) the expected amortization of
structured finance transactions is based in part on management’s assumptions regarding the performance of the underlying assets while the actual performance of those assets may
differ from management’s assumptions. Actual amortization of the U.S. public and global infrastructure finance portfolio and the structured finance portfolio may be faster or slower than
expected by management; both portfolios may differ from expectations in the same direction or one portfolio may amortize more quickly while the other may amortize more slowly.
AGM1 Net Par Outstanding Amortization
Current and Projected Year-End Amounts
As of December 31, 2014
($ in billions)
• Assured Guaranty Municipal1 is committed to
insuring only U.S. public finance and global
infrastructure transactions now and in the future2
• AGM’s1 existing insured portfolio is expected to
rapidly evolve toward its public finance focus
• We project that AGM’s1 legacy global structured
finance insured portfolio ($26 billion as of
December 31, 2014 vs. $127 billion as of September
30, 2008) will amortize rapidly – 30% by year-end
2015 and 72% by year-end 20173
4Q-14 4Q-15 4Q-16 4Q-17 4Q-18 4Q-19
Public Finance Structured Finance
$162
$144 $132
$118 $111 $105
Actual Expected 3

13
Initial Capitalization of MAC
• MAC was initially capitalized, in July 2013, to
approximately $800 million through cash and
securities contributed by Assured Guaranty
Municipal1 and AGC
– Assured Guaranty Municipal1 contributed $425 million in return
for a 61% ownership stake in Municipal Assurance Holdings Inc.
(MAC Holdings)
– AGC contributed $275 million in return for a 39% ownership
stake in MAC Holdings
– MAC Holdings, as the 100% owner of MAC, contributed cash
and securities to increase MAC’s policyholders’ surplus to $400
million and also purchased a $300 million, 0% surplus note, with
no maturity, issued by MAC
– Assured Guaranty Municipal1 purchased a 20-year, $100 million,
5% surplus note issued by MAC
• Assured Guaranty Municipal1 and AGC also ceded
$111 billion in par to MAC along with the associated
$709 million in unearned premium reserves (UPR)
– Assured Guaranty Municipal1 ceded $87 billion in par along with
the associated $463 million in UPR
– AGC ceded $24 billion in par along with the associated $246
million in UPR
Unlike a typical start-up, MAC began with significant investment
income and predictable future earned revenue built in.
Note: All numbers are presented on a statutory basis except for par amounts, which are presented on
a GAAP basis. Initial capital contributions are pretax.
1. Please see page 3 for a definition of this convention.

14
AGC is Our Most Diversified Platform
U.S. Public Finance
$27.8
U.S. Structured
Finance $12.8
Non-U.S. Public
Finance $2.4
Non-U.S. Structured
Finance $3.0
Net Par Outstanding
As of December 31, 2014
($ in billions)
$46.0 billion, A average rating
28%
5%
60%
AA- average
rating A+ average
rating
A average rating
A- average rating
7%
• AGC, a diversified insurer, writes all classes
of financial guaranty business, including:
U.S. public finance, global infrastructure and
structured finance
• Structured finance new business
originations:
– Traditional ABS (e.g., auto loans and leases, credit
card receivables, consumer loans, equipment loans
and leases, trade receivables)
– Capital management solutions for financial
institutions
– No U.S. RMBS until product changes fundamentally
– Actively managed risk tolerance
– Investment grade underlying credit quality
• AGC has agreed to acquire Radian Asset
Assurance Inc. The transaction is expected
to close in the first half of 2015, subject to
regulatory approval.
– As of December 31, 2014, Radian Asset’s insured
statutory net par outstanding was $18.0 billion.
Subsequently, $3.8 billion of Radian Asset’s insured
portfolio was terminated, bringing the size of its
insured portfolio to $14.2 billion

15
AG Re’s Operating Structure
• AG Re is an insurance company
primarily engaged in providing
reinsurance to financial guarantors
– AG Re is rated AA (stable outlook) by
S&P and Baa1 (negative) by Moody’s1
• Provides reinsurance for Assured
Guaranty Municipal2 and AGC
• Portfolio opportunities with legacy
monolines
1. As of March 23, 2015.
2. Please see page 3 for a definition of this convention.
U.S. Public Finance
$88.3
U.S. Structured
Finance $7.7
Non-U.S. Public
Finance $9.3
Non-U.S. Structured
Finance $1.5
1%
Net Par Outstanding
As of December 31, 2014
($ in billions)
$106.8 billion, A average rating
7%
9%
83%
A+ average
rating
A- average
rating
A average rating
A-
average
rating

16
Underwriting Discipline
• Our U.S. public finance portfolio, our largest
exposure category, has performed well despite
increased financial pressure on municipal
obligors caused by the economic stress of recent
years
– We have tightened our public finance underwriting
standards
– Out of approximately 9,500 direct U.S. public finance
obligors, we expect future losses to be paid, net of
recoveries, on less than a dozen. In 4Q-14, we made
payments on only three
• Our principal losses in the last several years
have been on U.S. RMBS due to the lack of
adherence to underwriting standards by
mortgage originators
– Neither AGM1 nor AGC underwrote collateralized debt
obligations (CDOs) backed by RMBS, which has
protected us from losses on the scale experienced by
our former competitors
U.S. Public Finance
Non-U.S. Structured Finance
Non-U.S. Public
Finance
U.S. Structured Finance
10%
80%
Consolidated Net Par Outstanding
As of December 31, 2014
($ in billions)
$403.7 billion, A average rating
AA-
average rating
$41.2
BBB+
average rating
$31.4 8%
2%
AA average rating
$9.1
A average rating
$322.1
1. Please see page 3 for a definition of this convention.

U.S. Public Finance
New Issuance 1Q-13 2Q-13 3Q-13 4Q-13 1Q-14 2Q-14 3Q-14 4Q-14
Total Par Issued
($ in billions) $81.3 $88.7 $67.9 $73.4 $60.4 $83.1 $72.3 $99.3
Total Transactions
Issued 2,785 3,357 2,155 2,285 1,955 2,964 2,376 2,871
• We are focused on building demand for our
guaranties, both in the primary and the
secondary markets
– Secondary market policies totaled $904 million in net
par in 2014, compared with $1,062 million in net par
in 2013
• Despite headwinds, both par insured and
market penetration were higher in 2014
– Industry penetration of the number of transactions
with underlying A ratings increased to 52.5% in
4Q-14, up from 31.1% in 4Q-13
– Industry par penetration for all transactions with
underlying A ratings increased to 19.2% in 4Q-14,
up from 12.3% in 4Q-13
• Industry penetration for smaller deals
remains strong at 16.3% of all transactions
under $25 million in 4Q-14
Assured Guaranty
New Issue U.S. Public Finance
Insured Par Sold and Transaction Penetration1 ($ in millions)
1. Source: SDC database. As of December 31, 2014.
$1,175
$2,219
$1,474
$2,662
$1,434
$2,464
$3,757
$3,084
4.6% 4.2%
4.7% 5.1%
6.0% 6.1%
8.5%
6.9%
1Q-13 2Q-13 3Q-13 4Q-13 1Q-14 2Q-14 3Q-14 4Q-14
Insured Par Sold Transaction Penetration
17
New Business Production Penetration in the U.S. Public Finance Market

18
$72,000,324
California Statewide
Communities Development
Authority
Revenue Bonds
(Buck Institute for Research on
Aging)
November 2014
City Board of Education of
the City of Alabaster,
Alabama
$114,665,000
Special Tax School Warrants
August 2014
Successor Agency to the
Rancho Cucamonga
Redevelopment Agency,
California
$140,380,000
Tax Allocation Refunding Bonds
June 2014
The Delaware Economic
Development Authority
$29,225,000
Revenue Bonds
(Delaware State University Project)
December 2014
Michigan Finance
Authority
$446,170,000
Detroit Water and Sewerage
Department Sewage Disposal
System Revenue Refunding
Local Project Bonds
August 2014
In the Primary Market, $10.7 Billion of Insured Par on 697 Transactions
Sold With Our Insurance1, Including These Selected Issues
1. Source: SDC database. Sales from January 1 through December 31, 2014. Amounts are on a sale-date basis and reflect only those series insured by Assured Guaranty
Municipal2, AGC, or MAC.
2. Please see page 3 for a definition of this convention.
The Fundamental Demand for
Bond Insurance Continued in 2014
City of New Haven,
Connecticut
$96,150,000
General Obligation Bonds
August 2014
$81,565,000
Michigan Finance
Authority
$394,995,000
Detroit Water and Sewerage
Department Water Supply
System Revenue Refunding
Local Project Bonds
August 2014
Town of Oyster Bay,
New York
$137,715,000
General Obligation (Serial) Bonds
July 2014
Illinois Sports Facilities
Authority
$254,170,000
Sports Facilities Refunding Bonds
(State Tax Supported)
July 2014
New Hope Cultural
Education Facilities
Finance Corporation,
Texas
$66,420,000
Student Housing Revenue Bonds
(Texas A&M University Project)
May 2014
The Philadelphia Municipal
Authority, Pennsylvania
City Service Agreement Revenue
Bonds
April 2014
$61,095,000
City of Commerce City,
Colorado
Sales and Use Tax
Revenue Bonds
$73,445,000
Dormitory Authority of the
State of New York
School Districts Revenue Bond
Financing Program Revenue Bonds
May 2014
$153,340,000
El Dorado Irrigation
District, California
Refunding Revenue Bonds
February 2014
$121,190,000
May 2014
Lee County, Florida
Transportation Facilities Refunding
Revenue Bonds
$106,570,000
October 2014

19
Broadening Market Awareness Advertising Campaign

• In 4Q-14, we closed two new market
tax credit transactions and a reserve
financing transaction, generating $16
million of PVP1
• 2014 U.S. structured finance PVP1 was
$24 million
• New business production tends to
fluctuate as large, complex
transactions require a long time frame
to close
$4 $2
$5
$32
$2 $1
$3
$1 $1
$6
$1
$16
1Q
-12
2Q
-12
3Q
-12
4Q
-12
1Q
-13
2Q
-13
3Q
-13
4Q
-13
1Q
-14
2Q
-14
3Q
-14
4Q
-14
U.S. Structured PVP1 ($ in millions)
20
New Business Production U.S. Structured Finance Business Activity
1. Please see the appendix for an explanation of this non-GAAP financial measure and a reconciliation to gross written premiums.

• During 3Q-14, we insured a non-U.S.
diversified payment rights transaction
• During 2Q-14, we also insured a non-U.S.
diversified payment rights transaction
– $200 million notes backed by future dollar,
euro and pound-denominated remittances
due to Türkiye Garanti Bankası A.Ş.
(Garanti) from various U.S. and European
correspondent banks
• During 1Q-14, we guaranteed a U.K.
infrastructure bond
– £77 million bond issued by Solutions 4 North
Tyneside (Finance) PLC, to finance the
development and refurbishment of social
housing in the U.K.
$1
$13
$5
$7
$5 $4
1Q
-12
2Q
-12
3Q
-12
4Q
-12
1Q
-13
2Q
-13
3Q
-13
4Q
-13
1Q
-14
2Q
-14
3Q
-14
4Q
-14
Non-U.S. PVP1 by Quarter ($ in millions)
21
New Business Production Non-U.S. Business Activity
1. Please see the appendix for an explanation of this non-GAAP financial measure and a reconciliation to gross written premiums.

• Reassumption of previously ceded
business has increased the unearned
premium reserve and adjusted book value1
• High-quality portfolios from inactive
companies are of interest
– Public finance as well as high-quality structured
finance business, such as performing pooled
corporate and commercial receivables
1. Please see the appendix for an explanation of this non-GAAP financial measure and a reconciliation to GAAP book value.
2. Includes par related to insured credit derivatives.
3. AGC has agreed to acquire Radian Asset Assurance Inc. The transaction is expected to close in 1H-15.
22
New Business Production Reinsurance Platform
Year
Reassumed
Par
($ in billions)
Reassumed
UPR
($ in millions)
Commutation
Gain / (Loss)
($ in millions)
2009 $2.9 $65 ($11)
2010 15.5 104 50
2011 0.3 2 24
2012 19.2 109 82
2013 0.2 11 2
2014 1.2 20 23
Total $39.3 $311 $170
($ in millions) Net Par
Outstanding
American Overseas Re (formerly RAM Re)
$6,727
Tokio Marine 5,276
Radian Asset3 4,104
Syncora 3,715
Mitsui 2,033
Others 1,120
Total $22,975
Ceded Par Outstanding by Reinsurer2
As of December 31, 2014

S&P Moody’s KBRA
AGM AA
stable outlook
A2
stable outlook
AA+
stable outlook
MAC AA
stable outlook Not Rated
AA+
stable outlook
AGC AA
stable outlook
A3
negative outlook Not Rated
23
Financial Strength Ratings
Financial Strength Ratings As of March 23, 2015
• We maintain strong financial strength ratings
• On March 18, 2014, S&P upgraded the financial
strength ratings of AGM, MAC, and AGC to AA
(stable outlook)
– A key factor listed by S&P in support of the upgrade was
that “the full payment of claims to investors on various
‘high-profile’ municipal bankruptcies held in Assured’s
insured portfolio demonstrates and reiterates to various
constituents the value of bond insurance and the credit
position and capacity of the company.”
– S&P affirmed its ratings on July 2, 2014, stating that the
group’s capital adequacy cushion (the amount of capital
remaining after S&P’s simulated AAA depression test)
was $1.45 to $1.55 billion at year-end 2013, up from $450
to $500 million a year earlier
• In November 2014, Kroll Bond Rating Agency (KBRA) assigned AGM a rating of AA+ (stable outlook)
– In its report, KBRA states that AGM “demonstrates an ability to withstand KBRA’s conservative stress case loss assumptions
across the breadth of its insured portfolio” and “benefits from a tested management team supported by strong governance
and risk management systems”
– KBRA also assigns MAC a rating of AA+ (stable outlook)
• In January 2015, Moody’s published its revised bond insurer criteria
– Moody’s subsequently published Credit Opinions maintaining AGM and AGC’s existing ratings under the new methodology,
yet the revised criteria are clearly designed to cap the potential rating of any bond insurer at a level below the AA category

• The cumulative total (gross of reinsurance) of settlement receipts and commitments, R&W putbacks,
and future projected losses on terminated insurance protection was approximately $4.2 billion1,2
• Favorable 2013 ruling in Flagstar trial was a positive development for ongoing and future R&W litigation
• Our largest agreement was with Bank of America / Countrywide, which was signed in April 2011. We
have also signed agreements with Deutsche Bank in May 2012, UBS in May 2013, Flagstar in June 2013,
and Credit Suisse in 2014, as well as parties to other confidential agreements
• As a result of our success in pursuing R&W providers, our projected future R&W benefit has declined
1. As of December 31, 2014. Includes future benefits covered under our agreements with Bank of America/Countrywide, Deutsche Bank, UBS and agreements with certain
other parties. Bank of America, Deutsche Bank AG and UBS have collateralized their future reimbursement obligations with eligible assets placed in trust. The amount of
assets required to be posted may increase or decrease from time to time, as determined by rating agency requirements.
2. The R&W putbacks flow through the transaction waterfalls and do not necessarily benefit us dollar-for-dollar.
$1,671 $1,650 $1,370
$712
$317
4Q-10 4Q-11 4Q-12 4Q-13 4Q-14
Future Net R&W Benefit
24
Pursuing Loss Mitigation Strategies R&W Activity
Future Net R&W Benefit
($ in millions)
2009 2010 2011 2012 2013 2014 TotalSale Proceeds
$50.3
$184.5
$5.8 $17.9
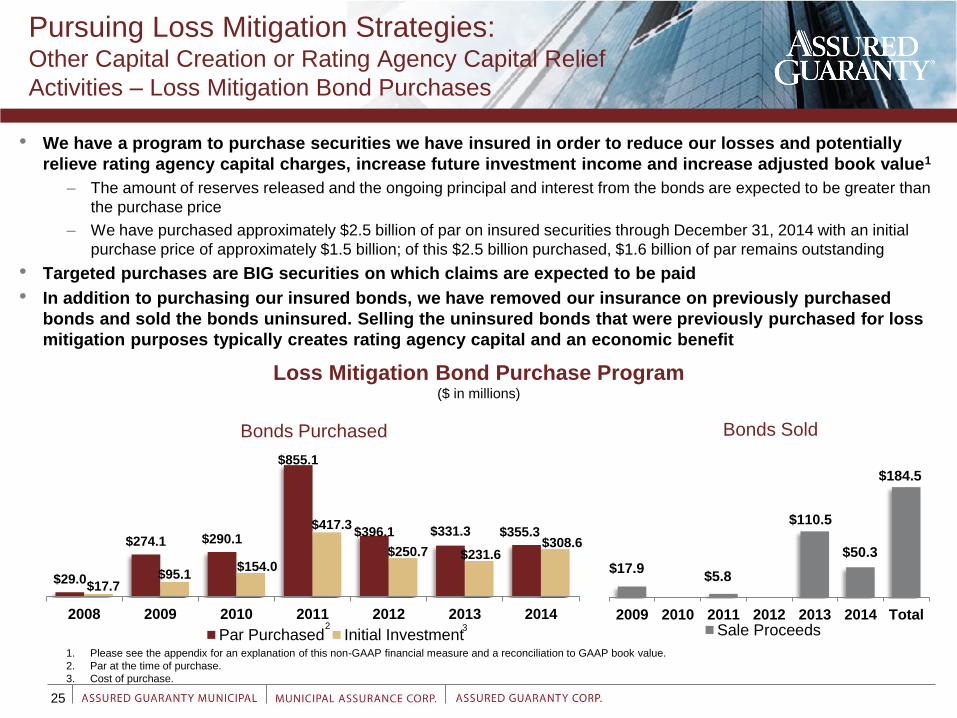
• We have a program to purchase securities we have insured in order to reduce our losses and potentially
relieve rating agency capital charges, increase future investment income and increase adjusted book value1
– The amount of reserves released and the ongoing principal and interest from the bonds are expected to be greater than
the purchase price
– We have purchased approximately $2.5 billion of par on insured securities through December 31, 2014 with an initial
purchase price of approximately $1.5 billion; of this $2.5 billion purchased, $1.6 billion of par remains outstanding
• Targeted purchases are BIG securities on which claims are expected to be paid
• In addition to purchasing our insured bonds, we have removed our insurance on previously purchased
bonds and sold the bonds uninsured. Selling the uninsured bonds that were previously purchased for loss
mitigation purposes typically creates rating agency capital and an economic benefit
$29.0
$274.1 $290.1
$855.1
$396.1 $331.3 $355.3
$17.7 $95.1
$154.0
$417.3
$250.7 $231.6 $308.6
2008 2009 2010 2011 2012 2013 2014
Par Purchased Initial Investment
Loss Mitigation Bond Purchase Program ($ in millions)
1. Please see the appendix for an explanation of this non-GAAP financial measure and a reconciliation to GAAP book value.
2. Par at the time of purchase.
3. Cost of purchase.
2 3
$110.5
Bonds Purchased Bonds Sold
25
Pursuing Loss Mitigation Strategies: Other Capital Creation or Rating Agency Capital Relief
Activities – Loss Mitigation Bond Purchases

26
Insured Portfolio Amortization Also
Creates Rating Agency Capital
4Q-09 4Q-10 4Q-11 4Q-12 4Q-13 4Q-14 4Q-15 4Q-16 4Q-17 4Q-18 4Q-19
Consolidated Net Par Outstanding Amortization by Asset Type as of December 31, 2014
($ in billions)
Public Finance Structured Finance
Actual Expected
27.2% 24.2% 20.6%
18.0% 15.9%
8.9% 6.2% 5.6% 5.1%
10.4%
$640 $617
$557 $519
$363 $333
$304 $269 $286
1
1. Please see footnote 3 on page 12.
79.4% 82.0% 84.1%
• Amortization of the portfolio reduces rating agency capital charges but also embedded future earned premiums
• Public finance exposure amortizes at a steady rate – $353.5 billion net par outstanding
– 8% expected to amortize by year-end 2015; 19% by year-end 20171
• Structured finance exposure amortizes quickly – $50.2 billion net par outstanding
– 25% expected to amortize by year-end 2015; 63% by year-end 20171
• New direct or assumed business originations, and reassumptions, increase future premiums
$459
72.8% 87.6% 75.8% 89.6%
93.8% 91.1% 94.9% 94.4%
12.4% $404
27
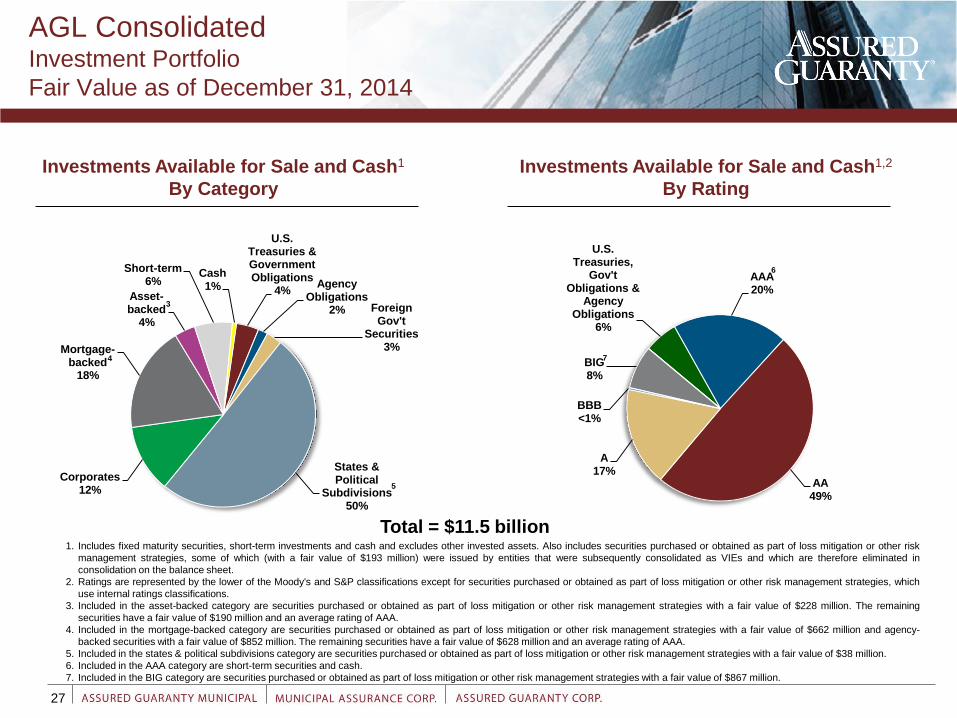
AGL Consolidated Investment Portfolio
Fair Value as of December 31, 2014
1. Includes fixed maturity securities, short-term investments and cash and excludes other invested assets. Also includes securities purchased or obtained as part of loss mitigation or other risk
management strategies, some of which (with a fair value of $193 million) were issued by entities that were subsequently consolidated as VIEs and which are therefore eliminated in
consolidation on the balance sheet.
2. Ratings are represented by the lower of the Moody's and S&P classifications except for securities purchased or obtained as part of loss mitigation or other risk management strategies, which
use internal ratings classifications.
3. Included in the asset-backed category are securities purchased or obtained as part of loss mitigation or other risk management strategies with a fair value of $228 million. The remaining
securities have a fair value of $190 million and an average rating of AAA.
4. Included in the mortgage-backed category are securities purchased or obtained as part of loss mitigation or other risk management strategies with a fair value of $662 million and agency-
backed securities with a fair value of $852 million. The remaining securities have a fair value of $628 million and an average rating of AAA.
5. Included in the states & political subdivisions category are securities purchased or obtained as part of loss mitigation or other risk management strategies with a fair value of $38 million.
6. Included in the AAA category are short-term securities and cash.
7. Included in the BIG category are securities purchased or obtained as part of loss mitigation or other risk management strategies with a fair value of $867 million.
U.S. Treasuries & Government Obligations
4% Agency
Obligations 2% Foreign
Gov't Securities
3%
States & Political
Subdivisions 50%
Corporates 12%
Mortgage-backed
18%
Asset-backed
4%
Short-term 6%
Cash 1%
Total = $11.5 billion
Investments Available for Sale and Cash1
By Category
Investments Available for Sale and Cash1,2
By Rating
U.S. Treasuries,
Gov't Obligations &
Agency Obligations
6%
AAA 20%
AA 49%
A 17%
BBB <1%
BIG 8%
4
6
7
5
3
28
Credit Default Swap Spreads
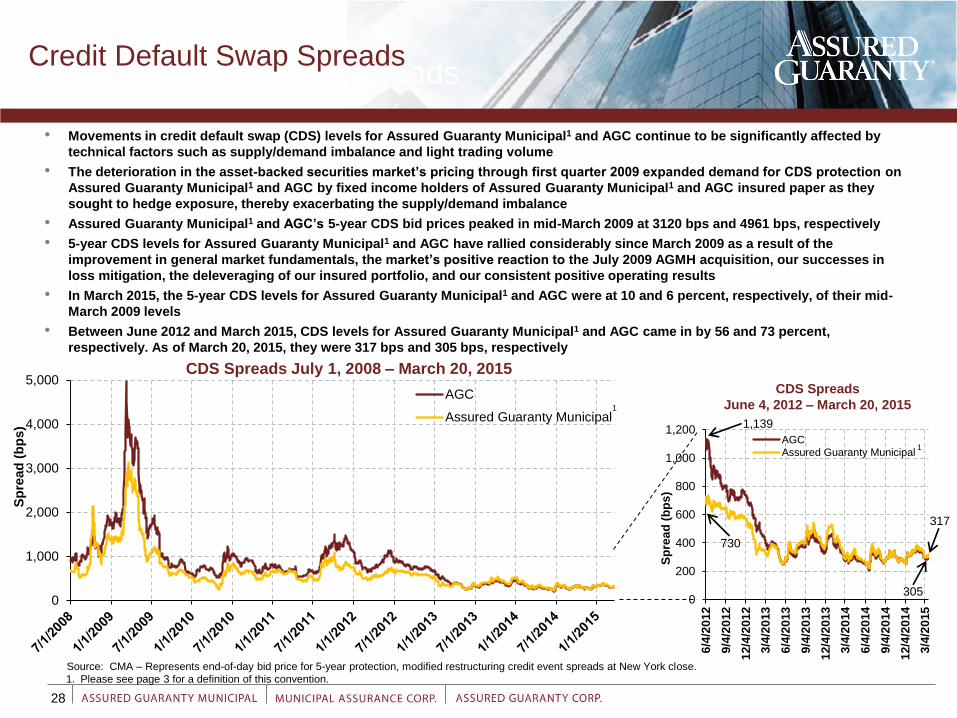
• Movements in credit default swap (CDS) levels for Assured Guaranty Municipal1 and AGC continue to be significantly affected by
technical factors such as supply/demand imbalance and light trading volume
• The deterioration in the asset-backed securities market’s pricing through first quarter 2009 expanded demand for CDS protection on
Assured Guaranty Municipal1 and AGC by fixed income holders of Assured Guaranty Municipal1 and AGC insured paper as they
sought to hedge exposure, thereby exacerbating the supply/demand imbalance
• Assured Guaranty Municipal1 and AGC’s 5-year CDS bid prices peaked in mid-March 2009 at 3120 bps and 4961 bps, respectively
• 5-year CDS levels for Assured Guaranty Municipal1 and AGC have rallied considerably since March 2009 as a result of the
improvement in general market fundamentals, the market’s positive reaction to the July 2009 AGMH acquisition, our successes in
loss mitigation, the deleveraging of our insured portfolio, and our consistent positive operating results
• In March 2015, the 5-year CDS levels for Assured Guaranty Municipal1 and AGC were at 10 and 6 percent, respectively, of their mid-
March 2009 levels
• Between June 2012 and March 2015, CDS levels for Assured Guaranty Municipal1 and AGC came in by 56 and 73 percent,
respectively. As of March 20, 2015, they were 317 bps and 305 bps, respectively
Source: CMA – Represents end-of-day bid price for 5-year protection, modified restructuring credit event spreads at New York close.
CDS Spreads July 1, 2008 – March 20, 2015
0
1,000
2,000
3,000
4,000
5,000AGC
Assured Guaranty Municipal
Sp
read
(b
ps)
Sp
rea
d (
bp
s)
CDS Spreads
June 4, 2012 – March 20, 2015
0
200
400
600
800
1,000
1,200
6/4
/20
12
9/4
/20
12
12/4
/201
2
3/4
/20
13
6/4
/20
13
9/4
/20
13
12/4
/201
3
3/4
/20
14
6/4
/20
14
9/4
/20
14
12/4
/201
4
3/4
/20
15
AGC
Assured Guaranty Municipal
317
1,139
730
Credit Default Swap Spreads
1. Please see page 3 for a definition of this convention.
1
1
305

Assured Guaranty Ltd. Consolidated
Insured Portfolio Overview
30
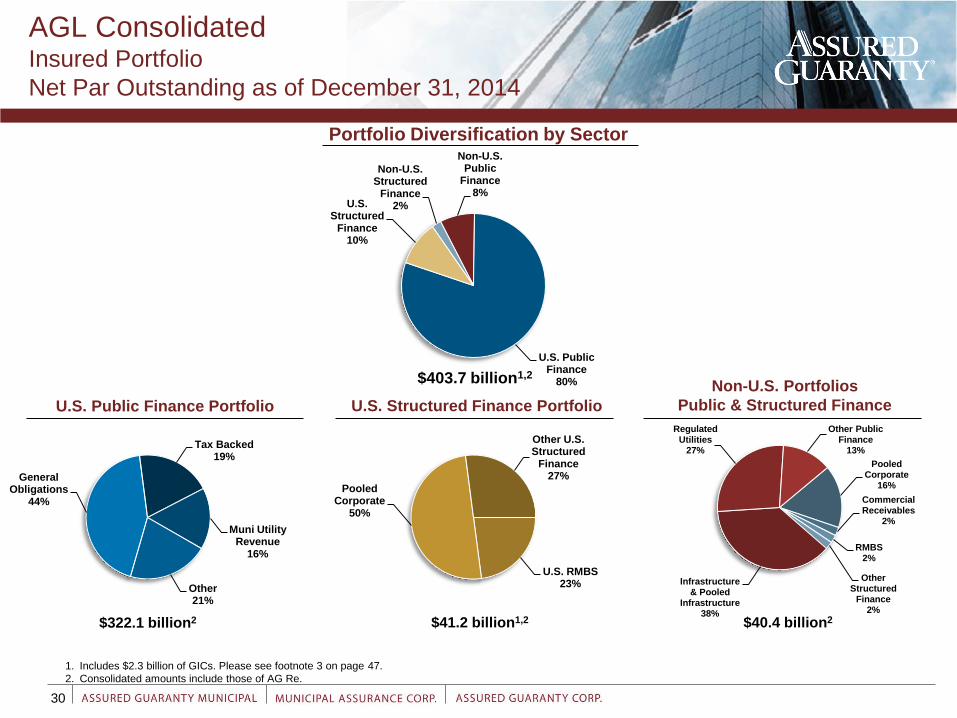
AGL Consolidated Insured Portfolio
Net Par Outstanding as of December 31, 2014
1. Includes $2.3 billion of GICs. Please see footnote 3 on page 47.
2. Consolidated amounts include those of AG Re.
Non-U.S. Public
Finance 8%
U.S. Public Finance
80%
U.S. Structured
Finance 10%
Non-U.S. Structured
Finance 2%
$403.7 billion1,2
Portfolio Diversification by Sector
General Obligations
44%
Tax Backed 19%
Muni Utility Revenue
16%
Other 21%
$322.1 billion2
U.S. Public Finance Portfolio
U.S. RMBS 23%
Pooled Corporate
50%
Other U.S. Structured
Finance 27%
$41.2 billion1,2
U.S. Structured Finance Portfolio
Pooled Corporate
16%
Commercial Receivables
2%
RMBS 2%
Other Structured
Finance 2%
Infrastructure & Pooled
Infrastructure 38%
Regulated Utilities
27%
Other Public Finance
13%
$40.4 billion2
Non-U.S. Portfolios
Public & Structured Finance

31
AGL Consolidated Insured Portfolio Ratings
Net Par Outstanding as of December 31, 2014
1. Includes $2.3 billion of GICs. Please see footnote 3 on page 47.
2. Consolidated amounts include those of AG Re.
AAA 7%
AA 25%
A 46%
BBB 17%
BIG 5%
$403.7 billion1,2
Portfolio Diversification by Rating
AAA 1%
AA 28%
A 55%
BBB 14%
BIG 2%
$322.1 billion2
U.S. Public Finance Portfolio U.S. Structured Finance Portfolio
Non-U.S. Portfolios
Public & Structured Finance
AAA 49%
AA 20%
A 7%
BBB 4%
BIG 20%
$41.2 billion1,2
AAA 15%
AA 8%
A 19%
BBB 53%
BIG 5%
$40.4 billion2

32
Exposure Net Par Outstanding Internal Rating
Water $ 878 BBB
Sewer $ 1,049 BBB
Total $ 1,927 BBB
• Municipal utilities exposure is $878 million of water revenue bonds and $1,049 million of sewer revenue bonds. Both the water and
sewer systems provide services to areas that extend significantly beyond the City of Detroit boundaries. – In September 2014, approximately $677 million of the Company's then combined $1.8 billion net par exposure to Detroit’s water revenue and sewer
revenue bonds was purchased by the City as part of a tender offer or refunded. The Company insured approximately $841 million gross par of new
water revenue and sewer revenue bonds, the proceeds of which funded the tender offer and refunding. Under the City's amended plan of adjustment,
the proposed impairment of all outstanding water revenue and sewer revenue bonds was removed, including those provisions which provided for the
impairment of interest rates and call protection on such bonds.
• General obligation unlimited tax exposure has been resolved – In 3Q-14, the settlement between the Company and City of Detroit regarding unlimited tax general obligation bonds was finalized. In December 2014,
the City’s plan of adjustment, which includes the terms of such settlement, became effective. At that time, investors exchanged 84.5% of the original
general obligation bonds for newly issued bonds that are basically identical to the original bonds except that they have the benefit of additional
pledged security and are issued by the Michigan Finance Authority. The remaining 15.5% of the general obligation bonds will be repaid solely by
Assured Guaranty. After giving effect to post-petition payments made by Assured Guaranty on the general obligation bonds, the settlement results in
an ultimate recovery to Assured Guaranty of approximately 74%.
• The Company no longer has exposure to the City’s Certificates of Participation – As of September 30, 2014, the Company’s general fund exposure was $175 million of Certificates of Participation. However, upon the effective date of
the City’s plan of adjustment, a commutation agreement between AG Re and FGIC pursuant to which FGIC commuted all the reinsurance AG Re
provided to FGIC with respect to the Certificates of Participation became effective.
• Net par exposure to Stockton is $117 million of pension obligation bonds
– On October 3, 2013, the Company reached a settlement with the City of Stockton regarding the treatment of the obligations insured by the Company.
Under the terms of the settlement, the Company will continue to receive net revenues from an office building and an option to take title to that building,
and will be entitled to certain fixed payments and certain variable payments contingent on the City's revenue growth. On October 30, 2014, the
bankruptcy court confirmed the plan of adjustment, which includes the terms of such settlement, and the plan became effective on February 25, 2015.
Details of Assured Guaranty’s Exposure to Detroit
Water / Sewer Exposure As of December 31, 2014
($ in millions)
AGL Consolidated Detroit & Stockton Exposure
Details of Assured Guaranty’s Exposure to Stockton

($ in millions) Net Par Outstanding Gross Par Outstanding Internal Rating
Puerto Rico Highways and Transportation Authority
(Transportation Revenue Bonds) $844 $912 BB-
Puerto Rico Electric Power Authority 772 1,006 B-
Puerto Rico Aqueduct and Sewer Authority 384 384 BB-
Puerto Rico Highways and Transportation Authority
(Highway Revenue Bonds) 273 582 BB
Puerto Rico Convention Center District Authority 174 174 BB-
Subtotal $2,447 $3,058 B+
Commonwealth - General Obligation Bonds $1,672 $1,844 BB
Puerto Rico Municipal Finance Agency 399 656 BB-
Puerto Rico Sales Tax Finance Corp. (COFINA) 269 269 BBB
Puerto Rico Public Buildings Authority 100 156 BB
Government Development Bank for Puerto Rico 33 33 BB
Puerto Rico Infrastructure Financing Agency 18 18 BB-
University of Puerto Rico 1 1 BB-
Subtotal $2,492 $2,977 BB
Total1 $4,939 $6,035 BB-
• In June 2014, the Puerto Rico legislature passed the Recovery Act in order to provide a legislative framework for certain public corporations experiencing
severe financial stress to restructure their debt, including PRHTA and PREPA. On February 6, 2015, the U.S. District Court for the District of Puerto Rico ruled
the Recovery Act is preempted by the U.S. Bankruptcy Code and is therefore void; the Commonwealth has appealed the ruling. The Commonwealth's
Resident Commissioner has introduced a bill to the U.S. Congress that, if passed, would enable the Commonwealth to authorize one or more of its public
corporations to restructure their debts under chapter 9 of the U.S Bankruptcy Code if they were to become insolvent. These recent events have resulted in
uncertainty among investors about the rights of creditors of the Commonwealth and its related authorities and public corporations.
• In August 2014, creditors, including AGM and AGC, agreed not to exercise rights and remedies until March 31, 2015, and the bank lenders agreed to extend
the maturity of two revolving lines of credit to the same date. PREPA agreed it would continue to make principal and interest payments on its outstanding
bonds, and interest payments in its lines of credit. It also agreed it would develop a five year business plan and a recovery program in respect of its operations.
• Legislation was signed by the governor on January 15, 2015, that provides for certain tax revenues that would support PRHTA and require the transfer of
certain liabilities and revenues from PHRTA to another authority, as well as requiring the transfer of the operations of poorly performing transit facilities to a
new authority.
1. AGL’s consolidated net par outstanding is divided between its subsidiaries as follows: $2.2 billion at AGM, $1.4 billion at AGC, $1.4 billion at AG Re, and $0 at MAC. A portion of the
subsidiary level exposure is eliminated upon consolidation due to instances where one subsidiary insured bonds that were previously insured by another subsidiary.
Subject to the
Now Voided
Recovery Act
Not Subject
to the
Now Voided
Recovery Act
Par Exposure to the Commonwealth and its Agencies As of December 31, 2014
33
AGL Consolidated Puerto Rico Exposure
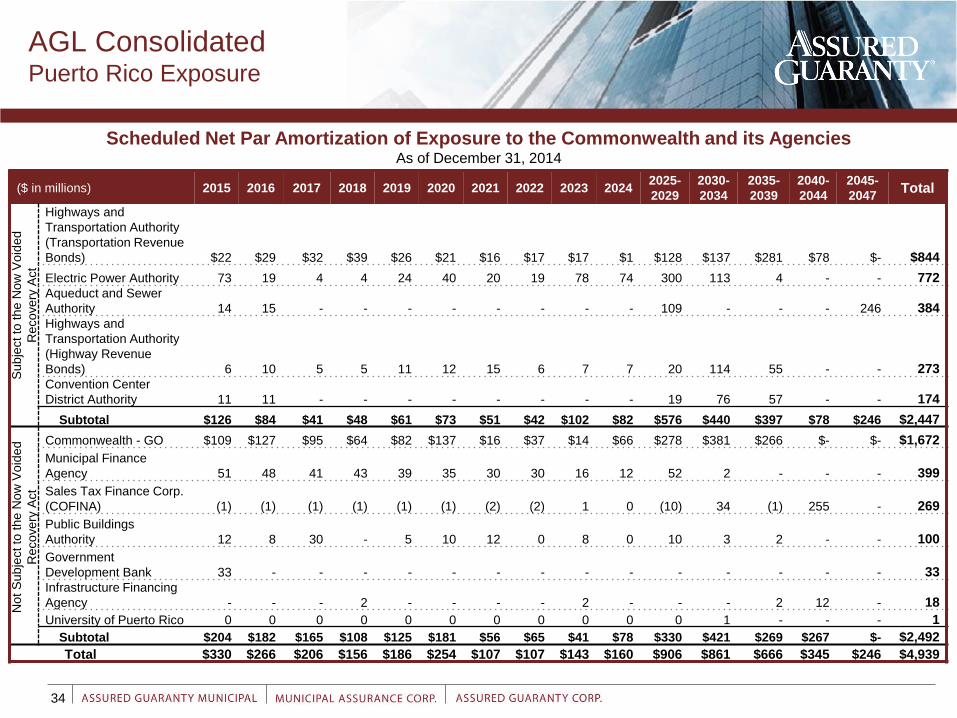
($ in millions) 2015 2016 2017 2018 2019 2020 2021 2022 2023 2024 2025-
2029
2030-
2034
2035-
2039
2040-
2044
2045-
2047 Total
Su
bje
ct to
th
e N
ow
Vo
ide
d
Recovery
Act
Highways and
Transportation Authority
(Transportation Revenue
Bonds) $22 $29 $32 $39 $26 $21 $16 $17 $17 $1 $128 $137 $281 $78 $- $844
Electric Power Authority 73 19 4 4 24 40 20 19 78 74 300 113 4 - - 772 Aqueduct and Sewer
Authority 14 15 - - - - - - - - 109 - - - 246 384 Highways and
Transportation Authority
(Highway Revenue
Bonds) 6 10 5 5 11 12 15 6 7 7 20 114 55 - - 273 Convention Center
District Authority 11 11 - - - - - - - - 19 76 57 - - 174
Subtotal $126 $84 $41 $48 $61 $73 $51 $42 $102 $82 $576 $440 $397 $78 $246 $2,447
No
t S
ub
ject to
th
e N
ow
Vo
ide
d
Recovery
Act
Commonwealth - GO $109 $127 $95 $64 $82 $137 $16 $37 $14 $66 $278 $381 $266 $- $- $1,672
Municipal Finance
Agency 51 48 41 43 39 35 30 30 16 12 52 2 - - - 399
Sales Tax Finance Corp.
(COFINA) (1) (1) (1) (1) (1) (1) (2) (2) 1 0 (10) 34 (1) 255 - 269
Public Buildings
Authority 12 8 30 - 5 10 12 0 8 0 10 3 2 - - 100
Government
Development Bank 33 - - - - - - - - - - - - - - 33 Infrastructure Financing
Agency - - - 2 - - - - 2 - - - 2 12 - 18
University of Puerto Rico 0 0 0 0 0 0 0 0 0 0 0 1 - - - 1
Subtotal $204 $182 $165 $108 $125 $181 $56 $65 $41 $78 $330 $421 $269 $267 $- $2,492
Total $330 $266 $206 $156 $186 $254 $107 $107 $143 $160 $906 $861 $666 $345 $246 $4,939
Scheduled Net Par Amortization of Exposure to the Commonwealth and its Agencies As of December 31, 2014
34
AGL Consolidated Puerto Rico Exposure

($ in millions) 2015 2016 2017 2018 2019 2020 2021 2022 2023 2024 2025-
2029
2030-
2034
2035-
2039
2040-
2044
2045-
2047 Total
Subje
ct to
the N
ow
Void
ed
Recovery
Act
Highways and
Transportation Authority
(Transportation Revenue
Bonds) $66 $72 $73 $79 $64 $57 $51 $51 $51 $34 $280 $257 $338 $84 $- $1,557
Electric Power Authority 109 51 36 35 55 70 48 47 104 97 365 125 5 - - 1,147 Aqueduct and Sewer
Authority 34 34 18 18 18 18 18 18 18 18 186 63 63 63 271 858 Highways and
Transportation Authority
(Highway Revenue
Bonds) 21 24 19 19 24 24 27 17 18 18 68 148 59 - - 486 Convention Center
District Authority 19 18 7 7 7 7 7 7 7 7 52 103 61 - - 309
Subtotal $249 $199 $153 $158 $168 $176 $151 $140 $198 $174 $951 $696 $526 $147 $271 $4,357
No
t S
ubje
ct to
the N
ow
Void
ed
Recovery
Act
Commonwealth - GO $195 $208 $170 $133 $149 $200 $71 $91 $67 $119 $492 $529 $295 $- $- $2,719
Municipal Finance
Agency 70 66 57 56 50 44 38 36 20 15 59 3 - - - 514
Sales Tax Finance Corp.
(COFINA) 13 13 13 13 13 13 13 13 16 15 63 106 63 283 - 650
Public Buildings
Authority 17 12 34 3 7 13 14 1 9 1 12 5 4 - - 132
Government
Development Bank 36 - - - - - - - - - - - - - - 36 Infrastructure Financing
Agency 1 1 1 3 1 1 1 1 3 1 3 3 5 13 - 38
University of Puerto Rico 0 0 0 0 0 0 0 0 0 0 0 1 - - - 1
Subtotal $332 $300 $275 $208 $220 $271 $137 $142 $115 $151 $629 $647 $367 $296 $- $4,090
Total $581 $499 $428 $366 $388 $447 $288 $282 $313 $325 $1,580 $1,343 $893 $443 $271 $8,447
Scheduled Net Debt Service Amortization of Exposure to the Commonwealth and its Agencies As of December 31, 2014
35
AGL Consolidated Puerto Rico Exposure

AAA $25.4
AA $8.7
A $3.4
BBB $3.7
BIG $9.0
• We expect Assured Guaranty’s global
structured finance insured portfolio ($50.2
billion as of December 31, 2014) to amortize
rapidly ─ 25% by year-end 2015 and 63% by
year-end 20172
– $27.3 billion in global pooled corporate obligations
expected to be reduced by 34% by year-end 2015
and by 84% by year-end 20172
– $9.4 billion in U.S. RMBS expected to be reduced by
16% by year-end 2015 and by 42% by year-end
20172
• Assured Guaranty and AGM’s3 total structured
finance exposures of $240.9 billion at
December 31, 2007 have declined by $190.7
billion to $50.2 billion December 31, 2014, a
79% reduction, or approximately $27 billion
per year
36
AGL Consolidated Structured Finance Exposures
Net Par Outstanding
U.S. and Non-U.S. Pooled
Corporate $27.3
U.S. RMBS $9.4
Financial Products (GICs) $2.3
Other Structured Finance $11.3
$50.2 billion, AA- average rating
By Internal Rating
1
54%
19%
22%
5%
51% 7%
7%
1. Please see footnote 3 on page 47.
2. Please see footnote 3 on page 12.
3. Please see page 3 for a definition of this convention and the appendix for a reconciliation to the corresponding GAAP value.
By Type As of December 31, 2014
($ in billions)
17%
18%
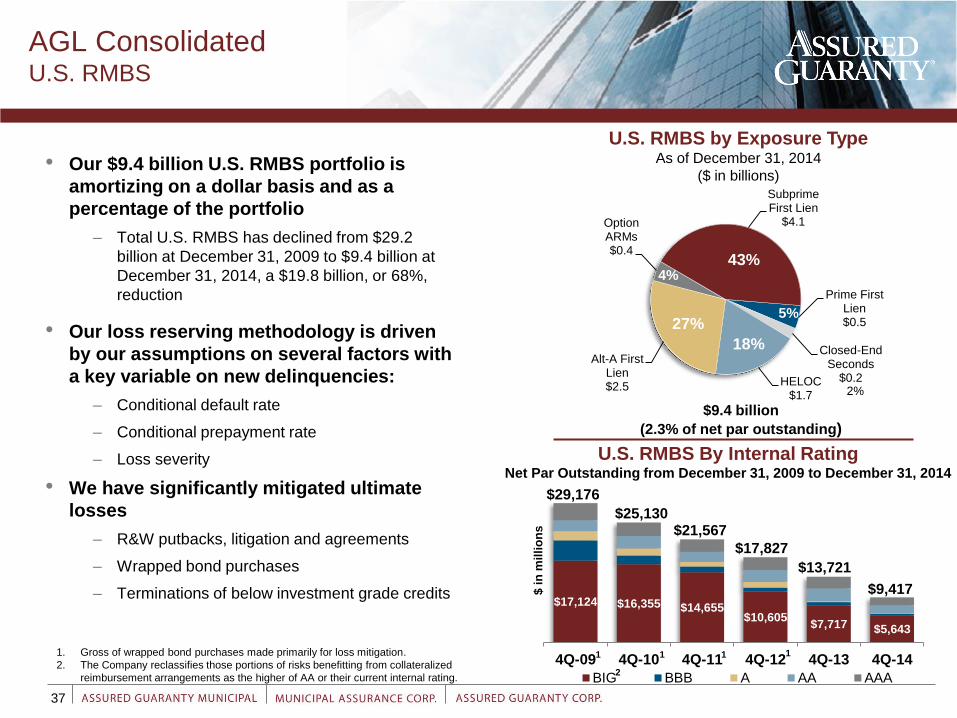
$17,124 $16,355 $14,655 $10,605
$7,717 $5,643
4Q-09 4Q-10 4Q-11 4Q-12 4Q-13 4Q-14
$ i
n m
illi
on
s
BIG BBB A AA AAA
$21,567
• Our $9.4 billion U.S. RMBS portfolio is
amortizing on a dollar basis and as a
percentage of the portfolio
– Total U.S. RMBS has declined from $29.2
billion at December 31, 2009 to $9.4 billion at
December 31, 2014, a $19.8 billion, or 68%,
reduction
• Our loss reserving methodology is driven
by our assumptions on several factors with
a key variable on new delinquencies:
– Conditional default rate
– Conditional prepayment rate
– Loss severity
• We have significantly mitigated ultimate
losses
– R&W putbacks, litigation and agreements
– Wrapped bond purchases
– Terminations of below investment grade credits
37
$9.4 billion
(2.3% of net par outstanding)
$29,176
$25,130
U.S. RMBS By Internal Rating Net Par Outstanding from December 31, 2009 to December 31, 2014
$17,827
$13,721
1. Gross of wrapped bond purchases made primarily for loss mitigation.
2. The Company reclassifies those portions of risks benefitting from collateralized
reimbursement arrangements as the higher of AA or their current internal rating.
$9,417
1 1 1 1
AGL Consolidated U.S. RMBS
U.S. RMBS by Exposure Type As of December 31, 2014
($ in billions)
Prime First Lien $0.5
Closed-End Seconds
$0.2 HELOC $1.7
Alt-A First Lien $2.5
Option ARMs $0.4
Subprime First Lien
$4.1
43%
18%
27%
4%
5%
2%
2

$2.4 $2.3 $2.2
$4.6 $4.4 $4.2 $4.0 $4.1 $3.8 $3.4 $3.2 $3.1 $2.7 $2.2
$2.2 $2.1 $2.0
$1.9 $1.9 $1.8 $1.7 $2.5
$2.2 $2.6 $2.6 $2.7 $2.6 $2.9
$18.2 $17.5
$17.0 $13.7
$13.2 $12.2
$11.7 $10.2
$8.5 $7.8 $7.2 $6.8
$5.3 $4.3
$0.8 $0.8
$0.9 $0.9
$0.9 $1.0
3Q
-11
4Q
-11
1Q
-12
2Q
-12
3Q
-12
4Q
-12
1Q
-13
2Q
-13
3Q
-13
4Q
-13
1Q
-14
2Q
-14
3Q
-14
4Q
-14
Repurchase adjustments
Total U.S. RMBS not included in R&W agreements
Settled net par outstanding without a loss-sharing component
Settled net par outstanding with a loss-sharing component
Net Par Outstanding by Quarter ($ in billions)
$4.6 $4.4
$6.5 $6.2 $5.9 $5.7
$4.3
$6.6
• 54% of total U.S. RMBS is included in R&W
agreements
– 72% of our exposure to troubled U.S. RMBS
transactions (below investment grade plus
reclassified par due to loss-sharing arrangements)
is included in R&W agreements
• 24% of total U.S. RMBS is included in loss-
sharing arrangements
– 31% of our exposure to troubled U.S. RMBS
transactions (below investment grade plus
reclassified par due to loss-sharing arrangements)
is covered by ongoing loss-sharing agreements
• Counterparties include Bank of America,
Deutsche Bank, UBS, Flagstar, as well as
parties to other confidential agreements
– UBS agreed to reimburse 85% of future claims
with no ceiling
– Flagstar agreed to reimburse 100% of future
losses
$22.5
$20.9 $19.9
$19.1 $17.8
$21.6
$17.1 $16.3
$15.4
$6.0 $6.0
$14.6 $13.0
$5.8
$10.5
$5.2
$12.6
$5.8 $5.1
$9.4
38
AGL Consolidated U.S. RMBS Exposure Loss-Sharing Arrangements (as of December 31, 2014)

39
AGL Consolidated First Lien 30-59 Day Delinquencies For Financial Guaranty Direct Transactions
Reflects actual AGM and AGC direct data. Assured Guaranty has not insured any U.S. RMBS since 2008.
• First lien 30-59 day delinquencies are down
since January 2009 in both percentage
terms and dollar amounts in Option-ARM,
Alt-A and subprime transactions
5.4
%
4.4
%
4.2
%
4.2
%
4.0
%
3.5
%
3.4
%
3.5
%
3.4
%
3.1
%
3.0
%
3.2
%
2.8
%
2.7
%
2.4
%
2.7
%
2.6
%
2.6
%
3.0
%
2.9
%
2.5
%
2.3
%
2.8
%
2.7
%
2.6
%
2.8
%
2.7
%
2.8
%
2.9
%
2.7
%
2.7
%
2.5
%
2.6
%
2.4
%
2.6
%
2.8
%
3.2
%
2.9
%
2.8
% 3.4
%
Mar-
09
Ju
n-0
9
Sep
-09
De
c-0
9
Mar-
10
Ju
n-1
0
Sep
-10
De
c-1
0
Mar-
11
Ju
n-1
1
Sep
-11
De
c-1
1
Mar-
12
Ju
n-1
2
Sep
-12
De
c-1
2
Ja
n-1
3
Feb
-13
Mar-
13
Apr-
13
May-1
3
Ju
n-1
3
Ju
l-13
Aug
-13
Sep
-13
Oct-
13
No
v-1
3
De
c-1
3
Ja
n-1
4
Feb
-14
Mar-
14
Apr-
14
May-1
4
Ju
n-1
4
Ju
l-14
Aug
-14
Sep
-14
Oct-
14
No
v-1
4
De
c-1
4
Option-ARMs Originated 2003-2007
3.8
%
3.3
%
3.4
%
3.5
%
3.3
%
2.8
%
2.9
%
3.0
%
3.0
%
2.7
%
2.8
%
2.6
%
2.7
%
2.5
%
2.5
%
2.7
%
2.7
%
2.6
%
2.7
%
2.5
%
2.4
%
2.4
%
2.7
%
2.6
%
2.5
%
2.7
%
2.5
%
2.8
%
2.8
%
2.7
%
2.9
%
2.5
%
2.5
%
2.4
%
2.5
%
2.6
%
2.6
%
2.4
%
2.3
% 2.8
%
Mar-
09
Ju
n-0
9
Sep
-09
De
c-0
9
Mar-
10
Ju
n-1
0
Sep
-10
De
c-1
0
Mar-
11
Ju
n-1
1
Sep
-11
De
c-1
1
Mar-
12
Ju
n-1
2
Sep
-12
De
c-1
2
Ja
n-1
3
Feb
-13
Mar-
13
Apr-
13
May-1
3
Ju
n-1
3
Ju
l-13
Aug
-13
Sep
-13
Oct-
13
No
v-1
3
De
c-1
3
Ja
n-1
4
Feb
-14
Mar-
14
Apr-
14
May-1
4
Ju
n-1
4
Ju
l-14
Aug
-14
Sep
-14
Oct-
14
No
v-1
4
De
c-1
4
Alt-A Originated 2004-2007
5.9
%
5.2
%
5.3
%
5.1
%
4.4
%
4.1
%
4.4
%
4.5
%
4.0
%
3.8
%
4.2
%
4.3
%
3.8
%
3.8
%
3.9
%
4.1
%
4.3
%
4.2
%
4.1
%
3.8
%
3.7
%
3.6
%
4.0
%
4.0
%
4.0
%
4.1
%
4.1
%
4.2
%
3.7
%
4.2
%
4.0
%
3.6
%
3.6
%
3.7
%
3.9
%
3.9
%
4.1
%
4.0
%
3.9
%
4.2
%
Mar-
09
Ju
n-0
9
Sep
-09
De
c-0
9
Mar-
10
Ju
n-1
0
Sep
-10
De
c-1
0
Mar-
11
Ju
n-1
1
Sep
-11
De
c-1
1
Mar-
12
Ju
n-1
2
Sep
-12
De
c-1
2
Ja
n-1
3
Feb
-13
Mar-
13
Apr-
13
May-1
3
Ju
n-1
3
Ju
l-13
Aug
-13
Sep
-13
Oct-
13
No
v-1
3
De
c-1
3
Ja
n-1
4
Feb
-14
Mar-
14
Apr-
14
May-1
4
Ju
n-1
4
Ju
l-14
Aug
-14
Sep
-14
Oct-
14
No
v-1
4
De
c-1
4
Subprime Originated 2005-2008

40
AGL Consolidated Second Lien 30-59 Day Delinquencies For Financial Guaranty Direct Transactions
• Second lien 30-59 day delinquencies
are down since January 2009 in both
percentage terms and dollar amounts
for troubled HELOCs
Reflects actual AGM and AGC direct data. Assured Guaranty has not insured any U.S. RMBS since 2008.
Increase due
to anticipated
servicing
transfer
3.5
%
3.0
%
2.9
%
3.0
%
3.2
%
2.8
%
2.7
%
2.6
%
2.9
%
2.4
%
2.4
%
2.3
%
2.4
%
2.1
%
1.9
%
2.1
%
2.4
%
2.0
%
3.7
%
3.1
%
1.6
%
1.6
%
1.8
%
1.8
%
1.8
%
1.8
%
2.0
%
2.0
%
2.3
%
1.8
%
2.1
%
1.8
%
1.7
%
1.9
%
1.9
%
2.2
%
2.1
%
2.0
%
2.3
%
2.1
%
Mar-
09
Ju
n-0
9
Sep
-09
De
c-0
9
Mar-
10
Ju
n-1
0
Sep
-10
De
c-1
0
Mar-
11
Ju
n-1
1
Sep
-11
De
c-1
1
Mar-
12
Ju
n-1
2
Sep
-12
De
c-1
2
Ja
n-1
3
Feb
-13
Mar-
13
Apr-
13
May-1
3
Ju
n-1
3
Ju
l-13
Aug
-13
Sep
-13
Oct-
13
No
v-1
3
De
c-1
3
Ja
n-1
4
Feb
-14
Mar-
14
Apr-
14
May-1
4
Ju
n-1
4
Ju
l-14
Aug
-14
Sep
-14
Oct-
14
No
v-1
4
De
c-1
4
HELOCs Originated 2004-2007

Other $10.1
Canada
$3.5
France $2.8
Australia $4.1
United Kingdom
$19.9
• Non-U.S. exposure is 78% public finance and
22% structured finance
• Approximately 73% of non-U.S. structured
exposure is to pooled corporates
– 80% are rated A or higher
• Direct sovereign debt is limited to:
– Poland $201 million
Non-U.S. Exposure As of December 31, 2014
($ in billions)
$40.4 billion, A average rating
25% 9%
10% 49%
7%
41
AGL Consolidated Non-U.S. Public and Structured Finance
Net Par Outstanding
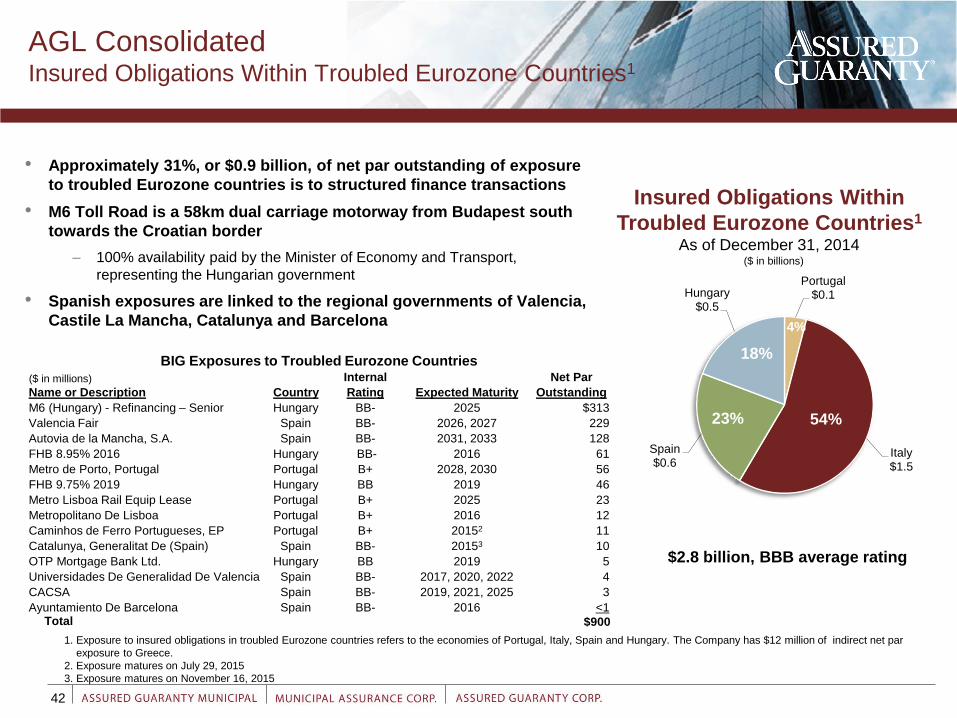
BIG Exposures to Troubled Eurozone Countries
Name or Description Country
Internal
Expected Maturity
Net Par
Rating Outstanding
M6 (Hungary) - Refinancing – Senior Hungary BB- 2025 $313
Valencia Fair Spain BB- 2026, 2027 229
Autovia de la Mancha, S.A. Spain BB- 2031, 2033 128
FHB 8.95% 2016 Hungary BB- 2016 61
Metro de Porto, Portugal Portugal B+ 2028, 2030 56
FHB 9.75% 2019 Hungary BB 2019 46
Metro Lisboa Rail Equip Lease Portugal B+ 2025 23
Metropolitano De Lisboa Portugal B+ 2016 12
Caminhos de Ferro Portugueses, EP Portugal B+ 20152 11
Catalunya, Generalitat De (Spain) Spain BB- 20153 10
OTP Mortgage Bank Ltd. Hungary BB 2019 5
Universidades De Generalidad De Valencia Spain BB- 2017, 2020, 2022 4
CACSA Spain BB- 2019, 2021, 2025 3
Ayuntamiento De Barcelona Spain BB- 2016 <1 Total $900
• Approximately 31%, or $0.9 billion, of net par outstanding of exposure
to troubled Eurozone countries is to structured finance transactions
• M6 Toll Road is a 58km dual carriage motorway from Budapest south
towards the Croatian border
– 100% availability paid by the Minister of Economy and Transport,
representing the Hungarian government
• Spanish exposures are linked to the regional governments of Valencia,
Castile La Mancha, Catalunya and Barcelona
51%
Insured Obligations Within
Troubled Eurozone Countries1
As of December 31, 2014
($ in millions)
($ in billions)
1. Exposure to insured obligations in troubled Eurozone countries refers to the economies of Portugal, Italy, Spain and Hungary. The Company has $12 million of indirect net par
exposure to Greece.
2. Exposure matures on July 29, 2015
3. Exposure matures on November 16, 2015
1%
Portugal $0.1
Italy $1.5
Spain $0.6
Hungary $0.5
$2.8 billion, BBB average rating
54% 23%
18%
42
AGL Consolidated Insured Obligations Within Troubled Eurozone Countries1
4%

Eiffage CEVM / Foster + Partners / Jean-Pierre Lescourret
AGM1 Portfolio Review
1. “AGM Consolidated” means Assured Guaranty Municipal Corp. and its consolidated entities (consisting primarily of Assured Guaranty (Europe) Ltd., Municipal Assurance
Holdings Inc. (MAC Holdings), Municipal Assurance Corp. (MAC), and variable interest entities Assured Guaranty Municipal Corp. is required to consolidate under
accounting principles generally accepted in the United States). “AGM” means AGM Consolidated excluding MAC Holdings and MAC. “Assured Guaranty Municipal”
means AGM Consolidated excluding MAC Holdings, MAC and Assured Guaranty (Europe) Ltd.

44
• AGM’s1 portfolio is diversified by asset
class
– 71% U.S. public finance
– 13% U.S. structured finance
– 13% Non-U.S. public finance
– 3% Non-U.S. structured finance
• The portfolio maintains a high overall
credit rating despite downgrades in our
U.S. RMBS portfolio
– A average internal rating
Net Par Outstanding1,2
As of December 31, 2014
($ in billions)
$162.2 billion, A average rating
$37.9
U.S. Public Finance $115.8
U.S. Structured Finance
$21.5
Non-U.S. Structured
Finance $4.5
Non-U.S. Public Finance
$20.3
13%
71%
13%
AA+ average
rating
A average rating
AA average rating
BBB+ average
rating
3%
1. Please see page 43 for a definition of this convention and the appendix for a reconciliation to the corresponding GAAP value.
2. Includes $2.3 billion in GICs. Please see footnote 3 on page 47.
2
AGM1 Insured Portfolio Overview

45
AGM1 Insured Portfolio
Net Par Outstanding as of December 31, 2014
Non-U.S. Public
Finance 13%
U.S. Public Finance
71%
U.S. Structured
Finance 13%
Non-U.S. Structured
Finance 3%
$162.2 billion2
Portfolio Diversification by Sector
General Obligations
36%
Tax Backed 22%
Muni Utility Revenue
19%
Other 23%
$115.8 billion
U.S. Public Finance Portfolio
U.S. RMBS 23%
Pooled Corporate
63%
Other U.S. Structured
Finance 14%
$21.5 billion2
U.S. Structured Finance Portfolio
Pooled Corporate
14%
RMBS 3%
Other Structured
Finance 2%
Infrastructure 38% Regulated
Utilities 25%
Other Public
Finance 18%
$24.8 billion
Non-U.S. Portfolios
Public & Structured Finance
1. Please see page 43 for a definition of this convention and the appendix for a reconciliation to the corresponding GAAP value.
2. Includes $2.3 billion in GICs. Please see footnote 3 on page 47.

46
AGM1 Insured Portfolio Ratings
Net Par Outstanding as of December 31, 2014
AAA 11%
AA 23%
A 42%
BBB 19%
BIG 5%
$162.2 billion2
Portfolio Diversification by Rating
AAA 1%
AA 27%
A 54%
BBB 15%
BIG 3%
$115.8 billion
U.S. Public Finance Portfolio U.S. Structured Finance Portfolio
Non-U.S. Portfolios
Public & Structured Finance
AAA 61%
AA 23%
A <1%
BBB 1%
BIG 15%
$21.5 billion2
AAA 15% AA
3%
A 23%
BBB 53%
BIG 6%
$24.8 billion
1. Please see page 43 for a definition of this convention and the appendix for a reconciliation to the corresponding GAAP value.
2. Includes $2.3 billion in GICs. Please see footnote 3 on page 47.

47
1. Please see page 43 for a definition of this convention and the appendix for a reconciliation to the corresponding GAAP value.
2. Includes investor-owned utilities.
3. Assured Guaranty did not acquire Financial Security Assurance Holdings’ Financial Products (FP) segment. Assured Guaranty and its subsidiaries are indemnified against
exposure to the FP segment by Dexia SA (Dexia). As of December 31, 2014, the aggregate accreted balance of the guaranteed investment contracts (GICs) was approximately
$2.3 billion. As of the same date, with respect to the assets supporting the GIC business, the aggregate accreted principal balance was approximately $3.4 billion, the aggregate
market value was approximately $3.1 billion and the aggregate market value after agreed reductions was approximately $2.3 billion. Cash and positive derivative value exceeded
the negative derivative values and other projected costs by approximately $0.1 billion.
Net Par
Outstanding
Avg. Internal
Rating
U.S. public finance:
General obligation $ 41,717 A
Tax backed 25,325 A
Municipal utilities 21,808 A
Transportation 12,442 A
Healthcare 7,356 A
Higher education 3,483 A
Housing 1,493 A
Infrastructure finance 1,322 BB+
Other public finance2 894 A
Total U.S. public finance 115,840 A
Non-U.S. public finance:
Infrastructure finance 9,448 BBB
Regulated utilities 6,291 BBB+
Other public finance 4,553 A
Total non-U.S. public finance 20,292 BBB+
Total public finance $ 136,132 A
Net Par
Outstanding
Avg. Internal
Rating
U.S. structured finance:
Pooled corporate obligations $ 13,574 AAA
RMBS 4,967 BBB-
Financial products3 2,276 AA-
Insurance securitizations 328 AA
Consumer receivables 160 BB-
Commercial receivables 38 BBB-
Structured credit 6 BB
Other structured finance 160 A-
Total U.S. structured finance 21,509 AA
Non-U.S. structured finance:
Pooled corporate obligations 3,429 AAA
RMBS 724 A
Other structured finance 372 AAA
Total non-U.S. structured finance 4,525 AA+
Total structured finance $ 26,034 AA
Total net par outstanding $ 162,166 A
AGM1 Insured Portfolio
Net Par Outstanding as of December 31, 2014
Net Par Outstanding By Asset Type
($ in millions)

AGM’s1 Total Gross Par Outstanding:
$310.1 billion As of December 31, 2014
Tokio Marine 25%
American Overseas
Reinsurance Company Limited*
26%
Radian Asset 19%
Syncora 17%
Mitsui Sumitomo
9%
Other 4%
Externally Ceded $21.5
Retained by AGM
$162.2
Ceded to Assured Guaranty
Companies $126.5
48
Reinsurance AGM1 Has Ceded 7% of Its Gross Insured Portfolio to a Diversified
Group of Non-Affiliated Reinsurers and Other Monolines
Externally Ceded Par Outstanding:
$21.5 billion (6.9%) As of December 31, 2014
($ in billions)
* Formerly RAM Reinsurance Company Ltd.
1. Please see page 43 for a definition of this convention and the appendix for a reconciliation to the corresponding GAAP value.
2. AGC has agreed to acquire Radian Asset Assurance Inc. The transaction is expected to close in 1H-15.
2

49
AGM1 Amortization of Global
Insured Structured Finance Portfolio
$Billion
1. Please see page 43 for a definition of this convention and the appendix for a reconciliation
to the corresponding GAAP value.
2. Please see footnote 3 on page 12.
3. Please see footnote 3 on page 47.
$26.0 Billion Net Par Outstanding As of December 31, 2014
• We expect AGM’s1 legacy global structured finance insured portfolio ($26.0 billion
as of December 31, 2014 versus $127.3 billion as of September 30, 2008) to
amortize rapidly ─ 30% by year-end 2015 and 72% by year-end 2017.2
– $17.0 billion in global pooled corporate obligations expected to be reduced by
38% by year-end 2015 and by 93% by year-end 2017
– $5.0 billion in U.S. RMBS expected to be reduced by 16% by year-end 2015
and by 41% by year-end 2017
– $0.2 billion in U.S. consumer receivable obligations expected to be reduced
by 18% by year-end 2015 and by 57% by year-end 2017
– $1.6 billion in other structured finance (excluding FP) expected to be reduced
by 6% by year-end 2015 and by 23% by year-end 2017
• Former FP business not part of Assured Guaranty’s purchase; we are indemnified
against exposure to the FP business by Dexia. In addition, Assured Guaranty
also has been protected by guaranties issued by the French and Belgian
governments with respect to the GIC portion of the FP business.
– $2.3 billion in GICs expected to be reduced by 16% by year-end 2015 and by
25% by year-end 2017
$0
$5
$10
$15
$20
$25
$30
U.S. and Non-U.S. Pooled Corporates
U.S. Residential Mortgages
U.S. Consumer Receivables
Financial Products (GICs)
Other Structured Finance
U.S. and Non-U.S. Pooled Corporate
$17.0 U.S. Residential Mortgages
$5.0
U.S. Consumer Receivables
$0.2
Financial Products (GICs)
$2.3
Other Structured Finance
$1.6 3
AAA $16.5
AA $5.2
A $0.2
BBB $0.5
BIG $3.6

50
AGM1 U.S. RMBS Exposure
• AGM’s1 U.S. RMBS portfolio is amortizing on an
absolute basis and has declined as a percentage
of the portfolio
– $5.0 billion net par outstanding versus $17.1 billion at
year-end 2008, a decrease of 71%
– 3.1% of total net par outstanding versus 4.0% at year-
end 2008
– No U.S. RMBS underwritten since January 2008
• We have significantly mitigated ultimate losses
– R&W putbacks, litigation and agreements
– Wrapped bond purchases
– Terminations of below investment grade credits
By Type As of December 31, 2014
($ in billions)
$5.0 billion, 3.1% of net par outstanding
Prime First Lien $0.1
Alt-A First Lien $0.8
Closed End
Seconds $0.2
Option ARMs $0.2
HELOC $1.2
Subprime First Lien
$2.5 50%
4%
25%
16%
4%
1%
AAA $0.9
AA $0.9
A <$0.01
BBB $0.2
BIG $3.0
18%
60% 18%
4% <0.1%
By Rating
1. Please see page 43 for a definition of this convention and the appendix for a reconciliation to the
corresponding GAAP value.
2. Please see footnote 2 on page 37.
2

51
AGM1 Non-RMBS Exposure U.S. Structured Finance
• 82% of AGM’s1 non-RMBS U.S.
structured finance portfolio consists of
pooled corporate obligations
– 90% of U.S. pooled corporate exposure is of
AAA quality
• Non-RMBS U.S. structured finance credit
experience has been generally strong
given the economic stress of recent
years
$16.5 billion net par outstanding
U.S. Non-RMBS Structured Finance As of December 31, 2014
($ in billions)
$53.7
Pooled Corporate
Obligations $13.6
Other U.S. ABS $0.4
Insurance Securitizations
$0.3
Financial Products
$2.3
82% 14%
2
2%
1. Please see page 43 for a definition of this convention and the appendix for a reconciliation to the corresponding GAAP value.
2. Please see footnote 3 on page 47.
2%

52
AGM1 Global Pooled Corporate Obligations
• AGM’s1 pooled corporate exposure is
generally highly rated and well protected
– Average current credit enhancement of 27.1%
– 89% rated AAA
– AAA average rating
– 2% rated BIG
• $44 million of TruPS (bank and insurance
company only)
– Average rating of AA+
– Average current credit enhancement remains
strong at 58.2%
Pooled Corporate Obligations
By Asset Class
As of December 31, 2014
($ in billions)
$17.0 billion net par outstanding
CBOs/CLOs $8.1
Market Value CDOs of
Corporates $0.9
Synthetic Investment
Grade Pooled Corporates
$7.4
Trust Preferred <$0.1
Other $0.6
48%
6%
43%
<1% 3%
1. Please see page 43 for a definition of this convention and the appendix for a reconciliation to the corresponding GAAP value.
2. CBOs are collateralized bond obligations. CLOs are collateralized loan obligations.
2

53
AGM1 Investment Portfolio
Fair Value as of December 31, 2014
1. Please see page 43 for a definition of this convention and the appendix for a reconciliation to the corresponding GAAP value.
2. Includes fixed maturity securities, short-term investments and cash and excludes other invested assets. Also includes securities purchased or obtained as part of loss mitigation or other risk
management strategies, some of which (with a fair value of $60 million) were issued by entities that were subsequently consolidated as VIEs and which are therefore eliminated in
consolidation on the balance sheet.
3. Ratings are represented by the lower of the Moody's and S&P classifications except for securities purchased or obtained as part of loss mitigation or other risk management strategies, which
use internal ratings classifications.
4. Included in the asset-backed category are securities purchased or obtained as part of loss mitigation or other risk management strategies with a fair value of $95 million. The remaining
securities have a fair value of $72 million and an average rating of AAA.
5. Included in the mortgage-backed category are securities purchased or obtained as part of loss mitigation or other risk management strategies with a fair value of $502 million and agency-
backed securities with a fair value of $202 million. The remaining securities have a fair value of approximately $218 million and an average rating of AAA.
6. Included in the AAA category are short-term securities and cash.
7. Included in the BIG category are securities purchased or obtained as part of loss mitigation or other risk management strategies with a fair value of $642 million.
U.S. Treasuries & Government Obligations
<1%
Agency Obligations
1% Foreign
Gov't Securities
4%
States & Political
Subdivisions 56%
Corporates 11%
Mortgage-backed
18%
Asset-backed
3%
Short-term 7%
Cash <1%
Total = $5.1 billion
Investments Available for Sale and Cash2
By Category
Investments Available for Sale and Cash2,3
By Rating
U.S. Treasuries,
Gov't Obligations &
Agency Obligations
1%
AAA 18%
AA 50% A
19%
BBB <1%
BIG 12%
5
6
7
4

54
($ in millions)
AGM Consolidated1 Expected Loss and Loss
Adjustment Expense (“LAE”) to Be Paid As of December 31, 2014
1. Please see page 43 for a definition of this convention.
2. Includes the effect of changes in the Company's estimate of future recovery on representations and warranties (R&W).
Expected loss to be paid in the table above represents the PV of expected net claims payments and reimbursements. Under GAAP, however, a reserve and
corresponding loss expense is generally recognized in the period and for the amount that expected losses exceed unearned premium reserve. For AGM, unearned
premium reserve on the Acquisition Date (July 1, 2009) represented fair value and incorporated all expected losses at that date. See Notes to the financial statements in
the 2014 AGL Form 10-K for a complete discussion of the accounting policy for financial guaranty insurance and credit derivative contracts.
Rollforward of Net Expected Loss and LAE to be Paid for the Three Months Ended December 31, 2014
Financial Guaranty Insurance Contracts and
Net Expected Loss
to be Paid
(Recovered) as of
Economic Loss
Development
(Paid) Recovered
Losses
Net Expected Loss
to be Paid
(Recovered) as of
Credit Derivatives September 30, 2014 During 4Q-142 During 4Q-14 December 31, 2014
U.S. RMBS
First lien:
Alt-A first lien $ 182 $ (87) $ 142 $ 237
Option ARMs (36) (18) 35 (19)
Subprime first lien 221 9 (7) 223
Total first lien 367 (96) 170 441
Second lien:
Closed-end second lien (14) 1 11 (2)
HELOC (143) 15 108 (20)
Total second lien (157) 16 119 (22)
Total U.S. RMBS 210 (80) 289 419
Other structured finance 27 (2) (1) 24
U.S. public finance 98 47 (3) 142
Non-U.S. public finance 38 (4) — 34
Total $ 373 $ (39) $ 285 $ 619

Municipal Assurance Corp.
Portfolio Review

56
MAC Insured Portfolio (100% U.S. Public Finance)
Net Par Outstanding as of December 31, 2014
General Obligations
59%
Muni Utility Revenue
16%
Tax Backed 15%
Other 10%
$90.6 billion
Portfolio Diversification by Sector
AAA 2%
AA 34%
A 55%
BBB 9%
BIG <0.1%
Portfolio Diversification by Rating
Net Par
Outstanding
Avg. Internal
Rating
U.S. public finance:
General obligation $ 53,271 A+
Municipal utilities 14,615 A+
Tax backed 13,687 A+
Higher education 3,761 A
Transportation 3,662 A
Housing 675 AA-
Other public finance 915 A+
Total U.S. public finance $ 90,586 A+
Net Par Outstanding By Asset Type
($ in millions)
Net Par
Outstanding % of Total
California $ 14,010 15.5%
Texas 8,951 10.0%
Pennsylvania 7,265 8.0%
Illinois 5,335 5.9%
New York 5,014 5.5%
Michigan 4,447 4.9%
Florida 3,904 4.3%
New Jersey 3,461 3.8%
Ohio 3,165 3.5%
Indiana 2,572 2.8%
Other states 32,462 35.8%
Total U.S. public finance $ 90,586 100.0%
Net Par Outstanding By State
($ in millions)
1
1. A total of $79 million net par outstanding; consists of five revenue sources rated in the BB
category from the general obligation and transportation sectors.

57
MAC Investment Portfolio
Fair Value as of December 31, 2014
1. Includes fixed maturity securities, short-term investments and cash.
2. Ratings are represented by the lower of the Moody's and S&P classifications.
3. Included in the mortgage-backed category are agency-backed securities with a fair value of $22 million. The remaining securities have a fair value of $48 million and an average rating
of AAA.
4. Included in the AAA category are short-term securities and cash.
U.S. Treasuries & Government Obligations
1% Agency
Obligations 1%
States & Political
Subdivisions 83%
Corporates 6%
Mortgage-backed
5%
Asset-backed
2%
Short-term & cash 2%
Total = $1.5 billion
Investments Available for Sale and Cash1
By Category
Investments Available for Sale and Cash1,2
By Rating
U.S. Treasuries,
Gov't Obligations &
Agency Obligations
2%
AAA 14%
AA 67%
A 17%
BBB <1%
3
4

Eiffage CEVM / Foster + Partners / Jean-Pierre Lescourret
Assured Guaranty Corp.
Portfolio Review

59
• AGC’s portfolio is diversified by asset
class
– 60% U.S. public finance
– 28% U.S. structured finance
– 5% Non-U.S. public finance
– 7% Non-U.S. structured finance
• Portfolio maintains a high overall
credit rating despite downgrades in
U.S. RMBS portfolio
– Average internal rating of A 35%
4%
52%
9%
U.S. Public Finance
$27.8
U.S. Structured
Finance $12.8
Non-U.S. Public
Finance $2.4
Non-U.S. Structured
Finance $3.0
Net Par Outstanding
As of December 31, 2014
($ in billions)
$46.0 billion, A average rating
28%
5%
60%
7%
AA- average rating A+ average rating
A average rating
A- average rating
AGC Insured Portfolio Overview
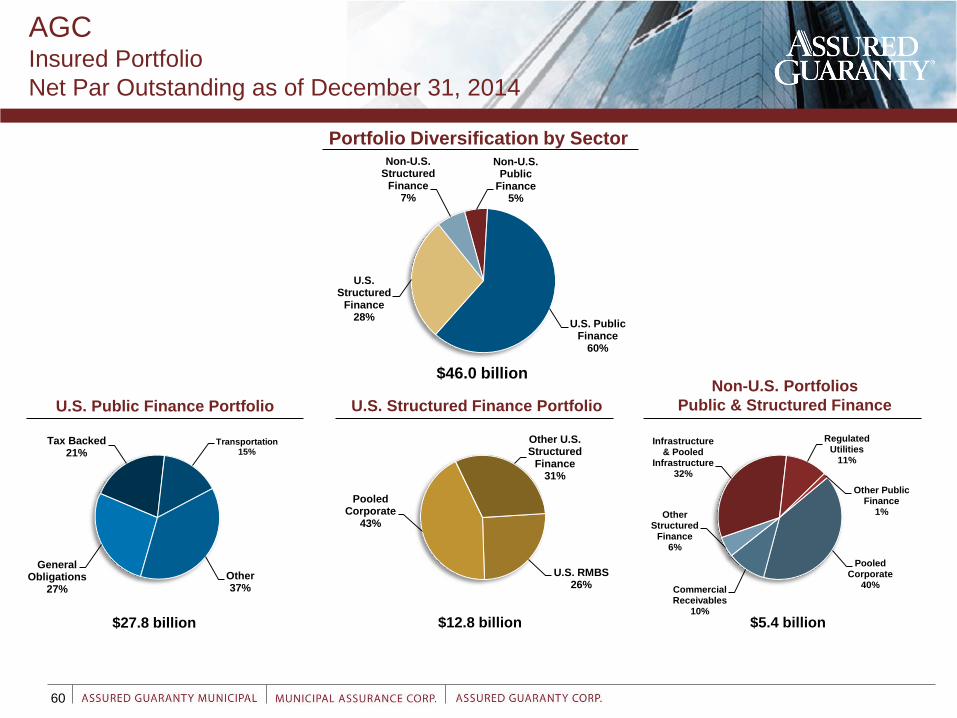
60
AGC Insured Portfolio
Net Par Outstanding as of December 31, 2014
Non-U.S. Public
Finance 5%
U.S. Public Finance
60%
U.S. Structured
Finance 28%
Non-U.S. Structured
Finance 7%
$46.0 billion
Portfolio Diversification by Sector
General Obligations
27%
Tax Backed 21%
Transportation 15%
Other 37%
$27.8 billion
U.S. Public Finance Portfolio
U.S. RMBS 26%
Pooled Corporate
43%
Other U.S. Structured
Finance 31%
$12.8 billion
U.S. Structured Finance Portfolio
Pooled Corporate
40% Commercial Receivables
10%
Other Structured
Finance 6%
Infrastructure & Pooled
Infrastructure 32%
Regulated Utilities
11%
Other Public Finance
1%
$5.4 billion
Non-U.S. Portfolios
Public & Structured Finance

61
AGC Insured Portfolio Ratings
Net Par Outstanding as of December 31, 2014
AAA 15%
AA 16%
A 40%
BBB 17%
BIG 12%
$46.0 billion
Portfolio Diversification by Rating
AAA <1%
AA 14%
A 60%
BBB 19%
BIG 7%
$27.8 billion
U.S. Public Finance Portfolio U.S. Structured Finance Portfolio
Non-U.S. Portfolios
Public & Structured Finance
AAA 40%
AA 15%
A 14%
BBB 6%
BIG 25%
$12.8 billion
AAA 29%
AA 28%
A 6%
BBB 32%
BIG 5%
$5.4 billion

62
Net Par
Outstanding
Avg. Internal
Rating
U.S. public finance:
General obligation $ 7,458 A
Tax backed 5,734 A-
Transportation 4,292 A-
Municipal utilities 3,362 A-
Healthcare 3,151 A
Higher education 1,580 A
Infrastructure finance 990 BBB+
Investor-owned utilities 393 A-
Housing 80 A-
Other public finance 753 A
Total U.S. public finance 27,793 A-
Non-U.S. public finance:
Pooled infrastructure 1,137 AA
Infrastructure finance 605 BBB+
Regulated utilities 590 A-
Other public finance 67 A+
Total non-U.S. public finance 2,399 A+
Total public finance $ 30,192 A
Net Par
Outstanding
Avg. Internal
Rating
U.S. structured finance:
Pooled corporate obligations $ 5,519 AA-
RMBS 3,249 BBB
CMBS and other commercial real estate related exposures 1,551 AAA
Consumer receivables 1,110 A+
Insurance securitization 861 A
Commercial receivables 322 A-
Structured credit 54 BB
Other structured finance 100 A+
Total U.S. structured finance 12,766 A
Non-U.S. structured finance:
Pooled corporate obligations 2,185 AA+
Commercial receivables 550 BBB
RMBS 37 AAA
Other structured finance 262 BBB+
Total non-U.S. structured finance 3,034 AA-
Total structured finance $ 15,800 A+
Total net par outstanding $ 45,992 A
AGC Insured Portfolio
Net Par Outstanding as of December 31, 2014
Net Par Outstanding By Asset Type
($ in millions)
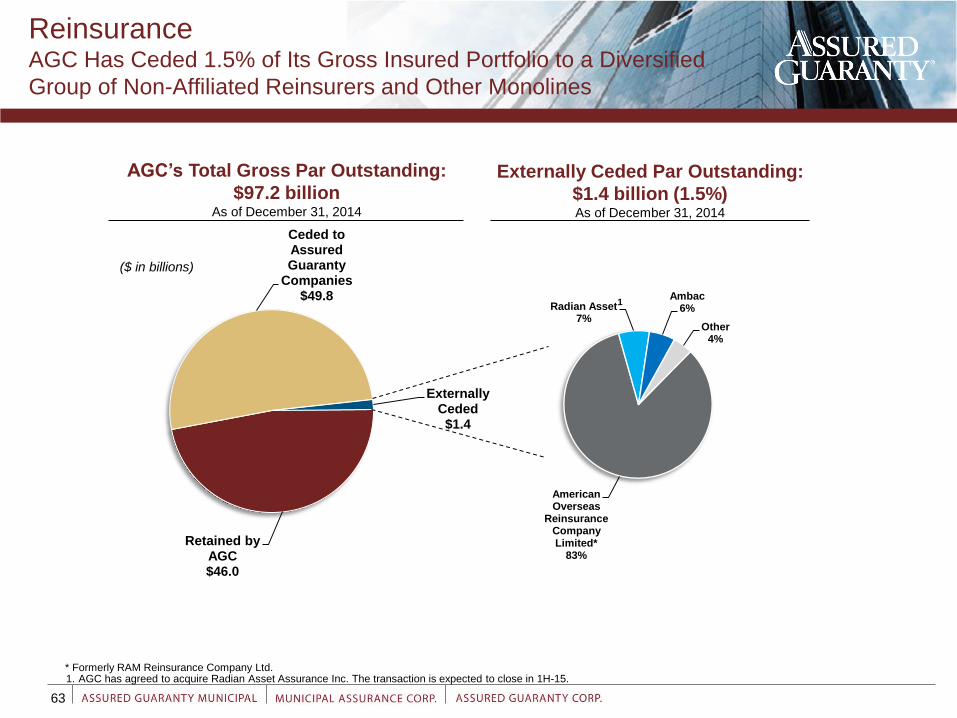
Retained by AGC $46.0
Ceded to Assured Guaranty
Companies $49.8
Externally Ceded $1.4
American Overseas
Reinsurance Company Limited*
83%
Radian Asset 7%
Ambac 6%
Other 4%
63
Reinsurance AGC Has Ceded 1.5% of Its Gross Insured Portfolio to a Diversified
Group of Non-Affiliated Reinsurers and Other Monolines
AGC’s Total Gross Par Outstanding:
$97.2 billion As of December 31, 2014
* Formerly RAM Reinsurance Company Ltd.
Externally Ceded Par Outstanding:
$1.4 billion (1.5%) As of December 31, 2014
(1)
($ in billions)
1. AGC has agreed to acquire Radian Asset Assurance Inc. The transaction is expected to close in 1H-15.
1

64
AGC U.S. RMBS Exposure
By Type As of December 31, 2014
($ in billions)
$3.2 billion, 7.1% of net par outstanding
Prime First Lien $0.3
Alt-A First Lien $1.3
Closed End
Seconds $0.1
Option ARMs $0.2
HELOC $0.2
Subprime First Lien
$1.2
6%
7%
39% 9%
2%
AAA $0.6
AA $0.6
A $0.1
BBB $0.1
BIG $1.9
18%
57%
19%
3%
By Rating
37%
• AGC’s U.S. RMBS portfolio is amortizing on
an absolute basis and has declined as a
percentage of the portfolio
– $3.2 billion versus $13.4 billion at year-end 2007,
a decrease of 76%
– 7.1% of total net par outstanding versus 14.3% at
year-end 2007
• We have significantly mitigated ultimate
losses
– R&W putbacks, litigation and agreements
– Wrapped bond purchases
– Terminations
3% 1
1. Please see footnote 2 on page 37.

65
AGC Non-RMBS Exposure U.S. Structured Finance
• AGC’s non-RMBS U.S. structured finance
exposures consist principally of:
– Pooled corporate obligations
– CMBS
– Consumer receivables
• Non-RMBS U.S. structured finance credit
experience has been generally strong given
the economic stress of recent years
– 47% rated AAA
– 14% rated BIG
U.S. Non-RMBS Structured Finance As of December 31, 2014
($ in billions)
Pooled corporate
obligations $5.5
Commercial mortgage-
backed securities
$1.6
Consumer receivables
$1.1
Insurance securitizations
$0.9
Commercial receivables
$0.3
Structured credit $0.1
Other structured
finance $0.1
58%
$9.5 billion net par outstanding
16%
12%
1%
1%
9%
3%
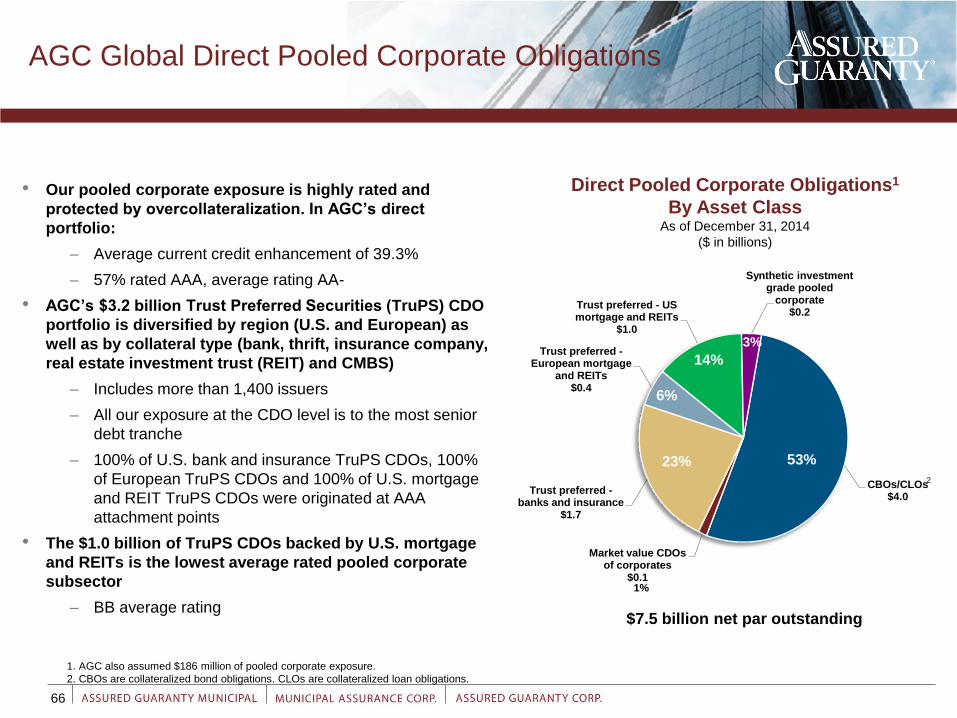
CBOs/CLOs $4.0
Market value CDOs of corporates
$0.1
Trust preferred - banks and insurance
$1.7
Trust preferred - European mortgage
and REITs $0.4
Trust preferred - US mortgage and REITs
$1.0
Synthetic investment grade pooled
corporate $0.2
66
AGC Global Direct Pooled Corporate Obligations
• Our pooled corporate exposure is highly rated and
protected by overcollateralization. In AGC’s direct
portfolio:
– Average current credit enhancement of 39.3%
– 57% rated AAA, average rating AA-
• AGC’s $3.2 billion Trust Preferred Securities (TruPS) CDO
portfolio is diversified by region (U.S. and European) as
well as by collateral type (bank, thrift, insurance company,
real estate investment trust (REIT) and CMBS)
– Includes more than 1,400 issuers
– All our exposure at the CDO level is to the most senior
debt tranche
– 100% of U.S. bank and insurance TruPS CDOs, 100%
of European TruPS CDOs and 100% of U.S. mortgage
and REIT TruPS CDOs were originated at AAA
attachment points
• The $1.0 billion of TruPS CDOs backed by U.S. mortgage
and REITs is the lowest average rated pooled corporate
subsector
– BB average rating
Direct Pooled Corporate Obligations1
By Asset Class
As of December 31, 2014
($ in billions)
1. AGC also assumed $186 million of pooled corporate exposure.
2. CBOs are collateralized bond obligations. CLOs are collateralized loan obligations.
$7.5 billion net par outstanding
53% 23%
6%
14%
2
3%
1%

Traditional CMBS $1.39
CDOs of commercial real estate
$0.16
67
AGC Direct U.S. CMBS Exposure
• AGC’s CMBS-related exposures were underwritten at high
attachment points
– All deals except one were written with triple-A ratings at
inception
– One deal was written with a single-A rating at inception
– AAA current average rating
• $1.4 billion traditional CMBS portfolio
– Most of the exposures were written as “basket trades”; some
have additional credit enhancement from a first-loss deductible
– 100% rated AAA as of December 31, 2014
– Average current credit enhancement stands at 41.4% vs. initial
credit enhancement of 32.9%
• $160 million commercial real estate CDO portfolio
– Two transactions
– Average current credit enhancement stands at 57.9% vs. initial
credit enhancement of 53.4%
• Beginning in the middle of 2006, AGC concluded that
underwriting standards applied to newly originated
commercial property loans were deteriorating and adjusted
underwriting standards accordingly
$1.55 billion net par outstanding
Direct U.S. Commercial Real Estate Exposure1
By Sector
As of December 31, 2014
($ in billions)
90%
10%
1. AGC also assumed $5 million of U.S. CMBS exposure.

68
AGC Direct U.S. Consumer Receivables
Direct U.S. Consumer Receivables by Type1
As of December 31, 2014
($ in billions)
$1.0 billion net par outstanding
$0.0
$0.4
$1.0
$1.2
• Despite the economic stress of recent
years, AGC’s consumer receivable portfolio
is entirely investment grade:
– Average rating of A+
– For all transactions, current credit enhancement is
higher than initial credit enhancement
– 33% rated AAA
Student Loans $1.0
Auto <$0.1
99%
1. AGC also assumed $66 million of U.S. consumer receivable exposure.
1%

69
AGC Investment Portfolio
Fair Value as of December 31, 2014
1. Includes fixed maturity securities, short-term investments and cash and excludes other invested assets. Also includes securities purchased or obtained as part of loss mitigation or other
risk management strategies, some of which (with a fair value of $133 million) were issued by entities that were subsequently consolidated as VIEs and which are therefore eliminated in
consolidation on the balance sheet.
2. Ratings are represented by the lower of the Moody's and S&P classifications except for securities purchased or obtained as part of loss mitigation or other risk management strategies,
which use internal ratings classifications.
3. Included in the asset-backed category are securities purchased or obtained as part of loss mitigation or other risk management strategies with a fair value of $133 million. The remaining
securities have a fair value of <$1 million and an average rating of BBB+.
4. Included in the mortgage-backed category are securities purchased or obtained as part of loss mitigation or other risk management strategies with a fair value of $159 million and agency-
backed securities with a fair value of $27 million. The remaining securities have a fair value of $18 million and an average rating of AAA.
5. Included in the states & political subdivisions category are securities purchased or obtained as part of loss mitigation or other risk management strategies with a fair value of $30 million.
6. Included in the AAA category are short-term securities and cash.
7. Included in the BIG category are securities purchased or obtained as part of loss mitigation or other risk management strategies with a fair value of $225 million.
U.S. Treasuries & Government Obligations
11%
Agency Obligations
3%
Foreign Gov't
Securities 4%
States & Political
Subdivisions 59%
Corporates 3%
Mortgage-backed
9%
Asset-backed
6%
Short-term 4%
Cash 1%
Total = $2.3 billion
Investments Available for Sale and Cash1
By Category
Investments Available for Sale and Cash1,2
By Rating
U.S. Treasuries,
Gov't Obligations &
Agency Obligations
14%
AAA 15%
AA 47%
A 13%
BBB 1%
BIG 10%
4 6
7
5
3

70
AGC Expected Loss and LAE to Be Paid As of December 31, 2014
($ in millions)
1. Includes the effect of changes in the Company's estimate of future recovery on R&W.
Expected loss to be paid in the table above represents the PV of expected net claims payments and reimbursements. Under GAAP, however, a reserve and corresponding
loss expense is generally recognized in the period and for the amount that expected losses exceed unearned premium reserve. See Notes to the financial statements in the
2014 AGL Form 10-K for a complete discussion of the accounting policy for financial guaranty insurance and credit derivative contracts.
Rollforward of Net Expected Loss and LAE to be Paid for the Three Months Ended December 31, 2014
Financial Guaranty Insurance Contracts and
Net Expected Loss
to be Paid
(Recovered) as of
Economic Loss
Development
(Paid) Recovered
Losses
Net Expected Loss
to be Paid
(Recovered) as of
Credit Derivatives September 30, 2014 During 4Q-141 During 4Q-14 December 31, 2014
U.S. RMBS
First lien:
Prime first lien $ 8 $ (5) $ — $ 3
Alt-A first lien 55 (41) 44 58
Option ARMs 4 (2) (1) 1
Subprime first lien 65 (1) (3) 61
Total first lien 132 (49) 40 123
Second lien:
Closed-end second lien 5 — 1 6
HELOC (5) 2 1 (2)
Total second lien — 2 2 4
Total U.S. RMBS 132 (47) 42 127
TruPS 20 (2) — 18
Other structured finance (52) (1) 3 (50)
U.S. public finance 41 6 2 49
Non-U.S. public finance 3 (1) — 2
Total $ 144 $ (45) $ 47 $ 146

Appendix

72
Appendix Explanation of Non-GAAP Financial Measures
Endnotes related to non-GAAP financial measures discussed in the presentation:
The Company references financial measures that are not in accordance with GAAP. Management and the board of directors utilize non-GAAP financial measures in evaluating the
Company’s financial performance and as a basis for determining senior management incentive compensation. By providing these non-GAAP financial measures, investors, analysts
and financial news reporters have access to the same information that management reviews internally. In addition, Assured Guaranty’s presentation of non-GAAP financial measures
is consistent with how analysts calculate their estimates of Assured Guaranty’s financial results in their research reports on Assured Guaranty and with how investors, analysts and the
financial news media evaluate Assured Guaranty’s financial results.
The following paragraphs define each non-GAAP financial measure and describe why it is useful. A reconciliation of the non-GAAP financial measure and the most directly comparable
GAAP financial measure, if available, is presented within this presentation. Non-GAAP financial measures should not be viewed as substitutes for their most directly comparable GAAP
measures.
Operating Income: Management believes that operating income is a useful measure because it clarifies the understanding of the underwriting results of the Company’s financial
guaranty business, and also includes financing costs and net investment income, and enables investors and analysts to evaluate the Company’s financial results as compared with the
consensus analyst estimates distributed publicly by financial databases. Operating income is defined as net income (loss) attributable to Assured Guaranty Ltd., as reported under
GAAP, adjusted for the following:
1. Elimination of the after-tax realized gains (losses) on the Company’s investments, except for gains and losses on securities classified as trading. The timing of realized gains and
losses, which depends largely on market credit cycles, can vary considerably across periods. The timing of sales is largely subject to the Company’s discretion and influenced by
market opportunities, as well as the Company’s tax and capital profile. Trends in the underlying profitability of the Company’s business can be more clearly identified without the
fluctuating effects of these transactions.
2. Elimination of the after-tax non-credit-impairment unrealized fair value gains (losses) on credit derivatives, which is the amount in excess of the present value of the expected
estimated economic credit losses and non-economic payments. Such fair value adjustments are heavily affected by, and in part fluctuate with, changes in market interest rates,
credit spreads and other market factors and are not expected to result in an economic gain or loss. Additionally, such adjustments present all financial guaranty contracts on a
more consistent basis of accounting, whether or not they are subject to derivative accounting rules.
3. Elimination of the after-tax fair value gains (losses) on the Company’s committed capital securities. Such amounts are heavily affected by, and in part fluctuate with, changes in
market interest rates, credit spreads and other market factors and are not expected to result in an economic gain or loss.
4. Elimination of the after-tax foreign exchange gains (losses) on remeasurement of net premium receivables and loss and LAE reserves. Long-dated receivables constitute a
significant portion of the net premium receivable balance and represent the present value of future contractual or expected collections. Therefore, the current period’s foreign
exchange remeasurement gains (losses) are not necessarily indicative of the total foreign exchange gains (losses) that the Company will ultimately recognize.
5. Elimination of the effects of consolidating FG VIEs in order to present all financial guaranty contracts on a more consistent basis of accounting, whether or not GAAP requires
consolidation. GAAP requires the Company to consolidate certain VIEs that have issued debt obligations insured by the Company even though the Company does not own such
VIEs.

73
Appendix Explanation of Non-GAAP Financial Measures (Continued)
Operating Shareholders’ Equity: Management believes that operating shareholders’ equity is a useful measure because it presents the equity of Assured Guaranty Ltd. with all
financial guaranty contracts accounted for on a more consistent basis and excludes fair value adjustments that are not expected to result in economic loss. Many investors, analysts
and financial news reporters use operating shareholders’ equity as the principal financial measure for valuing Assured Guaranty Ltd.’s current share price or projected share price and
also as the basis of their decision to recommend, buy or sell Assured Guaranty Ltd.’s common shares. Many of the Company’s fixed income investors also use operating shareholders’
equity to evaluate the Company’s capital adequacy. Operating shareholders’ equity is the basis of the calculation of adjusted book value (see below). Operating shareholders’ equity is
defined as shareholders’ equity attributable to Assured Guaranty Ltd., as reported under GAAP, adjusted for the following:
1. Elimination of the effects of consolidating FG VIEs in order to present all financial guaranty contracts on a more consistent basis of accounting, whether or not GAAP requires
consolidation. GAAP requires the Company to consolidate certain VIEs that have issued debt obligations insured by the Company even though the Company does not own such
VIEs.
2. Elimination of the after-tax non-credit-impairment unrealized fair value gains (losses) on credit derivatives, which is the amount in excess of the present value of the expected
estimated economic credit losses and non-economic payments. Such fair value adjustments are heavily affected by, and in part fluctuate with, changes in market interest rates,
credit spreads and other market factors and are not expected to result in an economic gain or loss.
3. Elimination of the after-tax fair value gains (losses) on the Company’s committed capital securities. Such amounts are heavily affected by, and in part fluctuate with, changes in
market interest rates, credit spreads and other market factors and are not expected to result in an economic gain or loss.
4. Elimination of the after-tax unrealized gains (losses) on the Company’s investments that are recorded as a component of accumulated other comprehensive income (AOCI)
(excluding foreign exchange remeasurement). The AOCI component of the fair value adjustment on the investment portfolio is not deemed economic because the Company
generally holds these investments to maturity and therefore should not recognize an economic gain or loss.
Operating return on equity (‘‘Operating ROE’’): Operating ROE represents operating income for a specified period divided by the average of operating shareholders’ equity at the
beginning and the end of that period. Management believes that operating ROE is a useful measure to evaluate the Company’s return on invested capital. Many investors, analysts and
members of the financial news media use operating ROE to evaluate Assured Guaranty Ltd.’s share price and as the basis of their decision to recommend, buy or sell the Assured
Guaranty Ltd. common shares. Quarterly and year-to-date operating ROE are calculated on an annualized basis.

74
Appendix Explanation of Non-GAAP Financial Measures (Continued)
Adjusted Book Value: Management believes that adjusted book value is a useful measure because it enables an evaluation of the net present value of the Company’s in-force
premiums and revenues in addition to operating shareholders’ equity. The premiums and revenues included in adjusted book value will be earned in future periods, but actual earnings
may differ materially from the estimated amounts used in determining current adjusted book value due to changes in foreign exchange rates, prepayment speeds, terminations, credit
defaults and other factors. Many investors, analysts and financial news reporters use adjusted book value to evaluate Assured Guaranty Ltd.’s share price and as the basis of their
decision to recommend, buy or sell the Assured Guaranty Ltd. common shares. Adjusted book value is operating shareholders’ equity, as defined above, further adjusted for the
following:
1. Elimination of after-tax deferred acquisition costs, net. These amounts represent net deferred expenses that have already been paid or accrued and will be expensed in future
accounting periods.
2. Addition of the after-tax net present value of estimated net future credit derivative revenue. See below.
3. Addition of the after-tax value of the unearned premium reserve on financial guaranty contracts in excess of expected loss to be expensed, net of reinsurance. This amount
represents the expected future net earned premiums, net of expected losses to be expensed, which are not reflected in GAAP equity.
Net present value of estimated net future credit derivative revenue: Management believes that this amount is a useful measure because it enables an evaluation of the value of
future estimated credit derivative revenue. There is no corresponding GAAP financial measure. This amount represents the present value of estimated future revenue from the
Company’s credit derivative in-force book of business, net of reinsurance, ceding commissions and premium taxes for contracts without expected economic losses, and is discounted
at 6%. Estimated net future credit derivative revenue may change from period to period due to changes in foreign exchange rates, prepayment speeds, terminations, credit defaults or
other factors that affect par outstanding or the ultimate maturity of an obligation.
PVP or present value of new business production: Management believes that PVP is a useful measure because it enables the evaluation of the value of new business production
for Assured Guaranty by taking into account the value of estimated future installment premiums on all new contracts underwritten in a reporting period as well as premium supplements
and additional installment premium on existing contracts as to which the issuer has the right to call the insured obligation but has not exercised such right, whether in insurance or
credit derivative contract form, which GAAP gross premiums written and the net credit derivative premiums received and receivable portion of net realized gains and other settlements
on credit derivatives (Credit Derivative Revenues) do not adequately measure. PVP in respect of financial guaranty contracts written in a specified period is defined as gross upfront
and installment premiums received and the present value of gross estimated future installment premiums, in each case, discounted at 6%. For purposes of the PVP calculation,
management discounts estimated future installment premiums on insurance contracts at 6%, while under GAAP, these amounts are discounted at a risk-free rate. Additionally, under
GAAP, management records future installment premiums on financial guaranty insurance contracts covering non-homogeneous pools of assets based on the contractual term of the
transaction, whereas for PVP purposes, management records an estimate of the future installment premiums the Company expects to receive, which may be based upon a shorter
period of time than the contractual term of the transaction. Actual future net earned or written premiums and Credit Derivative Revenues may differ from PVP due to factors including,
but not limited to, changes in foreign exchange rates, prepayment speeds, terminations, credit defaults, or other factors that affect par outstanding or the ultimate maturity of an
obligation.

($ in millions)
75
Three Months Ended
December 31,
2014 2013 New business production analysis:
PVP:
Public finance - U.S. $ 38 $ 61
Public finance - non-U.S. — 5
Structured finance - U.S. 16 1
Structured finance - non-U.S. — —
Total PVP $ 54 $ 67
Reconciliation of PVP to gross written premiums (GWP):
PVP of financial guaranty insurance $ 54 $ 67
Less: financial guaranty installment premium PVP 17 7
Total: financial guaranty upfront GWP 37 60
Plus: financial guaranty installment GWP and other GAAP adjustments1 (27 ) (2 )
Total GWP $ 10 $ 58
1. Includes present value of new business on installment policies plus GWP adjustment on existing installment policies due to changes in assumptions, any cancellations of
assumed reinsurance contracts and other GAAP adjustments.
Please refer to the preceding pages of the appendix for an explanation of the non-GAAP financial measures.
Appendix AGL Consolidated
Reconciliation of PVP to GWP
Financial guaranty gross par written:
Public finance - U.S. $ 4,067 $ 2,743
Public finance - non-U.S. — 122
Structured finance - U.S. 400 —
Structured finance - non-U.S. — —
Total $ 4,467 $ 2,865
Year Ended
December 31,
2014 2013
$ 128 $ 116
7 18
24 7
9 —
$ 168 $ 141
$ 168 $ 141
42 26
126 115
(22 ) 8
$ 104 $ 123
$ 12,275 $ 8,671
128 392
418 287
350 —
$ 13,171 $ 9,350

76
Appendix AGL Consolidated
Reconciliation of GAAP Book Value to Adjusted Book Value
Please refer to the preceding pages of the appendix for an explanation of the non-GAAP financial measures.
($ in millions, except per share amounts)
As of: December 31, 2014 December 31, 2013
Total Per Share Total Per Share
Reconciliation of shareholders' equity to adjusted book value:
Shareholders' equity $ 5,758 $ 36.37 $ 5,115 $ 28.07 Less after-tax adjustments:
Effect of consolidating FG VIEs (44 ) (0.28 ) (172 ) (0.95 ) Non-credit impairment unrealized fair value gains (losses) on credit derivatives (527 ) (3.33 ) (1,052 ) (5.77 )
Fair value gains (losses) on committed capital securities 23 0.14 30 0.16
Unrealized gain (loss) on investment portfolio excluding foreign exchange effect 373 2.36 145 0.80
Operating shareholders' equity $ 5,933 37.48 $ 6,164 33.83 After-tax adjustments:
Less: Deferred acquisition costs 156 0.99 161 0.88
Plus: Net present value of estimated net future credit derivative revenue 109 0.69 146 0.80 Plus: Net unearned premium reserve on financial guaranty contracts in excess of expected loss to be expensed 2,609 16.48 2,884 15.83
Adjusted book value $ 8,495 $ 53.66 $ 9,033 $ 49.58

77
Appendix Reconciliation of AGM1 Net Par Outstanding to
AGM Consolidated1 Net Par Outstanding
December 31, 2014
($ in millions)
AGM1 MAC
AGM
Consolidated1
U.S. public finance:
General obligation $ 41,717 $ 53,271 $ 94,988
Tax backed 25,325 13,687 39,012
Municipal utilities 21,808 14,615 36,423
Transportation 12,442 3,662 16,104
Healthcare 7,356 - 7,356
Higher education 3,483 3,761 7,244
Housing 1,493 675 2,168
Infrastructure finance 1,322 - 1,322
Other public finance 894 915 1,809
Total U.S. public finance 115,840 90,586 206,426
Non-U.S. public finance:
Infrastructure finance 9,448 - 9,448
Regulated utilities 6,291 - 6,291
Other public finance 4,553 - 4,553
Total non-U.S. public finance 20,292 - 20,292
Total public finance $ 136,132 $ 90,586 $ 226,718
U.S. structured finance:
Pooled corporate obligations $ 13,574 $ - 13,574
RMBS 4,967 - 4,967
Financial products 2 2,276 - 2,276
Insurance securitizations 328 - 328
Consumer receivables 160 - 160
Commercial receivables 38 - 38
Structured credit 6 6
Other structured finance 160 - 160
Total U.S. structured finance 21,509 - 21,509
Non-U.S. structured finance:
Pooled corporate obligations 3,429 - 3,429
RMBS 724 - 724
Other structured finance 372 - 372
Total non-U.S. structured finance 4,525 - 4,525
Total structured finance $ 26,034 $ - $ 26,034
Total $ 162,166 $ 90,586 $ 252,752
Distribution by Ratings of U.S. Public Finance Portfolio
1. Please see page 43 for a definition of this convention.
2. Please see footnote 3 on page 47.
Note: all net par amounts exclude bonds purchased for loss mitigation purposes.
Net Par Outstanding by Asset Type
December 31, 2014
($ in millions)
AGM1 MAC
AGM
Consolidated1
Ratings:
AAA $ 1,133 $ 2,121 $ 3,254
AA 31,814 30,361 62,175
A 62,094 50,025 112,119
BBB 17,604 8,000 25,604
BIG 3,195 79 3,274
Net par outstanding $ 115,840 $ 90,586 $ 206,426

78
Appendix Reconciliation of AGM1 Investment Portfolio and Cash to
AGM Consolidated1 Investment Portfolio and Cash
December 31, 2014
($ in millions)
AGM1 MAC
AGM
Consolidated1
Investment portfolio, available-for-sale
Fixed-maturity securities:
Obligations of states and political subdivisions $ 2,381 $ 1,074 $ 3,455
Insured obligations of state and political subdivisions 529 205 734
U.S. Treasury securities and obligations of U.S. government agencies 16 18 34
Agency obligations 26 9 35
Corporate securities 546 97 643
Mortgage-backed securities (MBS):
Residential MBS (RMBS) 704 22 726
Commercial MBS (CMBS) 218 48 266
Asset-backed securities 167 26 193
Foreign government securities 191 - 191
Total fixed-maturity securities 4,778 1,499 6,277
Short-term investments and cash 366 29 395
Total $ 5,144 $ 1,528 $ 6,672
Less: FG VIEs 60 - 60
Total $ 5,084 $ 1,528 $ 6,612
December 31, 2014
($ in millions)
AGM1 MAC
AGM
Consolidated1
Ratings:
U.S. Treasury securities and obligations of U.S. government agencies $ 16 $ 18 $ 34
Agency obligations 26 9 35
AAA/Aaa 575 195 770
AA/Aa 2,548 1,019 3,567
A/A 954 256 1,210
BBB 17 2 19
Below investment grade (BIG) 642 - 642
Total fixed-maturity securities, available-for-sale 4,778 1,499 6,277
Less: FG VIEs 65 - 65
Total fixed-maturity securities, available-for-sale $ 4,713 $ 1,499 $ 6,212
1. Please see page 43 for a definition of this convention.
Fair Value
Fair Value
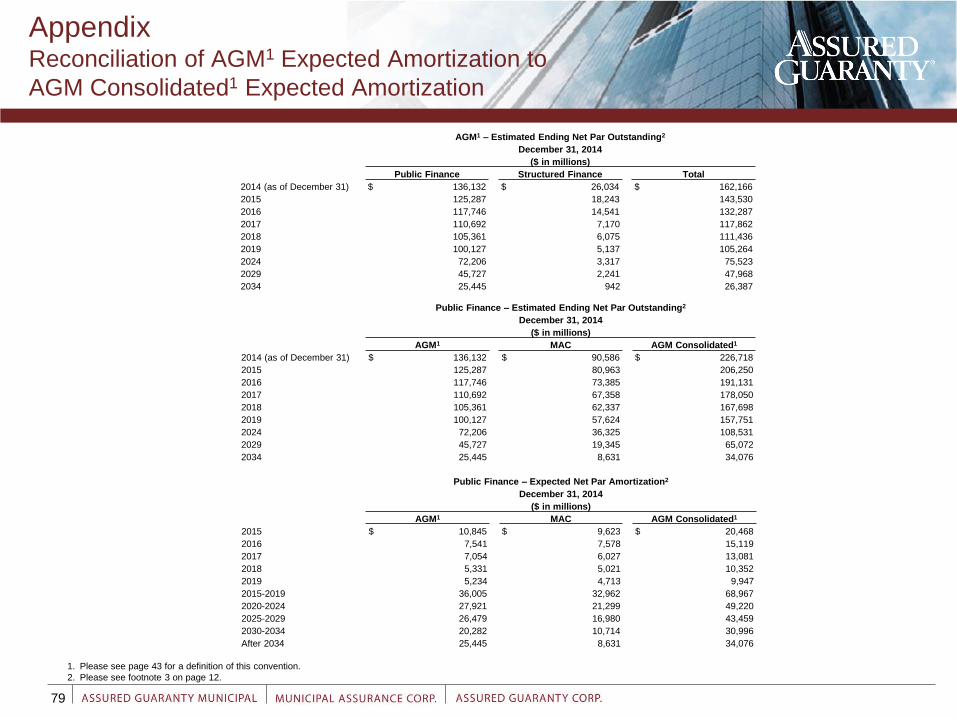
79
Appendix Reconciliation of AGM1 Expected Amortization to
AGM Consolidated1 Expected Amortization
1. Please see page 43 for a definition of this convention.
2. Please see footnote 3 on page 12.
Public Finance – Estimated Ending Net Par Outstanding2
December 31, 2014
($ in millions)
AGM1 MAC AGM Consolidated1
2014 (as of December 31) $ 136,132 $ 90,586 $ 226,718
2015 125,287 80,963 206,250
2016 117,746 73,385 191,131
2017 110,692 67,358 178,050
2018 105,361 62,337 167,698
2019 100,127 57,624 157,751
2024 72,206 36,325 108,531
2029 45,727 19,345 65,072
2034 25,445 8,631 34,076
Public Finance – Expected Net Par Amortization2
December 31, 2014
($ in millions)
AGM1 MAC AGM Consolidated1
2015 $ 10,845 $ 9,623 $ 20,468
2016 7,541 7,578 15,119
2017 7,054 6,027 13,081
2018 5,331 5,021 10,352
2019 5,234 4,713 9,947
2015-2019 36,005 32,962 68,967
2020-2024 27,921 21,299 49,220
2025-2029 26,479 16,980 43,459
2030-2034 20,282 10,714 30,996
After 2034 25,445 8,631 34,076
AGM1 – Estimated Ending Net Par Outstanding2
December 31, 2014
($ in millions)
Public Finance Structured Finance Total
2014 (as of December 31) $ 136,132 $ 26,034 $ 162,166
2015 125,287 18,243 143,530
2016 117,746 14,541 132,287
2017 110,692 7,170 117,862
2018 105,361 6,075 111,436
2019 100,127 5,137 105,264
2024 72,206 3,317 75,523
2029 45,727 2,241 47,968
2034 25,445 942 26,387
80
Fixed Income Investor Presentation
December 31, 2014
Assured Guaranty Contacts:
Robert Tucker
Managing Director
Investor Relations and Corporate Communications
Direct: 212.339.0861
Michael Walker
Managing Director
Fixed Income Investor Relations
Direct: 212.261.5575
Glenn Alterman
Associate
Investor Relations
Direct: 212.339.0854