Whole-brain opto-fMRI map of mouse VTA dopaminergic ...
10
ARTICLE OPEN Whole-brain opto-fMRI map of mouse VTA dopaminergic activation reflects structural projections with small but significant deviations Horea-Ioan Ioanas 1 ✉ , Bechara John Saab 2 and Markus Rudin 1,3 © The Author(s) 2022 Ascending dopaminergic projections from neurons located in the Ventral Tegmental Area (VTA) are key to the etiology, dysfunction, and control of motivation, learning, and addiction. Due to the evolutionary conservation of this nucleus and the extensive use of mice as disease models, establishing an assay for VTA dopaminergic signaling in the mouse brain is crucial for the translational investigation of motivational control as well as of neuronal function phenotypes for diseases and interventions. In this article we use optogenetic stimulation directed at VTA dopaminergic neurons in combination with functional Magnetic Resonance Imaging (fMRI), a method widely used in human deep brain imaging. We present a comprehensive assay producing the first whole-brain opto-fMRI map of dopaminergic activation in the mouse, and show that VTA dopaminergic system function is consistent with its structural VTA projections, diverging only in a few key aspects. While the activation map predominantly highlights target areas according to their relative projection densities (e.g., strong activation of the nucleus accumbens and low activation of the hippocampus), it also includes areas for which a structural connection is not well established (such as the dorsomedial striatum). We further detail the variability of the assay with regard to multiple experimental parameters, including stimulation protocol and implant position, and provide evidence-based recommendations for assay reuse, publishing both reference results and a reference analysis workflow implementation. Translational Psychiatry (2022)12:60 ; https://doi.org/10.1038/s41398-022-01812-5 BACKGROUND The dopaminergic system consists of a strongly localized, and widely projecting set of neurons with cell bodies clustered in the midbrain into two lateralized nucleus pairs, the Substantia Nigra pars compacta (SNc) and the Ventral Tegmental Area (VTA, Fig. 1a). On account of the small number of dopaminergic neurons (≈300,000 in humans [1], ≈10,000 in rats [2], and ≈4000 in mice [3]), tractography commonly fails to resolve the degree centrality of this neurotransmitter system, precluding it from being a prominent node in such graph representations of the brain. However, it is precisely the small number of widely branching and similar neurons, which makes the dopaminergic system a credible candidate for truly node-like function in coordinating brain activity. As is expected given such salient features, the system is widely implicated in neuropsychiatric phenomena (including addiction [4, 5], attentional control [6], motivation [7], creativity [8], personality [9], neurodegeneration [10], and schizophrenia [11]), and is a common target for pharmacological interventions. Lastly, due to high evolutionary conservation [12], the dopami- nergic system is also an excellent candidate for translational study. Imaging a neurotransmitter system comprised of a small number of cells based only on spontaneous activity is highly unreliable due to an intrinsically low signal to noise ratio (SNR). This limitation can, however, be overcome by introducing exogenous stimulation. While the colocalization of widely projecting dopaminergic cell bodies into nuclei renders tempo- rally precise and population-wide targeting feasible, dopaminergic nuclei also contain notable sub-populations of non-dopaminergic cells, which may confound an intended dopaminergic read-out [13]. In order to specifically target dopaminergic cells, they need to be sensitized to an otherwise inert stimulus in a transcription- dependent manner. This can be achieved via optogenetics, which is based on light-stimulation of cells expressing light-sensitive proteins such as channelrhodopsin [14]. Cell-type selectivity can be achieved by Cre-conditional channelrhodopsin vector delivery [15] to transgenic animals expressing Cre-recombinase under a dopaminergic promoter. Following protein expression, stimuli can be delivered via an implanted optic fiber. The combination of this stimulation method with fMRI is commonly referred to as opto- fMRI and can provide information on functional connectivity between a primary activation site and associated projection areas [16, 17]. Key questions surrounding VTA function in preclinical models are, firstly, method feasibility in animal models more accessible to transgenic techniques, such as the mouse; and secondly, a mapping of the efferent spectrum for dopaminergic VTA output. In particular, in the study of the Rat VTA, it has both been suggested that the efferent dopaminergic spectrum encompasses Received: 16 March 2021 Revised: 16 October 2021 Accepted: 12 January 2022 1 Institute for Biomedical Engineering, ETH and University of Zurich, Zurich, Switzerland. 2 Preclinical Laboratory for Translational Research into Affective Disorders, DPPP, Psychiatric Hospital, University of Zurich, Zurich, Switzerland. 3 The LOOP Zurich, Zurich, Switzerland. ✉ email: [email protected] www.nature.com/tp Translational Psychiatry 1234567890();,:
-
Upload
khangminh22 -
Category
Documents
-
view
0 -
download
0
Transcript of Whole-brain opto-fMRI map of mouse VTA dopaminergic ...

ARTICLE OPEN
Whole-brain opto-fMRI map of mouse VTA dopaminergicactivation reflects structural projections with small butsignificant deviationsHorea-Ioan Ioanas 1✉, Bechara John Saab 2 and Markus Rudin1,3
© The Author(s) 2022
Ascending dopaminergic projections from neurons located in the Ventral Tegmental Area (VTA) are key to the etiology, dysfunction,and control of motivation, learning, and addiction. Due to the evolutionary conservation of this nucleus and the extensive use ofmice as disease models, establishing an assay for VTA dopaminergic signaling in the mouse brain is crucial for the translationalinvestigation of motivational control as well as of neuronal function phenotypes for diseases and interventions. In this article we useoptogenetic stimulation directed at VTA dopaminergic neurons in combination with functional Magnetic Resonance Imaging (fMRI),a method widely used in human deep brain imaging. We present a comprehensive assay producing the first whole-brain opto-fMRImap of dopaminergic activation in the mouse, and show that VTA dopaminergic system function is consistent with its structuralVTA projections, diverging only in a few key aspects. While the activation map predominantly highlights target areas according totheir relative projection densities (e.g., strong activation of the nucleus accumbens and low activation of the hippocampus), it alsoincludes areas for which a structural connection is not well established (such as the dorsomedial striatum). We further detail thevariability of the assay with regard to multiple experimental parameters, including stimulation protocol and implant position, andprovide evidence-based recommendations for assay reuse, publishing both reference results and a reference analysis workflowimplementation.
Translational Psychiatry (2022) 12:60 ; https://doi.org/10.1038/s41398-022-01812-5
BACKGROUNDThe dopaminergic system consists of a strongly localized, andwidely projecting set of neurons with cell bodies clustered in themidbrain into two lateralized nucleus pairs, the Substantia Nigrapars compacta (SNc) and the Ventral Tegmental Area (VTA,Fig. 1a). On account of the small number of dopaminergic neurons(≈300,000 in humans [1], ≈10,000 in rats [2], and ≈4000 in mice[3]), tractography commonly fails to resolve the degree centralityof this neurotransmitter system, precluding it from being aprominent node in such graph representations of the brain.However, it is precisely the small number of widely branching andsimilar neurons, which makes the dopaminergic system a crediblecandidate for truly node-like function in coordinating brainactivity. As is expected given such salient features, the system iswidely implicated in neuropsychiatric phenomena (includingaddiction [4, 5], attentional control [6], motivation [7], creativity[8], personality [9], neurodegeneration [10], and schizophrenia[11]), and is a common target for pharmacological interventions.Lastly, due to high evolutionary conservation [12], the dopami-nergic system is also an excellent candidate for translational study.Imaging a neurotransmitter system comprised of a small
number of cells based only on spontaneous activity is highlyunreliable due to an intrinsically low signal to noise ratio (SNR).This limitation can, however, be overcome by introducing
exogenous stimulation. While the colocalization of widelyprojecting dopaminergic cell bodies into nuclei renders tempo-rally precise and population-wide targeting feasible, dopaminergicnuclei also contain notable sub-populations of non-dopaminergiccells, which may confound an intended dopaminergic read-out[13]. In order to specifically target dopaminergic cells, they need tobe sensitized to an otherwise inert stimulus in a transcription-dependent manner. This can be achieved via optogenetics, whichis based on light-stimulation of cells expressing light-sensitiveproteins such as channelrhodopsin [14]. Cell-type selectivity canbe achieved by Cre-conditional channelrhodopsin vector delivery[15] to transgenic animals expressing Cre-recombinase under adopaminergic promoter. Following protein expression, stimuli canbe delivered via an implanted optic fiber. The combination of thisstimulation method with fMRI is commonly referred to as opto-fMRI and can provide information on functional connectivitybetween a primary activation site and associated projection areas[16, 17].Key questions surrounding VTA function in preclinical models
are, firstly, method feasibility in animal models more accessible totransgenic techniques, such as the mouse; and secondly, amapping of the efferent spectrum for dopaminergic VTA output.In particular, in the study of the Rat VTA, it has both beensuggested that the efferent dopaminergic spectrum encompasses
Received: 16 March 2021 Revised: 16 October 2021 Accepted: 12 January 2022
1Institute for Biomedical Engineering, ETH and University of Zurich, Zurich, Switzerland. 2Preclinical Laboratory for Translational Research into Affective Disorders, DPPP,Psychiatric Hospital, University of Zurich, Zurich, Switzerland. 3The LOOP Zurich, Zurich, Switzerland. ✉email: [email protected]
www.nature.com/tpTranslational Psychiatry
1234567890();,:

but extends beyond well documented structural projections [18]—or alternatively, that VTA dopaminergic efferences are compara-tively sparse and that based on translational insight thedopaminergic paradigm of motivation-related VTA function couldbe questioned [19].The current study of whole-brain VTA dopaminergic function in
mice aims to produce three novel research outputs. Firstly, aproof-of-principle documenting the feasibility of midbrain dopa-minergic opto-fMRI in the mouse should be demonstrated, using aprotocol that affords qualitative comparability with extant rat data,such as block stimulation and right VTA targeting. Pursuing openquestions in the field, results should be quantitatively bench-marked with respect to histologically documented structuralprojections in the mouse. Secondly, the procedure needs to beoptimized by systematic variation of experimental parameters(such as targeting and stimulation protocol variations) in order toascertain reliability and reproducibility, as is required for a
general-purpose dopaminergic system assay. Lastly, a referenceneurophenotype of stimulus-evoked dopaminergic function(represented as a brain-wide voxelwise map) should be publishedin standard space to facilitate co-registered data integration,operative targeting, and comparative evaluation of pathology ortreatment-induced effects.These goals presuppose not only the production of experi-
mental data, but also the development of a transparent, reliable,and publicly accessible analysis workflow, which leverages pre-existing standards for mouse-brain data processing [20] andextends them to the statistical analysis.
METHODSAnimal preparationVTA dopaminergic neurons were specifically targeted via optogeneticstimulation. As shown in Fig. 1d, this entails a triple selection process.
Fig. 1 The cell biological compartmentalization of dopaminergic neurotransmission (and susceptibility to psychopharmacology) canpartly be mapped onto neuroanatomical features by a simple network model, using optogenetics. Depicted are schematic overviews ofthe VTA dopaminergic system at various spatial resolutions. a Schematic map of VTA dopaminergic projections [50, 52–54]. Dotted structuresare off-slice, and projection arrows do not reflect actual fiber bundle paths. b Simplified network model of 1-step signal relay followingoptogenetic stimulation of the VTA. The u1 weighting corresponds to VTA somatic excitability and u2a, u2b, u2c, and u2d correspond totransmission at the dopaminergic synapses in the respective projection areas. c Schematic overview of VTA dopaminergic neurons, with thesoma located in the VTA and synapses in one or multiple other projection area voxels. Excitability at the soma are contingent on D2autoinhibition, while transmission at the synapse is contingent on dopamine metabolism, turnover, and postsynaptic D1 expression [55].d Schematic of optogenetic cell selection and activation. Orange denotes dopaminergic cells, gray enlarged elements on the cell peripheryindicate channelrhodopsin expression, and cyan segments on the cell periphery denote depolarization events. AC adenylyl cyclase, DAdopamine, DAT dopamine transporter, DS dorsal striatum, Hipp hippocampus, MAO monoamine oxydase, mPFC medial prefrontal cortex,NAcc nucleus accumbens, OT olfactory tuberculum, TT tenia tecta, Tyr tyrosine, VMAT vesicular monoamine transporter.
H.-I. Ioanas et al.
2
Translational Psychiatry (2022) 12:60

Firstly, cells are selected based on gene expression (via a transgenic mousestrain), secondly the location is selected based on the injection site, andthirdly, activation is based on the overlap of the aforementioned selectionsteps with the irradiation volume covered by the optic fiber.A C57BL/6-based mouse strain was chosen, which expresses Cre-
recombinase under the dopamine transporter (DAT) promoter [21].Transgenic construct presence was assessed via polymerase chain reaction(PCR) for the Cre construct, using the forward primer ACCAGCCAGCTATCAACTCG and the reverse primer TTGCCCCTGTTTCACTATCC. A total of 25transgenic animals and 7 wild-type control animals are included in thestudy. The animal sample consisted of 18 males and 14 females, with agroup average age of 302 days (standard deviation 143 days) at the studyonset. The sample size was determined based on the range foundsufficient to uncover opto-fMRI results in the mouse serotonergic system[17].The right VTA of the animals was injected with a recombinant Adeno-
Associated Virus (rAAV) solution. The vector delivered a plasmid containinga floxed channelrhodopsin and YFP construct: pAAV-EF1a-double floxed-hChR2(H134R)-EYFP-WPRE-HGHpA, gifted to a public repository by KarlDeisseroth (Addgene plasmid #20298). Viral vectors and plasmids wereproduced by the Viral Vector Facility (VVF) of the Neuroscience CenterZurich (Zentrum für Neurowissenschaften Zürich, ZNZ). The solution wasprepared at a titer of 5.7 × 10¹² vg/ml and volumes from 0.8 to 1.6 µl wereinjected into the right VTA. Injection coordinates ranged in the poster-oanterior (PA) direction from −3.5 to −3.05mm (relative to bregma), indepth from 4.0 to 4.4 mm (relative to the skull), and were located 0.5 mmright of the midline. Construct expression was ascertained post mortem byfluorescent microscopy of formaldehyde-fixed 200 µm brain slices.For optical stimulation, animals were fitted with an optic fiber implant (l
= 4.7 mm d= 400 µm NA= 0.22) targeting the right VTA, at least 2 weeksbefore imaging. Implant target coordinates ranged in the PA directionfrom −3.5 to −3.05mm (relative to bregma), in depth from 4.0 to 4.6 mm(relative to the skull), and were located 0.5 to 0.55mm right of the midline.Stimulation was delivered via an Omicron LuxX 488-60 laser (488 nm),tuned to a power of 30mW at contact with the fiber implant, according tothe protocols listed in Tables S1 to S7. Stimulation protocols were deliveredto the laser and recorded to disk via the COSplayer device [22]. Animalphysiology, preparation, and measurement metadata were tracked withthe LabbookDB database framework [23].
MR acquisitionOver the course of preparation and measurement, animals were providedwith a constant flow of air with an additional 20% O2 gas (yielding a totalO2 concentration of ≈36 %). For animal preparation, anesthesia wasinduced with 3% isoflurane, and maintained at 2–3% during preparation—contingent on animal reflexes. Animals were fixed to a heated MRI-compatible cradle via ear bars and a face mask equipped with a bite hook.A subcutaneous (s.c.; right dorsal) and intravenous (i.v.; tail vein) infusionline were applied. After animal fixation, a bolus of medetomidinehydrochloride (Domitor, Pfizer Pharmaceuticals, UK) was delivered s.c. toa total dose of 100 ng/(g BW) and the inhalation anesthetic was reduced to1.5% isoflurane. After a 5min interval, the inhalation anesthetic was set to0.5% and medetomidine was continuously delivered at 200 ng/(g BW h) forthe duration of the experiment. This anesthetic protocol is closely based onextensive research into animal preparation for fMRI [24].All data were acquired with a Bruker Biospec system (7 T, 16 cm bore),
and an in-house built transmit/receive surface coil, engineered to permitoptic fiber implant protrusion.Anatomical scans were acquired via a TurboRARE sequence, with a RARE
factor of 8, an echo-time (TE) of 30ms, an inter-echo spacing of 10ms, anda repetition time (TR) of 2.95 s. Thirty adjacent (no slice gap) coronal sliceswere recorded with a nominal in-plane resolution of Δx(ν)= Δy(φ)= 75 µm(sampled as 180 voxels sagittally and 120 voxels horizontally), and a slicethickness of Δz(t)= 450 µm.Functional scans were acquired with a gradientecho EPI sequence, a flip
angle of 60°, and TR/TE= 1000ms/5.9ms. Thirty adjacent (no slice gap)coronal slices were recorded with a nominal in-plane resolution of Δx(ν)=Δy(φ)= 225 µm (sampled as 60 voxels sagittally and 29 voxels horizon-tally), and a slice thickness of Δz(t)= 450 µm. Functional scans wereacquired over a period of 25min, totalling 1500 repetitions. Changes incerebral blood volume (CBV) are measured as a proxy of neuronal activityfollowing the administration of an intravascular iron oxide nanoparticle-based contrast agent (Endorem, Laboratoire Guebet SA, France) [25]. Thecontrast agent (30.24 µg/(g BW)) is delivered as an i.v. bolus 10min prior tothe fMRI data acquisition, to achieve a pseudo-steady-state blood
concentration. This contrast is chosen to enable short echo-time imagingthereby minimizing artefacts caused by gradients in magnetic susceptibility.The total duration of the scan session, including induction, preparation,
and scanning (including the 10min delay after contrast agent administra-tion, taking place between the structural and functional scan) was ~80min.MR acquisition was performed blindly with respect to the implant
parameter variation, the measurement order was not systematicallyseparated between the conditions. All animal experiments and handlingwere performed in accordance with the relevant requirements of theCantonal Veterinary Office of Zurich, under licence ZH263/14 andextension ZH128/18.
PreprocessingData conversion from the proprietary ParaVision format was performed viathe Bruker-to-BIDS repositing pipeline [26] of the SAMRI package (version0.4 [27]). Following conversion, data were dummy-scan corrected,registered, and subject to controlled smoothing via the SAMRI Genericregistration workflow [20]. As part of this processing, the first 10 volumeswere discarded (automatically accounting for volumes excluded by thescanner software). Registration was performed using the standard SAMRImouse-brain-optimized parameter set for ANTs [28] (version 2.3.1). Datawere transformed to a stereotactically oriented standard space (theDSURQEC template space, as distributed in the Mouse Brain AtlasesPackage [29], version 0.5.3), which is based on a high-resolution T2-weighted atlas [30]. Controlled spatial smoothing was applied in thecoronal plane up to 250 µm via the AFNI package [31] (version 19.1.05).The registered time course data were frequency filtered depending on
the analysis workflow. For stimulus-evoked activity, the data was low-passfiltered at a period threshold of 225 s, and for seed-based functionalconnectivity, the data were band-pass filtered within a period range of2–225 s.
Statistics and dataVolumetric data was modelled using functions from the FSL softwarepackage [32] (version 5.0.11). First-level regression was applied to thetemporally resolved volumetric data via FSL’s glm function, whereas thesecond-level analysis was applied to the first-level contrast and varianceestimates via FSL’s flameo.Stimulus-evoked first-level regression was performed using a convolu-
tion of the stimulus sequence with an opto-fMRI impulse responsefunction, estimated by a beta fit of previously reported mouse opto-fMRIresponses [17]. Seed-based functional connectivity analysis was performedby regressing the time course of the voxel most sensitive to the stimulus-evoked activity (per scan) in the VTA region of interest.Brain parcellation for region-based evaluation was performed using non-
overlapping multi-center labelling [30, 33–35], as distributed in version0.5.3 of the Mouse Brain Atlases data package [29]. The mappingoperations were performed by a SAMRI function, using the nibabel [36]and nilearn [37] libraries (versions 2.3.1 and 0.5.0, respectively). Classifica-tion of implant coordinates into “best” and “rejected” categories wasperformed via 1D k-means clustering, implemented in the scikit-learnlibrary [38] (version 0.20.3). Distribution density visualizations were createdusing the Scott bandwidth density estimator [39], as implemented in theseaborn software package (0.9.0).Higher-level statistical modelling was performed with the Statsmodels
software package [40] (version 0.9.9), and the SciPy software package [41](version 1.1.0). Model parameters were estimated using the ordinary leastsquares method, and a type 3 analysis of variance (ANOVA) and aheteroscedasticity consistent covariance matrix [42] were employed tocontrol estimate variability for unbalanced categories. All t-tests producingexplicitly noted p-values are two-tailed.The VTA structural projection data used to compare and contrast the
activation maps produced I this study was sourced from the Allen BrainInstitute (ABI) mouse-brain connectome dataset [43]. As the targetpromoter of this study (DAT) is not included in the ABI connectomestudy, all available promoters were used (Sty17, Erbb4, Slc6a3, Th, Cck,Pdzk1ip1, Chrna2, Hdc, Slc18a2, Calb2, and Rasgrf2). Datasets with left-handed VTA injection sides were flipped to provide right-hand VTAprojection estimates. The data was converted and registered to theDSURQEC template space by the ABI Connectivity Data Generator package[44]. For the second-level statistical comparison between functionalactivation and structural projection, individual activation (betas) andprojection maps were normalized to a common scale by subtracting theaverage and dividing by the standard deviation.
H.-I. Ioanas et al.
3
Translational Psychiatry (2022) 12:60

Software management relevant for the exact reproduction of theaforementioned environment was performed via neuroscience packageinstall instructions for the Gentoo Linux distribution [45].All data analysis was performed on the entire dataset, without any data
being removed, and in the absence of individual category investigation.
Reproducibility and open dataThe resulting t-statistic maps (i.e., the top-level data visualized in thisdocument), which document the opto-fMRI dopaminergic map in themouse model, are distributed along with the source code of all analyses[46]. The BIDS [47] data archive which serves as the raw data recourse forthis document is openly distributed [48], as is the full instruction set forrecreating this document from the aforementioned raw data [46]. Thesource code for this document and all data analysis shown herein isstructured according to the RepSeP specifications [49].
RESULTSOpto-fMRI experiments were carried out in C57BL/6 miceexpressing Cre-recombinase under the dopamine transporterpromoter [21], with Cre-conditional viral vector induced expres-sion of channelrhodopsin (ChR2) and yellow fluorescent protein(YFP) in the dopaminergic midbrain. Light stimuli were deliveredvia an optic fiber pointing above the right VTA. Differentstimulation protocols were applied to the animals, consisting ofvariations within two main categories: block stimulation (with lightstimuli delivered in continuous blocks of at least 8 s—Tables S1 toS5) and phasic stimulation (with light stimuli delivered in shortbursts of up to 1 s in lenght—Tables S6 and S7). Additionally, thedataset details the effects of variation in the posteroainerior (PA)coordinates and the implant depth (equivalent to the dorsoventralcoordinate of the fiber endpoint), specified relative to bregma andthe skull surface, respectively.In the analysis of the resulting data, the mean t-statistic for the
stimulation regressor fit across the VTA region of interest is foundsensitive to the stimulation protocol category (F1,54= 47.26,p= 6.57 × 10⁻⁹), the stimulation target depth (F4,54= 2.656,p= 0.043), the stimulation target PA coordinates (F3,54= 3.063,
p= 0.036), but not the interaction of the depth and PA targetcoordinates (F12,54= 1.591, p= 0.16).The break-up by phasic and block stimulation is shown in Fig. 2
and significance is evaluated accounting for the entire statisticalmodel, consisting of categorical terms for both the stimuluscategory and the coordinates. The phasic and block levels of thestimulation variable yield p-values of 0.063 and 1.87 × 10− 5,respectively. Upon investigation of the t-statistic map, phasicstimulation further reveals no coherent activation pattern at thewhole-brain level (fig. S2b).The main and interaction effects of the implant coordinate
variables are better described categorically than linearly (Figs. S1and 2b). Consequently, the most suitable implant coordinategroup for the assay can best be determined on the basis ofcategorical classification of implant coordinates. We classify theimplant coordinates into a “best” and a “rejected” group byk-means clustering the aggregate VTA t-statistic scores into twoclusters, and find spatial coherence for the “best” coordinategroup (categorization highlighted in Fig. 2b).For block stimulation, the best implant category group (Fig. 3a)
and the rejected implant category group (Fig. 3c) show not only adifference in overall stimulus-evoked signal intensity but also adifference in efferent distribution, with the rejected implantcategory efferent spectrum more strongly weighted towardscaudal brain areas. This distinction specifically arises for implantcategorization based on block scan VTA t-statistic means, and isnot as salient if implants are categorized based on a poster-oanterior implant coordinate delimiter (Fig. S3).The activation pattern elicited by block stimulation in the best
implant category group shows strong coherent clusters ofactivation. The top activation areas are predominantly located inthe right hemisphere, with highly significant laterality (p= 8.27 ×10⁻⁷) seen in the comparison of left and right hemisphere atlasparcellation region averages. Activation is seen in regionssurrounding the stimulation site, such as the ventral tegmentaldecussation and the interpeduncular nucleus. The largest activa-tion cluster encompasses well-known dopaminergic VTA
Fig. 2 VTA activation is sensitive to the stimulation protocol category and the implant coordinates, with different trends in block andphasic stimulation trials. Depicted are multifactorial (protocol and implant coordinates) comparisons of signal intensity in the VTA region ofinterest. a Task group comparison for animals targeted at all explored combinations of implant coordinates. b Implant coordinate comparisonfor block stimulation trials (inner dots indicate best category group). n sample size, PA posteroanterior, rel. relative to.
H.-I. Ioanas et al.
4
Translational Psychiatry (2022) 12:60
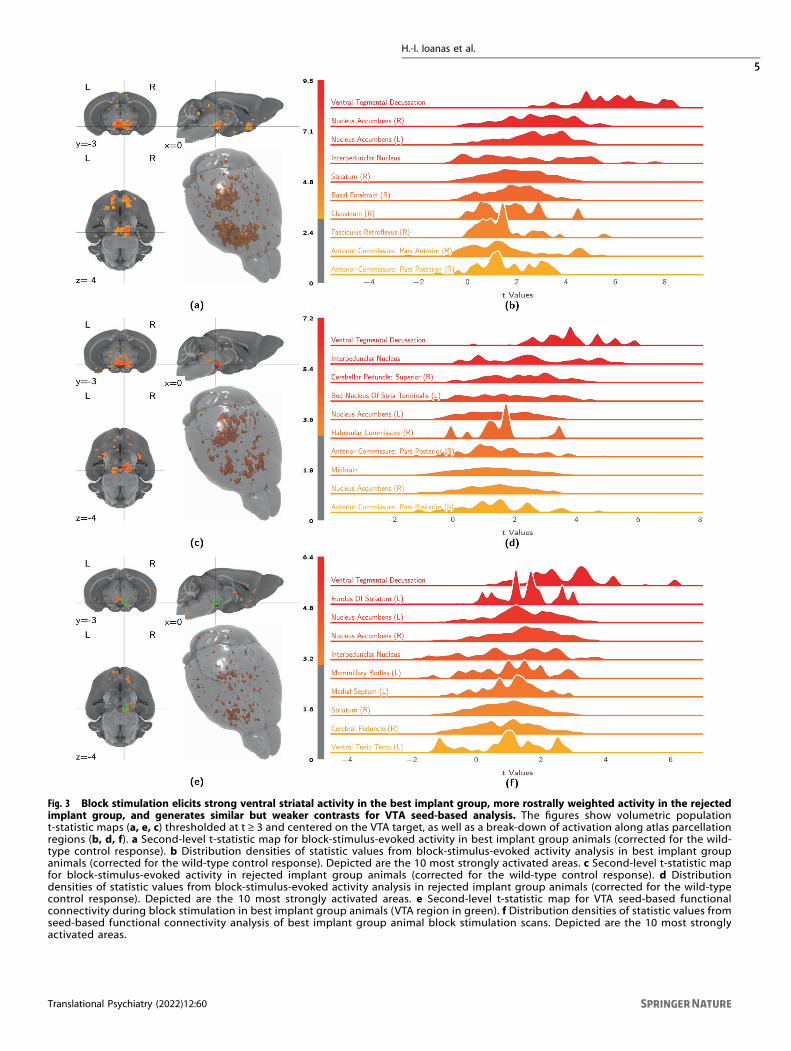
Fig. 3 Block stimulation elicits strong ventral striatal activity in the best implant group, more rostrally weighted activity in the rejectedimplant group, and generates similar but weaker contrasts for VTA seed-based analysis. The figures show volumetric populationt-statistic maps (a, e, c) thresholded at t ≥ 3 and centered on the VTA target, as well as a break-down of activation along atlas parcellationregions (b, d, f). a Second-level t-statistic map for block-stimulus-evoked activity in best implant group animals (corrected for the wild-type control response). b Distribution densities of statistic values from block-stimulus-evoked activity analysis in best implant groupanimals (corrected for the wild-type control response). Depicted are the 10 most strongly activated areas. c Second-level t-statistic mapfor block-stimulus-evoked activity in rejected implant group animals (corrected for the wild-type control response). d Distributiondensities of statistic values from block-stimulus-evoked activity analysis in rejected implant group animals (corrected for the wild-typecontrol response). Depicted are the 10 most strongly activated areas. e Second-level t-statistic map for VTA seed-based functionalconnectivity during block stimulation in best implant group animals (VTA region in green). f Distribution densities of statistic values fromseed-based functional connectivity analysis of best implant group animal block stimulation scans. Depicted are the 10 most stronglyactivated areas.
H.-I. Ioanas et al.
5
Translational Psychiatry (2022) 12:60

projection areas in the subcortical rostroventral regions of thebrain (nucleus accumbens, striatum, and the basal forebrain), withweaker activation observed in smaller structures in the vicinity ofthese regions, such as the fasciculus retroflexus, anteriorcommissure and the claustrum.This activation pattern is largely consistent with structural
projection data, as published by the Allen Brain Institute [43] witha few notable distinctions (Fig. 4). At the parcellation level, we seea moderately strong positive correlation between functionalactivation and structural projection (Fig. 4a), which is weaker atthe voxel level (Fig. 4b). In the midbrain, the coronal slice mapshows areas of increased functional activation with respect tostructural projection density in the contralateral VTA and theipsilateral substantia nigra. Coherent clusters of increased activa-tion are also observed in projection areas, most prominently in theipsilateral and contralateral dorsomedial striatum (Fig. 4c).Parcellation-based distributions (Fig. 4d, e) show this increasedactivation map encompassing additional areas in the contralateralhemisphere, in particular the contralateral nucleus accumbens,with activity extending into the claustrum. Areas for whichstructural projections clearly outweigh the functional response arefew and dispersed. These small clusters yield only weak negativecontrast distributions and are located predominantly in thecerebellum (Fig. 4d).We differentiate VTA transmission from VTA excitability by
mapping functional connectivity using a seed region in the rightVTA, which yielded the projection pattern shown in Fig. 3e. Theseclusters are more sparse compared to those identified by stimulus-evoked analysis, yet follow a similar distribution. While areasdisplaying the highest functional connectivity are located in theright hemisphere, the whole-brain parcellation-resolved responsedisplays no significant laterality (p= 0.11). Strong activation canbe seen in the parcellation regions surrounding the seed, such asthe ventral tegmental decussation and the closely locatedinterpeduncular nucleus. In the midbrain, seed-based functionalconnectivity highlights both the ipsilateral and the contralateralVTA with great specificity, unlike sitmulus-evoked analysis (Fig. 3a,e). Rostrovental dopaminergic projection areas remain promi-nently featured, including the nucleus accumbens and thestriatum (Fig. 3f).Stimulation in wild-type control animals (which is corrected for
in the aforementioned stimulus-evoked analyses) does not exhibita pattern of activity consistent with dopaminergic projections.Sparse grains containing regression scores of t ≥ 3 can beobserved, with the largest cluster in the lateral geniculate nucleusarea of the thalamus, suggesting visual activity (Fig. S5b). Atlasparcellation score distributions (Fig. S5c) do not strongly deviatefrom zero, with the highest scoring areas being in the vicinity ofthe fiber, possibly indicating VTA heating artefacts. Comparableregion t-statistic distributions are also found in areas of thecerebellum. Overall the whole-brain parcellation-resolvedresponse shows no significant laterality (p= 0.68).Histological analysis of the targeting site reveals that the optic
fiber implant displaces the YFP labelled neurons of the VTA (Fig.5). This dislocation was observed irrespective of the targeting areaor the speed of implant insertion (10–50 µm/s). Yet, labelledfilaments and soma remain in the imediate vecinity of the fiber tip,as seen in higher magnification images (Fig. 5c).
DISCUSSIONWhole-brain dopaminergic mapIn this article we present the first whole-brain opto-fMRI map ofVTA dopaminergic activity in the mouse. Published as voxelwisereusable data and discussed in terms of regions of interest in thearticle text, this constitutes an essential resource for preclinicalinvestigation of the dopaminergic system. The areas identified asfunctional VTA dopaminergic targets are largely consistent with
histological and electrophysiologic literature (as summarized inFig. 1a). This highlights the suitability of opto-fMRI for interrogat-ing the mouse dopaminergic system, which opens the way forlongitudinal recording with whole-brain coverage.The predominant VTA projection area identified both in
literature and in our study is the nucleus accumbens. This areais involved in numerous neuropsychological phenomena, and itsactivation further supports the method’s suitability to resolvemeaningful brain function and increase the predictability of novelinterventions using the mouse model organism. Particularly,potential limitations of dopaminergic VTA imaging as shown inrecent literature [19], appear to not constrain the protocol detailedin this study.Throughout brain regions with high signal amplitudes on either
metric, we observe a high degree of correspondence betweenfunctional activation and structural projection density. Yet, we alsodocument a number of notable differences between opto-fMRIderived projection areas and the structural substrate of thedopaminergic system. Overall, the contrast between function andstructure shows stronger signal and wider coverage for thefunctional activation pattern, particularly in projection areas.Notably, the functional map extends into the contralateral ventralstriatum, and both the contralateral and ipsilateral dorsal striatum.Activation of the contralateral ventral striatum might be attributedto an extension of the functional map to the contralateral VTA.This interpretation is supported by the contralateral projectionareas showing lower overall significance scores than the ipsilateralareas (Fig. 3b, f). The explanation of projection area extension intothe dorsal striatum on account of secondary activation of theipsilateral substantia nigra is, however, less reliable, since the mostrelevant cluster of increased functional activation—the dorsome-dial striatum—can be observed bilaterally, although potentialnigral activation is only seen ipsilaterally (Fig. 4c). Together withother recent literature [18, 50], it is also possible that VTAactivation on its own elicits dorsomedial striatial activity. Not leastof all, the local deformation of the VTA upon fiber implantationmay additionally confound parcellation in the vicinity of the fibertip (Fig. 5).Negative contrasts clusters between functional activation and
structural projection are overall very sparse (Fig. 4d). Yet, theamygdala, hippocampus, and the medial prefrontal cortex—known targets for VTA dopaminergic projections—do not revealstrong activation in opto-fMRI. Comparison with publishedstructural projection data indicates that this is due to low fiberbundle density, as these areas also do not show high amounts ofstructural projections.In the pursuit of differentiating primary activation from
subsequent signal transmission (and resolving a dopaminergicgraph relay model, as depicted in Fig. 1b) we present an analysisworkflow based on VTA seed-based connectivity. Our resultsindicate that this analysis is capable of identifying projectionareas, but is significantly less powerful than stimulus-evokedanalysis (Fig. 3a). VTA seed-based analysis highlights only a smallnumber of activation clusters and fails to show significantprojection laterality. This is an interesting outcome, as—giventhe superior performance of stimulus-evoked analysis—itdescribes two possible features of dopaminergic neurotransmis-sion in the VTA. The first is that the relay of primary VTAstimulation has higher fidelity than the fMRI measurement of VTAactivity itself (i.e., VTA activity is relayed accurately, but out-weighed by measurement noise). The second is that there is asignificant threshold to dopaminergic neurotransmission, bywhich fMRI-measurable baseline activity is predominantly notpropagated (i.e., VTA activity is measured accurately, but is relayedin a strongly filtered fashion). The seed-based analysis workflow,however successfully disambiguates VTA activation from adjacentmidbrain activation including for the contralateral VTA, which isoutside of the seed region of interest. This indicates that VTA
H.-I. Ioanas et al.
6
Translational Psychiatry (2022) 12:60

Fig. 4 Comparing VTA functional activation to structural projection data reveals good correspondence, with deviations involving thedorsomedial striatum and the contralateral ventral striatum. Depicted are correlation analyses (a, b) of the population-level functional andstructural statistic scores, alongside statistic distributions (c–e) for the contrast, taking into account variability across subjects. a Region-wiseregression plot between functional and structural projection maps. Tinted area indicates the 99% confidence interval of the regressionestimate. b Voxelwise regression plot between functional and structural projection maps. Tinted area indicates the 99% confidence interval ofthe regression estimate. c Coronal slices, showing the population-level contrast t-statistic between VTA functional activation and VTAstructural projections. d Distribution densities of t-statistics, showing the regions where VTA structural projection exceeds functionalactivation most strongly. e Distribution densities of t-statistics, showing the regions where VTA functional activation exceeds structuralprojection most strongly. Ant. Anterior, EC endopiriform claustrum, Int. intermediate, Med. medial, Nc. nucleus, p. pars, Post. posterior, WMwhite matter.
H.-I. Ioanas et al.
7
Translational Psychiatry (2022) 12:60

susceptibility to optogenetic stimulation may have a uniquesignature compared to surrounding midbrain tissue in whichactivation is also elicited in opto-fMRI.
Assay parametersThis article presents an evidence-based outline for assay reuse andrefinement. In particular, we detail the effects of stimulus protocolcategories and optogenetic targeting coordinates on the perfor-mance of the method.The break-down of target coordinates for optical stimulation
(Fig. 2) indicates that more rostral and deeper implant coordinateselicit stronger VTA signal responses to block stimulation trials.Based on our data we suggest targeting the optic implant at aposteroanterior distance of −3.05mm from bregma, a left-rightdistance of 0.5–0.55 mm from the midline, and a depth of 4.5 mmfrom the skull surface. Additional coordinate exploration might beadvisable, though further progression towards bregma may leadto direct stimulation of specific efferent fibers rather than the VTA.The absence of VTA activation as well as coherent activity
patterns elicited by phasic stimulation (Figs. 2a and S3b) highlightsthat phasic stimulation is unable to elicit activation measurable bythe assay in its current form. The overall low susceptibility to phasicstimulation is most likely due to the intrinsically lower statisticalpower of such stimulation protocols in fMRI.Regarding the distribution of activation across projection
areas, we note a strong and unexpected divergence between themost sensitive (“best”) and least sensitive (“rejected”) implantcoordinate category responses to block stimulation (Fig. 3a, c). Inaddition to a difference in VTA and efferent signal intensity(expected as per the selection criterion), we also notice adifferent pattern of target areas. Interestingly, the activity patternelicited in the “rejected” group is more strongly weightedtowards the hindbrain, and the efferent pattern includes theperiaqueductal gray, a prominent brainstem nucleus involved inemotional regulation [51]. This effect might be related to theactivation of descending dopaminergic projections, thoughfurther investigation is needed to clarify this point and, ingeneral, to better understand the cross-connectivity betweendeep brain nuclei.The activation patterns in wild-type control animals are very
sparse (Fig. S5), and—whether or not they are controlled for in theform of a second-level contrast—do not meaningfully impact thedopaminergic block stimulation contrast (Figs. 3a and S4). Basedon the activation distribution, however, it may be inferred thattrace heating artefacts (midbrain activation) and visual stimulation(lateral geniculate nucleus thalamic activation) are present. Onaccount of this, for further experiments, we suggest using eyeocclusion and dark or dark-painted ferrule sleeves (to avoid visualstimulation), as well as laser power lower than the 30mW(239mW/mm2) used in this study (to further reduce heatingartefacts).
Stimulus-evoked analysis displayed significant laterality; never-theless, large clusters displaying significant activation were alsoobserved on the contralateral side. Fluorescence microscopy(Fig. 4c) revealed that expression of the viral construct injected atthe site of the right VTA extends over a large area, including partof the contralateral VTA. Inspection of the functional map at themidbrain stimulation site corroborates that activity in fact spreadsto the contralateral VTA (Fig. 3a). This explains the occurrence ofcontralateral fMRI responses, which are most likely weaker due toa lower photon fluence at the site of the left VTA. Together, thesedata suggest that the solution volume and virus amount injectedfor the assay could be significantly reduced, to less than the 0.8 µl(5.7 × 10¹² vg/ml) used as the minimal volume in this study.The most salient qualitative feature of Fig. 5 is, however, the
displacement of labelled neurons from the area in the proximity ofthe optic fiber implant tip. This feature was consistent acrossanimals and implantation sites, and is a relevant concern as itaffects the accuracy of targeting small structures. In particular,such a feature could exacerbate limitations arising from heatingartefacts, since the maximum SNR attainable at a particular level ofphoton fluence may be capped to an unnecessarily low level. Thiseffect might be mitigated by using thinner optic fiber implants(e.g., 200 µm, as opposed to the 400 µm fibers used in this study).
CONCLUSIONIn this article we demonstrate the suitability of opto-fMRI forinvestigating a neurotransmitter system that exhibits node-likefunction in coordinating brain activity. We present the first whole-brain map of VTA dopaminergic signalling in the mouse in astandard space aligned with stereotactic coordinates [46]. Wedetermine that the mapping is consistent with known structuralprojections, and note the instances where differences areobserved. Further, we explore network structure-aware analysisvia functional connectivity (Fig. 3e), finding that the assay providessuperior identification of the VTA, but limited support for signalrelay imaging. An in-depth investigation of experimental variation,based on open source and reusable workflows, supports thecurrent findings by identifying detailed evidence-based instruc-tions for assay reuse. Our study provides a reference dopaminergicstimulus-evoked functional neurophenotype map and a novel andthoroughly documented workflow for the preclinical imaging ofdopaminergic function, both of which are crucial to elucidatingthe etiology of numerous disorders and improving psychophar-macological interventions in health and disease.
REFERENCES1. Rice MW, Roberts RC, Melendez-Ferro M, Perez-Costas E. Mapping dopaminergic
deficiencies in the substantia nigra/ventral tegmental area in schizophrenia. BrainStruct Funct. 2016;221:185–201. https://doi.org/10.1007/s00429-014-0901-y
Fig. 5 Fiber implantation causes strong local cell displacement in the VTA. Depicted are YFP (coexpressed with Channelrhodopsin)fluorescent microscopy images of the VTA, overlaid on corresponding transmission microscopy images of the same focal plane. All slices areseen in neurological orientation (the right of the image corresponds to the right of the animal). A higher magnification of b is depicted inc. White bars indicate a scale of 500 µm, and slices are shown in neurological orientation. a 3.05 mm caudal of Bregma. b 3.5 mm caudal ofBregma. c 3.5 mm caudal of Bregma.
H.-I. Ioanas et al.
8
Translational Psychiatry (2022) 12:60

2. German DC, Manaye KF. Midbrain dopaminergic neurons (nuclei a8, a9, and a10):three-dimensional reconstruction in the rat. J Comp Neurol. 1993;331:297–309.https://doi.org/10.1002/cne.903310302
3. Triarhou LC, Norton J, Ghetti B. Mesencephalic dopamine cell deficit involvesareas a8, a9 and a10 in weaver mutant mice. Exp brain Res. 1988;70:256–65.https://doi.org/10.1007/BF00248351
4. Di Chiara G, Imperato A. Drugs abused by humans preferentially increasesynaptic dopamine concentrations in the mesolimbic system of freely movingrats. Proc Natl Acad Sci USA. 1988;85:5274–5278. https://doi.org/10.1073/pnas.85.14.5274
5. Di Chiara G. Drug addiction as dopamine-dependent associative learning dis-order. Eur J Pharmacol. 1999;375:13–30. https://doi.org/10.1016/s0014-2999(99)00372-6
6. Nieoullon A. Dopamine and the regulation of cognition and attention. ProgNeurobiol. 2002;67:53–83. https://doi.org/10.1016/s0301-0082(02)00011-4
7. Salamone JD. The involvement of nucleus accumbens dopamine in appetitiveand aversive motivation. Behav Brain Res. 1994;61:117–33. https://doi.org/10.1016/0166-4328(94)90153-8
8. Chermahini SA, Hommel B. The (b)link between creativity and dopamine: Spon-taneous eye blink rates predict and dissociate divergent and convergent thinking.Cognition. 2010;115:458–65. https://doi.org/10.1016/j.cognition.2010.03.007
9. Depue RA, Collins PF. Neurobiology of the structure of personality: dopamine,facilitation of incentive motivation, and extraversion. Behav Brain Sci.1999;22:491–517. https://doi.org/10.1017/s0140525x99002046
10. Masliah E. Dopaminergic loss and inclusion body formation in -synuclein mice:Implications for neurodegenerative disorders. Science. 2000;287(5456):1265–1269.https://doi.org/10.1126/science.287.5456.1265
11. Howes OD, Kapur S. The dopamine hypothesis of schizophrenia: version III–thefinal common pathway. Schizophr Bull. 2009;35:549–62. https://doi.org/10.1093/schbul/sbp006. letin, 35(3):549-62
12. Yamamoto K, Vernier P. The evolution of dopamine systems in chordates. FrontNeuroanat. 2011. https://doi.org/10.3389/fnana.2011.00021.
13. Taylor SR, Badurek S, Dileone RJ, Nashmi R, Minichiello L, Picciotto MR, et al.GABAergic and glutamatergic efferents of the mouse ventral tegmental area. JComp Neurol. 2014;522:3308–34. https://doi.org/10.1002/cne.23603
14. Boyden ES, Zhang F, Bamberg E, Nagel G, Deisseroth K. Millisecond-timescale,genetically targeted optical control of neural activity. Nat Neurosci. 2005;8:1263–1268.https://doi.org/10.1038/nn1525
15. Orban PC, Chui D, Marth JD. Tissue- and site-specific DNA recombination intransgenic mice. Proc Natl Acad Sci USA. 1992;89:6861–6865. https://doi.org/10.1073/pnas.89.15.6861
16. Desai M, Kahn I, Knobloch U, Bernstein J, Atallah H, Yang A, et al. Mapping brainnetworks in awake mice using combined optical neural control and fMRI. JNeurophysiol. 2011;105:1393–405. https://doi.org/10.1152/jn.00828.2010
17. Grandjean J, Corcoba A, Kahn MC, Upton A, Deneris ES, Seifritz E, et al. A brain-wide functional map of the serotonergic responses to acute stress and fluoxetine.Nat Commun. 2019. https://doi.org/10.1038/s41467-018-08256-w.
18. Lohani S, Poplawsky AJ, Kim S-G, Moghaddam B. Unexpected global impact ofVTA dopamine neuron activation as measured by opto-fMRI. Mol Psychiatry.2016;22:585–94. https://doi.org/10.1038/mp.2016.102
19. Brocka M, Helbing C, Vincenz D, Scherf T, Montag D, Goldschmidt J, et al. Con-tributions of dopaminergic and non-dopaminergic neurons to VTA-stimulationinduced neurovascular responses in brain reward circuits. NeuroImage.2018;177:88–97. https://doi.org/10.1016/j.neuroimage.2018.04.059
20. Ioanas H-I, Marks M, Zerbi V, Yanik MF, Rudin M. An optimized registrationworkflow and standard geometric space for small animal brain imaging. Neu-roimage. 2021. https://doi.org/10.1016/j.neuroimage.2021.118386.
21. X, Zhuang J, Masson JA, Gingrich S, Rayport, Hen R. Targeted gene expression indopamine and serotonin neurons of the mouse brain. J Neurosci Methods.2005;143:27–32. https://doi.org/10.1016/j.jneumeth.2004.09.020
22. Aymanns F, Rudin M, Ioanas Horea-Ioan. COSplay: Contrast optimized stimulationplayer. J Open Source Softw. 2019;4:1171 https://doi.org/10.21105/joss.01171
23. Ioanas H-I, Saab B, Rudin M. LabbookDB: A wet-work-tracking database appli-cation framework. In Proc 16th Python in Science Conference, (SciPy, 2017).
24. Grandjean J, Schroeter A, Batata I, Rudin M. Optimization of anesthesia protocolfor resting-state fmri in mice based on differential effects of anesthetics onfunctional connectivity patterns. NeuroImage. 2014;102:838–47. https://doi.org/10.1016/j.neuroimage.2014.08.043
25. Marota JJA, Ayata C, Moskowitz MA, Weisskoff RM, Rosen BR, Mandeville JB, et al.Investigation of the early response to rat forepaw stimulation. Magn Reson Med.1999;41:247–52. https://doi.org/10.1002/(sici)1522-2594(199902)
26. Ioanas Horea-Ioan, Marks M, Garin CM, Dhenain M, Yanik MF, Rudin M, et al. Anautomated open-source workflow for standards-compliant integration of smallanimal magnetic resonance imaging data. Front neuroinformatics. 2020;14:5https://doi.org/10.3389/fninf.2020.00005
27. Ioanas H-I, et al. SAMRI—Small Animal Magnetic Resonance Imaging. (Zenodo orGitHub, 2019). https://doi.org/10.5281/zenodo.3234918.
28. Brian B, Avants NJ, Tustison G, Song PA, Cook A, Klein JC, et al. A reproducibleevaluation of ANTs similarity metric performance in brain image registration.NeuroImage. 2011;54:2033–44. https://doi.org/10.1016/j.neuroimage.2010.09.025
29. Ioanas H-I, Segessemann T, Rudin M. “Mouse Brain Atlases” generator workflows.(Zenodo or GitHub, 2019). https://doi.org/10.5281/zenodo.2545838.
30. Dorr AE, Lerch JP, Spring S, Kabani N, Henkelman RM. High resolution three-dimensional brain atlas using an average magnetic resonance image of 40 adultc57bl/6j mice. NeuroImage. 2008;42:60–69. https://doi.org/10.1016/j.neuroimage.2008.03.037
31. Cox RW. AFNI: software for analysis and visualization of functional magneticresonance neuroimages. Computers Biomed Res. 1996;29:162–73. https://doi.org/10.1006/cbmr.1996.0014
32. Jenkinson M, Beckmann CF, Behrens TEJ, Woolrich MW, Smith SM. FSL. Neuro-image. 2012;62:782–90. https://doi.org/10.1016/j.neuroimage.2011.09.015
33. Steadman PE, Ellegood J, Szulc KU, Turnbull DH, Joyner AL, Henkelmann RM, et al.Genetic effects on cerebellar structure across mouse models of autism using amagnetic resonance imaging atlas. Autism Res. 2013;7:124–37. https://doi.org/10.1002/aur.1344
34. Ullmann JFP, Watson C, Janke AL, Kurniawan ND, Reutens DC. A segmentationprotocol and MRI atlas of the c57bl/6j mouse neocortex. NeuroImage.2013;78:196–203. https://doi.org/10.1016/j.neuroimage.2013.04.008
35. Richards K, Watson C, Buckley RF, Kurniawan ND, Yang Z, Keller MD, et al. Seg-mentation of the mouse hippocampal formation in magnetic resonance images.NeuroImage. 2011;58:732–40. https://doi.org/10.1016/j.neuroimage.2011.06.025
36. Brett M, Hanke M, Markiewicz C, Côté M-A, McCarthy P, Cheng C, et al. nipy/nibabel: 2.3.1. 2018. https://doi.org/10.5281/zenodo.1464282.
37. Abraham A, Pedegosa F, Eickenberg M, Gervais P, Mueller A, Kossaifi J, et al.Machine learning for neuroimaging with scikit-learn. Front Neuroinformatics.2014. https://doi.org/10.3389/fninf.2014.00014.
38. Pedregosa F, Varoquaux G, Gramfort A, Michel V, Thirion B, Grisel O, et al. Scikit-learn: Machine learning in Python. J Mach Learn Res. 2011;12:2825–30. https://www.jmlr.org/papers/volume12/pedregosa11a/pedregosa11a.pdf
39. Scott DW. On optimal and data-based histograms. Biometrika. 1979;66:605–10.https://doi.org/10.1093/biomet/66.3.605
40. Seabold S, Perktold J. Statsmodels: Econometric and statistical modeling withPython. In 9th Python in Science Conference. (SciPy, 2010).
41. Oliphant TE. Python for scientific computing. Comput Sci Eng. 2007;9:10–20.https://doi.org/10.1109/mcse.2007.58
42. Long JS, Ervin LH. Using heteroscedasticity consistent standard errors in the linearregression model. Am Stat. 2000;54:217–24. https://doi.org/10.2307/2685594
43. Oh SW, Harris JA, Ng L, Winslow B, Cain N, Mihalas S, et al. A mesoscale connectomeof the mouse brain. Nature. 2014;508:207 https://doi.org/10.1038/nature13186
44. Segessemann T, Rudin M, Ioanas H-I. Abi connectivity data package generator.(Zenodo or GitHub, 2019). https://doi.org/10.5281/zenodo.3523375.
45. Ioanas Horea-Ioan, Saab B, Rudin. M. Gentoo linux for neuroscience—a replicable,flexible, scalable, rolling-release environment that provides direct access todevelopment software. Res Ideas Outcomes. 2017;3-:e12095 https://doi.org/10.3897/rio.3.e12095
46. Ioanas H-I, Saab BJ, Rudin M. Source Code for “A Whole-Brain Map and AssayParameter Analysis of Mouse VTA Dopaminergic Activation”. (Zenodo or “Atlas-sian Bitbucket”), 2019. https://doi.org/10.5281/zenodo.3263779.
47. Gorgolewski KJ, Auer T, Calhoun VD, Craddock RC, Das S, Duff EP, et al. The brainimaging data structure, a format for organizing and describing outputs of neuroi-maging experiments. Sci Data. 2016;3:160044 https://doi.org/10.1038/sdata.2016.44
48. Ioanas H-I, Saab BJ, Rudin M. BIDS Data for “A Whole-Brain Map and AssayParameter Analysis of Mouse VTA Dopaminergic Activation”. (Zenodo, 2019).https://doi.org/10.5281/zenodo.3236930.
49. Ioanas H-I, Rudin M. Reproducible self-publishing for Python-based research.EuroSciPy. (Zenodo, 2018). https://doi.org/10.6084/m9.figshare.7247339.v1.
50. Pan WX, Mao T, Dudman JT. Inputs to the dorsal striatum of the mouse reflect theparallel circuit architecture of the forebrain. Front Neuroanat. 2010. https://doi.org/10.3389/fnana.2010.00147.
51. Benarroch EE. Periaqueductal gray: an interface for behavioral control. Neurology.2012;78:210–217. https://doi.org/10.1212/wnl.0b013e31823fcdee
52. Aransay A, Rodríguez-López C, García-Amado M, Clascá F, Prensa L. Long-rangeprojection neurons of the mouse ventral tegmental area: a single-cell axon tra-cing analysis. Front Neuroanat. 2015. https://doi.org/10.3389/fnana.2015.00059.
53. Fields HL, Hjelmstad GO, Margolis EB, Nicola. SM. Ventral tegmental area neuronsin learned appetitive behavior and positive reinforcement. Annu Rev Neurosci.2007;30:289–316. https://doi.org/10.1146/annurev.neuro.30.051606.094341
54. Ikemoto S. Dopamine reward circuitry: Two projection systems from the ventralmidbrain to the nucleus accumbens–olfactory tubercle complex. Brain Res Rev.2007;56:27–78. https://doi.org/10.1016/j.brainresrev.2007.05.004
H.-I. Ioanas et al.
9
Translational Psychiatry (2022) 12:60

55. Torres GE, Gainetdinov RR, Caron. MG. Plasma membrane monoamine trans-porters: structure, regulation and function. Nat Rev Neurosci. 2003;4:13–25.https://doi.org/10.1038/nrn1008
AUTHOR CONTRIBUTIONSHII performed the methods development, experiments, data analysis, and drafted thearticle. BJS consulted on methods development, provided materials, and reviewedthe article. MR supervised the project, provided materials, consulted on MRI methods,and reviewed and edited the article.
FUNDINGThis work was funded by the Swiss National Science Foundation grant number310030-179257, which was awarded to MR.
COMPETING INTERESTSThe authors declare no competing interests.
ADDITIONAL INFORMATIONSupplementary information The online version contains supplementary materialavailable at https://doi.org/10.1038/s41398-022-01812-5.
Correspondence and requests for materials should be addressed to Horea-IoanIoanas.
Reprints and permission information is available at http://www.nature.com/reprints
Publisher’s note Springer Nature remains neutral with regard to jurisdictional claimsin published maps and institutional affiliations.
Open Access This article is licensed under a Creative CommonsAttribution 4.0 International License, which permits use, sharing,
adaptation, distribution and reproduction in anymedium or format, as long as you giveappropriate credit to the original author(s) and the source, provide a link to the CreativeCommons license, and indicate if changes were made. The images or other third partymaterial in this article are included in the article’s Creative Commons license, unlessindicated otherwise in a credit line to the material. If material is not included in thearticle’s Creative Commons license and your intended use is not permitted by statutoryregulation or exceeds the permitted use, you will need to obtain permission directlyfrom the copyright holder. To view a copy of this license, visit http://creativecommons.org/licenses/by/4.0/.
© The Author(s) 2022
H.-I. Ioanas et al.
10
Translational Psychiatry (2022) 12:60