Investigating water/oil interfaces with opto-thermophoresis
9
ARTICLE Investigating water/oil interfaces with opto-thermophoresis Youngsun Kim 1 , Hongru Ding 2 & Yuebing Zheng 1,2 ✉ Charging of interfaces between water and hydrophobic media is a mysterious feature whose nature and origin have been under debate. Here, we investigate the fundamentals of the interfacial behaviors of water by employing opto-thermophoretic tweezers to study temperature-gradient-induced perturbation of dipole arrangement at water/oil interfaces. With surfactant-free perfluoropentane-in-water emulsions as a model interface, additional polar organic solvents are introduced to systematically modify the structural aspects of the interface. Through our experimental measurements on the thermophoretic behaviors of oil droplets under a light-generated temperature gradient, in combination with theoretical analysis, we propose that water molecules and mobile negative charges are present at the water/oil interfaces with specific dipole arrangement to hydrate oil droplets, and that this arrangement is highly susceptible to the thermal perturbation due to the mobility of the negative charges. These findings suggest a potential of opto-thermophoresis in probing aqueous interfaces and could enrich understanding of the interfacial behaviors of water. https://doi.org/10.1038/s41467-022-31546-3 OPEN 1 Materials Science and Engineering Program and Texas Materials Institute, The University of Texas at Austin, Austin, TX 78712, USA. 2 Walker Department of Mechanical Engineering, The University of Texas at Austin, Austin, TX 78712, USA. ✉ email: [email protected] NATURE COMMUNICATIONS | (2022)13:3742 | https://doi.org/10.1038/s41467-022-31546-3 | www.nature.com/naturecommunications 1 1234567890():,;
-
Upload
khangminh22 -
Category
Documents
-
view
4 -
download
0
Transcript of Investigating water/oil interfaces with opto-thermophoresis

ARTICLE
Investigating water/oil interfaces withopto-thermophoresisYoungsun Kim 1, Hongru Ding 2 & Yuebing Zheng 1,2✉
Charging of interfaces between water and hydrophobic media is a mysterious feature
whose nature and origin have been under debate. Here, we investigate the fundamentals of
the interfacial behaviors of water by employing opto-thermophoretic tweezers to study
temperature-gradient-induced perturbation of dipole arrangement at water/oil interfaces.
With surfactant-free perfluoropentane-in-water emulsions as a model interface, additional
polar organic solvents are introduced to systematically modify the structural aspects of the
interface. Through our experimental measurements on the thermophoretic behaviors of oil
droplets under a light-generated temperature gradient, in combination with theoretical
analysis, we propose that water molecules and mobile negative charges are present at the
water/oil interfaces with specific dipole arrangement to hydrate oil droplets, and that this
arrangement is highly susceptible to the thermal perturbation due to the mobility of the
negative charges. These findings suggest a potential of opto-thermophoresis in probing
aqueous interfaces and could enrich understanding of the interfacial behaviors of water.
https://doi.org/10.1038/s41467-022-31546-3 OPEN
1Materials Science and Engineering Program and Texas Materials Institute, The University of Texas at Austin, Austin, TX 78712, USA. 2Walker Departmentof Mechanical Engineering, The University of Texas at Austin, Austin, TX 78712, USA. ✉email: [email protected]
NATURE COMMUNICATIONS | (2022) 13:3742 | https://doi.org/10.1038/s41467-022-31546-3 | www.nature.com/naturecommunications 1
1234
5678
90():,;
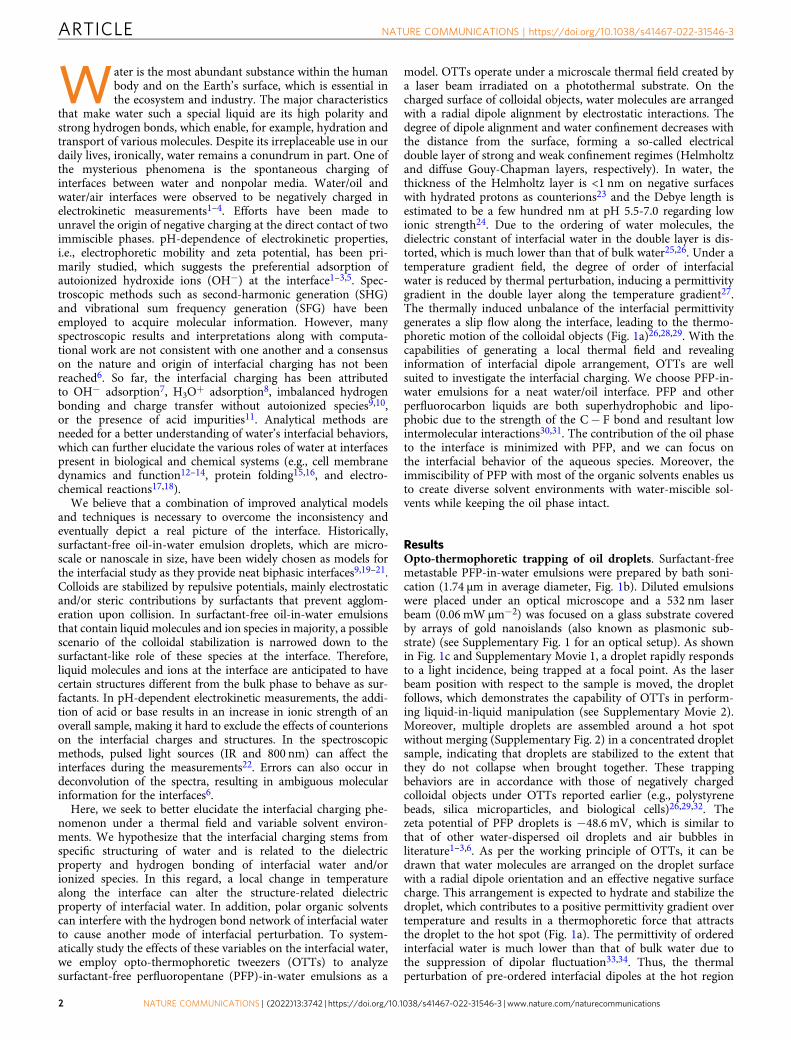
Water is the most abundant substance within the humanbody and on the Earth’s surface, which is essential inthe ecosystem and industry. The major characteristics
that make water such a special liquid are its high polarity andstrong hydrogen bonds, which enable, for example, hydration andtransport of various molecules. Despite its irreplaceable use in ourdaily lives, ironically, water remains a conundrum in part. One ofthe mysterious phenomena is the spontaneous charging ofinterfaces between water and nonpolar media. Water/oil andwater/air interfaces were observed to be negatively charged inelectrokinetic measurements1–4. Efforts have been made tounravel the origin of negative charging at the direct contact of twoimmiscible phases. pH-dependence of electrokinetic properties,i.e., electrophoretic mobility and zeta potential, has been pri-marily studied, which suggests the preferential adsorption ofautoionized hydroxide ions (OH−) at the interface1–3,5. Spec-troscopic methods such as second-harmonic generation (SHG)and vibrational sum frequency generation (SFG) have beenemployed to acquire molecular information. However, manyspectroscopic results and interpretations along with computa-tional work are not consistent with one another and a consensuson the nature and origin of interfacial charging has not beenreached6. So far, the interfacial charging has been attributedto OH− adsorption7, H3O+ adsorption8, imbalanced hydrogenbonding and charge transfer without autoionized species9,10,or the presence of acid impurities11. Analytical methods areneeded for a better understanding of water’s interfacial behaviors,which can further elucidate the various roles of water at interfacespresent in biological and chemical systems (e.g., cell membranedynamics and function12–14, protein folding15,16, and electro-chemical reactions17,18).
We believe that a combination of improved analytical modelsand techniques is necessary to overcome the inconsistency andeventually depict a real picture of the interface. Historically,surfactant-free oil-in-water emulsion droplets, which are micro-scale or nanoscale in size, have been widely chosen as models forthe interfacial study as they provide neat biphasic interfaces9,19–21.Colloids are stabilized by repulsive potentials, mainly electrostaticand/or steric contributions by surfactants that prevent agglom-eration upon collision. In surfactant-free oil-in-water emulsionsthat contain liquid molecules and ion species in majority, a possiblescenario of the colloidal stabilization is narrowed down to thesurfactant-like role of these species at the interface. Therefore,liquid molecules and ions at the interface are anticipated to havecertain structures different from the bulk phase to behave as sur-factants. In pH-dependent electrokinetic measurements, the addi-tion of acid or base results in an increase in ionic strength of anoverall sample, making it hard to exclude the effects of counterionson the interfacial charges and structures. In the spectroscopicmethods, pulsed light sources (IR and 800 nm) can affect theinterfaces during the measurements22. Errors can also occur indeconvolution of the spectra, resulting in ambiguous molecularinformation for the interfaces6.
Here, we seek to better elucidate the interfacial charging phe-nomenon under a thermal field and variable solvent environ-ments. We hypothesize that the interfacial charging stems fromspecific structuring of water and is related to the dielectricproperty and hydrogen bonding of interfacial water and/orionized species. In this regard, a local change in temperaturealong the interface can alter the structure-related dielectricproperty of interfacial water. In addition, polar organic solventscan interfere with the hydrogen bond network of interfacial waterto cause another mode of interfacial perturbation. To system-atically study the effects of these variables on the interfacial water,we employ opto-thermophoretic tweezers (OTTs) to analyzesurfactant-free perfluoropentane (PFP)-in-water emulsions as a
model. OTTs operate under a microscale thermal field created bya laser beam irradiated on a photothermal substrate. On thecharged surface of colloidal objects, water molecules are arrangedwith a radial dipole alignment by electrostatic interactions. Thedegree of dipole alignment and water confinement decreases withthe distance from the surface, forming a so-called electricaldouble layer of strong and weak confinement regimes (Helmholtzand diffuse Gouy-Chapman layers, respectively). In water, thethickness of the Helmholtz layer is <1 nm on negative surfaceswith hydrated protons as counterions23 and the Debye length isestimated to be a few hundred nm at pH 5.5-7.0 regarding lowionic strength24. Due to the ordering of water molecules, thedielectric constant of interfacial water in the double layer is dis-torted, which is much lower than that of bulk water25,26. Under atemperature gradient field, the degree of order of interfacialwater is reduced by thermal perturbation, inducing a permittivitygradient in the double layer along the temperature gradient27.The thermally induced unbalance of the interfacial permittivitygenerates a slip flow along the interface, leading to the thermo-phoretic motion of the colloidal objects (Fig. 1a)26,28,29. With thecapabilities of generating a local thermal field and revealinginformation of interfacial dipole arrangement, OTTs are wellsuited to investigate the interfacial charging. We choose PFP-in-water emulsions for a neat water/oil interface. PFP and otherperfluorocarbon liquids are both superhydrophobic and lipo-phobic due to the strength of the C− F bond and resultant lowintermolecular interactions30,31. The contribution of the oil phaseto the interface is minimized with PFP, and we can focus onthe interfacial behavior of the aqueous species. Moreover, theimmiscibility of PFP with most of the organic solvents enables usto create diverse solvent environments with water-miscible sol-vents while keeping the oil phase intact.
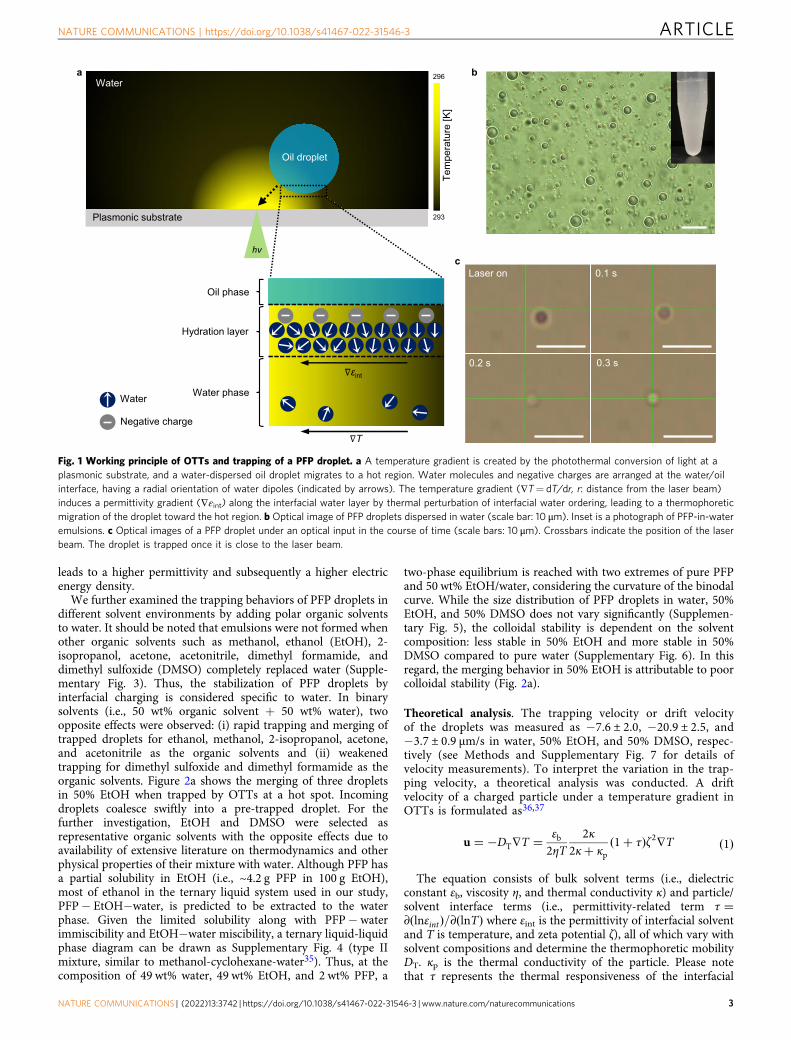
ResultsOpto-thermophoretic trapping of oil droplets. Surfactant-freemetastable PFP-in-water emulsions were prepared by bath soni-cation (1.74 µm in average diameter, Fig. 1b). Diluted emulsionswere placed under an optical microscope and a 532 nm laserbeam (0.06 mW μm−2) was focused on a glass substrate coveredby arrays of gold nanoislands (also known as plasmonic sub-strate) (see Supplementary Fig. 1 for an optical setup). As shownin Fig. 1c and Supplementary Movie 1, a droplet rapidly respondsto a light incidence, being trapped at a focal point. As the laserbeam position with respect to the sample is moved, the dropletfollows, which demonstrates the capability of OTTs in perform-ing liquid-in-liquid manipulation (see Supplementary Movie 2).Moreover, multiple droplets are assembled around a hot spotwithout merging (Supplementary Fig. 2) in a concentrated dropletsample, indicating that droplets are stabilized to the extent thatthey do not collapse when brought together. These trappingbehaviors are in accordance with those of negatively chargedcolloidal objects under OTTs reported earlier (e.g., polystyrenebeads, silica microparticles, and biological cells)26,29,32. Thezeta potential of PFP droplets is −48.6 mV, which is similar tothat of other water-dispersed oil droplets and air bubbles inliterature1–3,6. As per the working principle of OTTs, it can bedrawn that water molecules are arranged on the droplet surfacewith a radial dipole orientation and an effective negative surfacecharge. This arrangement is expected to hydrate and stabilize thedroplet, which contributes to a positive permittivity gradient overtemperature and results in a thermophoretic force that attractsthe droplet to the hot spot (Fig. 1a). The permittivity of orderedinterfacial water is much lower than that of bulk water due tothe suppression of dipolar fluctuation33,34. Thus, the thermalperturbation of pre-ordered interfacial dipoles at the hot region
ARTICLE NATURE COMMUNICATIONS | https://doi.org/10.1038/s41467-022-31546-3
2 NATURE COMMUNICATIONS | (2022) 13:3742 | https://doi.org/10.1038/s41467-022-31546-3 | www.nature.com/naturecommunications
leads to a higher permittivity and subsequently a higher electricenergy density.
We further examined the trapping behaviors of PFP droplets indifferent solvent environments by adding polar organic solventsto water. It should be noted that emulsions were not formed whenother organic solvents such as methanol, ethanol (EtOH), 2-isopropanol, acetone, acetonitrile, dimethyl formamide, anddimethyl sulfoxide (DMSO) completely replaced water (Supple-mentary Fig. 3). Thus, the stabilization of PFP droplets byinterfacial charging is considered specific to water. In binarysolvents (i.e., 50 wt% organic solvent + 50 wt% water), twoopposite effects were observed: (i) rapid trapping and merging oftrapped droplets for ethanol, methanol, 2-isopropanol, acetone,and acetonitrile as the organic solvents and (ii) weakenedtrapping for dimethyl sulfoxide and dimethyl formamide as theorganic solvents. Figure 2a shows the merging of three dropletsin 50% EtOH when trapped by OTTs at a hot spot. Incomingdroplets coalesce swiftly into a pre-trapped droplet. For thefurther investigation, EtOH and DMSO were selected asrepresentative organic solvents with the opposite effects due toavailability of extensive literature on thermodynamics and otherphysical properties of their mixture with water. Although PFP hasa partial solubility in EtOH (i.e., ~4.2 g PFP in 100 g EtOH),most of ethanol in the ternary liquid system used in our study,PFP− EtOH−water, is predicted to be extracted to the waterphase. Given the limited solubility along with PFP−waterimmiscibility and EtOH−water miscibility, a ternary liquid-liquidphase diagram can be drawn as Supplementary Fig. 4 (type IImixture, similar to methanol-cyclohexane-water35). Thus, at thecomposition of 49 wt% water, 49 wt% EtOH, and 2 wt% PFP, a
two-phase equilibrium is reached with two extremes of pure PFPand 50 wt% EtOH/water, considering the curvature of the binodalcurve. While the size distribution of PFP droplets in water, 50%EtOH, and 50% DMSO does not vary significantly (Supplemen-tary Fig. 5), the colloidal stability is dependent on the solventcomposition: less stable in 50% EtOH and more stable in 50%DMSO compared to pure water (Supplementary Fig. 6). In thisregard, the merging behavior in 50% EtOH is attributable to poorcolloidal stability (Fig. 2a).
Theoretical analysis. The trapping velocity or drift velocityof the droplets was measured as −7.6 ± 2.0, −20.9 ± 2.5, and−3.7 ± 0.9 μm/s in water, 50% EtOH, and 50% DMSO, respec-tively (see Methods and Supplementary Fig. 7 for details ofvelocity measurements). To interpret the variation in the trap-ping velocity, a theoretical analysis was conducted. A driftvelocity of a charged particle under a temperature gradient inOTTs is formulated as36,37
u ¼ �DT∇T ¼ εb2ηT
2κ2κþ κp
1þ τð Þζ2∇T ð1Þ
The equation consists of bulk solvent terms (i.e., dielectricconstant εb, viscosity η, and thermal conductivity κ) and particle/solvent interface terms (i.e., permittivity-related term τ ¼∂ðlnεintÞ=∂ðlnTÞ where εint is the permittivity of interfacial solventand T is temperature, and zeta potential ζ), all of which vary withsolvent compositions and determine the thermophoretic mobilityDT. κp is the thermal conductivity of the particle. Please notethat τ represents the thermal responsiveness of the interfacial
b
c
Tem
pera
ture
[K]
Water
Oil droplet
Negative charge
Water
a
Laser on 0.1 s
0.2 s 0.3 s
Plasmonic substrate
296
Hydration layer
int
T
Water phase
Oil phase
293
Fig. 1 Working principle of OTTs and trapping of a PFP droplet. a A temperature gradient is created by the photothermal conversion of light at aplasmonic substrate, and a water-dispersed oil droplet migrates to a hot region. Water molecules and negative charges are arranged at the water/oilinterface, having a radial orientation of water dipoles (indicated by arrows). The temperature gradient (∇T= dT/dr, r: distance from the laser beam)induces a permittivity gradient (∇εint) along the interfacial water layer by thermal perturbation of interfacial water ordering, leading to a thermophoreticmigration of the droplet toward the hot region. b Optical image of PFP droplets dispersed in water (scale bar: 10 μm). Inset is a photograph of PFP-in-wateremulsions. c Optical images of a PFP droplet under an optical input in the course of time (scale bars: 10 μm). Crossbars indicate the position of the laserbeam. The droplet is trapped once it is close to the laser beam.
NATURE COMMUNICATIONS | https://doi.org/10.1038/s41467-022-31546-3 ARTICLE
NATURE COMMUNICATIONS | (2022) 13:3742 | https://doi.org/10.1038/s41467-022-31546-3 | www.nature.com/naturecommunications 3
permittivity (i.e., the dipole alignment of interfacial solventmolecules), which is a key factor for the trapping, and has apositive value (~2) for water in an electrical double layer on thecharged particle surface27, which is different from a negative bulkcounterpart. At a higher temperature, interfacial water moleculesbecome less confined by surface charge, resulting in a higherpermittivity. Thus, εint has its maximum at the surface region ofthe droplet near the laser beam and minimum on the oppositeside. The other factors (e.g., dispersion and electric forces) thatcontribute to the thermophoresis of the charged particle areexcluded because their contributions to drift velocity are muchsmaller than the permittivity-gradient-driven force29,38,39. Thetemperature gradient ∇T was simulated using a heat transfermodel in liquid with a fixed Gaussian heat influx (see Materialsand Methods for simulation details). The heat influx was derivedfrom thermal imaging by quadriwave shearing interferometry(see Supplementary Figs. 8–10 and Supplementary Table 1 fordetails). More information on the effects of dispersion force andMarangoni flow is available in Supplementary Notes 1 and 2,Supplementary Table 2, and Supplementary Fig. 11.
As shown in Fig. 2b, c, the spatial temperature gradient isgenerated from the maximum temperature at a laser beamposition throughout a medium at room temperature. In water, its
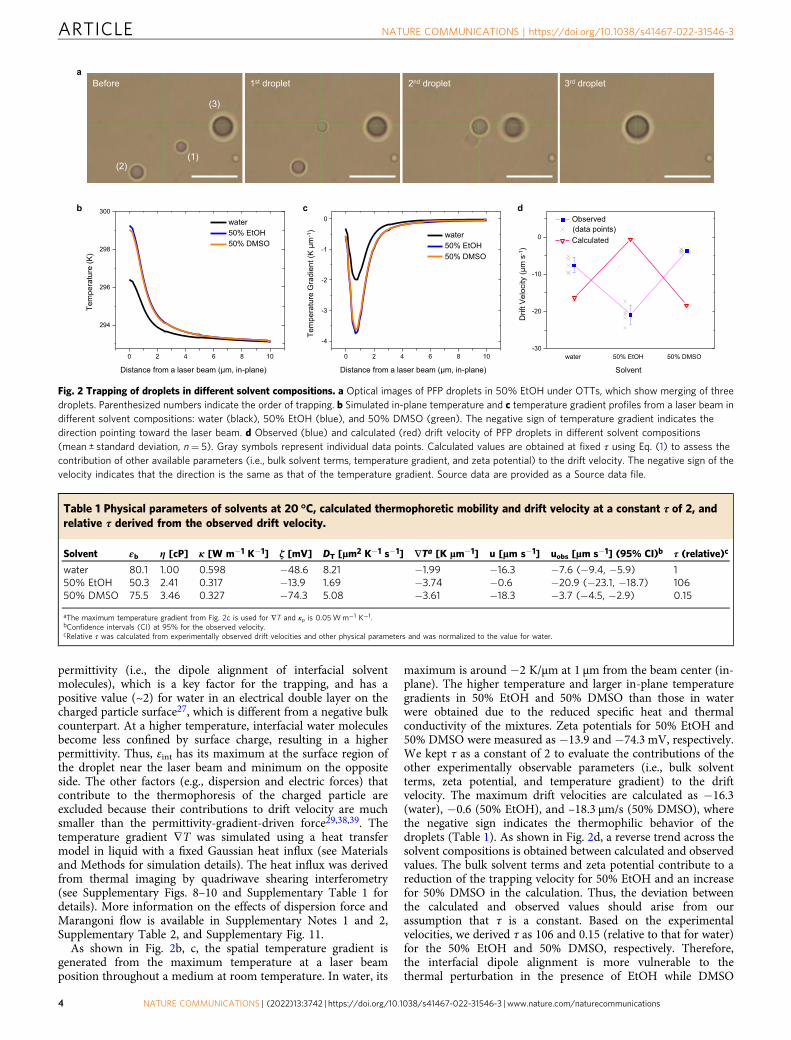
maximum is around −2 K/μm at 1 μm from the beam center (in-plane). The higher temperature and larger in-plane temperaturegradients in 50% EtOH and 50% DMSO than those in waterwere obtained due to the reduced specific heat and thermalconductivity of the mixtures. Zeta potentials for 50% EtOH and50% DMSO were measured as −13.9 and −74.3 mV, respectively.We kept τ as a constant of 2 to evaluate the contributions of theother experimentally observable parameters (i.e., bulk solventterms, zeta potential, and temperature gradient) to the driftvelocity. The maximum drift velocities are calculated as −16.3(water), −0.6 (50% EtOH), and –18.3 μm/s (50% DMSO), wherethe negative sign indicates the thermophilic behavior of thedroplets (Table 1). As shown in Fig. 2d, a reverse trend across thesolvent compositions is obtained between calculated and observedvalues. The bulk solvent terms and zeta potential contribute to areduction of the trapping velocity for 50% EtOH and an increasefor 50% DMSO in the calculation. Thus, the deviation betweenthe calculated and observed values should arise from ourassumption that τ is a constant. Based on the experimentalvelocities, we derived τ as 106 and 0.15 (relative to that for water)for the 50% EtOH and 50% DMSO, respectively. Therefore,the interfacial dipole alignment is more vulnerable to thethermal perturbation in the presence of EtOH while DMSO
Table 1 Physical parameters of solvents at 20 °C, calculated thermophoretic mobility and drift velocity at a constant τ of 2, andrelative τ derived from the observed drift velocity.
Solvent εb η [cP] κ [W m−1 K−1] ζ [mV] DT [µm2 K−1 s−1] ∇Ta [K µm−1] u [µm s−1] uobs [µm s−1] (95% CI)b τ (relative)c
water 80.1 1.00 0.598 −48.6 8.21 −1.99 −16.3 −7.6 (−9.4, −5.9) 150% EtOH 50.3 2.41 0.317 −13.9 1.69 −3.74 −0.6 −20.9 (−23.1, −18.7) 10650% DMSO 75.5 3.46 0.327 −74.3 5.08 −3.61 −18.3 −3.7 (−4.5, −2.9) 0.15
aThe maximum temperature gradient from Fig. 2c is used for ∇T and κp is 0.05Wm−1 K−1.bConfidence intervals (CI) at 95% for the observed velocity.cRelative τ was calculated from experimentally observed drift velocities and other physical parameters and was normalized to the value for water.
aBefore 1st droplet 2nd droplet 3rd droplet
(1)(2)
(3)
0 2 4 6 8 10
294
296
298
300
)K(erutarep
meT
Distance from a laser beam (µm, in-plane)
water50% EtOH50% DMSO
0 2 4 6 8 10
-4
-3
-2
-1
0
Tem
pera
ture
Gra
dien
t (K
µm-1
)
Distance from a laser beam (µm, in-plane)
water50% EtOH50% DMSO
water 50% EtOH 50% DMSO-30
-20
-10
0
Observed
Calculated
Drif
t Vel
ocity
(µm
s-1
)
Solvent
(data points)
b c d
Fig. 2 Trapping of droplets in different solvent compositions. a Optical images of PFP droplets in 50% EtOH under OTTs, which show merging of threedroplets. Parenthesized numbers indicate the order of trapping. b Simulated in-plane temperature and c temperature gradient profiles from a laser beam indifferent solvent compositions: water (black), 50% EtOH (blue), and 50% DMSO (green). The negative sign of temperature gradient indicates thedirection pointing toward the laser beam. d Observed (blue) and calculated (red) drift velocity of PFP droplets in different solvent compositions(mean ± standard deviation, n= 5). Gray symbols represent individual data points. Calculated values are obtained at fixed τ using Eq. (1) to assess thecontribution of other available parameters (i.e., bulk solvent terms, temperature gradient, and zeta potential) to the drift velocity. The negative sign of thevelocity indicates that the direction is the same as that of the temperature gradient. Source data are provided as a Source data file.
ARTICLE NATURE COMMUNICATIONS | https://doi.org/10.1038/s41467-022-31546-3
4 NATURE COMMUNICATIONS | (2022) 13:3742 | https://doi.org/10.1038/s41467-022-31546-3 | www.nature.com/naturecommunications
makes a rather rigid interfacial structure, compared to a purewater environment.
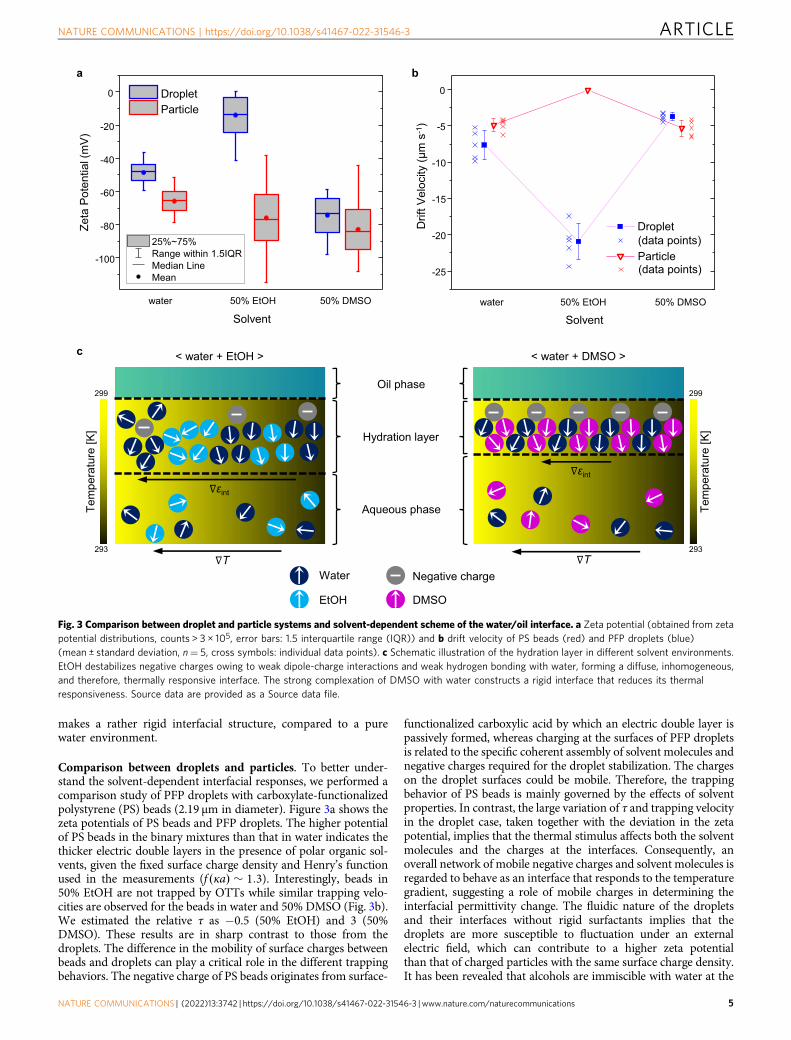
Comparison between droplets and particles. To better under-stand the solvent-dependent interfacial responses, we performed acomparison study of PFP droplets with carboxylate-functionalizedpolystyrene (PS) beads (2.19 μm in diameter). Figure 3a shows thezeta potentials of PS beads and PFP droplets. The higher potentialof PS beads in the binary mixtures than that in water indicates thethicker electric double layers in the presence of polar organic sol-vents, given the fixed surface charge density and Henry’s functionused in the measurements (f κað Þ � 1:3). Interestingly, beads in50% EtOH are not trapped by OTTs while similar trapping velo-cities are observed for the beads in water and 50% DMSO (Fig. 3b).We estimated the relative τ as −0.5 (50% EtOH) and 3 (50%DMSO). These results are in sharp contrast to those from thedroplets. The difference in the mobility of surface charges betweenbeads and droplets can play a critical role in the different trappingbehaviors. The negative charge of PS beads originates from surface-
functionalized carboxylic acid by which an electric double layer ispassively formed, whereas charging at the surfaces of PFP dropletsis related to the specific coherent assembly of solvent molecules andnegative charges required for the droplet stabilization. The chargeson the droplet surfaces could be mobile. Therefore, the trappingbehavior of PS beads is mainly governed by the effects of solventproperties. In contrast, the large variation of τ and trapping velocityin the droplet case, taken together with the deviation in the zetapotential, implies that the thermal stimulus affects both the solventmolecules and the charges at the interfaces. Consequently, anoverall network of mobile negative charges and solvent molecules isregarded to behave as an interface that responds to the temperaturegradient, suggesting a role of mobile charges in determining theinterfacial permittivity change. The fluidic nature of the dropletsand their interfaces without rigid surfactants implies that thedroplets are more susceptible to fluctuation under an externalelectric field, which can contribute to a higher zeta potentialthan that of charged particles with the same surface charge density.It has been revealed that alcohols are immiscible with water at the
-100
-80
-60
-40
-20
0
Solvent
)Vm(laitne toP
ateZDropletParticle
water 50% EtOH 50% DMSO
-25
-20
-15
-10
-5
0
DropletDrif
t Vel
ocity
(µm
s- 1
)
water 50% DMSO
Particle
Solvent
(data points)
(data points)
50% EtOH
25%~75%Range within 1.5IQRMedian LineMean
Hydration layer
Aqueous phase
Oil phase
< water + EtOH > < water + DMSO >
int
T
int
T
]K[erutarep
meT
299
293
Tem
pera
ture
[K]
299
293
DMSO
Water
EtOH
Negative charge
a b
c
Fig. 3 Comparison between droplet and particle systems and solvent-dependent scheme of the water/oil interface. a Zeta potential (obtained from zetapotential distributions, counts > 3 × 10⁵, error bars: 1.5 interquartile range (IQR)) and b drift velocity of PS beads (red) and PFP droplets (blue)(mean ± standard deviation, n= 5, cross symbols: individual data points). c Schematic illustration of the hydration layer in different solvent environments.EtOH destabilizes negative charges owing to weak dipole-charge interactions and weak hydrogen bonding with water, forming a diffuse, inhomogeneous,and therefore, thermally responsive interface. The strong complexation of DMSO with water constructs a rigid interface that reduces its thermalresponsiveness. Source data are provided as a Source data file.
NATURE COMMUNICATIONS | https://doi.org/10.1038/s41467-022-31546-3 ARTICLE
NATURE COMMUNICATIONS | (2022) 13:3742 | https://doi.org/10.1038/s41467-022-31546-3 | www.nature.com/naturecommunications 5
microscale regime, forming separate clusters of water and alcoholthat are responsible for their abnormally small mixing entropy40.For the PS bead case, the interfacial dipole arrangement at theinterface is originally disordered to some extent in the presence ofEtOH molecules due to intercalated EtOH domains and lessaccessible charge-dipole interactions, resulting in the higher per-mittivity of interfacial solvent molecules than that of pure inter-facial water34. Under the temperature gradient, molecules at the hotregion have a higher degree of freedom to be aligned with the fixedcharges on the bead surface, resulting in the negative sign of τ,which is like the temperature–permittivity relationship of a bulkliquid. However, on the droplet surface, mobile charges can movearound to form dipole–charge complexes with water moleculesregardless of environment, thus providing a dipole-orientedinterface. The external heat perturbs both charges and solventmolecules and, consequently, an overall dipole orientation becomesrandomized at the hot region, leading to the thermophilic behaviorof droplets. As depicted in Fig. 3c for the 50% EtOH case, theseinterfacial charges are destabilized due to their weak interactionswith EtOH and a lack of a homogeneous, tightly bound hydrogenbonding network, leading to the large permittivity gradient overtemperature. On the other hand, DMSO can form strong com-plexes with water41,42, which is also evidenced by their highlyexothermic mixing. This strong interaction leads to a highlyordered dipole alignment around the charged bead surface wherethe thermal stimulus indues the entropy-driven permittivity gra-dient. In contact with the PFP droplet, however, DMSO and watermolecules construct a rigid interface with mobile charges optimallydistributed to have a much strongly bound network, leading to theweak responsiveness of the droplet to a thermal field due to theinhibited mobility of the charges. We conclude that, rather thanspecific adsorption of negative charges on a PFP droplet, theinterfacial charging can be attributed to the formation of mobile-charge–solvent networks, which spontaneously occurs to hydrate ahydrophobic surface.
DiscussionThe identity of negative ion species that are responsible forinterfacial charging is still in question. Among autoionized spe-cies (H3O+ and OH−), OH− might be a favorable networkcomponent as it has a more π-hydrogen bonding character thanH3O+, which further strengthens the charge–dipole networkthrough hydrogen bonds to hydrogens of water in addition to thecharge–dipole electrostatic interaction. It has been revealed thatOH− (one O site) accepts more than three H-bonds from waterwhile H3O+ (three H sites) donates three H-bonds to water (c.f.,the total coordination number of three in the ideal tetrahedralcoordination for the O site of OH− and H sites of H3O+)43–45.This implies that OH− accommodates more water molecules thanH3O+ does upon hydration, and we attribute this hypercoordi-nation of hydroxide ions with water to the π-hydrogen bondingcharacteristic of OH−. The concept of amphiphilicity of OH− andH3O+ can be also considered43. The O site of OH−, which ishypercoordinated with water, can be regarded as a hydrophilicpart with the H site of OH− as a hydrophobic part. For H3O+,three H sites and one O site correspond to hydrophilic andhydrophobic parts, respectively. Taken altogether, OH− accom-modates more water molecules than H3O+ and resultant hyper-coordination makes OH− preferential amphiphilic species thatoccupy water/oil interfaces.
Another possibility for the negative interface comes withbicarbonate ions (HCO3
−). Atmospheric carbon dioxide dissolvesin water, producing carbonate ion species, mostly HCO3
− belowpH 7. The critical contribution of HCO3
− to the chargingof surfactant-free oil-in-water emulsions has been reported46,47.
Given the oxygen-rich resonance structure of HCO3−, it is a good
candidate for the ionic amphiphile at the interface. The hyper-coordination of water molecules to the O sites of HCO3
− ispredicted due to its π-bonding characteristic, thus having a highlyhydrophilic oxygen-rich region with a relatively hydrophobic Hsite that points toward the oil phase. It is worth noting thatperfluorocarbon liquid has a significantly high gas solubility thanother classes of liquid. Even though our system contains only1 vol% of PFP, the reaction of CO2 contained in PFP with watercan occur at the interface during emulsification, which results inthe interfacial enrichment of HCO3
−.It is also noteworthy that surface-active impurities could be
responsible for interfacial charging. A possibility that fatty acids inhydrocarbon oils behave as surfactants at water/oil interfaceswas suggested11 although there have been debates on it48–50.To examine the impurity effect, we conducted a comparison studyin which distilled solvents were used. Most surface-active specieswould be charged species like acids. The boiling point of acids,when compared to that of organic compounds or perfluorocarbonswith the same number of carbons, is much higher (e.g., 118 °C foracetic acid vs. 78 °C for ethanol and 140 °C for perfluoropentanoicacid vs. 29 °C for perfluoropentane). Thus, we rationalized that anyacid impurities would be remarkably removed by distillation.Moreover, as perfluorocarbons are more chemically and thermallystable than hydrocarbon counterparts, it is less likely that impu-rities are generated in perfluorocarbon upon storage. PFP, ethanoland DMSO (vacuum applied) were distilled, and the first quarter ofdistillate was used. As shown in Supplementary Fig. 12, there is nodistinct change in the drift velocity with the distilled solvents. Ifimpurities were the major source of the interfacial charge, thereduced concentration of impurities in the distilled solvents wouldhave affected the thermophoretic velocity to certain extent.Therefore, the arrangement of ionic species and water moleculesmight be the major sources of the interfacial charging and opto-thermophoresis although it would be practically impossible toprepare perfectly clean interfaces.
Some of the previous spectroscopic studies concluded that theinterfacial charging arose from the asymmetry or imbalance ofhydrogen bonds and the charge transfer from hydrogen bondacceptors to donors without inclusion of autoionized species9,10.However, the addition of DMSO might enhance the differencebetween hydrogen bond acceptors and donors as DMSO onlyserves as acceptors and result in less interfacial charges, which isinconsistent with our results on the DMSO–water binary mixture.Therefore, according to our studies, the presence of mobilenegative charges and their strong anchoring with water moleculesby cooperative electrostatic and hydrogen bonding interactions isa more likely scenario for the hydration of oil droplets, which isalso suggested in a tetraphenylborate–water model13. Moreover,the hydrogen atoms of water in dangling hydrogen bonds, whichpoint toward hydrophobic surfaces16,51,52, can be attributed tothe existence of mobile negative charges near the droplet surfacesas proposed in our model.
To further investigate the scenario with OH−, moleculardynamics simulations for the density profile of OH− at interfacesbetween PFP and three different aqueous phases were carried out(see Supplementary Note 3). As shown in Supplementary Fig. 13,OH− ions are distributed near the PFP phase in all three systems.The relative peak density of OH− is 50% DMSO > water > 50%EtOH and a relatively diffuse distribution of OH− is observedwith 50% EtOH, implying a stronger interfacial confinement ofOH− at the PFP/50% DMSO and a weaker confinement of OH−
in PFP/50% EtOH. The degree of the interfacial OH− confine-ment can be correlated with the stabilization strength of OH− bysolvent molecules and furthermore the rigidness of interfacemade of ion-solvent complexes. These results are consistent with
ARTICLE NATURE COMMUNICATIONS | https://doi.org/10.1038/s41467-022-31546-3
6 NATURE COMMUNICATIONS | (2022) 13:3742 | https://doi.org/10.1038/s41467-022-31546-3 | www.nature.com/naturecommunications
our opto-thermophoresis-based interpretations of the relation-ship between the thermal response of permittivity and interfacialstructures.
On the other hand, the interfacial tension at liquid-liquidinterfaces can be considered to understand the interfacial char-ging phenomenon. The interfacial tension between water and PFPis reported as 53.9 mN/m at 293.15 K53. The interfacial tensionfor PFP/50% EtOH and PFP/50% DMSO was estimated from thefollowing equations that account for dispersion and polar com-
ponents of surface tension (γd and γp, respectively)54,55, γA=B ¼γA þ γB � 2
ffiffiffiffiffiffiffiffiffiffi
γdAγdB
q
� 2ffiffiffiffiffiffiffiffiffiffi
γpAγpB
p
and γA ¼ γdA þ γpA, whereγA=B; γA;and γB are interfacial tension between A and B, surfacetension of A and B, respectively (see Supplementary Table 3 fordetails of calculated values). The obtained interfacial tensions forPFP/50% EtOH and PFP/50% DMSO are 16.9 and 31.7 mN/m,respectively. The interfacial tension can be regarded as a drivingforce for the interfacial accumulation of surfactant-like species56,which are the complexes of negative ions and solvent molecules inour systems. The remarkedly low interface tension between PFPand 50% EtOH implies less accumulation of the interfacial spe-cies. Along with the microscopic phase segregation of EtOH andwater, this may contribute to the diffuse and fragile interface thatresults in the poor colloidal stability, low zeta potential, andstrong opto-thermophoresis. The PFP/50% DMSO interfaceexhibits relatively high interfacial tension (which is still lowerthan that of PFP/water), thus promoting ions and molecules to beaccumulated at the interface. Upon the accumulation, strongDMSO−water complexes can be locally formulated around thedroplet, which strengthen the interfacial structure (i.e., rigidinterface). We attribute this to the high colloidal stability, highzeta potential, and low thermal sensitivity of droplets in water-DMSO than in water, despite the calculated lower interfacialtension for PFP/50% DMSO. The effect of microscopic interac-tions between solvent molecules, especially between water andDMSO, could be more predominant in the hydration of micro-scale droplets than in bulk contact. Therefore, the actual inter-facial tension for microscale droplets is predicted to be lowered,compared to the above-obtained values for the bulk contact.
In summary, probing the oil-water interfaces under a thermalfield using OTTs provides a complementary perspective, in termsof thermal responsiveness of the interfaces and subsequentdipole arrangement of water and charge, on the long-standingmystery of water’s interfacial charging phenomena. Our analyseson the thermophoretic behavior of oil droplets in the differentsolvent compositions suggest that water and mobile ion speciesform interfacial layers at specific dipole arrangement to stabilizethe hydrophobic matters. These opto-thermophoretic analysescan be extended to other oil materials such as n-alkanes andmore polar oils to study contributions of oils to interfacialstructures (e.g., the effects of their polarity and intermolecularinteractions)3. This work is limited in directly identifying ionicspecies and their complexation with water, thus calling for thefurther studies in which opto-thermophoresis is combined withspectroscopic and computational techniques to elucidate thephenomena pertinent to interfacial behaviors of water. In addi-tion, the capability of manipulating, assembling, and mergingdroplets in liquids will allow a wider range of applications ofOTTs, including controllable microreactors57,58 and reconfi-gurable microfluidics59.
MethodsMaterials and sample preparation. Deionized water was obtained from a Milli-Qwater purification system (Millipore, Bedford, MA, USA). The pH and conductivityof water in the experiments were measured as ~6.7 and ~0.2 µS/cm, respectively.Perfluoropentane (PFP, 99.0%, FluoroMed, L.P.), ethanol (EtOH, ≥99.5%,
Millipore Sigma) and dimethyl sulfoxide (DMSO, 99.9%, Fisher Chemical) wereused as received. Carboxylate-functionalized polystyrene (PS) beads (2.19 µm,cross-linked, 2% divinylbenzene) were purchased from Bangs Laboratories, Inc.Surfactant-free PFP-in-water emulsions were prepared by sonicating a mixture ofPFP and water (1:99, v/v) in a bath sonicator (Branson 2800, 40 kHz) for 10 sec60.Emulsions in binary solvents (50 wt%) were prepared at the same volume ratio.Gold nanoislanlds (Au NIs) substrates were prepared by thermally depositing4.5 nm gold thin films on glass slides (Denton thermal evaporator, bar pressure:1 × 10⁻⁵ Torr) followed by thermal annealing in a box furnace (Lindberg Blue M,Thermo Fischer Scientific) at 550 °C for 2 h61.
The zeta potential of emulsions was recorded by the dynamic light scattering(DLS) method with a 633 nm laser in a backscattering mode (Zetasizer Nano ZSand Zetasizer software v7.18, Malvern Instruments). Samples were loaded into afolded capillary cell, and the temperature was set at 20 °C (120 min of equilibrationtime). Henry’s function f κað Þ � 1:3 (κ�1: Debye length and a: particle radius) wasused. For the binary solvent mixtures, the following dispersant properties wereused: 2.41 mPa s (viscosity), 1.362 (refractive index), 50.3 (dielectric constant) for50% EtOH, and 3.46 mPa s (viscosity), 1.407 (refractive index), 75.5 (dielectricconstant) for 50% DMSO.
Optical setup. An inverted microscope (Nikon Ti-E) with a 100x oil objective(NA 1.3, Nikon) was used. A 532 nm laser (Genesis MX STM-1 W, Coherent)beam was expanded by a 5x beam expander (GBE05-A, Thorlabs) and focusedonto a substrate stage. A notch filter (533 nm) was placed between the objectiveand CCD to block the incident laser beam and images were obtained through acolor charge-coupled device (CCD, Nikon). White light was directed from thetop of the stage for bright-field imaging. Emulsion samples were loaded onto theplasmonic substrate with a cylindrical spacer (100 μm in height), which wascovered by a cover slip to minimize the evaporation of solvent during experi-ments (Supplementary Fig. 1).
Measurement of trapping velocity. Trapping of a single PFP droplet wasrecorded with a CCD camera (100 ms exposure time). The trajectory of the dropletwas measured at each frame (1 frame= 0.1 s) and the velocity was derived from alinear region of the trajectory (Supplementary Fig. 7).
Temperature measurements. Microscale temperature profiles were obtainedthrough thermal imaging by quadriwave shearing interferometry (TIQSI)62. Athermal imaging camera (SID4-HR, Phasics) was coupled to an inverted micro-scope (Nikon Ti-E) with a 100x oil objective (NA 1.3, Nikon). Water was used as amedium and thermal imaging was recorded through a SIDFTHERMO software(Phasics). Since it was not possible to directly obtain the temperature profile at lowoptical power used in the trapping studies, temperatures at higher optical powerwere first measured (Supplementary Fig. 8), then the temperature profile at theworking power was calculated using linear extrapolation from a maximumtemperature–optical power curve with the fixed width from measurements (Sup-plementary Fig. 9).
Simulation of temperature profiles. A finite-element solver (COMSOLMultiphysics) was used to simulate temperature profiles. Cross-sectional geo-metry of a 10 μm × 10 μm water domain was constructed. Gaussian heat influx(~A exp [−2r2/ω2]) was set to coincide with the derived temperature profilefrom Supplementary Fig. 9 and coupled to heat transfer in water. For binarysolvents (50% EtOH and DMSO), temperature-dependent functions of heatcapacity at constant pressure, Cp and thermal conductivity, κ were derived fromliterature63–65 (Supplementary Table 1) and used along with the fixed heat influxobtained in water.
Data availabilityThe data supporting the findings of this study are available within the article andits Supplementary Information files as well as Source Data. Any other data relevant tothis study are available from the corresponding author upon request. Source data areprovided with this paper.
Received: 3 November 2021; Accepted: 20 June 2022;
References1. Marinova, K. G. et al. Charging of oil-water interfaces due to spontaneous
adsorption of hydroxyl ions. Langmuir 12, 2045–2051 (1996).2. Takahashi, M. ζ Potential of microbubbles in aqueous solutions: electrical
properties of the gas−water interface. J. Phys. Chem. B 109, 21858–21864(2005).
NATURE COMMUNICATIONS | https://doi.org/10.1038/s41467-022-31546-3 ARTICLE
NATURE COMMUNICATIONS | (2022) 13:3742 | https://doi.org/10.1038/s41467-022-31546-3 | www.nature.com/naturecommunications 7
3. Creux, P., Lachaise, J., Graciaa, A., Beattie, J. K. & Djerdjev, A. M. Strongspecific hydroxide ion binding at the pristine oil/water and air/waterinterfaces. J. Phys. Chem. B 113, 14146–14150 (2009).
4. Jungwirth, P. Spiers memorial lecture: ions at aqueous interfaces. FaradayDiscuss 141, 9–30 (2008).
5. Zimmermann, R., Freudenberg, U., Schweiß, R., Küttner, D. & Werner, C.Hydroxide and hydronium ion adsorption — a survey. Curr. Opin. ColloidInterface Sci. 15, 196–202 (2010).
6. Agmon, N. et al. Protons and hydroxide ions in aqueous systems. Chem. Rev.116, 7642–7672 (2016).
7. Fang, H. et al. Evidence of the adsorption of hydroxide ion at hexadecane/water interface from second harmonic generation study. RSC Adv. 5,23578–23585 (2015).
8. Petersen, P. B. & Saykally, R. J. Evidence for an enhanced hydroniumconcentration at the liquid water surface. J. Phys. Chem. B 109, 7976–7980(2005).
9. Vaécha, R. et al. The orientation and charge of water at the hydrophobic oildroplet - Water interface. J. Am. Chem. Soc. 133, 10204–10210 (2011).
10. Vácha, R. et al. Charge transfer between water molecules as the possible originof the observed charging at the surface of pure water. J. Phys. Chem. Lett. 3,107–111 (2012).
11. Roger, K. & Cabane, B. Why are hydrophobic/water interfaces negativelycharged? Angew. Chem. Int. Ed. 51, 5625–5628 (2012).
12. Ball, P. Water as an active constituent in cell biology. Chem. Rev. 108, 74–108(2008).
13. Scheu, R. et al. Charge asymmetry at aqueous hydrophobic interfaces andhydration shells. Angew. Chem. Int. Ed. 126, 9714–9717 (2014).
14. Cheng, C. Y., Varkey, J., Ambroso, M. R., Langen, R. & Han, S. Hydrationdynamics as an intrinsic ruler for refining protein structure at lipid membraneinterfaces. Proc. Natl Acad. Sci. USA 110, 16838–16843 (2013).
15. Levy, Y. & Onuchic, J. N. Water mediation in protein folding and molecularrecognition. Annu. Rev. Biophys. Biomol. Struct. 35, 389–415 (2006).
16. Grdadolnik, J., Merzel, F. & Avbelj, F. Origin of hydrophobicity and enhancedwater hydrogen bond strength near purely hydrophobic solutes. Proc. NatlAcad. Sci. USA 114, 322–327 (2017).
17. Schwierz, N. et al. Hydrogen and electric power generation from liquidmicrojets: Design principles for optimizing conversion efficiency. J. Phys.Chem. C. 120, 14513–14521 (2016).
18. Li, C. Y. et al. In situ probing electrified interfacial water structures atatomically flat surfaces. Nat. Mater. 18, 697–701 (2019).
19. Beattie, J. K. & Djerdjev, A. M. The pristine oil/water interface: Surfactant-freehydroxide-charged emulsions. Angew. Chem. Int. Ed. 43, 3568–3571 (2004).
20. Eastoe, J. & Ellis, C. De-gassed water and surfactant-free emulsions: History,controversy, and possible applications. Adv. Colloid Interface Sci. 134–135,89–95 (2007).
21. Sakai, T. Surfactant-free emulsions. Curr. Opin. Colloid Interface Sci. 13,228–235 (2008).
22. Backus, E. H. G., Bonn, D., Cantin, S., Roke, S. & Bonn, M. Laser-heating-induced displacement of surfactants on the water surface. J. Phys. Chem. B116, 2703–2712 (2012).
23. Brüesch, P. & Christen, T. The electric double layer at a metal electrode inpure water. J. Appl. Phys. 95, 2846–2856 (2004).
24. Moon, J. K., Jeong, J., Lee, D. & Pak, H. K. Electrical power generation bymechanically modulating electrical double layers. Nat. Commun. 4, 4–9(2013).
25. Bockris, J. O. M., Devanathan, M. A. V. & Muller, K. On the structure ofcharged interfaces. Proc. R. Soc. Lond. Ser. A. Math. Phys. Sci. 274, 55–79(1963).
26. Lin, L. et al. Interfacial-entropy-driven thermophoretic tweezers. Lab Chip 17,3061–3070 (2017).
27. Derjaguin, B. V., Churaev, N. V. & Muller, V. M. Surface Forces. (Springer,1987). https://doi.org/10.1007/978-1-4757-6639-4.
28. Lin, L. et al. Thermophoretic tweezers for low-power and versatilemanipulation of biological cells. ACS Nano 11, 3147–3154 (2017).
29. Peng, X. et al. Optothermophoretic manipulation of colloidal particles innonionic liquids. J. Phys. Chem. C. 122, 24226–24234 (2018).
30. Dalvi, V. H. & Rossky, P. J. Molecular origins of fluorocarbon hydrophobicity.Proc. Natl Acad. Sci. USA 107, 13603–13607 (2010).
31. Krafft, M. P. & Riess, J. G. Perfluorocarbons: life sciences and biomedical uses.J. Polym. Sci. Part A Polym. Chem. 45, 1185–1198 (2007).
32. Lin, L., Hill, E. H., Peng, X. & Zheng, Y. Optothermal manipulations ofcolloidal particles and living cells. Acc. Chem. Res. 51, 1465–1474 (2018).
33. Fumagalli, L. et al. Anomalously low dielectric constant of confined water.Science 360, 1339–1342 (2018).
34. Qi, C., Zhu, Z., Wang, C. & Zheng, Y. Anomalously low dielectric constant ofordered interfacial water. J. Phys. Chem. Lett. 12, 931–937 (2021).
35. Binous, H. & Bellagi, A. Calculation of ternary liquid‐liquid equilibrium datausing arc‐length continuation. Eng. Rep. 3, e12296 (2021).
36. Putnam, S. A., Cahill, D. G. & Wong, G. C. L. Temperature dependence ofthermodiffusion in aqueous suspensions of charged nanoparticles. Langmuir23, 9221–9228 (2007).
37. Anderson, J. Colloid transport by interfacial forces. Annu. Rev. Fluid Mech. 21,61–99 (1989).
38. Uppalapati, M., Huang, Y. M., Jackson, T. N. & Hancock, W. O. Microtubulealignment and manipulation using AC electrokinetics. Small 4, 1371–1381(2008).
39. Liu, S., Lin, L. & Sun, H. B. Opto-thermophoretic manipulation. ACS Nano 15,5925–5943 (2021).
40. Guo, J. H. et al. Molecular structure of alcohol-water mixtures. Phys. Rev. Lett.91, 1–4 (2003).
41. Oh, K.-I., Rajesh, K., Stanton, J. F. & Baiz, C. R. Quantifying hydrogen-bondpopulations in dimethyl sulfoxide/water mixtures. Angew. Chem. Int. Ed. 129,11533–11537 (2017).
42. Oh, K. I. & Baiz, C. R. Crowding stabilizes DMSO-water hydrogen-bondinginteractions. J. Phys. Chem. B 122, 5984–5990 (2018).
43. Chen, M. et al. Hydroxide diffuses slower than hydronium in water because itssolvated structure inhibits correlated proton transfer. Nat. Chem. 10, 413–419(2018).
44. Mundy, C. J., Kuo, I. F. W., Tuckerman, M. E., Lee, H. S. & Tobias, D. J.Hydroxide anion at the air-water interface. Chem. Phys. Lett. 481, 2–8 (2009).
45. Payaka, A., Yotmanee, P. & Tongraar, A. Characteristics of the‘hypercoordination’ of hydroxide (OH -) in water: a comparative study of HF/MM and B3LYP/MM MD simulations. J. Mol. Liq. 188, 89–95 (2013).
46. Yan, X. et al. Central role of bicarbonate anions in charging water/hydrophobic interfaces. J. Phys. Chem. Lett. 9, 96–103 (2018).
47. Yan, X., Stocco, A., Bernard, J. & Ganachaud, F. Freeze/thaw-induced carbondioxide trapping promotes emulsification of oil in water. J. Phys. Chem. Lett. 9,5998–6002 (2018).
48. Jena, K. C., Scheu, R. & Roke, S. Surface impurities are not responsible for thecharge on the oil/water interface: a comment. Angew. Chem. Int. Ed. 51,12938–12940 (2012).
49. Beattie, J. K. & Gray-Weale, A. Oil/water interface charged by hydroxide ionsand deprotonated fatty acids: a comment. Angew. Chem. Int. Ed. 124,13115–13116 (2012).
50. Roger, K. & Cabane, B. Uncontaminated hydrophobic/water interfaces areuncharged: a reply. Angew. Chem. Int. Ed. 51, 12943–12945 (2012).
51. Hölzl, C. & Horinek, D. Pressure increases the ice-like order ofwater at hydrophobic interfaces. Phys. Chem. Chem. Phys. 20, 21257–21261(2018).
52. Scatena, L. F., Brown, M. G. & Richmond, G. L. Water at hydrophobicsurfaces: weak hydrogen bonding and strong orientation effects. Science 292,908–912 (2001).
53. Morgado, P., Gaspar, J. & Filipe, E. J. M. Liquid–liquid interfaces:Water–perfluoroalkanes and water–perfluoroalkylalkanes, experimentalinterfacial tensions and molecular simulation. J. Mol. Liq. 312, 113385(2020).
54. Binks, B. P. & Clint, J. H. Solid wettability from surface energy components:Relevance to pickering emulsions. Langmuir 18, 1270–1273 (2002).
55. Fowkes, F. M. Additivity of intermolecular forces at interfaces. I.Determination of the contribution to surface and interfacial tensionsof dispersion forces in various liquids 1. J. Phys. Chem. 67, 2538–2541(1963).
56. Bergfreund, J., Bertsch, P. & Fischer, P. Effect of the hydrophobic phase oninterfacial phenomena of surfactants, proteins, and particles at fluid interfaces.Curr. Opin. Colloid Interface Sci. 56, 101509 (2021).
57. Yang, Z., Wei, J., Sobolev, Y. I. & Grzybowski, B. A. Systems of mechanizedand reactive droplets powered by multi-responsive surfactants. Nature 553,313–318 (2018).
58. Lhee, S. M. et al. Spatial localization of charged molecules by salt ions in oil-confined water microdroplets. Sci. Adv. 6, 1–10 (2020).
59. Feng, W. et al. Harnessing liquid-in-liquid printing and micropatternedsubstrates to fabricate 3-dimensional all-liquid fluidic devices. Nat. Commun.10, 1–9 (2019).
60. Kim, Y., Ding, H. & Zheng, Y. Enhancing surface capture and sensing ofproteins with low-power optothermal bubbles in a biphasic liquid. Nano Lett.20, 7020–7027 (2020).
61. Lin, L. et al. Opto-thermoelectric nanotweezers. Nat. Photonics 12, 195–201(2018).
62. Baffou, G. et al. Thermal imaging of nanostructures by quantitative opticalphase analysis. ACS Nano 6, 2452–2458 (2012).
63. Åke Melinder. Thermophysical properties of aqueous solutions used assecondary working fluids. (KTH Royal Institute of Technology, 2007).
64. Checoni, R. F. & Volpe, P. L. O. Measurements of the molar heat capacitiesand excess molar heat capacities for water + organic solvents mixtures at288.15 K to 303.15 K and atmospheric pressure. J. Solut. Chem. 39, 259–276(2010).
ARTICLE NATURE COMMUNICATIONS | https://doi.org/10.1038/s41467-022-31546-3
8 NATURE COMMUNICATIONS | (2022) 13:3742 | https://doi.org/10.1038/s41467-022-31546-3 | www.nature.com/naturecommunications
65. Zhou, J.-C., Che, Y.-Y., Wu, K.-J., Shen, J. & He, C.-H. Thermal conductivityof DMSO + C2H5OH, DMSO + H2O, and DMSO + C2H5OH + H2Omixtures at T = (278.15 to 338.15) K. J. Chem. Eng. Data 58, 663–670 (2013).
AcknowledgementsWe acknowledge the financial supports of the National Institute of General MedicalSciences of the National Institutes of Health DP2GM128446 (Y.Z.) and the NationalScience Foundation NSF-ECCS-2001650 (Y.Z.).
Author contributionsY.K. and Y.Z. designed the research; Y.K. performed experiments; H.D. performed MDsimulations; Y.K. and Y.Z. analyzed the data and wrote the manuscript; Y.Z. supervisedthe project.
Competing interestsThe authors declare no competing interests.
Additional informationSupplementary information The online version contains supplementary materialavailable at https://doi.org/10.1038/s41467-022-31546-3.
Correspondence and requests for materials should be addressed to Yuebing Zheng.
Peer review information Nature Communications thanks Jotam Bergfreund, JulesMagda, Shawn Putnam, Antonio Stocco and the other, anonymous, reviewer(s) for theircontribution to the peer review of this work.
Reprints and permission information is available at http://www.nature.com/reprints
Publisher’s note Springer Nature remains neutral with regard to jurisdictional claims inpublished maps and institutional affiliations.
Open Access This article is licensed under a Creative CommonsAttribution 4.0 International License, which permits use, sharing,
adaptation, distribution and reproduction in any medium or format, as long as you giveappropriate credit to the original author(s) and the source, provide a link to the CreativeCommons license, and indicate if changes were made. The images or other third partymaterial in this article are included in the article’s Creative Commons license, unlessindicated otherwise in a credit line to the material. If material is not included in thearticle’s Creative Commons license and your intended use is not permitted by statutoryregulation or exceeds the permitted use, you will need to obtain permission directly fromthe copyright holder. To view a copy of this license, visit http://creativecommons.org/licenses/by/4.0/.
© The Author(s) 2022
NATURE COMMUNICATIONS | https://doi.org/10.1038/s41467-022-31546-3 ARTICLE
NATURE COMMUNICATIONS | (2022) 13:3742 | https://doi.org/10.1038/s41467-022-31546-3 | www.nature.com/naturecommunications 9