Product Update Automotive Exterior OSRAM Opto Semiconductors
Upload
independentCategory
view
3download
0
ARTICLE IN PRESS
0030-3992/$ - se
doi:10.1016/j.op
�Correspond
+886 4 4519951
E-mail addr
Optics & Laser Technology 37 (2005) 623–630
www.elsevier.com/locate/optlastec
An opto-electrical method for measuring the gap of LCD glass plates
Jason Choa, Chern-Sheng Lina,�, Ben Jamin Janb, Chia-Hau Lina, Nin-Chun Changa
aDepartment of Automatic Control Engineering, Feng Chia University, Taichung, Taiwan, ROCbPecision Machinery Research & Development Center, Taichung, Taiwan
Received 19 January 2004; received in revised form 22 August 2004; accepted 1 October 2004
Available online 9 December 2004
Abstract
We focus on the experimented system development for the measurement of the gap of LCD glass plates. The measurement system
includes a laser light source, lens module, image capturing system and the algorithm for calculation of the position of light spots. We
emphasize the structure of laser triangulation in an optical system. The software is focused on the algorithm for calculating the
position of light point, including centroid calculation method (CCM) and Fourier phase shift (FPS).
Furthermore, to verify the feasibility of the algorithm, we use computer software to simulate experiments. We also discuss the
contribution of the noise to the accuracy for the CCM and FPS. To complete the development of the opto-electrical measurement
system and to verify the accuracy for the hardware architecture, we use a novel mechanism of multi-track and concentricity, laser
light source, lens module, and image capturing system.
r 2004 Elsevier Ltd. All rights reserved.
Keywords: Centroid calculation method; Fourier phase shift method; Mechanism of multi-track and concentricity
1. Introduction
The series of liquid crystal display (LCD) productioncovers each of the following procedures: baking, curing,rubbing, dry cleaning, combination rubbing and drycleaning, spacer spraying, gasket seal printing anddispensing, combination alignment, assembly, andliquid crystal filling. An LCD assembly sequenceconsists of adhesive dispensing (required for sealingthe panels), location and alignment of one plate withrespect to the other and exposure to cure the adhesiveand bond the two plates together [1,2]. In the assemblyprocess (Fig. 1), the distance between the top plate andthe bottom plate is from 0.06 to 0.1 mm. A rotator andan xy-table can drive the substrate to the correctposition within a tolerance of 0.01–0.04 mm. There aremany types of equipment used to measure the plate-to-plate distance accurately. This paper focuses on the
e front matter r 2004 Elsevier Ltd. All rights reserved.
tlastec.2004.10.003
ing author. Tel.: +886 4 45172503929; fax:
.
ess: [email protected] (C.-S. Lin).
experimented system development for the measurementof the gap of LCD glass plates. The measurement systemincludes a laser light source, lens module, CCD imagecapturing system and the algorithm for calculation ofthe position of light spots.
Generally PSD and CCD sensors are used as opto-sensor for detecting the deformation of objects. ThePSD sensor uses the variation of electric current betweenX1 and X2 to survey the movement of objects while thelight spots, shift to different positions as shown inFig. 2(a). The CCD sensor uses the variation of the lightintensity distribution from the CCD sensor. Thisvariation can be detected by the peak value of thedistribution of light intensity, as shown in Fig. 2(b).
The PC-based opto-electrical shift measurementsystems are becoming popular since the prices of PCand image capture systems have become acceptable topopular and special demands of industries. The pro-posed measurement system is a ‘‘PC-based opto-electrical measurement technique for limpid glasses’gap’’. This measurement system includes a laser lightsource, lens module, image capturing system and the

ARTICLE IN PRESS
x
X1 X2
x
pixel
inte
nsity
Detector area
Light spot
Pixel elements
Light spot
(a)
(b)
Fig. 2. (a) Structure of a PSD sensor. (b) Structure of a CCD sensor.
X-Y Table rotator
upper plate
bottomplate
gap
Fig. 1. The assembly process of LCD production line.
gap
pR1
R2
R3
R4
R5
2θ
1θ
n2
n2
n1
Fig. 3. Distribution of reflected ray from reflection.
J. Cho et al. / Optics & Laser Technology 37 (2005) 623–630624
algorithm for calculation of the position of light spots.This system acts not only like a gap gauge, but alsocould be applied for the measurement of the depth oflimpid objects and object movement.
2. Analysis of reflected laser light
To confirm the distribution of intensity from rever-beration in advance, we calculate the intensity ofreflection for R1;R2;R3;R4; and R5 by wave theory asshown in Fig. 3. We could get the �s vector ofreflectance by the wave theory [3,4]:
r? ¼ �n1 cos y1 � n2 cos y2
n1 cos y1 þ n2 cos y2: (1)
The �p vector of oscillation reflex rate:
rP ¼ þn2 cos y1 � n1 cos y2
n2 cos y1 þ n1 cos y2: (2)
The �s vector of transparency:
t? ¼2n1 cos y1
n1 cos y1 þ n2 cos y2: (3)
The �p vector of transparency:
tP ¼2n1 cos y1
n2 cos y1 þ n1 cos y2: (4)
The laser light source we used is not polarized. Theenergy from p and s vectors of laser light source is halfof the incident light [5]. Therefore, we can get thereflectance of incident light as
r ¼1
2ðrs þ rpÞ ¼
1
2
n1 cos y1 � n2 cos y2
n1 cos y1 þ n2 cos y2
� �2"
þn2 cos y1 � n1 cos y2
n2 cos y1 þ n1 cos y2
� �2#: ð5Þ
Ignoring the absorption of the medium, we get
rþ t ¼ 1: (6)
We set the transparency of the incident light as t:Assume the incident angle be 30�; n1 ¼ 1; and n2 ¼ 1:52;we will obtain
R1 :R2 :R3 :R4 :R5 ¼ 35:4 : 20:6 : 28 : 16:2 : 0:
The theoretical results is shown in Fig. 4 and theexperimental result is shown in Fig. 5. The ratio ofR1;R2;R3; and R4 is
R1 :R2 :R3 :R4 ¼ 27 : 25 : 26 : 23:
3. Analysis of geometrical size for the laser light
reflection
The geometric relation between the interval size p ofthe reflected laser light R2 and R3 and the interval size

ARTICLE IN PRESS
Fig. 5. Experimental result of distribution of intensity of incident
angle 30�:
Fig. 4. Theoretical distribution of intensity of incident angle 30�:
x
u(x)
cx0
Fig. 6. Illustration of centroid calculation method.
x
u(x)
cx0
NT
f(x)
Fig. 7. Illustration of Fourier phase shift method.
J. Cho et al. / Optics & Laser Technology 37 (2005) 623–630 625
gap between the two glasses is obtained by the reflectionand deflection laws [6,7].
gap ¼p
2 sin y1: (7)
These algorithms for the calculation of the position oflight spot are focusing on the centroid calculationmethod (CCM) and fourier phase shift (FPS) method.
3.1. Centroid calculation method, CCM [8]
We calculate the positions of the light spot bythe center-of-gravity position x̄c for the distributionfunction of light intensity uðxÞ as shown in Fig. 6 and
Eq. (8).
x̄c ¼
R1
�1xuðxÞdxR1
�1uðxÞdx
: (8)
3.2. Fourier phase shift method, FPS
This method uses the shift feature of FPS to evaluatethe shift value for the position of light point, as shown inFig. 7. f ðxÞ ¼ f ð�xÞ; the phase fF ðsÞ of the FPS F ðsÞ
would be equal to 0. Assuming
uðxÞ ¼ f ðx � x̄Þ; (9)
this function is sampled in the interval ‘‘j 2 f0;Ng’’, thenthe FPS of uðxÞ would be
UðsÞ ¼ expð�i2psx̄ÞF ðsÞ; (10)
fU ðsÞ ¼ �2psx̄: (11)
We could get the phase value ½0;SC in the positivefrequency interval by DFT calculation:
fðjÞ ¼ �2pj
NTx̄; (12)
j ¼ 0; 1; 2; . . . ;N; and T is the sampling cycle.We could evaluate the best slope 2p/x̄S by the phase
value obtained above, the /x̄S is the best center-of-gravity position. We could also find the differencesbetween CCM and FPS as listed in Table 1.
ARTICLE IN PRESS
Table 1
A comparison of CCM and FPS
Items Centroid calculation method (CCM) Fourier phase shift (FPS) method
Pre-built the single module No No
The level of the single in symmetricity Higher Lower
Noise from DC and low band Sensitive Not sensitive
Noise from high band Not sensitive in general case. But it would be
sensitive when the
Depends on the wave shapes of the light-
intensity function
function’s curve change strongly or Simple curve is highly sensitive
sampling number is small Symmetrical curve is not sensitive
The curve and width of the function for pixel
sensor
It would not be sensitive if the curve of the
function for pixel sensor
It would be not sensitive if the function for
sensor is symmetric
Fig. 8. Intensity distribution of Gaussian distribution.
Fig. 9. Intensity distribution of Airy pattern.
J. Cho et al. / Optics & Laser Technology 37 (2005) 623–630626
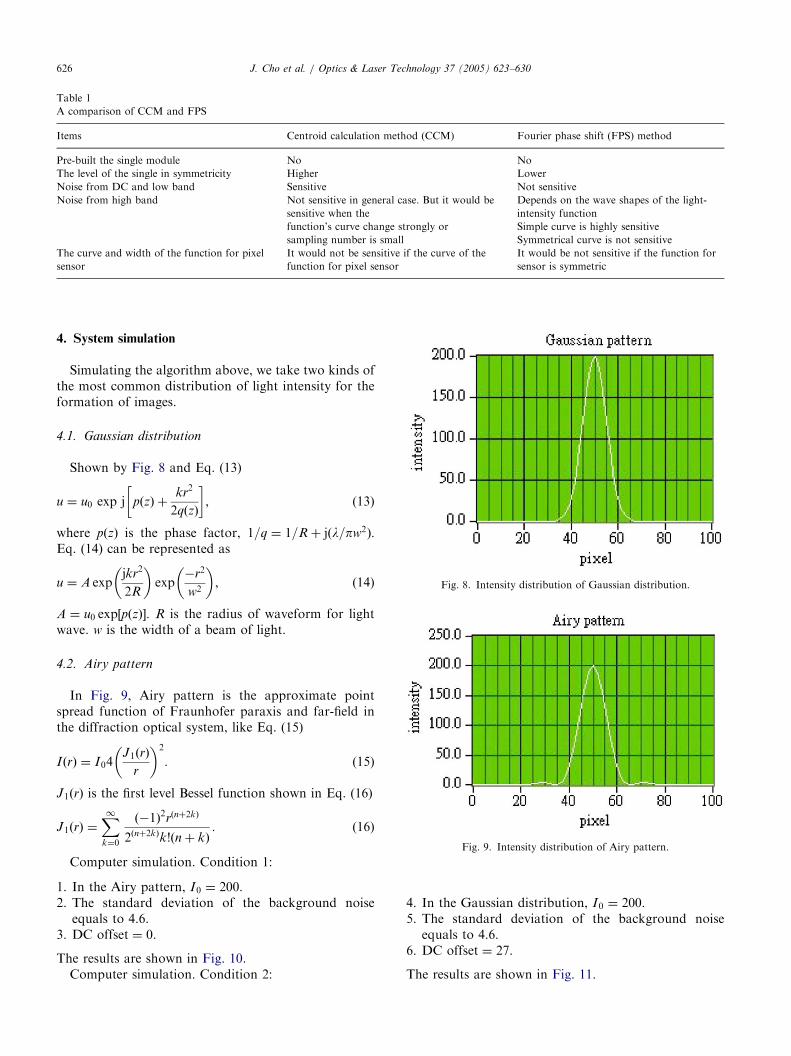
4. System simulation
Simulating the algorithm above, we take two kinds ofthe most common distribution of light intensity for theformation of images.
4.1. Gaussian distribution
Shown by Fig. 8 and Eq. (13)
u ¼ u0 exp j pðzÞ þkr2
2qðzÞ
� �; (13)
where pðzÞ is the phase factor, 1=q ¼ 1=R þ jðl=pw2Þ:Eq. (14) can be represented as
u ¼ A expjkr2
2R
� �exp
�r2
w2
� �; (14)
A ¼ u0 exp½pðzÞ : R is the radius of waveform for lightwave. w is the width of a beam of light.
4.2. Airy pattern
In Fig. 9, Airy pattern is the approximate pointspread function of Fraunhofer paraxis and far-field inthe diffraction optical system, like Eq. (15)
IðrÞ ¼ I04J1ðrÞ
r
� �2
: (15)
J1ðrÞ is the first level Bessel function shown in Eq. (16)
J1ðrÞ ¼X1k¼0
ð�1Þ2rðnþ2kÞ
2ðnþ2kÞk!ðn þ kÞ: (16)
Computer simulation. Condition 1:
1.
In the Airy pattern, I0 ¼ 200: 2. The standard deviation of the background noiseequals to 4.6.
3. DC offset ¼ 0.The results are shown in Fig. 10.Computer simulation. Condition 2:
4.
In the Gaussian distribution, I0 ¼ 200: 5. The standard deviation of the background noiseequals to 4.6.
6. DC offset ¼ 27.The results are shown in Fig. 11.

ARTICLE IN PRESS
Fig. 10. Simulation result of condition 1.
Fig. 11. Simulation result of condition 2.
J. Cho et al. / Optics & Laser Technology 37 (2005) 623–630 627
Computer simulation. Condition 3:
7.
In the Airy pattern, I0 ¼ 200: 8. The standard deviation of the background noiseequals to 4.6.
9. DC offset ¼ 27.The results are shown in Fig. 12.
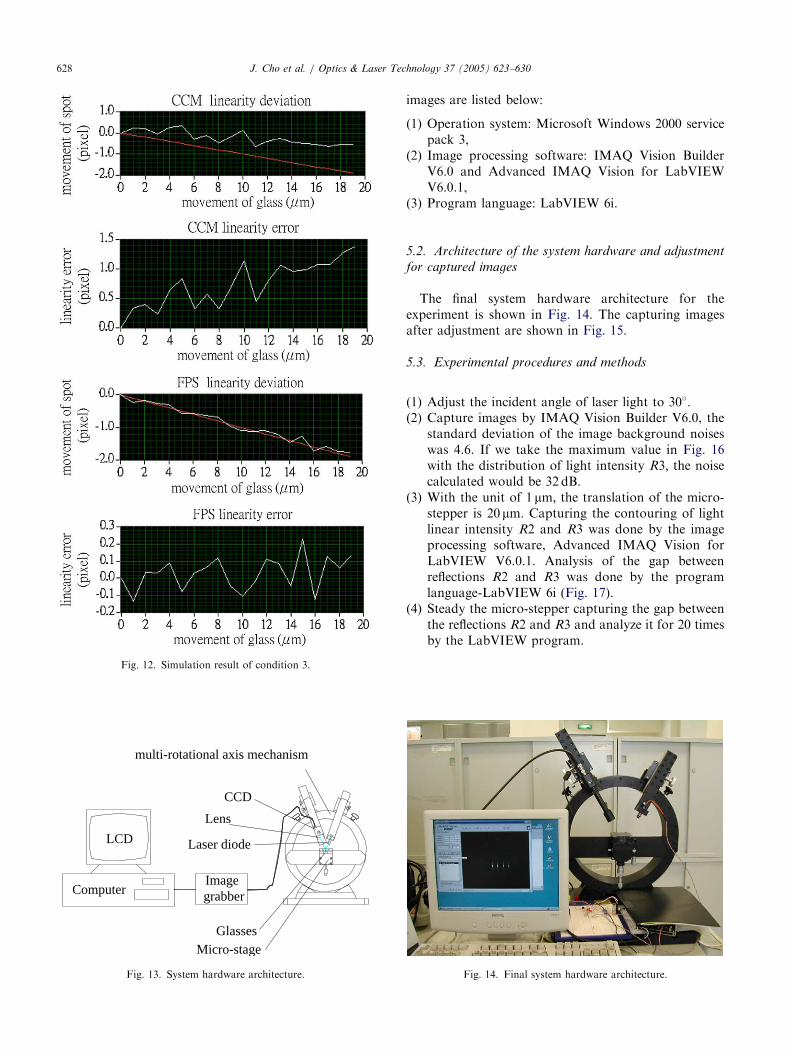
5. System architecture and test results
5.1. Hardware design
The design of hardware architecture for this system isbased on the experimental requirement shown in Fig. 13.
(1)
Laser diode: ONSET-GPD02A (wavelength equalsto 650 nm).(2)
Image capture adapter: NI-PCI-1411. (3) Lens: Moritex-MML1-65D.(4)
CCD: Warex-WAT-902. (5) PC: attached with Pentium III CPU, Processorclock: 733 MHZ, 896 MB Memory.
(6) The main features of mechanism of multi-track andconcentricity are:(a) the single-axis translator of CCD can revolve
around the test center,(b) the double-axis translator of CCD can revolve
around the test center and shift alone they-axis,
(c) single- and double-axis translators could revolvearound the center of the turntable.
(7)
Micro-stepper: SURUGA-SEIKI-B43-60 with mini-mum feed length 0:5mm:The operation system, image processing software,program language for the analysis of experimental
ARTICLE IN PRESS
Fig. 12. Simulation result of condition 3.
Laser diode
Imagegrabber
Glasses
LCD
Computer
Micro-stage
CCD
Lens
multi-rotational axis mechanism
Fig. 13. System hardware architecture.
J. Cho et al. / Optics & Laser Technology 37 (2005) 623–630628
images are listed below:
(1)
Operation system: Microsoft Windows 2000 servicepack 3,(2)
Image processing software: IMAQ Vision BuilderV6.0 and Advanced IMAQ Vision for LabVIEWV6.0.1,(3)
Program language: LabVIEW 6i.5.2. Architecture of the system hardware and adjustment
for captured images
The final system hardware architecture for theexperiment is shown in Fig. 14. The capturing imagesafter adjustment are shown in Fig. 15.
5.3. Experimental procedures and methods
(1)
Adjust the incident angle of laser light to 30�: (2) Capture images by IMAQ Vision Builder V6.0, thestandard deviation of the image background noiseswas 4.6. If we take the maximum value in Fig. 16with the distribution of light intensity R3; the noisecalculated would be 32 dB.
(3)
With the unit of 1mm; the translation of the micro-stepper is 20mm: Capturing the contouring of lightlinear intensity R2 and R3 was done by the imageprocessing software, Advanced IMAQ Vision forLabVIEW V6.0.1. Analysis of the gap betweenreflections R2 and R3 was done by the programlanguage-LabVIEW 6i (Fig. 17).(4)
Steady the micro-stepper capturing the gap betweenthe reflections R2 and R3 and analyze it for 20 timesby the LabVIEW program.Fig. 14. Final system hardware architecture.

ARTICLE IN PRESS
Fig. 15. Capturing of images after adjusting.
Fig. 16. Distribution of intensity for reflected ray R3:
Fig. 17. Final hardware light spot position analysis result.
J. Cho et al. / Optics & Laser Technology 37 (2005) 623–630 629
We can obtain the results from system experimentsand computer simulations, as shown in Table 2. Whenthe background noise increases, the linear accuracy of
CCM and FPS would also decreases. Furthermore, thebackground noise has more influence on CCM thanFPS. That means that FPS has better accuracy thanCCM.
6. Conclusion
The characteristics obtained from the simulations ofthe algorithm for calculation of the position of lightspot and actual system experiments are listed in thefollowing.
(a)
DC noise has significant influence on CCM but littleon FPS.(b)
High band noise has more influence on CCM thanFPS.(c)
The accuracy of Airy pattern and Gaussian dis-tribution are similar when the waveform of Airypattern changes slightly.(d)
When the background noise increases the linearinaccuracy of CCM and FPS would raise too. Inother words, the background noise has moreinfluence on CCM than FPS.(e)
The best way to prove the accuracy is the compres-sion of background noise.Acknowledgements
This work was sponsored by the National ScienceCouncil under Grant no. NSC92-2212-E-035-006.

ARTICLE IN PRESS
Table 2
Comparison of system experiment and PC simulation result (unit: pixel)
Conditions Centroid calculation method (CCM) Fourier phase shift method (FPS)
Max linear Min linear Repeatability Max linear Min linear Repeatability
inaccuracy inaccuracy inaccuracy inaccuracy
Actual experimental conditions
1. Incident angle ¼ 30�
2. Standard deviation of background noise ¼ 4:6 0.94 �0.24 0.45 0.18 �0.06 0.17
3. DCoffset ¼ 27
PC simulating condition 1:
1. Airy pattern
2. Standard deviation of background noise ¼ 4:6 0.499 �0.004 0.025 �0.021
3. DC offset ¼ 0
PC simulating condition 1:
1. Gaussian distribution
2. Standard deviation of background noise ¼ 4:6 1.33 0 0.153 �0.117
3. DC offset ¼ 27
PC simulating condition 3:
1. Airy pattern
2. Standard deviation of background noise ¼ 4:6 1.369 0 0.23 �0.131
3. DC offset ¼ 0
J. Cho et al. / Optics & Laser Technology 37 (2005) 623–630630
References
[1] Lin C-S, Lay Y-L, Huan C-C, Chang H-C, Hwang T-S. An image-
based LCD positioning system utilizing the modified FHT method.
Optik 2003;114(4):151–60.
[2] Lin C-S, Wu W-Z, Lay Y-L, Chang M-W. A digital image-based
measurement system for a LCD backlight module. Opt Laser
Technol 2001;33(7):523–9.
[3] Bakker Mde, Verbeek PW, Steenvoorden GK, Young IT. The
PSD transfer funtion. IEEE Trans Electron Devices 2002;
49(1):202–6.
[4] Alexander BF, Ng KC. Elimination of systematic error in sub-pixel
accuracy centroid estimation. Opt Eng 1991;30(9):1320–31.
[5] Fillard JP. Subpixel accuracy location estimation from digital
signals. Opt Eng 1992;31:2465–71.
[6] Welch SS. Effects of window size and shape on accuracy of
subpixel centroid estimation of target images. NASA Technical
paper 3331, September 1993.
[7] Canaba H, Alonso J, Bernabeu E. Laser beam deflectometry based
on a sfubpixel resolution algorithm. Opt Eng 2001;40:2517–23.
[8] Nazarathy M, Shmir J. Fourier optics described by operator
algebra. J Opt Soc Am 1980;70(2):150–9.
Copyright © 2022 FDOKUMEN