
Trial Indication(s) Protocol Number Protocol Title Clinical Trial Phase
Upload
independentCategory
view
0download
0
ATrial-Based Experimental Design for fMRI
Eric Zarahn, Geoff Aguirre, and Mark D’Esposito1
Department of Neurology, University of Pennsylvania Medical Center, Philadelphia, Pennsylvania 19104
Received January 14, 1997
An experimental design for functional MRI (fMRI) ispresented whose conceptual units of analysis are behav-ioral trials, in contrast to blocks of trials. This type ofdesign is referred toasa trial-based (TB) fMRIdesign. It isexplained how TB designs can afford the ability to: (1)randomize the presentation of behavioral trials and (2)utilize intertrialvariance inuncontrolledbehavioralmea-sures to examine their functional correlates. Aparticulartype of TB design that involves modeling trial-evokedfMRI responses with one or more shifted impulse re-sponse functions is described. This design is capable ofdiscriminating functional changes occurring during tem-porally separated behavioral subcomponents within tri-als. An example of such a design is implemented and itsstatistical specificity, functional sensitivity, and func-tional specificityaretested. r 1997Academic Press
INTRODUCTION
This paper will describe a general experimentaldesign and ensuing parametric statistical analysis thatexploits the temporal resolution of fMRI. This type ofdesign uses trial-based (TB) behaviors as its conceptualunits of analysis and is hence referred to as a trial-based design. A trial-based behavior may be defined asa self-contained behavioral/perceptual unit which istemporally delimited. Each trial-based behavior maybe composed of one or several theoretical behavioralconstructs or behavioral subcomponents. Perceptualdiscrimination, short-termmemory, priming, and recog-nition memory are some examples of psychologicalconstructs amenable to study as trial-based behaviors.Essentially, TB designs attempt to model fMRI signal
changes associated with trials as opposed to blocks oftrials. In a fashion conceptually similar to event relatedpotential (ERP) studies (e.g., Johnson et al., 1997), theneuroimaging signals evoked in response to temporallyisolated behavioral trials are recorded. These evokedfMRI responses are then analyzed within a statisticalframework to test hypotheses regarding the neuralsubstrates of the trial-based behaviors.
To motivate TB methodology, we will begin with adiscussion of the ostensible experimental advantages ofTB designs over traditional, ‘‘blocked’’ designs. Next,the basic logic of a specific type of TB design isdiscussed, with an emphasis upon the ability of fMRI totheoretically resolve discrete neural events. Finally, anempirical application of these ideas is presented, includ-ing tests of statistical specificity, functional specificity,and functional sensitivity.
Advantages of a TB Design
The transition from a blocked design to a TB design isaccompanied by theoretical improvements in the imple-mentation, analysis, and interpretation of functionalneuroimaging experiments. These include the abilityto: (1) randomize the presentation of behavioral trialsand (2) utilize intertrial variance in uncontrolled behav-ioral measures to examine their functional correlates.These advantages will accompany any TB design andare a consequence of the ability to analyze signalchanges evoked by temporally isolated trials. An addi-tional advantage is conferred by the specific TB designto be presented here: the ability to discriminate func-tional changes occurring during temporally separatedbehavioral subcomponents within trials. This latteradvantage provides the opportunity in some cases toavoid cognitive subtractive methodology. Each of thesepoints will be discussed in turn below.
(1) Trial Randomization
One proposed advantage of a TB fMRI design is theability to randomize trials. The trials of blocked designsutilized with both PET and fMRI are, by definition, notrandomized. Rather, a blocked design2 means that thevariable(s) of interest is manipulated across periods of
1 To whom reprint requests should be addressed.
2 The use of the term blocked design here should not be confusedwith the use of blocking in ANOVA designs. In the latter type ofdesigns, the treatments of interest are randomly assigned to experi-mental units within levels, or blocks, of nuisance variables. Incontrast, we use the term blocked design here to denote the clusteringtogether of similar trial types within the same blocks of time. In thesedesigns, the average neuroimaging signal over a block of trials of typeA is compared to the average neuroimaging signal over a block oftrials of type B.
NEUROIMAGE 6, 122–138 (1997)ARTICLE NO. NI970279
1221053-8119/97 $25.00Copyright r 1997 by Academic PressAll rights of reproduction in any form reserved.

time in which many trials of the same condition arepresented. This often leads to awkward behavioralconstraints in these types of neuroimaging designs. Forexample, most studies of the neural substrates ofrecognition/novelty processing have involved present-ing subjects with blocks of either all old or all newstimuli together for judgements of recognition (e.g.,Nyberg et al., 1996; Schacter et al., 1996; Tulving et al.,1996).The randomization of trials would seem to be impor-
tant when predictability of condition from trial to trialby the subject is a psychological, and thus by hypoth-esis a functional, issue. The interaction of the structureof trial presentation (i.e., blocked or random) with taskcan be hypothesized to occur on at least two levels.First, the order of trial presentation may interact witha behavioral task to have an effect upon the cognitive/neural processes engaged during the trials themselves.Second, the structure of trial presentation may interactwith a behavioral task to affect the behavioral statebetween trials [i.e., during the intertrial interval (ITI)or interstimulus interval (ISI)]. These two types ofinteractions are discussed separately below.One possible temporal locus of interaction between
the structure of trial presentation and behavior isduring the trial itself. An example of this can be seen inthe false recognition of lures semantically associatedwith words presented during study (Roediger andMcDermott, 1995). In their PET study, Schacter andcolleagues (1996) reported a signal difference withinthe left temporo-parietal cortex between the veridicalrecognition of words and the false recognition of lures.As is standard for PET studies, the true targets (thewords that were actually presented during learning)and lures were presented in separate blocks during therecognition test. A subsequent ERP study (Johnson etal., 1997) performed using the same word lists as thePET study also found differences between true targetsand lures in a left parietal recording site, but only whenthe trial types were blocked as in the PET study ofSchacter et al. (1996). No such difference was found atthis site when the trial types were presented pseudo-randomly. This result was interpreted in the context ofthe source monitoring framework (Johnson et al., 1997)which posits that subjects rely on different strategiesfor recognition depending upon, among other variables,the test conditions. These results suggest, first, thattwo neuroimaging experiments, using the same stimuli,may differ fundamentally simply as a function of thestructure of trial presentation, and, second, that theresults of a test for such differences may bear directlyupon the validity of a cognitive neuroscience model.Another possible temporal locus of interaction be-
tween the structure of trial presentation and behavioris during the ITI. It is possible that some aspects ofprocessing occurring during the ITI depend upon the
local temporal context provided by previous trials. Aneffect of this kind might be manifested, for example, asa relatively long duration cognitive state that is associ-ated with the performance of shorter duration behav-iors. One teleological purpose of such a state might beto allow the subject to be optimally prepared for thetrials of a particular condition. A classic, blocked PETor fMRI design would be sensitive to, and unable todistinguish between, both the changes in functionalactivity associated with different trials and the changesin functional activity between those trials (i.e., duringthe ITI). These kinds of effects have been previouslyobservedwith themethods of hemodynamic neuroimag-ing (Pardo et al., 1991), electroencephalography (EEG;Pleydell-Pearce, 1994), and single-unit electrophysiol-ogy studies (Colby et al., 1996).
(2) Utilization of Intertrial Variance in UncontrolledBehavioral Measures or Trial Characteristicsto Examine Their Functional Correlates
It is often of interest to ask questions regarding therelationship between functional activity and measur-able aspects of either a trial-based behavior (e.g.,accuracy, reaction time; Friston et al., 1995c) or charac-teristics of a trial (e.g., frequency of a word in arecognition paradigm, contrast of a visual stimulus,location of a stimulus in egocentric space). This isdifficult to do optimally in a blocked paradigm (e.g.,Nyberg et al., 1996) because the neuroimaging signal isaveraged over blocks of trials, and hence the variance ofsuch covariates (and thus the power to detect relation-ships with functional activity) is reduced. As explainedbelow, TB designs allow the experimenter to exploitintertrial variance in behavior and/or trial characteris-tics to test for relationships between functional activityand these covariates.
(3) Resolution of Temporally Separated Neural Events
A type of TB design allows the discrimination of theneural correlates of behavioral subcomponents of anintegrated behavior if these subcomponents are sepa-rated in time by a few seconds. As an example, one mayexamine the neural correlates of the later part of thememory-requiring delay period in paradigms that tapshort-term memory, independently of the other behav-ioral components of the task. This example will bedemonstrated in the current report (however, not all TBdesigns would necessarily have this ability). The osten-sible utility of being able to attribute signal changes todifferent behavioral subcomponents is that one theoreti-cally gains the ability to test hypotheses about theneural substrates of these subcomponents without rely-ing on cognitive subtraction.
123TRIAL-BASED fMRI

Logic of the Current TB Design
Using Impulse Responses to Model fMRI SignalChanges during Trial-Based Behaviors
Many behaviors of interest in psychology can takeplace on the order of hundreds of milliseconds. Depend-ing on the behavior in question, a single behavioraltrial may be hypothesized to be associated with a briefneural event (i.e., a neural transient). A set of manysimilar behavioral trials in time would then yield asuccession of such neural transients.Aneural transientwill, in turn, cause a brief fMRI signal change (Richteret al., 1996), which we informally refer to as an impulseresponse function (IRF; Boynton et al., 1996). If wewish to model the evoked fMRI response caused by asingle neural transient the IRFwould seeman appropri-ate a priori candidate. Similarly, the fMRI signalevoked by a series of shifted neural transients would bemodeled appropriately by a set of shifted IRFs. Differ-ent sets of such shifted IRFs could be used to model theevoked fMRI responses to different types of behavioraltrials. Within this framework, there is no requirementfor the different types of trials to appear in anyparticular order. Instead, different trial types can bepresented in any order. By the same reasoning, one canseparately model the evoked fMRI responses to trialscategorized according to any scheme of interest (e.g.,correct vs. incorrect trials; Aguirre et al., 1997).To optimize the signal:noise of a TB design, trials
must be spaced sufficiently apart to allow evolution andfull decay to baseline of hemodynamic signal changesbetween adjacent trials. If this is not done (and trialsare presented, for example, every 2 s) the design will beof very low power. This is because of the low-passfiltering effected by hemodynamics. Short ITIs intro-duce high frequencies into the task (i.e., input) andhence will reduce the amount of task variance passedinto the hemodynamic response.It might initially be assumed that detection of the
fMRI responses attributable to brief neural transientswould be weaker than that afforded by blocked designs.Two observed features of the BOLD fMRI system may,however, undermine this assumption. First, it has beenreported that the magnitude of the fMRI response isgreater to brief neural inputs than would be predictedfrom the magnitude of the fMRI response to longerneural inputs (Boynton et al., 1996). Second, reports ofthe 1/f character of BOLD fMRI noise (Zarahn et al.,1997) suggest suboptimal signal:noise at frequenciestypically used in blocked designs (Fig. 1). The ability todetect fMRI signals associated with behavioral trialswill be demonstrated empirically in this report.Distinguishing within-trial fMRI signal changes.
The temporal dynamics of neural activity are quiterapid, even in association (i.e., nonprimary) cortices.For example, neural activity in the lateral intraparietal
area of macaques was observed to increase within 100ms of the visual presentation of a saccade target (GnadtandAndersen, 1988). In contrast, the temporal dynam-ics of the BOLD fMRI signal increase are on a scale ofseconds, apparently due to the relatively slow changesin blood flow (Leniger-Follert and Hossman, 1979;Conrad and Klingelhofer, 1989) which are hypothesizedto play a role in decreasing the local de-oxyhemoglobinconcentration (Malonek and Grinvald, 1996). However,even within a single trial-based behavior, neural activ-ity can contain meaningful information in the dynamicrange of the fMRI signal. As an example, a subpopula-tion of neurons in dorsolateral prefrontal cortex wasobserved to have a response during both the stimuluspresentation and the ensuing several seconds of delayof a delayed-response task (Fuster et al., 1982). In sucha case, fMRI should be able to temporally distinguishfunctional changes associated with the later delayperiod from those associated with the stimulus presen-tation (thus avoiding cognitive subtraction). This argu-ment is based upon the autocorrelation function of anestimated BOLD fMRI IRF (Fig. 2) which suggests thatevoked fMRI responses to neural events separated byat least 4 s should be readily resolvable statistically(Kleinbaum et al., 1988).
FIG. 1. Estimate (obtained from subject P) of the relative signal:noise in BOLD fMRI data vs the frequency of behavioral paradigm.This function was obtained by dividing the transfer function of theIRF from subject P (see Methods) by the 1/f model fit (Eq. (1) fromZarahn et al., 1997) to the square root of the average of thevoxel-averaged power spectra across 13 noise datasets (data previ-ously reported in Zarahn et al., 1997), and then normalizing by themaximum of the resulting function. Overlaid is the bandwidthtypically occupied by the fundamental frequencies of blocked para-digms (0 , frequency # 0.0167Hz in light gray) and that correspond-ing to the trial durations found in TB paradigms (0.0333 # fre-quency # 0.0625 Hz in dark gray).
124 ZARAHN, AGUIRRE, AND D’ESPOSITO

Application of a TB Design
Regions that remain active throughout the delayperiod of spatial short-term memory tasks are candi-dates for being involved in spatial mnemonic processes.Neural activity during the delay period of spatialshort-term memory tasks has been observed in singleunits of many brain regions in nonhuman primates (forexample, Fuster et al., 1982; Funahashi et al., 1989;Gnadt and Andersen, 1988). Here we attempted todetermine if any such functional activity could beobserved in humans at the spatial resolution of fMRIwith a TB experimental design. The same dataset wasalso used to test the validity of the TBmethodology. Forthe sake of summary, attributes of the TB designutilized in this report and those of a typical blockeddesign are contrasted in Table 1.
METHODS
Behavioral Paradigm
The behavioral paradigm involved positional discrimi-nation (i.e., comparing the positions) of two visualstimuli that were presented either simultaneously orseparated in time. The discrimination during the simul-
taneous stimuli presentation (called the No-Delay, orND, condition) thus involved a perceptual discrimina-tion, while the discrimination based upon temporallyseparated stimuli (called the Delay, or D, condition)was thought to require the memory of the first stimu-lus. The discrimination judgement of the subject wasindicated by a motor response in both the ND and the Dconditions.There are two important differences between the ND
and the D conditions in the context of this report. One isthat during the ND condition, a motor response wasproduced by the subject in an early part of the trial,while in the D condition it was produced in a later partof the trial. This difference will be used later in tests offunctional sensitivity and specificity. The second differ-ence is that during the ND trials, the subject made apositional discrimination between two simultaneouslypresented visual stimuli, while during D trials thesubject made a positional discrimination guided byremembered spatial information about a stimulus thatwas presented prior to a delay period. This difference isrelevant to the test for changes in functional activityduring the delay. The details of ND and D trials arepresented below.
ND Condition
The time line of anND trial is schematized in Fig. 3A.Each trial began with a blank screen (gray background)for 3600 ms. A centrally located dark fixation line (Fig.4) then appeared and remained on the screen for a
FIG. 2. Estimate (obtained from subject P) of the BOLD fMRIsignal autocorrelation function. This provides a measure of thesmoothness of the BOLD response to changes in neural activity andhence the temporal resolution of the BOLD signal. The broader theautocorrelation function, the more difficult it becomes to statisticallyresolve temporally neighboring neural signals with fMRI. Note thatthis is not the autocorrelation function of the entire fMRI time seriesper se (Boynton et al., 1996; Zarahn et al., 1997), but rather only ofthose components conforming to convolution with the hemodynamicresponse (Friston et al., 1994). The fMRI responses to neural eventsspaced $4 s apart should be readily resolvable with fMRI due to thefairly low autocorrelation at that lag (R > 0.29).
TABLE 1
Trial-based designdescribed in this report Typical blocked design
Evoked fMRI signal changeswere modeled with indepen-dent variables composed ofshifted impulse response func-tions
Evoked fMRI signal changes aremodeled with independentvariables composed of boxcars(or smoothed boxcars)
The order of presentation of dif-ferent trial types was random-ized
Similar trial types are presentedtogether in blocks
Functional signals associatedwith a given trial type werecompared to the ITI (akin toERP studies) as well as to oneanother
Functional signals associatedwith a given trial type are onlycompared to other blocks oftime representing other condi-tions
Functional signal changes associ-ated with different behavioralsubcomponents within a trialwere modeled separately
Functional signal changes associ-ated with different behavioralsubcomponents within a trialare not modeled separately
Trial-wise variance in behavior(e.g., side of response) was uti-lized to test for functional cor-relates
Block-wise variance in behaviorcan be utilized to test for func-tional correlates
125TRIAL-BASED fMRI

period of 13.4 s. The subject was instructed to maintainfixation on this line for as long as it remained on thescreen. At t 5 3900 ms, a dark line (referred to as thetarget; Fig. 4) appeared in the subject’s upper leftquadrant. One hundred milliseconds later, the targetwas joined on the screen by a second stimulus which
was composed of a pair of lines separated by a distanceequal to the length of the target line (referred to as thevernier; Fig. 4) for a further 1000 ms. During this 1000ms, the subject made a response based on judging therelative eccentricities of the target and vernier stimuli.If the vernier was more eccentric (i.e., farther awayfrom the fixation line) than the target line, the correctresponse was to press the right button of a gamepadinterface with a finger of the right hand. Likewise, theleft button was to be pushed with left hand if thevernier was less eccentric than the target stimulus. Theprobability of the correct motor response being left orright on any given trial was 50%. The response had tooccur during the 1000 ms of the simultaneous target/vernier stimuli presentation (time 5 4000–5000 msafter the beginning of the trial) or else it was notrecorded. Thus, the response was required while thestimuli forming the basis of the judgement were stillpresent.Ablank screen was shown from the offset of thefixation line until the formal start of the next trial(which could have been an ND or D trial). A ‘‘snapshot’’of a typical arrangement of fixation line, target, andvernier stimuli during time 5 4000–5000 ms of an NDtrial is shown in Fig. 4.
FIG. 3. The temporal structures of individual (A) ND trials and (B) D trials of the spatial short-termmemory task used to test the validityof the TB design. Each trial is 30 s long (including ITI). The arrows denote when particular events occur within the trial. Gray bars show whenresponses were accepted in each trial type. Time increases as one goes to the right.
FIG. 4. The stimuli used in both D andND trials are shown above(this particular arrangement of stimuli would be seen only in NDtrials, though).
126 ZARAHN, AGUIRRE, AND D’ESPOSITO

D Condition
The time line of a D trial is schematized in Fig. 3B.Each trial began with a blank screen (gray background)for 3600 ms. A fixation line then appeared and re-mained on the screen for a period of 13.4 s. The subjectwas instructed to maintain fixation on this line for aslong as it remained on the screen. At t 5 3900 ms, atarget appeared in the subject’s upper left quadrant for100 ms. A 12-s delay ensued during which only thefixation line was present. At t 5 16 s, a vernier stimuliappeared for a duration of 1000 ms. The same responserules as in the No-Delay trials determined the correctresponse. The response had to occur while the vernierstimulus was present (time 5 16,000–17,000 ms afterthe beginning of the trial) or else it was not recorded.Thus, the response was required while one of thestimuli that formed the basis of the judgement was notpresent (i.e., the target), while the other one waspresent (i.e., the vernier). Thus some mnemonic repre-sentation of the target was presumably required torespond correctly at an above-chance level.The target stimuli for both the ND and the D
conditions were presented at eccentricities of roughly6–12°. All black line stimuli (fixation, target, andvernier) were approximately 0.2° thick and 1.7° long.The target and vernier stimuli on a given trial (eitherND or D) were separated by approximately 1.1° along aradius emanating from the center of the fixation line atapproximately a 45° angle.Each trial in both the ND and D conditions was 30 s.
This duration includes any effective ITI. The ND and Dtrials were presented pseudo-randomly in runs of 20trials each (consisting of 10 ND and 10 D trials). Theduration of a run was thus 10 min. Subject V (seebelow) performed 4 runs of the paradigm while beingscanned, for a total of 40 ND trials and 40 D trials.
fMRI Scanning Methods
Subjects
Two healthy, male, right-handed volunteers (both age19) participated in this study. They will be referred toas subjects P and V. Both gave informed consent.
Data Acquisition
Imaging was carried out on a 1.5T SIGNA scanner(G.E. Medical Systems) equipped with a prototype fastgradient system for echoplanar imaging. A standardradiofrequency (RF) head coil was used with foampadding to comfortably restrict head motion. High-resolution sagittal and axial T1-weighted images wereobtained in the subject. Using the BOLD (Ogawa et al.,1993) technique, a total of 300 gradient echo echopla-nar images per slice (TR 5 2000 ms, TE 5 50 ms, ninecontiguous 5-mm axial slices) were then obtained in
each of four activation runs at a resolution of 64 3 64pixels in a 24-cm field of view. This yielded a total of1200 data points in time per voxel. During these scans,the subject (either P or V) was performing a behavioralparadigm described above. Twenty seconds of ‘‘dummy’’gradient and RF pulses preceded the actual data acqui-sition to approach steady-state tissue magnetization.
Data Processing
Off-line data processing was performed on SUNSparc workstations using programs written in Interac-tive Data Language (Research Systems, Boulder, CO).After image reconstruction and prior to motion correc-tion, the data were sinc interpolated in time to correctfor the fMRI acquisition sequence. The data were thensubjected to two iterations of least-squares, 6-param-eter, rigid-body realignment (Friston et al., 1995a)without corrections for spin history (Friston et al.,1996b). The motion parameters estimated during thesecond iteration for the dataset of subject V were lessthan 0.05 mm in translation in any direction and lessthan 0.15° in rotation about any axis. The performanceof the motion correction resulted in the loss of the topand bottom slices (due to z-motion out of the field ofview).
Analysis of fMRI Time Series
The time series analysis is based upon the separationin time between various behavioral subcomponents ofthe ND and D tasks relative to the temporal resolutionof fMRI. Conceptually, the D condition was composed ofthe temporal subcomponents of stimulus presentation,delay, and discrimination/response periods. Each sub-component is temporally contiguous with the other inthat no absolute boundary can be laid down definingwhen one ends and another begins. However, as theduration of the delay period is long both with respect toneural dynamics and the fMRI response, it is theoreti-cally possible to statistically isolate the delay periodfrom the other task components. The strategy adoptedinvolved modeling the possible fMRI response to neuralactivity occurring at each task subcomponent as ashifted BOLD impulse response function (IRF). Thoughthis may initially not seem valid as all behavioralsubcomponents (e.g., the delay) will not necessarily bebrief, linear combinations of shifted IRFs will flexiblymodel nearly any fMRI waveform if the width of theIRF is on the order of the time between the shiftedIRFs. An estimate of the BOLD fMRI IRF was thusrequired to compose the independent variables.
Acquisition of a BOLD IRF Estimate
To obtain an estimate of the BOLD fMRI IRF, apreliminary subject (subject P) was scanned using asimilar protocol to the one used to scan the experimen-
127TRIAL-BASED fMRI

tal subject (subject V). A region of interest was definedaround the central sulcus of subject P. This region ofinterest was used to generate trial-averaged time se-ries for this subject. As the neural activity in this brainregion was assumed to be involved only in somatosen-sory-motor computation, any changes in fMRI signalduring the trials was taken to be attributable to themotor response in each trial. The fMRI response on NDtrials (relative to the onset of the target and vernierstimuli at t 5 4000 ms) was thus taken as an estimateof the BOLD fMRI IRF (thismethod is similar conceptu-ally to the pulsed IRF estimate of Boynton et al., 1996).This seemed reasonable as the reaction times for NDtrials (mean 5 461 ms for subject V) were brief relativeto the smoothness of the observed fMRI response (Fig.2). This IRF estimate from subject P was then used tomodel the evoked fMRI responses of subject V. Theadvantage of doing this is (as opposed to using an IRFestimate from the same dataset one is analyzing statis-tically) is that one is not susceptible to artifactuallyhigh correlations that would occur due to stochasticfluctuations shared by the independent and dependentvariables (due to spatially coherency in fMRI datasets;Zarahn et al., 1997).
Logic for Independent Variable Compositionand Test of Delay Period Activity
It has been observed in nonhuman primates that theneural responses to the isolated behavioral componentsfound at the beginning and end of spatial workingmemory trials (i.e., the stimulus presentation andchoice periods, respectively) are on the order of hun-dreds of milliseconds (Fuster et al., 1982; Funahashi etal., 1990). Additionally, nearly all of the varianceintroduced in the fMRI signal by a brief (,1 s) neuralinput should be explained by an independent variablethat models that evoked fMRI response as an IRFtime-locked to this brief neural input. Independentvariables that are composed of IRFs time-locked to thestimulus presentation and choice periods (which wewill refer to as D1 and D4; see Fig. 5) should thus modelthe fMRI responses attributable to neural activityduring these periods, respectively. In contrast, indepen-dent variables composed of IRFs shifted to the midst ofthe delay (which we will refer to as D2 and D3; see Fig.5) should model fMRI responses corresponding to themiddle of the delay period. This argument is presentedgraphically in Fig. 6, which demonstrates how thecoefficients of the set of independent variables wouldrespond to increasing the duration of a square wave ofneural input which is convolved with the IRF. Thesimulation presented in Fig. 6 assumes linearity.
General Linear Model
The statistical analysis was performed within theframework of Worsley and Friston’s modification of the
general linear model (GLM) for autocorrelated data(1995). The K matrix (Worsley and Friston, 1995)included estimates of 1/f noise (Zarahn et al., 1997) aswell as a filter which removed information above 0.217Hz (which was applied to the fMRI time series). Thepurpose of the 0.217 Hz filter was to remove artifactswe observe in our data at and sometimes around theNyquist frequency (0.25 Hz for TR 5 2 s). Little or nophysiologic information is present in the fMRI signal inthis range (Friston et al., 1994; Boynton et al., 1996;Zarahn et al., 1997). The data were not temporallysmoothed with an IRF estimate as advocated by Wors-ley and Friston (1995) as doing so would broaden theeffective autocorrelation function and hence worsentemporal resolution. Temporal smoothing could beavoided here as a form for the residual autocorrelationstructure (i.e., the 1/f model; Zarahn et al., 1997) wasassumed. In order to achieve maximal spatial resolu-tion, spatial smoothing of the data was not performed.The independent variable array for the univariate
analysis contained eight task variables (i.e., ND1, ND2,ND3, ND4 and D1, D2, D3, D4; Fig. 5), low-frequencyconfounds up to 0.0125 Hz (to remove variable low-frequency components; Friston et al., 1995b), and an
FIG. 5. A segment (corresponding to a single trial) of the fourindependent variables (or task covariates) used to model a given typeof trial (i.e., D or ND). For a given trial type, the four task covariatescontained IRFs shifted with respect to one another by 4 s. Eachshifted IRF modeled a distinct period within trials of a givencondition. The outer task covariates for D trials (D1 and D4)corresponded in time to the target stimulus presentation (marked bythe left arrow along the time axis) and the discrimination period(right arrow), respectively. The middle task covariates of D trials (D2and D3) corresponded to the middle of the delay period (gray baralong the time axis).
128 ZARAHN, AGUIRRE, AND D’ESPOSITO

intercept. The dependent variable contained the 1200data points of each voxel’s time series. The parametersof the model were estimated at each voxel and dividedby their standard errors to yield t statistics with 902effective degrees of freedom (Worsley and Friston,1995). Gaussian probabilities were used due to the highdegrees of freedom. As spatial smoothing was notperformed, Bonferroni correction was used to control a
in the face of multiple voxel-wise comparisons (seebelow).
Methodological Validation
Statistical Specificity
To examine false-positive rates with the TB analysis,10 human subject ‘‘noise’’ datasets (used as well inprevious analyses; Zarahn et al., 1997) were subjectedto the current method of analysis. A sham sequence oftrial conditions (i.e., D or ND) was generated pseudo-randomly for each noise dataset and served as the basisof the task variables for that dataset. There were only160 images per ‘‘noise’’ dataset as opposed to 1200images in the experimental dataset. This should not beimportant, though, as the false-positive rates for thisanalysis should depend mainly upon the satisfaction ofthe assumptions regarding temporal autocorrelationstructure (which should be independent of the numberof observations) and normality (the ‘‘noise’’ datasets,
with lower numbers of observations than the Subject Vdataset, should only have worse violations of thisassumption). Separate statistical maps (t maps, eachwith 110 effective degrees of freedom) were created foreach of the eight weakly correlated task variables foreach dataset, yielding 80 maps total. The specificitymeasure used was the proportion of maps that con-tained at least one voxel that exceeded the one-tailed,Bonferroni corrected a 5 0.05 threshold for that map.
Functional Sensitivity
We define functional sensitivity as the ability todetect functionally meaningful signal changes. Twotests of functional sensitivity which were performed onthe dataset of subject V are described below.Test 1. As the ND trials involve motor output, we
would expect that there should be an observable func-tional response in the sensorimotor cortex. A searchvolume in sensorimotor cortex was defined by one of theauthors on the T1 (structural) images. The centralsulcus was identified as the first medial-lateral sulcusposterior to, and not in contact with, the posteriorextent of the superior frontal sulcus on the superiormost slices. The search volume included both the sulcusand the surrounding gray matter. This yielded a total(left and right combined) search volume of 200 voxelsand a corresponding one-tailed Bonferroni corrected
FIG. 6. The response of the coefficients of D trial task covariates to an increasing duration of neural input is shown. (A) The behavior of thecoefficients of the model given successively longer pulses (beginning at time 0) of constant amplitude neural activity. It can be seen thatthe coefficient of each task covariate begins at zero with zero duration. The coefficient of D1 initially responds with a steep slope. In contrast,the coefficients of D2 and D3 remain relatively insensitive until the duration of neural activity extends further into the delay period. In (B), thefirst part of A is shown with an expanded time axis to highlight the relative insensitivity of the coefficients of the delay-period covariates (D2and D3) to roughly the first second of neural input. This schematic assumes a linear transform of neural activity change into BOLD fMRIsignal change. Coefficients are normalized to the maximum of the coefficient of D1.
129TRIAL-BASED fMRI

threshold of z 5 3.48 for a region-wise a 5 0.05. Thestatistical map corresponding to the coefficients of ND1wasmasked with this search volume and the number ofsuprathreshold voxels recorded. Suprathreshold voxelsare expected if the TB method is valid (assumingsufficient power).Test 2. Test 1 is meant to test for fMRI responses
related to motor output by testing for relationshipswith ND1. As there is also a motor output requiredduring the period of time represented by D4 thatinvolves the same musculature (but on completelyseparate trials), we would expect a functional responseduring this period as well. As a second test of thefunctional sensitivity of the TB method, the presence ofa relationship with D4 was tested for in the time seriesof the largest central sulcus regions detected by ND1.The largest contiguous (in 3-D) clusters of suprathresh-old voxels in the left and right hemispheres of thesearch region were used to create two spatially aver-aged time series, respectively. The coefficient of D4 wastested for significance in these two time series. a wascontrolled at 0.05 per comparison.
Functional Specificity
We define functional specificity as the selectivity, intime and space, for functionally meaningful signals asopposed to some unspecified source of nonspecific sig-nal. This concept is to be contrasted with statisticalspecificity. Two tests of the functional specificity of theTB method (thus including the functional specificity ofthe fMRI signal itself ) were performed in the dataset ofsubject V. The first dealt broadly with overall temporaland spatial specificity, and the second dealt with spatialspecificity.Test 1. As the activity of neurons in the sensorimo-
tor cortex seems strongly correlated only to motorexecution and somato-sensory stimulation that canoccur from feedback, we would not expect this region tobe active over baseline when no response is beingperformed in this paradigm. Task variables D1 andND4 model fMRI signal change during trial periodswhen no motor output was formally required. We thuschecked for the presence of relationships with D1 andND4 in the spatially averaged time series from the leftand right suprathreshold clusters from the sensorimo-tor search regions. a (one-tailed) was controlled at 0.05per comparison.Test 2. On any given trial (either ND or D), the
subject could respond with either a left- or right-handed button press. The button pressed denoted thesubject’s choice on the spatial discrimination for thattrial. Though EMG recordings were not performed, thebutton presses were recorded, and thus it was knownwhether the subject pressed the left or right button on agiven trial. Based on the crossed nature of sensorimotor
representation in cortex, we would expect that therewould be greater contralateral than ipsilateral sensori-motor neural activity for a given side of button press. Ifthe method of analysis used was functionally specific,then the fMRI signal should also show such a pattern.To test this idea, another GLM analysis was performedon the data of subject V that included separate indepen-dent variables for left and right responses correspond-ing to ND1 and D4. The number of suprathreshold(z . 3.48) voxels in the central sulcus search volume(described above) corresponding to ND1 of the rightand left button press trials were examined separatelyfor laterality with the following measure: (number ofleft hemisphere voxels)/(number of left hemispherevoxels 1 number of right hemisphere voxels). It isexpected that this measure will be greater for right-button presses than for left-button presses. A voxelcount measure (as opposed to a maximum signal mea-sure) was used as it will be sensitive both to increasedsignal in individual voxels (due to a greater likelihoodof such voxels surpassing threshold) and to a greaterexpanse of cortex being activated (due to a presumedlarger muscular representation being involved on theside executing the response than on the contralateralside). The absence of such a pattern would call intoquestion the functional specificity of the method.
Examination of Cognitive Subtractive Assumptionsin Context of a Short-Term-Memory Task
If the assumptions of cognitive subtraction in thecontext of neuroimaging studies of short-term memory(as expressed in Jonides et al., 1993) were to hold, thenthe fMRI signal change associated with simultaneoustarget and vernier stimuli presentation and motorresponse during ND trials (modeled by the variableND1) should be equal to the combined fMRI signalchange associated with the separate target presenta-tion during D trials of target (modeled by D1) andvernier presentation/motor response (modeled by D4) ifthere was no increase in neural activity during thedelay. If this fails to hold, then tests of delay periodactivity using cognitive subtraction might yield artifac-tual results. This assumption was tested by computingthe contrast of (D1 1 D4) 2 (ND1 1 ND4). If thiscontrast is significantly different from zero in a regionwhere the delay period activity (as assessed by thecontrast D2 1 D3) is not significantly different fromzero, then this would suggest that the conjunctiveassumption of cognitive subtraction in neuroimagingcould have failed. The search procedure accepted voxelsthat were significantly (two-tailed, a 5 0.05 map-wiseBonferroni corrected threshold 5 4.43) different fromzero for the contrast (D1 1 D4) 2 (ND1 1 ND4) andhad a z score less than 1.65 for the contrast (D2 1 D3).
130 ZARAHN, AGUIRRE, AND D’ESPOSITO

Test for Sustained Delay Period Activity
A test for sustained activity throughout the delayperiod of the task was performed. To be accepted, voxelshad to satisfy two criteria. First, the contrast D2 1 D3had to be significant. This contrast assessed the taskeffect during the delay compared to the ITI. Second, thecontrast (D2 1 D3) 2 (ND2 1 ND3) had to be signifi-cant. The purpose of this subtractive criterion was toguard against artifacts due to a poor modeling ofsubject V’s IRF by the independent variables (i.e.,subject P’s IRF). Each test was performed on thedataset of Subject V, at a map-wise level (5157 voxels,a 5 0.05, one-tailed, Bonferroni corrected for map,threshold 5 4.27). This combined test should be nearlyinsensitive to BOLD fMRI signal changes caused byneural activity increases during the target presenta-tion and choice periods of D trials (i.e., insensitive tothe assumptions of cognitive subtraction; see Logic forIndependent Variable Composition and Test of DelayActivity above). It might initially be argued that byincluding the criterion of significance of (D2 1 D3) 2
(ND2 1 ND3), the design did indeed utilize cognitivesubtraction for detection of activity during the delay.However, that argument is not valid as the subtractivecriterion was a necessary, but not a sufficient, conditionfor acceptance. It should also be noted that if the truehemodynamic response was known for every regionand every subject, then the subtractive criterion wouldnot have been required.
RESULTS
Statistical Specificity
The proportion of ‘‘noise’’ maps containing at leastone voxel surpassing the nominal two-tailed, Bonfer-roni corrected a 5 0.05 threshold (for t statistics with110 effective degrees of freedom) was 5/80. This propor-tion of false positive maps was not significantly greaterfrom 5% [a one-tailed binomial test (P 5 0.05, n 5 80)was NS].As there were 8 maps per subject, the 80 mapsmay not necessarily be independent due to shareddeviations from the modeled temporal autocorrelationstructure (Zarahn et al., 1997). However, there was notmore than one false positive map per subject, suggest-ing that the maps were practically independent in thissense.This is a different result than that obtained from
previous analyses in ‘‘noise’’ datasets that used a lowerfrequency boxcar paradigm as the assumed input(Zarahn et al., 1997). In those analyses using the sameassumed autocorrelation structure (Worsley and Fris-ton, 1995) and a superset of the same ‘‘noise’’ datasets,map-wise false-positive rates were significantly higherthan that expected from Gaussian inferential statistics(Zarahn et al., 1997). A possibility for the difference in
results is that the higher frequency (power primarily$0.033 Hz) paradigm used in the current analysis wasin a more stable part of the spectrum than the para-digm assumed in Zarahn et al. (a boxcar with fundamen-tal frequency at 0.0125 Hz).
Functional Sensitivity
Test 1
If the TB analysis is sensitive to neural changes, thenit should be able to detect functional responses in thesensorimotor strip associated with the motor output. Totest this idea, a search volume that encompassed mostof the central sulcus (bilaterally) was defined manuallyon the T1 images (Fig. 7). In Fig. 7, the voxels display-ing a positive suprathreshold (using a one-taileda 5 0.05 threshold, Bonferroni corrected for the com-bined left and right hemisphere search volumes) rela-tionship with ND1 in this search volume are shown.There were 41 voxels of 105 total voxels above thresh-old in the left hemisphere search volume (39% of theleft search volume) and 29 voxels of 95 total voxelsabove threshold in the right hemisphere search volume(31% of the right search volume). This result suggeststhat the TB analysis was indeed sensitive to the motorresponse related neural activity presumed to occur inthis region during ND trials.
Test 2
ND1 and D4 modeled motor responses during NDandD trials, respectively. Since the same types of motorbehaviors were required in both the ND and the Dtrials, the presence of a significant relationship withND1 in a set of voxels should predict a significantrelationship with D4. The time series for the left region(averaged over the voxels that were suprathreshold forthe voxel-wise tests for ND1 described above) yieldedt 5 13.6 (P , 0.00001) corresponding to ND1 and t 5
11.1 (P , 0.00001) corresponding to D4. The time seriesfor the right region (similarly averaged) yielded t 5
15.0 (P , 0.00001) corresponding to ND1 and t 5 7.8(P , 0.00001) corresponding to D4. Thus a relationship
FIG. 7. The sensorimotor search region defined by the authors onthe T1 images is shown in translucent green. Overlaid in a red toyellow (low to high t values) color scale are the suprathreshold(a 5 0.05, Bonferroni corrected for search region volume) voxelscorresponding to the ND1 task covariate. This covariate models thespatial discrimination (that requires either a left- or right-sidedmotor response) during ND trials.
131TRIAL-BASED fMRI
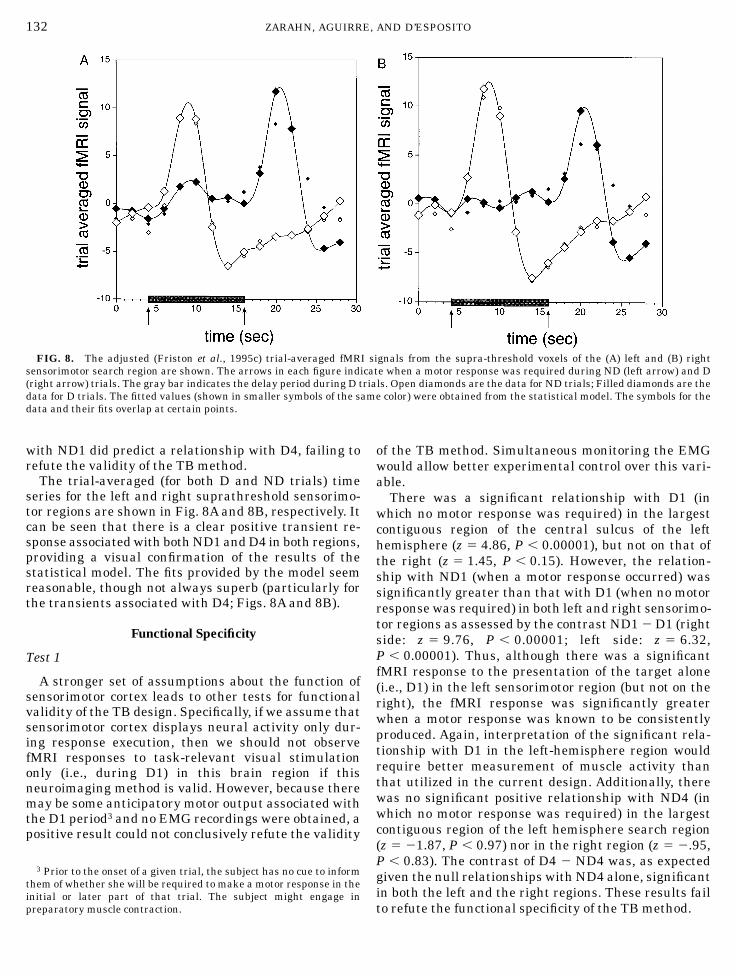
with ND1 did predict a relationship with D4, failing torefute the validity of the TB method.The trial-averaged (for both D and ND trials) time
series for the left and right suprathreshold sensorimo-tor regions are shown in Fig. 8A and 8B, respectively. Itcan be seen that there is a clear positive transient re-sponse associatedwith bothND1 andD4 in both regions,providing a visual confirmation of the results of thestatistical model. The fits provided by the model seemreasonable, though not always superb (particularly forthe transients associated with D4; Figs. 8A and 8B).
Functional Specificity
Test 1
A stronger set of assumptions about the function ofsensorimotor cortex leads to other tests for functionalvalidity of the TB design. Specifically, if we assume thatsensorimotor cortex displays neural activity only dur-ing response execution, then we should not observefMRI responses to task-relevant visual stimulationonly (i.e., during D1) in this brain region if thisneuroimaging method is valid. However, because theremay be some anticipatory motor output associated withthe D1 period3 and no EMG recordings were obtained, apositive result could not conclusively refute the validity
of the TB method. Simultaneous monitoring the EMGwould allow better experimental control over this vari-able.There was a significant relationship with D1 (in
which no motor response was required) in the largestcontiguous region of the central sulcus of the lefthemisphere (z 5 4.86, P , 0.00001), but not on that ofthe right (z 5 1.45, P , 0.15). However, the relation-ship with ND1 (when a motor response occurred) wassignificantly greater than that with D1 (when no motorresponse was required) in both left and right sensorimo-tor regions as assessed by the contrast ND1 2 D1 (rightside: z 5 9.76, P , 0.00001; left side: z 5 6.32,P , 0.00001). Thus, although there was a significantfMRI response to the presentation of the target alone(i.e., D1) in the left sensorimotor region (but not on theright), the fMRI response was significantly greaterwhen a motor response was known to be consistentlyproduced. Again, interpretation of the significant rela-tionship with D1 in the left-hemisphere region wouldrequire better measurement of muscle activity thanthat utilized in the current design. Additionally, therewas no significant positive relationship with ND4 (inwhich no motor response was required) in the largestcontiguous region of the left hemisphere search region(z 5 21.87, P , 0.97) nor in the right region (z 5 2.95,P , 0.83). The contrast of D4 2 ND4 was, as expectedgiven the null relationships with ND4 alone, significantin both the left and the right regions. These results failto refute the functional specificity of the TB method.
3 Prior to the onset of a given trial, the subject has no cue to informthem of whether she will be required to make a motor response in theinitial or later part of that trial. The subject might engage inpreparatory muscle contraction.
FIG. 8. The adjusted (Friston et al., 1995c) trial-averaged fMRI signals from the supra-threshold voxels of the (A) left and (B) rightsensorimotor search region are shown. The arrows in each figure indicate when a motor response was required during ND (left arrow) and D(right arrow) trials. The gray bar indicates the delay period during D trials. Open diamonds are the data for ND trials; Filled diamonds are thedata for D trials. The fitted values (shown in smaller symbols of the same color) were obtained from the statistical model. The symbols for thedata and their fits overlap at certain points.
132 ZARAHN, AGUIRRE, AND D’ESPOSITO

Test 2
A second specificity analysis was performed whichcompared the fMRI responses in primary sensorimotorregions to the single left- and right-sided button pressesduring each ND trial. Of the 40 ND trials for Subject V,there were 18 with right-sided responses and 22 withleft-sided responses. The GLM analysis was rerun,coding for the right and left motor output trials inseparate ND1-independent variables. The contrastspecifying only right-sided responses during ND trialsyielded 35 suprathreshold voxels (combined acrosshemispheres) with a laterality index (higher for ahigher proportion of suprathreshold voxels in the lefthemisphere) of 0.77. The contrast specifying only left-sided responses during ND trials yielded 45 supra-threshold voxels (combined across hemispheres) with alaterality index of 0.29.4 Note that, though appropriate,this pattern of laterality would occur 25% of the time bychance alone.
An Examination of Cognitive Subtractive Assumptions
The joint assumptions of cognitive subtraction in thecontext of the short-term memory task employed weretested using the TB design. These assumptions are (1)D trials are composed by inserting a delay into thecognitive processes of ND trials and (2) the transformfrom neural activity to fMRI signal change is linear.These assumptions could not be tested separately here,but only jointly such that a violation of either or bothwould result in a failure of cognitive subtraction.Regions were found thatmay have violated the assump-tions of cognitive subtraction. Visual inspection of sucha region (shown in Fig. 9) shows that though there is arobust response during the early parts of both ND andD trials, and a similarly robust response during thelater parts of D trials, the activity returns to baselineduring the delay period. This region was composed of asingle voxel in right prefrontal cortex. The contrast forD2 1 D3 yielded a t value of 1.12 (NS) while thecontrast (D1 1 D4) 2 (ND1 1 ND4) yielded a t value of5.6 (mapwise significant at a 5 0.05).
Test for Sustained Delay Period Activity
As a final test of the method, the whole dataset ofSubject V was tested for regions that exhibited asignificant increase in functional activity during thedelay period. Many brain regions displayed such anincrease (data not shown; general results will be pre-sented elsewhere). The trial-averaged time series from
a region of right prefrontal cortex is shown in Fig. 10.The t value corresponding to (D2 1 D3) was 6.82 (map-wise significant at a 5 0.05). The increased level offMRI signal corresponding to the delay period detectedby the model (as compared to the ITI) is also evidentvisually (Fig. 10). The location of this voxel was onlyapproximately 1 cm away from the voxel whose trial-averaged time series is displayed in Fig. 9.The fMRI signal of Fig. 10 displayed peaks at the
beginning and end of D trials. This behavior is associ-ated in time with the target stimulus presentation anddiscrimination periods of D trials. Despite this unevenbehavior, the fit of the model was quite adequate (Fig.10). This good fit is provided by the use of multipleshifted IRFs which flexibly model the signal changes ineach type of trial. Such a close agreement betweenpredicted and observed values would not have beenachieved if a single independent variable which spannedthe delay period was used.It might initially be argued that one would not
require delay period activity to explain the bimodalbehavior displayed during D trials in Fig. 10. Rather, itmight be contended that the observed waveform couldsimply be explained by the sum of two phasic re-sponses: one associated with the stimulus presentationand one with the choice period. However, this argumentis not valid as any variance that can be explained inthat manner (i.e., explainable by D1 and D4) will not
4 It may be surprising that there was any ipsilateral sensorimotoractivation at all. However, contralateral muscular activity (Dettmerset al., 1995) and ipsilateral functional activation (Dettmers et al.,1995; Schroder et al., 1995; Blinkenberg et al., 1996) have beenreported with task-related unilateral movements.
FIG. 9. The trial-averaged fMRI signal from a region (1 voxel insize) in right PFC. The contrast (D1 1 D4) 2 (ND1 1 ND4) wassignificantly greater than zero (at a map-wise a 5 0.05) in thisregion. Additionally, the contrast D2 1 D3 (i.e., corresponding to thecovariates that model the delay period) was not significant in thisregion. Together, these results suggest, but do not prove, thatcognitive subtraction failed in this region (for an explanation of thesymbols, see legend to Fig. 8).
133TRIAL-BASED fMRI

contribute to the significance of the relationship of D2or D3. This is in fact the basis of the reasoning for thelack of reliance on cognitive subtraction in this setting.If the same test of cognitive subtractive assumptions
applied to the time series of Fig. 9 is applied to the voxelof Fig. 10, it fails as well [(D1 1 D4) 2 (ND1 1 ND4)yields a t value of 7.13, P , 0.00001]. But again, thevariance explainable by D1 andD4 did not contribute tothe statistical significance of the coefficients D2 or D3.Thus, the possibility that cognitive subtraction did failin this voxel does not detract from the conclusion thatthis voxel did indeed display functional activity thatcorrelated with the delay period. This indifference tothe assumptions of cognitive subtraction is a directresult of using a TB design that modeled the fMRIresponses during multiple temporal periods within asingle trial.
DISCUSSION
The Validity of the TB Design
Statistical specificity was demonstrated for this par-ticular implementation of a TB design. The issue ofstatistical specificity is of course, not particular to TBdesigns. However, that the false-positive rate was notsignificantly different from the nominal level makes theresults of the other validation tests, particularly thoseof functional sensitivity, amenable to interpretation.The results presented support the sensitivity of the
TB design in two ways. First, the fMRI signal changes
in sensorimotor cortex had significant relationshipswith a task variable corresponding to the execution of amotor response during ND trials. Second, in the spa-tially averaged time series from those same voxels, arelationship was present with another task variablethat corresponded to the execution of a motor responseduring D trials. The absence of such expected func-tional responses would have provided grounds to dis-pute the validity of the TB design.The functional specificity of the TB design imple-
mented here was unable to be refuted. First, periods oftime in the behavioral trials that lacked a requiredmotor response (but shared other contextual elementsof the task) displayed significantly smaller fMRI signalchanges in sensorimotor cortex than periods of time inthe trials that required amotor response (in those sametime series). Second, laterality of motor output wasassociated with appropriately lateralized functionalactivity in sensorimotor cortex.This latter test of functional specificity involved
separatemodeling of the fMRI responses correspondingto left- and right-handed motor output which occurredin an experimentally uncontrolled manner according tothe subject’s choice. This type of analysis based uponuncontrolled trial characteristics could be performedonly within the framework of a TB design. This sort ofanalysis could also be performed using other aspects ofbehavior in many different behavioral paradigms totest structure:function hypotheses. For example,Aguirre and colleagues (1997) were able to use a TBdesign in conjunction with a word-recognition para-digm to compare the functional signals in the hippocam-pus associated with correctly vs incorrectly recognizedwords (an experimentally uncontrolled variable) aswell as old vs new words (an experimentally controlledvariable).
Temporal Characteristics of BOLD fMRI Signalsand TB Designs
The nature of the quantitative relationship betweenneural activity and fMRI signal change is not com-pletely understood at present. Though there have beenobservations of some nonlinearities in the system(Vasquez and Noll, 1996), it has been reported to betime-intensity separable (Boynton et al., 1996). That is,varying the intensity, or amplitude, of the input signal(i.e. neural activity) seemed to vary the intensity of theoutput signal, but not its time course (Boynton et al.,1996). This observation, if reliable, is very importantfor fMRI as a neuroimaging method as it allows one totheoretically distinguish between changes in durationand intensity of neural activity by looking for differ-ences in the shape or scaling, respectively, of the fMRItime course (however, see Vasquez and Noll, 1996).Coarsely, this means that the fMRI signal change
FIG. 10. The trial-averaged fMRI signal from a region (1 voxel insize) also in right PFC that did show significant activity during thedelay as assessed by a joint test of the significance of the contrast(D2 1 D3) and the significance of the contrast [(D2 1 D3) 2 (ND2 2
ND3)] (for an explanation of the symbols, see legend to Fig. 8).
134 ZARAHN, AGUIRRE, AND D’ESPOSITO

associated with neural activity of a certain durationwould not be expected to ‘‘leak over’’ in unpredictableways into adjacent temporal periods of the time serieswhen its intensity varies. Rather, the property oftime-intensity separability should allow one to model(at least approximately) the fMRI changes associatedwith neural activity occurring during particular peri-ods of time.Richter et al. (1996) observed well-resolved fMRI
responses in contralateral motor cortex to individualfinger movements (button presses) that were separatedfrom each other by only a few seconds. The BOLDautocorrelation function obtained in the current studyalso suggests that a temporal resolution of about 4–6 sshould be easily attainable. Increased numbers ofobservations would theoretically allow detection of agiven signal with even more closely spaced set of IRFs.Such amethodmight be desirable when testing hypoth-eses about neural events that are separated by only 1 or2 s. However, more experimental work on the temporaldynamics of the BOLD signal must be performed beforesuch analyses could be interpreted with any confidence.The data from a separate subject were used to obtain
an IRF which was subsequently used in the composi-tion of the independent variables for the TB analysis. Itwas not known a priori if the IRF obtained from onesubject would be applicable to the data of anothersubject. Richter et al. (1996) reported some variabilityacross subjects in evoked fMRI responses in sensorimo-tor cortex. Boynton et al. (1996) reported very similarIRFs for two subjects when the IRFs were derived fromfMRI responses to periodic visual stimuli and slightlydifferent IRFs when they were determined with pulsedstimuli. In the current study, there seemed to beacceptable, but not superb, agreement between theevoked responses in sensorimotor cortex between thepreliminary and the validation datasets used in thisstudy. The fMRI responses in sensorimotor cortex fromboth datasets peaked (using interpolated values) be-tween 4 and 6 s after the onset of the discriminationstimuli during ND trials. One notable difference be-tween the IRFs from the two datasets was that the IRFfrom subject V was apparently narrower than that ofsubject P. This slight disagreement caused a relativelyinferior modeling of transients during D4 (compared toND1).5 Another difference was the presence of anundershoot observed in subject V but not in subject P. Itis possible that the failure to explicitly model the
undershoot as a component of the IRF caused anoverstringent test of delay activity in subject V. Thelinear nature of this undershoot would seem to be animportant question for the interpretation of all TBdesigns and a topic for future research. Overall, theseresults suggest that while using the IRF from a differ-ent subject as the basis for forming independent vari-ables is practicable, the IRFs from different subjects dodisplay some variability.In addition to varying across subjects, the IRF could
theoretically vary across regions within a subject. Totest this idea one must make an assumption about thetemporal profile of neural activity in both regions. Ifone assumes that the temporal profile of neural activityassociated with ND trials was identical in both sensori-motor and prefrontal cortex, then the results presentedhere suggest that the IRF of a region of the prefrontalcortex peaked at about 2 s after that of the sensorimotorcortex (from Fig. 9 vs Figs. 8A and 8B). A lag differencebetween regional IRFs was also reported by Buckner etal. (1996), who showed that within a subject, a prefron-tal cortex response peaked about 1 s after the responsefrom an extrastriate region. The regional variation inIRFs could have been due to (1) differing temporalpatterns of neural activity in the different regions, (2)regional differences in physiological coupling betweenneuronal activity and blood flow changes, and (3)regional differences in the diameter of blood vesselscontained in the voxels of the observed regional activa-tions (Lee et al., 1995). However, a second putative IRFfrom prefrontal cortex presented in the current reporthad a very similar peak time and width to that of thesensorimotor cortex (Fig. 10).Additionally, the region oforigin for the time series of Figs. 9 and 10 wereapproximately 1 cm apart. This result casts doubt onthe hypothesis of there necessarily being a slowerBOLD fMRI IRF in all higher association cortex than inprimary (sensorimotor) cortex. Unfortunately though,this result sheds no light on the possible cause(s) of theobserved regional variability in fMRI transients (com-pare Fig. 9 to Figs. 8A, 8B, and 10).
Cognitive Subtraction in Short-Term Memory Paradigms
The use of cognitive subtraction to isolate the neuralsubstrates associated with a particular cognitive pro-cess involves the assumption of pure insertion. Pureinsertion is the idea that a cognitive process can beadded to a preexisting set of cognitive processes with-out affecting them. To prove this, one would need anindependent measure of the preexisting processes inthe absence and in the presence of the new process.This is an ill-posed problem as one has no way ofdifferentiating the manifestation of the preexistingprocesses from the new process when they are together.This problem exists in both chronometric psychologicalstudies (Sternberg, 1969) and neuroimaging (Friston et
5 The reason for the better modeling of ND1 period transients insensorimotor cortex compared to the modeling of D4 period tran-sients is the presence of the ND2-independent variable. A positiverelationship with ND1 combined with a negative relationship withND2 could effectively model a narrower response than any indepen-dent variable alone. As there was no independent variable followingD4 in time (i.e., a D5), the mismatch in IRFs between subjects P andV impacted the modeling of this transient to a greater extent.
135TRIAL-BASED fMRI
al., 1996a). In hemodynamic neuroimaging there is arequirement in addition to pure insertion for cognitivesubtractive methodology to yield nonartifactual re-sults: the linearity of the transform between neuralsignal and hemodynamic signal. Without linearity, anysubtractive results are prone to artifact, even if pureinsertion holds at a neural processing level.Anow commonplace usage of cognitive subtraction in
hemodynamic neuroimaging is in the study of theneural substrates of short-term or working memory.The realization of cognitive subtractive assumptions inparadigms which attempt to tap working memoryinvolves the pure insertion of a delay period (duringwhich working memory is engaged) in between a ‘‘per-ceptual’’ process (the presentation of the item(s) to bestored) and a ‘‘choice’’ process (making some decisionbased upon the item that was stored) (Jonides et al.,1993). The neural substrates of the working memoryprocess engaged during the delay, added to the presum-ably unchanged perceptual and choice processes, areproposed to be revealed by a subtraction of the inte-grated (i.e., averaged, summed, or totaled) functionalhemodynamic signal during a no-delay condition (analo-gous to the ND condition of the current study) from thatduring a delay condition (analogous to the D conditionof the current study). It is possible to conceive failuresof this contrivance. Artifacts of cognitive subtractionmight lead to the inference that a region displayedincreases in functional activity during the delay periodwhen in actuality it did not. This possibility receivedempirical support in the present study. Regions wereobserved that did not display increases in signaluniquely attributable to the delay, yet showed greaterintegrated task associated activity during D trials thanduring ND trials. This result suggests that the validityof cognitive subtraction might not hold in some brainregions in the context of this paradigm. The proposedTB design has the advantage of being able to use thetime dimension to resolve the fMRI signal attributableto the delay period from that attributable to the othercomponents of the task. Using this method, regionsthat displayed functional activity increases uniquelyattributable to the delay period were detected. Thenotable aspect of this result is that it seems nearlyimmune to possible failures of cognitive subtractionakin to the ones mentioned above. The use of a TB typedesign should allow similar investigations of the neuralsubstrates of short-term/working memory without theonus of cognitive subtractive assumptions. This ap-proach is similar conceptually to the manner in whichthese processes are studied in nonhuman primateselectrophysiologically (Fuster, 1982).The evidence against the use of cognitive subtractive
methodology in this paradigm was derived from aregion that did not display sustained activity duringthe delay. Nevertheless, it would be logically incorrect
to conclude that cognitive subtraction has been irrefut-ably shown to not hold from the results of this study.6However, to the extent that an the inability to find sucha region would have supported cognitive subtractiveassumptions, this result provides grounds for beingsomewhat wary of the fruits of cognitive subtraction inthis paradigm. Future electrophysiological experi-ments in nonhuman primates explicitly aimed at test-ing cognitive subtraction using classic short-termmemory paradigms would be helpful in addressing thismajor issue in cognitive neuroscience and neuroimag-ing. A benefit of performing these studies electrophysi-ologically (in addition to the greatly increased temporalresolution) would be that the pure insertion (in a neuralprocessing sense) assumption could be examined sepa-rately from the BOLD system linearity assumption.The test for delay activity used here involved compari-
sons of trial-evoked fMRI responses with the ITI. Thishypothesis test is to be contrasted with those per-formed in blocked designs that involve comparisons ofthe average signal during a block of D trials to theaverage signal during a block of ND trials. In additionto the problem of collapsing across behavioral subcom-ponents within a trial, this latter test would be sensi-tive to contributions from the block-specific ITIs. TheTB design used here controlled this confound by ran-domizing trial order, thus making prediction of trialtype, and hence the engaging of trial-type specificprocesses during the ITI, impossible.
Relation to Previous Work
The modeling of phasic changes in fMRI signal hasbeen proposed previously (Friston et al., 1995b). Fris-ton and colleagues described an analysis method usingbasis functions as covariates for the purpose of model-ing task-dependent adaptation as well as other types oftransient responses in blocked designs. There was noextension to TB analysis. However, an important gen-eral methodological concept presented in that reportwas the use of a priori defined response functions in thecontext of the GLM to model phasic fMRI changes. Thismethod has been applied here to effect a TB design andanalysis. In the current implementation of the generalmethod of Friston et al. (1995b), the chosen responsefunctions were shifted IRFs. Though these functionsshould not be formally considered a set of basis func-tions (as they do not strictly span the space of all
6 The reason that cognitive subtraction was not proven to havefailed here is that D1 and D4will tend to explain fMRI signal changesattributable to the neighborhood of time at the beginning or end ofthe delay period, not only impulses at these junctures. An increase inneural activity extending slightly after the stimulus presentationperiod and/or starting shortly before the choice period of D trialscompared to the homologous periods of ND trials would tend to causea failure of the test used here, even though neither pure insertion norlinearity might have failed.
136 ZARAHN, AGUIRRE, AND D’ESPOSITO
possible responses), they did seem to provide generallyadequate fits to the observed fMRI signal changes.Also,the use of shifted IRFs as the response functions didhave the advantage in this context of complete, intheory, explanation of the expected fMRI signal changesattributable to neural activity at the beginning and endof D trials.Buckner et al. (1996) have examined the trial-
averaged fMRI signal observed during behavioral trialsin which subjects engaged in word-stem completion.Transient fMRI responses to these behavioral trialswere reported in prefrontal cortex and extrastriatevisual areas. They reported overlap in the activationmaps derived from analyses of the fMRI signal changesassociated with word-stem completion in single trialand blocked designs. This result is sufficient for demon-strating at least some validity of TB designs, contin-gent of course upon the validity of blocked designs.However, complete overlap in the results from a blockeddesign and a trial-based design would not seem neces-sary for the validity of TB designs to hold. This isbecause of all the differences between TB and blockeddesigns (see Introduction). Indeed, if single-trial de-signs and blocked designs were always expected toyield the same results, then there would be no purposefor choosing one over the other. On the contrary, theimpetus for this report is the possibility that therecould be meaningful differences in the informationprovided by TB and blocked designs.There are notable differences between the analysis
methods used by Buckner et al. (1996) and thoseoutlined in the current report. The statistical methodused in Buckner et al. (1996) was the Kolmogronov–Smirnov (KS) test. This test is sensitive to any differ-ence in the cumulative probability distributions of twosets of data (Press et al., 1988). A significant differencebetween two conditions obtained with the KS testcannot necessarily be attributed to a difference inmeans between conditions. In contrast, the currentreport utilized a parametric statistical model that wassensitive to covariations between the functional hemo-dynamic signal and a priori defined response functions(Friston et al., 1995b). It is these covariations in BOLDsignal which have been demonstrated to be functionalmarkers in physiological studies (Kwong et al., 1992;Ogawa et al., 1993; Malonek and Grinvald, 1996).
CONCLUSIONS
In summary, we have described and provided aninitial validation for a class of fMRI experimentaldesigns referred to as a trial-based designs. Trial-baseddesigns exploit the temporal resolution of fMRI tomodel fMRI signal changes associated with behavioraltrials as opposed to blocks of behavioral trials. Widelyapplicable advantages of this method, from an experi-
mental psychological perspective, include the ability to(1) randomize the presentation of behavioral trials and(2) utilize intertrial variance in uncontrolled behav-ioral measures to examine their functional correlates.Afurther advantage of the particular TB design de-scribed here is the ability to look separately at theneural substrates of behavioral components temporallydissociable on the order of a few seconds. Importantmethodological issues for future research in this areaare the linear/nonlinear properties of the BOLD signaland the possibility/causes of intersubject and interre-gion variation in evoked BOLD IRFs.
ACKNOWLEDGMENTS
This research was supported by the McDonnell-Pew Program inCognitive Neuroscience, by the Charles A. Dana Foundation, and byNIH Grants NS 01762 andAG13483.
REFERENCES
Aguirre, G. K., Zarahn, E. Z., and D’Esposito, M. 1997. A test of therelationship between hippocampal activity and correct word recog-nition with trial-based fMRI. In Fourth Annual Meeting of theCognitive Neuroscience Society, Boston, MA, p. 63.
Blinkenberg, M., Bonde, C., Paulson, O. B., Svarer, C., and Law, I.1995. Rate dependence of cerebral activation during performanceof a repetitive motor task. In First International Conference onFunctional Mapping of the Human Brain, Paris, France, p. 280.
Boynton, G. M., Engel, S. A., Glover, G. H., and Heeger, D. J. 1996.Linear systems analysis of functional magnetic resonance imagingin human V1. J. Neurosci. 16:4207–4221.
Buckner, R. L., Bandettini, P. A., O’Craven, K. M., Savoy, R. L.,Petersen, S. E., Raichle, M. E., and Rosen, B. R. 1996. Detection ofcortical activation during averaged single trials of a cognitive taskusing functional magnetic resonance imaging. Proc. Natl. Acad.Sci. 93:14878–14883.
Conrad, B., and Klingelhofer, J. 1989. Dynamics of regional cerebralblood flow for various visual stimuli. Exp. Brain Res. 77:437–441.
Dettmers, C., Fink, G. R., Lemon, R. N., Stephan, K. M., Passingham,R. E., Silbersweig, D., Holmes,A., Ridding,M. C., Brooks, D. J., andFrackowiak, R. S. J. 1995. Relation between cerebral activity andforce in the motor areas of the human brain. J. Neurophysiol.74:802–815.
Friston, K. J., Ashburner, J., Frith, C. D., Poline, J.-B., Heather, J. D.,and Frackowiak, R. S. J. 1995a. Spatial registration and normaliza-tion of images.Hum. Brain Mapping 2:165–189.
Friston, K. J., Frith, C. D., Turner, R., and Frackowiak, R. S. J. 1995b.Characterizing evoked hemodynamics with fMRI. NeuroImage2:157–165.
Friston, K. J., Holmes, A. P., Worsley, K. J., Poline, J. P., Frith, C. D.,and Frackowiak, R. S. J. 1995c. Statistical parametric maps infunctional imaging: A general linear approach. Hum. Brain Map-ping 2:189–210.
Friston, K. J., Jezzard, P., and Turner, R. 1994. Analysis of functionalMRI time-series.Hum. Brain Mapping 1:153–171.
Friston, K. J., Price, C. J., Fletcher, P., Moore, C., Frackowiak, R. S.J., and Dolan, R. J. 1996a. The trouble with cognitive subtraction.NeuroImage 4:97–104.
137TRIAL-BASED fMRI

Friston, K. J., Williams, S., Howard, R., Frackowiak, R. S. J., andTurner, R. 1996b. Movement-related effects in fMRI time-series.Magn. Reson. Med. 35:346–355.
Funahashi, S., and Kubota, K. 1994. Working memory and prefrontalcortex.Neurosci. Res. 21:1–11.
Funhashi, S., Bruce, C. J., and Goldman-Rakic, P. S. 1989. Mnemoniccoding of visual space in the monkey’s dorsolateral prefrontalcortex. J. Neurophysiol. 61:331–349.
Fuster, J. M., Bauer, R. H., and Jervey, J. P. 1982. Cellular dischargein the dorsolateral prefrontal cortex of the monkey in cognitivetasks. Exp. Neurol. 77:679–694.
Gnadt, J. W., and Andersen, R. A. 1988. Memory related motorplanning activity in posterior parietal cortex of macaque. Exp.Brain Res. 70:216–220.
Johnson, M. K., Nolde, S. F., Mather, T. E. M., Kounios, J., Schacter,D. L., and Curran, T. 1996.Mental agendas can affect the similarityassociated with true and false recognition memory. Psychol. Sci. 8:250–257.
Jonides, J., Smith, E. E., Koeppe, R. A., Awh, E., Minoshima, S., andMintun, M. A. 1993. Spatial working memory in humans asrevealed by PET.Nature 363:623–625.
Kleinbaum, D. G., Kupper, L. L., and Muller, K. E. 1988. AppliedRegression Analysis and Other Multivariable Methods. DuxburyPress, Belmont, CA.
Kwong, K. K., Beliveau, J. W., Chesler, D. A., Goldberg, I. E.,Weisskoff, R. M., Poncelet, B. P., Kennedy, D. N., Hoppel, B. E.,Cohen, M. S., Turner, R., et al. 1992. Dynamic magnetic resonanceimaging of human brain activity during primary sensory stimula-tion. Proc. Natl. Acad. Sci. 89:5675–5679.
Lee, A. T., Glover, G. H., and Meyer, C. H. 1995. Discrimination oflarge venous vessels in time-course spiral blood-oxygen-level-dependent magnetic resonance functional imaging. Magn. Reson.Med. 33:745–754.
Leniger-Follert, E., and Hossmann, K. A. 1979. Simultaneous mea-surements of microflow and evoked potentials in the somatomotorcortex of the cat brain during specific sensory activation. PfluegersArch. 380:85–89.
Malonek, D., and Grinvald, A. 1996. Interactions between electricalactivity and cortical microcirculation revealed by imaging spectros-copy: Implications for functional brain. Science 272:551–554.
Nyberg, L., McIntosh, A. R., Houle, S., Nilsson, J. G., and Tulving, E.1996. Activation of medial temporal structures during episodicmemory retrieval.Nature 380:715–717.
Ogawa, S., Menon, R. S., Tank, D. W., Kim, S. G., Merkle, H.,Ellermann, J. M., and Ugurbil, K. 1993. Functional brain mappingby blood oxygenation level-dependent contrast magnetic resonanceimaging. A comparison of signal characteristics with a biophysicalmodel. Biophys. J. 64:803–812.
Pardo, J. V., Fox, P. T., and Raichle, M. E. 1991. Localization of ahuman system for sustained attention by positron emission tomog-raphy.Nature 349:61–64.
Pleydell-Pearce, C. W. 1994. DC potential correlates of attention andcognitive load. Cognit. Neuropsychol. 11:149–166.
Press, W. H., Flanner, B. P., Teukolsky, S. A., and Veterling, W. T.1992. Numerical Recipes in C: The Art of Scientific Computing.Cambridge Univ. Press, NewYork.
Richter, W., Ugurbil, K., and Kim, S. G. 1996. Limitations of temporalresolution in fMRI. In Second International Conference on Func-tional Mapping of the Human Brain, Boston, MA, p. S38.
Roediger, H. L., andMcDermott, K. B. 1995. Creating falsememories:Remembering words not presented in lists. J. Exp. Psychol. Learn-ing Memory Cognit. 21:803–814.
Schacter, D. L., Reiman, E., Curran, T., Yun, L. S., Bandy, D.,McDermott, K. B., and Roediger, I. H. 1996. Neuroanatomicalcorrelates of veridical and illusory recognition memory: Evidencefrom positron emission tomography.Neuron 17:267–274.
Sternberg, S. 1969. The discovery of processing stages: Extensions ofDonder’s method. Acta Psychol. 30:276–315.
Tulving, E., Markowitsch, H. J., Craik, F. I. M., Habib, R., and Houle,S. 1996. Novelty and familiarity activations in PET studies ofmemory encoding and retrieval. Cerebr. Cortex 6:71–79.
Vasquez, A. L., and Noll, D. C. 1996. Non-linear temporal aspects ofthe BOLD response in fMRI. In Proceedings of the InternationalSociety for Magnetic Resonance in Medicine, New York, NY, p. 1765.
Worsley, K. J., and Friston, K. J. 1995. Analysis of fMRI time-seriesrevisited—Again.NeuroImage 2:173–182.
Zarahn, E., Aguirre, G. K., and D’Esposito, M. 1997. Empiricalanalyses of BOLD fMRI statistics. I. Spatially unsmoothed datacollected under null-hypothesis conditions. NeuroImage 5:179–197.
138 ZARAHN, AGUIRRE, AND D’ESPOSITO
Copyright © 2022 FDOKUMEN