Trial Indication(s) Protocol Number Protocol Title Clinical Trial Phase
74
Clinical Trial Results Website CLHW090X2101 Page 1 Sponsor Novartis Generic Drug Name Not applicable Trial Indication(s) Resistant hypertension Protocol Number CLHW090X2101 Protocol Title A partially-blinded, randomized, placebo-controlled, adaptive single and multiple ascending dose study to assess safety, tolerability, pharmacokinetics and pharmacodynamics of LHW090 in healthy volunteers and in subjects with renal dysfunction Clinical Trial Phase Phase I
-
Upload
khangminh22 -
Category
Documents
-
view
1 -
download
0
Transcript of Trial Indication(s) Protocol Number Protocol Title Clinical Trial Phase

Clinical Trial Results Website CLHW090X2101
Page 1
Sponsor
Novartis
Generic Drug Name
Not applicable
Trial Indication(s)
Resistant hypertension
Protocol Number
CLHW090X2101
Protocol Title
A partially-blinded, randomized, placebo-controlled, adaptive single and multiple ascending dose study to assess safety, tolerability, pharmacokinetics and pharmacodynamics of LHW090 in healthy volunteers and in subjects with renal dysfunction
Clinical Trial Phase
Phase I

Clinical Trial Results Website CLHW090X2101
Page 2
Phase of Drug Development
Phase I
Study Start/End Dates
01-Mar-2013 to 28-Jun-2014
Reason for Termination (If applicable)
Not applicable
Study Design/Methodology
This study was an exploratory (non-confirmatory), five stage, multi-center study as follows:
•Stage 1 – an open-label, single dose (1 mg), single administration cohort in healthy volunteers to determine the preliminary pharmacokinetics of LHW090.
•Stage 2 – double-blind, randomized, placebo-controlled, single ascending dose (SAD) cohorts in healthy volunteers to determine safety, tolerability and PK/PD profile of LHW090.
•Stage 3 – double-blind, randomized, placebo-controlled multiple ascending dose (MAD) cohorts in healthy volunteers to determine safety, tolerability and PK/PD profile of LHW090.
•Stage 4 – adaptive, open-label, single dose administration cohorts in subjects with CRI. Two or more doses of LHW090, selected from Stage 2, were tested in Stage 4 to determine the safety, tolerability and PK/PD profile of LHW090 in this subject population.

Clinical Trial Results Website CLHW090X2101
Page 3
•Stage 5 –double-blind, randomized, placebo-controlled, MAD cohorts in subjects with CRI. A dose of LHW090 from Stage 4 was tested in Stage 5 to determine the safety, tolerability and PK/PD profile of LHW090 in this subject population. Each subject received 4 doses of LHW090.
Centers
3 centers in 1 country: United States (3)
Objectives:
Primary objective(s)
To evaluate the safety and tolerability of single oral doses of LHW090 in healthy volunteers.
To evaluate the safety and tolerability of multiple oral doses of LHW090 in healthy volunteers.
To evaluate the safety and tolerability of single oral doses of LHW090 in patients with chronic renal insufficiency.
To evaluate the safety and tolerability of multiple oral doses of LHW090 in patients with chronic renal insufficiency.
Secondary objective(s)
To evaluate and compare the pharmacokinetic and pharmacodynamic profiles (i.e., plasma atrial natriuretic peptide (ANP) and cyclic guanosine monophosphate (cGMP) levels) of single doses of LHW090 and its metabolites in healthy volunteers and in subjects with chronic renal insufficiency (CRI).
To evaluate the pharmacokinetics of LHW090 and its metabolites after single and multiple doses to healthy volunteers.
To evaluate the pharmacokinetics of LHW090 and its metabolites after single and multiple doses in subjects with CRI.
Test Product (s), Dose(s), and Mode(s) of Administration
The investigational drug, LHW090, (0.1 mg, 0.5 mg, 1 mg, 12.5 mg, 100 mg and matching placebo capsules)

Clinical Trial Results Website CLHW090X2101
Page 4
Statistical Methods
•For primary objective of safety, within each of Stage 2, 3, and 5, placebo subjects from across the cohorts were pooled together for assessment. Summary statistics were provided by treatment and visit/time.
•The secondary PD variables analyzed were plasma cGMP and ANP. Plasma cGMP and ANP were listed by treatment, subject, and visit/time. Summary statistics were provided by treatment and visit/time for each stage.
•Pharmacokinetic (PK) parameters were summarized using descriptive statistics and dose proportionality was assessed using the power model.
•The relationship between PK and key PD parameters (plasma ANP and cGMP) were explored using a graphical approach. Scatter plots along with regression line between plasma PD parameters levels with plasma PK concentration of LHW090 and LHV527 were provided.
Study Population: Key Inclusion/Exclusion Criteria
Inclusion Criteria:
For Stage 1, 2 and 3 subjects only:
Subjects eligible for inclusion in these stages of the study have to fulfill all of the following criteria at screening:
Healthy male and female subjects age 18 to 45 years of age included, and in good health as determined by past medical history, physical examination, vital signs, electrocardiogram, and laboratory tests at screening.
At screening, and first baseline, vital signs (systolic and diastolic blood pressure and pulse rate) will be assessed in the sitting position after the subject has rested for at least three minutes, and again (when required) after three minutes in the standing position. Sitting vital signs should be within the following ranges:
oral body temperature between 35.0-37.5 °C systolic blood pressure, 90-140 mm Hg diastolic blood pressure, 50-90 mm Hg pulse rate, 40 - 90 bpm
For Stage 4 subjects only:

Clinical Trial Results Website CLHW090X2101
Page 5
Male and female subjects, age 18 to 75 years of age included, with previously identified chronic renal insufficiency (estimated or measured GFR ≤ 45ml/min/1.73m2, or diabetic with estimated or measured GFR ≤ 60ml/min/1.73m2.) Diabetes can be established by the prescription and current use of anti-glycemic drugs, a random fasting glucose level of ≥ 144mg/dl or a hemoglobin A1c of ≥ 6.5%
At screening, vital signs (systolic and diastolic blood pressure and pulse rate) will be assessed in the sitting position after the subject has rested for at least three minutes, and again (when required) after three minutes in the standing position. Sitting vital signs should be within the following ranges:
oral body temperature between 35.0-37.5 °C
systolic blood pressure, 90-179 mm Hg
diastolic blood pressure, 50-100 mm Hg
pulse rate, 40 - 95 bpm
Exclusion Criteria:
For Stages 1, 2 and 3, subjects fulfilling any of the following additional criteria are not eligible for inclusion in this study:
An active history of clinically significant ECG abnormalities as determined by the Investigator, or any of the following ECG abnormalities at Screening or Baseline:
Long QT syndrome
QTcF > 450 msec (males; at screening)
QTcF > 460 msec (females; at screening)
Known history of current clinically significant arrhythmias.
Use of phosphodiesterase-5 inhibitors, UNLESS subjects agree to discontinue use of the drug for the duration of the study.
Pregnant or nursing (lactating) women, where pregnancy is defined as the state of a female after conception and until the termination of gestation, confirmed by a positive hCG laboratory test.
Women of child-bearing potential, defined as all women physiologically capable of becoming pregnant
Smokers (use of tobacco products in the previous 3 months). Urine cotinine levels will be measured during screening and at each baseline for all subjects. Smokers will be defined as any subject who reports tobacco use and/or who has a urine cotinine ≥ 500 ng/ml.
Hemoglobin levels below 11.0 g/dl at screening.

Clinical Trial Results Website CLHW090X2101
Page 6
Subjects in Stage 3 only of the study will be excluded if they have any of the following:
A history of allergy to topical anesthetic drops
A history of corneal disease
A history of eye surgery within three months prior to screening
A history of corneal surgery (including refractive surgery and corneal transplantation)
For Stage 4, subjects fulfilling any of the following additional criteria are not eligible for inclusion in this study:
An active history of clinically significant ECG abnormalities as determined by the Investigator, or any of the following ECG abnormalities at Screening or Baseline:
Long QT syndrome
QTcF > 480 msec at screening
Use of phosphodiesterase-5 inhibitors, UNLESS subjects agree to discontinue use of the drug for the duration of the study.
Pregnant or nursing (lactating) women, where pregnancy is defined as the state of a female after conception and until the termination of gestation, confirmed by a positive hCG laboratory test.
Women of child-bearing potential, defined as all women physiologically capable of becoming pregnant
Significant smokers. Significant smokers who are unable to tolerate using no more than 4 cigarettes a day should be excluded
History of right ventricular dysfunction within the last 12 months
Hemoglobin levels below 9.0 g/dl at screening.
Use of angiotensin converting enzyme inhibitors (ACEi), UNLESS subjects agree to either a withholding of their ACEi, or a switch to an angiotensin receptor blocker, starting 5 days (or 5 half-lives whichever is longer) prior to initiation of study and extending to the end-of-study visit. Patient who withhold their ACEi for the specified duration must first consult with their primary physician to determine their suitability and safety for this temporary withholding of ACEi.
Diuretic-dependence, i.e. unable to produce urine without diuretics, or at high risk of flash pulmonary edema without diuretics. Use of diuretics will exclude subjects UNLESS subjects agree to withhold diuretics starting the day prior to check-in and extending to discharge. Consultation of the subject with their primary physician must be used to determine their suitability and safety for temporary withholding of their diuretics.

Clinical Trial Results Website CLHW090X2101
Page 7
Participant Flow Table
Subject disposition – n (percent) of subjects - Stage 1 (safety analysis set)
LHW090 1mg N=3
Subjects
Completed 3 (100)
Subject disposition – n (percent) of subjects - Stage 2 (safety analysis set)
1mg SAD N=8
5mg SAD N=8
25mg SAD N=8
50mg SAD N=8
100mg SAD N=8
0.1mg SAD N=8
200mg SAD N=8
400mg SAD N=8
800mg SAD N=8
400mg SAD (Japanese ethnicity) N=8
Pooled placebo N=20
Total N=100
Subjects
Completed 8 (100) 8 (100) 8 (100) 8 (100) 8 (100) 8 (100) 8 (100) 8 (100) 8 (100) 8 (100) 20 (100) 100 (100)
Subject disposition - n (percent) of subjects - Stage 3 (Safety analysis set)
LHW090 5mg MAD N=6
LHW090 25mg MAD N=6
LHW090 50mg MAD N=6
LHW090 100mg MAD N=6
LHW090 200mg MAD N=6
LHW090 400mg MAD N=6
Pooled placebo N=12
Total N=48
Subjects
Completed 6 (100) 6 (100) 6 (100) 6 (100) 6 (100) 6 (100) 12 (100) 48 (100)

Clinical Trial Results Website CLHW090X2101
Page 8
Subject disposition – n (percent) of subjects - Stage 4 (Safety analysis set)
LHW090 5mg SAD N=6
LHW090 12.5mg SAD N=9
LHW090 25mg SAD N=9
LHW090 2mg SAD N=9
LHW090 5mg SAD N=9
Total N=42
Subjects
Completed 5 (83.3) 9 (100) 9 (100) 9 (100) 9 (100) 41 (97.6)
Discontinued 1 (16.7) 0 (0.0) 0 (0.0) 0 (0.0) 0 (0.0) 1 (2.4)
Main cause of discontinuation
Subject withdrew consent 1 (16.7) 0 (0.0) 0 (0.0) 0 (0.0) 0 (0.0) 1 (2.4)
Subject disposition – n (percent) of subjects - Stage 5 (Safety analysis set)
LHW090 5mg MAD N=9
Pooled placebo N=3
Total N=12
Subjects
Completed 9 (100) 3 (100) 12 (100)
Baseline Characteristics
Demographic summary by treatment group - Stage 1 (safety analysis set)
LHW090 1mg N=3
Age (years) Mean (SD) 25.0 (2.65)
Median 26.0
Range 22-27
Height (cm) Mean (SD) 181.00 (11.358)

Clinical Trial Results Website CLHW090X2101
Page 9
LHW090 1mg N=3
Median 176.00
Range 173.0-194.0
Weight (kg) Mean (SD) 80.97 (16.745)
Median 74.40
Range 68.5-100.0
Body mass index (kg/m2) Mean (SD) 24.51 (2.250)
Median 24.86
Range 22.11-26.57
Sex – n (%) Male 3 (100)
Predominant race – n (%) Caucasian 2 (66.7)
Black 1 (33.3)
Ethnicity – n (%) Other 3 (100)
Clinical Trial Results Website CLHW090X2101
______________________________________________________________________________________________________________________________________
Page 10
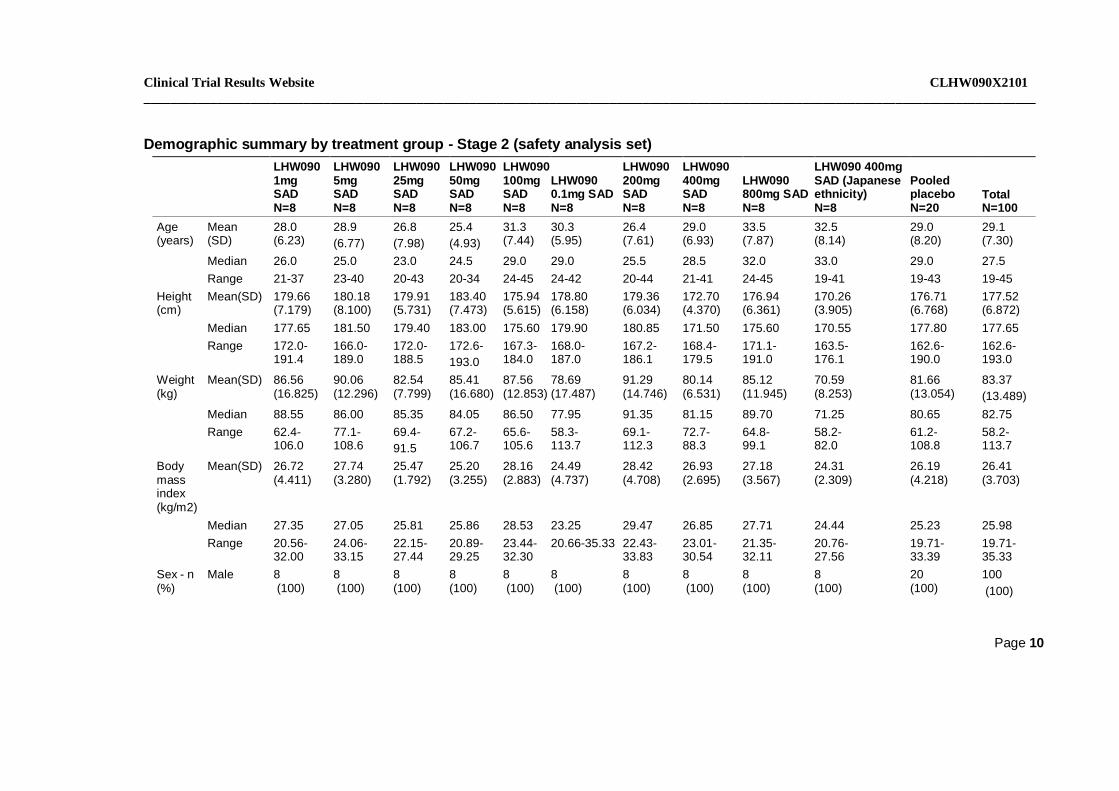
Demographic summary by treatment group - Stage 2 (safety analysis set)
LHW090 1mg SAD N=8
LHW090 5mg SAD N=8
LHW090 25mg SAD N=8
LHW090 50mg SAD N=8
LHW090 100mg SAD N=8
LHW090 0.1mg SAD N=8
LHW090 200mg SAD N=8
LHW090 400mg SAD N=8
LHW090 800mg SAD N=8
LHW090 400mg SAD (Japanese ethnicity) N=8
Pooled placebo N=20
Total N=100
Age (years)
Mean (SD)
28.0 (6.23)
28.9
(6.77)
26.8
(7.98)
25.4
(4.93)
31.3 (7.44)
30.3 (5.95)
26.4 (7.61)
29.0 (6.93)
33.5 (7.87)
32.5 (8.14)
29.0 (8.20)
29.1 (7.30)
Median 26.0 25.0 23.0 24.5 29.0 29.0 25.5 28.5 32.0 33.0 29.0 27.5
Range 21-37 23-40 20-43 20-34 24-45 24-42 20-44 21-41 24-45 19-41 19-43 19-45
Height (cm)
Mean(SD) 179.66 (7.179)
180.18 (8.100)
179.91 (5.731)
183.40 (7.473)
175.94 (5.615)
178.80 (6.158)
179.36 (6.034)
172.70 (4.370)
176.94 (6.361)
170.26 (3.905)
176.71 (6.768)
177.52 (6.872)
Median 177.65 181.50 179.40 183.00 175.60 179.90 180.85 171.50 175.60 170.55 177.80 177.65
Range 172.0- 191.4
166.0-189.0
172.0- 188.5
172.6-
193.0
167.3-184.0
168.0- 187.0
167.2-186.1
168.4- 179.5
171.1- 191.0
163.5- 176.1
162.6- 190.0
162.6- 193.0
Weight (kg)
Mean(SD) 86.56 (16.825)
90.06 (12.296)
82.54 (7.799)
85.41 (16.680)
87.56 (12.853)
78.69 (17.487)
91.29 (14.746)
80.14 (6.531)
85.12 (11.945)
70.59 (8.253)
81.66 (13.054)
83.37
(13.489)
Median 88.55 86.00 85.35 84.05 86.50 77.95 91.35 81.15 89.70 71.25 80.65 82.75
Range 62.4- 106.0
77.1-108.6
69.4-
91.5
67.2- 106.7
65.6- 105.6
58.3- 113.7
69.1- 112.3
72.7- 88.3
64.8- 99.1
58.2- 82.0
61.2- 108.8
58.2- 113.7
Body mass index (kg/m2)
Mean(SD) 26.72 (4.411)
27.74 (3.280)
25.47 (1.792)
25.20 (3.255)
28.16 (2.883)
24.49 (4.737)
28.42 (4.708)
26.93 (2.695)
27.18 (3.567)
24.31 (2.309)
26.19 (4.218)
26.41 (3.703)
Median 27.35 27.05 25.81 25.86 28.53 23.25 29.47 26.85 27.71 24.44 25.23 25.98
Range 20.56- 32.00
24.06-33.15
22.15- 27.44
20.89- 29.25
23.44-32.30
20.66-35.33 22.43-33.83
23.01- 30.54
21.35- 32.11
20.76- 27.56
19.71- 33.39
19.71- 35.33
Sex - n (%)
Male 8 (100)
8 (100)
8 (100)
8 (100)
8 (100)
8 (100)
8 (100)
8 (100)
8 (100)
8 (100)
20 (100)
100
(100)

Clinical Trial Results Website CLHW090X2101
______________________________________________________________________________________________________________________________________
Page 11
LHW090 1mg SAD N=8
LHW090 5mg SAD N=8
LHW090 25mg SAD N=8
LHW090 50mg SAD N=8
LHW090 100mg SAD N=8
LHW090 0.1mg SAD N=8
LHW090 200mg SAD N=8
LHW090 400mg SAD N=8
LHW090 800mg SAD N=8
LHW090 400mg SAD (Japanese ethnicity) N=8
Pooled placebo N=20
Total N=100
Predominant race - n (%)
Caucasian 6 (75.0)
4 (50.0)
3 (37.5)
7 (87.5)
5 (62.5)
4
(50.0)
8 (100)
2 (25.0)
4 (50.0)
0 (0.0)
16 (80.0)
59 (59.0)
Black 2 (25.0)
4 (50.0)
5 (62.5)
1 (12.5)
3 (37.5)
4 (50.0)
0 (0.0)
6 (75.0)
4 (50.0)
0 (0.0)
2 (10.0)
31 (31.0)
Asian 0 (0.0)
0 (0.0)
0 (0.0)
0 (0.0)
0 (0.0)
0 (0.0)
0 (0.0)
0 (0.0)
0 (0.0)
8 (100)
2 (10.0)
10 (10.0)
Ethnicity - n (%)
Hispanic/Latino
0 (0.0)
0 (0.0)
0 (0.0)
0 (0.0)
1 (12.5)
0 (0.0)
0 (0.0)
0 (0.0)
1 (12.5)
0 (0.0)
3 (15.0)
5 (5.0)
Japanese 0 (0.0)
0 (0.0)
0 (0.0)
0 (0.0)
0 (0.0)
0 (0.0)
0 (0.0)
0 (0.0)
0 (0.0)
8 (100)
2 (10.0)
10 (10.0)
Mixed ethnicity
0 (0.0)
0
(0.0)
0 (0.0)
0 (0.0)
0 (0.0)
0
(0.0)
0 (0.0)
0 (0.0)
1 (12.5)
0 (0.0)
1 (5.0)
2 (2.0)
Other 8 (100)
8 (100)
8 (100)
8 (100)
7 (87.5)
8 (100)
8 (100)
8 (100)
6 (75.0)
0 (0.0)
14 (70.0)
83 (83.0)
Demographic summary by treatment group - Stage 3 (safety analysis set)
LHW090 5mg MAD N=6
LHW090 25mg MAD N=6
LHW090
50mg MAD N=6
LHW090 100mg MAD N=6
LHW090
200mg MAD N=6
LHW090 400mg MAD N=6
Pooled placebo N=12
Total N=48
Age (years) Mean(SD) 35.2 (5.31) 28.7 (3.50) 31.5 (8.60) 31.3 (6.74) 37.7 (7.92) 29.7 (7.50) 31.5 (7.06) 32.1 (7.00)
Median 34.0 27.5 31.0 30.0 39.0 28.5 31.0 33.0
Range 29-42 25-33 18-42 23-39 24-45 21-42 18-40 18-45
Height (cm) Mean(SD) 178.08 (5.635) 181.52 (6.868)
171.92 (10.466) 175.17 (6.547) 182.40 (6.630) 169.50 (4.864) 175.53 (8.806) 176.20 (8.200)

Clinical Trial Results Website CLHW090X2101
______________________________________________________________________________________________________________________________________
Page 12
LHW090 5mg MAD N=6
LHW090 25mg MAD N=6
LHW090
50mg MAD N=6
LHW090 100mg MAD N=6
LHW090
200mg MAD N=6
LHW090 400mg MAD N=6
Pooled placebo N=12
Total N=48
Median 177.20 178.85 172.85 175.00 183.00 169.60 177.40 175.75
Range 172.0- 187.4
175.2- 190.5
160.0- 189.0
166.5- 184.5
174.4-
190.0
162.8- 176.4
156.5- 191.0
156.5-191.0
Weight (kg) Mean(SD) 83.95 (7.517)
92.12
(21.760)
78.78 (15.430)
88.30
(18.653)
97.97 (13.698)
80.05 (11.205)
89.03
(14.170)
87.40 (15.324)
Median 84.00 83.85 77.75 92.45 96.10 82.25 87.30 87.30
Range 75.7- 93.6
69.0-
128.4
57.1-
102.2
60.0- 112.6
79.8- 122.1
61.4- 90.6
66.5- 112.0
57.1-128.4
Body mass index (kg/m
2)
Mean(SD) 26.47
(1.953)
27.83 (5.490)
26.46 (3.098)
28.55 (4.592)
29.35 (2.692)
27.87 (3.895)
28.80 (3.215)
28.02
(3.567)
Median 26.45 26.73 27.17 28.57 29.21 28.61 30.03 28.53
Range 23.23- 28.97
22.35- 35.68
22.30- 29.37
21.64- 34.75
26.24-
33.82
21.70-32.88 20.82- 32.00
20.82-35.68
Sex - n (%) Male 6 (100)
6 (100)
6 (100)
6 (100)
6 (100)
6 (100) 12 (100)
48 (100)
Predominant race - n (%)
Caucasian 5 (83.3)
2 (33.3)
2 (33.3)
1 (16.7)
5 (83.3)
2 (33.3) 6 (50.0)
23 (47.9)
Black 1 (16.7)
4 (66.7)
3 (50.0)
5 (83.3)
0 (0.0)
1 (16.7) 6 (50.0)
20
(41.7)
Asian 0 (0.0)
0 (0.0) 1 (16.7)
0 (0.0)
0
(0.0)
1 (16.7) 0 (0.0)
2 (4.2)
Other 0 (0.0)
0 (0.0) 0 (0.0) 0 (0.0)
1 (16.7)
2 (33.3) 0 (0.0)
3 (6.3)
Ethnicity - n (%)
Hispanic/Latino
0 (0.0) 0 (0.0) 0 (0.0) 0 (0.0)
0
(0.0)
2 (33.3) 0 (0.0)
2 (4.2)

Clinical Trial Results Website CLHW090X2101
______________________________________________________________________________________________________________________________________
Page 13
LHW090 5mg MAD N=6
LHW090 25mg MAD N=6
LHW090
50mg MAD N=6
LHW090 100mg MAD N=6
LHW090
200mg MAD N=6
LHW090 400mg MAD N=6
Pooled placebo N=12
Total N=48
Indian (India subcontinent)
0 (0.0) 0 (0.0) 0 (0.0) 0 (0.0) 1 (16.7) 0 (0.0) 0 (0.0) 1 (2.1)
Mixed ethnicity
0 (0.0) 0 (0.0) 0 (0.0) 1 (16.7) 0 (0.0) 0 (0.0) 0 (0.0) 1 (2.1)
Other 6 (100) 6 (100) 6 (100) 5 (83.3) 5 (83.3) 4 (66.7) 12 (100) 44 (91.7)
Demographic summary by treatment group - Stage 4 (safety analysis set)
LHW090 5mg SAD N=6
LHW090 12.5mg SAD N=9
LHW090 25mg SAD N=9
LHW090 2mg SAD N=9
LHW090 5mg SAD N=9
Total N=42
Age (years) Mean (SD) 68.2 (2.86) 68.4 (5.83) 61.2 (8.29) 66.3 (7.25) 62.1 (11.56) 65.0 (8.17)
Median 68.0 69.0 59.0 69.0 65.0 67.0
Range 65-73 56-75 53-75 54-74 44-75 44-75
Height (cm) Mean (SD) 166.28 (11.024) 168.13 (8.273) 163.37 (10.398) 168.71 (11.207) 166.81 (10.705)
166.69 (9.997)
Median 168.00 169.70 159.40 170.00 169.00 169.25
Range 147.0-177.0 156.6-183.0 153.5-183.4 147.0-183.3 154.0-189.0 147.0-189.0
Weight (kg) Mean (SD) 74.75 (12.134) 84.98 (14.260) 84.61 (12.943) 89.62 (15.640) 88.07 (13.176) 85.10 (13.931)
Median 74.70 84.20 85.10 89.00 85.00 85.05
Range 56.8-90.3 66.7-108.1 66.5-111.7 58.4-113.7 69.5-111.9 56.8-113.7
Body mass index (kg/m2) Mean (SD) 26.97 (2.990) 29.85 (2.600) 31.63 (3.126) 31.25 (2.631) 31.56 (2.758) 30.49 (3.117)
Median 26.74 28.75 32.00 31.49 31.33 30.00
Range 22.34-31.25 27.19-34.69 28.22-36.00 27.03-35.65 28.12-35.63 22.34-36.00
Sex - n (%) Male 5 (83.3) 5 (55.6) 4 (44.4) 6 (66.7) 5 (55.6) 25 (59.5)
Female 1 (16.7) 4 (44.4) 5 (55.6) 3 (33.3) 4 (44.4) 17 (40.5)

Clinical Trial Results Website CLHW090X2101
______________________________________________________________________________________________________________________________________
Page 14
LHW090 5mg SAD N=6
LHW090 12.5mg SAD N=9
LHW090 25mg SAD N=9
LHW090 2mg SAD N=9
LHW090 5mg SAD N=9
Total N=42
Predominant race - n (%) Caucasian 4 (66.7) 7 (77.8) 8 (88.9) 9 (100) 5 (55.6) 33 (78.6)
Black 2 (33.3) 2 (22.2) 1 (11.1) 0 (0.0) 4 (44.4) 9 (21.4)
Ethnicity - n (%) Hispanic/Latino 0 (0.0) 0 (0.0) 2 (22.2) 1 (11.1) 1 (11.1) 4 (9.5)
Mixed ethnicity 0 (0.0) 0 (0.0) 0 (0.0) 1 (11.1) 0 (0.0) 1 (2.4)
Other 6 (100) 9 (100) 7 (77.8) 7 (77.8) 8 (88.9) 37 (88.1)
Creatinine (umol/L) Mean(SD) 173.3 (60.88) 155.6 (57.47) 142.7 (40.85) 132.1 (26.03) 164.8 (41.92)
Median 155 129 138 133 164
Range 126-284 100-279 99-232 97-170 102-246
eGFR (mL/min) Mean (SD) 34.8 (13.99) 31.0 (8.00) 44.2 (9.99) 42.6 (12.80) 36.0 (7.75)
Median 30 31 45 42 35.5
Range 19-50 23-39 26-55 28-61 27-47
Demographic summary by treatment group - Stage 5 (safety analysis set)
LHW090 5mg MAD N=9
Pooled placebo N=3
Total N=12
Age (years) Mean(SD) 63.4 (9.25) 65.7 (9.07) 64.0 (8.84)
Median 67.0 67.0 67.0
Range 48-74 56-74 48-74
Height (cm) Mean(SD) 166.08 (11.255) 164.83 (16.024) 165.77 (11.795)
Median 170.20 156.60 169.75
Range 146.5-177.0 154.6-183.3 146.5-183.3
Weight (kg) Mean(SD) 81.73 (14.987) 80.17 (26.235) 81.34 (17.000)
Median 84.80 66.70 84.30
Range 52.3-101.4 63.4-110.4 52.3-110.4
Body mass index (kg/m2) Mean(SD) 29.60 (4.541) 28.86 (3.477) 29.41 (4.160)
Median 30.30 27.20 29.77

Clinical Trial Results Website CLHW090X2101
______________________________________________________________________________________________________________________________________
Page 15
LHW090 5mg MAD N=9
Pooled placebo N=3
Total N=12
Range 21.07-35.18 26.53-32.86 21.07-35.18
Sex - n (%) Male 6 (66.7) 1 (33.3) 7 (58.3)
Female 3 (33.3) 2 (66.7) 5 (41.7)
Predominant race - n (%) Caucasian 6 (66.7) 3 (100) 9 (75.0)
Black 3 (33.3) 0 (0.0) 3 (25.0)
Ethnicity - n (%) Mixed ethnicity 4 (44.4) 1 (33.3) 5 (41.7)
Other 5 (55.6) 2 (66.7) 7 (58.3)
Creatinine (umol/L) Mean(SD) 176.0 (65.95) 105.7 (6.03)
Median 154 105
Range 104-290 100-112
eGFR (mL/min) Mean(SD) 42.6 (13.99) 55.0 (11.31)
Median 44 55
Range 19-60 47-63

Clinical Trial Results Website CLHW090X2101
______________________________________________________________________________________________________________________________________
Page 16
Summary of Efficacy
Primary Outcome Result(s)
Refer to Safety Result section for primary outcome result.
Secondary Outcome Result(s)
Summary statistics of plasma PD markers – Stage 1 PD analysis set
-------Results-------- -Change from baseline-
Scheduled ANP cGMP ANP cGMP
Treatment Day time(hr) Statistics (pg/mL) (nmol/L) (pg/mL) (nmol/L)
--------------------------------------------------------------------------------------------------
LHW090 1mg Day -1 Pre-Dose n 3 3
Mean 110.4333 4.9300
SD 15.82287 1.22282
Min 97.300 4.160
Median 106.0000 4.2900
Max 128.000 6.340
Day 1 1 hr n 3 3 3 3
Post-Dose
Mean 119.3333 3.4133 8.9000 -1.5167
SD 6.11010 1.32085 11.37673 1.27033
Min 114.000 1.890 -2.000 -2.270
Median 118.0000 4.1100 8.0000 -2.2300
Max 126.000 4.240 20.700 -0.050
4 hr n 3 3 3 3
Post-Dose
Mean 130.0000 4.4700 19.5667 -0.4600
SD 9.53939 2.32697 25.02725 2.29406
Min 121.000 1.890 -7.000 -2.270

Clinical Trial Results Website CLHW090X2101
______________________________________________________________________________________________________________________________________
Page 17
Median 129.0000 5.1100 23.0000 -1.2300
Max 140.000 6.410 42.700 2.120
LHW090 1mg Day 1 8 hr n 3 3 3 3
Post-Dose
Mean 103.9333 6.5200 -6.5000 1.5900
SD 20.06024 2.12981 11.15303 2.82491
Min 86.800 5.110 -19.200 -0.860
Median 99.0000 5.4800 -2.0000 0.9500
Max 126.000 8.970 1.700 4.680
Day 2 24 hr n 2 3 2 3
Post-Dose
Mean 112.0000 4.1600 -5.0000 -0.7700
SD 7.07107 2.01785 8.48528 1.96924
Min 107.000 1.890 -11.000 -2.270
Median 112.0000 4.8400 -5.0000 -1.5000
Max 117.000 5.750 1.000 1.460
Day 3 48 hr n 3 3 3 3
Post-Dose
Mean 111.3333 2.5333 0.9000 -2.3967
SD 7.02377 1.11429 14.87380 0.12503
Min 104.000 1.890 -16.000 -2.520
Median 112.0000 1.8900 6.7000 -2.4000
Max 118.000 3.820 12.000 -2.270
Summary statistics of plasma PD markers – Stage 2 -------------Results-------------- -------Change from baseline-------
Scheduled CYS ANP cGMP CYS ANP cGMP
Treatment Day time(hr) Statistics (ng/mL) (pg/mL) (nmol/L) (ng/mL) (pg/mL) (nmol/L)
-----------------------------------------------------------------------------------------------------------------------
LHW090 1mg Day -1 Pre-Dose n 8 2 8
SAD
Clinical Trial Results Website CLHW090X2101
______________________________________________________________________________________________________________________________________
Page 18
Mean 988.5000 47.4500 3.2375
SD 133.68299 31.46625 1.96732
Min 789.000 25.200 1.890
Median 976.0000 47.4500 1.8900
Max 1180.000 69.700 6.420
Day 1 0 hr n 8 3 8 8 0 8
Pre-Dose
Mean 964.0000 101.0000 3.6775 -24.5000 0.4400
SD 101.74478 32.79863 2.21736 123.79245 1.03193
Min 837.000 75.500 1.890 -200.000 -0.380
Median 951.0000 89.5000 2.8900 26.0000 0.0000
Max 1130.000 138.000 7.630 146.000 2.410
1 hr n 8 2 8 8 1 8
Post-Dose
Mean 930.2500 101.7000 2.8450 -58.2500 50.2000 -0.3925
SD 88.85261 37.19382 1.35923 76.84260 1.51882
Min 789.000 75.400 1.890 -180.000 50.200 -2.490
Median 940.5000 101.7000 1.8900 -72.0000 50.2000 0.0000
Max 1040.000 128.000 5.130 79.000 50.200 2.360
LHW090 1mg Day 1 4 hr n 8 2 8 8 1 8
SAD Post-Dose
Mean 889.0000 79.0000 4.2012 -99.5000 62.5000 0.9638
SD 126.89366 12.30366 2.16709 116.17843 1.11069
Min 730.000 70.300 1.890 -306.000 62.500 0.000
Median 907.0000 79.0000 4.3950 -94.0000 62.5000 0.5850
Max 1100.000 87.700 7.430 71.000 62.500 2.520
8 hr n 8 4 8 8 1 8
Post-Dose
Mean 828.0000 87.0500 4.7000 -160.5000 68.9000 1.4625
SD 90.24570 7.46436 2.29090 117.53054 1.20292
Min 726.000 80.500 1.890 -411.000 68.900 0.000
Median 809.5000 86.8000 4.6100 -122.5000 68.9000 1.5500

Clinical Trial Results Website CLHW090X2101
______________________________________________________________________________________________________________________________________
Page 19
Max 1010.000 94.100 8.400 -50.000 68.900 3.260
12 hr n 8 4 8 8 1 8
Post-Dose
Mean 754.5000 61.6750 5.2187 -234.0000 -5.0000 1.9813
SD 111.42711 26.03528 3.08089 124.17499 2.10417
Min 590.000 25.200 1.890 -507.000 -5.000 -2.240
Median 770.0000 67.4500 4.5750 -203.5000 -5.0000 2.6850
Max 960.000 86.600 10.300 -114.000 -5.000 4.400
LHW090 1mg Day 2 24 hr n 8 2 8 8 1 8
SAD Post-Dose
Mean 778.2500 141.6500 4.1087 -210.2500 62.1000 0.8713
SD 97.40160 76.86251 2.63362 93.89926 1.06892
Min 673.000 87.300 1.890 -362.000 62.100 0.000
Median 744.0000 141.6500 3.2850 -209.0000 62.1000 0.4200
Max 943.000 196.000 8.050 -46.000 62.100 2.790
Day 4 72 hr n 8 4 8 8 0 8
Post-Dose
Mean 659.3750 86.5250 5.4075 -329.1250 2.1700
SD 93.52148 60.15909 3.52602 88.75236 1.99896
Min 550.000 25.200 1.890 -496.000 0.000
Median 657.5000 75.9500 5.3550 -294.5000 2.3450
Max 841.000 169.000 10.900 -239.000 4.480
LHW090 5mg Day -1 Pre-Dose n 8 8 8
SAD
Mean 763.2500 131.3750 5.3387
SD 96.37686 16.66423 3.50138
Min 613.000 108.000 1.890
Median 793.5000 134.5000 5.0300
Max 864.000 160.000 13.100
Day 1 0 hr n 8 8 8 8 8 8
Clinical Trial Results Website CLHW090X2101
______________________________________________________________________________________________________________________________________
Page 20
Pre-Dose
Mean 778.8750 124.1250 6.2937 15.6250 -7.2500 0.9550
SD 124.44096 8.32273 6.58463 73.84141 17.66150 6.93059
Min 610.000 112.000 1.890 -81.000 -33.000 -7.820
Median 812.5000 124.0000 4.9000 10.0000 -6.5000 0.0650
Max 908.000 135.000 21.800 157.000 18.000 16.510
1 hr n 8 8 8 8 8 8
Post-Dose
Mean 746.5000 124.0000 6.8437 -16.7500 -7.3750 1.5050
SD 103.99863 10.99350 6.82720 108.02612 14.07061 7.23692
Min 610.000 109.000 1.890 -113.000 -30.000 -8.040
Median 746.5000 125.0000 4.8550 -64.5000 -1.5000 0.1200
Max 955.000 138.000 23.100 204.000 7.000 17.810
LHW090 5mg Day 1 4 hr n 8 8 8 8 8 8
SAD Post-Dose
Mean 733.7500 121.2750 7.3750 -29.5000 -10.1000 2.0362
SD 103.39211 41.89960 6.48588 80.10885 42.24919 6.32782
Min 551.000 25.200 1.890 -133.000 -104.800 -5.100
Median 730.0000 140.5000 6.9050 -40.0000 -4.0000 0.5200
Max 881.000 149.000 21.300 130.000 31.000 16.010
8 hr n 8 7 8 8 7 8
Post-Dose
Mean 679.1250 134.1429 7.6187 -84.1250 0.7143 2.2800
SD 89.47695 15.12645 3.89217 61.24293 24.44527 3.07694
Min 541.000 111.000 1.890 -150.000 -28.000 -1.900
Median 698.5000 135.0000 7.1750 -100.0000 -7.0000 2.1450
Max 795.000 152.000 13.900 44.000 44.000 8.610
12 hr n 8 8 8 8 8 8
Post-Dose
Mean 679.1250 133.1250 7.2587 -84.1250 1.7500 1.9200
SD 99.50368 8.59298 5.07527 98.19432 18.78259 4.93893
Min 544.000 116.000 1.890 -246.000 -23.000 -4.150
Median 681.0000 134.5000 6.8750 -95.0000 -4.0000 1.8050

Clinical Trial Results Website CLHW090X2101
______________________________________________________________________________________________________________________________________
Page 21
Max 840.000 146.000 17.500 89.000 28.000 12.210
LHW090 5mg Day 2 24 hr n 8 8 8 8 8 8
SAD Post-Dose
Mean 754.5000 131.0000 5.4700 -8.7500 -0.3750 0.1313
SD 122.48382 9.30438 3.02232 72.92805 16.73267 3.97190
Min 559.000 118.000 1.890 -142.000 -16.000 -7.470
Median 814.5000 130.5000 5.3900 -13.0000 -8.5000 0.3600
Max 867.000 145.000 11.400 116.000 23.000 6.110
Day 4 72 hr n 8 8 8 8 8 8
Post-Dose
Mean 714.0000 119.1250 4.3175 -49.2500 -12.2500 -1.0213
SD 115.56074 12.86676 2.77751 66.62850 18.62218 4.22856
Min 564.000 101.000 1.890 -131.000 -38.000 -9.240
Median 736.0000 120.5000 4.2250 -52.0000 -11.5000 -0.6900
Max 867.000 139.000 10.200 70.000 21.000 4.910
LHW090 25mg Day -1 Pre-Dose n 8 8 8
SAD
Mean 818.7500 132.0000 4.6437
SD 170.00231 46.20065 2.92305
Min 556.000 87.500 1.890
Median 852.0000 119.0000 4.0400
Max 1040.000 212.000 9.860
Day 1 0 hr n 8 8 8 8 8 8
Pre-Dose
Mean 846.7500 104.1500 3.6175 28.0000 -27.8500 -1.0263
SD 130.73501 24.71922 1.98204 164.74222 29.09438 1.98923
Min 647.000 73.600 1.890 -251.000 -83.000 -4.970
Median 833.0000 103.9500 3.0950 18.5000 -17.5000 -0.0500
Max 1030.000 153.000 6.870 290.000 7.000 1.280
1 hr n 8 8 8 8 8 8

Clinical Trial Results Website CLHW090X2101
______________________________________________________________________________________________________________________________________
Page 22
Post-Dose
Mean 780.0000 123.7750 4.2650 -38.7500 -8.2250 -0.3788
SD 106.63154 31.09753 3.00626 193.70578 28.16253 2.09145
Min 626.000 80.400 1.890 -329.000 -67.000 -4.150
Median 769.0000 119.5000 3.1200 -93.0000 -4.0000 0.0000
Max 928.000 176.000 10.100 277.000 30.000 3.130
LHW090 25mg Day 1 4 hr n 8 8 8 8 8 8
SAD Post-Dose
Mean 782.5000 149.4375 7.9237 -36.2500 17.4375 3.2800
SD 72.45886 53.73442 4.26806 224.33569 16.32141 3.07208
Min 661.000 97.500 1.890 -379.000 -10.000 -1.070
Median 791.5000 126.0000 8.9800 -53.0000 23.0000 4.7900
Max 881.000 235.000 13.100 299.000 38.000 6.130
8 hr n 8 7 8 8 7 8
Post-Dose
Mean 763.2500 139.3714 9.3075 -55.5000 1.8714 4.6638
SD 91.52166 43.39085 4.56234 180.00952 15.47091 4.09219
Min 561.000 75.600 5.130 -313.000 -13.000 -3.370
Median 777.5000 139.0000 7.3250 -86.5000 -5.0000 4.0050
Max 853.000 199.000 17.100 187.000 24.000 10.130
12 hr n 8 6 8 8 6 8
Post-Dose
Mean 776.8750 122.4500 10.2963 -41.8750 -13.8833 5.6525
SD 134.55263 45.72692 3.44433 212.33426 27.84094 2.19858
Min 475.000 95.800 5.050 -355.000 -65.000 1.840
Median 816.0000 99.8500 11.1000 -101.5000 -2.0000 6.1600
Max 900.000 212.000 15.100 224.000 9.700 8.130
LHW090 25mg Day 2 24 hr n 8 7 8 8 7 8
SAD Post-Dose
Mean 817.2500 111.5286 7.1900 -1.5000 -22.9000 2.5463
SD 165.29087 18.54191 2.16082 164.51227 34.71575 1.54702
Min 599.000 82.100 4.570 -213.000 -74.000 -1.010
Median 836.5000 118.0000 6.7850 -49.5000 -6.0000 2.7850
Max 1090.000 138.000 10.900 265.000 9.500 3.930

Clinical Trial Results Website CLHW090X2101
______________________________________________________________________________________________________________________________________
Page 23
Day 4 72 hr n 8 6 8 8 6 8
Post-Dose
Mean 814.0000 101.1167 4.3400 -4.7500 -36.5500 -0.3037
SD 145.86001 39.86258 2.03383 278.29622 34.84450 2.39662
Min 585.000 58.200 1.890 -317.000 -88.000 -4.970
Median 834.5000 101.2000 4.4400 -56.0000 -36.6500 0.2900
Max 1080.000 157.000 8.320 429.000 10.000 2.370
LHW090 50mg Day -1 Pre-Dose n 8 7 8
SAD
Mean 974.6250 118.5286 4.1675
SD 137.26402 39.48691 2.25840
Min 742.000 64.300 1.890
Median 1035.0000 124.0000 4.3050
Max 1090.000 177.000 8.300
Day 1 0 hr n 8 7 8 8 6 8
Pre-Dose
Mean 935.1250 85.1714 4.2325 -39.5000 -19.3167 0.0650
SD 110.32735 39.19025 1.59228 63.82118 24.62490 2.06625
Min 739.000 25.200 1.890 -133.000 -46.200 -2.540
Median 952.5000 92.5000 4.5900 -21.0000 -22.2500 0.0950
Max 1100.000 139.000 5.770 42.000 18.000 3.630
1 hr n 8 7 8 8 7 8
Post-Dose
Mean 856.3750 123.8429 4.2662 -118.2500 5.3143 0.0988
SD 121.03357 37.71330 1.57874 48.10034 24.13955 2.42059
Min 673.000 61.700 1.890 -218.000 -35.000 -3.280
Median 900.0000 131.0000 4.5100 -115.0000 10.0000 0.1250
Max 972.000 167.000 5.990 -68.000 38.000 4.100
LHW090 50mg Day 1 4 hr n 8 4 8 8 4 8
SAD Post-Dose
Mean 827.8750 151.5000 6.6163 -146.7500 37.1750 2.4488
SD 92.92153 22.88376 1.78846 83.46043 31.63736 2.47474
Min 678.000 128.000 4.230 -254.000 -8.000 -1.990

Clinical Trial Results Website CLHW090X2101
______________________________________________________________________________________________________________________________________
Page 24
Median 833.5000 152.0000 6.5300 -154.5000 46.5000 2.2650
Max 989.000 174.000 10.300 5.000 63.700 6.050
8 hr n 8 7 8 8 7 8
Post-Dose
Mean 779.1250 112.2000 8.3187 -195.5000 -6.3286 4.1513
SD 78.34072 40.50593 3.87596 101.08836 40.70654 3.73167
Min 621.000 57.500 1.890 -318.000 -55.000 0.000
Median 798.0000 108.0000 8.2200 -211.0000 -17.0000 3.6400
Max 859.000 191.000 15.600 -15.000 70.000 11.350
12 hr n 8 7 7 8 6 7
Post-Dose
Mean 701.0000 101.0857 6.8329 -273.6250 -5.2500 2.6771
SD 129.50124 41.97171 1.58123 97.29475 28.45064 2.34591
Min 531.000 25.200 4.320 -458.000 -39.100 0.170
Median 713.5000 96.0000 6.8500 -259.0000 -8.5000 2.4300
Max 871.000 156.000 8.520 -140.000 35.000 6.630
LHW090 50mg Day 2 24 hr n 8 6 8 8 5 8
SAD Post-Dose
Mean 821.3750 85.2833 7.5863 -153.2500 -26.9800 3.4188
SD 103.92296 40.49209 2.17397 108.26786 50.67052 2.36453
Min 682.000 25.200 4.670 -384.000 -94.200 -0.750
Median 852.0000 85.0500 7.1700 -150.0000 -31.0000 4.1050
Max 944.000 150.000 10.800 -52.000 29.000 6.550
Day 4 72 hr n 8 7 8 8 6 8
Post-Dose
Mean 834.0000 80.5000 4.9750 -140.6250 -28.4000 0.8075
SD 136.41533 35.39195 1.59762 127.35209 19.16319 1.86847
Min 644.000 25.200 1.890 -260.000 -50.400 -3.120
Median 817.5000 82.8000 5.1450 -169.5000 -31.6000 1.4750
Max 1090.000 134.000 6.590 129.000 -4.700 2.520
LHW090 100mg Day -1 Pre-Dose n 8 8 8

Clinical Trial Results Website CLHW090X2101
______________________________________________________________________________________________________________________________________
Page 25
SAD
Mean 927.0000 90.6875 3.5275
SD 114.44899 11.63142 1.81461
Min 796.000 74.000 1.890
Median 887.0000 89.5000 3.1800
Max 1160.000 105.000 5.830
Day 1 0 hr n 8 8 8 8 8 8
Pre-Dose
Mean 974.2500 85.2125 4.2387 47.2500 -5.4750 0.7113
SD 161.63694 11.49552 2.82882 107.78119 6.08223 1.49018
Min 735.000 67.600 1.890 -122.000 -14.900 -0.490
Median 1003.0000 86.8500 2.9350 47.0000 -5.9500 0.0000
Max 1150.000 101.000 8.680 210.000 2.300 4.080
1 hr n 8 8 8 8 8 8
Post-Dose
Mean 880.5000 94.3750 4.1862 -46.5000 3.6875 0.6588
SD 162.93820 19.93939 2.05910 123.76475 13.49809 1.02591
Min 671.000 65.500 1.890 -186.000 -11.900 -0.040
Median 899.5000 91.2000 4.6000 -63.0000 4.2500 0.0650
Max 1090.000 125.000 6.940 190.000 24.000 2.340
LHW090 100mg Day 1 4 hr n 8 8 8 8 8 8
SAD Post-Dose
Mean 867.5000 109.5375 6.8125 -59.5000 18.8500 3.2850
SD 129.94504 21.42728 3.27824 84.97899 14.41646 2.31134
Min 675.000 82.400 1.890 -182.000 -6.400 0.000
Median 876.5000 108.5000 7.3500 -67.0000 17.4000 4.6200
Max 1030.000 144.000 10.700 54.000 42.000 5.290
8 hr n 8 8 8 8 8 8
Post-Dose
Mean 837.5000 110.7625 9.1538 -89.5000 20.0750 5.6263
SD 122.55494 20.43400 2.69467 109.04652 12.95870 2.42315
Min 643.000 83.800 4.490 -239.000 1.500 2.600
Median 825.5000 114.5000 9.8050 -73.5000 18.9000 5.2900
Max 1010.000 146.000 13.000 79.000 44.000 8.910

Clinical Trial Results Website CLHW090X2101
______________________________________________________________________________________________________________________________________
Page 26
12 hr n 8 8 8 8 8 8
Post-Dose
Mean 874.2500 104.4875 8.2625 -52.7500 13.8000 4.7350
SD 130.59397 17.04209 2.95415 112.10295 8.41954 2.55164
Min 652.000 80.500 4.560 -201.000 -1.500 1.770
Median 900.5000 106.5000 8.6050 -69.0000 15.1000 4.0800
Max 1040.000 128.000 13.100 140.000 27.000 8.610
LHW090 100mg Day 2 24 hr n 8 8 8 8 8 8
SAD Post-Dose
Mean 926.7500 90.3125 7.9725 -0.2500 -0.3750 4.4450
SD 115.08848 10.41173 2.86174 104.05184 6.78312 2.68083
Min 754.000 76.200 3.830 -103.000 -10.800 1.310
Median 938.5000 93.6000 7.2050 -4.5000 1.7500 4.0050
Max 1070.000 104.000 13.100 201.000 8.600 9.110
Day 4 72 hr n 8 7 8 8 7 8
Post-Dose
Mean 944.7500 87.7000 4.7612 17.7500 -5.3714 1.2338
SD 142.49185 22.07291 2.44500 142.34540 18.32327 1.79067
Min 711.000 67.000 1.890 -150.000 -21.800 -1.370
Median 970.5000 86.1000 4.5600 7.5000 -10.3000 1.1450
Max 1130.000 133.000 8.590 271.000 31.000 3.990
LHW090 0.1mg Day -1 Pre-Dose n 8 8
SAD
Mean 92.5000 5.1862
SD 21.86641 2.32882
Min 67.600 1.890
Median 85.1000 5.4450
Max 133.000 8.070
Day 1 0 hr n 7 8 7 8
Pre-Dose
Mean 75.2571 4.1025 -13.6000 -1.0838
SD 44.78612 1.63913 32.30062 1.18680
Min 25.200 1.890 -65.700 -3.540

Clinical Trial Results Website CLHW090X2101
______________________________________________________________________________________________________________________________________
Page 27
Median 66.0000 4.2500 -14.4000 -1.0100
Max 150.000 6.780 27.000 0.000
1 hr n 8 8 8 8
Post-Dose
Mean 79.0375 3.6812 -13.4625 -1.5050
SD 18.26417 1.60566 24.74637 1.58714
Min 52.700 1.890 -49.100 -4.150
Median 80.6500 4.0900 -9.6000 -1.0150
Max 97.700 6.000 13.900 0.000
LHW090 0.1mg Day 1 4 hr n 8 8 8 8
SAD Post-Dose
Mean 87.8375 3.3750 -4.6625 -1.8113
SD 35.18875 1.69380 23.02576 1.46255
Min 71.400 1.890 -40.400 -3.640
Median 73.7000 2.8850 -7.8000 -1.8650
Max 174.000 6.000 41.000 0.000
8 hr n 7 8 7 8
Post-Dose
Mean 81.4000 5.0487 -14.6571 -0.1375
SD 21.13078 2.42865 25.85362 1.91010
Min 57.300 1.890 -60.700 -3.640
Median 77.2000 5.0750 -5.4000 -0.0700
Max 112.000 9.160 21.100 3.140
12 hr n 8 8 8 8
Post-Dose
Mean 80.8875 4.7937 -11.6125 -0.3925
SD 29.61112 1.93113 39.45060 0.95528
Min 25.200 1.890 -92.800 -1.690
Median 81.9500 5.3700 -2.9500 -0.3450
Max 121.000 6.560 39.000 1.060
LHW090 0.1mg Day 2 24 hr n 8 8 8 8
SAD Post-Dose
Mean 92.3000 4.6475 -0.2000 -0.5388

Clinical Trial Results Website CLHW090X2101
______________________________________________________________________________________________________________________________________
Page 28
SD 12.56321 2.30787 23.70256 1.05310
Min 72.300 1.890 -45.700 -2.260
Median 95.9500 4.5950 7.7000 -0.2550
Max 106.000 9.030 22.600 1.080
Day 4 72 hr n 8 8 8 8
Post-Dose
Mean 78.4000 4.9687 -14.1000 -0.2175
SD 26.81892 1.85133 20.16914 1.73581
Min 25.200 1.890 -42.400 -3.100
Median 79.9500 4.6600 -13.1500 -0.1450
Max 108.000 7.780 19.000 2.420
LHW090 200mg Day -1 Pre-Dose n 8 8
SAD
Mean 823.7500 4.2900
SD 140.09053 2.53043
Min 594.000 1.890
Median 799.5000 4.3550
Max 1080.000 9.260
Day 1 0 hr n 8 8 8 8
Pre-Dose
Mean 907.0000 4.0237 83.2500 -0.2662
SD 96.18286 1.36192 65.96915 2.32523
Min 767.000 1.890 -10.000 -3.940
Median 900.0000 4.5650 98.5000 -0.5850
Max 1070.000 5.320 173.000 3.110
1 hr n 8 8 8 8
Post-Dose
Mean 889.6250 3.5012 65.8750 -0.7888
SD 96.09956 1.36636 99.03309 1.96864
Min 768.000 1.890 -83.000 -4.780
Median 896.0000 4.1250 73.5000 -0.4350
Max 997.000 5.000 209.000 2.050

Clinical Trial Results Website CLHW090X2101
______________________________________________________________________________________________________________________________________
Page 29
LHW090 200mg Day 1 4 hr n 8 8 8 8
SAD Post-Dose
Mean 859.7500 7.4513 36.0000 3.1613
SD 91.74304 2.19418 98.69868 1.68878
Min 732.000 4.330 -85.000 1.290
Median 866.0000 7.6850 25.5000 2.4400
Max 995.000 11.700 208.000 5.980
8 hr n 8 8 8 8
Post-Dose
Mean 813.2500 10.3188 -10.5000 6.0288
SD 81.74656 3.53098 112.78678 2.10875
Min 683.000 6.720 -223.000 3.140
Median 828.0000 9.4550 -19.0000 5.8850
Max 912.000 16.200 137.000 9.620
12 hr n 8 8 8 8
Post-Dose
Mean 771.2500 9.7563 -52.5000 5.4663
SD 103.07799 3.72248 91.16547 2.82838
Min 634.000 5.310 -220.000 1.400
Median 768.0000 8.2100 -42.0000 5.6100
Max 958.000 16.500 40.000 10.820
LHW090 200mg Day 2 24 hr n 8 8
SAD Post-Dose
Mean 882.3750 58.6250
SD 102.59760 94.78689
Min 771.000 -50.000
Median 854.0000 26.5000
Max 1030.000 232.000
Day 4 72 hr n 8 8
Post-Dose
Mean 906.0000 82.2500
SD 81.31245 86.75046
Min 809.000 -60.000
Median 912.0000 63.0000

Clinical Trial Results Website CLHW090X2101
______________________________________________________________________________________________________________________________________
Page 30
Max 1020.000 215.000
LHW090 400mg Day -1 Pre-Dose n 8 5 8
SAD
Mean 1064.7500 46.3800 3.3025
SD 196.79631 23.46097 1.58283
Min 689.000 13.900 1.890
Median 1100.0000 42.8000 2.9700
Max 1300.000 71.700 5.670
Day 1 0 hr n 8 8 8 8 5 8
Pre-Dose
Mean 1084.3750 36.9500 2.6962 19.6250 -7.3600 -0.6063
SD 158.25832 17.96886 1.50850 119.13011 9.29882 1.03080
Min 822.000 13.900 1.890 -240.000 -21.400 -2.380
Median 1110.0000 36.0500 1.8900 30.0000 -2.0000 -0.0750
Max 1240.000 65.500 5.520 140.000 0.000 0.000
1 hr n 8 8 8 8 5 8
Post-Dose
Mean 971.1250 60.4375 3.0050 -93.6250 14.0400 -0.2975
SD 140.02289 13.10997 1.61566 106.66896 15.23821 0.77106
Min 743.000 35.800 1.890 -270.000 -1.000 -2.160
Median 1020.0000 64.5500 1.8900 -97.0000 15.8000 0.0000
Max 1140.000 77.200 5.670 54.000 34.400 0.190
LHW090 400mg Day 1 4 hr n 8 8 8 8 5 8
SAD Post-Dose
Mean 918.3750 91.2625 6.7775 -146.3750 45.0800 3.4750
SD 106.10364 6.50647 2.26457 106.30272 19.00610 2.01660
Min 776.000 82.000 3.940 -259.000 26.300 0.960
Median 927.5000 91.3000 6.8050 -164.5000 49.7000 3.1850
Max 1070.000 101.000 9.650 87.000 71.900 7.760
8 hr n 8 5 8 8 4 8
Post-Dose
Mean 869.5000 65.9400 10.9925 -195.2500 14.8500 7.6900
SD 125.54680 9.30554 3.07060 156.99932 18.19826 3.11595

Clinical Trial Results Website CLHW090X2101
______________________________________________________________________________________________________________________________________
Page 31
Min 731.000 52.300 6.590 -378.000 -5.300 4.700
Median 825.0000 69.4000 11.8000 -228.5000 16.1500 6.9400
Max 1130.000 76.100 15.300 122.000 32.400 13.410
12 hr n 8 3 8 8 3 8
Post-Dose
Mean 794.0000 55.4000 9.3275 -270.7500 -4.9333 6.0250
SD 120.91674 6.42106 1.30117 173.18260 14.88836 2.26320
Min 684.000 51.300 7.080 -450.000 -20.400 2.780
Median 748.0000 52.1000 9.4150 -326.5000 -3.7000 5.4600
Max 1000.000 62.800 11.500 67.000 9.300 9.610
LHW090 400mg Day 2 24 hr n 8 8
SAD Post-Dose
Mean 823.2500 -241.5000
SD 118.98950 168.36270
Min 720.000 -412.000
Median 776.5000 -302.0000
Max 1070.000 86.000
Day 4 72 hr n 8 8
Post-Dose
Mean 858.6250 -206.1250
SD 132.12217 174.69029
Min 748.000 -352.000
Median 807.5000 -272.0000
Max 1120.000 156.000
LHW090 800mg Day -1 Pre-Dose n 8 8
SAD
Mean 781.1250 3.1200
SD 74.86070 1.77678
Min 636.000 1.890
Median 789.5000 1.8900
Max 868.000 6.300

Clinical Trial Results Website CLHW090X2101
______________________________________________________________________________________________________________________________________
Page 32
Day 1 0 hr n 8 8 8 8
Pre-Dose
Mean 805.2500 2.4937 24.1250 -0.6263
SD 63.63231 1.70766 128.46393 1.29794
Min 735.000 1.890 -103.000 -2.790
Median 793.5000 1.8900 -1.0000 0.0000
Max 926.000 6.720 290.000 0.420
1 hr n 8 8 8 8
Post-Dose
Mean 850.8750 3.9712 69.7500 0.8513
SD 141.32176 1.86832 200.54764 1.71958
Min 746.000 1.890 -99.000 -1.110
Median 796.5000 4.2800 21.0000 0.0000
Max 1170.000 6.250 534.000 4.210
LHW090 800mg Day 1 4 hr n 8 8 8 8
SAD Post-Dose
Mean 833.8750 8.4862 52.7500 5.3663
SD 192.84223 3.75043 253.97849 2.74471
Min 669.000 1.890 -199.000 0.000
Median 765.5000 9.2600 11.5000 6.0600
Max 1260.000 12.700 624.000 8.170
8 hr n 8 8 8 8
Post-Dose
Mean 710.2500 10.8363 -70.8750 7.7163
SD 96.51462 4.20053 112.78353 3.91034
Min 573.000 5.180 -264.000 3.290
Median 719.5000 10.8000 -52.0000 7.7050
Max 872.000 17.900 81.000 16.010
12 hr n 8 8 8 8
Post-Dose
Mean 771.1250 9.5825 -10.0000 6.4625
SD 106.97188 3.26627 93.77024 3.07844
Min 660.000 6.280 -177.000 1.720
Median 710.5000 8.8100 -7.0000 6.9200

Clinical Trial Results Website CLHW090X2101
______________________________________________________________________________________________________________________________________
Page 33
Max 912.000 14.200 121.000 12.310
LHW090 800mg Day 2 24 hr n 8 8
SAD Post-Dose
Mean 707.0000 -74.1250
SD 74.35629 135.61125
Min 656.000 -190.000
Median 684.0000 -109.0000
Max 881.000 245.000
Day 4 72 hr n 8 8
Post-Dose
Mean 779.0000 -2.1250
SD 163.52108 226.62583
Min 662.000 -155.000
Median 719.5000 -91.5000
Max 1170.000 534.000
LHW090 400mg Day -1 Pre-Dose n 8
SAD
(Japanese
ethnicity)
Mean 1.8900
SD 0.00000
Min 1.890
Median 1.8900
Max 1.890
Day 1 0 hr n 8 8
Pre-Dose
Mean 1.8900 0.0000
SD 0.00000 0.00000
Min 1.890 0.000
Median 1.8900 0.0000
Max 1.890 0.000

Clinical Trial Results Website CLHW090X2101
______________________________________________________________________________________________________________________________________
Page 34
1 hr n 8 8
Post-Dose
Mean 1.8900 0.0000
SD 0.00000 0.00000
Min 1.890 0.000
Median 1.8900 0.0000
Max 1.890 0.000
LHW090 400mg Day 1 4 hr n 8 8
SAD Post-Dose
(Japanese
ethnicity)
Mean 2.8725 0.9825
SD 1.88878 1.88878
Min 1.890 0.000
Median 1.8900 0.0000
Max 6.770 4.880
8 hr n 8 8
Post-Dose
Mean 3.3737 1.4838
SD 2.27880 2.27880
Min 1.890 0.000
Median 1.8900 0.0000
Max 7.840 5.950
12 hr n 8 8
Post-Dose
Mean 3.0525 1.1625
SD 2.18667 2.18667
Min 1.890 0.000
Median 1.8900 0.0000
Max 7.260 5.370
Pooled Day -1 Pre-Dose n 16 13 20
placebo
Mean 884.0000 102.9154 3.8120
SD 175.91589 35.28935 1.97159
Min 582.000 36.100 1.890

Clinical Trial Results Website CLHW090X2101
______________________________________________________________________________________________________________________________________
Page 35
Median 899.5000 111.0000 3.8700
Max 1140.000 166.000 6.920
Day 1 0 hr n 16 14 20 16 13 20
Pre-Dose
Mean 902.8125 91.2429 3.3030 18.8125 -6.5923 -0.5090
SD 150.03165 35.81673 1.73865 123.65070 19.47496 1.29601
Min 633.000 25.200 1.890 -159.000 -37.900 -3.620
Median 874.5000 93.2500 1.8900 10.0000 -1.0000 0.0000
Max 1150.000 165.000 6.980 264.000 21.900 2.250
1 hr n 16 13 20 16 12 20
Post-Dose
Mean 887.8125 91.7462 2.6255 3.8125 -6.5333 -1.1865
SD 132.59322 42.34180 1.33724 144.10192 24.77199 1.43327
Min 687.000 48.300 1.890 -224.000 -50.100 -5.030
Median 891.0000 80.6000 1.8900 10.0000 4.2000 -0.6450
Max 1150.000 195.000 5.490 310.000 29.000 0.000
Pooled Day 1 4 hr n 16 12 20 16 11 20
placebo Post-Dose
Mean 878.8750 90.3583 3.7210 -5.1250 -7.0182 -0.0910
SD 141.26895 32.57809 3.21579 160.21272 16.26209 2.67393
Min 624.000 48.500 1.890 -238.000 -29.400 -3.620
Median 889.5000 87.8500 1.8900 2.5000 -6.6000 0.0000
Max 1080.000 150.000 14.400 313.000 19.300 9.080
8 hr n 16 13 20 16 12 20
Post-Dose
Mean 850.6875 91.0077 3.5455 -33.3125 -11.9917 -0.2665
SD 82.67907 30.16188 1.61010 161.77751 24.00149 1.45745
Min 724.000 25.200 1.890 -398.000 -58.000 -3.620
Median 858.0000 91.0000 4.0550 -15.0000 -8.5500 0.0000
Max 979.000 147.000 5.850 220.000 22.600 2.830
12 hr n 16 13 20 16 12 20
Post-Dose
Mean 818.8125 82.3231 3.6455 -65.1875 -21.4000 -0.1665

Clinical Trial Results Website CLHW090X2101
______________________________________________________________________________________________________________________________________
Page 36
SD 128.27950 24.11705 1.74112 208.44703 26.93342 1.58966
Min 532.000 25.200 1.890 -444.000 -81.500 -3.620
Median 840.0000 84.5000 3.9000 -45.5000 -16.3500 0.0000
Max 1020.000 124.000 6.310 237.000 13.900 3.730
Pooled Day 2 24 hr n 16 12 12 16 11 12
placebo Post-Dose
Mean 874.4375 98.0667 3.6750 -9.5625 -10.7182 -0.3658
SD 117.23763 25.77907 1.73155 203.53901 24.48485 1.67068
Min 640.000 52.900 1.890 -355.000 -65.000 -3.620
Median 878.5000 97.2500 3.9200 9.5000 -10.0000 -0.0200
Max 1050.000 145.000 6.330 361.000 15.000 2.120
Day 4 72 hr n 16 11 12 16 10 12
Post-Dose
Mean 818.1875 93.5909 3.6017 -65.8125 -20.3200 -0.4392
SD 128.83851 18.88234 1.88761 232.38021 18.81901 0.70401
Min 588.000 58.600 1.890 -403.000 -55.000 -2.010
Median 813.5000 93.1000 2.8800 -69.5000 -15.1000 0.0000
Max 1020.000 128.000 6.310 415.000 5.200 0.270
Summary statistics of plasma PD markers – Stage 3 -------------Results-------------- -------Change from baseline-------
Scheduled CYS ANP cGMP CYS ANP cGMP
Treatment Day time(hr) Statistics (ng/mL) (pg/mL) (nmol/L) (ng/mL) (pg/mL) (nmol/L)
-----------------------------------------------------------------------------------------------------------------
LHW090 5mg Day 1 Pre-Dose n 6
MAD
Mean 4.4650
SD 1.42102
Min 1.890
Median 5.0750
Max 5.500
Day 2 Pre-Dose n 6 6
Mean 5.6817 1.2167
SD 1.31618 1.11002

Clinical Trial Results Website CLHW090X2101
______________________________________________________________________________________________________________________________________
Page 37
Min 3.820 -0.360
Median 5.6750 1.6100
Max 7.840 2.340
Day 5 Pre-Dose n 6 6
Mean 5.7067 1.2417
SD 2.33717 2.45716
Min 1.890 -3.530
Median 5.6900 1.8950
Max 8.470 3.100
LHW090 5mg Day 14 Pre-Dose n 6 6
MAD
Mean 5.9017 1.4367
SD 2.02781 1.53402
Min 4.070 -0.010
Median 5.0850 1.2000
Max 9.550 4.050
Day 17 72 hr n 6 6
Post-Dose
Mean 4.0167 -0.4483
SD 1.68644 1.55281
Min 1.890 -3.560
Median 4.6950 0.0600
Max 5.540 0.740
LHW090 25m Day 1 Pre-Dose n 6
g
MAD
Mean 5.5117
SD 5.27491
Min 1.890
Median 3.9350
Max 15.900
Day 2 Pre-Dose n 5 5

Clinical Trial Results Website CLHW090X2101
______________________________________________________________________________________________________________________________________
Page 38
Mean 7.3020 3.8680
SD 4.99563 3.78619
Min 4.060 1.380
Median 5.3400 2.4900
Max 16.100 10.580
Day 5 Pre-Dose n 6 6
Mean 10.5750 5.0633
SD 12.23508 14.43990
Min 1.890 -14.010
Median 4.9350 3.0150
Max 34.300 30.390
LHW090 25m Day 14 Pre-Dose n 6 6
g
MAD
Mean 7.2467 1.7350
SD 4.85508 7.78604
Min 4.230 -11.670
Median 4.7400 2.7200
Max 16.500 12.590
Day 17 72 hr n 6 6
Post-Dose
Mean 6.0600 0.5483
SD 5.26727 7.57293
Min 1.890 -11.610
Median 4.1450 1.0550
Max 15.500 11.590
LHW090 50m Day 1 Pre-Dose n 6
g
MAD
Mean 3.6483
SD 2.10391
Min 1.890

Clinical Trial Results Website CLHW090X2101
______________________________________________________________________________________________________________________________________
Page 39
Median 3.0900
Max 6.890
Day 2 Pre-Dose n 6 6
Mean 6.0200 2.3717
SD 4.14314 2.51655
Min 1.890 -0.280
Median 4.4950 2.5350
Max 13.600 6.710
Day 5 Pre-Dose n 6 6
Mean 6.5167 2.8683
SD 2.79765 2.46629
Min 1.890 0.000
Median 7.2800 2.8350
Max 9.190 6.680
LHW090 50m Day 14 Pre-Dose n 6 6
g
MAD
Mean 5.8150 2.1667
SD 2.77675 1.72327
Min 1.890 0.000
Median 5.7400 2.3900
Max 9.520 4.760
Day 17 72 hr n 6 6
Post-Dose
Mean 4.4717 0.8233
SD 2.11554 1.63424
Min 1.890 -1.550
Median 5.0950 0.8250
Max 6.920 2.960
LHW090 100 Day 1 Pre-Dose n 6
mg
MAD
Mean 2.9200

Clinical Trial Results Website CLHW090X2101
______________________________________________________________________________________________________________________________________
Page 40
SD 1.59812
Min 1.890
Median 1.8900
Max 5.120
Day 2 Pre-Dose n 6 6
Mean 7.1367 4.2167
SD 1.30546 2.57349
Min 5.550 0.430
Median 6.8600 4.6250
Max 8.950 7.060
Day 5 Pre-Dose n 6 6
Mean 9.4433 6.5233
SD 2.44948 3.25988
Min 6.960 2.270
Median 9.0450 5.6500
Max 12.800 10.910
LHW090 100 Day 14 Pre-Dose n 6 6
mg
MAD
Mean 5.1700 2.2500
SD 1.87117 2.37320
Min 1.890 -0.680
Median 5.8800 2.3750
Max 6.700 4.810
Day 17 72 hr n 6 6
Post-Dose
Mean 5.5650 2.6450
SD 1.31049 1.39684
Min 4.690 -0.150
Median 5.1550 3.1050
Max 8.160 3.630
LHW090 200 Day 1 Pre-Dose n 6 5 6
mg

Clinical Trial Results Website CLHW090X2101
______________________________________________________________________________________________________________________________________
Page 41
MAD
Mean 887.3333 33.5600 2.6917
SD 187.57896 18.84630 1.25006
Min 659.000 13.900 1.890
Median 878.5000 39.0000 1.8900
Max 1200.000 55.200 4.520
Day 2 Pre-Dose n 6 6 6 6 5 6
Mean 936.8333 43.8333 6.1400 49.5000 11.0400 3.4483
SD 85.45506 9.62843 1.96944 205.28395 10.61334 1.28250
Min 864.000 31.800 3.980 -250.000 -2.100 2.090
Median 908.5000 41.8500 6.1850 30.0000 10.6000 3.3600
Max 1100.000 59.400 8.290 335.000 24.600 5.640
Day 3 Pre-Dose n 6 6
Mean 1010.3333 123.0000
SD 238.90556 301.85493
Min 638.000 -305.000
Median 1080.0000 142.0000
Max 1280.000 501.000
LHW090 200 Day 5 Pre-Dose n 6 6 6 6 5 6
mg
MAD
Mean 887.3333 38.3833 6.5500 0.0000 5.6000 3.8583
SD 226.79212 16.14514 1.43629 357.29428 15.39123 1.52349
Min 621.000 13.900 4.590 -477.000 -10.100 2.350
Median 865.5000 38.6500 6.3600 -76.5000 0.0000 3.7350
Max 1270.000 58.300 8.560 505.000 28.900 6.670
Day 9 Pre-Dose n 6 6
Mean 923.0000 35.6667
SD 249.80312 225.31282
Min 754.000 -178.000
Median 794.5000 -8.5000
Max 1380.000 439.000
Day 14 Pre-Dose n 6 6 6 6 5 6

Clinical Trial Results Website CLHW090X2101
______________________________________________________________________________________________________________________________________
Page 42
Mean 996.6667 29.8833 4.3450 109.3333 -0.4800 1.6533
SD 184.93530 12.93003 1.25502 187.59815 15.16301 1.22114
Min 790.000 13.900 1.890 -77.000 -14.400 0.000
Median 963.0000 34.2500 4.7650 44.5000 0.0000 1.7650
Max 1210.000 42.100 5.250 401.000 23.200 2.900
LHW090 200 Day 17 72 hr n 6 6 6 6 5 6
mg Post-Dose
MAD
Mean 1005.0000 38.7833 2.3933 117.6667 10.2000 -0.2983
SD 319.05109 13.83783 1.23291 295.80309 14.30944 2.01274
Min 693.000 13.900 1.890 -250.000 -10.400 -2.630
Median 892.0000 42.9500 1.8900 154.5000 7.8000 0.0000
Max 1520.000 53.600 4.910 485.000 27.200 3.020
LHW090 400 Day 1 Pre-Dose n 6
mg
MAD
Mean 2.4367
SD 1.33905
Min 1.890
Median 1.8900
Max 5.170
Day 2 Pre-Dose n 6 6
Mean 5.0400 2.6033
SD 3.55456 2.41272
Min 1.890 0.000
Median 4.7400 2.8500
Max 11.600 6.430
Day 5 Pre-Dose n 6 6
Mean 3.8750 1.4383
SD 3.35601 2.24927
Min 1.890 0.000
Median 1.8900 0.0000
Max 9.970 4.800

Clinical Trial Results Website CLHW090X2101
______________________________________________________________________________________________________________________________________
Page 43
LHW090 400 Day 14 Pre-Dose n 6 6
mg
MAD
Mean 3.1433 0.7067
SD 2.14464 1.10205
Min 1.890 0.000
Median 1.8900 0.0000
Max 7.090 2.320
Day 17 72 hr n 6 6
Post-Dose
Mean 2.5900 0.1533
SD 1.08445 1.07025
Min 1.890 -1.190
Median 1.8900 0.0000
Max 4.000 2.110
Pooled Day 1 Pre-Dose n 2 2 12
placebo
Mean 1065.5000 39.8000 4.5542
SD 133.64318 9.05097 2.72463
Min 971.000 33.400 1.890
Median 1065.5000 39.8000 4.4800
Max 1160.000 46.200 11.300
Day 2 Pre-Dose n 2 2 12 2 2 12
Mean 631.0000 43.1000 4.3420 -434.5000 3.3000 -0.2121
SD 56.56854 0.56569 2.76726 77.07464 8.48528 1.10371
Min 591.000 42.700 0.095 -489.000 -2.700 -1.950
Median 631.0000 43.1000 4.1500 -434.5000 3.3000 0.0000
Max 671.000 43.500 10.300 -380.000 9.300 2.210
Day 3 Pre-Dose n 2 2
Mean 816.5000 -249.0000
SD 72.83200 60.81118
Min 765.000 -292.000
Median 816.5000 -249.0000
Max 868.000 -206.000

Clinical Trial Results Website CLHW090X2101
______________________________________________________________________________________________________________________________________
Page 44
Pooled Day 5 Pre-Dose n 2 2 12 2 2 12
placebo
Mean 854.0000 47.5000 4.9617 -211.5000 7.7000 0.4075
SD 121.62237 1.97990 3.00164 255.26555 11.03087 1.71172
Min 768.000 46.100 1.890 -392.000 -0.100 -1.860
Median 854.0000 47.5000 4.9750 -211.5000 7.7000 0.0000
Max 940.000 48.900 11.200 -31.000 15.500 5.210
Day 9 Pre-Dose n 2 2
Mean 947.5000 -118.0000
SD 74.24621 207.88939
Min 895.000 -265.000
Median 947.5000 -118.0000
Max 1000.000 29.000
Day 14 Pre-Dose n 2 2 12 2 2 12
Mean 637.0000 33.7000 4.2533 -428.5000 -6.1000 -0.3008
SD 60.81118 2.68701 2.89613 72.83200 11.73797 1.29818
Min 594.000 31.800 1.890 -480.000 -14.400 -2.490
Median 637.0000 33.7000 3.0350 -428.5000 -6.1000 0.0000
Max 680.000 35.600 9.750 -377.000 2.200 2.460
Pooled Day 17 72 hr n 2 2 12 2 2 12
placebo Post-Dose
Mean 807.5000 38.5000 5.7958 -258.0000 -1.3000 1.2417
SD 51.61880 5.37401 3.47321 82.02439 3.67696 1.54831
Min 771.000 34.700 1.890 -316.000 -3.900 -0.300
Median 807.5000 38.5000 4.8100 -258.0000 -1.3000 0.7700
Max 844.000 42.300 13.500 -200.000 1.300 5.210
Summary statistics of plasma PD markers – Stage 4 -------------Results-------------- -------Change from baseline-------
Scheduled CYS ANP cGMP CYS ANP cGMP
Treatment Day time(hr) Statistics (ng/mL) (pg/mL) (nmol/L) (ng/mL) (pg/mL) (nmol/L)
-----------------------------------------------------------------------------------------------------------------------
LHW090 5mg Day -1 Pre-Dose n 6 6 6

Clinical Trial Results Website CLHW090X2101
______________________________________________________________________________________________________________________________________
Page 45
SAD
(cohort 1)
Mean 1973.3333 235.8500 10.0583
SD 704.17801 81.97765 5.92542
Min 1000.000 141.000 5.370
Median 2050.0000 216.0000 7.9000
Max 3050.000 340.100 20.900
Day 1 0 hr n 6 5 6 6 5 6
Pre-Dose
Mean 1921.6667 191.4200 8.5383 -51.6667 -48.0000 -1.5200
SD 528.18242 89.36013 4.94001 253.17320 73.82073 2.54945
Min 1190.000 105.000 5.210 -500.000 -148.000 -6.160
Median 2130.0000 182.0000 6.5250 10.0000 -67.0000 -0.7250
Max 2550.000 340.100 18.300 190.000 45.000 0.600
1 hr n 6 6 6 6 6 6
Post-Dose
Mean 1691.3333 208.0167 8.7283 -282.0000 -27.8333 -1.3300
SD 504.90659 72.28888 6.10671 255.01373 52.90526 2.32327
Min 998.000 138.000 1.890 -570.000 -111.000 -4.090
Median 1675.0000 193.5000 7.8300 -250.0000 -2.0000 -1.1600
Max 2480.000 340.100 19.800 -2.000 23.000 1.820
LHW090 5mg Day 1 4 hr n 5 5 5 5 5 5
SAD Post-Dose
(cohort 1)
Mean 1540.0000 243.4200 15.2600 -218.0000 28.4200 7.3700
SD 386.52296 86.68698 3.88690 170.79227 84.93516 3.07160
Min 1030.000 133.000 10.100 -410.000 -81.000 4.120
Median 1710.0000 246.0000 17.5000 -210.0000 12.0000 6.4000
Max 1890.000 340.100 18.700 30.000 122.100 12.130
8 hr n 5 5 5 5 5 5
Post-Dose
Mean 1420.4000 230.2200 15.7000 -337.6000 15.2200 7.8100
SD 393.40920 93.15950 4.11886 250.79633 82.21339 4.11519
Min 942.000 122.000 10.600 -740.000 -92.000 4.290

Clinical Trial Results Website CLHW090X2101
______________________________________________________________________________________________________________________________________
Page 46
Median 1510.0000 208.0000 17.1000 -280.0000 -3.0000 6.9300
Max 1800.000 340.100 20.500 -58.000 122.100 14.520
12 hr n 5 4 5 5 4 5
Post-Dose
Mean 1433.0000 184.0750 14.5660 -325.0000 -30.1750 6.6760
SD 336.11010 107.18841 5.24145 191.50718 66.83554 4.62420
Min 915.000 84.300 8.230 -550.000 -129.700 1.920
Median 1640.0000 158.0000 13.7000 -410.0000 -1.0000 5.7300
Max 1700.000 336.000 20.100 -85.000 11.000 14.120
LHW090 5mg Day 2 24 hr n 5 5 5 5 5 5
SAD Post-Dose
(cohort 1)
Mean 1840.0000 175.7800 11.7400 82.0000 -39.2200 3.8500
SD 577.79754 79.83008 3.46958 490.42838 52.85160 1.23562
Min 1310.000 82.900 7.200 -630.000 -131.100 1.830
Median 1620.0000 154.0000 11.2000 130.0000 -18.0000 4.1000
Max 2680.000 296.000 16.400 630.000 1.000 5.220
Day 4 72 hr n 5 5 5 5 5 5
Post-Dose
Mean 1894.0000 209.0400 8.5360 136.0000 -5.9600 0.6460
SD 516.94294 119.87954 2.30793 448.69812 83.39486 1.52467
Min 1380.000 115.000 5.590 -560.000 -99.000 -1.200
Median 1690.0000 134.0000 8.1300 330.0000 -7.0000 1.1100
Max 2510.000 340.100 11.100 510.000 122.100 2.150
LHW090 12.5m Day -1 Pre-Dose n 9 9
g
SAD
Mean 1661.1111 8.9133
SD 309.85660 5.86448
Min 1410.000 1.890
Median 1600.0000 5.8500
Max 2440.000 20.800
Day 1 0 hr n 9 9 9 9

Clinical Trial Results Website CLHW090X2101
______________________________________________________________________________________________________________________________________
Page 47
Pre-Dose
Mean 1552.2222 7.2156 -108.8889 -1.6978
SD 251.03674 4.97697 159.17321 1.83282
Min 1210.000 1.890 -310.000 -3.610
Median 1510.0000 6.0500 -110.0000 -2.7000
Max 2130.000 17.700 190.000 1.410
1 hr n 9 9 9 9
Post-Dose
Mean 1580.0000 7.9878 -81.1111 -0.9256
SD 231.40873 5.63138 178.98634 1.40675
Min 1230.000 1.890 -380.000 -4.050
Median 1520.0000 6.2700 -100.0000 -0.5100
Max 2060.000 20.600 130.000 0.490
LHW090 12.5m Day 1 4 hr n 9 9 9 9
g Post-Dose
SAD
Mean 1528.8889 16.3878 -132.2222 7.4744
SD 250.32201 9.54604 203.94716 4.90864
Min 1230.000 8.090 -440.000 -0.440
Median 1490.0000 12.8000 -140.0000 7.5000
Max 2080.000 38.100 170.000 17.300
8 hr n 9 8 9 8
Post-Dose
Mean 1283.6667 19.0275 -377.4444 9.2363
SD 524.81997 9.45869 467.92230 5.28286
Min 33.000 7.380 -1567.000 1.600
Median 1390.0000 19.4000 -260.0000 10.5000
Max 2000.000 36.400 -30.000 15.600
12 hr n 9 9 9 9
Post-Dose
Mean 1402.2222 18.0222 -258.8889 9.1089
SD 194.40793 9.03196 146.66667 5.18912
Min 1130.000 8.640 -580.000 0.960
Median 1380.0000 20.2000 -250.0000 8.7000

Clinical Trial Results Website CLHW090X2101
______________________________________________________________________________________________________________________________________
Page 48
Max 1860.000 35.100 -90.000 15.400
LHW090 12.5m Day 2 24 hr n 9 9 9 9
g Post-Dose
SAD
Mean 1462.2222 13.8256 -198.8889 4.9122
SD 180.19280 8.76320 197.89167 4.14068
Min 1110.000 4.260 -630.000 -0.600
Median 1450.0000 12.8000 -190.0000 3.8300
Max 1810.000 31.100 20.000 10.500
Day 4 72 hr n 9 9 9 9
Post-Dose
Mean 1525.5556 10.8133 -135.5556 1.9000
SD 275.59532 6.36838 201.74929 1.34932
Min 1300.000 4.950 -370.000 0.090
Median 1440.0000 8.5500 -220.0000 1.5700
Max 2170.000 24.000 310.000 3.800
LHW090 25mg Day -1 Pre-Dose n 9 9
SAD
Mean 2296.6667 7.9111
SD 708.69599 3.59330
Min 1350.000 1.890
Median 2570.0000 7.0700
Max 3650.000 14.000
Day 1 0 hr n 9 9 9 9
Pre-Dose
Mean 2138.8889 5.9756 -157.7778 -1.9356
SD 333.55826 3.07887 498.06570 2.11039
Min 1630.000 1.890 -1230.000 -6.390
Median 2100.0000 5.1100 -50.0000 -1.4000
Max 2560.000 12.600 430.000 0.020
1 hr n 9 9 9 9
Post-Dose
Mean 2167.7778 6.8233 -128.8889 -1.0878

Clinical Trial Results Website CLHW090X2101
______________________________________________________________________________________________________________________________________
Page 49
SD 418.32337 5.83801 482.27182 4.02516
Min 1490.000 1.890 -980.000 -6.650
Median 2250.0000 4.8500 -190.0000 -0.1100
Max 2670.000 20.600 640.000 6.600
LHW090 25mg Day 1 4 hr n 9 9 9 9
SAD Post-Dose
Mean 2231.1111 14.4900 -65.5556 6.5789
SD 436.93376 10.29138 500.62738 7.93492
Min 1550.000 6.450 -1210.000 -0.900
Median 2220.0000 12.4000 80.0000 5.9300
Max 2900.000 39.800 520.000 25.800
8 hr n 9 9 9 9
Post-Dose
Mean 2272.2222 15.1489 -24.4444 7.2378
SD 504.94499 9.69270 499.40242 7.24101
Min 1670.000 5.460 -860.000 0.760
Median 2120.0000 12.5000 20.0000 5.7000
Max 3280.000 37.400 610.000 23.400
12 hr n 9 9 9 9
Post-Dose
Mean 2145.5556 14.2911 -151.1111 6.3800
SD 333.65818 8.65109 523.93808 6.22136
Min 1720.000 6.280 -1170.000 1.060
Median 2120.0000 12.3000 -70.0000 4.3000
Max 2640.000 35.100 550.000 21.100
LHW090 25mg Day 2 24 hr n 9 9 9 9
SAD Post-Dose
Mean 2213.3333 10.9189 -83.3333 3.0078
SD 418.59885 5.78872 593.14838 4.41193
Min 1790.000 5.290 -1200.000 -1.110
Median 2140.0000 8.6300 20.0000 0.9800
Max 3050.000 22.700 580.000 11.640
Day 4 72 hr n 9 9 9 9

Clinical Trial Results Website CLHW090X2101
______________________________________________________________________________________________________________________________________
Page 50
Post-Dose
Mean 2174.4444 8.7078 -122.2222 0.7967
SD 433.62170 5.74997 580.08141 4.16736
Min 1520.000 4.550 -1310.000 -3.470
Median 2200.0000 6.4200 50.0000 -1.1200
Max 2910.000 23.100 650.000 9.100
LHW090 2mg Day -1 Pre-Dose n 9 9
SAD
Mean 1405.4444 4.6922
SD 317.26452 2.38123
Min 889.000 1.890
Median 1460.0000 5.3900
Max 1910.000 8.300
Day 1 0 hr n 9 9 9 9
Pre-Dose
Mean 1417.1111 3.1167 11.6667 -1.5756
SD 435.29658 1.90245 180.88256 2.41610
Min 876.000 1.890 -150.000 -6.410
Median 1410.0000 1.8900 -13.0000 0.0000
Max 2360.000 6.570 450.000 0.140
1 hr n 9 9 9 9
Post-Dose
Mean 1386.7778 3.4633 -18.6667 -1.2289
SD 372.84842 1.55469 124.07558 2.90866
Min 926.000 1.890 -220.000 -6.410
Median 1420.0000 4.1100 -20.0000 -0.1000
Max 2120.000 5.460 210.000 3.570
LHW090 2mg Day 1 4 hr n 9 9 9 9
SAD Post-Dose
Mean 1380.7778 7.5444 -24.6667 2.8522
SD 429.80396 3.13788 167.07558 1.91006
Min 756.000 1.890 -250.000 0.000
Median 1400.0000 7.1900 -99.0000 2.5000
Max 2200.000 11.900 290.000 6.060

Clinical Trial Results Website CLHW090X2101
______________________________________________________________________________________________________________________________________
Page 51
8 hr n 9 9 9 9
Post-Dose
Mean 1316.6667 8.6311 -88.7778 3.9389
SD 383.68314 2.56734 92.47132 1.45234
Min 689.000 5.880 -210.000 1.870
Median 1320.0000 7.7100 -110.0000 3.9900
Max 1950.000 13.200 40.000 6.630
12 hr n 9 9 9 9
Post-Dose
Mean 1434.7778 7.2978 29.3333 2.6056
SD 484.07948 1.67926 253.44427 2.25640
Min 743.000 4.680 -146.000 -1.120
Median 1340.0000 7.4700 -90.0000 3.4500
Max 2260.000 9.450 570.000 5.550
LHW090 2mg Day 2 24 hr n 9 9 9 9
SAD Post-Dose
Mean 1399.4444 4.7400 -6.0000 0.0478
SD 413.33616 2.50911 167.23935 1.74243
Min 819.000 1.890 -150.000 -3.300
Median 1370.0000 4.7200 -70.0000 0.0000
Max 2290.000 8.610 380.000 2.180
Day 4 72 hr n 9 9 9 9
Post-Dose
Mean 1437.6667 3.1678 32.2222 -1.5244
SD 422.66594 1.64547 169.39435 2.05654
Min 829.000 1.890 -140.000 -6.410
Median 1410.0000 1.8900 -30.0000 -1.2800
Max 2330.000 6.330 420.000 0.000
LHW090 5mg Day -1 Pre-Dose n 9 7 9
SAD
(cohort 5)
Mean 1564.6667 135.0714 7.5678
SD 435.44345 127.87503 4.77326

Clinical Trial Results Website CLHW090X2101
______________________________________________________________________________________________________________________________________
Page 52
Min 982.000 37.500 1.890
Median 1570.0000 83.6000 5.2500
Max 2340.000 412.000 16.400
Day 1 0 hr n 9 9 9 9 7 9
Pre-Dose
Mean 1527.3333 151.3778 5.8278 -37.3333 -5.7143 -1.7400
SD 358.88578 144.21408 4.92283 211.52778 17.15696 1.60702
Min 996.000 38.600 1.890 -400.000 -31.000 -3.460
Median 1510.0000 97.4000 4.5200 -60.0000 -3.9000 -2.1300
Max 1940.000 412.000 17.000 370.000 22.400 0.600
1 hr n 9 9 9 9 7 9
Post-Dose
Mean 1490.3333 117.2333 6.3178 -74.3333 -25.9286 -1.2500
SD 309.47294 68.61988 4.53346 182.15790 58.97352 2.80954
Min 923.000 38.300 1.890 -420.000 -149.000 -6.830
Median 1550.0000 95.1000 7.0200 -59.0000 0.4000 -1.1000
Max 1920.000 263.000 15.300 150.000 24.500 2.710
LHW090 5mg Day 1 4 hr n 9 8 9 9 6 9
SAD Post-Dose
(cohort 5)
Mean 1475.5556 145.8250 12.8133 -89.1111 -9.9833 5.2456
SD 331.32730 81.25165 7.44572 111.99157 57.86351 4.75203
Min 1030.000 55.100 4.410 -280.000 -111.000 -2.760
Median 1490.0000 109.5000 10.3000 -80.0000 15.3500 5.5700
Max 2060.000 301.000 24.900 48.000 39.000 11.850
8 hr n 9 7 9 9 5 9
Post-Dose
Mean 1423.2222 171.3714 12.6611 -141.4444 3.9000 5.0933
SD 344.83901 116.65856 5.12280 150.51006 45.97260 4.08169
Min 891.000 59.600 5.990 -450.000 -75.000 0.710
Median 1510.0000 127.0000 11.9000 -110.0000 22.0000 3.7700
Max 1890.000 337.000 20.600 110.000 43.400 14.710
12 hr n 9 8 9 9 7 9

Clinical Trial Results Website CLHW090X2101
______________________________________________________________________________________________________________________________________
Page 53
Post-Dose
Mean 1413.5556 129.5375 12.1422 -151.1111 -7.1714 4.5744
SD 308.99640 88.54871 5.76825 165.86474 49.37292 4.58163
Min 922.000 48.800 5.760 -440.000 -78.000 -2.960
Median 1440.0000 109.1500 9.8800 -60.0000 1.0000 4.8000
Max 1900.000 334.000 23.500 0.000 75.000 13.310
LHW090 5mg Day 2 24 hr n 9 8 9 9 7 9
SAD Post-Dose
(cohort 5)
Mean 1493.3333 106.7875 8.0011 -71.3333 -24.3571 0.4333
SD 331.70017 62.11697 4.98074 165.45694 69.36293 1.93624
Min 1040.000 56.900 1.890 -400.000 -173.000 -2.130
Median 1580.0000 82.7000 6.7400 -50.0000 -6.1000 0.5000
Max 1940.000 239.000 17.500 180.000 30.000 3.380
Day 4 72 hr n 9 8 9 9 7 9
Post-Dose
Mean 1546.6667 117.6375 5.7800 -18.0000 -18.4857 -1.7878
SD 403.05087 105.06182 4.34545 98.92421 30.17242 2.44764
Min 1040.000 36.100 1.890 -180.000 -70.700 -5.030
Median 1560.0000 93.1500 4.8400 -40.0000 -10.0000 -2.4500
Max 2290.000 367.000 15.600 120.000 19.400 2.950
Summary statistics of plasma PD markers – Stage 5 -------------Results-------------- -------Change from baseline-------
Scheduled CYS ANP cGMP CYS ANP cGMP
Treatment Day time(hr) Statistics (ng/mL) (pg/mL) (nmol/L) (ng/mL) (pg/mL) (nmol/L)
---------------------------------------------------------------------------------------------------------------------
LHW090 5mg Day -1 Pre-Dose n 4 9 9
MAD
Mean 1662.5000 95.4222 11.7389
SD 260.81603 34.86731 5.51249
Min 1310.000 54.800 5.740
Median 1700.0000 93.1000 11.3000
Max 1940.000 159.000 21.500

Clinical Trial Results Website CLHW090X2101
______________________________________________________________________________________________________________________________________
Page 54
Day 2 0 hr n 4 9 9 4 9 9
Pre-Dose
Mean 1542.5000 92.3778 16.8811 -120.0000 -3.0444 5.1422
SD 278.37325 25.18476 6.47716 53.54126 32.00770 5.89913
Min 1140.000 59.300 9.860 -170.000 -52.000 -8.000
Median 1625.0000 88.8000 15.7000 -125.0000 -3.5000 4.8000
Max 1780.000 140.000 29.500 -60.000 41.300 12.400
12 hr n 4 9 9 4 9 9
Post-Dose
Mean 1537.5000 99.9667 19.3444 -125.0000 4.5444 7.6056
SD 282.76905 37.73231 5.83355 80.20806 27.33025 4.97574
Min 1130.000 72.400 10.600 -180.000 -46.600 -2.100
Median 1630.0000 88.4000 19.4000 -155.0000 17.9000 8.7000
Max 1760.000 194.000 28.200 -10.000 35.000 14.600
LHW090 5mg Day 3 0 hr n 4 9 9 4 9 9
MAD Pre-Dose
Mean 1535.0000 90.5556 16.2500 -127.5000 -4.8667 4.5111
SD 257.48786 26.90326 6.60085 63.44289 34.57362 5.42709
Min 1160.000 52.800 7.350 -200.000 -66.200 -6.600
Median 1620.0000 93.1000 14.9000 -130.0000 0.2000 6.0600
Max 1740.000 137.000 30.400 -50.000 30.900 11.700
12 hr n 4 5 9 4 5 9
Post-Dose
Mean 1567.5000 91.2600 16.0167 -95.0000 -11.9400 4.2778
SD 267.87746 24.70208 6.67168 89.62886 17.51065 5.36636
Min 1210.000 64.300 5.300 -180.000 -33.100 -1.090
Median 1625.0000 85.9000 18.2000 -115.0000 0.3000 2.0500
Max 1810.000 130.000 23.800 30.000 1.500 15.960
Day 4 24 hr n 4 9 9 4 9 9
Post-Dose
Mean 1540.0000 83.4667 13.1856 -122.5000 -11.9556 1.4467
SD 250.19992 23.62144 4.97327 42.72002 34.28823 3.82175
Min 1180.000 55.200 4.550 -180.000 -63.800 -6.900
Median 1610.0000 78.7000 14.0000 -110.0000 -2.4000 2.7000

Clinical Trial Results Website CLHW090X2101
______________________________________________________________________________________________________________________________________
Page 55
Max 1760.000 126.000 22.500 -90.000 32.900 5.780
Pooled Day -1 Pre-Dose n 2 3 3
placebo
Mean 1310.0000 74.9000 5.5567
SD 127.27922 24.06180 1.01214
Min 1220.000 53.600 4.390
Median 1310.0000 70.1000 6.0800
Max 1400.000 101.000 6.200
Day 2 0 hr n 2 3 3 2 3 3
Pre-Dose
Mean 1275.0000 68.7333 6.3067 -35.0000 -6.1667 0.7500
SD 162.63456 19.63398 1.25261 35.35534 5.08167 1.99592
Min 1160.000 49.800 4.870 -60.000 -12.000 -1.210
Median 1275.0000 67.4000 6.8800 -35.0000 -3.8000 0.6800
Max 1390.000 89.000 7.170 -10.000 -2.700 2.780
12 hr n 2 2 3 2 2 3
Post-Dose
Mean 1165.0000 65.2500 6.8467 -145.0000 3.4000 1.2900
SD 219.20310 4.31335 0.72528 91.92388 7.35391 1.65928
Min 1010.000 62.200 6.110 -210.000 -1.800 0.030
Median 1165.0000 65.2500 6.8700 -145.0000 3.4000 0.6700
Max 1320.000 68.300 7.560 -80.000 8.600 3.170
Pooled Day 3 0 hr n 2 3 3 2 3 3
placebo Pre-Dose
Mean 1270.0000 75.5667 6.4400 -40.0000 0.6667 0.8833
SD 197.98990 15.96381 1.53353 70.71068 8.50078 2.46529
Min 1130.000 60.000 4.970 -90.000 -9.100 -1.110
Median 1270.0000 74.8000 6.3200 -40.0000 4.7000 0.1200
Max 1410.000 91.900 8.030 10.000 6.400 3.640
12 hr n 2 3 3 2 3 3
Post-Dose
Mean 1215.0000 69.9000 7.2400 -95.0000 -5.0000 1.6833

Clinical Trial Results Website CLHW090X2101
______________________________________________________________________________________________________________________________________
Page 56
SD 205.06097 24.41782 1.96924 77.78175 6.01082 2.93643
Min 1070.000 44.500 5.390 -150.000 -9.100 -0.810
Median 1215.0000 72.0000 7.0200 -95.0000 -7.8000 0.9400
Max 1360.000 93.200 9.310 -40.000 1.900 4.920
Day 4 24 hr n 2 3 3 2 3 3
Post-Dose
Mean 1265.0000 55.2000 6.0967 -45.0000 -19.7000 0.5400
SD 205.06097 14.01820 1.47025 77.78175 11.70427 2.35023
Min 1120.000 40.100 4.560 -100.000 -33.200 -1.520
Median 1265.0000 57.7000 6.2400 -45.0000 -13.5000 0.0400
Max 1410.000 67.800 7.490 10.000 -12.400 3.100
Summary of plasma pharmacokinetic parameters of LHW090 following single dose administration (0.1-800 mg) of LHW090 to healthy subjects (PK analysis set)-Stage 1 and 2
Dose Statistic Cmax
(ng/mL) Tmax
1
(hr) AUClast
(hr*ng/mL) AUCinf
(hr*ng/mL) AUC0-24h (hr*ng/mL)
T1/2 (hr)
CL/F (L/hr)
LHW090 %Hydrolysis (%)
1 mg (Stage 1) n 3 3 3 3 3 3 3 3
Mean (SD) 60.7 (11.4) 1.50 (1.00;2.00)
153 (28.3) 155 (29.5) 155 (30.5) 1.69 (0.922) 6.63 (1.26) 63.0 (3.60)
CV% mean 18.7 18.6 19.1 19.7 54.4 19.1 5.7
0.1 mg n 8 8 8 6 8 6 6 8
Mean (SD) 7.24 (2.26) 1.00 (1.00;1.00)
14.6 (5.09) 17.0 (5.72) 15.5 (5.13) 1.38 (0.728) 6.77 (3.46) 45.3 (9.49)
CV% mean 31.2 34.8 33.5 33.1 52.7 51.1 20.9
1 mg n 8 8 8 8 8 8 8 8
Mean (SD) 57.1 (22.2) 1.25 (0.967;3.00)
128 (34.9) 130 (35.2) 129 (35.8) 1.33 (0.618) 8.12 (1.77) 68.6 (5.05)
CV% mean 38.8 27.2 27.2 27.6 46.3 21.8 7.4
5 mg n 8 8 8 8 8 8 8 8
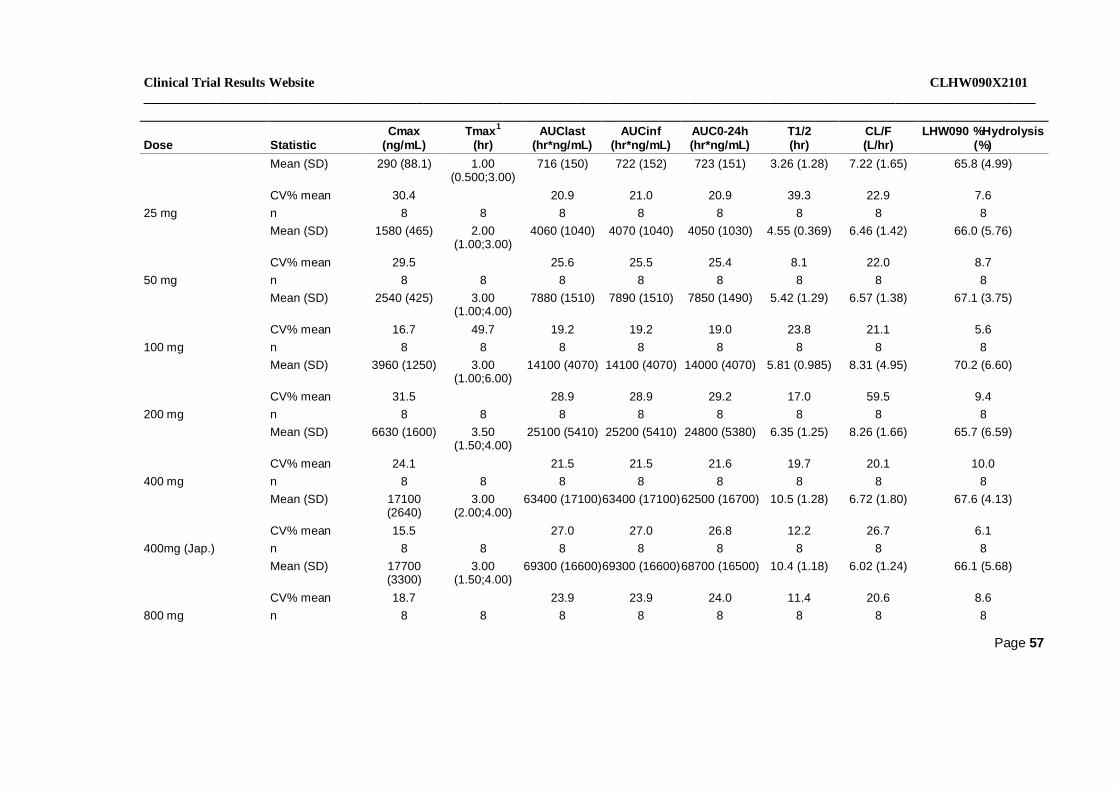
Clinical Trial Results Website CLHW090X2101
______________________________________________________________________________________________________________________________________
Page 57
Dose Statistic Cmax
(ng/mL) Tmax
1
(hr) AUClast
(hr*ng/mL) AUCinf
(hr*ng/mL) AUC0-24h (hr*ng/mL)
T1/2 (hr)
CL/F (L/hr)
LHW090 %Hydrolysis (%)
Mean (SD) 290 (88.1) 1.00 (0.500;3.00)
716 (150) 722 (152) 723 (151) 3.26 (1.28) 7.22 (1.65) 65.8 (4.99)
CV% mean 30.4 20.9 21.0 20.9 39.3 22.9 7.6
25 mg n 8 8 8 8 8 8 8 8
Mean (SD) 1580 (465) 2.00 (1.00;3.00)
4060 (1040) 4070 (1040) 4050 (1030) 4.55 (0.369) 6.46 (1.42) 66.0 (5.76)
CV% mean 29.5 25.6 25.5 25.4 8.1 22.0 8.7
50 mg n 8 8 8 8 8 8 8 8
Mean (SD) 2540 (425) 3.00 (1.00;4.00)
7880 (1510) 7890 (1510) 7850 (1490) 5.42 (1.29) 6.57 (1.38) 67.1 (3.75)
CV% mean 16.7 49.7 19.2 19.2 19.0 23.8 21.1 5.6
100 mg n 8 8 8 8 8 8 8 8
Mean (SD) 3960 (1250) 3.00 (1.00;6.00)
14100 (4070) 14100 (4070) 14000 (4070) 5.81 (0.985) 8.31 (4.95) 70.2 (6.60)
CV% mean 31.5 28.9 28.9 29.2 17.0 59.5 9.4
200 mg n 8 8 8 8 8 8 8 8
Mean (SD) 6630 (1600) 3.50 (1.50;4.00)
25100 (5410) 25200 (5410) 24800 (5380) 6.35 (1.25) 8.26 (1.66) 65.7 (6.59)
CV% mean 24.1 21.5 21.5 21.6 19.7 20.1 10.0
400 mg n 8 8 8 8 8 8 8 8
Mean (SD) 17100 (2640)
3.00 (2.00;4.00)
63400 (17100) 63400 (17100) 62500 (16700) 10.5 (1.28) 6.72 (1.80) 67.6 (4.13)
CV% mean 15.5 27.0 27.0 26.8 12.2 26.7 6.1
400mg (Jap.) n 8 8 8 8 8 8 8 8
Mean (SD) 17700 (3300)
3.00 (1.50;4.00)
69300 (16600) 69300 (16600) 68700 (16500) 10.4 (1.18) 6.02 (1.24) 66.1 (5.68)
CV% mean 18.7 23.9 23.9 24.0 11.4 20.6 8.6
800 mg n 8 8 8 8 8 8 8 8

Clinical Trial Results Website CLHW090X2101
______________________________________________________________________________________________________________________________________
Page 58
Dose Statistic Cmax
(ng/mL) Tmax
1
(hr) AUClast
(hr*ng/mL) AUCinf
(hr*ng/mL) AUC0-24h (hr*ng/mL)
T1/2 (hr)
CL/F (L/hr)
LHW090 %Hydrolysis (%)
Mean (SD) 20000 (5050)
3.00 (2.00;4.00)
96000 (21600) 96100 (21600) 95300 (21400) 11.3 (2.07) 8.70 (1.92) 70.9 (6.36)
CV% mean 25.2 22.5 22.5 22.5 18.4 22.1 9.0
Statistics presented include: n, arithmetic mean (standard deviation) and CV% arithmetic mean 1For Tmax, Median (Minimum;Maximum) are presented
Summary of plasma pharmacokinetic parameters of LHV527 following single dose administration (0.1- 800 mg) of LHW090 to healthy subjects (PK analysis set)-Stage 1 and 2
Dose Statistic Cmax
(ng/mL) Tmax
1
(hr)
AUClast (hr*ng/mL)
AUCinf (hr*ng/mL)
AUC0-24h (hr*ng/mL)
T1/2 (hr)
1 mg (Stage 1) n 3 3 3 3 3 3
Mean (SD) 34.8 (4.12) 3.00 (2.00;3.00) 258 (19.8) 309 (37.7) 204 (14.4) 47.2 (9.34)
CV% mean 11.8 7.7 12.2 7.1 19.8
0.1 mg n 8 8 8 8 8 8
Mean (SD) 3.34 (1.05) 1.50 (1.50;2.00) 11.5 (1.96) 13.6 (2.17) 12.1 (1.93) 2.48 (0.852)
CV% mean 31.4 17.1 16.0 16.0 34.4
1 mg n 8 8 8 8 8 8
Mean (SD) 40.0 (10.4) 2.50 (1.50;4.00) 277 (32.0) 327 (38.9) 217 (31.7) 42.2 (7.35)
CV% mean 25.9 11.6 11.9 14.6 17.4
5 mg n 8 8 8 8 8 8
Mean (SD) 193 (41.7) 3.00 (1.50;4.00) 1390 (279) 1430 (275) 1260 (261) 27.4 (6.60)
CV% mean 21.6 20.1 19.2 20.8 24.0
25 mg n 8 8 8 8 8 8
Mean (SD) 1180 (189) 3.00 (1.50;4.00) 7970 (2010) 8020 (2010) 7540 (1880) 16.1 (3.44)
CV% mean 15.9 25.2 25.1 25.0 21.3
50 mg n 8 8 8 8 8 8

Clinical Trial Results Website CLHW090X2101
______________________________________________________________________________________________________________________________________
Page 59
Dose Statistic Cmax
(ng/mL) Tmax
1
(hr)
AUClast (hr*ng/mL)
AUCinf (hr*ng/mL)
AUC0-24h (hr*ng/mL)
T1/2 (hr)
Mean (SD) 2280 (454) 4.00 (2.00;4.00) 16100 (3000) 16200 (3000) 15400 (2910) 15.1 (3.24)
CV% mean 19.9 18.6 18.5 18.9 21.5
100 mg n 8 8 8 8 8 8
Mean (SD) 4210 (770) 4.00 (3.00;6.00) 32500 (5320) 32600 (5330) 30600 (4960) 10.7 (2.29)
CV% mean 18.3 16.4 16.4 16.2 21.4
200 mg n 8 8 8 8 8 8
Mean (SD) 5830 (1730) 4.00 (4.00;6.00) 49200 (11800) 49300 (11800) 46000 (10900) 9.96 (2.41)
CV% mean 29.7 23.9 23.8 23.8 24.2
400 mg n 8 8 8 8 8 8
Mean (SD) 17000 (2740) 4.00 (3.00;6.00) 131000 (25600)
131000 (25700) 122000 (24100) 8.75 (1.37)
CV% mean 16.1 19.5 19.5 19.7 15.6
400mg (Jap.) n 8 8 8 8 8 8
Mean (SD) 16000 (4000) 4.00 (3.00;6.00) 136000 (30600)
136000 (30700) 127000 (27500) 10.4 (1.74)
CV% mean 24.9 22.5 22.5 21.7 16.7
800 mg n 8 8 8 8 8 8
Mean (SD) 26300 (4830) 4.00 (4.00;6.00) 237000 (48700)
237000 (48800) 222000 (43700) 9.03 (0.610)
CV% mean 18.4 20.5 20.5 19.7 6.8
Statistics presented include: n, arithmetic mean (standard deviation) and CV% arithmetic mean

Clinical Trial Results Website CLHW090X2101
______________________________________________________________________________________________________________________________________
Page 60
1For Tmax, Median (Minimum;Maximum) are presented
Summary of plasma pharmacokinetic parameters of LHW090 following multiple ascending dose administration of LHW090 to healthy subjects (PK analysis set)-Stage 3
Dose Day Statistic Cmax
(ng/mL) Tmax
1
(hr) AUCtau
(hr*ng/mL) AUClast
(hr*ng/mL)
Racc T1/2 (hr)
CLss/F (L/hr)
LHW090 % Hydrolysis
(%)
5 mg 1 n 6 6 6 6
Mean (SD) 256 (71.2) 1.50 (1.00;3.00)
672 (242) 68.5 (3.10)
CV% mean 27.8 36.0 4.5
14 n 6 6 6 6 6 6 6 6
Mean (SD) 341 (144) 1.25 (0.500;2.00)
741 (261) 740 (263) 1.11 (0.117) 4.59 (1.97) 7.47 (2.58) 71.2 (3.42)
CV% mean 42.1 35.3 35.6 10.5 42.9 34.6 4.8
25 mg 1 n 6 6 6 6
Mean (SD) 1490 (501) 1.00 (1.00;3.00)
3730 (1440) 68.5 (9.16)
CV% mean 33.6 38.7 13.4
14 n 6 6 6 6 6 6 6 6
Mean (SD) 1810 (339) 1.25 (1.00;3.00)
4470 (934) 4500 (956) 1.27 (0.230) 5.71 (0.730) 5.80 (1.24) 68.5 (6.68)
CV% mean 18.7 20.9 21.3 18.1 12.8 21.4 9.7
50 mg 1 n 6 6 6 6
Mean (SD) 3410 (944) 2.00 (1.00;3.00)
7190 (1100) 68.3 (3.37)
CV% mean 27.6 15.3 4.9
14 n 6 6 6 6 6 6 6 6
Mean (SD) 2810 (1070) 3.00 (1.00;4.00)
8470 (1220) 8520 (1230) 1.19 (0.172) 6.43 (0.885) 6.00 (0.850) 66.8 (3.55)

Clinical Trial Results Website CLHW090X2101
______________________________________________________________________________________________________________________________________
Page 61
Dose Day Statistic Cmax
(ng/mL) Tmax
1
(hr) AUCtau
(hr*ng/mL) AUClast
(hr*ng/mL)
Racc T1/2 (hr)
CLss/F (L/hr)
LHW090 % Hydrolysis
(%)
CV% mean 38.0 14.4 14.4 14.5 13.8 14.2 5.3
100 mg 1 n 6 6 6 6
Mean (SD) 5150 (2300) 3.00 (1.50;4.00)
14900 (3580) 66.3 (3.06)
CV% mean 44.6 23.9 4.6
14 n 6 6 6 6 6 6 6 6
Mean (SD) 5510 (1200) 1.75 (1.50;3.00)
17000 (2580) 17100 (2620) 1.16 (0.187) 10.9 (5.27) 6.03 (1.03) 67.5 (2.30)
CV% mean 21.7 15.2 15.3 16.1 48.3 17.1 3.4
200 mg 1 n 6 6 6 6
Mean (SD) 7650 (2930) 2.75 (1.00;4.00)
24500 (7410) 67.9 (5.51)
CV% mean 38.3 30.3 8.1
14 n 6 6 6 6 6 6 6 6
Mean (SD) 8230 (1690) 1.75 (1.00;4.00)
27900 (4470) 28100 (4550) 1.20 (0.288) 14.7 (4.85) 7.36 (1.52) 70.9 (5.99)
CV% mean 20.6 16.0 16.2 24.0 32.9 20.7 8.5
400 mg 1 n 6 6 6 6
Mean (SD) 15700 (5120)
3.00 (1.50;4.00)
57600 (9560) 65.5 (2.40)
CV% mean 32.5 16.6 3.7
14 n 6 6 6 6 6 6 6 6
Mean (SD) 15200 (5270)
3.00 (2.00;6.00)
65300 (13800) 66000 (13800) 1.13 (0.0694) 11.6 (2.45) 6.35 (1.31) 65.5 (3.77)
CV% mean 34.6 21.1 20.9 6.2 21.1 20.6 5.8
Statistics presented include: n, arithmetic mean (standard deviation) and CV% arithmetic mean 1For Tmax, Median (Minimum; Maximum) are presented

Clinical Trial Results Website CLHW090X2101
______________________________________________________________________________________________________________________________________
Page 62
Summary of plasma pharmacokinetic parameters of LHV527 following multiple ascending dose administration of LHW090 to healthy subjects (PK analysis set) - Stage 3
Dose Day Statistics Cmax
(ng/mL) Tmax
1
(hr) AUCtau
(hr*ng/mL) AUClast
(hr*ng/mL) Racc T1/2
(hr)
5 mg 1 n 6 6 6
Mean (SD) 227 (31.0) 2.50 (1.50;4.00) 1420 (314)
CV% mean 13.7 22.1
14 n 6 6 6 6 6 6
Mean (SD) 281 (40.1) 2.50 (2.00;3.00) 1770 (347) 1940 (389) 1.26 (0.082) 29.6 (2.10)
CV% mean 14.3 19.6 20.1 6.5 7.1
25 mg 1 n 6 6 6
Mean (SD) 1280 (195) 2.50 (2.00;4.00) 7940 (1180)
CV% mean 15.2 14.9
14 n 6 6 6 6 6 6
Mean (SD) 1490 (346) 3.00 (2.00;4.00) 9820 (1570) 10600 (1760) 1.24 (0.078) 14.2 (4.13)
CV% mean 23.1 16.0 16.6 6.3 29.0
50 mg 1 n 6 6 6
Mean (SD) 2830 (573) 3.00 (2.00;4.00) 15600 (2510)
CV% mean 20.3 16.1
14 n 6 6 6 6 6 6
Mean (SD) 2630 (625) 4.00 (1.50;6.00) 17100 (2360) 18000 (2420) 1.10 (0.0583) 13.8 (3.29)
CV% mean 23.8 13.8 13.5 5.3 23.8
100 mg 1 n 6 6 6
Mean (SD) 4460 (1350) 4.00 (2.00;4.00) 29100 (5080)
CV% mean 30.3 17.4
14 n 6 6 6 6 6 6
Mean (SD) 5090 (1530) 3.50 (3.00;4.00) 35500 (6940) 38000 (7190) 1.22 (0.138) 10.2 (1.84)
CV% mean 30.1 19.6 18.9 11.3 18.1

Clinical Trial Results Website CLHW090X2101
______________________________________________________________________________________________________________________________________
Page 63
Dose Day Statistics Cmax
(ng/mL) Tmax
1
(hr) AUCtau
(hr*ng/mL) AUClast
(hr*ng/mL) Racc T1/2
(hr)
200 mg 1 n 6 6 6
Mean (SD) 6610 (1660) 3.50 (1.50;6.00) 51600 (11900)
CV% mean 25.1 23.0
14 n 6 6 6 6 6 6
Mean (SD) 8200 (2920) 3.50 (2.00;6.00) 70100 (19100) 75400 (20300) 1.39 (0.337) 9.44 (1.80)
CV% mean 35.7 27.3 26.9 24.2 19.1
400 mg 1 n 6 6 6
Mean (SD) 14900 (2940) 4.00 (3.00;4.00) 109000 (17100)
CV% mean 19.7 15.7
14 n 6 6 6 6 6 6
Mean (SD) 14200 (3450) 4.00 (4.00;6.00) 124000 (22300) 133000 (23700) 1.13 (0.075) 9.33 (1.25)
CV% mean 24.3 18.0 17.8 6.6 13.4
Statistics presented include: n, arithmetic mean (standard deviation) and CV% arithmetic mean 1For Tmax, Median (Minimum;Maximum) are presented

Clinical Trial Results Website CLHW090X2101
______________________________________________________________________________________________________________________________________
Page 64
Summary of plasma pharmacokinetic parameters of LHW090 following SAD administration to subjects with CRI (PK analysis set)-Stage 4
Dose Statistic Cmax
(ng/mL) Tmax
1
(hr) AUClast
(hr*ng/mL) AUCinf
(hr*ng/mL) AUC0-24h (hr*ng/mL)
T1/2 (hr)
CL/F (L/hr)
LHW090 %Hydrolysis
(%)
2 mg n 9 9 9 9 9 9 9 9
Mean (SD) 147 (70.0) 1.00 (0.500;2.00)
271 (89.6) 273 (89.8) 274 (90.6) 2.09 (0.714) 8.24 (3.31) 82.0 (6.99)
CV% mean 47.6 33.1 32.9 33.0 34.2 40.2 8.5
5 mg n 5 5 5 5 5 5 5 5
Mean (SD) 411 (205) 1.00 (1.00;1.50)
869 (256) 875 (257) 878 (257) 2.71 (0.699) 6.17 (2.01) 82.7 (5.21)
CV% mean 49.8 29.5 29.4 29.3 25.8 32.6 6.3
5mg (repeat) n 9 9 9 9 9 9 9 9
Mean (SD) 276 (102) 1.00 (0.500;1.50)
653 (181) 658 (181) 660 (179) 2.14 (0.682) 8.02 (1.77) 84.3 (6.87)
CV% mean 37.0 27.6 27.5 27.1 31.9 22.0 8.2
5mg (pooled) n 14 14 14 14 14 14 14 14
Mean (SD) 324 (154) 1.00 (0.500;1.50)
730 (228) 735 (228) 738 (228) 2.34 (0.719) 7.36 (2.00) 83.7 (6.16)
CV% mean 47.6 31.2 31.1 30.8 30.7 27.2 7.4
12.5 mg n 9 9 9 9 9 9 9 9
Mean (SD) 980 (383) 1.53 (1.00;3.00)
1900 (499) 1910 (499) 1900 (496) 3.51 (1.05) 6.93 (1.64) 82.8 (7.43)
CV% mean 39.1 26.2 26.2 26.1 29.8 23.6 9.0
25 mg n 8 8 8 8 8 8 8 8
Mean (SD) 1570 (443) 1.76 (1.00;4.00)
3670 (1110) 3680 (1110) 3660 (1100) 4.39 (1.50) 7.58 (3.15) 85.4 (4.25)
CV% mean 28.3 30.3 30.2 30.1 34.1 41.5 5.0
Statistics presented include: n, arithmetic mean (standard deviation) and CV% arithmetic mean 1For Tmax, Median (Minimum;Maximum) are presented

Clinical Trial Results Website CLHW090X2101
______________________________________________________________________________________________________________________________________
Page 65
Summary of plasma pharmacokinetic parameters of LHV527 following SAD administration to subjects with CRI (PK analysis set)-Stage 4
Dose Statistic Cmax
(ng/mL) Tmax (hr)
1
AUClast (hr*ng/mL)
AUCinf (hr*ng/mL)
AUC0-24h (hr*ng/mL)
T1/2 (hr)
2 mg n 9 9 9 9 9 9
Mean (SD) 110 (37.6) 3.00 (1.50;4.00) 1370 (680) 1500 (712) 1030 (452) 27.6 (10.0)
CV% mean 34.3 49.5 47.6 43.9 36.5
5 mg n 5 5 5 5 5 5
Mean (SD) 336 (77.9) 3.00 (1.50;4.00) 4310 (1350) 4450 (1390) 3440 (921) 18.3 (5.20)
CV% mean 23.2 31.3 31.2 26.8 28.4
5mg (repeat) n 9 9 9 9 9 9
Mean (SD) 284 (112) 3.00 (1.50;10.0) 3890 (1520) 4020 (1640) 3050 (1010) 14.8 (4.07)
CV% mean 39.2 39.1 40.7 33.0 27.4
5mg (pooled) n 14 14 14 14 14 14
Mean (SD) 303 (101) 3.00 (1.50;10.0) 4040 (1420) 4170 (1510) 3190 (961) 16.1 (4.64)
CV% mean 33.3 35.2 36.3 30.1 28.8
12.5 mg n 9 9 9 9 9 9
Mean (SD) 887 (316) 4.00 (1.50;4.00) 10300 (3940) 10400 (3970) 8520 (3050) 13.5 (2.32)
CV% mean 35.6 38.4 38.2 35.9 17.2
25 mg n 8 8 8 8 8 8
Mean (SD) 1930 (497) 4.00 (2.00;4.00) 22500 (8530) 22800 (8860) 18200 (5400) 10.7 (1.74)
CV% mean 25.8 38.0 38.9 29.6 16.2
Statistics presented include: n, arithmetic mean (standard deviation) and CV% arithmetic mean 1For Tmax, Median (Minimum;Maximum) are presented

Clinical Trial Results Website CLHW090X2101
______________________________________________________________________________________________________________________________________
Page 66
Pharmacokinetic parameter summary for LHW090 and LHV527 following four 5 mg doses every 12 hr in subjects with chronic renal insufficiency (PK analysis set)-Stage 5
Analyte Statistic Cmax (ng/mL)
Tmax1
(hr) AUCtau (hr*ng/mL)
AUClast (hr*ng/mL)
T1/2 (hr)
CLss/F (L/hr)
LHW090 %Hydrolysis (%)
LHW090
n 9 9 9 9 9 9 9
Mean (SD)
355 (194) 1.50 (1.00;3.00)
835 (257) 865 (264) 9.38 (5.50)
6.45 (1.75)
86.0 (4.25)
CV% mean
54.7 30.8 30.6 58.7 27.1 4.9
LHV527 n 9 9 9 9 9
Mean (SD)
639 (232) 3.00 (2.00;4.00)
5600 (2460) 11400 (6450) 15.4 (2.25)
CV% mean
36.4 43.9 56.5 14.7
Statistics presented include: n, arithmetic mean (standard deviation) and CV% arithmetic mean 1For Tmax, Median (Minimum;Maximum) are presented
Summary of Safety
Safety Results
Incidence of AEs by primary system organ class - n(percent) of subjects - Stage 1 (safety analysis set)
LHW090 1mg
N=3
n (%)
Subjects with AEs 1 (33.3)
System organ class

Clinical Trial Results Website CLHW090X2101
______________________________________________________________________________________________________________________________________
Page 67
LHW090 1mg
N=3
n (%)
Gastrointestinal disorders 1 (33.3)
Incidence of AEs by primary system organ class - n(percent) of subjects - Stage 2 (safety analysis set)
LHW090 1mg SAD N=8
LHW090 5mg SAD N=8
LHW090 25mg SAD N=8
LHW090 50mg SAD N=8
LHW090 100mg SAD N=8
LHW090 0.1mg SAD N=8
LHW090 200mg SAD N=8
LHW090 400mg SAD N=8
LHW090 800mg SAD N=8
LHW090 400mg SAD (Japanese ethnicity)
N=8
Pooled placebo
N=20 Total
N=100
n (%) n (%) n (%) n (%) n (%) n (%) n (%) n (%) n (%) n (%) n (%) n (%)
Subjects with AEs 1 (12.5) 0 ( 0.0) 0 ( 0.0) 0 ( 0.0) 0 ( 0.0) 0 ( 0.0) 3 (37.5) 1 (12.5) 3 (37.5) 1 (12.5) 2 (10.0) 11 (11.0)
System organ class
Gastrointestinal disorders
0 ( 0.0) 0 ( 0.0) 0 ( 0.0) 0 ( 0.0) 0 ( 0.0) 0 ( 0.0) 2 (25.0) 0 ( 0.0) 2 (25.0) 1 (12.5) 1 (5.0) 6 (6.0)
Skin and subcutaneous tissue disorders
0 ( 0.0) 0 ( 0.0) 0 ( 0.0) 0 ( 0.0) 0 ( 0.0) 0 ( 0.0) 1 (12.5) 0 ( 0.0) 0 ( 0.0) 1 (12.5) 0 ( 0.0) 2 (2.0)
General disorders and administration site conditions
0 ( 0.0) 0 ( 0.0) 0 ( 0.0) 0 ( 0.0) 0 ( 0.0) 0 ( 0.0) 0 ( 0.0) 1 (12.5) 0 ( 0.0) 0 ( 0.0) 0 ( 0.0) 1 (1.0)
Immune system disorders
0 ( 0.0) 0 ( 0.0) 0 ( 0.0) 0 ( 0.0) 0 ( 0.0) 0 ( 0.0) 0 ( 0.0) 0 ( 0.0) 1 (12.5) 0 ( 0.0) 0 ( 0.0) 1 (1.0)
Injury, poisoning and procedural complications
1 (12.5) 0 ( 0.0) 0 ( 0.0) 0 ( 0.0) 0 ( 0.0) 0 ( 0.0) 0 ( 0.0) 0 ( 0.0) 0 ( 0.0) 0 ( 0.0) 0 ( 0.0) 1 (1.0)
Metabolism and nutrition disorders
0 ( 0.0) 0 ( 0.0) 0 ( 0.0) 0 ( 0.0) 0 ( 0.0) 0 ( 0.0) 0 ( 0.0) 0 ( 0.0) 1 (12.5) 0 ( 0.0) 0 ( 0.0) 1 (1.0)
Musculoskeletal and connective tissue disorders
0 ( 0.0) 0 ( 0.0) 0 ( 0.0) 0 ( 0.0) 0 ( 0.0) 0 ( 0.0) 0 ( 0.0) 0 ( 0.0) 1 (12.5) 0 ( 0.0) 0 ( 0.0) 1 (1.0)

Clinical Trial Results Website CLHW090X2101
______________________________________________________________________________________________________________________________________
Page 68
LHW090 1mg SAD N=8
LHW090 5mg SAD N=8
LHW090 25mg SAD N=8
LHW090 50mg SAD N=8
LHW090 100mg SAD N=8
LHW090 0.1mg SAD N=8
LHW090 200mg SAD N=8
LHW090 400mg SAD N=8
LHW090 800mg SAD N=8
LHW090 400mg SAD (Japanese ethnicity)
N=8
Pooled placebo
N=20 Total
N=100
n (%) n (%) n (%) n (%) n (%) n (%) n (%) n (%) n (%) n (%) n (%) n (%)
Nervous system disorders
0 ( 0.0) 0 ( 0.0) 0 ( 0.0) 0 ( 0.0) 0 ( 0.0) 0 ( 0.0) 0 ( 0.0) 0 ( 0.0) 0 ( 0.0) 0 ( 0.0) 1 (5.0) 1 (1.0)
Arranged in descending order of frequency (in total group) and by system organ class.
Incidence of AEs by primary system organ class – n (percent) of subjects - Stage 3 (safety analysis set)
LHW090 5mg MAD N=6
LHW090 25mg MAD N=6
LHW090 50mg MAD N=6
LHW090 100mg MAD N=6
LHW090 200mg MAD N=6
LHW090 400mg MAD N=6
Pooled placebo
N=12 Total N=48
n (%) n (%) n (%) n (%) n (%) n (%) n (%) n (%)
Subjects with AEs 1 (16.7) 1 (16.7) 1 (16.7) 1 (16.7) 5 (83.3) 3 (50.0) 3 (25.0) 15 (31.3)
System organ class
Nervous system disorders 0 ( 0.0) 1 (16.7) 0 ( 0.0) 1 (16.7) 2 (33.3) 1 (16.7) 3 (25.0) 8 (16.7)
Gastrointestinal disorders 0 ( 0.0) 0 ( 0.0) 1 (16.7) 0 ( 0.0) 2 (33.3) 1 (16.7) 0 ( 0.0) 4 (8.3)
Skin and subcutaneous tissue disorders 1 (16.7) 1 (16.7) 0 ( 0.0) 0 ( 0.0) 1 (16.7) 1 (16.7) 0 ( 0.0) 4 (8.3)
Respiratory, thoracic and mediastinal disorders 0 ( 0.0) 0 ( 0.0) 0 ( 0.0) 0 ( 0.0) 1 (16.7) 1 (16.7) 0 ( 0.0) 2 (4.2)
Eye disorders 0 ( 0.0) 0 ( 0.0) 0 ( 0.0) 0 ( 0.0) 0 ( 0.0) 0 ( 0.0) 1 (8.3) 1 (2.1)
Arranged in descending order of frequency (in total group) and by system organ class.
Incidence of AEs by primary system organ class – n (percent) of subjects - Stage 4 (safety analysis set)
LHW090 5mg SAD N=6
LHW090 12.5mg SAD N=9
LHW090 25mg SAD N=9
LHW090 2mg SAD N=9
LHW090 5mg SAD N=9
Total N=42
n (%) n (%) n (%) n (%) n (%) n (%)

Clinical Trial Results Website CLHW090X2101
______________________________________________________________________________________________________________________________________
Page 69
LHW090 5mg SAD N=6
LHW090 12.5mg SAD N=9
LHW090 25mg SAD N=9
LHW090 2mg SAD N=9
LHW090 5mg SAD N=9
Total N=42
n (%) n (%) n (%) n (%) n (%) n (%)
Subjects with AEs 0 ( 0.0) 3 (33.3) 1 (11.1) 1 (11.1) 0 ( 0.0) 5 (11.9)
System organ class
Gastrointestinal disorders 0 ( 0.0) 2 (22.2) 0 ( 0.0) 0 ( 0.0) 0 ( 0.0) 2 (4.8)
General disorders and administration site conditions 0 ( 0.0) 0 ( 0.0) 1 (11.1) 0 ( 0.0) 0 ( 0.0) 1 (2.4)
Infections and infestations 0 ( 0.0) 0 ( 0.0) 0 ( 0.0) 1 (11.1) 0 ( 0.0) 1 (2.4)
Nervous system disorders 0 ( 0.0) 1 (11.1) 0 ( 0.0) 0 ( 0.0) 0 ( 0.0) 1 (2.4)
Arranged in descending order of frequency (in total group) and by system organ class.
Incidence of AEs by primary system organ class – n (percent) of subjects - Stage 5 (safety analysis set)
LHW090 5mg MAD N=9
Pooled placebo
N=3 Total N=12
n (%) n (%) n (%)
Subjects with AE(s) 0 ( 0.0) 1 (33.3) 1 (8.3)
System organ class
Gastrointestinal disorders 0 ( 0.0) 1 (33.3) 1 (8.3)
Arranged in descending order of frequency (in total group) and by system organ class.
Incidence of AEs by preferred term – n (percent) of subjects - Stage 1 (safety analysis set)
LHW090 1mg N=3
n (%)
Subjects with AE(s) 1 (33.3)
Preferred term
Dry mouth 1 (33.3)

Clinical Trial Results Website CLHW090X2101
______________________________________________________________________________________________________________________________________
Page 70
Incidence of AEs by preferred term – n (percent) of subjects - Stage 2 (safety analysis set)
LHW090 1mg SAD N=8
LHW090 5mg SAD N=8
LHW090 25mg SAD N=8
LHW090 50mg SAD N=8
LHW090 100mg SAD N=8
LHW090 0.1mg SAD N=8
LHW090 200mg SAD N=8
LHW090 400mg SAD N=8
LHW090 800mg SAD N=8
LHW090 400mg SAD
(Japanese ethnicity)
N=8
Pooled placebo
N=20 Total
N=100
n (%) n (%) n (%) n (%) n (%) n (%) n (%) n (%) n (%) n (%) n (%) n (%)
Subjects with AE(s)
1 (12.5) 0 ( 0.0) 0 ( 0.0) 0 ( 0.0) 0 ( 0.0) 0 ( 0.0) 3 (37.5) 1 (12.5) 3 (37.5) 1 (12.5) 2 (10.0) 11 (11.0)
Preferred term
Diarrhea 0 ( 0.0) 0 ( 0.0) 0 ( 0.0) 0 ( 0.0) 0 ( 0.0) 0 ( 0.0) 1 (12.5) 0 ( 0.0) 2 (25.0) 1 (12.5) 1 (5.0) 5 (5.0)
Abdominal pain
0 ( 0.0) 0 ( 0.0) 0 ( 0.0) 0 ( 0.0) 0 ( 0.0) 0 ( 0.0) 1 (12.5) 0 ( 0.0) 0 ( 0.0) 0 ( 0.0) 0 ( 0.0) 1 (1.0)
Abdominal pain upper
0 ( 0.0) 0 ( 0.0) 0 ( 0.0) 0 ( 0.0) 0 ( 0.0) 0 ( 0.0) 0 ( 0.0) 0 ( 0.0) 0 ( 0.0) 0 ( 0.0) 1 (5.0) 1 (1.0)
Allergy to chemicals
0 ( 0.0) 0 ( 0.0) 0 ( 0.0) 0 ( 0.0) 0 ( 0.0) 0 ( 0.0) 0 ( 0.0) 0 ( 0.0) 1 (12.5) 0 ( 0.0) 0 ( 0.0) 1 (1.0)
Contusion 1 (12.5) 0 ( 0.0) 0 ( 0.0) 0 ( 0.0) 0 ( 0.0) 0 ( 0.0) 0 ( 0.0) 0 ( 0.0) 0 ( 0.0) 0 ( 0.0) 0 ( 0.0) 1 (1.0)
Dehydration 0 ( 0.0) 0 ( 0.0) 0 ( 0.0) 0 ( 0.0) 0 ( 0.0) 0 ( 0.0) 0 ( 0.0) 0 ( 0.0) 1 (12.5) 0 ( 0.0) 0 ( 0.0) 1 (1.0)
Dermatitis contact
0 ( 0.0) 0 ( 0.0) 0 ( 0.0) 0 ( 0.0) 0 ( 0.0) 0 ( 0.0) 1 (12.5) 0 ( 0.0) 0 ( 0.0) 0 ( 0.0) 0 ( 0.0) 1 (1.0)
Headache 0 ( 0.0) 0 ( 0.0) 0 ( 0.0) 0 ( 0.0) 0 ( 0.0) 0 ( 0.0) 0 ( 0.0) 0 ( 0.0) 0 ( 0.0) 0 ( 0.0) 1 (5.0) 1 (1.0)
Infusion site vesicles
0 ( 0.0) 0 ( 0.0) 0 ( 0.0) 0 ( 0.0) 0 ( 0.0) 0 ( 0.0) 0 ( 0.0) 1 (12.5) 0 ( 0.0) 0 ( 0.0) 0 ( 0.0) 1 (1.0)
Muscle spasms
0 ( 0.0) 0 ( 0.0) 0 ( 0.0) 0 ( 0.0) 0 ( 0.0) 0 ( 0.0) 0 ( 0.0) 0 ( 0.0) 1 (12.5) 0 ( 0.0) 0 ( 0.0) 1 (1.0)
Nausea 0 ( 0.0) 0 ( 0.0) 0 ( 0.0) 0 ( 0.0) 0 ( 0.0) 0 ( 0.0) 1 (12.5) 0 ( 0.0) 0 ( 0.0) 0 ( 0.0) 0 ( 0.0) 1 (1.0)
Pruritus 0 ( 0.0) 0 ( 0.0) 0 ( 0.0) 0 ( 0.0) 0 ( 0.0) 0 ( 0.0) 0 ( 0.0) 0 ( 0.0) 0 ( 0.0) 1 (12.5) 0 ( 0.0) 1 (1.0)
Arranged in descending order of frequency (in total group) and by preferred term.

Clinical Trial Results Website CLHW090X2101
______________________________________________________________________________________________________________________________________
Page 71
Incidence of AEs by preferred term – n (percent) of subjects - Stage 3 (safety analysis set)
LHW090 5mg MAD N=6
LHW090 25mg MAD N=6
LHW090 50mg MAD N=6
LHW090 100mg MAD N=6
LHW090 200mg MAD N=6
LHW090 400mg MAD N=6
Pooled placebo
N=12 Total N=48
n (%) n (%) n (%) n (%) n (%) n (%) n (%) n (%)
Subjects with AE(s) 1 (16.7) 1 (16.7) 1 (16.7) 1 (16.7) 5 (83.3) 3 (50.0) 3 (25.0) 15 (31.3)
Preferred term
Diarrhea 0 ( 0.0) 0 ( 0.0) 1 (16.7) 0 ( 0.0) 1 (16.7) 1 (16.7) 0 ( 0.0) 3 (6.3)
Dizziness 0 ( 0.0) 1 (16.7) 0 ( 0.0) 0 ( 0.0) 0 ( 0.0) 0 ( 0.0) 2 (16.7) 3 (6.3)
Headache 0 ( 0.0) 0 ( 0.0) 0 ( 0.0) 0 ( 0.0) 2 (33.3) 0 ( 0.0) 1 (8.3) 3 (6.3)
Tension headache 0 ( 0.0) 0 ( 0.0) 0 ( 0.0) 1 (16.7) 0 ( 0.0) 1 (16.7) 1 (8.3) 3 (6.3)
Oropharyngeal pain 0 ( 0.0) 0 ( 0.0) 0 ( 0.0) 0 ( 0.0) 1 (16.7) 1 (16.7) 0 ( 0.0) 2 (4.2)
Blepharospasm 0 ( 0.0) 0 ( 0.0) 0 ( 0.0) 0 ( 0.0) 0 ( 0.0) 0 ( 0.0) 1 (8.3) 1 (2.1)
Chronic pigmented purpura 1 (16.7) 0 ( 0.0) 0 ( 0.0) 0 ( 0.0) 0 ( 0.0) 0 ( 0.0) 0 ( 0.0) 1 (2.1)
Dermatitis contact 0 ( 0.0) 1 (16.7) 0 ( 0.0) 0 ( 0.0) 0 ( 0.0) 0 ( 0.0) 0 ( 0.0) 1 (2.1)
Nausea 0 ( 0.0) 0 ( 0.0) 0 ( 0.0) 0 ( 0.0) 1 (16.7) 0 ( 0.0) 0 ( 0.0) 1 (2.1)
Pruritus 0 ( 0.0) 0 ( 0.0) 0 ( 0.0) 0 ( 0.0) 0 ( 0.0) 1 (16.7) 0 ( 0.0) 1 (2.1)
Rash 0 ( 0.0) 0 ( 0.0) 0 ( 0.0) 0 ( 0.0) 1 (16.7) 0 ( 0.0) 0 ( 0.0) 1 (2.1)
Vomiting 0 ( 0.0) 0 ( 0.0) 0 ( 0.0) 0 ( 0.0) 1 (16.7) 0 ( 0.0) 0 ( 0.0) 1 (2.1)
Arranged in descending order of frequency (in total group) and by preferred term.
Incidence of AEs by preferred term – n (percent) of subjects - Stage 4 (safety analysis set)
LHW090 5mg SAD N=6
LHW090 12.5mg SAD N=9
LHW090 25mg SAD N=9
LHW090 2mg SAD N=9
LHW090 5mg SAD N=9
Total N=42
n (%) n (%) n (%) n (%) n (%) n (%)
Subjects with AE(s) 0 ( 0.0) 3 (33.3) 1 (11.1) 1 (11.1) 0 ( 0.0) 5 (11.9)
Preferred term
Abdominal pain upper 0 ( 0.0) 1 (11.1) 0 ( 0.0) 0 ( 0.0) 0 ( 0.0) 1 (2.4)
Catheter site related reaction 0 ( 0.0) 0 ( 0.0) 1 (11.1) 0 ( 0.0) 0 ( 0.0) 1 (2.4)

Clinical Trial Results Website CLHW090X2101
______________________________________________________________________________________________________________________________________
Page 72
LHW090 5mg SAD N=6
LHW090 12.5mg SAD N=9
LHW090 25mg SAD N=9
LHW090 2mg SAD N=9
LHW090 5mg SAD N=9
Total N=42
n (%) n (%) n (%) n (%) n (%) n (%)
Dry mouth 0 ( 0.0) 1 (11.1) 0 ( 0.0) 0 ( 0.0) 0 ( 0.0) 1 (2.4)
Dysgeusia 0 ( 0.0) 1 (11.1) 0 ( 0.0) 0 ( 0.0) 0 ( 0.0) 1 (2.4)
Upper respiratory tract infection 0 ( 0.0) 0 ( 0.0) 0 ( 0.0) 1 (11.1) 0 ( 0.0) 1 (2.4)
Arranged in descending order of frequency (in total group) and by preferred term.

Clinical Trial Results Website CLHW090X2101
Page 73
Incidence of AEs by preferred term – n (percent) of subjects - Stage 5 (safety analysis set)
LHW090 5mg MAD N=9
placebo N=3
Total N=12
n (%) n (%) n (%)
Subjects with AE(s) 0 ( 0.0) 1 (33.3) 1 (8.3)
Preferred term
Abdominal pain upper 0 ( 0.0) 1 (33.3) 1 (8.3)
Nausea 0 ( 0.0) 1 (33.3) 1 (8.3)
Arranged in descending order of frequency (in total group) and by preferred term.
Serious Adverse Events and Deaths
No deaths or severe AEs were reported. None of the AEs led to the discontinuation of the subjects from the study.
Other Relevant Findings
Not applicable.
Conclusion:
Safety: LHW090 was safe and well tolerated when given as single oral doses up to 800 mg and once daily multiple doses up to 400 mg in healthy subjects. LHW090 was safe and well tolerated when given as single oral doses up to 25 mg in subjects with chronic renal insufficiency.
Pharmacodynamics: Administration of LHW090 increased plasma cGMP and urinary cGMP excretion rates.
Pharmacokinetics:
Following single (0.1-800 mg) and multiple (5-400 mg) once daily doses of LHW090 to healthy subjects; LHW090 Tmax ranged from 1-3.5 hr and terminal elimination T1/2 from 1.33 - 14.7 hr. Accumulation in AUCtau was minor ranging from 1.11-1.27 and in-line with the T1/2, steady-state was achieved by approximately 4 days. Hydrolysis of LHW090 to the active moiety LHV527 was high, ranging from 63-70%. LHV527 Tmax was similar to LHW090 ranging from 1.5-4 hr with terminal elimination T1/2 from 2.5 - 47 hr after single doses and 9.33 -29.6 hr after multiple once daily doses. Accumulation in AUCtau was minor, ranging from 1.1- 1.39 and in-line with T1/2,

Clinical Trial Results Website CLHW090X2101
Page 74
steady-state was achieved by approximately 4 days. Approximately 29-54% and 35.8-49% of the dose after single doses and multiple doses, respectively, was excreted in urine as LHV527.
After single and multiple dose administration Cmax and AUC of LHW090 and LHV527 increased with increase in dose, however not in a dose-proportional manner over the investigated dose range.
For CRI subjects, Tmax of LHW090 and LHV527 was in the range of the healthy subjects. The T1/2 ranged from 2.09-4.39 hr for LHW090 and 10.7-27.6 hr for LHV527. At 5 and 25 mg single doses the Cmax and AUCinf of LHV527 were approximately1.6 fold and 2.9 fold higher compared to healthy subjects, which, may be attributed to the reduced renal clearance of LHV527 in subjects with CRI. Following single (2-25 mg) or multiple (four 5 mg doses administered 12 hr apart) doses, the % hydrolysis of LHW090 to LHV527 was also high, ranging from 82-86%.
The pharmacokinetics of LHW090 and LHV527 was similar between Japanese and non-Japanese subjects after administration of LHW090 at a 400 mg single dose.
Date of Clinical Trial Report
12 May 2015