
National Weather Forecasting Centre India Meteorological ...
1
2
3
4
56
78
9
10
11
12
13
14
15
16
17
18
19
20
21
22
23
24
25
26
27
28
29
30
31
32
CHAOS 5667 No. of Pages 26
13 July 2007 Disk UsedARTICLE IN PRESS
Chaos, Solitons and Fractals xxx (2007) xxx–xxx
www.elsevier.com/locate/chaos
OO
F
Wavelet based correlation coefficient of time seriesof Saudi Meteorological Data
S. Rehman a,*, A.H. Siddiqi b
a Center for Engineering Research, Research Institute, King Fahd University of Petroleum and Minerals, Dhahran-31261, Saudi Arabiab Department of Mathematical Sciences, King Fahd University of Petroleum and Minerals, Dhahran-31261, Saudi Arabia
Accepted 18 June 2007
RCTED
PAbstract
In this paper, wavelet concepts are used to study a correlation between pairs of time series of meteorological param-eters such as pressure, temperature, rainfall, relative humidity and wind speed. The study utilized the daily average val-ues of meteorological parameters of nine meteorological stations of Saudi Arabia located at different strategic locations.The data used in this study cover a period of 16 years between 1990 and 2005. Besides obtaining wavelet spectra, we alsocomputed the wavelet correlation coefficients between two same parameters from two different locations and show thatstrong correlation or strong anti-correlation depends on scale. The cross-correlation coefficients of meteorologicalparameters between two stations were also calculated using statistical function. For coastal to costal pair of stations,pressure time series was found to be strongly correlated. In general, the temperature data were found to be stronglycorrelated for all pairs of stations and the rainfall data the least.� 2007 Published by Elsevier Ltd.
ENC
OR
R1. Introduction
Major changes are likely to be experienced in the arid and semi-arid regions in the coming few decades as pointedout by Warren et al. [34]. Furthermore, the changes will be induced by increasing human pressure like exponential pop-ulation growth, continuing fossil fuel usage and ambitious water development projects. The actions of the humanbeings on the ecosystems cause the climatic changes. Climatic changes strongly affect the process of desertificationby its impact on the vegetation, soil and hydrological cycle as stated by Pimenta et al. [26]. The changes in climatedirectly change the temperature, wind speed, barometric pressure and rain fall, see [29]. The climate variability and cli-mate changes have been studied based on the analysis of different climatic variables. Temperature and rainfall time-ser-ies are commonly used to study the climatic changes as seen from Elagib and Mansell [15], Lazaro et al. [24] andMoonen et al. [25], etc.
Investigators from around the world have investigated climatic change such as Balling and Brazel [8] for UnitedStates of America, Jose et al. [18] for Philippines, Elagib and Abdu [14] for The Kingdom of Bahrain, Arnell [4] for
U0960-0779/$ - see front matter � 2007 Published by Elsevier Ltd.doi:10.1016/j.chaos.2007.06.054
* Corresponding author. Tel.: +966 3 8603802; Mobile: +966 502085496; fax: +966 3 860 3996.E-mail address: [email protected] (S. Rehman).URL: http://faculty.kfupm.edu.sa/ri/srehman (S. Rehman).
Please cite this article in press as: Rehman S, Siddiqi AH, Wavelet based correlation coefficient of time series ...,Chaos, Solitons & Fractals (2007), doi:10.1016/j.chaos.2007.06.054

33
34
35 Q1
36
37
38
39
40
41
42
43
44
45
46
47
48
49
50
51
52
53
54
55
56
57
58
59
60
61
62
63
64
65
66
67
68
69
70
71
72
73
74
75
76
77
78
79
80
81
82
83
84
85
2 S. Rehman, A.H. Siddiqi / Chaos, Solitons and Fractals xxx (2007) xxx–xxx
CHAOS 5667 No. of Pages 26
13 July 2007 Disk UsedARTICLE IN PRESS
RR
EC
TED
PR
OO
F
Europe, Kipkorir [21] for Kenya, Abahussain et al. [1] for Arab Region, Chang [10] for Taiwan and Moonen et al. [25]for Italy. There are a number of studies that discuss the anthropogenic impacts on the environment in arid regions suchas Kuwait City, Kuwait [5], Riyadh, Saudi Arabia (El-Sharif, 1985; Modaihsh, 1997) and Tehran, Iran 19]. Qureshi andKhan [27] have documented localized impacts resulting from urban and agriculture development on the environmentincluding the modification of local climate. Boer [9] used existing meteorological data of the United Arab Emirates(UAE) to study the climatic conditions of the country. The climate of UAE is classified as hyper-arid with differentbioclimatic zones within the country. According to Boer [9], there are higher mean precipitation rates in the north-east-ern part and low temperatures as compared to those in the southern and western regions.
In meteorology, oceanography, and other geophysical disciplines, correlation methods are required in order to gleaninformation from limited data. Furthermore, correlation reckoning is an important aid in the investigation of the rela-tion between non-synchronous weather anomalies in different regions of the earth as given in [17]. Chester et al. [11]used the variance distribution in a gravity wave model to predict the cross-correlation coefficient between the verticaland horizontal wind perturbations (and hence the momentum flux) as a function of azimuth angle. To validate the tech-nique, the cross-correlation coefficients and momentum fluxes derived from the imager data were compared with thezonal fluxes measured by a wind/temperature lidar employing the standard dual-beam Doppler technique.
Abbry et al. [2] studied the long range dependence of physical process using wavelet technique. The wavelet analysisis commonly used to investigate the frequency structure of the air temperature variability in the Aral Sea region by Val-entina et al. [33]. In order to investigate the time-scale structure of natural wind, Kitagawa and Nomura [22] applied thewavelet transform to the time history of a measured wind velocity data and constructed the wavelet based method insuch way that the created time history possesses the characteristics similar to those of the natural wind data. The surfaceair temperature time series of both hemispheres and the North Atlantic European area as well as the Southern Oscil-lation (SO) index time series were analyzed by Sonechkin et al. [32] using a wavelet transform technique. They con-cluded that the climate dynamics on inter-annual and interdecadal scales may be considered as a kind of classicalBrownian motion although its consideration as a flicker-noise was also possible.
Saudi Arabia is one of the hottest and driest countries in the world and is roughly located between 17� and 31� northlatitudes and 37� and 56� east longitudes. The land elevation varies from a few meters above mean sea level to few thou-sands of meters. Most of the Saudi Arabian land consists of desert and semi-desert with oasis with almost 50% of thetotal surface area as uninhabitable. The eastern part of Saudi Arabia is lowland with highly humid and hot climatewhile most of the western part is a plateau. The southwest part of the country is surrounded by mountains as highas 3000 m. The annual average precipitation varies from 80 to 140 mm in the country as reported by Alkolibi [6].The summer extreme temperature reaches as high as 45 �C while the relative humidity is very low and the skies are bluemost of the time during the year. In the middle part of Saudi Arabia know as Empty Quarter or Rub Al-Khali desert,the rain fall is very minimal, almost none. In highland and mountainous areas of the country, relatively there is moreprecipitation. According to Shepered [30], the precipitation increases southwest of the country in the Atlas mountainsand northeast in the Zagros mountains.
This study utilizes daily average values of meteorological data for a period of 16 years between 1990 and 2005 tostudy the climatic dynamics of nine locations through modern wavelet based techniques. The cross-correlation coeffi-cients for different pairs of locations are calculated using statistical and wavelet based methods. The location pairs aredesignated as coastal to coastal, coastal to inland and inland to inland locations. A total of 36 pairs of different com-binations of meteorological data collection stations are considered for the study.
UN
CO2. Description of the sites and meteorological time series data
The daily average values of temperature, pressure, precipitation, relative humidity and wind speed were obtainedfrom Presidency of Meteorology and Environment (PME), the organization which maintains complete range of mete-orological stations at national and international airports in the kingdom. The geographical coordinates and the heightabove mean sea level of the stations, the period of data collection and the number of records used in the present studyare summarized in Table 1. Dhahran, a coastal location is situated on the east coast along Arabian Gulf while Gizan,Jeddah and Yanbu lie along the red sea on South West, West and North West coasts, respectively. Climatically thesecoastal locations are identified as highly hot and humid. Abha is a hill station in south west of Saudi Arabia while Hailis another station located at high altitude. Guryat and Turaif are located in the northern most part of the Kingdomwhile Riyadh, the capital city is located in the central part of the country. Riyadh is known as hot and dry climaticregion. Guryat and Turaif are known for their cold climate throughout the year.
The long term means the maximum and minimum of daily average temperature values for all the locations are givenin Fig. 1. The long term mean temperature was found to have the maximum value of 30.2 �C at Gizan while a minimum
Please cite this article in press as: Rehman S, Siddiqi AH, Wavelet based correlation coefficient of time series ...,Chaos, Solitons & Fractals (2007), doi:10.1016/j.chaos.2007.06.054

OR
REC
TED
PR
OO
F
86
87
88
89
90
91
92
93
94
95
96
97
98
Table 1Meteorological station used in the study
Station Latitude Longitude Elevation (m) Period Records
Dhahran 26�06 0 50�10 0 22 1990–2005 5964Gizan 16�52 0 42�35 0 5 1990–2005 5964Jeddah 21�30 0 39�12 0 17 1990–2005 5964Yanbu 24�07 0 38�03 0 6 1990–2005 5964Abha 18�13 0 42�31 0 2200 1990–2005 5964Hail 27�31 0 41�44 0 992 1985–2005 7610Guryat 30�54 0 41�08 0 542 1990–2005 5964Turaif 31�41 0 38�40 0 827 1990–2005 5964Riyadh 24�42 0 46�44 0 624 1990–2005 5964
Fig. 1. Long term minimum, mean and maximum temperature at different locations.
S. Rehman, A.H. Siddiqi / Chaos, Solitons and Fractals xxx (2007) xxx–xxx 3
CHAOS 5667 No. of Pages 26
13 July 2007 Disk UsedARTICLE IN PRESS
UN
Cof 18.6 �C at Abha. The maximum temperature of 41.6 �C of the daily maximum was noticed at Riyadh, an inland loca-tion. The minimum of �4 �C of the daily mean over entire period i.e. from 1990 to 2005 was observed at Guryat,located in the northern part of Saudi Arabia. The long term mean barometric pressure values were found to be almostthe same for coastal locations such as Dhahran, Gizan, Jeddah and Yanbu. Furthermore, the pressure values were inthe range of 950 ± 10 mb for Guryat and Riyadh while around 915 mb for Hail and Turaif. The pressure was found tobe a minimum of 794 mb, as expected, for Abha, see Fig. 2.
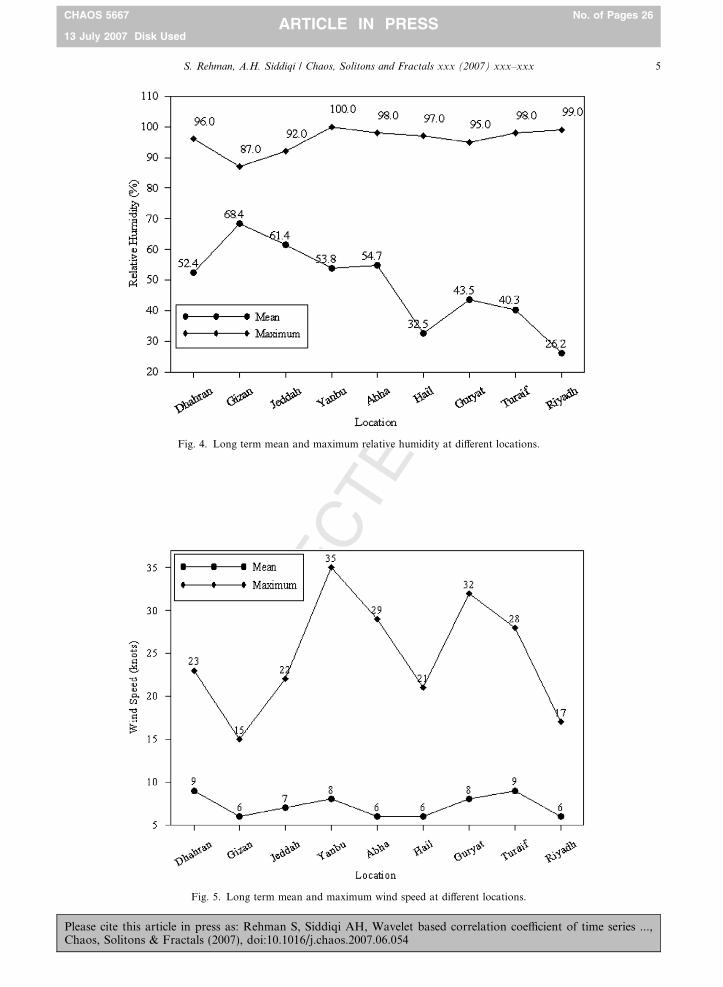
The maximum of the daily total and the annual average precipitation, over entire period of data reported here, forall the meteorological stations is depicted in Fig. 3. The annual average precipitation was obtained by dividing the sumof all daily total precipitation values by the number of years. The maximum daily precipitation of 125.0 mm wasobserved in Dhahran while a minimum of 25.7 in Turaif. The maximum annual mean precipitation of 244.8 mmwas found in Abha while a minimum of 37 mm in Yanbu. Relatively higher precipitation of more than 100 mm wasfound in Dhahran, Gizan, Abha, Hail and Riyadh. The long term mean relative humidity of more than 50% was notedat all coastal locations and Abha as seen in Fig. 4. Lower values of relative humidity were observed for inland locations
Please cite this article in press as: Rehman S, Siddiqi AH, Wavelet based correlation coefficient of time series ...,Chaos, Solitons & Fractals (2007), doi:10.1016/j.chaos.2007.06.054

UN
CO
RR
EC
TED
PR
OO
F
99
100
101
Fig. 2. Long term mean and maximum pressure at different locations.
Fig. 3. Long term precipitation at different locations.
4 S. Rehman, A.H. Siddiqi / Chaos, Solitons and Fractals xxx (2007) xxx–xxx
CHAOS 5667 No. of Pages 26
13 July 2007 Disk UsedARTICLE IN PRESS
such as Hail, Guryat, Turaif and Riyadh. Fig. 5 shows the long term mean wind speed at all the locations considered inthis study. The mean wind speed was found to vary between 6 and 9 knots at different locations. Highest wind speed of35 knots was observed in Yanbu.
Please cite this article in press as: Rehman S, Siddiqi AH, Wavelet based correlation coefficient of time series ...,Chaos, Solitons & Fractals (2007), doi:10.1016/j.chaos.2007.06.054
UN
CO
RR
EC
TED
PR
OO
F
Fig. 4. Long term mean and maximum relative humidity at different locations.
Fig. 5. Long term mean and maximum wind speed at different locations.
S. Rehman, A.H. Siddiqi / Chaos, Solitons and Fractals xxx (2007) xxx–xxx 5
CHAOS 5667 No. of Pages 26
13 July 2007 Disk UsedARTICLE IN PRESS
Please cite this article in press as: Rehman S, Siddiqi AH, Wavelet based correlation coefficient of time series ...,Chaos, Solitons & Fractals (2007), doi:10.1016/j.chaos.2007.06.054

102
103104
106106
107
108
109
110
112112
113
114
116116
117
118
120120
121
123123
124
126126
127
128
130130
131132
134134
135
136
137
138
139
140
141
142
143
144
145
6 S. Rehman, A.H. Siddiqi / Chaos, Solitons and Fractals xxx (2007) xxx–xxx
CHAOS 5667 No. of Pages 26
13 July 2007 Disk UsedARTICLE IN PRESS
3. Methodology
The cross-correlation coefficient r, which is a measure of linear association between two variables, is defined as:
PleaCha
r ¼Pn
i¼1ðxi � X Þðyi � Y ÞffiffiffiffiffiffiffiffiffiffiffiffiffiffiffiffiffiffiffiffiffiffiffiffiPni¼1ðxi � x
pÞ2Pn
i¼1ðyi � yÞ2: ð1Þ
F
A positive value of the coefficient r indicates that as one value increases, the other tends to increase whereas a negativevalue indicates that as one variable increases the other tends to decrease. As we know, from various researchers likeAddison [3], Daubechies [13 and 31], that wavelets can detect both the location and the scale of a structure. Waveletsare parameterized both by a dilation parameter (a > 0) and a translation parameter b(�1 < b <1) such that:
wa; b ¼ wx� b
a
� �: ð2Þ
OThe wavelet domain of one-dimensional function w is rather two-dimensional in nature; one dimension corresponds toscale and other to translation. The continuous wavelet transform for one dimension is defined as:
Oxða; bÞ ¼Z 1
�1f ðxÞw� jx� bj
b
� �; ð3Þ
Rwhere a is the scale, f(x) is one-dimensional function and w* (* is a complex conjecture) is analyzing wavelet or alsoknown as mother wavelet. We can choose a Mexican hat wavelet as a possible analyzing wavelet:
Pwðjx� bjÞa¼ 1
ð2pÞ0:5a2� jx� bj2
a2
!exp � jx� bj2
a2
!: ð4Þ
DWavelet spectrum denoted by M(a) is defined as:
MðaÞ ¼ 1
a
Z 1
�1wða; bÞ2 db: ð5Þ
EThe wavelet spectrum has power law behavior:
TMðaÞ � ak: ð6ÞCWavelet spectrum M(a) defines the energy of wavelet coefficient for scale ‘a’. Here k is exponent, the value of which isdecided by the power of a. The wavelet cross-correlation coefficient, as given by [28], is defined as:
Erw ¼R
w1ða; bÞw�2ða; bÞðM1ðaÞM2ðaÞÞ1=2
db: ð7Þ
RThe relation between correlation coefficient and wavelet correlation coefficient can be written as:
Rr ¼R
cxðaÞðM1ðaÞM2ðaÞÞ1=2a�1=2 daRðM1ðaÞa�1 da
RM2ðaÞ�1 daÞ1=2
db: ð8Þ
COIn order to check the features of temperature variation at two metrological stations one can plot wavelet spectrum of
temperatures at these stations and compare the correlation coefficient. In order to check the correlation between anytwo parameters at two different stations we compute r with the aid of Eq. (8) or r given by Eq. (1). If r is negative, thenthe variations at two stations are not correlated and for positive value the variations are correlated.
UN
4. Cross-correlation coefficient analysis using statistical methods
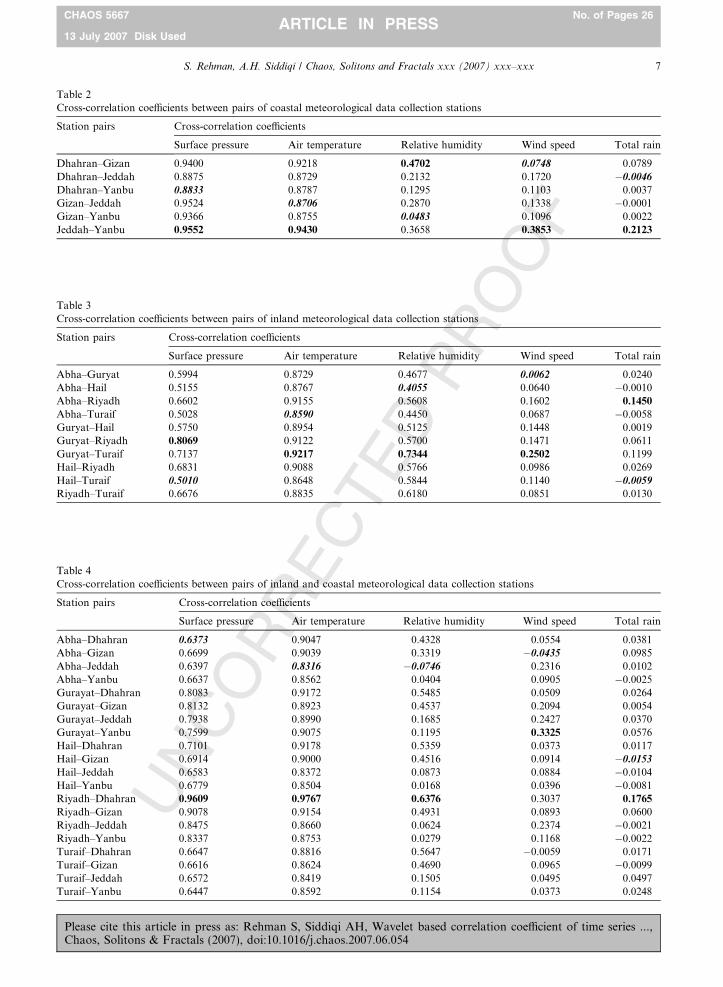
The cross-correlation coefficients between pairs of meteorological parameters from two different stations were cal-culated for different combinations, viz. coastal–coastal, coastal–inland and inland–inland stations. The cross-correla-tion coefficients were calculated using statistical function of the MATLAB and the resulting coefficients for all themeteorological parameters for 6 combinations of coastal pairs, 10 pairs of coastal to inland locations and 20 pairsof inland stations are summarized in Tables 2–4, respectively. As seen from Table 2, the pressure and temperature dataof coastal locations experienced excellent correlation while the rain fall data the minimum and in some cases. Like
se cite this article in press as: Rehman S, Siddiqi AH, Wavelet based correlation coefficient of time series ...,os, Solitons & Fractals (2007), doi:10.1016/j.chaos.2007.06.054
UN
CO
RR
EC
TED
PR
OO
F
Table 2Cross-correlation coefficients between pairs of coastal meteorological data collection stations
Station pairs Cross-correlation coefficients
Surface pressure Air temperature Relative humidity Wind speed Total rain
Dhahran–Gizan 0.9400 0.9218 0.4702 0.0748 0.0789Dhahran–Jeddah 0.8875 0.8729 0.2132 0.1720 �0.0046
Dhahran–Yanbu 0.8833 0.8787 0.1295 0.1103 0.0037Gizan–Jeddah 0.9524 0.8706 0.2870 0.1338 �0.0001Gizan–Yanbu 0.9366 0.8755 0.0483 0.1096 0.0022Jeddah–Yanbu 0.9552 0.9430 0.3658 0.3853 0.2123
Table 3Cross-correlation coefficients between pairs of inland meteorological data collection stations
Station pairs Cross-correlation coefficients
Surface pressure Air temperature Relative humidity Wind speed Total rain
Abha–Guryat 0.5994 0.8729 0.4677 0.0062 0.0240Abha–Hail 0.5155 0.8767 0.4055 0.0640 �0.0010Abha–Riyadh 0.6602 0.9155 0.5608 0.1602 0.1450
Abha–Turaif 0.5028 0.8590 0.4450 0.0687 �0.0058Guryat–Hail 0.5750 0.8954 0.5125 0.1448 0.0019Guryat–Riyadh 0.8069 0.9122 0.5700 0.1471 0.0611Guryat–Turaif 0.7137 0.9217 0.7344 0.2502 0.1199Hail–Riyadh 0.6831 0.9088 0.5766 0.0986 0.0269Hail–Turaif 0.5010 0.8648 0.5844 0.1140 �0.0059
Riyadh–Turaif 0.6676 0.8835 0.6180 0.0851 0.0130
Table 4Cross-correlation coefficients between pairs of inland and coastal meteorological data collection stations
Station pairs Cross-correlation coefficients
Surface pressure Air temperature Relative humidity Wind speed Total rain
Abha–Dhahran 0.6373 0.9047 0.4328 0.0554 0.0381Abha–Gizan 0.6699 0.9039 0.3319 �0.0435 0.0985Abha–Jeddah 0.6397 0.8316 �0.0746 0.2316 0.0102Abha–Yanbu 0.6637 0.8562 0.0404 0.0905 �0.0025Gurayat–Dhahran 0.8083 0.9172 0.5485 0.0509 0.0264Gurayat–Gizan 0.8132 0.8923 0.4537 0.2094 0.0054Gurayat–Jeddah 0.7938 0.8990 0.1685 0.2427 0.0370Gurayat–Yanbu 0.7599 0.9075 0.1195 0.3325 0.0576Hail–Dhahran 0.7101 0.9178 0.5359 0.0373 0.0117Hail–Gizan 0.6914 0.9000 0.4516 0.0914 �0.0153
Hail–Jeddah 0.6583 0.8372 0.0873 0.0884 �0.0104Hail–Yanbu 0.6779 0.8504 0.0168 0.0396 �0.0081Riyadh–Dhahran 0.9609 0.9767 0.6376 0.3037 0.1765
Riyadh–Gizan 0.9078 0.9154 0.4931 0.0893 0.0600Riyadh–Jeddah 0.8475 0.8660 0.0624 0.2374 �0.0021Riyadh–Yanbu 0.8337 0.8753 0.0279 0.1168 �0.0022Turaif–Dhahran 0.6647 0.8816 0.5647 �0.0059 0.0171Turaif–Gizan 0.6616 0.8624 0.4690 0.0965 �0.0099Turaif–Jeddah 0.6572 0.8419 0.1505 0.0495 0.0497Turaif–Yanbu 0.6447 0.8592 0.1154 0.0373 0.0248
S. Rehman, A.H. Siddiqi / Chaos, Solitons and Fractals xxx (2007) xxx–xxx 7
CHAOS 5667 No. of Pages 26
13 July 2007 Disk UsedARTICLE IN PRESS
Please cite this article in press as: Rehman S, Siddiqi AH, Wavelet based correlation coefficient of time series ...,Chaos, Solitons & Fractals (2007), doi:10.1016/j.chaos.2007.06.054
146
147
148
149
150
151
152
153
154
155
156
157
158
159
160
161
162
163
164
165
166
167
168
169
170
171
172
173
174
175
176
177
178
179
180
8 S. Rehman, A.H. Siddiqi / Chaos, Solitons and Fractals xxx (2007) xxx–xxx
CHAOS 5667 No. of Pages 26
13 July 2007 Disk UsedARTICLE IN PRESS
DPR
OO
F
Dhahran–Jeddah and Gizan–Jeddah, at all no correlation was observed. The maximum correlation coefficients of0.955, 0.943, 0.385 and 0.212 corresponding to pressure, temperature, wind speed and total rain, respectively, wereobserved for Jeddah–Yanbu pair of locations. In case of relative humidity, the highest correlation coefficient of0.470 was found for Dhahran–Gizan pair of locations.
In case of pairs of coastal and inland locations, the temperature data showed maximum correlation and then pres-sure, relative humidity, wind speed and rain followed, as given in Table 3. As seen from this table, maximum correlationcoefficients of 0.922, 0.734 and 0.250, corresponding to temperature, relative humidity and wind speed, respectively,were found between Guryat and Turaif. For pressure and total rain, the higher correlation coefficients were observedfor Guryat–Riyadh and Abha–Riyadh pairs of locations. The rain fall time series data were found to be least correlatedfor all the pairs reported in Table 3.
For inland locations, the coefficient for pressure varied between 0.637 and 0.961 corresponding to Abha–Dhahranand Riyadh–Dhahran pairs, respectively. Furthermore, the pressure time series of Riyadh showed strong correlationwith all the coastal locations with coefficient values greater than 0.83. Guryat station also exhibited higher values ofcorrelation with pressure time series of coastal locations, as given in Table 4, column 2. The temperature time serieswas found to be strongly correlated for all inland pairs of stations with coefficients greater than 0.83. The relativehumidity time series had good correlation (values greater than 0.5) for Guryat–Dhahran, Hail–Dhahran, Riyadh–Dhahran and Turaif–Dhahran pair of stations. This shows that relative humidity time series of Dhahran is correlatedwith Guryat, Hail, Riyadh and Turaif data. The other group of stations (Guryat–Gizan, Hail–Gizan, Riyadh–Gizanand Turaif–Gizan) was found to have correlation coefficients greater than 0.45, i.e., the relative humidity at Guryat,Hail, Riyadh and Turaif has good correlations with relative humidity time series of Gizan, a coastal location situatedon the south west coast of Saudi Arabia.
The wind speed time series was weakly correlated for all pairs of locations, as shown in Table 4, column 5. Relativelybetter correlation coefficients of greater than 0.2 were observed for Abha–Jeddah, Guryat–Gizan, Guryat–Jeddah, Gur-yat–Yanbu, Riyadh–Dhahran and Riyadh–Jeddah pairs of stations. The total rain time series data was found to be un-correlated for all pairs of inland and coastal locations except for Riyadh–Dhahran pair for which it was greater than0.1, as given in 6th column of Table 4.
EREC
T5. Correlation coefficient analysis using continuous wavelet method
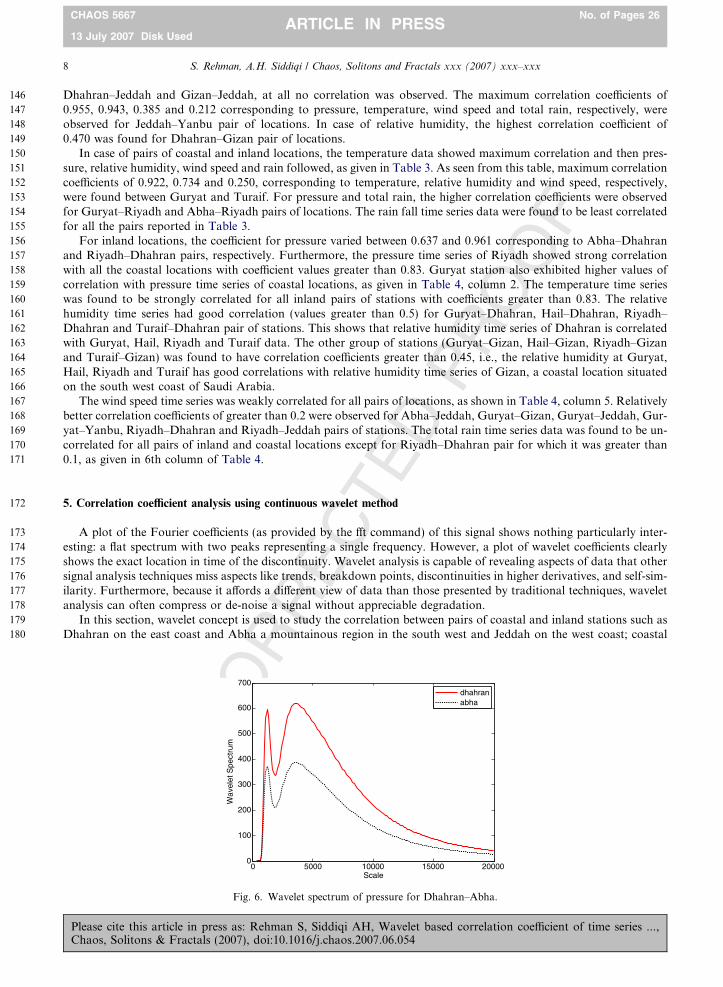
A plot of the Fourier coefficients (as provided by the fft command) of this signal shows nothing particularly inter-esting: a flat spectrum with two peaks representing a single frequency. However, a plot of wavelet coefficients clearlyshows the exact location in time of the discontinuity. Wavelet analysis is capable of revealing aspects of data that othersignal analysis techniques miss aspects like trends, breakdown points, discontinuities in higher derivatives, and self-sim-ilarity. Furthermore, because it affords a different view of data than those presented by traditional techniques, waveletanalysis can often compress or de-noise a signal without appreciable degradation.
In this section, wavelet concept is used to study the correlation between pairs of coastal and inland stations such asDhahran on the east coast and Abha a mountainous region in the south west and Jeddah on the west coast; coastal
UN
CO
R
0 5000 10000 15000 200000
100
200
300
400
500
600
700
Scale
Wav
elet
Spe
ctru
m
dhahranabha
Fig. 6. Wavelet spectrum of pressure for Dhahran–Abha.
Please cite this article in press as: Rehman S, Siddiqi AH, Wavelet based correlation coefficient of time series ...,Chaos, Solitons & Fractals (2007), doi:10.1016/j.chaos.2007.06.054

UN
CO
RR
EC
TED
PR
OO
F
0 5000 10000 15000 200000
5
10
15
20
25
30
35
40
45
50
Scale
Wav
elet
Spe
ctru
m
dhahranabha
Fig. 7. Wavelet spectrum of temperature for Dhahran–Abha.
0 5000 10000 15000 200000
0.1
0.2
0.3
0.4
0.5
0.6
0.7
0.8
Scale
Wav
elet
Spe
ctru
m
dhahranabha
Fig. 8. Wavelet spectrum of rain for Dhahran–Abha.
0 5000 10000 15000 200000
20
40
60
80
100
120
140
160
180
200
Scale
Wav
elet
Spe
ctru
m
dhahranabha
Fig. 9. Wavelet spectrum of humidity for Dhahran–Abha.
S. Rehman, A.H. Siddiqi / Chaos, Solitons and Fractals xxx (2007) xxx–xxx 9
CHAOS 5667 No. of Pages 26
13 July 2007 Disk UsedARTICLE IN PRESS
Please cite this article in press as: Rehman S, Siddiqi AH, Wavelet based correlation coefficient of time series ...,Chaos, Solitons & Fractals (2007), doi:10.1016/j.chaos.2007.06.054

181
182
183
10 S. Rehman, A.H. Siddiqi / Chaos, Solitons and Fractals xxx (2007) xxx–xxx
CHAOS 5667 No. of Pages 26
13 July 2007 Disk UsedARTICLE IN PRESS
stations such as Dhahran on the east coast and Gizan on the south west coast and Jeddah on the west coast and Dhah-ran on the east coast and finally an inland pairs of stations such as Riyadh in the central part and Guryat in the north-ern part. The wavelet spectra of pressure, temperature, rainfall, relative humidity and wind speed time series for
UN
CO
RR
EC
TED
PR
OO
F
0 5000 10000 15000 200000
5
10
15
20
25
30
35
40
45
Scale
Wav
elet
Spe
ctru
m
dhahranabha
Fig. 10. Wavelet spectrum of wind speed for Dhahran–Abha.
0 5000 10000 15000 200000.2
0.3
0.4
0.5
0.6
0.7
0.8
0.9
1
Scale
Wav
elet
Cor
rela
tion
Coe
ffici
ent
pressure
Fig. 11. Wavelet correlation coefficient for Dhahran–Abha
0 5000 10000 15000 20000Scale
Wa
vele
t Cor
rela
tion
Coe
ffici
ent
temperature
0.2
0.3
0.4
0.5
0.6
0.7
0.8
0.9
1
Fig. 12. Wavelet correlation coefficient for Dhahran–Abha.
Please cite this article in press as: Rehman S, Siddiqi AH, Wavelet based correlation coefficient of time series ...,Chaos, Solitons & Fractals (2007), doi:10.1016/j.chaos.2007.06.054
UN
CO
RR
EC
TED
PR
OO
F
0 5000 10000 15000 200000
0.1
0.2
0.3
0.4
0.5
0.6
0.7
0.8
0.9
1
Scale
Wav
elet
Cor
rela
tion
Coe
ffici
ent
rain
Fig. 13. Wavelet correlation coefficient for Dhahran–Abha.
0 5000 10000 15000 200000.2
0.3
0.4
0.5
0.6
0.7
0.8
0.9
1
Scale
Wav
elet
Cor
rela
tion
Coe
ffici
ent
humidity
Fig. 14. Wavelet correlation coefficient for Dhahran–Abha.
0 5000 10000 150000.2
0.3
0.4
0.5
0.6
0.7
0.8
0.9
1
Scale
Wav
elet
Cor
rela
tion
Coe
ffici
ent
speed
Fig. 15. Wavelet correlation coefficient for Dhahran–Abha.
S. Rehman, A.H. Siddiqi / Chaos, Solitons and Fractals xxx (2007) xxx–xxx 11
CHAOS 5667 No. of Pages 26
13 July 2007 Disk UsedARTICLE IN PRESS
Please cite this article in press as: Rehman S, Siddiqi AH, Wavelet based correlation coefficient of time series ...,Chaos, Solitons & Fractals (2007), doi:10.1016/j.chaos.2007.06.054

UN
CO
RR
EC
TED
PR
OO
F
184
185
186
0 5000 10000 15000 200000
100
200
300
400
500
600
700
Scale
Wav
elet
Spe
ctru
m
dhahrangizan
Fig. 16. Wavelet spectrum of pressure for Dhahran–Gizan.
0 5000 10000 15000 200000
10
20
30
40
50
60
Scale
Wav
elet
Spe
ctru
m
dhahrangizan
Fig. 17. Wavelet spectrum of temperature for Dhahran–Gizan.
0 5000 10000 15000 200000
1
2
3
4
5
6
7
Scale
Wav
elet
Spe
ctru
m
dhahrangizan
Fig. 18. Wavelet spectrum of rain for Dhahran–Gizan.
12 S. Rehman, A.H. Siddiqi / Chaos, Solitons and Fractals xxx (2007) xxx–xxx
CHAOS 5667 No. of Pages 26
13 July 2007 Disk UsedARTICLE IN PRESS
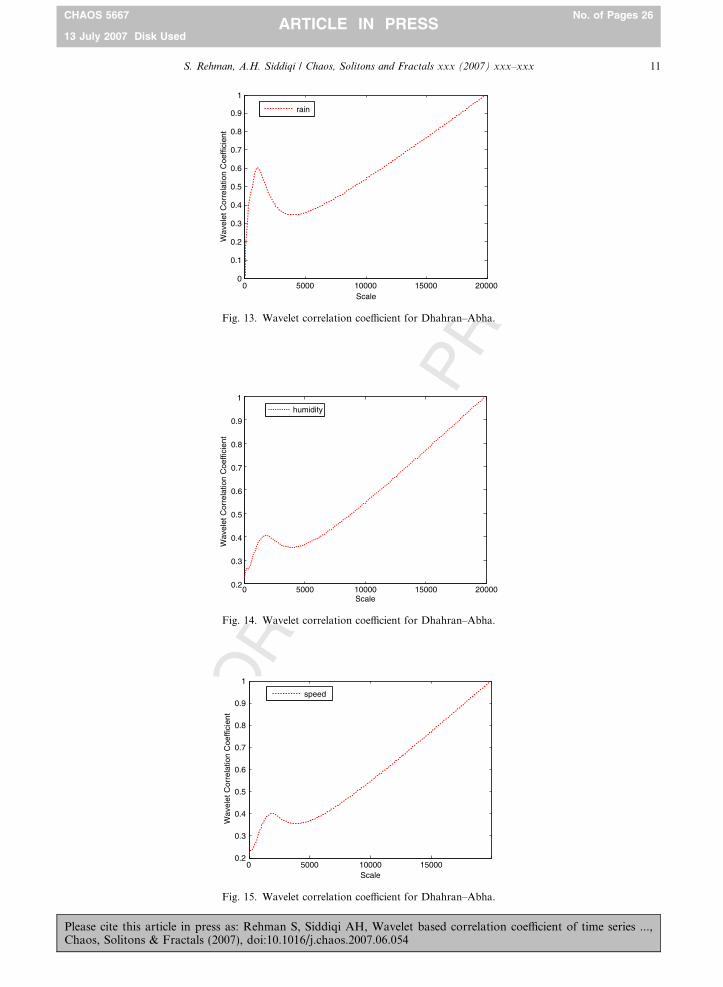
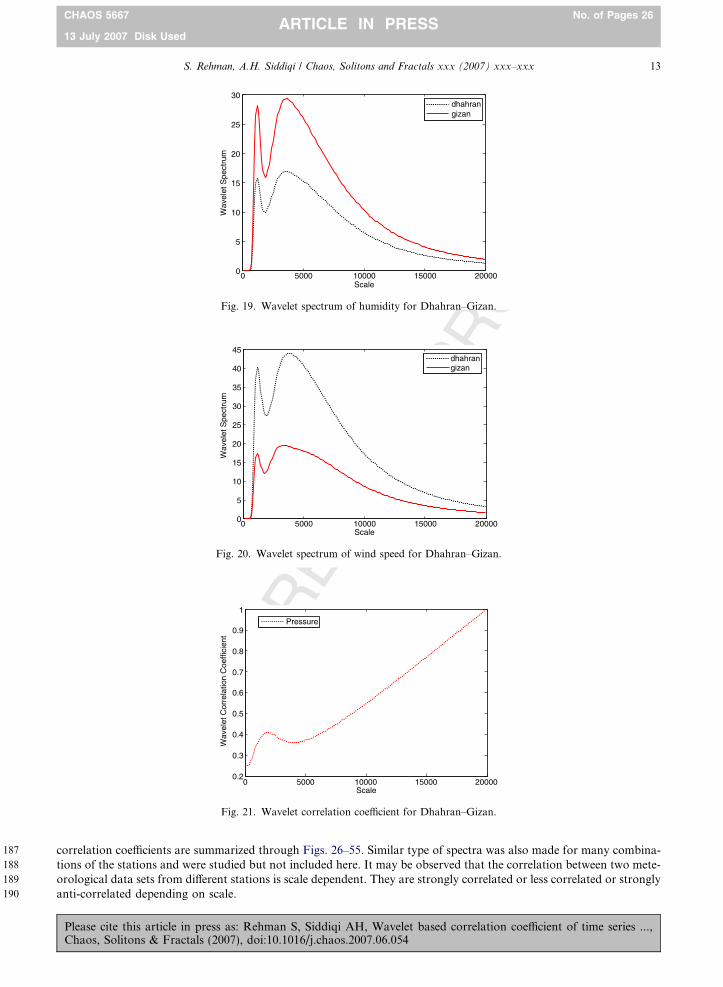
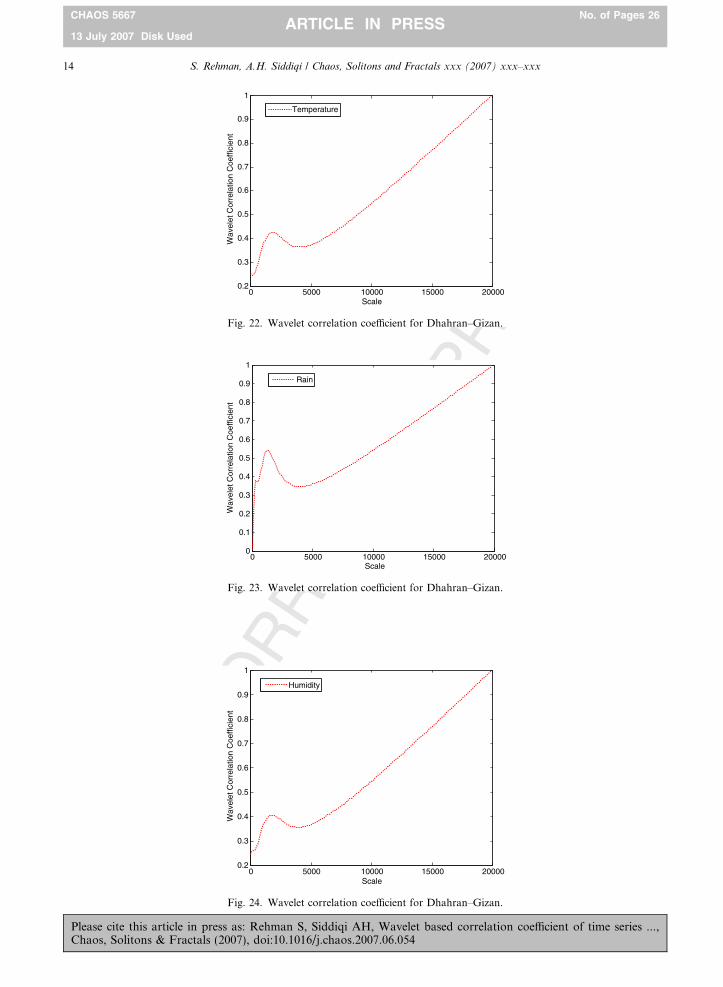
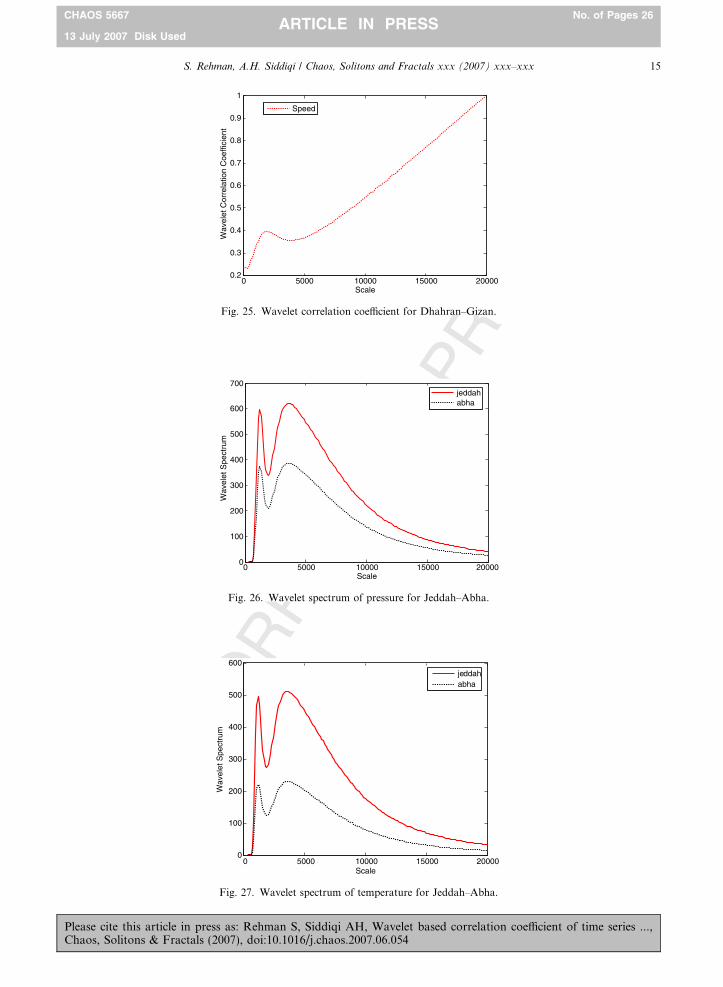
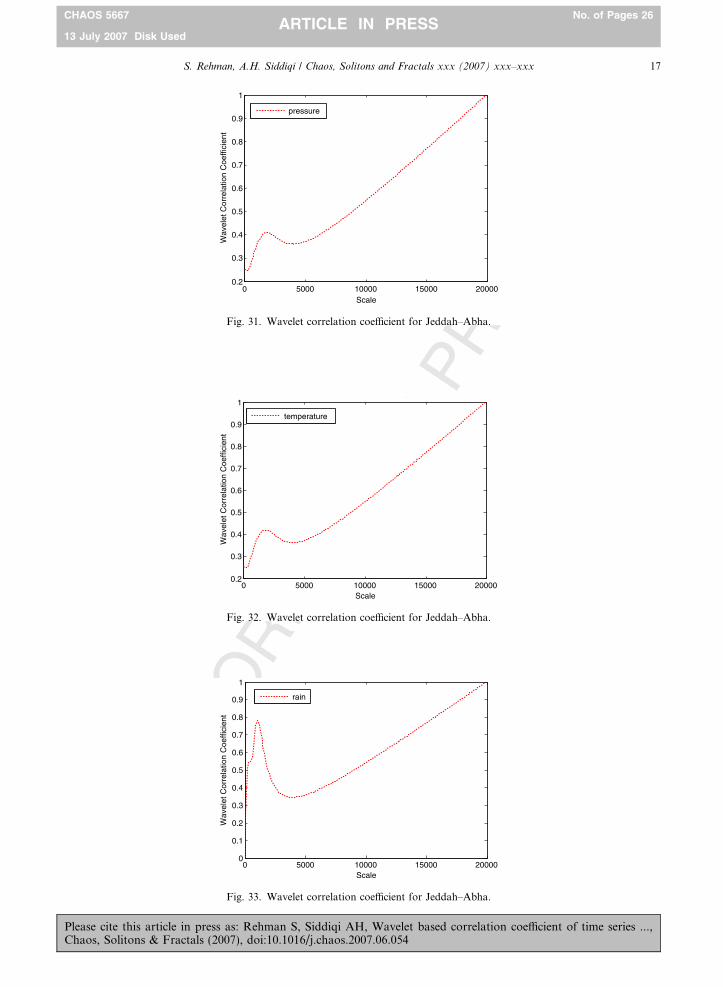
Dhahran-Abha stations are shown in Figs. 6–10 and the corresponding correlation coefficients are depicted in Figs. 11–15, respectively. The wavelet spectra of Dhharan–Gizan pair of stations are shown in Figs. 16–20 while the correspond-ing correlation coefficients are given in Figs. 21–25, respectively. For other pairs of stations, the wavelet spectra and the
Please cite this article in press as: Rehman S, Siddiqi AH, Wavelet based correlation coefficient of time series ...,Chaos, Solitons & Fractals (2007), doi:10.1016/j.chaos.2007.06.054
UN
CO
RR
EC
TED
PR
OO
F
187
188
189
190
0 5000 10000 15000 200000
5
10
15
20
25
30
Scale
Wav
elet
Spe
ctru
m
dhahrangizan
Fig. 19. Wavelet spectrum of humidity for Dhahran–Gizan.
0 5000 10000 15000 200000
5
10
15
20
25
30
35
40
45
Scale
Wav
elet
Spe
ctru
m
dhahrangizan
Fig. 20. Wavelet spectrum of wind speed for Dhahran–Gizan.
0 5000 10000 15000 200000.2
0.3
0.4
0.5
0.6
0.7
0.8
0.9
1
Scale
Wav
elet
Cor
rela
tion
Coe
ffici
ent
Pressure
Fig. 21. Wavelet correlation coefficient for Dhahran–Gizan.
S. Rehman, A.H. Siddiqi / Chaos, Solitons and Fractals xxx (2007) xxx–xxx 13
CHAOS 5667 No. of Pages 26
13 July 2007 Disk UsedARTICLE IN PRESS
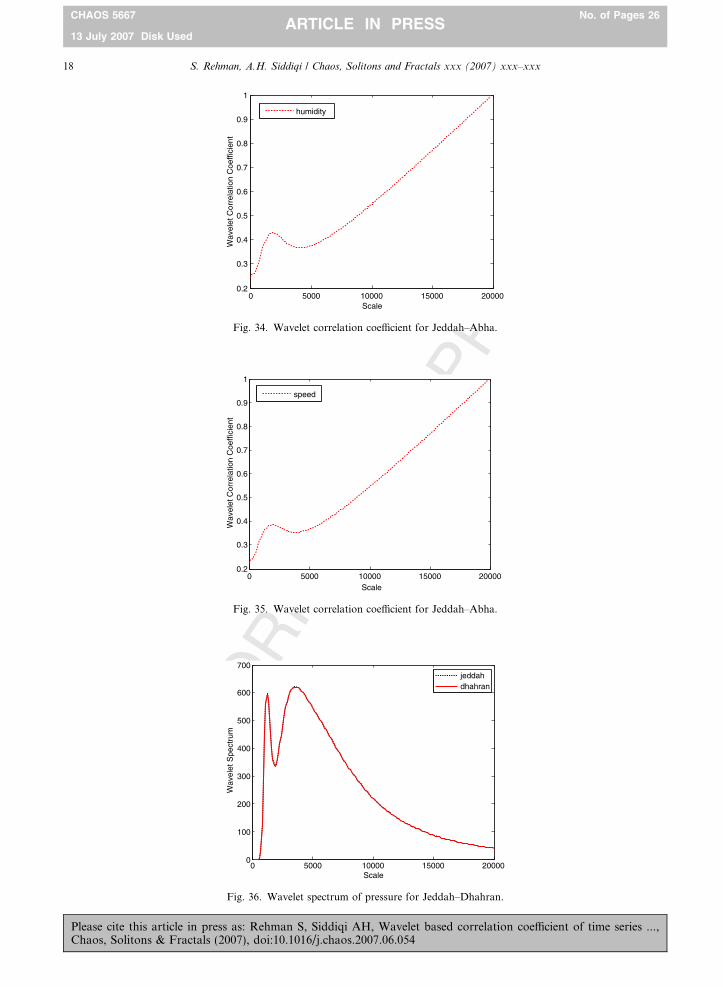
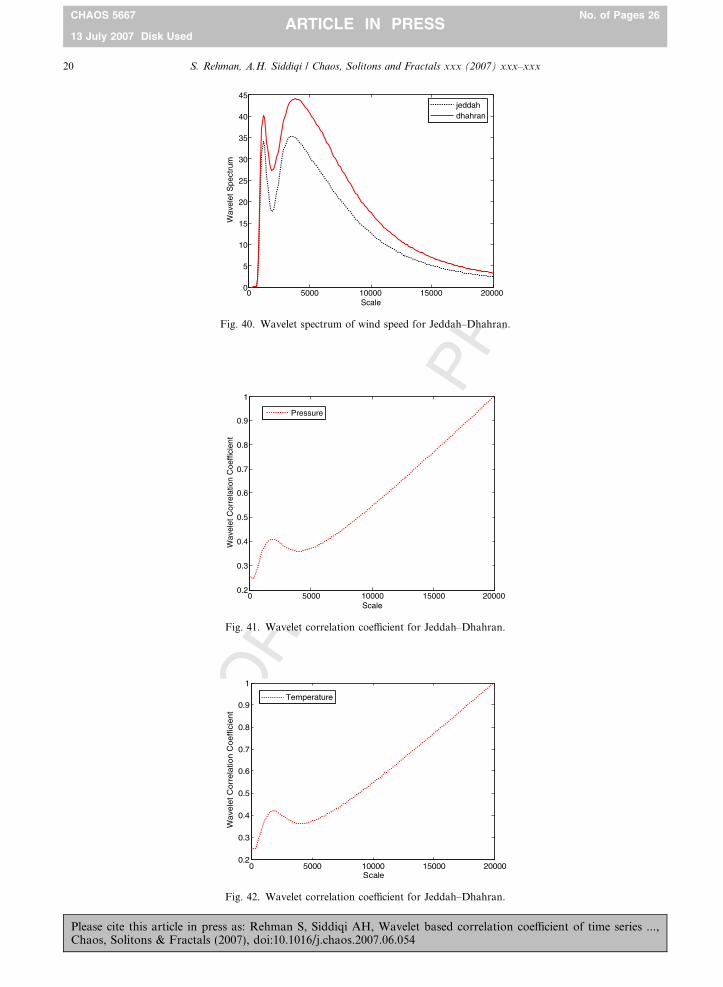
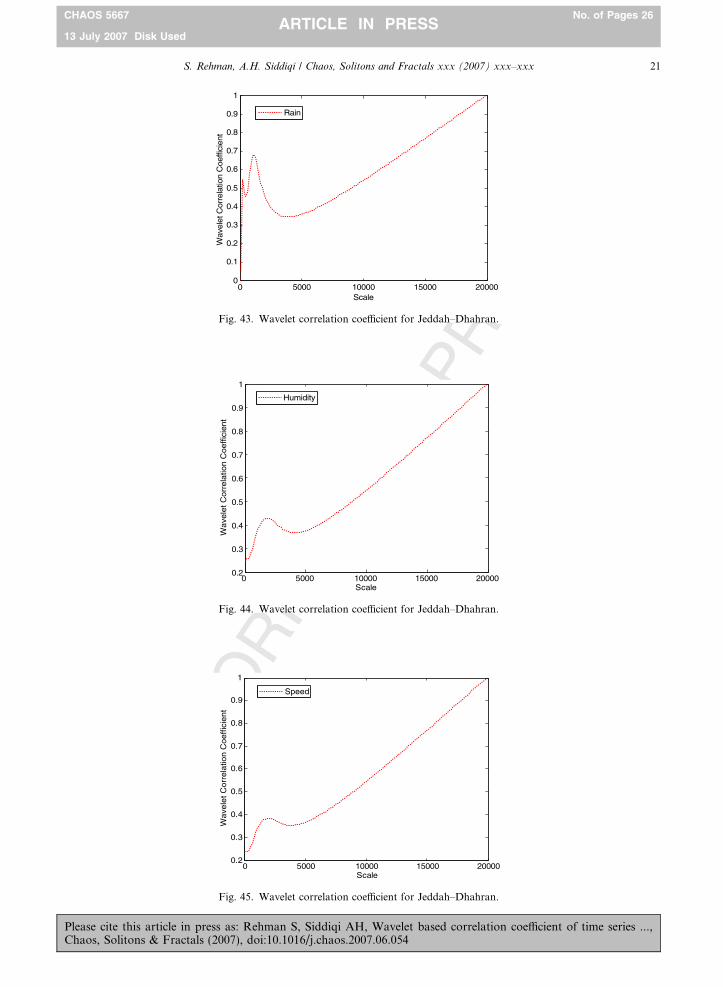
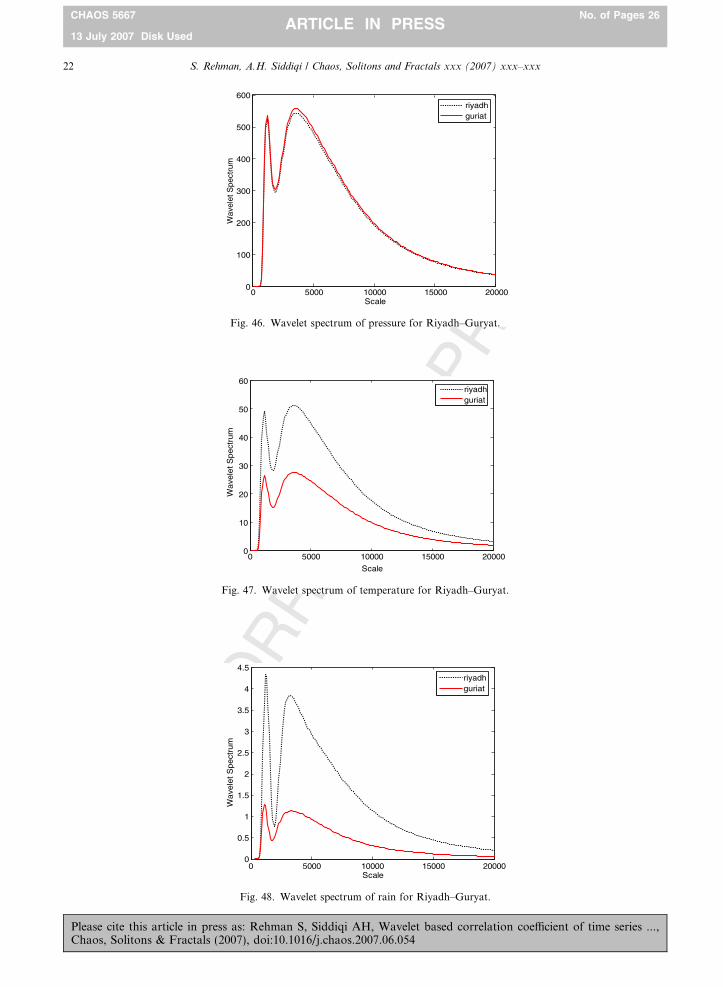
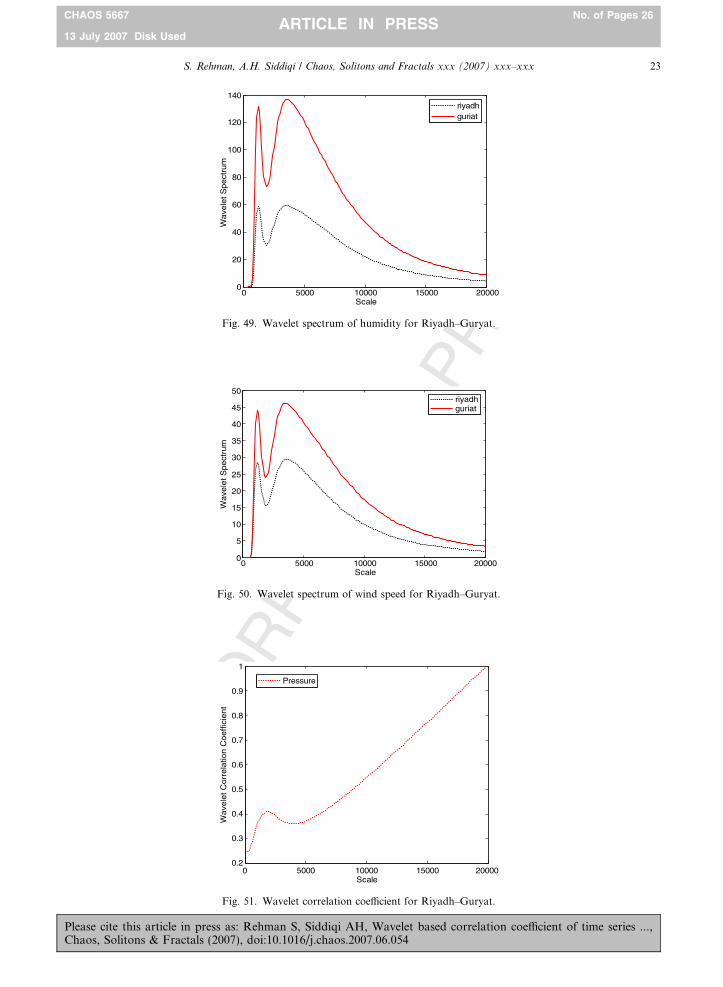
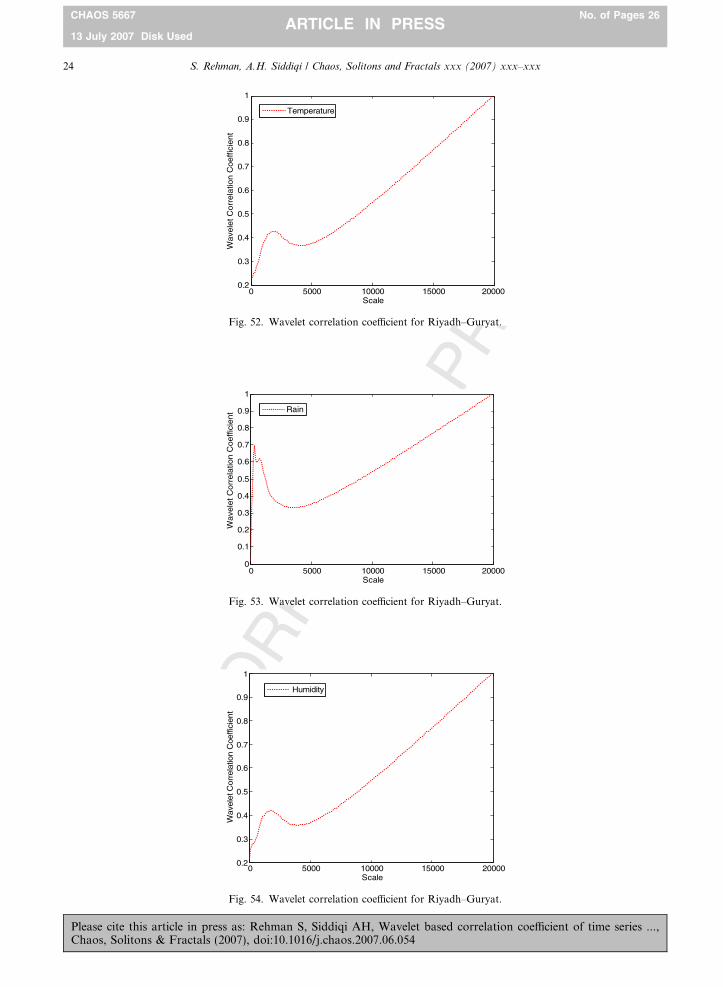
correlation coefficients are summarized through Figs. 26–55. Similar type of spectra was also made for many combina-tions of the stations and were studied but not included here. It may be observed that the correlation between two mete-orological data sets from different stations is scale dependent. They are strongly correlated or less correlated or stronglyanti-correlated depending on scale.
Please cite this article in press as: Rehman S, Siddiqi AH, Wavelet based correlation coefficient of time series ...,Chaos, Solitons & Fractals (2007), doi:10.1016/j.chaos.2007.06.054
UN
CO
RR
EC
TED
PR
OO
F
0 5000 10000 15000 200000.2
0.3
0.4
0.5
0.6
0.7
0.8
0.9
1
Scale
Wav
elet
Cor
rela
tion
Coe
ffici
ent
Temperature
Fig. 22. Wavelet correlation coefficient for Dhahran–Gizan.
0 5000 10000 15000 200000
0.1
0.2
0.3
0.4
0.5
0.6
0.7
0.8
0.9
1
Scale
Wav
elet
Cor
rela
tion
Coe
ffici
ent
Rain
Fig. 23. Wavelet correlation coefficient for Dhahran–Gizan.
0 5000 10000 15000 200000.2
0.3
0.4
0.5
0.6
0.7
0.8
0.9
1
Scale
Wav
elet
Cor
rela
tion
Coe
ffici
ent
Humidity
Fig. 24. Wavelet correlation coefficient for Dhahran–Gizan.
14 S. Rehman, A.H. Siddiqi / Chaos, Solitons and Fractals xxx (2007) xxx–xxx
CHAOS 5667 No. of Pages 26
13 July 2007 Disk UsedARTICLE IN PRESS
Please cite this article in press as: Rehman S, Siddiqi AH, Wavelet based correlation coefficient of time series ...,Chaos, Solitons & Fractals (2007), doi:10.1016/j.chaos.2007.06.054
UN
CO
RR
EC
TED
PR
OO
F
0 5000 10000 15000 200000.2
0.3
0.4
0.5
0.6
0.7
0.8
0.9
1
Scale
Wav
elet
Cor
rela
tion
Coe
ffici
ent
Speed
Fig. 25. Wavelet correlation coefficient for Dhahran–Gizan.
0 5000 10000 15000 200000
100
200
300
400
500
600
700
Scale
Wav
elet
Spe
ctru
m
jeddahabha
Fig. 26. Wavelet spectrum of pressure for Jeddah–Abha.
0 5000 10000 15000 200000
100
200
300
400
500
600
Scale
Wav
elet
Spe
ctru
m
jeddahabha
Fig. 27. Wavelet spectrum of temperature for Jeddah–Abha.
S. Rehman, A.H. Siddiqi / Chaos, Solitons and Fractals xxx (2007) xxx–xxx 15
CHAOS 5667 No. of Pages 26
13 July 2007 Disk UsedARTICLE IN PRESS
Please cite this article in press as: Rehman S, Siddiqi AH, Wavelet based correlation coefficient of time series ...,Chaos, Solitons & Fractals (2007), doi:10.1016/j.chaos.2007.06.054

UN
CO
RR
EC
TED
PR
OO
F
0 5000 10000 15000 200000
1
2
3
4
5
6
7
8
Scale
Wav
elet
Spe
ctru
m
jeddahabha
Fig. 28. Wavelet spectrum of rain for Jeddah–Abha.
0 5000 10000 15000 200000
5
10
15
20
25
30
Scale
Wav
elet
Spe
ctru
m
jeddahabha
Fig. 29. Wavelet spectrum of humidity for Jeddah–Abha.
0 5000 10000 15000 200000
5
10
15
20
25
30
35
40
Scale
Wav
elet
Spe
ctru
m
jeddahabha
Fig. 30. Wavelet spectrum of wind speed for Jeddah–Abha.
16 S. Rehman, A.H. Siddiqi / Chaos, Solitons and Fractals xxx (2007) xxx–xxx
CHAOS 5667 No. of Pages 26
13 July 2007 Disk UsedARTICLE IN PRESS
Please cite this article in press as: Rehman S, Siddiqi AH, Wavelet based correlation coefficient of time series ...,Chaos, Solitons & Fractals (2007), doi:10.1016/j.chaos.2007.06.054
UN
CO
RR
EC
TED
PR
OO
F
0 5000 10000 15000 200000.2
0.3
0.4
0.5
0.6
0.7
0.8
0.9
1
Scale
Wav
elet
Cor
rela
tion
Coe
ffici
ent
pressure
Fig. 31. Wavelet correlation coefficient for Jeddah–Abha.
0 5000 10000 15000 200000.2
0.3
0.4
0.5
0.6
0.7
0.8
0.9
1
Scale
Wav
elet
Cor
rela
tion
Coe
ffici
ent
temperature
Fig. 32. Wavelet correlation coefficient for Jeddah–Abha.
0 5000 10000 15000 200000
0.1
0.2
0.3
0.4
0.5
0.6
0.7
0.8
0.9
1
Scale
Wav
elet
Cor
rela
tion
Coe
ffici
ent
rain
Fig. 33. Wavelet correlation coefficient for Jeddah–Abha.
S. Rehman, A.H. Siddiqi / Chaos, Solitons and Fractals xxx (2007) xxx–xxx 17
CHAOS 5667 No. of Pages 26
13 July 2007 Disk UsedARTICLE IN PRESS
Please cite this article in press as: Rehman S, Siddiqi AH, Wavelet based correlation coefficient of time series ...,Chaos, Solitons & Fractals (2007), doi:10.1016/j.chaos.2007.06.054
UN
CO
RR
EC
TED
PR
OO
F
0 5000 10000 15000 200000.2
0.3
0.4
0.5
0.6
0.7
0.8
0.9
1
Scale
Wav
elet
Cor
rela
tion
Coe
ffici
ent
humidity
Fig. 34. Wavelet correlation coefficient for Jeddah–Abha.
0 5000 10000 15000 200000.2
0.3
0.4
0.5
0.6
0.7
0.8
0.9
1
Scale
Wav
elet
Cor
rela
tion
Coe
ffici
ent
speed
Fig. 35. Wavelet correlation coefficient for Jeddah–Abha.
0 5000 10000 15000 200000
100
200
300
400
500
600
700
Scale
Wav
elet
Spe
ctru
m
jeddahdhahran
Fig. 36. Wavelet spectrum of pressure for Jeddah–Dhahran.
18 S. Rehman, A.H. Siddiqi / Chaos, Solitons and Fractals xxx (2007) xxx–xxx
CHAOS 5667 No. of Pages 26
13 July 2007 Disk UsedARTICLE IN PRESS
Please cite this article in press as: Rehman S, Siddiqi AH, Wavelet based correlation coefficient of time series ...,Chaos, Solitons & Fractals (2007), doi:10.1016/j.chaos.2007.06.054

UN
CO
RR
EC
TED
PR
OO
F
0 5000 10000 15000 200000
10
20
30
40
50
60
Scale
Wav
elet
Spe
ctru
m
jeddahdhahran
Fig. 37. Wavelet spectrum of temperature for Jeddah–Dhahran.
0 5000 10000 15000 200000
0.5
1
1.5
2
2.5
3
3.5
4
WaS
cale
vele
t Spe
ctru
m
jeddahdhahran
Fig. 38. Wavelet spectrum of rain for Jeddah–Dhahran.
0 5000 10000 15000 200000
5
10
15
20
25
30
Scale
Wav
elet
Spe
ctru
m
jeddahdhahran
Fig. 39. Wavelet spectrum of humidity for Jeddah–Dhahran.
S. Rehman, A.H. Siddiqi / Chaos, Solitons and Fractals xxx (2007) xxx–xxx 19
CHAOS 5667 No. of Pages 26
13 July 2007 Disk UsedARTICLE IN PRESS
Please cite this article in press as: Rehman S, Siddiqi AH, Wavelet based correlation coefficient of time series ...,Chaos, Solitons & Fractals (2007), doi:10.1016/j.chaos.2007.06.054
UN
CO
RR
EC
TED
PR
OO
F
0 5000 10000 15000 200000
5
10
15
20
25
30
35
40
45
Scale
Wav
elet
Spe
ctru
m
jeddahdhahran
Fig. 40. Wavelet spectrum of wind speed for Jeddah–Dhahran.
0 5000 10000 15000 200000.2
0.3
0.4
0.5
0.6
0.7
0.8
0.9
1
Scale
Wav
elet
Cor
rela
tion
Coe
ffici
ent
Pressure
Fig. 41. Wavelet correlation coefficient for Jeddah–Dhahran.
0.2
0.3
0.4
0.5
0.6
0.7
0.8
0.9
1
Wave
let C
orr
ela
tion C
oeffic
ient
Temperature
0 5000 10000 15000 20000Scale
Fig. 42. Wavelet correlation coefficient for Jeddah–Dhahran.
20 S. Rehman, A.H. Siddiqi / Chaos, Solitons and Fractals xxx (2007) xxx–xxx
CHAOS 5667 No. of Pages 26
13 July 2007 Disk UsedARTICLE IN PRESS
Please cite this article in press as: Rehman S, Siddiqi AH, Wavelet based correlation coefficient of time series ...,Chaos, Solitons & Fractals (2007), doi:10.1016/j.chaos.2007.06.054
UN
CO
RR
EC
TED
PR
OO
F
Wav
elet
Cor
rela
tion
Coe
ffici
ent
0
0.1
0.2
0.3
0.4
0.5
0.6
0.7
0.8
0.9
1
Rain
0 5000 10000 15000 20000Scale
Fig. 43. Wavelet correlation coefficient for Jeddah–Dhahran.
Humidity
0 5000 10000 15000 20000Scale
0.2
0.3
0.4
0.5
0.6
0.7
0.8
0.9
1
Wave
let C
orr
ela
tion C
oeffic
ient
Fig. 44. Wavelet correlation coefficient for Jeddah–Dhahran.
0 5000 10000 15000 200000.2
0.3
0.4
0.5
0.6
0.7
0.8
0.9
1
Scale
Wave
let C
orr
ela
tion C
oeffic
ient
Speed
Fig. 45. Wavelet correlation coefficient for Jeddah–Dhahran.
S. Rehman, A.H. Siddiqi / Chaos, Solitons and Fractals xxx (2007) xxx–xxx 21
CHAOS 5667 No. of Pages 26
13 July 2007 Disk UsedARTICLE IN PRESS
Please cite this article in press as: Rehman S, Siddiqi AH, Wavelet based correlation coefficient of time series ...,Chaos, Solitons & Fractals (2007), doi:10.1016/j.chaos.2007.06.054
UN
CO
RR
EC
TED
PR
OO
F
0 5000 10000 15000 20000Scale
0
100
200
300
400
500
600
Wav
elet
Spe
ctru
m
riyadhguriat
Fig. 46. Wavelet spectrum of pressure for Riyadh–Guryat.
0
10
20
30
40
50
60
Wave
let S
pect
rum
riyadhguriat
0 5000 10000 15000 20000
Scale
Fig. 47. Wavelet spectrum of temperature for Riyadh–Guryat.
0
0.5
1
1.5
2
2.5
3
3.5
4
4.5
Wave
let S
pect
rum
riyadhguriat
0 5000 10000 15000 20000Scale
Fig. 48. Wavelet spectrum of rain for Riyadh–Guryat.
22 S. Rehman, A.H. Siddiqi / Chaos, Solitons and Fractals xxx (2007) xxx–xxx
CHAOS 5667 No. of Pages 26
13 July 2007 Disk UsedARTICLE IN PRESS
Please cite this article in press as: Rehman S, Siddiqi AH, Wavelet based correlation coefficient of time series ...,Chaos, Solitons & Fractals (2007), doi:10.1016/j.chaos.2007.06.054
UN
CO
RR
EC
TED
PR
OO
F
0
20
40
60
80
100
120
140riyadhguriat
Wave
let S
pect
rum
0 5000 10000 15000 20000Scale
Fig. 49. Wavelet spectrum of humidity for Riyadh–Guryat.
0
5
10
15
20
25
30
35
40
45
50riyadhguriat
0 5000 10000 15000 20000Scale
Wave
let S
pect
rum
Fig. 50. Wavelet spectrum of wind speed for Riyadh–Guryat.
Pressure
0.2
0.3
0.4
0.5
0.6
0.7
0.8
0.9
1
Wave
let C
orr
ela
tion C
oeffic
ient
0 5000 10000 15000 20000Scale
Fig. 51. Wavelet correlation coefficient for Riyadh–Guryat.
S. Rehman, A.H. Siddiqi / Chaos, Solitons and Fractals xxx (2007) xxx–xxx 23
CHAOS 5667 No. of Pages 26
13 July 2007 Disk UsedARTICLE IN PRESS
Please cite this article in press as: Rehman S, Siddiqi AH, Wavelet based correlation coefficient of time series ...,Chaos, Solitons & Fractals (2007), doi:10.1016/j.chaos.2007.06.054
UN
CO
RR
EC
TED
PR
OO
F
Temperature
0.2
0.3
0.4
0.5
0.6
0.7
0.8
0.9
1
Wave
let C
orr
ela
tion C
oeffic
ient
0 5000 10000 15000 20000Scale
Fig. 52. Wavelet correlation coefficient for Riyadh–Guryat.
0
0.1
0.2
0.3
0.4
0.5
0.6
0.7
0.8
0.9
1
Rain
Wave
let C
orr
ela
tion C
oeffic
ient
0 5000 10000 15000 20000Scale
Fig. 53. Wavelet correlation coefficient for Riyadh–Guryat.
0.2
0.3
0.4
0.5
0.6
0.7
0.8
0.9
1
Wav
elet
Cor
rela
tion
Coe
ffici
ent
Humidity
0 5000 10000 15000 20000Scale
Fig. 54. Wavelet correlation coefficient for Riyadh–Guryat.
24 S. Rehman, A.H. Siddiqi / Chaos, Solitons and Fractals xxx (2007) xxx–xxx
CHAOS 5667 No. of Pages 26
13 July 2007 Disk UsedARTICLE IN PRESS
Please cite this article in press as: Rehman S, Siddiqi AH, Wavelet based correlation coefficient of time series ...,Chaos, Solitons & Fractals (2007), doi:10.1016/j.chaos.2007.06.054

OO
F
191
192
193
194
195
196
197
198
199
200
201
202
203
204
205
206
207
208
209
210
211
212
213
214 Q2
215
216
217
218
Speed
0.2
0.3
0.4
0.5
0.6
0.7
0.8
0.9
1
Wav
elet
Cor
rela
tion
Coe
ffici
ent
0 5000 10000 15000 20000Scale
Fig. 55. Wavelet correlation coefficient for Riyadh–Guryat.
S. Rehman, A.H. Siddiqi / Chaos, Solitons and Fractals xxx (2007) xxx–xxx 25
CHAOS 5667 No. of Pages 26
13 July 2007 Disk UsedARTICLE IN PRESS
DPR
We find that the wavelet spectrum of pressure at Dhahran and Abha, as shown in Fig. 6, has two maxima betweenthe scale 0 and 20,000. Maxima at both places are attained at the same scale. In case of rainfall spectra of Dhahran andAbha (Fig. 8), the situation is different. The spectrum of Dhahran rainfall has minimum at the scale where the spectrumof Abha rainfall has maximum. We find that the wavelet correlation coefficient of pressure for Dhahran–Abha increasesup to scale 3000 then decreases up to 5000 and then increases again up to the end. This phenomenon is observed forwavelet based correlation coefficients for all meteorological parameters except rainfall data of Dhahran–Gizan(Fig. 23), Jeddah–Dhahran (Fig. 33) and Riyadh–Guryat (Fig. 53).
EOR
REC
T6. Conclusions
• Higher values of correlation coefficients were found for all the parameters for coastal stations among all the pairsused in this study.
• Temperature time series data were found to be highly correlated for all the pairs of stations while the total rain fall,the least. The pressure time series also exhibited good correlation compared to relative humidity and wind speed forall the pairs of stations.
• In case of coastal stations, the maximum correlation coefficients of 0.955, 0.943, 0.385 and 0.212; corresponding topressure, temperature, wind speed and total rain, respectively, were observed for Jeddah–Yanbu pair of locations. Incase of relative humidity, the highest correlation coefficient of 0.470 was found for Dhahran–Gizan pair of locations.
• In case of inland pairs of stations, the maximum correlation coefficient of 0.807 for pressure time series was foundfor Guryat–Riyadh pair while 0.922, 0.734, 0.250 for temperature, relative humidity and wind speed for Guryat–Turaif stations.
• Riyadh–Dhahran stations showed strong correlation with coefficients of 0.961, 0.977 and 0.638 corresponding topressure, temperature and relative humidity time series, respectively.
CN7. Uncited references
[7,12,16,20,23].
UAcknowledgment
The authors acknowledge the support of King Fahd University of Petroleum and Minerals (KFUPM), Dhahran,Saudi Arabia for the grant under the project INT/FRACTAL/310 to carry out this study.
Please cite this article in press as: Rehman S, Siddiqi AH, Wavelet based correlation coefficient of time series ...,Chaos, Solitons & Fractals (2007), doi:10.1016/j.chaos.2007.06.054

219
220221222223224225226227228229230231232233234235236237238239240241242243244245246247248249250251252253254255256257258259260261262263264265266267268269270271272273274275
276
26 S. Rehman, A.H. Siddiqi / Chaos, Solitons and Fractals xxx (2007) xxx–xxx
CHAOS 5667 No. of Pages 26
13 July 2007 Disk UsedARTICLE IN PRESS
UN
CO
RR
EC
TED
PR
OO
F
References
[1] Abahussain AA, Abdu AS, Al-Zubari WK, El-Deen NA, Abdul-Raheem M. Desertification in the Arab region: analysis ofcurrent status and trends. J Arid Environ 2002;51:521–45.
[2] Abbry P, Veitch D, Flandrin P. Long range dependence: revisiting aggregation with wavelets. J Time Series Anal1998;19(3):253–66.
[3] Addison PS. The illustrated wavelet transform handbook: introductory theory and applications in science and engineering,medicines and finance. Bristol and Philadelphia: Institute of Physics Publishing; 2002.
[4] Arnell NW. The effect of climate change on hydrological regimes in Europe: a continental perspective. Global Environ Change1999;9:5–3023.
[5] Akber A, Al-Awadi E, Ghoneim H. Water resources management in developing countries: a case study from Kuwait. In: MarinMA, Simonovic SP, editors. Integrated water resource management. Wallingford, Oxfordshire, UK: Integrational Association ofHydrological Sciences (IAHS) Publication No. 272. IAHS Press; 2001. p. 213–20.
[6] Alkolibi F. Possible effects of global warming on agriculture and water resources in Saudi Arabia: impacts and responses. ClimateChange 2002;54:225–45.
[7] Al-Sahhaf NA. The use of remote sensing and geographic information system technologies to detect, monitor and model urbanchange in Riyadh, Saudi Arabia. Doctoral Dissertation, University of California, Santa Barbara; 2000. p. 202.
[8] Balling Jr RC, Brazel SW. The impact of rapid urbanization on pan evaporation in Phoenix, Arizona. J Climatol 1987;7:593–7.[9] Boer B. An introduction to the climate of the United Arab Emirates. J Arid Environ 1997;35(1):3–16.
[10] Chang CC. The potential impact of climate change on Taiwan’s agriculture. Agric Econ 2002;27:51–64.[11] Chester SG, Kapil G, Yucheng Z, Gary S. Measuring gravity wave momentum fluxes with airglow imagers. J Geophys Res
1999;104(D10):11,903–16.[12] Cohen S, Ianetz A, Stanhill G. Evaporative climate change at Bet Dagan, Israel, (1964–1998). Agric Forest Meteorol
2002;111:83–91.[13] Daubechies I. Ten lectures on wavelets. Philadelphia: SIAM; 1992.[14] Elagib NA, Abdu ASA. Climate variability and aridity in Bahrain. J Arid Environ 1997;36:405–19.[15] Elagib NA, Mansell MG. Recent trends and anomalies in mean seasonal and annual temperatures over Sudan. J Arid Environ
2000;45:263–88.[16] Easterling DR, Meehl GA, Parmesan C, Chagnon SA, Karl TR, Mearns LO. Climate extremes: observations, modeling and
impacts. Science 2000;289:2074–86.[17] Franz B. The present status of correlation investigation in meteorology. Mon Weather Rev 1930(July):284–6.[18] Jose AM, Francisco RV, Cruz NA. A study on impact of climate variability/change on water resources in the Philippines.
Chemosphere 1996;33(9):1687–704.[19] Karamouz M, Torabi S, Zahraie B, Araghi-Nejhad S, Shahsavari M. An integrated approach to water resources development of
the Tehran region in Iran. J Am Water Resour Assoc 2001;37:1301–11.[20] Karl TR, Easterling DR. Climate extremes: selected review and future research directions. Climatic Change 1999;42:309–25.[21] Kipkorir EC. Analysis of rainfall climate on the Njemps flats, Baringo District, Kenya. J Arid Environ 2002;50:445–58.[22] Kitagawa T, Nomura T. A wavelet-based method to generate artificial wind fluctuation data. J Wind Eng Ind Aerodyn
2003;91:943–64.[23] Kunkel KE, Pritke RA, Chagnon SA. Temporal fluctuation in weather and climate extremes that cause economic and human
health impacts–a review. Bull Am Meteorol Soc 1999;80:1077–98.[24] Lazaro R, Rodrigo FS, Gutierrez FD, Puigdefabregas J. Analysis of a 30-year rainfall record (1967–1997) in semi-arid SE Spain
for implications on vegetation. J Arid Environ 2001;48:73–395.[25] Moonen AC, Ercoli L, Mariotti M, Masoni A. Climate change in Italy indicated by agrometeorological indices over 122 years.
Agric Forest Meteorol 2002;111:13–27.[26] Pimenta MT, Santos MJ, Rodrigues R. A Susceptibilidade a Desertificacao. Revista Florestal 1998;11(1):27–33.[27] Qureshi S, Khan N. Estimation of climatic transition in Riyadh (Saudi Arabia) in global warming perspective. GeoJournal
1994;33:423–32.[28] Razdan A. Wavelet correlation coefficient of strongly correlated time series. Physica A 2004;333:335–42.[29] Schwalm CR, Ek AR. Climate change and site: relevant mechanisms and modeling techniques. Forest Ecol Manage
2001;150:241–57.[30] Shepered JM. Evidence of urban-induced precipitation variability in arid climate regimes. J Arid Environ 2006;67:607–28.[31] Siddiqi AH. Applied functional analysis, numerical methods, wavelet methods and image processing. New York: Marcel Dekker;
2004.[32] Sonechkin DM, Astafyeva NM, Datsenko NM, Ivachtchenko NN, Jakubiak B. Multiscale oscillations of the global climate
system as revealed by wavelet transform of observational data time series. Theor Appl Climatol 1999;64:131–42.[33] Valentina MK, Roman MV, Peter OZ. Long-term variability of air temperature in the Aral Sea region. J Mar Syst 2004.[34] Warren A, Sud YC, Rozanov B. The future of deserts. J Arid Environ 1996;32(1):75–89.
Please cite this article in press as: Rehman S, Siddiqi AH, Wavelet based correlation coefficient of time series ...,Chaos, Solitons & Fractals (2007), doi:10.1016/j.chaos.2007.06.054
Copyright © 2022 FDOKUMEN