World Meteorological Organization
19
To: Permanent Representatives (or Directors of Meteorological or Hydrometeorological Services) of Members of WMO cc: Presidents of Regional Associations President and vice-presidents of SERCOM President and vice-presidents of INFCOM Director of the National Centers for Environmental Information (NCEI), Asheville Our ref.: 09732/2020/S/CS/CMP/WWR-2020 29 May 2020 Annex: 1 (available in English only) Subject: Collection of data for publication in World Weather Records 2018 and 2019 Action required: Submission of data as soon as possible but not later than 31 July 2020 Dear Sir/Madam, I wish to inform you that arrangements have been made for the collection of the World Weather Records (WWR). As you may recall, the Seventeenth World Meteorological Congress (Cg-17) noted the successful implementation of the new approach for the annual submission of WWR and urged Members to submit their data in a timely manner as described by Resolution 14 (EC-64) — Submission of World Weather Records on an annual basis (Executive Council: Abridged Final Report of the sixty-fourth session (WMO-No. 1092)). I invite you therefore to prepare the data for stations from your country published in the World Meteorological Organization’s (WMO) Observing Systems Capability Analysis and Review Tool for surface-based observations (OSCAR/Surface, see: https://oscar.wmo.int/surface). The data should cover 2018 and 2019 and, if not submitted yet, please also provide the corresponding data for the periods 1991-2000, 2001- 2010 and for the years 2011, 2012, 2013, 2014, 2015, 2016 and 2017. I would like to emphasize that our databases show big data gaps in most parts of the world for the periods/years mentioned above. It is requested that data be digitized and provided in either EXCEL or text format, following the attached updated draft Guidelines for the Submission of the World Weather Records 2011+ (WMO-No. 1186), (draft version 3.0 of May 2020). Updates comprise a revised (logical) sequence of climatic elements (Section II.1), related template adjustments including the accommodation of WIGOS Station Identifiers (Section II.2) and a revision of the WWR collection mechanism (Annex 1). Updated EXCEL and text file templates are available here: https://community.wmo.int/world-weather-records-wwr. To facilitate the publication of data in the WWR, I would be grateful if you could send your contribution at your earliest convenience, but not later than 31 July 2020, to the respective Lead Centre for the Global Climate Observing System (GCOS) as per Annex 1 of the guidelines. Annual updates of WWR collected under this scheme and quality-controlled thereafter are accessible through the World Data Center for Meteorology: https://www.ncdc.noaa.gov/wdcmet/data-access-search-viewer-tools/world- weather-records-wwr-clearinghouse. The most recent update includes 2011-2016 data of the current eleventh series of WWR (2011-2020).
-
Upload
khangminh22 -
Category
Documents
-
view
1 -
download
0
Transcript of World Meteorological Organization

To: Permanent Representatives (or Directors of Meteorological or Hydrometeorological Services) of Members of WMO
cc: Presidents of Regional Associations President and vice-presidents of SERCOM President and vice-presidents of INFCOM Director of the National Centers for Environmental Information (NCEI), Asheville
Our ref.: 09732/2020/S/CS/CMP/WWR-2020 29 May 2020
Annex: 1 (available in English only)
Subject: Collection of data for publication in World Weather Records 2018 and 2019
Action required: Submission of data as soon as possible but not later than 31 July 2020
Dear Sir/Madam,
I wish to inform you that arrangements have been made for the collection of the World Weather Records (WWR). As you may recall, the Seventeenth World Meteorological Congress (Cg-17) noted the successful implementation of the new approach for the annual submission of WWR and urged Members to submit their data in a timely manner as described by Resolution 14 (EC-64) — Submission of World Weather Records on an annual basis (Executive Council: Abridged Final Report of the sixty-fourth session (WMO-No. 1092)).
I invite you therefore to prepare the data for stations from your country published in the World Meteorological Organization’s (WMO) Observing Systems Capability Analysis and Review Tool for surface-based observations (OSCAR/Surface, see: https://oscar.wmo.int/surface). The data should cover 2018 and 2019 and, if not submitted yet, please also provide the corresponding data for the periods 1991-2000, 2001-2010 and for the years 2011, 2012, 2013, 2014, 2015, 2016 and 2017. I would like to emphasize that our databases show big data gaps in most parts of the world for the periods/years mentioned above.
It is requested that data be digitized and provided in either EXCEL or text format, following the attached updated draft Guidelines for the Submission of the World Weather Records 2011+ (WMO-No. 1186), (draft version 3.0 of May 2020). Updates comprise a revised (logical) sequence of climatic elements (Section II.1), related template adjustments including the accommodation of WIGOS Station Identifiers (Section II.2) and a revision of the WWR collection mechanism (Annex 1). Updated EXCEL and text file templates are available here: https://community.wmo.int/world-weather-records-wwr.
To facilitate the publication of data in the WWR, I would be grateful if you could send your contribution at your earliest convenience, but not later than 31 July 2020, to the respective Lead Centre for the Global Climate Observing System (GCOS) as per Annex 1 of the guidelines.
Annual updates of WWR collected under this scheme and quality-controlled thereafter are accessible through the World Data Center for Meteorology: https://www.ncdc.noaa.gov/wdcmet/data-access-search-viewer-tools/world-weather-records-wwr-clearinghouse. The most recent update includes 2011-2016 data of the current eleventh series of WWR (2011-2020).

- 2 -
Should you require further clarification, please do not hesitate to contact the WMO Climate Monitoring and Policy Services Division (Mr Omar Baddour, Head, Climate Monitoring and Policy Services Division and Mr Peer Hechler, Scientific Officer: [email protected]).
Yours faithfully,
~(11*~ (E. Manaenkova)
for the Secretary-General

09732/2020/S/CS/CMP/WWR-2020, ANNEX
Draft updated Guidelines for the Submission of the World Weather Records 2011+ Version 3.0, May 2020, NCEI/WMO/PH;
Updates of content highlighted:
- Section II.1: Revised (logical) sequence of the climatic elements
- Section II.2: Template adjustments including accommodation of WIGOS Station Identifier (template adjustments have been incorporated –but not highlighted anymore- in Annexes 2 and 3)
- Annex 1: Update of collection mechanism
- Text alignments and updates as appropriate

ANNEX, p. 2
Table of Contents
I. BACKGROUND ........................................................................................... 3
I.1 History .................................................................................................. 3
I.2 Submission Channels of the WWRs ........................................................... 3
I.3 Quality Assurance and Accessibility of WWRs.............................................. 3
II. METHODOLOGY FOR REPRESENTING THE WWRs ...................................... 3
II.1 Data Elements ........................................................................................ 3
II.2 Data Format ........................................................................................... 4
Option 1: Excel ............................................................................................ 4
(a) Station Header Records ......................................................................... 5
(b) Yearly Data Records ............................................................................. 6
Option 2: Text ............................................................................................. 8
(a) Station Header Records ......................................................................... 8
(b) Yearly Data Records ............................................................................. 9
II.3 History Metadata (Station Notes) ............................................................ 10
Annex I: Proposed collection mechanism by region ..................................... 11
Annex II: Example Excel File (single station per tab) .................................. 13
Annex III: Example Text File (single station per file) .................................. 14
Annex IV: Station Notes Example ................................................................ 17

ANNEX, p. 3
I. BACKGROUND
I.1 History
The World Weather Records (WWR) database contains historical monthly climatic data from land surface stations worldwide. First released in 1927, the WWR database has been widely employed in operational climate monitoring, international climate assessments, and numerous other applications. To date, there have been ten editions of WWR, the first containing data up through 1920, with each successive release containing data for another decade (i.e., 1921-1930, 1931-1940, 1941-1950, 1951-1960, 1961-1970, 1971-1980, 1981-1990, 1991-2000, 2001-2010). Since its inception, WWR has been produced by three different institutions: the Smithsonian Institution (1927, 1934, 1947); the U.S. Weather Bureau (1959, 1967); and the U.S. National Oceanic and Atmospheric Administration (NOAA; 1983, 1991, 2005). The current edition will also be produced by NOAA. It addresses the 2011+ period, consistent with WMO Secretariat guidance. However, the previous edition lacked data for many countries, posing an impediment to climate monitoring and assessment activities because of the decline in station coverage starting in 1991. World Meteorological Congress XVI, Geneva 2011, emphasized the importance of updating the World Weather Records continuously. It requested Members to complete the data sets for WWR 1991-2000, submit WWR for 2001-2010, and -starting from 2011- move towards annual updates of the WWR. This approach has been formalised through Resolution 14 (EC-64) Submission of World Weather Records on an Annual Basis.
I.2 Submission Channels of the WWRs
Each WMO Member should submit two types of files to the responsible CBS Lead Center for GCOS or to WMO as appropriate (see suggested collection mechanisms in ANNEX I). The first file type should contain station data for the country (single Excel file containing all stations OR single text file per station) and the second should contain a history metadata file (ANNEX IV). These files can be submitted via electronic mail following guidance provided by the WMO Secretariat or by a regional coordinating center. In the list of countries in ANNEX I, the responsible institutions are given for each region including an email address. In case of any question the Members are encouraged to contact WMO: [email protected].
I.3 Quality Assurance and Accessibility of WWRs
WWRs can be accessed through the World Data Centre for Meteorology, National Centers for Environmental Information (NCEI), Asheville, United States of America at https://www.ncdc.noaa.gov/wdcmet/data-access-search-viewer-tools/world-weather-records-wwr-clearinghouse. It is planned to provide access to quality-controlled WWRs within six months of the WMO’s submission deadline annually. Routine quality assurance reviews of NCEI focus on gross data problems and include format consistency checks, determination of duplication and reasonableness of submitted values and metadata.
II. METHODOLOGY FOR REPRESENTING THE WWRs
II.1 Data Elements
This document provides guidance on how to format data for submission to the current edition of WWR. As in the previous edition, the database will contain six climatic elements:
(code 2) Monthly mean station pressure
(code 3) Monthly mean sea level pressure
(code 4) Monthly mean air temperature
ANNEX, p. 4
(code 5) Total precipitation in tenths of a mm Monthly mean maximum temperature
(code 6) Mean daily maximum air temperature in tenths of a °C Monthly mean minimum temperature
(code 7) Mean daily minimum air temperature in tenths of a °C Total monthly precipitation
As practiced in recent years, monthly means of daily relative humidity can be submitted too:
(code 8) Monthly mean relative humidity.
The primary goal is to capture year-by-year, month-by-month data for each element at each station (e.g., total monthly precipitation for Geneva in January 2011, February 2011, …, December 2015+). However, station metadata are also of particular importance. At a minimum these metadata should include station name, coordinates, and elevation. Preferably, observation times, averaging formulas, instrumentation types and station changes will also be documented. WMO Members should submit data for all of their surface stations that have an official WMO station index number/WIGOS Station Identifier.
II.2 Data Format
Each WMO Member should submit the WWRs data in either Excel or text file format. This section describes the format of these files, which are similar to previous editions of WWR. There are generally two record types in these formats:
(a) Station header records documenting basic station characteristics
(b) Yearly data records with monthly and annual data for a particular year
Note that Decadal Average (MEAN) and Climate Normal (CLINO) records are no longer necessary with this data submission.
Option 1: Excel
An example of a properly formatted Excel submission is given in ANNEX II and an electronic template is provided to Members. A single Excel file should contain all stations for a given country, with a single station on each tab, and each tab containing a single station’s elements.
The first line for each station must be a station header record, which should contain the most recent information for the station. A second header record line has been added to accommodate the new WIGOS Station Identifier.
The next yearly data record section contains data for each climatic element for that station. Leave the element section blank if the station does not report that element.

ANNEX, p. 5
(a) Station Header Records
Station header records contain 15 fields documenting basic station characteristics. These characteristics should represent the most recent location of the station. Stated in tabular form, the contents include the following:
FIELD COLUMNS CONTENTS NOTES
1-2 Leave these columns blank
1A 3-7 WMO number 5-digit with leading 0 if applicable, right-justified. Leave null if new station with only WIGOS Station Identifier.
2B 8-8 Element Designator Code 1 = Station header record
3C 9-10 Degrees of latitude (0-90) Right-justified
4C 11-12 Minutes of latitude (0-59) Right-justified
5C 13-14 Seconds of latitude (if available, 0-59) Right-justified
6C 15-15 Hemisphere of latitude N (Northern) or S (Southern)
7D 16-18 Degrees of longitude (0-180) Right-justified
8D 19-20 Minutes of longitude (0-59) Right-justified
9D 21-22 Seconds of longitude (if available, 0-59) Right-justified
10D 23-23 Hemisphere of longitude E (Eastern) or W (Western)
11E 24-47 Name of country in English Left-justified
12F 48-71 Name of station in English Left-justified
13G 72-76 Height of station above sea level (whole meters)
Right-justified
14H 77-83 Height of barometer above sea level (tenths of meters)
Right-justified
L 3-33 WIGOS Station Identifier (WSI) Maximum 31 character identifier from WMO’s OSCAR system, left-justified

ANNEX, p. 6
(b) Yearly Data Records
Each yearly data record contains monthly and annual data for a particular year. These records contain 17 fields documenting the WMO number (if applicable), element type, year, monthly data values, and the annual value. Stated in tabular form, the contents include the following:
FIELD COLUMNS CONTENTS NOTES
1-2 Leave these columns blank
1A 3-7 WMO number 5-digit with leading 0 if applicable, right-justified. Leave null if new station with only WIGOS Station Identifier.
2B 8-8 Element Designator Code
2 = mean station pressure in tenths of hpa.
3 = mean sea level pressure in tenths of hpa.
4 = mean daily air temperature in tenths of a °C.
5 = total precipitation in tenths of a mm.
6 = mean daily maximum air temperature in tenths of a °C.
7 = mean daily minimum air temperature in tenths of a °C.
8 = mean of the daily relative humidity in whole percent.
3I 9-12 Year 4-digits
4J 13-13 Average Value Designator Code
Blank = Yearly data record
5K 14-18 January If a value is missing, then leave the field blank.
All values should be right-justified.
Decimal points are implied (e.g., 1014.1 hpa should be entered as “10141”).
If there is no value after the decimal, the last character should be
“0” (e.g., 1014.0 hpa should be “10140”).
If the temperature is negative, the 1st value of the field should be "-" (e.g., -13).
If precipitation is zero, the field should be "0". If there was trace precipitation, the field should be "T".
6K 19-23 February
7K 24-28 March
8K 29-33 April
9K 34-38 May
10K 39-43 June
11K 44-48 July
12K 49-53 August
13K 54-58 September
14K 59-63 October
15K 64-68 November
16K 69-73 December
17K 74-78 Annual

ANNEX, p. 7
If data are missing for an entire year, then only complete Fields 1-4A, B, I and J.
Yearly data can be provided only for the data-year in question but also for other data-years where data were not previously submitted or need to be corrected.

ANNEX, p. 8
Option 2: Text
An example of a properly formatted text file submission is given in ANNEX III and a template is provided. A single text file should contain one station containing that single station’s elements.
The first line for each station must be a station header record which should contain the most recent information for the station. A second header record line has been added to accommodate the new WIGOS Station Identifier.
The next yearly data record section contains data for each climatic element for that station. Leave the element section blank by using spaces if the station does not report that element. Do not use 9’s or -9’s or tabs to represent missing data.
(a) Station Header Records
Station header records contain 8 rows documenting basic station characteristics. These characteristics should represent the most recent location of the station.
LINE POSITION CONTENTS NOTES
1 40-44 WMO number 5-digit with leading 0 if applicable, left-justified. Leave null if new station with only WIGOS Station Identifier.
2 40-63 Name of station in English Left-justified
3 40-63 Name of country in English Left-justified
4 40-49 Latitude Degrees (0-90) Minutes (0-59) Seconds (0-59) Direction (N or S)
Left-justified, example 09 04 00N
5 40-50 Longitude Degrees (0-180) Minutes (0-59) Seconds (0-59) Direction (E or W)
Left-justified, example
000 45 59S
6 40-49 Height of station above sea level Left-justified, whole meters
7 40-49 Height of barometer above sea level Left-justified, tenths of meters, explicit decimal
8 40-70 WIGOS Station Identifier (WSI) Maximum 31 character identifier from WMO’s OSCAR system, left-justified

ANNEX, p. 9
(b) Yearly Data Records
Each yearly data record contains monthly and annual data for a particular year. These records contain 14 fields documenting the year, element type, monthly data values, and the annual value. Stated in tabular form, the contents include the following:
FIELD COLUMNS CONTENTS NOTES
1 1-4 Year 4-digits
2 6-11 January If a value is missing, then leave the field blank.
All values should be right-justified.
Decimal points should be explicitly noted except for relative humidity (which is rounded to whole percent).
If there is no value after the decimal, the last character should be “0” (e.g., 1014 hpa should be “1014.0”).
If the temperature is negative, the 1st value of the field should be "-" (e.g., -13).
If precipitation is zero, the field should be "0". If there was trace precipitation, the field should be "T".
3 13-18 February
4 20-25 March
5 27-32 April
6 34-39 May
7 41-46 June
8 48-53 July
9 55-60 August
10 62-67 September
11 69-74 October
12 76-81 November
13 83-88 December
14 90-95 Annual
If data are missing for an entire year, then only complete Field 1. If data are missing for any months, use spaces to fill (not the tab key).
Yearly data can be provided only for the data-year in question but also for other data-years where data were not previously submitted or need to be corrected.

ANNEX, p. 10
II.3 History Metadata (Station Notes)
Each WMO Member should submit one file containing all of the metadata (station notes) for all of the stations in their country. There is no required format for this information, but there is some preferred content to make the greatest possible use of the submitted climatic data. Critical content includes the times of observation, the formulas used in computing means, and the types of instrumentation. To the extent possible, this information should be specific to each climatic element. Furthermore, it is extremely helpful if historical changes are explicitly documented for all types of metadata, including observation times, averaging formulas, instrumentation types, and (changes in) basic parameters such as location and elevation. An example of station notes is given in Annex IV.

ANNEX, p. 11
Annex I: Proposed collection mechanism by region
REGION Countries (ENG) Collection mechanism Alternative
REGION I
Angola, Algeria, Benin, Botswana, Burkina Faso, Burundi, Cameroon, Canary Islands, Comoros Islands, Cape Verde, Central African Republic, Chad, Congo, Côte d'Ivoire, Democratic Republic of the Congo, Djibouti, Egypt, Eritrea, Ethiopia, Gabon, Ghana, Gambia, Guinea, Guinea Bissau, Guinea Equatorial, Kenya, Lesotho, Liberia, Libya, Madagascar, Malawi, Mali, Niger, Nigeria, Mauritania, Mauritius, Morocco, Mozambique, Namibia, the Ocean Islands (St. Helena Island, Ascension Island, Martin de Vivies, Iles Crozet, Iles Kerguelen), Rwanda, Senegal, Seychelles, Sierra Leone, Sao Tome and Principe, Somalia, South Africa, South Sudan, Sudan, Swaziland, Togo, Tunisia, Uganda, United Republic of Tanzania, Zambia, Zimbabwe
CBS Lead Center for GCOS Africa, Morocco (DMN), [email protected]
WMO, Geneva; [email protected]
REGION II
Afghanistan, Armenia, Azerbaijan, Bahrain, Brunei, Cambodia, China, India, Iran, Japan, Jordan, Kazakhstan, Kyrgyzstan, Laos, Malaysia, Maldives, Mongolia, Myanmar, Nepal, Oman, Pakistan, Philippines, Qatar, Republic of Korea, Russian Federation, Saudi Arabia, Singapore, Sri Lanka, Syria, Tajikistan, Thailand, Turkey, United Arab Emirates, Vietnam, Yemen
CBS Lead Center for GCOS Asia, Japan (JMA); [email protected]
WMO, Geneva; [email protected]
REGION III
All countries of RA III CBS Lead Center for GCOS South America, Chile (DMC); [email protected]
WMO, Geneva; [email protected]
REGION IV
All countries of RA IV CBS Lead Center for GCOS North and Central America, Caribbean, USA (NCEI); [email protected]
WMO, Geneva; [email protected]
REGION V
Countries of RA V, which are not noted under RA II
CBS Lead Center for GCOS South West Pacific, Australia (BOM); [email protected]
WMO, Geneva; [email protected]
REGION VI
Countries of RA VI, which are not noted under RA II
CBS Lead Center for GCOS Europe, Germany (DWD); [email protected]
WMO, Geneva; [email protected]

ANNEX, p. 12
Note: The above CBS Lead Centres for GCOS constitute the principle regional nodes of the WWR collection mechanism. The WMO Secretariat does not act as a node in the WWR collection mechanism. Members are requested to contact the WMO Secretariat ([email protected]) for coordination should submission problems arise.
ANNEX, p. 13
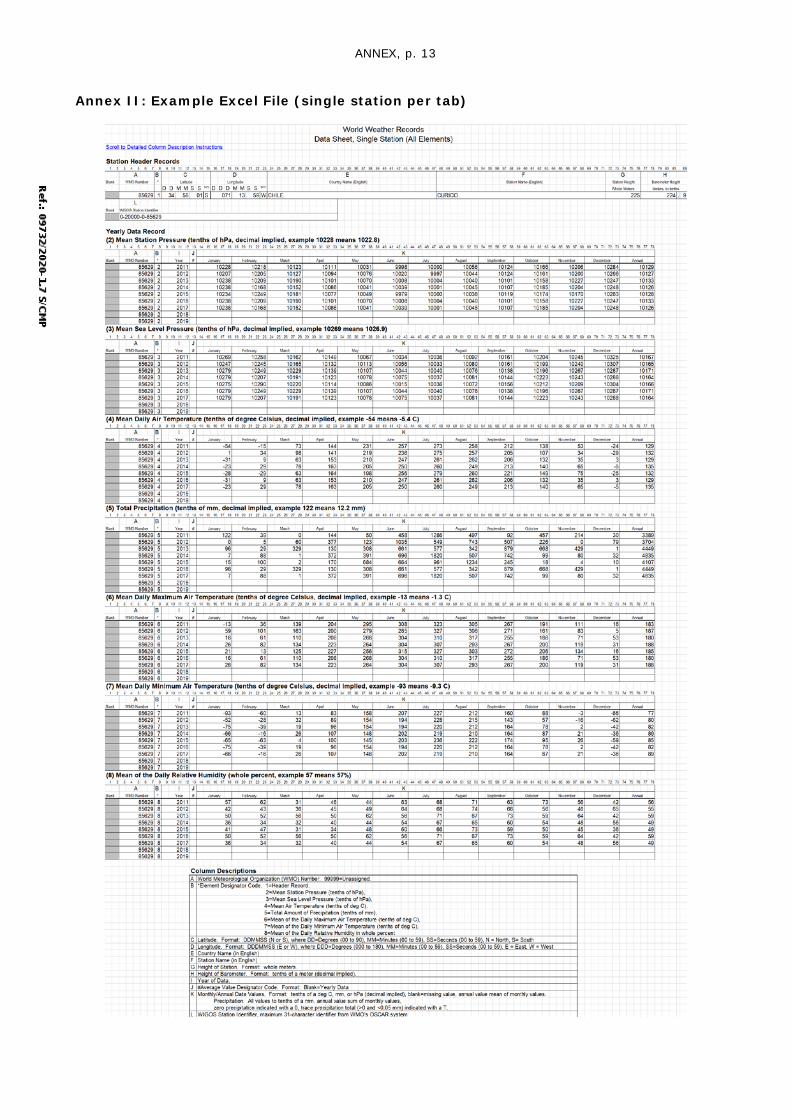
Annex II: Example Excel File (single station per tab)

ANNEX, p. 14
Annex III: Example Text File (single station per file)
WMO Number: 85629
Station Name: CURICO GENERAL FREIRE
Country Name: CHILE
Latitude (DD MM SS N/S): 34 58 00 S
Longitude (DDD MM SS E/W): 071 14 00 W
Station Height (whole meters): 228
Barometer Height (meters, to tenths): 228.0
WIGOS Station Identifier (WSI): 0-20000-0-85629
(2) Mean Station Pressure (precision to tenths of hPa)
Year Jan Feb Mar Apr May Jun Jul Aug Sep Oct Nov Dec ANNUAL
2011 989.0 986.9 989.1 989.8 990.0 993.8 993.2 992.9 993.5 991.6 989.9 988.3 990.7
2012 988.3 988.5 988.7 990.7 990.5 991.5 990.7 991.3 990.9 991.6 988.6 986.3 989.8
2013 985.2 987.3 988.3 989.5 991.4 991.2 991.9 992.9 990.1 989.1 987.8 989.3
2014 986.9 986.2 987.3 989.8 990.7 992.0 989.0 992.7 990.9 990.7 990.0 986.2 989.4
2015 987.5 986.1 986.3 990.3 990.1 990.0 991.4 992.7 990.4 989.6 988.7 988.1 989.3
2016 985.2 987.3 988.3 989.5 991.4 991.2 991.9 992.9 990.1 989.1 987.8 989.3
2017 986.9 986.2 987.3 989.8 990.7 992.0 989.0 992.7 990.9 990.7 990.0 986.2 989.4
2018
2019
(3) Mean Sea Level Pressure (precision to tenths of hPa)
Year Jan Feb Mar Apr May Jun Jul Aug Sep Oct Nov Dec ANNUAL
2011 1015.1 1012.9 1015.4 1016.5 1016.9 1021.2 1020.2 1020.6 1018.4 1016.3 1014.4 1017.4
2012 1014.3 1014.6 1015.0 1017.5 1017.7 1018.8 1017.9 1018.5 1017.8 1018.5 1015.0 1012.3 1016.5
2013 1011.0 1012.3 1013.6 1015.1 1016.7 1019.0 1018.6 1019.2 1020.0 1016.7 1015.3 1013.7 1015.9
2014 1012.8 1012.3 1016.7 1018.0 1019.5 1016.3 1020.0 1017.8 1012.3 1016.1
2015 1013.5 1012.1 1012.6 1017.3 1017.2 1017.1 1018.7 1020.1 1017.3 1016.3 1015.0 1014.2 1016.0
2016 1011.0 1012.3 1013.6 1015.1 1016.7 1019.0 1018.6 1019.2 1020.0 1016.7 1015.3 1013.7 1015.9
2017 1012.8 1012.3 1016.7 1018.0 1019.5 1016.3 1020.0 1017.8 1012.3 1016.1
2018
2019

ANNEX, p. 15
(4) Mean Daily Air Temperature (precision to tenths of degrees Celsius)
Year Jan Feb Mar Apr May Jun Jul Aug Sep Oct Nov Dec ANNUAL
2011 19.4 19.3 16.7 13.6 12.0 -7.2 7.7 8.2 9.8 12.8 15.9 18.8 13.5
2012 19.9 18.6 16.4 12.7 9.6 8.3 9.3 8.8 11.7 12.5 14.9 19.7 13.5
2013 20.5 19.1 16.1 12.2 7.9 -5.4 6.5 8.6 9.7 14.0 17.3 19.9 13.1
2014 20.3 18.2 16.4 11.4 8.3 6.1 -7.4 7.6 10.9 13.1 15.1 18.1 12.7
2015 19.3 18.6 15.8 10.6 9.6 9.6 -7.6 7.6 11.0 13.0 16.2 18.6 13.1
2016 20.5 19.1 16.1 12.2 7.9 -5.4 6.5 8.6 9.7 14.0 17.3 19.9 13.1
2017 19.3 18.6 15.8 10.6 9.6 9.6 -7.6 7.6 11.0 13.0 16.2 18.6 13.1
2018
2019
(5) Total Precipitation (precision to tenths of mm)
Year Jan Feb Mar Apr May Jun Jul Aug Sep Oct Nov Dec ANNUAL
2011 11.7 0 0 2.4 191.1 75.2 44.6 110.8 33.7 18.9 0.2 0 488.6
2012 7.0 0 37.7 14.7 168.9 408.8 208.7 115.1 186.7 43.9 2.0 0 1193.5
2013 8.3 1.0 0.3 17.5 55.9 147.9 139.7 116.0 24.9 0.4 0 0.2 512.1
2014 0 1.5 3.0 22.4 203.7 135.2 390.3 108.3 65.2 47.4 6.7 0 983.7
2015 0.3 0 29.9 25.0 127.1 26.1 126.5 6.6 46.7 71.9 0.2 0 460.3
2016 7.0 0 37.7 14.7 168.9 408.8 208.7 115.1 186.7 43.9 2.0 0 1193.5
2017 8.3 1.0 0.3 17.5 55.9 147.9 139.7 116.0 24.9 0.4 0 0.2 512.1
2018
2019
(6) Mean Daily Maximum Air Temperature (precision to tenths of degree Celsius)
Year Jan Feb Mar Apr May Jun Jul Aug Sep Oct Nov Dec ANNUAL
2011 1.3 3.6 13.9 20.4 29.5 30.8 32.3 30.5 26.7 19.1 11.1 1.6 18.2
2012 5.9 10.1 16.3 20.0 27.9 28.5 32.7 30.6 27.1 16.1 8.3 0.5 18.7
2013 1.6 6.1 11.0 20.8 26.8 30.4 31.0 31.7 25.5 18.6 7.1 5.3 18.0
2014 2.6 8.2 13.4 22.3 26.4 30.4 30.7 29.3 26.7 20.0 11.9 3.1 18.8

ANNEX, p. 16
2015 2.1 1.3 12.5 22.7 25.6 31.5 32.7 30.3 27.2 20.6 13.4 1.6 18.5
2016 1.6 6.1 11.0 20.8 26.8 30.4 31.0 31.7 25.5 18.6 7.1 5.3 18.0
2017 2.6 8.2 13.4 22.3 26.4 30.4 30.7 29.3 26.7 20.0 11.9 3.1 18.8
2018
2019
(7) Mean Daily Minimum Air Temperature (precision to tenths of degree Celsius)
Year Jan Feb Mar Apr May Jun Jul Aug Sep Oct Nov Dec ANNUAL
2011 9.3 6.0 1.3 8.3 15.8 20.7 22.7 21.2 16.0 8.8 0.3 6.6 7.7
2012 5.2 2.8 3.2 8.9 15.4 19.4 22.8 21.5 14.3 5.7 1.6 6.2 8.0
2013 1.6 6.1 11.0 20.8 26.8 30.4 31.0 31.7 25.5 18.6 7.1 5.3 18.0
2014 2.6 8.2 13.4 22.3 26.4 30.4 30.7 29.3 26.7 20.0 11.9 3.1 18.8
2015 2.1 1.3 12.5 22.7 25.6 31.5 32.7 30.3 27.2 20.6 13.4 1.6 18.5
2016 1.6 6.1 11.0 20.8 26.8 30.4 31.0 31.7 25.5 18.6 7.1 5.3 18.0
2017 2.6 8.2 13.4 22.3 26.4 30.4 30.7 29.3 26.7 20.0 11.9 3.1 18.8
2018
2019
(8) Mean Daily Relative Humidity (whole percent)
Year Jan Feb Mar Apr May Jun Jul Aug Sep Oct Nov Dec ANNUAL
2011 57 62 31 46 44 63 68 71 63 73 56 42 56
2012 19 22 29 35 41 45 46 46 42 37 28 22 34
2013 20 22 25 33 41 45 47 46 43 38 27 20 34
2014 20 22 29 31 39 45 47 46 43 38 27 18 34
2015 18 20 26 34 40 45 47 47 43 37 25 23 34
2016 20 22 25 33 41 45 47 46 43 38 27 20 34
2017 20 22 29 31 39 45 47 46 43 38 27 18 34
2018
2019

ANNEX, p. 17
Annex IV: Station Notes Example
TRINIDAD AND TOBAGO (2 stations)
General:
All observation hours were in local time. A total of 24 hourly observations per day were used in computing the means of temperature and pressure except at Crown Point. At this station, part time operation existed during June to December 1980; January 1976; 1977, and 1978; February, March, April 1976; and for February, March, and April 1978. Observation hours during these periods were 0700 to 2300 hours or 0800 to 22 hours.
At Piarco, the period of record of CLINO values for sea level pressure and temperature was 1946-1975. For precipitation it was 1946-1980. No CLINO exists for Crown Point since past records begin only in 1970.
Pressure:
Pressure was measured by a Kew Pattern barometer until 1974 after which a precision Aneroid type was used. Heights of the barometers were 13.4 meters at Piarco and 6.7 meters at Crown Point.
Temperature:
Thermometers, housed in a standard Stevenson Screen, were 1.2 meters above ground at both stations.
Precipitation:
Rainfall was measured by a pot gauge. A Tilting – Siphon rain recorder adjusted the pot gauge. Rainfall was measured four times daily at 0200, 0800, 1400, and 2000 hours local time at both stations except during part time operations at Crown Point. Heights of the rain gauges were .3 meters at Piarco, and 3 meters at Crown Point.
URUGUAY (13 stations)
General:
CLINO values correspond to the period 1951-80 for precipitation and 1946-1980 for other elements. Rain gauges and thermometers were located 1.5 meters above the ground.
Pressure and Temperature:
The monthly pressure and temperature values were both computed from the equation:
1/10(00+03+06+09+12+15+18+21 hours GMT + Mean Max + Mean Min)
Precipitation:
The daily values were measured at 0900 hours GMT. ____________