Water & air Quality Directory 2019
364
WATER & AIR QUALITY DIRECTORY 2019 KERALA STATE POLLUTION CONTROL BOARD tIcf kwØm\ aen\oIcW \nb{´W t_mÀUv Data edited and compiled by V T Sajimon Chief Environmental Scienst M.H. Sherafudeen Senior Environmental Scienst K.B. Sreeja Environmental Scienst
-
Upload
khangminh22 -
Category
Documents
-
view
1 -
download
0
Transcript of Water & air Quality Directory 2019

Water & air Quality Directory 2019
Kerala State Pollution Control Board tIc-f kwØm-\ a-en-\oI-c-W \n-b{´-W t_mÀUv
Data edited and compiled by
V T SajimonChief Environmental Scientist
M.H. SherafudeenSenior Environmental Scientist
K.B. Sreeja Environmental Scientist


Directory 2019 3
Kerala State Pollution Control Board
ktµiw
]nW-dm-bn hn-Pb³ap-Jy-a{´ntIcfw
tIc-f kwØm-\ a-en-\oI-c-W \n-b{´W t_mÀ-Uv k-w-Øm-\-¯n-sâ
P-eþhm-bp Kp-W-\n-e-hm-cw kw-_-Ôn-¨ hn-h-c-§Ä DÄ-s¸-Sp-¯n H-cp hmÀ-
jn-I U-b-dÎ-dn {]-kn-²o-I-cn-¡p-¶p F-¶-dn-ª-Xn k-t´mjw.
]-cn-Øn-Xn {]-hÀ-¯-I-À¡pw K-th-j-W hn-ZymÀ-°n-IÄ¡pw s]m-Xp-P-\-
§Ä¡pw G-sd D-]-Im-c-{]-Z-am-bn-cn-¡pw Cu U-b-d-Î-dn F-¶v {]-Xo-£n-¡p¶p.
FÃm `m-hp-I-§fpw t\-cp¶p.
]n-W-dm-bn hn-Pb³


Directory 2019 5
Kerala State Pollution Control Board
INTRODUCTIONKerala State Pollution Control Board with great pleasure is publishing the Water and Air Quality
Directory -2019, the 12th in its series, illustrating the status of water and air quality of our State. The water and Air quality data were generated by the laboratories of the Board during the year 2019 by monthly water quality monitoring and 24 hours Air quality monitoring. The data along with the location maps of various monitoring stations are presented in the directory. Details of monitoring conducted by the boardare shown below:-
1. National Water Quality Monitoring Programme (NWMP) : A total of 128 monitoring stations which include 65 stations in 42 Rivers, seven in Rivulets/ Tributaries, six in Reservoirs, Three in fresh water Lakes, eight in Estuarine lakes, Three in canals, Two in ponds and 34 station in Ground water under this programme.
2. State Water Quality Monitoring Programme (SWMP) at 129 stations in 22 rivers and 23 stations in 4 lakes.
3. National Ambient Air Quality Monitoring Programme (NAMP) at 27 stations in the state.
4. State Ambient Air Quality Monitoring (SAMP) at 8 stations in the state.
5. PM 2.5 monitoring commenced in all districts during 2019.
6. Monitoring Water Quality of Rural Water Supply Schemes.
7. Continuous Ambient Air Quality Monitoring Stations (CAAQMS) have been established one each at Thiruvananthapuram, Kollam, Kannur, Kozhikode and two stations at Ernakulam (one in commercial and one in industrial area).
The Designated Best Use (DBU) classification of the water bodies given in this directory is as per the Water Quality Criteria evolved by the CPCB. (Annexure IV). We express our sincere gratitude to the Central Pollution Control Board for their continuing co-operation and support, the Kerala State Remote sensing and Environment Centre for their valuable help for preparing the maps and the Board staff who collected samples, analyzed, consolidated and compiled the reports. Any suggestions and criticisms on how to improve the directory further would be entertained.As in the previous year, the trend analysis of Water Quality of major rivers and of Ambient Air Quality at the stations has also been presented incorporating the annual average data of 2019.We are proud to mention that the Board’s Central Laboratory at Gandhi Nagar, Cochin – 20 is an NABL accredited Laboratory as per ISO/IEC 17025:2017 by the National Accreditation Board for Testing and Calibration Laboratories for 61 parameters in the discipline of chemical and biological testing.
SREEKALA S PRof. K. P. SUDHEERMember Secretary Chairman

Directory 2019
Kerala State Pollution Control Board
6
6
CONTeNTs
1. RIVER STATIoNS1.1 Neyyar River ................................................................................................................. 131.2 Mamom River .............................................................................................................. 151.3 Ayroor River ................................................................................................................. 171.4 Karamana River ............................................................................................................ 191.5 Ithikkara River .............................................................................................................. 221.6 Vamanapuram River .................................................................................................... 251.7 Pallickal River ............................................................................................................... 271.8 Achenkovil River ........................................................................................................... 301.9 Kallada River ................................................................................................................. 341.10 Pamba River ............................................................................................................... 371.11 Meenachil River ......................................................................................................... 411.12 Manimala River .......................................................................................................... 441.13 Periyar River ............................................................................................................... 481.14 Muvattupuzha River ................................................................................................... 51 1.15 Chalakudy River ......................................................................................................... 541.16 Karuvannur River ....................................................................................................... 571.17 Puzhakkal River .......................................................................................................... 601.18 Keecheri River ............................................................................................................ 621.19 Bharathapuzha river .................................................................................................. 641.20 Kadalundi River .......................................................................................................... 681.21 Tirur River .................................................................................................................. 711.22 Chaliyar River ............................................................................................................. 741.23 Kabani River ............................................................................................................... 771.24 Bhavani River ............................................................................................................. 801.25 Kuttiyadi River ............................................................................................................ 831.26 Mahi River .................................................................................................................. 85
WATER QUALITY DATA of NATIoNAL WATER QUALITY MoNIToRING PRoGRAMME (NWMP) AND STATE WATER QUALITY MoNIToRING PRoGRAMME (SWMP) - 2019

Directory 2019 7
Kerala State Pollution Control Board
1.27 Kallai River .................................................................................................................. 871.28 Korapuzha River ......................................................................................................... 891.29 Kuppam river .............................................................................................................. 921.30 Thalassery River ......................................................................................................... 941.31 Ancharakkandy River ................................................................................................. 961.32 Ramapuram River ...................................................................................................... 991.33 Kavai River ................................................................................................................ 1011.34 Valapattanam River .................................................................................................. 1031.35 Neeleswaram River .................................................................................................. 1061.36 Kariangode River ...................................................................................................... 1081.37 Chandragiri River ..................................................................................................... 1101.38 Mogral River ............................................................................................................. 1121.39 Shiriya River ............................................................................................................. 1141.40 Uppala River ............................................................................................................. 1171.41 Manjeswaram River ................................................................................................. 1191.42 Peruvamba River ...................................................................................................... 1211.43 Thodupuzha River ..................................................................................................... 1231.44 Munnar River ............................................................................................................ 125
2. RIVULETS/TRIBUTARIES2.1 Kadambrayar .............................................................................................................. 1292.2 Chithrapuzha .............................................................................................................. 1312.3 Korayar ....................................................................................................................... 1332.4 Pullur River ................................................................................................................. 1352.5 Kalpathy Puzha ........................................................................................................... 1372.6 Maniyankode Puzha ................................................................................................... 138
3. fRESH WATER LAKES3.1 Vellayani Lake ............................................................................................................. 1413.2 Sasthamkotta Lake ..................................................................................................... 1433.3 Pookode Lake ............................................................................................................. 145
4. ESTUARINE LAKES4.1 Akkulam Lake ............................................................................................................. 1494.2 Ashtamudi Lake ........................................................................................................... 1504.3 Paravur Lake ............................................................................................................... 1514.4 Punnamada Lake ........................................................................................................ 1524.5 Vembanadu Lake ........................................................................................................ 1534.6 Kodungallur Lake ........................................................................................................ 1554.7. Kayamkulam Lake ...................................................................................................... 156
5. RESERVoIRS, PoNDS AND CANAL STATIoNS5.1 Pazhassi Reservoir ...................................................................................................... 1595.2 Edamalayar Reservoir ................................................................................................ 1605.3 Bhoothathankettu Reservoir ..................................................................................... 1615.4 Malampuzha Reservoir .............................................................................................. 1625.5 Periyar (Thekkady) Reservoir ..................................................................................... 163

Directory 2019
Kerala State Pollution Control Board
8
8
5.6 Karapuzha Reservoir .................................................................................................. 1655.7 Mananchira Pond ....................................................................................................... 1665.8 Padmatheertham Pond .............................................................................................. 1675.9 Canoli Canal ............................................................................................................... 1685.10 Palakkattuthazham Thode ....................................................................................... 1695.11 Unthithode ............................................................................................................... 170
6. WELL STATIoNS6.1 Pappanamcode .......................................................................................................... 1736.2 Nedumangad .............................................................................................................. 1746.3 Kundara ...................................................................................................................... 1756.4 KMML ......................................................................................................................... 1766.5 Kureeppuzha .............................................................................................................. 1776.6 Punalur ....................................................................................................................... 1786.7 Fathimapuram ............................................................................................................ 1796.8 Karoor ......................................................................................................................... 1806.9 Vaikom ........................................................................................................................ 1816.10 Vadavathoor ............................................................................................................. 1826.11 Cherthala .................................................................................................................. 1836.12 Sarvodayapuram ...................................................................................................... 1846.13 Vyttila ....................................................................................................................... 1856.14 Edayar ...................................................................................................................... 1866.15 Brahmapuram .......................................................................................................... 1876.16 Eloor ......................................................................................................................... 1886.17 Kalamassery ............................................................................................................. 1896.18 Poonkunnam ............................................................................................................ 1906.19 Laloor ....................................................................................................................... 1916.20 Ollur ......................................................................................................................... 1926.21 Karukamani .............................................................................................................. 1936.22 Malappuram ............................................................................................................ 1946.23 Manjeri ..................................................................................................................... 1956.24 Chungappally ........................................................................................................... 1966.25 Mavoor ..................................................................................................................... 1976.26 Vellippararamba ....................................................................................................... 1986.27 Kannur ...................................................................................................................... 1996.28 Karimbam ................................................................................................................. 2006.29 Parassinikkadavu ...................................................................................................... 2016.30 Payyannur-1 ............................................................................................................. 2026.31 Payyannur-2 ............................................................................................................. 2036.32 Punnelpettippalam .................................................................................................. 2046.33 Ambalamugal Bore well ............................................................................................ 2056.34 Chelora Trenching ground ........................................................................................ 206
7. GENERAL TREND ANALYSIS of SELECTED RIVER STATIoNS (2012-2019)7.1 Achenkovil River ......................................................................................................... 2097.2 Bharathapuzha ........................................................................................................... 2117.3 Chalakudy River ......................................................................................................... 213

Directory 2019 9
Kerala State Pollution Control Board
7.4 Chaliyar River ............................................................................................................. 2147.5 Chandragiri River ....................................................................................................... 2167.6 Kadalundi River .......................................................................................................... 2177.7 Kallada River ............................................................................................................... 2197.8 Muvattupuzha River ................................................................................................... 2207.9 Pamba river ................................................................................................................ 2217.10 Periyar River ............................................................................................................. 2247.11 Karamana at Moonnattumukku .............................................................................. 231
8. WATER QUALITY (APRIL) DATA-2019 ....................................................................... 235
9. RURAL WATER SUPPLY SCHEMES QUALITY of SoURCE WATER ............................249
10. GENERAL EVALUATIoN oN WATER QUALITY 2019 ................................................. 270
11. AMBIENT AIR QUALITY DATA-2019 & TREND ANALYSIS 2010-2019 11.1 Thiruvananthapuram ............................................................................................... 27411.2 Kollam ...................................................................................................................... 28211.3 Pathanamthitta ........................................................................................................ 28611.4 Alappuzha ................................................................................................................ 29011.5 Kottayam .................................................................................................................. 29411.6 Idukki ........................................................................................................................ 29811.7 Ernakulam ................................................................................................................ 30011.8 Thrissur .................................................................................................................... 31611.9 Palakkad ................................................................................................................... 32011.10 Malappuram .......................................................................................................... 32211.11 Kozhikkode ............................................................................................................. 32411.12 Wayanad ................................................................................................................ 32811.13 Kannur .................................................................................................................... 33211.14 Kasaragod ............................................................................................................... 336
12. GENERAL EVALUATIoN oN AIR QUALITY 2019 ...................................................... 340
13. BoARD’S LABoRAToRIES ......................................................................................... 341
14. CoNCLUSIoN ........................................................................................................... 347
Annexure-I. National Water Quality Monitoring programme Network-2019 ................ 348
Annexure II. State Water Quality Monitoring programme Network-2019 ...................... 351
Annexure-III. Geographical Coordinates of River Stations (NWMP & SWMP) 2019 ...... 355
Annexure-IV. Water quality criteria (CPCB) ..................................................................... 361
Annexure-V. National Ambient Air Quality Standards (NAAQS) ...................................... 362
Annexure-VI. Parameters,Units and Methods ................................................................. 363
Annexure-VII. Abbreviations ............................................................................................ 364

Directory 2019
Kerala State Pollution Control Board
10
10

Directory 2019 11
Kerala State Pollution Control Board
1111
RiveR StationS

Directory 2019
Kerala State Pollution Control Board
12
12
12

Directory 2019 13
Kerala State Pollution Control Board
12 13

Directory 2019
Kerala State Pollution Control Board
14
14
1.1 Neyyar River
The Neyyar River originates from the Western Ghats at Agasythyakoodam. The river flows through Neyyattinkara Taluk and joins the Lakshadweep Sea at Poovar near Kovalam after travelling a distance of 56 km. Neyyar Irrigation Project is situated in this river. Two stations functioning in this river are Amaravila (Amaravila bridge) on Thiruvananthapuram-Kanyakumari Highway (NH 47) and Aruvippuram (Aruvippuram bathing ghat).
2019 NEYYAR RIVER
River Stations pH EC µmhos/cm
DOmg/l
BODmg/l
TC MPN/100ml
FC MPN/100ml CLASS*
Aruvippuram2284 NWMP
Max 7.6 147 7.1 6.5 920 480
DMin 6.1 92 4.1 0.4 200 100
Mean 6.7 124 6.2 3.5 517 216
Std. Dev 0.4 18.06 0.9 2.2 209.47 148.54
Amaravila 1563 NWMP
Max 7.3 157 7.0 3.9 1500 600
CMin 6.0 80 3.6 0.1 400 100
Mean 6.7 118 5.9 1.6 836 256
Std. Dev 0.5 25.94 1.0 1.3 331.57 149.94
*See Annexure IV
2284 1563Pre-monsoon 6.7 6.6Monsoon 6.7 6.6Post-monsoon 6.7 6.9
6.456.5
6.556.6
6.656.7
6.756.8
6.856.9
6.95
Var
iati
on in
pH
pH
2284 1563Pre-monsoon 139 131Monsoon 113 97Post-monsoon 112 123
020406080
100120140160
Var
iati
on in
EC
Electrical Conductivity, µmhos/cm
2284 1563Pre-monsoon 6.2 5.3Monsoon 6.2 6.4Post-monsoon 6.3 6.4
0
1
2
3
4
5
6
7
Var
iati
on in
Do
Dissolved oxygen, mg/l
2284 1563Pre-monsoon 5.1 0.9Monsoon 3.2 2.6Post-monsoon 1.3 1.6
0
1
2
3
4
5
6
Var
iati
on in
Bo
D
Biological oxygen Demand, mg/l
2284 1563Pre-monsoon 556 760Monsoon 458 955Post-monsoon 530 803
0
200
400
600
800
1000
1200
Var
iati
on in
TC
Total Coliform, MPN/100ml
Season PeriodPre monsoon January-May
Monsoon June-SeptemberPost Monsoon October-December

Directory 2019 15
Kerala State Pollution Control Board

Directory 2019
Kerala State Pollution Control Board
16
16
1.2 Mamom River
The Mamom River originates from Panthalakuttu Hills at Vembayam. It flows through Attingal town and joins Anchuthengu kayal at Chirayinkeezhu after travelling a distance of 27 km. Sampling station of this river is located at Mamom Bridge on Thiruvananthapuram-Kollam National Highway.
2019 MAMOM RIVER
River Stations pH EC µmhos/cm
DO mg/l
BOD mg/l
TC MPN/100ml
FC MPN/100ml CLASS*
Mamom2285 NWMP
Max 7.8 189 7.4 4.6 2500 910
CMin 6.1 102 4.1 0.5 200 100
Mean 6.7 140 5.6 2.7 1220 502
Std. Dev 0.4 29.39 1.1 1.4 763.06 332.73
*See Annexure IV
2285Pre-monsoon 6.9Monsoon 6.6Post-monsoon 6.5
6.3
6.4
6.5
6.6
6.7
6.8
6.9
Var
iati
on
in
pH
pH
2285Pre-monsoon 133Monsoon 125Post-monsoon 174
020406080
100120140160180200
Var
iati
on
in
EC
Electrical Conductivity, µmhos/cm
2285Pre-monsoon 5.6Monsoon 5.3Post-monsoon 6.1
4.85.05.25.45.65.86.06.2
Var
iati
on
in
Do
Dissolved oxygen, mg/l
2285Pre-monsoon 3.8Monsoon 2.4Post-monsoon 1.6
0.00.51.01.52.02.53.03.54.0
Var
iati
on
in
Bo
D
Biological oxygen Demand, mg/l
2285Pre-monsoon 1780Monsoon 935Post-monsoon 667
0200400600800
100012001400160018002000
Var
iati
on
in
TC
Total Coliform, MPN/100ml
Season PeriodPre monsoon January-May
Monsoon June-SeptemberPost Monsoon October-December

Directory 2019 17
Kerala State Pollution Control Board

Directory 2019
Kerala State Pollution Control Board
18
18
1.3 Ayroor River
The Ayroor River originates from Navayikulam and culminates at Edava-Nadayara kayal after travelling a distance of 17 km. Important town located nearby this river is Varkala. The sampling location is at Ayroor Bridge in Elakamom panchayath
2019 AYROOR RIVER
River Stations pH EC µmhos/cm
DO mg/l
BOD mg/l
TC MPN/100ml
FC MPN/100ml CLASS*
Ayroor2286 NWMP
Max 7.7 179 6.4 5.5 1200 310
CMin 5.9 100 1.5 1 310 100
Mean 6.7 141 5.0 2.9 807 199
Std. Dev 0.5 26.55 1.6 1.5 253.64 82.4
*See Annexure IV
2286Pre-monsoon 6.6Monsoon 6.8Post-monsoon 6.6
6.5
6.6
6.6
6.7
6.7
6.8
6.8
Var
iati
on in
pH
pH
2286Pre-monsoon 156Monsoon 131Post-monsoon 131
115120125130135140145150155160
Var
iati
on in
EC
Electrical Conductivity, µmhos/cm
2286Pre-monsoon 4.4Monsoon 4.8Post-monsoon 6.2
0.01.02.03.04.05.06.07.0
Var
iati
on in
Do
Dissolved oxygen, mg/l
2286Pre-monsoon 4.2Monsoon 1.5Post-monsoon 2.6
0.00.51.01.52.02.53.03.54.04.5
Var
iati
on in
Bo
D
Biological oxygen Demand, mg/l
2286Pre-monsoon 968Monsoon 608Post-monsoon 803
0
200
400
600
800
1000
1200
Var
iati
on in
TC
Total Coliform, MPN/100ml
Season PeriodPre monsoon January-May
Monsoon June-SeptemberPost Monsoon October-December

Directory 2019 19
Kerala State Pollution Control Board

Directory 2019
Kerala State Pollution Control Board
20
20
1.4 Karamana River
The Karamana River flows entirely through Thiruvananthapuram District. This River originates from the Western Ghats at Agasthyakoodam is the main water supply source of Thiruvananthapuram city and Nedumangad town. Two dams are constructed across this river at Peppara and Aruvikkara. Moonattumukku is located near the point where T.S. canal (Parvathy Puthanar) meets Karamana River. The major canals in Thiruvananthapuram city such as Vanchiyoor, Ulloor and Amayizhanjan empty into this canal. The main tributary of Karamana River is Killiyar which joins the river at Pallathukadavu. NWMP sampling stations are located at Aruvikkara and Moonattumukku and SWMP sampling stations include Peppara, Thiruvallom, Mangattukadavu and Pallathukadavu
2019 KARAMANA RIVER
River Stations pH EC µmhos/cm
DO mg/l
BOD mg/l
TC MPN/100ml
FC MPN/100ml CLASS*
Peppara K1 SWMP
Max 7.4 94 7.9 5.5 500 200
BMin 6.1 14 4.5 0.8 100 80
Mean 6.7 64 6.1 2.5 283 107
Std. Dev 0.4 24.91 0.9 1.7 126.73 29.95
Aruvikkara3471 NWMP
Max 7.3 186 7.7 4.3 600 500
BMin 6.0 70 5.0 1.1 180 79
Mean 6.6 110 6.4 2.7 331 139
Std. Dev 0.4 30.43 0.7 1.1 144.75 117.63
MangattukadavuK2 SWMP
Max 7.7 135 6.9 4.9 2000 900
CMin 5.9 11 4.3 1.3 400 200
Mean 6.5 76 5.8 2.9 1233 408
Std. Dev 0.5 39.82 0.9 1.4 521.07 250.3
PallathukadavuK3 SWMP
Max 7.5 176 5.9 8.2 5000 3000
EMin 6.5 53 0.8 0.2 800 500
Mean 6.8 103 3.6 2.8 1558 867
Std. Dev 0.3 36.31 2.0 2.4 1157.16 697.18

Directory 2019 21
Kerala State Pollution Control Board
ThiruvallomK4 SWMP
Max 7.3 734 2.6 18.0 10000 4800
EMin 3.9 179 0.0 1.1 4000 600
Mean 6.5 322 1.1 8.1 5608 1942
Std. Dev 0.9 151.48 1.0 4.8 1856.42 1210.15
Moonnattumukku1155 NWMP
Max 7.2 935 2.8 10.2 410000 190000
EMin 6.4 405 0.1 2.9 8100 3100
Mean 6.7 592 1.0 6.3 58042 23217
Std. Dev 0.3 142.6 0.8 2.3 112243.3 52785.41
*See Annexure IV
K1 3471 K2 K3 K4 1155Pre-monsoon 6.5 6.3 6.4 6.7 6.6 6.6Monsoon 6.6 6.7 6.5 6.7 6.8 6.9Post-monsoon 7 6.9 6.7 6.9 5.7 6.6
012345678
Var
iati
on in
pH
pH
K1 3471 K2 K3 K4 1155Pre-monsoon 70 110 91 100 298 621Monsoon 47 130 42 126 388 611Post-monsoon 78 81 79 77 272 518
0100200300400500600700
Var
iati
on in
EC
Electrical Conductivity, µmhos/cm
K1 3471 K2 K3 K4 1155Pre-monsoon 6 6.1 5.7 4.8 1.9 1Monsoon 5.7 6.3 5.6 1.8 1.1 1.7Post-monsoon 6.7 7 6.2 4.1 0 0.1
012345678
Var
iati
on in
Do
Dissolved oxygen, mg/l
K1 3471 K2 K3 K4 1155Pre-monsoon 2.2 2.3 2.8 3.6 8.4 7.4Monsoon 2.7 3.2 2.6 1.8 4.8 5.3Post-monsoon 2.8 2.4 3.6 2.7 11.8 5.9
02468
101214
Var
iati
on in
Bo
D
Biological oxygen Demand, mg/l
K1 3471 K2 K3 K4 1155Pre-monsoon 380 222 1600 2060 4420 116000Monsoon 200 413 875 1150 7825 20125Post-monsoon 233.3 403 1100 1266.7 4633.3 12000
020000400006000080000
100000120000140000
Var
iati
on in
TC
Total Coliform, MPN/100ml
Season PeriodPre monsoon January-May
Monsoon June-SeptemberPost Monsoon October-December

Directory 2019
Kerala State Pollution Control Board
22
22

Directory 2019 23
Kerala State Pollution Control Board
The Ithikkara River originates from Ponmudi Hills in Thiruvanthapuram district. This river with a length of about 56 km flows through Kollam District and finally enters the Paravur Kayal. Ithikkara Village is located near the river stretch which is 15 km from Kollam and 2 km from Chathanoor. NWMP Sampling stations of Ithikkara River are located at Ithikkara (Ithikkara Bridge) and Ayoor and SWMP sampling stations include Kottuvamukku, Vellinalloor and Uppukadavu.
1.5 Ithikkara River
2019 ITHIKKARA RIVER
River Stations pH EC µmhos/cm
DO mg/l
BOD mg/l
TC MPN/100ml
FC MPN/100ml CLASS*
KottuvamukkuK5 SWMP
Max 7.9 220 7.6 2.3 680 210
BMin 6.8 99 5.8 0.8 280 90
Mean 7.4 140 6.8 1.4 407 148
Std. Dev 0.3 41 0.5 0.4 104.65 44.95
Ayoor 1564 NWMP
Max 7.6 130 6.9 2.1 410 210
BMin 7.0 118 6.0 1.2 170 70
Mean 7.2 125 6.5 1.7 278 127
Std. Dev 0.2 4.13 0.3 0.3 75.54 45.62
Vellinalloor K6 SWMP
Max 7.6 265 7.4 12.0 760 340
CMin 6.5 98 6.1 1.1 310 100
Mean 7.1 138 6.7 2.5 513 183
Std. Dev 0.3 48.93 0.4 3.0 143.93 76.55
Ithikkara 2287 NWMP
Max 7.8 9890 6.8 2.1 490 280
Below EMin 6.8 9140 5.9 1.4 260 91
Mean 7.4 9520 6.3 1.7 377 167
Std. Dev 0.3 312.56 0.3 0.2 85.53 61.58
UppukadavuK7 SWMP
Max 8.1 8760 6.9 2.2 810 320
BelowE Min 6.8 1540 5.2 1.0 310 100
Mean 7.2 4257 6.1 1.7 575 198
Std. Dev 0.3 2412.17 0.6 0.4 168.33 78.18
*See Annexure IV

Directory 2019
Kerala State Pollution Control Board
24
24
K5 1564 K6 2287 K7Pre-monsoon 7.2 7.3 7.2 7.2 7.2Monsoon 7.5 7.2 7.0 7.4 7.1Post-monsoon 7.7 7.2 7.2 7.5 7.5
6.46.66.87.07.27.47.67.8
Var
iati
on in
pH
pH
K5 1564 K6 2287 K7Pre-monsoon 6.6 6.4 6.4 6.2 5.7Monsoon 7.2 6.5 7.0 6.2 6.3Post-monsoon 6.7 6.8 6.6 6.7 6.5
0.01.02.03.04.05.06.07.08.0
Var
iati
on in
Do
Dissolved oxygen, mg/l
K5 1564 K6 2287 K7Pre-monsoon 112 124 116 9861 5771Monsoon 148 128 153 9355 4021Post-monsoon 176 122 157 9169 2047
0
2000
4000
6000
8000
10000
12000
Var
iati
on in
EC
Electrical Conductivity, µmhos/cm
K5 1564 K6 2287 K7Pre-monsoon 1.5 1.8 1.4 1.9 1.2Monsoon 1.3 1.8 4.3 1.5 1.9Post-monsoon 1.5 1.3 1.9 1.7 2.0
0.00.51.01.52.02.53.03.54.04.55.0
Var
iati
on in
Bo
D
Biological oxygen Demand, mg/l
K5 1564 K6 2287 K7Pre-monsoon 340 330 552 448 690Monsoon 490 283 588 373 448Post-monsoon 407 187 350 263 553
0100200300400500600700800
Var
iati
on in
TC
Total Coliform, MPN/100ml
Season PeriodPre monsoon January-May
Monsoon June-SeptemberPost Monsoon October-December

Directory 2019 25
Kerala State Pollution Control Board

Directory 2019
Kerala State Pollution Control Board
26
26
1.6 Vamanapuram River
The Vamanapuram River originates from Chemunjimotta Hills in the Western Ghats. It flows through Vamanapuram Village and finally ends at Anchuthengu after flowing a distance of 88 km. Vamanapuram River is the major drinking water source of Vamanapuram Village. The sampling station is located at Vamanapuram bridge on the MC Road.
2019 VAMANAPURAM RIVER
River Stations pH EC µmhos/cm
DO mg/l
BOD mg/l
TC MPN/100ml
FC MPN/100ml CLASS*
Vamanapuram1442 NWMP
Max 7.8 223 7.4 6.3 2600 940
CMin 6.2 75 3.1 0.4 400 100
Mean 6.7 143 5.6 2.8 1211 376
Std. Dev 0.4 52.26 1.2 1.6 730.71 299.35
*See Annexure- IV
1442Pre-monsoon 6.6Monsoon 7.0Post-monsoon 6.7
6.46.56.66.76.86.97.07.1
Var
iati
on
in
pH
pH
1442Pre-monsoon 190Monsoon 98Post-monsoon 125
020406080
100120140160180200
Var
iati
on
in
EC
Electrical Conductivity, µmhos/cm
1442Pre-monsoon 4.6Monsoon 6.0Post-monsoon 6.5
0.01.02.03.04.05.06.07.0
Var
iati
on
in
Do
Dissolved oxygen, mg/l
1442Pre-monsoon 2.5Monsoon 3.7Post-monsoon 2.0
0.00.51.01.52.02.53.03.54.0
Var
iati
on
in
Bo
D
Biological oxygen Demand, mg/l
1442Pre-monsoon 1738Monsoon 880Post-monsoon 773
0200400600800
100012001400160018002000
Var
iati
on
in
TC
Total Coliform, MPN/100ml
Season PeriodPre monsoon January-May
Monsoon June-SeptemberPost Monsoon October-December

Directory 2019 27
Kerala State Pollution Control Board

Directory 2019
Kerala State Pollution Control Board
28
28
1.7 Pallickal River
The Pallickal River, having a length of about 42 km, flows through Kollam District. The NWMP station is located at Nellimugal. The nearest town is Karunagappally. Selected SWMP stations are Adoor and Thodiyoor.

Directory 2019 29
Kerala State Pollution Control Board
2019 PALLICKAL RIVER
River Stations pH EC µmhos/cm
DO mg/l
BOD mg/l
TC MPN/100ml
FC MPN/100ml CLASS*
Nellimugal2288 NWMP
Max 7.2 132 7.1 2.2 480 260
BMin 6.5 83 6.0 1.2 100 60
Mean 6.8 122 6.5 1.8 333 158
Std. Dev 0.2 12.68 0.4 0.3 99.12 62.06
AdoorK8 SWMP
Max 7.6 218 7.3 1.7 760 300
CMin 6.4 98 5.4 0.9 290 100
Mean 7.0 146 6.6 1.4 575 163
Std. Dev 0.3 32.61 0.6 0.2 136.15 57.1
ThodiyoorK9 SWMP
Max 7.5 198 6.7 2.0 960 230
CMin 6.8 110 5.1 1.1 290 70
Mean 7.2 144 5.7 1.6 619 155
Std. Dev 0.2 23.37 0.5 0.3 209.65 46.02
*See Annexure IV
2288 K8 K9Pre-monsoon 6.7 7.2 7.2Monsoon 6.8 6.8 7.2Post-monsoon 7.1 7.1 7.3
6.36.46.56.66.76.86.97.07.17.27.37.4
Varia
tion
in p
H
pH
2288 K8 K9Pre-monsoon 6.2 6.0 5.8Monsoon 6.6 7.2 5.5Post-monsoon 7 6.9 5.6
0.01.02.03.04.05.06.07.08.0
Varia
tion
in D
o
Dissolved oxygen, mg/l
2288 K8 K9Pre-monsoon 116 147 139Monsoon 128 149 144Post-monsoon 124 141 152
020406080
100120140160
Varia
tion
in E
C
Electrical Conductivity, µmhos/cm
2288 K8 K9Pre-monsoon 2.0 1.4 1.4Monsoon 1.8 1.4 1.8Post-monsoon 1.4 1.5 1.8
0.0
0.5
1.0
1.5
2.0
2.5
Varia
tion
in B
oD
Biological oxygen Demand, mg/l
2288 K8 K9Pre-monsoon 360 542 582Monsoon 345 685 842.5Post-monsoon 273 483 383
0100200300400500600700800900
Varia
tion
in T
C
Total Coliform, MPN/100ml
Season PeriodPre monsoon January-May
Monsoon June-SeptemberPost Monsoon October-December

Directory 2019
Kerala State Pollution Control Board
30
30

Directory 2019 31
Kerala State Pollution Control Board
1.8 Achenkovil River
The Achenkovil River is formed by the confluence of Kallar and several small streams originating from the Western Ghats. It is flowing through Kollam, Pathanamthitta and Alappuzha districts. The river travels a distance of nearly 128 km and finally joins the Pamba river at Veeyupuram village near Mavelikkara (Alappuzha District). The NWMP sampling stations are located at Kallarakadavu, Thumpamon, Pandalam and Chennithala. SWMP stations include Aruvapulam, Konni, Kumpazha, Pandalam, Pallipad.

Directory 2019
Kerala State Pollution Control Board
32
32
2019 ACHENKOVIL RIVER
River Stations pH EC µmhos/cm
DO mg/l
BOD mg/l
TC MPN/100ml
FC MPN/100ml CLASS*
AruvapulamK10 SWMP
Max 7.7 139 7.5 1.9 600 280
BMin 6.6 61 6.2 0.5 380 110
Mean 7.2 97 6.8 1.5 500 170
Std. Dev 0.3 25.25 0.4 0.4 83.5 60.9
KonniK11 SWMP
Max 7.6 130 7.4 1.7 690 480
BMin 6.7 66 4.6 0.9 320 90
Mean 7.2 94 6.5 1.3 763 152
Std. Dev 0.3 23.27 0.9 0.3 100.37 107.01
KumpazhaK12 SWMP
Max 7.8 137 7.1 2.2 720 510
BMin 6.5 47 5.4 0.8 290 110
Mean 7.3 99 6.6 1.6 500 180
Std. Dev 0.4 29.7 0.5 0.5 129.16 111.03
Kallarakadavu3465 NWMP
Max 7.3 128 7.4 2.8 630 480
BMin 6.0 102 6.0 1.6 310 130
Mean 6.9 118 6.7 1.9 400 23
Std. Dev 0.4 6.26 0.5 0.3 90.75 97.53
Thumpamon 1342 NWMP
Max 7.3 134 6.5 2.4 480 280
BMin 6.5 114 5.3 1.6 170 70
Mean 6.9 125 5.9 2.0 318 162
Std. Dev 0.3 5.56 0.4 0.2 110.44 67.95
Pandalam3466 NWMP
Max 7.4 124 7.2 2.4 630 410
BMin 6.5 102 5.4 1.6 260 130
Mean 7.1 119 6.3 1.9 464 265
Std. Dev 0.3 6.46 0.6 0.2 125.8 98.12
Pallipad K13 SWMP
Max 8.2 153 6.8 2.3 950 240
BMin 6.8 49 4.8 0.9 320 100
Mean 7.5 116 5.8 1.7 488 158
Std. Dev 0.4 31.76 0.7 0.4 161.46 49.01
Chennithala1443 NWMP
Max 7.1 132 6.3 2.6 540 320
BMin 6.0 116 5.1 1.6 220 100
Mean 6.7 124 5.6 2.1 379 211
Std. Dev 0.3 5.18 0.4 0.3 90.9 78.33
*See Annexure IV

Directory 2019 33
Kerala State Pollution Control Board
K10 K11 K12 3465 1342 3466 K13 1443Pre-monsoon 7.3 7.1 7.3 6.8 6.9 6.9 7.8 6.5Monsoon 7.2 7.4 7.3 6.9 6.9 7.2 7.0 6.7Post-monsoon 7.1 7.2 7.4 7.2 7.1 7.4 7.7 7.0
5.86.06.26.46.66.87.07.27.47.67.88.0
Var
iati
on in
pH
pH
K10 K11 K12 3465 1342 3466 k13 1443Pre-monsoon 7.1 6.2 6.4 6.3 5.6 5.8 5.1 5.3Monsoon 6.7 6.5 6.6 6.9 5.8 6.5 6.0 5.6Post-monsoon 6.5 7.1 6.7 7.3 6.4 7.1 6.7 6.2
0.01.02.03.04.05.06.07.08.0
Var
iati
on in
Do
Dissolved oxygen, mg/l
K10 K11 K12 3465 1342 3466 k13 1443Pre-monsoon 86 81 90 118 126 116 123 122Monsoon 88 83 82 120 127 120 85 128Post-monsoon 126 129 136 117 121 123 145 120
020406080
100120140160
Var
iati
on in
EC
Electrical Conductivity, µmhos/cm
K10 K11 K12 3465 1342 3466 k13 1443Pre-monsoon 1.1 1.1 1.3 2.0 2.2 2.1 1.4 2.0Monsoon 1.7 1.4 1.6 2.1 1.8 1.9 2.0 2.2Post-monsoon 1.8 1.6 2.2 1.7 1.8 1.8 2.0 2.2
0.0
0.5
1.0
1.5
2.0
2.5
Var
iati
on in
Bo
D
Biological oxygen Demand,mg/l
K10 K11 K12 3465 1342 3466 k13 1443Pre-monsoon 452 484 442 414 396 588 442 430Monsoon 545 443 495 435 323 420 533 398Post-monsoon 523 453 607 330 183 317 507 270
0100200300400500600700
Var
iati
on in
TC
Total Coliform, MPN/100ml
Season PeriodPre monsoon January-May
Monsoon June-SeptemberPost Monsoon October-December

Directory 2019
Kerala State Pollution Control Board
34
34

Directory 2019 35
Kerala State Pollution Control Board
1.9 Kallada River
The Kallada River originates from the Kulathuppuzha section of Western Ghats and merges with Ashtamudi Lake. It flows entirely through Kollam district. Perumthottamkadavu is the only NWMP station selected in this river which is near Punalur Paper Mills, Punalur. The major utility of this river is for irrigation. The SWMP sampling stations located are Kannamkottukadavu, Urukunnu, Punalur, Pathanapuram and Enath.
2019 Kallada River
River Stations pH EC µmhos/cm
DO mg/l
BOD mg/l
TC MPN/100ml
FC MPN/100ml CLASS*
Urukunnu K14 SWMP
Max 7.8 266 7.2 1.7 770 270
CMin 6.8 51 6.1 1.3 310 110
Mean 7.2 115 6.5 1.5 518 183
Std. Dev 0.3 69.34 0.4 0.1 147.59 52.45
Punalur K15 SWMP
Max 7.5 175 7.1 2.0 870 310
CMin 6.8 65 6.1 1.2 310 100
Mean 7.1 106 6.8 1.5 514 178
Std. Dev 0.3 34.62 0.3 0.2 171.28 61.18
Perumthottakadavu 0042 NWMP
Max 7.4 118 7.1 2.1 470 280
BMin 6.5 104 6.2 1.2 210 82
Mean 7.0 114 6.7 1.6 328 181
Std. Dev 0.3 4.13 0.3 0.3 83.1 67.75
Pathanapuram K16 SWMP
Max 7.6 112 7.3 1.9 660 210
BMin 6.9 68 6.1 0.9 360 110
Mean 7.3 90 6.6 1.5 483 138
Std. Dev 0.3 13.81 0.4 0.3 102.01 37.2
Enathu K17 SWMP
Max 7.6 112 7.3 2.2 820 230
BMin 6.8 66 5.3 1.3 110 80
Mean 7.2 87 6.7 1.6 432 154
Std. Dev 0.3 12.33 0.6 0.2 176.73 52.82

Directory 2019
Kerala State Pollution Control Board
36
36
Kannankottukadavu K18 SWMP
Max 7.8 14320 7.1 2.7 820 240
EMin 6.4 7678 5.2 1.6 270 80
Mean 7.2 10665 6.4 2.2 452 141
Std. Dev 0.4 2438.75 0.5 0.4 157.28 53.36
*See Annexure IV
K14 K15 42 K16 K17 K18Pre-monsoon 7.1 7.1 6.9 7.2 7.0 7.3Monsoon 7.3 6.9 7.0 7.3 7.3 7.4Post-monsoon 7.4 7.0 7.3 7.6 7.3 6.9
6.46.66.87.07.27.47.67.8
Var
iati
on in
pH
pH
K14 K15 42 k16 k17 k18Pre-monsoon 6.7 6.5 6.5 6.9 6.2 6.1Monsoon 6.4 7.0 6.8 6.6 7.2 6.5Post-monsoon 6.4 6.8 7.0 6.2 7.0 6.5
5.65.86.06.26.46.66.87.07.27.4
Var
iati
on in
Do
Dissolved oxygen, mg/l
K14 K15 42 K16 K17 K18Pre-monsoon 69 78 112 76 78 13294Monsoon 99 104 115 99 91 8790Post-monsoon 213 154 116 101 99 8782
02000400060008000
100001200014000
Vra
iati
on in
EC
Electrical Conductivity, µmhos/cm
K14 K15 42 K16 K17 K18Pre-monsoon 1.5 1.7 1.8 1.4 1.6 2.1Monsoon 1.4 1.3 1.6 1.7 1.7 2.1Post-monsoon 1.6 1.5 1.3 1.4 1.5 2.5
0.0
0.5
1.0
1.5
2.0
2.5
3.0
Var
iati
on in
Bo
D
Biological oxygen Demand, mg/l
K14 K15 42 K16 K17 K18Pre-monsoon 442 454 394 444 388 470Monsoon 475 668 325 533 548 450Post-monsoon 700 410 223 483 350 427
0100200300400500600700800
Var
iati
on in
TC
Total Coliform, MPN/100ml
Season PeriodPre monsoon January-May
Monsoon June-SeptemberPost Monsoon October-December

Directory 2019 37
Kerala State Pollution Control Board

Directory 2019
Kerala State Pollution Control Board
38
38
1.10 Pamba River
The Pamba River originates from the Pulachi Malai Hills of the Peerumedu Plateau in the Western Ghats. It flows through Ranni, Pathanamthitta, Thiruvalla, Chenganoor, Kuttanadu, Ambalappuzha and finally reaches Vembanadu lake. The NWMP river stations are located at Pamba Down in Parumala, Chengannoor (Chengannoor Town) and Thakazhy (Near Thakazhy Bridge). SWMP sampling stations include Pulinkunnu, Edatua, Kozhencherry, Ranni, Athikayam, Vadasserikkara, Pamba U/S, Kakkiyar, Kochupamba, Njunagar.
2019 PAMBA RIVER
River Stations pH EC µmhos/cm
DOmg/l
BODmg/l
TC MPN/100ml
FC MPN/100ml CLASS*
Kochupampa K19 SWMP
Max 7.5 85 7.8 1.9 9000 7500
CMin 6.3 33 5.9 0.5 980 680
Mean 6.9 49 7.1 0.9 1792 1476
Std. Dev 0.3 17.8 0.6 0.4 2285.6 1915.31
Kakkiyar K20 SWMP
Max 8.0 373 7.9 3.0 69000 37500
DMin 7.0 169 4.9 0.5 990 760
Mean 7.1 241 6.9 1.2 7012 4089
Std. Dev 0.4 75.73 0.9 0.7 19528.23 10532.9
Triveni Upstream K21 SWMP
Max 8.0 90 7.8 1.7 78000 42500
DMin 7.0 46 6.1 0.2 430 210
Mean 7.3 65 6.9 0.9 8136 4846
Std. Dev 0.3 13.94 0.5 0.5 22132.61 12094.22
Njunagar K22 SWMP
Max 7.1 374 7.6 11.8 82000 62500
DMin 6.4 40 1.2 0.7 1185 740
Mean 6.7 141 5.7 2.1 8703 6753
Std. Dev 0.3 113.88 1.8 3.1 23176.08 17685.05

Directory 2019 39
Kerala State Pollution Control Board
Pamba Down (Parumala)
1565NWMP
Max 6.9 88 6.6 3.9 660 460
BMin 6.3 56 2.1 0.5 270 140
Mean 6.6 69 5.2 1.5 465 253
Std. Dev 0.2 10.19 1.2 0.9 107.24 105.67
Vadasserikkara K23 SWMP
Max 7.4 55 8.4 1.3 1990 1870
CMin 6.3 30 6.5 0.4 800 620
Mean 6.9 40 7.4 0.8 1181 942
Std. Dev 0.3 8.43 0.6 0.3 363.2 364.61
Athikkayam K24 SWMP
Max 7.9 271 7.7 1.0 2090 1970
CMin 6.4 56 6.5 0.3 800 520
Mean 7.2 121 7.2 0.7 1151 919
Std. Dev 0.5 69.1 0.4 0.2 417.34 424.18
Ranni K25 SWMP
Max 7.8 85 8.1 1.6 1800 1540
CMin 6.6 33 6.1 0.3 900 700
Mean 7.0 47 7.0 0.8 1193 918
Std. Dev 0.3 16.84 0.7 0.5 292.96 241.78
Kozhencherry K26 SWMP
Max 7.5 77 8.0 1.0 1690 1500
CMin 6.4 28 6.0 0.3 640 470
Mean 6.9 44 7.1 0.5 953 758
Std. Dev 0.3 16.63 0.6 0.2 278.96 271.09
Chengannoor 1156 NWMP
Max 6.8 72 8.0 1.5 840 630
CMin 6.1 43 5.3 0.3 380 170
Mean 6.4 57 6.4 0.7 599 364
Std. Dev 1.8 10.18 0.8 0.3 135.27 157.91
Edatua K27 SWMP
Max 7.1 78 4.8 2.0 2350 1980
EMin 6.5 38 2.0 0.6 1000 760
Mean 6.7 61 3.8 1.3 1389 1101
Std. Dev 0.2 13.52 0.8 0.5 419.47 401.17
Thakazhi1341 NWMP
Max 7.0 100 5.8 2.5 540 380
CMin 6.1 68 3.1 0.8 220 110
Mean 6.5 86.3 4.2 0.9 410 213
Std. Dev 0.2 10.64 0.9 0.5 99.82 98.75
Pulinkunnu K28 SWMP
Max 7.2 105 7.0 1.7 2020 1850
CMin 6.3 26 0.9 0.3 788 590
Mean 6.8 66 5.3 0.8 1114 928
Std. Dev 0.3 29.26 1.7 0.5 432.88 441.23
*See Annexure IV

Directory 2019
Kerala State Pollution Control Board
40
40
K19 K20 K21 K22 1565 K23 K24 K25 K26 115
6 K27 1341 K28
Pre-monsoon 7.0 7.3 7.3 6.8 6.6 6.9 7.2 6.8 6.8 6.4 6.8 6.6 6.7Monsoon 7.0 6.9 7.1 6.6 6.6 7.1 7.2 7.0 7.0 6.4 6.7 6.6 7.0Post-monsoon 6.8 6.9 7.5 6.8 6.5 6.7 7.1 7.1 6.8 6.4 6.6 6.4 6.7
5.65.86.06.26.46.66.87.07.27.47.67.8
Var
iati
on
in
pH
pH
K19 K20 K21 K22 1565 K23 K24 K25 K26 115
6 K27 1341 K28
Pre-monsoon 7.2 7.3 6.7 4.5 5.1 7.6 7.2 7.1 6.9 6.3 3.3 4.7 5.5Monsoon 7.3 7.2 7.4 7.2 5.6 7.7 7.3 7.3 7.6 6.7 4.2 4.1 4.7Post-monsoon 6.4 5.8 6.7 5.8 4.7 6.7 7.2 6.3 6.8 6.1 4.0 3.6 5.4
0.01.02.03.04.05.06.07.08.09.0
Var
iati
on
in
Do
Dissolved oxygen, mg/l
K19 K20 K21 K22 1565 K23 K24 K25 K26 115
6 K27 1341 K28
Pre-monsoon 48 308 70 263 72 38 187 52 45 58 62 95 71Monsoon 37 187 54 53 61 38 71 38 35 49 54 77 43Post-monsoon 68 202 72 57 78 48 76 51 54 66 69 84 80
050
100150200250300350
Var
iati
on
in
EC
Electrical Conductivity, µmhos/cm
K19 K20 K21 K22 1565 K23 K24 K25 K26 115
6 K27 1341 K28
Pre-monsoon 1.0 1.2 1.0 3.7 1.9 0.7 0.7 0.5 0.4 0.9 1.0 2.0 0.7Monsoon 0.7 0.9 0.7 0.9 1.1 0.6 0.6 0.7 0.5 0.5 1.2 1.8 0.6Post-monsoon 1.1 1.4 1.3 1.2 1.4 1.1 0.9 1.3 0.8 0.8 1.7 2.0 1.2
0.00.51.01.52.02.53.03.54.0
Var
iati
on
in
Bo
D
Biological oxygen Demand, mg/l
K19 K20 K21 K22 1565 K23 K24 K25 K26 115
6 K27 1341 K28
Pre-monsoon 2684 1472 1666 1761 498 1280 1382 1152 1010 636 1440 454 1122Monsoon 1013 1216 623 1229 363 913 878 1040 810 465 1105 305 858Post-monsoon 1343 1890 3933 3817 547 1373 1130 1467 1047 717 1683 477 1357
02000400060008000
100001200014000160001800020000
Var
iati
on
in
TC
Total Coliform, MPN/100ml
Season PeriodPre monsoon January-May
Monsoon June-SeptemberPost Monsoon October-December

Directory 2019 41
Kerala State Pollution Control Board

Directory 2019
Kerala State Pollution Control Board
42
42
1.11 Meenachil River
The Meenachil River originates from the Western Ghats and flows through Erattupettah, Palai, Kidangoor, Ettumanoor and Kottayam, where it divides into its tributaries before emptying into the Vembanadu Lake. The NWMP sampling station in this river is at Kidangoor which is near Palai town. SWMP Sampling stations include Theekoy, Bharanganam, Kadapattoor, Punnathara, Thazhathangadi, Kumarakom.
2019 MEENACHIL RIVER
River Stations pH EC µmhos/cm
DOmg/l
BODmg/l
TC MPN/100ml
FC MPN/100ml CLASS*
Theekoy K29 SWMP
Max 7.7 71 8.2 1.4 2900 1400
CMin 6.5 36 5.0 0.1 1000 500
Mean 7.1 48 7.0 0.5 1950 1046
Std. Dev 0.4 12.29 1.1 0.4 567.69 262.38
Bharanganam K30
SWMP
Max 7.6 105 8.0 1.0 4300 2400
CMin 6.4 38 6.2 0.2 1600 800
Mean 7.2 41 7.6 0.5 2667 1350
Std. Dev 0.4 25.89 0.6 0.2 846.47 487.11
CKadappattoor K31 SWMP
Max 7.6 154 8.7 0.8 3000 1400
Min 6.9 42 6.7 0.2 1200 600
Mean 7.3 46 7.4 0.5 1846 967
Std. Dev 0.2 36 0.6 0.2 512.33 241.52
Kidangoor 1339
NWMP
Max 7.9 103 7.7 0.9 4900 2800
CMin 6.8 44 6.0 0.2 700 310
Mean 7.5 70 7.0 0.5 2625 1418
Std. Dev 0.3 20.58 0.6 0.2 1157.09 668.41
Punnathara K32 SWMP
Max 7.7 108 8.1 1.1 4350 2100
CMin 6.8 44 6.4 0.1 700 500
Mean 7.4 49 7.3 0.6 2000 1050
Std. Dev 0.2 24.24 0.5 0.3 934.93 421.58

Directory 2019 43
Kerala State Pollution Control Board
Thazhathangadi K33 SWMP
Max 7.7 13240 7.8 0.8 4900 2450
CMin 5.7 43 3.8 0.2 900 350
Mean 7.2 2018 6.1 0.4 2338 1204
Std. Dev 0.5 4257.53 1.2 0.2 957.06 510.11
Kumarakam K34 SWMP
Max 7.6 22820 7.1 1.2 7000 3800
CMin 4.8 102 3.4 0.1 1200 650
Mean 6.7 287 4.8 0.7 3425 1838
Std. Dev 0.9 8703.64 1.3 0.3 1683.14 971.2
*See Annexure IV
K29 K30 K31 1339 K32 K33 K34Pre-monsoon 6.8 7.0 7.1 7.4 7.3 7.2 6.6Monsoon 7.1 7.1 7.4 7.5 7.3 6.9 6.3Post-monsoon 7.4 7.5 7.4 7.7 7.6 7.5 7.5
0.01.02.03.04.05.06.07.08.09.0
Var
iati
on in
pH
pH
K29 K30 K31 1339 K32 K33 K34Pre-monsoon 6.4 7.0 7.5 6.7 7.5 6.6 5.9Monsoon 7.4 7.8 7.3 7.0 7.0 5.4 4.9Post-monsoon 7.5 7.5 7.4 7.3 7.4 6.3 4.5
0.01.02.03.04.05.06.07.08.09.0
Var
iati
on in
Do
Dissolved oxygen, mg/l
K29 K30 K31 1339 K32 K33 K34Pre-monsoon 56 77 103 83 91 2111 6580Monsoon 43 55 54 69 63 3362 5979Post-monsoon 40 42 49 50 51 71 209
01000200030004000500060007000
Var
iati
on in
EC
Electrical Conductivity, µmhos/cm
K29 K30 K31 1339 K32 K33 K34Pre-monsoon 0.5 0.6 0.7 0.6 0.4 0.5 0.5Monsoon 0.4 0.4 0.4 0.4 0.5 0.4 0.6Post-monsoon 0.8 0.7 0.5 0.4 0.6 0.4 0.7
0.00.10.20.30.40.50.60.70.80.9
Var
iati
on in
Bo
D
Biological oxygen Demand, mg/l
K29 K30 K31 1339 K32 K33 K34Pre-monsoon 1780 2230 1620 2560 2310 1930 3220Monsoon 2350 3088 2088 2075 1750 2125 3200Post-monsoon 1700 2833 1900 3467 1817 3300 4067
0500
10001500200025003000350040004500
Var
iati
on in
TC
Total Coliform,MPN/100ml
Season PeriodPre monsoon January-May
Monsoon June-SeptemberPost Monsoon October-December

Directory 2019
Kerala State Pollution Control Board
44
44

Directory 2019 45
Kerala State Pollution Control Board
1.12 Manimala River
The Manimala River originates from the Muthavara Hills near Peerumedu in Idukki district and has a length of about 92 km. It flows through Kottayam and Pathanamthitta districts and finally joins Pamba River at Muttar in Alappuzha. Erumeli, Manimala, Mundakkayam, Chambakkulam etc are the important towns on the banks of this river. The NWMP river stations are located at Thondara and Kallooppara. SWMP river stations are located at Thottabhagam, Mallappally, Valakkayam, Pazhayidam, Erumeli, Koottikkal, Yendhayar.
2019 MANIMALA RIVER
River Stations pH EC µmhos/cm
DOmg/l
BODmg/l
TC MPN/100ml
FC MPN/100ml CLASS*
Kallooppara1340 NWMP
Max 7.9 330 8.1 3.0 920 610
BMin 6.9 80 5.4 0.4 100 50
Mean 7.3 256 6.8 1.6 473 263
Std. Dev 0.3 67.32 0.8 0.8 268.75 179.05

Directory 2019
Kerala State Pollution Control Board
46
46
Thondara 1384 NWMP
Max 7.6 304 8.0 2.4 1200 790
CMin 6.8 84 5.8 0.3 200 100
Mean 7.2 248 6.7 1.6 673 383
Std. Dev 0.3 60.74 0.6 0.7 269.29 189.85
Yendhayar K35 SWMP
Max 7.6 73 8.6 3.2 1100 700
BMin 6.8 20 5.4 0.4 100 50
Mean 7.1 38 7.4 1.6 458 253
Std. Dev 0.2 17.73 1.1 0.9 391.87 231.18
Kottikkal K36 SWMP
Max 7.6 170 9.8 3.3 3500 2450
CMin 6.8 34 6.1 0.9 0 0
Mean 7.2 68 7.9 1.8 750 498
Std. Dev 0.3 44.96 0.9 0.9 932.74 672.57
Erumeli K37 SWMP
Max 7.4 116 9.6 3.0 1800 1300
CMin 6.8 35 7.2 0.4 200 100
Mean 7.1 60 8.3 1.8 967 597
Std. Dev 0.2 27.33 0.6 0.9 457.93 373.54
Pazhayidam K38 SWMP
Max 7.4 100 8.3 3.1 4800 3100
CMin 6.8 48 5.9 0.2 200 100
Mean 7.1 69 7.2 1.6 1883 1048
Std. Dev 0.2 19.77 0.7 0.9 1226.85 791.19
Valakkayam K39 SWMP
Max 7.5 111 8.3 7.4 6000 4200
CMin 6.9 56 6.8 0.1 200 50
Mean 7.2 74 7.6 2.2 1092 690
Std. Dev 0.2 19.74 0.5 2.0 1590.57 1141.57
Manimala K40 SWMP
Max 7.5 110 8.9 3.2 1200 830
CMin 6.8 60 6.4 0.5 100 50
Mean 7.1 75 7.6 1.7 692 362
Std. Dev 0.2 17.75 0.6 0.9 387.2 267.51
Mallappally K41 SWMP
Max 7.3 138 8.1 3.1 6100 4300
CMin 6.8 43 6.4 0.1 200 100
Mean 7.0 71 7.3 1.6 2117 1386
Std. Dev 0.2 29.72 0.5 1.0 2402.97 1671.73
Thottabhagam K42 SWMP
Max 7.5 120 7.9 3.0 1000 400
CMin 6.5 52 5.2 0.3 200 100
Mean 7.0 71 7.0 1.4 517 231
Std. Dev 0.2 23.45 1.0 0.9 269.12 113.28
*See Annexure IV

Directory 2019 47
Kerala State Pollution Control Board
1340 1384 K35 K36 K37 K38 K39 K40 K41 K42Pre-monsoon 7.5 7.3 7.1 7.2 7.1 7.1 7.2 7.1 7.1 7.0Monsoon 7.3 7.3 7.2 7.4 7.2 7.3 7.4 7.2 7.0 7.0Post-monsoon 7.0 6.9 6.9 7.0 7.0 6.9 7.1 7.0 6.9 6.8
6.4
6.6
6.8
7.0
7.2
7.4
7.6
Var
iati
on
in
pH
pH
1340 1384 K35 K36 K37 K38 K39 K40 K41 K42Pre-monsoon 230 230 54 85 71 84 90 87 87 86Monsoon 297 281 30 67 57 63 68 69 62 58Post-monsoon 244 236 21 40 47 53 57 64 56 65
050
100150200250300350
Var
iati
on
in
EC
Electrical Conductivity, µmhos/cm
1340 1384 K35 K36 K37 K38 K39 K40 K41 K42Pre-monsoon 6.2 6.6 6.5 7.5 8.3 6.6 7.5 7.4 7.3 6.2Monsoon 7.0 6.3 7.9 8.3 8.2 7.6 7.4 7.9 7.1 7.4Post-monsoon 7.4 7.5 8.3 8.0 8.3 7.6 8.2 7.6 7.6 7.7
0.01.02.03.04.05.06.07.08.09.0
Var
iaat
ion
in
Do
Dissolved oxygen, mg/l
1340 1384 K35 K36 K37 K38 K39 K40 K41 K42Pre-monsoon 1.9 1.9 2.4 2.6 2.7 2.4 2.8 2.6 2.4 2.2Monsoon 1.3 1.6 1.0 1.2 1.3 1.4 0.9 1.1 0.9 0.8Post-monsoon 1.4 0.9 1.3 1.4 0.8 0.5 2.9 0.8 1.0 0.9
0.00.51.01.52.02.53.03.5
Var
iati
on
in
Bo
D
Biological oxygen Demand, mg/l
1340 1384 K35 K36 K37 K38 K39 K40 K41 K42Pre-monsoon 556 720 320 1280 1340 940 1680 400 4460 620Monsoon 480 723 575 325 775 3100 550 900 300 350Post-monsoon 327 530 533 433 600 1833 833 900 633 567
0500
100015002000250030003500400045005000
Var
iati
on
in
TC
Total Coliform, MPN/100ml
Season PeriodPre monsoon January-May
Monsoon June-SeptemberPost Monsoon October-December

Directory 2019
Kerala State Pollution Control Board
48
48

Directory 2019 49
Kerala State Pollution Control Board
1.13 Periyar River
The Periyar River is the longest river in Kerala. It originates from the Sivagiri hills of the Western Ghats. It has a length of 244 km. Major hydroelectric projects of Kerala which are Pallivasal, Chengulam, Idukki, Panniyar, Neriyamangalam, Edamalayar, Lower Periyar etc. are located in this river. The river bifurcates at Alwaye as Mangalapuzha branch and Marthandavarma branch. Several major, minor and small scale industries are located on the banks of these two branches. Periyar River is the main drinking water source of Cochin Corporation, Aluva and Paravur towns and a lot of Panchayaths like Kadamakudy, Puthencruz etc.The sampling stations of Periyar are located in the upper, middle and lower stretches. The sampling stations are at Eloor, Kalady, KWA water intake at Aluva, Sewage discharge point at Aluva, Pathalam, Kalamassery, Purappillikkadavu and Muppathadam.
2019 PERIYAR RIVER
River Stations pH EC µmhos/cm
DOmg/l
BODmg/l
TC MPN/100ml
FC MPN/100ml CLASS*
Kalady0018 NWMP
Max 7.6 56 8.2 2.6 7000 3800
CMin 6.6 32 4.0 0.5 460 170
Mean 7.1 42 6.7 1.1 2683 1477
Std. Dev 0.3 7.49 1.3 0.6 2267.11 1345.43
KWA Aluva 3468 NWMP
Max 7.5 64 8.8 2.7 5400 3500
CMin 6.5 30 5.3 0.3 14 10
Mean 7.0 47 6.7 1.1 1395 756
Std. Dev 0.3 8.5 1.0 0.7 1573.61 1041.35
SDP Aluva1338 NWMP
Max 7.3 78 7.7 2.1 7900 7000
CMin 4.1 38 4.8 0.4 1200 580
Mean 6.7 54 6.2 1.4 4417 2307
Std. Dev 0.9 12.11 1.0 0.6 2237.63 1854.67
Muppathadam 2333 NWMP
Max 7.7 92 7.9 1.6 5400 3500
CMin 6.8 35 4.5 0.1 1100 240
Mean 7.2 58 5.8 0.9 2758 1202
Std. Dev 0.3 19.49 1.1 0.6 1231.75 894.77

Directory 2019
Kerala State Pollution Control Board
50
50
Eloor 0017 NWMP
Max 7.7 33000 9.6 2.8 43000 12000
EMin 6.6 90 4.4 0.3 400 170
Mean 7.2 12303 6.6 1.5 6369 2505
Std. Dev 0.4 14019.22 1.5 0.8 11692.56 3180.01
Pathalam 2334 NWMP
Max 7.2 29000 9.1 2.9 26000 4700
EMin 6.5 44 4.7 0.2 1400 400
Mean 6.9 7610 6.9 1.1 5683 2293
Std. Dev 0.2 9619.45 1.6 0.9 6734.69 1358.94
Purappillikadavu 2336 NWMP
Max 7.7 9600 7.2 2.8 7000 2700
EMin 6.7 49 5.3 0.1 110 40
Mean 7.2 3700 6.3 1.1 1439 591
Std. Dev 0.3 3321.74 0.6 0.9 1915.92 751.15
Kalamassery 2335 NWMP
Max 7.3 135 7.4 2.4 16000 4600
CMin 6.3 41 0.9 0.3 1700 350
Mean 7.0 77 4.8 1.1 4825 2286
Std. Dev 0.3 34.51 1.8 0.7 3694.01 1293.1
*See Annexure IV
18 3468 1338 2333 17 2334 2336 2335Pre-monsoon 7.1 7.0 6.8 7.5 7.3 6.9 7.3 7.0Monsoon 7.0 6.9 6.2 7.0 7.0 7.0 7.3 6.9Post-monsoon 7.1 7.0 7.0 7.1 7.1 6.9 7.1 6.9
0.01.02.03.04.05.06.07.08.0
Va
ria
tio
n i
n p
H
pH
18 3468 1338 2333 17 2334 2336 2335Pre-monsoon 38 47 59 67 27576 14968 7054 97Monsoon 48 48 57 56 1756 2848 1392 69Post-monsoon 40 45 42 45 911 1696 1188 54
05000
1000015000200002500030000
Va
ria
tio
n i
n E
C
Electrical Conductivity, µmhos/cm
18 3468 1338 2333 17 2334 2336 2335Pre-monsoon 6.9 6.3 5.7 6.1 7.0 6.7 6.2 4.1Monsoon 6.0 7.0 6.2 5.6 6.5 6.9 6.5 4.8Post-monsoon 7.3 7.1 7.1 5.6 6.1 7.1 6.2 5.9
0.01.02.03.04.05.06.07.08.0
Va
ria
tio
n i
n D
o
Dissolved oxygen,mg/l
18 3468 1338 2333 17 2334 2336 2335Pre-monsoon 1.1 0.7 1.1 1.2 1.0 1.3 0.7 1.7Monsoon 1.6 1.5 1.7 0.8 1.8 1.0 2.0 0.5Post-monsoon 0.6 1.2 1.3 0.4 1.8 0.7 0.6 1.0
0.0
0.5
1.0
1.5
2.0
2.5
Va
ria
tio
n i
n B
oD
Biological oxygen Demand, mg/l
18 3468 1338 2333 17 2334 2336 2335Pre-monsoon 2478 518 2920 1820 2126 4260 818 6020Monsoon 3125 2608 6350 3500 4225 8550 2700 4175Post-monsoon 2433 1238 4333 3333 16300 4233 793 3700
02000400060008000
1000012000140001600018000
Va
ria
tio
n i
n T
C
Total Coliform, MPN/100ml
Season PeriodPre monsoon January-May
Monsoon June-SeptemberPost Monsoon October-December

Directory 2019 51
Kerala State Pollution Control Board

Directory 2019
Kerala State Pollution Control Board
52
52
1.14 Muvattupuzha
The Muvattupuzha River is formed by the union of three rivers viz., Thodupuzha, Kaliyar and Kothamangalam at Moovattupuzha. Malankara dam is constructed across Thodupuzha River for irrigation purpose. This river finally joins the Vaikom lake and drains into the Lakshadweep Sea. The NWMP station selected is at Vettikkattumukku. The nearby towns are Muvattupuzha and Piravom. SWMP stations include Malankara Dam, Muvattupuzha, Peruvamoozhy, Ramamangalam, Piravom, Murinjapuzha.
2019 MUVATTUPUZHA RIVER
River Stations pH EC µmhos/cm
DOmg/l
BODmg/l
TC MPN/100ml
FC MPN/100ml CLASS*
Malankara Dam K43 SWMP
Max 7.7 80 8.2 0.8 6000 3600
CMin 6.6 45 6.2 0.1 600 350
Mean 7.2 60 7.7 0.5 2667 1508
Std. Dev 0.3 11.73 0.6 0.3 1694.02 999.28
Muvattupuzha K44
SWMP
Max 7.3 76 7.9 0.6 5000 2700
CMin 6.5 49 6.3 0.1 1300 650
Mean 7.1 56 7.3 0.4 2717 1375
Std. Dev 0.3 9.82 0.5 0.2 1126.61 721.9
Peruvammoozhy K45 SWMP
Max 7.9 77 7.9 0.8 3400 2000
CMin 6.7 50 7.0 0.1 1150 600
Mean 7.4 62 7.5 0.4 2063 1208
Std. Dev 0.3 9.66 0.4 0.2 670.18 437.36
Ramamangalam K46 SWMP
Max 7.9 79 7.9 0.6 2650 1600
CMin 6.5 50 6.9 0.1 950 400
Mean 7.4 66 7.5 0.3 1767 917
Std. Dev 0.4 11.25 0.4 0.2 595.95 363.28
Piravom K47 SWMP
Max 7.9 107 7.9 0.6 4000 2100
CMin 6.8 52 6.6 0.1 1400 600
Mean 7.5 58 7.2 0.4 2417 1225
Std. Dev 0.3 14.74 0.5 0.1 804.34 422.39

Directory 2019 53
Kerala State Pollution Control Board
Vettikkattumukku 0043 NWMP
Max 7.9 86 7.8 0.8 4900 2700
CMin 6.9 54 5.7 0.2 2200 1100
Mean 7.5 70 6.9 0.5 3383 1808
Std. Dev 0.3 10.89 0.6 0.2 734.64 456.68
MurinjapuzhaK48 SWMP
Max 7.8 4154 8.0 1.1 6000 3200
CMin 6.3 70 5.4 0.3 1850 1200
Mean 7.4 1243 6.8 0.7 3808 2067
Std. Dev 0.4 1639.46 0.8 0.3 1403.38 634.73
*See Annexure IV
K43 K44 K45 K46 K47 43 K48Pre-monsoon 7.0 7.0 7.2 7.2 7.2 7.4 7.0Monsoon 7.4 7.0 7.6 7.6 7.6 7.6 7.7Post-monsoon 7.4 7.2 7.6 7.6 7.6 7.6 7.7
6.46.66.87.07.27.47.67.8
Varia
tion
in p
H
pH
K43 K44 K45 K46 K47 43 K48Pre-monsoon 7.9 7.6 7.6 7.6 7.4 7.3 7.0Monsoon 7.6 6.8 7.2 7.3 6.8 6.3 6.1Post-monsoon 7.4 7.5 7.6 7.5 7.4 7.1 7.2
0.01.02.03.04.05.06.07.08.09.0
Varia
tion
in D
o
Dissolved oxygen, mg/l
K43 K44 K45 K46 K47 43 K48Pre-monsoon 66 69 67 75 76 74 1758Monsoon 59 60 61 63 63 70 1178Post-monsoon 50 55 55 56 58 62 470
0200400600800
100012001400160018002000
Varia
tion
in E
C
Electrical Conductivity, µmhos/cm
K43 K44 K45 K46 K47 43 K48Pre-monsoon 0.6 0.5 0.5 0.4 0.4 0.6 0.7Monsoon 0.4 0.4 0.3 0.3 0.4 0.3 0.5Post-monsoon 0.5 0.3 0.3 0.3 0.3 0.7 0.9
0.00.10.20.30.40.50.60.70.80.91.0
Varia
tion
In B
oD
Biological oxygen Demand, mg/l
K43 K44 K45 K46 K47 43 K48Pre-monsoon 1360 2270 1630 1510 1920 3500 3830Monsoon 3700 2963 2250 2075 3250 3225 3088Post-monsoon 3467 3133 2533 1783 2133 3400 4733
0500
100015002000250030003500400045005000
Varia
tion
in T
C
Total Coliform,MPN/100ml
Season PeriodPre monsoon January-May
Monsoon June-SeptemberPost Monsoon October-December

Directory 2019
Kerala State Pollution Control Board
54
54

Directory 2019 55
Kerala State Pollution Control Board
1.15 Chalakudypuzha
Chalakudypuzha, the fifth longest river in Kerala has a total stretch of about 145 km. It originates from the Anamali and Nelliampathy ranges of the Western Ghats and flows westwards through the districts of Palakkad, Thrissur and Ernakulam. The major portion of this river flows through Thrissur district and finally joins the Periyar River near Paravur and drains into the Lakshadweep Sea. The NWMP sampling station located is at Pulickakadavu and the SWMP sampling locations are Peringalkuth Bridge, Vettilapara, Kanjirappilly, Chalakudy, Pulikkakadavu, Palapuzhakadavu.
2019 CHALAKUDY PUZHA
River Stations pH EC µmhos/cm
DOmg/l
BODmg/l
TC MPN/100ml
FC MPN/100ml CLASS*
Peringal Bridge K49 SWMP
Max 7.5 47 9.4 4.5 1000 800
BMin 6.2 29 7.2 0.6 100 52
Mean 6.6 41 8.0 1.7 367 190
Std. Dev 0.4 4.89 0.6 1.1 270.8 210.43
Vettilappara K50
SWMP
Max 7.6 51 13.8 6.7 400 200
BMin 6.2 35 7.5 0.4 100 20
Mean 6.9 42 8.7 2.0 208 88
Std. Dev 0.4 5.00 1.7 1.6 108.36 60.49
BKanjirapilly
K51 SWMP
Max 7.7 53 9.3 2.6 700 400
Min 5.9 31 6.6 0.3 100 68
Mean 6.7 45 8.2 1.5 342 206
Std. Dev 0.5 6.94 0.7 0.7 178.16 93.92
CChalakudy Bridge K52 SWMP
Max 7.2 60 9.3 2.5 2000 600
Min 6.1 33 6.6 0.5 100 100
Mean 6.6 49 7.9 1.6 583 217
Std. Dev 0.3 8.13 0.7 0.6 574.98 146.68
Pulikkakadavu K53 SWMP
Max 7.5 303 10.0 3.1 700 300
BMin 5.8 39 6.2 0.4 100 40
Mean 6.6 116 8.3 1.8 333 140
Std. Dev 0.4 103 1.2 0.8 182.57 78.14

Directory 2019
Kerala State Pollution Control Board
56
56
Pulickakadavu 1154 NWMP
Max 7.4 375 8.6 2.6 4700 2400
CMin 6.0 40 3.6 0.3 340 79
Mean 6.9 130 6.4 0.9 1555 696
Std. Dev 0.4 109.38 1.5 0.6 1131.34 592.68
PalapuzhakadavuK54 SWMP
Max 7.1 272 9.8 2.7 2000 500
BMin 6.1 37 6.6 0.7 100 48
Mean 6.5 127 8.1 1.6 442 158
Std. Dev 0.3 90.7 1.0 0.5 529.94 142.89
*See Annexure IV
K49 K50 K51 K52 K53 1154 K54Pre-monsoon 6.7 6.8 6.6 6.8 6.6 6.9 6.4Monsoon 6.4 6.6 6.5 6.3 6.2 6.8 6.3Post-monsoon 6.8 7.3 7.3 6.6 7.0 7.1 6.9
5.65.86.06.26.46.66.87.07.27.47.6
Var
iati
on in
pH
pH
K49 K50 K51 K52 K53 1154 K54Pre-monsoon 8.2 8.2 8.1 8.4 9.6 6.2 8.8Monsoon 7.9 8.2 8.0 7.8 7.2 6.0 7.6Post-monsoon 7.6 10.2 8.5 7.3 7.6 7.3 7.6
0.0
2.0
4.0
6.0
8.0
10.0
12.0
Var
iati
on in
Do
Dissolved oxygen ,mg/l
K49 K50 K51 K52 K53 1154 K54Pre-monsoon 42 44 51 54 207 217 195Monsoon 37 37 38 40 46 75 81Post-monsoon 45 45 43 55 57 59 74
0
50
100
150
200
250
Var
iati
on in
EC
Electrical Conductivity, µmhos/cm
K49 K50 K51 K52 K53 1154 K54Pre-monsoon 1.8 1.2 1.9 2.0 2.4 0.9 1.9Monsoon 1.1 1.8 0.9 1.3 1.1 1.1 1.4Post-monsoon 2.3 3.6 1.6 1.3 1.5 0.7 1.5
0.00.51.01.52.02.53.03.54.0
Var
iati
on in
Bo
D
Biological oxygen Demand, mg/l
K49 K50 K51 K52 K53 1154 K54Pre-monsoon 380 220 460 880 320 884 700Monsoon 325 175 250 375 400 2435 300Post-monsoon 400 233 267 367 267 1500 200
0
500
1000
1500
2000
2500
3000
Var
iati
on in
TC
Total Coliform, MPN/100ml
Season PeriodPre monsoon January-May
Monsoon June-SeptemberPost Monsoon October-December

Directory 2019 57
Kerala State Pollution Control Board

Directory 2019
Kerala State Pollution Control Board
58
58
1.16 Karuvannur River
The Karuvannur River originates from the Manali Aar from the Vaniampara Hills. The Kurumali and Manali Aar join together and flow as Karuvannur River through 29 Grama Panchayats in Thrissur District and 2 in Palakkad District within the entire stretch of 48 km. Peechi and Cheemeni irrigation projects are situated in this river. The NWMP river station is located at Karuvannoor Bridge in Karuvannur town. SWMP sampling locations are Kainoorchira Bridge, Mupliyam, Palakadavu, Kottenkode, Karanchira.
2019 KARUVANNUR RIVER
River Stations pH EC µmhos/cm
DOmg/l
BODmg/l
TC MPN/100ml
FC MPN/100ml CLASS*
Kainoorchira Bridge K55 SWMP
Max 7.5 355 10 3.6 1300 400
BMin 5.6 61 5.4 0.8 100 60
Mean 6.5 107 7.2 2.0 458 186
Std. Dev 0.6 79.53 1.3 0.7 384.85 114.27
Mupliyam Bridge K56 SWMP
Max 7.3 395 9.2 2.6 2000 600
CMin 5.8 35 6.3 0.4 100 48
Mean 6.6 79 7.7 1.7 508 217
Std. Dev 0.5 100.41 0.9 0.6 499.92 183.98
Palakadavu K57 SWMP
Max 7.5 207 8.7 3.7 1200 800
BMin 5.6 41 5.9 1.0 200 80
Mean 6.5 69 7.2 2.0 417 226
Std. Dev 0.6 47.34 0.9 0.7 297.97 213.9
Karuvannur 2289 NWMP
Max 7.5 121 7.5 2.9 610 480
CMin 6.0 65 5.0 0.8 100 60
Mean 6.6 92 6.5 1.7 348 157
Std. Dev 0.5 18.94 0.8 0.6 180.81 121.16
Kottenkode K58 SWMP
Max 7.5 203 7.8 2.8 1000 600
BMin 6.5 44 5.5 0.5 100 20
Mean 6.7 84 6.5 1.8 392 187
Std. Dev 0.4 42.53 0.8 0.6 308.83 204.26

Directory 2019 59
Kerala State Pollution Control Board
Karanchira K59 SWMP
Max 7.2 204 7.9 2.5 2500 1200
CMin 6.1 54 5.5 1.3 100 40
Mean 6.6 94 6.7 2.0 533 246
Std. Dev 0.4 37.75 0.7 0.4 661.04 362.88
*See Annexure IV
K55 K56 K57 2289 K58 K59Pre-monsoon 6.5 6.6 6.6 6.5 6.6 6.6Monsoon 6.1 6.2 6.0 6.5 6.5 6.6Post-monsoon 7.0 7.0 7.0 6.9 7.0 6.9
5.45.65.86.06.26.46.66.87.07.2
Var
iati
on in
pH
pH
K55 K56 K57 2289 K58 K59Pre-monsoon 7.2 7.8 7.4 7.0 6.1 7.1Monsoon 6.8 7.9 6.6 6.0 7.1 6.4Post-monsoon 7.9 7.3 7.5 6.2 6.6 6.5
0.01.02.03.04.05.06.07.08.09.0
Var
iati
on in
Do
Dissolved oxygen, mg/l
K55 K56 K57 2289 K58 K59Pre-monsoon 85 43 48 102 55 78Monsoon 155 136 105 89 112 116Post-monsoon 81 65 58 78 93 92
020406080
100120140160180
Var
iati
on in
EC
Electrical Conductivity, µmhos/cm
K55 K56 K57 2289 K58 K59Pre-monsoon 2.5 1.7 1.9 1.6 1.7 1.9Monsoon 1.9 1.7 1.6 1.4 1.8 1.8Post-monsoon 1.3 1.6 2.6 2.1 2.0 2.3
0.0
0.5
1.0
1.5
2.0
2.5
3.0
Var
iati
on in
Bo
D
Biological oxygen Demand, mg/l
K55 K56 K57 2289 K58 K59Pre-monsoon 620 760 620 276 580 820Monsoon 275 350 275 395 200 375Post-monsoon 433 300 267 403 333 267
0100200300400500600700800900
Var
iati
on in
TC
Total Coliform, MPN/100ml
Season PeriodPre monsoon January-May
Monsoon June-SeptemberPost Monsoon October-December

Directory 2019
Kerala State Pollution Control Board
60
60

Directory 2019 61
Kerala State Pollution Control Board
1.17 Puzhakkal River
This river is originated by the union of several rivulets such as Parathode, Pumalathode, Meduthode and Katacharuthode and finally debouches into the Lakshadweep Sea. The sampling station is located at Puzhakkal Bridge.
2019 PUZHAKKAL RIVER
River Stations pH EC µmhos/cm
DOmg/l
BODmg/l
TC MPN/100ml
FC MPN/100ml CLASS*
Puzhakkal 2290 NWMP
Max 7.7 182 7.5 2.6 1000 400
BMin 5.8 85 5.0 1.0 100 55
Mean 6.7 128 5.8 1.7 449 163
Std. Dev 0.6 30.56 0.9 0.6 270.2 92.7
*See Annexure IV
2290Pre-monsoon 6.5Monsoon 6.7Post-monsoon 7.1
6.16.26.36.46.56.66.76.86.97.07.17.2
Var
iati
on
in
pH
pH
2290Pre-monsoon 139Monsoon 132Post-monsoon 104
020406080
100120140160
Var
iati
on
in
EC
Electrical Conductivity, µmhos/cm
2290Pre-monsoon 5.9Monsoon 6.3Post-monsoon 5.1
0.01.02.03.04.05.06.07.0
Var
iati
on
in
Do
Dissolved oxygen, mg/l
2290Pre-monsoon 1.9Monsoon 2.0Post-monsoon 1.2
0.0
0.5
1.0
1.5
2.0
2.5
Var
iati
on
in
Bo
D
Biological oxygen Demand, mg/l
2290Pre-monsoon 580Monsoon 355Post-monsoon 357
0100200300400500600700
Var
iati
on
in
TC
Total Coliform, MPN/100ml
Season PeriodPre monsoon January-May
Monsoon June-SeptemberPost Monsoon October-December

Directory 2019
Kerala State Pollution Control Board
62
62

Directory 2019 63
Kerala State Pollution Control Board
1.18 Keecheri River
The Keecheri River originates from the western cliffs of the Western Ghats in Thalapathi Taluk. The NWMP sampling station is located at Vadakkancherry in Thrissur District.
2019 KEECHERI RIVER
River Stations pH EC µmhos/cm
DOmg/l
BODmg/l
TC MPN/100ml
FC MPN/100ml CLASS*
Vadakkancherry 2291 NWMP
Max 7.8 195 7.1 2.8 790 480
BMin 6.0 88 4.9 0.9 200 100
Mean 6.6 129 6.1 2.0 424 190
Std. Dev 0.6 33.61 0.7 0.5 197.14 126.92
*See Annexure IV
2291Pre-monsoon 6.5Monsoon 6.5Post-monsoon 7.1
6.0
6.2
6.4
6.6
6.8
7.0
7.2
Var
iati
on
in
pH
pH
2291Pre-monsoon 152Monsoon 120Post-monsoon 105
020406080
100120140160
Var
iati
on
in
EC
Electrical Conductivity, µmhos/cm
2291Pre-monsoon 5.8Monsoon 6.5Post-monsoon 6.1
5.55.65.75.85.96.06.16.26.36.46.5
Var
iati
on
in
Do
Dissolved oxygen, mg/l
2291Pre-monsoon 2.1Monsoon 1.5Post-monsoon 2.4
0.0
0.5
1.0
1.5
2.0
2.5
Var
iati
on
in
Bo
D
Biological oxygen Demand, mg/l
2291Pre-monsoon 596Monsoon 300Post-monsoon 303
0100200300400500600700
Var
iati
on
in
TC
Total Coliform, MPN/100ml
Season PeriodPre monsoon January-May
Monsoon June-SeptemberPost Monsoon October-December

Directory 2019
Kerala State Pollution Control Board
64
64

Directory 2019 65
Kerala State Pollution Control Board
1.19 Bharathapuzha
The Bharathapuzha River ‘otherwise called Nila River’ is the second longest river in Kerala. It stretches a length of about 209 km and has its presence in three districts namely Palakkad, Malappuram and Thrissur. This river originates from the Anamalai Hills and empties into the Lakshadweep Sea at Ponnani. The NWMP sampling stations selected in this river are Pattambi (Pattambi Bridge) near Pattambi Town and Kuttippuram (Kuttippuram Bridge). SWMP sampling locations are at Arngottukulumb, Lakkidi, Mangalam, Naragampilly, Parali, Shornur, Thootha, Tripalur, Thavannoor, Nariparamba.
2019 BHARATHAPUZHA RIVER
River Stations pH EC µmhos/cm
DOmg/l
BODmg/l
TC MPN/100ml
FC MPN/100ml CLASS*
Naragampilly K60 SWMP
Max 8.2 1510 6.9 4.0 900 500
BMin 7.5 318 5.8 1.4 10 10
Mean 7.9 929 6.3 2.4 276 158
Std. Dev 0.3 403.55 0.4 1.1 360.28 231.86

Directory 2019
Kerala State Pollution Control Board
66
66
Arangottukulumbu K61 SWMP
Max 8.2 1566 7.8 29.6 1000 100
BMin 7.2 328 2.6 0.3 20 10
Mean 7.7 925 5.9 5.1 331 74
Std. Dev 0.3 417.42 1.4 9.3 381.23 39.75
Parali K62 SWMP
Max 8.4 1156 7.0 5.8 1000 800
BMin 6.7 241 5.1 1.1 20 10
Mean 7.4 492 6.1 2.6 261 216
Std. Dev 0.5 252.35 0.6 1.3 316.07 291.02
Thrippalur K63 SWMP
Max 8.0 580 7.8 4.8 3000 800
CMin 6.8 222 4.6 0.9 10 100
Mean 7.6 347 6.5 2.3 528 450
Std. Dev 0.4 108.33 0.9 1.4 1042.54 494.97
Mangalam K64 SWMP
Max 7.6 405 7.2 6.6 2300 1400
CMin 6.4 105 4.2 0.7 10 10
Mean 7.1 206 6.4 2.4 509 430
Std. Dev 0.4 111.94 0.8 1.8 780.7 593.13
Lakkidi K65 SWMP
Max 8.3 684 7.6 2.4 900 600
BMin 6.2 172 4.6 0.9 20 20
Mean 7.4 315 6.6 1.6 364 230
Std. Dev 0.5 135.42 0.9 0.5 306.44 254.17
Shornur K66 SWMP
Max 8.4 488 7.8 2.7 2000 1500
BMin 7.1 158 5.9 0.5 30 10
Mean 7.5 272 6.7 1.6 421 299
Std. Dev 0.4 84.16 0.5 0.7 542.8 539.92
Pattambi 2332 NWMP
Max 8.2 508 7.1 2.6 1300 1200
BMin 6.5 160 5.7 1.1 31 0
Mean 7.4 271 6.3 2.0 367 159
Std. Dev 0.5 89.36 0.4 0.5 372.5 341.64
Thootha K67 SWMP
Max 7.9 151 7.7 2.4 1200 700
BMin 6.7 56 6.4 0.3 20 20
Mean 7.3 95 7.0 1.2 350 239
Std. Dev 0.4 27.78 0.4 0.5 333.66 238.71
Kuttipuram 2331 NWMP
Max 8.2 360 7.2 2.9 840 260
BMin 6.0 96 5.3 0.8 31 2
Mean 7.3 186 6.5 1.8 328 102
Std. Dev 0.7 72.44 0.5 0.7 249.19 76.67
Thavannoor K68 SWMP
Max 8.0 310 8.8 6.3 68 28
BMin 6.7 102 4.0 0.8 4 4
Mean 7.4 218 7.0 2.9 26 15
Std. Dev 0.3 80.92 1.4 1.5 18.25 11.12
Nariparamba K69 SWMP
Max 8.5 311 8.6 5.3 74 32
BMin 6.8 95 5.6 0.8 8 8
Mean 7.4 220 7.4 2.8 29 16
Std. Dev 0.4 83.56 1.0 1.3 17.53 8.52
*See Annexure IV

Directory 2019 67
Kerala State Pollution Control Board
K60 K61 K62 K63 K64 K65 K66 2332 K67 233
1 K68 K69
Pre-monsoon 7.7 7.5 7.3 7.2 6.9 7.2 7.5 7.3 7.2 7.5 7.4 7.4Monsoon 8.2 7.7 7.2 7.6 7.1 7.4 7.4 7.4 7.2 7.2 7.3 7.3Post-monsoon 7.9 8.0 7.8 7.9 7.4 7.9 7.7 7.5 7.4 7.0 7.6 7.7
6.26.46.66.87.07.27.47.67.88.08.28.4
Var
iati
on in
pH
pH
K60 K61 K62 K63 K64 K65 K66 2332 K67 233
1 K68 K69
Pre-monsoon 1183 1193 430 297 285 277 239 255 120 189 284 280Monsoon 442 429 377 307 185 239 234 220 80 122 146 158Post-monsoon 1163 1153 746 437 154 479 380 365 74 266 201 204
0200400600800
100012001400
Var
iati
on in
EC
Electrical Conductivity, µmhos/100cm
K60 K61 K62 K63 K64 K65 K66 2332 K67 233
1 K68 K69
Pre-monsoon 6.5 5.1 6.2 7.1 6.8 7.2 7.1 6.5 7.3 6.9 7.0 7.7Monsoon 6.1 6.7 5.8 5.8 5.9 6.1 6.4 6.2 6.7 6.4 6.3 6.9Post-monsoon 6.1 6.0 6.1 6.7 6.7 6.3 6.3 6.0 6.9 6.2 8.1 7.7
0.01.02.03.04.05.06.07.08.09.0
Var
iati
on in
Do
Dissolved oxygen, mg/l
K60 K61 K62 K63 K64 K65 K66 2332 K67 233
1 K68 K69
Pre-monsoon 3.2 12.4 3.1 2.7 4.2 1.6 1.6 2.1 1.6 2.1 3.2 3.5Monsoon 2.3 1.4 2.4 2.9 2.0 1.5 1.9 1.7 0.8 1.6 2.3 2.5Post-monsoon 1.8 1.4 1.8 1.2 1.1 1.6 1.2 2.0 1.1 1.6 3.1 1.9
0.02.04.06.08.0
10.012.014.0
Var
iati
on in
Bo
D
Biological oxygen Demand, mg/l
K60 K61 K62 K63 K64 K65 K66 2332 K67 233
1 K68 K69
Pre-monsoon 180 360 207 25 10 340 308 224 206 284 17 25Monsoon 47 67 73 57 90 110 78 146 193 148 24 23Post-monsoon 600 567 567 1333 1233 733 1067 900 800 643 44 45
0200400600800
100012001400
Var
iati
on in
TC
Total Coliform, MPN/100ml
Season PeriodPre monsoon January-May
Monsoon June-SeptemberPost Monsoon October-December

Directory 2019
Kerala State Pollution Control Board
68
68

Directory 2019 69
Kerala State Pollution Control Board
1.20 Kadalundi River
The Kadalundi River is formed by the union of tributaries Olipuzha and Veliyar which originate from Cherakombanmala and Erattukombanmala of the Silent Valley. It has a length of nearly 120 km and finally debouches into the Lakshadweep Sea. A famous bird sanctuary is located on the banks of Kadalundi River near Beypore port. The NWMP stations selected are Thiroorangadi and Hajiyarapilly. SWMP stations are located at Oravambrum, Anakkayam, Manikuth, Kooriyad.
2019 KADALUNDI RIVER
River Stations pH EC µmhos/cm
DOmg/l
BODmg/l
TC MPN/100ml
FC MPN/100ml CLASS*
Oravambrum K70 SWMP
Max 7.5 138 8.7 3.9 80 40
AMin 6.5 42 4.0 0.6 12 4
Mean 6.9 77 6.7 1.7 27 18
Std. Dev 0.3 31.68 1.6 0.9 19.91 12.4
Anakkayam K71 SWMP
Max 7.3 117 9.2 4.4 72 40
AMin 6.3 57 5.3 0.6 8 4
Mean 6.9 83 7.0 2.0 25 16
Std. Dev 0.4 22 1.2 1.3 16.37 11.91
Hajiyarappally 2293 NWMP
Max 7.6 140 8.3 2.1 61 40
AMin 6.5 60 4.6 0.6 20 4
Mean 7.1 100 6.7 1.3 36 19
Std. Dev 0.4 29.08 1.1 0.4 13.53 10.03
Manikuth K72 SWMP
Max 7.4 117 9.0 2.6 60 28
AMin 6.3 59 3.5 1.2 12 12
Mean 6.9 85 6.9 1.8 32 18
Std. Dev 0.4 17.06 1.5 0.6 14.28 7.02
Kooriyad K73 SWMP
Max 7.4 145 8.6 4.4 49 28
AMin 6.5 63 4.0 0.8 12 6
Mean 7.0 93 6.8 2.0 29 13
Std. Dev 0.3 27.72 1.4 1.0 12.66 9.07

Directory 2019
Kerala State Pollution Control Board
70
70
Thiroorangadi 1566 NWMP
Max 7.9 158 8.0 3.4 81 70
BMin 6.0 65 4.0 0.8 8 4
Mean 7.0 103 6.6 2.1 37 21
Std. Dev 0.5 28.11 1.0 0.9 26.34 20.11
*See Annexure IV
K70 K71 2293 K72 K73 1566Pre-monsoon 7.0 7.1 7.2 7.0 7.1 7.2Monsoon 6.8 6.8 7.1 6.8 6.9 7.0Post-monsoon 6.8 6.7 6.7 6.8 6.8 6.5
6.06.26.46.66.87.07.27.4
Var
iati
on in
pH
pH
K70 K71 2293 K72 K73 1566Pre-monsoon 6.8 7.3 6.8 7.0 7.1 6.6Monsoon 6.4 6.6 6.5 6.4 6.2 6.2Post-monsoon 6.9 7.2 6.9 7.3 7.1 7.2
5.45.65.86.06.26.46.66.87.07.27.4
Var
iati
on in
Do
Dissolved oxygen, mg/l
K70 K71 2293 K72 K73 1566Pre-monsoon 105 97 124 97 108 123Monsoon 53 79 93 81 92 97Post-monsoon 55 64 72 69 70 78
020406080
100120140
Var
iati
on in
EC
Electrical Conductivity, µmhos/cm
K70 K71 2293 K72 K73 1566Pre-monsoon 1.6 2.4 1.4 2.0 2.7 2.5Monsoon 2.2 1.9 1.5 1.6 1.4 1.7Post-monsoon 1.5 1.5 0.9 1.7 1.7 1.9
0.0
0.5
1.0
1.5
2.0
2.5
3.0
Var
iati
on in
Bo
D
Biological oxygen Demand, mg/l
K70 K71 2293 K72 K73 1566Pre-monsoon 19 18 33 31 33 23Monsoon 39 21 37 35 16 39Post-monsoon 29 43 39 31 40 57
0
10
20
30
40
50
60
Var
iati
on in
TC
Total Coliform, MPN/100ml
Season PeriodPre monsoon January-May
Monsoon June-SeptemberPost Monsoon October-December

Directory 2019 71
Kerala State Pollution Control Board

Directory 2019
Kerala State Pollution Control Board
72
72
1.21 Tirur River
The Tirur River originates from the Athavanad village and has a length of 48 km, joins Bharathapuzha at Ponnani and finally reaches the Lakshadweep Sea. The selected NWMP river station is at Thalakkadathur (Thalakkadathur Bridge) in Malappuram District. SWMP river stations include Mangatteri, Kooloopalam, Ezhur, Thazhepalam.
2019 TIRUR RIVER
River Stations pH EC µmhos/cm
DOmg/l
BODmg/l
TC MPN/100ml
FC MPN/100ml CLASS*
Kooloopalam K74 SWMP
Max 7.6 232 8.1 3.4 48 24
CMin 6.3 67 1.8 0.2 12 8
Mean 7.1 118 4.8 1.4 28 15
Std. Dev 0.5 65.04 2.1 1.0 13.86 6.66
Ezhur K75 SWMP
Max 7.5 203 6.6 4.3 48 18
CMin 6.5 71 3.8 0.8 20 8
Mean 6.7 124 4.6 1.8 29 13
Std. Dev 0.3 50.5 0.8 1.2 9.62 3.93
Thazhepalam K76 SWMP
Max 7.6 33090 8.6 3.4 80 40
Below EMin 5.8 109 2.3 0.4 16 8
Mean 6.8 11547 4.5 1.2 34 21
Std. Dev 0.5 13128.78 2.0 0.8 22.58 12.95
Thalakkadathur 2292 NWMP
Max 7.5 39650 6.7 3.2 63 48
Below EMin 6.0 74 2.1 0.8 17 8
Mean 6.7 10058 4.5 1.3 40 20
Std. Dev 0.5 14070.24 1.6 0.7 14.02 10.89
Mangattiri K77 SWMP
Max 8.0 37180 6.6 2.7 52 26
Below EMin 5.9 113 1.6 0.4 12 4
Mean 7.1 13831 4.4 1.3 27 15
Std. Dev 0.5 16905.08 1.5 0.8 10.83 7.89
*See Annexure IV

Directory 2019 73
Kerala State Pollution Control Board
K74 K75 K76 2292 K77Pre-monsoon 7.0 6.6 7.1 6.5 7.1Monsoon 7.1 7.0 6.8 6.8 6.8Post-monsoon 7.1 6.7 6.6 7.0 7.4
6.06.26.46.66.87.07.27.47.6
Var
iati
on
in
pH
pH
K74 K75 K76 2292 K77Pre-monsoon 7.8 4.1 4.8 3.9 4.1Monsoon 4.6 5.1 4.4 5.0 4.4Post-monsoon 2.9 4.8 4.2 4.8 5.0
0.01.02.03.04.05.06.07.08.09.0
Var
iati
on
in
Do
Dissolved oxygen, mg/l
K74 K75 K76 2292 K77Pre-monsoon 222 177 24410 21374 26500Monsoon 81 88 3953 3378 8133Post-monsoon 85 90 233 105 314
0
5000
10000
15000
20000
25000
30000
Var
iati
on
in
EC
Electrical Conductivity,µmhos/cm
K74 K75 K76 2292 K77Pre-monsoon 1.9 2.0 1.2 1.3 1.6Monsoon 1.9 1.9 1.6 1.6 1.1Post-monsoon 0.6 1.2 0.6 1.1 1.1
0.0
0.5
1.0
1.5
2.0
2.5
Var
iati
on
in
Bo
D
Biological oxygen Demand, mg/l
K74 K75 K76 2292 K77Pre-monsoon 18 34 18 34 22Monsoon 33 29 53 38 34Post-monsoon 29 23 33 54 25
0
10
20
30
40
50
60
Var
iati
on
in
TC
Total Coliform, MPN/100ml
Season PeriodPre monsoon January-May
Monsoon June-SeptemberPost Monsoon October-December

Directory 2019
Kerala State Pollution Control Board
74
74

Directory 2019 75
Kerala State Pollution Control Board
1.22 Chaliyar River
The Chaliyar River is the fourth longest river in Kerala. It has a length of about 169 km and flows through Malappuram and Kozhikode districts and finally joins the Lakshadweep Sea at Kozhikkode. It originates from the Western Ghats at Elambalan Hills located near Cherambadi Town in Nilgiri district of Tamilnadu. This river is a significant transportation route for raw materials of the wood industries located at Nilambur and Kallai areas. The selected NWMP River stations are at Nilambur (up stream station) Koolimadu and Chungapally (down stream station). SWMP stations arelocated at Mundayamthodu, Vadapuram, Kuruvanpuzha, Areakode and Feroke.
2019 CHALIYAR RIVER
River Stations pH EC µmhos/cm
DOmg/l
BODmg/l
TC MPN/100ml
FC MPN/100ml CLASS*
Nilambur 3464 NWMP
Max 8.1 160 8.2 1.9 6300 4900
CMin 6.1 28 6.0 0.0 260 150
Mean 7.1 78 7.4 0.7 2902 1972
Std. Dev 0.7 33.21 0.7 0.6 2445.7 1662.51
Kuruvanpuzha K78 SWMP
Max 8.3 116 9.4 2.3 4100 2500
CMin 6.1 20 4.8 0.1 280 120
Mean 7.0 47 7.4 1.1 1634 1123
Std. Dev 0.8 26.51 1.2 0.7 1176.83 844.86
Vadapuram K79 SWMP
Max 8.1 142 8.3 2.1 8000 5400
CMin 6.0 36 4.9 0.2 150 100
Mean 6.9 73 7.2 1.0 3495 2408
Std. Dev 0.7 29.21 0.9 0.6 2863.63 2098.39
Mundayamthodu K80 SWMP
Max 7.3 231 7.7 2.0 5300 4600
CMin 5.8 26 2.7 0.1 960 280
Mean 6.6 66 6.5 0.9 3279 2211
Std. Dev 0.5 63.84 1.6 0.7 1567.41 1510.01
Areacode K81 SWMP
Max 8.0 119 10.0 2.6 9800 5600
CMin 6.0 32 6.3 0.1 40 30
Mean 7.1 81 7.7 1.2 3812 1981
Std. Dev 0.7 29.71 0.9 0.8 3772.9 1921.65

Directory 2019
Kerala State Pollution Control Board
76
76
Koolimadu 0020 NWMP
Max 7.9 128 8.7 1.7 6300 5600
CMin 6.2 26 6.1 0.0 140 100
Mean 7.2 70 7.6 0.7 2391 1685
Std. Dev 0.6 28.14 0.8 0.6 2251.31 1718.94
Chungappally 0021 NWMP
Max 7.7 42100 9.2 1.5 7000 4600
EMin 6.1 34 5.1 0.0 81 60
Mean 7.2 12090 7.2 0.5 2904 1820
Std. Dev 0.6 16439.89 1.1 0.5 2709.57 1524.09
Feroke K82 SWMP
Max 8.0 50350 7.9 1.9 9200 7000
EMin 5.7 49 5.8 0.3 500 300
Mean 7.4 22346 6.8 1.1 3817 2225
Std. Dev 0.8 22490.63 0.7 0.6 3487.86 2043.23
*See Annexure IV
3464 K78 K79 K80 K81 20 21 K82Pre-monsoon 7.6 7.5 7.6 6.9 7.7 7.6 7.6 7.9Monsoon 6.4 6.2 6.2 6.0 6.3 6.6 6.7 6.5Post-monsoon 7.2 7.3 6.8 6.7 7.0 7.2 7.2 7.6
0123456789
Varia
tio in
pH
pH
3464 K78 K79 K80 K81 20 21 K82Pre-monsoon 7.5 6.8 6.9 4.7 7.8 7.5 6.4 6.4Monsoon 7.0 7.9 7.3 7.5 7.6 7.7 7.7 7.1Post-monsoon 7.9 7.8 7.4 7.3 7.7 7.6 8.1 7.3
0.01.02.03.04.05.06.07.08.09.0
Varia
tion
in D
o
Dissolved oxygen, mg/l
3464 K78 K79 K80 K81 20 21 K82Pre-monsoon 106 69 96 115 108 89 28910 43242Monsoon 52 32 59 47 58 55 83 11065Post-monsoon 66 30 53 36 67 59 64 2558
05000
100001500020000250003000035000400004500050000
Varia
tion
in E
CElectrical Conductivity, µmhos/cm
3464 K78 K79 K80 K81 20 21 K82Pre-monsoon 1.0 1.5 1.5 1.2 2.2 1.0 0.7 1.5Monsoon 0.3 0.9 0.8 0.8 0.8 0.4 0.5 0.9Post-monsoon 0.5 0.6 0.4 0.6 0.6 0.6 0.2 0.7
0.0
0.5
1.0
1.5
2.0
2.5
Varia
tion
in B
oD
Biological oxygen Demand, mg/l
3464 K78 K79 K80 K81 20 21 K82Pre-monsoon 504 562 648 1370 748 418 1010 1360Monsoon 5250 2650 5800 3900 6925 4625 4925 6725Post-monsoon 3767 2067 5167 4567 4767 2700 3367 4033
010002000300040005000600070008000
Varia
tion
in T
C
Total Coliform, MPN/100ml
Season PeriodPre monsoon January-May
Monsoon June-SeptemberPost Monsoon October-December

Directory 2019 77
Kerala State Pollution Control Board

Directory 2019
Kerala State Pollution Control Board
78
78
1.23 Kabani River
The Kabani River, the main tributary of Cauvery River originates from the Pakramtalam Hills situated near Mananthavadi, Wayanad district and has a length of about 210 km. It flows eastward and joins the Cauvery River in Karnataka State. The Panamaram River joians Kabani at Payyampally. After traversing a distance of nearly 2 km from the confluence point, Kabani forms an island called Karuva spreading over 520 acres which is noted for its flora and fauna. The river station is located at Muthankara in Mananthavadi town.SWMP sampling locations include U/S of Panamaram (Neerattadi), D/S of Panamaram (Changadakadavu), At DTPC, At Forestkadavu, At Thonikadavu, U/S of Mananthavady and D/S of Mananthavady.
2019 KABANI RIVER
River Stations pH EC µmhos/cm
DOmg/l
BODmg/l
TC MPN/100ml
FC MPN/100ml CLASS*
Muthankara 1207
NWMP
Max 7.7 166 7.8 1.8 196 104
BMin 6.6 43 4.1 0.2 24 6
Mean 7.0 99 6.8 0.8 90 32
Std. Dev 0.4 39.97 1.0 0.5 57.64 27.58
U/S of Panamaram K83 SWMP
Max 7.8 178 8.0 1.8 160 52
BMin 6.7 33 4.2 0.1 30 4
Mean 7.3 95 6.6 0.9 80 28
Std. Dev 0.3 44.12 1.2 0.6 43.32 16.5
D/S of Panamaram K84 SWMP
Max 8.0 176 8.6 2.3 140 64
BMin 6.8 42 5.2 0.1 30 4
Mean 7.3 106 6.9 0.9 76 20
Std. Dev 0.4 40.31 1.1 0.7 34.82 18.94
At DTPC K85 SWMP
Max 7.5 167 7.9 1.9 160 126
BMin 6.5 42 4.3 0.3 44 14
Mean 7.1 103 6.8 0.8 93 40
Std. Dev 0.3 38.99 1.0 0.5 39.62 29.13

Directory 2019 79
Kerala State Pollution Control Board
At Forest kadavu K86 SWMP
Max 7.3 172 7.2 1.3 202 82
BMin 7.1 111 6.0 0.1 52 30
Mean 7.2 138 6.5 0.6 145 53
Std. Dev 0.1 31.21 0.6 0.6 81 26.63
At Thonikadavu K87 SWMP
Max 7.4 174 8.2 1.8 220 52
BMin 6.5 78 5.1 0.1 34 18
Mean 7.0 121 7.3 1.0 91 34
Std. Dev 0.2 27.49 0.9 0.6 56.96 11.31
U/S of Mananthavadi K88 SWMP
Max 7.9 204 8.6 2.3 184 50
BMin 6.7 32 2.6 0.1 10 0
Mean 7.2 90 6.2 0.8 91 30
Std. Dev 0.4 49.31 1.6 0.7 49.47 15.17
D/S of Mananthavadi K89 SWMP
Max 7.8 109 7.6 1.3 144 132
BMin 6.5 29 4.4 0.1 1 0
Mean 7.1 64 6.7 0.7 84 39
Std. Dev 0.4 23.17 1.1 0.4 39.08 35
*See Annexure IV
1207 K83 K84 K85 K87 K88 K89Pre-monsoon 7.1 7.3 7.1 7.2 7 7 7Monsoon 7.0 7.5 7.6 7.0 7 8 7Post-monsoon 6.9 7.2 7.2 7.0 7 7 7
6.26.46.66.87.07.27.47.67.8
Varia
tion
in p
H
pH
1207 K83 K84 K85 K87 K88 K89Pre-monsoon 6.5 6.8 7.3 6.7 7.3 6.8 6.7Monsoon 7.0 6.7 6.6 6.6 7.2 5.7 6.4Post-monsoon 6.9 6.3 6.5 7.1 7.4 6.1 7.1
0.01.02.03.04.05.06.07.08.0
Varia
tion
in D
o
Dissolved oxygen, mg/l
1207 K83 K84 K85 K87 K88 K89Pre-monsoon 132 133 137 137 143 82 79Monsoon 76 67 81 77 111 86 55Post-monsoon 75 70 88 80 98 110 49
020406080
100120140160
Varia
tion
in E
C
Electrical Conductivity, µmhos/cm
1207 K83 K84 K85 K87 K88 K89Pre-monsoon 1.1 1.0 1.1 1.1 1.3 0.8 0.8Monsoon 0.4 1.2 1.0 0.9 0.9 1.1 0.6Post-monsoon 0.7 0.2 0.4 0.4 0.6 0.4 0.8
0.0
0.2
0.4
0.6
0.8
1.0
1.2
1.4
Varia
tion
in B
oD
Biological oxygen Demand, mg/l
1207 K83 K84 K85 K87 K88 K89Pre-monsoon 112 108 81 99 98 132 103Monsoon 76 49 92 82 93 71 81Post-monsoon 74 74 44 99 77 47 55
0
20
40
60
80
100
120
140
Varia
tion
in T
C
Total Coliform, MPN/100ml
Season PeriodPre monsoon January-May
Monsoon June-SeptemberPost Monsoon October-December

Directory 2019
Kerala State Pollution Control Board
80
80

Directory 2019 81
Kerala State Pollution Control Board
1.24 Bhavani River
The Bhavani River has a length of the about 217 km. This river originates from the Nilgiri Hills of the Western Ghats at Mukkli in Kerala. It flows through Attappadi plateau for nearly 25 km stretch and through Coimbatore and Erode in Tamilnadu and merges with Cauvery River. It flows through three States- Kerala, Tamilnadu and Karnataka. The major portion of this river flows through Tamilnadu. The NWMP sampling station is located at Elachivazhi near Agali in Palakkad district and SWMP stations are Kottathara and Thavalam.
2019 BHAVANI RIVER
River Stations pH EC µmhos/cm
DOmg/l
BODmg/l
TC MPN/100ml
FC MPN/100ml
CLASS*
Thavalam K90 SWMP
Max 8.1 108 8 2.9 2700 800
BMin 6.5 59 5.5 0.3 10 100
Mean 7.4 84 6.9 1.3 442 325
Std. Dev 0.5 16.87 0.7 1.0 856.82 320.16

Directory 2019
Kerala State Pollution Control Board
82
82
K90 K91 1208Pre-monsoon 7 7 8Monsoon 7 7 8Post-monsoon 8 8 8
77777888
Varia
tion
in p
H
pH
K90 K91 1208Pre-monsoon 6.3 6.7 7.0Monsoon 7.2 7.0 7.2Post-monsoon 7.4 7.2 7.5
5.65.86.06.26.46.66.87.07.27.47.6
Var
iati
on in
Do
Dissolved oxygen, mg/l
K90 K91 1208Pre-monsoon 94 276 258Monsoon 65 145 131Post-monsoon 92 161 159
0
50
100
150
200
250
300
Varia
tion
in E
C
Electrical Conductivity, µmhos/cm
K90 K91 1208Pre-monsoon 2.3 1.2 1.4Monsoon 0.7 1.2 0.8Post-monsoon 0.6 0.9 0.5
0.0
0.5
1.0
1.5
2.0
2.5
Varia
tion
in B
oD
Biological oxygen Demand, mg/l
K90 K91 1208Pre-monsoon 140 150 77Monsoon 117 53 208Post-monsoon 1070 1267 1637
0200400600800
10001200140016001800
Varia
tion
in T
C
Total Coliform, MPN/100ml
Kottathara K91 SWMP
Max 8.1 371 7.8 2.6 2900 1700
BMin 7.1 58 4.1 0.1 10 10
Mean 7.6 204 6.9 1.1 446 340
Std. Dev 0.3 106.86 1.0 0.7 881.3 616.93
Elachivazhi1208 NWMP
Max 8.2 290 8.2 2.5 3800 2500
CMin 7.3 80 6.2 0.3 0 0
Mean 7.7 191 7.2 1.0 511 278
Std. Dev 0.3 81.78 0.6 0.7 1064.47 708.4
*See Annexure IV
Season PeriodPre monsoon January-May
Monsoon June-SeptemberPost Monsoon October-December

Directory 2019 83
Kerala State Pollution Control Board

Directory 2019
Kerala State Pollution Control Board
84
84
1.25 Kuttiyadipuzha
This 74 km long river originates from Marikottai (Western Ghats). Oripuzha, Thottilpalam and Kannathil are the major tributaries of this river. A dam intented for power generation and agricultural purpose was built across this river. The NWMP river station selected is at Estatemukku. Nearest town is Kuttiyadi in Kozhikode district.
2019 KUTTIYADI RIVER
River Stations pH EC µmhos/cm
DOmg/l
BODmg/l
TC MPN/100ml
FC MPN/100ml CLASS*
Estatemukku 1567 NWMP
Max 7.7 44 9.9 1.5 1700 1400
CMin 6.2 24 6.8 0.0 70 50
Mean 6.9 29 8.5 0.7 518 379
Std. Dev 0.5 5.94 0.7 0.5 526.31 434.68
*See Annexure IV
1567Pre-monsoon 6.9Monsoon 7.1Post-monsoon 6.9
6.86.86.96.97.07.07.17.1
Var
iati
on in
pH
pH
1567Pre-monsoon 27Monsoon 31Post-monsoon 31
242526272829303132
Var
iati
on in
EC
Electrical onductivity, µmhos/cm
1567Pre-monsoon 8.1Monsoon 8.6Post-monsoon 9.1
7.47.67.88.08.28.48.68.89.09.2
Var
iati
on in
Do
Dissolved oxygen, mg/l
1567Pre-monsoon 0.7Monsoon 0.6Post-monsoon 0.8
0.00.10.20.30.40.50.60.70.80.9
Var
iati
n in
Bo
D
Biological oxygen Demand,mg/l
1567Pre-monsoon 159Monsoon 680Post-monsoon 900
0100200300400500600700800900
1000
Var
iati
on in
TC
Total Coliform,MPN/100ml
Season PeriodPre monsoon January-May
Monsoon June-SeptemberPost Monsoon October-December

Directory 2019 85
Kerala State Pollution Control Board

Directory 2019
Kerala State Pollution Control Board
86
86
1.26 Mahe River
The Mahe River otherwise named as Mayyazhipuzha originates from the western slopes of Wayanad hills (Western Ghats). It flows through a distance of 54 km and finally falls into the Lakshadweep sea at Mahi (Pondicherry). This river is mainly used for inland navigation. NWMP sampling station is located at Valayam in Kozhikode district.
2019 MAHE RIVER
River Stations pH EC µmhos/cm
DOmg/l
BODmg/l
TC MPN/100ml
FC MPN/100ml CLASS*
Valayam 1568 NWMP
Max 7.7 102 8.6 2.4 7000 3400
CMin 6.4 33 5.7 0.0 460 180
Mean 6.9 59 7.1 0.8 2425 1347
Std. Dev 0.4 22.97 0.8 0.8 2463.35 1278.82
*See Annexure IV
1568Pre-monsoon 7.1Monsoon 6.7Post-monsoon 6.8
6.56.66.76.86.97.07.17.2
Var
iati
on
in
pH
pH
1568Pre-monsoon 75Monsoon 51Post-monsoon 45
01020304050607080
Var
iati
on
in
EC
Electrical Conductivity,µmhos/cm
1568Pre-monsoon 6.7Monsoon 7.5Post-monsoon 7.2
6.26.46.66.87.07.27.47.6
Var
iati
on
in
Do
Dissolved oxygen, mg/l
1568Pre-monsoon 1.0Monsoon 0.3Post-monsoon 1.0
0.0
0.2
0.4
0.6
0.8
1.0
1.2
Var
iati
on
in
Bo
D
Biological oxygen Demand, mg/l
1568Pre-monsoon 744Monsoon 3695Post-monsoon 3533
0500
1000150020002500300035004000
Var
iati
on in
TC
Total Coliform, MPN/100ml
Season PeriodPre monsoon January-May
Monsoon June-SeptemberPost Monsoon October-December

Directory 2019 87
Kerala State Pollution Control Board

Directory 2019
Kerala State Pollution Control Board
88
88
1.27 Kallaipuzha
Kallai River originates from the Cherukulathur village in Kozhikode and joins at Arabian Sea after flowing through Kovoor, Olavanna and kallai. The sampling station is located at Kallai near Kozhikode town.
2019 KALLAI RIVER
River Stations pH EC µmhos/cm
DOmg/l
BODmg/l
TC MPN/100ml
FC MPN/100ml CLASS*
Kallai Bridge 2294 NWMP
Max 7.9 52300 5.8 4.6 28000 12800
Below EMin 7.0 126 2.1 0.2 400 200
Mean 7.5 31630 4.3 1.5 11833 5942
Std. Dev 0.3 15832.06 1.3 1.3 7954.34 3874.73
*See Annexure IV
2294Pre-monsoon 7.5Monsoon 7.8Post-monsoon 7.3
7.07.17.27.37.47.57.67.77.87.9
Var
iati
on in
pH
pH
2294Pre-monsoon 39272Monsoon 28934Post-monsoon 22489
05000
1000015000200002500030000350004000045000
Var
iati
on in
EC
Electrical Conductivity, µmhos/cm
2294Pre-monsoon 3.6Monsoon 5.1Post-monsoon 4.2
0.0
1.0
2.0
3.0
4.0
5.0
6.0
Var
iati
on in
Do
Dissolved oxygen, mg/l
2294Pre-monsoon 1.4Monsoon 0.8Post-monsoon 2.8
0.0
0.5
1.0
1.5
2.0
2.5
3.0
Var
iati
on in
Bo
D
Biological oxygen Demand, mg/l
2294Pre-monsoon 11760Monsoon 11450Post-monsoon 12467
10800110001120011400116001180012000122001240012600
Var
iati
on in
TC
Total Coliform, MPN/100ml
Season PeriodPre monsoon January-May
Monsoon June-SeptemberPost Monsoon October-December

Directory 2019 89
Kerala State Pollution Control Board

Directory 2019
Kerala State Pollution Control Board
90
90
1.28 Korapuzha River
This 40 km long river is formed by the confluence of Alakapuzha and Punnoorpuzha. It originates from the mountains of Wayanad district. It empties into the Lakshadweep Sea at Elattur. The NWMP river station is located at Kanayankode near Kozhikode. SWMP stations are located at Purakkattiri and Anaparakadavu.

Directory 2019 91
Kerala State Pollution Control Board
2019 KORAPUZHA RIVER
River Stations pH EC µmhos/cm
DOmg/l
BODmg/l
TC MPN/100ml
FC MPN/100ml CLASS*
Kanayankode 2295 NWMP
Max 7.9 33250 7.9 2.4 5000 4600
Below EMin 6.4 218 4.1 0.1 400 200
Mean 7.2 16123 5.9 0.9 1867 1319
Std. Dev 0.5 14739.06 1.0 0.8 1199.5 1126.95
Purakkattiri K92 SWMP
Max 7.7 41810 7.0 2.9 9000 7100
Below EMin 6.0 97 4.1 0.3 700 100
Mean 7.1 21875 5.8 1.3 2675 1883
Std. Dev 0.5 18096.19 0.9 0.7 2414.02 1911.13
Anapparakadavu K93 SWMP
Max 8.3 48290 8.2 5.4 13400 11000
Below EMin 6.9 298 4.9 0.3 500 300
Mean 7.6 31844 6.5 1.8 4158 3300
Std. Dev 0.4 16284.79 1.1 1.4 4744.85 3942.77
*See Annexure IV
2295 K92 K93Pre-monsoon 7.5 7.3 7.8Monsoon 6.9 7.1 7.4Post-monsoon 7.0 6.9 7.6
6.46.66.87.07.27.47.67.88.0
Varia
tin in
pH
pH
2295 K92 K93Pre-monsoon 5.9 5.4 6.3Monsoon 5.2 5.6 5.9Post-monsoon 6.7 6.7 7.6
0.01.02.03.04.05.06.07.08.0
Varia
tion
in D
o
Dissolved oxygen,mg/l
2295 K92 K93Pre-monsoon 30520 38692 45418Monsoon 8654 13795 26327Post-monsoon 2088 4620 16577
05000
100001500020000250003000035000400004500050000
Varia
tion
in E
C
Electrical Conductivity, µmhos/cm
2295 K92 K93Pre-monsoon 1.5 1.6 2.1Monsoon 0.2 1.5 2.0Post-monsoon 1.0 0.6 1.3
0.0
0.5
1.0
1.5
2.0
2.5
Varia
tion
in B
oD
Biological oxygen Demand, mg/l
2295 K92 K93Pre-monsoon 1540 1300 2940Monsoon 2275 2900 5000Post-monsoon 1867 4667 5067
0
1000
2000
3000
4000
5000
6000
Varia
tion
in T
C
Total Coliform, MPN/100ml
Season PeriodPre monsoon January-May
Monsoon June-SeptemberPost Monsoon October-December

Directory 2019
Kerala State Pollution Control Board
92
92

Directory 2019 93
Kerala State Pollution Control Board
1.29 Kuppam River
This river originates from the Padinalkad Ghats reserve forest in the Coorg district of Karnataka. It has a length of about 83 km. It joins the River before emptying into the Lakshadweep Sea. The sampling stations selected are at Taliparamba in Kannur and Rayoram near Alakkode.
2019 KUPPAM RIVER
River Stations pH EC µmhos/cm
DOmg/l
BODmg/l
TC MPN/100ml
FC MPN/100ml CLASS*
Rayoram 2298 NWMP
Max 7.8 125 8 2.9 610 130
BMin 6.8 32 4.8 0.0 80 10
Mean 7.3 69 7.2 1.3 338 57
Std. Dev 0.3 27.11 0.9 95.0 179.28 36.43
Thaliparambu 1569 NWMP
Max 7.5 41800 8.2 2.8 790 120
Below EMin 6.2 64 4.9 0.3 49 10
Mean 7.0 17670 6.6 1.4 416 81
Std. Dev 0.4 18630.47 1.3 0.9 219.92 40.1
*See Annexure IV
2298 1569Pre-monsoon 7.6 7.2Monsoon 7.1 6.8Post-monsoon 7.2 6.8
6.26.46.66.87.07.27.47.67.8
Var
iati
on in
pH
pH
2298 1569Pre-monsoon 83 33540Monsoon 70 10633Post-monsoon 45 602
05000
10000150002000025000300003500040000
Var
iati
on in
EC
Electrical Conductivity, µmhos/cm
2298 1569Pre-monsoon 6.9 5.8Monsoon 7.2 7.1Post-monsoon 7.7 7.3
0.01.02.03.04.05.06.07.08.09.0
Var
iati
on in
Do
Dissolved oxygen,mg/l
2298 1569Pre-monsoon 1.3 1.8Monsoon 1.2 0.9Post-monsoon 1.6 1.3
0.00.20.40.60.81.01.21.41.61.82.0
Var
iati
on in
Bo
D
Biological oxygen Demand,mg/l
2298 1569Pre-monsoon 336 368Monsoon 433 490Post-monsoon 217 396
0
100
200
300
400
500
600
Var
iati
on in
TC
Total Coliform, MPN/100ml
Season PeriodPre monsoon January-May
Monsoon June-SeptemberPost Monsoon October-December

Directory 2019
Kerala State Pollution Control Board
94
94

Directory 2019 95
Kerala State Pollution Control Board
1.30 Thalassery River
The Thalasserry River otherwise named as Ponnayam River has a length of 28 km and originates from Kannoth reserve forests of the Western Ghats.It has its presence in the villages of Cheruvancheri, Mudiyanga, Pattyam, Mokeri and Pandakal before joining the Lakshadweep Sea. The selected NWMP river station is at Pathipalam near Thalassery town.
2019 THALASSERY RIVER
River Stations pH EC µmhos/cm
DOmg/l
BODmg/l
TC MPN/100ml
FC MPN/100ml CLASS*
Pathipalam 2296 NWMP
Max 7.4 122 8 2.1 740 150
BMin 6.2 56 1.3 0.3 100 10
Mean 6.6 88 5.3 1.0 390 71
Std. Dev 0.3 0.32 2.0 0.6 174.2 46.8
*See Annexure IV
2296Pre-monsoon 6.9Monsoon 6.4Post-monsoon 6.4
6.16.26.36.46.56.66.76.86.97.0
Var
iati
on
in
pH
pH
2296Pre-monsoon 105Monsoon 81Post-monsoon 70
0
20
40
60
80
100
120
Var
iati
on in
EC
Electrical Conductivity, µmhos/cm
2296Pre-monsoon 4.3Monsoon 5.8Post-monsoon 6.4
0.01.02.03.04.05.06.07.0
Var
iati
on in
Do
Dissolved oxygen,mg/l
2296Pre-monsoon 0.8Monsoon 1.0Post-monsoon 1.1
0.0
0.2
0.4
0.6
0.8
1.0
1.2
Vri
atio
n in
Bo
D
Biological oxygen Demand,mg/l
2296Pre-monsoon 460Monsoon 305Post-monsoon 387
050
100150200250300350400450500
Var
iati
on in
TC
Total Coliform, MPN/100ml
Season PeriodPre monsoon January-May
Monsoon June-SeptemberPost Monsoon October-December

Directory 2019
Kerala State Pollution Control Board
96
96

Directory 2019 97
Kerala State Pollution Control Board
1.31 Ancharakkandy River
The Ancharakkandy River originates from Kannoth reserve forest. It has a total stretch of 48 km. It is strengthened by the confluence of small tributaries namely Kapputhodu and Idumbathodu near Kunderipoyil. This river branches into two at Orikkara and one branch meets the Lakshadweep Sea at Thalassery. The selected NWMP river stations are at Ancharakkandy and Meruvambai. The adjoining town is Koothuparamba. This river has the main water supply schemes of Kuthuparamba, Kizhallur and Mangathadam grama panchayath.
2019 ANCHARAKANDY RIVER
River Stations pH EC µmhos/cm
DOmg/l
BODmg/l
TC MPN/100ml
FC MPN/100ml CLASS*
Meruvambai 2297
NWMP
Max 7.4 135 8 2.5 560 150
BMin 6.4 48 4.2 0.2 100 20
Mean 6.9 82 6.2 1.2 299 66
Std. Dev 0.3 32.86 1.4 0.8 155.71 39.08
Ancharakkandy 2319 NWMP
Max 7.4 22000 8.8 2.1 650 170
Below EMin 6.1 56 4.6 0.1 120 20
Mean 6.8 5938 6.5 0.9 392 78
Std. Dev 0.4 8495.66 1.1 0.6 159.76 45.18
*See Annexure IV

Directory 2019
Kerala State Pollution Control Board
98
98
2297 2319Pre-monsoon 7.2 7.2Monsoon 6.7 6.4Post-monsoon 6.8 6.9
5.86.06.26.46.66.87.07.27.4
Var
iati
on in
pH
pH
2297 2319Pre-monsoon 5.8 6.3Monsoon 6.3 6.4Post-monsoon 6.6 6.9
5.25.45.65.86.06.26.46.66.87.07.2
Var
iati
on in
Do
Dissolved oxygen, mg/l
2297 2319Pre-monsoon 101 10434Monsoon 77 4722Post-monsoon 57 68
0
2000
4000
6000
8000
10000
12000
Var
iati
on in
EC
Electrical Conductivity, µmhos/cm
2297 2319Pre-monsoon 1.5 1.2Monsoon 0.9 0.7Post-monsoon 0.9 0.6
0.00.20.40.60.81.01.21.41.61.8
Var
iati
on in
Bo
D
Biological oxygen Demand, mg/l
2297 2319Pre-monsoon 348 440Monsoon 228 305Post-monsoon 313 427
050
100150200250300350400450500
Var
iati
on in
TC
Total Coliform, MPN/100ml
Season PeriodPre monsoon January-May
Monsoon June-SeptemberPost Monsoon October-December

Directory 2019 99
Kerala State Pollution Control Board

Directory 2019
Kerala State Pollution Control Board
100
100
1.32 Ramapuram River
The Ramapuram River originates from the hills in Iringal village in Kannur district. It flows through the villages of Pariyaram, Kolapartvayal, Cherythazham and Madai. The river finally drains into the Kavai backwaters. The NWMP river station is located at Ramapuram bridge in Pazhayangady town in Kannur.
2019 RAMAPURAM RIVER
River Stations pH EC µmhos/cm
DOmg/l
BODmg/l
TC MPN/100ml
FC MPN/100ml CLASS*
Ramapuram 2299 NWMP
Max 7.7 53500 8.3 2.4 500 150
Below EMin 6.1 131 3.2 0.3 100 10
Mean 7.0 18506 4.8 1.4 218 39
Std. Dev 0.5 21727.85 1.4 0.6 141.49 38.46
*See Annexure IV
2299Pre-monsoon 7.5Monsoon 6.7Post-monsoon 6.8
6.26.46.66.87.07.27.47.6
Var
iati
on
in
pH
pH
2299Pre-monsoon 32990Monsoon 13818Post-monsoon 619
05000
100001500020000250003000035000
Var
iati
on
in
EC
Electrical Conductivity, µmhos/cm
2299Pre-monsoon 5.5Monsoon 4.2Post-monsoon 4.3
0.0
1.0
2.0
3.0
4.0
5.0
6.0
Var
iati
on
in
Do
Dissolved oxygen, mg/l
2299Pre-monsoon 1.7Monsoon 0.9Post-monsoon 1.4
0.00.20.40.60.81.01.21.41.61.8
Var
iati
on
in
Bo
D
Biological oxygen Demand, mg/l
2299Pre-monsoon 190Monsoon 195Post-monsoon 293
0
50
100
150
200
250
300
350
Var
iati
on in
TC
Total Coliform, MPN/100ml
Season PeriodPre monsoon January-May
Monsoon June-SeptemberPost Monsoon October-December

Directory 2019 101
Kerala State Pollution Control Board

Directory 2019
Kerala State Pollution Control Board
102
102
1.33 Kavai River
This river has a length of about 31 km and originates from Cheemeni hillock. It flows through Alapadamba and Vadassery and finally enters the backwater at Udumbunthala. Check dams are constructed in the upstream and down stream of this river. The selected NWMP sampling station is at Kuttiyolpalam in Peralam Village near Payyanur.
2019 KAVAI RIVER
River Stations pH EC µmhos/cm
DOmg/l
BODmg/l
TC MPN/100ml
FC MPN/100ml CLASS*
Kuttiyolpalam 2301 NWMP
Max 7.3 20700 6.3 2.1 810 180
CMin 5.8 42 3.6 0.3 50 10
Mean 6.7 1803 4.8 1.1 481 99
Std. Dev 0.4 5951.15 0.9 0.6 288.27 59.21
*See Annexure IV
2301Pre-monsoon 7.0Monsoon 6.4Post-monsoon 6.8
6.06.16.26.36.46.56.66.76.86.97.07.1
Var
iati
on in
pH
pH
2301Pre-monsoon 116Monsoon 5224Post-monsoon 52
0
1000
2000
3000
4000
5000
6000
Var
iati
on in
EC
Electrical Conductivity, µmhos/cm
2301Pre-monsoon 4.5Monsoon 4.5Post-monsoon 5.7
0.0
1.0
2.0
3.0
4.0
5.0
6.0
Var
iati
on in
Do
Dissolved oxygen, mg/l
2301Pre-monsoon 1.3Monsoon 1.0Post-monsoon 0.9
0.00.20.40.60.81.01.21.4
Var
iati
on in
Bo
D
Biological oxygen Demand, mg/l
2301Pre-monsoon 522Monsoon 528Post-monsoon 350
0
100
200
300
400
500
600
Var
iati
on in
TC
Total Coliform, MPN/100ml
Season PeriodPre monsoon January-May
Monsoon June-SeptemberPost Monsoon October-December

Directory 2019 103
Kerala State Pollution Control Board

Directory 2019
Kerala State Pollution Control Board
104
104
1.34 Valapattanam River
Valapattanam River originates from Brahmagiri forests of Kodagu district in Karnataka State and joins Kuppam River and empties into the Arabian Sea. It has a length of 110 km. The irrigation project, Pazhassi Dam is in Valapattanam river. Major tributaries are Srikandapuram, Bharapuzha Valiyapuzha, Venipuzha and Aralampuzha. The NWMP stations selected are Parassinikadavu( near Parassinikadavu temple) and Pazhassi Reservoir. SWMP stations are located at Valapattanam, Chenglayi, Irikoor.
2019 VALAPATTANAM RIVER
River Stations pH EC µmhos/cm
DOmg/l
BODmg/l
TC MPN/100ml
FC MPN/100ml CLASS*
Pazhassi 2318 NWMP
Max 8 92 8.1 1.2 500 160
BMin 6.7 36 6.3 0.1 40 5
Mean 7.4 66 7.5 0.6 251 53
Std. Dev 0.4 17.54 0.5 0.4 167.6 42.43
Irikkoor K94
SWMP
Max 8.0 1248 7.9 2.2 800 160
BMin 6.4 36 6.9 0.1 100 10
Mean 7.4 181 7.4 1.0 371 57
Std. Dev 0.5 338.85 0.3 0.7 232.12 53.98
Chengalayi K95 SWMP
Max 8.0 29900 8.0 1.8 650 120
Below EMin 6.8 42 4.9 0.2 50 8
Mean 7.3 10266 6.8 0.9 264 41
Std. Dev 0.4 12123.93 1.0 0.5 177.43 36.05
Parassinikadavu 3473 NWMP
Max 7.6 42600 8.2 2.7 750 170
Below EMin 6.9 66 4.5 0.7 31 5
Mean 7.3 21844 6.6 1.8 265 64
Std. Dev 0.3 18398.18 1.2 0.6 238.31 59.48

Directory 2019 105
Kerala State Pollution Control Board
2318 K94 K95 3473 K96Pre-monsoon 7.8 7.8 7.4 7.5 7.8Monsoon 7.1 6.9 7.1 7.0 7.2Post-monsoon 7.2 7.3 7.4 7.3 7.4
6.46.66.87.07.27.47.67.88.0
Var
iati
on in
pH
pH
2318 K94 K95 3473 K96Pre-monsoon 7.6 7.5 6.3 6.0 6.1Monsoon 7.6 7.5 6.9 7.0 5.8Post-monsoon 7.1 7.2 7.3 7.0 5.7
0.01.02.03.04.05.06.07.08.0
Var
iati
on in
Do
Dissolved oxygen, mg/l
2318 K94 K95 3473 K96Pre-monsoon 80 335 19282 38400 36580Monsoon 59 82 6626 11734 14068Post-monsoon 55 58 95 7730 22117
05000
1000015000200002500030000350004000045000
Var
iati
on in
EC
Electrical Conductivity, µmhos/cm
2318 K94 K95 3473 K96Pre-monsoon 0.6 1.2 0.8 1.8 1.6Monsoon 0.5 0.7 0.8 1.9 1.5Post-monsoon 0.9 0.9 0.9 1.4 2.8
0.0
0.5
1.0
1.5
2.0
2.5
3.0
Var
iati
on in
Bo
D
Biological oxygen Demand, mg/l
2318 K94 K95 3473 K96Pre-monsoon 153 498 364 234 236Monsoon 363 370 210 348 448Post-monsoon 267 160 170 207 580
0100200300400500600700
Var
iati
on in
TC
Total Coliform, MPN/100ml
Valapattanam K96 SWMP
Max 8.0 45200 7.7 3.1 800 240
Below EMin 6.9 663 3.6 0.3 120 16
Mean 7.5 25460 5.9 1.8 393 68
Std. Dev 0.3 16324.24 1.2 1.0 211.45 65.57
*See Annexure IV
Season PeriodPre monsoon January-May
Monsoon June-SeptemberPost Monsoon October-December

Directory 2019
Kerala State Pollution Control Board
106
106

Directory 2019 107
Kerala State Pollution Control Board
1.35 Neeleswaram River
The Neeleswaram River originates from Hosdurg taluk in Kasaragod district and joins Karingode River at Kottappuram. It has a total length of 41 km. Two NWMP stations are located in this river, one at Nambiarackal dam, a check dam for preventing saline water intrusion, near Padannakkkad and the other at Hosdurg near Kerala Agricultural University.
2019 NEELESWARAM RIVER
River Stations pH EC-µmhos/cm DO- mg/l BOD- mg/l TC-MPN/100ml FC-MPN/100ml CLASS*
Nambiarckal 2302 NWMP
Max 8.1 820 8.2 2.7 940 240
BMin 6.2 53 5.9 0.6 120 26
Mean 7.1 266 6.6 1.8 500 101
Std. Dev 0.7 292.77 0.8 0.7 246.54 61.1
Hosdurg 1570 NWMP
Max 8.1 40000 8.2 2.9 1400 390
Below EMin 6.3 75 3.0 0.4 230 32
Mean 7.1 16353 6.2 1.7 705 150
Std. Dev 0.6 19864.25 1.4 0.7 481.39 130
*See Annexure IV
1570 2302Pre-monsoon 7.6 0.8Monsoon 7.0 1.0Post-monsoon 6.5 0.5
0.01.02.03.04.05.06.07.08.09.0
Var
iati
on
in
pH
pH
1570 2302Pre-monsoon 38818 535Monsoon 445 87Post-monsoon 122 58
05000
1000015000200002500030000350004000045000
Var
iati
on in
EC
Electrical Conductivity, µmhos/cm
1570 2302Pre-monsoon 5.3 6.3Monsoon 6.4 6.7Post-monsoon 7.5 7.1
0.01.02.03.04.05.06.07.08.0
Var
iati
on in
Do
Dissolved oxygen, mg/l
1570 2302Pre-monsoon 5.3 6.3Monsoon 6.4 6.7Post-monsoon 7.5 7.1
0.01.02.03.04.05.06.07.08.0
Var
iati
on in
Do
Dissolved oxygen, mg/l
1570 2302Pre-monsoon 1220 636Monsoon 365 450Post-monsoon 300 340
0
200
400
600
800
1000
1200
1400
Var
iati
on in
TC
Total Coliform, MPN/100ml
Season PeriodPre monsoon January-May
Monsoon June-SeptemberPost Monsoon October-December

Directory 2019
Kerala State Pollution Control Board
108
108

Directory 2019 109
Kerala State Pollution Control Board
1.36 Kariangode River
The Kariangode River flows through Hosdurg taluk. It has a total length of 64 km. This river falls into the Lakshadweep Sea. The NWMP sampling station located is at Kakkadavu near Cheemeni. During summer a check dam is constructed to divert the river to Ezhimala Naval Academy.
2019 KARIANgODE RIVER
River Stations pH EC µmhos/cm
DOmg/l
BODmg/l
TC MPN/100ml
FC MPN/100ml CLASS*
Kakkadavu 1571 NWMP
Max 8.1 105 8.7 1.8 840 220
BMin 6.4 54 4.1 0.0 65 16
Mean 7.2 71 7.3 0.7 296 61
Std. Dev 0.5 13.09 1.3 0.5 295.01 62.44
*See Annexure IV
1571Pre-monsoon 7.7Monsoon 7.1Post-monsoon 6.7
6.06.26.46.66.87.07.27.47.67.8
Var
iati
on
in
pH
pH
1571Pre-monsoon 76Monsoon 68Post-monsoon 66
60626466687072747678
Var
iati
on
in
EC
Electrical Conductivity, µmhos/cm
1571Pre-monsoon 6.9Monsoon 7.4Post-monsoon 7.9
6.26.46.66.87.07.27.47.67.88.0
Var
iati
on
in
Do
Dissolved oxygen, mg/l
1571Pre-monsoon 0.6Monsoon 0.8Post-monsoon 0.6
0.00.10.20.30.40.50.60.70.80.9
Var
iati
on
in
Bo
D
Biological oxygen Demand, mg/l
1571Pre-monsoon 517Monsoon 158Post-monsoon 110
0
100
200
300
400
500
600
Var
iati
on in
TC
Total Coliform, MPN/100ml
Season PeriodPre monsoon January-May
Monsoon June-SeptemberPost Monsoon October-December

Directory 2019
Kerala State Pollution Control Board
110
110

Directory 2019 111
Kerala State Pollution Control Board
1.37 Chandragiripuzha
This river has a length of 105 km and originates from Puttibattu forest in Karnataka State. It flows westwards and falls into the Lakshadweep Sea. The NWMP river station located is at Padiyathadka in Kasaragod district.
2019 CHANDRAgIRI RIVER
River Stations pH EC µmhos/cm
DOmg/l
BODmg/l
TC MPN/100ml
FC MPN/100ml CLASS*
Padiathadka 1572 NWMP
Max 8.1 120 8.7 2.8 1200 280
BMin 6.3 39 6.3 0.3 92 17
Mean 6.9 67 7.6 1.4 350 64
Std. Dev 0.7 22.19 0.8 0.9 341.01 81.26
*See Annexure IV
1572Pre-monsoon 7.6Monsoon 6.7Post-monsoon 6.3
0.01.02.03.04.05.06.07.08.09.0
Var
iati
on
in
pH
pH
1572Pre-monsoon 89Monsoon 59Post-monsoon 56
0102030405060708090
100
Var
iati
on
in
EC
Electrical Conductivity, µmhos/cm
1572Pre-monsoon 7.5Monsoon 7.1Post-monsoon 8.4
6.46.66.87.07.27.47.67.88.08.28.48.6
Var
iati
on
in
Do
Dissolved oxygen, mg/l
1572Pre-monsoon 0.8Monsoon 1.6Post-monsoon 1.6
0.00.20.40.60.81.01.21.41.61.8
Var
iati
on
in
Bo
D
Biological oxygen Demand, mg/l
1572Pre-monsoon 664Monsoon 198Post-monsoon 240
0
100
200
300
400
500
600
700
Var
iati
on
in
TC
Total Coliform, MPN/100ml
Season PeriodPre monsoon January-May
Monsoon June-SeptemberPost Monsoon October-December

Directory 2019
Kerala State Pollution Control Board
112
112

Directory 2019 113
Kerala State Pollution Control Board
1.38 Mogral River
This river is 34 km long and originates from the forest of Nathoorkarnataka in Kasaragod district. It flows through Yatirir, Madhur and Patla and merges with the Lakshadweep Sea. The NWMP river station is located at Mogral Bridge near Mogral town.
2019 MOgRAL RIVER
River Stations pH EC µmhos/cm
DOmg/l
BODmg/l
TC MPN/100ml
FC MPN/100ml CLASS*
Mogral Bridge2304 NWMP
Max 7.9 49800 7.8 2.1 1720 430
Below EMin 6.2 119 4.1 0.5 150 31
Mean 7.0 21370 6.0 1.3 703 178
Std. Dev 0.6 23018.71 1.3 0.5 648.15 150.77
*See Annexure IV
2304Pre-monsoon 7.6Monsoon 6.5Post-monsoon 6.7
5.86.06.26.46.66.87.07.27.47.67.8
Var
iati
on
in
pH
pH
2304Pre-monsoon 47253Monsoon 1218Post-monsoon 5101
05000
100001500020000250003000035000400004500050000
Var
iati
on
in
EC
Electrical Conductivity, µmhos/cm
2304Pre-monsoon 4.9Monsoon 6.8Post-monsoon 6.7
0.01.02.03.04.05.06.07.08.0
Var
iati
on in
Do
Dissolved oxygen, mg/l
2304Pre-monsoon 1.5Monsoon 1.4Post-monsoon 0.9
0.00.20.40.60.81.01.21.41.6
Var
iati
on
in
Bo
D
Biological oxygen Demand,mg/l
2304Pre-monsoon 1392Monsoon 223Post-monsoon 193
0200400600800
1000120014001600
Var
iati
on in
TC
Total Coliform, MPN/100ml
Season PeriodPre monsoon January-May
Monsoon June-SeptemberPost Monsoon October-December

Directory 2019
Kerala State Pollution Control Board
114
114

Directory 2019 115
Kerala State Pollution Control Board
1.39 Shiriya River
The Shiriya River originates in the State of Karnataka, travels through a length of 61 km and joins the Kumbala Lake and empties into the Lakshadweep Sea. The NWMP Sampling station is at Angadimogaru town in Kasaragod district. The SWMP sampling stations are Yethdka, Bakkilapadavu, Swargathodu, Vaninagar, Sullyapadavu.
2019 SHIRIYA RIVER
River Stations pH EC µmhos/cm
DO mg/l
BOD mg/l
TC MPN/100ml
FC MPN/100ml CLASS*
Yethadka K97 SWMP
Max 8.2 86 11.5 3.4 1560 435
BMin 6.1 64 5.6 0.5 40 4
Mean 7.0 73 8.2 1.3 442 135
Std. Dev 0.7 8.28 1.5 1.0 614.51 178.58
Bakkilapadavu K98
SWMP
Max 8.0 102 9.7 3.6 1720 448
BMin 6.1 52 5.5 0.4 50 4
Mean 6.8 64 7.9 1.4 409 109
Std. Dev 0.6 15.9 1.2 1.0 631.04 176.78
Swargathodu K99 SWMP
Max 8.1 80 8.7 1.3 1550 480
BMin 6.3 31 4.0 0.1 50 4
Mean 7.0 50 7.3 0.7 436 118
Std. Dev 0.6 13.11 1.4 0.5 591.88 173.45
Vani Nagar K100 SWMP
Max 7.8 98 9.6 2.5 1670 480
BMin 6.1 54 4.7 0.1 30 4
Mean 6.8 71 7.2 1.2 471 112
Std. Dev 0.6 16.13 1.6 0.7 684.7 176.67
Sullyapadavu K101 SWMP
Max 6.7 189 8.7 1.2 1480 416
BMin 6.0 70 5.2 0.5 30 4
Mean 6.5 98 7.6 0.9 250 70
Std. Dev 0.3 40.92 1.2 0.2 542.53 152.58

Directory 2019
Kerala State Pollution Control Board
116
116
Angadimogaru 2305 NWMP
Max 7.0 66 9.7 2.8 540 80
BMin 6.1 39 7.0 0.1 85 19
Mean 6.6 55 8.2 1.9 332 56
Std. Dev 0.3 11.5 0.8 0.8 154.36 19.82
*See Annexure IV
K97 K98 K99 K100 K101 2305Pre-monsoon 7.4 7.1 7.2 7.2 6.2 6.8Monsoon 6.9 6.4 6.6 6.5 6.3 6.8Post-monsoon 6.8 7.0 7.1 6.8 6.7 6.3
0.01.02.03.04.05.06.07.08.0
Var
iati
on in
pH
pH
K97 K98 K99 K100 K101 2305Pre-monsoon 9.1 9.0 5.6 5.9 5.2 7.0Monsoon 7.6 7.0 7.5 7.1 7.6 8.3Post-monsoon 8.2 8.3 8.1 8.8 8.3 8.4
0.01.02.03.04.05.06.07.08.09.0
10.0
Var
iati
on in
Do
Dissolved oxygen, mg/l
K97 K98 K99 K100 K101 2305Pre-monsoon 76 79 67 69 189 65Monsoon 74 64 42 80 92 52Post-monsoon 68 54 48 61 75 56
020406080
100120140160180200
Var
iati
on in
EC
Electrical Coductivity, µmhos/cm
K97 K98 K99 K100 K101 2305Pre-monsoon 2.6 2.4 1.0 1.7 0.9 2.0Monsoon 0.8 1.0 0.9 0.7 0.8 2.4Post-monsoon 0.8 1.3 0.4 1.3 0.9 1.1
0.0
0.5
1.0
1.5
2.0
2.5
3.0
Var
iati
on in
Bo
D
Biological oxygen Demand, mg/l
K97 K98 K99 K100 K101 2305Pre-monsoon 1313 1500 1450 1427 1480 85Monsoon 83 123 215 63 37 363Post-monsoon 50 63 53 60 53 373
0200400600800
1000120014001600
Varia
tion
in T
C
Total Coliform, MPN/100ml
Season PeriodPre monsoon January-May
Monsoon June-SeptemberPost Monsoon October-December

Directory 2019 117
Kerala State Pollution Control Board

Directory 2019
Kerala State Pollution Control Board
118
118
1.40 Uppala River
The Uppala River has a length of 50 km and originates from the Veejakumbha hills in Karnataka State. It flows through Kasaragod and empties into the Lakshadweep Sea at the northern part of Uppala town. The NWMP sampling station is located at Uppala.
2019 UPPALA RIVER
River Stations pH EC µmhos/cm
DO mg/l
BOD mg/l
TC MPN/100ml
FC MPN/100ml CLASS*
Uppala Bridge 2306 NWMP
Max 7.9 46500 9.1 3.3 1980 490
Below EMin 6.1 62 4.4 0.1 110 32
Mean 7.1 17812 6.7 1.8 701 180
Std. Dev 0.5 21491.77 1.3 0.9 730.24 173.25
*See Annexure IV
2306Pre-monsoon 7.6Monsoon 6.7Post-monsoon 7.0
6.26.46.66.87.07.27.47.67.8
Var
iati
on
in
pH
pH
2306Pre-monsoon 42086Monsoon 198Post-monsoon 838
05000
1000015000200002500030000350004000045000
Var
iati
on
in
EC
Electrical Conductivity,µmhos/cm
2306Pre-monsoon 5.6Monsoon 7.3Post-monsoon 7.9
0.01.02.03.04.05.06.07.08.09.0
Var
iati
on
in
Do
Dissolved oxygen, mg/l
2306Pre-monsoon 2.3Monsoon 1.7Post-monsoon 1.1
0.0
0.5
1.0
1.5
2.0
2.5
Var
iati
on
in
Bo
D
Biological oxygen Demand, mg/l
2306Pre-monsoon 1456Monsoon 160Post-monsoon 163
0200400600800
1000120014001600
Var
iati
on
in
TC
Total Coliform, MPN/100ml
Season PeriodPre monsoon January-May
Monsoon June-SeptemberPost Monsoon October-December

Directory 2019 119
Kerala State Pollution Control Board

Directory 2019
Kerala State Pollution Control Board
120
120
1.41 Manjeswaram River
This 16 km long river originates from the northern boundary of Jeraka, Kasaragod district. It flows through the villages of Pavoori and Badajay and finally combines with Uppala River. The selected NWMP river station is located at Bajrakkara Bridge in Kasaragod.
2019 MANJESWARAM RIVER
River Stations pH EC µmhos/cm
DO mg/l
BOD mg/l
TC MPN/100ml
FC MPN/100ml CLASS*
Bajrakkara 2307 NWMP
Max 8.2 228 8.5 2.9 940 220
BMin 6.2 54 3.0 1.0 40 4
Mean 7.0 96 7.0 1.9 177 41
Std. Dev 0.7 57.87 1.8 0.7 286.7 67.81
*See Annexure IV
2307Pre-monsoon 8.2Monsoon 6.6Post-monsoon 6.7
0.01.02.03.04.05.06.07.08.09.0
Var
iati
on
in
pH
pH
2307Pre-monsoon 189Monsoon 73Post-monsoon 65
020406080
100120140160180200
Var
iati
on
in
EC
Electrical Conductivity, µmhos/cm
2307Pre-monsoon 4.2Monsoon 7.5Post-monsoon 8.4
0.01.02.03.04.05.06.07.08.09.0
Var
iati
on
in
Do
Dissolved oxygen, mg/l
2307Pre-monsoon 1.8Monsoon 1.9Post-monsoon 2.0
1.61.71.71.81.81.91.92.02.02.12.1
Var
iati
on
in
Bo
D
Biological oxygen Demand, mg/l
2307Pre-monsoon 508Monsoon 83Post-monsoon 84
0
100
200
300
400
500
600
Var
iati
on i
n TC
Total Coliform, MPN/100ml
Season PeriodPre monsoon January-May
Monsoon June-SeptemberPost Monsoon October-December

Directory 2019 121
Kerala State Pollution Control Board

Directory 2019
Kerala State Pollution Control Board
122
122
1.42 Peruvamba River
This 51 km long river originates from the Western Ghats near Pekkunnu in Vayakara village. It flows through Peringome, Kuttur, Mathamangalam and Kunhimangalam. It bifurcates at Ezhimala and one branch falls into Kavai backwaters and the other into the Lakshadweep Sea.Mancharuthuthodu, the main tributary of the river originates from Pekkunnu joins the river at Mathamangalam. The other important streams are the Challachal, the Mukkuttenkarachal and the Nitaringapuzha. The selected NWMP station in this river is at Chandapura near Taliparamba town.
2019 PERUVAMBA RIVER
River Stations pH EC µmhos/cm
DO mg/l
BOD mg/l
TC MPN/100ml
FC MPN/100ml CLASS*
Chandrapura 2300 NWMP
Max 7.3 100 7.1 2.6 760 210
BMin 6.3 39 4.4 0.2 150 20
Mean 6.8 147 5.9 1.4 368 68
Std. Dev 0.4 300.75 1.1 0.8 178.64 54.36
*See Annexure IV
2300Pre-monsoon 7.1Monsoon 6.7Post-monsoon 6.6
6.46.56.66.76.86.97.07.1
Var
iati
on
in
pH
pH
2300Pre-monsoon 78Monsoon 310Post-monsoon 44
050
100150200250300350
Var
iati
on
in
EC
Electrical Conductivity, µmhos/cm
2300Pre-monsoon 5.5Monsoon 5.7Post-monsoon 6.9
0.01.02.03.04.05.06.07.08.0
Var
iati
on
in
Do
Dissolved oxygen, mg/l
2300Pre-monsoon 1.5Monsoon 0.9Post-monsoon 1.7
0.00.20.40.60.81.01.21.41.61.8
Var
iati
on
in
Bo
D
Biological oxygen Demand, mg/l
2300Pre-monsoon 340Monsoon 365Post-monsoon 417
050
100150200250300350400450
Var
iati
on in
TC
Total Coliform, MPN/100ml
Season PeriodPre monsoon January-May
Monsoon June-SeptemberPost Monsoon October-December

Directory 2019 123
Kerala State Pollution Control Board
1.43 Thodupuzha River
It is originated from Thodupuzha Taluk in the Idukki district and is a tributary of the Muvattupuzha river. The SWMP stations located in the river are Thookupalam, Near Chittoor, Near Vengalloor Bridge, Near Pappootty Bar & Restaurant, Near Moopilkadavu Bridge, Near Malankara Dam.
2019 THODUPUZHA RIVER
River Stations pH EC µmhos/cm
DO mg/l
BODmg/l
TC MPN/100ml
FC MPN/100ml CLASS*
Near Malankara DamK102 SWMP
Max 7 90 8.1 2.7 16200 4400
DMin 5.9 45 6.6 1.1 1600 500
Mean 6.3 69 7.3 1.7 5458 1892
Std. Dev 0.3 15.6 0.4 0.5 3872.62 1137.35
Near Mooppilakkadavu Bridge K103 SWMP
Max 7.0 96 7.9 2.8 12600 7400
DMin 5.8 50 6.4 0.8 1700 1100
Mean 6.4 72 7.4 1.6 6767 2867
Std. Dev 0.4 15.94 0.4 0.6 3268.4 1732.23
Near Pappootty Bar &Restaurant
K104SWMP
Max 7.5 103 8.4 2.5 18400 6400
DMin 5.9 44 6.1 1.1 1800 900
Mean 6.5 70 7.6 1.8 7783 3283
Std. Dev 0.5 17.67 0.7 0.4 4770.71 1830.96
Near Vengalloor Bridge K105 SWMP
Max 7.0 89 8.0 2.9 12800 5900
DMin 5.9 51 5.6 1.0 1400 300
Mean 6.4 71 7.3 1.7 6008 2683
Std. Dev 0.3 13.14 0.6 0.6 3299.16 1457.79
Thookkupalam Near Chittoor K106 SWMP
Max 6.6 100 8.0 2.7 8700 4700
DMin 5.9 50 5.1 1.5 3600 900
Mean 6.4 74 7.3 2.0 5892 2958
Std. Dev 0.2 14.54 0.8 0.4 1613.27 1172.77
*See Annexure IV

Directory 2019
Kerala State Pollution Control Board
124
124
K102 K103 K104 K105 K106Pre-monsoon 6.2 6.2 6.2 6.3 6.3Monsoon 6.1 6.3 6.5 6.4 6.4Post-monsoon 6.7 6.8 7.0 6.8 6.3
5.45.65.86.06.26.46.66.87.07.2
Var
iati
on in
pH
pH
K102 K103 K104 K105 K106Pre-monsoon 7.2 7.2 7.9 7.5 7.2Monsoon 7.6 7.6 7.4 7.4 7.3Post-monsoon 7.2 7.2 7.5 6.6 7.5
6.06.26.46.66.87.07.27.47.67.88.0
Var
iati
on in
Do
Dissolved oxygen, mg/l
K102 K103 K104 K105 K106Pre-monsoon 78 86 81 80 87Monsoon 67 64 64 66 64Post-monsoon 54 59 59 61 67
0102030405060708090
100
Var
iati
on in
EC
Electrical Conductivity, µmhos/cm
K102 K103 K104 K105 K106Pre-monsoon 1.9 1.6 2.0 2.0 2.1Monsoon 1.6 1.7 1.6 1.5 1.9Post-monsoon 1.5 1.6 1.6 1.4 1.9
0.0
0.5
1.0
1.5
2.0
2.5
Var
iati
on in
Bo
D
Biological oxygen Demand, mg/l
K102 K103 K104 K105 K106Pre-monsoon 4020 9440 8340 7420 7080Monsoon 8800 4850 9625 6200 5725Post-monsoon 3400 4867 4400 3400 4133
0
2000
4000
6000
8000
10000
12000
Var
iati
on in
TC
Total Coliform, MPN/100ml
Season PeriodPre monsoon January-May
Monsoon June-SeptemberPost Monsoon October-December
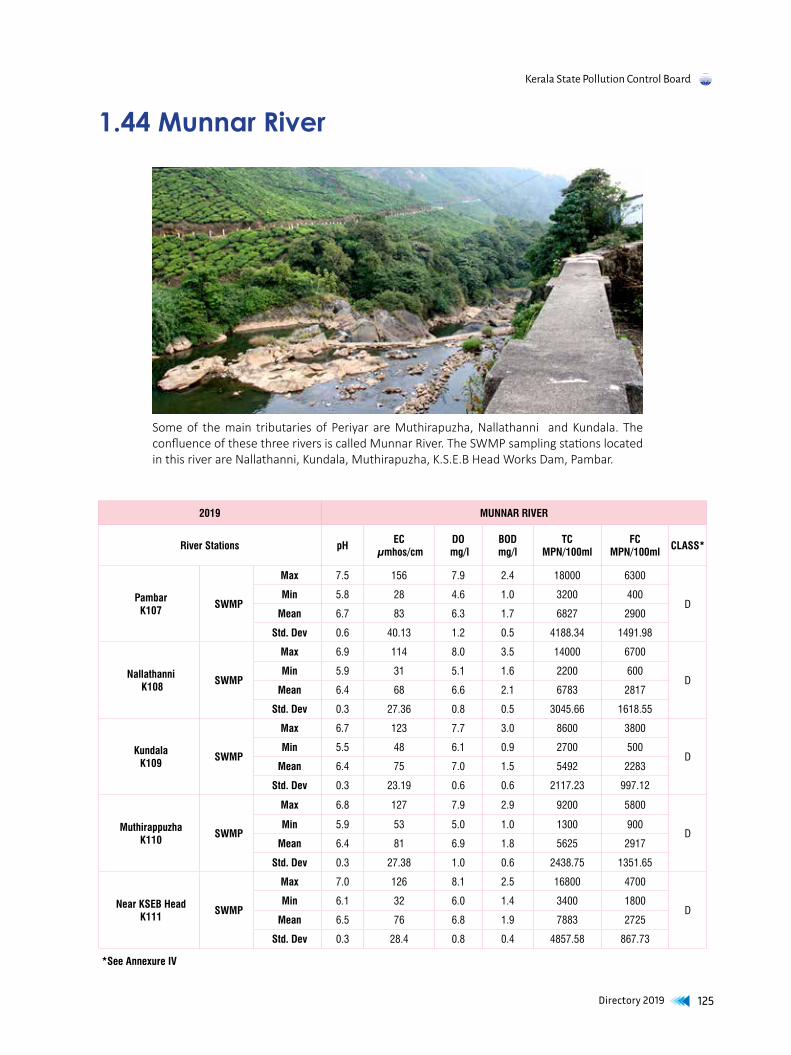
Directory 2019 125
Kerala State Pollution Control Board
1.44 Munnar River
Some of the main tributaries of Periyar are Muthirapuzha, Nallathanni and Kundala. The confluence of these three rivers is called Munnar River. The SWMP sampling stations located in this river are Nallathanni, Kundala, Muthirapuzha, K.S.E.B Head Works Dam, Pambar.
2019 MUNNAR RIVER
River Stations pH EC µmhos/cm
DO mg/l
BODmg/l
TC MPN/100ml
FC MPN/100ml CLASS*
Pambar K107 SWMP
Max 7.5 156 7.9 2.4 18000 6300
DMin 5.8 28 4.6 1.0 3200 400
Mean 6.7 83 6.3 1.7 6827 2900
Std. Dev 0.6 40.13 1.2 0.5 4188.34 1491.98
Nallathanni K108 SWMP
Max 6.9 114 8.0 3.5 14000 6700
DMin 5.9 31 5.1 1.6 2200 600
Mean 6.4 68 6.6 2.1 6783 2817
Std. Dev 0.3 27.36 0.8 0.5 3045.66 1618.55
Kundala K109 SWMP
Max 6.7 123 7.7 3.0 8600 3800
DMin 5.5 48 6.1 0.9 2700 500
Mean 6.4 75 7.0 1.5 5492 2283
Std. Dev 0.3 23.19 0.6 0.6 2117.23 997.12
Muthirappuzha K110
SWMP
Max 6.8 127 7.9 2.9 9200 5800
DMin 5.9 53 5.0 1.0 1300 900
Mean 6.4 81 6.9 1.8 5625 2917
Std. Dev 0.3 27.38 1.0 0.6 2438.75 1351.65
Near KSEB Head K111 SWMP
Max 7.0 126 8.1 2.5 16800 4700
DMin 6.1 32 6.0 1.4 3400 1800
Mean 6.5 76 6.8 1.9 7883 2725
Std. Dev 0.3 28.4 0.8 0.4 4857.58 867.73
*See Annexure IV

Directory 2019
Kerala State Pollution Control Board
126
126
K107 K108 K109 K110 K111Pre-monsoon 6.5 6.4 6.2 6.4 6.4Monsoon 6.5 6.4 6.4 6.4 6.4Post-monsoon 7.2 6.5 6.5 6.5 6.7
5.65.86.06.26.46.66.87.07.27.4
Var
iati
on in
pH
pH
K107 K108 K109 K110 K111Pre-monsoon 5.6 6.7 7.2 6.9 6.9Monsoon 6.5 6.4 6.9 6.8 6.9Post-monsoon 7.0 7.0 6.6 6.9 6.4
0.01.02.03.04.05.06.07.08.0
Var
iati
on I
Do
Dissolved oxygen, mg/l
K107 K108 K109 K110 K111Pre-monsoon 96 73 89 96 83Monsoon 79 53 71 73 73Post-monsoon 67 81 58 67 66
0
20
40
60
80
100
120
Var
iati
on in
EC
Electrical Conductivity,µmhos/cm
K107 K108 K109 K110 K111Pre-monsoon 1.8 2.5 1.7 1.9 2.3Monsoon 1.7 1.9 1.6 1.8 1.7Post-monsoon 1.4 1.7 1.2 1.8 1.5
0.0
0.5
1.0
1.5
2.0
2.5
3.0
Var
iati
on in
Bo
D
Biological oxygen Demand,mg/l
K107 K108 K109 K110 K111Pre-monsoon 8280 7600 6240 5680 11000Monsoon 6700 7250 5550 6750 7025Post-monsoon 4533 4800 4167 4033 3833
0
2000
4000
6000
8000
10000
12000
Var
iati
on in
TC
Total Coliform, MPN/100ml
Season PeriodPre monsoon January-May
Monsoon June-SeptemberPost Monsoon October-December

Directory 2019 127
Kerala State Pollution Control Board
127
RivuletS/tRibutaRieS

Directory 2019
Kerala State Pollution Control Board
128
128

Directory 2019 129
Kerala State Pollution Control Board

Directory 2019
Kerala State Pollution Control Board
130
130
2.1 Kadambrayar riverThe Kadambrayar is the drain from the irrigation canals of Bhoothathankettu which are well connected with the adjoining paddy fields. The Kadambrayar joins Chitrapuzha near Brahmapuram. The two stations monitoring under the National water quality Programme (NWMP) are at Brahmapuram (2337)andManakkakadavu (2338).
2019 KADAMBRAYAR
River Stations pH EC µmhos/cm
DO mg/l
BODmg/l
TCMPN/100ml
FC MPN/100ml CLASS*
Manakkakadavu 2338 NWMP
Max 7.6 160 8.4 4.4 7900 6300
EMin 6.5 88 0.8 0.4 340 120
Mean 7.0 118 3.5 2.2 3178 2038
Std. Dev 0.3 23.22 2.3 1.1 2414.99 2143.41
Brahmapuram 2337 NWMP
Max 7.3 210 4.8 3.6 120000 100000
EMin 6.5 94 0.8 1.2 700 200
Mean 6.8 133 1.9 2.4 28758 19765
Std. Dev 0.3 36.52 1.2 0.6 43238.15 34539.82
*See Annexure IV
2338 2337Pre-monsoon 7.0 6.9Monsoon 7.1 6.9Post-monsoon 6.7 6.7
6.56.66.76.86.97.07.17.2
Var
iati
on
in
pH
pH
2338 2337Pre-monsoon 115 120Monsoon 131 145Post-monsoon 106 140
020406080
100120140160
Var
iati
on
in
EC
Electrical Conductivity, µmhos/cm
2338 2337Pre-monsoon 2.3 1.4Monsoon 5.2 2.6Post-monsoon 3.3 1.5
0.0
1.0
2.0
3.0
4.0
5.0
6.0
Var
iati
on
in
Do
Dissolved oxygen, mg/l
2338 2337Pre-monsoon 2.8 2.7Monsoon 1.6 2.4Post-monsoon 1.8 2.0
0.0
0.5
1.0
1.5
2.0
2.5
3.0
Var
iati
on
in
Bo
D
Biological oxygen Demand, mg/l
2338 2337Pre-monsoon 1248 25320Monsoon 5075 41575Post-monsoon 3867 17400
05000
1000015000200002500030000350004000045000
Var
iati
on
in
TC
Total Coliform, MPN/100ml
Season PeriodPre monsoon January-May
Monsoon June-SeptemberPost Monsoon October-December

Directory 2019 131
Kerala State Pollution Control Board

Directory 2019
Kerala State Pollution Control Board
132
132
2.2 Chithrapuzha river
Chithrapuzha river, one of the tidal tributaries of Periyar River flowing throughAmbalamedu, receives effluent discharges from several industrial establishments in Kochi area.The upstream portion of Chitrapuzha has a link with the Kadambrayar. Sampling station under the National water quality Programme (NWMP) is at Irumpanam( 1573).
2019 CHITHRAPUZHA
River Stations pH EC µmhos/cm
DO mg/l
BODmg/l
TCMPN/100ml
FC MPN/100ml CLASS*
Irumpanam 1573 NWMP
Max 7.1 6500 7.1 2.8 17000 6300
EMin 6.4 149 1.4 0.4 840 170
Mean 6.6 1925 3.2 1.9 5712 3098
Std. Dev 0.2 2267.06 1.8 0.9 4154.28 1682.93
*See Annexure IV
1573Pre-monsoon 6.6Monsoon 6.6Post-monsoon 6.6
6.6
6.6
6.6
6.6
6.6
6.6
6.6
Var
iati
on
in
pH
pH
1573Pre-monsoon 3874Monsoon 784Post-monsoon 197
0500
10001500200025003000350040004500
Var
iati
on
in
EC
Electrical Conductivity, µmhos/cm
1573Pre-monsoon 3.8Monsoon 3.4Post-monsoon 1.9
0.00.51.01.52.02.53.03.54.0
Var
iati
on
in
Do
Dissolved oxygen, mg/l
1573Pre-monsoon 1.8Monsoon 1.9Post-monsoon 2.0
1.71.71.81.81.91.92.02.02.1
Var
iati
on
in
Bo
D
Biological oxygen Demand, mg/l
1573premansoo 2848Monsoon 9025Post-monsoon 6067
0100020003000400050006000700080009000
10000
Var
iato
n i
n T
C
Total Coliform, MPN/100ml
Season PeriodPre monsoon January-May
Monsoon June-SeptemberPost Monsoon October-December

Directory 2019 133
Kerala State Pollution Control Board

Directory 2019
Kerala State Pollution Control Board
134
134
2.3 Korayar River
Korayar is one of the tributaries of river Kalpathipuzha, which in turn is a main tributary of the Bharathapuzha River, the second longest river in Kerala. The sampling station is located at Kanjikode( Nagarampally Bridge) near Pudussery town in Palakaddistrict( 2326). The Kanjikode industrial area is located on the banks of this river.
2019 KORAYAR RIVER
River Stations pH EC µmhos/cm
DO mg/l
BODmg/l
TCMPN/100ml
FC MPN/100ml CLASS*
Kanjikkode 2326 NWMP
Max 8 1524 7.3 3.0 920 400
BMin 6.2 300 5.4 0.7 0 0
Mean 7.5 745 6.5 2.0 469 120
Std. Dev 0.6 368.11 0.6 0.8 412.46 151.73
*See Annexure IV
2326Pre-monsoon 7.0Monsoon 7.8Post-monsoon 7.7
6.46.66.87.07.27.47.67.88.0
Var
iati
on
in
pH
pH
2326Pre-monsoon 608Monsoon 451Post-monsoon 1223
0200400600800
100012001400
Var
iati
on
in
EC
Electrical Conductivity, µmhos/cm
2326Pre-monsoon 6.5Monsoon 6.4Post-monsoon 6.7
6.16.26.36.46.56.66.76.8
Var
iati
on
in
Do
Dissolved oxygen, mg/l
2326Pre-monsoon 2.5Monsoon 2.3Post-monsoon 1.1
0.0
0.5
1.0
1.5
2.0
2.5
3.0
Var
iati
on
in
Bo
D
Biological oxygen Demand, mg/l
2326Pre-monsoon 373Monsoon 153Post-monsoon 913
0100200300400500600700800900
1000
Var
iati
on in
TC
Total Coliform, MPN/100ml
Season PeriodPre monsoon January-May
Monsoon June-SeptemberPost Monsoon October-December

Directory 2019 135
Kerala State Pollution Control Board

Directory 2019
Kerala State Pollution Control Board
136
136
2.4 Pullur River
The Pullur River takes its origin in Pullur region in Hosdurgtaluk of Kasaragod district and is the main stream joining the Chithari River. The sampling station is located at Pullurbridge( 2303) near Kanhangad town.
2019 PULLUR RIVER
River Stations pH EC µmhos/cm
DO mg/l
BODmg/l
TCMPN/100ml
FC MPN/100ml CLASS*
Pullur 2303 NWMP
Max 8.2 78 9.1 3.8 1850 380
CMin 5.2 37 4.9 1.0 140 26
Mean 6.7 55 7.2 2.0 639 96
Std. Dev 0.8 14.04 1.2 1.0 611.65 107.9
*See Annexure IV
2303Pre-monsoon 6.7Monsoon 6.7Post-monsoon 6.7
6.76.76.76.76.76.76.76.76.76.7
Var
iati
on
in
pH
pH
2303Pre-monsoon 58Monsoon 47Post-monsoon 63
010203040506070
Var
iati
on
in
EC
Electrical Conductivity, µmhos/cm
2303Pre-monsoon 5.5Monsoon 7.4Post-monsoon 8.0
0.01.02.03.04.05.06.07.08.09.0
Var
iati
on
in
Do
Dissolved oxygen, mg/l
2303Pre-monsoon 3.0Monsoon 1.7Post-monsoon 1.8
0.00.51.01.52.02.53.03.5
Var
iati
on
in
Bo
D
Biological oxygen Demand, mg/l
2303Pre-monsoon 1675Monsoon 383Post-monsoon 290
0200400600800
10001200140016001800
Var
iati
on in
TC
Total Coliform, MPN/100ml
Season PeriodPre monsoon January-May
Monsoon June-SeptemberPost Monsoon October-December

Directory 2019 137
Kerala State Pollution Control Board
2.5 Kalpathy Puzha
Kalpathypuzha is one of the main tributaries of the Bharathapuzha River. It originates in the upper slopes of the western ghats at Chenthamarakulam, north of Walayar. It is formed by the confluence of four streams, namely Malampuzha, Walayar, Korayar, and Varattar. The river is named after the Kalpathi Siva Temple near Palakad town. Sampling station is at Kalpathy( code3460), downstream of the temple.
2019 KALPATHY PUZHA
River Stations pH EC µmhos/cm
DO mg/l
BODmg/l
TCMPN/100ml
FC MPN/100ml CLASS*
Kalpathy3460 NWMP
Max 8.1 1296 6.9 3.0 2200 1000
CMin 6.6 133 2.1 1.2 110 10
Mean 7.5 527 5.7 2.4 703 282
Std. Dev 0.4 356.15 1.3 0.6 622.34 316.32
*See Annexure IV
3460Pre-monsoon 7.4Monsoon 7.7Post-monsoon 7.6
7.37.37.47.47.57.57.67.67.77.77.8
Var
iati
on
in
pH
pH
3460Pre-monsoon 322Monsoon 376Post-monsoon 1019
0
200
400
600
800
1000
1200
Var
iati
on
in
EC
Electrical Conductivity, µmhos/cm
3460Pre-monsoon 5.3Monsoon 6.0Post-monsoon 6.0
4.85.05.25.45.65.86.06.2
Var
iati
on
in
Do
Dissolved oxygen, mg/l
3460Pre-monsoon 2.6Monsoon 2.3Post-monsoon 2.2
2.02.12.22.32.42.52.62.7
Var
iati
on
in
Bo
D
Biological oxygen Demand, mg/l
3460Pre-monsoon 640Monsoon 127Post-monsoon 1383
0200400600800
1000120014001600
Var
iati
on in
TC
Total Coliform, MPN/100ml
Season PeriodPre monsoon January-May
Monsoon June-SeptemberPost Monsoon October-December

Directory 2019
Kerala State Pollution Control Board
138
138
2.6 Maniyankode Puzha
ManiyankodePuzha is a tributary of river Panamaram in Wayanad district. Discharges from Kalpetta town enter into this stream. Sampling station is located at ManiyankodeBridge (code 3459)
2019 MANIYANKODE PUZHA
River Stations pH EC µmhos/cm
DO mg/l
BODmg/l
TCMPN/100ml
FC MPN/100ml CLASS*
Maniyankode 3459 NWMP
Max 7.6 199 7.1 2.8 170 84
BMin 6.5 66 4.2 0.2 17 2
Mean 7.0 129 5.9 1.0 80 36
Std. Dev 0.4 39.5 0.9 0.9 53.33 27.68
*See Annexure IV
3459Pre-monsoon 6.9Monsoon 7.1Post-monsoon 7.0
6.8
6.9
6.9
7.0
7.0
7.1
7.1
Var
iati
on
in
pH
pH
3459Pre-monsoon 160Monsoon 109Post-monsoon 106
020406080
100120140160180
Var
iati
on
in
EC
Electrical Conductivity, µmhos/cm
3459Pre-monsoon 5.9Monsoon 5.5Post-monsoon 6.5
5.05.25.45.65.86.06.26.46.6
Var
iati
on
in
Do
Dissolved oxygen, mg/l
3459Pre-monsoon 0.5Monsoon 1.7Post-monsoon 0.8
0.00.20.40.60.81.01.21.41.61.8
Var
iati
on
in
Bo
D
Biological oxygen Demand, mg/l
3459Pre-monsoon 47Monsoon 30Post-monsoon 27
05
101520253035404550
Var
iati
on
in
TC
Total Coliform, MPN/100ml
Season PeriodPre monsoon January-May
Monsoon June-SeptemberPost Monsoon October-December

Directory 2019 139
Kerala State Pollution Control Board
139
FReSh WateR lakeS

Directory 2019
Kerala State Pollution Control Board
140
140

Directory 2019 141
Kerala State Pollution Control Board
3.1 Vellayani Lake
Vellayani Lake, or VellayaniKayal as it is better known in Kerala, is the largest fresh water lake in Thiruvananthapuram district. The lake water is extensively used for drinking and irrigational purposes.There are two water intake points of the Kerala Water Authority , one at Kadavinmoola and other at Vandithadam. The totalarea of the lake is reduced drastically due illegal sand mining, encroachment and land reclamation. Now the lake is under threat of pollution mainly from domestic wastes from nearby areas. The NWMP monitoring station is at Vandithadam.
141
2019 VELLAYANI LAKE
River Stations pH EC µmhos/cm
DO mg/l
BODmg/l
TCMPN/100ml
FC MPN/100ml CLASS*
Vandithadam 3470 NWMP
Max 7.5 225 6.2 6.4 2000 940
EMin 5.8 120 0.1 0.4 400 100
Mean 6.7 183 3.6 4.1 1028 378
Std. Dev 0.5 31.44 2.5 1.9 556.63 336.56
Kakkamoola Left K112 SWMP
Max 7.4 110 6.5 6.3 4200 2200
CMin 6.2 17 0.5 0.6 200 100
Mean 6.7 61 4.3 2.5 1975 642
Std. Dev 0.4 35.21 1.8 1.5 1687.99 672.12
Kakkamoola Right K113
SWMP
Max 7.8 99 6.7 6.1 5000 2000
CMin 6.1 14 2.4 0.9 600 100
Mean 6.8 56 4.7 2.6 2592 775
Std. Dev 0.5 31.29 1.3 1.4 1708.51 619.57
Vaavamoola Left K114
SWMP
Max 7.8 79 7.9 5.5 4200 2200
CMin 6.0 17 2.8 0.3 600 200
Mean 6.7 42 5.4 2.7 1958 983
Std. Dev 0.6 24.52 1.4 1.7 1152.44 593.65

Directory 2019
Kerala State Pollution Control Board
142
142
Vaavamoola Right K115 SWMP
Max 7.7 81 7.8 6.8 4500 1800
CMin 6.0 13 2.1 0.8 500 100
Mean 6.7 39 5.1 2.7 1908 517
Std. Dev 0.5 27.5 1.4 1.9 1298.57 523.68
Agriculture College K116 SWMP
Max 7.7 81 6.7 5.5 4000 2000
CMin 6.4 17 3.9 0.4 400 100
Mean 6.9 43 5.2 2.3 1308 508
Std. Dev 0.4 26.48 0.9 1.6 1152.44 575.97
*See Annexure IV
3470 K112 K113 K114 K115 K116Pre-monsoon 6.6 6.6 6.5 6.3 6.3 6.6Monsoon 6.8 6.6 6.9 6.8 6.8 7.1Post-monsoon 6.9 7.2 7.1 7.2 7.1 7.2
5.86.06.26.46.66.87.07.27.4
Varia
tion
in p
H
pH
3470 K112 K113 K114 K115 K116Pre-monsoon 4.1 4.8 4.9 4.7 5.0 4.8Monsoon 4.2 4.5 5.3 5.0 4.9 5.6Post-monsoon 1.9 3.1 3.5 7.2 5.5 5.4
0.01.02.03.04.05.06.07.08.0
Varia
tin in
Do
Disolved oxygen, mg/l
3470 K112 K113 K114 K115 K116Pre-monsoon 205 23 23 26 18 25Monsoon 150 97 84 35 36 38Post-monsoon 189 77 75 78 79 79
0
50
100
150
200
250
Varia
tion
in E
C
Electrical Conductivity, µmhos/cm
3470 K112 K113 K114 K115 K116Pre-monsoon 4.4 2.2 2.1 2.3 2.2 1.5Monsoon 3.0 3.3 3.5 3.9 3.7 3.0Post-monsoon 5.1 1.9 2.3 1.7 2.1 2.6
0.0
1.0
2.0
3.0
4.0
5.0
6.0
Varia
tion
in B
oD
Biological oxygen Demand, mg/l
3470 K112 K113 K114 K115 K116Pre-monsoon 1600 3540 4080 3040 2960 2280Monsoon 588 1100 1975 1275 1350 650Post-monsoon 663 533 933 1067 900 567
0500
10001500200025003000350040004500
Varia
tion
in T
C
Total Coliform, MPN/100ml
Season PeriodPre monsoon January-May
Monsoon June-SeptemberPost Monsoon October-December

Directory 2019 143
Kerala State Pollution Control Board
3.2 Sasthamkotta Lake
This is considered as the largest fresh water lake in Kerala. It meets the drinking water needs of half million people of Kollam district and also provides fishing resources. The lake is a designated wetland of international importance under the Ramsar Convention since November 2002.The monitoring station under the NWM Programme is at Sasthamkotta, near the pumping station of KeralaWaterAuthority .Karunagappally is the nearest town
2019 SASTHAMKOTTA LAKE
River Stations pH EC µmhos/cm
DO mg/l
BODmg/l
TCMPN/100ml
FC MPN/100ml CLASS*
Sasthamkotta 1385 NWMP
Max 7.2 132 7.4 2.0 430 200
BMin 6.0 114 6.2 1.2 170 10
Mean 6.7 121 6.8 1.7 278 107
Std. Dev 0.3 4.86 0.4 0.3 84.22 53.6
Ambalakkadavu K117 SWMP
Max 7.5 196 7.1 1.9 420 200
BMin 6.4 120 5.8 1.1 200 80
Mean 7.0 160 6.5 1.5 284 111
Std. Dev 0.3 25.98 0.4 0.3 71.15 32.04
KWA PumphouseK118 SWMP
Max 7.3 193 7.1 2.0 870 210
BMin 6.2 126 5.7 1.1 120 70
Mean 7.0 158 6.4 1.6 371 105
Std. Dev 0.4 20.39 0.6 0.3 220.6 40.79
Kottakuzhy K119 SWMP
Max 7.9 183 7.0 2.4 330 160
BMin 6.8 125 6.2 1.5 190 60
Mean 7.3 156 6.5 2.1 250 104
Std. Dev 0.3 17.92 0.3 0.3 43.28 27.46

Directory 2019
Kerala State Pollution Control Board
144
144
VilantharaK120 SWMP
Max 7.4 198 6.9 2.4 460 160
BMin 6.7 129 6.1 1.7 210 70
Mean 7.0 154 6.5 2.0 301 113
Std. Dev 0.2 21.74 0.3 0.2 81.85 24.62
Pottakannamukku K121 SWMP
Max 7.6 169 6.9 2.7 360 150
BMin 6.8 120 5.8 1.4 130 40
Mean 7.1 146 6.4 2.1 214 84
Std. Dev 0.2 17.58 0.4 0.4 63.17 30.29
Vattolikadavu K122 SWMP
Max 7.6 152 6.9 2.4 370 150
BMin 7.1 130 5.8 1.6 160 80
Mean 7.3 140 6.4 2.0 235 93
Std. Dev 0.2 7.41 0.3 0.3 58.39 20.15
*See Annexure IV
1385 K117 K118 K119 K120 K121 K122Pre-monsoon 6.5 6.8 6.7 7.3 7.2 7.2 7.3Monsoon 6.8 7.1 7.1 7.2 7.0 7.1 7.2Post-monsoon 7.1 7.4 7.2 7.6 6.8 7.1 7.5
5.86.06.26.46.66.87.07.27.47.67.8
Var
iati
on in
pH
pH
1385 K117 K118 K119 K120 K121 K122Pre-monsoon 6.5 6.5 6.4 6.5 6.3 6.2 6.1Monsoon 6.8 6.3 6.0 6.5 6.6 6.9 6.7Post-monsoon 7.3 6.8 6.9 6.5 6.8 6.3 6.6
0.01.02.03.04.05.06.07.08.0
Var
iati
on in
Do
Dissolved oxygen, mg/l
1385 K117 K118 K119 K120 K121 K122Pre-monsoon 120 141 173 168 158 148 141Monsoon 123 164 153 134 147 130 137Post-monsoon 120 187 139 165 155 166 143
020406080
100120140160180200
Var
iati
on in
EC
Electrical Conductivity, µmhos/cm
1385 K117 K118 K119 K120 K121 K122Pre-monsoon 1.7 1.3 1.3 2.2 2.3 2.4 2.3Monsoon 1.8 1.5 2.0 2.2 1.8 2.0 1.9Post-monsoon 1.6 1.8 1.7 1.6 1.9 1.7 1.8
0.0
0.5
1.0
1.5
2.0
2.5
3.0
Var
iati
on in
Bo
D
Biological oxygen Demand, mg/l
1385 K117 K118 K119 K120 K121 K122Pre-monsoon 312 332 478 274 354 162 220Monsoon 305 253 273 228 240 245 263Post-monsoon 183 247 323 240 293 260 223
0
100
200
300
400
500
600
Var
iati
on in
TC
Total Coliform, MPN/100ml
Season PeriodPre monsoon January-May
Monsoon June-SeptemberPost Monsoon October-December

Directory 2019 145
Kerala State Pollution Control Board
3.3 Pookode Lake
A major tourist destination in the Wayanad district of Kerala,Pookode is a natural freshwater lake nestling amid evergreen forests and mountain slopes at an altitude of 770 meters above sea level. It is the smallest and highest altitude freshwater lake in Kerala. IIt is the smallest and highest altitude freshwater lake in Kerala. Panamaram, the rivulet which ultimately becomes Kabani River originates from the Pookode lake. It is spread across an area of 8.5 hectares and with a maximum depth of 6.5 metres. The NWMP monitoring station is at Pookode, the nearest town being Kalpetta.
2019 POOKODE LAKE
River Stations pH EC µmhos/cm
DO mg/l
BODmg/l
TCMPN/100ml
FC MPN/100ml
CLASS*
Boat Jetty K123 SWMP
Max 7.9 42 8.4 1.3 184 166
BMin 7.1 18 5.8 0.3 24 4
Mean 7.5 27 7.3 0.8 72 37
Std. Dev 0.2 5.69 0.8 0.4 43.74 43.46
Deepest Point K124 SWMP
Max 7.7 41 9.3 2.4 122 46
BMin 7.0 20 4.8 0.2 30 2
Mean 7.4 28 7.0 1.2 56 22
Std. Dev 0.2 5.91 1.2 0.9 25.02 16.27

Directory 2019
Kerala State Pollution Control Board
146
146
146
K123 K124 K125 1580 K126Pre-monsoon 7.6 7.4 7.1 6.9 6.7Monsoon 7.5 7.4 7.3 7.2 6.9Post-monsoon 7.3 7.3 7.2 7.1 7.0
6.26.46.66.87.07.27.47.67.8
Var
iati
on in
pH
pH
K123 K124 K125 1580 K126Pre-monsoon 7.1 6.6 6.8 6.6 6.4Monsoon 7.7 7.9 7.5 7.7 7.7Post-monsoon 7.0 6.3 6.1 5.6 5.7
0.01.02.03.04.05.06.07.08.09.0
Var
iati
on in
Do
Dissolved oxygen, mg/l
K123 K124 K125 1580 K126Pre-monsoon 31 32 33 32 32Monsoon 25 27 26 27 26Post-monsoon 23 22 22 23 22
05
101520253035
Var
iati
on in
EC
Electrical Conductivity, µmhos/cm
K123 K124 K125 1580 K126Pre-monsoon 0.9 1.1 1.2 1.4 1.0Monsoon 0.8 1.5 1.2 1.3 1.2Post-monsoon 0.7 0.9 1.0 1.1 0.4
0.00.20.40.60.81.01.21.41.61.8
Var
iati
on in
Bo
D
Biological oxygen Demand, mg/l
K123 K124 K125 1580 K126Pre-monsoon 68 46 42 45 50Monsoon 56 54 49 61 49Post-monsoon 101 77 59 45 31
0
20
40
60
80
100
120
Var
iati
on in
TC
Total Coliform, MPN/100ml
Silt DepositingZone K125
SWMP
Max 7.5 45 8.4 2.6 86 40
AMin 6.5 19 4.7 0.1 20 0
Mean 7.2 28 6.8 1.2 48 17
Std. Dev 0.3 6.88 1.1 0.8 21.95 14.12
Pookode 1580 NWMP
Max 7.9 43 9.0 2.6 102 40
BMin 6.7 19 5.1 0.3 18 2
Mean 7.0 28 6.7 1.3 50 19
Std. Dev 0.3 6.74 1.8 0.7 26.73 11.46
Second Deepest Point K126
SWMP
Max 7.2 41 9.0 1.8 80 40
AMin 6.3 19 4.4 0.2 20 2
Mean 6.8 28 6.7 0.9 45 16
Std. Dev 0.2 6.08 1.2 0.5 20.11 10.66
*See Annexure IV
Season PeriodPre monsoon January-May
Monsoon June-SeptemberPost Monsoon October-December

Directory 2019 147
Kerala State Pollution Control Board
eStuaRine lakeS

Directory 2019
Kerala State Pollution Control Board
148
148
148

Directory 2019 149
Kerala State Pollution Control Board
148
4.1 Akkulam Lake
This lake is located in KazhakkottamandKovalam Bye pass in Thiruvananthapuram district. The Akkulam Lake is, in fact, a part of the Veli Lake, where it joins with the sea.This is a prime picnic spot for both domestic and international tourists. The lake is severely contaminated with wastes from the Thiruvananthapuramcity coming through canals. Water quality monitoring is done under the NWMP at Oruvathilkotta in Kadakampally village.
149
2019 AKKULAM LAKE
River Stations pH EC µmhos/cm
DO mg/l
BODmg/l
TCMPN/100ml
FC MPN/100ml CLASS*
Oruvathilkotta 1383 NWMP
Max 7.9 662 7.2 7.2 2500 1500
DMin 6.4 255 0.1 1.6 430 180
Mean 6.8 508 3.8 4.0 1263 533
Std. Dev 0.5 121.17 2.9 2.0 721.91 456.27
*See Annexure IV
1383Pre-monsoon 6.9Monsoon 6.6Post-monsoon 7.0
6.36.46.56.66.76.86.97.07.1
Var
iati
on
in
pH
pH
1383Pre-monsoon 551Monsoon 408Post-monsoon 568
0
100
200
300
400
500
600
Var
iati
on
in
EC
Electrical Conductivity, µmhos/cm
1383Pre-monsoon 5.7Monsoon 4.0Post-monsoon 0.2
0.0
1.0
2.0
3.0
4.0
5.0
6.0
Var
iati
on
in
Do
Dissolved oxygen, mg/l
1383Pre-monsoon 2.9Monsoon 3.8Post-monsoon 6.2
0.01.02.03.04.05.06.07.0
Var
iati
on in
Bo
D
Biological oxygen Demand, mg/l
1383Pre-monsoon 1284Monsoon 1030Post-monsoon 1537
0200400600800
10001200140016001800
Var
iati
on in
TC
Total Coliform, MPN/100ml
Season PeriodPre monsoon January-May
Monsoon June-SeptemberPost Monsoon October-December

Directory 2019
Kerala State Pollution Control Board
150
150
4.2 Ashtamudi Lake
This lake, which flows through Kollam district is one of the largest and deepest wetland ecosystems in Kerala. Ashtamudi Wetland was included in the list of wetlands of international importance, as defined by the Ramsar Convention for the conservation and sustainable utilization of wetlands. The monitoring station under NWMP is at Neendakara Fishing Harbour which is near to its confluence point with Lakshadweep sea.
2019 ASHTAMUDI LAKE
River Stations pH EC µmhos/cm
DO mg/l
BODmg/l
TCMPN/100ml
FC MPN/100ml CLASS*
Neendakara 1441 NWMP
Max 8.1 19350 5.6 4.0 920 680
Below EMin 7.5 18120 3.4 1.4 480 260
Mean 7.8 18382 4.2 3.1 672 458
Std. Dev 0.2 355.02 0.7 0.9 141.43 141.75
*See Annexure IV
1441Pre-monsoon 7.9Monsoon 7.6Post-monsoon 7.7
7.57.57.67.67.77.77.87.87.97.98.0
Var
iati
on
in
pH
pH
1441Pre-monsoon 18458Monsoon 18453Post-monsoon 18159
1800018050181001815018200182501830018350184001845018500
Var
iati
on
in
EC
Electrical Conductivity, µmhos/cm
1441Pre-monsoon 4.8Monsoon 3.7Post-monsoon 3.8
0.0
1.0
2.0
3.0
4.0
5.0
6.0
Var
iati
on
in
Do
Dissolved oxygen, mg/l
1441Pre-monsoon 2.3Monsoon 3.7Post-monsoon 3.8
0.00.51.01.52.02.53.03.54.0
Var
iati
on in
Bo
D
Biological oxygen Demand, mg/l
1441Pre-monsoon 664Monsoon 805Post-monsoon 510
0100200300400500600700800900
Var
iati
on in
TC
Total Coliform, MPN/100ml
Season PeriodPre monsoon January-May
Monsoon June-SeptemberPost Monsoon October-December

Directory 2019 151
Kerala State Pollution Control Board
4.3 Paravur Lake
Paravur Lake in Kollam district occupies an area of 6.62sq.km. The Ithikkara River empties into this lake. The monitoring station under NWMP is at Paravur near The Railway station.
2019 PARAVUR LAKE
River Stations pH EC µmhos/cm
DO mg/l
BODmg/l
TCMPN/100ml
FC MPN/100ml CLASS*
Paravur 1574 NWMP
Max 8 13980 6.6 2.2 410 200
Below E Min 7.4 12260 5.4 1.4 220 100
Mean 7.6 12850 6 1.8 338 152
Std. Dev 0.2 462.46 0.4 0.3 66.49 27.91
*See Annexure IV
1574Pre-monsoon 7.7Monsoon 7.6Post-monsoon 7.7
7.5
7.5
7.6
7.6
7.7
7.7
7.8
Var
iati
on
in
pH
pH
1574Pre-monsoon 13236Monsoon 12753Post-monsoon 12337
118001200012200124001260012800130001320013400
Var
iati
on
in
EC
Electrical Conductivity, µmhos/cm
1574Pre-monsoon 5.8Monsoon 5.9Post-monsoon 6.5
5.25.45.65.86.06.26.46.6
Var
iati
on
in
Do
Dissolved oxygen, mg/l
1574Pre-monsoon 2.0Monsoon 1.7Post-monsoon 1.7
1.51.51.61.61.71.71.81.81.91.92.02.0
Var
iati
on in
Bo
D
Biological oxygen Demand, mg/l
1574Pre-monsoon 346Monsoon 360Post-monsoon 293
050
100150200250300350400
Var
iati
on in
TC
Total Coliform, MPN/100ml
Season PeriodPre monsoon January-May
Monsoon June-SeptemberPost Monsoon October-December

Directory 2019
Kerala State Pollution Control Board
152
152
4.4 Punnamada Lake
Punnamada Kayal in Kuttanad, Alappuzha district is a part of the Vembanad Lake which is India’s longest lake and the biggest lake in Kerala. The famous Annual Nehru Trophy Boat Race of Kerala is conducted on parts of Punnamada Lake. The Station is located at Punnamad in Alapuzha town.
2019 PUNNAMADA LAKE
River Stations pH EC µmhos/cm
DO mg/l
BODmg/l
TCMPN/100ml
FC MPN/100ml CLASS*
Punnamada 1579 NWMP
Max 7.6 5248 7.7 3.9 1100 600
CMin 6.8 506 2.9 2.1 10 2
Mean 7.2 1857 5.4 2.8 564 317
Std. Dev 0.3 1385.01 1.5 0.5 271.64 171.24
*See Annexure IV
1579Pre-monsoon 7.3Monsoon 7.3Post-monsoon 6.9
6.66.76.86.97.07.17.27.37.4
Var
iati
on
in
pH
pH
1579Pre-monsoon 2894Monsoon 1545Post-monsoon 546
0500
100015002000250030003500
Var
iati
on
in
EC
Electrical Conductivity, µmhos/cm
1579Pre-monsoon 6.3Monsoon 5.5Post-monsoon 3.9
0.0
1.0
2.0
3.0
4.0
5.0
6.0
7.0
Var
iati
on
in
Do
Dissolved oxygen, mg/l
1579Pre-monsoon 3.2Monsoon 2.6Post-monsoon 2.6
0.00.51.01.52.02.53.03.5
Axi
s Ti
tle
Biological oxygen Demand, mg/l
1579Pre-monsoon 492Monsoon 505Post-monsoon 763
0100200300400500600700800900
Var
iati
on in
TC
Total Coliform, MPN/100ml
Season PeriodPre monsoon January-May
Monsoon June-SeptemberPost Monsoon October-December

Directory 2019 153
Kerala State Pollution Control Board
4.5 Vembanadu Lake
Vembanadu Lake, the largest lake in Kerala, spans an area of 2033 sq.km thereby making the second largest wetland ecosystem in India. It is the largest of the Ramsar Sites in the state of Kerala.Vembanadu Lake is bordered by Alappuzha, Kottayam, and Ernakulamdistricts.It is situated at the sea level, and is separated from the Lakshadweep sea by a narrow barrier island. The lake is fed by 10 rivers flowing into it including the six major rivers of central Kerala namely the Achenkovil, Manimala, Meenachil, Muvattupuzha, Pamba and Periyar. The Vembanadu lake has two NWMP sampling stations viz, Pathiramanal (MuhammaGramaPanchayath, Alapuzha) and Oil Tanker Jetty (Near Offshore Road, Kochi).
2019 VEMBANADU LAKE
River Stations pHEC
µmhos/cmDO
mg/lBODmg/l
TCMPN/100ml
FC MPN/100ml CLASS*
Pathiramanal 2312 NWMP
Max 7.5 9120 7.9 3.9 310 180
EMin 6.8 713 6.1 0.9 10 2
Mean 7.1 2909 7.1 2.7 128 60
Std. Dev 0.2 2376.11 0.5 0.9 94.76 57.2
Oil Tanker Jetty 1575 NWMP
Max 8.0 44000 8.4 3.6 310000 140000
Below EMin 6.8 1200 2.5 0.8 840 430
Mean 7.2 24300 5.3 2.0 48420 22040
Std. Dev 0.3 14250.76 1.6 0.9 95881.42 42217.11
*See Annexure IV

Directory 2019
Kerala State Pollution Control Board
154
154
2312 1575Pre-monsoon 7.1 7.2Monsoon 7.3 7.1Post-monsoon 7.0 7.6
6.76.86.97.07.17.27.37.47.57.67.7
Var
iati
on
in
pH
pH
2312 1575Pre-monsoon 6.8 4.6Monsoon 7.2 6.1Post-monsoon 7.5 5.4
0.01.02.03.04.05.06.07.08.0
Var
iati
on
in
Do
Dissolved oxygen, mg/l
2312 1575Pre-monsoon 4612 37256Monsoon 2403 13208Post-monsoon 745 17500
05000
10000150002000025000300003500040000
Var
iati
on
in
EC
Electrical Conductivity, µmhos/cm
2312 1575Pre-monsoon 3.2 1.7Monsoon 2.4 1.7Post-monsoon 2.2 3.0
0.00.51.01.52.02.53.03.5
Var
iati
on
in
Bo
D
Biological oxygen Demand, mg/l
2312 1575Pre-monsoon 140 13788Monsoon 155 6825Post-monsoon 73 161600
020000400006000080000
100000120000140000160000180000
Var
iati
on
in
TC
Total Coliform, MPN/100ml
Season PeriodPre monsoon January-May
Monsoon June-SeptemberPost Monsoon October-December

Directory 2019 155
Kerala State Pollution Control Board
4.6 Kodungallur Lake
This is one among the major back waters in Kerala and is located in thrissur district. One of the Periyar tributary (Mangalapuzha branch) and Chalakudy River joins Kodungallur lake. The monitoring station under NWMP is located at Kodungallur.
2019 KODUNgALLUR LAKE
River Stations pH EC µmhos/cm
DO mg/l
BODmg/l
TCMPN/100ml
FC MPN/100ml CLASS*
Kodungallur 1577 NWMP
Max 7.8 27500 7.2 2.0 3400 2100
Below EMin 3.9 504 4.4 0.2 480 220
Mean 7 16368 6.0 1.2 1626 836
Std. Dev 1.0 8441.44 1.0 0.6 934.55 533.78
*See Annexure IV
1577Pre-monsoon 7.3Monsoon 6.6Post-monsoon 7.3
6.0
6.2
6.4
6.6
6.8
7.0
7.2
7.4
Var
iati
on in
pH
pH
1577Pre-monsoon 22168Monsoon 14669Post-monsoon 8967
0
5000
10000
15000
20000
25000
Var
iati
on in
EC
Electrical Conductivity, µmhos/cm
1577Pre-monsoon 6.5Monsoon 5.2Post-monsoon 6.1
0.0
1.0
2.0
3.0
4.0
5.0
6.0
7.0
Var
iati
on in
Do
Dissoved oxygen, mg/l
1577Pre-monsoon 1.0Monsoon 1.5Post-monsoon 1.3
0.00.20.40.60.81.01.21.41.6
Var
iati
on in
Bo
D
Biological oxygen Demand, mg/l
1577Pre-monsoon 1022Monsoon 1700Post-monsoon 2533
0
500
1000
1500
2000
2500
3000
Var
iati
on in
TC
Total Coliform, MPN/100ml
Season PeriodPre monsoon January-May
Monsoon June-SeptemberPost Monsoon October-December

Directory 2019
Kerala State Pollution Control Board
156
156
4.7 Kayamkulam Lake
Kayamkulam Kayal, is a shallow brackish water lagoon stretching between Panmanaand Karthikapally in Alapuzha district. It has an outlet to the Arabian seaat Kayamkulam barrage. The monitoring station under NWMP is at Kayamkulam.
2019 KAYAMKULAM LAKE
River Stations pH EC µmhos/cm
DO mg/l
BODmg/l
TCMPN/100ml
FC MPN/100ml CLASS*
Kayamkulam 1578 NWMP
Max 8.2 65248 6.9 5.2 2700 1800
Below EMin 7.5 6458 1.1 0.5 20 2
Mean 8 31121 5.5 3.3 1246 726
Std. Dev 0.2 22035.32 1.7 1.2 907.84 601.5
*See Annexure IV
1578Pre-monsoon 8.1Monsoon 7.9Post-monsoon 7.7
7.5
7.6
7.7
7.8
7.9
8.0
8.1
8.2
Var
iati
on in
pH
pH
1578Pre-monsoon 51216Monsoon 23885Post-monsoon 7278
0
10000
20000
30000
40000
50000
60000
Var
iati
on in
EC
Electrical Conductivity, µmhos/cm
1578Pre-monsoon 6.3Monsoon 4.6Post-monsoon 5.3
0.0
1.0
2.0
3.0
4.0
5.0
6.0
7.0
Var
iati
on in
Do
Dissolved oxygen, mg/l
1578Pre-monsoon 3.7Monsoon 2.4Post-monsoon 3.8
0.00.51.01.52.02.53.03.54.0
Var
iati
on in
Bo
D
Biological oxygen Demand, mg/l
1578Pre-monsoon 706Monsoon 1430Post-monsoon 1900
0200400600800
100012001400160018002000
Var
iati
on in
TC
Total Coliform, MPN/100ml
Season PeriodPre monsoon January-May
Monsoon June-SeptemberPost Monsoon October-December

Directory 2019 157
Kerala State Pollution Control Board
ReSeRvoiRS, PondS &
Canal StationS

Directory 2019
Kerala State Pollution Control Board
158
158
158158

Directory 2019 159
Kerala State Pollution Control Board
5.1 Pazhassi Reservoir
The Pazhassi irrigation Project is intended to raise the water level of the PazhassiDam at Kuyiluracross the Valapattanam river in Kannur District. The pazhassi project aims irrigation activities in the district. KWA relies on Pazhassi project as a source of drinking water. The Japan drinking water project and the Kannur international airport are using water from the Pazhassi Reservoir. The Kerala State Electricity Board has envisaged utilization of the water for a small hydro project. The Reservoir has a live storage capacity of 97.5 MCM. Water Quality is monitoring under the NWMP Programme( code 2318) .
2019 PAZHASSI RESERVOIR
River Stations pH EC µmhos/cm
DOmg/l
BODmg/l
TC MPN/100ml
FCMPN/100ml CLASS*
Pazhassi 2318 NWMP
Max 8 92 8.1 1.2 500 160
BMin 6.7 36 6.3 0.1 40 5
Mean 7.4 66 7.5 0.6 251 53
Std. Dev 0.4 17.54 0.5 0.4 167.6 42.43
*See Annexure IV
2318Pre-monsoon 7.8Monsoon 7.1Post-monsoon 7.2
6.6
6.8
7.0
7.2
7.4
7.6
7.8
8.0
Var
iati
on in
pH
pH
2318Pre-monsoon 80Monsoon 59Post-monsoon 55
0102030405060708090
Var
itio
n in
EC
Electrical Conductivity, µmhos/cm
2318Pre-monsoon 7.6Monsoon 7.6Post-monsoon 7.1
6.86.97.07.17.27.37.47.57.67.7
Var
iati
on in
Do
Dissolved oxygen, mg/l
2318Pre-monsoon 0.6Monsoon 0.5Post-monsoon 0.9
0.00.10.20.30.40.50.60.70.80.91.0
Varia
tion
in B
oD
Biological oxygen Demand, mg/l
2318Pre-monsoon 153Monsoon 363Post-monsoon 267
050
100150200250300350400
Varia
tion
in T
C
Total Coliform, MPN/100ml
Season PeriodPre monsoon January-May
Monsoon June-SeptemberPost Monsoon October-December

Directory 2019
Kerala State Pollution Control Board
160
160
5.2 Edamalayar Reservoir
The Edamalayar Reservoir is created by the Edamalayar Dam located near Bhoothathankettu, on the Edamalayarriver, a tributary of the Periyar River in Kerala. This multi purpose reservoir covers 28.3 km2 in the western ghats. The reservoir storage is utilizing for hydroelectric power generation and also benefit the Edamalyar Irrigation Development Project.
2019 EDAMALAYAR RESERVOIR
River Stations pH EC µmhos/cm
DOmg/l
BODmg/l
TC MPN/100ml
FCMPN/100ml CLASS*
Edamalayar 2330 NWMP
Max 8 37 9.2 3 320 250
BMin 6.8 19 6.4 0.2 10 4
Mean 7.1 26 7.7 1 108 48
Std. Dev 0.4 5.92 0.8 0.9 101.45 67.84
*See Annexure IV
2330Pre-monsoon 7.0Monsoon 7.1Post-monsoon 7.3
6.96.97.07.07.17.17.27.27.37.37.47.4
Var
iati
on in
pH
pH
2330Pre-monsoon 24Monsoon 33Post-monsoon 20
0
5
10
15
20
25
30
35
Var
iati
on in
EC
Electrical Conductivity, µmhos/cm
2330Pre-monsoon 7.2Monsoon 8.0Post-monsoon 8.1
6.66.87.07.27.47.67.88.08.2
Var
iati
on in
Do
Dissolved oxygen, mg/l
2330Pre-monsoon 0.7Monsoon 0.8Post-monsoon 1.7
0.00.20.40.60.81.01.21.41.61.8
Var
iati
on in
Bo
D
Biological oxyygen Demand, mg/l
2330Pre-monsoon 68Monsoon 173Post-monsoon 87
020406080
100120140160180200
Var
iati
on in
TC
Total Coliform, MPN/100ml
Season PeriodPre monsoon January-May
Monsoon June-SeptemberPost Monsoon October-December

Directory 2019 161
Kerala State Pollution Control Board
5.3 Bhoothathankettu Reservoir
The Bhoothathankettu dam built across Periyar river lies in Pindimana village near Kothamangalam, Ernakulam district. This Dam is intended for power generation as well as for irrigation through connected channels for Periyar Valley Project.
2019 BHOOTHATHANKETTU RESERVOIR
River Stations pH EC µmhos/cm
DOmg/l
BODmg/l
TC MPN/100ml
FCMPN/100ml CLASS*
Bhoothathankettu 2329 NWMP
Max 7.6 47 9.3 2.7 4600 2500
CMin 6.7 21 6.6 0.2 110 58
Mean 7.1 35 7.5 1.1 1188 737
Std. Dev 0.3 7.67 0.8 0.8 1398.82 879.47
*See Annexure IV
2329Pre-monsoon 7.0Monsoon 7.3Post-monsoon 7.0
6.97.07.07.17.17.27.27.37.3
Var
iati
on in
pH
pH
2329Pre-monsoon 35Monsoon 36Post-monsoon 36
34343535353535363636
Var
iati
on in
EC
Electrical Conductivity, µmhos/cm
2329Pre-monsoon 7.3Monsoon 7.5Post-monsoon 7.8
7.07.17.27.37.47.57.67.77.87.9
Var
iati
on in
Do
Dissolved oxygen, mg/l
2329Pre-monsoon 0.5Monsoon 1.5Post-monsoon 1.8
0.00.20.40.60.81.01.21.41.61.82.0
Var
iati
on in
Bo
D
Biological oxygen Demand, mg/l
2329Pre-monsoon 240Monsoon 840Post-monsoon 3233
0
500
1000
1500
2000
2500
3000
3500
Var
iati
on in
TC
Total Coliform, MPN/100ml
Season PeriodPre monsoon January-May
Monsoon June-SeptemberPost Monsoon October-December

Directory 2019
Kerala State Pollution Control Board
162
162
5.4 Malampuzha Reservoir
The Malampuzha reservoir is the largest reservoir in Kerala. Located in Palakkad district,the dam is built across Malampuzha river, a tributary of the Bharathapuzha. This dam has a total capacity of 226 million cubic metres. The water is mainly utilized for irrigating paddy fields of Palakkad District.
2019 MALAMPUZHA RESERVOIR
River Stations pH EC µmhos/cm DO mg/l BOD
mg/lTC
MPN/100mlFC
MPN/100ml CLASS*
Malampuzha 2328 NWMP
Max 7.6 130 7.8 2.8 700 490
BMin 6.8 82 6.2 0.6 0 0
Mean 7.2 106 7.1 1.2 234 105
Std. Dev 0.3 17.6 0.5 0.6 241.9 145.69
*See Annexure IV
2328Pre-monsoon 7.1Monsoon 7.1Post-monsoon 7.4
6.97.07.07.17.17.27.27.37.37.47.4
Var
iati
on in
pH
pH
2328Pre-monsoon 93Monsoon 123Post-monsoon 104
0
20
40
60
80
100
120
140
Var
iati
on in
EC
Electrical Conductivity, µmhos/cm
2328Pre-monsoon 7.2Monsoon 6.9Post-monsoon 7.3
6.7
6.8
6.9
7.0
7.1
7.2
7.3
Var
iati
on in
Do
Dissolved oxygen, mg/l
2328Pre-monsoon 1.2Monsoon 1.4Post-monsoon 0.8
0.00.20.40.60.81.01.21.41.6
Varia
tion
in B
oD
Biological oxygen Demand, mg/l
2328Pre-monsoon 224Monsoon 121Post-monsoon 400
050
100150200250300350400450
Varia
tion
in T
C
Total Coliform, MPN/100ml
Season PeriodPre monsoon January-May
Monsoon June-SeptemberPost Monsoon October-December

Directory 2019 163
Kerala State Pollution Control Board
5.5 Periyar (Thekkady) Reservoir
This is a splendid artificial lake formed by the Mullaperiyar Dam across the PeriyarRiver.It lies within the Periyar wild life sanctuary which spread across 777km2 of which 360 km2 is the thick ever green forest. The Periyar Tiger Reserve is apartof it. The NWMP sampling station is at Thekkady. The sampling stations under SWMP are located at five locations ie; at Canal Shutter, Boat Landing, Dam site, Padikkayam, and at Thannikkudy.
2019 PERIYAR (THEKKADY) RESERVOIR
River Stations pH EC µmhos/cm
DOmg/l
BODmg/l
TC MPN/100ml
FCMPN/100ml CLASS*
Canal Shutter K127
SWMP
Max 7.6 69 6.9 0.9 3000 1300
CMin 6.6 41 4.9 0.1 400 50
Mean 7.2 51 6.3 0.5 1225 608
Std. Dev 0.3 9.44 0.6 0.3 646.49 285.11
Boat Landing K128 SWMP
Max 7.9 58 7.3 0.8 2600 1200
CMin 6.4 38 5.2 0.2 250 100
Mean 7.3 49 6.9 0.4 1075 541.67
Std. Dev 0.4 6.86 0.6 0.2 640.84 326.02
Thekkady1576
NWMP
Max 7.9 60 7.9 0.9 1100 750
CMin 6.8 41 6.2 0.1 0 0
Mean 7.5 48 7.1 0.4 554 209
Std. Dev 0.3 6.41 0.5 0.2 427.52 239.84
Padikkayam K129 SWMP
Max 8.0 61 7.9 0.9 1200 650
CMin 6.8 42 6.2 0.1 100 100
Mean 7.6 51 7.3 0.4 554 275
Std. Dev 0.3 7.26 0.5 0.2 323.62 163.64

Directory 2019
Kerala State Pollution Control Board
164
164
K127 K128 1576 K129 K130Pre-monsoon 7.0 7.1 7.3 7.4 7.3Monsoon 7.2 7.2 7.5 7.7 7.5Post-monsoon 7.5 7.8 7.8 7.9 7.9
6.46.66.87.07.27.47.67.88.08.2
Var
iati
n in
pH
pH
K127 K128 1576 K129 K130Pre-monsoon 6.4 7.0 6.9 7.1 7.4Monsoon 6.1 6.6 7.0 7.4 7.3Post-monsoon 6.5 6.9 7.5 7.4 7.7
0.01.02.03.04.05.06.07.08.09.0
Var
iati
on in
Do
Dissolved oxygen, mg/l
K127 K128 1576 K129 K130Pre-monsoon 56 53 51 54 56Monsoon 52 48 50 51 48Post-monsoon 43 43 43 44 44
0
10
20
30
40
50
60
Var
iati
on in
EC
Electrical Conductivity, µmhos/cm
K127 K128 1576 K129 K130Pre-monsoon 0.4 0.4 0.5 0.3 0.4Monsoon 0.5 0.4 0.3 0.5 0.4Post-monsoon 0.5 0.4 0.3 0.5 0.4
0.0
0.1
0.2
0.3
0.4
0.5
0.6
Var
iati
on in
Bo
D
Biological oxygen Demand, mg/l
K127 K128 1576 K129 K130Pre-monsoon 990 810 470 575 400Monsoon 1238 1213 675 575 575Post-monsoon 1600 1333 533 683 600
0200400600800
10001200140016001800
Var
iati
on in
TC
Total Coliform, MPN/100ml
Thannikudy K130
SWMP Max 8.0 63 7.8 0.7 1000 500
BMin 6.8 39 6.7 0.1 100 100
Mean 7.5 50 7.4 0.4 442 188
Std. Dev 0.4 7.61 0.4 0.2 306.59 148.65
*See Annexure IV
Season PeriodPre monsoon January-May
Monsoon June-SeptemberPost Monsoon October-December

Directory 2019 165
Kerala State Pollution Control Board
5.6 Karapuzha Reservoir
Karapuzha Dam is located in the Waynad district of Kerala, is one of the biggest earth dams in India. It is across the Karapuzha river, a tributary of the river Kabani. Situated at Vazhavatta, 16 km away from Kalpetta town, the main purpose of the reservoir is irrigation and drinking water source forKalpetta Municipality.
2019 KARAPUZHA RESERVOIR
River Stations pH EC µmhos/cm
DOmg/l
BODmg/l
TC MPN/100ml
FCMPN/100ml CLASS*
Karapuzha Dam 3458 NWMP
Max 7.1 190 8.0 2.0 112 56
AMin 6.5 100 5.1 0.1 15 2
Mean 6.7 123 6.8 1.1 48 20
Std. Dev 0.2 22.99 0.9 0.6 28.4 15.5
*See Annexure IV
3458Pre-monsoon 6.7Monsoon 6.7Post-monsoon 6.8
6.66.66.66.66.76.76.76.76.76.86.8
Var
iati
on in
pH
pH
3458Pre-monsoon 135Monsoon 117Post-monsoon 109
020406080
100120140160
Var
iati
on in
EC
Electrical Conductivity, µmhos/cm
3458Pre-monsoon 6.8Monsoon 6.7Post-monsoon 6.9
6.6
6.7
6.7
6.8
6.8
6.9
6.9
7.0
Var
iati
on in
Do
Dissolved oxygen, mg/l
3458Pre-monsoon 1.4Monsoon 1.0Post-monsoon 0.8
0.00.20.40.60.81.01.21.41.6
Var
iati
on in
Bo
D
Biological oxygen Demand, mg/l
3458Pre-monsoon 40Monsoon 75Post-monsoon 23
01020304050607080
Var
iati
on in
TC
Total Coliform, MPN/100ml
Season PeriodPre monsoon January-May
Monsoon June-SeptemberPost Monsoon October-December

Directory 2019
Kerala State Pollution Control Board
166
166
5.7 Mananchira Pond
Mananchira is a manmade freshwater lake, which is situated at the centre of the city of Kozhikode. The lake is 3.49 acres (14,120 m2) in area, is rectangular in shape and is fed by a natural spring. The water of the lake is kept entirely for drinking purpose.
2019 MANANCHIRA POND
River Stations pH EC µmhos/cm
DOmg/l
BODmg/l
TC MPN/100ml
FCMPN/100ml CLASS*
Mananchira 3462 NWMP
Max 8.1 100 9.8 1.0 700 600
BMin 7.0 50 6.6 0.0 49 10
Mean 7.6 80 8.0 0.4 284 161
Std. Dev 0.4 16.01 1.1 0.3 210.78 163.24
*See Annexure IV
3462Pre-monsoon 7.7Monsoon 7.5Post-monsoon 7.8
7.3
7.4
7.5
7.6
7.7
7.8
7.9
Var
iati
on in
pH
pH
3462Pre-monsoon 85Monsoon 82Post-monsoon 69
0102030405060708090
Var
iati
on in
EC
Electrical Conductivity, µmhos/cm
3462Pre-monsoon 8.4Monsoon 7.3Post-monsoon 8.5
6.66.87.07.27.47.67.88.08.28.48.6
Var
iati
on in
Do
Dissolved oxygen, mg/l
3462Pre-monsoon 0.2Monsoon 0.6Post-monsoon 0.3
0.0
0.1
0.2
0.3
0.4
0.5
0.6
Var
iati
on in
Bo
D
Biological oxygen Demand, mg/l
3462Pre-monsoon 118Monsoon 301Post-monsoon 537
0
100
200
300
400
500
600
Var
iati
on in
TC
Total Coliform, MPN/100ml
Season PeriodPre monsoon January-May
Monsoon June-SeptemberPost Monsoon October-December

Directory 2019 167
Kerala State Pollution Control Board
5.8 Pond At Padmatheertham
Padmatheertham, the sacred pond is associated with the SreePadmanabhaSwamy Temple, Thiruvananthapuram. The pond, situated in the East Fort was equipped with a constant supply of fresh water from Maruthamkuzhi check dam in the riverKilliyar by means of a channel known as Kochar.andthe polluted spill over from Padmatheertham was connected to the nearby Patrakulam, an outlet from this drained its overflow to the thekanamkarathodu.. Later the drainage system became obsolete,the fresh water supply from Kocharceased andPadmatheertham has to rely on its original aquifers.This pond is widely used by pilgrims for bathing purpose.
2019 PADMATHEERTHAM POND
River Stations pH EC µmhos/cm
DOmg/l
BODmg/l
TC MPN/100ml
FCMPN/100ml CLASS*
Padmatheertham 2325 NWMP
Max 8.2 385 6.6 75 2600 700
EMin 6.1 180 0.1 1.4 200 100
Mean 7.4 269 3.8 9.5 725 209
Std. Dev 0.7 74.89 2.7 20.7 670.77 189.85
*See Annexure IV
2325Pre-monsoon 7.5Monsoon 6.9Post-monsoon 7.6
6.4
6.6
6.8
7.0
7.2
7.4
7.6
7.8
Var
iati
on in
pH
pH
2325Pre-monsoon 216Monsoon 267Post-monsoon 359
050
100150200250300350400
Var
iati
on in
EC
Electrical Conductivity, µmhos/cm
2325Pre-monsoon 5.6Monsoon 4.4Post-monsoon 0.1
0.0
1.0
2.0
3.0
4.0
5.0
6.0
Var
iati
on in
Do
Dissolved oxygen, mg/l
2325Pre-monsoon 3.5Monsoon 3.1Post-monsoon 28.1
0.0
5.0
10.0
15.0
20.0
25.0
30.0
Varia
tion
in B
oD
Biological oxygen Demand, mg/l
2325Pre-monsoon 376Monsoon 558Post-monsoon 1530
0200400600800
10001200140016001800
Varia
tion
in T
C
Total Coliform, MPN/100ml
Season PeriodPre monsoon January-May
Monsoon June-SeptemberPost Monsoon October-December

Directory 2019
Kerala State Pollution Control Board
168
168
5.9 Canoli Canal
The Canoli Canal which was constructed during the British rule for inland water transport is connecting the Korapuzha in the north and the Kallayipuzha in the south in Kozhikode district and is 11.5km long. The canal is facing issues such as weed infestation, discharge of untreated and partially treated waste water from hotels, hospitals, and markets. Thus the Canal is now the receptacle for a major portion of sewage generated in the city and is the major contributor to pollution downstream of Kallayiriver.
2019 CANOLI CANAL
River Stations pH EC µmhos/cm
DOmg/l
BODmg/l
TC MPN/100ml
FCMPN/100ml CLASS*
Canoli3461 NWMP
Max 7.7 43100 7.5 2.1 7800 4900
Below EMin 6.6 195 3.2 0.2 200 100
Mean 7.4 23185 5.1 0.9 2366 1528
Std. Dev 0.3 18082.29 1.4 0.6 2578.35 1552.18
*See Annexure IV
3461Pre-monsoon 7.4Monsoon 7.3Post-monsoon 7.3
7.2
7.3
7.3
7.4
7.4
7.5
7.5
Var
iati
on in
pH
pH
3461Pre-monsoon 39626Monsoon 11271Post-monsoon 11669
05000
1000015000200002500030000350004000045000
Var
iati
on in
EC
Electrical Conductivity, µmhos/cm
3461Pre-monsoon 5.2Monsoon 5.2Post-monsoon 4.8
4.6
4.7
4.8
4.9
5.0
5.1
5.2
5.3
Var
iati
on in
Do
Dissolved oxygen, mg/l
3461Pre-monsoon 0.6Monsoon 1.0Post-monsoon 1.1
0.0
0.2
0.4
0.6
0.8
1.0
1.2
Var
iati
on in
Bo
D
Biological oxygen Demand, mg/l
3461Pre-monsoon 1594Monsoon 4000Post-monsoon 1473
0500
10001500200025003000350040004500
Var
iati
on in
TC
Total Coliform, MPN/100ml
Season PeriodPre monsoon January-May
Monsoon June-SeptemberPost Monsoon October-December

Directory 2019 169
Kerala State Pollution Control Board
5.10 Palakkattuthazham Thodu
Palakkkattuthazhamthodu is a drainage canal that carries water from Perumbavoor town and nearby areas and joins River Periyar at Mudikkal. The Periyar Valley irrigation canal water also contributes during summer. It carries sewage discharges from the city and enters River Periyar without any treatment. Sampling station under the National Water Quality Programme (NWMP) is located at Mudikkal (code 3469)
2019 PALAKKATTUTHAZHAM THODU
River Stations pH EC µmhos/cm
DOmg/l
BODmg/l
TC MPN/100ml
FCMPN/100ml CLASS*
Palakkattuthazham Thodu 3469 NWMP
Max 7.6 145 7.3 3.5 8400 6300
DMin 6.5 58 2.6 1.1 3500 1500
Mean 6.9 84 4.5 1.9 6550 3892
Std. Dev 0.3 24.28 1.3 0.7 1393.17 1428.58
*See Annexure IV
3469Pre-monsoon 6.9Monsoon 6.8Post-monsoon 6.8
6.7
6.8
6.8
6.9
6.9
7.0
Var
iati
on in
pH
pH
3469Pre-monsoon 66Monsoon 107Post-monsoon 85
0
20
40
60
80
100
120
Var
iati
on in
EC
Electrical Conductivity, µmhos/cm
3469Pre-monsoon 4.6Monsoon 4.5Post-monsoon 4.3
4.24.24.34.34.44.44.54.54.64.64.7
Var
iati
on in
Do
Dissolved oxygen, mg/l
3469Pre-monsoon 1.8Monsoon 1.7Post-monsoon 2.3
0.0
0.5
1.0
1.5
2.0
2.5
Varia
tion
in B
oD
Biological oxygen Demand, mg/l
3469Pre-monsoon 5700Monsoon 7050Post-monsoon 7300
010002000300040005000600070008000
Varia
tion
in T
C
Total Coliform, MPN/100ml
Season PeriodPre monsoon January-May
Monsoon June-SeptemberPost Monsoon October-December

Directory 2019
Kerala State Pollution Control Board
170
170
5.11 Unthithode
Unthithode is the downstream of the combined Kuzhikandamthodu and Panachithodu which joins with Edamula branch of River Periyar near Eloor Ferry. The Kuzhikandamthodu mainly carries effluent from M/s. HIL, M/s. Merchem, M/s. FACT(UD). Panachithodu is a sewage drain. Sampling is station under the National Water Quality Programme (NWMP) is located at Unhithode(code 3467) is near the culvert on the way to Eloor Ferry.
2019 UNTHITHODE
River Stations pH EC µmhos/cm
DOmg/l
BODmg/l
TC MPN/100ml
FCMPN/100ml CLASS*
Unthithode 3467 NWMP
Max 7.3 30000 4.8 3.6 110000 70000
Below E Min 6.5 319 1.5 1 5400 2600
Mean 7.0 11548 2.9 2 24967 14750
Std. Dev 0.2 12097.64 1.0 0.7 36984.92 22654.06
*See Annexure IV
3467Pre-monsoon 7.2Monsoon 6.8Post-monsoon 6.9
6.6
6.7
6.8
6.9
7.0
7.1
7.2
7.3
Var
iati
on in
pH
pH
3467Pre-monsoon 24434Monsoon 3212Post-monsoon 1187
0
5000
10000
15000
20000
25000
30000
Var
iati
on in
EC
Electrical Conductivity, µmhos/cm
3467Pre-monsoon 3.0Monsoon 3.0Post-monsoon 2.8
2.62.72.72.82.82.92.93.03.03.1
Var
iati
on in
Do
Dissolved oxygen, mg/l
3467Pre-monsoon 2.2Monsoon 1.7Post-monsoon 2.2
0.0
0.5
1.0
1.5
2.0
2.5
Var
iati
on in
Bo
D
Biological oxygen Demand, mg/l
3467Pre-monsoon 26760Monsoon 35925Post-monsoon 7367
05000
10000150002000025000300003500040000
Var
iati
on in
TC
Total Coliform, MPN/100ml
Season PeriodPre monsoon January-May
Monsoon June-SeptemberPost Monsoon October-December

Directory 2019 171
Kerala State Pollution Control Board
Well StationS

Directory 2019
Kerala State Pollution Control Board
172
172

Directory 2019 173
Kerala State Pollution Control Board
6.1 Well At Pappanamcode - 1581
Latitude : 08028’27”NLongitude : 76058’87”EType : Trend Station Narrative : Open well near National Highway in Pappanamcode. Nemom village,Thiruvananthapuram
173
Code 1581 At Pappanamcode
2019 pH EC BOD TC FC
Unit µmhos/cm mg/l MPN/100ml MPN/100ml
Max 5.7 152 3.4 400 200
Min 4.5 152 0.9 310 100
Mean 5.1 152 2.15 355 150
Std.Dev 0.85 0 1.77 63.64 70.71

Directory 2019
Kerala State Pollution Control Board
174
174
6.2 Well At Nedumangadu - 1582
Latitude : 08036’26”NLongitude : 76059’89”EType : Trend Station Narrative : Well at Nedumangad,near Nedumangad Govt
Hospital in Thiruvananthapuram district.
Code 1582 At Nedumangadu
2019 pH EC BOD TC FC
Unit µmhos/cm mg/l MPN/100ml MPN/100ml
Max 6.2 178 4.1 400 100
Min 5.7 155 1 300 100
Mean 6.0 167 2.6 350 100
Std.Dev 0.4 16.26 2.2 70.71 0

Directory 2019 175
Kerala State Pollution Control Board
6.3 Well At Kundara - 1583
Latitude : 08053’62”NLongitude : 76036’25”EType : Trend Station Narrative : Open well near Kundara Ceramic factory
in Kollam district.
Code 1583 At Kundara
2019 pH EC BOD TC FC
Unit µmhos/cm mg/l MPN/100ml MPN/100ml
Max 6.7 166 1.2 100 48
Min 6.5 156 1.2 70 20
Mean 6.6 161 1.2 85 34
Std.Dev 0.1 7.07 0 21.21 19.8

Directory 2019
Kerala State Pollution Control Board
176
176
6.4 Well At KMML - 2315
Latitude : 09000’46”NLongitude : 76032’14”EType : Impact Station Narrative : Open well near KMML.Chavara,Kollam
district.
Code 2315 At KMML
2019 pH EC BOD TC FC
Unit µmhos/cm mg/l MPN/100ml MPN/100ml
Max 7.6 234 1.6 110 60
Min 7.5 220 1 110 60
Mean 7.6 227 1.3 110 60
Std.Dev 0.1 9.9 0.4 0 0

Directory 2019 177
Kerala State Pollution Control Board
6.5 Well At Kureepuzha - 2314
Latitude : 08054’44”NLongitude : 76033’54”EType : Trend Station Narrative : Open well located at Kureepuzha
near Chandy Depot Kollam
Code 2314 At Kureepuzha
2019 pH EC BOD TC FC
Unit µmhos/cm mg/l MPN/100ml MPN/100ml
Max 6.9 210 1.4 140 79
Min 6.8 176 1.1 84 27
Mean 6.9 193 1.3 112 53
Std.Dev 0.1 24.04 0.2 39.6 36.77

Directory 2019
Kerala State Pollution Control Board
178
178
6.6 Well At Punalur - 0035
Latitude : 08059’59”NLongitude : 76055’22”EType : Impact Station Narrative : Open well station located at Punalur
near Kallada River in Kollam District.
Code 0035 At Punalur
2019 pH EC BOD TC FC
Unit µmhos/cm mg/l MPN/100ml MPN/100ml
Max 6.9 154 1 79 26
Min 5.8 148 1 60 10
Mean 6.4 151 1 70 18
Std.Dev 0.8 4.24 0 13.44 11.31

Directory 2019 179
Kerala State Pollution Control Board
6.7 Well At Fathimapuram - 2308
Latitude : 09026’41”NLongitude : 76033’20”E Type : Impact Station Narrative : Public well loated near Fathimapuram
Municipal waste dump site in Perunna village,Changanasserry
Taluk in Kottayam district
Code 2308 At Fathimapuram
2019 pH EC BOD TC FC
Unit µmhos/cm mg/l MPN/100ml MPN/100ml
Max 7.3 247 1 4100 2000
Min 7 197 0.6 540 280
Mean 7.2 222 0.8 2320 1140
Std.Dev 0.2 35.36 0.3 2517.3 1216.22

Directory 2019
Kerala State Pollution Control Board
180
180
6.8 Well At Karoor - 2309
Latitude : 09040’47”NLongitude : 76042’35”E Type : Impact Station Narrative : Open well at Lalam
village,Meenachil taluk in Pala Municipality in Kottayam District
Code 2309 At Karoor
2019 pH EC BOD TC FC
Unit µmhos/cm mg/l MPN/100ml MPN/100ml
Max 7.5 304 0.6 3600 1800
Min 7.1 76 0.1 49 2
Mean 7.3 190 0.4 1825 901
Std.Dev 0.3 161.22 0.4 2510.94 1271.38

Directory 2019 181
Kerala State Pollution Control Board
6.9 Well At Vaikom - 2310
Latitude : 09045’06”NLongitude : 76023’44”EType : Impact Station Narrative : Public well located in Naduvila village, Vaikom
Municipality near Vaikom municipality waste dumpsite.
Code 2310 At Vaikom
2019 pH EC BOD TC FC
Unit µmhos/cm mg/l MPN/100ml MPN/100ml
Max 6.8 198 0.3 2400 1300
Min 6.6 91 0.2 140 69
Mean 6.7 145 0.25 1270 685
Std.Dev 0.1 75.66 0.1 1598.06 870.45

Directory 2019
Kerala State Pollution Control Board
182
182
6.10 Well At Vadavathoor - 2311
Latitude : 09036’12”NLongitude : 76033’36”EType : Impact Station Narrative : Public well located at Vadavathoor in
Vijayapuram Village, Kotttayam taluk near Kottayam municipality waste dumpsite
Code 2311 At Vadavathoor
2019 pH EC BOD TC FC
Unit µmhos/cm mg/l MPN/100ml MPN/100ml
Max 6.7 160 0.4 4900 2400
Min 6.6 103 0.3 600 280
Mean 6.7 132 0.4 2750 1340
Std.Dev 0.1 40.31 0.1 3040.56 1499.07

Directory 2019 183
Kerala State Pollution Control Board
6.11 Well At Cherthala - 1584
Latitude : 09041’33”NLongitude : 76019’26”EType : Impact Station Narrative : Open well at Cherthala in Alappuzha district
Code 1584 At Cherthala
2019 pH EC BOD TC FC
Unit µmhos/cm mg/l MPN/100ml MPN/100ml
Max 6.9 412 1.7 790 280
Min 6.8 299 1.1 100 10
Mean 6.9 356 1.4 445 145
Std.Dev 0.1 79.9 0.4 487.9 190.92

Directory 2019
Kerala State Pollution Control Board
184
184
6. 12 Well At Sarvodayapuram - 2313
Latitude : 09033’18”NLongitude : 760 19’17’’EType : Impact Station Narrative : Open well located at Sarvodayapuram,in Kalavoor Panchayat near Municipal waste dumping yard of
Alappuzha muncipality
Code 2313 At Sarvodayapuram
2019 pH EC BOD TC FC
Unit µmhos/cm mg/l MPN/100ml MPN/100ml
Max 7.6 485 1.2 400 200
Min 7.5 268 1.2 100 49
Mean 7.6 377 1.2 250 125
Std.Dev 0.1 153.44 0 212.13 106.77

Directory 2019 185
Kerala State Pollution Control Board
6.13 Well At Vyttila - 1585
Latitude : 09058’08”N Longitude : 76019’01”EType : Domestic Station Narrative : Well located at Vytilla in Kochi
Corporation in Ernakulam district.
Code 1585 At Vytilla
2019 pH EC BOD TC FC
Unit µmhos/cm mg/l MPN/100ml MPN/100ml
Max 7.7 520 1.4 2300 1200
Min 7.5 277 0.2 240 100
Mean 7.6 399 0.8 1270 650
Std.Dev 0.1 171.83 0.9 1456.64 777.82

Directory 2019
Kerala State Pollution Control Board
186
186
6.14 Well At Edayar - 1586
Latitude : 10005’18”N Longitude : 76018’09”EType : Domestic Station Narrative : Open Well located at Edayar near
Industrial area in Kadungalloor panchayath in Ernakulam district.
Code 1586 At Edayar
2019 pH EC BOD TC FC
Unit µmhos/cm mg/l MPN/100ml MPN/100ml
Max 6.5 352 1.1 7900 6300
Min 6.2 244 0.2 700 270
Mean 6.4 298 0.7 4300 3285
Std.Dev 0.2 76.37 0.6 5091.17 4263.85

Directory 2019 187
Kerala State Pollution Control Board
6.15 Well At Brahmapuram - 2323
Latitude : 09059’28”NLongitude : 76021’49”EType : ImpactStation Narrative : Well at Brahmapuram in Vadavukode
Puthencruz panchayath in Ernakulam district near municipal solid waste treatment yard
Code 2323 At Brahmapuram
2019 pH EC BOD TC FC
Unit µmhos/cm mg/l MPN/100ml MPN/100ml
Max 6.9 218 0.6 2200 1000
Min 6.5 174 0.3 700 480
Mean 6.7 196 0.5 1450 740
Std.Dev 0.3 31.11 0.2 1060.66 367.7

Directory 2019
Kerala State Pollution Control Board
188
188
6.16 Well At Eloor - 0019
Latitude : 10004’80”NLongitude : 76017’55”EType : Impact Station Narrative : Well at Eloor in Eloor Panchayath,
Ernakulam district.
Code 0019 At Eloor
2019 pH EC BOD TC FC
Unit µmhos/cm mg/l MPN/100ml MPN/100ml
Max 6.2 145 0.2 1700 700
Min 5.9 140 0.2 490 340
Mean 6.1 143 0.2 1095 520
Std.Dev 0.2 3.53 0 855.6 254.56

Directory 2019 189
Kerala State Pollution Control Board
6.17 Well At Kalamassery - 1587
Latitude : 10002’ 50”NLongitude : 76019’00”EType : Impact Station Narrative : Open Well located at Kalamassery in Kalamassery municipality near to NH 47 in Ernakulam district.
Code 1587 At Kalamassery
2019 pH EC BOD TC FC
Unit µmhos/cm mg/l MPN/100ml MPN/100ml
Max 7 340 0.2 540 240
Min 6.2 268 0.2 540 100
Mean 6.6 304 0.2 540 170
Std.Dev 0.6 50.91 0 0 98.99

Directory 2019
Kerala State Pollution Control Board
190
190
6.18 Well At Poonkunnam - 1588
Latitude : 10022’48”NLongitude : 76012’48”EType : Impact Station Narrative : Well at Poonkunnam in Thrissur Corporation.
Code 1588 At Poonkunnam
2019 pH EC BOD TC FC
Unit µmhos/cm mg/l MPN/100ml MPN/100ml
Max 6.3 267 1.1 2000 280
Min 6 160 0.9 310 100
Mean 6.2 214 1 1155 190
Std.Dev 0.2 75.66 0.1 1195.01 127.28

Directory 2019 191
Kerala State Pollution Control Board
6.19 Well At Laloor - 2321
Latitude : 10030’91”NLongitude : 76011’15”EType : Impact Station Narrative : Well at Laloor in Ayyanthol near the MSW
dump site in Thrissur Corporation.
Code 2321 At Laloor
2019 pH EC BOD TC FC
Unit µmhos/cm mg/l MPN/100ml MPN/100ml
Max 6.1 264 0.7 400 10
Min 5.9 180 0.4 100 10
Mean 6 222 0.6 250 10
Std.Dev 0.1 59.4 0.2 212.13 0

Directory 2019
Kerala State Pollution Control Board
192
192
6.20 Well At Ollur - 2322
Latitude : 10028’90”NLongitude : 76011’11”EType : Impact Station Narrative : Open well in Ollur village,Thrissur Corporation located in the market place.
Code 2322 At Ollur
2019 pH EC BOD TC FC
Unit µmhos/cm mg/l MPN/100ml MPN/100ml
Max 5.8 140 1.2 1000 100
Min 5 130 0.8 200 10
Mean 5.4 135 1 600 55
Std.Dev 0.6 7.07 0.3 565.69 63.64

Directory 2019 193
Kerala State Pollution Control Board
6.21 Well At Karukamani - 2327
Latitude : 10041’76”NLongitude : 76043’42”EType : Domestic Station Narrative : Public well in Karukamoni,Chitoor Taluk
in Palakkad district.
Code 2327 At Karukamani
2019 pH EC BOD TC FC
Unit µmhos/cm mg/l MPN/100ml MPN/100ml
Max 8 770 1.4 550 10
Min 7.2 768 0.5 29 10
Mean 7.6 769 1.0 290 10
Std.Dev 0.6 1.41 0.6 368.4 0

Directory 2019
Kerala State Pollution Control Board
194
194
6.22 Well At Malappuram - 1589
Latitude : 11002’48”NLongitude : 76005’03”EType : Impact Station Narrative : Partially covered well at Malappuram in Malappuram Down Hill market area.
Code 1589 At Malappuram
2019 pH EC BOD TC FC
Unit µmhos/cm mg/l MPN/100ml MPN/100ml
Max 7.6 730 1.6 84 34
Min 6.5 332 0.3 24 10
Mean 7.1 531 1.0 54 22
Std.Dev 0.8 281.43 0.9 42.43 16.97

Directory 2019 195
Kerala State Pollution Control Board
6.23 Well At Manjeri - 2320
Latitude : 11006’40”NLongitude : 76008’26”EType : Impact Station Narrative : Well located in Government HSS Manjeri in Manjeri
Town Malappuram district.
Code 2320 At Manjeri
2019 pH EC BOD TC FC
Unit µmhos/cm mg/l MPN/100ml MPN/100ml
Max 7.3 256 1.6 70 38
Min 6.3 236 0.5 18 10
Mean 6.8 246 1.1 44 24
Std.Dev 0.7 14.14 0.8 36.77 19.8

Directory 2019
Kerala State Pollution Control Board
196
196
6.24 Well At Chungappally - 0022
Latitude : 11014’61”NLongitude : 75053’89”EType : Impact Station Narrative : Public well located in Mavoor panchayath in Kozhikode district
Code 0022 At Chungappally
2019 pH EC BOD TC FC
Unit µmhos/cm mg/l MPN/100ml MPN/100ml
Max 6.8 123 0.5 1000 630
Min 6.4 66 0.2 170 81
Mean 6.6 94.5 0.4 585 355.5
Std.Dev 0.3 40.31 0.2 586.9 388.2

Directory 2019 197
Kerala State Pollution Control Board
6.25 Well At Mavoor - 1590
Latitude : 11015’65”NLongitude : 75057’11”EType : Domestic Station Narrative : Public well located in Mavoor panchayath in
Kozhikode district
Code 1590 At Mavoor
2019 pH EC BOD TC FC
Unit µmhos/cm mg/l MPN/100ml MPN/100ml
Max 6.6 103 0.2 320 150
Min 6.4 92 0.1 260 120
Mean 6.5 98 0.2 290 135
Std.Dev 0.1 7.78 0.1 42.43 21.21

Directory 2019
Kerala State Pollution Control Board
198
198
6.26 Well At Vellipparamba - 3464
Latitude : 11016’08”NLongitude : 76050’30”EType : Trend Station Narrative : Open well near to Medical College
Kozhikode
Code 3463 At Velliparamba
2019 pH EC BOD TC FC
Unit µmhos/cm mg/l MPN/100ml MPN/100ml
Max 6.2 99 0.7 8400 4600
Min 5.2 80 0.3 540 210
Mean 5.7 90 0.5 4470 2405
Std.Dev 0.7 13.44 0.3 5557.86 3104.2

Directory 2019 199
Kerala State Pollution Control Board
6.27 Well At Kannur - 1591
Latitude : 11052’64”NLongitude : 75022’17”EType : Trend Station Narrative : Well station located
at Kannur taluk, Kannur district.
Code 1591 At Kannur
2019 pH EC BOD TC FC
Unit µmhos/cm mg/l MPN/100ml MPN/100ml
Max 6.7 119 1.2 150 21
Min 4.6 116 0.3 100 20
Mean 5.7 118 0.8 125 21
Std.Dev 1.5 2.12 0.6 35.36 0.71

Directory 2019
Kerala State Pollution Control Board
200
200
6.28 Well At Karimbam - 3475
Latitude : 12002’34”NLongitude : 77022’42”EType : Impact Station Narrative : Open well located near to
waste dumping yard in Kannur district.
Code 3475 At Karimbam
2019 pH EC BOD TC FC
Unit µmhos/cm mg/l MPN/100ml MPN/100ml
Max 4.9 96 2 350 40
Min 4.6 67 1.6 49 4
Mean 4.8 82 1.8 200 22
Std.Dev 0.2 20.51 0.28 212.84 25.46

Directory 2019 201
Kerala State Pollution Control Board
6.29 Well At Parassinikadavu - 3472
Latitude : 11054’29”NLongitude : 75026’47”EType : ` Domestic Station Narrative : Open well of Parassinikadavu Temple
in Kannur district
Code 3472 At Parassinikadavu
2019 pH EC BOD TC FC
Unit µmhos/cm mg/l MPN/100ml MPN/100ml
Max 8 11750 1 100 10
Min 7 612 0.9 60 10
Mean 7.5 6181 1.0 80 10
Std.Dev 0.7 7875.76 0.1 28.28 0

Directory 2019
Kerala State Pollution Control Board
202
202
6.30 Well At Payyannur I - 1592
Latitude : 12008’88”NLongitude : 75012’86”EType : Trend Station Narrative : Well at Payyannur
in Vellur village, Taliparamba Taluk, Kannur district
Code 1592 At Payyannur - I
2019 pH EC BOD TC FC
Unit µmhos/cm mg/l MPN/100ml MPN/100ml
Max 6.6 359 2.3 150 32
Min 6.6 328 0.9 100 17
Mean 6.6 344 1.6 125 25
Std.Dev 0 21.92 1.0 35.36 10.61

Directory 2019 203
Kerala State Pollution Control Board
6.31 Well At Payyannur II - 3474
Latitude : 12007’15”NLongitude : 75012’31”EType : Impact Station Narrative : Open well near waste dumping
yard at Murikoil, Payyannur
Code 3474 At Payyannur -II
2019 pH EC BOD TC FC
Unit µmhos/cm mg/l MPN/100ml MPN/100ml
Max 6.9 239 2.5 120 40
Min 6.9 148 1.1 100 21
Mean 6.9 194 1.8 110 31
Std.Dev 0 64.35 1.0 14.14 13.44

Directory 2019
Kerala State Pollution Control Board
204
204
6.32 Well At Punnelpettipalam - 2317
Latitude : 11043’36”NLongitude : 75030’92”EType : Impact Station Narrative : open well near Punnelpettipalam in Thalasserry Taluk in Kannur district
204
Code 2317 At Punnelpettipalam
2019 pH EC BOD TC FC
Unit µmhos/cm mg/l MPN/100ml MPN/100ml
Max 5.9 308 1.3 60 10
Min 5.5 280 0.9 20 4
Mean 5.7 294 1.1 40 7
Std.Dev 0.3 19.8 0.3 28.28 4.24

Directory 2019 205
Kerala State Pollution Control Board
204
Code 2324 Ambalamughal Borewell
2019 pH EC BOD TC FC
Unit µmhos/cm mg/l MPN/100ml MPN/100ml
Max 6.1 96 1.2 230 120
Min 5.6 66 0.3 10 2
Mean 5.9 81 0.8 120 61
Std.Dev 0.4 21.21 0.6 155.56 83.44
6.33 Well At Ambalamughal Borewell - 2324
Latitude : 9.980 53’26”NLongitude : 76036’72’69”EType : Impact Station Narrative : Ambalamugal borewell in Ernakulam District

Directory 2019
Kerala State Pollution Control Board
206
206
Code 2316 At Chelora Trenching ground
2019 pH EC BOD TC FC
Unit µmhos/cm mg/l MPN/100ml MPN/100ml
Max 6.9 140 2.9 460 40
Min 5.1 54 1.8 100 20
Mean 6 97 2.4 280 30
Std.Dev 1.3 60.81 0.8 254.56 14.14
6.34 Well At Chelora Trenching Ground - 2316
Latitude : 11.90010’19”NLongitude : 75.44018’04”EType : Impact Station Narrative : open well at At Chelora Trenching Ground in Kannurdistrict

Directory 2019 207
Kerala State Pollution Control Board
GeneRal tRend analySiS oF SeleCted RiveR StationS
(2012-2019)

Directory 2019
Kerala State Pollution Control Board
208
208

Directory 2019 209
Kerala State Pollution Control Board
7.1.1 ACHENKOVIL AT THUMPAMON - Station Code: 1342
Ann
ual A
vera
geA
nnua
l Ave
rage
Ann
ual A
vera
ge
2012 2013 2014 2015 2016 2017 2018 2019PH 7.2 7.3 7.5 7.4 7.4 7.2 7.2 6.9DO 7.0 6.4 6.7 6.6 6.2 6.9 6.4 5.9
0.02.04.06.08.0
pH & Do trend at Thumpamon
2012 2013 2014 2015 2016 2017 2018 2019BOD 1.4 2.0 1.3 1.2 1.4 1.2 1.5 2.0
0.0
1.0
2.0
3.0
BoD trend at Thumpamon
2012 2013 2014 2015 2016 2017 2018 2019TC 1223 1573 833 165 233 392 273 318FC 236 340 383 85 90 150 98 162
0500
100015002000
TC & fC trend at Thumpamon

Directory 2019
Kerala State Pollution Control Board
210
210
7.1.2 ACHENKOVIL AT CHENNITHALA- Station Code: 1443
2012 2013 2014 2015 2016 2017 2018 2019PH 7.0 7.1 7.4 7.4 7.3 7.1 6.6 6.7DO 6.6 6.0 5.8 6.4 6.4 6.7 6.2 5.6
0.02.04.06.08.0
pH & Do trend at Chennithala
2012 2013 2014 2015 2016 2017 2018 2019BOD 1.1 1.7 1.4 1.4 1.4 1.1 1.4 2.1
0.0
1.0
2.0
3.0
BoD trend at Chennithala
2012 2013 2014 2015 2016 2017 2018 2019TC 670 538 690 736 446 342 526 379FC 275 262 287 290 167 132 187 211
0200400600800
TC & fC trend at Chennithala
Ann
ual A
vera
geA
nnua
l Ave
rage
Ann
ual A
vera
ge

Directory 2019 211
Kerala State Pollution Control Board
7.2.1 BHARATHAPUZHA AT PATTAMBI - Station Code: 2332
2012 2013 2014 2015 2016 2017 2018 2019PH 8.1 7.9 7.7 7.7 7.3 7.5 7.3 7.4DO 7.1 6.7 6.6 6.7 7.1 7.7 7.6 6.3
0.0
5.0
10.0
pH & Do trend at Pattambi
2012 2013 2014 2015 2016 2017 2018 2019BOD 0.9 0.9 1.6 1.3 1.2 2.5 1.6 2.0
0.0
1.0
2.0
3.0
BoD trend at Pattambi
2012 2013 2014 2015 2015 2017 2018 2019TC 992 426 571 528 228 333 428 367FC 524 191 362 250 174 217 188 159
0500
10001500
TC & fC trend at Pattambi
Ann
ual A
vera
geA
nnua
l Ave
rage
Ann
ual A
vera
ge

Directory 2019
Kerala State Pollution Control Board
212
212
7.2.2 BHARATHAPUZHA AT KUTTIPPURAM- Station Code: 2331
2012 2013 2014 2015 2016 2017 2018 2019PH 7.3 7.7 7.3 7.6 7.1 7.4 7.4 7.3DO 6.2 6.9 6.9 7.0 7.6 8.2 7.6 6.5
0.0
5.0
10.0
pH & Do trend at Kuttippuram
2012 2013 2014 2015 2016 2017 2018 2019BOD 1.0 0.7 0.7 0.8 1.2 1.9 1.3 1.8
0.0
1.0
2.0
3.0
BoD trend at Kuttippuram
2012 2013 2014 2015 2016 2017 2018 2019TC 676 443 497 277 270 150 577 328FC 296 255 246 185 167 85 185
0200400600800
TC & fC trend at Kuttippuram
Ann
ual A
vera
geA
nnua
l Ave
rage
Ann
ual A
vera
ge

Directory 2019 213
Kerala State Pollution Control Board
7.3 CHALAKUDY AT PULICKAKADAVU - Station Code: 1154
2012 2013 2014 2015 2016 2017 2018 2019PH 6.8 6.9 6.9 7.1 6.8 6.6 6.7 6.9DO 6.3 5.6 6.8 7.5 6.4 6.2 6.8 6.4
0.02.04.06.08.0
pH & Do trend at Pulickakadavu
2012 2013 2014 2015 2016 2017 2018 2019BOD 1.2 1.2 1.1 1.4 1.2 1.5 1.6 0.9
0.00.51.01.52.0
BoD trend at Pulickakadavu
2012 2013 2014 2015 2015 2017 2018 2019TC 780 990 552 277 388 67761 1870 1555FC 224 266 264 168 262 59194 685 696
0
10000
20000
30000
40000
50000
60000
70000
80000
TC & fC trend at Pulickakadavu
Ann
ual A
vera
geA
nnua
l Ave
rage
Ann
ual A
vera
ge

Directory 2019
Kerala State Pollution Control Board
214
214
7.4.1 CHALIYAR AT CHUNGAPALLY- Station Code: 0021
2012 2013 2014 2015 2015 2017 2018 2019PH 7.3 7.3 7.4 7.4 7.1 7.4 7.4 7.2DO 7.0 6.9 6.6 6.4 6.6 6.3 6.6 7.2
5.56.06.57.07.58.0
pH & Do trend at Chungapally
2012 2013 2014 2015 2016 2017 2018 2019BOD 0.9 0.8 0.8 0.4 0.7 0.8 0.9 0.5
0.0
0.5
1.0
BoD trend at Chungapally
2012 2013 2014 2015 2016 2017 2018 2019TC 503 2440 1760 792 254 377 1802 2904FC 256 1725 1221 501 106 196 984 1820
01000200030004000
TC & fC trend at Chungapally
Ann
ual A
vera
geA
nnua
l Ave
rage
Ann
ual A
vera
ge

Directory 2019 215
Kerala State Pollution Control Board
7.4.2 CHALIYAR AT KOOLIMADU- Station Code: 0020
2012 2013 2014 2015 2016 2017 2018 2019PH 7.2 7.4 7.5 7.4 7.1 7.3 7.4 7.2DO 7.3 7.3 7.0 6.9 6.7 6.4 7.2 7.6
5.56.06.57.07.58.0
pH & Do trend at Koolimadu
2012 2013 2014 2015 2016 2017 2018 2019BOD 0.6 0.8 0.8 0.8 0.6 0.7 0.8 0.7
0.0
0.5
1.0
BoD trend at Koolimadu
2012 2013 2014 2015 2016 2017 2018 2019TC 893 4208 3691 670 337 286 1139 2391FC 468 2984 2652 465 147 162 617 1685
0200040006000
TC & fC trend at Koolimadu
Ann
ual A
vera
geA
nnua
l Ave
rage
Ann
ual A
vera
ge

Directory 2019
Kerala State Pollution Control Board
216
216
7.5 CHANDRAGIRI AT PADIATHADKA- Station Code: 1572
2012 2013 2014 2015 2016 2017 2018PH 7.2 6.9 7.2 7.0 6.7 6.8 7.1 6.9DO 7.4 7.2 7.5 7.5 7.7 7.5 7.5 7.6
6.06.57.07.58.0
pH & Do trend at Padiathadka
2012 2013 2014 2015 2016 2017 2018 2019BOD 0.7 1.3 1.2 1.0 1.0 1.0 1.3 1.4
0.0
0.5
1.0
1.5
BoD trend at Padiathadka
2012 2013 2014 2015 2016 2017 2018 2019TC 255 150 597 730 1316 576 1232 350FC 54 33 75 128 140 97 333 64
0500
10001500
TC & fC trend at Padiathadka
Ann
ual A
vera
geA
nnua
l Ave
rage
Ann
ual A
vera
ge

Directory 2019 217
Kerala State Pollution Control Board
2012 2013 2014 2015 2016 2017 2018 2019BOD 1.2 1.6 1.6 1.6 1.3 1.4 1.7 2.1
0.0
1.0
2.0
3.0
BoD trend at Thiroorangadi
7.6.1 KADALUNI AT THIROORANGADI- Station Code: 1566
2012 2013 2014 2015 2016 2017 2018 2019PH 6.7 6.9 6.8 6.8 6.8 6.8 6.9 7.0DO 6.0 6.7 6.6 7.0 6.6 6.4 6.6 6.6
5.05.56.06.57.07.5
pH & Do trend at Thiroorangadi
2012 2013 2014 2015 2016 2017 2018 2019TC 680 704 319 67 133 158 106 106FC 253 236 209 29 77 75 54 21
0200400600800
TC & fC trend at Thiroorangadi
Ann
ual A
vera
geA
nnua
l Ave
rage
Ann
ual A
vera
ge

Directory 2019
Kerala State Pollution Control Board
218
218
7.6.2 KADALUNDI AT HAJIYARAPPALLY - Station Code: 2293
2012 2013 2014 2015 2016 2017 2018 2019PH 6.8 6.9 6.8 6.8 6.7 7.0 7.0 7.1DO 6.7 6.8 6.9 7.0 6.8 6.5 6.9 6.7
6.06.57.07.5
pH & Do trend at Hajiyarappally
2012 2013 2014 2015 2016 2017 2018 2019BOD 1.0 1.8 1.5 1.6 1.5 1.9 1.6 1.3
0.00.51.01.52.0
BoD trend at Hajiyarappally
2012 2013 2014 2015 2016 2017 2018 2019TC 626 708 235 67 78 376 98 36FC 275 243 78 29 46 184 49 19
0200400600800
TC & fC trend at Hajiyarappally
Ann
ual A
vera
geA
nnua
l Ave
rage
Ann
ual A
vera
ge

Directory 2019 219
Kerala State Pollution Control Board
7.7 KALLADA AT PERUMTHOTTAMKADAVU- Station Code: 0042
2012 2013 2014 2015 2016 2017 2018PH 7.2 7.1 7.6 7.6 7.6 7.2 7.1 7.0DO 7.1 6.7 7.2 7.2 6.8 7.1 6.8 6.7
6.06.57.07.58.0
pH & Do trend at Perumthottamkadavu
2013 2014 2015 2016 2017 2018 2019BOD 1.6 1.3 1.5 1.3 1.4 1.5 1.6
0.00.51.01.52.0
BoD trend at Perumthottamkadavu
2012 2013 2014 2015 2016 2017 2018TC 608 738 406 664 286 367 249FC 251 313 187 269 105 141 102
0200400600800
TC & fC trend at Perumthottamkadavu
Ann
ual A
vera
geA
nnua
l Ave
rage
Ann
ual A
vera
ge

Directory 2019
Kerala State Pollution Control Board
220
220
7.8 MUVATTUPUZHA AT VETTIKATTUMUKKU - Station Code: 0043
2012 2013 2014 2015 2016 2017 2018 2019PH 7.1 7.2 6.7 7.1 6.8 6.9 7.3 7.5DO 6.7 6.8 6.9 6.9 6.8 6.1 6.1 6.9
0.02.04.06.08.0
pH & Do trend at Vettikkatumukku
2012 2013 2014 2015 2016 2017 2018 2019BOD 1.2 0.6 0.6 0.7 0.5 0.7 0.5 0.5
0.0
0.5
1.0
1.5
BoD trend at Vettikattumukku
2012 2013 2014 2015 2016 2017 2018 2019TC 1739 2392 3364 1962 2355 2258 2983 3383FC 964 1200 1890 1118 1236 1233 1558 1808
01000200030004000
TC & fC trend at Vettikkattumukku
Ann
ual A
vera
geA
nnua
l Ave
rage
Ann
ual A
vera
ge

Directory 2019 221
Kerala State Pollution Control Board
7.9.1 PAMBA AT CHENGANNUR - Station Code: 1156
2012 2013 2014 2015 2016 2017 2018 2019PH 7.0 7.2 6.8 6.6 6.7 6.3 6.4 6.4DO 6.0 6.1 5.1 5.7 4.7 5.5 5.7 6.4
0.02.04.06.08.0
pH & Do trend at Chengannoor
2012 2013 2014 2015 2016 2017 2018 2019BOD 1.0 0.7 0.6 0.7 0.6 0.4 0.6 0.7
0.0
0.5
1.0
1.5
BoD trend at Chengannoor
2012 2013 2014 2015 2016 2017 2018TC 493 311 303 1962 317 348 476 599FC 243 181 170 1118 162 211 299 364
0100020003000
TC & fC trend at Chengannoor
Ann
ual A
vera
geA
nnua
l Ave
rage
Ann
ual A
vera
ge

Directory 2019
Kerala State Pollution Control Board
222
222
7.9.2 PAMBA AT PARUMALA - Station Code: 1565
2012 2013 2014 2015 2016 2017 2018 2019PH 7.2 7.0 6.9 6.8 6.7 6.5 6.4 6.5DO 4.5 4.2 3.7 6.1 3.6 4.0 4.4 5.1
0.02.04.06.08.0
pH & Do trend at Parumala
2012 2013 2014 2015 2016 2017 2018 2019BOD 1.0 0.7 0.5 1.4 0.8 0.7 0.9 1.5
0.00.51.01.52.0
BoD trend at Parumala
2012 2013 2014 2015 2016 2017 2018 2019TC 537 420 294 13055 374 415 403 465FC 279 240 162 9136 197 257 250 253
05000
1000015000
TC & fC trend at Parumala
Ann
ual A
vera
geA
nnua
l Ave
rage
Ann
ual A
vera
ge

Directory 2019 223
Kerala State Pollution Control Board
7.9.3 PAMBA AT THAKAZHI - Station Code: 1341
2012 2013 2014 2015 2016 2017 2018 2019PH 7.1 7.0 6.8 6.3 6.9 6.4 6.4 6.5DO 4.4 4.3 4.8 4.4 3.7 3.9 4.5 4.2
0.02.04.06.08.0
pH & Do trend at Thakazhi
2012 2013 2014 2015 2016 2017 2018 2019BOD 1.5 0.7 0.7 1.3 0.6 0.7 0.9 1.9
0.0
1.0
2.0
3.0
BoD trend at Thakazhi
2012 2013 2014 2015 2016 2017 2018TC 722 391 341 1201 342 433 466FC 358 222 218 831 206 267 303
0500
10001500
TC & fC trend at Thakazhi
Ann
ual A
vera
geA
nnua
l Ave
rage
Ann
ual A
vera
ge

Directory 2019
Kerala State Pollution Control Board
224
224
7.10.1 PERIYAR AT KALADY - Station Code: 0018
2012 2013 2014 2015 2016 2017 2018 2019PH 7.2 7.2 7.0 7.1 7.5 6.8 6.6 7.1DO 7.5 7.2 7.1 7.0 5.9 6.8 6.5 6.7
0.02.04.06.08.0
pH & Do trend at Kalady
2012 2013 2014 2015 2016 2017 2018 2019BOD 1.1 1.3 1.0 1.2 0.9 1.4 1.2 1.1
0.0
0.5
1.0
1.5
BoD trend at Kalady
2012 2013 2014 2015 2016 2017 2018 2019TC 1134 828 527 203 550 3978 2511 2683FC 282 216 294 102 410 1658 928 1477
0200040006000
TC & fC trend at Kalady
Ann
ual A
vera
geA
nnua
l Ave
rage
Ann
ual A
vera
ge

Directory 2019 225
Kerala State Pollution Control Board
7.10.2 PERIYAR AT SDP ALUVA - Station Code: 1338
2012 2013 2014 2015 2016 2017 2018PH 7.0 7.0 6.9 6.9 7.0 6.7 6.5 6.7DO 6.8 6.3 6.3 5.8 5.6 6.0 6.1 6.2
0.02.04.06.08.0
pH & Do trend at SDP Aluva
2012 2013 2014 2015 2016 2017 2018PH 7.0 7.0 6.9 6.9 7.0 6.7 6.5 6.7DO 6.8 6.3 6.3 5.8 5.6 6.0 6.1 6.2
0.02.04.06.08.0
pH & Do trend at SDP Aluva
2012 2013 2014 2015 2016 2017 2018 2019TC 1134 1876 790 133 125 12388 4775 4417FC 282 487 382 75 74 11303 2708 2307
050000
100000150000
TC & fC trend at SDP Aluva
Ann
ual A
vera
geA
nnua
l Ave
rage
Ann
ual A
vera
ge

Directory 2019
Kerala State Pollution Control Board
226
226
7.10.3 PERIYA AT ELOOR - Station Code: 0017
2012 2013 2014 2015 2016 2017 2018 2019PH 6.9 7.0 6.8 6.9 6.7 6.9 6.7 7.2DO 5.1 5.5 4.8 4.6 4.2 5.1 5.6 6.6
0.02.04.06.08.0
pH & Do trend at Eloor
2012 2013 2014 2015 2016 2017 2018 2019BOD 2.1 2.2 1.8 2.0 1.8 2.1 2.5 1.5
0.0
1.0
2.0
3.0
BoD trend at Eloor
2012 2013 2014 2015 2016 2017 2018 2019TC 1946 1894 611 179 189 3612 2875 6369FC 408 473 298 97 98 2474 2007 2505
02000400060008000
TC & fC trend at Eloor
Ann
ual A
vera
geA
nnua
l Ave
rage
Ann
ual A
vera
ge

Directory 2019 227
Kerala State Pollution Control Board
7.10.4 PERIYAR AT MUPPATHADAM - Station Code: 2333
2012 2013 2014 2015 2016 2017 2018 2019PH 6.8 7.2 6.9 7.0 6.9 6.7 6.7 0.2DO 5.9 6.4 6.3 6.3 6.5 5.9 6.0 5.8
0.02.04.06.08.0
pH & Do trend at Muppathadam
2012 2013 2014 2015 2016 2017 2018 2019BOD 2.2 1.4 1.3 1.2 1.1 1.4 1.3 0.9
0.0
1.0
2.0
3.0
BoD trend at Muppathadam
2012 2013 2014 2015 2016 2017 2018 2019TC 1520 1357 988 185 198 2951 3174 2758FC 386 362 382 97 110 1840 1508 1202
01000200030004000
TC & fC trend at Muppathadam
Ann
ual A
vera
geA
nnua
l Ave
rage
Ann
ual A
vera
ge

Directory 2019
Kerala State Pollution Control Board
228
228
7.10.5 PERIYAR AT KALAMASSERY - Station Code: 2335
2012 2013 2014 2015 2016 2017 2018 2019PH 6.7 7.0 6.9 6.9 6.5 6.5 6.4 7.0DO 4.9 4.6 5.9 5.4 4.5 3.7 4.3 4.8
0.02.04.06.08.0
pH & Do trend at Kalamassery
2012 2013 2014 2015 2016 2017 2018 2019BOD 2.2 1.7 3.2 2.8 2.5 2.1 2.6 1.1
0.01.02.03.04.0
BoD trend at Kalamassery
2012 2013 2014 2015 2016 2017 2018 2019TC 2200 1937 1227 177 194 4118 5317 4825FC 480 631 606 91 120 2553 1878 2286
0200040006000
TC & fC trend at Kalamassery
Ann
ual A
vera
geA
nnua
l Ave
rage
Ann
ual A
vera
ge

Directory 2019 229
Kerala State Pollution Control Board
7.10.6 PERIYAR AT VETTUKADAVU (PATHALAM) - Station Code: 2334
2012 2013 2014 2015 2016 2017 2018 2019PH 6.7 7.0 6.8 6.9 8.3 6.9 6.7 6.9DO 4.9 5.9 5.6 6.5 4.5 5.7 5.8 6.9
0.0
5.0
10.0
pH & Do trend at Vettukadavu
2012 2013 2014 2015 2016 2017 2018 2019BOD 2.2 2.2 2.0 2.8 2.1 2.6 2.7 1.1
0.0
1.0
2.0
3.0
BoD trend at Vettukadavu
2012 2013 2014 2015 2016 2017 2018 2019TC 2200 1284 778 177 191 4024 3483 5683FC 480 330 403 91 74 2642 1469 2293
0200040006000
TC & fC trend at Vettukadavu
Ann
ual A
vera
geA
nnua
l Ave
rage
Ann
ual A
vera
ge

Directory 2019
Kerala State Pollution Control Board
230
230
7.10.7 PERIYAR AT PURAPPILLIKADAVU - Station Code:2336
2012 2013 2014 2015 2016 2017 2018 2019PH 6.9 6.9 7.1 7.0 6.2 7.0 6.9 7.2DO 6.8 6.5 6.6 6.5 5.9 6.8 6.0 6.3
0.01.02.03.04.05.06.07.08.0
pH and Do Trend at Purappillikadavu
2012 2013 2014 2015 2016 2017 2018 2019BOD 1.4 2.0 1.3 1.2 0.8 1.6 2.2 1.1
0.0
1.0
2.0
3.0
BoD trend at Purappillikadavu
2012 2013 2014 2015 2016 2017 2018 2019TC 1258 1223 1573 833 165 518 2438 1439FC 348 236 340 383 85 303 994 591
0100020003000
TC & fC trend at Purappillikadavu
Ann
ual A
vera
geA
nnua
l Ave
rage
Ann
ual A
vera
ge

Directory 2019 231
Kerala State Pollution Control Board
7.11. KARAMANA AT MOONNATTUMUKKU - Station Code: 1155
2012 2013 2014 2015 2016 2017 2018 2019PH 7.1 7.2 7.7 7.3 6.9 6.9 6.9 6.7DO 0.5 2.7 1.9 1.5 1.6 1.7 3.5 1.0
0123456789
pH and Do Trend at moonnattumukku
2012 2013 2014 2015 2016 2017 2018 2019BOD 21.2 12.4 26.9 22.0 43.9 42.2 13.9 6.3
0.05.0
10.015.020.025.030.035.040.045.050.0
BoD trend at moonnattumukku
2012 2013 2014 2015 2016 2017 2018 2019TC 15833 18779 37250 31500 36967 39093 41983 58042FC 3317 2867 10883 12800 14642 16478 18533 23217
0
10000
20000
30000
40000
50000
60000
70000
TC&fC trend at Moonnattumukku
Ann
ual A
vera
geA
nnua
l Ave
rage
Ann
ual A
vera
ge

Directory 2019
Kerala State Pollution Control Board
232
232

Directory 2019 233
Kerala State Pollution Control Board
WateR Quality aPRil data 2019

Directory 2019
Kerala State Pollution Control Board
234
234

Directory 2019 235
Kerala State Pollution Control Board
WATER QUALITY DATA APRIL 2019
Name of River stations Station Code
Neyyar Mamom Ayoor Karamana Malampuzha
Amaravila 1563
Aruvipuram 2284
Mamom Bridge 2285
Ayoor Bridge 2286
Aruvikkara 3471
Moonnattumukku 1155
Malampuzha 2328
Parameters
Temperature OC 34 34 33 33 37 37 32
pH 7 7.6 6.5 6.3 6.2 7.2 6.9
Conductivity µS/cm 145 147 124 156 101 680 94
Turbidity NTU 0.7 0.5 5 8.7 0.5 10.7 1
Phenoph: Alkalinity 0 0 0 0 0 0 0
Total Alkalinity 30 36 24 38 22 65 32
Chlorides mg/L 15 16 22 20 14 135 5
COD mg/L 16 16 30 10 15.2 52 4
TKN mg/L 0.01 0.01 0.01 0.01 0 0.01 0
Amm- N mg/L 0 0 0 0 0 0 0
Hardness mg/L 54 57 42 55 35 193 42
Calcium as CaCO3 mg/L 29 33 26 32 23 123 26
Magnesium as CaCO3 mg/L 25 24 16 23 12 70 16
Sulphate mg/L 12 6.2 4.5 4 6 35 5
Sodium mg/L 7.8 8 11.5 10 7.7 68 2.5
TDS mg/L 83 83 71 90 57 375 62
TFS mg/L 72 65 52 74 36 352 56
TSS mg/L 50 39 36 38 26 270 10
Phosphate mg/L 0 0 0 0 0 0 0.02
Boron mg/L 0 0 0 0 0 0 0
Potassium mg/L 1.3 0.9 1.4 1.5 1.1 17 0.6
BOD mg/L 1 5.9 2.9 5.5 3 6.5 0.6
Flouride mg/L 0 0 0 0 0 0.00 0.6
DO mg/L 5.9 6.1 4.1 3.7 5.9 1.1 7.1
Nitrate N mg/L 0.22 0.3 0.3 0.1 0.1 2.6 0.5
TC MPN/100ml 400 490 2000 1000 250 43000 20
FC MPN/100ml 200 350 840 310 100 13000 10
Metals
Cadmium mg/L BDL BDL BDL BDL BDL BDL BDL
Copper mg/L BDL BDL BDL BDL BDL BDL BDL
Lead µg/L BDL BDL BDL BDL BDL BDL BDL
Chromium mg/L BDL BDL BDL BDL BDL BDL BDL
Nickel mg/L BDL BDL BDL BDL BDL BDL BDL
Zinc mg/L BDL BDL BDL BDL 12 BDL BDL
Iron mg/L 82 14 BDL 23 50 BDL BDL
Pesticides
Alpha BHC µg/L BDL BDL BDL BDL BDL BDL BDL
Beta BHC µg/L BDL BDL BDL BDL BDL BDL BDL
gamma BHC µg/L BDL BDL BDL BDL BDL BDL BDL
Delta BHC µg/L BDL BDL BDL BDL BDL BDL BDL
Endosulphan-I µg/L BDL BDL BDL BDL BDL BDL BDL
Endosulphan-II µg/L BDL BDL BDL BDL BDL BDL BDL
Aldrin µg/L BDL BDL BDL BDL BDL BDL BDL
Dieldrin µg/L BDL BDL BDL BDL BDL BDL BDL
0P DDT µg/L BDL BDL BDL BDL BDL BDL BDL
PP DDT µg/L BDL BDL BDL BDL BDL BDL BDL

Directory 2019
Kerala State Pollution Control Board
236
236
WATER QUALITY DATA APRIL 2019
Name of River stations Station Code
Ithikkara Vamanapuram Pallickal Kallada Oruvathilkotta Sasthamkotta
Ayoor 1564
Ithikkara 2287
Vamanapuram 1442
Nellimugal2288
Perumthottakadavu 0042
Oruvathilkotta 1383
Sasthamkotta 1385
ParametersTemperature OC 23 23 35 23 24 37 22pH 7.1 6.8 6.5 6.5 7.3 7.9 6.6Conductivity µS/cm 128 9884 223 128 116 565 120Turbidity NTU 0 0 8.9 0 0 10.6 0Phenoph: Alkalinity 0 0 0 0 0 0 0Total Alkalinity 28 32 50 26 20 68 24Chlorides mg/L 24 3568 22 24 21 120 32COD mg/L 9.8 24 80 7 9.6 12 6.4TKN mg/L 0.01 0.01 0.01 0.01 0.01 0.01 0.01Amm- N mg/L 0 0 0 0 0 0 0Hardness mg/L 44 660 77 44 38 170 38Calcium as CaCO3 mg/L 28 380 48 26 22 110 26Magnesium as CaCO3 mg/L 16 280 29 18 16 60 12Sulphate mg/L 0 8 15 2.6 5.3 22 1.5Sodium mg/L 12 1878 11.1 12.4 10.8 60 16TDS mg/L 80 6088 128 86 72 330 84TFS mg/L 60 3816 112 60 56 312 38TSS mg/L 42 40 89 38 36 256 30Phosphate mg/L 0 0 0 0 0 0 0Boron mg/L 0 0 0 0 0 0 0Potassium mg/L 2.8 82 5.1 1.9 2 1.4 2.5BOD mg/L 2 2.1 3.8 2 2 1.8 1.8Flouride mg/L 0 0 0 0 0 0 0DO mg/L 6.2 6 5.4 6 6.2 5 6.2Nitrate N mg/L 0.98 1.20 0.3 0.66 0.64 0.1 54TC MPN/100ml 380 490 1400 470 410 600 320FC MPN/100ml 210 280 940 280 280 210 140
MetalsCadmium mg/L BDL BDL BDL BDL BDL BDL BDLCopper mg/L BDL BDL BDL BDL BDL BDL BDLLead µg/L BDL BDL BDL BDL BDL BDL BDLChromium mg/L BDL BDL BDL BDL BDL BDL BDLNickel mg/L BDL BDL BDL BDL BDL BDL BDLZinc mg/L 21 124 BDL 94 BDL BDL 37Iron mg/L 642 332 42 297 45 BDL 961
PesticidesAlpha BHC µg/L BDL BDL BDL BDL BDL BDL BDLBeta BHC µg/L BDL BDL BDL BDL BDL BDL BDLgamma BHC µg/L BDL BDL BDL BDL BDL BDL BDLDelta BHC µg/L BDL BDL BDL BDL BDL BDL BDLEndosulphan-I µg/L BDL BDL BDL BDL BDL BDL BDLEndosulphan-II µg/L BDL BDL BDL BDL BDL BDL BDLAldrin µg/L BDL BDL BDL BDL BDL BDL BDLDieldrin µg/L BDL BDL BDL BDL BDL BDL BDL0P DDT µg/L BDL BDL BDL BDL BDL BDL BDLPP DDT µg/L BDL BDL BDL BDL BDL BDL BDL

Directory 2019 237
Kerala State Pollution Control Board
WATER QUALITY DATA APRIL 2019
Name of River stations Station Code
Achenkovil Pamba
Thumpamon 1342
Chennithala1443
Kallarakkadavu 3465
Pandalam3466
Chengannur 1156
Thakazhi 1341
Pamba Down 1565
Parameters
Temperature OC 24 23 23 23 30 32 32
pH 7.3 6.5 6.8 7.2 6.1 6.6 6.4
Conductivity µS/cm 132 124 124 122 55 93 72
Turbidity NTU 0 0 0 0 8.8 10.4 7.3
Phenoph: Alkalinity 0 0 0 0 0 0 0
Total Alkalinity 30 28 26 28 10 11 10
Chlorides mg/L 20 23 20 22 10 16 10
COD mg/L 9.2 7.8 7 8 3.2 9.6 3.2
TKN mg/L 0.02 0.01 0.01 0.01 0.20 0.32 0.26
Amm- N mg/L 0 0 0 0 0.14 0.2 0.18
Hardness mg/L 42 46 44 46 14 30 26
Calcium as CaCO3 mg/L 28 28 24 30 10 18 16
Magnesium as CaCO3 mg/L 14 18 20 16 4 12 10
Sulphate mg/L 0 2.6 4 5 4.3 6.9 8
Sodium mg/L 10.4 11.8 9.9 11.8 5.1 7.8 5.1
TDS mg/L 80 84 76 80 35 58 41
TFS mg/L 62 62 48 46 30 52 35
TSS mg/L 38 44 20 38 24 47 30
Phosphate mg/L 0 0 0 0 0 0 0
Boron mg/L 0 0 0 0 0 0 0
Potassium mg/L 2.5 2.4 2.2 2.6 0.47 0.61 0.53
BOD mg/L 2.4 2.4 2 2.4 0.8 2.5 0.5
Flouride mg/L 0 0 0 0 0.20 0.30 0.25
DO mg/L 5.4 5.2 6 5.4 5.3 3.7 6.2
Nitrate N mg/L 0.76 0.7 0.72 0.68 0.29 0.41 0.37
TC MPN/100ml 460 480 400 610 600 410 480
FC MPN/100ml 280 310 240 370 170 110 150
Metals
Cadmium mg/L BDL BDL BDL BDL BDL BDL BDL
Copper mg/L BDL BDL BDL BDL BDL BDL BDL
Lead µg/L BDL BDL BDL BDL BDL BDL BDL
Chromium mg/L BDL BDL BDL BDL BDL BDL BDL
Nickel mg/L BDL BDL BDL BDL BDL BDL BDL
Zinc mg/L 28 BDL 28 31 142 172 249
Iron mg/L 239 621 335 133 72 48 142
Pesticides
Alpha BHC µg/L BDL BDL BDL BDL BDL BDL BDL
Beta BHC µg/L BDL BDL BDL BDL BDL BDL BDL
gamma BHC µg/L BDL BDL BDL BDL BDL BDL BDL
Delta BHC µg/L BDL BDL BDL BDL BDL BDL BDL
Endosulphan-I µg/L BDL BDL BDL BDL BDL BDL BDL
Endosulphan-II µg/L BDL BDL BDL BDL BDL BDL BDL
Aldrin µg/L BDL BDL BDL BDL BDL BDL BDL
Dieldrin µg/L BDL BDL BDL BDL BDL BDL BDL
0P DDT µg/L BDL BDL BDL BDL BDL BDL BDL
PP DDT µg/L BDL BDL BDL BDL BDL BDL BDL

Directory 2019
Kerala State Pollution Control Board
238
238
WATER QUALITY DATA APRIL 2019
Name of River stations Station Code
Meenachil Manimala Periyar Ashtamudi Paravur
Kidangoor 1339
Kallooppara 1340
Thondara 1384
Eloor 0017
Kalady 0018
Ashtamudi 1441
Paravur 1574
ParametersTemperature OC 30 32 32 32 30 25 21pH 7.6 7.6 7.4 7.7 6.6 7.7 7.6Conductivity µS/cm 92 286 261 29850 36 18260 13060Turbidity NTU 1.8 0 0 2.7 0.2 0 0Phenoph: Alkalinity 0 0 0 0 0 0 0Total Alkalinity 23 80 30 67 16 48 32Chlorides mg/L 14 46 50 11000 2 6620 4490COD mg/L 12.8 8 12 3.2 4.2 62 28TKN mg/L 0.22 0 0.01 0.05 0.30 0.01 0Amm- N mg/L 0 0 0 0 0 0 0Hardness mg/L 25 110 80 3960 23 2450 990Calcium as CaCO3 mg/L 10 50 40 560 15 1696 640Magnesium as CaCO3 mg/L 15 60 40 3400 8 754 350Sulphate mg/L 1.2 8 16 1000 6.4 80 68Sodium mg/L 7.4 23 25 5600 1 3346 2320TDS mg/L 60 196 180 19638 32 12210 7740TFS mg/L 55 120 160 18000 26 9060 4324TSS mg/L 14 52 80 26 10 80 48Phosphate mg/L 0 0 0 0.16 0.01 0 0Boron mg/L 0 0 0 0.01 0 0 0Potassium mg/L 2.26 8 2.2 227 1.23 144 125BOD mg/L 0.5 2.4 1.7 0.3 0.9 2.8 2.2Flouride mg/L 0 0.5 0.4 0 0.02 0 0DO mg/L 6 5.5 6.1 8.3 6.1 4 5.4Nitrate N mg/L 0.8 0.01 0.05 0.7 0.1 2.6 0.92TC MPN/100ml 3400 400 1200 400 6300 700 390FC MPN/100ml 1300 170 790 170 2400 490 200
MetalsCadmium mg/L BDL BDL BDL BDL BDL BDL BDLCopper mg/L BDL BDL BDL BDL BDL BDL BDLLead µg/L BDL BDL BDL BDL BDL BDL BDLChromium mg/L BDL BDL BDL BDL BDL BDL BDLNickel mg/L BDL BDL BDL BDL BDL BDL BDLZinc mg/L 19 81 52 BDL BDL BDL 68Iron mg/L 180 334 268 22 BDL 29 173
PesticidesAlpha BHC µg/L BDL BDL BDL BDL BDL BDL BDLBeta BHC µg/L BDL BDL BDL BDL BDL BDL BDLgamma BHC µg/L BDL BDL BDL BDL BDL BDL BDLDelta BHC µg/L BDL BDL BDL BDL BDL BDL BDLEndosulphan-I µg/L BDL BDL BDL BDL BDL BDL BDLEndosulphan-II µg/L BDL BDL BDL BDL BDL BDL BDLAldrin µg/L BDL BDL BDL BDL BDL BDL BDLDieldrin µg/L BDL BDL BDL BDL BDL BDL BDL0P DDT µg/L BDL BDL BDL BDL BDL BDL BDLPP DDT µg/L BDL BDL BDL BDL BDL BDL BDL

Directory 2019 239
Kerala State Pollution Control Board
WATER QUALITY DATA APRIL 2019
Name of River stations Station Code
Periyar Valapattanam
SDP Aluva 1338
Muppathadam 2333
Pathalam 2334
Kalamassery 2335
Purappallikkadavu 2336
KWA Intake Aluva 3468
Pazhassi2318
Parameters
Temperature OC 30 29 29 31 31 31 32
pH 6.6 7.4 6.5 6.3 7.5 6.5 7.6
Conductivity µS/cm 57 42 460 48 9600 45 75
Turbidity NTU 0.1 0.5 0.8 0.8 1.6 3.6 0.1
Phenoph: Alkalinity 0 0 0 0 0 0 0
Total Alkalinity 14 14 20 17 33 14 20
Chlorides mg/L 5 6 122 5 4100 4 8
COD mg/L 3.2 4.2 8 4.2 4.2 4.2 4
TKN mg/L 0.32 0.07 0 0.00 0.04 0.62 0.25
Amm- N mg/L 0 0 0 0 0 0 0.026
Hardness mg/L 22 27 68 25 1370 26 21
Calcium as CaCO3 mg/L 10 13 20 14 310 12 11
Magnesium as CaCO3 mg/L 12 14 48 11 1060 14 10
Sulphate mg/L 2.8 4.2 6.2 4.2 144 3.5 1.5
Sodium mg/L 2.8 3.4 60 2.5 2025 2.2 4.61
TDS mg/L 32 34 260 34 6400 30 41
TFS mg/L 26 28 200 28 5800 20 38
TSS mg/L 12 10 15 10 15 18 16
Phosphate mg/L 0.09 0.0700 0.09 0.0300 0.08 0.16 0.01
Boron mg/L 0 0 0 0.03 0.02 0.04 0.75
Potassium mg/L 1.55 1.22 4.28 1.36 89.50 1.3 0.69
BOD mg/L 1.5 1.3 2.6 1.1 0.6 0.9 1.2
Flouride mg/L 0 0.024 0.04 0.03 0.23 0.02 0.24
DO mg/L 5.4 6.9 5.2 5.4 7 5.3 7.5
Nitrate N mg/L 0.09 0.25 0.1 0.1 0.1 0.2 0.004
TC MPN/100ml 3100 2000 2500 1700 1000 480 48
FC MPN/100ml 1000 700 1700 840 540 310 10
Metals
Cadmium mg/L BDL BDL BDL BDL BDL BDL BDL
Copper mg/L BDL BDL BDL BDL BDL BDL BDL
Lead µg/L BDL BDL BDL BDL BDL BDL BDL
Chromium mg/L BDL BDL BDL BDL BDL BDL BDL
Nickel mg/L BDL BDL BDL BDL BDL BDL BDL
Zinc mg/L BDL BDL BDL BDL BDL BDL BDL
Iron mg/L BDL BDL BDL BDL 10 BDL 160
Pesticides
Alpha BHC µg/L BDL BDL BDL BDL BDL BDL BDL
Beta BHC µg/L BDL BDL BDL BDL BDL BDL BDL
gamma BHC µg/L BDL BDL BDL BDL BDL BDL BDL
Delta BHC µg/L BDL BDL BDL BDL BDL BDL BDL
Endosulphan-I µg/L BDL BDL BDL BDL BDL BDL BDL
Endosulphan-II µg/L BDL BDL BDL BDL BDL BDL BDL
Aldrin µg/L BDL BDL BDL BDL BDL BDL BDL
Dieldrin µg/L BDL BDL BDL BDL BDL BDL BDL
0P DDT µg/L BDL BDL BDL BDL BDL BDL BDL
PP DDT µg/L BDL BDL BDL BDL BDL BDL BDL

Directory 2019
Kerala State Pollution Control Board
240
240
WATER QUALITY DATA APRIL 2019
Name of River stations Station Code
Kadambrayar Muvattupuzha Chalakudy Chithrapuzha Periyar Kodungallur
Brahmapuram 2337
Manackakadavu 2338
Vettikkattumukku 0043
Pulikkakadavu 1154
Irumpanam 1573
Thekkady 1576
Kodungallur 1577
ParametersTemperature OC 31 31 32 31 30 30 27pH 6.5 6.6 7.6 6.7 6.6 7.5 7.6Conductivity µS/cm 110 88 76 375 5210 57 24300Turbidity NTU 1.4 4.9 2.2 0.2 3.5 1.2 2.4Phenoph: Alkalinity 0 0 0 0 0 0 0Total Alkalinity 20 19 17 18 22 17 57Chlorides mg/L 12 14 15 81 1750 10 8800COD mg/L 10 10 9.6 3.2 3.2 6.4 3.2TKN mg/L 1.3 1.1 0.27 1.6 0 0.13 0Amm- N mg/L 0 0 0 0.05 0 0 0Hardness mg/L 34 29 24 134 700 15 2950Calcium as CaCO3 mg/L 11 9 15 45 250 9 640Magnesium as CaCO3 mg/L 23 20 9 89 450 6 2310Sulphate mg/L 4.9 4.5 4.5 6.2 90 3.7 250Sodium mg/L 7.1 9.91 7.3 40 900 5 4300TDS mg/L 60 59 53 206 3600 39 16200TFS mg/L 50 50 51 185 2900 37 15700TSS mg/L 14 25 15 12 50 10 20Phosphate mg/L 0.2700 0.1700 0 0.06 6.2 0 0.82Boron mg/L 0 0 0 0 0.05 0 0.2Potassium mg/L 3.71 2.64 1.86 1.8 0.95 1.11 191BOD mg/L 2.3 2 0.6 1 0.6 0.4 0.4Flouride mg/L 0.04 0.04 0 0.03 0.01 0 0.449DO mg/L 1.5 4.9 7.8 6 7.1 7.6 7.2Nitrate N mg/L 0.8 0 0.44 0.2 0.74 0.03 0.15TC MPN/100ml 700 1000 4100 1200 3100 1000 1200FC MPN/100ml 200 430 1800 940 2100 790 700
MetalsCadmium mg/L BDL BDL BDL BDL BDL BDL BDLCopper mg/L BDL BDL BDL BDL BDL BDL BDLLead µg/L BDL BDL BDL BDL BDL BDL BDLChromium mg/L BDL BDL BDL BDL BDL BDL BDLNickel mg/L BDL BDL BDL BDL BDL BDL BDLZinc mg/L BDL BDL 38 BDL BDL 39 BDLIron mg/L 103 80 39 BDL 771 38 18
PesticidesAlpha BHC µg/L BDL BDL BDL BDL BDL BDL BDLBeta BHC µg/L BDL BDL BDL BDL BDL BDL BDLgamma BHC µg/L BDL BDL BDL BDL BDL BDL BDLDelta BHC µg/L BDL BDL BDL BDL BDL BDL BDLEndosulphan-I µg/L BDL BDL BDL BDL BDL BDL BDLEndosulphan-II µg/L BDL BDL BDL BDL BDL BDL BDLAldrin µg/L BDL BDL BDL BDL BDL BDL BDLDieldrin µg/L BDL BDL BDL BDL BDL BDL BDL0P DDT µg/L BDL BDL BDL BDL BDL BDL BDLPP DDT µg/L BDL BDL BDL BDL BDL BDL BDL

Directory 2019 241
Kerala State Pollution Control Board
WATER QUALITY DATA APRIL 2019
Name of River stations Station Code
Karuvannur Puzhakkal Keecheri Kalpathypuzha Korayar Kabani Maniyankode Puzha
Karuvannur Bridge 2289
Puzhakkal Bridge 2290
Vadakkanchery 2291
Kalpathy3460
Kanjikode 2326
Muthankara 1207
Maniyankode Bridge 3459
ParametersTemperature OC 30 31 32 31 37 29 34
pH 6.8 6.6 6.8 7.7 6.2 6.7 6.7
Conductivity µS/cm 83 149 165 450 590 140 157
Turbidity NTU 0.2 5.2 31.7 3 3 0 0
Phenoph: Alkalinity 0 0 0 0 0 0 0
Total Alkalinity 21 30 40 150 198 38 44
Chlorides mg/L 10 19 22 12 38 13 16
COD mg/L 7.2 8.2 9.4 32 32 2 2
TKN mg/L 0.01 0.01 0.5 0.04 0.05 0.22 0.25
Amm- N mg/L 0 0 0.32 0 0 0 0
Hardness mg/L 18 43 50 188 236 52 52
Calcium as CaCO3 mg/L 14 30 42 116 120 25 27
Magnesium as CaCO3 mg/L 4 13 8 72 116 27 25
Sulphate mg/L 0 9.5 4.5 9 38.3 4.2 0
Sodium mg/L 5.4 10.2 12 6 20 6.5 7.9
TDS mg/L 50 89 99 260 345 78 87
TFS mg/L 20 23 23 230 308 68 78
TSS mg/L 12 15 11 10 10 10 10
Phosphate mg/L 1.4 1.7 1.9 0.21 0.2010 0 0
Boron mg/L 0 0 0 0 0 0 0
Potassium mg/L 4.91 8.23 5.31 4 5.2 1.9 2.4
BOD mg/L 2.2 1.2 1.9 2.9 2.8 1.8 0.5
Flouride mg/L 0 0 0 0.7 0.80 0 0
DO mg/L 6.8 6 6.6 5.6 5.4 4.1 5.4
Nitrate N mg/L 0.16 0.22 0.24 5.21 1.20 0.13 0.13
TC MPN/100ml 100 1000 490 840 790 40 49
FC MPN/100ml 60 100 200 580 280 24 36
MetalsCadmium mg/L BDL BDL BDL BDL BDL BDL BDL
Copper mg/L BDL BDL BDL BDL BDL BDL BDL
Lead µg/L BDL BDL BDL BDL BDL BDL BDL
Chromium mg/L BDL BDL BDL BDL BDL BDL BDL
Nickel mg/L BDL BDL BDL BDL BDL BDL BDL
Zinc mg/L BDL BDL BDL BDL BDL BDL BDL
Iron mg/L 24 15 16 BDL BDL 19 11
PesticidesAlpha BHC µg/L BDL BDL BDL BDL BDL BDL BDL
Beta BHC µg/L BDL BDL BDL BDL BDL BDL BDL
gamma BHC µg/L BDL BDL BDL BDL BDL BDL BDL
Delta BHC µg/L BDL BDL BDL BDL BDL BDL BDL
Endosulphan-I µg/L BDL BDL BDL BDL BDL BDL BDL
Endosulphan-II µg/L BDL BDL BDL BDL BDL BDL BDL
Aldrin µg/L BDL BDL BDL BDL BDL BDL BDL
Dieldrin µg/L BDL BDL BDL BDL BDL BDL BDL
0P DDT µg/L BDL BDL BDL BDL BDL BDL BDL
PP DDT µg/L BDL BDL BDL BDL BDL BDL BDL

Directory 2019
Kerala State Pollution Control Board
242
242
WATER QUALITY DATA APRIL 2019
Name of River stations Station Code
Bharathapuzha Kadalundi Tirur Periyar Periyar
Kuttipuram 2331
Pattambi 2332
Thiroorangadi 1566
Hajiyarppally 2293
Thalakadathur 2292
Edamalayar2330
Bhoothathankettu2329
Parameters
Temperature OC 31 33 30 30 30 30 27
pH 7.7 7.8 7.2 7.5 6.6 6.9 6.8
Conductivity µS/cm 220 250 116 133 26010 23 40
Turbidity NTU 2 2 0 0 0 0.3 4.4
Phenoph: Alkalinity 0 0 0 0 0 0 0
Total Alkalinity 80 85 21 23.5 245 9 11
Chlorides mg/L 7 12 19 24 7350 3 4
COD mg/L 4 12 8 3.2 4 3.2 4.2
TKN mg/L 0.01 0.03 0 0 0 0.4 0.21
Amm- N mg/L 0 0 0 0 0 0 0
Hardness mg/L 92 104 33 35 2256 20 20
Calcium as CaCO3 mg/L 58 54 30 20 1950 5 6
Magnesium as CaCO3 mg/L 34 50 3 15 306 15 14
Sulphate mg/L 9.2 13 6.3 3.9 1100 2 2
Sodium mg/L 3.6 6 9.4 12 4180 1.8 2
TDS mg/L 121 150 67 74 14500 18 28
TFS mg/L 108 135 26 27 10500 14 20
TSS mg/L 10 10 15 46 250 10 12
Phosphate mg/L 0.0800 0.1000 0 0.0000 0.0200 0 0.0300
Boron mg/L 0 0 0 0 0 0 0
Potassium mg/L 0.6 1.20 2 2.8 300 0.74 4.6
BOD mg/L 0.8 2.6 2 0.8 1 0.6 0.8
Flouride mg/L 0.40 0.50 0 0.62 0 0 0.02
DO mg/L 7.2 5.8 6.6 4.6 2.3 7.5 7
Nitrate N mg/L 0.41 0.56 0.45 0.85 1 0.17 0.13
TC MPN/100ml 79 170 20 48 28 210 140
FC MPN/100ml 40 40 10 24 14 84 84
Metals
Cadmium mg/L BDL BDL BDL BDL BDL BDL BDL
Copper mg/L BDL BDL BDL BDL BDL BDL BDL
Lead µg/L BDL BDL BDL BDL BDL BDL BDL
Chromium mg/L BDL BDL BDL BDL BDL BDL BDL
Nickel mg/L BDL BDL BDL BDL BDL BDL BDL
Zinc mg/L BDL BDL BDL BDL 24 BDL BDL
Iron mg/L 13 BDL 58 66 37 61 14
Pesticides
Alpha BHC µg/L BDL BDL BDL BDL BDL BDL BDL
Beta BHC µg/L BDL BDL BDL BDL BDL BDL BDL
gamma BHC µg/L BDL BDL BDL BDL BDL BDL BDL
Delta BHC µg/L BDL BDL BDL BDL BDL BDL BDL
Endosulphan-I µg/L BDL BDL BDL BDL BDL BDL BDL
Endosulphan-II µg/L BDL BDL BDL BDL BDL BDL BDL
Aldrin µg/L BDL BDL BDL BDL BDL BDL BDL
Dieldrin µg/L BDL BDL BDL BDL BDL BDL BDL
0P DDT µg/L BDL BDL BDL BDL BDL BDL BDL
PP DDT µg/L BDL BDL BDL BDL BDL BDL BDL

Directory 2019 243
Kerala State Pollution Control Board
WATER QUALITY DATA APRIL 2019
Name of River stations Station Code
Chaliyar Bhavani Kuttiyadi Mahe Karapuzha
Koolimadu 0020
Chungappally0021
Nilambur 3464
Elachivazhy 1208
Estatemukku 1567
Valayam 1568
Karapuzha Dam3458
Parameters
Temperature OC 31 31 32 31 32 27 32
pH 7.9 7.6 7.9 7.7 6.7 6.9 6.7
Conductivity µS/cm 128 42100 160 269 32 102 120
Turbidity NTU 0 0 0 1 0 0 0
Phenoph: Alkalinity 0 0 0 0 0 0 0
Total Alkalinity 40 55 28 135 8 27 36
Chlorides mg/L 16 11500 26 6 5 14 15
COD mg/L 10 8 3.2 4 10 12 2
TKN mg/L 0.09 0.50 0.01 0.01 0.19 0.44 0.41
Amm- N mg/L 0.07 0.12 0 0 0.14 0.2 0
Hardness mg/L 46 3000 43 154 9 26 43
Calcium as CaCO3 mg/L 40 300 32 78 2 12 25
Magnesium as CaCO3 mg/L 6 2700 11 76 7 14 18
Sulphate mg/L 0 3000 11.4 11 0 0 0
Sodium mg/L 7.8 7500 14 3 2.5 10.4 7.6
TDS mg/L 75 25000 89 149 20 58 66
TFS mg/L 68 21500 80 132 12 52 50
TSS mg/L 8 10 10 10 10 10 10
Phosphate mg/L 0 0 0 0.1000 0 0 0
Boron mg/L 0 0 0 0 0 0 0
Potassium mg/L 2.1 600 3.2 0.5 0.7 2.4 1.1
BOD mg/L 1.7 0.8 1.9 2.5 1.5 2.4 1.5
Flouride mg/L 0.16 0.7 0.09 0.60 0.5 0.4 0
DO mg/L 6.1 6.2 7.2 6.2 8.5 5.7 5.1
Nitrate N mg/L 0.01 0.51 0.05 0.69 0.08 0.21 0.13
TC MPN/100ml 150 1000 490 60 70 460 24
FC MPN/100ml 110 630 270 49 60 280 10
Metals
Cadmium mg/L BDL BDL BDL BDL BDL BDL BDL
Copper mg/L BDL BDL BDL BDL BDL BDL BDL
Lead µg/L BDL BDL BDL BDL BDL BDL BDL
Chromium mg/L 56 BDL BDL BDL BDL BDL BDL
Nickel mg/L BDL BDL BDL BDL BDL BDL BDL
Zinc mg/L 62 BDL 18 BDL BDL BDL BDL
Iron mg/L 240 26 37 BDL 15 25 9
Pesticides
Alpha BHC µg/L BDL BDL BDL BDL BDL BDL BDL
Beta BHC µg/L BDL BDL BDL BDL BDL BDL BDL
gamma BHC µg/L BDL BDL BDL BDL BDL BDL BDL
Delta BHC µg/L BDL BDL BDL BDL BDL BDL BDL
Endosulphan-I µg/L BDL BDL BDL BDL BDL BDL BDL
Endosulphan-II µg/L BDL BDL BDL BDL BDL BDL BDL
Aldrin µg/L BDL BDL BDL BDL BDL BDL BDL
Dieldrin µg/L BDL BDL BDL BDL BDL BDL BDL
0P DDT µg/L BDL BDL BDL BDL BDL BDL BDL
PP DDT µg/L BDL BDL BDL BDL BDL BDL BDL

Directory 2019
Kerala State Pollution Control Board
244
244
WATER QUALITY DATA APRIL 2019
Name of River stations Station Code
Kallai Korapuzha Kuppam Thalassery Vembanadu
Kallai bridge 2294
Kanayankode2295
Thaliparamba 1569
Rayoram2298
Pathipalam 2296
Pathiramanal 2312
OTJ 1575
ParametersTemperature OC 34 31 30 28 32 31 32pH 7.9 7.4 7.1 7.6 6.7 6.8 7.1Conductivity µS/cm 52300 30950 38800 90 122 3500 35350Turbidity NTU 0 0 1.2 1.3 2.4 0 5.8Phenoph: Alkalinity 0 0 0 0 0 0 0Total Alkalinity 120 100 87 24 33 60 71Chlorides mg/L 12900 8900 12900 12 16 800 17200COD mg/L 18 4.6 6.4 8 3.2 80 4.2TKN mg/L 0.78 0.51 0.65 0.2 0.5 0 1.32Amm- N mg/L 0.46 0.06 0.094 0.067 0.24 0 0.02Hardness mg/L 5800 3100 6400 30 28 490 515Calcium as CaCO3 mg/L 800 100 1100 11 19 90 340Magnesium as CaCO3 mg/L 5000 3000 5300 19 9 400 175Sulphate mg/L 5500 2000 354 2.8 2.32 120 1006Sodium mg/L 8500 5000 7915 5.94 7.96 398.2 8600TDS mg/L 30000 18500 24738 50 70 2000 28500TFS mg/L 26100 16000 17317 42 62 1800 27300TSS mg/L 12 10 35 12 25 280 42Phosphate mg/L 0.0000 0.0000 0 0.01 0.04 0 0.48Boron mg/L 0 0 0 0.04 0.097 0 0.02Potassium mg/L 280 250 302 0.92 1.58 35 52.1BOD mg/L 1.5 1.7 2.8 2.9 0.3 2.9 0.8Flouride mg/L 0.9 0.25 0.00 0.55 0.26 0.8 0.64DO mg/L 5.3 5.6 5 7.1 1.3 7.5 6.5Nitrate N mg/L 0.9 0.45 0.097 0.002 0.002 0.1 0.48TC MPN/100ml 400 2800 220 200 400 200 1100FC MPN/100ml 200 1800 20 20 40 100 430
MetalsCadmium mg/L BDL BDL BDL BDL BDL BDL BDLCopper mg/L BDL BDL BDL BDL BDL BDL BDLLead µg/L BDL BDL BDL BDL BDL BDL BDLChromium mg/L BDL BDL BDL BDL BDL BDL BDLNickel mg/L BDL BDL BDL BDL BDL BDL BDLZinc mg/L BDL BDL BDL BDL BDL 359 BDLIron mg/L 57 BDL 37 BDL BDL 1179 193
PesticidesAlpha BHC µg/L BDL BDL BDL BDL BDL BDL BDLBeta BHC µg/L BDL BDL BDL BDL BDL BDL BDLgamma BHC µg/L BDL BDL BDL BDL BDL BDL BDLDelta BHC µg/L BDL BDL BDL BDL BDL BDL BDLEndosulphan-I µg/L BDL BDL BDL BDL BDL BDL BDLEndosulphan-II µg/L BDL BDL BDL BDL BDL BDL BDLAldrin µg/L BDL BDL BDL BDL BDL BDL BDLDieldrin µg/L BDL BDL BDL BDL BDL BDL BDL0P DDT µg/L BDL BDL BDL BDL BDL BDL BDL
PP DDT µg/L BDL BDL BDL BDL BDL BDL BDL

Directory 2019 245
Kerala State Pollution Control Board
WATER QUALITY DATA APRIL 2019
Name of River stations Station Code
Valapattanam Ancharakandy Ramapuram Kavai Kariangode Padmatheertham Pond
Parassinikkadavu 3473
Meruvamba2297
Ancharakandy 2319
Ramapuram Bridge 2299
Kutiyolpalam 2301
Kakkadavu 1571
Sree Padmanabha Swami Temple
2325
ParametersTemperature OC 32 33 32 34 32 30 36pH 7.4 7.1 7.1 7.4 7.3 7.2 7.2Conductivity µS/cm 42600 129 22000 45300 125 70 225Turbidity NTU 0.8 2 0.9 2.5 2.8 0.2 71.2Phenoph: Alkalinity 0 0 0 0 0 0 0Total Alkalinity 88 34 61 91 22 28 58Chlorides mg/L 18200 17 10900 19000 20 10 32COD mg/L 6.4 4 4 4 3.2 4 40TKN mg/L 0.7 0.41 0.4 0.58 0.45 0.23 0Amm- N mg/L 0.02 0.06 0.03 0.05 0.024 0 0Hardness mg/L 7200 29 3740 7600 29 24 75Calcium as CaCO3 mg/L 2000 17 1700 1500 15 10 52Magnesium as CaCO3 mg/L 5200 12 2040 6100 14 14 23Sulphate mg/L 373.3 0.66 352 379 27.8 0 0Sodium mg/L 11586 9.8 5937 11523 11.3 6 16.1TDS mg/L 32500 90 19600 32500 90 40 130TFS mg/L 20268 72 7168 22049 77 32 121TSS mg/L 22 20 18 29 28 10 88Phosphate mg/L 0 0 0 0 0 0 0Boron mg/L 0 0.023 0.35 0 0.086 3.76 0Potassium mg/L 309.2 1.62 186 364 2.24 0.9 1.2BOD mg/L 1.8 2.5 2.1 2.4 0.3 0.3 5.5Flouride mg/L 0.00 0.44 0.00 0.02 0 0 0DO mg/L 4.5 4.2 4.6 3.3 6.3 5.5 6Nitrate N mg/L 0.02 0.004 0.02 0.002 0.075 0.1 0.02TC MPN/100ml 48 100 350 100 280 840 410FC MPN/100ml 12 20 120 20 58 220 170
MetalsCadmium mg/L BDL BDL BDL BDL BDL BDL BDLCopper mg/L BDL BDL BDL BDL BDL BDL BDLLead µg/L BDL BDL BDL BDL BDL BDL BDLChromium mg/L BDL BDL BDL BDL BDL BDL BDLNickel mg/L BDL BDL BDL BDL BDL BDL BDLZinc mg/L BDL BDL BDL BDL BDL BDL BDLIron mg/L 42 BDL BDL 173 430 101 BDL
PesticidesAlpha BHC µg/L BDL BDL BDL BDL BDL BDL BDLBeta BHC µg/L BDL BDL BDL BDL BDL BDL BDLgamma BHC µg/L BDL BDL BDL BDL BDL BDL BDLDelta BHC µg/L BDL BDL BDL BDL BDL BDL BDLEndosulphan-I µg/L BDL BDL BDL BDL BDL BDL BDLEndosulphan-II µg/L BDL BDL BDL BDL BDL BDL BDLAldrin µg/L BDL BDL BDL BDL BDL BDL BDLDieldrin µg/L BDL BDL BDL BDL BDL BDL BDL0P DDT µg/L BDL BDL BDL BDL BDL BDL BDLPP DDT µg/L BDL BDL BDL BDL BDL BDL BDL

Directory 2019
Kerala State Pollution Control Board
246
246
WATER QUALITY DATA APRIL 2019
Name of River stations Station Code
Neeleswaram Chithrapuzha Chithrapuzha Mogral Canoli Mananchira
Hosdurg 1570
Nambiarckal Dam 2302
Palakkattuthazhamthode 3469
Unthithode at Eloor 3467
Mogral Bridge 2304
Canoli canal 3461
Mananchira 3462
ParametersTemperature OC 30 29 29 32 30 32 33pH 7.9 8.1 6.5 7.1 7.9 7.7 7.6Conductivity µS/cm 40000 720 58 26230 49800 43100 100Turbidity NTU 0.2 0.2 1.5 1.2 0.8 0 0Phenoph: Alkalinity 0 0 0 0 0 0 0Total Alkalinity 100 41 17 69 120 35 24Chlorides mg/L 12800 229 5 9150 15100 10500 15COD mg/L 6.3 6.2 10 10 4 8 3.2TKN mg/L 0.64 0.51 0.65 0.01 0.56 0.36 0.01Amm- N mg/L 0 0 0 0 0 0.25 0Hardness mg/L 7100 90 27 2960 7200 5400 34Calcium as CaCO3 mg/L 2800 25 10 400 1800 2900 30Magnesium as CaCO3 mg/L 4300 65 17 2560 5400 2500 4Sulphate mg/L 250 3 0.64 13 338 4680 4Sodium mg/L 6500 112 3.08 4600 7500 6504 8TDS mg/L 22350 478 32 17500 30125 24000 61TFS mg/L 19100 138 25 16000 28100 20500 50TSS mg/L 10 10 10 20 35 10 10Phosphate mg/L 0 0 0.18 0.29 0.0000 0 0Boron mg/L 5.61 5.29 0 0.06 5.61 0 0Potassium mg/L 200 4.9 1.58 18.16 250 282 0.8BOD mg/L 0.9 0.9 2.3 2.2 1.6 0.6 0.2Flouride mg/L 0.17 0.08 0.026 0.52 0.7 0.9 0.09DO mg/L 3 6.5 4.5 2.9 5.9 6.3 9.6Nitrate N mg/L 0.07 0.06 0.42 1.4 0.09 0.61 0.07TC MPN/100ml 1200 940 8400 6300 380 490 70FC MPN/100ml 330 240 3400 2600 1700 100 49
MetalsCadmium mg/L BDL BDL BDL BDL BDL BDL BDLCopper mg/L BDL BDL BDL BDL BDL BDL BDLLead µg/L BDL BDL BDL BDL BDL BDL BDLChromium mg/L BDL BDL BDL BDL BDL BDL BDLNickel mg/L BDL BDL BDL BDL BDL BDL BDLZinc mg/L BDL BDL BDL BDL BDL 53 19Iron mg/L 50 59 422 BDL 67 BDL 45
PesticidesAlpha BHC µg/L BDL BDL BDL BDL BDL BDL BDLBeta BHC µg/L BDL BDL BDL BDL BDL BDL BDLgamma BHC µg/L BDL BDL BDL BDL BDL BDL BDLDelta BHC µg/L BDL BDL BDL BDL BDL BDL BDLEndosulphan-I µg/L BDL BDL BDL BDL BDL BDL BDLEndosulphan-II µg/L BDL BDL BDL BDL BDL BDL BDLAldrin µg/L BDL BDL BDL BDL BDL BDL BDLDieldrin µg/L BDL BDL BDL BDL BDL BDL BDL0P DDT µg/L BDL BDL BDL BDL BDL BDL BDLPP DDT µg/L BDL BDL BDL BDL BDL BDL BDL

Directory 2019 247
Kerala State Pollution Control Board
WATER QUALITY DATA APRIL 2019
Name of River stations Station Code
Uppala Peruvamba Kayamkulam Punnamada Pookode Vellayani
Uppala Bridge 2306
Chandappura2300
Kayamkulam 1578
Punnamada 1579
Pookode 1580
Vandithadam 3470
ParametersTemperature OC 28 32 30 32 32 34pH 7.9 7.1 8.2 7.4 6.8 7.1Conductivity µS/cm 40500 76 54210 2630 29 218Turbidity NTU 0.2 2.3 0 0 0 1Phenoph: Alkalinity 0 0 0 0 0 0Total Alkalinity 92 11 80 40 6 48Chlorides mg/L 12200 13 15300 680 6 32COD mg/L 6.3 3.2 64 100 2 34TKN mg/L 0.65 0.44 0 0 0.05 0Amm- N mg/L 0 0 0 0 0 0Hardness mg/L 6800 19 4700 180 8 73Calcium as CaCO3 mg/L 4000 13 1200 100 4 52Magnesium as CaCO3 mg/L 2800 6 3500 80 4 21Sulphate mg/L 186 3 620 105 0 4.5Sodium mg/L 6185 5.43 7612 386.4 3 16TDS mg/L 26100 42 29800 1500 16 127TFS mg/L 24500 38 26400 1040 10 111TSS mg/L 48 10 960 110 10 86Phosphate mg/L 0 0 0 0 0 0Boron mg/L 5.63 0.01 0 0 0 0Potassium mg/L 285 0.52 580 20.5 0.6 1.3BOD mg/L 1.1 1.3 3.3 3 1.2 5.6Flouride mg/L 0.1 0 1 0.9 0 0DO mg/L 6.5 5.4 5.9 6.3 5.1 6.2Nitrate N mg/L 0.13 0.003 0.78 0.1 0.13 0.1TC MPN/100ml 1400 200 790 400 63 1800FC MPN/100ml 350 48 200 600 10 940
MetalsCadmium mg/L BDL BDL BDL BDL BDL BDLCopper mg/L BDL BDL BDL BDL BDL BDLLead µg/L BDL BDL BDL BDL BDL BDLChromium mg/L BDL BDL BDL BDL BDL BDLNickel mg/L BDL BDL BDL BDL BDL BDLZinc mg/L BDL BDL 29 184 15 34Iron mg/L 44 BDL 115 184 82 16
PesticidesAlpha BHC µg/L BDL BDL BDL BDL BDL BDLBeta BHC µg/L BDL BDL BDL BDL BDL BDLgamma BHC µg/L BDL BDL BDL BDL BDL BDLDelta BHC µg/L BDL BDL BDL BDL BDL BDLEndosulphan-I µg/L BDL BDL BDL BDL BDL BDLEndosulphan-II µg/L BDL BDL BDL BDL BDL BDLAldrin µg/L BDL BDL BDL BDL BDL BDLDieldrin µg/L BDL BDL BDL BDL BDL BDL0P DDT µg/L BDL BDL BDL BDL BDL BDLPP DDT µg/L BDL BDL BDL BDL BDL BDL

Directory 2019
Kerala State Pollution Control Board
248
248

Directory 2019 249
Kerala State Pollution Control Board
RuRal WateR SuPPly SCheMeS Quality oF SouRCe WateR

Directory 2019
Kerala State Pollution Control Board
250
250

Directory 2019 251
Kerala State Pollution Control Board
9.1 PaLakkad diStrict
Station1:Vazhukkupara-ChinnamoolatharaKudivellaPadhathi,
EruthempathiGramapanchayath.
Station 2 :Eruthempathi Gramapanchayath 2014-15
Malayandi Koundanoor Kudivella Padhathi, Eruthempathi
Gramapanchayath
Station 3: NalleppillyAgraharam, Kudivellavitharana padhathi-2016,
NalleppillyGramapanchayath
Station 4 :AngamasalaKudivella Pandhathi-2016-
17,ErimayoorGramapanchayath
Station 5 :Mangodupookurissi Colony kudivellaPadhathi,
MelarkodeGramapanchayath
Station 6: Janakiya soothra napadhathi 2007-2008, pookurissi
Mangode Kudivellapadhathi, MelarkodeGramapanchayath,
Station7: kunjansmara kasudhajhala vitharanapadhathi, Wevers Colony,
Ottapalam Municipality
Station 8:BRGF pumphouse, Pathakadavu, Ottapalam Municipality
Station 9: Jalanidhi - Lakkidi-Perur Gramapanchayath,
Brihathkudivellapadhathi
Station 10 :Vadanam-Kurissi Village kudivellaPadhathi,
OngallurGramapanchayath
Station 11: Pattambi block Panchayath Ongallur
Vellakkadanmaril Kudivellapadhathi, Ongallur Grama Panchayath.
Station 12: Ongallur 4 cent Kudivella Padhathi Janakiya soothranam
2007-08, OngallurGramaPanchayath
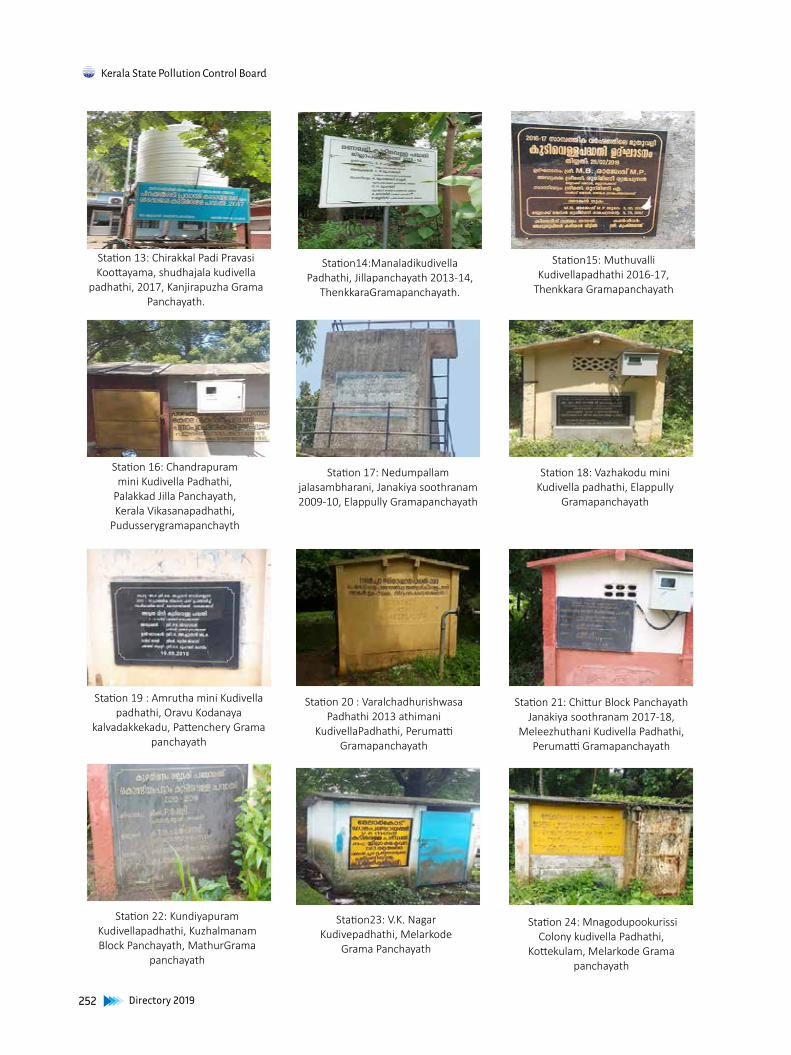
Directory 2019
Kerala State Pollution Control Board
252
252
Station 13: Chirakkal Padi Pravasi Koottayama, shudhajala kudivella
padhathi, 2017, Kanjirapuzha Grama Panchayath.
Station14:Manaladikudivella Padhathi, Jillapanchayath 2013-14,
ThenkkaraGramapanchayath.
Station15: Muthuvalli Kudivellapadhathi 2016-17,
Thenkkara Gramapanchayath
Station 16: Chandrapuram mini Kudivella Padhathi,
Palakkad Jilla Panchayath, Kerala Vikasanapadhathi,
Pudusserygramapanchayth
Station 17: Nedumpallam jalasambharani, Janakiya soothranam 2009-10, Elappully Gramapanchayath
Station 18: Vazhakodu mini Kudivella padhathi, Elappully
Gramapanchayath
Station 19 : Amrutha mini Kudivella padhathi, Oravu Kodanaya
kalvadakkekadu, Pattenchery Grama panchayath
Station 20 : Varalchadhurishwasa Padhathi 2013 athimani
KudivellaPadhathi, Perumatti Gramapanchayath
Station 21: Chittur Block Panchayath Janakiya soothranam 2017-18,
Meleezhuthani Kudivella Padhathi, Perumatti Gramapanchayath
Station 22: Kundiyapuram Kudivellapadhathi, Kuzhalmanam Block Panchayath, MathurGrama
panchayath
Station23: V.K. Nagar Kudivepadhathi, Melarkode
Grama Panchayath
Station 24: Mnagodupookurissi Colony kudivella Padhathi,
Kottekulam, Melarkode Grama panchayath

Directory 2019 253
Kerala State Pollution Control Board
Station 25: KWA chathakunnu Kudivellapadhathi, Sree krishnapuram
Grama panchayath
Station 28: Muringalam Mini Kudivella padhathi, Muthuthala
GramaPanchayath.
Station 29: Kariyanur Pallipuram mini sudhajalavitharana Padhathi,
pallipuramGramaPanchayath
Station 30:UrulanPadi, kudivella padhathi,
ParuthurGramapanchayath
Station 31: KWA Span Karakurushi Thachanpara Shudhalavithara Padhathi, Karakkurushi Grama
Panchayath
Station 32 :KWA Karakurushi Thachanpara Samagra Shudhalavithara
Padhathi, Thachampara Grama Panchayath
Station 33 : Chirakkal Padi Pravasi Koottayama, shudhajala kudivella
padhathi, 2017, Kanjirapuzha Grama Panchayath
Station 34: Mambaram-Puthugramam Mini Kudivellapathi, Kannadi Grama
Panchayath
Station 35 :Mambaram- Mini Kudivella pathi kerala sarkar Samuhya neethi vakuppusamjojitha Shishu vikasana sewana Padhathi, Kannadi Grama
Panchayath
Station 36 :Para-mini Kudivella padhathi, Vengodi, EleppullyGramaPanchayatha

Directory 2019
Kerala State Pollution Control Board
254
254
Sl. No. Parameter Unit SAMPLE ID
January (17.1.19) February (12.02.19) March (16.3.19) April (10.4.19)
1 2 3 4 5 6 7 8 9 10 11 12
1 Colour Hazen BDL BDL BDL BDL BDL BDL BDL BDL BDL BDL BDL BDL
2 Odour _ Agreeable Agreeable Agreeable Agreeable Agreeable Agreeable Agreeable Agreeable Agreeable Agreeable Agreeable Agreeable
3 Turbidity NTU BDL BDL BDL BDL BDL BDL BDL BDL BDL BDL BDL BDL
4 pH _ 7.2 7.6 7.6 6.8 6.9 7.2 7.7 7 6.9 7.9 8 8.1
5Total hardness
(as CaCO3 ) mg/l 356 428 316 214 146 102 184 104 106 146 160 190
6 Iron(as Fe) " BDL 0.01 BDL 0.80 0.78 0.31 0.10 0.19 0.02 0.06 0.30 0.17
7 Chloride(as Cl) " 10 22 22 12 6 4 11 8 7 8 8 8
8BOD
(3 days at 270C)" 0.3 0.4 0.2 0.3 0.3 0.2 0.3 0.3 0.3 0.3 0.2 0.3
9 Nitrate(as NO3) " 0.75 3.48 2.93 0.26 0.07 0.08 0.50 0.28 0.08 1.24 0.77 0.92
10 Fluoride(as F) " 0.3 0.5 0.5 1.02 10.05 1.02 1 0.9 0.9 0.3 0.6 0.7
11 Total Coliforms cfu/100ml 160 Absent 200 Absent 1240 Absent 400 Absent Absent 180 180 130
12 Fecal Coliforms cfu/100ml 60 Absent 60 Absent Absent Absent 100 Absent Absent 50 Absent 80
Station 1 : Vazhukkupara-ChinnamoolatharaKudivellaPadhathi, EruthempathiGramapanchayathStation 2 : EruthempathiGramapanchayath 2014-15 MalayandiKoundanoorKudivellaPadhathi, ,
EruthempathiGramapanchayathStation 3 : NalleppillyAgraharam, Kudivellavitharana padhathi-2016, NalleppillyGramapanchayathStation 4 : AngamasalaKudivella Pandhathi-2016-17, ErimayoorGramapanchayathStation 5 : Mangodupookurissi Colony kudivellaPadhathi, MelarkodeGramapanchayathStation 6 : Janakiyasoothranapadhathi2007-2008, pookurissiMangodeKudivellapadhathi,
MelarkodeGramapanchayath,Station7 : kunjansmarakasudhajhalavitharanapadhathi, Wevers Colony, Ottapalam MunicipalityStation 8 : BRGF pumphouse, Pathakadavu, Ottapalam MunicipalityStation 9 : Jalanidhi-Lakkidi-PerurGramapanchayath, Brihathkudivellapadhathi, Station 10 : Vadanam-Kurissi Village kudivellaPadhathi, OngallurGramapanchayathStation 11 : Pattambi block PanchayathOngallurVellakkadanmarilKudivellapadhathi, OngallurGramaPanchayath. Station 12 : Ongallur 4 cent KudivellaPadhathiJanakiyasoothranam 2007-08, OngallurGramaPanchayath
Sl. No. Parameter Unit SAMPLE ID
May (08.5.19) June (19.6.19) July (06.7.19) August (14.8.19)
13 14 15 16 17 18 19 20 21 22 23 24
1 Colour Hazen BDL BDL BDL BDL BDL BDL BDL BDL BDL BDL BDL BDL
2 Odour _ Agreeable Agreeable Agreeable Agreeable Agreeable Agreeable Agreeable Agreeable Agreeable Agreeable Agreeable Agreeable
3 Turbidity NTU BDL BDL BDL BDL BDL BDL BDL BDL BDL BDL BDL BDL
4 pH _ 7.3 7.1 7.1 7.7 7.6 7.5 7.7 7.8 7.7 7.3 7.6 7.4
5Total hardness
(as CaCO3 ) mg/l 62 140 64 114 302 238 256 272 224 300 386 138
6 Iron(as Fe) " 0.33 BDL BDL BDL BDL BDL 0.03 0.02 0.03 BDL BDL 0.01
7 Chloride(as Cl) " 6 14 6 8 22 22 35 52 41 79 43 24
8BOD
(3 days at 270C)
" 0.2 0.5 0.5 0.3 0.3 0.3 0.3 0.3 0.3 0.2 0.4 0.3
9 Nitrate(as NO3) " 0.58 1.60 2.41 0.05 0.08 0.02 0.21 0.03 BDL 0.08 0.07 0.03
10 Fluoride(as F) " 0.3 0.2 0.3 0.4 0.4 0.6 0.4 0.6 0.6 0.21 0.32 0.13

Directory 2019 255
Kerala State Pollution Control Board
11 Total Coliforms cfu/100ml 1300 20 30 175 80 150 85 15 125 35 100 Absent
12 Fecal Coliforms cfu/100ml 900 10 20 150 60 125 Absent Absent 60 Absent Absent Absent
Station 13 : ChirakkalPadiPravasiKoottayama, shudhajalakudivellapadhathi, 2017, KanjirapuzhaGramaPanchayath.Station14 : ManaladikudivellaPadhathi, Jillapanchayath 2013-14, ThenkkaraGramapanchayath. Station15 : MuthuvalliKudivellapadhathi 2016-17, ThenkkaraGramapanchayathStation 16 : Chndrapuram mini KudivellaPadhathi, Palakkad JillaPanchayath, Kerala Vikasanapadhathi,
PudusserygramapanchaythStation 17 : Nedumpallamjalasambharani, Janakiyasoothranam 2009-10, ElappullyGramapanchayathStation 18 : Vazhakodu mini Kudivellapadhathi, ElappullyGramapanchayathStation 19 : Amrutha mini Kudivellapadhathi, OravuKodanayakalvadakkekadu, PattencheryGramapanchayathStation 20 : VaralchadhurishwasaPadhathi 2013 athimaniKudivellaPadhathi, PerumattiGramapanchayathStation 21 : Chittur Block PanchayathJanakiyasoothranam 2017-18, MeleezhuthaniKudivellaPadhathi,
PerumattiGramapanchayathStation 22 : KundiyapuramKudivellapadhathi, Kuzhalmanam Block Panchayath, MathurGramapanchayathStation23 : V.K. Nagar Kudivepadhathi, MelarkodeGramaPanchayath Station 24 : Mnagodupookurissi Colony kudivellaPadhathi, Kottekulam, MelarkodeGramapanchayath
Sl. No. Parameter Unit SAMPLE ID
September (16.9.19) October (10.10.19) November (7.11.19) December (6.12.19)
25 26 27 28 29 30 31 32 33 34 35 36
1 Colour Hazen BDL BDL BDL BDL BDL BDL BDL BDL BDL BDL BDL BDL
2 Odour _ Agreeable Agreeable Agreeable Agreeable Agreeable Agreeable Agreeable Agreeable Agreeable Agreeable Agreeable Agreeable
3 Turbidity NTU BDL BDL BDL BDL BDL BDL BDL BDL BDL BDL BDL BDL
4 pH _ 7.8 7.0 9.7 6.4 7.7 7.2 7.0 7.0 7.0 7.1 7.6 7.8
5Total hardness
(as CaCO3 ) mg/l 56 196 32 174 88 150 20 18 60 308 268 298
6 Iron(as Fe) " 0.01 BDL BDL 0.55 BDL 0.20 BDL BDL 0.10 BDL 0.02 BDL
7 Chloride(as Cl) " 16.5 38.5 17.5 18 29 27 8.91 8.91 14.8 108.7 69.23 97.9
8BOD
(3 days at 270C)" 0.3 0.5 0.3 0.3 0.5 0.3 0.5 0.3 0.4 0.3 0.3 0.3
9 Nitrate(as NO3) " 0.10 0.94 0.66 0.02 BDL BDL 0.44 0.26 0.06 26.35 3.37 0.33
10 Fluoride(as F) " 0.03 0.15 0.08 0.06 0.03 0.38 0.07 0.07 0.13 0.30 0.38 0.35
11 Total Coliforms cfu/100ml Absent Absent Absent 50 150 1500 Absent 100 800 750 Absent 150
12 Fecal Coliforms cfu/100ml Absent Absent Absent Absent 50 400 Absent Absent 400 150 Absent 100
Station 25 : KWA chathakunnuKudivellapadhathi, SreekrishnapuramGramapanchayathStation26 : AmbalaparaKesavanpathiyilthacharamakunnathkudivellapadhathi, AmbalaparaGramaPanchayath (Picture not
available)Station 27 : MurukkumpottaKudivellapadhathi, AmbalaparaGramaPanchayath (Picture not available)Station 28 : Muringalam Mini Kudivellapadhathi, MuthuthalaGramaPanchayath.Station 29 : KariyanurPallipuram mini sudhajalavitharanaPadhathi, pallipuramGramaPanchayathStation 30 : UrulanPadi, kudivellapadhathi, ParuthurGramapanchayathStation 31 : KWA Span KarakurushiThachanparaShudhalavitharaPadhathi, KarakkurushiGramaPanchayathStation 32 : KWA KarakurushiThachanparaSamagraShudhalavitharaPadhathi, ThachamparaGramaPanchayathStation 33 : ChirakkalPadiPravasiKoottayama, shudhajalakudivellapadhathi, 2017, KanjirapuzhaGramaPanchayathStation 34 : Mambaram-Puthugramam Mini Kudivellapathi, KannadiGramaPanchayathStation 35 : Mambaram- Mini KudivellapathikeralasarkarSamuhyaneethivakuppusamjojithaShishuvikasanasewanaPadhathi,
KannadiGramaPanchayathStation 36 : Para-mini Kudivellapadhathi, Vengodi, EleppullyGramaPanchayatha

Directory 2019
Kerala State Pollution Control Board
256
256
9.2 thriSSur diStrict
RW VAYANTHALA RW POOMALA RW PERIYARAM
RW VELUR RW THOLUR
Sl.No. Parameter Unit SAMPLE ID
Dt:01.01.19 Dt:05.03.19 Dt:10.05.19 Dt:02.07.19 Dt:15.10.19
RP1 RV1 RPM1 BV1 RT1
1 Colour Hazen NIL NIL NIL NIL NIL
2 Odour _ NIL NIL NIL NIL NIL
3 pH _ 6.4 6.4 7 6.2 7.2
4 Electrical Conductivity μs/cm
5 Turbidity NTU 2.1 0.5 0.7 1.2 1.8
6 Iron(as Fe) mg/l BDL 0.19 BDL BDL BDL
7 Total hardness(as CaCO3 ) " 14 240 26 100 35
8 Chloride(as Cl) " 28 38 52 52 18
9 Nitrate(as NO3) " 0.25 0.32 0.12 0.14 BDL
10 Ammonia(as NH3-N) "
11 Fluoride(as F) " BDL BDL BDL BDL BDL
12 BOD (3 days at 270C) " 2 1.5 2.1 1.2 2
13 Total Coliforms cfu/100ml 2000 100 100 NIL 200
14 Fecal Coliforms cfu/100ml
1 RP1 PARIYARM 2 RV1 VYANTHALA 3 RPM1 POOMALA 4 BV1 VELUR 5 RT1 THOLUR

Directory 2019 257
Kerala State Pollution Control Board
9.3 kozhikode diStrict
Rws1- Kattakalam-Peringattparambu Sc Colony Shudhajala Vidharana
Padhathi, Vilakkumadam. Source: well Perumanna Gramapanchayath
Rws2-Kunnummal-Cholakkal Kudivellapadhathi, Perumanna Gramapanchayath Source:well Perumanna Gramapanchayath
Rw3-Vilayil Mayangott Sangam Jalasechana Padhathi
Source:well Perumanna Gramapanchayath
Rws4-Edoliparamba Kacheriparamb Kudivellapadhathi Source:well Perumanna Gramapanchayath
Rws5- Karuvarapatta Kudivellapadhathi, Kattangal Koduvalli
Road, Near Bridge Source:well Chathamangalam Gramapanchayath
Rws6- Eranhiparamb Kacheriparamb Kudivella padhathiSource: well
Chathamangalam Grama panchayath
Rws7- Palathummal Kudivella Padhathi Source: well
Chathamangalam Gramapanchayath
Rws8-Naduvath Thazham Kudivella Padhathi Source: well
Chathamangalam Gramapanchayath
Rws 9- Parathikunnu Kudivella Padhathi Source:well Chemancheri
Gramapanchayath
Rws10- Kottuvayal Kudivella Padhathi Source:well Chemancheri
Gramapanchayath
Rws11- Muthachikavu Kudivella Padhathi Source:well
Chemancheri Gramapanchayath
Rws12- Arayidathu Kudivella Padhathi Source:well Chemancheri
Gramapanchayath

Directory 2019
Kerala State Pollution Control Board
258
258
Rws13- Ezhinilam Kudivellapadhathi, Parammal, Mavoor Source:well
Mavoor Gramapanchayath
Rws14- Kottakkunnu Kudivlla Padhathi, Aduvad, Parakkulam,
Mavoor Source:well Mavoor Gramapanchayath
Rws15- Kalluvettukuzhi Kudivella padhathi, Mavoor Source:well
Mavoor Gramapanchayath
Rws16- Modayangal Meethal Koonichimattukunnu Sc Colony
Kudivellapadhathi, Kanniparamba, Mavoor Source:well Mavoor
Gramapanchayath
Rws17- Nalukandathil Kudivellapadhathi, Kakkur
Source:well Kakkur Gramapanchayath
Rws18- Kottarakkunnu Kudivella padhathi, Kakkur Source:well Kakkur
Gramapanchayath
Rws19- Perattumala Kudivellapadhathi, Kakkur
Source:well Kakkur Gramapanchayath
Rws20- Thalappadimala Kudivellapadhathi, Kakkur
Source:well Kakkur Gramapanchayath
Sample Details:January-Rws1: Kattakalam -Peringathparamb Sc Colony Shudhajala Vidharana Padhathi, VilakkumadamJanuary- Rws2:Kunnummal- Cholakkal Kudivella PadhathiJanuary-Rws3:Vilayil Mayangot Sangam Jalasechana PadhathiJanuary-Rws4:Edoliparamb Kacheriparamb Kudivella PadhathiFebruary-April-Rws5: Karuvarapatta Kudivellapadhathi, Kattangal Koduvalli Road, Near BridgeFebruary-April- Rws6:Eranhiparamb Kudivellapadhathi, Kalanthode-Koolimadu RoadFebruary-April-Rws7:Palathummal Kudivellapadhathi, ChathamangalamFebruary-April-Rws8:Naduvath Thazham KudivellapadhathiMay-July-Rws9: Parathikunnu Kudivella PadhathiMay-July- Rws10:Kottuvayal Kudivellapadhathi

Directory 2019 259
Kerala State Pollution Control Board
Sl.No. Parameter Unit SAMPLE ID
15.01.2019 15.01.2019 15.01.2019 15.01.2019 14.03.2019 14.03.2019 14.03.2019 14.03.2019 18.06.2019 18.06.2019
RWS1 RWS2 RWS3 RWS4 RWS5 RWS6 RWS7 RWS8 RWS9 RWS10
1 Colour Hazen NIL NIL NIL NIL NIL NIL NIL NIL NIL NIL
2 Odour _ No Odour No Odour No Odour No Odour No Odour No Odour No Odour No Odour No Odour No Odour
3 pH _ 4.9 5.5 6 5.4 6.4 5.5 6.1 5.8 5.5 5.4
4 Electrical Conductivity μs/cm 57 71 97 69 68 41 76 62 49 55
5 Turbidity NTU * * * * * * * * * *
6 Iron(as Fe) mg/l BDL BDL BDL BDL BDL BDL BDL BDL BDL BDL
7Total hardness(as CaCO3 )
" 7 9 28 16 15 5 19 12 9 10
8 Chloride(as Cl) " 16 18 20 18 11 11 12 13 15 17
9 Nitrate(as NO3) " BDL BDL BDL BDL BDL 1.42 BDL 3.30 1.40 3.13
10 Ammonia(as NH3-N) "
11 Fluoride(as F) " 0.04 BDL BDL 0.04 BDL BDL BDL BDL BDL BDL
12 BOD (3 days at 270C) " BDL 0.9 BDL BDL 0.5 0.6 0.7 BDL 0.9 1
13 Total Coliforms cfu/100ml 50 180 780 1500 10 170 200 600 164 100
14 Fecal Coliforms cfu/100ml 40 100 390 1100 NIL 110 80 400 54 68
Sl.No. Parameter Unit SAMPLE ID
18.06.2019 18.06.2019 17.09.2019 17.09.2019 17.09.2019 17.09.2019 18.11.2019 18.11.2019 18.11.2019 18.11.2019
RWS11 RWS12 RWS13 RWS14 RWS15 RWS16 RWS17 RWS18 RWS19 RWS20
1 Colour Hazen NIL NIL NIL NIL NIL NIL NIL NIL NIL NIL
2 Odour _ No Odour No Odour No Odour No Odour No Odour No Odour No Odour No Odour No Odour No Odour
3 pH _ 5.7 5.6 7.3 6.8 6.6 7 7.1 6.5 5.7 5.8
4 Electrical Conductivity μs/cm 203 182 65 60 83 92 182 80 70 81
5 Turbidity NTU * * BDL BDL BDL BDL BDL BDL BDL BDL
6 Iron(as Fe) mg/l BDL BDL BDL BDL BDL BDL BDL BDL BDL BDL
7 Total hardness(as CaCO3 ) " 52 43 26 17 6 38 60 28 11 22
8 Chloride(as Cl) " 28 27 14 23 18 18 12 12 16 9
9 Nitrate(as NO3) " 21.7 23.12 4.61 6.64 16.1 BDL 1.2 2.3 15.1 2.9
10 Ammonia(as NH3-N) "
11 Fluoride(as F) " BDL BDL BDL BDL BDL BDL BDL BDL BDL BDL
12 BOD (3 days at 270C) " 1 1.4 BDL BDL BDL BDL 0.8 0.5 BDL BDL
13 Total Coliforms cfu/100ml 38 26 260 140 150 150 500 120 170 220
14 Fecal Coliforms cfu/100ml 28 18 200 120 100 120 220 60 20 70
May-July-Rws11:Muthachikavu KudivellapadhathiMay-July-Rws12:Arayidath KudivellapadhathiAugust-October-Rws13: Ezhinilam Kudivellapadhathi, Parammal, MavoorAugust-October- Rws14:Kottakkunnu Kudivellapadhathi, Aduvad, Parakkulam, MavoorAugust-October-Rws15:Kalluvettukuzhi Kudivellapadhathi, MavoorAugust-October-Rws16:Modayangal Meethal Koonichimattukunnu Sc Colony Kudivellapadhathi, Kanniparamba, MavoorNovember-December-Rws17: Nalukandathil, KakkoorNovember-December- Rws18:Kottarakunnu, KakkurNovember-December-Rws19:Perattumala, KakkurNovember-December-Rws20:Thalappadimala, Kakkur

Directory 2019
Kerala State Pollution Control Board
260
260
9.4 kaSaragod diStrict
Station No.01(RW117): Ammankode MogarGrama panchayath:
Muliyar, No. of houses: 9 houses Date of Sampling:
16.01.2019
Station No.02(RW118): Kunhimoola
Grama panchayath: Muliyar, No. of houses:
14 houses Date of Sampling: 16.01.2019
Station No.03(RW119): Eriyanni Payam
Grama panchayath: Muliyar, No. of houses:
30 houses Date of Sampling: 16.01.2019
Station No.03(RW119): Eriyanni Payam
Grama panchayath: Muliyar, No. of houses:
30 houses Date of Sampling: 16.01.2019
Station No.05(RW121): Thurav Grama panchayath:
KAYYUR CHEEMENI No. Of houses: 30
houses Date of Sampling: 16.02.2019
Station No.09(RW125): Perumbally Grama panchayath: Kallar
No. of houses: All over the Panchayath Date of Sampling: 16.03.2019
Station No.10(RW126): Kottakunnu Grama
panchayath: East - Eleri No. of houses: 15 houses Date of
Sampling: 25.04.2019
Station No.11(RW127): Kadumeni Grama
panchayath: East - Eleri No. of houses: 35 houses
Date of Sampling: 25.04.2019
Station No.12(RW128): Periya Grama panchayath:
Pullur - Periya, No. of houses: 19 houses, Date of Sampling:
07.05.2019
Station No.06(RW122): Kizhakkekkara Grama panchayath: KAYYUR
CHEEMENI, No. Of houses: 55 houses, Date of
Sampling: 16.02.2019
Station No.07(RW123): Oklavu - Kottakandam
Grama panchayath: KallarNo. Of houses: 15 houses
Date of Sampling: 16.03.2019
Station No.08(RW124): Pookunnamthattu
Grama panchayath: KallarNo. of houses: 20 houses
Date of Sampling: 16.03.2019

Directory 2019 261
Kerala State Pollution Control Board
Station No.13(RW129): Kuniya, Grama panchayath:
Pullur - Periya, No. of houses: 24 houses, Date of
Sampling: 07.05.2019
Station No.17 (RW133): Orkkalam, Grama
panchayath: Cheruvathur No. of houses: 427 Houses
Date of Sampling: 18.06.2019
Station No.21 (RW137): Vazhapanthal, Grama
panchayath: Kinanoor - Karinthalam, No. of houses:
130 Houses, Date of Sampling: 21.08.2019
Station No.22 (RW138): Chooripara, Grama
panchayath: Kinanoor - Karinthalam, No. of houses:
120 Houses, Date of Sampling: 21.08.2019
Station No.23 (RW139): Kaniyada, Grama
panchayath: Kinanoor - Karinthalam, No. of houses:
140 Houses, Date of Sampling: 21.08.2019
Station No.24 (RW140): Nedumthudupp
Grama panchayath: MadikaiNo. of houses: 174 Houses
Date of Sampling: 23.09.2019
Station No.18 (RW134): Nedumthudupp
Grama panchayath: MadikaiNo. of houses: 4 houses
Date of Sampling: 11.07.2019
Station No.19 (RW135): Koottapunna
Grama panchayath: MadikaiNo. of houses: 25 houses
Date of Sampling: 11.07.2019
Station No.20 (RW136): Koranganadi
Grama panchayath: MadikaiNo. of houses: 17 houses
Date of Sampling: 11.07.2019
Station No.14 (RW130): Echikundu, Grama
panchayath: Pullur - PeriyaNo. of houses: 38 houses
Date of Sampling: 07.05.2019
Station No15 (RW131): Madakkara, Grama
panchayath: Cheruvathur No. of houses: Harbour
Date of Sampling: 18.06.2019
Station No.16(RW132): Kulangattu, Grama
panchayath: Cheruvathur No. of houses: More than
1000 Houses, Date of Sampling: 18.06.2019

Directory 2019
Kerala State Pollution Control Board
262
262
Station No.25 (RW141): Koottapunna, Grama panchayath: Madikai
No. of houses: 25 HousesDate of Sampling:
23.09.2019
Station No.29(RW145): Mavungal, Grama
panchayath: PanathadyNo. of houses: 5 Houses
Date of Sampling: 28.10.2019
Station No.33 (RW149): Olavara, Grama panchayath: Trikaripur, No. of houses: 60 Houses, Date of Sampling:
18.12.2019
Station No.34 (RW150): Olavar - Alankara
Grama panchayath: Trikaripur, No. of houses: 25 Houses, Date of Sampling:
18.12.2019
Station No.35(RW151): Thykkeal, Grama
panchayath: TrikaripurNo. of houses: 50 Houses
Date of Sampling: 18.12.2019
Station No.30(RW146): Karadukka, Grama
panchayath: KaradukkaNo. of houses: 28 Houses
Date of Sampling: 20.11.2019
Station No.31 (RW147): Karimbuvalappu
Grama panchayath: Karadukka, No. of houses: 24
Houses, Date of Sampling: 20.11.2019
Station No.32 (RW148): Adukkam, Grama
panchayath: KaradukkaNo. of houses: 42 Houses
Date of Sampling: 20.11.2019
Station No.26(RW142): Panathur, Grama
panchayath: PanathadyNo. of houses: 5 Houses
Date of Sampling: 28.10.2019
Station No.27(RW143): Panathur BusstandGrama panchayath:
Panathady, No. of houses: 5 Houses, Date of Sampling:
28.10.2019
Station No.28(RW144): Chiramkadavu
Grama panchayath: Panathady, No. of houses: 5 Houses, Date of Sampling:
28.10.2019

Directory 2019 263
Kerala State Pollution Control Board
Sl.No. Parameter Unit SAMPLE ID
16.01.19 16.01.19 16.01.19 16.02.19 16.02.19 16.02.19 16.03.19 16.03.19 16.03.19 25.04.19 25.04.19
RW117 RW118 RW119 RW120 RW121 RW122 RW123 RW124 RW125 RW126 RW127
1 Colour Hazen <5 <5 <5 <5 <5 <5 <5 <5 <5 <5 <5
2 Odour _ None None None None None None None None None None None
3 pH _ 6.9 7.0 7.3 8.8 8.4 8.3 8.0 7.8 7.7 7.3 6.8
4 Electrical Conductivity μs/cm 228 167 114 38 191 104 62 80 128 75 92
5 Turbidity NTU 0.3 2 1.6 0.5 0.1 0.6 0.1 0.1 0.2 0.5 0.6
6 Iron(as Fe) mg/l BDL 0.35 0.39 BDL 0.11 BDL BDL 0.04 0.09 BDL BDL
7 Total hardness(as CaCO3 ) " 102 72 43 20 130 51 25 28 60 30 30
8 Chloride(as Cl) " 10 10 12 7 5 6 10 16 10 7 13
9 Nitrate(as NO3) " BDL BDL BDL 0.123 0.0443 0.044 0.48 0.75 0.21 0.044 0.290
10 Ammonia(as NH3-N) " BDL BDL BDL BDL BDL BDL BDL BDL BDL BDL BDL
11 Fluoride(as F) " 0.258 BDL 0.68 0.18 0.50 0.16 0.36 BDL 0.50 BDL BDL
12 BOD(3 days at 270C) " 0.9 2.5 2.3 1.0 1.7 1.0 0.6 0.3 0.3 1.5 2.6
13 Total Coliforms cfu/100ml 20 10 20 10 80 20 20 10 20 150 40
14 Fecal Coliforms cfu/100ml ND ND ND ND 36 ND 4 ND 8 20 24
Sample 01 : RW 117 - Ammankode Mogar SC Colony Tank. Water supply to 9 Houses, Muliyar PanchayathSample 02 : RW 118 - Kunhimoola SC Colony Water Supply Tank. Water supply to 14 Houses, Muliyar PanchayathSample 03 : RW 119 - Eriyanni - Payam SC Colony Tank. Water supply to 30 Houses, Muliyar PanchayathSample 04 : RW 120 - Kariyapp Rajiv Gandhi Kudivella Padhathi Water Tank. Water supply to 25 Houses, Kayyur - Cheeemeni
PanchayathSample 05 : RW 121 - Thurav - Samagra Kudivella Padhathi (RGDWM) Water Tank. Water supply to 30 Houses, Kayyur -
Cheeemeni PanchayathSample 06 : RW 122 - Cheemeni Kizhakkekara Meethal Water Supply Scheme. Water supply to 55 Houses, Kayyur - Cheeemeni
PanchayathSample 07 : RW 123 - Oklavu-Kottakandam ST Colony Kudivella Padhathi. Water supply to 15 Houses, Kallar PanchayathSample 08 : RW 124 - Pookuunnamthattu Water Supply Scheme. Water supply to 20 Houses, Kallar PanchayathSample 09 : RW 125 - Kappungara,Perumbally Water Supply Scheme. Water supply to all over the panchayath, Kallar PanchayathSample 10 : RW 126 - Kottakunnu, ST Colony Tank. Water supply to 15 Houses, East Eleri PanchayathSample 11 : RW 127 - Vietnum colony water tank,Pattemkanam, Kadumeni. Water supply to 35 Houses, East Eleri Panchayath
Sl.No. Parameter Unit SAMPLE ID
07.05.19 07.05.19 07.05.19 18.06.19 18.06.19 18.06.19 11.07.19 11.07.19 11.07.19 21.08.19 21.08.19 21.08.19
RW128 RW129 RW130 RW131 RW132 RW133 RW134 RW135 RW136 RW137 RW138 RW139
1 Colour Hazen <5 <5 <5 <6 <7 <8 <9 <10 <11 <12 <13 <14
2 Odour _ None None None None None None None None None None None None
3 pH _ 7.4 7.5 7.5 7.9 5.6 5.4 7.1 7.0 7.0 6.5 6.7 6.6
4 Electrical Conductivity μs/cm 189 163 200 296 375 343 163 210 141 64 53 63
5 Turbidity NTU 1.1 0.9 1.1 0.6 0.7 2.6 1.2 1 4 0.2 0.5 1.3
6 Iron(as Fe) mg/l BDL BDL BDL BDL BDL BDL BDL BDL BDL BDL BDL BDL
7 Total hardness(as CaCO3) " 95 80 102 120 72 48 84 113 75 26 29 31
8 Chloride(as Cl) " 8 10 8 40 120 100 8 10 10 10 8 5
9 Nitrate(as NO3) " BDL BDL BDL 0.09 0.89 0.09 0.04 0.09 0.09 BDL 0.01 0.00
10 Ammonia(as NH3-N) " BDL BDL BDL BDL BDL BDL BDL BDL BDL BDL BDL BDL
11 Fluoride(as F) " BDL BDL BDL BDL BDL BDL BDL BDL BDL BDL BDL BDL
12 BOD(3 days at 270C) " 1.3 1.0 0.3 1.0 0.8 0.7 0.3 0.3 0.7 2.9 1.3 2
13 Total Coliforms cfu/100ml 150 230 580 80 20 100 100 30 110 70 80 10
14 Fecal Coliforms cfu/100ml 5 20 84 8 ND 8 ND ND ND 4 ND ND

Directory 2019
Kerala State Pollution Control Board
264
264
Sample 12 : RW 128 - Periya Lakshamveedu Kudivellapadhathi Tank. Water supply to 19 Houses,Pullur - Periya PanchayathSample 13 : RW 129 - Chakkliyar colony water tank,Kuniya. Water supply to 24 Houses, Pullur - Periya PanchayathSample 14 : RW 130 - Jalanidhi water supply scheme Lakshamveedu Vayararavalli Echikundu. Water supply to 38 Houses, Pullur
- Periya PanchayathSample 15 : RW 131 - Madakkara Harbour Tank, Cheruvathur. Water supply to Harbour, Cheruvathur PanchayathSample 16 : RW 132 - Kulangattu water supply scheme,Cheruvathur. Water supply to More than 1000 Houses, Cheruvathur
PanchayathSample 17 : RW 133 - Orkkalam shudhajala vitharan padhathi. Water supply to 427 Houses, Cheruvathur PanchayathSample 18 : RW 134 - Nedumthudup ST Colony water supply scheme. Water supply to 4 Houses, Madikai PanchayathSample 19 : RW 135 - Koottappunna ST kudivella padhathi. Water supply to 25 Houses, Madikai PanchayathSample 20 : RW 136 - Nedumthudup colony water supply scheme,Koranganadi. Water supply to 17 Houses, Madikai PanchayathSample 21 : RW 137 - Vazhapanthal Jalanidhi water supply scheme. Water supply to 130 Houses, Kinanoor - Karinthalam
PanchayathSample 22 : RW 138 - Chooripara Jalanidhi Water Supply Scheme. Water supply to 120 Houses, Kinanoor - Karinthalam
PanchayathSample 23 : RW 139 - Kaniyada Moolakke Water Supply Scheme. Water supply to 140 Houses, Kinanoor - Karinthalam Panchayath
Sl.No. Parameter Unit SAMPLE ID
23.09.19 23.09.19 28.10.19 28.10.19 28.10.19 28.10.19 20.11.19 20.11.19 20.11.19 18.12.19 18.12.19 18.12.19
RW 140 RW 141 RW 142 RW 143 RW 144 RW 145 RW 146 RW 147 RW 148 RW 149 RW 150 RW 151
1 Colour Hazen <5 <5 <5 <5 <5 <5 <5 <5 <5 <5 <5 <5
2 Odour _ None None None None None None None None None None None None
3 pH _ 6.4 6.7 6.9 5.7 5.9 6.0 6.7 6.9 7.1 5.5 5.3 5.3
4 Electrical Conductivity μs/cm 135 179 69 73 45 55 133 159 255 164 73 152
5 Turbidity NTU 2.3 1.8 0.8 0.9 0.8 1.3 1 4.2 0.6 1.3 0.5 0.5
6 Iron(as Fe) mg/l BDL BDL BDL 0.01 BDL BDL BDL BDL BDL BDL 0.01 BDL
7Total hardness(as
CaCO3) " 71 83 32 35 24 30 55 63 110 50 20 53
8 Chloride(as Cl) " 7 8 12 6 4 4 12 10 10 20 12 26
9 Nitrate(as NO3) " 0.05 0.09 0.11 0.53 0.05 0.05 0.63 0.04 0.93 0.49 0.71 0.95
10 Ammonia(as NH3-N) " BDL BDL BDL BDL BDL BDL BDL BDL BDL BDL BDL BDL
11 Fluoride(as F) " BDL BDL 0.02 0.03 0.02 0.02 0.12 0.31 0.01 0.01 0.01 0.15
12 BOD(3 days at 270C) " 1.6 2.6 0.4 1.1 0.4 1.1 0.2 0.1 0.1 0.5 1.1 2.1
13 Total Coliforms cfu/100ml 50 300 20 30 50 20 70 100 60 20 10 520
14 Fecal Coliforms cfu/100ml ND 64 ND ND 4 ND 24 20 12 ND ND 76
Sample 24 : RW 140 - Nedumthudup colony water supply scheme,Koranganadi. Water supply to 174 Houses, Madikai Panchayath
Sample 25 : RW 141 - Koottappunna ST Kudivella Padhathi. Water supply to 25 Houses, Madikai PanchayathSample 26 : RW 142 - Open well near Panathur Anganawadi near busstand. Water supply to 5 Houses, Panathady PanchayathSample 27 : RW 143 - Open well in panathur busstand behind panchayath office. Water supply to Not Started, Panathady
PanchayathSample 28 : RW 144 - Chiramkadavu water supply scheme. Water supply to More than 500 Houses, Panathady PanchayathSample 29 : RW 145 - Mavungal RWSS Kudivella padhadhi. Water supply to 100 Houses, Panathady PanchayathSample 30 : RW 146 - Ugraniadukkam Jalanidhi Kudivella Padhadhi Karadukka. Water supply to 28 Houses, Karadukka PanchayathSample 31 : RW 147 - Jalanidhi Kerala Gramina Shudhajala Vitharana Shuchitha Padhadhi ,Karimbuvalappu,Karadkka. Water
supply to 24 Houses, KaradukkaPanchayathSample 32 : RW 148 - Jalanidhi Kerala Gramina Shudhajala Vitharana Shuchitha Padhadhi, Adukkam,Karadkka. Water supply to
42 Houses, Kinanoor - Karadukka PanchayathSample 33 : RW 149 - RGNDWM Jaladhara II RWSS, Olavara. Water supply to 60 Houses, Trikaripur PanchayathSample 34 : RW 150 - RGNDWM Sector Reforms Project, RWSS, Olavara - Akarankara. Water supply to 25 Houses, Trikaripur
PanchayathSample 35 : RW 151 - RGNDWM Sector Reforms Project, RWSS, Thykkeal Sudhajala Vitharana Padhathi. Water supply to 50
Houses, Trikaripur Panchayath

Directory 2019 265
Kerala State Pollution Control Board
9.5 wayanad diStrict
Padippura paniya colony
Palakkolly colony
Vannathara colony
Colimoola paniyacolony Palladamkunnu kuruma colony
badarkandam kuruma colony Mundavara paniya colony
Sl.No. Parameter Unit SAMPLE ID
10/1/19 10/1/19 10/1/19 10/1/19 10/1/19 7/2/19 7/2/19 7/2/19 7/2/19 7/2/19
1 2 3 4 5 6 7 8 9 10
1 Colour Hazen NIL NIL NIL NIL NIL NIL NIL NIL NIL NIL
2 Odour _ NIL NIL NIL NIL NIL NIL NIL NIL NIL NIL
3 pH _ 7.5 7.2 6.9 6.8 7 7.7 7 7.2 7.4 7
4 Electrical Conductivity μs/cm 251 299 324 1527 616 636 642 582 228 218
5 Turbidity NTU NIL NIL NIL NIL NIL NIL NIL NIL NIL NIL
6 Iron(as Fe) mg/l 0.001 0.004 0.003 0.15 0.002 0.007 0.002 0.008 0.003 0.002
7Total hardness(as
CaCO3 ) " 68 89 95 352 142 203 194 127 57 94
8 Chloride(as Cl) " 44 45 49 248 115 51 78 89 34 17
9 Nitrate(as NO3) " 0.25 0.38 0.23 1.5 0.84 0.29 0.38 0.21 0.18 0.02
10 Ammonia(as NH3-N) "
11 Fluoride(as F) " BDL BDL BDL BDL BDL BDL BDL BDL BDL BDL
12 BOD(3 days at 270C) " 0.1 0.3 1.5 1.1 0.2 1.4 0.2 0.3 0.5 0.3
13 Total Coliforms cfu/100ml 304 260 240 256 262 140 162 146 126 64
14 Fecal Coliforms cfu/100ml 222 250 144 118 14 34 46 112 40 36
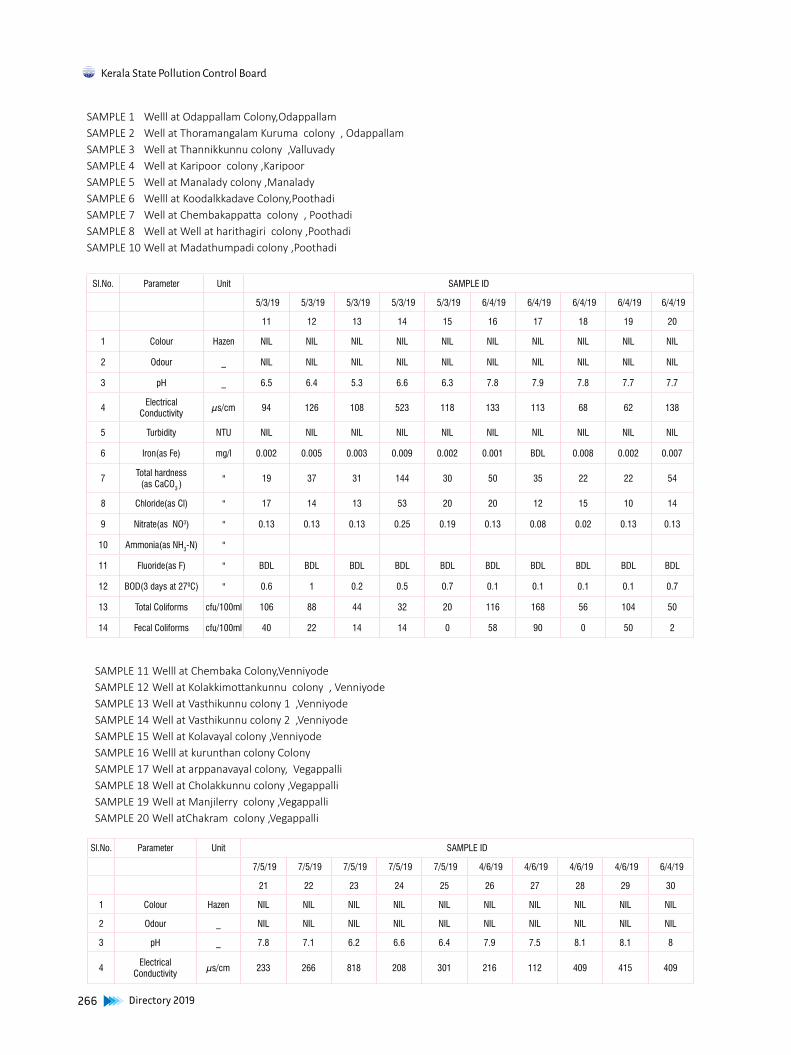
Directory 2019
Kerala State Pollution Control Board
266
266
Sl.No. Parameter Unit SAMPLE ID
5/3/19 5/3/19 5/3/19 5/3/19 5/3/19 6/4/19 6/4/19 6/4/19 6/4/19 6/4/19
11 12 13 14 15 16 17 18 19 20
1 Colour Hazen NIL NIL NIL NIL NIL NIL NIL NIL NIL NIL
2 Odour _ NIL NIL NIL NIL NIL NIL NIL NIL NIL NIL
3 pH _ 6.5 6.4 5.3 6.6 6.3 7.8 7.9 7.8 7.7 7.7
4Electrical
Conductivityμs/cm 94 126 108 523 118 133 113 68 62 138
5 Turbidity NTU NIL NIL NIL NIL NIL NIL NIL NIL NIL NIL
6 Iron(as Fe) mg/l 0.002 0.005 0.003 0.009 0.002 0.001 BDL 0.008 0.002 0.007
7Total hardness
(as CaCO3 ) " 19 37 31 144 30 50 35 22 22 54
8 Chloride(as Cl) " 17 14 13 53 20 20 12 15 10 14
9 Nitrate(as NO3) " 0.13 0.13 0.13 0.25 0.19 0.13 0.08 0.02 0.13 0.13
10 Ammonia(as NH3-N) "
11 Fluoride(as F) " BDL BDL BDL BDL BDL BDL BDL BDL BDL BDL
12 BOD(3 days at 270C) " 0.6 1 0.2 0.5 0.7 0.1 0.1 0.1 0.1 0.7
13 Total Coliforms cfu/100ml 106 88 44 32 20 116 168 56 104 50
14 Fecal Coliforms cfu/100ml 40 22 14 14 0 58 90 0 50 2
SAMPLE 11 Welll at Chembaka Colony,VenniyodeSAMPLE 12 Well at Kolakkimottankunnu colony , VenniyodeSAMPLE 13 Well at Vasthikunnu colony 1 ,VenniyodeSAMPLE 14 Well at Vasthikunnu colony 2 ,VenniyodeSAMPLE 15 Well at Kolavayal colony ,VenniyodeSAMPLE 16 Welll at kurunthan colony ColonySAMPLE 17 Well at arppanavayal colony, VegappalliSAMPLE 18 Well at Cholakkunnu colony ,VegappalliSAMPLE 19 Well at Manjilerry colony ,VegappalliSAMPLE 20 Well atChakram colony ,Vegappalli
Sl.No. Parameter Unit SAMPLE ID
7/5/19 7/5/19 7/5/19 7/5/19 7/5/19 4/6/19 4/6/19 4/6/19 4/6/19 6/4/19
21 22 23 24 25 26 27 28 29 30
1 Colour Hazen NIL NIL NIL NIL NIL NIL NIL NIL NIL NIL
2 Odour _ NIL NIL NIL NIL NIL NIL NIL NIL NIL NIL
3 pH _ 7.8 7.1 6.2 6.6 6.4 7.9 7.5 8.1 8.1 8
4Electrical
Conductivityμs/cm 233 266 818 208 301 216 112 409 415 409
SAMPLE 1 Welll at Odappallam Colony,OdappallamSAMPLE 2 Well at Thoramangalam Kuruma colony , OdappallamSAMPLE 3 Well at Thannikkunnu colony ,ValluvadySAMPLE 4 Well at Karipoor colony ,KaripoorSAMPLE 5 Well at Manalady colony ,ManaladySAMPLE 6 Welll at Koodalkkadave Colony,PoothadiSAMPLE 7 Well at Chembakappatta colony , PoothadiSAMPLE 8 Well at Well at harithagiri colony ,PoothadiSAMPLE 10 Well at Madathumpadi colony ,Poothadi

Directory 2019 267
Kerala State Pollution Control Board
Sl.No. Parameter Unit SAMPLE ID
5/7/19 5/7/19 5/7/19 5/7/19 5/7/19 7/8/19 7/8/19 7/8/19 7/8/19 7/8/19
31 32 33 34 35 36 37 38 39 40
1 Colour Hazen NIL NIL NIL NIL NIL NIL NIL NIL NIL NIL
2 Odour _ NIL NIL NIL NIL NIL NIL NIL NIL NIL NIL
3 pH _ 8 8 7.5 7.8 7.9 6.9 7.1 7.2 7 7
4Electrical
Conductivityμs/cm 1628 622 299 899 538 469 393 403 293 189
5 Turbidity NTU NIL NIL NIL NIL NIL NIL NIL NIL NIL NIL
6 Iron(as Fe) mg/l 0.02 0.02 0.05 0.18 0.03 0.17 0.04 0.16 BDL BDL
7Total hardness
(as CaCO3 ) " 565 210 95 317 221 193 137 165 116 61
8 Chloride(as Cl) " 305 105 38 176 39 65 64 57 35 22
9 Nitrate(as NO3) " 0.28 0.3 0.16 0.31 0.21 0.18 0.21 0.13 0.2 0.13
10 Ammonia(as NH3-N) "
11 Fluoride(as F) " BDL BDL BDL BDL BDL BDL BDL BDL BDL BDL
12 BOD (3 days at 270C) " 3.7 1.7 1.2 2.2 2.8 0.8 0.6 0.4 0.6 1.3
13 Total Coliforms cfu/100ml 24 36 78 54 66 60 96 84 76 270
14 Fecal Coliforms cfu/100ml 14 20 38 14 44 26 14 32 34 196
SAMPLE 21 Welll at Armad Colony,ArmadSAMPLE 22 Well at Puthannoor Kalkory colony, ChethalayamSAMPLE 23 Well at padippura paniya colony ,ChethalayamSAMPLE 24 Well at Kombanmoola kattunaikka colony ,ChethalayamSAMPLE 25 Well at Madayamvayal paniya colony ,ChethalayamSAMPLE 26 Welll at Gunnika parambu Colony1,ThirunellySAMPLE 27 Well at Gunnika parambu Colony 2,ThirunellySAMPLE 28 Well at Anakyam colony ,TholpettySAMPLE 29 Well at Nedumvayal colony ,TholpettySAMPLE 30 Well at Begoor colony ,Thirunelly
5 Turbidity NTU NIL NIL NIL NIL NIL NIL NIL NIL NIL NIL
6 Iron(as Fe) mg/l 0.001 0.003 0.018 0.002 0.004 0.17 0.19 0.02 BDL 0.07
7Total hardness
(as CaCO3 ) " 82 68 232 88 79 84 50 168 142 148
8 Chloride(as Cl) " 22 48 140 19 65 30 10 46 73 69
9 Nitrate(as NO3) " 0.21 0.32 0.21 0.13 0.13 0.13 0.1 0.21 0.23 0.1
10 Ammonia(as NH3-N) "
11 Fluoride(as F) " BDL BDL BDL BDL BDL BDL BDL BDL BDL BDL
12 BOD(3 days at 270C) " 1.1 0.8 4.2 0.1 0.6 0.9 0.4 0.6 1 0.5
13 Total Coliforms cfu/100ml 32 120 70 96 48 208 182 240 264 146
14 Fecal Coliforms cfu/100ml 28 26 42 28 20 78 52 112 90 14

Directory 2019
Kerala State Pollution Control Board
268
268
Sl.No. Parameter Unit SAMPLE ID
4/9/19 4/9/19 4/9/19 4/9/19 4/9/19 11/10/19 11/10/19 11/10/19 11/10/19 11/10/19
41 42 43 44 45 46 47 48 49 50
1 Colour Hazen NIL NIL NIL NIL NIL NIL NIL NIL NIL NIL
2 Odour _ NIL NIL NIL NIL NIL NIL NIL NIL NIL NIL
3 pH _ 6.7 6.7 7 6.8 6.7 6.6 6.8 6.7 6.9 6.9
4Electrical
Conductivityμs/cm 511 795 191 682 850 208 177 219 725 362
5 Turbidity NTU NIL NIL NIL NIL NIL NIL NIL NIL NIL NIL
6 Iron (as Fe) mg/l 0.005 0.004 BDL 0.008 BDL 0.004 0.12 0.007 BDL 0.09
7Total hardness
(as CaCO3 ) " 197 212 69 281 304 76 58 71 163 98
8Chloride(as Cl)
" 38 141 15 124 151 29 24 24 149 54
9 Nitrate(as NO3) " 0.13 0.29 0.1 0.21 0.25 0.18 0.07 0.1 0.34 0.21
10Ammonia(as
NH3-N)"
11 Fluoride(as F) " BDL BDL BDL BDL BDL BDL BDL BDL BDL BDL
12BOD (3 days at
270C)" 0.3 0.8 0.2 1.1 1.7 0.3 0.3 0.7 0.1 0.3
13 Total Coliforms cfu/100ml 36 124 12 132 42 6 34 46 42 172
14 Fecal Coliforms cfu/100ml 18 32 2 84 32 2 0 20 38 0
SAMPLE 41 Welll at Koottampali colony,ThelambattaSAMPLE 42 Well at Eramkolly colony,ThelambettaSAMPLE 43 Well at Ullilam Colony ,ThelambattaSAMPLE 44 Well at Mulanchira colony , ThelambattaSAMPLE 45 Well at Malappura colony ,NaikkettySAMPLE 46 Welll at Choramkolly colony,KannankodeSAMPLE 47 Well at Karakappali colony,NenmenikkunnuSAMPLE 48 Well at Kolipali Colony ,NenmenikkunnuSAMPLE 49 Well at Kundanamkunnu colony , EruthkalluSAMPLE 50 Well at Kakkamala colony ,Kakkamala
SAMPLE 31 Welll at Valamangamoola Colony 1,Pulpally
SAMPLE 32 Well at Valamangamoola Colony 2,Pulpally
SAMPLE 33 Well at Valamangamoola Colony 3,Pulpally
SAMPLE 34 Well at Perikkallor colony , Perikkallor
SAMPLE 35 Well at Moonnupalam colony ,Perikkallor
SAMPLE 36 Welll at Madalpadi colony,Pulpally
SAMPLE 37 Well at Palakkolly colony,Pulpally
SAMPLE 38 Well at Udhumakkara Colony ,Mullankolly
SAMPLE 39 Well at Karakkandy pniya colony , Mullankolly
SAMPLE 40 Well at Kollivayal colony ,Mullankolly

Directory 2019 269
Kerala State Pollution Control Board
Sl.No. Parameter Unit SAMPLE ID
5/11/19 5/11/19 5/11/19 5/11/19 5/11/19 9/12/19 9/12/19 9/12/19 9/12/19 9/12/19
51 52 53 54 55 56 57 58 59 60
1 Colour Hazen NIL NIL NIL NIL NIL NIL NIL NIL NIL NIL
2 Odour _ NIL NIL NIL NIL NIL NIL NIL NIL NIL NIL
3 pH _ 7 6.9 6.8 7 6.9 7.1 6.7 6.6 6.8 6.5
4 Electrical Conductivity μs/cm 237 708 725 315 341 170 161 248 136 373
5 Turbidity NTU NIL NIL NIL NIL NIL NIL NIL NIL NIL NIL
6 Iron(as Fe) mg/l 0.05 0.09 0.104 0.01 0.002 0.02 0.02 0.12 0.07 0.1
7 Total hardness(as CaCO3) " 100 296 312 125 136 44 62 59 42 69
8 Chloride(as Cl) " 13 104 105 63 29 37 12 41 24 70
9 Nitrate(as NO3) " 0.14 0.28 0.21 0.08 0.21 0.21 0.19 0.25 0.08 0.28
10 Ammonia(as NH3-N) "
11 Fluoride(as F) " BDL BDL BDL BDL BDL BDL BDL BDL BDL BDL
12 BOD (3 days at 270C) " 0.7 1.3 1 0.3 1.3 0.8 0.5 0.2 0.3 0.2
13 Total Coliforms cfu/100ml 52 6 78 56 44 20 14 22 28 16
14 Fecal Coliforms cfu/100ml 34 2 50 30 32 4 6 8 18 4
SAMPLE 51 Welll at Alumkalam colony,MuthangaSAMPLE52 Well at Thakarakappadi colony,MuthangaSAMPLE 53 Well at Maikkaa Colony ,MuthangaSAMPLE 54 Well at Kalankandi colony , MuthangaSAMPLE 55 Well at Edathara colony ,MuthangaSAMPLE 56 Welll at Vannathara colony 1,ChulliyodeSAMPLE 57 Well at Vannathara colony 2,ChulliyodeSAMPLE 58 Well at Ambalakkunnu Colony ,ChulliyodeSAMPLE 59 Well at Kolimoola paniya colony , ChulliyodeSAMPLE 60 Well at Kazhambumkara kuruma colony ,Chulliyode

Directory 2019
Kerala State Pollution Control Board
270
270
GENERAL EVALUATIoN oN WATER QUALITY
Rivers play major role in the water cycle of the blue planet and their quality is a direct reflection of the civilization and living standards of the region. Kerala is blessed with 44 rivers and their tributaries. All the rivers in our state are monsoon fed and water scarcity for drinking as well as for other uses are common in summer months at different places. Surface water quality of the water bodies are deteriorating due to various anthropogenic activities.The results of industrialization, urbanization, increased population etc. is felt on the water resources in such a way that the quantity is falling short and quality deteriorating with time. Waste disposal across the world primarily involves dilution by the water courses and various types of such anthropogenic activities constantly pollute the fresh water sources. Seasonal variations in precipitation and surface run off also affect the status of water quality.
Fresh, clean water is a limited resource and delivering clean water to the society is essential for a healthy ecosystem. The quality of water is identified in terms of the physical, chemical, biological and bacteriological parameters. With the ever increasing use of water for domestic, industrial and irrigation the monitoring and assessment of water quality on continual basis has become essential and it conveys the pollution status of a water body and the data generated can be utilized for planning and sustainable development. For identification of the water bodies or their parts where water quality is at variance with water quality criteria, it was felt important to measure quality of that water body or its parts. Central Pollution Control Board (CPCB) has established primary water quality criteria for classifying inland surface waters into various categories (A to E and Below E) based on Designated Best Use (DBU).
Classification of river stretches has been done based on the data generated during the year 2019. The major problem associated with river water quality is the bacterial contamination and 34% of the water bodies monitored under National Water Quality Monitoring Programme (NWMP) and State Water Quality Monitoring Programme (SWMP) are classified into various use based classes on the basis of bacterial population. Apart from the coli form counts, increased BOD, decreased Dissolved Oxygen content and increased Electrical Conductivity are also the major determining factors in the DBU classification.
Aruvippuram in River Neyyar is having average BOD value of 3.5 mg/L and classed into “D”. Munnattumukku and Thiruvallam in River Karamana are classed as “D” because of the low DO content and High BOD values along with increased bacterial population. The station at Pallathukadavu in Karamana River is also reported very low DO content. The sampling locations of Triveni, Kakiyar and Njunangar in River Pamba are having average coli form counts above 5000 MPN/100ml and fall into class “D”. Edatua and Tkakazhi are reported to have average DO content below 4 mg/L and are classed into “D” Naraparamba and Thavanur in River Bharathapuzha fall into “B” class because of the average BOD value. All other stations in Bharathapuzha are classed as “B” because of coli form counts. Kallayi River in Kozhikode district have low DO content, high coli form counts apart from high Electrical Conductivity. All stations in the rivers of Thodupuzha and Munnar are classed as “D” due to the increased coli form colonies. Kadambrayar in River Periyar is classified into “E” because of very low DO content and very high coli form counts. The station Manakkakadavu in Periyar River is reported to have DO average less than 4 mg/L and classed into “E”. Chitrapuzha at Irumbanam is also reported to have low DO content, High total coli forms and thus classed into “E”.
Ground water samples monitored during the year 2019 under NWMP and Source water monitoring of the Rural Water Supply Schemes across the state report the presence of coli form bacteria in 93.1% of the samples. Proximity to septic tanks, unprotected open wells, cluster of housing units and lack of periodical cleaning and disinfection are the reasons for increasing counts of coli forms in well water. Since majority of the people in the state depend on well water for drinking, the quality of well water has to be monitored periodically. Otherwise chances of spreading water borne diseases are more. Hence local administration and health authorities should make all efforts to ensure safe drinking water to the public.

Directory 2019 271
Kerala State Pollution Control Board
271
aMbient aiR Quality data-2019
& tRend analySiS 2010-2019

Directory 2019
Kerala State Pollution Control Board
272
272

Directory 2019 273
Kerala State Pollution Control Board
High Volume Samplerfor measurement of RSPM, SPM, So2 & Nox
273
11. AMBIENT AIR QUALITY DATA
The Kerala State Pollution Control Board is monitoring ambient air quality at 35 locations in the state. The locations fall under the categories of industrial, Commercial, residential and sensitive. Of the 35 stations 27 come under National Ambient Air Quality Monitoring Programme (NAMP) and 8 under State Ambient Air Quality Monitoring programme (SAMP). Sulphur dioxide, Nitrogen oxides and Respirable Suspended Particulate Matter (Class 10 micron size) (RSPM) are monitored regularly. 24 hour ambient air quality monitoring is conducted with a sampling frequency of two days/week. Sulphur dioxide (SO2) and Nitrogen Oxides (NOx) are monitored at four hour interval and Respirable Suspended Particulate Matter (RSPM) at eight hour interval. Monitoring of remaining parameters under NAAQS are in the implementation level. The Board had started PM 2.5 monitoring in all stations. The monitoring and method of analysis are according to the National Ambient Air Quality Standards (NAAQS). The details of ambient air monitoring stations with respect to location, category and data are provided in the ensuing pages.

Directory 2019
Kerala State Pollution Control Board
274
274
11.1. thiruVananthaPuram diStrict
National Ambient Air Quality Network
11.1.1. Monitoring Location : Filatex, Veli, Station code -357 Type : Industrial
Latitude : 8030’16.9”N
Longitude : 76053’47”E
Air Parameters monitored : Sulphur Dioxide (SO2), Nitrogen Oxides (NOx), Respirable Suspended Particulate Matter (RSPM) .

Directory 2019 275
Kerala State Pollution Control Board
11.1.1 Thiruvananthapuram Category: Industrial
Ambient Air Quality Trend 2019Filatex-Veli-Stn Code:357
n: number of days monitoring conductedµg/m³ : microgram per cubic metre
Trend Analysis 2010-2019
Parameter Sulphur dioxide μg/m³ Nitrogen Dioxide μg/m³ Respirable Suspended Particulate matter μg/m³
24 h ave Limit :80 μg/m³ ,max 80 μg/m³ ,max 100 μg/m³ ,max
Mon Mean StDev Minm Maxim n Mean StDev Minm Maxim n Mean StDev Minm Maxim n
Jan 15.46 1.18 13.10 16.50 10 26.20 1.50 22.70 27.80 10 55 7 47 66 10
Feb 13.20 0.80 12.10 14.10 9 25.86 2.98 19.70 28.50 9 50 7 41 60 9
Mar 22.02 4.35 13.60 28.50 10 30.06 4.83 24.10 39.50 10 54 7 46 68 10
Apr 10.25 1.38 8.50 12.10 6 15.92 2.38 13.60 18.90 6 40 10 23 51 6
May 7.77 0.84 6.70 9.00 11 17.67 2.01 12.80 20.40 11 36 5 26 47 11
Jun 6.48 0.65 5.80 7.40 8 15.45 2.01 13.50 19.50 8 35 4 29 41 8
Jul 6.51 0.66 5.80 7.70 10 11.95 1.74 9.80 16.50 10 37 8 26 52 10
Aug 7.14 1.31 5.90 10.00 9 12.81 0.87 11.40 14.10 9 35 4 30 44 9
Sep 7.03 0.81 5.90 8.40 8 12.18 0.58 11.40 13.20 8 35 3 31 40 8
Oct 6.77 1.18 5.50 8.20 7 11.31 1.14 10.20 13.30 7 44 11 33 63 7
Nov 7.72 1.18 6.30 9.80 9 12.76 0.83 11.60 14.10 9 42 9 27 52 9
Dec 7.35 0.67 6.50 8.30 8 13.50 0.86 12.30 15.10 8 47 12 31 58 8
Annual Average 9.81 μg/m³ 17.14 μg/m³ 43 μg/m³
Limit : 50 μg/m³ , max 40 μg/m³ , max 60 μg/m³ ,max
0
10
20
30
40
50
60
70
2010 2011 2012 2013 2014 2015 2016 2017 2018 2019 LIMIT
SO2
NOX
RSPM
2010 2011 2012 2013 2014 2015 2016 2017 2018 2019 LIMIT
SO2 6.33 6.65 6.56 6.78 6.86 7.35 17.6 16.7 16.38 9.81 30
NOX 25.36 24.64 22.27 22.96 22.27 25.04 24.04 26.45 24.82 17.14 40
RSPM 49.13 49.15 50.93 51.26 51.26 53 53 51 54 43 60

Directory 2019
Kerala State Pollution Control Board
276
276
11.1.2 Monitoring Location : SMV School, Over Bridge, Station code :181 Type : Sensitive
Latitude : 8029’20”N
Longitude : 76056’53.3”E
Air Parameters monitored : Sulphur Dioxide (SO2), Nitrogen Oxides (NOx), Respirable Suspended Particulate Matter (RSPM)

Directory 2019 277
Kerala State Pollution Control Board
11.1.2 SMV School, Over Bridge Category: Sensitive
SMV School-Stn Code:181Ambient Air Quality Data - 2019
n: number of days monitoring conductedµg/m³ : microgram per cubic metre
Parameter Sulphur dioxide µg/m³ Nitrogen Dioxide µg/m³Respirable Suspended Particulate
matter µg/m³
24 h ave Limit :80 µg/m³ ,max 80 µg/m³ ,max 100 µg/m³ ,max
Mon Mean StDev Minm Maxim n Mean StDev Minm Maxim n Mean StDev Minm Maxim n
Jan 6.17 0.33 5.70 6.60 10 16.26 0.70 15.20 17.30 10 52 7 42 68 10
Feb 13.86 1.25 12.50 16.60 9 25.96 2.87 20.70 29.60 9 48 8 41 64 9
Mar 16.99 3.72 11.40 22.20 10 25.30 4.16 15.70 31.60 10 49 9 36 65 10
Apr 10.57 2.17 8.80 14.30 6 16.52 2.77 12.20 20.30 6 42 6 33 50 6
May 8.00 0.94 6.80 9.90 11 17.80 1.55 15.50 19.70 11 39 6 32 50 11
Jun 6.94 0.95 5.30 8.00 8 16.36 2.49 13.00 20.70 8 38 7 31 51 8
Jul 6.63 0.84 5.40 7.80 10 10.13 3.05 4.50 12.40 10 41 11 30 61 10
Aug 6.98 0.71 5.40 7.80 9 12.92 0.91 11.50 14.10 9 37 6 29 46 9
Sep 7.79 0.58 7.00 8.70 8 12.76 0.59 11.50 13.40 8 35 3 31 38 8
Oct 6.03 1.15 4.20 7.70 7 11.10 1.43 9.30 12.80 7 38 3 36 44 7
Nov 7.69 1.35 5.90 10.00 9 12.66 1.14 11.00 14.30 9 39 5 28 46 9
Dec 7.76 1.22 5.7 9.2 8 14.03 2.18 11.7 18.8 8 44 8 30 53 8
Annual Average8.78 μg/m³ 15.98 μg/m³ 42 μg/m³
Limit : 50 μg/m³ , max 40 μg/m³ , max 60 μg/m³ ,max
Trend Analysis 2010-2019
0
10
20
30
40
50
60
70
2010 2011 2012 2013 2014 2015 2016 2017 2018 2019 LIMIT
SO2
NOX
RSPM
2010 2011 2012 2013 2014 2015 2016 2017 2018 2019 LIMIT
SO2 6.74 6.9 6.96 7.06 7.68 7.82 7.79 7.78 6.7 8.78 20
NOX 27.19 27.39 23.6 24.18 24.65 26.14 26.42 26.04 24.23 15.98 30
RSPM 56.2 56.68 54.03 53.53 51.64 56 53 49 48 42 60

Directory 2019
Kerala State Pollution Control Board
278
278
11.1.3. Monitoring Location : Cosmopolitan Hospital, Murinjapalam Station code : 419
Type : Sensitive
Latitude : 8031’1.4”N
Longitude : 76056’8.4”E
Air Parameters monitored : Sulphur Dioxide (SO2), Nitrogen Oxides (NOx), Respirable Suspended Particulate Matter (RSPM)

Directory 2019 279
Kerala State Pollution Control Board
11. 1.3. Cosmopolitan Hospital, Murinjapalam Category: Sensitive
n: number of days monitoring conductedµg/m³ : microgram per cubic metre
COSMOPOLITAN HOSPITAL-Stn Code 419Ambient Air Quality Data - 2019
Parameter Sulphur dioxide µg/m³ Nitrogen Dioxide µg/m³ Respirable Suspended Particulate matter µg/m³
24 h ave Limit :80 µg/m³ ,max 80 µg/m³ ,max 100 µg/m³ ,max
Mon Mean StDev Minm Maxim n Mean StDev Minm Maxim n Mean StDev Minm Maxim n
Jan 6.83 0.54 6.10 7.60 10 11.68 0.81 10.90 13.00 10 53 7 44 65 10
Feb 12.82 1.34 9.70 14.30 9 23.99 4.98 13.40 28.60 9 50 9 37 63 9
Mar 7.72 1.31 6.00 9.90 10 11.98 1.80 7.70 14.00 10 43 3 40 48 10
Apr 10.57 0.93 9.30 11.90 6 13.03 1.68 9.90 14.70 6 34 10 22 48 6
May 8.04 0.95 6.40 9.60 11 18.20 1.92 15.50 22.40 11 35 6 27 43 11
Jun 6.73 1.11 5.20 8.10 8 15.71 2.84 12.90 21.00 8 34 3 30 41 8
Jul 7.26 0.83 5.90 8.20 10 12.55 4.94 4.50 24.70 10 34 6 26 44 10
Aug 7.10 1.00 5.30 8.70 9 12.27 1.32 10.60 14.20 9 36 5 31 45 9
Sep 7.24 0.97 5.60 8.50 8 12.43 0.64 11.60 13.30 8 35 4 31 43 8
Oct 6.83 2.76 3.00 12.00 7 11.31 1.52 8.60 13.50 7 40 5 35 49 7
Nov 7.72 1.31 6.00 9.90 9 11.98 1.80 7.70 14.00 9 43 3 38 48 9
Dec 7.36 0.78 6.4 8.3 8 13.18 1.88 11.8 17.7 8 49 6 44 59 8
Annual Average6.24 μg/m³ 14.03 μg/m³ 40 μg/m³
Limit : 50 μg/m³ , max 40 μg/m³ , max 60 μg/m³ ,max
Trend Analysis 2010-2019
2010 2011 2012 2013 2014 2015 2016 2017 2018 2019 LIMIT
SO2 6.44 6.5 7.33 6.92 6.87 7.32 7.3 7.48 5.75 6.24 20
NOX 25.87 25.73 22.38 22.64 23.25 25.59 25.84 25.47 21.58 14.03 30
RSPM 50.33 51.05 52.66 52.08 50.35 55 53 48 45 40 60
0
10
20
30
40
50
60
70
2010 2011 2012 2013 2014 2015 2016 2017 2018 2019 LIMIT
SO2
NOX
RSPM

Directory 2019
Kerala State Pollution Control Board
280
280
11.1.4. Monitoring Location : Plamoodu Station code : 358 Type : Residential & Others
Latitude : 80 30’49.6”N
Longitude : 76066’45.2”E
Air Parameters monitored : Sulphur Dioxide (SO2), Nitrogen Oxides (NOx), Respirable Suspended Particulate Matter (RSPM)

Directory 2019 281
Kerala State Pollution Control Board
11. 1. 4. Plamoodu Category: Residential
Plamoodu-Stn Code:358Ambient Air Quality Data - 2019
Parameter Sulphur dioxide µg/m³ Nitrogen Dioxide µg/m³ Respirable Suspended Particulate matter µg/m³
24 h ave Limit :80 µg/m³ ,max 80 µg/m³ ,max 100 µg/m³ ,max
Mon Mean StDev Minm Maxim n Mean StDev Minm Maxim n Mean StDev Minm Maxim n
Jan 6.94 0.38 6.40 7.50 9 23.00 0.87 21.90 24.70 9 53 3 49 56 9
Feb 12.37 1.81 9.70 14.80 9 22.91 5.21 13.40 28.90 9 48 5 42 55 9
Mar 11.28 3.22 7.90 17.70 10 23.90 6.71 15.30 33.70 10 49 5 42 58 10
Apr 10.07 1.70 7.10 11.70 6 13.73 2.80 8.80 16.60 6 39 4 33 43 6
May 8.15 0.89 7.00 9.80 11 18.10 2.73 13.30 22.90 11 40 5 28 48 11
Jun 7.46 1.04 5.70 8.80 8 16.90 1.92 14.80 21.00 8 33 3 29 38 8
Jul 6.68 0.70 5.20 7.60 10 10.36 2.38 4.50 12.70 10 36 6 26 45 10
Aug 6.90 1.55 5.20 9.60 9 12.36 1.16 10.60 13.50 9 38 6 31 49 9
Sep 6.90 0.57 6.10 7.60 8 12.35 0.47 11.90 13.30 8 35 4 30 43 8
Oct 7.07 2.27 3.80 10.80 7 11.79 1.12 10.40 13.50 7 39 8 31 53 7
Nov 7.93 2.05 5.40 11.50 9 12.62 1.68 10.80 16.20 9 42 11 26 57 9
Dec 7.01 0.80 5.6 8.2 8 14.13 2.22 12.5 19.3 8 45 9 32 57 8
Annual Average8.23 μg/m³ 16.01 μg/m³ 41 μg/m³
Limit : 50 μg/m³ , max 40 μg/m³ , max 60 μg/m³ ,max
n: number of days monitoring conductedµg/m³ : microgram per cubic metre
Trend Analysis 2010-2019
0
10
20
30
40
50
60
70
2010 2011 2012 2013 2014 2015 2016 2017 2018 2019 LIMIT
SO2
NOX
RSPM
2010 2011 2012 2013 2014 2015 2016 2017 2018 2019 LIMIT
SO2 6.33 6.65 6.56 6.78 6.86 7.35 7.36 7.7 7.49 8.23 30
NOX 25.36 24.64 22.27 22.96 22.27 25.04 24.99 26.13 23.67 16.01 40
RSPM 49.13 49.15 50.93 51.26 51.26 53 51 49 50 41 60

Directory 2019
Kerala State Pollution Control Board
282
282
11.2..1. Monitoring Location : Kadappakkada, Station code : 621 Type : Residential & Others
Latitude : 80 88.445 N
Longitude : 760 58.347 E
Air Parameters monitored : Sulphur Dioxide (SO2), Nitrogen Oxides (NOx), Respirable Suspended Particulate Matter (RSPM)
11.2. koLLam diStrict

Directory 2019 283
Kerala State Pollution Control Board
11.2.1 KSPCB, DO, Kadapakkada Categor y: Residential & Others
KADAPPAKKADA-Stn Code: 621Ambient Air Quality Data - 2019
Parameter Sulphur dioxide µg/m³ Nitrogen Dioxide µg/m³ Respirable Suspended Particulate matter µg/m³
24 h ave Limit :80 µg/m³ ,max 80 µg/m³ ,max 100 µg/m³ ,max
Mon Mean StDev Minm Maxim n Mean StDev Minm Maxim n Mean StDev Minm Maxim n
Jan 2.00 0.00 2.00 2.00 10 4.50 0.00 4.50 4.50 10 45.37 2.65 40.67 49.67 10
Feb 2.00 0.00 2.00 2.00 10 4.50 0.00 4.50 4.50 10 42.63 3.28 34.33 46.00 10
Mar 2.00 0.00 2.00 2.00 10 4.50 0.00 4.50 4.50 10 45.40 2.00 41.67 48.30 10
Apr 2.00 0.00 2.00 2.00 8 4.50 0.00 4.50 4.50 8 46.50 1.93 45.00 50.00 8
May 2.00 0.00 2.00 2.00 9 4.50 0.00 4.50 4.50 9 46.67 2.00 44.00 50.00 9
Jun 2.00 0.00 2.00 2.00 9 4.50 0.00 4.50 4.50 9 41.11 4.08 32.00 46.00 9
Jul 2.57 0.38 2.00 2.90 10 4.66 0.34 4.50 5.30 10 45.20 1.62 43.00 48.00 10
Aug 2.58 0.33 2.00 2.90 9 4.84 0.55 4.50 6.00 9 46.22 1.79 44.00 49.00 9
Sep 2.44 0.34 2.00 2.90 8 4.50 0.00 4.50 4.50 8 45.88 1.25 44.00 38.67 8
Oct 2.19 0.16 2.00 2.30 8 5.35 1.15 4.50 8.00 8 45.00 1.51 43.00 48.00 8
Nov 2.21 0.24 2.00 2.70 9 4.86 0.58 4.50 6.10 9 44.78 1.64 42.00 47.00 9
Dec 2.24 0.13 2.00 2.30 10 4.90 0.42 4.50 5.30 10 45.00 1.70 42.00 47.00 10
Annual Average2.19 μg/m³ 4.68 μg/m³ 45 μg/m³
Limit : 50 μg/m³ , max 40 μg/m³ , max 60 μg/m³ ,max
n: number of days monitoring conductedµg/m³ : microgram per cubic metre
Trend Analysis 2010-2019
0
10
20
30
40
50
60
70
2010 2011 2012 2013 2014 2015 2016 2017 2018 2019 LIMIT
SO2
NOX
RSPM
2010 2011 2012 2013 2014 2015 2016 2017 2018 2019 LIMIT
SO2 3.47 3.64 4.66 5.34 3.76 4.46 4.04 2.34 2.11 2.19 50
NOX 9.96 17.27 19.01 14.63 9.49 10.03 7.46 4.5 4.45 4.68 40
RSPM 30.97 57.25 42.51 39.71 33.82 47 45 39 45 45 60

Directory 2019
Kerala State Pollution Control Board
284
284
11.2.2 Monitoring Location : KMML, Chavara, Kollam, Station code ; 620 Type : Industrial
Latitude : 090 00.189 N
Longitude : 760 53.347 E
Air Parameters monitored : Sulphur Dioxide (SO2), Nitrogen Oxides (NOx), Respirable Suspended Particulate Matter (RSPM)

Directory 2019 285
Kerala State Pollution Control Board
11 .2. 2 KMML, Chavara Category: Industrial
KMML-CHAVARA-620Ambient Air Quality Data - 2019
Parameter Sulphur dioxide µg/m³ Nitrogen Dioxide µg/m³ Respirable Suspended Particulate matter µg/m³
24 h ave Limit :80 µg/m³ ,max 80 µg/m³ ,max 100 µg/m³ ,max
Mon Mean StDev Minm Maxim n Mean StDev Minm Maxim n Mean StDev Minm Maxim n
Jan 2.89 0.36 2.40 3.28 10 6.15 0.69 5.25 7.08 10 44 3 40 49 10
Feb 2.81 0.34 2.40 3.45 10 5.65 0.60 4.50 6.30 10 44 2 40 47 10
Mar 3.05 0.26 2.88 3.53 10 6.25 0.26 6.03 6.90 10 46 3 41 50 10
Apr 3.09 0.23 2.90 3.50 7 6.30 0.36 6.10 7.10 7 46 1 45 48 7
May 3.03 0.33 2.40 3.50 9 6.14 0.30 5.40 6.40 9 46 2 44 50 9
Jun 3.16 0.49 2.40 4.10 9 6.40 0.59 5.40 7.19 9 45 3 42 51 9
Jul 4.11 0.50 3.50 4.90 10 7.18 0.81 6.10 8.90 10 45 1 43 47 10
Aug 3.47 0.47 2.90 4.30 9 6.69 0.76 5.30 7.70 9 48 3 45 55 9
Sep 3.26 0.28 2.50 3.50 8 6.06 0.57 5.30 7.10 8 52 15 45 89 8
Oct 3.45 0.45 2.70 4.10 8 7.60 0.63 6.80 8.50 8 47 1 45 48 8
Nov 3.78 0.37 3.20 4.50 9 7.52 1.23 5.40 9.30 9 46 2 42 49 9
Dec 3.9 0.41 3.3 4.4 10 7.15 0.56 6.2 8.1 10 46 1.6 43 48 10
Annual Average3.33 μg/m³ 6.60 μg/m³ 46μg/m³
Limit : 50 μg/m³ , max 40 μg/m³ , max 60 μg/m³ ,max
n: number of days monitoring conductedµg/m³ : microgram per cubic metre
Trend Analysis 2010-2019
2010 2011 2012 2013 2014 2015 2016 2017 2018 2019 LIMIT
SO2 2.08 3.28 4.07 3.22 5.33 5.52 4.07 3.39 3.07 3.33 50
NOX 18.76 22.14 19.62 8.05 11.38 10.12 7.59 6.45 6.23 6.59 40
RSPM 57.88 51.06 39.48 32.18 35.89 44 46 47 49 46 60
0
10
20
30
40
50
60
70
2010 2011 2012 2013 2014 2015 2016 2017 2018 2019 LIMIT
SO2
NOX
RSPM

Directory 2019
Kerala State Pollution Control Board
286
286
11.3.1 Monitoring Location : Makkamkunnu, Station code : 619 Type : Residential & Others
Latitude : 90 26’708’’N
Longitude : 760 78’257’’E
Air Parameters monitored : Sulphur Dioxide (SO2), Nitrogen Oxides (NOx), Respirable Suspended Particulate Matter (RSPM)
11.3. Pathanamthitta diStrict

Directory 2019 287
Kerala State Pollution Control Board
11.3.1 Makkamkunnu Category: Residential & Others
Makkamkunnu-Stn Code:619Ambient Air Quality Data - 2019
Parameter Sulphur dioxide µg/m³ Nitrogen Dioxide µg/m³ Respirable Suspended Particulate matter µg/m³
24 h ave Limit :80 µg/m³ ,max 80 µg/m³ ,max 100 µg/m³ ,max
Mon Mean StDev Minm Maxim n Mean StDev Minm Maxim n Mean StDev Minm Maxim n
Jan 2.00 0.00 2.00 2.00 10 17.91 0.38 17.30 18.50 10 36 1 34 37 10
Feb 2.00 0.00 2.00 2.00 10 17.64 0.28 17.30 18.00 10 36 1 35 37 10
Mar 2.00 0.00 2.00 2.00 10 17.88 0.31 17.50 18.40 10 34 1 33 36 10
Apr 2.00 0.00 2.00 2.00 8 17.95 0.64 17.10 18.90 8 34 0 33 34 8
May 2.00 0.00 2.00 2.00 8 18.25 0.23 18.00 18.60 8 33 1 31 34 8
Jun 2.00 0.00 2.00 2.00 9 15.70 1.55 14.00 18.00 9 32 1 30 33 9
Jul 2.00 0.00 2.00 2.00 10 16.45 1.18 14.90 18.00 10 32 1 31 33 10
Aug 2.00 0.00 2.00 2.00 9 16.29 1.08 15.20 18.00 9 32 1 31 33 9
Sep 2.00 0.00 2.00 2.00 8 16.49 0.77 15.50 18.00 8 33 1 32 34 8
Oct 2.00 0.00 2.00 2.00 8 15.45 1.33 14.10 18.00 8 34 1 32 35 8
Nov 2.00 0.00 2.00 2.00 8 16.51 0.90 15.50 18.00 8 33 1 32 34 8
Dec 2.00 0.00 2.00 2.00 10 15.96 1.59 14.1 18 10 33 1 32 35 10
Annual Average2.00 μg/m³ 16.87 μg/m³ 34 μg/m³
Limit : 50 μg/m³ , max 40 μg/m³ , max 60 μg/m³ ,max
n: number of days monitoring conductedµg/m³ : microgram per cubic metre
Trend Analysis 2010-2019
2010 2011 2012 2013 2014 2015 2016 2017 2018 2019 LIMIT
SO2 2 2 2 2.00 2.00 2.00 2 2 2.00 2.00 50
NOX 13.44 13.13 15.02 13.38 12.36 13.68 14.88 15.94 15.39 16.87 40
RSPM 27.25 22.2 23.33 23.33 22.2 24 26 28 32 34 60
0
10
20
30
40
50
60
70
2010 2011 2012 2013 2014 2015 2016 2017 2018 2019 LIMIT
SO2
NOX
RSPM

Directory 2019
Kerala State Pollution Control Board
288
288
11.3.2 Monitoring Location : Thiruvalla, Station code : Nil Type : Residential & Others
Latitude : 90 38’345’’N
Longitude : 76057’ 406’’E
Air Parameters monitored : Sulphur Dioxide (SO2), Nitrogen Oxides (NOx), Respirable Suspended Particulate Matter (RSPM)

Directory 2019 289
Kerala State Pollution Control Board
11.3.2 Thiruvalla Category: Residential & Others
Thiruvalla-Stn Code:NilAmbient Air Quality Data - 2019
Parameter Sulphur dioxide µg/m³ Nitrogen Dioxide µg/m³ Respirable Suspended Particulate matter µg/m³
24 h ave Limit :80 µg/m³ ,max 80 µg/m³ ,max 100 µg/m³ ,max
Mon Mean StDev Minm Maxim n Mean StDev Minm Maxim n Mean StDev Minm Maxim n
Jan 0 0 0
Feb 0 0 0
Mar 2.00 0.00 2.00 2.00 7 17.56 0.28 17.30 18.00 7 35 1 34 35 7
Apr 2.00 0.00 2.00 2.00 8 17.74 0.21 17.40 18.00 8 33 1 32 35 8
May 2.00 0.00 2.00 2.00 8 18.84 0.27 18.40 19.20 8 38 1 36 40 8
Jun 2.00 0.00 2.00 2.00 9 16.14 0.92 14.30 17.00 9 34 1 32 35 9
Jul 2.00 0.00 2.00 2.00 10 16.97 0.76 15.90 18.10 10 34 1 32 35 10
Aug 2.00 0.00 2.00 2.00 9 16.81 0.59 15.90 17.90 9 35 1 32 36 9
Sep 2.00 0.00 2.00 2.00 8 16.36 0.43 15.80 16.80 8 35 1 32 36 8
Oct 2.00 0.00 2.00 2.00 8 16.20 0.73 15.10 17.10 8 35 1 32 37 8
Nov 2.00 0.00 2.00 2.00 9 16.31 0.73 15.00 17.00 9 36 2 32 39 9
Dec 2.00 0.00 2.00 2.00 10 16.13 0.47 15.2 16.7 10 35 1 32 37 10
Annual Average2.00 μg/m³ 16.91 μg/m³ 35 μg/m³
Limit : 50 μg/m³ , max 40 μg/m³ , max 60 μg/m³ ,max
n: number of days monitoring conductedµg/m³ : microgram per cubic metre

Directory 2019
Kerala State Pollution Control Board
290
290
11.4.1. Monitoring Location : William goodacre, Pathirapally, Station code : 1002 Type : Commercial
Latitude : 090 49’865’’ N
Longitude : 76032’838’’E
Air Parameters monitored : Sulphur Dioxide (SO2), Nitrogen Oxides (NOx), Respirable Suspended Particulate Matter (RSPM)
11.4 aLaPPuzha diStrict

Directory 2019 291
Kerala State Pollution Control Board
11.4.1. WILLIAM GOODACRE Category: Commercial
William Goodacre-Stn Code:1002Ambient Air Quality Data - 2019
n: number of days monitoring conductedµg/m³ : microgram per cubic metre
Parameter Sulphur dioxide µg/m³ Nitrogen Dioxide µg/m³ Respirable Suspended Particulate matter µg/m³
24 h ave Limit :80 µg/m³ ,max 80 µg/m³ ,max 100 µg/m³ ,max
Mon Mean StDev Minm Maxim n Mean StDev Minm Maxim n Mean StDev Minm Maxim n
Jan 2.00 0.00 2.00 2.00 10 4.50 0.00 4.50 4.50 10 64 11 37 74 10
Feb 2.00 0.00 2.00 2.00 10 4.50 0.00 4.50 4.50 10 67 6 59 77 10
Mar 2.00 0.00 2.00 2.00 5 4.50 0.00 4.50 4.50 5 74 6 69 84 5
Apr
May 2.37 0.61 2.00 3.70 9 6.67 0.64 5.90 7.90 9 64 8 50 75 9
Jun 2.00 0.00 2.00 2.00 9 4.50 0.00 4.50 4.50 9 64 14 47 84 9
Jul 2.51 1.13 2.00 5.30 10 5.28 1.20 4.50 8.00 10 55 9 41 64 10
Aug 2.58 1.63 2.00 6.60 9 5.51 1.78 4.50 10.00 9 46 3 40 49 9
Sep 2.00 0.00 2.00 2.00 8 5.31 1.47 4.50 8.70 8 49 2 47 52 8
Oct 2.00 0.00 2.00 2.00 8 4.50 0.00 4.50 4.50 8 45 3 40 49 8
Nov 2.00 0.00 2.00 2.00 8 4.50 0.00 4.50 4.50 8 45 2 40 48 8
Dec 2.00 0.00 2.00 2.00 10 5.23 1.27 4.50 8.40 10 52 5 40 58 10
Annual Average2.13 μg/m³ 5.00 μg/m³ 57 μg/m³
Limit : 50 μg/m³ , max 40 μg/m³ , max 60 μg/m³ ,max
Trend Analysis 2010-2019
2010 2011 2012 2013 2014 2015 2016 2017 2018 2019 LIMIT
SO2 2 2 2 2 2 2 2 2 2 2.18 50
NOX 4.6 4.5 4.5 4.5 4.5 4.5 4.5 4.5 4.5 5.19 40
RSPM 39.64 39.5 45.27 47.24 44.16 43 43 52 45 53 60
0
10
20
30
40
50
60
70
2010 2011 2012 2013 2014 2015 2016 2017 2018 2019 LIMIT
SO2
NOX
RSPM

Directory 2019
Kerala State Pollution Control Board
292
292
11.4.2. Monitoring Location : Thondamkulangara, Station code 618 Type : Residential
Latitude : 090 50’650’’ N
Longitude : 760 34’ 302’’ E
Air Parameters monitored : Sulphur Dioxide (SO2), Nitrogen Oxides (NOx), Respirable Suspended Particulate Matter (RSPM)

Directory 2019 293
Kerala State Pollution Control Board
11.4.2. Thondamkulangara Category: Residential
District Office -Alappuzha-Stn Code:618Ambient Air Quality Data - 2019
Parameter Sulphur dioxide µg/m³ Nitrogen Dioxide µg/m³ Respirable Suspended Particulate matter µg/m³
24 h ave Limit :80 µg/m³ ,max 80 µg/m³ ,max 100 µg/m³ ,max
Mon Mean StDev Minm Maxim n Mean StDev Minm Maxim n Mean StDev Minm Maxim n
Jan 2.00 0.00 2.00 2.00 10 4.50 0.00 4.50 4.50 10 53 17 23 75 10
Feb 2.00 0.00 2.00 2.00 10 4.50 0.00 4.50 4.50 10 62 7 51 75 10
Mar 2.00 0.00 2.00 2.00 10 4.50 0.00 4.50 4.50 10 61 13 39 84 10
Apr 2.00 0.00 2.00 2.00 8 4.50 0.00 4.50 4.50 8 57 10 48 74 8
May 2.00 0.00 2.00 2.00 9 4.50 0.00 4.50 4.50 9 53 14 32 73 9
Jun 2.00 0.00 2.00 2.00 9 4.50 0.00 4.50 4.50 9 43 13 24 58 9
Jul 2.00 0.00 2.00 2.00 9 4.50 0.00 4.50 4.50 9 40 9 28 55 9
Aug 2.00 0.00 2.00 2.00 9 4.50 0.00 4.50 4.50 9 45 3 39 49 9
Sep 2.00 0.00 2.00 2.00 8 4.50 0.00 4.50 4.50 8 42 2 40 45 8
Oct 2.00 0.00 2.00 2.00 8 4.50 0.00 4.50 4.50 8 40 3 35 45 8
Nov 2.00 0.00 2.00 2.00 8 4.50 0.00 4.50 4.50 8 40 2 37 43 8
Dec 2.00 0.00 2.00 2.00 10 4.50 0.00 4.50 4.50 10 43 2 39 46 10
Annual Average2.00 μg/m³ 4.50 μg/m³ 48 μg/m³
Limit : 50 μg/m³ , max 40 μg/m³ , max 60 μg/m³ ,max
n: number of days monitoring conductedµg/m³ : microgram per cubic metre
Trend Analysis 2010-2019
2010 2011 2012 2013 2014 2015 2016 2017 2018 2019 LIMIT
SO2 2 2 2 2 2 2 2 2 2 2 50
NOX 4.6 4.5 4.5 4.5 4.5 4.5 4.5 4.5 4.5 4.5 40
RSPM 39.64 39.5 45.27 47.24 44.16 43 43 52 45 48 60
0
10
20
30
40
50
60
70
2010 2011 2012 2013 2014 2015 2016 2017 2018 2019 LIMIT
SO2
NOX
RSPM

Directory 2019
Kerala State Pollution Control Board
294
294
11..5. 1. Monitoring Location : Nagampadom, Station code : 187 Type : Residential & Others
Latitude : 090 59’456’’ N
Longitude : 760 51’972’’ E
Air Parameters monitored : Sulphur Dioxide (SO2), Nitrogen Oxides (NOx), Respirable Suspended Particulate Matter (RSPM)
11.5 kottayam diStrict

Directory 2019 295
Kerala State Pollution Control Board
11.5.1. Nagampadom Category: Residential & Others
Nagampadam-Stn Code:187Ambient Air Quality Data - 2019
Parameter Sulphur dioxide µg/m³ Nitrogen Dioxide µg/m³ Respirable Suspended Particulate matter µg/m³
24 h ave Limit :80 µg/m³ ,max 80 µg/m³ ,max 100 µg/m³ ,max
Mon Mean StDev Minm Maxim n Mean StDev Minm Maxim n Mean StDev Minm Maxim n
Jan 2.70 0.00 2.70 2.70 10 12.22 0.11 12.00 12.40 10 41 5 36 50 10
Feb 2.63 0.15 2.30 2.70 10 12.28 0.12 12.10 12.50 10 42 4 35 47 10
Mar 2.99 0.11 2.70 3.10 10 12.92 0.21 12.60 13.20 10 46 2 41 50 10
Apr 2.73 0.22 2.30 3.00 8 12.69 0.16 12.40 12.90 8 42 6 32 49 8
May 2.40 0.32 2.00 2.70 9 12.63 0.30 12.30 13.10 9 45 5 34 50 9
Jun 2.04 0.13 2.00 2.40 9 12.40 0.12 12.20 12.60 9 44 2 41 46 9
Jul 2.08 0.17 2.00 2.40 10 12.37 0.13 12.10 12.50 10 37 4 33 45 10
Aug 2.09 0.18 2.00 2.40 9 12.42 0.07 12.30 12.50 9 34 4 27 41 9
Sep 2.24 0.27 2.00 2.70 8 12.35 0.12 12.20 12.50 8 32 3 28 38 8
Oct 2.19 0.27 2.00 2.70 8 12.25 0.11 12.10 12.40 8 33 4 27 38 8
Nov 2.49 0.24 2.00 2.70 9 12.23 0.09 12.10 12.40 9 45 4 38 52 9
Dec 2.16 0.21 2.00 2.40 10 12.48 0.11 12.30 12.70 10 44 4 39 50 10
Annual Average2.40 µg/m³ 12.44 µg/m³ 40 µg/m³
Limit : 50 µg/m³ , max 40 µg/m³ , max 60 µg/m³ ,max
n: number of days monitoring conductedµg/m³ : microgram per cubic metre
Trend Analysis 2010-2019
0
10
20
30
40
50
60
70
2010 2011 2012 2013 2014 2015 2016 2017 2018 2019 LIMIT
SO2
NOX
RSPM
2010 2011 2012 2013 2014 2015 2016 2017 2018 2019 LIMIT
SO2 4.94 4.42 6.17 6.93 6.11 5.24 4.13 4.42 3.16 2.4 50
NOX 14.41 12.31 14.6 18.44 20.92 21.42 15.6 14.19 12.94 12.44 40
RSPM 40.94 43.6 57.05 65.75 56.76 60 50 41 39 40 60

Directory 2019
Kerala State Pollution Control Board
296
296
11.5.2. Monitoring Location : Vadavathoor, station code : 361 Type : Industrial
Latitude : 90 59’719’’ N
Longitude : 760 56’ 399’’ E
Air Parameters monitored : Sulphur Dioxide (SO2), Nitrogen Oxides (NOx), Respirable Suspended Particulate Matter (RSPM)

Directory 2019 297
Kerala State Pollution Control Board
11.5.2. Vadavathoor Category: Industrial
VADAVATHOOR-Stn Code:361Ambient Air Quality Data - 2019
Parameter Sulphur dioxide µg/m³ Nitrogen Dioxide µg/m³ Respirable Suspended Particulate matter µg/m³
24 h ave Limit :80 µg/m³ ,max 80 µg/m³ ,max 100 µg/m³ ,max
Mon Mean StDev Minm Maxim n Mean StDev Minm Maxim n Mean StDev Minm Maxim n
Jan 3.13 0.19 3.00 3.40 10 12.78 0.16 12.50 13.00 10 51 4 46 61 10
Feb 3.10 0.23 2.70 3.40 10 12.85 0.18 12.60 13.10 10 49 3 42 54 10
Mar 3.34 0.26 3.00 3.70 10 13.66 0.34 13.10 14.00 10 52 2 48 55 10
Apr 3.21 0.26 3.00 3.70 8 13.59 0.20 13.20 13.80 8 49 4 43 55 8
May 3.26 0.41 2.30 3.80 9 13.24 0.35 12.80 13.80 9 57 5 48 63 9
Jun 2.24 0.31 2.00 2.70 9 12.68 0.16 12.50 13.00 9 48 2 44 51 9
Jul 2.26 0.30 2.00 2.70 10 12.63 0.14 12.40 12.90 10 38 5 34 48 10
Aug 2.33 0.28 2.00 2.70 9 12.76 0.17 12.50 13.00 9 40 4 35 45 9
Sep 2.50 0.25 2.00 2.70 8 12.73 0.18 12.50 13.00 8 39 3 34 44 8
Oct 2.24 0.27 2.00 2.70 8 12.50 0.32 12.10 12.90 8 37 6 29 44 8
Nov 2.61 0.24 2.40 3.10 9 12.56 0.35 12.00 13.00 9 44 5 36 51 9
Dec 2.41 0.26 2.00 2.70 10 12.47 0.29 12.00 12.80 10 48 3 44 52 10
Annual Average2.72 µg/m³ 12.87 µg/m³ 46 µg/m³
Limit : 50 µg/m³ , max 40 µg/m³ , max 60 µg/m³ ,max
n: number of days monitoring conductedµg/m³ : microgram per cubic metre
Trend Analysis 2010-2019
2010 2011 2012 2013 2014 2015 2016 2017 2018 2019 LIMIT
SO2 4.94 4.42 6.17 6.93 6.11 5.24 4.6 4.85 3.44 2.72 50
NOX 14.41 12.31 14.6 18.44 20.92 21.42 17.51 14.94 13.51 12.87 40
RSPM 40.94 43.6 57.05 65.75 56.76 60 58 59 50 46 60
0
10
20
30
40
50
60
70
2010 2011 2012 2013 2014 2015 2016 2017 2018 2019 LIMIT
SO2
NOX
RSPM

Directory 2019
Kerala State Pollution Control Board
298
298
11.6.1. Monitoring Location : Thodupuzha (SAMP) Type : Commercial
Latitude : 090 54’12’’ N
Longitude : 760 42’ 39’’ E
Air Parameters monitored : Sulphur Dioxide (SO2), Nitrogen Oxides (NOx), Respirable Suspended Particulate Matter (RSPM)
11.6 idukki diStrict

Directory 2019 299
Kerala State Pollution Control Board
11.6.1. Thodupuzha Category: Commercial
Thodupuzha(SAMP)Ambient Air Quality Data - 2019
Parameter Sulphur dioxide µg/m³ Nitrogen Dioxide µg/m³ Respirable Suspended Particulate matter µg/m³
24 hr Limit :80 µg/m³ ,max 80 µg/m³ ,max 100 µg/m³ ,max
Mon Mean StDev Minm Maxim n Mean StDev Minm Maxim n Mean StDev Minm Maxim n
Jan 2.00 0.00 2.00 2.00 10 4.50 0.00 4.50 4.50 50 50 6 41 58 10
Feb 1.60 0.84 0.00 2.00 10 3.60 1.90 0.00 4.50 10 38 9 25 48 10
Mar 2.00 0.00 2.00 2.00 10 4.50 0.00 4.50 4.50 10 38 5 28 48 10
Apr 2.00 0.00 2.00 2.00 8 4.50 0.00 4.50 4.50 8 40 5 31 50 8
May 2.00 0.00 2.00 2.00 9 4.50 0.00 4.50 4.50 9 30 6 21 40 9
Jun 2.00 0.00 2.00 2.00 9 4.50 0.00 4.50 4.50 9 39 10 26 58 9
Jul 2.00 0.00 2.00 2.00 9 4.50 0.00 4.50 4.50 9 37 6 29 47 9
Aug 2.00 0.00 2.00 2.00 9 4.50 0.00 4.50 4.50 9 31 6 24 39 9
Sep 2.00 0.00 2.00 2.00 8 4.50 0.00 4.50 4.50 8 34 5 29 45 8
Oct 2.00 0.00 2.00 2.00 8 4.50 0.00 4.50 4.50 8 29 5 18 34 8
Nov 2.00 0.00 2.00 2.00 9 4.50 0.00 4.50 4.50 9 34 3 28 38 9
Dec 2.00 0.00 2.00 2.00 10 4.50 0.00 4.50 4.50 10 33 6 20 39 10
Annual Average2.00 μg/m³ 4.50 μg/m³ 36 μg/m³
Limit : 50 μg/m³ , max 40 μg/m³ , max 60 μg/m³ ,max
n: number of days monitoring conductedµg/m³ : microgram per cubic metre
Trend Analysis 2010-2019
0
10
20
30
40
50
60
70
2010 2011 2012 2013 2014 2015 2016 2017 2018 2019 LIMIT
SO2
NOX
RSPM
2010 2011 2012 2013 2014 2015 2016 2017 2018 2019 LIMIT
SO2 2.08 2.64 2 2.00 2.00 2.00 2 2 2 2 50
NOX 12.14 8.15 6.5 4.50 4.50 4.50 4.5 4.5 4.5 4.5 40
RSPM 22.34 16.99 15.23 14.79 16.35 29 35 34 42 36 60

Directory 2019
Kerala State Pollution Control Board
300
300
11.7. 1. Monitoring Location : Methanam (Eloor I), Station code : 149 Type : Commercial
Latitude : 100 07’ 969’’N
Longitude : 760 29’ 676’’E
Air Parameters monitored : Sulphur Dioxide (SO2), Nitrogen Oxides (NOx), Respirable Suspended Particulate Matter (RSPM)
11.7 ernakuLam diStrict

Directory 2019 301
Kerala State Pollution Control Board
11.7.1. Eloor - Methanam Category: Commercial
Methanam-Eloor I-Stn Code:149Ambient Air Quality Data - 2019
Parameter Sulphur dioxide µg/m³ Nitrogen Dioxide µg/m³ Respirable Suspended Particulate matter µg/m³
24 h ave Limit :80 µg/m³ ,max 80 µg/m³ ,max 100 µg/m³ ,max
Mon Mean StDev Minm Maxim n Mean StDev Minm Maxim n Mean StDev Minm Maxim n
Jan 3.00 0.00 3.00 3.00 10 21.26 2.49 17.78 26.37 10 90 20 43 119 10
Feb 3.40 0.52 3.00 4.00 10 20.13 3.38 16.59 28.35 10 83 24 56 144 10
Mar 2.56 0.73 2.00 4.00 9 17.70 5.90 5.72 26.29 9 59 11 43 76 9
Apr 3.00 1.07 2.00 5.00 8 19.64 3.41 15.63 25.00 8 54 10 42 72 8
May 3.22 0.83 2.00 4.00 9 21.12 4.46 15.75 30.66 9 40 4 35 45 9
Jun 2.13 0.28 2.00 2.80 9 18.00 5.00 9.00 24.00 9 34 3 31 40 9
Jul 2.00 0.00 2.00 2.00 9 14.44 2.88 12.00 21.00 9 31 1 30 33 9
Aug 2.11 0.33 2.00 3.00 9 17.67 2.69 12.00 22.00 9 30 2 27 33 9
Sep 2.38 0.52 2.00 3.00 8 17.88 4.02 13.00 24.00 8 31 2 27 33 8
Oct 2.13 0.35 2.00 3.00 8 17.50 2.45 13.00 21.00 8 30 4 27 37 8
Nov 2.22 0.67 2.00 4.00 9 16.89 2.98 10.00 20.00 9 35 5 27 42 9
Dec 2.18 0.40 2.00 3.00 11 22.18 4.17 14.00 27.00 11 51 10 39 69 11
Annual Average2.53 18.70 μg/m³ 47 μg/m³
Limit : 50 μg/m³ , max 40 μg/m³ , max 60 μg/m³ ,max
n: number of days monitoring conductedµg/m³ : microgram per cubic metre
Trend Analysis 2010-2019
2010 2011 2012 2013 2014 2015 2016 2017 2018 2019 LIMIT
SO2 2.14 2.24 2.59 2.40 2.00 2.00 2 2 2.21 2.53 50
NOX 5.69 5.04 4.65 4.58 10.46 20.1 37.45 29.43 23.17 18.7 40
RSPM 29.38 16.73 53.71 75.20 52.43 35 49 46 60 47 60
0
10
20
30
40
50
60
70
80
2010 2011 2012 2013 2014 2015 2016 2017 2018 2019 LIMIT
SO2
NOX
RSPM

Directory 2019
Kerala State Pollution Control Board
302
302
11.7.2. Monitoring Location : TCC (Eloor II) station code : 29 Type : Industrial
Latitude : 100 07’435’’N
Longitude : 76030’ 394’’E
Air Parameters monitored : Sulphur Dioxide (SO2), Nitrogen Oxides (NOx), Respirable Suspended Particulate Matter (RSPM)

Directory 2019 303
Kerala State Pollution Control Board
11.7. 2. Eloor - TCC Category: Industrial
TCC-Eloor II-Stn code:29Ambient Air Quality Data - 2019
Parameter Sulphur dioxide µg/m³ Nitrogen Dioxide µg/m³ Respirable Suspended Particulate matter µg/m³
24 h ave Limit :80 µg/m³ ,max 80 µg/m³ ,max 100 µg/m³ ,max
Mon Mean StDev Minm Maxim n Mean StDev Minm Maxim n Mean StDev Minm Maxim n
Jan 4.00 0.00 4.00 4.00 4 28.51 2.41 25.91 30.99 4 101 21 78 127 4
Feb 3.70 0.48 3.00 4.00 10 21.96 2.22 18.66 25.86 10 72 9 58 83 10
Mar 2.90 1.10 2.00 5.00 10 26.31 22.98 10.06 42.56 10 59 11 42 75 10
Apr 3.50 0.76 3.00 5.00 8 19.59 2.88 14.29 23.41 8 53 8 42 65 8
May 3.56 0.53 3.00 4.00 9 26.53 3.69 21.89 32.12 9 45 5 39 56 9
Jun 2.66 0.57 2.00 3.50 9 22.81 3.80 16.93 27.98 9 36 3 32 42 9
Jul 2.54 0.36 2.00 3.20 9 21.20 3.49 14.40 25.20 9 34 1 32 36 9
Aug 2.00 0.00 2.00 2.00 9 23.89 1.54 22.00 27.00 9 37 3 33 43 9
Sep 2.59 0.48 2.00 3.30 7 20.71 4.86 16.00 30.00 7 36 3 32 41 7
Oct 2.25 0.46 2.00 3.00 8 19.38 3.02 16.00 24.00 8 38 7 32 48 8
Nov 2.50 0.90 2.00 4.00 9 19.9 3.9 14.0 26.0 9 44 6 36 53 9
Dec 3.55 0.93 2.00 5.00 11 28.73 3.82 21.00 33.00 11 66 11 48 83 11
Annual Average2.98 μg/m³ 23.29 μg/m³ 52 μg/m³
Limit : 50 μg/m³ , max 40 μg/m³ , max 60 μg/m³ ,max
n: number of days monitoring conductedµg/m³ : microgram per cubic metre
Trend Analysis 2010-2019
0
10
20
30
40
50
60
70
80
2010 2011 2012 2013 2014 2015 2016 2017 2018 2019 LIMIT
SO2
NOX
RSPM
2010 2011 2012 2013 2014 2015 2016 2017 2018 2019 LIMIT
SO2 2.22 2.55 2.9 2.34 2.00 2.00 2 2 2.63 2.98 50
NOX 5.75 5.18 4.96 4.57 11.66 21.19 38.24 31.97 28.08 23.29 40
RSPM 29.36 18.3 69.49 70.34 55.01 45 54 56 72 52 60

Directory 2019
Kerala State Pollution Control Board
304
304
11 .7.3. Monitoring Location : Near South Overbridge, Station code : 338
Type : Commercial
Latitude : 090 96’518’’ N
Longitude : 76029’203’’ E
Air Parameters monitored : Sulphur Dioxide (SO2), Nitrogen Oxides (NOx), Respirable Suspended Particulate Matter (RSPM

Directory 2019 305
Kerala State Pollution Control Board
11.7.3. South Over bridge Category: Commercial
ERNAKULAM SOUTH OVER BRIDGE-Stn Code:338Ambient Air Quality Data - 2019
Parameter Sulphur dioxide µg/m³ Nitrogen Dioxide µg/m³ Respirable Suspended Particulate matter µg/m³
24 h ave Limit :80 µg/m³ ,max 80 µg/m³ ,max 100 µg/m³ ,max
Mon Mean StDev Minm Maxim n Mean StDev Minm Maxim n Mean StDev Minm Maxim n
Jan 2.00 0.00 2.00 2.00 9 16.64 9.41 4.50 32.40 9 69 16 37 85 9
Feb 2.00 0.00 2.00 2.00 10 16.90 7.80 5.50 30.60 10 67 14 48 91 10
Mar 2.00 0.00 2.00 2.00 9 10.53 2.85 7.20 14.80 9 49 17 26 75 9
Apr 2.00 0.00 2.00 2.00 6 10.58 4.78 4.50 16.80 6 33 8 27 46 6
May 2.00 0.00 2.00 2.00 7 8.47 4.13 4.50 15.60 7 33 10 20 52 7
Jun
Jul
Aug
Sep
Oct 2.00 0.00 2.00 2.00 4 5.45 1.37 4.50 7.40 4 34 9 22 42 4
Nov 2.00 0.00 2.00 2.00 10 17.33 7.61 5.70 31.20 10 44 7 38 56 10
Dec 2.00 0.00 2.00 2.00 10 13.80 5.58 6.90 26.30 10 55 13 26 74 10
Annual Average2.00 μg/m³ 12.46 μg/m³ 48 μg/m³
Limit : 50 μg/m³ , max 40 μg/m³ , max 60 μg/m³ ,max
n: number of days monitoring conductedµg/m³ : microgram per cubic metre
Trend Analysis 2010-2019
2010 2011 2012 2013 2014 2015 2016 2017 2018 2019 LIMIT
SO2 3.71 3.59 3.62 2.46 2.60 2.75 2.23 2.42 2.72 2.00 50
NOX 15.68 17.2 15.25 7.04 7.44 9.06 12.27 12.52 1269 12.46 40
RSPM 36 53 73 84 71 46 57 49 53 48 60
0
10
20
30
40
50
60
70
80
90
2010 2011 2012 2013 2014 2015 2016 2017 2018 2019 LIMIT
SO2
NOX
RSPM

Directory 2019
Kerala State Pollution Control Board
306
306
11.7.4. Monitoring Location : Vyttila, Station code : 562 (544) Type : Residential, Rural & Others
Latitude : 90 95’823’’ N
Longitude : 760 32’ 522’’ E
Air Parameters monitored : Sulphur Dioxide (SO2), Nitrogen Oxides (NOx), Respirable Suspended Particulate Matter (RSPM)

Directory 2019 307
Kerala State Pollution Control Board
11.7.4. Vyttila Category: Residential, Rural& Others
VYTTILA-Stn code:562Ambient Air Quality Data - 2019
Parameter Sulphur dioxide µg/m³ Nitrogen Dioxide µg/m³ Respirable Suspended Particulate matter µg/m³
24 h ave Limit :80 µg/m³ ,max 80 µg/m³ ,max 100 µg/m³ ,max
Mon Mean StDev Minm Maxim n Mean StDev Minm Maxim n Mean StDev Minm Maxim n
Jan 2.00 0.00 2.00 2.00 9 16.30 9.20 5.90 33.20 9 74 14 44 89 9
Feb 2.00 0.00 2.00 2.00 10 17.62 7.37 6.30 28.40 10 74 39 48 181 10
Mar 2.00 0.00 2.00 2.00 10 11.03 3.61 6.70 18.60 10 45 13 21 65 10
Apr 2.00 0.00 2.00 2.00 6 9.80 2.82 5.60 13.60 6 34 7 25 42 6
May 2.00 0.00 2.00 2.00 9 11.50 4.30 5.30 16.90 9 30 9 18 45 9
Jun 2.00 0.00 2.00 2.00 9 7.30 2.10 5.30 11.10 9 21 5 12 26 9
Jul 2.00 0.00 2.00 2.00 9 10.56 5.17 4.50 22.10 9 23 8 11 33 9
Aug 2.00 0.00 2.00 2.00 8 9.48 4.95 5.30 17.50 8 22 7 16 37 8
Sep 2.00 0.00 2.00 2.00 8 10.80 4.20 4.50 15.80 8 24 10 13 45 8
Oct 2.00 0.00 2.00 2.00 7 8.86 1.80 5.30 10.50 7 33 14 18 54 7
Nov 2.00 0.00 2.00 2.00 10 15.90 8.41 5.90 30.60 10 53 10 34 69 10
Dec 2.00 0.00 2.00 2.00 10 14.70 3.60 9.90 19.60 10 63 11 46 82 10
Annual Average2.00 μg/m³ 11.99 μg/m³ 41 μg/m³
Limit : 50 μg/m³ , max 40 μg/m³ , max 60 μg/m³ ,max
n: number of days monitoring conductedµg/m³ : microgram per cubic metre
Trend Analysis 2010-2019
0
10
20
30
40
50
60
70
2010 2011 2012 2013 2014 2015 2016 2017 2018 2019 LIMIT
SO2
NOX
RSPM
2010 2011 2012 2013 2014 2015 2016 2017 2018 2019 LIMIT
SO2 4.47 3.9 3.49 2.47 3.00 3.09 2.3 2.71 3.22 2.00 50
NOX 13.69 15.31 11.9 8.54 8.74 9.43 19.23 19.55 13.61 11.99 40
RSPM 41 47 60 43 66 41 52 50 51 41 60

Directory 2019
Kerala State Pollution Control Board
308
308
11.7.5. Monitoring Location : Irumpanam, Station code : 30 Type : Industrial
Latitude : 90 98’ 792’’ N
Longitude : 760 35’ 068’’ E
Air Parameters monitored : Sulphur Dioxide (SO2), Nitrogen Oxides (NOx), Respirable Suspended Particulate Matter (RSPM)

Directory 2019 309
Kerala State Pollution Control Board
11.7.5. Irumpanam Category: Industrial
IRUMPANAM-Stn Code:30Ambient Air Quality Data - 2019
Parameter Sulphur dioxide µg/m³ Nitrogen Dioxide µg/m³ Respirable Suspended Particulate matter µg/m³
24 h ave Limit :80 µg/m³ ,max 80 µg/m³ ,max 100 µg/m³ ,max
Mon Mean StDev Minm Maxim n Mean StDev Minm Maxim n Mean StDev Minm Maxim n
Jan 2.00 0.00 2.00 2.00 9 15.70 6.60 5.70 26.10 9 82 23 39 118 9
Feb 2.00 0.00 2.00 2.00 10 16.10 6.40 6.70 27.40 10 68 9 55 82 10
Mar 2.00 0.00 2.00 2.00 10 10.10 4.10 5.40 18.60 10 54 15 39 80 10
Apr 2.00 0.00 2.00 2.00 6 9.10 3.90 4.50 15.20 6 36 5 28 40 6
May 2.20 0.40 2.00 3.20 8 8.10 3.30 4.50 13.70 8 28 7 17 37 8
Jun 2.00 0.00 2.00 2.00 9 6.60 3.10 4.50 14.50 9 24 4 15 29 9
Jul 2.00 0.00 2.00 2.00 9 8.80 3.30 4.50 14.60 9 23 10 12 49 9
Aug 2.00 0.00 2.00 2.00 9 6.40 1.70 4.50 10.30 9 23 7 12 39 9
Sep 2.00 0.00 2.00 2.00 8 7.80 2.70 4.50 12.80 8 27 9 18 43 8
Oct 2.00 0.00 2.00 2.00 7 11.40 4.20 6.30 17.10 7 28 7 18 36 7
Nov 2.00 0.00 2.00 2.00 10 13.88 7.27 4.50 28.50 10 46 6 37 56 10
Dec 2.00 0.00 2.00 2.00 10 18.60 7.10 10.80 35.00 10 55 9 41 69 10
Annual Average2.02 μg/m³ 11.05 μg/m³ 41 μg/m³
Limit : 50 μg/m³ , max 40 μg/m³ , max 60 μg/m³ ,max
n: number of days monitoring conductedµg/m³ : microgram per cubic metre
Trend Analysis 2010-2019
2010 2011 2012 2013 2014 2015 2016 2017 2018 2019 LIMIT
SO2 4.06 3.16 3.45 2.39 2.73 2.66 2.28 2.44 3.19 2.02 50
NOX 11.1 12.04 10.45 4.96 5.03 5.98 13.14 13.79 10.67 11.05 40
RSPM 37.71 37.4 113.55 104.30 106.64 25 33 54 51 41 60
0
20
40
60
80
100
120
2010 2011 2012 2013 2014 2015 2016 2017 2018 2019 LIMIT
SO2
NOX
RSPM

Directory 2019
Kerala State Pollution Control Board
310
310
11.7.6. Monitoring Location : Kalamassery, Station code : 346 (546) Type : Industrial
Latitude : 100 05’021’’ N
Longitude : 760 31’ 327’’ E
Air Parameters monitored : Sulphur Dioxide (SO2), Nitrogen Oxides (NOx), Respirable Suspended Particulate Matter (RSPM)

Directory 2019 311
Kerala State Pollution Control Board
11.7.6. Kalamassery Category: Industrial
KALAMASSERY-Stn Code:346 (546)Ambient Air Quality Data - 2019
Parameter Sulphur dioxide µg/m³ Nitrogen Dioxide µg/m³ Respirable Suspended Particulate matter µg/m³
24 h ave Limit :80 µg/m³ ,max 80 µg/m³ ,max 100 µg/m³ ,max
Mon Mean StDev Minm Maxim n Mean StDev Minm Maxim n Mean StDev Minm Maxim n
Jan 2.00 0.00 2.00 2.00 7 12.00 7.10 4.50 23.30 7 37 19 16 64 7
Feb 2.00 0.00 2.00 2.00 10 13.10 4.30 8.60 21.80 10 83 17 63 120 10
Mar 2.00 0.00 2.00 2.00 10 8.00 3.50 4.50 15.40 10 58 17 38 86 10
Apr 2.00 0.00 2.00 2.00 6 8.10 1.80 5.70 10.90 6 45 19 29 76 6
May 2.00 0.00 2.00 2.00 9 8.20 3.40 4.50 15.30 9 45 12 30 71 9
Jun 2.20 0.40 2.00 3.10 9 7.60 3.70 4.50 15.60 9 37 9 17 50 9
Jul 2.00 0.00 2.00 2.00 9 8.20 2.30 4.50 11.90 9 38 8 28 50 9
Aug 2.00 0.00 2.00 2.00 8 9.40 4.60 4.50 17.40 8 28 7 17 37 8
Sep 2.00 0.00 2.00 2.00 7 10.50 4.30 4.50 15.60 7 40 12 24 62 7
Oct 2.00 0.00 2.00 2.00 7 8.70 4.00 4.50 16.40 7 41 12 29 61 7
Nov 2.00 0.00 2.00 2.00 10 12.90 8.30 4.50 31.00 10 59 12 39 77 10
Dec 2.00 0.00 2.00 2.00 12 12.90 3.50 7.10 17.80 12 61 11 35 74 12
Annual Average2.02 μg/m³ 9.97 μg/m³ 48 μg/m³
Limit : 50 μg/m³ , max 40 μg/m³ , max 60 μg/m³ ,max
n: number of days monitoring conductedµg/m³ : microgram per cubic metre
Trend Analysis 2010-2019
0
10
20
30
40
50
60
70
2010 2011 2012 2013 2014 2015 2016 2017 2018 2019 LIMIT
SO2
NOX
RSPM
2010 2011 2012 2013 2014 2015 2016 2017 2018 2019 LIMIT
SO2 5.67 3.8 3.34 2.46 2.63 2.94 2.18 2.43 3.07 2.02 50
NOX 17.04 15.2 10.85 7.14 7.30 7.92 11.01 9.21 10.55 9.97 40
RSPM 45.93 58.6 63.32 66.32 47.02 43 57 49 61 48 60

Directory 2019
Kerala State Pollution Control Board
312
312
11.7.7. Monitoring Location : M.G. Road, Station code : 147(545) Type : Commercial
Latitude : 090 96’290’’ N
Longitude : 76028’591’’ E
Air Parameters monitored : Sulphur Dioxide (SO2), Nitrogen Oxides (NOx), Respirable Suspended Particulate Matter (RSPM)

Directory 2019 313
Kerala State Pollution Control Board
11.7.7. MG Road Category: Commercial
M G ROAD-Stn Code:147 (545)Ambient Air Quality Data - 2019
Parameter Sulphur dioxide µg/m³ Nitrogen Dioxide µg/m³ Respirable Suspended Particulate matter µg/m³
24 h ave Limit :80 µg/m³ ,max 80 µg/m³ ,max 100 µg/m³ ,max
Mon Mean StDev Minm Maxim n Mean StDev Minm Maxim n Mean StDev Minm Maxim n
Jan 2.00 0.00 2.00 2.00 9 16.20 6.30 8.30 26.20 9 62 21 26 90 9
Feb 2.00 0.00 2.00 2.00 10 16.63 8.34 5.30 30.80 10 52 8 36 62 10
Mar 2.00 0.00 2.00 2.00 9 11.13 5.99 4.50 23.90 9 43 15 16 67 9
Apr 2.00 0.00 2.00 2.00 6 11.88 3.53 8.60 17.10 6 38 6 31 47 6
May 2.00 0.00 2.00 2.00 9 8.18 3.32 4.50 14.90 9 41 12 21 58 9
Jun 2.04 0.13 2.00 2.40 9 7.84 3.87 4.50 14.40 9 30 9 18 42 9
Jul 2.00 0.00 2.00 2.00 9 9.18 4.01 4.50 17.10 9 26 9 15 39 9
Aug 2.00 0.00 2.00 2.00 9 5.77 1.01 4.50 6.80 9 23 5 18 34 9
Sep 2.00 0.00 2.00 2.00 8 10.31 5.15 4.50 18.50 8 24 8 16 38 8
Oct 2.00 0.00 2.00 2.00 7 17.97 4.02 12.80 23.20 7 26 7 18 35 7
Nov 2.00 0.00 2.00 2.00 10 12.73 5.31 5.60 20.00 10 45 10 32 58 10
Dec 2.00 0.00 2.00 2.00 10 14.46 3.06 10.80 22.20 10 58 15 29 85 10
Annual Average2.00 µg/m³ 11.86 µg/m³ 39 µg/m³
Limit : 50 µg/m³ , max 40 µg/m³ , max 60 µg/m³ ,max
n: number of days monitoring conductedµg/m³ : microgram per cubic metre
Trend Analysis 2010-2019
2010 2011 2012 2013 2014 2015 2016 2017 2018 2019 LIMIT
SO2 4.15 4.27 3.8 2.36 2.86 3.09 2.21 2.55 3.12 2 50
NOX 13.09 19.3 15.02 5.83 7.51 6.51 11.77 12.31 13.62 11.86 40
RSPM 34.4 39.9 66.55 74.50 74.39 48 47 52 53 39 60
0
10
20
30
40
50
60
70
80
2010 2011 2012 2013 2014 2015 2016 2017 2018 2019 LIMIT
SO2
NOX
RSPM

Directory 2019
Kerala State Pollution Control Board
314
314
11.7.8. Monitoring Location : Perumbavoor (Kuttippadam), Station code : 999 Type : Industrial
Latitude : 100 09’322’’ N
Longitude : 760 45’950’’ E
Air Parameters monitored : Sulphur Dioxide (SO2), Nitrogen Oxides (NOx), Respirable Suspended Particulate Matter (RSPM)

Directory 2019 315
Kerala State Pollution Control Board
11.7.8. Perumbavoor (Kuttippadam) Category: Industrial
Perumbavoor (Kuttippadam)-Stn Code: 999Ambient Air Quality Data - 2019
Parameter Sulphur dioxide µg/m³ Nitrogen Dioxide µg/m³ Respirable Suspended Particulate matter µg/m³
24 h ave Limit :80 µg/m³ ,max 80 µg/m³ ,max 100 µg/m³ ,max
Mon Mean StDev Minm Maxim n Mean StDev Minm Maxim n Mean StDev Minm Maxim n
Jan 3.46 0.52 2.60 4.20 10 21.22 1.84 18.80 25.20 10 98 16 66 117 10
Feb 2.86 0.50 2.00 3.60 9 18.18 2.56 13.60 21.80 9 82 25 49 122 9
Mar 3.42 1.47 2.00 5.90 10 17.44 5.79 9.50 26.40 10 74 27 40 117 10
Apr 5.24 3.31 2.00 11.40 8 11.23 3.18 6.40 16.20 8 63 8 49 73 8
May 3.30 1.83 2.00 6.90 9 9.52 2.38 5.60 13.30 9 53 11 39 73 9
Jun 2.42 0.48 2.00 3.30 9 4.50 7.10 4.50 16.40 9 59 15 45 92 9
Jul 4.70 1.39 3.20 7.30 10 8.70 1.86 6.00 11.40 10 65 20 33 98 10
Aug 3.06 1.57 2.00 6.50 7 11.46 4.36 8.00 18.00 7 51 18 29 78 7
Sep 4.40 2.02 2.00 7.30 8 12.48 2.66 7.90 16.80 8 68 20 47 102 8
Oct 6.76 4.28 2.00 12.50 8 12.00 5.06 6.70 20.10 8 56 18 33 80 8
Nov 6.60 2.20 2.80 9.70 9 13.86 1.88 10.30 15.80 9 80 13 62 103 9
Dec 3.55 2.16 2.00 8.90 10 14.16 3.23 9.90 18.00 10 91 15 75 112 10
Annual Average4.15 μg/m³ 12.90 μg/m³ 70 μg/m³
Limit : 50 μg/m³ , max 40 μg/m³ , max 60 μg/m³ ,max
n: number of days monitoring conductedµg/m³ : microgram per cubic metre
Trend Analysis 2014-2019
0
10
20
30
40
50
60
70
80
2014 2015 2016 2017 2018 2019 LIMIT
Series1
Series2
Series3
2014 2015 2016 2017 2018 2019 LIMIT
SO2 2.89 3.00 2.16 2.22 2.42 4.15 50
NOX 7.78 7.72 15.35 15.48 15.2 12.9 40
RSPM 51.11 45 61 52 57 70 60

Directory 2019
Kerala State Pollution Control Board
316
316
11.8. thriSSur diStrict
11.8.1Monitoring Location : Poonkunnam, Thrissur, Station code : 624 Type : Residential & Others
Latitude : 100 53.43 N Longitude : 760 21.557 E
Air Parameters monitored : Sulphur Dioxide (SO2), Nitrogen Oxides (NOx), Respirable Suspended Particulate Matter (RSPM)
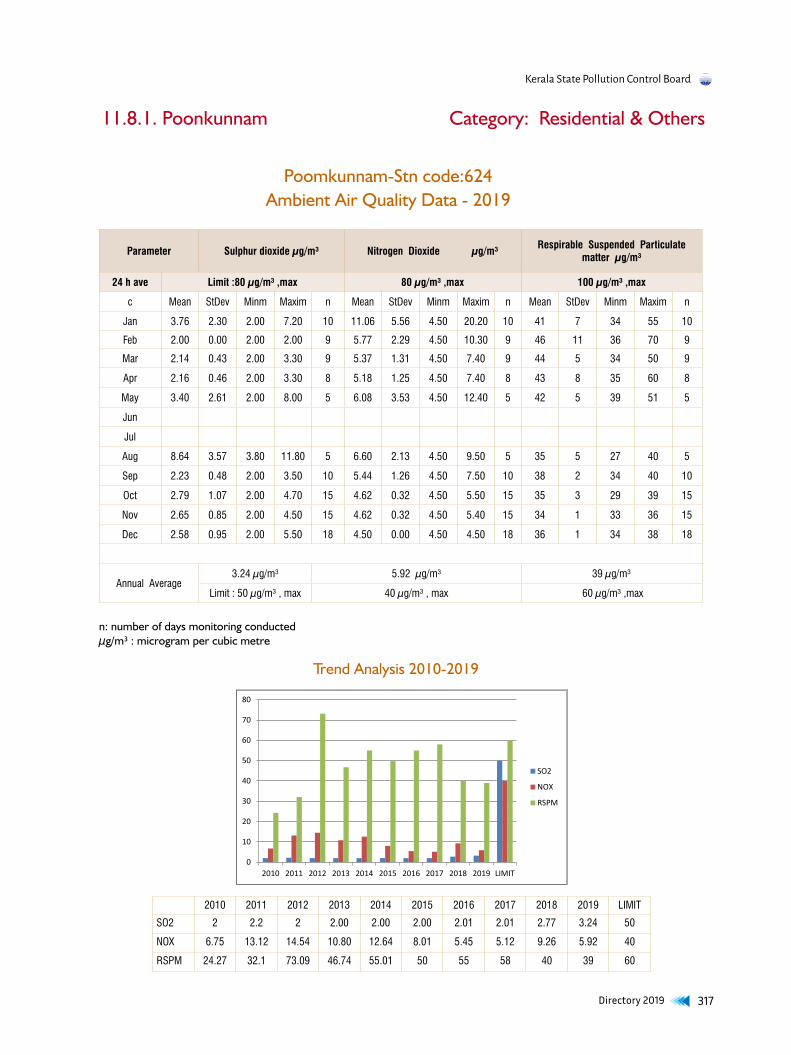
Directory 2019 317
Kerala State Pollution Control Board
11.8.1. Poonkunnam Category: Residential & Others
Poomkunnam-Stn code:624Ambient Air Quality Data - 2019
Parameter Sulphur dioxide µg/m³ Nitrogen Dioxide µg/m³ Respirable Suspended Particulate matter µg/m³
24 h ave Limit :80 µg/m³ ,max 80 µg/m³ ,max 100 µg/m³ ,max
c Mean StDev Minm Maxim n Mean StDev Minm Maxim n Mean StDev Minm Maxim n
Jan 3.76 2.30 2.00 7.20 10 11.06 5.56 4.50 20.20 10 41 7 34 55 10
Feb 2.00 0.00 2.00 2.00 9 5.77 2.29 4.50 10.30 9 46 11 36 70 9
Mar 2.14 0.43 2.00 3.30 9 5.37 1.31 4.50 7.40 9 44 5 34 50 9
Apr 2.16 0.46 2.00 3.30 8 5.18 1.25 4.50 7.40 8 43 8 35 60 8
May 3.40 2.61 2.00 8.00 5 6.08 3.53 4.50 12.40 5 42 5 39 51 5
Jun
Jul
Aug 8.64 3.57 3.80 11.80 5 6.60 2.13 4.50 9.50 5 35 5 27 40 5
Sep 2.23 0.48 2.00 3.50 10 5.44 1.26 4.50 7.50 10 38 2 34 40 10
Oct 2.79 1.07 2.00 4.70 15 4.62 0.32 4.50 5.50 15 35 3 29 39 15
Nov 2.65 0.85 2.00 4.50 15 4.62 0.32 4.50 5.40 15 34 1 33 36 15
Dec 2.58 0.95 2.00 5.50 18 4.50 0.00 4.50 4.50 18 36 1 34 38 18
Annual Average3.24 μg/m³ 5.92 μg/m³ 39 μg/m³
Limit : 50 μg/m³ , max 40 μg/m³ , max 60 μg/m³ ,max
n: number of days monitoring conductedµg/m³ : microgram per cubic metre
Trend Analysis 2010-2019
2010 2011 2012 2013 2014 2015 2016 2017 2018 2019 LIMIT
SO2 2 2.2 2 2.00 2.00 2.00 2.01 2.01 2.77 3.24 50
NOX 6.75 13.12 14.54 10.80 12.64 8.01 5.45 5.12 9.26 5.92 40
RSPM 24.27 32.1 73.09 46.74 55.01 50 55 58 40 39 60
0
10
20
30
40
50
60
70
80
2010 2011 2012 2013 2014 2015 2016 2017 2018 2019 LIMIT
SO2
NOX
RSPM

Directory 2019
Kerala State Pollution Control Board
318
318
11.8. 2. Monitoring Location : Peringandoor, Thrissur, Station code : 1000 Type : Industrial
Latitude : 100 53’ 42” N Longitude : 760 21’ 5” E
Air Parameters monitored : Sulphur Dioxide (SO2), Nitrogen Oxides (NOx), Respirable Suspended Particulate Matter (RSPM)

Directory 2019 319
Kerala State Pollution Control Board
11.8.2 Peringandoor Category: Industrial
PERINGANDOOR -Stn code:1000Ambient Air Quality Data - 2019
Parameter Sulphur dioxide µg/m³ Nitrogen Dioxide µg/m³ Respirable Suspended Particulate matter µg/m³
24 h ave Limit :80 µg/m³ ,max 80 µg/m³ ,max 100 µg/m³ ,max
Mon Mean StDev Minm Maxim n Mean StDev Minm Maxim n Mean StDev Minm Maxim n
Jan
Feb
Mar 2.23 0.51 2.00 3.50 10 4.84 0.79 4.50 6.90 10 45 7 33 55 10
Apr 2.00 0.00 2.00 2.00 8 4.50 0.00 4.50 4.50 8 42 5 37 52 8
May 2.40 0.55 2.00 3.00 5 6.08 3.53 4.50 12.40 5 42 5 39 51 5
Jun 2.97 1.67 2.00 4.90 3 5.30 1.39 4.50 6.90 9 38 2 35 39 9
Jul 2.52 0.78 2.00 3.90 11 5.71 2.09 4.50 11.40 11 39 3 34 43 11
Aug 3.99 3.12 2.00 9.60 9 5.18 1.38 4.50 8.20 9 30 6 22 40 9
Sep 3.34 2.31 2.00 8.70 8 5.45 1.80 4.50 9.00 8 37 3 34 42 8
Oct 2.87 1.50 2.00 4.60 3 4.77 0.46 4.50 5.30 3 35 1 34 36 3
Nov 2.10 0.26 2.00 2.70 7 4.74 0.42 4.50 5.40 7 34 1 33 35 7
Dec 2.49 1.04 2.00 4.60 10 4.67 0.36 4.50 5.40 10 36 1 34 37 10
Annual Average2.69 μg/m³ 5.12 μg/m³ 38 μg/m³
Limit : 50 μg/m³ , max 40 μg/m³ , max 60 μg/m³ ,max
n: number of days monitoring conductedµg/m³ : microgram per cubic metre

Directory 2019
Kerala State Pollution Control Board
320
320
11.9 . PaLakkad diStrict
11.9.1Monitoring Location : Carborandum Universal/SEPR Refractories, Kanjikode, Station code : 311
Type : Industrial
Latitude : 100 79’312’’ N Longitude : 760 74’ 148’’ E
Air Parameters monitored : Sulphur Dioxide (SO2), Nitrogen Oxides (NOx), Respirable Suspended Particulate Matter (RSPM)

Directory 2019 321
Kerala State Pollution Control Board
11.9.1. Kanjikode Category: Industrial
Kanjikkode-Stn Code:311Ambient Air Quality Data - 2019
Parameter Sulphur dioxide µg/m³ Nitrogen Dioxide µg/m³ Respirable Suspended Particulate matter µg/m³
24 h ave Limit :80 µg/m³ ,max 80 µg/m³ ,max 100 µg/m³ ,max
Mon Mean StDev Minm Maxim n Mean StDev Minm Maxim n Mean StDev Minm Maxim n
Jan 2.00 0.00 2.00 2.00 10 8.89 0.68 7.50 9.60 10 75 26 52 144 10
Feb 2.00 0.00 2.00 2.00 10 7.42 1.22 5.30 9.20 10 62 14 41 84 10
Mar 2.00 0.00 2.00 2.00 10 8.10 1.13 6.00 9.20 10 60 14 36 87 10
Apr 2.00 0.00 2.00 2.00 8 6.91 1.32 4.50 9.10 8 53 10 43 74 8
May 2.00 0.00 2.00 2.00 9 4.94 0.90 4.50 6.90 9 38 7 30 49 9
Jun 2.00 0.00 2.00 2.00 9 6.50 1.42 4.50 8.60 9 26 9 17 48 9
Jul 2.00 0.00 2.00 2.00 10 6.80 1.77 4.50 8.70 10 21 5 15 31 10
Aug 2.00 0.00 2.00 2.00 9 6.30 1.50 4.50 8.50 9 24 10 11 41 9
Sep 2.00 0.00 2.00 2.00 6 6.12 1.03 4.50 7.00 6 26 11 12 49 6
Oct 2.00 0.00 2.00 2.00 7 6.34 1.11 4.50 7.70 7 32 14 14 50 7
Nov 2.17 0.40 2.00 3.20 9 9.72 7.87 4.50 4.50 9 70 23 39 103 9
Dec 4.07 3.11 2.00 9.60 10 7.61 6.65 4.50 25.40 10 16 79 62 111 10
Annual Average2.19 μg/m³ 7.14 μg/m³ 42 μg/m³
Limit : 50 μg/m³ , max 40 μg/m³ , max 60 μg/m³ ,max
n: number of days monitoring conductedµg/m³ : microgram per cubic metre
Trend Analysis 2010-2019
0
10
20
30
40
50
60
70
2010 2011 2012 2013 2014 2015 2016 2017 2018 2019 LIMIT
SO2
NOX
RSPM
2010 2011 2012 2013 2014 2015 2016 2017 2018 2019 LIMIT
SO2 3.22 2.99 3.13 2.70 2.00 2.00 2 2 2.54 2.19 50
NOX 6.17 8.86 6.98 4.74 6.41 7.42 8.56 8.96 8.61 7.14 40
RSPM 32.39 22.95 39.33 39.26 40.19 47 41 44 43 42 60

Directory 2019
Kerala State Pollution Control Board
322
322
11.10. maLaPPuram diStrict
11.10.1 Monitoring Location : Kakkanchery, near KINFRA Station code : 623 Type : Industrial
Latitude : 110 15’ 385” N
Longitude : 750 89’ 287” E
Air Parameters monitored : Sulphur Dioxide (SO2), Nitrogen Oxides (NOx), Respirable Suspended Particulate Matter (RSPM)

Directory 2019 323
Kerala State Pollution Control Board
11.10.1. Kakkancherry Category: Industrial
Kakkancherry-Stn Code:623Ambient Air Quality Data - 2019
Parameter Sulphur dioxide µg/m³ Nitrogen Dioxide µg/m³ Respirable Suspended Particulate matter µg/m³
24 h ave Limit :80 µg/m³ ,max 80 µg/m³ ,max 100 µg/m³ ,max
Mon Mean StDev Minm Maxim n Mean StDev Minm Maxim n Mean StDev Minm Maxim n
Jan 2.00 0.00 2.00 2.00 10 14.07 2.79 9.60 19.00 10 35 12 23 56 10
Feb 2.00 0.00 2.00 2.00 10 15.76 2.16 13.50 19.80 10 31 4 24 37 10
Mar 2.00 0.00 2.00 2.00 10 14.95 2.78 10.20 19.40 10 43 17 25 70 10
Apr 2.00 0.00 2.00 2.00 8 15.53 1.08 14.50 17.20 8 38 6 28 49 8
May 2.00 0.00 2.00 2.00 9 16.49 1.39 13.90 18.30 9 39 5 32 47 9
Jun 2.00 0.00 2.00 2.00 9 15.13 2.29 11.30 18.40 9 43 13 22 67 9
Jul 2.00 0.00 2.00 2.00 10 13.56 2.61 9.30 16.90 10 31 5 25 38 10
Aug 2.00 0.00 2.00 2.00 9 14.94 1.99 10.50 16.90 9 27 1 25 29 9
Sep 2.00 0.00 2.00 2.00 6 14.46 2.19 10.60 17.20 6 27 3 22 32 6
Oct 2.00 0.00 2.00 2.00 7 14.74 1.13 12.80 15.90 7 32 5 26 40 7
Nov 2.00 0.00 2.00 2.00 9 13.61 3.36 8.70 20.60 9 38 10 21 47 9
Dec 2.00 0.00 2.00 2.00 10 16.21 2.54 12.20 20.00 10 31 4 22 35 10
Annual Average2.00 μg/m³ 14.95 μg/m³ 35 μg/m³
Limit : 50 μg/m³ , max 40 μg/m³ , max 60 μg/m³ ,max
n: number of days monitoring conductedµg/m³ : microgram per cubic metre
Trend Analysis 2010-2019
0
10
20
30
40
50
60
70
2010 2011 2012 2013 2014 2015 2016 2017 2018 2019 LIMIT
SO2
NOX
RSPM
2010 2011 2012 2013 2014 2015 2016 2017 2018 2019 LIMIT
SO2 2 2 2 2.00 2.00 2.00 2 2 2 2 50
NOX 4.53 5.9 4.64 4.87 11.50 13.46 16.57 21.24 17.11 14.95 40
RSPM 30.12 32.2 36.72 37.46 43.54 43 37 32 31 35 60

Directory 2019
Kerala State Pollution Control Board
324
324
11.11 . kozhikode diStrict
11.11.1Monitoring Location : Kozhikode city, Station code : 360 Type : Commercial
Latitude : 110 25; 06”1 N
Longitude : 750 78’ 30” E
Air Parameters monitored : Sulphur Dioxide (SO2), Nitrogen Oxides (NOx), Respirable Suspended Particulate Matter (RSPM)

Directory 2019 325
Kerala State Pollution Control Board
11.11.1. Kozhikode city Category: Commercial
KOZHIKKODE CITY-Stn Code:360Ambient Air Quality Data - 2019
Parameter Sulphur dioxide µg/m³ Nitrogen Dioxide µg/m³ Respirable Suspended Particulate matter µg/m³
24 h ave Limit :80 µg/m³ ,max 80 µg/m³ ,max 100 µg/m³ ,max
Mon Mean StDev Minm Maxim n Mean StDev Minm Maxim n Mean StDev Minm Maxim n
Jan 2.00 0.00 2.00 2.00 9 4.78 0.83 4.50 7.00 9 33 6 25 44 9
Feb 2.00 0.00 2.00 2.00 8 5.93 1.55 4.50 7.80 8 68 18 39 100 8
Mar 2.00 0.00 2.00 2.00 10 4.84 0.44 4.50 5.40 10 50 9 34 57 10
Apr 2.00 0.00 2.00 2.00 8 4.83 0.66 4.50 6.30 8 45 6 37 55 8
May 2.00 0.00 2.00 2.00 9 5.13 0.88 4.50 7.00 9 33 6 25 44 9
Jun 2.00 0.00 2.00 2.00 8 6.18 1.59 4.50 8.70 8 41 12 21 56 8
Jul 2.00 0.00 2.00 2.00 10 6.49 2.47 4.50 12.80 10 34 15 14 58 10
Aug 2.00 0.00 2.00 2.00 7 5.57 1.14 4.50 7.40 7 31 14 17 55 7
Sep 2.00 0.00 2.00 2.00 8 5.69 2.27 4.50 10.30 8 27 8 19 40 8
Oct 2.00 0.00 2.00 2.00 7 5.11 0.99 4.50 7.20 7 27 17 14 62 7
Nov 2.00 0.00 2.00 2.00 7 5.69 1.98 4.50 9.90 7 23 7 14 32 7
Dec 2.00 0.00 2.00 2.00 1 4.50 0.00 4.50 4.50 1 16 3 11 21 1
Annual Average2.00 μg/m³ 5.40 μg/m³ 36 μg/m³
Limit : 50 μg/m³ , max 40 μg/m³ , max 60 μg/m³ ,max
n: number of days monitoring conductedµg/m³ : microgram per cubic metre
Trend Analysis 2010-2019
0
10
20
30
40
50
60
70
2010 2011 2012 2013 2014 2015 2016 2017 2018 2019 LIMIT
SO2
NOX
RSPM
2010 2011 2012 2013 2014 2015 2016 2017 2018 2019 LIMIT
SO2 3.59 2.6 2 2.00 2.00 2.00 2 2 2 2 50
NOX 8.49 8.3 8.52 19.41 22.28 24.1 17.87 18.58 10.99 5.4 40
RSPM 44.56 35.59 56.46 51.33 51.37 56 51 45 62 36 60

Directory 2019
Kerala State Pollution Control Board
326
326
11.11.2 Monitoring Location : Nallalam, Station code : 359 Type : Industrial
Latitude : 110 20’ 60” N
Longitude : 750 81’ 08” E
Air Parameters monitored : Sulphur Dioxide (SO2), Nitrogen Oxides (NOx), Respirable Suspended Particulate Matter (RSPM)

Directory 2019 327
Kerala State Pollution Control Board
11.11.2 Nallalam Category: Industrial
NALLALAM,Kozhikkode-Stn code:359Ambient Air Quality Data - 2019
Parameter Sulphur dioxide µg/m³ Nitrogen Dioxide µg/m³ Respirable Suspended Particulate matter µg/m³
24 h ave Limit :80 µg/m³ ,max 80 µg/m³ ,max 100 µg/m³ ,max
Mon Mean StDev Minm Maxim n Mean StDev Minm Maxim n Mean StDev Minm Maxim n
Jan 2.00 0.00 2.00 2.00 7 5.94 1.29 4.50 7.50 7 89 18 68 110 7
Feb 2.00 0.00 2.00 2.00 8 6.26 2.56 4.50 10.30 8 60 14 39 85 8
Mar 2.00 0.00 2.00 2.00 9 4.59 0.27 4.50 5.30 9 39 16 17 62 9
Apr 0 0 0
May 0 0 0
Jun 0 0 0
Jul 0 0 0
Aug 2.00 0.00 2.00 2.00 8 4.73 0.42 4.50 5.40 8 18 6 12 28 8
Sep 2.00 0.00 2.00 2.00 8 5.56 2.09 4.50 10.50 8 23 6 15 31 8
Oct 2.00 0.00 2.00 2.00 7 4.69 0.49 4.50 5.80 7 23 9 14 40 7
Nov 2.00 0.00 2.00 2.00 9 4.50 0.00 4.50 4.50 9 41 16 24 73 9
Dec 2.00 0.00 2.00 2.00 10 4.50 0.00 4.50 4.50 10 60 15 30 78 10
Annual Average2.00 μg/m³ 5.10 μg/m³ 44 μg/m³
Limit : 50 μg/m³ , max 40 μg/m³ , max 60 μg/m³ ,max
n: number of days monitoring conductedµg/m³ : microgram per cubic metre
Trend Analysis 2010-2019
0
10
20
30
40
50
60
70
2010 2011 2012 2013 2014 2015 2016 2017 2018 2019 LIMIT
SO2
NOX
RSPM
2010 2011 2012 2013 2014 2015 2016 2017 2018 2019 LIMIT
SO2 2 2 2 2.00 2.00 2.00 2 2 2 2 50
NOX 9.78 7.46 7.74 13.48 16.22 17.9 17.76 16.77 7.86 5.1 40
RSPM 38.69 56.6 53.78 45.75 40.41 41 50 48 47 44 60

Directory 2019
Kerala State Pollution Control Board
328
328
11.12. wayanad diStrict
11.12.1Monitoring Location : Sulthan Bathery, Station code : 622 Type : Sensitive
Latitude : 110 66’ 561” N
Longitude : 760 26’ 3” E
Air Parameters monitored : Sulphur Dioxide (SO2), Nitrogen Oxides (NOx), Respirable Suspended Particulate Matter (RSPM)

Directory 2019 329
Kerala State Pollution Control Board
11.12 .1. Sulthan Bathery Category: Sensitive
Sulthanbathery-Stn code:622Ambient Air Quality Data - 2019
Parameter Sulphur dioxide µg/m³ Nitrogen Dioxide µg/m³ Respirable Suspended Particulate matter µg/m³
24 h ave Limit :80 µg/m³ ,max 80 µg/m³ ,max 100 µg/m³ ,max
Mon Mean StDev Minm Maxim n Mean StDev Minm Maxim n Mean StDev Minm Maxim n
Jan 2.00 0.00 2.00 2.00 8 4.50 0.00 4.50 4.50 8 37 4 27 40 8
Feb 2.00 0.00 2.00 2.00 10 4.50 0.00 4.50 4.50 10 37 2 34 41 10
Mar 2.00 0.00 2.00 2.00 10 4.50 0.00 4.50 4.50 10 33 1 32 35 10
Apr 2.00 0.00 2.00 2.00 8 4.50 0.00 4.50 4.50 8 36 1 35 37 8
May 2.00 0.00 2.00 2.00 9 4.50 0.00 4.50 4.50 9 35 1 35 36 9
Jun 2.00 0.00 2.00 2.00 8 4.50 0.00 4.50 4.50 8 31 2 28 34 8
Jul 2.00 0.00 2.00 2.00 10 4.50 0.00 4.50 4.50 10 20 2 17 22 10
Aug 2.00 0.00 2.00 2.00 7 4.50 0.00 4.50 4.50 7 17 3 14 21 7
Sep 2.00 0.00 2.00 2.00 4 4.50 0.00 4.50 4.50 4 19 1 17 20 4
Oct 2.00 0.00 2.00 2.00 8 4.50 0.00 4.50 4.50 8 19 2 16 21 8
Nov 2.00 0.00 2.00 2.00 9 4.50 0.00 4.50 4.50 9 24 1 22 26 9
Dec 2.00 0.00 2.00 2.00 10 4.50 0.00 4.50 4.50 10 26 2 21 28 10
Annual Average2.00 μg/m³ 4.50 μg/m³ 28 μg/m³
Limit : 50 μg/m³ , max 40 μg/m³ , max 60 μg/m³ ,max
n: number of days monitoring conductedµg/m³ : microgram per cubic metre
Trend Analysis 20010-2019
0
10
20
30
40
50
60
70
2010 2011 2012 2013 2014 2015 2016 2017 2018 2019 LIMIT
SO2
NOX
RSPM
2010 2011 2012 2013 2014 2015 2016 2017 2018 2019 LIMIT
SO2 2.07 2.04 2 2.00 2.00 2.00 2 2 2 2 50
NOX 12.32 11.53 7.79 4.50 4.50 4.50 4.57 4.54 4.5 4.5 40
RSPM 45.74 28.5 33.72 42.24 36.00 37 40 43 34 28 60

Directory 2019
Kerala State Pollution Control Board
330
330
11.12.2 Monitoring Location : Kalpetta Code 1001 Type : Sensitive
Latitude : 110 60’ 944” N
Longitude : 760 08’ 2” E
Air Parameters monitored : Sulphur Dioxide (SO2), Nitrogen Oxides (NOx), Respirable Suspended Particulate Matter (RSPM)

Directory 2019 331
Kerala State Pollution Control Board
11.12 .1. Kalpetta Category: Sensitive
Kalpetta -Stn code:1001Ambient Air Quality Data - 2019
Parameter Sulphur dioxide µg/m³ Nitrogen Dioxide µg/m³ Respirable Suspended Particulate matter µg/m³
24 h ave Limit :80 µg/m³ ,max 80 µg/m³ ,max 100 µg/m³ ,max
Mon Mean StDev Minm Maxim n Mean StDev Minm Maxim n Mean StDev Minm Maxim n
Jan 0 0 0
Feb 0 0 0
Mar 2.00 0.00 2.00 2.00 10 4.50 0.00 4.50 4.50 10 35 1 33 37 10
Apr 2.00 0.00 2.00 2.00 8 4.50 0.00 4.50 4.50 8 36 1 35 37 8
May 0 0 0
Jun 2.00 0.00 2.00 2.00 8 4.50 0.00 4.50 4.50 8 31 2 28 34 8
Jul 2.00 0.00 2.00 2.00 10 4.50 0.00 4.50 4.50 10 22 2 19 26 10
Aug 2.00 0.00 2.00 2.00 8 4.50 0.00 4.50 4.50 8 18 2 15 21 8
Sep 2.00 0.00 2.00 2.00 8 4.50 0.00 4.50 4.50 8 20 2 17 23 8
Oct 2.00 0.00 2.00 2.00 8 4.50 0.00 4.50 4.50 8 20 1 17 21 8
Nov 2.00 0.00 2.00 2.00 9 4.50 0.00 4.50 4.50 9 24 1 22 26 9
Dec 2.00 0.00 2.00 2.00 10 4.50 0.00 4.50 4.50 10 27 1 25 29 10
Annual Average2.00 μg/m³ 4.50 μg/m³ 28 μg/m³
Limit : 50 μg/m³ , max 40 μg/m³ , max 60 μg/m³ ,max
n: number of days monitoring conductedµg/m³ : microgram per cubic metre

Directory 2019
Kerala State Pollution Control Board
332
332
11.13. kannur diStrict
11.13.1 Monitoring Location : Kannur (SAMP) Type : Commercial
Latitude : 11° 52’ 35” N
Longitude : 75° 21’ 22” E
Air Parameters monitored : Sulphur Dioxide (SO2), Nitrogen Oxides (NOx), Respirable Suspended Particulate Matter (RSPM)

Directory 2019 333
Kerala State Pollution Control Board
11.13.1. Kannur Category: Commercial
KANNUR (SAMP)Ambient Air Quality Data - 2019
Parameter Sulphur dioxide µg/m³ Nitrogen Dioxide µg/m³ Respirable Suspended Particulate matter µg/m³
24 h ave Limit :80 µg/m³ ,max 80 µg/m³ ,max 100 µg/m³ ,max
Mon Mean StDev Minm Maxim n Mean StDev Minm Maxim n Mean StDev Minm Maxim n
Jan 2.00 0.00 2.00 2.00 9 4.50 0.00 4.50 4.50 9 58 13 32 75 9
Feb 2.00 0.00 2.00 2.00 10 8.85 2.51 5.40 11.60 10 50 8 37 60 10
Mar 2.00 0.00 2.00 2.00 10 6.35 1.13 4.50 8.00 10 36 6 30 45 10
Apr 2.01 0.04 2.00 2.10 8 7.56 2.80 4.50 11.40 8 30 14 18 53 8
May 2.29 0.72 2.00 4.18 9 7.81 4.93 4.50 18.30 9 39 18 17 77 9
Jun 2.05 0.16 2.00 2.48 9 6.92 1.67 5.30 9.70 9 33 14 14 57 9
Jul 2.05 0.15 2.00 2.46 10 6.59 1.27 5.29 9.06 10 31 12 11 49 10
Aug 2.00 0.00 2.00 2.00 9 6.92 2.48 4.50 12.37 9 48 25 19 105 9
Sep 2.00 0.00 2.00 2.00 8 8.00 1.28 7.09 8.90 8 31 1 30 31 8
Oct 2.00 0.00 2.00 2.00 8 4.50 0.00 4.50 4.50 8 25 8 19 31 8
Nov 2.03 0.10 2.00 2.30 9 7.71 3.52 4.50 13.76 9 26 5 15 30 9
Dec 2.00 0.00 2.00 2.00 10 7.43 1.89 4.50 9.91 10 36 13 18 64 10
Annual Average2.04 μg/m³ 6.93 μg/m³ 37 μg/m³
Limit : 50 μg/m³ , max 40 μg/m³ , max 60 μg/m³ ,max
n: number of days monitoring conductedµg/m³ : microgram per cubic metre
Trend Analysis 2010-2019
0
10
20
30
40
50
60
70
80
90
100
2010 2011 2012 2013 2014 2015 2016 2017 2018 2019 LIMIT
SO2
NOX
RSPM
2010 2011 2012 2013 2014 2015 2016 2017 2018 2019 LIMIT
SO2 2.04 2.2 2.34 3.75 2.82 2.00 2.00 2.00 2.01 2.04 50
NOX 5.72 6.55 7.46 5.05 4.51 4.56 4.53 4.5 6.33 6.93 40
RSPM 38.76 42.46 50.65 35.63 87.46 63 56 64 51 37 60

Directory 2019
Kerala State Pollution Control Board
334
334
11.13.2 Monitoring Location : Mangattuparambu (SAMP) Type : Residential, Rural & Others
Latitude : 11°59’00” N
Longitude : 75°21’ 50” E
Air Parameters monitored : Sulphur Dioxide (SO2), Nitrogen Oxides (NOx), Respirable Suspended Particulate Matter (RSPM)

Directory 2019 335
Kerala State Pollution Control Board
11.13.2. Kannur, Mangattuparamb Category: Residential, Rural & Others
MANGATTUPARAMBA (SAMP)Ambient Air Quality Data - 2019
Parameter Sulphur dioxide µg/m³ Nitrogen Dioxide µg/m³ Respirable Suspended Particulate matter µg/m³
24 h ave Limit :80 µg/m³ ,max 80 µg/m³ ,max 100 µg/m³ ,max
Mon Mean StDev Minm Maxim n Mean StDev Minm Maxim n Mean StDev Minm Maxim n
Jan 2.00 0.00 2.00 2.00 9 9.42 3.01 4.50 14.10 9 61 10 45 73 9
Feb 2.00 0.00 2.00 2.00 10 7.04 1.99 4.50 10.20 10 56 14 35 80 10
Mar 2.00 0.00 2.00 2.00 10 5.40 1.24 4.50 7.70 10 39 6 31 49 10
Apr 2.00 0.00 2.00 2.00 8 6.43 3.69 4.50 15.30 8 31 12 18 56 8
May 2.34 1.02 2.00 5.07 9 6.78 4.76 4.50 19.00 9 33 9 23 50 9
Jun 2.04 0.11 2.00 2.32 9 4.75 0.51 4.50 5.87 9 25 5 19 31 9
Jul 2.00 0.00 2.00 2.00 10 5.27 2.05 4.50 11.00 10 16 10 6 37 10
Aug 2.15 0.32 2.00 2.90 9 4.88 0.76 4.50 6.40 9 21 10 10 46 9
Sep 2.00 0.00 2.00 2.00 8 4.95 1.27 4.50 8.10 8 20 7 13 29 8
Oct 2.04 0.05 2.00 2.10 8 4.75 0.48 4.50 5.70 8 26 9 16 40 8
Nov 2.00 0.00 2.00 2.00 9 5.21 1.17 4.50 7.70 9 45 12 35 66 9
Dec 2.03 0.09 2.00 2.28 10 6.24 1.11 4.50 7.90 10 64 15 46 92 10
Annual Average2.05 μg/m³ 5.93 μg/m³ 36 μg/m³
Limit : 50 μg/m³ , max 40 μg/m³ , max 60 μg/m³ ,max
n: number of days monitoring conductedµg/m³ : microgram per cubic metre
Trend Analysis 2010-2019
0
10
20
30
40
50
60
70
80
Chart Title
SO2
NOX
RSPM
2010 2011 2012 2013 2014 2015 2016 2017 2018 2019 LIMIT
SO2 2.09 2.4 2.21 3.47 2.80 2.80 2 2 2.21 2.05 50
NOX 7.32 5.24 6.87 5.25 4.55 4.50 4.53 4.53 5.93 5.93 40
RSPM 35.47 43.4 22.27 77.73 55.14 40 40 63 48 36 60

Directory 2019
Kerala State Pollution Control Board
336
336
11.14. kaSargode diStrict
11.14.1 Monitoring Location : Kasargode (SAMP) Type : Residential, Rural & Others
Latitude : 12019.273 N
Longitude : 750 05.016 E
Air Parameters monitored : Sulphur Dioxide (SO2), Nitrogen Oxides (NOx), Respirable Suspended Particulate Matter (RSPM)

Directory 2019 337
Kerala State Pollution Control Board
11.14.1. Kasargode Category: Residential, Rural & Others
KasargodeAmbient Air Quality Data - 2019
Parameter Sulphur dioxide µg/m³ Nitrogen Dioxide µg/m³ Respirable Suspended Particulate matter µg/m³
24 h ave Limit :80 µg/m³ ,max 80 µg/m³ ,max 100 µg/m³ ,max
Mon Mean StDev Minm Maxim n Mean StDev Minm Maxim n Mean StDev Minm Maxim n
Jan 2.00 0.00 2.00 2.00 10 4.50 0.00 4.50 4.50 10 45 9 34 61 10
Feb 2.00 0.00 2.00 2.00 10 4.50 0.00 4.50 4.50 10 48 10 32 64 10
Mar 2.00 0.00 2.00 2.00 10 4.75 0.79 4.50 7.00 10 56 9 43 71 10
Apr 2.00 0.00 2.00 2.00 8 4.50 0.00 4.50 4.50 8 54 7 45 64 8
May 2.00 0.00 2.00 2.00 10 4.68 0.53 4.50 6.10 10 55 9 44 76 10
Jun 2.10 0.11 2.00 2.30 9 4.74 0.34 4.50 5.40 9 57 6 47 64 9
Jul 2.00 0.00 2.00 2.00 10 4.50 0.00 4.50 4.50 10 48 11 28 61 10
Aug 2.00 0.00 2.00 2.00 8 4.60 0.28 4.50 5.30 8 41 7 31 49 8
Sep 2.00 0.00 2.00 2.00 8 4.50 0.00 4.50 4.50 8 49 5 43 57 8
Oct 2.00 0.00 2.00 2.00 4 4.50 0.00 4.50 4.50 4 46 11 36 56 4
Nov 2.00 0.00 2.00 2.00 9 4.50 0.00 4.50 4.50 9 40 4 35 49 9
Dec 2.00 0.00 2.00 2.00 10 4.50 0.00 4.50 4.50 10 45 6 34 58 10
Annual Average2.01 μg/m³ 4.56 μg/m³ 49 μg/m³
Limit : 50 μg/m³ , max 40 μg/m³ , max 60 μg/m³ ,max
n: number of days monitoring conductedµg/m³ : microgram per cubic metre
Trend Analysis 2010-2019
2010 2011 2012 2013 2014 2015 2016 2017 2018 2019 LIMIT
SO2 2.25 2.4 2.22 2.00 2.01 2.06 2.02 2.03 2.04 2.01 50
NOX 13.51 12.17 7.09 8.53 5.15 5.48 5.13 4.92 4.67 4.56 40
RSPM 52.62 55.7 43.2 50.98 36.71 31 39 36 42 49 60
0
10
20
30
40
50
60
70
2010 2011 2012 2013 2014 2015 2016 2017 2018 2019 LIMIT
SO2
NOX
RSPM

Directory 2019
Kerala State Pollution Control Board
338
338
11.14.2 Monitoring Location : Kanhangad (SAMP) Type : Residential, Rural & Others
Latitude : 120 30.414 N
Longitude : 740 59.644 E
Air Parameters monitored : Sulphur Dioxide (SO2), Nitrogen Oxides (NOx), Respirable Suspended Particulate Matter (RSPM)

Directory 2019 339
Kerala State Pollution Control Board
11.14.2. Kanhangad Category: Residential, Rural & Others
Kanhangad (SAMP)Ambient Air Quality Data - 2019
Parameter Sulphur dioxide µg/m³ Nitrogen Dioxide µg/m³ Respirable Suspended Particulate matter µg/m³
24 h ave Limit :80 µg/m³ ,max 80 µg/m³ ,max 100 µg/m³ ,max
Mon Mean StDev Minm Maxim n Mean StDev Minm Maxim n Mean StDev Minm Maxim n
Jan 2.00 0.00 2.00 2.00 10 4.50 0.00 4.50 4.50 10 40 8 30 55 10
Feb 2.00 0.00 2.00 2.00 10 4.68 0.57 4.50 6.30 10 51 6 44 62 10
Mar 2.00 0.00 2.00 2.00 10 4.80 0.95 4.50 7.50 10 62 8 44 75 10
Apr 2.00 0.00 2.00 2.00 8 4.60 0.30 4.50 5.40 8 60 6 56 74 8
May 2.00 0.00 2.00 2.00 9 4.59 0.27 4.50 5.30 9 53 7 46 68 9
Jun 2.20 0.13 2.10 2.50 9 4.84 0.42 4.50 5.80 9 47 8 36 58 9
Jul 2.00 0.00 2.00 2.00 10 4.50 0.00 4.50 4.50 10 37 7 27 48 10
Aug 2.00 0.00 2.00 2.00 8 4.50 0.00 4.50 4.50 8 38 4 34 44 8
Sep 2.00 0.00 2.00 2.00 8 4.50 0.00 4.50 4.50 8 52 7 44 66 8
Oct 2.00 0.00 2.00 2.00 4 4.50 0.00 4.50 4.50 4 45 5 39 50 4
Nov 2.00 0.00 2.00 2.00 9 4.61 0.33 4.50 5.50 9 41 7 28 48 9
Dec 2.00 0.00 2.00 2.00 10 4.60 0.32 4.50 5.50 10 49 9 37 60 10
Annual Average2.02 μg/m³ 4.60 μg/m³ 48 μg/m³
Limit : 50 μg/m³ , max 40 μg/m³ , max 60 μg/m³ ,max
n: number of days monitoring conductedµg/m³ : microgram per cubic metre
Trend Analysis 2010-2019
2010 2011 2012 2013 2014 2015 2016 2017 2018 2019 LIMIT
SO2 2.25 2.4 2.13 2.00 2.00 2.05 2.14 2.02 2.06 2.02 50
NOX 11.36 10.24 7.9 8.18 5.39 6.99 5.83 5.31 4.83 4.6 40
RSPM 50.59 49.9 40.78 42.75 37.7 38 44 31 43 48 60
0
10
20
30
40
50
60
70
2010 2011 2012 2013 2014 2015 2016 2017 2018 2019 LIMIT
SO2
NOX
RSPM

Directory 2019
Kerala State Pollution Control Board
340
340
GENERAL EVALUATIoN oN AIR QUALITY - 2019
The Board is monitoring ambient air quality at a total of 35 stations in the state under National Ambient Air Quality Monitoring Programme (NAMP) and State Ambient Air Quality Monitoring Programme (SAMP).The parameters monitored are Sulphur dioxide (SO2), Oxides of Nitrogen (NOx), and Respirable Suspended Particulate Matter (RSPM). Measurement of Particulate matter ( PM2.5) started in all stations .
The annual average concentrations of Sulphur dioxide and Oxides of Nitrogen were not exceeded the permissible limit values in any of the monitoring stations during the period from 2010 to 2019. Whereas the annual average of RSPM values (PM10) were exceeded the limit in the monitoring stations located at Kuttipadam(70µg/m³), in Ernakulam district during the year 2019.
Annual Average - Respirable Suspended Particulate Matter -2019
Annual Average Limit Value of RSPM =60µg/m³X axis=StationsY axis= Annual Average RSPM µg/m³

Directory 2019 341
Kerala State Pollution Control Board
boaRd’S laboRatoRieS

Directory 2019
Kerala State Pollution Control Board
342
342

Directory 2019 343
Kerala State Pollution Control Board
The Board has laboratories in all 14 districts. Laboratories are also attached to Environmental Surveillance Centre at Eloor and the district level office at Perumbavoor. The Central Laboratory Complex which is located at Gandhi Nagar, Kadavanthra, Kochi-20 is the pride of Kerala State Pollution Control Board. It functions in the Board’s own building covering a total floor area of 1020 m2. This laboratory has achieved a phenomenal growth in capacity and caliber over the past 35 years upholding quality and credibility all the time. It has six important sections namely (1) Effluent Lab (2) Surface/Ground Water Lab (3) Project Lab (4) Air Lab (5) Biology Lab (6) Microbiology Lab.
It has 3 fully air-conditioned instrument rooms equipped with most modern sophisticated instruments like Atomic Absorption Spectrophotometer with Flame and graphite Furnace and Hydride generation unit, Gas Chromatograph with ECD and NPD, Gas Chromatograph with FID and ATD, High Performance Liquid Chromatograph with UV and Fluorescence detectors, UV-Visible scanning Spectrophotometer, Specific Ion Analyser, CHNS Analyser etc.. Some of the sophisticated equipments available are MilliQ Water System, Microwave solid sample Digester, TCLP Extraction Apparatus etc.
Central laboratory co-ordinates the water and air quality monitoring and analysis of samples at the Board’s District/Regional Laboratories and compiles the results generated. This Laboratory consistently maintain top ranking in the Analytical Quality Control Exercise/Performance evaluation Tests conducted by Central Pollution Control Board. The reports on the performance of the Central Laboratory Ernakulam and the Regional Laboratory Kozhikode in the 29th Proficiency Testing Programme on water analysis, conducted by CPCB during February 2013 are given on page 388 and 389. The laboratory has obtained super excellent grade in proficiency testing in microbiological parameters conducted by CPCB during 2013. Relevant page of the document is given on page 390.
Since last few years, the Central Laboratory has been in the process of implementing the management and technical requirements as per ISO/IEC 17025:2005. Now the laboratory has fulfilled all the requirements, and has successfully passed both the pre assessment and final audit by the National Accreditation Board for Testing and Calibration Laboratories and recommended the laboratory for accreditation for the entire scope of 61 parameters in the discipline of Chemical and Biological testing. Certificate of accreditation is awaited. This achievement will be a big leap in the progress of the laboratory and a milestone in its history
Photographs of some of the sophisticated instruments and their applications in the environmental sample analysis are given below. Atomic Absorption Spectrophotometer with Flame, Graphite Furnace and Hydride generation unit (Make: Perkin Elmer-AAnalyst 700)
Applications:Analysis of Heavy Metals in water, waste water, air particulates, soil, sediment, sludge and hazardous wastes.etc.
12. BOARD’S LABORATORIES

Directory 2019
Kerala State Pollution Control Board
344
344
Gas Chromatograph with Auto sampler, ECD and NPD .( Make:Perkin Elmer–CLARUS 500)
Applications:Analysis of the individual organic compounds present in water, waste water, air and air particulates are determined by GC. Environmentally more significant are Pesticide residues, Chlorophenols, PolyChlorinated Biphenyls (PCBs), Dioxins etc
Gas Chromatograph with ATD and FID (Make: Perkin Elmer–CLARUS-500)
Applications:Analysis of the individual organic compounds present in water, waste water, air and air particulates. Environmentally more significant are VOCs, Phenols, Poly nuclear Aromatic Hydrocarbons(PAHs)etc.
High Performance Liquid Chromatograph (HPLC)(Make: Shimadzu Prominence)
Applications:Determination of Carbamate pesticides, Poly nuclear Aromatic Hydrocarbons (PAHS) etc.
TOC Analyser(Make: Analytic Jena)
Applications: Determination of Total Carbon (TC) and In-organic Carbon(IC)(The difference will give TOC)

Directory 2019 345
Kerala State Pollution Control Board
TOX Analyser(Make: EUROGLASS-EDC)
Applications:For the estimation of organic bound Halogens. Screening of large number of samples before specific and complex analysis and for extensive field surveying in case of halogenated compounds pollution.
CHNS Analyser(Make: Eurovector-EA )
Applications:For the determination of Carbon, Nitrogen, Hydrogen and Sulphur content in any sample.
GCMS Analyser Gas Chromatograph- Mass Spectroscopy(with Purge & Trap)

Directory 2019
Kerala State Pollution Control Board
346
346
CENTRAL LABORATORY, KERALA STATE POLLUTION
CONTROL BOARD
has been assessed and accredited in accordance with the standard
ISO/IEC 17025:2017
''General Requirements for the Competence of Testing &
Calibration Laboratories''
for its facilities at
GANDHI NAGAR, KOCHI, ERNAKULAM, KERALA, INDIA
in the field of
TESTING
Certificate Number: TC-8525
Issue Date: 29/05/2019 Valid Until: 28/05/2021
This certificate remains valid for the Scope of Accreditation as specified in the annexure subject to continued
satisfactory compliance to the above standard & the relevant requirements of NABL.(To see the scope of accreditation of this laboratory, you may also visit NABL website www.nabl-india.org)
Signed for and on behalf of NABL
N. Venkateswaran
Chief Executive Officer

Directory 2019 347
Kerala State Pollution Control Board
CoNCLUSIoNWater quality management in India is enacted under the Water (Prevention and Control of Pollution) Act 1974 to maintain wholesomeness of aquatic resources and Air (Prevention and Control of Pollution) Act, 1981 to arrest the deterioration in the air quality. Kerala State Pollution Control Board has undertaken the responsibility of documenting surface and ground water quality of water resources and the air quality in the state.
Surface and ground water quality are monitored under the National Water Quality Monitoring Programme( NWMP) and State Water Quality Monitoring Programme (SWMP) and source water monitoring of Rural water supply schemes. Ambient air quality are monitoredin all districts under National Ambient Air Quality Monitoring (NAMP) and State Ambient Air Quality Monitoring (SAMP)programme. Continuous Ambient Air Quality Monitoring Stations (CAAQMS) are functioning at Thiruvananthapuram, Kollam, Ernakulam, Kozhikode and Kannur districts. Water and air quality are assessed as per the CPCB standards.
The water and air quality data generated are beneficial for planning sustainable development in waste management systems by giving due importance to abatement of environmental pollution.

Directory 2019
Kerala State Pollution Control Board
348
348
Annexure INATIoNAL WATER QUALITY MoNIToRING
PRoGRAMME NETWoRK 2019
SL NO.Name of Water Body Station code Name of stations Monitoring frequency Class
RIVER STATIONS 2018 2019
1 Neyyar 1563 Amaravila Monthly C C
2284 Aruvippuram Monthly C D
2 Mamom 2285 Mamom Bridge Monthly C C
3 Ayroor 2286 Ayroor Bridge Monthly C C
4 Karamana 1155 Moonnattumukku Monthly E E
3471 Aruvikkara Monthly B B
5 Ithikkara 1564 Ayoor Monthly B B
2287 Ithikkara Bridge Monthly E Below E
6 Vamanapuram 1442 Vamanapuram Monthly C C
7 Pallickal 2288 Pallickal Monthly B B
8 Achenkovil 1342 Thumpamon Monthly B B
1443 Chennithala Monthly B B
3465 Kallarakadavu Monthly B B
3466 Pandalam Monthly B B
9 Kallada 42 Perumthottamkadavu Monthly B B
10 Pamba 1156 Chengannoor Monthly B C
1341 Thakazhi Monthly B C
1565 Pamba Down Monthly B B
11 Meenachil 1339 Kidangoor Monthly C C
12 Manimala 1340 Kallooppara Monthly B B
1384 Thondara Monthly B C
13 Periyar 17 Eloor Monthly Below E E
18 Kalady Monthly C C
2333 Muppathadam Monthly C C
2336 Purappillikadavu Monthly Below E E
2334 Pathalam Monthly Below E E
2335 Kalamassery Monthly E C
3468 KWA Aluva Monthly C C
1338 SDP Aluva Monthly C C
14 Muvattupuzha 43 Vettikkattumukku Monthly C C
15 Chalakudy 1154 Pulickakadavu Monthly C C
16 Karuvannur 2289 Karuvannur Bridge Monthly B C
17 Puzhakkal 2290 Puzhakkal Bridge Monthly C B
18 Keecheri 2291 Vadakkancherry Monthly B B
19 Bharathapuzha 2331 Kuttipuram Monthly C B
2332 Pattambi Monthly B B
20 Kadalundi 1566 Thiroorangadi Monthly B B
2293 Hajiyarappilly Monthly B A
21 Tirur 2292 Thalakadathur Monthly Below E Below E
22 Chaliyar 3464 Nilambur Monthly C C
20 Koolimadu Monthly C C
21 Chungappilly Monthly Below E E
23 Kabani 1207 Muthankara Monthly Below E B

Directory 2019 349
Kerala State Pollution Control Board
24 Bhavani 1208 Elachivazhi Monthly B C
25 Kuttiyadi 1567 Estatemukku Monthly B C
26 Mahe 1568 Valayam Monthly C C
27 Kallai 2294 Kallai Bridge Monthly Below E Below E
28 Korapuzha 2295 Kanayankode Monthly Below E Below E
29 Kuppam 1569 Thaliparambu Monthly Below E Below E
2298 Rayoram Monthly C B
30 Thalassery 2296 Pathipalam Monthly C B
31 Anjarakandy 2297 Meruvamba Monthly C B
2319 Anjarakandy Monthly Below E Below E
32 Ramapuram 2299 Ramapuram bridge Monthly Below E Below E
33 Kavai 2301 Kuttiyolpalam Monthly C C
34 Valapattanam 3473 Parassinikadavu Monthly Below E Below E
35 Neeleswaram 1570 Hosdurg Monthly Below E Below E
2302 Nambiarackal Monthly C B
36 Kariangode 1571 Kakkadavu Monthly C B
37 Chandragiri 1572 Padiyathdukka Monthly C B
38 Mogral 2304 Mogral Bridge Monthly Below E Below E
39 Shiriya 2305 Angadimogaru Monthly C B
40 Uppala 2306 Uppala Bridge Monthly Below E Below E
41 Manjeswaram 2307 Bajarakkara Bridge Monthly C B
42 Peruvamba 2300 Chanthappura Monthly C B
RIVULETS/TRIBUTARIES
1 Kadambrayar 2337 Brahmapuram Monthly C E
2338 Manackakadavu Monthly C E
2 Chithrapuzha 1573 Irumpanam Monthly C E
3 Korayar 2326 Kanjikode Monthly B B
4 Pullur 2303 Pullur Bridge Monthly C C
5 Kalpathy puzha 3460 Kalpathy Monthly C C
6 Maniyankode 3459 Maniyankode Monthly B B
FRESH WATER LAKE STATIONS
1 Vellayani 3470 Vellayani Monthly C E
2 Sasthamkotta 1385 Sasthamkotta Monthly B B
3 Pookode 1580 Pookode Monthly A B
ESTUARINE LAKE STATIONS
1 Akkulam 1383 Oruvathilkotta Monthly C D
2 Ashtamudi 1441 Neendakara Monthly Below E Below E
3 Paravur 1574 Paravur Monthly Below E Below E
4 Punnamada lake 1579 Alappuzha Monthly C C
5 Vembanadu lake 1575 Oil Tanker Jetty Monthly Below E Below E
2312 Pathiramanal Monthly Below E E
6 Kodungallur 1577 Kodungallur Monthly Below E Below E
7 Kayamkulam lake 1578 Kayamkulam Monthly Below E Below E
RESERVOIRES ,PONDS & CANAL STATIONS
1 Pazhassi 2318 Pazhassi Monthly C B
2 Edamalayar 2330 Edamalayar Monthly C B
3 Bhoothathankettu 2329 Bhoothathankettu Monthly C C
4 Malampuzha 2328 Malampuzha Monthly B B
5 Periyar(Thekkady) 1576 Thekkady Monthly B C
6 Karapuzha 3458 Karapuzha Monthly B A
7 Mananchira pond 3462 Mananchira Monthly B B

Directory 2019
Kerala State Pollution Control Board
350
350
8 Padmatheertham pond 2325 Padmatheertham Monthly B E
9 Canoli canal 3461 Canoli Monthly Below E Below E
10 Palakkattuthazham thodu 3469 Palakkattuthazham thodu Monthly E D
11 Unthithode 3467 Unthithode Monthly Below E Below E
WELL STATIONS
1 Thiruvanathapuram 1581 Pappanamkode Half Yearly
1582 Nedumangadu Half Yearly
2 Kollam 1583 Kundara Half Yearly
2314 Kureepuzha Half Yearly
2315 KMML Chavara Half Yearly
35 Punalur Half Yearly
3 Kottayam 2308 Fathimapuram Half Yearly
2309 Karoor Half Yearly
2310 Vaikom Half Yearly
2311 Vadavathoor Half Yearly
4 Alappuzha 1584 Cherthala Half Yearly
2313 Sarvodayapuram Half Yearly
5 Ernakulam 19 Eloor Half Yearly
1585 Vyttila Half Yearly
1586 Edayar Half Yearly
1587 Kalamassery Half Yearly
2323 Brahmapuram Half Yearly
6 Thrissur 1588 Poonkunnam Half Yearly
2321 Laloor Half Yearly
2322 Ollur Half Yearly
7 Palakkad 2327 Karukamani Half Yearly
8 Malappuram 1589 Malappuram Half Yearly
2320 Manjery Half Yearly
9 Kozhikode 22 Chungappally Half Yearly
1590 Mavoor Half Yearly
3463 Velliparamba Half Yearly
10 Kannur 1591 Kannur Half Yearly
1592 Payyannur I Half Yearly
2317 Punnelpettippalam Half Yearly
3474 Payyannur II Half Yearly
3472 Parassinikadavu Half Yearly
3475 Karimbam Half Yearly
No Station Details
1 River Stations 65
2 Rivulets/Tributaries 7
3 Reservoir Stations 6
4 Freshwater Lake Stations 3
5 Estuarine Lake Stations 8
6 Canal Stations 3
7 Pond Stations 2
8 Well Stations 34
Total 128

Directory 2019 351
Kerala State Pollution Control Board
Annexure IISTATE WATER QUALITY MoNIToRING PRoGRAMME NETWoRK 2019
Sl. No. Name of Water Body District Village Station
Code Station Name Monitoring Frequency Class
1 Karamana Thiruvananthapuram Peppara K1 Peppara Monthly B
Thiruvananthapuram Aruvikkara 3471 Aruvikkara Monthly B
Thiruvananthapuram Thirumala K2 Mangattukadavu Monthly C
Thiruvananthapuram K3 Pallathukadavu Monthly E
Thiruvananthapuram Thiruvallom K4 Thiruvallom Monthly E
Thiruvananthapuram 1155 Moonattumukku Monthly E
2 Ithikkara Kollam Anchal K5 Kottuvamukku Monthly B
Kollam Edamulakkal 1564 Ayoor Monthly B
Kollam Vellinalloor K6 Vellinalloor Monthly C
Kollam Adichanellore 2287 Ithikkara Monthly Below E
Kollam Adichanellore K7 Uppukadavu Monthly Below E
3 Pallickal Pathanamthitta Nellimugal 2288 Nellimugal Monthly B
Kollam Periyanadu K8 Adoor Monthly C
Kollam Kalladibhagom K9 Thodiyoor Monthly C
4 Achenkovil Kollam Pathanamthitta K10 Aruvappulam Monthly B
Kollam Konni K11 Konni Monthly B
Kollam Kumbazha K12 Kumbazha Monthly B
Kollam Pandalam 3466 Pandalam Monthly B
Kollam Pallipadu K13 Pallippadu Monthly B
5 Kallada Kollam Edamon K14 Urukunnu Monthly C
Kollam Punalur K15 Punallur Monthly C
Kollam Vilakudi 42 Perumthottamkadavu Monthly B
Kollam Pathanapuram K16 Pathanapuram Monthly B
Kollam Enathu K17 Enathu Monthly B
Kollam West Kallada K18 Kannamkottukadavu Monthly E
6 Pamba Pathanamthitta Perunadu K19 Kochupampa Monthly C
Pathanamthitta Perunadu K20 Kakkiyar Monthly D
Pathanamthitta Perunadu K21 Triveni Upstream Monthly D
Pathanamthitta Perunadu K22 Njunagar Monthly D
Alappuzha Perunadu 1565 Pampa Downstream Monthly B
Pathanamthitta Perunadu K23 Vadasserikkara Monthly C
Pathanamthitta Athikkayam K24 Athikkayam Monthly C
Pathanamthitta Ranni K25 Ranni Monthly C
Pathanamthitta Kozhencherry K26 Kozhencherry Monthly C
Pathanamthitta Chenganoor 1156 Chengannoor Monthly C
Pathanamthitta Edatua K27 Edatua Monthly E
Alappuzha Thakazhi 1341 Thakazhi Monthly C
Pathanamthitta Pulinkunnu K28 Pulinkunnu Monthly C
7 Meenachil Kottayam Thalanadu K29 Theekoy Monthly C
Kottayam Bharanganam K30 Bharanganam Monthly C

Directory 2019
Kerala State Pollution Control Board
352
352
Kottayam Mutholi K31 Kadappattoor Monthly C
Kottayam Ayarkunnam K32 Punnathara Monthly C
Kottayam Kottayam K33 Thazhathangadi Monthly C
Kottayam Kumarakam K34 Kumarakam Monthly C
8 Manimala Alappuzha Yendhayar K35 Yendhayar Monthly B
Alappuzha Mundakayam K36 Kottikkal Monthly C
Alappuzha Erumeli K37 Erumeli Monthly C
Alappuzha Cheruvally K38 Pazhayidam Monthly C
Alappuzha Mallappilly K39 Valakkayam Monthly C
Alappuzha Vellavoor K40 Manimala Monthly C
Alappuzha Mallapally K41 Mallappally Monthly C
Alappuzha Kaviyoor K42 Thottabhagam Monthly C
9 Muvattupuzha Kottayam Muttam K43 Malankara Dam Monthly C
Kottayam Velloorkunnam K44 Muvattupuzha Monthly C
Kottayam Muvattupuzha K45 Peruvammoozhy Monthly C
Kottayam Ramamangalam K46 Ramamangalam Monthly C
Kottayam Vellore K47 Piravom Monthly C
Kottayam Vadayar 43 Vettikkattumukku Monthly C
Kottayam Chempu K48 Murinjapuzha Monthly C
10 Chalakudy Thrissur Pariyaram K49 Peringal Bridge Monthly B
Thrissur Pariyaram K50 Vettilappara Monthly B
Thrissur Pariyaram K51 Kanjirapilly Monthly B
Thrissur Muringoor K52 Chalakkudy Bridge Monthly C
Thrissur Kalloor K53 Pulikkakadavu Monthly B
Thrissur Kalloor K54 Palapuzhakadavu Monthly B
11 Karuvannur Thrissur Puthoor K55 Kainoor Monthly B
Thrissur Nandipulam K56 Mupliyam Bridge Monthly C
Thrissur Arattupuzha K57 Palakkadavu Monthly B
Thrissur Porathissery 2289 Karuvannoor Bridge Monthly C
Thrissur Karalam K58 Kottenkode Monthly B
Thrissur Karalam K59 Karanchira Monthly C
12 Bharathapuzha Palakkad Pudussery K60 Naragampilly Monthly B
Palakkad Marutharode K61 Arangottukulumb Monthly B
Palakkad Parali K62 Parali Monthly B
Palakkad Erimayur K63 Tripalur Monthly C
Palakkad Vadakkancherry K64 Mangalam Monthly C
Palakkad Lakkidi K65 Lakkidi Monthly B
Palakkad Shornur K66 Shornur Monthly B
Palakkad Pattambi 2332 Pattambi Monthly B
Palakkad Cherupulassery K67 Thootha Monthly B
Malappuram Kuttipuram 2331 Bharathapuzha at Kuttipuram Monthly B
Malappuram Thavanoor K68 Thavannoor Monthly B
Malappuram Thavanoor K69 Nariparamba Monthly B
13 Kadalundi Malappuram Nenmeni K70 Oravambrum Monthly A
Malappuram Anakkayam K71 Anakkayam Monthly A

Directory 2019 353
Kerala State Pollution Control Board
Malappuram Panakad 2293 Hajiyarappilly Monthly A
Malappuram Oorakam K72 Manikuth Monthly A
Malappuram Vengara K73 Kooriyadu Monthly A
14 Tirur Malappuram Thalakad K74 Kooloopalam Monthly C
Malappuram Thalakad K75 Ezhur Monthly C
Malappuram Thalakad K76 Thazhepalam Monthly Below E
Malappuram Cheriyamundam 2292 Thalakadathur Monthly Below E
Malappuram Thalakad K77 Mangattiri Monthly Below E
15 Chaliyar Kozhikode Chaliyar K78 Kuruvanpuzha Monthly C
Kozhikode Mambad K79 Vadapuram Monthly C
Kozhikode Mambad K80 Mundaymthodu Monthly C
Kozhikode Arecode K81 Areacode Monthly C
Kozhikode Feroke K82 Feroke Monthly E
16 Kabani Wayanad Panamaram k83 U/S of Panamaram Monthly B
Wayanad Panamaram K84 D/S of Panamaram Monthly B
Wayanad Pulpally K85 DTPC Monthly B
Wayanad Pulpally K86 Forest Kadavu Monthly B
Wayanad Thrissilery K87 Thonikkadavu Monthly B
Wayanad Mananthavadi K88 U/S of Mananthavadi Monthly B
Wayanad Nallurnada K89 D/S of Mananthavadi Monthly B
17 Bhavani Palakkad Agali K90 Thavalam Monthly B
Palakkad Pudur K91 Kottathara Monthly B
18 Korapuzha Kozhikode Elathur K92 Purakkattiri Monthly Below E
Kozhikode Chemancheri K93 Anapparakkadavu/Vengalam Monthly Below E
19 Valapattanam Kannur Padiyoor 2318 Pazhashi Reservoir Monthly B
Kannur Irikkur K94 Irikkur Monthly B
Kannur Chengalayi K95 Chengalayi Monthly Below E
Kannur Parassinikadavu 3473 Parashinikkadavu Monthly Below E
Kannur Valapattanam K96 Valapattanam Monthly Below E
20 Shiriya Kasaragod Enmakaje K97 Yethadka Monthly B
Kasaragod Enmakaje K98 Bakkilapadavu Monthly B
Kasaragod Padre K99 Swargathodu Monthly B
Kasaragod Padre K100 Vani Nagar Monthly B
Kasaragod Nettangie K101 Sulliapadavu Monthly B
21 Thodupuzha Idukki Muttom K102 Near Malankara Dam Monthly D
Idukki Thodupuzha K103 Near Mooppilkkadavu Bridge Monthly D
Idukki Thodupuzha K104Near Pappootty Bar &
RestaurantMonthly D
Idukki Thodupuzha K105 Near Vengalloor Bridge Monthly D
Idukki Chittoor K106 Thookkupalam Near Chittoor Monthly D
22 Munnar Idukki Munnar K108 Nallathanni Monthly D
Idukki KDH Village K109 Kundala Monthly D
Idukki KDH Village K110 Muthirapuzha Monthly D
Idukki KDH Village K111 Near KSEB Dam Monthly D
Idukki Marayoor K107 Pambar Monthly D

Directory 2019
Kerala State Pollution Control Board
354
354
23 Vellayani Lake Thiruvananthapuram 3470 Vandithadam Monthly E
Thiruvananthapuram K112 Kakkamoola Left Monthly C
Thiruvananthapuram K113 Kakkamoola Right Monthly C
Thiruvananthapuram K114 Vavamoola Left Monthly C
Thiruvananthapuram K115 Vavamoola Right Monthly C
Thiruvananthapuram K116 Agriculture College Monthly C
24 Sastamkotta Lake Kollam Sasthamkotta 1385 Sasthamkotta Monthly B
Kollam Sasthamkotta K117 Ambalakkadavu Monthly B
Kollam Sasthamkotta K118 KWA Pump House Monthly B
Kollam West Kallada K119 Kottakkuzhi Monthly B
Kollam West Kallada K120 Villanthra Monthly B
Kollam Mynagappally K121 Pottakkannamukku Monthly B
Kollam West Kallada K122 Vattolikkadavu Monthly B
25 Pookode Lake Wayanad Kunnathidavaka K123 Boat Jetty Monthly B
Wayanad Kunnathidavaka K124 Deepest Point Monthly B
Wayanad Kunnathidavaka K125 Silt Depositing Zone Monthly A
Wayanad Kunnathidavaka 1580 Centre Point Monthly B
Wayanad Kunnathidavaka K126 Second Deepest Point Monthly A
26 Thekkady Lake Kottayam Kumali K127 Canal Shutter Monthly C
Kottayam Kumali K128 Boat Landing Monthly C
Idukki Kumali 1576 Dam Site Monthly C
Kottayam Kumali K129 Padikkayam Monthly C
Kottayam Kumali K130 Thannikudy Monthly B

Directory 2019 355
Kerala State Pollution Control Board
Annexure IIIGEOGRAPHICAL COORDINATES OF RIVER STATIONS (NWMP & SWMP)
Sl. No.Name of Water Body District Station Code Station Name Latitude Longitude
RIVER STATIONS
1 Neyyar Thiruvananthapuram 1563 Amaravila 08°23'29"N 77°05'55"E
Thiruvananthapuram 2284 Aruvippuram 08°25'25"N 77°05'35"E
2 Mamom Thiruvananthapuram 2285 Mamom Bridge 08°40'39"N 76°49'38"E
3 Ayroor Thiruvananthapuram 2286 Ayroor Bridge 08°46'26"N 76°43'31"E
4 Karamana Thiruvananthapuram K1 Peppara 08°37'22.39"N 77°08'16.89"E
Thiruvananthapuram 3471 Aruvikkara 08°34'21"N 77°01'13"E
Thiruvananthapuram K2 Mangattukadavu 08°29'47.63"N 77°0'14.46"E
Thiruvananthapuram K3 Pallathukadavu 08°27'18.58"N 76°57'31.7"E
Thiruvananthapuram K4 Thiruvallom 08°26'30.07"N 76°57'14.89"E
Thiruvananthapuram 1155 Moonnattumukku 08°26'29"N 76°57'12"E
5 Ithikkara Kollam K5 Kottuvamukku 08°54'30"N 76°53'55"E
Kollam 1564 Ayoor 08°53'25"N 76°46'28"E
Kollam K6 Vellinalloor 08°51'27"N 76°46'28"E
Kollam 2287 Ithikkara 08°51'43"N 76°46'51"E
Kollam K7 Uppukadavu 08°50'14"N 76°40'20"E
6 Vamanapuram Thiruvananthapuram 1442 Vamanapuram 08°43'38"N 76°53'54"E
7 Pallickal Pathanamthitta 2288 Nellimugal 09°07'33"N 76°42'14"E
Kollam K8 Adoor 09°09'43"N 76°43'23"E
Kollam K9 Thodiyoor 09°03'38"N 76°33'58"E
8 Achenkovil Kollam K10 Aruvappulam 09°15'25"N 76°48'16"E
Kollam K11 Konni 09°13'49"N 76°51'18"E
Kollam K12 Kumbazha 09°15'23"N 76°48'15"E
Pathanamthitta 3465 Kallarakadavu 09°15'29"N 76°47'23"E
Pathanamthitta 1342 Thumpamon 09°13'48"N 76°43'49"E
Pathanamthitta 3466 Pandalam 09°14'01"N 76°40'22"E
Kollam K13 Pallippadu 09°16'41"N 76°29'26"E
Alappuzha 1443 Chennithala 09°15'42"N 76°31'50"E
9 Kallada Kollam K14 Urukunnu 08°59'12"N 77°01'15"E
Kollam K15 Punallur 09°01'04"N 76°55'41"E
Kollam 42 Perumthottamkadavu 09°04'57"N 76°51'59"E
Kollam K16 Pathanapuram 09°04'04"N 76°51'21"E
Kollam K17 Enathu 09°05'18"N 76°45'19"E
Kollam K18 Kannamkottukadavu 09°00'1522"N 76°6103'24"E
10 Pamba Pathanamthitta K19 Kochupampa 09°24'.823"N 77°04'.246"E
Pathanamthitta K20 Kakkiyar 09°24'.798"N 77°04'.236"E
Pathanamthitta K21 Triveni Upstream 09°24'.801"N 77°04'.029"E
Pathanamthitta K22 Njunagar 09°41'.648"N 77°06'.658"E
Alappuzha 1565 Parumala (Pamba Down) 09°32'84"N 76°53'67"E
Pathanamthitta K23 Vadasserikkara 09°34'153"N 76°82'924"E
Pathanamthitta K24 Athikkayam 09°22'.911"N 76°50'.113"E

Directory 2019
Kerala State Pollution Control Board
356
356
Pathanamthitta K25 Ranni 09°22'.785"N 76°46'.741"E
Pathanamthitta K26 Kozhancheri 09°20'.218"N 76°42'.235"E
Alappuzha 1156 Chengannur 09°33'54"N 76°60'81"E
Pathanamthitta K27 Edatua 09°21'.860"N 76°28'.614"E
Alappuzha 1341 Thakazhi 09°37'053"N 76°42'159"E
Pathanamthitta K28 Pulinkunnu 09°26'944"N 76°26'729"E
11 Meenachil Kottayam K29 Theekoy 09°41'950"N 76°43'805"E
Kottayam K30 Bharanganam 09°41'950"N 76°43.805"E
Kottayam K31 Kadappattoor 09°42'26"N 76°40'19"E
Kottayam 1339 At Kidangoor 09°68'21"N 76°60'80"E
Kottayam K32 Punnathara 09°26'596"N 76°25'811"E
Kottayam K33 Thazhathangadi 09°35'443"N 76°29'952"E
Kottayam K34 Kumarakam 09°62'85"N 76°.42'980"E
12 Manimala Pathanamthitta 1340 Kalloopara 09°23'34"N 76°38'40"E
Pathanamthitta 1384 Thondra 09°21'64"N 76°35'23"E
Alappuzha K35 Yendhayar 09.617921° N 76.891521° E
Alappuzha K36 Kottikkal 09°35'480"N 76°52'980"E
Alappuzha K37 Erumeli 09°33'600"N 76°48'821"E
Alappuzha K38 Pazhazhyidam 09°31'579"N 76°46'966"E
Alappuzha K39 Valakkayam 09.512090N 76.780575 E
Alappuzha K40 Manimala 09°28'494"N 76°44'530"E
Alappuzha K41 Mallappally 09°26'820"N 76°39'645"E
Alappuzha K42 Thottabhagam 09°23'158"N 76°37'159"E
13 Periyar Ernakulam 18 Kalady 10°09'40"N 76°26'31"E
Ernakulam 3468 KWA Aluva 10°06'43"N 76°21'38"E
Ernakulam 1338 SDP Aluva 10°05'45"N 76°20'36"E
Ernakulam 2333 Muppathadam 10°05'30"N 76°20'02"E
Ernakulam 17 Eloor 10°04'22"N 76°16'52"E
Ernakulam 2334 Pathalam 10°05'15"N 76°17'55"E
Ernakulam 2336 Purappillikadavu 10°08'41"N 76°16'56"E
Ernakulam 2335 Kalamassery 10°03'48"N 76°19'06"E
14 Muvattupuzha Kottayam K43 Malankara Dam 09°51'9.36"N 76°44'41"E
Kottayam K44 Muvattupuzha 09°59'21.84"N 76°34'44.4"E
Kottayam K45 Peruvammoozhy 09°58'33.24"N 76°30'26.3"E
Kottayam K46 Ramamangalam 09°56'8.88"N 76°29'50.64"E
Kottayam K47 Piravom 09°52'23.16"N 76°29'31.2"E
Kottayam 43 Vettikkattumukku 09°48'13.7"N 76°27'20.16"E
Kottayam K48 Murinjapuzha 09°49'0.12"N 76°23'38.4"E
15 Chalakudy Thrissur K49 Peringal Bridge 10°18'09.84"N 76°35'46.92"E
Thrissur K50 Vettilappara 10°17'33.86"N 76°28'39.32"E
Thrissur K51 Kanjirapilly 10°18'14.59"N 76°23'48.29"E
Thrissur K52 Chalakkudy Bridge 10°17'41.04"N 76°20'11.06"E
Thrissur K53 Pulikkakadavu 10°14'01.75"N 76°1953.26"E
Thrissur 1154 Pulickakadavu 10°12'48"N 76°19'58"E
Thrissur K54 Palapuzhakadavu 10°14'01.75"N 76°2010.96'E

Directory 2019 357
Kerala State Pollution Control Board
16 Karuvannur Thrissur K55 Kainoor 10°29'26.04"N 76°16'30.06"E
Thrissur K56 Mupliyam Bridge 10°24'07.75"N 76°19'58.50"E
Thrissur K57 Palakkadavu 10°25'27.75"N 76°14'11.26"E
Thrissur 2289 Karuvannur at Karuvannur Bridge 10°24'14"N 76°12'41"E
Thrissur K58 Kottenkode 10°24'07.59"N 76°12'20.31"E
Thrissur K59 Karanchira 10°24'06.68"N 76°09'06.31"E
17 Puzhakkal Thrissur 2290 Puzhakkal at Puzhakkal Bridge 10°32'44"N 76°10'41"E
18 Keecheri Thrissur 2291 Keechery at Vadakkancherry 10°37'08"N 76°06'53"E
19 Bharathapuzha Palakkad K60 Naragampilly 10°42'.974"N 76°43'.099"E
Palakkad K61 Arangottukulumb 10°48'08.9"N 76°42'10.8"E
Palakkad K62 Parali 10°47'.850"N 76°33'.551"E
Palakkad K63 Tripalur 10°38'.915"N 76°29'.718"E
Palakkad K64 Mangalam 10°36'.028"N 76°29'.396"E
Palakkad K65 Lakkidi 10°54'.940"N 76°17'.405"E
Palakkad K66 Shornur 10°45'.234"N 76°16'.513"E
Palakkad 2332 Bharathapuzha at Pattambi 10°47'57"N 76°10'49"E
Palakkad K67 Thootha 10°54'.940"N 76°17'.405"E
Malappuram 2331 Bharathapuzha at Kuttipuram 10°50'26"N 76°01'20"E
Malappuram K68 Thavannoor 10°85'4286"N 75°97'6887"E
Malappuram K69 Nariparamba 10°81'9095"N 75°96'.3927"E
20 Kadalundi Malappuram K70 Oravambrum 11°05'.095"N 76°13'.175"E
Malappuram K71 Anakkayam 11°04'.924"N 76°07'.335"E
Malappuram 2293 Hajiyarappilly 11°03'111"N 76°03'505"E
Malappuram K72 Manikuth 11°02'.817"N 76°01'.017"E
Malappuram K73 Kooriyadu 11°02'.547"N 75°56'.375"E
Malappuram 1566 Thiroorangady 11°02'10"N 76°56'14"E
21 Tirur Malappuram K74 Kooloopalam 10°52'.853"N 75°57'.166"E
Malappuram K75 Ezhur 10°91'6055"N 75°.944698"E
Malappuram K76 Thazhepalam 10°91'4562"N 75°91'.8419"E
Malappuram 2292 Tirur at Thalakkadathur 10°55'975"N 75°560'48"E
Malappuram K77 Mangattiri 10°53'.499"N 75°55'.011"E
22 Chaliyar Malappuram 3464 At Nilambur 11°16'35"N 76°13'18"E
Kozhikode K78 Kuruvanpuzha 11°31'117"N 76°19'993"E
Kozhikode K79 Vadapuram 11°26'261"N 76°20'385"E
Kozhikode K80 Mundayamthodu 11°27'064"N 76°18'252"E
Kozhikode K81 Areacode 11°13'.548"N 76°03'.435"E
Kozhikode 20 At Koolimadu 11°16'06"N 75°58'41"E
Kozhikode 21 At Chungappilly 11°14'31"N 75°53'57"E
Kozhikode K82 Feroke 11°18'.0769"N 75°82'.27793"E
23 Kabani Wayanad 1207 At Muthankara 11°48'31"N 76°05'08"E
Wayanad K83 U/S of Panamaram 11°72'46"N 76°05'81"E
Wayanad K84 D/S of Panamaram 11°74'15"N 76°07'41"E
Wayanad K85 DTPC 11°82'19"N 76°08'99"E
Wayanad K86 Forest Kadavu 11°74'15"N 76°07'41"E
Wayanad K87 Thonnikkadavu 11°84'53"N 76°11'35"E

Directory 2019
Kerala State Pollution Control Board
358
358
Wayanad K88 U/S of Mananthavadi 11°79'98"N 75°99'76"E
Wayanad K89 D/S of Mananthavadi 11°78'77"N 76°00'29"E
24 Bhavani Palakkad K90 Thavalam 11°05'.603"N 76°35'.456"E
Palakkad K91 Kottathara 11°09'.795"N 76°41'.488"E
Palakkad 1208 Bhavani at Elachivazhi 11°09'22"N 76°40'07"E
25 Kuttiyadi Kozhikode 1567 At Kuttiyadi Estate 11°35'58"N 75°50'10"E
26 Mahe Kozhikode 1568 At Valayam 11°42'05"N 75°39'59"E
27 Kallai Kozhikode 2294 At Kallai Bridge 11°14'13"N 75°47'16"E
28 Korapuzha Kozhikode 2295 At Kanayankode 11°26'38"N 75°43'42"E
Kozhikode K92 Purakkattiri 11°34'.1416"N 75°76'.1122"E
Kozhikode K93 Anapparakkadavu/Vengalam 11°37'.1393"N 75°74'.2508"E
29 Kuppam Kannur 2298 At Rayoram 12°12'35"N 75°26'28"E
Kannur 1569 At Thaliparamba 12°47'12.7"N 75°34'06.6"E
30 Thalassery Kannur 2296 At Pathipalam 12°47'12.7"N 75°34'06.6"E
31 Ancharakkandy Kannur 2297 At Meruvamba 11°52'30.4"N 75°34'38.4"E
Kannur 2319 At Ancharakkandy 11°52'58.2"N 75°31'45.7"E
32 Ramapuram Kannur 2299 At Ramapuram Bridge 12°02'47"N 75°15'56"E
33 Kavai Kannur 2301 At Kuttiyolpalam 12°09'35.4"N 75°12'34.2"E
34 Valapattanam Kannur 2318 Pazhassi Reservoir 11°59'26"N 75°37'05"E
Kannur K94 Irikkoor 11°59'.427"N 75°32'.866"E
Kannur K95 Chengalayi 12°02'.228"N 75°29'.344"E
Kannur 3473 At Parassinikadavu 11°59'06"N 75°24'13.5"E
Kannur K96 Valapattanam 11°55'.833"N 75°21'.207"E
35 Neeleswaram Kasaragod 2302 At Nambiarckal 12°19'280"N 75°05'02"E
Kasaragod 1570 At Hosdurg 12°15'11.3"N 75°07'25.5"E
36 Kariangode Kasaragod 1571 At Kakkadavu 12°16'.029"N 75°16'920"E
37 Chandragiri Kasaragod 1572 At Padiyathadka 12°33'576"N 74°57'372"E
38 Mogral Kasaragod 2304 At Mogral Bridge 12°16'179"N 75°05'015"E
39 Shiriya Kasaragod K97 Yethadka 12°36'07.7"N 75°07'34.5"E
Kasaragod K98 Bakkilapadavu 12°40'20.4"N 75°05'21.8"E
Kasaragod K99 Swargathodu 12°38'11.9"N 75°08'15.3"E
Kasaragod K100 Vani Nagar 12°35'38.8"N 75°10'56.8"E
Kasaragod K101 Sulliapadavu 12°36'34.5"N 76°12'09.0"E
Kasaragod 2305 At Angadimogaru 12°16'129"N 75°07'234"E
40 Uppala Kasaragod 2306 At Uppala Bridge 12°19'279"N 74°05'012"E
41 Manjeswaram Kasaragod 2307 At Bajarkkara Bridge 12°16'179"N 75°07'234"E
42 Peruvamba Kannur 2300 At Chandappura 12°06'30.7"N 75°17'12"E
43 Thodupuzha Idukki K102 Near Malankara Dam 09°50'908"N 76°44'632"E
Idukki K103 Near Mooppilakkadavu Bridge 09°89'44015"N 76°71'6438"E
Idukki K104 Near Pappootty Bar & Restaurant 09°89'750"N 76°71'146"E
Idukki K105 Near Vengalloor Bridge 09°90'102"N 76°70'569"E
Idukki K106 Thookkupalam Near Chittoor 09°91'690"N 76°68'440"E
44 Munnar Idukki K107 Pambar 10°51'51"N 77°10'112"E
Idukki K108 Nallathanni 10°09'451"N 77°54'48"E
Idukki K109 Kundala 10°84'48"N 77°62'74"E

Directory 2019 359
Kerala State Pollution Control Board
Idukki K110 Muthirapuzha 10°81'99"N 77°62'24"E
Idukki K111 Near KSEB Dam 10°70'74"N 77°06'287"E
RIVULETS/TRIBUTARIES
1 Kadambrayar Ernakulam 2338 Manakkakadavu 10°12'48"N 76°19'58"E
Ernakulam 2337 Brahmapuram 09°59'38"N 76°21'42"E
2 Chithrapuzha Ernakulam 1573 Irumpanam 09°59'30"N 76°21'07"E
3 Korayar Palakkad 2326 Korayar at Kanjikode 10°47'44"N 76°46'49"E
4 Pullur Kasaragod 2303 At Pullur Bridge 12°20'595"N 75°05'560"E
5 Kalpathypuzha Palakkad 3460 Kalpathipuzha at Kalpathi 10°47'25"N 76°38'23"E
6 Maniyankodepuzha Wayanad 3459 Maniyankode Bridge 11°37'35"N 76°03'32"E
FRESH WATER LAKE STATIONS
1 Vellayani Lake Thiruvananthapuram 3470 Vandithadam 08°39'11"N 76°48'47"E
Thiruvananthapuram K112 Kakkamoola Left 08°42'81526"N 76.9947168 E
Thiruvananthapuram K113 Kakkamoola Right 08°42'81526"N 76.9947168 E
Thiruvananthapuram K114 Vavamoola Left 08°412'849"N 76°99'.4432"E
Thiruvananthapuram K115 Vavamoola Right 08°412'849"N 76°99'.4432"E
Thiruvananthapuram K116 Agriculture College 08°43'22797"N 76°99'01514"E
2 Sasthamkotta Lake Kollam 1385 Sasthamkotta Lake 09°04'24"N 76°37'30"E
Kollam K117 Ambalakkadavu 09°04'00"N 76°62'89"E
Kollam K118 KWA Pump House 09°04'24"N 76°62'30"E
Kollam K119 Kottakkuzhi 09°03'02"N 76°61'41"E
Kollam K120 Villanthra 09°03'21"N 76°62'50"E
Kollam K121 Pottakkannamukku 09°03'45"N 76°61'34"E
Kollam K122 Vattolikkadavu 09°03'37"N 76°63'09"E
3 Pookode Lake Wayanad K123 Boat Jetty 11°54'09"N 76°02'72"E
Wayanad K124 Deepest Point 11°54'13"N 76°02'74"E
Wayanad K125 Silt Depositing Zone 11°54'24"N 76°02'81"E
Wayanad 1580 Pookode Lake 11°32'26"N 76°01'37"E
Wayanad K126 Second Deepest Point 11°54'27"N 76°02'67"E
ESTUARINE LAKE STATIONS
1 Akkulam Thiruvananthapuram 1383 Oruvathilkotta 08°29'39"N 76°55'52"E
2 Ashtamudi Lake Kollam 1441 Astamudi Lake 08°48'19"N 76°40'01"E
3 Paravur Lake Kollam 1574 Paravur Lake 09°14'01"N 76°40'14"E
4 Punnamada Lake Alappuzha 1579 Punnamada lake 09°30'02"N 76°21'13"E
5 Vembanadu Lake Alappuzha 2312 Pathiramanal 09°37'11"N 76°22'59"E
Ernakulam 1575 Oil Tanker Jetty 09°57'59"N 76°16'44"E
6 Kodungallur Lake Ernakulam 1577 Kodungallur Lake 10°11'58"N 76°12'00"E
7 Kayamkulam Lake Alappuzha 1578 Kayamkulam lake 09°09'12"N 76°28'49"E
RESERVOIRS, PONDS & CANAL STATIONS
1 Pazhassi RSVR Kannur 2318 Pazhassi Reservoir 11°59'26"N 75°37'05"E
2 Edamalayar RSVR Ernakulam 2330 Edamalayar Reservoir 10°13'13"N 76°42'21"E
3 Bhoothathankettu RSVR Ernakulam 2329 Bhoothathankettu Reservoir 10°08'06"N 75°39'41"E
4 Malampuzha RSVR Palakkad 2328 Reservoir at Malampuzha 10°49'44"N 76°40'51"E
5 Periyar(Thekkady Lake) Kottayam K127 Canal Shutter 09°59'69"N 77°17'27"E
Kottayam K128 Boat Landing 09°57'75"N 77°17'99"E

Directory 2019
Kerala State Pollution Control Board
360
360
Idukki 1576 Thekkady Lake 09°52'94"N 77°14'43"E
Kottayam K129 Padikkayam 09°55'04"N 77°15'68"E
Kottayam K130 Thannikudy 09°55'04"N 77°15'68"E
6 Karapuzha RSVR Wayanad 3458 Karapuzha Dam at Wayanad 11°37'03"N 76°10'16"E
7 Mananchira Pond Malappuram 3462 At Kozhikode 11°15'18"N 75°46'46"E
8 Padmatheertham Pond Thiruvananthapuram 2325 Padmatheertham 08°28'58"N 76°56'43"E
9 Canoli Canal Kozhikode 3461 At Eranjikkal 11°19'14"N 76°45'31"E
10 Palakkattuthazhamthodu Ernakulam 3469Palakkattuthazhamthodu at
Perumbavoor10°06'51"N 76°27'56"E
11 Unthithode Canal Ernakulam 3467 Unthithodu canal at Eloor 10°04'17"N 76°17'10"E
gROUND WATER (WELL STATIONS)
1 Thiruvananthapuram Thiruvananthapuram 1581 Well at Pappanamcode 08°28'27"N 76°58'87"E
Thiruvananthapuram 1582 Well at Nedumangadu 08°36'26"N 76°59'89"E
2 Kollam Kollam 35 Well at Punalur 11°14'31"N 75°53'57"E
Kollam 1583 Well at Kundara 08°57'22"N 76°40'26"E
Kollam 2315 Well at Chavara 09°00'28"N 76°32'08"E
Kollam 2314 Well at Kureepuzha 08°54'26"N 76°33'32"E
3 Alappuzha Alappuzha 2313 Well at Sarvodayapuram 09°33'18"N 76°19'17"E
Alappuzha 1584 Well at Cherthala 09°41'33"N 09°41'33"E
4 Kottayam Kottayam 2308 Well at Fathimapuram 09°44'95"N 76°55'37"E
Kottayam 2309 Well at Karoor 09°73'84"N 76°68'48"E
Kottayam 2310 Well at Vaikom 09°72'16"N 76°39'27"E
Kottayam 2311 Well at Karoor 09°59'51"N 76°56'32"E
5 Ernakulam Ernakulam 1585 Well at Vyttila 09°58'08"N 76°19'01"E
Ernakulam 1586 Well at Edayar 10°05'18"N 76°18'09"E
Ernakulam 1587 Well at Kalamassery 10°02'50"N 76°19'00"E
Ernakulam 19 Well at Eloor 10°04'22"N 76°18'27"E
Ernakulam 2323 Well at Brahmapuram 09°59'28"N 76°21'49"E
Ernakulam 2324 Ambalamughal Borewell 09°59'03"N 76°21'49"E
6 Thrissur Thrissur 2321 Well at Laloor 10°30'55"N 76°11'09"E
Thrissur 2322 Well at Ollur 10°28'54"N 76°11'07"E
Thrissur 1588 Well at Punkunnam 10°22'29"N 76°12'29"E
7 Palakkad Palakkad 2327 Well at Karukamani 10°41'46"N 76°43'25"E
8 Malappuram Malappuram 1589 Well at Malappuram 11°02'48"N 76°05'03"E
Malappuram 2320 Well at Manjeri 11°06'40"N 76°08'26"E
9 Kozhikode Kozhikode 22 Well at Chungappilly 11°14'37"N 76°53'53"E
Kozhikode 1590 Well at Mavoor 11°15'39"N 75°57'07"E
Kozhikode 3463 Well at Velliparamba 11°16'08"N 76°50'30"E
10 Kannur Kannur 1591 Well at Kannur 11°05'264"N 75°022'17"E
Kannur 1592 Well at Payyannur Janatha Mill 12°08'88"N 75°12'86"E
Kannur 2317 Well at Punnolpettipalam 11°53'22"N 75°30'92"E
Kannur 2316 Well at Chelora Trenching Ground 11°54'04"N 75°26'31"E
Kannur 3472 Well at Parassinikadavu Temple 11°54'29"N 75°26'47"E
Kannur 3474 Well at Payyannur (Murukoil) 12°07'15"N 75°12'31"E
Kannur 3475 Well at Karimbam 12°02'34"N 75°22'42"E

Directory 2019 361
Kerala State Pollution Control Board
Annexure IVWATER QuALITy CRITERIA (CPCB)
The water quality management in India is performed under the provisions of Water (Prevention and Control of Pollution) Act, 1974. But the Act does not define the level of wholesomeness to be maintained or restored in different water bodies of the country. It was considered ambitious to maintain or restore all natural water body at prestine level. Planning pollution control activities to attain such a goal is bound to be deterrent to developmental activities and is also cost prohibitive. Thus the Central Pollution Control Board evolved a concept of “Designated Best Use (DBU) to define the level of wholesomeness of the different water bodies to be maintained or restored according to the primary use of the water body.
use based classification of surface waters in India.
Designated-Best-UseClass of
waterCriteria
Drinking Water Source without conventional treatment but after disinfection
A
Total Coliforms Organism MPN/100ml shall be 50 or lesspH between 6.5 and 8.5
Dissolved Oxygen 6mg/l or moreBiochemical Oxygen Demand 5 days 20C 2mg/l or less
Outdoor bathing (Organised) BTotal Coliforms Organism MPN/100ml shall be 500 or less pH between 6.5 and
8.5 Dissolved Oxygen 5mg/l or moreBiochemical Oxygen Demand 5 days 20C 3mg/l or less
Drinking water source after conventional treatment and disinfection
CTotal Coliforms Organism MPN/100ml shall be 5000 or less pH between 6 to 9
Dissolved Oxygen 4mg/l or moreBiochemical Oxygen Demand 5 days 20C 3mg/l or less
Propagation of Wild life and Fisheries DpH between 6.5 to 8.5 Dissolved Oxygen 4mg/l or more
Free Ammonia (as N) 1.2 mg/l or less
Irrigation, Industrial Cooling, Controlled Waste disposal
E
pH between 6.0 to 8.5Electrical Conductivity at 25C micro mhos/cm Max.2250
Sodium absorption Ratio Max. 26Boron Max. 2mg/l
Class-E Not Meeting A, B, C, D & E Criteria

Directory 2019
Kerala State Pollution Control Board
362
362
Annexure VNATIONAL AMBIENT AIR QuALITy STANDARDS (NAAQS)
Sl No. Pollutant
Time weight-ed
average
Concentration in Ambient Air
Industrial, Resi-dential, Rural &
other area
Ecologically Sensi-tive area (notified by Central Govt.
Method of measurement
(1) (2) (3) (4) (5) (6)
1Sulphur dioxide (SO2) µg/m3 Annual * 50
201. Improved West and Gaeke Method2. Ultraviolet Fluorescence
24 Hours ** 8080
2
Oxides of Nitrogen (NO2) µg/m3 Annual * 40
301. Modified Jacob & Hochheiser
(Na-Arsenite) 2. Chemiluminescence
24 Hours ** 8080
3Particulate Matter (Size less than 10µm) or PM10 µg/m3 Annual * 60 60
1. Gravimetric2. TOEM3. Beta attenuation
24 Hours ** 100 100
4Particulate Matter (Size less than 2.5µm) or PM2.5 µg/m3 Annual * 40 40
1. Gravimetric2. TOEM3. Beta attenuation
24 Hours ** 60 60
5Ozone (O3)µg/m3 8 Hours * 100 100
1. UV Photometric2. Chemiluminescence3. Chemical Method
1 Hour ** 180 180
6Lead (Pb)µg/m3 Annual * 0.5 0.5
1. AAS / ICP method after sam-pling on EPM 2000 or equiva-lent filter paper
2. ED-XRF using Teflon filter24 Hours ** 1.0 1.0
7Carbon Monoxide (CO) mg/m3 8 Hours ** 02 02 1. Non Dispersive Infrared
(NDIR) Spectroscopy1 Hour 04 04
8Ammonia (NH3)µg/m3 Annual * 100 100 1. Chemiluminescence
2. Indophenol blue method24 Hours ** 400 400
9Benzene (C6 H6)µg/m3
Annual *
05 051. Gas Chromatography based
continuous analyzer2. Adsorption and Desorption
followed by GC Analysis
10Benzo (a) Pyrene (BaP) – Particulate phase only, ng/m3
Annual *
01 01 - Solvent extraction followed by HPLC/GC analysis
11Arsenic (As)ng/m3 Annual * 06 06
1. - AAS / ICP method after sampling on EPM 2000 or equiva-lent filter paper
12 Nickel (Ni), ng/m3 Annual * 20 201. - AAS / ICP method after sampling on EPM 2000 or equiva-lent filter paper
* Annual arithmetic mean of minimum 104 measurements in a year twice a week 24 hourly at uniform interval.** 24 hourly/8 hourly values should be met 98% of the time in a year. However, 2% of the time, it may exceed but not
on two consecutive days.
NOTE1. National Ambient Air Quality Standard: The levels of air quality necessary with an adequate margin of safety, to protect
the public health, vegetation and property.2. Whenever and wherever two consecutive values exceed the limit specified above for the respective category, it would
be considered adequate reason to institute regular/continuous monitoring and further investigations

Directory 2019 363
Kerala State Pollution Control Board
Annexure VIPARAMETERS, UNITS, METHoDS & REfERENCES
SL.No PARAMETER UNIT METHoDS REfERENCE
1 Temperature 0c Thermometer APHA-2550 B
2 pH --- pH Meter-Electrometric method APHA-4500 H+ B
3 Ele.Conductivity µs/cm Conductivity meter APHA-2510 B
4 Dissolved Oxygen mg/l Titrimetric Method ( Winkler-Modified) APHA- 4500 –O C
5 Turbidity NTU Nephelometric method APHA -2130 B
6 Ammoniacal Nitrogen(NH4N) mg/l Colorimetric -Phenate method APHA-4500 -NH3 F
7 Nitrate-Nitrogen mg/l Cadmium reduction ,followed by colorimetric APHA-4500 -NO3
- e
8 Nitrite Nitrogen mg/l colorimetric APHA-4500 -NO2- B
9 Orthophosphate as PO4 mg/l Colorimetric (Ascorbic acid) method APHA-4500- P E
10 Biochemical Oxygen Demand(BOD) mg/l Oxygen Depletion method( 3 Days at
27oC) IS :3025 (Part 44)
11 Chemical Oxygen Demand(COD) mg/l Open reflux method APHA-5220 B
12 Sodium mg/l Flame Photometry method APHA -3500-Na B
13 Potassium mg/l Flame Photometry method APHA- 3500-K B
14 calcium mg/l EDTA- Titrimetric method APHA-3500 -Ca B
15 Magnesium mg/l EDTA- Titrimetric method APHA- 3500 -Mg B
16 Chloride mg/l Titrimetric (Argentometric) method APHA-4500- Cl- B
17 Sulphate mg/l Turbidity method APHA- 4500 -SO42- e
18 Fluoride mg/l Colorimetric/Ion -Selective Electrode method
APHA -4500-F- D/ APHA-4500-F- c
19 Boron mg/l Colorimetric (Curcumin) method APHA-4500- B B
20 Total Coliform n/100ml MF method-Standard Total Coliform Membrane Filter procedure APHA-9222 B
21 Fecal Coliform n/100ml MF method- Fecal Coliform Membrane Filter procedure APHA -9222 D
22 T.K.N mg/l Digestion and Colorimetric-Macro Kjeldahl method APHA -4500-Norg B
23 Total Dissolved Solids mg/l Gravimetric method-Dried at 1800 c APHA-2540 C
24 Total Suspended Solids mg/l Gravimetric method-Dried at 103-1050 c APHA-2540 D
25 Total Fixed and Volatile Solids mg/l Gravimetric method-heated at
5500 c APHA-2540 E
26 Hardness mg/l EDTA Titrimetric method APHA-2340 C
27 Alkalinity mg/l Titration method APHA-2320 B
28 Other Metals µg/l Atomic Absorption Spectrometry method APHA- 3111 B
29 Organo chlorine Pesticides µg/l Gas Chromatography APHA-6630 B

Directory 2019
Kerala State Pollution Control Board
364
364
Annexure VII
ABBREVIATIONSATD Automated Thermal Desorber
APHA American Public Health Association
BDL Class Detection Level
BDU Best Designated Use
BOD Biochemical Oxygen Demand
COD Chemical Oxygen Demand
CPCB Central Pollution Control Board
DO Dissolved Oxygen
ecD Electron Capture Detector
FC Fecal Coliforms
FDS Fixed Dissolved Solids
FID Flame Ionization Detector
Gc Gas Chromatograph
HPLC High Performance Liquid Chromatograph
IC Ion Chromatograph
IS Indian Standards
Max/Maxim Maximum
Min/Minim Minimum
MPN Most Probable Number
NAAQS National Ambient Air Quality Standards
NAMP National Air Quality Monitoring Programme
NPD Nitrogen Phosphorous Detector
NTU Nephelometric Turbidity Unit
NWMP National Water Quality Monitoring Programme
RSPM Respirable Particulate Matter
SAMP State Air Quality Monitoring Programme
sD Standard Deviation
SPM Suspended Particulate Matter
SWMP State Water Quality Monitoring Programme
TC Total Coliforms
TCLP Toxicity Characteristic Leachate Procedure
TDS Total Dissolved Solids
TKN Total Kjeldhal Nitrogen
TOC Total Organic Carbon
TOX Total Organic Halogens
TSS Total Suspended Solids
UV Ultra-Violet