Air Quality - CORE
370
Proceedings of Abstracts 10th International Conference on Air Quality Science and Application Milano, 14-18 March 2016 Editors Paola Radice, Sandro Finardi, Aidan Farrow, Charles Chemel, Joana De Medeiros, Vikas Singh and Ranjeet S. Sokhi
-
Upload
khangminh22 -
Category
Documents
-
view
0 -
download
0
Transcript of Air Quality - CORE

Proceedings of Abstracts
10th International Conference on
Air Quality Science and Application
Milano, 14-18 March 2016
Editors
Paola Radice, Sandro Finardi, Aidan Farrow, Charles Chemel, Joana De Medeiros, Vikas Singh and Ranjeet S. Sokhi


Proceedings of Abstracts 10th International Conference on
Air Quality Science and Application
Milano, 14-18 March 2016
Editors
Paola Radice1 and Sandro Finardi1
Aidan Farrow2, Charles Chemel2, Joana De Medeiros2, Vikas Singh2 and
Ranjeet S. Sokhi2
1 Arianet srl, via Gilino 9, 20128 Milano, Italia
2 Centre for Atmospheric and Instrumentation Research (CAIR),
University of Hertfordshire, UK
Organised by University of Hertfordshire, UK
ARIANET srl, Italy ARPA Lombardia, Italy

Published by the University of Hertfordshire
College Lane
Hatfield
AL10 9AB
United Kingdom
and
Arianet srl
via Gilino 9
20128 Milano
Italia
ISBN: 978-1-909291-76-8
Cover picture:
Paola Radice
Design and production:
Arianet srl
via Gilino 9
20128 Milano
Italia
All inquiries to:
Professor Ranjeet S Sokhi
Centre for Atmospheric Science and Instrumentation Research (CAIR)
University of Hertfordshire
College Lane, Hatfield, AL0 9AB, UK
Tel: +44(0) 1707 284520 Fax: +44(0) 1707 284208
Email: [email protected]

Acknowledgement of Supporting Organisations
The support of the following organisations is gratefully acknowledged:
University of Hertfordshire, UK
ARIANET srl, Italy
ARPA Lombardia, Italy
A2A Ambiente, Italy
Project Automation, Italy
RISAM GAS srl, Italy
TRANSPHORM (FP7 Project) Transport related Air Pollution and Health impacts- Integrated
Methodologies for Assessing Particulate Matter
COST 728 Action on Enhancing Meso-Scale Meteorological Modelling Capabilities for Air
Pollution and Dispersion Applications
COST ES0602 Towards a European Network on Chemical Weather Forecasting and Information
Systems
ES1004 European framework for online integrated air quality and meteorology modelling
(EUMetChem)
The Aerosol Society, UK
American Meteorological Society (AMS)
Air & Waste Management Association (A&WMA)
European Meteorological Society (EMS)
World Meteorological Organisation (WMO) and the GAW Urban Research Meteorology and
Environment (GURME) programme
We are grateful for the attendance and support of the exhibitors:
AEROSOL D.O.O., Slovenia
ARIA Technologies, France
CERC Ltd, UK
Markes International Ltd, UK
TerrAria srl, Italy
TSI, US
Conference Organising Committee Ranjeet S Sokhi (Chair), University of Hertfordshire, UK
Sandro Finardi (Chair of the Local Organising Committee), ARIANET srl, Italy
Guido Lanzani, ARPA Lombardia, Italy
Vikas Singh, NARL, India
Aidan Farrow, University of Hertfordshire, UK
Maria Teresa Radaelli, ARIANET srl, Italy
Paola Radice, ARIANET srl, Italy
Conference Secretariat, University of Hertfordshire Dr Aidan Farrow
Dr Charles Chemel
Joana De Medeiros
Dr Vikas Singh

International Scientific and Advisory Committee
Professor Ranjeet S Sokhi (Chair), University of Hertfordshire, UK
Dr Peter Suppan, Karlsruhe Institute of Technology, Germany
Professor Nicolas Moussiopoulos, Aristotle University Thessaloniki, Greece
Professor Alexander Baklanov, World Meteorological Organisation
Professor John Bartzis, University of West Macedonia, Greece
Professor Zissis Samaras, Aristotle University of Thessaloniki, Greece
Dr Matthias Ketzel, NERI, Denmark
Professor Carlos Borrego, University of Aveiro, Portugal
Dr Sandro Finardi, ARIANET, Italy
Dr Trond Bohler, NILU, Norway
Professor Rainer Friedrich, IER University of Stuttgart, Germany
Professor Eugene Genikhovich, Main Geophysical Observatory, Russia
Professor Sue Grimmond, Kings College London, UK
Dr ST Rao, North Carolina State University, USA
Professor Greg Carmichael, University of Iowa, USA
Dr Gufran Beig, Indian Institute of Tropical Meteorology, India
Dr Vikas Singh, National Atmospheric Research Laboratory, India
Professor Steven R Hanna, Hanna Consultants and Harvard Public School of Public Health, USA
Professor Mark Z Jacobson, University of Stanford, USA
Professor Judy Chow, Desert Research Institute, USA
Professor Jaakko Kukkonen, Finnish Met Institute, Finland
Professor Millán Millán, CEAM, Spain
Professor Roberto San Jose, Technical University of Madrid, Spain
Professor Michael Schatzmann, University of Hamburg, Germany
Dr Andreas Skouloudis, JRC, ISPRA
Dr Jacek Kaminski, York University, Canada
Professor James Sloan, University of Waterloo, Canada
Professor Selahattin Incecik, Technical University of Istanbul, Turkey
Dr R.K.M.Jayanty, RTI International, USA
Professor Hyo Choi, Kangnung National University, Korea

Preface
This 10th International Conference in Air Quality - Science and Application is being held in the
elegant and vibrant city of Milan, Italy. Our local hosts are ARIANET and ARPA Lombardia both
of whom play a leading role in assessing and managing air pollution in the area. The meeting builds
upon the series that began at the University of Hertfordshire, UK in July 1996. Subsequent meetings
have been held at the Technical University of Madrid, Spain (1999), Loutraki, Greece (2001),
Charles University, Prague, Czech Republic (2003), Valencia, Spain (2005), Cyprus (2007),
Istanbul, Turkey (2009) Athens, Greece (2012) and Garmisch-Partenkirchen, Germany (2014).
Over the last two decades controls to limit air pollution have increased but the problem of poor air
quality persists in all cities of the world. Consequently, the issue of the quality of air that we breathe
remains at the forefront of societal concerns and continues to demand the attention of scientists and
policy makers to reduce health impacts and to achieve sustainable development. Although
urbanisation is growing in terms of population, transport, energy consumption and utilities, science
has shown that impact from air pollution in cities is not restricted to local scales but depends on
contributions from regional and global scales including interactions with climate change. Despite
improvements in technology, users still demand robust management and assessment tools to
formulate effective control policies and strategies for reducing the health impact of air pollution.
The topics of papers presented at the conference reflect the diversity of scales, processes and
interactions affecting air pollution and its impact on health and the environment. As usual, the
conference is stimulating cross-fertilisation of ideas and cooperation between the different air
pollution science and user communities. In particular, there is greater involvement of city, regional
and global air pollution, climate change, users and health communities at the meeting.
This international conference brings together scientists, users and policy makers from across the
globe to discuss the latest scientific advances in our understanding of air pollution and its impacts
on our health and environment. In addition to the scientific advances, the conference will also seek
to highlight applications and developments in management strategies and assessment tools for
policy and decision makers. This volume presents a collection of abstracts of papers presented at the
Conference. The main themes covered in the Conference include:
Air quality and impact on regional to global scales
Development/application/evaluation of air quality and related models
Environmental and health impact resulting from air pollution
Measurement of air pollutants and process studies
Source apportionment and emission models/inventories
Urban meteorology
Special session: Air quality impacts of the increasing use of biomass fuels
Special session: Air quality management for policy support and decisions
Special session: Air pollution meteorology from local to global scales
Special session: Climate change and human health
Special Session: Modelling and measuring non-exhaust emissions from traffic
Special session: Transport related air pollution - PM and its impact on cities and across Europe
Ranjeet S Sokhi, University of Hertfordshire, UK
Sandro Finardi, ARIANET srl, Italy
March 2016


i
PART ONE: ORAL SESSIONS ..................................................................... 1
KEY NOTE SPEAKERS ............................................................................... 3
AN ANALOG-BASED METHOD TO GENERATE PROBABILISTIC AQ PREDICTION OVER THE US............................ 4 S. Alessandrini (1), L. Delle Monache (1), Irina Djalalova (2), Jim Wilczak (2) ..................................................... 4
MULTISCALE MODELLING OF HEALTH IMPACTS AND RELATED EXTERNAL COST FROM AIR POLLUTION IN EUROPE AND DENMARK OVER 36 YEARS (1979-2014) USING THE INTEGRATED MODEL SYSTEM EVA ............. 5
J. Brandt (1), M. S. Andersen (1), J. Bønløkke (2), J. H. Christensen (1), T. Ellermann (1), K. M. Hansen (1), O.
Hertel (1), U. Im
(1), S. S. Jensen
(1), M. Ketzel
(1), O.-K. Nielsen
(1), M. S. Plejdrup
(1), T. Sigsgaard (2) and C.
Geels (1) ............................................................................................................................................................... 5
HEALTH IMPACTS THROUGHOUT SOUTHEAST ASIA OF FOREST FIRES IN INDONESIA ....................................... 6 J. Buonocore (1), S. Koplitz (2), M. Marlier (3), J. Schwartz (4), D. Jacob (2), R. DeFries (3), L. Mickley (2), S. Myers (4,5) .......................................................................................................................................................... 6
HISTORY AND PERSPECTIVE OF AIR QUALITY IN MILAN AND THE PO VALLEY: SCIENTIFIC AND MANAGEMENT CHALLENGES .................................................................................................................................................... 7
S. Finardi (1), G. Lanzani (2) ................................................................................................................................. 7
MODELLING THE FUTURE HEALTH IMPACTS RELATED TO OZONE, SECONDARY INORGANIC AEROSOLS AND PRIMARY PM IN EUROPE — RESPONSE TO PROJECTED CHANGES IN CLIMATE, EMISSIONS, DEMOGRAPHY AND BUILDING STOCK ...................................................................................................................................... 8
C. Geels (1), C. Andersson (2), O. Hänninen (3), A. S. Lansø (1), C. Ambelas Skjøth (4), P. E. Schwarze (5) and J. Brandt (1) ............................................................................................................................................................. 8
THE IMPACT OF WEATHER CHANGES ON AIR QUALITY AND HEALTH IN THE UNITED STATES IN 1994-2012 ..... 9 Iny Jhun (1), Brent A. Coull (2), Joel Schwartz (1), Bryan Hubbell (3), Petros Koutrakis (1) ................................ 9
THE EFFECTS OF INTERCONTINENTAL EMISSION SOURCES ON EUROPEAN AIR POLLUTION LEVELS ............... 10 J.E. Jonson, S. Valiyaveetil and M. Shultz .......................................................................................................... 10
CHARACTERIZING THE INFLUENCE OF HEMISPHERIC TRANSPORT ON REGIONAL AIR POLLUTION ................. 11 R. Mathur, J. Xing, S. Napelenok, C. Hogrefe, G. Sarwar, D. Kang ..................................................................... 11
INTELLIGENT TRANSPORT SYSTEMS (ITS) AS A TOOL TO REDUCE CARBON FOOTPRINT AND POLLUTANT EMISSIONS IN CITIES ...................................................................................................................................... 12
Zissis Samaras (1), Leonidas Ntziachristos (1), Ilias Vouitsis (1), Silvana Toffolo (2), Giorgio Magra (2), Alvaro Garcia-Castro (3), Cristina Valdes (3), Christian Vock (4), Werner Maier (5) .................................................... 12
NORTH AFRICAN DUST SOURCES AND DUST EXPORT TOWARDS EUROPE AND THE CARIBBEAN ................... 13 K. Schepanski (1), R. Wagner (1), B. Heinold (1) and I. Tegen (1) ...................................................................... 13
AIR QUALITY AND IMPACT ON REGIONAL TO GLOBAL SCALE ............... 15
25-YEAR REANALYSIS OF REGIONAL BACKGROUND SURFACE OZONE FOR SWEDEN ...................................... 17 C. Andersson, M. Engardt and H. Alpfjord ......................................................................................................... 17
CHANGES IN PERSIAN GULF AIR QUALITY OBSERVED BY THE OZONE MONITORING INSTRUMENT ................ 18 M. P. Barkley ...................................................................................................................................................... 18
MULTI MODEL PROCESS STUDY ON INTERCONTINENTAL TRANSPORT OF MERCURY ..................................... 19

ii
J. Bieser (1,2), A. Dastoor (3), C.N. Gencarelli (4), I.M. Hedgecock (4), V. Matthias (1), N.E. Selin (5), F. DeSimone (4), S. Song (5), O. Travnikov (6), X. Zang (7,8) ................................................................................. 19
ANALYSIS OF NO2 POLLUTION IN MEGACITIES BY EARTH OBSERVATION ....................................................... 20 Thilo Erbertseder(1), Christoph Bergemann(1), Hannes Taubenböck (1), Frank Baier(1), ................................ 20
INDOOR CONCENTRATION OF PM1, PM2.5 AND PM10 IN A MAIN SHOPPING MALL IN AL AIN CITY, UAE ......... 21 G. O. Odhiambo ................................................................................................................................................. 21
A SUB-GRID MODEL FOR IMPROVING THE SPATIAL RESOLUTION OF AIR QUALITY MODELLING AT A EUROPEAN SCALE ........................................................................................................................................... 22
M.R. Theobald (1), M. Vieno (2) and D. Simpson (3) ......................................................................................... 22
CHARACTERIZATION OF THE OZONE PLUME OVER THE IBERIAN PENINSULA DUE TO MADRID AND BARCELONA CITIES ......................................................................................................................................... 23
Víctor Valverde (1), María T. Pay (1), José M. Baldasano (1,2) .......................................................................... 23
ASSESSING EFFICACY OF NEW PLANT-WALL SYSTEM TO REDUCE INDOOR AIR POLLUTION ........................... 24 M. Zavattaro1, M. Burchett1, F. Torpy1 ............................................................................................................ 24
DEVELOPMENT APPLICATION EVALUATION OF AIR QUALITY AND RELATED MODELS ................................................................................. 25
TEN YEARS OF CITY-WIDE HIGH-RESOLUTION SIMULATIONS OF NOX CONCENTRATIONS .............................. 27 A. Berchet, K. Zink, D. Brunner and L. Emmenegger ......................................................................................... 27
COUPLING METEOROLOGICAL AND CHEMICAL ENSEMBLES IN AIR QUALITY DATA ASSIMILATION ................ 28 Christoph Bergemann (1), Frank Baier (1), Thilo Erbertseder (1) ...................................................................... 28
HOW GOOD ARE AEROSOL-CLOUD INTERACTIONS IN ONLINE COUPLED MODELS? ....................................... 29 R. Baró(1), D. Brunner(2), L. Palacios-Peña(1), R. Bianconi(3), G. Curci(4), M. Hirtl(5), L. Honzak(6), R. Forkel(7), A. Manders(8), L. Neal(9), N. Savage(9), M. Schaap(8) P. Tuccella(4), H. Van der Gon(8) J. Werhahn(7), R Žabkar(6) P. Jiménez-Guerrero(1) ............................................................................................. 29
MONITORING AIR QUALITY OVER CHINA: RESULTS OF THE PANDA MODELING SYSTEM ............................... 30 I. Bouarar (1), G. Brasseur (1), C. Granier (2), Y. Xie (3), X. Wang(4), Q. Fan (4), L. Wang (5) ........................... 30
A MULTI-MODEL CASE STUDY ON AEROSOL-METEORLOGY INTERACTIONS WITH REGIONAL ONLINE COUPLED CHEMISTRY-METEOROLOGY MODELS ............................................................................................................ 31
R. Forkel (1), A. Baklanov(2,3), A. Balzarini (4), R. Baró (5), D. Brunner (6), M. Hirtl (7), P. Jiménez-Guerrero (5), Oriol Jorba (8), L. Honzak (9), J.L. Pérez (10), G. Pirovano (4), R. San José (10), W. Schroeder (11), G. Tsegas (12), J. Werhahn (1), Ralf Wolke (11), R. Žabkar (9) ..................................................................... 31
MODELLING OF AIR QUALITY ALONG STATE ROADS IN DENMARK ................................................................. 32 S.S. Jensen (1), M. Ketzel (1), U. Im (1), P. Løftstrøm (1), J. Brandt, (1), J. Fryd (2) and L.N. Michelsen
(2) ....... 32
THE LARGE EDDY SIMULATION APPROACH IN AIR QUALITY RESEARCH - APPLICATION EXAMPLES USING THE ADREA-HF CODE ............................................................................................................................................. 33
N. Koutsourakis (1,2), J.G. Bartzis (1), A.G. Venetsanos (2), N.C. Markatos (3) ................................................. 33
EVALUATION OF A GLOBAL TROPOSPHERIC OZONE SMILULATION WITH STATION DATA INCLUDING METEOROLOGICAL VARIABLES ....................................................................................................................... 34
N. Kaffashzadeh (1,2), M. G. Schultz (1,2), A. Hense (2), S. Schröder (1) and O. Stein (1) ................................ 34
DETAILED INVESTIGATION OF TRAFFIC POLLUTION DISPERSION NEAR DENMARKS NO2 HOT-SPOT ............... 35

iii
M. Ketzel (1), J. Brandt (1), U. Im (1), T.-B. Ottosen (2,3), S.S. Jensen (1), T. Ellermann (1), K.E. Kakosimos (3), M.B. Poulsen(1) and O. Hertel (1) ..................................................................................................................... 35
MODELLING AND COMPARING THE IMPACT OF THREE SEA SALT EMISSIONS PARAMETERIZATIONS ON ATMOSPHERIC NITRATE CONCENTRATIONS IN THE NORTH-WESTERN EUROPEAN REGION ........................... 36
D. Neumann (1), V. Matthias (1), A. Aulinger (1), J. Bieser (1,2), and M. Quante (1) ........................................ 36
HOW TO ENSURE HIGH QUALITY PREDICTIONS OF DISPERSION MODELS IN HIGH COMPLEX TERRAIN? – A GUIDELINE FOR RANKING MODEL’S PERFORMANCE ...................................................................................... 37
R. Petrik (1), K.H. Schlünzen (1), D. Öttl (2) and T. Flassak (3) ........................................................................... 37
POLLUTED EVENTS OVER ASIAN CITIES: VALIDATION, SOURCE RECEPTOR TEST AND FIRST RESULTS. ............ 38 M. Pommier
1, M. Gauss
1, H. Fagerli
1, A. Nyiri
1, P. Wind
1and A. Benedictow
1 ................................................... 38
MODELLING NO2 CONCENTRATION USING CFD-RANS MODEL WITH HIGH RESOLUTION TRAFFIC EMISSIONS 39 B. Sanchez
(1), JL Santiago
(1), F. Martin
(1), A. Martilli
(1), E. Rivas
(1), R. Borge
(2), C. Quaassdorff
(2) and D. de la
Paz (2)
.................................................................................................................................................................. 39
ENVIRONMENTAL AND HEALTH IMPACT RESULTING FROM AIR POLLUTION ........................................................................................... 41
ENDOTOXIN IN AIR VERSUS DUST: COMPARISON BETWEEN AMBIENT FARMING ENVIRONMENT AND INDOOR HOME ENVIRONMENT ..................................................................................................................... 43
A. Adhikari ......................................................................................................................................................... 43
EXPOSURE TO PARTICULATE MATTER AND CHRONIC OBSTRUCTIVE PULMONARY DISEASE IN THE CITY OF NOVI SAD, REPUBLIC OF SERBIA ..................................................................................................................... 44
S. Bijelovic (1,2), N. Dragic (1,2), M. Arsic (2), T. Popovic (3) ............................................................................ 44
REDUCTION IN MORTALITY PARALLELS DECREASE IN PM10 EXPOSURE, LOMBARDY (ITALY) .......................... 45 M. Carugno (1), D. Consonni (2), P.A. Bertazzi (1,2), A. Biggeri (3,4), M. Baccini (3,4) ...................................... 45
SECTORIAL CONTRIBUTIONS TO AMBIENT PM CONCENTRATIONS IN STOCKHOLM AND ESTIMATED PREMATURE MORTALITY DUE TO BLACK CARBON EXPOSURES ...................................................................... 46
K. Eneroth (1), A. Engström Nylén (1), L. Burman (1) and C. Johansson (1, 2) .................................................. 46
CHILDREN EXPOSURE TO AIR POLLUTANTS IN INDOOR OF PRIMARY SCHOOLS RETROSPECTIVE AIR QUALITY SIMULATION TO SUPPORT EPIDEMIOLOGICAL STUDIES ................................................................................. 47
S. Finardi (1), G. Calori (1), A. D’Allura (1), P. Radice (1), G. Brusasca (1) .......................................................... 47
PUBLIC HEALTH GAINS FROM STRICT REGULATIONS ON FINE PARTICULATE AIR POLLUTION ........................ 48 D.Giannadaki (1), J.Lelieveld (1,2), and A. Pozzer (2) ........................................................................................ 48
THE USE OF INDICES TO DESCRIBE SHORT TERM EFFECTS OF AIR QUALITY AND BIOMETEOROLOGY ON MORBIDITY IN WESTERN GERMANY .............................................................................................................. 49
Hanna Leona Lokys (1,2), Jürgen Junk (1), Andreas Krein (1) ............................................................................ 49
PHYSICO-CHEMICAL PROPERTIES AND BIOLOGICAL EFFECTS OF DIESEL AND BIOMASS PARTICLES ................ 50 E. Longhin (1), L. Capasso (1), R. Bengalli (1), S. Mollerup (2), C. Di Benedetto (1), J.A. Holme (3), J. Øvrevik (3), P. Parenti (1), M. Gualtieri (4), M. Camatini (1) ................................................................................................. 50
CORRELATION BETWEEN ANNOYANCE AND THE COMBINED EFFECT OF PARTICULATE MATTER ................... 51 M. Machado (1), J.M. Santos (2), N.C. Reis Jr.(2), V.A. Reisen (2), I. Mavroidis (3), H.H.A. Cotta (2) ................ 51
ON THE USE OF CARBONACEOUS PARTICLE EXPOSURE METRICS IN HEALTH IMPACT CALCULATIONS ........... 52

iv
H. Olstrup (1), C. Johansson (1,2) and B. Forsberg (3) ....................................................................................... 52
PERSONAL EXPOSURE ASSESSMENT TO AIR POLLUTANTS USING PORTABLE SENSORS AND AGENT BASED MODELLING ................................................................................................................................................... 53
D.A. Sarigiannis (1,2), D. Chapizanis (1), P. Kontoroupis (1), S. Karakitsios (1) .................................................. 53
DESERT DUST ADVECTIONS IN SOUTHERN EUROPE DURING 2001-2010: FREQUENCY OF THE EPISODES, CONTRIBUTION TO GROUND-LEVEL PM10 CONCENTRATIONS, AND SHORT-TERM HEALTH EFFECTS ............. 54
M. Stafoggia (1) on behalf of the MED-PARTICLES Study GROUP ..................................................................... 54
ON THE IMPACT OF AIR QUALITY ON HUMAN HEALTH: APPLICATION OF AN AIR QUALITY INDEX FOR THESSALONIKI, GREECE .................................................................................................................................. 55
P. Syropoulou (1), T.M Giannaros (1), A. Poupkou (1), S. Dimopoulos (1), D. Melas (1) and D. Balis (1) .......... 55
ECONOMIC IMPACTS FROM PM2.5 POLLUTION-RELATED HEALTH EFFECTS IN CHINA: A PROVINCIAL LEVELED ANALYSIS ....................................................................................................................................................... 56
Y. Xie (1,2), HC. Dai(2), HJ. Dong(2), T. Hanaoka(2), T. Masui(1,2) .................................................................... 56
MEASUREMENT OF AIR POLLUTANTS AND PROCESS STUDIES ............. 57
OUTDOOR PM2.5 AND BC EXPOSURE ASSESSMENT IN URBAN SLUMS OF MUMBAI, INDIA ............................. 59 A. Anand (1), H.C. Phuleria (1) ........................................................................................................................... 59
A NEW LONG TERM FINE PARTICLE MONITOR FOR THE URBAN ENVIRONMENT ............................................ 60 I Bennett ............................................................................................................................................................ 60
CHAMBRE – THE DEVELOPMENT OF AN ATMOSFERIC SIMULATION CHAMBER AT GENOA UNIVERSITY ........ 61 P.Brotto (1,2), M.C. Bove (1,2), F.Cassola (1,2), E.Gatta (1), D.Massabò (1,2), F.Parodi (2), V.Vigo (2) and P.Prati (1,2) ........................................................................................................................................................ 61
QUANTIFYING AIR POLLUTION EXPOSURE USING WEARABLE SENSORS AND MOBILE PHONES ..................... 62 N. Castell, P. Schneider and W. Lahoz ............................................................................................................... 62
PROVIDING VERTICAL GRADIENT CONCENTRATION MEASUREMENTS FOR interconnected studies on air quality and climate change ............................................................................................................................ 63
A. Dvorská (1), K. Komínková (1, 2), M. Čampulová (1, 3) and V. Hanuš (1) ..................................................... 63
MEASUREMENTS OF PM FLUXES AND SIZE SEGREGATED CONCENTRATIONS ABOVE THE CITY OF NAPLES .... 64 D.Famulari(1), I. Russo(1), D.Piscitelli(1), P.DiTommasi(1), A.Esposito(1), M.Tosca(1), G. Agrillo(1), B.Gioli(2) , E.Magliulo(1), A.Zaldei(2), A. Riccio(4), A.Mazzarella(3), R.Viola(3), N. Scafetta(3), P.Toscano(2) ................... 64
OPERATION OF A LOW-COST NO2/O3 SENSOR NETWORK IN ZURICH: PERFORMANCE ANALYSIS AND APPLICATIONS ................................................................................................................................................ 65
M.D. Mueller (1), Ch.Hueglin (1) ....................................................................................................................... 65
BIOTAIR: BIOFILTRATION FOR ROAD TRAFFIC EMMISSIONS, APPLICATION TO A ROAD TUNNEL ................... 66 J-F. Petit (1), P. Barbe (1), M. Bouquet (1), C. Neaud (1), L. Meffray (1), J-F. Burkhart (2), B. Vidal (2), O. Borot (3), B.Goussebayle (3), D.Muller (4) .................................................................................................................. 66
HOURLY REPARTITION OF HYDROGEN SULPHIDE FROM GAS MEASURE DOWNWIND OF A LANDFILL ........... 67 V. Pierre-Georges (1), J. Molinie (2), C. Bassette (2), F. Bade (2), P. Nuiro (3) .................................................. 67
LONG-TERM OIAP SPECTROSCOPIC DATASETS, TYPICAL AND ABNORMAL VARIATIONS AND TEMPORAL TENDENCIES IN BACKGROUND AND URBAN CO AND CH4 .............................................................................. 68
E. Grechko1, A. Dzhola
1, V. Rakitin
1, E. Fokeeva
1, G. Wang
2 .............................................................................. 68

v
STUDY OF CHEMICAL TRANSFORMATION IN A PHOTOCHEMICAL CHAMBER OF EXHAUST EMISSIONS FROM SMALL BIOMASS BURNNING STOVES ............................................................................................................. 69
F. Reyes (1,2), Y. Vázquez (1,2), 1, G. López (1), N. López (2,4), M. A. Rubio (2), E. Lissi (2), A. Cádiz (3), P. Oyola (1) ............................................................................................................................................................ 69
HIGH RESOLUTION MAPPING OF THE TROPOSPHERIC NO2 DISTRIBUTION IN THREE BELGIAN CITIES BASED ON AIRBORNE APEX REMOTE SENSING ................................................................................................................ 70
F. Tack (1), A. Merlaud (1), T. Danckaert (1), C. Fayt (1), H. Yu (1), M.-D. Iordache (2), F. Fierens (3) K. Meuleman (2), and M. Van Roozendael (1) ....................................................................................................... 70
SPATIAL DISTRIBUTION OF PARTICULATE MATTER AND NO2 ALONG THE BUSY FEDERAL HIGHWAY B14 IN THE CITY OF STUTTGART - RESULTS OF MOBILE AND DIFFUSIVE SAMPLER MEASUREMENTS ............................... 71
U. Vogt (1), U. Reuter (2) ................................................................................................................................... 71
BIOMONITORING OF PAHS AND OXYGENATED DERIVATIVES (OPAHS) .......................................................... 72 C. Walgraeve (1), F, Van der Elst (1), P. De Wispelaere (1), H. Van Langenhove (1) ......................................... 72
SOURCE APPORTIONMENT AND EMISSION MODELS-INVENTORIES ..... 73
MEASURING LANDFILLS CH4 EMISSION WITH AIRCRAFT, EDDY COVARIANCE AND CHAMBERS TECHNIQUES 75 S. Di Lonardo (1), S. Cappello (2), P. Carlucci (2), P. Di Tommasi (2), A. Esposito (2), D. Famulari (2), D. Gasbarra (2), V. Magliulo (2), D. Piscitelli (2), L. Shindler (2), P. Toscano (1), C. Vagnoli (1), L. Vitale (2), A. Zaldei (1), R. Baraldi (3), O. Facini (3), C. Belli (4), P. Stefani (4) and B. Gioli (1) ............................................... 75
COMPARING A NEW GIS-BASED APPROACH FOR CALCULATING AREA-BASED PM2.5 EMISSIONS LOADS WITH RESULTS FROM THE GAUSSIAN AIR POLLUTION DISPERSION MODEL OML-HIGHWAY ................................... 76
P. Gaffron .......................................................................................................................................................... 76
MAPPING OF PRIMARY AND SECONDARY AEROSOL IN THE PO VALLEY DURING WINTER .............................. 77 S. Gilardoni (1), M. Paglione (1), P. Massoli (2), M. Rinaldi (1), M. C. Pietrogrande (3), V. Poluzzi (4) C. Carbone (5), V. Gianelle (6), C. Colombi (6), R. Hillamo (7), M. Aurela (7), E. Petralia (9), M. Berico (9), M. Bressi (8), C.A. Belis (8), F. Cavalli (8), C. Facchini (1), S. Fuzzi (1) ..................................................................................... 77
ESTIMATION OF THE CONTRIBUTIONS OF INDUSTRIAL AND RESIDENTIAL COMBUSTION SOURCES TO THE PM10, PM2.5 AND B(A)P LEVELS OVER THE APULIA REGION (SOUTHERN ITALY) .............................................. 78
R. Giua (1), A. Morabito(1), I. Schipa(1), A. Tanzarella(1), C. Silibello (2) and G. Assennato (1) ....................... 78
IMPROVED MODELLING OF AMMONIA BY USING MANURE TRANSPORT DATA ............................................. 79 C. Hendriks (1), R. Kranenburg (1), J. Kuenen (1), M. Schaap (1) ...................................................................... 79
EMISSION FACTORS FROM RESIDENTIAL BIOMASS HEATING SISTEMS ........................................................... 80 F. Hugony (1), C. Morreale (2), G. Migliavacca (2), M. Zublena (3), L. Frassy (3), G. Pession (3),I. Tombolato (3) ........................................................................................................................................................................... 80
EMISSIONS FROM SHIPS IN PORTS ................................................................................................................. 81 V. Matthias (1), A. Aulinger (1), J. Hulskotte (2), L. van Espen (3), J. de Rue (4) ............................................... 81
HIGH RESOLUTION EMISSION ESTIMATION IN A HEAVILY TRAFFICKED URBAN AREA IN MADRID (SPAIN) ..... 82 C. Quaassdorff, R. Borge, D. de la Paz, J. Pérez, J.M. de Andrés, J. Lumbreras ................................................. 82
MAX-DOAS MEASUREMENTS OF SHIPPING EMISSIONS ................................................................................. 83 André Seyler (1), Folkard Wittrock (1), Lisa Kattner (1,2), Barbara Mathieu-Üffing (1,2), Enno Peters (1), Andreas Richter (1), Stefan Schmolke (2), Volker Matthias (3), Armin Aulinger (3) and John P. Burrows (1) .. 83
URBAN METEOROLOGY ........................................................................ 85

vi
THE EFFECT OF GEOMETRY MODIFICATION ON THE CONCENTRATION FIELD IN AN URBAN ENVIRONMENT . 87 Eva Berbekar(1), Frank Harms(1), Bernd Leitl(1) ............................................................................................... 87
ON THE ASSESSEMENT OF THE DRAG FORCE DUE TO CUBE ARRAYS EXPOSED TO DIFFERENT BOUNDARY LAYERS ........................................................................................................................................................... 88
R. Buccolieri (1), H. Wigö (2), M. Sandberg (2), S. Di Sabatino (3) ..................................................................... 88
WRF PBL MODELS COMPARISON AGAINST DATA MEASURED IN A URBAN ENVIRONMENT ........................... 89 Enrico Ferrero (1), Stefano Alessandrini (2), Francois Vandenberghe (2) ......................................................... 89
A CFD STUDY ON THE EFFECTIVENESS OF TREES TO DISPERSE ROAD TRAFFIC EMISSIONS AT A CITY SCALE ... 90 A.P.R Jeanjean (1), G. Hinchliffe (2), W.A. McMullan (3), P.S. Monks (4), R.J. Leigh (1) .................................... 90
CFD STUDY OF INDUCED EFFECTS OF TRESS ON AIR QUALITY IN A NEIGHBORHOOD OF PAMPLONA ............. 91 E. Rivas, JL. Santiago, F. Martin, B. Sánchez, A. Martilli ..................................................................................... 91
COMPARISON OF TEMPORAL VARIATION OF MODIS DERIVED DUST CONCENTRATION AND SURFACE OBSERVATION OVER AN URBAN AREA ........................................................................................................... 92
S. Sabetghadam (1), M. Khoshsima (2) and M. Hafezi (1) ................................................................................. 92
MIXING LAYER HEIGHT MEASUREMENTS DETERMINE INFLUENCE OF METEOROLOGY ON AIR POLLUTANT CONCENTRATIONS IN URBAN AREA ............................................................................................................... 93
K. Schäfer (1), B. Bonn (2), A. Geiß (3), H. Gerwig (4), C. Münkel (5), R. Nothard (6), E. von Schneidemesser (2) and M. Wiegner (3)............................................................................................................................................ 93
INFLUENCE OF URBAN HEAT ISLAND ON ATMOSPHERIC COMPOSITION ........................................................ 94 A. Skorokhod (1), N. Elansky (1), O.Lavrova (1), and N. Pankratova (1) ............................................................ 94
SPECIAL SESSION – AIR POLLUTION METEOROLOGY FROM LOCAL TO GLOBAL SCALES .................................................................................... 95
VERTICAL TROPOSPHERIC DISTRIBUTION OF AEROSOL OVER THE PO VALLEY REGION, UNDER DIFFERENT TRANSPORT REGIMES. ................................................................................................................................... 97
S. Bucci (1,2), F.Fierli (1), F. Cairo (1), F. Ravetta (3), J.C. Raut (3), P.Cristofanelli (4), S.De Cesari(4), J. Größ (5) ........................................................................................................................................................................... 97
NORTH ATLATIC OSCILLATION MODEL PROJECTIONS AND INFLUENCE ON TRACER TRANSPORT. .................. 98 S. Bacer (1), T. Christoudias (2), A. Pozzer (1) .................................................................................................... 98
SIMULATING AEROSOL-CLOUD INTERACTIONS OVER SOUTHERN WEST AFRICA WITH COSMO-ART IN THE FRAMEWORK OF DACCIWA ............................................................................................................................ 99
Deetz, K.(1), Vogel, B.(1) .................................................................................................................................... 99
IMPACT OF REGIONAL CIRCULATION ON METEOROLOGY AND EXTREME EVENTS OVER ASIA FOR PRESENT AND FUTURE CLIMATE ................................................................................................................................. 100
J.S.N. de Medeiros; R. Sokhi ............................................................................................................................ 100
COASTAL OZONE IN NAPLES: EPISODE ANALYSIS BY MEANS OF AIRCRAFT MEASUREMENTS AND MESOSCALE MODELLING ................................................................................................................................................. 101
S. Finardi (1), D. Gasbarra (2), G. Calori (1), A. D’Allura (1), B. Gioli (3), G. Agrillo (2), P. Carlucci (2), L. Shindler (2) and V. Magliulo (2) ..................................................................................................................................... 101
THE INFLUENCE OF MID-LATITUDE CYCLONE TRACKS ON SURFACE OZONE AT REMOTE EUROPEAN COASTAL MONITORING SITES ...................................................................................................................................... 102
K.E. Knowland (1, 2), R.M. Doherty (2), K.I. Hodges (3) ................................................................................... 102

vii
THE IMPACT OF LONG RANG AIR TRANSPORT ON THE SURFACE NH3 LEVELS AT A RURAL SITE IN THE NORTH CHINA PLAIN IN SUMMER 2013 .................................................................................................................... 103
Z.Y. Meng (1), X.B. Xu (1), W.L. Lin (2), Y.L. Xie (3), S.H. Jia (1), R. Zhang (4), Y.A. Jiang (5) ............................. 103
SOURCE-RECEPTOR RELATIONSHIPS OF INTERCONINENTAL TRANSPORT USING THE UKCA CHEMISTRY-CLIMATE MODEL FOR THE TF-HTAP PHASE 2 PROJECT. ................................................................................ 104
G.Folberth (1), F O’ Connor (1), S.Turnock (1), R.Doherty (2), A.Archibald (3), O.Wild (4), W.Collins (5), D.Stevenson (2) and S.Arnold (6) .................................................................................................................... 104
FORECASTING LONG-RANGE AIR QUALITY IMPACTS OF WILDFIRE EMISSIONS ............................................ 105 M. Parrington, A. Agusti-Panareda, A. Benedetti, R. Engelen, F. di Giuseppe, J. Flemming, A. Inness, L. Jones, S. Massart, V.-H. Peuch ................................................................................................................................... 105
THE INFLUENCE OF SYNOPTIC WEATHER REGIMES ON UK AIR QUALITY: REGIONAL MODEL STUDIES OF TROPOSPHERIC COLUMN NO2 ...................................................................................................................... 106
R. Pope (1, 2), N. Savage (3), M. Chipperfield (1, 2), C. Ordóñez (3) and L. Neal (3) ....................................... 106
A MULTI-SCALE MODELLING SYSTEM FOR STUDYING URBAN CHEMISTRY AND TRANSPORT ....................... 107 J.R. Stocker (1), C.M. Hood (1), I.A. Mackenzie (2), D.J. Carruthers (1), R.M. Doherty (2), T. L. Malkin (3), L.K. Whalley (3), D.E. Heard (3)
and M.Vieno (4).................................................................................................... 107
METEOROLOGICAL CONDITIONS ASSOCIATED WITH EXTREME POLLUTION EVENTS OVER THE NORDIC COUNTRIES .................................................................................................................................................. 108
Manu Anna Thomas (1) and Abhay Devasthale (2) ......................................................................................... 108
SOURCE APPORTIONMENT MODELLING OF OC AND NMVOCS IN THE BERLIN URBAN AREA ....................... 109 E. von Schneidemesser (1), B. Bonn (1), C. Ehlers (2), H. Gerwig (3), A.M. Villalobos (4), D. Klemp (2), C. Kofahl (2), J. Kura (3), A. Lüdecke (3), A. Pietsch (3), R. Nothard (5), K. Schäfer (6), and J.J. Schauer (4) .................. 109
BLACK CARBON Ambient CONCENTRATIONs and sources IN BANGKOK ....................................................... 110 P. Suwattiga (1), W. Sae Tung (1), W. Limpaseni (2) and W. Phairuang (3) ..................................................... 110
IDENTIFYING THE MOST HAZARDOUS SYNOPTIC CONDITIONS FOR WINTER UK PM10 EXCEEDENCES ......... 111 C. Webber (1), H. Dacre (1), W. Collins (1) and G. Masato (1) ......................................................................... 111
SPECIAL SESSION - AIR QUALITY IMPACTS OF THE INCREASING USE OF BIOMASS FUELS .................................................................................. 113
RESIDENTIAL WOOD COMBUSTION IN ATHENS SINCE 2010: IMPACTS ON AIR QUALITY AND ATMOSPHERIC VARIABLES ................................................................................................................................................... 115
E. Athanasopoulou (1), O. Speyer (1), D. Brunner (2), H. Vogel (3), B. Vogel (3) and E. Gerasopoulos (1) .... 115
THE USE OF 14C MEASUREMENTS ON OC AND EC FOR WOOD BURNING SOURCE APPORTIONMENT AT AN URBAN SITE IN NORTHERN ITALY. ................................................................................................................ 116
V. Bernardoni (1), G. Calzolai (2), M. Chiari (2), M. Fedi (2), F. Lucarelli (2), S. Nava (2), A. Piazzalunga (3,*), F. Riccobono (1, #), F. Taccetti (2), G. Valli (1), R. Vecchi (1) ............................................................................... 116
RESULTS FROM A PILOT STUDY ON THE COMPOSITION AND TOXICITY OF ULTRAFINE PARTICLES DUE TO WOOD BURNING .......................................................................................................................................... 117
M. Dell’Acqua (1), S. Becagli (2), V. Bernardoni (1), L. Corbella (3), E. Corsini (4), A. Crespi (1), P. Fermo (3), R. Gonzalez (3), C. L. Galli (4), G. Lonati (5), L. Marabini (4), M. Marinovich (4), S. Ozgen (5), S. Signorini (6), R. Tardivo (5), G. Valli (1), R. Vecchi (1) ............................................................................................................... 117
BIOMASS BURNING CONTRIBUTION TO PAHS CONCENTRATION IN THE URBAN AREA OF ROME. MAIN FINDINGS FROM THE LIFE+ EXPAH PROJECT AND FURTHER OBSERVATIONS. ............................................... 118

viii
C. Gariazzo (1), S. Argentini (2), C. Balducci (3), M.P. Bogliolo (1), A. Cecinato (3), G. Cesaroni
(4), A. Cristofari
(1), A. D’Allura (5), S. Finardi
(5), F.Forastiere
(4), M.P. Gatto
(1), M. Gherardi
(1), A. Gordiani
(1), O. Hänninen
(6), M. Lamberti (1), A. Pelliccioni
(1), M. Perilli
(3), C. Perrino
(3), D. Porta
(4), P. Radice
(5), P. Romagnoli
(3),
F. Sacco (7), C. Silibello
(5), M. Stafoggia
(4), L. Tofful
(3). ............................................................................... 118
INTEGRATED METHODOLOGY FOR ASSESSING DOMESTIC WOOD BURNER MUNICIPAL SHARE .................. 119 A. Marongiu, E. Angelino ................................................................................................................................. 119
REACTIVE OXYGEN SPECIES FOUND IN URBAN PM2.5 AND PM10: CHEMICAL ANALYSIS AND SOURCE APPORTIONMENT ........................................................................................................................................ 120
Dimosthenis Α. Sarigiannis (1), Marianthi Kermenidou (1), Stavroula Kyriakou (1), Roxani Tzimou – Tsitouridou (2) and Spyros P. Karakitsios (1) ................................................................................................... 120
OUTDOOR AND INDOOR MEASUREMENTS OF BIOMASS COMBUSTION INDUCED BLACK CARBON, CO AND PAH IN A RESIDENTIAL AREA ........................................................................................................................ 121
J. Zheng, G. Baumbach, U. Vogt, G. Scheffknecht ........................................................................................... 121
THE IMPACT OF WOOD BURNING FOR RESIDENTIAL HEATING ON AIR QUALITY IN MILAN AND THE PO VALLEY: ANALYSIS AND PERSPECTIVES ......................................................................................................... 122
G. Lanzani, E. Angelino, C. Colombi, V. Gianelle, , A. Marongiu ..................................................................... 122
ENVIRONMENTAL IMPACT OF BIOMASS BURNING FOR CIVIL USES ONTO A MOUNTAIN AREA ................... 123 F. Petracchini (1) , C. Balducci (1), M. Perilli (1), A. Cecinato (1), F. Liotta (1), M. Segreto (1), V. Paolini (1), L. Paciucci (1). ...................................................................................................................................................... 123
A CROWSOURCING TOOL TO IMPROVE THE ESTIMATE OF WOOD-BURNING EMISSIONS FROM DOMESTIC HEATING ...................................................................................................................................................... 124
S. López-Aparicio, M. Vogt, L. Liu, H.V. Røen ................................................................................................... 124
AIR QUALITY impact OF THE DIFFUSION of high efficiency pellet boilers at eu level .................................... 125 G. Maffeis (1), S. Greco (1), A. Cherubini (1), M. Chiesa (2), B. Monteleone (2), ML. Venuta (2) ................... 125
USING A DISPERSION MODEL-BASED APPROACH FOR THE SPATIAL AND TEMPORAL DISAGGREGATION OF PM EMISSIONS FROM BIOMASS COMBUSTION IN HEATING SYSTEMS IN THESSALONIKI, GREECE ..................... 126
N. Moussiopoulos (1), G. Tsegas (1), Ch. Vlachokostas (1), C. Sioutas (2) ....................................................... 126
HEALTH AND MONETARY COST ATTRIBUTED TO AEROSOL AND GASEOUS EMISSIONS FROM BIOMASS USE FOR SPACE HEATING .................................................................................................................................... 127
D.A. Sarigiannis (1,2,3), M. Kermenidou (1), D. Zikopoulos (1), S. Nikolaki (1) and S. Karakitsios (1,2) .......... 127
SPECIAL SESSION - AIR QUALITY MANAGEMENT FOR POLICY SUPPORT AND DECISIONS .................................................................................. 129
INFLUENCE OF AMMONIA EMISSIONS ON PARTICLE FORMATION IN EUROPE ............................................. 131 A.M. Backes (1), A. Aulinger (1), J. Bieser (1, 2), V. Matthias (1), M. Quante (1) ............................................ 131
MICRO-SCALE MODELLING OF URBAN AIR QUALITY TO FORECAST NO2 CRITICAL LEVELS IN TRAFFIC HOT-SPOTS ........................................................................................................................................................... 132
G. Carlino (1), L. Pallavidino (1), R. Prandi (1), A. Avidano (2), G. Matteucci (2), F. Ricchiuti (2), P. Bajardi (3) and L. Bolognini (3) .......................................................................................................................................... 132
HIGH RESOLUTION FORECASTING OF AIR QUALITY AND EXPOSURE FOR HEALTHIER CITIES (HIRAE) ............ 133 A.R. Farrow (1) and R.S. Sokhi (1) .................................................................................................................... 133
THE ROLE OF AIR QUALITY MODELLING WHEN MAKING MAJOR POLICY DECISIONS IN THE UK ................... 134

ix
Bernard Fisher ................................................................................................................................................. 134
IDENTIFYING AIR QUALITY EPISODIC EVENTS AND SEASONAL CHANGES OVER THE UK USING SATELLITE OBSERVATIONS OF TROPOSPHERIC NITROGEN DIOXIDE .............................................................................. 135
R. H. Chaudhari (1), H. Gadhavi (3), V. Sethi (1), R. Kumar (4), A. Namdeo(2), M. C. Bell (2) .......................... 135
FAIRMODE’S EU COMPOSITE MAPPING EXERCISE ........................................................................................ 136 S. Janssen (1) and Ph. Thunis (2) ..................................................................................................................... 136
CHANGES IN AIR POLLUTION EXPOSURE CAUSED BY REDUCED EMISSIONS VERSUS CLIMATE CHANGE IN STOCKHOLM, SWEDEN ................................................................................................................................. 137
C. Johansson (1,2), C. Andersson (3), B. Forsberg (3) ...................................................................................... 137
FUSION OF AIR QUALITY INFORMATION BASED ON THE COMBINATION OF STATISTICAL AND DISPERSION MODELLING APPROACHES ........................................................................................................................... 138
L. Johansson (1) A. Karppinen (1) and J. Kukkonen (1) .................................................................................... 138
MONITORING SHIPPING EMISSION REGULATIONS WITH IN-SITU MEASUREMENTS ..................................... 139 Lisa Kattner (1,2), Barbara Mathieu-Ueffing (1,2), André Seyler (1), John Burrows (1), Stefan Schmolke (2), and Folkard Wittrock (1) .................................................................................................................................. 139
RIAT+, AN INTEGRATED ASSESSMENT TOOL TO EVALUATE EFFECTIVE AIR QUALITY MEASURES AT REGIONAL SCALE ........................................................................................................................................................... 140
G. Maffeis (1), M. Volta (2), P. Thunis (3), R. Gianfreda (1), F. Ferrari (1), C. Carnevale (2), E. Pisoni (3) G. Guariso (4) ....................................................................................................................................................... 140
SUPPORTING DECISION-MAKING PROCESSES THROUGH POLICY ACCEPTABILITY ANALYSIS: THE CASE OF AIR QUALITY POLICIES ........................................................................................................................................ 141
M. Maione (1), E. Valeri (2), P. Polidori (1), D. Teobaldelli (1), M.L. Williams (3), V. Gatta (4) Y. Kazepov (5), V. Sergi (1)............................................................................................................................................................ 141
THE FRENCH EXAMPLE OF TACKLING AIR POLLUTION FROM BIOMASS FUELS: AN ESSENTIAL TIGHT RELATIONSHIP BETWEEN SCIENTIFIC RESEARCH AND PUBLIC POLICIES........................................................ 142
A. Marzin, French Environment and Energy Management Agency, Air Quality Department ......................... 142
MODELED TRENDS IN BACKGROUND OZONE FOR THE UNITED STATES OVER FIVE DECADES FROM 1970 TO 2020 ............................................................................................................................................................. 143
Uarporn Nopmongcol (1), Naresh Kumar (2), Jaegun Jung (1), and Greg Yarwood (1) ................................... 143
ENVIRONMENTAL ASSESSMENT OF LAST-MILE lOGISTIC Optimization strategies ........................................ 144 C. Pozzi (1), A.Nanni (1), E. Seregni (2) ........................................................................................................... 144
SCALE ISSUES IN REGIONAL AIR QUALITY MODELING FOR POLICY SUPPORT................................................ 145 S.T. Rao (1,2), C. Hogrefe (3), M. Astitha (2), H. Luo (2), and R. Mathur (3) .................................................... 145
FORECASTING AND ANALYSIS OF PM2.5 EPISODES AFFECTING THE UK - CONTRASTING LOCAL AND REGIONAL INFLUENCES ................................................................................................................................................. 146
V. Singh (1,2) and R. S. Sokhi (1) ...................................................................................................................... 146
SHORT TERM ACTIONS FOR ABATEMENT OF NO2: TRAFFIC AND AIR QUALTIY MODELING .......................... 147 I. Sundvor (1), T. W. Haug (2), B.A. Høiskar(1), G. Sousa Santos (1) ................................................................ 147
CHINA’S REVISED AIR QUALITY INDEX (AQI) COMPARED TO OTHER AQI-S ................................................... 148 S. van den Elshout (1), L. Blyth (2), Lei YU (3), Wei LIU (3), N. Veldeman (2) .................................................. 148
FUGITIVE DUST: A REVIEW OF SUSPENSION PROCESSES AND CONTROL MEASURES ................................... 149 J.G. Watson (1), J.C. Chow (1), X.L. Wang (1), J. A. Gillies (1), V. Etyemezian (1) ............................................ 149

x
SUPPORTING NATIONAL AIR QUALITY POLICIES WITH A cHEMICAL tRANSPORT mODEL: THE ITALIAN EXPERIENCE WITH the mODELLING sYSTEM minni ....................................................................................... 150
G. Zanini, M. Adani, G. Briganti, A. Cappelletti, L. Ciancarella, G. Cremona, I. D’Elia, M. D’Isidoro, M. Mircea, A. Piersanti, G. Righini, G. Vialetto, L. Vitali ..................................................................................................... 150
SPECIAL SESSION – CLIMATE CHANGE AND HUMAN HEALTH ............ 151
VARIABILITY IN TEMPERATURE-RELATED MORTALITY PROJECTIONS UNDER CLIMATE CHANGE .................. 153 Tarik Benmarhnia ............................................................................................................................................ 153
CAUSAL EFFECTS OF EXTREME HOT DAYS ON MORTALITY IN LOS ANGELES ................................................. 154 M.-A. Bind (1), L. Miratrix (2), and M.-A. Bind (1)............................................................................................ 154
REVIEW OF BLACK AND BROWN CARBON MEASUREMENTS AND EFFECTS .................................................. 155 J.C. Chow (1), J.G. Watson (1), X.L. Wang (1), Guenter Engling (1), L.-W.A. Chen (2) ..................................... 155
EU POLICIES FOR AIR QUALITY: EXPECTED IMPACTS ON CLIMATE CHANGE IN THE MEDITERRANEAN BASIN156 C.Carnevale (1), G.Finzi (1), A.Pederzoli (1), E. Turrini (1), M.Volta (1) ........................................................... 156
SÃO PAULO MEGACITY: NARROWING THE UNCERTAINTIES ON AEROSOL AND CLIMATE CHANGES IN SÃO PAULO (NUANCE) PROJECT .......................................................................................................................... 157
A. Fornaro 1, M.F. Andrade
1, P.A. Dominutti
1, T. Nogueira
1, M.S. Vieira-Filho
1, R.Y. Ynoue
1, J.J. Pedrotti
2, C.
Neves1, Fabio L. T. Gonçalves
1, Bruna Segalin
1, A. Vara
1, S. Ibarra
1, R. Astolfo
1.............................................. 157
CLIMATE VARIABLES AND MICRORNAS IN ELDERLY MEN ............................................................................. 158 S. Fossati (1,2), A. Baccarelli (2), A. Zanobetti (2), P.S. Vokonas(3), R.O. Wright (2,4), J.D. Schwartz (2) ........ 158
CARDIORESPIRATORY Morbidity and MORTALITY DUE to Multiple exposures to airborne pollutants in Santiago de Chile .......................................................................................................................................... 159
U. Franck (1), A. Leitte (1, 2) and P. Suppan (3) ............................................................................................... 159
SHORT TERM EFFECT OF EXTREME TEMPERATURES ON MORTALITY AND INTERACTION EFFECT WITH AIR POLLUTION IN ITALIAN CITIES ...................................................................................................................... 160
P. Michelozzi (1), F.K. de’Donato (1), M. Scortichini (1) , M. Stafoggia (1) ...................................................... 160
EVALUATION Of The AEROSOL-RADIATION AND AEROSOL-CLOUD INTERACTIONS In An On-Line Coupled Model Over The Iberian Peninsula ............................................................................................................... 161
L. Palacios-Peña (1), R.Baró (1), J. L. Guerrero-Rascado (2,3), L. Arboledas-Alados (2,3) and P. Jiménez-Guerrero (1) ..................................................................................................................................................... 161
STREET-LEVEL MODELLING OF CLIMATE ADAPTATION MEASURES AND THEIR CONSEQUENCES ON SUBJECTIVE BIOLOGICAL INDICES AND URBAN AIR QUALITY ....................................................................... 162
J. Resler (1), N. Benešová (2), P. Juruš (1), P. Krč (1), M. Belda (3), O. Vlček (2), J. Lopata (2), P. Derbek (1), D. Srbová (2), K. Eben (1), P. Bauerová (2), P. Hrubeš (1), J. Blumelová (1) and M. Kazmuková (4) .................... 162
GHG landfill emissions determination using a flux chamber ........................................................................ 163 C. Sánchez ; A. Narros ; I. del Peso ; M.M. de la Fuente ; E. Rodríguez ........................................................... 163
THE IMPACT OF HEAT WAVES ON ISCHEMIC HEART DISEASES IN GERMANY – PRESENT SITUATION AND CLIMATE CHANGE ........................................................................................................................................ 164
S. Zacharias (1), C. Koppe (2) and H.-G. Mücke (3) .......................................................................................... 164
CHRONIC EFFECTS OF TEMPERATURE VARIABILITY ON MORTALITY IN SOUTH EASTERN UNITED STATES: IMPLICATIONS FOR PUBLIC HEALTH RISK OF FUTURE CLIMATE CHANGE...................................................... 165
L. Shi (1), I. Kloog (2), J. D. Schwartz(1), A. Zanobetti(1) ................................................................................. 165

xi
FINE SCALE SPATIAL AND TEMPORAL VARIATION IN TEMPERATURE AND ARRHYTHMIA EPISODES IN THE VA NORMATIVE AGING STUDY .......................................................................................................................... 166
A. Zanobetti (1), B. A. Coull (2), I. Kloog (1,3), D. Sparrow (4), P. S. Vokonas (4), D. R. Gold (1,5), J. D. Schwartz (1) .................................................................................................................................................................... 166
SPECIAL SESSION – MODELLING AND MEASURING NON-EXHAUST EMISSIONS FROM TRAFFIC ................................................................. 167
NON-EXHAUST CONTRIBUTIONS TO PM10 AND PM2.5 AT FIVE EUROPEAN CITIES ...................................... 169 F. Amato (1), F. Lucarelli (2), S. Nava (2), G. Calzolai (2), A. Karanasiou (1), C. Colombi (3), V.L. Gianelle (3), C. Alves (4), D. Custódio (4), K. Eleftheriadis (5), E. Diapouli (5), C. Reche (1), A. Alastuey (1), M.C. Minguillón (1), M. Severi (6), S. Becagli (6), T. Nunes (7), M. Cerqueira (4), C. Pio (4), M. Manousakas (8), T. Maggos (8), S. Vratolis (8), R.M. Harrison (9,10) and X. Querol (1) ........................................................................................ 169
ADVANCED RECEPTOR MODELLING TO QUANTIFY EXHAUST AND NON-EXHAUST TRAFFIC EMISSIONS: RESULTS FROM A CASE STUDY IN FLORENCE (ITALY) .................................................................................... 170
V. Bernardoni (1), G. Calzolai (2,3), A. Crespi (1), F. Lucarelli (2,3), S. Nava (3), G. Valli (1), R. Vecchi (1) ...... 170
TURBIDITY AS A PROXY FOR ROAD SURFACE DUST LOAD (DL180) ............................................................... 171 G.Blomqvist, M.Gustafsson, S. Janhäll and I.Järlskog ...................................................................................... 171
CONCENTRATIONS AND EMISSION FACTORS FOR PM2.5 AND PM10 FROM ROAD TRAFFIC IN SWEDEN ........ 172 M. Ferm and K. Sjöberg ................................................................................................................................... 172
ROAD DUST LOAD VARIABILITY IN STOCKHOLM, SWEDEN ........................................................................... 173 M. Gustafsson (1), G. Blomqvist (1), S. Janhäll (1), C. Johansson (2,3), M. Norman (3) .................................. 173
ROAD CLEANING ABATING ROAD DUST –TEST OF ROAD SWEEPERS IN TUNNEL AND STREET ...................... 174 S. Janhäll (1), M. Gustafsson (1), B. Snilsberg (2)............................................................................................. 174
DUST EMISSIONS FROM HEAVY VEHICLE TRAFFIC ON PAVED INDUSTRIAL ROADS ...................................... 175 U. Klenk (1), H. Holst (2) .................................................................................................................................. 175
EVALUATION OF AIR POLLUTION BY PM10 AND PM2.5 ON ST. PETERSBURG RING ROAD: MOBILE MEASUREMENTS AND SOURCE APPORTIONMENT MODELLING................................................................... 176
O.V. Lozhkina, N.V. Nevmerzhitsky, V.N. Lozhkin ............................................................................................ 176
MODELLING ROAD DUST EMISSION ABATEMENT MEASURES USING THE NORTRIP MODEL: VEHICLE SPEED AND STUDDED TYRE REDUCTION ................................................................................................................. 177
M. Norman (1), I. Sundvor (2), B.R. Denby (3), C. Johansson (1,4), M. Gustafsson (5), G. Blomqvist (5) and S. Janhäll (5) ........................................................................................................................................................ 177
CHARACTERIZATION OF PRIMARY PARTICULATE VEHICULAR EMISSIONS IN AN URBAN TUNNEL IN NAPLES, ITALY ............................................................................................................................................................ 178
A. Riccio(1), E. Chianese(1), D. Monaco(1), M.V. Prati(2), M.A. Costagliola(2), G. Perretta(2), L. Shindler(3), G. Agrillo(3), D. Gasbarra(3), A. Esposito(3), L. Carlucci(3), M. Tosca(3), A. Nanni(4), G. Brusasca(4), C. Pozzi(4) ......................................................................................................................................................................... 178
THE LOWBRASYS PROJECT: PARTICLE MEASUREMENT PROCEDURE FOR BRAKE EMISSION TESTS ............... 179 F. Riccobono (1), T. Grigoratos (1), G. Perricone (2), G. Straffellini (3), J. Wahlström (4) and the LOWBRASYS Consortium ...................................................................................................................................................... 179
THE ROLE OF DUST BINDING IN CUTTING DOWN PM10 CONCENTRATIONS IN URBAN AMBIENT AIR: CASE HELSINKI CITY CENTRE .................................................................................................................................. 180
R. Ritola1, K. Kupiainen
1,5, L. Pirjola
2, J. Niemi
3, A. Stojiljkovic
1, A. Malinen
2, J-P. Männikkö
4 ......................... 180

xii
NEW DEVELOPMENTS AND APPLICATIONS OF THE NORTRIP ROAD DUST EMISSION MODEL ...................... 181 B.R. Denby (1), M. Gustafsson, G. Blomqvist, S. Janhäll, M. Norman, C. Johansson, C. Bennet, M. Ketzel, I. Sundvor. K. Kupiainen, A. Stojiljkovic, A. Karppinen, J. Kukkonen, M. Kauhaniemi, L. Pirojola, H. Parviainen 181
The relative importance of tailpipe and non-tailpipe emissions on the oxidative potential of ambient particles in Los Angeles, CA ........................................................................................................................................ 182
Farimah Shirmohammadi1, Sina Hasheminassab1, Dongbin Wang1, James J. Schauer2, Martin M. Shafer2, Ralph J. Delfino3, Constantinos Sioutas1 ........................................................................................................ 182
ROAD DUST MODELING FOR AIR QUALITY FORECASTING IN NORWAY ........................................................ 183 I. Sundvor (1), B. R. Denby (2), I. Vallejo (1), J. K. Süld (2 ), G. Sousa Santos (1) .............................................. 183
SPECIAL SESSION –TRANSPORT RELATED AIR POLLUTION PM AND ITS IMPACT ON CITIES AND ACROSS EUROPE ........................................... 185
AIR POLLUTION AT THE CHARILAOS TRIKOUPIS BRIDGE (GREECE) ............................................................... 187 D.A. Sarigiannis (1), E.J. Handakas (1), M. Kermenidou (1), P. Charisiadis, (2), K. Makris (2), A. Gotti (1) and S.P. Karakitsios (1) ........................................................................................................................................... 187
MODELLING AND MEASUREMENT OF URBAN AEROSOL PROCESSES FROM ROADSIDE TO AMBIENT........... 188 M. Karl (1,*), J. Kukkonen (2), M.P. Keuken (3), S. Lützenkirchen (4), L. Pirjola (5,6) and T. Hussein (7,6) ..... 188
MODELLING OF THE PARTICLE NUMBER CONCENTRATIONS IN FIVE EUROPEAN CITIES ............................... 189 J. Kukkonen (1), M. Karl (2), M.P. Keuken (3), H.A.C. Denier van der Gon (3), B.R. Denby (2)(8), V. Singh (4), J. Douros (5), A. Manders (3), Z. Samaras (5), N. Moussiopoulos (5), S. Jonkers (3), M. Aarnio (1), A. Karppinen (1), L. Kangas (1), S. Lützenkirchen (6), Tuukka Petäjä (7), Vouitsis, I. (5), R. S. Sokhi (4) ............................... 189
HEALTH RISK ASSESSMENT OF REDUCED AIR POLLUTION EXPOSURE WHEN CHANGING COMMUTING BY CAR TO BIKE ........................................................................................................................................................ 190
B. Lövenheim (1), C. Johansson (1, 2), Lina Wahlgren (4), Hans Rosdahl (4), Jane Salier Eriksson (4), P. Schantz
(4), Peter Almström (5), Svante Berglund (5), A. Markstedt (5), Magnus Strömberg (3), Johan Nilsson Sommar (3) and B. Forsberg (3) ..................................................................................................................................... 190
HIGH-RESOLUTION SOURCE APPORTIONMENT MODELLING FOR AMSTERDAM AND ROTTERDAM ............. 191 A. Manders, R. Kranenburg, S. Jonkers, M. Schaap and H. Denier van der Gon ............................................. 191
OPERATIONAL APPLICATION OF AN EMPIRICAL APPROACH FOR DETERMINING CONCENTRATION INCREMENTS AT THE STREET LEVEL .............................................................................................................. 192
E. Chourdakis, N. Moussiopoulos, F. Barmpas and I.Douros ........................................................................... 192
INVESTIGATING THE NO2 EMISSIONS OF INDIVIDUAL VEHICLES UNDER REAL DRIVING AND ITS CONTRIBUTION TO LOCAL AIR POLLUTION .................................................................................................. 193
D. Pöhler (1), F. Kanatschnig (1), M. Horbanski (1), A. Friedrich (2), J. Lampel (1,3) and U. Platt (1) .............. 193
EXHAUST PARTICLES AND NOX EMISSIONS OF A SCR EQUIPPED HEAVY DUTY TRUCK IN REAL-WORLD DRIVING CONDITIONS ................................................................................................................................................ 194
S. Saari (1), P. Karjalainen (1), L. Pirjola (2), L. Ntziachristos (1,3), J. Keskinen (1) and T. Rönkkö (1) ............. 194
PHYSICAL CHARACTERIZATION OF AIRBORNE PARTICLES IN THESSALONIKI ................................................. 195 Ι. Vouitsis, S. Amanatidis, L. Ntziachristos and Z. Samaras .............................................................................. 195
PART TWO: POSTER SESSIONS ............................................................ 197

xiii
AIR QUALITY AND IMPACT ON REGIONAL TO GLOBAL SCALE ............. 199
MODELLING TRENDS IN AIR QUALITY SENSITIVITY TO 20TH CENTURY CLIMATE VARIABILITY ACROSS TROPICAL TO BOREAL CLIMATES .................................................................................................................. 201
A.R. Farrow ...................................................................................................................................................... 201
CLIMATOLOGY OF AEROSOLS, CLOUD AND RAINFALL CHARACTERISTICS OVER MADURAI DURING MONSOON AND DROUGHT PERIODS .............................................................................................................................. 202
G. Indira (1), B. Vijay Bhaskar (1) ..................................................................................................................... 202
AEROSOL AND ENVIRONMENTAL CONTAMINATION IN A DENTAL HOSPITAL - EVIDENCE FROM INDIA ....... 203 S. Katpattil (1) .................................................................................................................................................. 203
IMPACT OF BIOMASS BURNING ON indian AIR QUALITY during pre-monsoon season ................................. 204 A.Nithin Kumar (1), Vikas Singh (2), Amit Kesarkar (2) and M. Sri Murali (1) ................................................. 204
SHORT-TERM VARIABIITY OF INORGANIC IONIC COMPONENTS IN FINE AEROSOLS OVER ATHENS, GREECE.205 D. Paraskevopoulou (1), P. Zarmpas (2), L. Fourtziou (2), N. Mihalopoulos (1,2) ........................................... 205
PARTICLE NUMBER CONCENTRATION AND PARTICLE SIZE DISTRIBUTION MEASUREMENTS BY MOBILE LABORATORY IN TAMPERE, FINLAND ........................................................................................................... 206
O. Potila (1), K. Pihlava (1), H. Timonen (2), R. Hillamo (2), J. Kuula (2), H. Wihersaari (1), P. Simonen (1), M. Olin (1), M. Dal Maso (1), J. Keskinen (1) and T. Rönkkö (1)............................................................................ 206
STUDY OF THE RADIATIVE PROPERTIES OF AEROSOLS FROM SATELLITE DATA OVER AN URBAN AREA: AIR QUALITY APPLICATION ................................................................................................................................. 207
Samaneh Sabetghadam (1), Masoud Khoshsima (2) ....................................................................................... 207
AIR QUALITY IMPACTS OF THE INCREASING USE OF BIOMASS FUELS 209
IMPACT OF BIOMASS COMBUSTION ON THE URBAN AIR QUALITY OF ATHENS ........................................... 211 M.Gratsea (1), E.Gerasopoulos (1), E.Liakakou (1), N.Mihalopoulos (1,2) ...................................................... 211
IMPACT OF EU CLIMATE AND AIR QUALITY POLICY ON OZONE DAMAGE IN EUROPE .................................. 212 C. Hendriks (1), W. Schöpp (2), M. Schaap (1), N. Forsell (2), G. Kiesewetter (2)............................................ 212
ULTRAFINE PARTICLE EMISSION CHARACTERISTICS OF A RESIDENTIAL PELLET STOVE ................................. 213 S. Ozgen (1), S. Becagli (2), V. Bernardoni (3), L. Corbella (4), A. Crespi (3), M. Dell'Acqua (3), P. Fermo (4), R. Gonzalez (4), G. Lonati (1), S. Signorini (5), R. Tardivo (1), G. Valli (3), R. Vecchi (3), L. Galli (6) ..................... 213
MODELLING OF THE IMPACT OF CONSUMPTION OF BIOMASS FOR HOME HEATING ON AIR QUALITY IN A DISTRICT OF MADRID CITY ........................................................................................................................... 214
J.L. Santiago and F. Martin .............................................................................................................................. 214
TRANSFORMATION RATIOS OF PHENOLS AND NITRO-PAHS GENERATED BY STOVES WOOD BURNING: A PHOTOCHEMICAL CHAMBER STUDY ............................................................................................................ 215
Y. Vásquez (1,2), F. Reyes (1,2), N. Olivera (2), N. López (1), P. Oyola (1), E. Gramsch(2), M.Rubio(3), E. Lissi (3); A. Cadíz (4); and Pérola de Castro Vasconcellos(5). ................................................................................. 215
DEVELOPMENT APPLICATION EVALUATION OF AIR QUALITY AND RELATED MODELS ............................................................................... 217
EVALUATION OF aEROSOL OPTICAL PROPERTIES USING THE CAMX-AODEM MODELLING SYSTEM .............. 219 A.Balzarini (1), L.Ferrero (2), B.Mazzini (2), T.C.Landi (3), G.Pirovano (1), A.Riccio (4) ................................... 219

xiv
RECENT CFD MODELLING AND EXPERIMENTAL STUDIES OF AIR QUALITY AND THERMAL COMFORT IN URBAN AREAS .......................................................................................................................................................... 220
R. Buccolieri (1), S.M. Salim (2), J.L. Santiago (3), F. Salamanca (4) ................................................................ 220
EXPERIMENTAL INVESTIGATION OF THE INFLUENCE OF A CUBIC BUILDING ON THE WIND EROSION OF A MIXING OF ERODIBLE AND NON-ERODIBLE PARTICLES ................................................................................ 221
Maria Clara Caliman (1,2,4), Bruno Furieri (2), Jean-Luc Harion (3), Jane Meri Santos (2), Alexandre Valance (4), Ahmed Ould El Moctar (5) ......................................................................................................................... 221
MATHEMATICAL MODELLING OF EMISSIONS FROM A BED OF GRANULAR MATERIAL EXPOSED TO A TURBULENT FLOW ........................................................................................................................................ 222
Maria Clara Caliman (1,2,4), Bruno Furieri (2), Jean-Luc Harion (3), Jane Meri Santos (2), Alexandre Valance (4), Ahmed Ould El Moctar (5) ......................................................................................................................... 222
IMPROVED REGRESSION METHODS FOR MAPPING TRAFFIC RELATED AIR QUALITY .................................... 223 B.R. Denby ....................................................................................................................................................... 223
DEVELOPMENT OF AIR QUALITY FORECASTING SYSTEM IN THE EASTERN MEDITERRANEAN USING THE WRF-CHEM MODEL............................................................................................................................................... 224
G. K. Georgiou (1), T. Christoudias (2), Y. Proestos (2), M. Vrekoussis (1,3), M. Pikridas (1), P. Hadjinicolaou (1), H. Fischer (4), S. Kleanthous (5), J. Lelieveld (1,4) ..................................................................................... 224
DEVELOPMENT OF ANFIS MODEL WITH OPTIMISED INPUTS TO REDUCE THE COMPUTATIONAL COST AND TIME FOR GROUND LEVEL OZONE FORECASTING ......................................................................................... 225
Amit Kumar Gorai ............................................................................................................................................ 225
HIGH-RESOLUTION Modeling OF Urban Air Quality in the Berlin-Brandenburg Region WITH WRF-CHEM: A MODEL Evaluation ....................................................................................................................................... 226
F. Kuik (1), G. Churkina (1), A. Lauer (2), K. Mar (1), T. Butler (1) .................................................................... 226
EVALUATION OF THE dISPERSION OF ODOUR IN ITALY: MODELLING STUDIES COMPLYING WITH THE NATIONAL REFERENCE GUIDELINE ............................................................................................................... 227
A. Mantovani (1), M. Benzo (1) ....................................................................................................................... 227
MODELLING of arsenic aerosol IN SOUTH-WEST SPAIN ................................................................................ 228 C. Milford (1,2), C. Marrero (2), A. Sánchez de la Campa (1), R. Fernández-Camacho (1), J.J. Bustos(2), S. Rodríguez (2), N. Castell (3), J. De la Rosa (1) and A.F. Stein (4) ...................................................................... 228
RELATIONSHIP BETWEEN MODELLED POLLUTION of NITROGEN DIOXIDE AND TRAFFIC FLOW .................... 229 A. Miškinytė (1), A. Dėdelė (1), G. Šidlauskaitė (1) .......................................................................................... 229
USE OF COMPLEMENTARY METRICS TO IMPROVE DATA ASSIMILATION PERFORMANCES ........................... 230 A.Nanni, C. Silibello, C. Pozzi, G. Calori ............................................................................................................ 230
A HYBRID MODELING SYSTEM FOR the evaluatioN of URBAN CONCENTRATIONS: CASE STUDY FOR MIlan area ..................................................................................................................................................................... 231
N. Pepe (1,2), G. Pirovano (1), A. Balzarini (1), A. Toppetti (1), G. M. Riva (1), G. Lonati (2) and M. Bedogni (3) ......................................................................................................................................................................... 231
AIR POLLUTION FORECASTS COMPARED WITH DAILY MEASUREMENT AT THE ISLAND OF LAMPEDUSA ...... 232 F. Petracchini (1), E. Zampetti (1), L. Paciucci (1), F. Liotta (1), M. Segreto (1), P. Papa (1), V. Flammia (1) ... 232
INFLUENCE OF ATMOSPHERIC STABILITY ON THE ESTIMATION OF TRACE METALS CONCENTRATIONS BY MEANS OF LINEAR STATISTICAL MODELS ..................................................................................................... 233
G. Santos (1), S. Terán (1) and I. Fernández-Olmo (1) ..................................................................................... 233
ERROR APPORTIONMENT FOR AIR QUALITY MODELLING: ADVANCEMENTS IN MODEL EVALUTION ........... 234

xv
E. Solazzo, S. Galmarini .................................................................................................................................... 234
EVALUATION OF OZONE LEVELS FROM Α GLOBAL MODEL IN EASTERN MEDITERRANEAN SEA - THE INFLUENCE OF ETESIAN WINDS .................................................................................................................... 235
E. Solomou (1), A. Poupkou (1), P. Zanis (2) and D. Melas (1) ......................................................................... 235
MODELLING EXERCISES IN COST ACTION ES1006: LOCAL-SCALE MODELS FOR ACCIDENTAL RELEASES IN BUILT ENVIRONMENTS ........................................................................................................................................... 236
Silvia Trini Castelli (1), Kathrin Baumann-Stanzer (2), Bernd Leitl (3), Gianni Tinarelli (4), Maya Milliez (5), Eva Berbekar (6), Anniko Rakai (6), Vladimir Fuka (7), Antti Hellsten (8), Anton Petrov (9), George Efthimiou (10) (11), Spyros Andronopoulos (11), Richard Tavares (12), Patrick Armand (13), Claudio Gariazzo (14), Maxime Nibart (15) and all COST ES1006 Members (16) .............................................................................................. 236
GRAMM/GRAL: a coupled model system to simulate air pollution at the city scale ..................................... 237 K. Zink (1), A. Berchet (1), D. Brunner (1), J. Brunner (2) and L. Emmenegger (1)........................................... 237
ENVIRONMENTAL AND HEALTH IMPACT RESULTING FROM AIR POLLUTION ......................................................................................... 239
DISTRIBUTION OF PARTICULATE MASS CONCENTRATIONs IN A COMPLEX TRAFFIC HOT SPOT .................... 241 B. Artíñano (1), E. Díaz Ramiro (1), F. J. Gómez-Moreno (1), S. Vardoulakis (2), C. Dimitroulopoulou (2), C. Yagüe (3), G. Maqueda (3), C. Román-Cascón (3), M. Sastre (3), R. Borge (4), J. Lumbreras (4) and E. Latorre (5) .................................................................................................................................................................... 241
CHILDREN EXPOSURE TO AIR POLLUTANTS IN INDOOR OF PRIMARY SCHOOLS ........................................... 242 A. Ferreira (1), S.M. Cardoso (2) ...................................................................................................................... 242
POLLUTANT DATA MAPPING AT MUNICIPALITY LEVEL FOR EXPOSURE ASSESSMENT ON EUROPEAN countries ..................................................................................................................................................................... 243
S. Ghigo (1), S. Bande (1), L. Ciancarella (2), M. Mircea (2), A. Piersanti (2), G Righini (2), X. Basagaña (3), D. Agis (3), M. Rus(4), M. Gandini (1) .................................................................................................................. 243
ASSESSMENT BY MODELING OF THE ATMOSPHERIC DISPERSION THE EMISSIONS OF A THERMAL POWER STATION IN DOUALA (CAMEROON) ............................................................................................................. 244
Jean Roger Kaze Djamen (1), Robert Mbiake (2), Richard Leduc (3) ............................................................... 244
THE METHODOLOGY OF DETAILED LINKING BETWEEN THE AIR POLLUTION MODELLING OVER A COMPLEX TERRAIN AND RESPIRATORY DISEASES IN CHILDREN – THE ZASAVJE REGION, SLOVENIA, CASE ................... 245
A. Kukec (1), L. Zaletel-Kragelj (1), B. Grašič (2), P. Mlakar (2) and M.Z. Božnar (2) ........................................ 245
HAVOC OF OUTDOOR AIR CONTAMINANTS - A CASE STUDY FROM INDIA ................................................. 246 Dr. S.K. Sharma ................................................................................................................................................ 246
SEASONAL DISTRIBUTION OF VIABLE BACTERIAL AEROSOL IN BENGALURU URBAN, KARNATAKA, INDIA ... 247 S Sivasakthivel (1) and N.Nandini (2)* ............................................................................................................. 247
AIR POLLUTION, HEALTH AND SOCIAL DEPRIVATION ASSESSMENT IN MUMBAI .......................................... 248 Laksh Trehan (1), Harish C. Phuleria (1), Rashmi S. Patil (1), Anil Namdeo (2) ................................................ 248
SPATIAL DISTRIBUTION OF NON-REGULATED BIOGENIC AIR POLLUTANTS (ALLERGENIC POLLEN) ACROSS BERLIN, GERMANY ....................................................................................................................................... 249
B. Werchan (1,2,3), M. Werchan (1,2), H.-G. Mücke (4) and K.-C. Bergmann (1) ........................................... 249
REGIONAL SCALE AMINE CHEMISTRY DISPERSION MODELLING WITH COSMO-MUSCAT ............................. 250

xvi
Ralf Wolke (1), Andreas Tilgner (1), Detlef Hinneburg (1), Roland Schrödner (1, 2), Claus Nielse (3), Hartmut Herrmann (1) ................................................................................................................................................... 250
MEASUREMENT OF AIR POLLUTANTS AND PROCESS STUDIES ........... 251
A TWO-YEAR STUDY ON URBAN PARTICLE NUMBER (0.3-10 µM) AND MASS CONCENTRATIONS (<10 µM): LEVELS IN TIME AND WEEKLY VARIATION .................................................................................................... 253
Dayana M. Agudelo-Castañeda(1), Elba C. Teixeira(1),(2), Ismael L. Schneider(1), Felipe N. Pereira(2) ........ 253
ASSESSMENT OF IMPACTS OF COARSE AND FINE PARTICLES FROM BUILDING DEMOLITION WORKS ON SURROUNDING AREAS ................................................................................................................................. 254
F. Azarmi (1), P. Kumar (1) (2) ......................................................................................................................... 254
EVALUATION OF ARTIFACTS AFFECTING COLLECTION OF AIRBORNE PAHS .................................................. 255 C. Balducci (1), A. Febo (1),M. Perilli (1), P. Romagnoli (1), A. Cecinato (1), C. Tortorella (2), S. Iacobellis (2) 255
CFD-URANS PREDICTION OF DOSAGE-BASED PARAMETERS FROM SHORT-TERM RELEASES (PUFFS) OF HAZARDOUS AIRBORNE MATERIALS ............................................................................................................ 256
J.G. Bartzis (1), G.C. Efthimiou (2) and S. Andronopoulos (2) .......................................................................... 256
CUSTOM MADE DUST MONITOR EQQUIPED WITH FAST GPS MODULE AND INTERNET CONNECTION ......... 257 J. Bartyzel (1), L. Chmura (1,2), M. Galkowski(1), J.M. Necki (1), M. Zimnoch (1), K. Rozanski (1) .................. 257
DETERMINANTS OF PERSONAL EXPOSURE TO BLACK CARBON IN STOCKHOLM TRAFFIC ............................. 258 G. Bero Bedada(1), N. Andersson(1),T. Bellander(1,2), A. Georgellis(1,2), I. Sagán(1,2), C. Johansson (3,4), A. Merritt(1,2) ...................................................................................................................................................... 258
PARTICULATE MATTER MEASUREMENTS AT KASPROWY WIERCH MOUNTAIN STATION AND ZAKOPANE CITY IN SOUTHERN POLAND – PRELIMINARY RESULTS ......................................................................................... 259
L. Chmura (1,2), J. Bartyzel (2), M. Zimnoch (2), J. Necki (2), M. Galkowski (2), D. Zieba(2), K. Rozanski (2) .. 259
AIR POLLUTION ANALYSIS AND DEPENDENCE ON METEOROLOGY IN KLAIPĖDA CITY .................................. 260 A. Dėdelė (1), A. Miškinytė (1), M. Vilkaitė (1) ................................................................................................ 260
MODELLING HIGH RESOLUTION PM1 INDOOR CONCENTRATIONS USING CONTAM MODEL ......................... 261 C. Gariazzo (1), A. Pelliccioni (1), R. Ferrante (1), G. Cattani (2) ...................................................................... 261
MODELLING THE OZONE CONCENTRATION OVER MEDITERRANEAN MBL: ESTIMATION OF SHIP EMISSIONS IMPACT ........................................................................................................................................................ 262
C. N. Gencarelli (1), F. De Simone (1), F. Carbone (1), I. M. Hedgecock (1), F. Sprovieri (1) and N. Pirrone (2) ......................................................................................................................................................................... 262
EXAMINATION OF THE SPATIAL DISTRIBUTION AND TEMPORAL VARIATION OF BLACK CARBON IN SANTIAGO DE CHILE ....................................................................................................................................................... 263
E. Gramsch (1), F. Pardo (1), P. Oyola (2), and P. Pérez (1) ............................................................................. 263
HEAVY METAL EXPOSURE SOURCE IDENTIFICATION AND HEALTH IMPACT ASSOCIATED WITH INDOOR PARTICULATE MATTER (PM10 & PM2.5) -A STATISTICAL ANALYSIS ............................................................. 264
Alfred Lawrence*, Tahmeena Khan, Seema Joshi .......................................................................................... 264
SPATIAL DISTRIBUTION OF SIZE SEGREGATED PARTICULATE MATTER IN SLUMS SITUATED NEAR HEAVILY TRAVELED TRAFFIC ROADS IN MUMBAI, INDIA ............................................................................................ 265
P. B. Panchal (1), R. S. Patil (1), R. Kumar (1, 2), H. C. Phuleria (1) .................................................................. 265
“NO GAS” PROJECT: EXHAUSTED DUMP EMISSIONS .................................................................................... 266

xvii
L. Paciucci, C. Balducci, A. Cecinato, A. Imperiali, M. Perilli, M. Frattoni, F. Petracchini, M. Segreto, F. Vichi, P. Romagnoli ........................................................................................................................................................ 266
APPLICATION OF DIGITAL IMAGE PROCESSING TECHNIQUE IN DETERMINING VISUAL AIR QUALITY: A FEASIBILITY STUDY ....................................................................................................................................... 267
Samaneh Sabetghadam ................................................................................................................................... 267
DETERMINATION OF 19 PAHS IN AIR SAMPLES USING GAS CHROMATOGRAPHY - MASS SPECTROMETRY .. 268 D.A. Sarigiannis (1,2), S. Nikolaki (1), D. Zikopoulos (1), and M. Kermenidou (1) ........................................... 268
MICROBIAL AIR QUALITY AND SURFACE CONTAMINATION IN HOSPITAL AMBULANCE SERVICES –AN EXPLORATION .............................................................................................................................................. 269
A. Sha (1) ......................................................................................................................................................... 269
NANOPARTICLES ASSESSMENT IN SAPIRANGA CITY, SOUTHERN BRAZIL ...................................................... 270 I.L. Schneider (1), E.C. Teixeira (1,2), L.F.S. Oliveira (1,3), M.D. Vargas (2), P. Krecl (4), and L. Gidhagen (5) . 270
THE IMPACT OF SPEED AND CONGESTION ON TRAFFIC EMISSIONS WITH SPECIFIC ATTENTION TO DATA ANALYSIS ..................................................................................................................................................... 271
S. van den Elshout (1) and S.M. Willers (1) ...................................................................................................... 271
CHARACTERIZATION OF INDOOR/OUTDOOR PM10, PM2.5, PM1 AND RADON CONCENTRATIONS IN AN OLD MEDICAL CENTER ............................................................................................................................ 272
K.Verijkazemi (1), Gh.Bahmannia (2) ............................................................................................................... 272
MEASUREMENTS OF OZONE AND RELATED TRACE GASES AT SEMI-ARID URBAN SITE OF INDIA: DIURNAL AND SEASONAL VARIATIONS IN AIR QUALITY ...................................................................................................... 273
Ravi Yadav (1), L.k. Sahu (1), G. Beig (2), S.N.A. Jaaffrey (3) ............................................................................ 273
SOURCE APPORTIONMENT AND EMISSION MODELS-INVENTORIES ... 275
PM1 CHARACTERISATION AND SOURCE APPORTIONMENT AND AEROSOL SIZE DISTRIBUTION AT A HOT-SPOT POLLUTION AREA (MILAN, ITALY)................................................................................................................. 277
V. Bernardoni (1), A. Bigi (2), M. Elser (1, *), P. Fermo (3), G. Ghermandi (2), A. Piazzalunga (3,**), G. Valli (1), R. Vecchi (1) ..................................................................................................................................................... 277
CAN FLOATING CAR DATA HELP IMPROVING TRAFFIC EMISSIONS ESTIMATES? ........................................... 278 N. Castell, M. Vogt, D. Vo Thanh, S. Lopez-Aparicio and I. Sundvor ................................................................ 278
ESTIMATING THE AIR MANGANESE EMISSION IN the saNTANDER BAY (NORTHERN SPAIN) ........................ 279 I. Fernández-Olmo (1), D. López (1), A. di Gianvito (1) and J.A. Fernández-Ferreras (1) ................................. 279
QUANTIFICATION AND CHARACTERIZATION OF EMISSIONS FROM OPEN-FIELD AGRICULTURAL RESIDUE BURNING IN MAHARASHTRA ....................................................................................................................... 280
M. Garg (1), C. Venkataraman (2), H. C. Phuleria (1) ....................................................................................... 280
ATMOSPHERIC PARTICULATE POLLUTION TO NEARBY BIZERTE LAGOON (MEDITERRANEAN LAGOON) ....... 281 Essia Hamdi (1), Dalila Taieb(2) ....................................................................................................................... 281
FUGITIVE PARTICULATE MATTER EMISSIONS AT CONSTRUCTION SITES ....................................................... 282 H. Hassan (1), K. Kakosimos (1), P. Kumar (2) .................................................................................................. 282
SOURCE APPORTIONMENT USING PMF RECEPTOR MODEL OF AIRBORNE PM10 IN THE PORT-CITY OF RIJEKA (CROATIA) .................................................................................................................................................... 283
B. Mifka (1) and A. Alebić Juretić (1, 2) ............................................................................................................ 283

xviii
TAXI TIMES EFFECT ON AIRCRAFT EMISSIONS AND POLLUTANTS DISPERSION ............................................. 284 E. Pecorari (1), E.Innocente (1), A. Mantovani (2), D. Bassano (3), G. Rampazzo (1), L. Palmeri (4) ............. 284
INTEGRATED SOURCE APPORTIONMENT IN SUPPORT OF AOSTA VALLEY AND PIEMONTE AIR QUALITY PLANS ..................................................................................................................................................................... 285
G. Pession (1), T. Magri (1), G. Calori (2), M.P.Costa (2), S. Bande (3), F. Bissardella (3), M. Clemente (3) .... 285
THE IMPORTANCE OF MOTOR VEHICLE EMISSIONS ON THE PM2.5 POLLUTION OF THE CITY OF MEDELLÍN AS DEDUCTED FROM THE HOURLY VARIATIONS IN PM2.5 CONCENTRATIONS AND FROM CHEMICAL ANALYSIS OF PM2.5 MATERIAL ........................................................................................................................................... 286
E. Posada (1), M.Gómez (2) ............................................................................................................................. 286
VISIBILITY IMPAIRMENT SOURCE APPORTIONMENT ANALYSIS IN AN URBAN AREA DURING 2007 TO 2009 287 Samaneh Sabetghadam (1), Masoud Khoshsima (2) ....................................................................................... 287
SOURCE APPORTIONMENT ANALYSIS OF ATMOSPHERIC PARTICULATE AIR MATTER OVER A SOUTHERN MEDITERRANEAN COAST ............................................................................................................................. 288
D.Taieb (1), A.Ben Brahim (1) .......................................................................................................................... 288
APPLICATION OF AERMOD FOR DETERMINATION OF AIR QUALITY IN AN INDUSTRIAL REGION, TURKEY .... 289 Gizem Tuna(1), Hicran Altuğ (2), Tolga Elbir (1), Eftade Gaga(2) .................................................................... 289
URBAN METEOROLOGY ...................................................................... 291
WIND TUNNEL EXPERIMENTS FOR DEVELOPING STREET NETWORK PARAMETERISATIONS ......................... 293 M. Carpentieri (1), P. Hayden (1), A. Robins (1), Z.-T. Xie (2) and O. Coceal (3) .............................................. 293
SPECIAL SESSION – AIR POLLUTION METEOROLOGY FROM LOCAL TO GLOBAL SCALES .................................................................................. 295
URBAN NEAR-GROUND LEVELS OZONE PROFILE IN THAILAND ..................................................................... 297 T. Apichattam (1), S. Bualert (1) ...................................................................................................................... 297
MIXING AND DEPOSITION PROCESSES DURING LONG-RANGE TRANSPORT OF SAHARAN DUST .................. 298 B. Heinold (1), K. Schepanski (1) and I. Tegen (1) ............................................................................................ 298
MODELLING URBAN HOURLY WIND SPEEDS BASED ON MEASURED NEARBY AIRPORT WIND SPEEDS ......... 299 T.-B. Ottosen (1,2), M. Ketzel (3), O. Hertel (3), J. Brandt (3), H. Skov (1,3), Sven-Erik Gryning (4), Ekaterina Batchvarova(4,5), and K. E. Kakosimos (2) ...................................................................................................... 299
MODELING THE ASH DISPERSION AND DEPOSITION FROM THE COTOPAXI VOLCANO: THE AUGUST 14
TH 2015 ERUPTION ...................................................................................................................... 300
R. Parra (1), B. Bernard (2) ............................................................................................................................... 300
MODELING THE WIND DIRECTION AND SPEED AT DIFERENT FLIGHT LEVELS OVER THE COTOPAXI VOLCANO DURING THE ERUPTIVE PERIOD OF AUGUST 2015 ........................................................................................ 301
R. Parra (1), H. Brumberg (2) ........................................................................................................................... 301
INFLUENCE OF URBAN SENSIBLE HEAT FLUX ON TROPICAL ATMOSPHERIC STABILITY, BANGKOK THAILAND ..................................................................................................................................................................... 302
M.Putkhong1,T. Rungratanaubon
1, S. Bualert
1................................................................................................. 302
INFLUENCE OF TEMPERATURE INVERSIONS ON AIR QUALITY OVER TEHRAN, IRAN - A CASE STUDY ............ 303 S. Torbatian (1), M. Naderi (1), V.Hosseini (2) ................................................................................................. 303

xix
SPECIAL SESSION – AIR QUALITY MANAGEMENT FOR POLICY SUPPORT AND DECISIONS .................................................................................. 305
LIFE-SAVING INFORMATION: MORTALITY RISK REDUCTION FROM AIR QUALITY FORECASTS ...................... 307 J. Aldy (1) and M.-A. Bind (2) ........................................................................................................................... 307
ASSESSING THE ECONOMIC VALUE OF A REGIONAL AIR QUALITY PLAN ....................................................... 308 E. Angelino (1), C. Carnevale (2), F. Ferrari (3), R. Gianfreda (3) G. Guariso (4), G. Lanzani (1), G. Maffeis (3), E. Turrini(2), M. Volta (2) ..................................................................................................................................... 308
INTEGRATED EFFECTS OF NESTING, HORIZONTAL RESOLUTION AND LOCAL INFORMATIONS ON AIR QUALITY FORECAST PERFORMANCE AT DIFFERENT SCALES ........................................................................................ 309
A. D’Allura (1), A. Bolignano (2), F. Stel (3), G. Pession (4) .............................................................................. 309
MODELLING AMBIENT AIR QUALITY USING A SECTOR BASED LAND USE REGRESSION TECHNIQUE ............. 310 Aoife Donnelly
1*, Owen Naughton
2, Bruce Misstear
1, Francesco Pilla
1, Brian Broderick
1 ............................... 310
STATISTICAL ESTIMATION OF LOCAL AMBIENT AIR QUALITY ....................................................................... 311 I. Matyasovszky (1) and K. Labancz (2) ............................................................................................................ 311
THE USE OF SODAR MEASUREMENTS IN ASSESSING ANEMOLOGICAL CONDITIONS OF KRAKOW ................ 312 L. Osrodka, E. Krajny ........................................................................................................................................ 312
A METHODOLOGICAL APPROACH INQUANTIFYING UNCERTAINTIES OF AIR QUALITY HEALTH IMPACT ASSESSMENTS .............................................................................................................................................. 313
D. A. Sarigiannis (1), P. Kontoroupis (1) , C. Schieberle (2), B. Miller (3), V. P. Singh (4) ................................. 313
EFFECT OF OZONE ENRICHED WATER AS BIOCIDE ON AIRBORNE BACTERIAL AND FUNGAL CONCENTRATION IN INDOOR ENVIRONMENT .......................................................................................................................... 314
Sivasakthivel S (1) and N.Nandini (2) ............................................................................................................... 314
APPRAISAL, A FP7 PROJECT ON INTEGRATED ASSESSMENT MODELING FOR REGIONAL AIR QUALITY POLICY ..................................................................................................................................................................... 315
M. Volta1, G. Guariso
17, J.M. Baldasano
15, C. Belis
2, N. Blond
5, C. Bouland
14, C. Carnevale
1, A. Clappier
6, J.
Douros7, G. Finzi
1, A. Graff
16, S. Janssen
3, K. Juda-Rezler
11, N. Karvosenoja
4, G. Maffeis
12, A. Martilli
13, A.
Miranda8, Z. Nahorski
10, E. Pisoni
2, M. Rasoloharimahefa
14, E. Real
9, H. Relvas
8, P. Thunis
2, E. Turrini
1, P.
Viaene3, L. White
18........................................................................................................................................... 315
SPECIAL SESSION – CLIMATE CHANGE AND HUMAN HEALTH ............ 317
CLIMATE CHANGE AND ITS IMPACT ON HUMAN HEALTH ............................................................................ 319 A. Alebic-Juretic ............................................................................................................................................... 319
STUDY OF PERSONAL EXPOSURE TO ATMOSPHERIC PARTICLES BY VOLUNTEERS FROM EDUCATION SECTOR IN SOUTHERN BRAZIL ................................................................................................................................... 320
D. S. De Almeida, L. D. Martins ........................................................................................................................ 320
MID-21ST
CENTURY AIR QUALITY AT THE URBAN SCALE: CASE STUDIES FOR PARIS AND STOCKHOLM ......... 321 K. Markakis (1), M. Valari (1), M. Engardt (2), G. Lacressoniere (3), R. Vautard (3) and C. Andersson (2) ...... 321
CLIMATE, AIR QUALITY, AND HEALTH BENEFITS OF OFFSHORE WIND IN THE USA ....................................... 322 J. Buonocore (1), P. Luckow (2), B. Biewald (2), J. Fisher (2), J. Levy (3) .......................................................... 322
ESTIMATION OF POTENTIAL ADVERSE HEALTH EFFECTS IN ASSOCIATION WITH WEATHER PARAMETERS, AMBIENT AIR POLLUTANTS AND POLLEN IN THE AUGSBURG REGION ......................................................... 323

xx
J. Cyrys (1,2), C. Beck (3), K. Wolf (1), S. Breitner (1), T. Kusch (2), K. Berger (1), A. Schneider (1) and A. Peters (1) .................................................................................................................................................................... 323
INDOOR CLIMATE VARIABLES AND ENDOTHELIAL FUNCTION IN ADULTS ..................................................... 324 S. Fossati (1,2), E. Pasqual (1,2), A. Spinazzè (3), A. Cattaneo (3), D. Cavallo (3), P. Carrer (2) ...................... 324
SPECIAL SESSION –MODELLING AND MEASURING NON-EXHAUST EMISSIONS FROM TRAFFIC ................................................................. 325
HIGH TIME RESOLUTION MEASUREMENTs TO IDENTIFY NON-EXHAUST EMISSIONS FROM ROAD TRAFFIC: A PILOT study in london (uk) ........................................................................................................................... 327
M. Dell’Acqua (1), D. C. S. Beddows (2), V. Bernardoni (1), G. Calzolai (3), G. Fuller (4), D. Green (4), R. M. Harrison (2,5), F. Lucarelli (3), S. Nava (3), G. Valli (1), R. Vecchi (1) ............................................................... 327
APPLICATION OF TWO ROAD DUST EMISSION MODELS TO ASSESS THE AIR QUALITY IMPACT OF OPTIONS FOR REDUCING NON-EXHAUST PM10 EMISSIONS ......................................................................................... 328
Ana Stojiljkovic (1), Mari Kauhaniemi (2), Jaakko Kukkonen (2), Kaarle Kupiainen (1, 7), Ari Karppinen (2), Liisa Pirjola (3), Anu Kousa (4), Jarkko Niemi (4), Matthias Ketzel (5), Bruce Rolstad Denby (6) ............................ 328
SPECIAL SESSION –TRANSPORT RELATED AIR POLLUTION PM AND ITS IMPACT ON CITIES AND ACROSS EUROPE ........................................... 329
AIR QUALITY IMPACT ASSESSEMENT FOR RINGLAND ................................................................................... 331 B. Maiheu, S. Vranckx, W. Lefebvre and S. Janssen ......................................................................................... 331
AUTHOR INDEX ................................................................................... 332

1
PART ONE: ORAL SESSIONS

2

3
KEY NOTE SPEAKERS

4
AN ANALOG-BASED METHOD TO GENERATE PROBABILISTIC AQ PREDICTION OVER THE US
S. Alessandrini (1), L. Delle Monache (1), Irina Djalalova (2), Jim Wilczak (2)
(1) National Center for Atmospheric Research, Boulder, Colorado, USA; (2) National Oceanic and Atmospheric
Administration, Boulder, Colorado, USA
Presenting author email: [email protected]
Summary
This study aims to apply the analog ensemble (AnEn) technique to probabilistic predictions of O3 and PM2.5 surface
concentrations over the US. The deterministic predictions of O3 and PM2.5 concentrations by Community Multi-scale Air
Quality (CMAQ) Chemical Transport Model (CTM) over 564 sites of AIRNow Environmental Protection Agency (EPA)
network across the US are used as input to the AnEn. The AnEn model searches for past forecasts similar to the current
forecast, and takes the correspondent past observations to build the ensemble predictions. An evaluation of proprieties such
as statistical consistency, resolution, and reliability is performed by using a 1-year long data-set of observations. The AnEn
algorithm is a cost-effective method to generate reliable and well-calibrated probabilistic air quality forecasts.
Introduction
High concentrations of surface O3 and PM2.5 cause respiratory and cardiovascular problems leading to premature deaths and
high costs associated with health care, school absences, missed work, lost income potential from premature deaths, and
damages to crops and forests. Accurate air quality (AQ) predictions can provide individuals and communities with timely
information to help them limit exposure and reduce health problems caused by poor air quality. The decision-making process
effectiveness in the areas of public health and AQ can be improved by developing accurate deterministic predictions and a
reliable quantification of their uncertainty provided by the ensemble forecasts.
Methodology and Results
The AnEn technique (Delle Monache et al. 2011, 2013) has been
extensively tested for the probabilistic prediction of both
meteorological variables and renewable energy (Alessandrini et
al., 2015).
The AnEn is built from an historical set of deterministic
predictions and observations of the quantity to be predicted. For
each forecast lead time and location, the ensemble prediction of
a given variable is constituted by a set of measurements of the
past (i.e., 1-hour averages of PM2.5 and O3 concentrations).
These measurements are those concurrent to past deterministic
predictions for the same lead time and location, chosen based on
their similarity to the current forecast. The forecasted variables
used to identify the past forecast similar to the current one are
called analog predictors.
In this application we use as predictors, among others
meteorological variables, the O3 and PM2.5 concentrations
forecasts over the continental US generated by the U.S. EPA CMAQ CTM (Byun and Schere, 2006) model. The forecasts are
issued at 12 UTC with a 24 hours frequency for lead times between 0-48 hours ahead over the period 01 July 2014-31 July
2015. The first 6 months of this period are used for training purposes while the remaining part for the verification. This
includes an in-depth analysis of important attributes of probabilistic predictions generated with the AnEn, carried out using
the observations at 564 sites across the US. Attributes such as statistical consistency, reliability, resolution, sharpness, and the
spread-skill relationship are verified. The AnEn provides reliable, sharp, and statistical consistent probabilistic AQ
predictions, at a fraction of the real-time computational cost of traditional ensemble methods.
Conclusions
This novel application of an analog-based method to AQ predictions demonstrates several advantages:
A drastic reduction of both systematic and random errors of model-based (CMAQ) deterministic predictions, while
considerably increasing the correlation between the predictions and the observations;
The use of only one deterministic model prediction to generate an ensemble, therefore avoiding the need for model
perturbation strategies, and reducing considerably the real-time computational cost of generating an ensemble;
Intrinsic ability to produce reliable probabilistic forecasts (i.e., no ensemble calibration is required).
References
Alessandrini, S., Delle Monache, L., Sperati, S., & Nissen, J. N. (2015). A novel application of an analog ensemble for short-
term wind power forecasting. Renewable Energy, 76, 768-781.
Byun D. W., and K. L. Schere (2006), Description of the Models-3 Community Multiscale Air Quality (CMAQ) Model:
System overview, governing equations, and science algorithms, Appl. Mech. Rev., 59, 51-77.
Delle Monache, L., T. Nipen, Y. Liu, G. Roux, and R. Stull (2011), Kalman filter and analog schemes to post-process
numerical weather predictions, Mon. Wea. Rev., 139, 3554–3570.
Delle Monache, L., T. Eckel, D. Rife, B. Nagarajan, K. Searight (2013), Probabilistic weather predictions with an analog
ensemble, Mon. Wea. Rev., 141, 3498-3516.
Figure 1 Maximum daily 8-hour average surface O3 on July 9 2013. Shown are the model prediction (shading) from CMAQ,
and measurement (filled solid circle) from the AIRNow EPA
network.

5
MULTISCALE MODELLING OF HEALTH IMPACTS AND RELATED EXTERNAL COST FROM AIR
POLLUTION IN EUROPE AND DENMARK OVER 36 YEARS (1979-2014) USING THE INTEGRATED MODEL
SYSTEM EVA
J. Brandt (1), M. S. Andersen (1), J. Bønløkke (2), J. H. Christensen (1), T. Ellermann (1), K. M. Hansen (1), O. Hertel (1),
U. Im (1), S. S. Jensen (1), M. Ketzel (1), O.-K. Nielsen (1), M. S. Plejdrup (1), T. Sigsgaard (2) and C. Geels (1)
(1) Aarhus University, Department of Environmental Science, Frederiksborgvej 399, 4000 Roskilde, Denmark; (2) Aarhus
University, Department of Public Health, Bartholins Allé 2, Building1260, 8000 Aarhus C, Denmark
Presenting author email: [email protected]
Summary
A multiscale assessment of health impacts from air pollution and related external cost has been conducted for Europe and
Denmark using the integrated EVA model system (Brandt et al., 2013a; 2013b; Geels et al., 2015) over a period of 36 years
(1979-2014). The EVA system is based on the impact-pathway methodology, where the site-specific emissions will result,
via atmospheric transport and chemistry, in a concentration distribution, which together with detailed population data, is used
to estimate the population-level exposure. Using exposure-response functions and economic valuations, the exposure is
transformed into impacts on human health and related external costs.
Introduction
According to WHO, air pollution is now the world’s largest single environmental health risk (WHO, 2014;
http://www.who.int/mediacentre/news/releases/2014/air-pollution/en/). Around 7 million people died prematurely in 2012 as
a result of air pollution exposure from both outdoor and indoor emission sources (WHO, 2014). WHO estimates that there
were 3.7 million premature deaths in 2012 from urban and rural sources worldwide due to exposure to outdoor air pollution.
In Europe, recent results (Brandt et al., 2013a; 2013b) show that outdoor air pollution caused 570.000 premature deaths in
2011 and around 3.500 premature deaths in Denmark alone. Air pollution, in general, is a transboundary and scale dependent
challenge with global, regional, national and local sources giving rise to large geographic variability and thereby large
differences in the geographical distribution of human exposure to air pollution. Furthermore, air pollution levels has evolved
over the latest decades with a decreasing trend due to air pollution legislations at national and international levels. With
present state-of-the-art air pollution models, integrated assessment model systems and computer resources it is now possible
to perform a long-term assessment of the developments of health impacts across decades.
Methodology and Results
In this study we have used a coupling of two chemistry transport models to calculate the air pollution concentration at
different domains and scales; the Danish Eulerian Hemispheric Model (DEHM) setup with four two-way nested domains to
calculate the air pollution levels in the Northern Hemisphere with resolutions from 150 x 150 km2 (Northern Hemisphere)
over 50 x 50 km2 (Europe), 16.7 x 16.7 km2 (Northern Europe) and down to 5.6 x 5.6 km2 (Denmark). The Urban
Background Model (UBM) is used to further calculate the air pollution concentrations in Denmark at a 1 km x 1 km
resolution using results from DEHM as boundary conditions. The emission data as well as the population data have been
represented in the model system with the same high resolution. In this study, the integrated model system, EVA, has been
used to estimate the health impacts and related external cost for Europe and Denmark at all these scales. New developments
of the integrated model system and evaluation of the models against measurements will be presented as well as the
development of health impacts and related external costs over a very long time period of 36 years (1979-2014).
Conclusions
A multiscale long term assessment of air pollution concentrations, human health impacts and related external costs has been
carried out for Europe for the period 1979-2014. The results can e.g. be used to evaluate and quantify the effect of
international agreements driving the significant decrease in anthropogenic emissions of important air pollutants.
Acknowledgement
This work was supported by DCE – National Centre for Environment and Energy with the project: ”Health impacts and
external costs from air pollution in Denmark over 25 years” and NordForsk under the Nordic Programme on Health and
Welfare with the project: “Understanding the link between Air pollution and Distribution of related Health Impacts and
Welfare in the Nordic countries (NordicWelfAir)”.
References
Brandt, J., J. D. Silver, J. H. Christensen, M. S. Andersen, J. Bønløkke, T. Sigsgaard, C. Geels, A. Gross, A. B. Hansen, K.
M. Hansen, G. B. Hedegaard, E. Kaas and L. M. Frohn, 2013a. Contribution from the ten major emission sectors in
Europe to the Health-Cost Externalities of Air Pollution using the EVA Model System – an integrated modelling
approach. Atm. Chem. Phys., Vol. 13, pp. 7725-7746. doi:10.5194/acp-13-7725-2013.
Brandt, J., J. D. Silver, J. H. Christensen, M. S. Andersen, J. Bønløkke, T. Sigsgaard, C. Geels, A. Gross, A. B. Hansen, K.
M. Hansen, G. B. Hedegaard, E. Kaas and L. M. Frohn, 2013b. Assessment of Past, Present and Future Health-Cost
Externalities of Air Pollution in Europe and the contribution from international ship traffic using the EVA Model System.
Atm. Chem. Phys.. Vol. 13, pp. 7747-7764. doi:10.5194/acp-13-7747-2013.
Geels, C., C. Andersson, O. Hänninen, A. S. Lansø, P. Schwarze and J. Brandt, 2015. Future Premature Mortality due to Air
Pollution in Europe – Sensitivity to Changes in Climate, Anthropogenic Emissions, Population and Building stock, Int. J.
Environ. Res. Public Health, Int., 12, 2837-2869. doi:10.3390/ijerph120302837.

6
HEALTH IMPACTS THROUGHOUT SOUTHEAST ASIA OF FOREST FIRES IN INDONESIA
J. Buonocore (1), S. Koplitz (2), M. Marlier (3), J. Schwartz (4), D. Jacob (2), R. DeFries (3), L. Mickley (2), S. Myers (4,5)
(1) Center for Health and the Global Environment, Harvard T.H. Chan School of Public Health, Boston, MA USA (2) School
of Engineering and Applied Sciences, Harvard University, Cambridge, MA, USA (3) Department of Ecology, Evolution and
Environmental Biology, Columbia University, New York, NY, USA (4) Department of Environmental Health, Harvard T.H.
Chan School of Public Health, Boston, MA, USA (5) Harvard University Center for the Environment, Cambridge, MA, USA
Presenting author email: [email protected]
Summary
This study constructs a model framework to evaluate the air quality and health impacts of forest fires in Indonesia, and
applies this to 2006, a year with high fire activity. This study finds that these fires are a substantial contributor to air pollution
in Southeast Asia, and to the health burden in this region. We then examine the effect that various land protection policies
will have on emissions from these forest fires.
Introduction
Globally, outdoor air pollution outdoors is attributed to approximately 3.3 million excess deaths annually (Lelieveld et al.
2015), and is the 8th largest contributor to the global burden of disease (Lim et al. 2012). Landscape fires and biomass
burning are major contributors to air pollution in Southeast Asia, and climate change may exacerbate the risk of fires through
drought and by making conditions more favorable for forest pathogens and pests. Here, we estimate the health impact of
forest fires in Southeast Asia and discuss how alternatives for land management will affect fire conditions.
Methodology and Results
We developed a modeling framework that combines satellite-based land
use change and fire data and a fire emissions inventory to estimate
PM2.5 emissions for the 2006 fire season in Indonesia, which was a year
when both the El Niño Southern Oscillation and Indian Ocean Dipole
were in their warm phase. We then feed the PM2.5 emissions into an
atmospheric chemistry, fate, and transport model to simulate changes in
air quality across Southeast Asia. We then develop an air pollution
health impact assessment model to estimate mortality impacts across
Southeast Asia of the 2006 fire season, using high-resolution population
data and up-to-date epidemiology adapted to scenarios with high levels
of PM2.5. The modeling shows that the fires substantially increase PM2.5
across SE Asia – around 11 µg/m3 averaged across Indonesia, 8 µg/m3
in Singapore, and 4.5 µg/m3 in Malaysia. This increase in PM2.5 can be
attributed to around 64,000 excess deaths in Indonesia, 1,500 excess
deaths in Singapore, and 7,700 in Malaysia. Additionally, we simulate
the effect of different land management policies and economic scenarios, and
find that policy choices can dramatically affect
fire emissions – a policy with intensive protection of forest land which
prioritizes protection of peatland may result in a ~50% reduction in fire
emissions.
Conclusions
The emissions from forest fires in Indonesia are a substantial burden to both
air quality and health, in all of Southeast Asia, and climate change
could make conditions in the region more conducive to fires. However,
policies to protect forest from fires, especially those in peatland, could
substantially reduce these emissions.
Acknowledgement
This work was supported by a grant from the Rockefeller Foundation.
References
Lelieveld J, Evans JS, Fnais M, Giannadaki D, Pozzer a. 2015. The contribution of outdoor air pollution sources to premature
mortality on a global scale. Nature 525:367–371; doi:10.1038/nature15371.
Lim SS, Vos T, Flaxman AD, Danaei G, Shibuya K, Adair-Rohani H, et al. 2012. A comparative risk assessment of burden
of disease and injury attributable to 67 risk factors and risk factor clusters in 21 regions, 1990–2010: a systematic analysis for
the Global Burden of Disease Study 2010. Lancet.
Country Deaths
from fires
PM2.5 from
fires
(µg/m3)
Indonesia 64,000 11.19
Malaysia 7,700 4.57
Singapore 1,500 8.82
Fig.1: Annual average PM2.5 attributable to fires in
Indonesia in 2006.
Table 1: Excess mortality attributable to 2006 fires
in Indonesia, and countrywide average PM2.5
attributable to fires in Indonesia in 2006.

7
HISTORY AND PERSPECTIVE OF AIR QUALITY IN MILAN AND THE PO VALLEY: SCIENTIFIC AND
MANAGEMENT CHALLENGES
S. Finardi (1), G. Lanzani (2)
(1) ARIANET Srl, Via Gilino, 9 20128, Milan, Italy; (2) ARPA Lombardia, Via Rosellini 17 20124 Milan, Italy
Presenting author email: [email protected]
Summary
The evolution of pollutants concentration levels in the city of Milan during the last 4 decades clearly shows the impact of the
local economic and social changes together with the effects of combustion/transport technologies improvement and
environmental measures. Despite its improvement, present air quality condition qualifies Milan and the Po Valley as air
pollution hot spots of Europe, this condition is also related to their peculiar orographic characteristics and to the
meteorological conditions unfavourable to pollutants dispersion, that often affect the area. The historical recording of
concentrations and the overall knowledge provided by a number of studies focused on the Po Valley are the starting point to
identify deficiencies of our present knowledge about emissions, dispersion and chemical reactions of pollutants. The
effectiveness of past measures and the difficulties to individuate and realize policies capable to achieve the compliance with
European air quality standards are analysed to propose research priorities and suggest possible emission sectors to be targeted
to reach a better air quality and reduce the health impact of air pollution in Milan and similar critical regions.
Introduction
Milan urban area is located in the central-northern part of the Po Valley and accounts for about 3.5 million inhabitants. The
Po Valley has a global population of about 20 million people, it is home a large fraction of the Italian industry, agricultural
production and livestock. The pollutant emissions generated by economic activities, together with residential heating and
traffic, give rise to one of the areas of major concern for air pollution in Europe, where the European Commission air quality
standards are presently not attained for NO2, PM10 and O3. The atmospheric circulation of the Po valley is characterised by
the strong modification of synoptic flow due to the high mountains (Alps and Apennines chains) that surround the valley on
three sides. Local atmospheric circulation, dominated by calms and weak winds, favours the development of critical
dispersion conditions, gives rise to air pollution episodes and makes local measures hardly effective.
Methodology and Results
Available air quality observations (starting from late ‘70s) set in
evidence the dramatic reduction of pollutant concentrations
determined by the deindustrialization process, the change of fuels for
residential heating, technological improvement and renewal of
vehicles, and implementation of European and local measures. The
concentrations reduction rates decreased from the beginning of the
new century, preventing the achievement of air quality limits
compliance. State-of-the-art measurements and modelling tools have
been used to evaluate the impact of planned measures. Scenarios
analysis identified source sectors to be targeted but showed
difficulties to reach the compliance objective. A further effort to
improve our knowledge and refine our analysis tools is needed to
increase the studies reliability. Literature modelling studies show
more difficulties in reproducing PM concentrations in the Po Valley
than elsewhere in Europe. Non exhaust traffic emissions (in
particular from brakes and tyres) and resuspension contribution are
not yet reliably estimated. Large uncertainties affect biomass burning
emissions especially for ultrafine PM, condensable VOCs and PAHs.
The improvement of meteorological modelling of during weak wind is desirable due to the common overestimation of wind
intensity and dispersion conditions. PM in Milan has a dominant contribution from inorganic and organic secondary aerosols
(Fig. 1; AIRUSE, 2015) highlighting the need of multiscale analysis and measures planning. Many model applications and
inter-comparison studies pointed out that the production of secondary aerosols is often underestimated and improvements of
gas phase/aerosol models effectiveness is desirable.
Conclusions
Milan and Po Valley climatology highlights the need of a further improvement of scientific knowledge about air quality in
critical conditions to support and improve the capability to evaluate measures effectiveness. Present knowledge identifies
biomass burning for residential heating and agricultural activities as the emission sectors that can be targeted by effective
emission reduction policies, without forgetting traffic contribution. A better prediction capability can support measures
adoption: considering territory specificity, relevant economic investments and planning of innovative and visionary measures
are needed to achieve air quality standards compliance.
References
AIRUSE, 2015. PM speciation and Source apportionment. Report of the LIFE+ project AIRUSE LIFE11 ENV/ES/584 PM,
March 2015
Fig.1 PM10 composition measured in Milan urban
background station (from AIRUSE LIFE+ project)

8
MODELLING THE FUTURE HEALTH IMPACTS RELATED TO OZONE, SECONDARY INORGANIC
AEROSOLS AND PRIMARY PM IN EUROPE — RESPONSE TO PROJECTED CHANGES IN CLIMATE,
EMISSIONS, DEMOGRAPHY AND BUILDING STOCK
C. Geels (1), C. Andersson (2), O. Hänninen (3), A. S. Lansø (1), C. Ambelas Skjøth (4), P. E. Schwarze (5) and J. Brandt (1)
(1) Aarhus University, Department of Environmental Science, Denmark;
(2) Swedish Meteorological and Hydrological Institute, Sweden
(3) Department of Health Protection, National Institute for Health and Welfare, Finland
(4) Institute of Science and the Environment, University of Worcester, United Kingdom
(5) Department of Air Pollution and Noise, Norwegian Institute of Public Health, Norway
Presenting author email: [email protected]
Summary
An integrated assessment system has been setup for projections of the future developments in air pollution related premature
mortality across Europe. The main objective has been to study the impact of changes in climate, emissions, building stocks
and demography on the regional scale impacts of exposure to surface ozone (O3), Secondary Inorganic Aerosols (SIA) and
primary particulate matter (PPM).
Introduction
It is well known that air pollution components like ozone (O3) and particulate matter smaller than 2.5 µm (PM2.5) are
associated with negative health effects for humans. The World Health Organization now rates air pollution as the largest
single environmental health risk at the global scale. Integrated assessment systems can be used to increase our knowledge on
how the negative impacts of air pollution will change in the future due to changes in main drivers like climate and both
natural and anthropogenic emissions. The health effects are age-dependent so the general trend in Europe towards an aging
society can also modify the impact of air pollution. Likewise will the trend towards a more energy efficient building stock in
Europe be important for the infiltration rate of outdoor pollution into the houses and hence for the general exposure of the
population. In this study we use an assessment system to investigate the relative importance of these parameters.
Methodology and Results
The assessment system is based on a model chain including both global and regional climate models and two Chemistry-
Transport Models (CTMs), DEHM and MATCH (Geels et al. 2015). The model chain applies climate data and anthropogenic
emissions representing current day conditions as well as projections for the future. Here also the possible impact of a
warming climate on anthropogenic ammonia emissions is included. In the current setup the Danish Economic Valuation of
Air Pollution (EVA) (Brandt et al. 2013a,b) system combines the air quality simulations from the two CTMs with gridded
demography data to get the population exposure. Population-level health impacts are then assessed by linking the exposure to
a number of exposure-response functions. We have extended the system to describe changes in infiltration rates and the
possible impacts on the exposure in the Nordic countries. Even if energy saving are highly prioritised in EU, the resulting
impacts on the building stock and hence infiltration rates have not previously been included in long term projections of air
pollution related premature mortality. The sensitivity of the health outcome to the projected changes in drivers is tested
stepwise and we focus on two future decades (the 2050’s and 2080’s) relative to a present day decade (the 2000’s).
Conclusions
If the anticipated reductions of 30-85% in emissions of main air pollutants in Europe are obtained towards the 2080s, a
reduction of up to almost 80% in PM-related chronic mortality could be reached. Climate change alone can lead to a small
increase (ca. 15 % for Europe in total) in the number of premature deaths related to ozone-exposure in the two future periods.
For the Nordic region it has been evaluated how the transition towards more energy efficient housing impact the subsequent
infiltration rate of outside air pollution into the houses and hence the exposure. For the first time it has been quantified how
this will add positively to the decline in PM2.5 related health impacts. The change in demography and increase in ammonia
emissions has on the other hand the potential to increase the number of death related to air pollution.
Acknowledgement
This has mainly supported by the Nordic Council of Ministers through the FAN project (KOL-1204). The development of an
ammonia scenario has been funded through the EU project ECLAIRE (project No.: 282910).
References
Brandt, J., J. D. Silver, J. H. Christensen, M. S. Andersen, J. Bønløkke, T. Sigsgaard, C. Geels, A. Gross, A. B. Hansen, K.
M. Hansen, G. B. Hedegaard, E. Kaas and L. M. Frohn, 2013. Contribution from the ten major emission sectors in Europe to
the Health-Cost Externalities of Air Pollution using the EVA Model System – an integrated modelling approach. Atm. Chem.
and Phys., 13, 7725-7746. doi:10.5194/acp-13-7725-2013.
Brandt, J., J. D. Silver, J. H. Christensen, M. S. Andersen, J. Bønløkke, T. Sigsgaard, C. Geels, A. Gross, A. B. Hansen, K.
M. Hansen, G. B. Hedegaard, E. Kaas and L. M. Frohn, 2013. Assessment of Past, Present and Future Health-Cost
Externalities of Air Pollution in Europe and the contribution from international ship traffic using the EVA Model System”.
Atm. Chem. and Phys., pp. 7747-7764, 2013. doi:10.5194/acp-13-7747-2013.
Geels, C., C. Andersson, O. Hänninen, A. S. Lansø, P. Schwarze and J. Brandt, 2015. Future Premature Mortality due to Air
Pollution in Europe – Sensitivity to Changes in Climate, Anthropogenic Emissions, Population and Building stock, Int. J.
Environ. Res. Public Health, Int., 12, 2837-2869. doi:10.3390/ijerph120302837.

9
THE IMPACT OF WEATHER CHANGES ON AIR QUALITY AND HEALTH IN THE UNITED STATES IN 1994-
2012
Iny Jhun (1), Brent A. Coull (2), Joel Schwartz (1), Bryan Hubbell (3), Petros Koutrakis (1)
(1) Department of Environmental Health, Harvard T. H. Chan School of Public Health, Boston, MA, United States; (2)
Department of Environmental Health, Harvard T. H. Chan School of Public Health, Boston, MA, United States; (3) Office of
Air Quality, Planning, and Standards, US Environmental Protection Agency, Research Triangle Park, NC, United States.
Presenting author email: [email protected]
Summary
In this study, we aimed to estimate historical weather-related changes in air pollution and the associated health impacts in the
US. Using statistical models, we quantified the retrospective weather “penalty” on ozone (O3) and fine particulate matter
(PM2.5). We found significant weather-related air pollution increases, which were associated with over 20,000 premature
deaths during our study period of 19 years. We found that temperatures have risen and wind speeds have declined in the past
two decades—both changes promote accumulation of air pollution. Past changes in weather conditions have already had
significant adverse impacts on air quality and health, and the weather penalty on air pollution and its associated health
impacts will likely persist in the future climate.
Introduction
Air quality is heavily influenced by weather conditions. There is a growing body
of evidence that climate change will adversely impact air quality. As O3 and PM2.5
exposures are associated with premature mortality (Krewski et al 2009, Jerrett et
al 2009), it is important to understand the impact of a changing climate. Many
climate modeling studies have projected future O3 and PM2.5 concentrations;
however, less is known about the historical impacts of long-term weather changes.
Methodology and Results
We analyzed 19 years of air pollution and weather data (1994-2012) from 468 O3
monitoring sites, 62 PM2.5 monitoring sites, and over 200 ground-level weather
stations across the US. Using statistical regression models, we quantified past
weather-related increases, or “weather penalty”, in O3 and PM2.5, and thereafter
estimated the associated excess deaths. We derived the weather penalty as the
additional increases in air pollution relative to trends assuming constant weather
conditions (i.e., trends adjusted for temperature, wind speed, relative humidity,
and precipitation frequency). During our study period, temperature increased and
wind speed decreased in most US regions. Nationally, weather-related 8-h max O3
increases were 0.18 ppb per year (95% CI: 0.06, 0.31) in the warm season (May-
Oct) and 0.07 ppb per year (95% CI: 0.02, 0.13) in the cold season (Nov-Apr) (Fig
1). The weather penalties on O3 were relatively larger than PM2.5 weather
penalties, which were 0.056 µg/m3 per year (95% CI: 0.016, 0.096) in warm
months and 0.027 µg/m3 per year (95% CI: 0.010, 0.043) in cold months. Weather
penalties on O3 and PM2.5 were associated with 290 (95% CI: 80, 510) and 770
(95% CI: 190, 1,350) excess annual deaths, respectively. Over a 19-year period,
this amounts to 20,300 excess deaths (5,600 from O3, 14,700 from PM2.5)
attributable to the weather penalty on air quality.
Conclusions
Historical changes in weather conditions have had significant impacts on air
quality and health. Temperature has increased and wind speed has decreased in
most US regions. As climate models predict temperature increases, higher
frequency of heat waves, and more stagnation episodes, weather-related increases
in O3 and PM2.5-related mortalities will likely persist in the future.
Acknowledgement
The Harvard School of Public Health Scholarship and the US EPA grant RD-
834798-01 made this work possible. Its contents are solely the responsibility of the
grantee and do not necessarily represent the official views of the US EPA. Further,
the US EPA does not endorse the purchase of any commercial products or services
mentioned in the publication.
References
Jerrett M, Burnett R T, Pope C A, Ito K, Thurston G, Krewski D, Shi Y, Calle E and Thun M 2009 Long-term ozone
exposure and mortality. N. Engl. J. Med. 360 1085–95
Krewski D, Jerrett M, Burnett R T, Ma R, Hughes E, Shi Y, Turner M C, III C A P, Thurston G, Calle E and Thun M J 2009
Extended follow-up and spatial analysis of the American Cancer Society Study linking particulate air pollution and mortality
(Boston, MA: Health Effects Institute)
Unadjusted trends, weather-adjusted
trends, and weather penalties of 8-h max O3 and PM2.5 by region in May-
Oct. 95% confidence intervals
shown.
O3 (Warm Season)
No
rth
we
st
Up
pe
r M
idw
est
Ind
ustr
ial M
idw
est
No
rth
ea
st
S. C
alif
orn
ia
So
uth
we
st
So
uth
ea
st
Na
tio
na
l
-1.00
-0.75
-0.50
-0.25
0.00
0.25
0.50
0.75
Met-Adjusted
Unadjusted
Penalty
O
3(p
pb/y
ear)
PM2.5 (Warm Season)
No
rth
we
st
Up
pe
r M
idw
est
Ind
ustr
ial M
idw
est
No
rth
ea
st
S. C
alif
orn
ia
So
uth
we
st
So
uth
ea
st
Na
tio
na
l
-1.00
-0.75
-0.50
-0.25
0.00
0.25
0.50
0.75
Met-Adjusted
Unadjusted
Penalty
P
M2.5
( g/m
3/y
ea
r)

10
THE EFFECTS OF INTERCONTINENTAL EMISSION SOURCES ON EUROPEAN AIR POLLUTION LEVELS
J.E. Jonson, S. Valiyaveetil and M. Shultz
Norwegian Meteorological Institute, Oslo, Norway
Presenting author email: [email protected]
Summary
This study aims to quantify the contributions from European and non European sources to air pollution levels in Europe. The
main focus is on ozone as this species has a sufficiently long residence time in the troposphere to be advected between
continents, but results for other species as PM is also discussed. The study demonstrates that although the largest contribution
to air pollutions in Europe are from European sources, there are also large contributions from other continents, in particular
for ozone as this species has a relatively long residence time in the free troposphere.
Introduction
In HTAP 1 final report (HTAP, 2010) it was shown that a significant portion
of the boundary layer ozone could be attributed to intercontinental sources,
but in HTAP 1 several scientific questions were left open, or in need of being
constrained. As a result an extended model experiment has been set up under
HTAP2 (Task Force on Hemispheric Transport of Air Pollution,
www.htap.org). The model calculations from a set of global models, all using the same set of anthropogenic emissions, will
help to characterize and constrain the uncertainty in these estimates. In this
presentation we show some of the first results from this modelling exercise,
focusing on the effects on the European continent. The results from HTAP2
will in the future serve as input to assessments of the impacts of control
strategies on the contribution of regional and extra-regional emissions sources
to the exceedance of air quality standards and to impacts on human health,
ecosystems, and climate.
Methodology and Results
Models participating in the HTAP2 experiment are requested to perform a
number of calculations, reducing the anthropogenic emissions of air pollutants in several regions of the world, combined and
separately for NOx, SOx, particulate matter, CO and VOC (Volatile Organic Matter). In the source/receptor calculations the
anthropogenic emissions are reduced by 20% in different source regions throughout the globe. Here we focus on the effects
on European air pollution levels. For HTAP2 a set of receptor regions have been defined, shown in Figure 1.
Conclusions
The HTAP2 calculations are still ongoing, and a limited set of model
calculations are yet available. More results will be available in the
coming months. In the HTAP (2010) report it was estimated that the
response to a 20% reduction of ozone precursor emissions outside
Europe amounted to 43% of the response to 20% reduction in European
sources. Roughly half that response would be from North American
sources. But depending on the regions shown in Figure 1, there is a
spread in the contribution from both European and non European
sources. For ozone the largest contributions from other continents are
calculated for the spring months when ozone production over the
polluted continents starts to increase, while at the same time the
lifetime of ozone in the free troposphere is relatively long. The ozone
production over the continents peaks in summer, but at the same time
the lifetime of ozone in the free troposphere is decreasing. As an
example Figure 2 shows the seasonal contributions to ozone levels in
the European regions shown in Figure 1 from a 20% reduction in North
American anthropogenic emissions. The calculated contributions from
North America are of similar magnitude for the four regions, with the largest contributions calculated for region 44 (Greece
and Turkey). More results will be added here as more model calculations become available.
Acknowledgement
This work has been funded by EMEP under the LRTAP UNECE Convention.
References
HTAP: Hemispheric transport of air pollution. 2010. Edited by: Frank Dentener, Terry Keating and Hajime Akimoto, Tech.
Rep. Air Pollution Studies No. 17, United Nations Economic Commission for Europe, Geneva, available from www.htap.org.
Figure 2. Seasonal contributions to boundary
layer ozone in the 4 European regions calculated
by 4 different global models
Figure.1 Source receptor regions in Europe. Brown:NW Europe w of Baltic Sea (R41),
Rlight green SW Europe(R42), Dark red E.
Europe(R43), yellow Greece and Turkey(R44) pe
Winter Spring Summer Aurtumn

11
CHARACTERIZING THE INFLUENCE OF HEMISPHERIC TRANSPORT ON REGIONAL AIR POLLUTION
R. Mathur, J. Xing, S. Napelenok, C. Hogrefe, G. Sarwar, D. Kang
Atmospheric Modeling and Analysis Division, National Exposure Research Laboratory, U.S. Environmental Protection
Agency, Research Triangle Park, NC 27711
Presenting author email: [email protected]
Summary
Observational and modeling studies have demonstrated that pollutants near the Earth’s surface can be convectively lofted to
higher altitudes where strong winds can efficiently transport them from one continent to another, thereby impacting air
quality on intercontinental to global scales. Since transport is efficient in the free-troposphere and since simulations over
Continental scales and annual cycles provide sufficient opportunity for “atmospheric turn-over”, i.e., exchange between the
free-troposphere and the boundary-layer, a conceptual framework is needed wherein interactions between processes
occurring at various spatial and temporal scales can be consistently examined. The WRF-CMAQ model is expanded to
hemispheric scales and multi-decadal model simulations performed for the period spanning 1990-2010 are analyzed to
examine changes in hemispheric air pollution resulting from changes in emissions over this period. Source region
sensitivities estimated using the direct decoupled method in CMAQ are then combined with the estimated long-term trends to
characterize the changing contributions of different source regions to background O3 levels in the U.S.
Introduction
Strategies for reduction of pollution levels of surface air over a region are complicated not only by the interplay of local
emissions sources and several complex physical, chemical, dynamical processes in the atmosphere, but also hemispheric
background levels of pollutants. To assist with the design of emission control strategies that yield compliance with more
stringent air quality standards, models must possess the fidelity to accurately simulate ambient pollutant levels across the
entire spectrum ranging from background to extreme concentrations. Consistent modeling frameworks that can represent the
interactions between various physical and chemical atmospheric processes at the disparate space and time scales are thus
needed to characterize the relative contributions of different source regions to background pollution levels at receptor
regions.
Methodology and Results
Expansion of the coupled WRF-CMAQ modeling system to hemispheric scales is pursued to enable the development of a
robust modeling framework in which the interactions between atmospheric processes occurring at various spatial and
temporal scales can be examined in a consistent manner. The WRF-CMAQ modeling system was applied over a domain
encompassing the northern hemisphere. The horizontal domain, set on a polar stereographic projection, was discretized using
grid cells with a 108 km resolution, while the vertical extent ranging from the surface to 50 mb was discretized with 44 layers
of variable thickness with a 20 m deep lowest layer. Emissions of NOx, SO2, CO, volatile organic compounds, and
particulate matter from anthropogenic, biomass burning, and biogenic sources were derived from existing global inventories.
Model simulations for the 1990-2010 period and numerous associated sensitivity simulations (examining impacts of vertical
layer structure, stratospheric O3 influences, representation of NOx recycling through organic nitrates, halogen chemistry in
marine environments) have been conducted to establish the capability to exercise CMAQ over the Northern hemisphere.
CMAQ configured with the direct decoupled method is used to estimate source region contributions to O3 levels in the
receptor region. These are then combined with the multi-decadal simulations to delineate the trends in the relative
contributions of different source regions across the northern hemisphere to background O3 levels in the U.S.
Significance and Implications
The U.S. National Ambient Air Quality Standard (NAAQS) for O3 was recently proposed to be lowered to 70ppb, raising the
importance of accurate characterization of background pollution levels. Changes in emission patterns over different regions
of the world are likely to exacerbate the impacts of long-range pollutant transport on background pollutant levels in the U.S.,
which may then impact the attainment of local air quality standards. The successful expansion of coupled WRF-CMAQ to
the hemispheric scales now provides a robust framework to examine interactions between atmospheric processes occurring at
various spatial and temporal scales in a consistent manner and to characterize changes in regional background pollutant levels
as well as the spatial heterogeneity in aerosol loading and associated radiative impacts over the Northern hemisphere.

12
INTELLIGENT TRANSPORT SYSTEMS (ITS) AS A TOOL TO REDUCE CARBON FOOTPRINT AND
POLLUTANT EMISSIONS IN CITIES
Zissis Samaras (1), Leonidas Ntziachristos (1), Ilias Vouitsis (1), Silvana Toffolo (2), Giorgio Magra (2), Alvaro Garcia-
Castro (3), Cristina Valdes (3), Christian Vock (4), Werner Maier (5)
Presenting author email: [email protected]
Introduction
Daily increasing levels of congestion underscore the importance of intelligent transportation systems. The idea of ITS is to
ensure the efficient utilization of the available road capacity by controlling traffic operations and influencing drivers´
behaviour by providing information. The aim of this paper was to present a study that developed a new evaluation
methodology regarding the impact of ITS-related initiatives, measures and innovations on urban mobility and on individual
vehicle and vehicle fleets energy consumption and CO2 emissions.
Methodology and Results
The project implemented existing commercial models and
tuned them to simulate the impacts of ICT measures. These
activities were accompanied by real-world experiments using
floating cars in the cities of Turin, Madrid and Rome. The
experiments were on the one hand used to calibrate the
enhanced models and on the other to validate the performance
and accuracy of the methodology. The project (ICT-Emissions)
has produced results addressing a wealth of cooperative ITS
systems. To enable a reliable prognosis of future developments
in a scenario approach the project covered a large number of
current and near future vehicle technologies such as hybrid,
plug-in hybrids and electric vehicles. The main achievements
include the overall consistency of the modelling approach
across the micro and the macro level both for traffic and
emissions, a new Gipps’ function for eco-driving simulation, a
micro-level driver simulator for Adaptive Cruise Control
(ACC), extension of ADAS simulator to micro traffic
simulators, data collection with floating cars with and without
ICT measures in place, validation and development of eco-
driving cycles and creation of a web-based database
application. As regards vehicle related ITS (i.e., ecodriving,
green navigation, ACC), the analysis of the results showed
that a. On a per vehicle basis, effects on CO2 emissions can
be substantial – Reductions can exceed 15%, b. The CO2
benefit is constrained by the traffic conditions and penetration
rates themselves, as the on-road ITS equipped vehicle fraction
increases, c. The maximum is reached at up to 50%
penetration and under non-congested conditions and d.
Benefits differ with driving environment. For traffic targeted
ITS (Variable Speed Limits, Urban Traffic Control), the
analysis of the results showed that: a. Under non congested
conditions the maximum reduction due to Urban Traffic
Control can reach up to 8%, b. Traffic conditions constrain the effect on total CO2 emissions, e.g. congestion reduces the
benefit, c. Similarly Variable Speed Limits can have a local effect in the order of 2% CO2 reduction and d. Most importantly,
the global effect needs to be considered, on top of the local effect.
Conclusions
Overall, ITS was found to be able to measurably contribute to CO2 emissions reduction, although the effects are found to
depend on local conditions (traffic, infrastructure, fleet, etc.). This potential will best be deployed in the future in
combination with more advanced vehicles and systems e.g. predicting navigation systems in combination with hybrid
vehicles
Acknowledgement
This work was funded by the 7th European Framework project ICT-Emissions - Assessing the impact of ICT on road
transport emissions (Project Reference: 288466).
References Garcia-Castro, A., Monzon, A. Using Floating Car Data to Analyse the Effects of ITS Measures and Eco-Driving. Sensors (2014b), 14,
21358-21374, doi:10.3390/s141121358. Toffolo, S., Morello, E., Samaras, Z., Ntziachristos, L., Christian, V, Maier, W., Garcia-Castro, A., 2014. ICT-emissions methodology for
assessing ITS and ICT solutions. Transport Research Arena 2014, Paris.
Fig.1. Architecture of the integrated methodology
Fig.2. CO2 benefit (%) at urban roads for 3 different traffic levels
and 3 ACC penetration rates: 20-60-100% (right)

13
NORTH AFRICAN DUST SOURCES AND DUST EXPORT TOWARDS EUROPE AND THE CARIBBEAN
K. Schepanski (1), R. Wagner (1), B. Heinold (1) and I. Tegen (1)
(1) Leibniz Institute for Tropospheric Research (TROPOS), Permoser Str. 15, 04318 Leipzig, Germany
Presenting author email: [email protected]
Summary
We discuss the atmospheric dust life-cycle over North Africa including its dust transport pathways towards Europe and
across the Atlantic toward the Caribbean. This study includes satellite data providing information on active dust sources, and
model simulations providing information on atmospheric circulation and near-surface wind speed distribution. Using both
satellite and numerical model data in concert, a multi-dimensional picture of the atmospheric dust life-cycle can be drawn.
Outcomes from this study illustrate (1) the spatio-temporal distribution of dust sources over North Africa, (2) identified
atmospheric circulation patterns fostering dust emission and transport along the major pathways toward Europe and across
the Atlantic, and (3) the variability of the dust concentration as part of the local aerosol burden.
Introduction
Mineral dust emitted from arid and semi-arid region is a major contributor to the atmosphere aerosol burden and a global
player in the Earth system. The knowledge on the contribution of mineral dust to the atmospheric aerosol composition is
crucial for understanding the multi-faceted aerosol-atmosphere interactions: Mineral dust aerosol influences directly the
Earth radiation budget by absorbing and scattering solar radiation, and indirectly by affecting atmospheric dynamics and
cloud formation processes. As mineral dust provides nutrients to the ecosystems, it ultimately impacts on the CO2-cycle.
Mineral dust not only impacts on the environment, it further affects our modern way of living and human well-being as it
contributes to local and regional reduction in air quality.
Methodology and Results
Studies analysing satellite observations illustrate the spatial and temporal distribution of emitting dust sources (Schepanski et
al., 2012). Results show that high surface wind speeds, a prerequisite for dust entrainment into the atmosphere, are frequently
related to the morning break-down of the nocturnal low-level jet (LLJ). For North African dust emission, the LLJ is the
dominant and frequent driving mechanism for dust uplift, in average 65% of DSA events inferred from MSG SEVIRI IR dust
index images are related to LLJs (Schepanski et al., 2009). Here, we present a study
investigating atmospheric circulation patterns over North Africa favouring (a) dust
entrainment into the boundary layer, and (b) dust export towards Europe and the
Caribbean Sea - the two major transport pathways of North African dust. Satellite-
based information on the spatio-temporal distribution of dust source activation (DSA)
events are inferred from 15-minute MSG SEVIRI dust observations are linked to
atmospheric circulation regimes over North Africa determining the surface wind speed
distribution and ultimately dust emission and transport. Multi-annual simulations of the
atmospheric dust life-cycle using the meso-scale atmosphere-aerosol model system
COSMO-MUSCAT (Tegen et al., 2013) are analysed with regard to the spatio-
temporal distribution of DSA, dust transport pathways and the atmospheric circulation.
Major meteorological features and determining dominant atmospheric circulation
patterns are: (1) the Harmattan flow, (2) the Monsoon flow, (3) the Saharan heat low,
(4) cold surges and cold-air intrusions from the Mediterranean into the North African
continent, and (5) cyclones. All elements show a significant variability in their spatial
extent respectively centre location and strength, which affects the spatio-temporal
distribution of DSA events and dust transport pathways ultimately determining
atmospheric dust concentrations over populated areas in Europe and overseas.
Conclusions
Altogether, the results from this study aim at illustrating the relevance of knowing the dust source locations in concert with
the atmospheric circulation. Ultimately, this study addresses the question of what is finally transported toward Europe and
across the Atlantic from which source regions - and fostered by which atmospheric circulation pattern. Outcomes from this
study contribute to the understanding of varying atmospheric mineral dust contributions to the aerosol burden affecting
populated areas around Europe and across the Atlantic.
References
Schepanski K., Tegen I., Macke A., 2012, Comparison of satellite based observations of Saharan dust source areas, Rem.
Sens. Environm.,123, 90-97, doi:10.1016/j.rse.2012.03.019
Schepanski K., Tegen I., Todd M. C., Heinold B., Bönisch G., Laurent B., Macke A., 2009, Meteorological processes forcing
Saharan dust emission inferred from MSG-SEVIRI observations of subdaily dust source activation and numerical models, J.
Geophys. Res., 114, D10201, doi:10.1029/2008JD01325
Tegen I., Schepanski K., Heinold B., 2013, Comparing two years of Saharan dust source activation obtained by regional
modelling and satellite observations, Atmos. Chem. Phys. 13, 2381-2390, doi:10.5194/acp-13-2381-2013
Figure 2: Dust optical depth simulated by COSMO-MUSCAT illustrating dust
transport from North Africa towards
Europe on 29 March 2014, 15 UTC.

14

15
AIR QUALITY AND IMPACT ON REGIONAL TO GLOBAL SCALE

16

17
25-YEAR REANALYSIS OF REGIONAL BACKGROUND SURFACE OZONE FOR SWEDEN
C. Andersson, M. Engardt and H. Alpfjord
Swedish Meteorological and Hydrological Institute, Norrköping, Sweden
Presenting author email: [email protected]
Objectives
The objectives of this work are to map the surface ozone in
Sweden during 1990-2014 using a combination of model
and measurements, and to determine trends and 25-year
extreme values.
Introduction
Surface ozone is monitored annually through measurements
and modelling. Changes in global, European and Swedish
emissions over the last 25 years may have caused changes
to the Swedish background surface ozone. To monitor
whether the situation is improving or not we conduct a
reanalysis which can be used to investigate trends and to
which we can compare the annual monitoring. We take into
account changes in measurements, and changes in global,
European and Swedish emissions and climate variability.
Methodology
We use data assimilation in
two dimensions (2dvar) to
combine hourly
measurements of surface
ozone with modelled ozone
fields (the first guess).
Measurements are generally
considered as having smaller
errors than the dispersion
model, whereas the latter has
full temporal and spatial
coverage. By combining the
two we achieve a time-
consistent dataset that is an
improvement as compared to
measurements and model.
The dispersion model
MATCH is used for
modelling surface ozone and
for the data assimilation. It is
driven by the meteorological reanalysis EURO4M and
emissions from EMEP (Europe) and SMED (Swedish high-
resolution) and its domain covers Europe whereas the 2dvar
was conducted covering Sweden and Norway.
Two reanalysis datasets were produced
Including all available measurements
Including only long-term measurement datasets
The first dataset is the best possible mapping for each single
year. The second data set can be used for trend and extreme
value analyses.
Results
The 2dvar analysis technique was evaluated using cross
validation for one year (2013). This resulted in improved
bias and correlation coefficient compared to the first guess.
The 2dvar results are dependent on the observations (the
bias is approx. zero and the correlation coefficient approx. 1
at the observation sites). Measured and modelled (MATCH,
2dvar) annual statistics were also compared for all years
(see Fig. 2).
Trends and extreme values were calculated based on the
second data set for a number of metrics, such as SOMO35,
AOT40 and exceedances above threshold levels (see
examples in Fig. 3). The annual mean has decreased in
northern and southern Sweden, whereas it has decreased in
the middle. AOT40 and SOMO35 are decreasing almost
everywhere. This is due to a decrease in the highest
concentrations in the whole country, whereas the lowest
percentiles have increased.
Conclusions
Two data sets describing a combination of measured and
modelled surface ozone in Sweden have been produced.
This can be used for monitoring whether the situation is
improving or deteriorating, and for trend analyses and effect
studies. The highest percentiles of surface ozone have
decreased in Sweden whereas the lowest have increased.
Acknowledgement
This project was funded by the Swedish Environmental
Protection Agenc
Figure 2. Annual mean surface ozone modelled with MATCH
(blue line), observed (red star) and from the 2dvar analysis
(black line) at one observation site in Sweden.
Figure 1. Measurement sites
used in the 2dvar analysis.
Figure 3. Trend in annual mean (left) surface ozone and
number of exceedance days above the threshold 120 g m-3.
Unit: g m-3 per year (left) and #days per year (right).

18
CHANGES IN PERSIAN GULF AIR QUALITY OBSERVED BY THE OZONE MONITORING INSTRUMENT
M. P. Barkley
Earth Observation Science Group, Dep. Physics & Astronomy, University of Leicester, UK
Presenting author email: [email protected]
Summary
A decade’s worth of trace gas and aerosol observations from the Ozone Monitoring Instrument (OMI), on-board NASA’s
Aura satellite, is used to study changes in local air-quality at over 500 locations across the Persian Gulf and Middle East. A
time series analysis that examines the trends in nitrogen dioxide (NO2), formaldehyde (HCHO), sulphur dioxide (SO2), and
retrieved aerosol parameters, reveals that air quality is significantly deteriorating for the majority urban areas.
Introduction
Air-quality in Iranian cities is often much worse than, for example, more publicised air-pollution events in China, yet it has
been seldom investigated; only a handful of studies exist for the Persian region. Furthermore, emissions of pollutants gases,
such as nitrogen oxides (NOx = NO2 + NO), within this region are only expected to increase in the future owing to the
presence of large industrialised areas, high population densities, inefficient transport networks, and lack of regulatory air-
quality controls. The main goal of this work is to use space-borne measurements of atmospheric composition to improve our
understanding of air pollution over the Persian Gulf and surrounding area, and to determine long-term changes in the region’s
air-quality.
Methodology and Results
A detailed time series analysis is performed to examine the temporal variations in nitrogen dioxide (NO2), formaldehyde
(HCHO), sulphur dioxide (SO2), and retrieved aerosol parameters, as observed by the OMI instrument over 2005-2014. The
variations in these trace gases within about 10 km of over 500 locations in the Persian Gulf regions are quantified. Statistical
tools based on those used for greenhouse gas analysis, are used to determine the overall trend and growth rate variability, and
seasonal variations in these air-quality metrics. The variability of ancillary retrieval parameters such as air mass factors,
cloud cover and aerosol loading are also examined to determine if observed changes in these trace gases are in fact real.
Conclusions The analysis shows that air-quality at over 70% of locations with the Persian Gulf is significantly getting worse (particularly
for NO2) and that regulatory control over surface pollutant emissions is drastically need to mitigate the subsequent impact on
air-health.
Fig.1 Example time series analysis of OMI NO2 vertical columns over Kharg Island (Iran). The top panel shows the observed vertical columns (in dark grey) and the spectral decomposition fit to the data (in blue). The middle and bottom panels show the temporal
variation in the growth rate and seasonal cycle respectively.

19
MULTI MODEL PROCESS STUDY ON INTERCONTINENTAL TRANSPORT OF MERCURY
J. Bieser (1,2), A. Dastoor (3), C.N. Gencarelli (4), I.M. Hedgecock (4), V. Matthias (1), N.E. Selin (5), F. DeSimone (4), S.
Song (5), O. Travnikov (6), X. Zang (7,8)
(1) Helmholtz-Zentrum Geesthacht, Institute of Coastal Research, Max-Planck-Straße 1, 21502 Geesthacht, Germany; (2) DLR, Deutsches
Luft und Raumfahrtzentrum, Münchener Straße 20, 82234 Weßling; (3) Meteorological Service of Canada, Environment Canada, 2121
Route Transcanadienne, Dorval, Que., Canada H9P 1J3; (4) CNR – Istituto Inquinamento Atmosferico, U.O.S. Di Rende, UNICAL-Polifunzionale, 87036 Rende, Italia; (5) Engineering Systems Division & Department of Earth, Atmospheric, and Planetary Sciences,
Massachusetts Institute of Technology, Cambridge, Ma., USA; (6) Meteorological Synthesizing Center-East of EMEP, 2nd Roshchinsky
proezd., 8/5 Moscow 115419, Russia; (7) National Centre for Atmospheric Sciences (NCAS), Cambridge, UK; (8) Centre for Atmospheric Sciences, Department of Chemistry, University of Cambridge, Cambridge, CB2 1EW, UK
Presenting author email: [email protected]
Summary In this study we used an ensemble of chemistry transport models (CTMs) to identify and quantify the global transport
patterns of mercury. Models were evaluated and improved using a newly available global dataset of mercury observations.
Anthropogenic emissions were found to be the major source of mercury deposition with east Asia (coal combustion) and
Africa (gold mining) being the major sources regions (sectors). Due to the legally binding Minamata Convention on mercury
which will come into force in 2017, countries are obliged to drastically reduce Hg emissions (UNEP, 2013). Based on future
emission scenarios, we investigated the impact of different policies on the global mercury cycle in the near future.
Introduction This study is part of the EU FP7 project GMOS (Global Mercury Observation System). Based on the observations of the
GMOS network we use an ensemble of CTMs to identify the major source regions and source sectors and to quantify their
impact on the global mercury cycle from emission to deposition. Mercury is a substance producing significant adverse
neurological and other health effects, with particular concerns expressed about its harmful effects on unborn children and
infants (UNEP, 2013). Recent studies estimate, that the mercury burden has increased by a factor of 7 in the atmosphere and
a factor of 5 in the Ocean since pre-industrial times (Amos et al., 2013). The main sources of mercury are the combustion of
fossil fuels and small scale artisanal gold mining (Pirrone et al., 2010). In the atmosphere, gaseous elemental mercury is
dispersed globally before it is oxidized and deposited. In the Ocean mercury is then methylated and accumulates along the
food chain.
Methodology and Results In the course of the GMOS project a mercury modelling task force (MMTF) was
initiated in order to include research groups from outside the EU. At first, a
common set of sensitivity analysis runs was performed to investigate the
influence of emission speciation and atmospheric chemistry on global and
regional transport patterns. In total 4 global and 3 regional CTMs participated in
the MMTF (Table 1). In a second step, we used source apportionment
techniques to track mercury emissions from major source regions and source
sectors (Fig. 1b). Moreover, the source apportionment was done for three future emission scenarios. It was found, that about
50% of today's global Hg deposition is due to legacy emissions. These are mainly re-emissions of previously deposited Hg
from the Ocean. Because of the constant cycling of Hg between Ocean and Atmosphere this source of deposition can be
neglected when calculating a net flux into the Ocean. Looking only at the anthropogenic sources of deposition to different
oceanic regions, it was found that Hg emissions from east Asia (orange) are responsible for more than 50% of the total (Fig.
1a). The second largest source region is Africa (pink)
contributing 12% on a global scale. Emissions from Europe
(green) are only important for the Mediterranean and other
regional Seas. Future emission scenarios indicate, that
emissions from south Asia will become more important on
a global scale, potentially becoming the strongest source
region in 2035. Meanwhile emissions from east Asia are
expected to stagnate or decrease, depending on the
scenario.
Conclusions A model inter-comparison study showed that CTMs are
capable to reproduce the global concentration and
deposition patterns as observed by the GMOS network. In
general the model ensemble leads to a better agreement with observations. Based on these refined models we identified east
Asia and Africa as the current major sources of mercury deposition into the Ocean. Emission scenarios for 2035 indicate that
depending on the implementation of the Minamata Convention Hg input into the Ocean can be reduced drastically and that
emissions from south Asia might become more important on a global scale.
References
Amos, H.M., Jacob, D.J., Streets, D.G., Sunderland, E.M. (2013). Legacy impacts of all-time anthropogenic emissions on the global mercury
cycle. Global Biogeochemical Cycles, vol. 27, 1-12, doi: 10.1002/gbc.20040.
Pirrone, N., et al. (2010). Global mercury emissions to the atmosphere from anthropogenic and natural sources, Atmos. Chem. Phys., 10 (13), 5951–5964.
UNEP (United Nations Environmental Program). (2013). Minamata Convention on Mercury, Text and Annexes, available:
http://www.mercuryconvention.org/Portals/11/documents/Booklets/Minamata%20Convention%20on%20Mercury_booklet_English.pdf
Figure 1: a) Model ensemble of source apportionment of annual
mercury deposition into FAO aquatic regions (left). The bar to the left
depicts the source apportionment for the total deposition into the
Ocean. b) Colours indicate source regions tracked by the CTMs (right)
Model Institution
GLEMOS EMEP / MSC-E
ECHMERIT CNR-IIA (Italy)
GEM-MACH-Hg Environment Canada
GEOS-Chem MIT (USA)
CMAQ-Hg HZG (Germany)
WRF-CHEM CNR-IIA (Italy)
p-TOMCAT Cambridge (UK)
Table 1: CTMs and Institutions participating
in the Mercury Modelling Task Force (MMTF)

20
ANALYSIS OF NO2 POLLUTION IN MEGACITIES BY EARTH OBSERVATION
Thilo Erbertseder(1), Christoph Bergemann(1), Hannes Taubenböck (1), Frank Baier(1),
(1) Deutsches Zentrum für Luft- und Raumfahrt, Deutsches Fernerkundungsdatenzentrum, 82234 Weßling, Germany
Presenting author email: [email protected]
Summary
In this study we investigate the variability and trends of NO2 pollution in 30 megacities by analyzing different Earth
Observation data sets. Multi-annual records of tropospheric NO2 from SCIAMACHY (2002-2012) and GOME-2 (2007-
2015) are combined with the global urban footprint of each megacity as a proxy for urban growth. The consistent and
homogenous data sets enable a global comparison of the findings for the megacities and a classification with respect to their
socio-economic development. The possibilities of current and upcoming Earth Observation missions are discussed.
Introduction
Concerning air pollution and its effects on human health and climate, megacities and mega-regions have become the focus in
recent years (WMO, 2012) However, from a global perspective, megacities are quiet heteorogeneous in terms of urban
growth rates and the resulting spatial pattern. Moreover, their predominant functionalities, ie whether industrially dominated
or already taking part in the emerging information society, impact on pollution characteristics as well.
Method and results
A globally systematic multi-sensor approach is applied to analyse NO2 pollution variability in megacities linked to urban
growth rates and population development. To quantify the global tropospheric NO2 variability satellite-based observations of
GOME-2 (2007-2015) and SCIAMACHY (2002-2010) are examined The linear trend is determined by an approach building
upon Weatherhead et al. (1998). The classification of the dynamics of urban development and the spatial pattern for 2002 and
2012 is based on optical Landsat and TanDEM-X radar data (Taubenböck et al., 2014).
Considering the per-capita NO2 pollution, the megacities can clearly be classified into three groups with differentiated
pollution characteristics (of increasing magnitude): the cities of the Global South, the cities of Europa and USA, and the
cities in China and Korea. With respect to the linear trends, each of these groups shows a typical development. While the
NO2 levels in Europe and
USA are decreasing, a strong
increase can be found
throughout the megacities of
the Global South.
Heterogeneous trends are
observed for Chinese and
Korean megacities. Here the
trends vary spatially and
urban growth pattern need to
be taken into account to draw
the conclusions in line with
in-situ measurements. This is
demonstrated by the NO2
analysis of the mega-region
Guangzhou-Shenzhen-Hong
Kong, a dynamic industrial
and economic region with
globally unprecedented
growth rates so far.
Conclusion
Satellite-based time series of tropospheric NO2 observations and urban settlement pattern have been combined for the first
time. The systematic analysis enables to classify megacities with respect to growth, pollution characteristics and significant
trends as well as to delineate heterogeneous trends within megaregions.
References
Erbertseder T et al. (2015): Stadtregionen als globale Zentren der Luftverschmutzung – in: Globale Urbanisierung –
Perspektive aus dem All, Springer
Taubenböck H et al. (2014): New dimensions of urban landscapes: The spatio-temporal evolution from a polynuclei area to a
mega-region based on remote sensing data. In: Applied Geography. Vol. 47, pp. 137-153.
Weatherhead E C et al. (1998): Factors affecting the detection of trends: Statistical considerations and applications to
environmental data. Journal of Geophysical Research, 103, 17149-17161.
WMO (2012), WMO/IGAC Impacts of Megacities on Air Pollution and Climate, GAW Report No. 205.
Fig 1: Megacities sorted by per-capita NO2 pollution (decreasing from left to right) and
the corresponding relative trends (%/year)

21
INDOOR CONCENTRATION OF PM1, PM2.5 AND PM10 IN A MAIN SHOPPING MALL IN AL AIN CITY, UAE
G. O. Odhiambo
Department of Geography & Urban Planning, UAE University, P. O. Box 1551, Al Ain, UAE
Presenting author email: [email protected]
Summary
The study was carried out with the main objective of assessing concentrations of fine particulate matter (PM1, PM2.5 and
PM10) and Total Suspended Particles (TSP) in the indoor air of one of the main malls in Al Ain, UAE, during the months of
June and July 2015. Measurements were carried out using a DustTrak instrument in five locations. High concentrations of
fine particulate matter, exceeding the WHO standards for both PM2.5 and PM10 by large margins, were observed posing
serious health implications to the public. Re-suspension of particles due to cleaning and especially movement inside the mall
as well as diffusing of outdoor fine particles may be a major contributor to the high levels of particulate matter recorded in
the mall.
Introduction
Indoor air quality is an important public health issue as people spend most of their time indoors. This is especially so for
regions with extreme climate condition such as the United Arab Emirate (UAE) where in summer air temperature can soar to
over 45oC. Indeed urban air pollution is one of the leading risk factors for the global burden of disease. Of particular concern
are airborne fine particles that cause greater health impact than any other air pollutants (Ashmore and Dimitroulopoulou,
2009). This study was conducted in one of the main malls in Al Ain city, UAE, an environmental issues of significant
concern given that there is always an inflow of large populations into the malls for shopping, entertainment and dining
especially during the summer months when outdoor temperature is too high for any outdoor activities. The study was carried
out with the main objective of assessing concentrations of fine particulate matter (PM1, PM2.5 and PM10) and Total
Suspended Particles (TSP) in the indoor air of one of the main malls in Al Ain during the months of June and July 2015.
Methodology and Results
Measurements were carried out using a DustTrak™ dust monitor (Model 8534) in five locations as follows: within a shop
located on the ground floor close to an entrance from one of the main parking lots (S1), inside a supermarket on the first floor
(S2), inside a furniture shop on the first floor (S3) and on a corridor facing the main entrance, also on the first floor (S4).
Another sampling point was in one of the main parking lots (S5). Scanning electron microscopy was used for particle
morphology analysis.
The 24-h mean concentrations of PM1 varied from 21.89 μg/m3 to 40.46 μg/m3. PM2.5 values ranged between 23.15 μg/m3
and 44.57 μg/m3 whereas PM10 values were between 25.58 μg/m3 to 58.66 μg/m3 and TSP range was from 27.78 μg/m3 to
76.71 μg/m3. Indoors, the highest concentrations of particulate matter were observed in the shop on the ground floor closer to
the entrance to the parking lot probably due to penetration of particulate matter from the parking lot and resuspension due to
cleaning and movements within the shop. Much higher concentrations were recorded at the parking lot where 24-h mean PM1
values were 88.85 μg/m3 (25.16-190.64), PM2.5
was 101.19 μg/m3 (31.65-203.73 μg/m3), PM10
was 132.07 μg/m3 (37.38-292.67 μg/m3) and TSP
was 139.67 μg/m3 (37.28-324 μg/m3), exceeding
the WHO (2006) standards for both PM2.5 and
PM10 by a large margin posing serious health
implications to the public. Peak PM values were
recorded from late afternoon until around 10:30
pm (Fig. 1) when the mall closes indicating that
indoor movements causing resuspension of
particles was mainly responsible for high values
observed. Outdoor influence is also possible as
much higher concentrations were observed on
the ground floor in the shop adjacent to the main
entrance (S1) from the parking lot as well as on
the first floor closer to the main entrance (S2).
The evaluation of SEM micrographs of the
samples showed that most of the particles are
smaller than 10 m.
Conclusion
This is a pioneering work on indoor particulate matter assessment in the malls in the UAE. Considering the high values of
fine particulate matter observed in the study and especially given that malls are major recreation centres in the UAE, more
elaborate and long-term studies are needed to understand their influences on human health and to identify the respective
emission sources of these pollutants.
Reference
Ashmore MR and Dimitroulopoulou C. 2009. Personal exposure of children to air pollution. Atmos. Environ., 43(1), 128-
141.
Fig. 1 showing the diurnal profile of fine particles recorded in a shop close to
the entrance from one of the parking lots in the Mall

22
A SUB-GRID MODEL FOR IMPROVING THE SPATIAL RESOLUTION OF AIR QUALITY MODELLING AT A
EUROPEAN SCALE
M.R. Theobald (1), M. Vieno (2) and D. Simpson (3)
(1) Atmospheric Pollution Division, Centro de Investigaciones Energéticas Medio Ambientales y Tecnológicas (CIEMAT),
Madrid, Spain; (2) Centre for Ecology and Hydrology, Edinburgh, UK; (3) EMEP MSC-W, Norwegian Meteorological
Institute, Oslo, Norway
Presenting author email: [email protected]
Summary
A sub-grid model has been developed to simulate the spatial distributions of mean annual NO2 and NH3 concentrations
within the grid cell of a chemical transport model. The inclusion of the sub-grid model substantially improves the predictions
of the chemical transport model reducing both mean model error and increasing the spatial correlation with measured
concentrations.
Introduction
Currently, chemical transport models used to assess impacts of air quality applied at a European scale, such as the EMEP
MSC-W model (Simpson et al., 2012), lack the spatial resolution necessary to simulate the fine-scale spatial variability. This
spatial variability is especially important for assessing the impacts to human health or ecosystems of short-lived pollutants,
such as nitrogen dioxide (NO2) or ammonia (NH3). In order to simulate this spatial variability, a sub-grid model has been
developed to estimate the spatial distributions (at a spatial resolution of 1 × 1 km2) of atmospheric concentrations within the
grid squares of a chemical transport model (in this case the 50 × 50 km2 grid squares of the EMEP model). The sub-grid
model combines high resolution emission data with simple parameterisations of atmospheric dispersion to simulate the
spatial distribution of mean annual concentrations within each grid square of the chemical transport model.
Methodology and Results
Simple parameterisations of atmospheric
dispersion from a 1 × 1 km2 area source
were produced using three atmospheric
dispersion models (ADMS v4,
AERMOD v12345 and LADD) and an
arbitrary European meteorological
dataset. For the dispersion of NH3, the
source was assumed to be at ground
level (to represent agricultural sources),
whereas for NO2, simulations were
carried out for two emission heights
(ground level to represent traffic sources
and a height of 400 m to represent the
effective emission height of large stack
sources). The mean dispersion fields
(average of the three models) were then
multiplied by high resolution (1 × 1 km2)
emission maps of NO2 and NH3 for two
study areas (Scotland and the
Netherlands) using a moving window approach. The resulting maps of “sub-grid distributions” were then combined with the
low-resolution 50 × 50 km2 concentration predictions of the EMEP model (in order to conserve the large-scale processes
whilst adding the fine detail) to give high resolution (1 × 1 km2) concentration maps (Fig. 1). A statistical comparison of the
performance of the two models shows that the sub-grid model represents a substantial improvement on the predictions of the
EMEP model reducing both mean model error (from 37% to 32% for NO2 and from 42% to 30% for NH3 and increasing the
spatial correlation (r) with the measured concentrations (from 0.52 to 0.79 for NO2 and from 0.74 to 0.86 for NH3).
Conclusions
The inclusion of a sub-grid model that combines high resolution emission data with simple parameterisations of atmospheric
dispersion can improve the annual mean concentration predictions of chemical transport models applied at a European scale.
Acknowledgement
This work was supported by European Commission FP7 project ÉCLAIRE (Project No.: 282910)
References
Simpson, D., Benedictow, A., Berge, H., Bergström, R., Emberson, L.D., Fagerli, H., Flechard, C.R., Hayman, G.D., Gauss,
M., Jonson, J.E., 2012. The EMEP MSC-W chemical transport model–technical description. Atmospheric Chemistry and
Physics 12, 7825-7865.
Fig.1 EMEP model predictions of mean annual NO2 concentrations in the Netherlands
(left) and with the inclusion of the sub-grid model (right).

23
CHARACTERIZATION OF THE OZONE PLUME OVER THE IBERIAN PENINSULA DUE TO MADRID AND
BARCELONA CITIES
Víctor Valverde (1), María T. Pay (1), José M. Baldasano (1,2)
(1) Earth Sciences Department, Barcelona Supercomputing Center-Centro Nacional de Supercomputación, Barcelona,
Spain. (2) Environmental Modeling Laboratory, Technical University of Catalonia, Barcelona, Spain.
Presenting author email: [email protected]
Summary
On-road transport is the main anthropogenic contributor to O3 precursor’s emissions in Madrid and Barcelona metropolitan
areas: 65%/59% of NOx, 40%/33% of NMVOC, and 67%/85% of CO emissions, respectively; but this contribution to O3 is
not well understood. The present work aims at increasing the understanding on the role of on-road transport emissions from
main Spanish urban areas in O3 dynamics over Spain under typical meteorological circulation types.
Introduction
Despite the ~30% emission decrease of the main tropospheric ozone (O3) precursors in Spain in the 2001-2012 period, the O3
concentration in summer still exceeds the target value for the protection of the human health of the Air Quality Directive
(2008/50/EC).
Methodology and Results
The ISAM-CMAQ within the CALIOPE air quality system (WRF/HERMES/CMAQ/BSC-DREAM8b) has been applied to
understand the effect of on-road transport emissions of Madrid and Barcelona metropolitan areas to O3 concentration and its
dynamics. The results indicate that the daily maximum O3 concentration attributed to the on-road transport emissions from
Madrid and Barcelona metropolitan areas contribute up to 24% and 8% to total O3 concentration, respectively, within an area
of influence of 200 km. The contribution is particularly significant (up to 80-100 µg m-3 in an hour) to the O3 concentration
peak during the central hours of the day in the O3 season (April-September). The maximum O3T-MAD concentration is
calculated within the metropolitan area of Madrid but the plume, channelled by the Tajo and the Henares valleys, affects
large areas of the Iberian Peninsula. The O3T-BCN plume is more driven by sea-land and mountain-valley breezes than by
the synoptic advection and its maximum concentration is usually registered over the Mediterranean Sea. The O3
concentration transported long-range to the Iberian Peninsula is significant in the area of influence of Madrid and Barcelona,
being maxima under cold (70-96%) and minima in warm circulation types (35-70%).
Conclusions
The daily maximum contribution of the on-road transport emissions from the Madrid and Barcelona metropolitan areas to the
total O3 concentration modelled under the most typical meteorological circulation types (CTs) affecting the Iberian Peninsula
is 23.5% for Madrid and 7.7% for Barcelona. For both Madrid and Barcelona areas of influence (~ 200 km) there is a
background O3 concentration of ~60 µg m-3 on average for all the CTs. The O3 attributed to on-road transport emissions is
relevant to explain O3 peak concentration and exceedances of the regulatory target values.
Acknowledgement
This work is partially funded by the Iberdrola Foundation by the pre-doctoral grant held by V. Valverde and the post-doctoral
grant held by M. T. Pay in the Beatriu de Pinós program (2011 BP-A2 00015), and partly funded by the CGL2013-46736-R
and 2014 SGR 522 projects.
References
Pope C.A., Dockery D.W., 2006. Health Effects of Fine Particulate Air Pollution: Lines that Connect. Journal of Air and
Waste Management Association 56, 709-742.

24
ASSESSING EFFICACY OF NEW PLANT-WALL SYSTEM TO REDUCE INDOOR AIR POLLUTION
M. Zavattaro1, M. Burchett1, F. Torpy1
1Plants and Environmental Quality Research Group (PEQRG), School of Life Sciences, Faculty of Science, University of
Technology, Sydney, New South Wales, Australia
Presenting author email: [email protected]
Summary
The aim of this research has been to provide a detailed investigation of alternative methods for improving indoor air quality,
including an assessment of whether a novel modular, optionally fan-assisted or passive plant-wall system, can be utilized to
reduce the energy load on mechanical building ventilation systems. Module biosafety was first examined by measuring
possible bioparticle emanations. The biosafety of the modules was examined first, by measuring possible bioparticle
emanations. No significant increase in fungal particles over background levels was found. Furthermore, no Legionella spp.
was detected. The tested indoor air pollutions were CO2, TVOCs and PM10/2.5 and the plant-wall module’s removal
capacity was determined. Data indicated both the optionally fan-assisted or passive plant-wall system can reduce
concentrations of CO2, VOCs and PM10/2.5. Using an unoccupied, single-person office space, the research also determined a
set of metrics relating to optimum lighting type, intensity and airflow rates, for two commonly used indoor plant species,
Epipremnum aureum and Chlorophytum comosum, to achieve the most effective reduction of the tested indoor air pollutants.
The information resulting from the findings will be useful to building managers, particularly in maximising air quality
improvement performance by the installation of fan-assisted, living-plant-based wall modules and encourage future
implementation of plants within buildings to reduce indoor air pollutant concentration.
Introduction
Evidence from several studies suggest indoor plants can reduce concentrations of indoor air pollutants, including TVOC’s
and CO2 (Tarran et al., 2007). In addition, they have also been implicated in improving individual psychological well-being
and hence, overall workplace productivity. Urban air pollution is a major global health problem. The US EPA (2015) reports
that indoor air can be up to 2 to 5 times – and sometimes 100 times, higher than a city’s outdoor air. The use of indoor plant-
walls is an increasingly popular element of city building design, since they can be further developed and utilised to improve
indoor air quality by reducing the concentration of CO2, TVOCs and PM10/2.5 and improve a building’s sustainability rating
by reducing the use of mechanical building ventilation systems.
Methodology and Results
The modules (50x50 cm, containing 16 plants per module) were tested first in air-tight bench-top chambers, and then in an
unoccupied, single-person office space. For the biosafety trials, air samples were taken with a Reuter Centrifugal air sampler
onto Sabouaud’s dextrose agar strips, and incubated at 23oC for 7 days. Fungal colonies were identified to genus level by
gross microscopic morphology. The fungal propagule density as colony-forming units per cubic metre (cfu/m3) in the tested
office was found not to exceed that of typical ambient office fungal propagule density loads, nor was any hazardous genera
identified (such as Aspergillius fumigatus). Each of the plant-wall modules were tested for presence/absence of Legionella
spp., using both water, soil and air samples. These were conducted as per the Centers for Disease Control and Prevention
recommended environmental sampling procedures and Legionella spp. identification. In bench-top chamber testing,
increasing levels of CO2 draw down were found over a 40 minute period, with light intensities at 10, 50 and 100 µmol m-2 s-1
respectively. With two common internationally used indoor plant species, Chlorophytum comosum and Epipremnum aureum,
it was found that CO2 draw down was greatest at 100 µmol m-2 s-1, with an average loss of 10% from an initial starting
concentration of 1000 ppm. PM10/2.5 draw down rates with the two plant species were also measured over a 40 minute
period, with varying fan-assisted intensities, after an initial injection of 1000 µg/m3 of particulate matter. With fan-assistance
on, the PM10/2.5 levels were reduced to normal ambient indoor levels after an average of 5 minutes. With no fan-assistance
an average of 17 minutes was required for PM10/2.5 concentrations to reach ambient office levels, and with no modules a
period of about 26 minutes was recorded.
Conclusions
This research, which investigated fan-assisted plant-wall removal capacity of indoor air contaminants, indicated that the
modules tested can improve indoor air quality by reducing indoor concentrations of CO2, VOCs and PM10/2.5. Compared to
modules without substrate ventilation or when no modules were present, it was also found, in bench-chambers or in offices,
that when fan-assisted, the modules were more effective at reducing levels of the pollutants. In addition, the modules, with or
without fan-assistance, were found not to be a source of Legionella spp., nor did they increase airborne fungal propagule
density above normal background levels. The goal of this research is to contribute to the long term effectiveness of such
modular green-wall systems to improve indoor air quality, reduce energy loads of the heating, ventilation and air-
conditioning (HVAC) systems within city buildings, thereby improving a building’s sustainability rating.
References Tarran J., Torpy F., Burchett M., 2007. Use of living pot-plants to cleanse indoor air. Research Rev. In: 6th Internat conf
indoor air qual., ventln., energy conserv., sustainable built environ., Sendai, Japan, pp 249–256.

25
DEVELOPMENT APPLICATION EVALUATION OF AIR QUALITY
AND RELATED MODELS

26

27
TEN YEARS OF CITY-WIDE HIGH-RESOLUTION SIMULATIONS OF NOX CONCENTRATIONS
A. Berchet, K. Zink, D. Brunner and L. Emmenegger
Empa, Swiss Federal Laboratories for Materials Science and Technology, Dübendorf, Switzerland
Presenting author email: [email protected]
Summary
Ten years of hourly NOx concentrations in two Swiss cities are simulated using the GRAMM/GRAL modelling system at the
building resolving scale. We compare the hourly simulations to in situ measurements of meteorological parameters and NOx
concentrations. The prevailing wind patterns in the surroundings of the two cities are well reproduced by the mesoscale
model GRAMM. These winds constrain the microscale model GRAL which simulates the air flow and air pollutant
dispersion within the cities at 5 m resolution. Observed magnitudes and temporal variability of NOx concentrations are
mostly well reproduced suggesting a generally high quality of the simulations suitable for average population exposure
assessment. While short temporal scales (up to one day) are not well simulated, probably due to a poor representation of the
cycle of emissions, concentration variations at synoptic to seasonal scales are precisely reproduced.
Introduction
The impact of air pollution on human health is well established through numerous long- and short-term epidemiological
studies. However, a precise assessment of the exposure of individual persons has been lacking in most epidemiological
cohort studies conducted so far due to the difficulties in properly representing the large spatial and temporal variations of
pollutant levels in cities. Approaches to tackle this issue require either dense observation networks or expensive high-
resolution models. Here, we present and evaluate a modelling system providing detailed air pollution maps at hourly
resolution for long periods of time (10 years in our case) with affordable computation resources and using standard air quality
observations existing in most cities.
Methodology and Results
The mesoscale meteorological model GRAMM (Almbauer et al., 2000)
accounts for the influences of topography and of land use types at 100 m
resolution in the region around each city (~40 km). The microscale model
GRAL (Oettl, 2015) is nested into GRAMM and simulates the flow and
air pollutant dispersion within the city at building resolving resolution
(example for the city of Lausanne in Figure 1). Dispersion simulations
are computed for a large set of different emission categories (e.g., light
and heavy traffic, heating, industry). The modelling system relies on a
catalogue of steady-state reference simulations. In situ observations of
wind direction and speed are used to choose the optimal matching
situation in the catalogue for every hour of the simulated period.
At the mesoscale, land-use- and topography-driven wind patterns are
very well reproduced by the GRAMM model, despite a general
underestimation of wind speeds. At the building scale, the winds within
the street canyons are well simulated by the GRAL model (at the
4 validation sites in Figure 1), though narrow streets are not well
represented at the chosen 5 m resolution (e.g., at DGE07), leading to
unrealistically high concentrations. The average magnitude of simulated
concentrations deviates by less than 10% at 3 of the 4 validation sites in
the city, where the winds in the local street canyon are well simulated.
The diurnal variability of NOx concentrations is reproduced with a
correlation coefficient of 0.4 – 0.6 depending on the site, only 10% better
than what could be obtained by a direct extrapolation of traffic density.
Day-to-day variability, conversely, is very well simulated, with
correlations of 0.8 – 0.9. Thus, the alternation between periods of
pollutant accumulation under stable high-pressure conditions and cleaner,
windy periods is very precisely simulated by our modelling system.
Conclusions
We developed a comprehensive tool for long-term city-wide high-resolution simulations of air pollution. This tool is very
accurate in reproducing the 3D average magnitude and variability of concentrations at the city scale. A better horizontal
resolution and improvements in accounting for emission variability at different time-scales are still required for accurately
dealing with pollution peaks shorter than the daily timescale.
References
Almbauer, R.A., Oettl, D., Bacher, M., and Sturm, P.J. 2000. Simulation of the air quality during a field study for the city of
Graz. Atmos. Environ. 34, 4581–4594.
Oettl, D. 2015. Quality assurance of the prognostic, microscale wind-field model GRAL 14.8 using wind-tunnel data
provided by the German VDI guideline 3783-9. J. Wind Eng. Ind. Aerodyn. 142, 104–110.
Fig.1 Validation sites in GRAL domain.
Fig.2 Daily time series at a validation site

28
COUPLING METEOROLOGICAL AND CHEMICAL ENSEMBLES IN AIR QUALITY DATA ASSIMILATION
Christoph Bergemann (1), Frank Baier (1), Thilo Erbertseder (1)
(1) Deutsches Zentrum für Luft- und Raumfahrt, Deutsches Fernerkundungsdatenzentrum, Oberpfaffenhofen
Summary
In this study we investigate the impact of including meteorological uncertainties into an ensemble of air quality model runs.
This is analyzed with respect to the possibilities of using the ensemble to drive an Ensemble Kalman Filter based data
assimilation approach.
Introduction
Ensemble modelling is an attractive method of accounting for uncertainties inherent to air quality modelling. Besides this,
ensembles also enable access to powerful assimilation methods such as the Ensemble Kalman Filter (EnKF). Their success
however relies on adequate descriptions of the model uncertainty. These uncertainties are caused by a variety of factors:
Emissions, model parametrizations as well as the input meteorology. While research has been done on multi-model
ensembles to assess uncertainties in the model formulation as well as on ensembles with input parameters changed, less
attention has been paid to meteorological uncertainty.
Method and results
Generating an ensemble of meteorological data is straightforward. We use
the WRF model (Skamarock et al., 2008) driven by global ensemble data
from the GEFS v2 reforecast dataset. Furthermore we use different physical
parametrizations of WRF to obtain a meteorological ensemble with 30
members. As a cheaper alternative, we employ a meteorological ensemble of
three members consisting of forecasts with different lead time. This approach
may appear attractive as these data are often available as results from
operational forecast chains.
These results are then fed into the POLYPHEMUS/DLR ensemble
modelling system that is based on the Polyphemus air quality platform
(Mallet et al. 2007). This system adds uncertainty of emissions and other
parameters to produce an air quality ensemble consisting of 80 members.
The model domain as illustrated in the figure covers Europe at a horizontal
resolution of 0.5°.
In order to assess the impact on the quality of the simulated background error
covariances, we analyze the background error correlations. The figure shows
the results the correlation of ozone at 200m height in Munich with other
pixels at that height for a single point in time (during August 2011) for the
small (top) and large ensembles. It can clearly be seen that the larger
meteorological ensemble reduces spurious correlations at larger distances
from the point of reference.
This is crucial for ensemble data assimilation as the spurious correlations for
the small ensemble are so large that even rigorous localization was not able
to get a working EnKF assimilation.
Conclusion
Including meteorological uncertainty into air quality ensembles is desirable.
However, for the purpose of data assimilation, there appears to be no way
around operating a full-blown meteorology ensemble. A likely reason is that
the small meteorological ensemble introduces too large discontinuities
within the ensemble causing the correlation artifacts.
References
Mallet V., Quélo D., Sportisse B., Ahmed de Biasi M., Debry É., Korsakissok I., Wu L., Roustan Y., Sartelet K., Tombette
M. and Foughil H., 2007. Technical Note: The air quality modeling system Polyphemus. Atmospheric Chemistry and Physics
7, pp. 5479-5487
Skamarock W. C., Klemp J. B., Dudhia J., Gill D. O., Barker D. M., Duda M. G., Huang X.-Y., Wang W., Powers J. G.,
2008. A Description of the Advanced Research WRF Version 3. Technical Note TN-475+STR, NCAR.
Figure: Ensemble correlations of ozone with a point
near Munich at 200m height for the small (top) and
large (bottom) ensemble. See the text for details.

29
HOW GOOD ARE AEROSOL-CLOUD INTERACTIONS IN ONLINE COUPLED MODELS?
R. Baró(1), D. Brunner(2), L. Palacios-Peña(1), R. Bianconi(3), G. Curci(4), M. Hirtl(5), L. Honzak(6), R. Forkel(7), A.
Manders(8), L. Neal(9), N. Savage(9), M. Schaap(8) P. Tuccella(4), H. Van der Gon(8) J. Werhahn(7), R Žabkar(6) P.
Jiménez-Guerrero(1)
(1) Regional Campus of International Excellence “Campus Mare Nostrum”, University of Murcia; (2) EMPA; (3)
Enviroware; (4) University L’Aquila; (5) ZAMG; (6) SPACE-SI; (7) IMK-IFU; (8) TNO; (9) UK MET Office
Presenting author email: [email protected]
Summary
A model evaluation of aerosol-cloud interactions through the Air Quality Model Evaluation International Initiative phase 2
(AQMEII-2) (Alapaty et al., 2012) has been performed using satellite data.
Introduction
Atmospheric aerosols affect air quality and influence the Earth’s radiation budget. The study of aerosol radiative effects and
feedbacks with the climate system is nowadays one of the most important topics in climate science. In order to build
confidence in air quality-climate interaction studies, a thorough evaluation of integrated meteorology-atmospheric chemistry
models is needed, at both global and regional scale. Aerosol-cloud interactions (ACIs), in particular, continue to constitute
one of the most important uncertainties in anthropogenic climate perturbations. The main objective of this contribution is to
assess whether the inclusion of ACIs in regional-scale, integrated models improves the simulation of the climate-chemistry-
cloud-radiation system over Europe. For this purpose, simulations for the year 2010 conducted with several different models
under the umbrella of AQMEII-2 and the European COST Action EuMetChem are used.
Methodology and Results
An overview of the one-year model simulations contributing to this study is presented in Table 1. It includes six simulations
with and one simulation without accounting for ACIs. In order to analyze the effect of different model settings on the
representation of ACIs, the simulation of a number of different cloud variables is compared and evaluated against
observations. The evaluation uses satellite data from the ESA Climate Change Initiative (http://www.esa-cloud-cci.org/) and
from the MODIS instrument. The following variables affected by ACIs have been studied: cloud condensation nuclei, cloud
droplet number, cloud ice path, cloud optical depth, cloud water liquid path, effective radius and convective/large scale
precipitation. In addition, the relationship between aerosol optical depth (AOT) and several cloud variables has been studied.
Finally, the effect of ACIs on air quality was analyzed based on two similar simulations with and without considering ACIs.
Results indicate that the on-line representation of ACIs increases the number of cloud condensation nuclei as well as cloud
droplet number over areas with high aerosol levels, for example during the Russian and Portuguese forest fire in summer
2010. Overall, the models tend to underestimate the cloud fraction over the entire domain. Precipitation over the Atlantic
Ocean is enhanced when prognostic aerosol concentrations are accounted for in the process of cloud droplet formation.
Furthermore, a positive relationship between some cloud variables and AOT is observed, simulated by the majority of the
models. Changes in ozone and particulate matter due to ACIs have also been found.
Simulation Model Microphysics Gas
Phase
SW
radiation
LW
radiation
Aerosol
Aerosol
feedbacks
1
WRF
Chem
Lin RADM2
RRTM Goddard MADE
SORGAM Yes
2
Morrison 3
RADM2
integ1
4 RACM RRTMG RRTMG
MADE VBS
5* RADM2 MADE SORGAM No
6
RACMO
LOTOS-
EUROS
Tiedtke,
Tompkins
Neggers
CB-IV RRTM RRTM ISORROPIA II 2
bins Yes
7 METUM
UKCA
Wilson &
Ballard RAQ Edwards-Slingo Classic
Conclusions
The on-line representation of ACIs reduces the bias and improves correlations between observed and model simulated cloud
variables for some regions and periods. Further comprehensive studies will be needed for a better understanding of these
interactions and to help us to improve the knowledge of the climate and air quality interactions.
Acknowledgement
We acknowledge AQMEII2, EuMetChem COST Action ES1004, the Joint Research Center Ispra and the Institute for
Environment and Sustainability for its ENSEMBLE system, and CGL2013-48491-R/CGL2014-59677-R (through European
Regional Development Fund –FEDER).
References
Alapaty, K et al., 2012. New directions: understanding interactions of air quality and climate change at regional scales.
Atmos. Environ. 49, 419-421

30
MONITORING AIR QUALITY OVER CHINA: RESULTS OF THE PANDA MODELING SYSTEM
I. Bouarar (1), G. Brasseur (1), C. Granier (2), Y. Xie (3), X. Wang(4), Q. Fan (4), L. Wang (5)
(1) Max Planck Institute for Meteorology, Germany; (2) CNRS, LATMOS/IPSL, Paris, France; (3) The Shanghai Center for
Urban Environmental Meteorology (SCUEM), China; (4) Sun Yat-Sen University, Department of Environmental Science,
School Of Environmental Science and Engineering (SESE-SYSU), Guangzhou, China; (5) Institute of Atmospheric Physics,
Chinese Academy of Sciences (IAPCAS), China
Presenting author email: [email protected]
Summary
By combining space and in-situ observations and surface emissions of chemical pollutants with complex mathematical
models of atmospheric composition, detailed analyses and reliable predictions of regional air quality in East Asia are
produced within the EU-funded project PANDA and disseminated to the public. Through collaboration between scientists
from Europe and China, this project aims to improve our understanding of the processes responsible for the formation,
dispersion and destruction of air pollutants. Detailed modeling studies of recent haze events in East Asia are conducted and
comprehensive prototype systems for the prediction of air quality are developed with the aim of improving methods for
monitoring air quality in support of European and Chinese policies.
Introduction
In this study, we combine space and in-situ observations and WRF-Chem regional model simulations to analyse regional air
quality in East Asia during haze events that occurred recently in 2010 and 2013. The detailed modeling studies aim to
evaluate (e.g. Figure 1) and improve the performance of the WRF-Chem model which is also used for our air quality
prediction system developed within PANDA. An ensemble modeling approach based on several global and regional state-of-
the art models is constructed and an inter-comparison exercise is organised in order to improve our understanding of the
differences among current models for simulating and predicting haze events in East Asia.
Methodology
Our modeling system follows a downscaling approach: global model systems provide initial and boundary conditions to
regional model simulations over East Asia with WRF-Chem. Model simulations at higher resolution (e.g. 20km) are then
performed over a nested domain which covers the most polluted regions in East Asia. In this study, we show a
comprehensive evaluation (e.g. Figure 1) of our modeling system with satellite and in-situ observations of pollutants (O3,
CO, NOx and particles) at several surface stations during the pollution events that occurred in winter 2010 and 2013 and
summer 2010. Sensitivity of the model results to emissions emissions is investigated using different emission inventories
(MACCity, REASv2 and HTAPv2). The impact of initial and boundary forcing is assessed using data from MOZART
(NCAR) and MACC (ECMWF) global simulations. The performance of our modeling and forecasting system is also
evaluated against other models in an inter-comparison modeling exercise.
Conclusion
In this study we demonstrate the importance of using a downscaling approach to better reproduce and predict air pollution
events that occur in East Asia. The performance of our WRF-Chem modeling system is influenced not only by the grid
resolution but also the emission inventories used, their resolution and diurnal variation as well as the choice of boundary and
atmospheric forcing. Interesting differences are found among the models involved in our study indicating the need to assess
the relation between the performance of the models and the complexity of their chemistry and aerosol schemes.
Acknowledgement
The authors acknowledge supported from the EU-funded project PANDA. We acknowledge the ECCAD and MEIC teams
for providing emission inventories and the Jülich Supercomputing Centre (JSC) for the granted computing time.
Fig.1 Comparison of WRF-Chem model results at 60km and 20km resolution with MACCity (Mct_) and HTAPv2(Htp_)
emissions against surface observations (Obs) of NOx and PM10 respectively in Shanghai and Beijing in January 2010.
Obs Mct_60km
Htp_20km Mct_20km
Obs Mct_60km
Htp_20km Mct_20km

31
A MULTI-MODEL CASE STUDY ON AEROSOL-METEORLOGY INTERACTIONS WITH REGIONAL
ONLINE COUPLED CHEMISTRY-METEOROLOGY MODELS
R. Forkel (1), A. Baklanov(2,3), A. Balzarini (4), R. Baró (5), D. Brunner (6), M. Hirtl (7), P. Jiménez-Guerrero (5),
Oriol Jorba (8), L. Honzak (9), J.L. Pérez (10), G. Pirovano (4), R. San José (10), W. Schroeder (11), G. Tsegas (12),
J. Werhahn (1), Ralf Wolke (11), R. Žabkar (9)
(1) Karlsruhe Inst. of Technology (KIT), IMK-IFU, Garmisch-Partenkirchen; (2) World Meteorological Organization,
Geneva, Switzerland (3), Danish Meteorological Institute, Denmark (on leave); (4) RSE, Milano; (5) University Murcia,
MAR-UMU, Spain; (6) Lab. for Air Pollution/Environmental Technology, Empa, Dübendorf, Switzerland;
(7) ZAMG, Vienna, Austria; (8) Earth Sciences Department, Barcelona Supercomputing Center, Spain;
(9) University Ljubljana, SPACE-SI; (10) Technical Univ. of Madrid, ESMG, Spain;
(11) TROPOS, Leipzig, Germany; (12) LHTEE, Aristotle University, Thessaloniki, Greece
Presenting author email: [email protected]
Summary
Simulation results from three different online coupled meteorology-atmospheric chemistry models are compared and
analysed with respect to the effect of the aerosol radiative impact on meteorological fields, effect of aerosol cloud
interactions, and feedbacks on pollutant concentrations.
Introduction
The importance of different processes and feedbacks in online coupled chemistry-meteorology models for air quality
simulations and weather prediction is investigated in COST Action ES1004 EuMetChem (http://eumetchem.info/). In order to
analyse the aerosol direct and indirect effects and the response of different models to aerosol-meteorology interactions case
studies for two episodes were performed with different online coupled models (Baklanov et al., 2014) as a coordinated
exercise of Working Groups 2 and 4 of EuMetChem.
Methodology and Results
Simulations with different online coupled meteorology-atmospheric chemistry models were carried out for Europe with and
without including aerosol-meteorology interactions. The two considered episodes are the Russian heat wave and wildfires
episode in July/August 2010 and a period in October 2010 with enhanced cloud cover and rain and including an event with
Saharan dust transport to Europe. These episodes had been identified during the previous AQMEII phase2 exercise
(Galmarini et al., 2015) and were selected on behalf of their strong potential for direct and indirect aerosol effects on
meteorology. The participating models were COSMO-ART, COSMO-Muscat, and WRF-Chem with different chemistry and
physics options (for references of the models see Baklanov et al, 2014). Common emissions and boundary conditions for all
participating models and a unified output strategy allow analyzing the model output with respect to similarities and
differences in the model response to the aerosol direct effect and aerosol cloud interactions.
The high aerosol emissions during the summer 2010 Russian wildfire episode led to pronounced feedback effects. For
example, the direct aerosol effect lowered the episode mean solar radiation by up to 100 W m-3 and episode mean
temperature by up to 1 degree in the area with maximum aerosol from fire emissions. A quite magnitude of the response to
the direct aerosol effect was found for WRF-Chem and COSMO-MUSCAT. The high aerosol concentrations emitted from
the wildfires over Russia were found to decrease the small amount of precipitation over Russia during this episode by another
10% to 30% when aerosol cloud interactions were taken into account for the WRF-Chem simulations.
Conclusions and Outlook
For the applied horizontal resolution, the impact of aerosol feedbacks on pollutant distributions was frequently smaller than
differences among the single models. As a next step, a more systematic analysis of aerosol cloud interactions for different
WRF-Chem options will be performed.
Acknowledgement
We gratefully acknowledge the contribution of various groups to the second air Quality Model Evaluation international
Initiative (AQMEII) activity: TNO (anthropogenic emissions database); ECMWF/MACC project & Météo-France/CNRM-
GAME (chemical boundary conditions), FMI (fire emissions), the support by Cost action ES1004 EuMetChem and the
contributions of all members of the Cost action ES1004 EuMetChem.
References
Baklanov, A., Schlünzen, K., Suppan, P., Baldasano, J., Brunner, D., Aksoyoglu, S., Carmichael, G., Douros, J., Flemming,
J., Forkel, R., Galmarini, S., Gauss, M., Grell, G., Hirtl, M., Joffre, S., Jorba, O., Kaas, E., Kaasik, M., Kallos, G., Kong, X.,
Korsholm, U., Kurganskiy, A., Kushta, J., Lohmann, U., Mahura, A., Manders-Groot, A., Maurizi, A., Moussiopoulos, N.,
Rao, S. T., Savage, N., Seigneur, C., Sokhi, R. S., Solazzo, E., Solomos, S., Sørensen, B., Tsegas, G., Vignati, E., Vogel, B.,
Zhang, Y., 2014. Online coupled regional meteorology chemistry models in Europe: Current status and prospects. Atmos.
Chem. Phys., 14, 317-398, doi:10.5194/acp-14-317-2014.
Galmarini, S., Hogrefe, C., Brunner, D., Makar, P., Baklanov, A., 2015. Preface to the Special Issue Section: Evaluating
Coupled Models (AQMEII P2). Atmos. Environ., 115, 340-344, doi: 10.1016/j.atmosenv.2015.06.009.

32
MODELLING OF AIR QUALITY ALONG STATE ROADS IN DENMARK
S.S. Jensen (1), M. Ketzel (1), U. Im (1), P. Løftstrøm (1), J. Brandt, (1), J. Fryd (2) and L.N. Michelsen (2)
(1) Department of Environmental Science, Aarhus University, Roskilde, Denmark; (2) Danish Road Directorate,
Copenhagen, Denmark
Presenting author email: [email protected]
Summary
This study mapped air quality along the state road network in Denmark including all major motorways and main roads. For
the first time a national data set of modelled air quality data along the entire state road network has been established in
Denmark. The OML-Highway model, which is a GIS-based tool for calculating air quality along roads in open terrain, was
used to map air quality. The model approach, input data and evaluation of model results will be presented together with the
model results.
Introduction
The Danish Road Directorate has supported the development of the OML-Highway model, its application in a number of
Environmental Impact Assessments (EIA), a guidance report on air quality assessment along motorways and a user manual
for the OML-Highway model - all carried out by the Department of Environmental Science, Aarhus University (AU). With
the present project the Danish Road Directorate aims to map air quality along all state roads to be able to provide this
information to the general public on their website using webGIS. The new information will also be used as environmental
indicators in the annual reporting of environmental impacts of the state roads. Furthermore, the data set is envisioned to be a
screening tool in relation to future EIAs of state road projects.
Methodology and Results
The OML-Highway model requires information about the road network with traffic data, background concentrations,
meteorological data and calculation points. The road network is based on vejman.dk which includes traffic data for all state
roads in Denmark. Travel speed data is based on GPS readings from many vehicles. Background concentrations are
calculated with the regional air quality model Danish Eulerian Hemispheric Model (DEHM) and a local-scale model Urban
Background Model (UBM) with associated emission and meteorological data. Emissions for Denmark are based on the
emission model SPREAD which has emissions for Denmark for all sources broken down on a 1x1 km2 grid. The calculations
are carried out in the following way. The starting point is calculated background concentrations for the centre point of a 1x1
km2 grid from DEHM/UBM. This constitutes the background concentration for a given road segment of the road network.
Emissions from the state roads have not been included in these background calculations to avoid double-counting of
emissions from roads. Next, the OML-Highway model is used to calculate the contribution from the road to the calculation
points along the road within 1000 m from the centre line. The nearest located background concentrations are added to
concentrations of the calculation points. In this approach a simplified chemistry model was used to predict NO2. The
geographical variations of NO2, PM2.5 and PM10 in 2012 are shown in the below figure.
Conclusions
Air quality as annual means of NO2, PM2.5 and PM10 along the Danish state road network within 1000 m from the centre line
has been modelled for the first time to describe the geographic variation, and as a source of information to the general public.
Indicative exceedances of the NO2 annual mean were identified along parts of the most busy motorway sections at short
distance from the road. Annual means of PM2.5 and PM10 were well below limit values.
Acknowledgement
The Danish Road Directorate financed the project.
References
Jensen, S.S., Becker, T., Ketzel, M., Løfstrøm, P., Olesen, H.R., Lorentz, H. 2010: OML-Highway within the framework of
SELMAGIS. Aarhus University, Denmark, 26 p, NERI Technical Report No. 771. http://www.dmu.dk/Pub/FR771.pdf.
Fig.1. Geographical variation of calculated annual means of NO2, PM2.5 og PM10 in 2012.

33
x/D
Ve
rtic
alm
ass
flu
xe
s
0.2 0.4 0.6 0.8
-2
-1.5
-1
-0.5
0
0.5
1
1.5
2
2.5
3<wc*> /U
ref
<W><C*>/Uref
<WC*>/Uref
Step-up canyon
THE LARGE EDDY SIMULATION APPROACH IN AIR QUALITY RESEARCH - APPLICATION EXAMPLES
USING THE ADREA-HF CODE
N. Koutsourakis (1,2), J.G. Bartzis (1), A.G. Venetsanos (2), N.C. Markatos (3)
(1) Environmental Technology Laboratory, Department of Mechanical Engineering, University of West Macedonia, Kozani,
50100, Greece; (2) Environmental Research Laboratory, NCSR Demokritos, Aghia Paraskevi, 15310, Greece; (3) School of
Chemical Engineering, National Technical University of Athens, Zografou Campus, Athens, 15780, Greece
Presenting author email: [email protected]
Summary
The Large Eddy Simulation (LES) is a Computational Fluid Dynamics methodology with proliferous applications in a wide
range of scientific fields. In air quality research, the LES offers unique advantages like the accurate representation of flow
unsteadiness and of the transient mixing processes. Part of the LES potential is presented in the present study through
application examples that include turbulent flow and dispersion studies in different geometries (street canyons, room, city).
Introduction
The cumulative number of all publications that use LES increases so fast, that doubles every 4,3 years. LES is a natively
time-dependent methodology that partly resolves turbulence and leads to deeper understanding of the turbulent flow, which is
very crucial for the pollutant dispersion studies. LES can handle flows with inherent intermittency and calculate the
dispersion from sources that change with time and space. LES reveals flow phenomena like bursts and unsteady vortices and
provides concentration extremes. The consequences from the dispersion of odorous, toxic, or flammable gases can be
predicted. Turbulent structures and coherent vortices can be examined. LES provides the time series of the variables solved,
offering a tremendous volume of information that can be obtained through statistical processing. The advantages of LES can
be seen in practice through the applications presented, most of which include comparison with experimental results.
Methodology and Results
In all cases examined, the Smagorinsky model was used along with
a van-Driest dumping function near the wall. Numerics involved
central differences in space and Crank-Nicolson in time. The
number of cells varied from 162000 of case 1 (street canyon) to 3,3
million of case 4 (city). In case 1, dispersion from a street-level
line source in a street canyon was examined. LES results compared
very well with experimental data. Visualization of instantaneous
concentration isosurfaces revealed characteristic tongue-like
structures that redistribute the pollutant inside the canyon and
transfer it intermittently towards the free stream. Examination of
concentration time series showed among others the high variance
of the values near the source and the high-frequency turbulence
near the top of the canyon. In case 2, the flow and dispersion in
two asymmetric canyons was theoretically examined. The study of
the turbulent structures made clear the high correlation of negative
velocity fluctuations with high concentration areas (Fig.1a). It was
found that pollutant removal in the step-down canyon was mainly
due to turbulent transport (96%), while the removal in the step-up
was much higher and was due in about 84% to advection (Fig.1b).
The examination of a puff evolution showed in practice the about
10 times lower ability of the step-down canyon to disperse the
pollutant. In case 3, the dispersion of a light flammable gas in a
hallway was examined. Comparison with experimental data showed superior performance of ADREA-HF LES compared to
results from RANS and another LES code. Concentration values presented bursts at the sensor close to the source. This fact
made clear that the use of LES is indispensable if the danger of explosion has to be estimated. In case 4 the flow in the semi-
idealized city “Michel-Stadt” was simulated. Comparison of the results with wind tunnel data showed good agreement in the
average flow, while the stresses were underestimated from LES. The study of the evolution of the velocity vectors with time
revealed areas of interesting physical phenomena like bursts, sudden flow direction changes and unsteady vortices, which are
expected to have a significant role in the pollutant dispersion. LES was able to provide skewed and bimodal probability
density functions of flow variables in areas of high unsteadiness. The study of coherent structures, through concurrent
visualization of vorticity and velocity-fluctuation isosurfaces, made clear the dominance of vorticity sheets and hairpin
vortices above the city roof-level. It was found that the hairpin vortices (which have strong correlation with pollutant removal
events) are created mainly through upward piercing of the vorticity sheets from low-velocity areas.
Conclusions
The LES methodology inherently resolves turbulence and is very suitable for cases of transient flows with high unsteadiness.
The LES opens new horizons in the volume of information that can be extracted from a simulation, especially through
statistical processing of the resulting time-series. The examination of turbulent structures and pollutant removal mechanisms
and the deeper understanding of dispersion processes are examples of the numerous prospects the LES offers. Hence, there is
need to encourage the use of LES in air quality research.
Fig.1 a. Low velocity isosurfaces and concentration
contours above the canyons. b. Streamwise distributions of
turbulent, advective and total pollutant mass fluxes at z=h2
a
b
x/D
Ve
rtic
alm
ass
flu
xe
s
0.2 0.4 0.6 0.8
-2
-1.5
-1
-0.5
0
0.5
1
1.5
2
2.5
3
<wc*> /Uref
<W><C*>/Uref
<WC*>/Uref
(total)
(advective)
(turbulent)
Step-down canyon

34
EVALUATION OF A GLOBAL TROPOSPHERIC OZONE SMILULATION WITH STATION DATA
INCLUDING METEOROLOGICAL VARIABLES
N. Kaffashzadeh (1,2), M. G. Schultz (1,2), A. Hense (2), S. Schröder (1) and O. Stein (1)
(1)Institute for Energy and Climate Research, Troposphere IEK(8), Forschungzentrum Jülich, 52425, Germany;
(2)Meteorological Institute, University of Bonn, 53121 Bonn, Germany
Presenting author email: [email protected]
Summary The goals of this study are first to define an objective method for appropriate vertical model level selection for model-data
comparison and second to perform time filtering to decrease the impact of the potential bias on the chemistry model
evaluation, which arises from the model’s failure to simulate mesoscale weather events. Hourly measurements of temperature
(T), relative humidity (RH), and ozone (O3) at ten stations are analysed with 3-hourly model output from the Monitoring
Atmospheric Composition and Climate (MACC) reanalysis for the time period 2007-2012. Using the minimum mean square
error of the T or RH anomalies, we find that the optimum vertical level for the evaluation of the model at mountain stations
(altitude >1000m) is between the surface and the level which corresponds to the actual altitude of the station. At low-
elevation sites, this criterion correctly identifies the surface layer as the optimal layer. Time filtering does indeed affect the
ozone bias; it may be reduced by up to 35%.
Introduction
Since the coarse grid box resolution (~100 km) of global chemistry climate models (CCM) prevents an adequate
representation of mesoscale meteorology such as mountain wave activities, upslope wind, land-sea breeze etc., a variety of
spatio-temporal sampling have been used in order to improve model-data comparison. Schutgens et. al. (2015) emphasised
temporal sampling has a large impact on model evaluation and suggested 3 or 6 hourly data may be more appropriate to
many model evaluation than daily or monthly model data as it is currently common practice. Another significant impact of
the coarse model resolution is poor representation of the true surface elevation. As a result, it is not-trivial to choose the best
vertical model for comparison to data from mountain stations. Consequently, some authors have simply disregarded
mountain sites from their analysis. Others have selected the vertical model level based on the minimum difference between
actual altitude and average grid-cell elevation (e.g. E. Katragkou et al., 2015). This may lead to poor model-data agreement in
some cases, because the model atmosphere might be classified as free tropospheric air, while there can be local boundary
layer influences affecting the measurements at the real station. In this study, T and RH data in hourly resolution is used to
identify the optimum model level for the comparison of chemical composition data.
Methodology and Results Comparison between the anomalies of measured and simulated meteorological
variables such as T and RH is used to select the appropriate vertical model level. It
turns out that the optimum model level for mountain stations will lie between the
surface level and the level which corresponds to the altitude of the station. During
the night time, the optimum model level is located several levels beneath that of
during the day. For surface stations (altitude < 500 m) the optimum level sits at the
surface (See Table 1). In a second step, the meteorological data are used to identify
the time periods when the model captures the meteorological situation well, and is
therefore unlikely influenced by local perturbations and representative for a larger
region on the scale of the model resolution. When this filter is applied, the MSE of
simulated ozone mixing ratios is often reduced regardless of whether T or RH is
used as reference (Table 1). Note that this is not a necessary consequence, because
it is also possible that “bad matches” of meteorological conditions hide true model
errors which then become more apparent if the data are filtered.
Conclusions
The appropriate choices of the vertical model level and the time episodes for model-data comparisons have a considerable
impact on the evaluation of chemistry climate models. Here, we explored the use of highly resolved meteorological
observations to identify the optimum model level and filter the time series data. The results suggest that this meteorological
information is indeed helpful to improve the model evaluation.
Acknowledgement
We acknowledge GAW World Data Center for Greenhouse Gases (WDGCC) at the Japan Meteorological Agency in Tokyo
for their help for providing observation data.
References
Katragkou E., Zanis P., Tsikerdekis A., Kapsomenakis J., Melas D., Eskes H., Flemming J., Huijnen V., Inness A., Schultz
M. G., Stein O., and Zerefos C. S., 2015. Evaluation of Near-Surface Ozone over Europe from the MACC Reanalysis.
Geosci. Model Dev., 8, 2299-2314.
Schutgens N. A. J., Partridge D. G., Stier P., 2015. The Importance of Temporal Collocation for the Evaluation of Aerosol
Models with Observation. Atmos. Chem. Phys. Discuss, 15, 26191-26230
Table1. Relative difference of MSE for ozone after vertical model level
selection and time filtering.

35
DETAILED INVESTIGATION OF TRAFFIC POLLUTION DISPERSION NEAR DENMARKS NO2 HOT-SPOT
M. Ketzel (1), J. Brandt (1), U. Im (1), T.-B. Ottosen (2,3), S.S. Jensen (1), T. Ellermann (1), K.E. Kakosimos (3), M.B.
Poulsen(1) and O. Hertel (1)
(1) Aarhus University, Roskilde, 4000, Denmark; (2) University of Southern Denmark, Odense, Denmark; (3) Texas A&M
University at Qatar, Doha, Qatar
Presenting author email: [email protected]
Summary
This study aims to investigate in details the pollution situation near one of Denmark’s NO2 hot-spots, the monitoring station
at H.C. Andersens Boulevard (HCAB) in Copenhagen. The investigations cover various elements as detailed traffic counts in
each of the 7 traffic lanes; wind speed measurements both at a nearby roof station and inside the street canyon and
measurements at different locations in the street additional to the main monitoring station. Moreover the study contributes to
a further development of the Operational Street Pollution Model (OSPM) that allows handling the inhomogeneous
distribution of the emissions over the various lanes and the positioning of the receptor location further away from the
buildings. The presentation will give an overview of the study and show the main results and conclusions derived from this
comprehensive project.
Introduction
HCAB is a street station in the Danish National Monitoring
Programme and presently the only monitoring station where the
EU limit value for NO2 is exceeded. This exceedance triggered a
lot of interest and research connected with this station. Previously
the Danish EPA funded a measuring campaign over several month
with a parallel station moved about 3 m further away from the
traffic compared to the permanent station (Ellermann et al. 2014).
These parallel measurements indicated a relatively large difference
of 10 µg/m3 (18%) between both locations.
In order to investigate these small scale air pollution gradients in
more details and develop methods to describe these gradients
better with OSPM, a new project has been initiated.
Methodology and Results
The location of the permanent monitoring station at HCAB close
to the 7 traffic lanes is shown in Fig. 1. The here-described
investigation includes the following experimental elements:
Concentration measurements using passive samplers and small
mobile sensors arranged in horizontal profiles along and
perpendicular to street orientation to investigate the gradients in NO2 concentrations
Detailed traffic counts and emission modelling in all 7 driving lanes
Meteorological measurements using sonic anemometers both in the street canon and at the roof top.
Based on these experimental inputs as well as previous work conducted by Ottosen at al. (2015), this project also includes a
further development of OSPM as: the operational implementation of the inhomogeneous distribution of the emissions in-
between different driving lanes and enable a variable horizontal positioning of the modelled receptor point between building
wall and driving lanes in case of very wide sidewalks or bike lanes as shown in Fig.1.
The project results help gain a deeper understanding of the complex dispersion situation near HCAB and key findings of the
various project elements will be presented. The newly implemented features in OSPM give a much better possibility to
describe the measured pollution levels and gradients.
Acknowledgement
This work was supported by DCE-Danish Centre for Environment and Energy at Aarhus University with project funds in fall
2015. The authors are thankful to Copenhagen municipality, especially Åse Boss Henrichsen for the good cooperation and
performing the detailed traffic counts.
References
Ellermann, T, Brandt, J, Jensen, SS, Hertel, O, Løfstrøm, P, Ketzel, M, Olesen, HR & Winther, M 2014, Undersøgelse af de
forøgede koncentrationer af NO2 på H.C. Andersens Boulevard. Aarhus University, DCE – Danish Centre for Environment
and Energy. Scientific Report from DCE - Danish Centre for Environment and Energy, no. 111
Ottosen, T-B, Kakosimos, KE, Johansson, C, Hertel, O, Brandt, J, Skov, H, Berkowicz, R, Ellermann, T, Jensen, SS &
Ketzel, M, 2015. Analysis of the impact of inhomogeneous emissions in the Operational Street Pollution Model (OSPM).
Geosci. Model Dev. 8, 1-14 (in press).
Fig.1 Map of the location of the measuring station H.C. Andersens Boulevard (read arrow) and the 7 traffic lanes
close to it. The cross section for traffic counts is
marked.Table.1. Some of the AQMEII2 models features of the simulations studied ( * simulation without considering
ACIs).

36
MODELLING AND COMPARING THE IMPACT OF THREE SEA SALT EMISSIONS PARAMETERIZATIONS
ON ATMOSPHERIC NITRATE CONCENTRATIONS IN THE NORTH-WESTERN EUROPEAN REGION
D. Neumann (1), V. Matthias (1), A. Aulinger (1), J. Bieser (1,2), and M. Quante (1)
(1) Institute of Coastal Research, Helmholtz-Zentrum Geesthacht, Geesthacht, 21502, Germany; (2) Institute of Atmospheric
Physics., Deutsches Zentrum für Luft- und Raumfahrt (DLR), Weßling, 82234, Germany
Presenting author email: [email protected]
Summary
This study aims to evaluate how strong different sea salt emission parameterizations impact atmospheric nitrate (NO3-)
concentrations in order to access how relevant sea salt emission improvements are for secondary particle formation. For this
purpose three sea salt emission parameterizations were compared in chemistry transport model (CTM) simulations and
compared against EMEP measurements. It was found that none of the considered parameterizations generally improved
predicted NO3- compared to measurements. Commonly, the presence of sea salt should decrease NO3
- concentrations.
Unexpectedly, one parameterization led to an increase in NO3- compared to the situation without sea salt.
Introduction
Sea salt particles contribute considerably to total particle mass in coastal regions offering surface for condensation of air
pollutants, such as nitric acid (HNO3). Therefore, sea salt needs to be considered in air quality model studies in coastal
regions. In some regions, HNO3 condensation primarily depends on the availability of sea salt (Im, 2013). The target of this
study is to evaluate the impact of different sea salt emission parameterizations on nitrate (NO3-) in North-western Europe.
Materials and Methods
The Community Multiscale Air Quality (CMAQ) Modeling System v5.0.1 was
employed for the study. Sea salt emissions are parameterized by Gong (2003) and are
enhanced in the surf zone. In this study, sea salt emissions were updated by a salinity
dependence. The model was run for each two month in winter and summer 2008.
Below, GO03 and ZERO denote runs with standard and no emissions, respectively.
Two additional sea salt emission parameterizations SP13 (MA03/MO86/SM93 of
Spada et al. (2013)) and OV14 (Ovadnevaite et al., 2014) have been implemented.
Modelled NO3-+HNO3 (SNO3) data were evaluated against daily EMEP
measurements. The sum is compared because three-filter packs were employed at some EMEP stations. Mean normalized
bias (MNB), Spearman’s correlation coefficient (R), and the relative difference to the ZERO case were calculated (Δzero =
(µcase - µzero)/µzero). The two presented stations (two of 18 considered ones) are located on an island (DK05) and inland (DE07).
Results and Discussion
SNO3 correlates better at DK05 than at DE07. The impact of the emission case
on R is low. OV14 case commonly produces the highest MNB. SNO3 is
underestimated at DK05 and slightly overestimated at DE07. The
underestimation at DK05 is probably caused by lack in NOX emissions.
We expected less SNO3 in the presence of sea salt because coarse particle mass
is dominated by sea salt and coarse particle depose faster than fine ones.
However, SNO3 concentrations of OV14 exceeded those of ZERO (Δzero > 0).
We assume that the dry deposition velocity of OV14 coarse particles is lower
than expected due to relatively small coarse particle fraction (Fig. 1).
Conclusions
None of the three compared sea salt emission parameterizations led to generally better predicted SNO3 concentrations. In the
OV14 case, SNO3 concentrations are commonly higher than in the GO03 and SP13 cases because of a lower dry deposition
velocity. The OV14 concentrations are even higher than ZERO concentrations which was unexpected. From this result we
conclude that sea salt does not generally reduce atmospheric nitrate concentrations but that the impact depends on the size
distribution. Therefore, size resolved sea salt particle emissions need to be further assessed in further studies.
Acknowledgement
We acknowledge discussion with Matthias Karl, Anna Backes, Jan Arndt (all HZG), Uma Shankar, James Kelly, and Brett
Gantt (all U.S. EPA). EMEP data was extracted from the NILU’s EBAS database. Data evaluation was performed with R.
References
Gong S.L., 2003. A parameterization of sea-salt aerosol source function for sub- and super-micron particles. Global
Biogeochem. Cycles. 17, 7ff.
Im U., 2013. Impact of sea-salt emissions on the model performance and aerosol chemical composition and deposition in the
East Mediterranean coastal regions. Atmos. Environ. 75, 329 – 340.
Ovadnevaite J., Manders A., de Leeuw G., Ceburnis D., Monahan C., Partanen A.-I., Korhonen H., O’Dowd C.D., 2014. A
sea spray aerosol flux parameterization encapsulating wave state, Atmos. Chem. Phys. 14, 1837–1852.
Spada M. et al., 2013. Modeling and evaluation of the global sea-salt aerosol distribution: sensitivity to size-resolved and sea-
surface temperature dependent emission schemes. Atmos. Chem. Phys. 13, 11735-11755
Tab.1 Stat. SNO3 data (summer 2008). MNB is
given in µg/m3. Δzero denotes (µcase - µzero)/µzero.
Fig.1 Sea salt emission parameterizations
Case MNB R Δzero
DE
07 GO03 0.04 0.39 -10.5%
SP13 0.09 0.40 -6.4%
OV14 0.23 0.44 6.3%
ZERO 0.16 0.41 0.0%
DK
05
GO03 -0.30 0.57 -11.9%
SP13 -0.27 0.57 -8.5%
OV14 -0.18 0.59 3.7%
ZERO -0.20 0.58 0.0%

37
HOW TO ENSURE HIGH QUALITY PREDICTIONS OF DISPERSION MODELS IN HIGH COMPLEX
TERRAIN? – A GUIDELINE FOR RANKING MODEL’S PERFORMANCE
R. Petrik (1), K.H. Schlünzen (1), D. Öttl (2) and T. Flassak (3)
(1) Meteorological Institute, University of Hamburg, Hamburg, Germany; (2) Government of Styria, Section Air Quality
Control, Graz, Austria; (3) LOHMEYER Consulting Engineers, Karlsruhe, Germany
Presenting author email: [email protected]
Summary
Our investigation aims to establish quality criteria for high-resolution models to ensure a realistic dispersion calculation in
high complex terrain. Evaluation data sets were identified, which mainly fulfill the demands on data quality and spatial
density. Various models with different complexity used for scientific as well as consultant purposes were evaluated with
respect to the near surface atmospheric fields. Simple error measures reveal a clear separation between high complex models
and less complex low order models, which are not able to properly simulate the atmospheric processes in the planetary
boundary layer. The application of a kind of bootstrap analysis helped to derive evaluation criteria for the different evaluation
data sets. This study shows that a careful model error analysis is required for calm wind conditions.
Introduction and Objectives
A prerequisite for air quality assessments are reliable measurements and high quality tools for dispersion calculations.
However, considering model applications used to prepare certificates for future planned industrial sites or factories, there are
no well-defined quality criteria or evaluation strategies out there in the German-speaking region. In particular in regions with
complex and steep terrain high quality simulations with high resolutions are needed to guarantee a dispersion modeling of
industrial pollutants as realistic as possible. Therefore, we aim to examine and derive evaluation criteria and strategies for
consultant-applied models which are going to be part of industrial standards and guidelines.
Methodology and results
The main challenges in establishing quality criteria for models running on a resolution of about 100 meter are first, the
identification of proper evaluation data providing a high-density observational network and reliable measurements in
particular with respect to wind direction, wind speed and temperature. Second, synoptic situations favoring the high load of
pollutants within the planetary boundary layer have to be investigated with respect to model forcing, considering also an easy
to use handling for consultant companies. Four different data sets remained as candidates for an evaluation suite: a
postfrontal flow around an isolated hill (Sophienhöhe, Germany), the establishment of a counter-flow in the Graz basin
(Austria) in winter time (Öttl, 2000), drainage flows in
the Stuttgart basin (Germany) in spring time (Figure 1)
and the flow in the Sochi region at the Southern
Caucasus. Qualitative and quantitative criteria were
developed for each test case. Due to small sample sizes
the quantitative evaluation has to be restricted to simple
measures AME and RMSE. Moreover, for calm wind
conditions meandering effects has to be considered for
the error calculation. Evaluation of various models with
different complexity reveals that the error characteristics
for the near winds is different for the most sophisticated
mesoscale models compared to less sophisticated low
order models. Due to the application of a kind of boot-
strap analysis a threshold is derived for each test case,
which allows for a separation between ’good’ models
and ’bad’ models. The ‘acceptable’ model error turns
out to be test case specific, but, for instance, the AME
is often below 1 m/s in wind speed and below 20° in
wind direction.
Conclusions
High-quality and high-density measurement networks are rare but essential for the evaluation of models in high complex
terrain. The small amount of measurements sites often allows only for the usage of simple evaluation measures. However,
general methods may be used to find evaluation criteria (thresholds) appropriate for each individual measurement data set,
but more reference data sets are needed to further examine such a generalized method proposed here.
Acknowledgements
This work was supported by the German Association of Engineers and funded by the Federal Environmental Agency of
Germany. We acknowledge the experts providing a thorough insight into the measurement campaigns.
References
Öttl, D. and Almbauer, R.A. and Sturm, P.J. and Piringer, M.; and K. Baumann: Analyzing the nocturnal wind field in the
city of Graz, Atmos. Environ. 35 (2000), pp. 379-387
Figure 3: Temperature and flow field simulation for the test case
Stuttgart (Germany)

38
POLLUTED EVENTS OVER ASIAN CITIES: VALIDATION, SOURCE RECEPTOR TEST AND FIRST
RESULTS.
M. Pommier1, M. Gauss1, H. Fagerli1, A. Nyiri1, P. Wind1and A. Benedictow1
(1) Norwegian Meteorological Institute, Oslo, Norway
Presenting author email: [email protected]
Summary
This study aims to evaluate the EMEP MSC-W chemical transport model (CTM) in simulating high pollution events over
cities in Asia. This work is the first attempt to use the EMEP CTM with a fine horizontal resolution (0.1°×0.1°) over Asia and
to simulate the pollution over urban regions. The first part of the work has been to focus on the evaluation of the EMEP CTM
with measurements from different platforms (satellite, ground-based, in situ) and to identify the biases or the errors in the
simulation. This evaluation is important in order to establish the capabilities of the model to identify air pollution sources.
Sensitivity of the simulations to emissions over the test cities (Delhi, Beijing, Shanghai and Guangzhou/Honk Kong/Macau)
is also presented.
Introduction
The EMEP MSC-W chemistry transport model (Simpson et al., 2012) has been used for decades to calculate source-receptor
relationships between European countries (including Russia). Since 2010 MET Norway has been involved in regional source-
receptor calculations in forecast mode for the European FP7 and H2020 projects MACC-II and MACC-III. Currently, this
type of calculations is done operationally for 6 European cities on a weekly basis (see http://macc.copernicus-
atmosphere.eu/services/aqac/policy_interface/regional_sr/ for more information and results). For the European FP7 project
PANDA, the method has been applied to Chinese agglomerations. The model resolution is 0.1°×0.1°, using ECMWF IFS
meteorological data and HTAPv2 (0.1°×0.1°) emissions.
Methodology and Results
The first objective of our work is to evaluate our simulations
with measurements and to analyze how sensitive our
simulations are to emissions sources. For this work we
collected different datasets for different years.
For example, the US administration provides surface PM2.5
measurements over their embassy and their consulates. In
total, there are measurements over 4 stations: Beijing,
Chengdu, Guangzhou and Shanghai. Fig. 1 presents the time
series for 2012 over Beijing. The figure shows that the model
is able to capture the levels and the temporal variation of
surface concentrations during this selected year, although
some deviation is recognized (probably related to the
relatively coarse resolution of the model with respect to point
measurements and the lack of NRT emission data).
Fig. 1 Daily PM2.5 surface concentrations over Beijing from
Jan 2012 to Dec 2012. The blue curve represents the EMEP simulations and the measurements are plotted in red. The
correlation coefficient and the mean bias are also provided. The shade error bar corresponds to the standard deviation.
A test of source-receptor calculations for 4 different cities (Delhi, Beijing, Shanghai and Guangzhou) was also performed. In
this study we were interested by 2 months: January and July. For this evaluation, all emissions over each city were reduced
by 15%. A similar reduction was also done in another simulation for all emissions except over the cities. Both simulations
(reduction over the city and reduction everywhere except over the city) were compared separately to the base run that
included all emissions. These tests highlighted the large impact of local sources and surrounding environment on pollution
levels over the Asian cities. For example Guangzhou is twice more influenced by the reduction of the emissions inside the
city for PM10 than Beijing in July. Each Chinese city presents a small increase of their surface O3 concentrations after
reduction of all the emissions inside the cities.
Conclusions
The EMEP CTM allows reliable simulations of air pollution events, and in the future we could use the model to forecast this
surface pollution.
Acknowledgement
The research leading to these results has received funding from the European Union’s Seventh Framework Program under
Grant Agreement no. 606719 (PANDA).
Reference
Simpson D., Benedictow A., Berge H., Bergström R., Emberson L. D., Fagerli H., Flechard C. R., Hayman G. D., Gauss M.,
Jonson J. E., Jenkin M. E., Nyiri A., Richter C., Semeena V. S., Tsyro S., Tuovinen J.-P., Valdebenito A., Wind P., 2012.
The EMEP MSC-W chemical transport model – technical description, Atmos. Chem. Phys., 12, 7825–7865.

39
MODELLING NO2 CONCENTRATION USING CFD-RANS MODEL WITH HIGH RESOLUTION TRAFFIC
EMISSIONS
B. Sanchez (1), JL Santiago (1), F. Martin (1), A. Martilli (1), E. Rivas (1), R. Borge (2), C. Quaassdorff (2) and D. de la Paz (2) (1) 1Air Pollution Division, Environmental Department, CIEMAT, Madrid, Spain; (2) Laboratory of Environmental Modelling,
Technical University of Madrid (UPM), Madrid, Spain
Presenting author email: [email protected]
Summary
The aim of this work is to obtain high resolution maps of average pollutant concentration for a large period (several weeks) in
real urban areas. To achieve this purpose, several meteorological scenarios are simulated by using CFD-RANS model taking
into account high resolution emissions, the aerodynamical effects of vegetation and urban morphology. This study is focused
on an urban area of Madrid (Fernández Ladreda square) where high NO2 concentration values are registered. An intensive
experimental campaign was carried out with a large number of passive samplers distributed around the square. These
measurements are used to validate the modelling results.
Introduction
High resolution maps of average concentration over a large period of time are necessary for air quality management and the
assessment of abatement measures. The Computational Fluid Dynamics (CFD) models are able to simulate airflow and
pollutant dispersion with very high resolution (~1m). However, due to computational loads, it is not possible (within a
reasonable CPU time) to run an unsteady CFD simulation of several weeks or months. The solution proposed (Santiago et al.,
2013) is to run only a set of scenarios (corresponding to 16 wind directions) using steady CFD-RANS simulations. In this
study, this methodology is applied to a complex urban area using emissions from a very detailed microscale traffic and
emission model. This is an important issue because according to previous source contribution analysis, NO2 ambient
concentration levels in the innermost area of Madrid are strongly dominated by road traffic (Borge et al., 2014).
Methodology and Results
The size of the study area (Fig 1.) is 1km x 1km. The modelling domain comprises one tunnel, several kinds of vegetation
and several streets with high traffic intensity. Emissions used to feed the CFD-RANS model cover a 300m x 300m around the
square with a resolution of 5 m. Twelve emission scenarios corresponding to different traffic patterns for different periods of
the day and days of the week are considered in this study. The final map of average concentration is made by means of a
combination of the simulated scenarios
considering concurrent wind patterns within
the period analysed. Pollutant concentration is
computed assuming i) non-reactive pollutants
and ii) thermal effects negligible in
comparison with dynamical effects. As a
consequence tracer concentration at a certain
hour depends only on emissions, background
pollution and wind speed at that hour (no
memory between one hour and the following
one). In addition, the dynamic effects of
vegetation are included in CFD simulations
assuming the trees as a porous medium
(Santiago et al., 2013). It should be noted that
the period simulated in this study correspond
to winter conditions (February 2015), where
the pollutant concentrations are less affected
by atmospheric chemistry and thermal effects
are negligible. The methodology is assessed
using experimental data from 200 passive
samplers distributed around the square.
Conclusions
A high resolution emission model has been satisfactorily implemented in the CFD-RANS model. The results obtained with
this methodology are in agreement with experimental measurements of the campaign.
Acknowledgement
This study has been supported by the project TECNAIRE (S2013/MAE-2972) funded by The Regional Government of
Madrid.
References
Borge, R, Lumbreras, J, Pérez, J, de la Paz, D, Vedrenne, M, de Andrés, JM, Rodríguez, ME, 2014: Emission inventories and
modeling requirements for the development of air quality plans. Application to Madrid (Spain). Science of the Total
Environment 466-467, 809-819.
Santiago JL, Martín F, Martilli A, 2013: A computational fluid dynamic modelling approach to assess the representativeness
of urban monitoring stations. Science of the Total Environment 454-455, 61-72.
Fig1. Real geometry, computational domain and pollutant distribution for SE wind direction

40

41
ENVIRONMENTAL AND HEALTH IMPACT RESULTING
FROM AIR POLLUTION

42

43
ENDOTOXIN IN AIR VERSUS DUST: COMPARISON BETWEEN AMBIENT FARMING ENVIRONMENT AND
INDOOR HOME ENVIRONMENT
A. Adhikari
Department of Environmental Health Sciences, Jiann-Ping Hsu College of Public Health, P.O. Box: 8015, Georgia Southern
University, Statesboro, Georgia 30460, U.S.A.
Presenting author email: [email protected]
Summary
This study aims to investigate the relationship between airborne endotoxin and farm soil-dust or indoor house-dust borne
endotoxin present in total inhalable particles and particles of different size ranges. Good correlation was observed between
dustborne endotoxin and airborne endotoxin in indoor home environment, however, significant correlation was lacking in
ambient farming environment. Although levels of aerosolizable endotoxin in farm soil dust were relatively stable, airborne
concentration of endotoxin differ a lot probably due to different farming activities including spraying of pesticides and
spraying of water in farms.
Introduction
Endotoxin is a cell wall component of Gram-negative bacteria and is composed of lipopolysaccharides as a main ingredient.
Inhaled endotoxin contributes significantly to the induction of airway inflammation and dysfunction. Many studies in
occupational environments including farming environments have shown positive associations between endotoxin exposure
and different types of respiratory disorders, including asthma-like symptoms, chronic airway obstruction, bronchitis,
byssinosis, and elevated airway responsiveness. Endotoxin exposure in various work environments has also been recognized
as a causative factor in the etiology of occupational lung diseases, such as non-allergic asthma and organic dust toxic
syndromes. Low level exposures to endotoxins stimulate the immune system and are believed to play a role in its appropriate
development. However, high concentration of endotoxin, usually anticipated in moisture damaged homes, can act as irritant
and very high inhalation exposure can cause a flu-like illness that includes fever and difficulty in breathing. Airborne
particulate matter in both indoor and outdoor environment carry a significant amount of endotoxin. Both airborne and dust
borne endotoxin levels should be characterized to understand the exposure routes for inhalable endotoxin and adequate
information is unavailable on this research topic, particularly in ambient farming environment.
Methodology and Results
Endotoxin in aerosolizable soil dust of agricultural farms and floor dust of houses were analysed. Aerosolizable soil dust
from farms were collected by using a microbial source tester or FSSST. The FSSST is an inexpensive and portable device
which was found suitable for aggressive sampling of releasing potentially aersolizable fungal spores, endotoxin, and (13)-
β-D-glucan from various contaminated sources. The FSSST sampling unit is a closed aerosolization chamber, equipped with
two pumps that are tightly placed on the farm ground during aerosolization tests. A push vacuum pump produce an airflow
that pass through a HEPA filter. The incoming air flow directed through the 112-orifice stage at the bottom of the device,
create air jets toward the contaminated surface. The dust aerosolized by the air jets were collected into a filter in a cassette
connected at the sampling line operated by a pull vacuum pump. The process inside the FSSST cap simulated the release of
aerosolizable endotoxin from the farm ground surface in worst case scenario, with their subsequent immediate collection.
Dust samples from homes were collected with a vacuum cleaner at a flow rate of 800 l/min. A custom-made cone-shape
HEPA filter trap with a collection efficiency exceeding 95% for particles larger than 0.3 μm was attached to the nozzle of the
vacuum cleaner to collect the dust sample. For carpeted floor, dust samples were collected from an area of 2 m2 at a
vacuuming rate of 2 min/m2. For non-carpeted floor, the entire floor of the selected room was vacuumed at the rate of 1
min/m2. Large dust particles were removed by sieving and the resulting dust was stored at −20 °C before analyses. Air
samples were collected with a combination of Button Inhalable Sampler (for total inhalable particles) and the NIOSH two-
stage cyclone sampler for estimating inhalable and size-selective exposure levels for endotoxin. This approach significantly
improved the current air sampling protocols for endotoxin. Endotoxin in all sample extracts obtained from two types of dust
samples, the Button Sampler, and NIOSH two stage cyclone sampler were analysed using the endotoxin-specific kinetic
chromogenic LAL-assay (Pyrochrome, Associates of Cape Cod, East Falmouth, MA). Dust samples were extracted in
pyrogen-free sterile water by sonication and intermittent shaking followed by centrifugation. Supernatants were collected and
analysed. Similarly, filter extracts and tube extracts from air samplers were analysed for endotoxin. In brief, pyrogen free
water plus 0.05% Tween 20 were added to extracts, vortexed for 1 h, and aliquots of 25 µL were transferred to 96 microwell
plates. After adding specific Pyrochrome reagent the absorbance and kinetics of color reactions were studied by a Microplate
Reader at 405 nm. Endotoxin concentration levels were calculated as endotoxin units (EU/m3 and EU/mg). Correlations
between endotoxin in dust versus air in home environments were significant with respect to concentration (EU/m3; r = 0.325;
p = 0.036) and loading on floor surfaces (EU/m2; r = 0.311; p = 0.045), however, similar significant correlations were lacking
in farming environment between the endotoxin levels in aerosolizable soil dust versus airborne concentrations (p > 0.05),
although both measurements were conducted in parallel.
Conclusions
Determinants for airborne and dusts borne endotoxin exposure levels in indoor home environments are similar, however for
an ambient farming environment these determinants are too diverse and probably soil dust is not a major source for airborne
endotoxin in farming environments.
Acknowledgement
This work was supported by the US HUD Grant No. OHLHH0199-09 and NIH/NIEHS Grant No. R21ES017316. I
acknowledge Reshmi Indugula, Christopher Schaffer, and Eric Kettleson for their help during sampling and/or analysis.

44
EXPOSURE TO PARTICULATE MATTER AND CHRONIC OBSTRUCTIVE PULMONARY DISEASE IN THE
CITY OF NOVI SAD, REPUBLIC OF SERBIA
S. Bijelovic (1,2), N. Dragic (1,2), M. Arsic (2), T. Popovic (3)
(1)University of Novi Sad, School of Medicine, Republic of Serbia;(2) Institute of Public Health of Vojvodina (IPHV),
Republic of Serbia; (3)Republic Hydrometeorological Institution of Serbia (RHIS)
Presenting author email:[email protected]
Summary
The objective was to examine the relationship between the concentration of particulate matter with 10 or less microns in
diameter (PM10) and hospital admissions (HA) for Chronic Obstructive Pulmonary Disease (COPD) in the City of Novi Sad,
Republic of Serbia (NS). Epidemiological time series approach was applied throughout 3 year’s period (2011 - 2013).
Poisson regression model adjusted with temperature (T), relative humidity (RH), years (Y), seasons (S) and weekends (W)
was used for statistical analysis. The results showed significantly positive association between mean daily PM10
concentration and daily number of COPD HA, in a way that 10μg/m3 increment of PM10 increases COPD HA by 6%.
Introduction
There is a large body of evidence of the effects of short-term exposure to PM10 on human health (1). According to World
Health Organization (WHO) 3.7 million deaths were attributable to ambient air pollution in 2012 (2). The objective of the
study was to examine the association between PM10 and HA for COPD.
Methodology and Results
The epidemiological time series approach for the period 1st January 2011 - 31st December 2013 was used. The mean PM10
concentration at each day was regressed to number of HA for COPD (ICD10: J44) at the same day, with confounding factors:
values of T and RH, Y, S and W. The data of the daily PM10, T and RH values were provided by RHIS, while the data of
daily COPD HA were provided by IPHV. Poisson regression processed by SPSS software (Version 21) was used.
Statistically significant coefficient for the PM10 at a 5% level was accepted as evidence of association. The results were
expressed as a RR with the 95% Confidence Interval (95%CI) for quantifying the increase/decrease of the risk for HA, based
on a corresponding daily 10 μg/m3 increment of PM10 over the entire study period.
Throughout observed period 875 HA caused by COPD were registered with average daily number 0.79±0.99 (Table 1). The
mean PM10 was 35.71μg/m3±22.91 μg/m3, average value of T and RH was 12.110C±9.110C and 69.51%±16.29%,
respectively. Poisson regression (Table 2) showed that mean daily PM10 were positively associated with COPD HA
(p=0.003). Average daily number of COPD HA increase by 6% for each 10μg/m3 increment of PM10 (RR=1.006; 95%CI:
1.002 - 1.009).
Table1. Descriptive statistics of COPD HA, PM10 and the meteorological data in the NS, throughout study period (2011-
2013)
Average Std. Deviation Minimum Maximum
COPD (n=875) 0.79 0.99 0.00 5.00
PM10 (μg/m3) 35.71 22.91 0.85 148.36
Temperature (0C) 12.11 9.11 -18.00 30.00
Relative humidity (%) 69.51 16.29 23.00 98.00
Table 2. Adjusted RR* estimates and 95% CI for COPD admissions associated with PM10 concentrations in NS
Pollutant β coefficients
95% Confidence Interval for β
p Value RR Lower Bound Upper Bound
PM10 0.003 0.156 1.006 1.002 1.009
Temperature -0.001 0.036 0.999 0.998 1.000
Relative humidity -0.007 0.010 0.993 0.987 0.998
*Poisson regression model adjusted with years, seasons and weekends
Conclusion Association of mean daily PM10 concentrations, even they were well below WHO guideline values, and daily COPD HA
among person aged 18+ in the NS in the period 2011-2013 represents public health problem and suggests further
multidisciplinary preventive action.
References
1. Mészáros D, Markos J, FitzGerald DG, et al. An observational study of PM10 and hospital admissions for acute
exacerbations of chronic respiratory disease in Tasmania, Australia 1992–2002. BMJ Open Resp Res 2015;2:e000063.
doi:10.1136/bmjresp-2014-000063
2. Burden of disease attributable to outdoor air pollution for 2012. Geneva (Switzerland): World Health Organization, 2014

45
REDUCTION IN MORTALITY PARALLELS DECREASE IN PM10 EXPOSURE, LOMBARDY (ITALY)
M. Carugno (1), D. Consonni (2), P.A. Bertazzi (1,2), A. Biggeri (3,4), M. Baccini (3,4)
(1) Department of Clinical Sciences and Community Health, Università degli Studi di Milano, Milan, 20122, Italy; (2)
Epidemiology Unit, Department of Preventive Medicine, Fondazione IRCCS Ca’ Granda - Ospedale Maggiore Policlinico,
Milan, 20122, Italy; (3) Department of Statistics, Informatics and Applications “G. Parenti,” University of Florence,
Florence, 50134, Italy; (4) Biostatistics Unit, Cancer Prevention and Research Institute (ISPO), Florence, 50139, Italy.
Presenting author email: [email protected]
Summary
Concentration of particulate matter with aerodynamic diameter ≤ 10µg/m3 (PM10) has been decreasing over the last years in
Lombardy. Annual deaths attributable (AD) to PM10 exceeding the WHO 20µg/m3 threshold for PM10 annual average were
302.4 in 2003-2006 and dropped to 162 in 2014. The reduction in PM10 concentrations over time halved the number of ADs.
Introduction
In the last ten years, the concentration of PM10 in the Lombardy region has been gradually decreasing
(http://www2.arpalombardia.it/sites/QAria/_layouts/15/QAria/Inquinanti.aspx). Such a reduction is most likely due to
combined effects of climatic variations, implementation of policies for air quality control and the economic crisis affecting
volumes of road traffic and industrial production. Taking the cue from the health impact assessment performed by Baccini et
al. (2011) on the main cities of Lombardy in the period 2003-2006, we evaluated how the mortality burden due to PM10
varied when considering its concentrations in 2014.
Methods and Results
Since we considered a short calendar period, we assumed our study population and its mortality rates to be constant over
time. We also assumed that the effect of PM10 on mortality did not change and we used the same a posteriori city-specific
concentration-response functions (CRF) of Baccini et al. 2011. PM10 annual average concentrations for 2014 were acquired
from the air quality monitoring network of the Lombardy Regional Environmental Protection Agency. We considered air
pollution and natural mortality data for 13 areas: 11 cities with more than 50,000 inhabitants, 1 smaller alpine town
(Sondrio), and the agricultural administrative district of Lodi. The impact of air pollution on mortality was quantified in terms
of the number of deaths attributable (AD) to exposure levels exceeding the threshold of 20µg/m3 for PM10 annual average
(WHO Air Quality Guidelines, 2005). ADs per year were calculated for the periods of interest (𝑝1= 2003-2006, 𝑝2 = 2014). We then focused on the difference between AD𝑝1
and AD𝑝2 to quantify the variation of the mortality burden between the two
periods (Δ𝐴𝐷). The attributable community rate (ACR, Steenland and Armstrong, 2006) per 100,000 inhabitants was also
calculated for each area and period as well as its difference between the two periods (Δ𝐴𝐶𝑅). Results are reported in the table.
Study Area Population
(2007)
PM10 in 𝒑𝟏
(µg/m3)
PM10 in 𝒑𝟐
(µg/m3) CRF
𝐀𝐃𝒑𝟏(𝐀𝐂𝐑𝒑𝟏
)
𝐀𝐃𝒑𝟐(𝐀𝐂𝐑𝒑𝟐
) 𝚫𝑨𝑫 (𝚫𝑨𝑪𝑹)
𝚫𝑨𝑫 80%
Credibility Int.
Bergamo 115,781 46.1 26.0 0.33 10.2 (8.8) 2.3 (2.0) 7.9 (6.8) -3.4 ; 19.1
Brescia 189,742 49.4 31.3 0.13 4.7 (2.5) 1.8 (0.9) 2.9 (1.5) -9.8 ; 15.9
Busto Arsizio 80,633 44.7 26.0 0.27 4.6 (5.7) 1.1 (1.4) 3.5 (4.3) -3.3 ; 10.2
Como 83,175 43.6 25.0 0.30 5.7 (6.8) 1.2 (1.4) 4.5 (5.4) -3.3 ; 12.2
Cremona 71,998 53.5 32.0 0.25 6.4 (8.9) 2.3 (3.2) 4.1 (5.7) -5.1 ; 13.6
Lecco 47,325 38.4 19.0 0.18 1.6 (3.4) 0.0 (0) 1.6 (3.4) -3.9 ; 7.3
Lodi district 219,670 52.6 33.0 0.32 19.9 (9.1) 8.1 (3.7) 11.8 (5.4) -4.1 ; 28.9
Mantova 47,649 50.6 33.0 0.34 5.6 (11.7) 2.4 (5.1) 3.2 (6.7) -1.8 ; 8.5
Milan 1,299,633 52.5 36.0 0.63 231.3 (17.8) 115.3 (8.9) 116.0 (8.9) 65 ; 176
Pavia 70,207 44.4 33.0 0.29 5.2 (7.4) 2.8 (4.0) 2.4 (3.4) -2.2 ; 7.3
Sondrio 22,214 42.8 20.0 0.28 1.2 (5.4) 0.0 (0) 1.2 (5.4) -1.4 ; 3.9
Varese 82,037 29.6 25.0 0.40 3.0 (3.7) 1.6 (2.0) 1.4 (1.7) -0.6 ; 3.6
Vigevano 60,738 42.2 31.0 0.24 3.0 (4.9) 1.5 (2.5) 1.5 (2.5) -1.9 ; 5.1
Total 2,390,802 - - 0.30 302.4 (12.6) 140.4 (5.9) 162.0 (6.8) 24.2 ; 311.6
Conclusions
The observed reduction in air pollution concentrations over time halved the number of attributable deaths. The WHO
threshold for PM10 annual average is still far from being met in most of the cites, and appropriate policies for emission
reduction could still have a large beneficial effect on population health.
References
Baccini M., Biggeri A., Grillo P., Consonni D., Bertazzi P.A., 2011. Health impact assessment of fine particle pollution at the
regional level. Am. J. Epidemiol. 174(12), 1396-405.
Steenland K., Armstrong B., 2006. An overview of methods for calculating the burden of disease due to specific risk factors.
Epidemiology. 17(5), 512-9.
World Health Organization, 2005. Air Quality Guidelines: Global Update 2005. Particulate Matter, Ozone, Nitrogen Dioxide
and Sulfur Dioxide. WHO: Geneva, Switzerland. (http://www.euro.who.int/__data/assets/pdf_file/0005/78638/E90038.pdf).

46
Figure 1. Annual mean BC concentrations due to local emissions in
Stockholm County in 2011.
SECTORIAL CONTRIBUTIONS TO AMBIENT PM CONCENTRATIONS IN STOCKHOLM AND ESTIMATED
PREMATURE MORTALITY DUE TO BLACK CARBON EXPOSURES
K. Eneroth (1), A. Engström Nylén (1), L. Burman (1) and C. Johansson (1, 2)
(1) Environmental and Health Protection Administration, Stockholm, Sweden, (2) Atmospheric Science Unit, Department of
Analytical Chemistry and Environmental Sciences, Stockholm University, Stockholm, Sweden
Presenting author email: [email protected]
Summary
We have modelled annual mean PM10, PM2.5, PM-exhaust and Black Carbon (BC) concentrations and exposures 1990-2011
from different sources at between 35 and 500 meter resolution to be used in epidemiological studies and health impact
assessments. For the city of Stockholm the population weighted BC was 0.75 µg m-3 due mainly to road traffic and
residential biomass combustion. Applying a relative risk of premature mortality of 6% per µg m-3 we estimate that local
emissions of BC in 2011 causes about 400 premature deaths per year in Stockholm.
Introduction
Of ambient air pollutants, PM exposure is considered to be most important for adverse health effects, but evidence is not
conclusive on which particulate characteristics or sources that are responsible for the effects. Recent epidemiological studies
indicate that associations between adverse health effects is
stronger for BC than PM2.5 (Janssen et al., 2011). In this
study we have performed dispersion calculations of annual
mean concentration of PM due to local emission from
several sectors in Stockholm County. We compare
estimated premature mortalities associated with PM
exposures using published relative risk factors.
Methodology and Results
We have developed local emission inventories of PM10,
PM2.5, PM-exhaust and black carbon (BC) for road traffic,
sea traffic, residential heating (including leisure firing) and
energy production in Stockholm County for the years
1990, 1995, 2000, 2005 and 2011. For road traffic the
emissions consists of both vehicle exhaust and non-
exhaust particles generated during wear of brakes, tyres
and road surface. Using a Gaussian dispersion model
urban background concentrations at roof-top level in built-
up areas and a street canyon model annual mean
concentrations of PM10, PM2.5, PM-exhaust and BC were
calculated at a spatial resolution of between 35 – 500
meters. Generally, road traffic non-exhaust particles is the
dominating source of PM10 and PM2.5 in Stockholm
County, but e.g. in rural areas combustion particles from
residential heating and leisure firing can constitute the
largest local source. For BC, emissions from road traffic is
somewhat more important than emissions from residential
heating when it comes to population exposure. The
emissions from sea traffic contribute little to the overall
PM exposure due to the location of the emissions in
relation to the residents.
We have also calculated the excess number of premature deaths associated with exposure to locally emitted PM based on
population weighted concentrations for the city of Stockholm in 2011. Assuming a relative risk of 6% per 1 µg BC m-3 and
using our population weighted mean concentration due to local sources of 0.75 µg m-3 we obtain approximately 400
premature deaths per year due to BC emissions. This is compared to the mortality associated with PM10 and PM2.5.
Conclusions
Exposure calculations of PM10, PM2.5, PM-exhaust and BC for different source sectors in Stockholm County show that road
traffic and residential heating are the dominating sources. Population exposure of BC due to local emissions is estimated to
cause 400 premature deaths per year.
Acknowledgement
This work is part of the Swedish Clean Air and Climate research program (SCAC) financed by the Swedish Environmental
Protection Agency.
References
Janssen et al., 2011, Black Carbon as an Additional Indicator of the Adverse Health Effects of Airborne Particles Compared
with PM10 and PM2.5. Environmental Health Perspectives, 119, 1691-1699.

47
CHILDREN EXPOSURE TO AIR POLLUTANTS IN INDOOR OF PRIMARY SCHOOLS RETROSPECTIVE AIR
QUALITY SIMULATION TO SUPPORT EPIDEMIOLOGICAL STUDIES
S. Finardi (1), G. Calori (1), A. D’Allura (1), P. Radice (1), G. Brusasca (1)
(1) ARIANET Srl, Via Gilino 9, 20128 Milano, Italy
Presenting author email: [email protected]
Summary
Past air quality conditions in Lombardia Region have been to be reconstructed to support epidemiological investigations
concerning lung cancer. A correct evaluation of long term exposure to air pollution is important to estimate its effects on
pathologies characterised by long latency. During the latest decades Milan area experienced a relevant decrease of pollutants
concentration that does not allow to consider present air quality representative for past air pollution conditions. Air pollution
levels have therefore been reconstructed using air quality modelling, with an approach suitable to produce results comparable
with present air quality assessments. Hourly and long term average concentrations have been compared with the available
measurements for year 1990, and with air quality analyses for 2000 and later years to set in evidence the decrease of
concentrations and their space distribution variation.
Introduction
The health impact of air pollution has often been analysed using available air quality measurements. More recently, the space
distribution of pollutants concentration has been taken into account using different modelling techniques, e.g. land use
regression models and deterministic air quality models. These analyses usually refer to the latest years, due to the availability
and space coverage of the monitoring stations. Recently the International Agency for Research on Cancer (IARC) has
classified outdoor air pollution as carcinogen (Straif et al., 2013). Due to its long latency, the occurrence of cancer can be
related to the subject exposure to air pollution during his lifetime. A correct evaluation of exposure should be therefore based
on past concentration levels. Milan and the other cities in Lombardia Region experienced a dramatic reduction of pollutants
concentration from the seventies to the beginning of the present century, making extrapolations from present values not
feasible. Aside of the concentrations values, their space distribution is expected to be modified by the urban growth in the
city suburbs and deindustrialization processes.
Methodology and Results
Even if Lombardia Region is one of the areas with longer
monitoring records in Italy, PM10 started to be routinely
measured in 1998 and before that date only a very limited
number of TSP measurements were available. Even the number
of stations measuring NO2 and O3 in 1990 was much smaller
than the present one, and wide areas of the Region were not
covered. Therefore, the reconstruction of past air quality can
hardly be based only on measurements due to the limited
number and the sparseness of available observations. The
national emission inventory has data disaggregated at Province
level from 1990. The digital description of land cover, a key
proxy parameter for the space disaggregation of emissions, is
available at European scale from 1990 too, thanks to the
CORINE Land Cover project. It was therefore decided to
perform a model reconstruction of air pollutants concentrations
for year 1990 to obtain a first estimate of past air pollutants concentration and to verify the feasibility of a more thorough
evaluation of past concentrations from 1980 onward. The modelling approach has been selected to obtain results comparable
with air quality analysis performed by the Regional Air Quality Agency (ARPA Lombardia) and by the national project
MINNI (http://www.minni.org/). The modelling system is based on the chemical transport model FARM (Mircea et al.,
2014) coupled with the meteorological model WRF (http://www.wrf-model.org/) and has been configured with nested
computational domains reaching the maximum resolution over Lombardia Region with a grid spacing of 4 km.
Meteorological fields have been reconstructed downscaling ECMWF ERA-Interim meteorological analyses. Estimated
concentrations have been compared with the available measurements for year 1990, and with air quality analyses for year
2000 evidencing the decrease of concentrations fields and partial variation of their space distribution.
Conclusions
Retrospective air quality simulations can be performed for 1990 and later years with the same input data and modelling
methodology used for recent years. Differences between past and present concentration fields can be quantified to improve
population exposure estimate. A more demanding investigation is necessary to reconstruct earlier years, for which space
disaggregated emissions are not available, and an industrial sources inventory should be built due to their emission relevance.
References
Mircea M., Ciancarella L., Briganti G., Calori G., Cappelletti A., Cionni I., Costa M., Cremona G., D’Isidoro M., Finardi S.,
Pace G., Piersanti A., Righini G., Silibello C., Vitali L., Zanini G. 2014. Assessment of the AMS-MINNI system capabilities
to predict air quality over Italy for the calendar year 2005. Atmospheric Environment 84,178-188.
K. Straif, A. Cohen, J. Samet. 2013. IARC Scientific Publication N. 161, Air Pollution and Cancer, ISBN 978-92-832-2166-1
Fig.1 Lombardia Region NOx emissions (tons/year; blue) and
Milan urban background NO2 concentration (μg/m3; red)

48
PUBLIC HEALTH GAINS FROM STRICT REGULATIONS ON FINE PARTICULATE AIR POLLUTION
D.Giannadaki (1), J.Lelieveld (1,2), and A. Pozzer (2)
(1) The Cyprus Institute, Energy, Environment and Water Research Center, 1645 Nicosia, Cyprus; (2) Max Planck Institute
for Chemistry, Atmospheric Chemistry Department, 55128 Mainz, Germany
Presenting author email: [email protected]
Summary
The main aim of this work is to evaluate the implementation of recent air quality standards for fine particulate matter (PM2.5)
in the European Union (EU), United States (US) and other countries worldwide and to estimate the public health gains that
could be expected if EU or US standards for long term exposure were adopted and enforced internationally. We first
investigated premature mortality attributable to PM2.5 in adults ≥30yrs and children <5yrs, applying a high-resolution global
atmospheric chemistry model combined with epidemiological concentration response functions. To assess the impact of
applying air quality standards for PM2.5 pollution we performed sensitivity calculations where we set these standards as the
upper concentration limits in the health impact function, thus assuming they are strictly implemented. The key finding of this
study is that even small changes at the lower standards of annual mean PM2.5 concentrations (e.g., < 20μg/m3) can have a
significant impact on mortality rates. Our results underscore the large positive impact on human health worldwide by
implementing the recently lowered US air quality standard of 12μg/m3 or even a lower limit for annual mean PM2.5.
Introduction
Outdoor air pollution by fine particles ranks among the top ten global health risk factors that can lead to premature mortality
(Lim et al., 2012). Epidemiological cohort studies, mainly conducted in the United States and Europe, have shown that the
long-term exposure to PM2.5 is associated with increased mortality from cardiovascular, respiratory diseases and lung cancer.
Fine particles can cause health impacts even at very low concentrations. Populations in large parts of the world, especially in
Asia, are exposed to very high levels of PM2.5 pollution. Most of PM2.5 originates from combustion engines, power plants,
industry, household energy use, agriculture, biomass burning and natural sources like desert dust. Estimates of mortality
attributable to outdoor air pollution are useful to justify air quality control policies and help improve public health.
Methodology and Results
For this work we used the EMAC atmospheric chemistry–general
circulation model, applied at high resolution to compute global
PM2.5 concentrations, combined with population data, country-level
health statistics and pollution exposure response functions. To
estimate premature mortality attributable to PM2.5 we follow the
same methodology as Lelieveld et al. (2015) and the Global Burden
of Disease for 2010 (Lim et al. 2012) applying improved exposure
response functions that more realistically account for health effects
at very high PM2.5 concentrations. We primarily assume that all
particles are equally toxic, but also include a sensitivity study that
accounts for differential toxicity. We estimate the global premature
mortality by PM2.5 at 3.15 million/year in 2010. China is the
leading country with about 1.33 million, followed by India with
575 thousand and Pakistan with 105 thousand. For the 28 EU
member countries we estimate 173 thousand and for the US 52
thousand premature deaths in 2010. We find that emissions from
residential energy use such as heating and cooking, prevalent in
India and China, have the largest impact on premature mortality
globally. We performed sensitivity studies to estimate the reductions in mortality that could be achieved if the PM2.5 air
quality standards of the EU and US and other national standards would be implemented worldwide. With the EU annual
mean standard of 25μg/m3 the global premature mortality due to PM2.5 exposure would drop by 17%; while within the EU the
effect is negligible. With the US standard of 12μg/m3 premature mortality by PM2.5 would drop by 46% worldwide; 4% in the
US and 20% in the EU, 69% in China, 49% in India and 36% in Pakistan. These estimations take into consideration that
about 22% of the global PM2.5 related mortality cannot be avoided due to the contribution of natural PM2.5 sources.
Conclusions
Our results suggest the need to adopt globally a strict limit for annual mean PM2.5 levels, like the US limit of 12μg/m3 or even
a lower limit to substantially reduce premature mortality in most of the world, while in strongly polluted regions like South
and East Asia essentially any PM2.5 reduction can significantly reduce premature mortality.
References
Lelieveld J., Evans J.S., Fnais M., Giannadaki D., Pozzer A., 2015. The contribution of outdoor air pollution sources to
premature mortality on a global scale. Nature 525, 367–37.
Lim, S. S., Vos, T., Flaxman, A. D., Danaei, G., Shibuya, K. et al., 2012. A comparative risk assessment of burden of disease
and injury attributable to 67 risk factors and risk factor clusters in 21 regions, 1990–2010: a systematic analysis for the
Global Burden of Disease Study 2010. Lancet 380, 2224-2260.
Fig.1 Mortality linked to outdoor air pollution in
2010. Units: deaths per area of 100km x 100km

49
THE USE OF INDICES TO DESCRIBE SHORT TERM EFFECTS OF AIR QUALITY AND
BIOMETEOROLOGY ON MORBIDITY IN WESTERN GERMANY
Hanna Leona Lokys (1,2), Jürgen Junk (1), Andreas Krein (1)
(1) Luxembourg Institute of Science and Technology (LIST), Environmental Research & Innovation Department (ERIN), 5,
avenue des Hauts-Fourneaux, L-4362 Esch/Alzette, Luxembourg; (2) University of Münster, Climatology Working Group,
Heisenbergstraße 2, D-48149 Münster, Germany
Presenting author email: [email protected]
Summary
The influences of air quality and thermal stress on hospital admissions due to cardiovascular and respiratory diseases are
assessed using Poisson regression models combined with distributed lag nonlinear models (DLNMs) (Gasparrini 2011). The
use of corresponding indices is equally suited to the use of single metrics, thus gives the opportunity to facilitate
communication to the public as well as to include all parameters of interest without the need to exclude some due to
correlation of covariates.
Introduction
Several studies analyse either the impact of air quality or the impact of thermal stress on health outcomes - mostly mortality.
Early studies only treat the weather or the air pollution as independent variable, without considering confounders. Later this
changed to the use of either meteorology or air quality as confounder. However, these studies are still rare, and especially the
combined effects can vary across locations.
Methodology and Results
The analysis was conducted in 39 administrative districts along a north-south gradient
in the western part of Germany covering the period from 2001 to 2011. Data sets for
each district included air quality (NO2, SO2, O3 and PM10), biometeorology (air
temperature, wind speed, relative humidity and global radiation) and hospital
admissions (case specific diagnoses based on ICD-10) on a daily basis. To assess if the
commonly used indices UTCI (Jendritzky et al. 2012) and CAQI (van den Elshout et al.
2008) are suited to describe the association between air quality, biometeorological
factors and cardiovascular and respiratory diseases, we used Poisson regression models
combined with DLNMs. We controlled for a long term and seasonal trend, day of the
week, holidays and influenza.
The comparison of models using the pollutants and meteorological parameters with
models using the indices shows that both methods have a similar adjusted R-square of
0.5 to 0.7 depending on the district.
The Bi-dimensional exposure-lag-response association reveals that cold stress leads to
an increased relative risk (RR) after 2 to 6 days, while heat stress results in an
immediate RR increase that lasts up to ten days (fig 1). The range from 10 to 25 degrees
UTCI shows a RR of about 1. This is well in line with the definition of the “no thermal
stress” at a range from 9 to 26 degree UTCI. The Results for the CAQI show that only
very high values lead to an increase in RR (fig 2). The response is immediate and lasts
up to 2 days.
Conclusions
The Poisson regression model combined with a DLNM could show that the UTCI and
CAQI are suitable to assess the effects of air quality and thermal stress on
cardiovascular and respiratory hospital admissions in Germany. The RR around 1 for
the range of 10 to 25 degree UTCI underlies the suitability of the index.
As some of the pollutants and meteorological factors are highly correlated, e.g. ozone
and temperature, the use of indices gives the opportunity to include even the correlated
measures. Another benefit from using the indices is that the model results are easily
accessible by the public and stakeholders as the indices provide a summary of
biometeorological stressors and air quality parameters.
Acknowledgement
This work was supported by the National Research Fund in Luxembourg (4965163 - FRESHAIR). We acknowledge the
support by “Niedersächsisches Ministerium für Umwelt, Energie und Klimaschutz“, „Landesamt für Natur, Umwelt und
Verbraucherschutz NRW“ and the „Research Data Centres of the Federal Statistical Office and the statistical offices of the
Länder” for providing data on air quality, meteorology and hospital admission data.
References
Gasparrini A, 2011. Distributed Lag Linear and Non-Linear Models in R: The Package dlnm. J. Stat. Softw. 43:1-20.
Jendritzky G, de Dear R, Havenith G, 2012. UTCI-why another thermal index? Int. J. Biometeorol. 56:421-428.
van den Elshout S, Leger K, Nussio F, 2008. Comparing urban air quality in Europe in real time a review of existing air
quality indices and the proposal of a common alternative. Environ. Int. 34:720-726.
Fig.2 Bi-dimensional exposure-
lag-response association for air quality
Fig.1 Bi-dimensional exposure-
lag-response association for
biometeorological parameters

50
PHYSICO-CHEMICAL PROPERTIES AND BIOLOGICAL EFFECTS OF DIESEL AND BIOMASS PARTICLES
E. Longhin (1), L. Capasso (1), R. Bengalli (1), S. Mollerup (2), C. Di Benedetto (1), J.A. Holme (3), J. Øvrevik (3), P.
Parenti (1), M. Gualtieri (4), M. Camatini (1)
(1) POLARIS Research Centre, Dept. of Earth and Environmental Sciences, University of Milano-Bicocca, Milano, Italy; (2)
Dept. of Biological and Chemical Working Environment, National Institute of Occupational Health, Oslo, Norway; (3)
Division of Environmental Medicine, Norwegian Institute of Public Health, N-0403 Oslo, Norway; (4) ENEA Dept.
Sustainability Laboratory of air pollution (SSPT-MET-INAT) Saluggia, Italy.
Presenting author email: [email protected]
Summary
Diesel and biomass combustion are main sources of fine and ultrafine particulate matter (PM) in North Italy. The particles
here used were sampled under controlled laboratory conditions, characterized for their physico-chemical properties, and
tested for their biological effects in a human pulmonary epithelial cell culture model. The results evidenced a higher PAHs
and metals content in diesel particles, which also induced stronger cell responses such as cell morphology modification, gene
modulation and interleukin release.
Introduction
Ambient particulate matter (PM) toxicity has been widely studied in the past decades for its effects on human health. WHO
reported that 7 million worldwide annual premature deaths are linked to air pollution, confirming this as the largest
environmental health risk in the world (WHO, 2014). In the effort of retraining ambient air quality, greatest awareness has
now been gained on the necessity to re-evaluate the standards limits, aiming not only at low PM concentrations, but focusing
on the reduction of specific components, sources and size fractions (Cassee et al., 2013). In the Lombardy Region diesel used
for private and public transport and biomass burning for residential heating represents important sources of fine PM. Previous
research has highlighted the complexity of studying combustion particle toxicity. Differences in fuel properties and
combustion conditions can result in significant variation in the particles chemical content, greatly affecting the biological
effects (Shen et al., 2014). In the present study, PM produced by diesel (DPM) and biomass (BPM) combustion under
controlled laboratory conditions were evaluated to determine the physico-chemical properties and related biological effects of
these ultrafine particles sources.
Methodology and Results
DPM and BPM were sampled on Teflon filters from
an Euro 4 vehicle without DPF and from a 25 kW
pellet boiler, respectively. Content of PAHs and
metals were determined by GC/MS and ICP-MS
respectively, and particles morphology analysed by
TEM and SEM. Human bronchial epithelial cells
(HBEC3) were exposed to particles for up to 2
weeks. Cell morphology was inspected daily by an
inverted microscope. Changes in gene expression
were evaluated by RT-qPCR, and the release of
inflammatory mediators by ELISA. The scratch
wound assay was used for cell migration analysis.
DPM had a higher concentration of PAHs and
metals with respect to BPM. Genes related to
xenobiotic metabolism were modulated by both
PM, while genes involved in inflammatory response
and oxidative stress were modulated only after exposure to DPM. Moreover, exposure to DPM increased the release of the
cytokines IL-1β, IL-6 and IL-8, changed the cell morphology, and reduced migration.
Conclusions
The higher PAH and metal content in DPM was accompanied by stronger biological effects. In HBEC3 cells, DPM activated
the inflammatory response and oxidative stress pathways, changed cell morphology and reduced migration. In contrast, BPM
produced by the combustible material and at the burning conditions here used resulted in only minor or no biological effects.
The results here presented highlight the importance to evaluate the sources emissions in order to select more effective
strategies to improve air quality.
Acknowledgement
INNOVHUB performed particles sampling. This research was supported by a grant of Cariplo Foundation to M.C.
References
Cassee F.R., Héroux M.E., Gerlofs-Nijland M.E., Kelly F.J., 2013. Particulate matter beyond mass: recent health evidence on
the role of fractions, chemical constituents and sources of emission. Inhal Toxicol. 25(14), 802-812.
Shen G., Wei S., Zhang Y., Wang B., et al., 2014. Emission and Size Distribution of Particle-bound Polycyclic Aromatic
Hydrocarbons from Residential Wood Combustion. Biomass & bioenergy 55, 141-147.
WHO, 2014. 7 million premature deaths annually linked to air pollution. News release, Geneva.
Fig.1 Alteration in cell morphology and migration.
Inverted light microscopy images (10x) showing
cells morphology, and cell migration assessed by
scratch wound assay after 72 h exposure to DPM
and BPM (2.5 μg/cm2).

51
CORRELATION BETWEEN ANNOYANCE AND THE COMBINED EFFECT OF PARTICULATE MATTER
M. Machado (1), J.M. Santos (2), N.C. Reis Jr.(2), V.A. Reisen (2), I. Mavroidis (3), H.H.A. Cotta (2)
(1) Instituto Federal do Espírito Santo (IFES), (2) Universidade Federal do Espírito Santo (UFES), Department of
Environmental Engineering, Vitória, Brazil, (3), Hellenic Open University, Patras, Greece
Presenting author email: [email protected]
Summary
The aim of this paper is to estimate the risk between exposure to particulate material concentrations (SP, PM10 and TSP) and
perceived annoyance, reported by respondents in Vitoria Region (Brazil). For that, a survey by phone (panel survey) from
2011 to 2014 with a representative sample of the region was conducted. It was examined the behaviour of particulate matter,
as PM10, Total Suspended Particles (TSP) and Settled Particles (SP), monitored in the air quality stations.
Introduction
Particulate matter is an air pollutant that causes damage to human health, animals and plants, affects the climate and is a
potential cause of annoyance through deposition on materials and buildings. The perceived annoyance caused by particulate
matter is related mainly to the increase of dust in urban and residential environments when it settles. Settled particles can
originate from many sources, e.g., paved and unpaved roads, buildings, agricultural operations and wind erosion that
represent the largest contributions beyond the relatively minor vehicular and industrial sources emissions. Several studies
have quantified the relationship between annoyance from air pollutants (Rotko et al., 2002; Amundsen et al. 2008;
Nikolopoulou et al., 2011). However, it can be observed that each pollutant is included as single covariate in the regression
model and, it is well-known that pollutants concentrations are inter-correlated. Therefore, the multicollinearity between
pollutants concentration must be taken into account to evaluate their relationship with annoyance due to air pollution. In this
context, this study presents a multivariate statistical techniques combination to analyse at the same model the combined
effects of total suspended particles (TSP), PM10 and settled particles (SP).
Methodology and Results
The combination of logistic regression and PCA techniques was applied by Roberts & Martins (2006) to evaluate the
associations of pollutants (PM10, O3, SO2, NO2 and CO) and their health effects avoiding the problem of multicollinearity.
However, as pointed out by Zamprogno (2013), the PCA technique requires variables that are not correlated in time, i. e.,
stationary time series (serially independent) and air pollutants concentration time series can hardly be assumed stationary.
Thus, it was necessary to use times series model to
identify the existence of temporal correlation to
eliminate then.
In the multiple logistic regression model the three
first principal components (PC1, PC2 and PC3)
were used as the covariates and a dichotomised
mean of annoyance. The model have a good fitted,
but there is no sense to analyse, individually, each
parameters estimated here, they are important to
calculate the relative risk shown in Table I. The relative risk (RR) of annoyance results were expressed by the interquartile
variation range. Thus, the RR of annoyance estimated for the pollutant Settled Particles (SP) increases approximately by a
factor of 1.5 considering the interquartile variation equal to 2g/m² 30 days. For the others pollutants the relative risk varied
from 1.6 (PM10 mean) to 2.4 (PM10 maxim) and from 1.8 (TSP mean) to 2.2. (TSP maxim).
Conclusions
The relative risk (RR) provide data on the strength of association between the risk factor (air pollution) in the study and the
outcome (annoyance). In this context, the estimates relative risk showed that, in general, an increase in air pollutant
concentrations (i.e., the particulate matter metrics examined here: TSP, PM10 and SP) significantly contributes in increasing
the probability of being annoyed.
Acknowledgement
FAPES and CAPES (Brazilian government agencies for technology development and scientific research).
References
Amundsen, A. H., Klaeboe R., Fyhri A. (2008). Annoyance from vehicular air pollution: Exposure–response relationships for
Norway. Atmospheric Environment, Volume 42, 7679-7688.
Nikolopoulou M., Kleissl J., Linden P.F., Lykoudis S. (2011). Pedestrians' perception of environmental stimuli through field
surveys: Focus on particulate pollution. Science of the Total Environment, 409(13), 2493-202.
Rotko et al., (2002) Determinants of perceived air pollution annoyance and association between annoyance scores and air
pollution (PM2.5, NO2) concentrations in the European EXPOLIS study. Atmospheric Environment 36, 4593–4602.
Roberts s, Martin m. Using supervised principal components analysisto assess multiple pollutant effects.environ health
perspect. 2006;114(12):1977-82.
Zamprogno, b. (2013). Análise de componentes principais no domínio do tempo e suas implicações em dados
autocorrelacionados. Phd thesis. Programa de pós-graduação em engenharia ambiental do centro tecnológico, ufes, vitoria,
brasil
Pollutants RR IC (95%) Dif IC
SP PM10 (monthly mean) TSP (monthly mean) PM10 (monthly maxim)
TSP (monthly maxim)
1.462
1.649
2.181
2.411
1.822
(1.070; 1.854)
(1.061; 2.237)
(1.471; 2.891)
(1.401; 3.421)
(0.592; 3.052)
0,784
1,176
1,42
2,02
2,46
TABLE I- THE RELATIVE RISK ESTIMATED

52
ON THE USE OF CARBONACEOUS PARTICLE EXPOSURE METRICS IN HEALTH IMPACT
CALCULATIONS
H. Olstrup (1), C. Johansson (1,2) and B. Forsberg (3)
(1) Atmospheric Science Unit, Department of Analytical Chemistry and Environmental Sciences, Stockholm University, 114
18 Stockholm, Sweden; (2) Environment and Health Administration, SLB, Box 8136, 104 20 Stockholm, Sweden; (3)
Division of Occupational and Environmental Medicine, Department of Public Health and Clinical Medicine, Umeå
University, 90187 Umeå, Sweden
Presenting author email: [email protected]
Summary
Combustion-related carbonaceous particles seem to be a better indicator of adverse health effects compared to PM2.5 and
PM10. Historical studies are based on black smoke (BS), but more recent use absorbance (Abs), black carbon (BC) or
elemental carbon (EC) as exposure indicators. To estimate health risks based on BS, we review the literature regarding the
relations between Abs, BS, BC and EC. We also discuss the uncertainties associated with the comparison of RRs based on
these conversions. EC is reported to be between 5.2 % and 26 % of BS with a mean value for 15 relationships of 12 %.
Correlations of different metrics at one particular site are higher than when different sites are compared. Comparing all
traffic, urban and rural sites, there is no systematic site dependence, indicating that other properties of the particles or errors
affect the measurements and obscure the results. It is shown that the percent increase in mortality associated with EC may be
several times higher than for PM10, but this is highly dependent on the relation used. RRs for all-cause mortality associated
with short-term exposure to PM10 seems to be higher at sites with higher EC concentrations, but more data are needed.
Introduction
The results from many studies indicate that exposure to combustion-related carbon-containing particles is associated with
more adverse health effects compared to exposure to undefined particulate matter (PM2.5 and PM10) (Janssen et al. 2011).
Black smoke (BS) has been monitored as an indicator of air-quality worldwide since decades. But later, health-risk estimates
are based on light absorbance (Abs), black carbon (BC) or thermo-optical methods (EC), as they are considered more specific
for carbon-containing combustion particles. In this study our aims are: 1.) to review different transformations between BS
and BC or EC reported in the literature. This is done to assess the degree of comparability between different epidemiological
studies using the different metrics, and the possible ranges of increased mortality risks associated with black-carbon particles.
2.) To compare the estimated increase in mortality associated with short-term exposure to PM10 and EC (BC). We focus on
short-term exposure studies, where risk estimates for either one of BS, BC or EC are reported together with risk estimates for
PM10. 3.) To analyse if the effect of PM10 on daily mortality depends on the EC concentration.
Methodology and Results
By using the different relations between EC and BS at various places, described in different articles, we have calculated the
absolute health-risk increase for some cities with reported PM10 and EC (BC) concentrations. We have also analysed how the
different measurement methods may affect the results in epidemiological studies. Many studies have addressed the question
of what is the cause of the health effects associated with PM exposure (e.g. Grahame et al. 2014). Several authors discuss the
importance of the carbonaceous particles as particularly important. Based on these results, we have analysed if there is any
relation between the relative risks (RR) associated with PM10 and the concentration of EC. We show that the relative risks
regarding all-cause mortality from exposure to PM10 will increase as a function of the levels of elemental carbon (EC), and
this slope is significant (95 % CI).
Conclusions
During the last years, the health risks associated with combustion-related particles have received an increasing attention. The
measurement methods for carbonaceous PM are important to address, since they may cause large uncertainties when used in
health impact calculations in epidemiological research. In order to reduce the uncertainties regarding the importance of
combustion-related carbonaceous aerosols, a more specific and standardized methodology for measuring combustion-related
particles is urgently needed.
Acknowledgement
This work was partly financed by the Swedish Environmental Protection Agency as part of the Swedish Clean Air & Climate
Research Program
References
Janssen N.A.H., Hoek G., Simic-Lawson M., Fischer P., van Bree L., ten Brink H. et al., 2011. Black Carbon as an
Additional Indicator of the Adverse Health Effects of Airborne Particles Compared with PM10 and PM2.5. Environmental
Health Perspectives 119, 1691-1699.
Grahame T.J., Klemm R., Schlesinger R.B., 2014. Public health and components of particulate matter: the changing
assessment of black carbon. Journal of Air and Waste Management Association 64, 620-660.

53
PERSONAL EXPOSURE ASSESSMENT TO AIR POLLUTANTS USING PORTABLE SENSORS AND AGENT
BASED MODELLING
D.A. Sarigiannis (1,2), D. Chapizanis (1), P. Kontoroupis (1), S. Karakitsios (1)
(1) Aristotle University of Thessaloniki, Department of Chemical Engineering, Environmental Engineering Laboratory,
54124, Thessaloniki, Greece; (2) Chair of Environmental Health Engineering, Institute of Advanced Study, Pavia 27100,
Italy
Presenting author email: [email protected]
Summary
This study examines the feasibility of using multiple wearable sensors for tracking personal location and activities and
assessing exposure at a personal level using Agent Based Modelling (ABM). Using this approach, an individual exposure
model was developed that can feed into population-based exposure assessments without imposing prior bias, but rather
basing its estimations onto emerging properties of the agent system behaviour. This approach permits the identification of
daily variability of exposure and leads to useful conclusions regarding capping exposure to high air pollution levels.
Introduction
The downsizing of monitoring technologies and the respective costs make it possible for various environmental stressors and
exposure factors to be measured more easily and frequently, thus providing a more reliable “time - geography of exposure”
shifting the current paradigm from a population to an individual level. Data collected by “smart” devices can help provide
more accurate exposure assessment for epidemiological studies and health impact assessment. This study is based on ABM, a
technique that simulates the actions and interactions of autonomous software objects, the “agents”, enabling a better
understanding of the behaviour of individuals and populations in social and evolutionary settings. Our ABM models are fed
with input from a web of wearable sensors tracking location, activity, but also climatic and air pollution parameters in cities.
Methodology and Results
A pilot multi-sensor campaign took place in
Thessaloniki, Greece, examining the use of the Moves
smartphone app and commercially available fitness
monitors, such as the FitBit Flex, for tracking people’s
location and activities. 25 participants wore these
devices along with a GPS sensor and an accelerometer
for a week. Location, motion and intensity of activity
data were used as input to an Artificial Neural Network
(ANN) model, built to derive a time-location model
based solely on sensor data as a more precise substitute
to cumbersome time logs. Using Monte Carlo analysis,
distributions of participants’ movement and activities
were extrapolated to a larger population. Furthermore,
using a geographically explicit agent-based model, the
trajectory of individual “agents” was modelled and geo-
referenced. Coupling the agent trajectories with high
spatial resolution urban air quality modelled maps of
hourly concentration of PM in Thessaloniki, personal
exposure was estimated. Inhalation-adjusted exposure to
air pollutants was then evaluated by assigning pollutant concentrations to an agent based on his/her coordinates, activities and
the corresponding inhalation rate. PM levels and size distribution varied among different parts of the urban agglomeration
and hours of the day, as well as among different seasons. On average, personal exposure results were between 10 and 20%
more accurate than the equivalent estimate using ambient air concentration of PM as exposure proxy.
Conclusions
An improvement of exposure assessment, extending it to personal intake dose, allows better conclusions regarding the
association between air pollution and health at the population level. The dynamic nature of intake dose assessment at the
individual level supports the derivation of guidance regarding behavioural options that limit exposure to high pollution levels.
This study represents the first step in the development of a methodological approach to estimate the external exposome,
which encompasses the totality of human environmental exposures at an individual level, taking into account different
activity patterns, consumer behaviours and lifestyle factors. Such a model would be useful for assessing exposure for specific
vulnerable subgroups, such as children, the elderly and people with low socioeconomic status.
Acknowledgement
This work has received funding from the European Union’s Seventh Programme for research, technological development and
demonstration under grant agreement No 603946 (Health and Environment-wide Associations via Large population Surveys -
HEALS).
Fig.1 Exposure assessment
using ABM
Fig.2 Daily intake dose per body
weight for a
randomly picked agent

54
DESERT DUST ADVECTIONS IN SOUTHERN EUROPE DURING 2001-2010: FREQUENCY OF THE
EPISODES, CONTRIBUTION TO GROUND-LEVEL PM10 CONCENTRATIONS, AND SHORT-TERM
HEALTH EFFECTS
M. Stafoggia (1) on behalf of the MED-PARTICLES Study GROUP
(1) Department of Epidemiology, Lazio Regional Health Service, Rome, Italy
Presenting author email: [email protected]
Summary
This study aimed to estimate the frequency of desert dust advection episodes in Southern Europe over a long time period, and
to investigate the health effects of PM10 on mortality and hospitalizations, also comparing the relative effects of desert vs
non-desert PM10. To accomplish these goals, we have used several atmospheric models to identify dust episodes, and we
adopted standard statistical approaches to quantify ground-level contributions. These contributions have been then related to
health endpoints via time-series analysis. We identified many desert dust episodes in the study area, with clear north-south
gradients. These episodes affected both mortality and hospitalization endpoints, with risk excesses comparable to those found
for PM10 originating from local sources.
Introduction
While there is a large consensus on the causal role of total PM on health endpoints, the evidence on the association between
short-term exposure to desert dust and health outcomes is still controversial. In this study we aimed at estimating the short-
term effects of particulate matter ≤ 10 μm (PM10) on mortality and hospital admissions in 13 south-European cities,
distinguishing between PM10 originating from desert and from other sources. This was accomplished by applying
standardized procedures of data collection and analysis.
Methodology and Results
We identified desert dust advection days in multiple Mediterranean areas for 2001-2010 by combining modelling tools, back-
trajectories and satellite data. For each advection day, we estimated PM10 concentrations originating from desert, and
computed PM10 from other sources by difference. We fitted city-specific Poisson regression models to estimate the
association between PM from different sources (desert and non-desert) and daily mortality and emergency hospitalizations.
Finally, we pooled city-specific results in a random-effects meta-analysis. On average, 15% of days were impacted by desert
dust at ground level (desert PM10 > 0 μg/m3). Most episodes occurred in spring-summer, with increasing gradient of both
frequency and intensity North-South and West-East of the Mediterranean basin.
We found significant associations of both PM10 concentrations with mortality. Increases of 10-μg/m3 in non-desert and
desert PM10 (lag 0-1 days) were associated with increases in natural mortality of 0.55% (95% CI: 0.24, 0.87%) and 0.65%
(95% CI: 0.24, 1.06%), respectively. Similar associations were estimated for cardio-respiratory mortality and hospital
admissions.
Conclusions
PM10 originated from desert was positively associated with mortality and hospitalizations in Southern Europe. Policy
measures should aim at reducing population exposure to anthropogenic airborne particles even in areas with large
contribution from desert dust advections.
References
Pey J., Querol X., Alastuey A., Forastiere F., Stafoggia M. 2013. African dust outbreaks over the Mediterranean Basin during
2001–2011: PM10 concentrations, phenomenology and trends, and its relation with synoptic and mesoscale meteorology.
Atmos Chem Phys. 42, 1395-141.
Stafoggia M., Zauli-Sajani S., Pey J., Samoli E., Alessandrini E., Basagaña X., Cernigliaro A., Chiusolo M., Demaria M.,
Díaz J., Faustini A., Katsouyanni K., Kelessis A.G., Linares C., Marchesi S., Medina S., Pandolfi P., Pérez N., Querol X.,
Randi G., Ranzi A., Tobias A., Forastiere F.; and the MED-PARTICLES Study Group. 2015. Desert Dust Outbreaks in
Southern Europe: Contribution to Daily PM10 Concentrations and Short-Term Associations with Mortality and Hospital
Admissions. Environ Health Perspect. Jul 24 [Epub ahead of print].
Acknowledgments
This research was supported by the European Union under the grant agreement LIFE+ ENV/IT/327. I thank the MED-
PARTICLES Study Group for its support. MED-PARTICLES Study Group: Italy: E. Alessandrini, P. Angelini, G. Berti, L.
Bisanti, E. Cadum, M. Catrambone, M. Chiusolo, M. Davoli, F. de’ Donato, M. Demaria, M. Gandini, M. Grosa, A. Faustini,
S. Ferrari, F. Forastiere, P. Pandolfi, R. Pelosini, C. Perrino, A. Pietrodangelo, L. Pizzi, V. Poluzzi, G. Priod, G. Randi, A.
Ranzi, M. Rowinski, C. Scarinzi, M. Stafoggia, E. Stivanello, S. Zauli-Sajani; Greece: K. Dimakopoulou, K. Elefteriadis, K.
Katsouyanni, A. Kelessis, T. Maggos, N. Michalopoulos, S. Pateraki, M. Petrakakis, S. Rodopoulou, E. Samoli, V. Sypsa;
Spain: D. Agis, J. Alguacil, B. Artiñano, J. Barrera-Gómez, X. Basagaña, J. de la Rosa, J. Diaz, R. Fernandez, B. Jacquemin,
A. Karanasiou, C. Linares, B. Ostro, N. Perez, J. Pey, X. Querol, P. Salvador, A.M. Sanchez, J. Sunyer, A. Tobias; France:
M. Bidondo, C. Declercq, A. Le Tertre, P. Lozano, S. Medina, L. Pascal, M. Pascal

55
ON THE IMPACT OF AIR QUALITY ON HUMAN HEALTH: APPLICATION OF AN AIR QUALITY INDEX
FOR THESSALONIKI, GREECE
P. Syropoulou (1), T.M Giannaros (1), A. Poupkou (1), S. Dimopoulos (1), D. Melas (1) and D. Balis (1)
(1) Laboratory of Atmospheric Physics, Aristotle University of Thessaloniki, Thessaloniki, 54 124, Greece
Presenting author email: [email protected]
Summary
In this study, we present the implementation and evaluation of an advanced air quality index for the coastal Mediterranean
city of Thessaloniki, Greece. The selected index, namely the Aggregate Risk Index (ARI), was integrated into an operational
air quality forecasting system, comprised of the meso-scale meteorological WRF model and the air quality CAMx model.
Results from the operational implementation of the coupled WRF/CAMx modelling system for a six-month period in the year
2012 were used for evaluating the respective ARI estimates. The evaluation process was carried out using health data
provided by a major hospital in the greater Thessaloniki area. Several different scenarios were investigated in order to verify
the presence of any correlation between the predicted ARI values and the number of either hospital admissions or examined
patients. This analysis revealed the existence of a time lag between the ARI forecasts and health data. In particular, it was
found that the health data of the current day correlate better with the simulated daily maximum ARI values of the previous
two to three days. This study suggests that ARI is a promising tool for assessing the impact of air quality on human health.
Introduction
Extensive research over the past decade has shown that exposure to air pollutants is strongly connected to health endpoints
such as increased hospital admissions for respiratory and/or cardiovascular diseases, and mortality. Further, there is a
profound relation between human health and well-being from the one side and air pollution levels from the other. Therefore,
it is not surprising that the impact of deteriorated air quality on human health has become a critical component in relevant
policy discussions. Taking this into consideration, we implemented an advanced air quality index as part of an operational air
quality forecasting system. The goal of this study is to evaluate the suitability of the selected index as a tool for assessing the
impact of air quality conditions on human health.
Methodology and Results
The air quality modelling system employed consists of the
meteorological WRF model off-line coupled with the photochemical air
quality CAMx model (Fig. 1). The air quality index integrated into the
WRF/CAMx modelling system is ARI, described in detail by Sicard et
al. (2011). The modelling system was implemented operationally over a
high resolution (2 km) domain, focused on the city of Thessaloniki,
during a six-month period spanning January through June 2012.
Domain-averaged values of the predicted daily maximum, minimum
and mean ARI, classified per targeted pathology, were compared to
health data acquired from the “Georgios Papanikolaou” General
Hospital of Thessaloniki. The conducted analysis focused on examining
potential associations between the predicted ARI values and the health
data. At a first stage, the health data of the current day were contrasted
to the forecasted ARI data for the same day, revealing the absence of
any statistically significant correlation. At a second stage, the health
data of the current day were compared against the modeled ARI data
of the previous N days. This particular time lag scenario revealed the
existence of statistically significant correlations between ARI and the health endpoints represented by the provided medical
data. It was found that the forecasted daily maximum ARI of the previous 2-3 days correlates with the hospital admissions of
the current day. For instance, the correlation coefficient between the daily maximum value of ARI of the previous 2 days and
daily hospital admissions for cardiac diseases was found equal to 0.40 (statistically significant at the α=0.05 level). Similar
results were also obtained for other pathologies, such as for cardiovascular and respiratory diseases.
Conclusions
The current study has shown that ARI can be exploited as a tool for assessing the impact of deteriorated air quality on human
health. The conducted preliminary analysis revealed that forecasts of this particular index might be of great usefulness to
authorities involved in the health sector.
Acknowledgement
This work was funded by FP7-PASODOBLE (Contract No.: 241557). Model simulations have been conducted using the EGI
and HellasGrid infrastructures and support has been provided by the Scientific Computing Centre of A.U.Th.
References
Sicard P., Lesne O., Alexandre N., Mangin A., Collomp R., 2011. Air quality trends and potential health effects –
Development of an aggregate risk index. Atmos. Environ. 45, 1145-1153.
Fig.1 Flow chart of the WRF/CAMx modelling
system.

56
ECONOMIC IMPACTS FROM PM2.5 POLLUTION-RELATED HEALTH EFFECTS IN CHINA: A
PROVINCIAL LEVELED ANALYSIS
Y. Xie (1,2), HC. Dai(2), HJ. Dong(2), T. Hanaoka(2), T. Masui(1,2)
(1) Department of Social Engineering, Tokyo Institute of Technology, 2-12-1 Ookayama, Meguro-ku, Tokyo 152-8550,
Japan; (2) Center for Social and Environmental Systems Research, National Institute for Environmental Studies, 16-2
Onogawa, Tsukuba-City, Ibaraki, 305-8506, Japan
Presenting author email: [email protected]
Summary
This study aims to evaluate the PM2.5 pollution-related health impacts on the national and provincial economy by combining
GAINS-China model and a Computable General Equilibrium (CGE) model. Applying our approach to 30 provinces in China
shows that provinces with high PM2.5 concentration may have a substantial impact on their health and economy. PM2.5
pollution leads to additional health expenditure and work time loss. Comparing with health expenditure, work time loss has
more significant negative impact on the economy. Air pollution control technology also costs a lot, which is much higher
than health expenditure. However, considering the cost and benefit, the net benefit is considerable in most of the provinces,
especially in developed regions.
Introduction
With fast growth and development, China is facing severe challenges relating to its environment, particularly the notorious
haze pollution in recent years. Exposure to a high concentration of PM2.5 increases both mortality and morbidity (Pope III,
Burnett et al. 2002). Health problem can lead to additional health expenditure and work time loss. The economic impact from
PM2.5 pollution-related health effects in China should be a concern to the policymaker. However, most of the current studies
are about PM10 pollution focused only on one city, province or region levels, which cannot reflect the regional disparity of
economic damage to 30 provinces in China (Matus, Nam et al. 2012). Therefore, this study aims to forecast and evaluate the
long-term economic impacts caused by PM2.5 pollution in 30 Chines provinces and reveal its regional disparity.
Methodology and Results
We develop an exposure-response model that combines the
GAINS-China model and a CGE model. GAINS-China provides
annual average PM2.5 concentration and air pollution control cost
for 30 provinces. Exposure-response model is used to quantify the
health endpoint due to PM2.5 pollution, including mortality,
chronic bronchitis, asthma, respiratory hospital admission,
Cerebrovascular hospital admission, Cardiovascular hospital
admissions and work loss day. Work time loss due to mortality
and morbidity is the input data to CGE model, which simulates
the economic impact of PM2.5 pollution for each province.
Results show that PM2.5 pollution will cause national GDP loss
of 1.94% and additional health expenditure of 140 billion Yuan
in 2030. Provinces with high PM2.5 concentration have high
GDP loss (Fig.1), for instance, Tianjin (3.12% loss in GDP),
Shanghai (2.81%), Henan (2.71%), Beijing (2.65%) and Hebei
(2.57%). By contrast, improving air quality by adopting air
pollution control technology could save health expenditure,
increase labour supply and bring GDP gain. By considering GDP
recovery, health expenditure saving and additional control cost,
net benefit is positive for most provinces (Fig.2). Net benefit is
0.80% of GDP in 2030 in China. At the provincial level, the net
benefit is positive in Tianjin (2.1% of GDP), Shanghai (2.07% of
GDP), Beijing (1.9% of GDP), Henan (1.6% of GDP), Jiangsu
(1.6% of GDP), and Hebei (1.2% of GDP), whereas negative in
some western provinces such as Ningxia, Inner Mongolia,
Guizhou, Gansu and Heilongjiang in 2030.
Conclusions
Air pollution control technology can reduce PM2.5 concentration and increase labour supply, thus bring significant positive
economic benefit, especially for more developed provinces.
Acknowledgement
This study was supported by the Environmental Research and Technology Development Fund (S-12-2 and 2-1402) of the
Ministry of the Environment, Government of Japan.
References
Matus, K., et al. (2012). "Health damages from air pollution in China." Global Environmental Change 22(1): 55-66.
Pope III, C. A., et al. (2002). "Lung cancer, cardiopulmonary mortality, and long-term exposure to fine particulate air
pollution." JAMA 287(9): 1132-1141.
Fig.1 PM2.5 concentration and GDP loss in 30 provinces in 2030
Fig.2 Net benefit of air pollution control technology in 2030

57
MEASUREMENT OF AIR POLLUTANTS AND PROCESS
STUDIES

58

59
OUTDOOR PM2.5 AND BC EXPOSURE ASSESSMENT IN URBAN SLUMS OF MUMBAI, INDIA
A. Anand (1), H.C. Phuleria (1)
(1) Centre for Environmental Science and Engineering(CESE), IIT Bombay, Powai Mumbai, 40076, India
Presenting author email: [email protected]
Summary
The aim of this study is to assess the outdoor PM2.5 and BC exposures in four urban slums of Mumbai and their intra and
inter spatio-temporal variations using mobile monitoring technique. DustTrak and microAeth were employed to measure the
real time PM2.5 and BC concentrations. The PM2.5 concentrations are observed to be similar in all of the four slums, whereas
BC concentrations show heterogeneity among the four slums, with high concentration observed in three of the four slums
which are in the periphery of heavy traffic roads. Multi variable regression analysis shows that type of road and type of slum
are the significant predictors of outdoor PM2.5 and BC concentrations with the model explaining 71% and 47% variability in
BC and PM2.5 concentrations, respectively. This study shows that the people living in the slums are exposed to high levels of
PM2.5 and BC, with the population residing along heavy and medium traffic roads being the most exposed.
Introduction
About 41% of the inhabitants in Mumbai live in slums. Most of these slums are located in the periphery of major traffic
highways, railway lines and landfill sites, raising concerns of high air pollution exposures. The disease pattern analysis in
various slums of Mumbai shows that 18-45% of the diseases reported are potentially related to air pollution. However, so far
no extensive studies have been conducted to investigate the existing levels of air pollution exposures of the Mumbai slum
population. Hence the present study was conducted in four urban slums in Mumbai to assess the outdoor air pollution
exposures of PM2.5and Black Carbon and their spatio-temporal variations both within and between the slums.
Methodology and Results
Eleven days of mobile monitoring were conducted in four urban
slums of Mumbai namely Santosh Nagar, Hanuman Nagar,
Malwani and Subhash Nagar. In each monitoring trip, a person
outfitted with a back pack containing DustTrak for measuring real
time PM2.5 concentration, microAeth for measuring real time black
carbon concentration and a GPS unit, walked along a pre-designed
path in each neighborhood. Average PM2.5 and BC concentrations
were 34±8 µg/m3 and 5916±3564 ng/m3, respectively, among all
the four slums. PM2.5 concentrations exhibited intra and inter-slum
homogenous spatial distributions (coefficient of divergence, COD
= 0.06-0.2) whereas BC showed considerably heterogeneity (COD
range 0.30-0.50). Higher BC concentrations were observed in three
of the four slums which are in the periphery of heavy traffic roads.
Further analysis shows that the local sources contribute 64% -75%
to BC where as it is only 19%-37% for PM2.5 concentration which
explains the higher within slum spatial variation in BC
concentrations compared to PM2.5. Multi variable regression models
developed to examine the contributions of different exposure
predictor variables in predicting the outdoor PM2.5 and BC
concentrations, show that type of road and type of slum are the
significant predictors of outdoor PM2.5 and BC concentrations. The
model explained 71% and 47% variability in BC and PM2.5
concentrations, respectively.
Conclusions
The study shows that the people living in the slums are exposed to
high levels of PM2.5 and BC, with the population residing along heavy
and medium traffic roads being the most exposed. The extrapolation of these results to all the slums of Mumbai suggests that
about half of the city’s population is indeed at higher risk regarding air pollution exposures, with the poor ventilation and air
tightness of the slum homes raising the concerns even more.
Fig.1 monitoring locations and monitoring routes
Fig.2 Average BC concentrations in four slums

60
A NEW LONG TERM FINE PARTICLE MONITOR FOR THE URBAN ENVIRONMENT
I Bennett
Pegasor Oy, Tampere, Finland
Presenting author: [email protected]
Summary WHO considers fine particles in our urban air to be one of the most significant threats to human health and yet we still do not
monitor them adequately or properly. This paper will describe a new monitor specifically designed to monitor the full range
of fine particles on a long term basis, without the use of solvents or radioactive sources; a robust monitor delivering relevant
information.
Aerosol charging and electrometry instruments have always suffered from the fact that once they are turned on they
immediately begin to degrade towards an all-too-frequent user maintenance interval and so have never been considered as
long term monitoring solutions. The Pegasor AQUrban uses electrical particle charging (EPC) but instead of direct
electrometry of the charge carried by the deposited aerosol particles, AQUrban measures that charge by difference,
comparing the energy output from the corona and the returned energy from unattached air ions. The result is a fine particle
monitor that operates for many months with no user maintenance and that sees ALL the fine particles, right down to <10nm
instead of only down to c300 nm, the limit of detection of most deployed optical devices.
AQUrban reports mass, number and surface are concentration to Cloud based storage where it can immediately be accessed
through many devices including Smart City nets.
Introduction
Aerosol Electrometry is a well established method of aerosol detection and short term monitoring based on the attachment of
air ions to the surface of aerosol particles such that the surface becomes saturated before the supply of air ions is exhausted.
Corona discharge is used to create an excess of air ions within a flow of clean air which is then turbulently mixed with the
sampled aerosol within an air ejector that is used to pull the sampled atmosphere into the sensor. The air ions are highly
mobile and very quickly become attached to the sampled aerosol particles. The mixture of aerosol and unattached air ions
passes directly through an ion trap that uses an electrical field to remove the unattached air ions to the surface of the trap
where the current that is created is measured using highly sensitive electrometers. The aerosol particles, which are much less
mobile, pass directly through the ion trap and are returned to the atmosphere. The entire sensor is housed within a Faraday
cup to minimise external effects, and can be used to monitor aerosols across a wide range of non condensing conditions.
Methodology and Results
Our investigations of this technology have shown
that the lower limit of detection is <10nm.
Developments in electrometer design have greatly
increased the linear dynamic range of such devices
and we have successfully applied this sensor
technology to raw vehicle emissions at the tail pipe,
as well as to indoor air and urban air applications.
Work has been carried out at LAT , University of
Thessaloniki which has shown that the charging
efficiency is largely unaffected by the chemical
nature of the aerosols and that robust extrapolation
from surface area, which is the primary parameter
of measurement, to both number and mass concentrations is possible. Trial units are on site in a number of European and
Asian Cities and we shall be presenting data from these sites in this presentation.
Conclusions
Current methods of monitoring mass concentration of fine particles within urban air are no longer sufficiently sensitive.
Recent reductions in mass concentration in our urban air have not been reflected in a corresponding reduction in respiratory
health effects. Indeed, the incidence of respiratory disease associated with urban living has gone up whilst mass
concentrations have gone down. At the same time, probably as a result of modern abatement technologies, the number
concentration of fine particles has risen and has been shown to be a reliable measure and predictor of respiratory disease
incidence. Pegasor will demonstrate that their AQUrban fine particle monitor is sensitive to very real changes in fine particle
concentration, that are not detected by other technologies

61
CHAMBRE – THE DEVELOPMENT OF AN ATMOSFERIC SIMULATION CHAMBER AT GENOA
UNIVERSITY
P.Brotto (1,2), M.C. Bove (1,2), F.Cassola (1,2), E.Gatta (1), D.Massabò (1,2), F.Parodi (2), V.Vigo (2) and P.Prati (1,2)
(1) Department of Physics, University of Genoa, Genoa, 16146, Italy; (2)National Institute of Nuclear Physics (INFN),
Genoa Department, Genoa, 16146, Italy
Presenting author email: [email protected]
Summary
We present the characterization and first experiments results of the atmospheric chamber ChAMBRe (Chamber for Aerosol
Modelling and Bio-aerosol Research) which has been developed and equipped to study the bioaerosol atmospheric
interactions, the investigate on aerosol optical properties and to test innovative instruments and methodologies for particulate
matter collection.
Introduction
Environmental simulation chambers are small to large-scale facilities
where atmospheric conditions can be monitored in real-time under
control to reproduce realistic environments and to study interactions
among their constituents. Up to now, they have been used mainly to
study chemical and photochemical processes that occur in the
atmosphere, but the high versatility of these facilities allows for a wider
application covering all fields of atmospheric aerosol science. A
stainless steel atmospheric simulation chamber (volume approximately
3 m3, see Figure 1) has been recently installed at the National Institute
of Nuclear Physics in Genoa (INFN-Genova, www.ge.infn.it) in
collaboration with the Environmental Physics Laboratory at the Physics
Department of Genoa University (www.labfisa.ge.infn.it).
Methodology and Results
The scientific activities at ChAMBRe focus on the following topics:
1) Bioaerosol properties
The biological component of atmospheric aerosol (bio-aerosol) is a
relevant subject of science but many of its aspects still require deeper investigation. A strong improvement in the
understanding of microorganisms behaviour in the atmosphere can be provided by atmospheric chamber experiments, that
allow for a scientific intermediate approach between “in vitro” and “in vivo” analysis. Aerosol with realistic composition,
including living micro-organisms, can be injected in artificial environments with controlled physical and chemical parameters
and then accurately analyzed. In particular, a systematic approach can be used for a better description of micro-organisms
viability, of colonies growing modulation of and other issues relevant to their spread and their pathogenicity. Very promising
results in this direction were obtained by the authors at the CESAM facility at CNRS-LISA (Brotto et al, 2015) and will be
presented here, while similar results were obtained nearly at the same time at AIDA chamber at KIT (Amato et al, 2015).
1) Aerosol optical properties – methodologies and instruments testing
The instrumental development efforts at the Environmental Physics Laboratory of the University of Genoa, recently resulted
in a new Multi Wavelength Absorbance analyzer (Massabò et al. 2015) which measure the light absorption on aerosol loaded
filters at five wavelengths from UV (absorption bands of organic compounds, mineral dust) to near infrared (carbon soot, ...).
Furthermore, a new data reduction methodology has been introduced to disentangle the concentration of Black and Brown
carbon in atmospheric aerosol, demonstrating the need to mitigate not only exhaust but also non-exhaust emissions, as a
potentially important source of PM10. The atmospheric chamber is an effective tool to produce known aerosol mixtures and
to test the performance of the optical technology. Actually, there is an on-going collaboration with the CNRS-LISA team
working at CESAM following that procedure.
Acknowledgement
We would like to acknowledge prof. J.F. Doussin and LISA laboratories (http://www.lisa.univ-paris12.fr/en) for providing us
part of the chamber structure and for the very useful and fruitful technical discussions
References
Amato, P., Joly, M., Schaupp, C., Attard, E., Möhler, O., Morris, C. E., Brunet, Y.., and Delort, A.-M.: Survival and ice
nucleation activity of bacteria as aerosols in a cloud simulation chamber, Atmos. Chem. Phys. Discuss., 15, 4055-4082,
doi:10.5194/acpd-15-4055-2015, 2015
Brotto P, Repetto B, Formenti P, Pangui E, Livet A, Boussherrine N, Martini I, Varnier O, Doussin JF, Prati P (2015) Use of
an atmospheric simulation chamber for bioaerosol investigation: a feasibility study, Aerobiologia, doi:0.1007/s10453-015-
9378-2
Massabò D, Caponi L, Bernardoni V, Bove MC, Brotto P, Calzolai G, Cassola F, Chiari M, Fedi ME, Fermo P, Giannoni M,
Lucarelli F, Nava S, Piazzalunga A, Valli G, Vecchi R, Prati P (2015) Multi-wavelength optical determination of black and
brown carbon in atmospheric aerosols, Atmospheric Environment, doi:10.1016/j.atmosenv.2015.02.058
Fig.1 ChAMBRe layout structure and pictures

62
QUANTIFYING AIR POLLUTION EXPOSURE USING WEARABLE SENSORS AND MOBILE PHONES
N. Castell, P. Schneider and W. Lahoz
Norwegian Institute for Air Research (NILU), Instituttveien 18, NO-2027 Kjeller, Norway
Presenting author email: [email protected]
Summary
Quantifying human exposure to air pollutants is a challenging task. In urban areas, air pollution presents a high spatial and
temporal variability. At the same time, every individual has unique activity-patterns that will result in a different exposure to
air pollution. In this work we explore how new developments in sensor technology (i.e. low-cost sensors, smart phones) can
enable us to monitor personal exposure to air pollutants while people are performing their daily activities.
Introduction
Exposure assessment has been defined as “… the process of estimating or measuring magnitude, frequency and duration of
exposure to an agent…” (Zartarian et al., 2007). The traditional method of assessing human exposure is to estimate
population-wide annual (long-term) or daily (short term) average exposure concentrations, using fixed monitoring networks
and air quality models. This type of assessment, operating on aggregated data does not provide a representative measure of an
individual's personal exposure as it assumes exposure of individuals to the air pollution levels at their residential address and
ignores the impact of individual mobility and activity patterns, especially time spent away from home.
Personal exposure assessment is evolving quickly and latest advances in technology enable the tracking of individuals while
simultaneously estimating or measuring pollutant concentrations (Castell, et al., 2014).
Methodology and Results
In this work, we present two methods for monitoring the movement of individuals and assess their exposure to air pollutants
during their regular daily routines. The first approach represents a direct exposure from measurements made while the subject
is carrying a low-cost air quality sensor and a smart phone while moving through the environment, for example on foot or by
bicycle. The data from the sensor is combined with the GPS data to estimate exposure. The second approach is an indirect
exposure estimation where the individual only carries a smartphone. The GPS data obtained from the mobile phone is
integrated with air pollution data obtained from air quality models to estimate the individual exposure along a given track.
In both approaches the exposure is computed by averaging the concentration along a line segment and multiplying it by the
time spent on this segment. Moreover, if we know the heart rate of the individual it is possible to estimate the inhalation rate
(ventilation) and asses the inhaled dose over a track. This is important because differences in the ventilation will influence the
inhaled doses of air pollution. Zuurbier et al. (2009) shows that ventilation levels of cyclists are on average two times higher
than those of bus and car passengers.
Both of the both approaches have been tested in Oslo, Norway. The advantage of using a wearable sensor is that it is possible
to capture different micro-environments (e.g. inside the bus, in the office), however data accuracy from low-cost sensors
presents a challenge. The advantage of merging the GPS data with an air quality map is that the individual does not need to
carry a sensor, making the approach applicable for addressing larger populations. In the second approach, it is also possible to
produce exposure estimates over hypothetical routes or routes that the individual plans to take in the future. The main
disadvantage is that only outdoor air pollution is estimated and it is not possible to estimate the exposure in micro-
environments.
Conclusions
The initial field trials in Oslo indicate that low-cost sensor technologies offer the possibility to enhance existing methods for
quantifying exposure to air pollutants. However, the main challenges to using these technologies include precision and
accuracy of the low-cost sensors measurements. Results show that the combination of tracking devices (e.g. GPS from
mobile phone) and air quality maps can provide an automated system to provide personalized air quality information. The
methodology is able to incorporate activity sensors to monitor heart rate for estimating personal air pollution inhalation
dosage. This information will be of interest to citizens.
Acknowledgement
CITI-SENSE has received funding from the European Union's Seventh Framework Programme for research technological
development and demonstration under grant agreement no 308524.
References
Castell, N., et al., 2014. Mobile technologies and services for environmental monitoring: The Citi-Sense-MOB approach.
Urban Climate. http://dx.doi.org/10.1016/j.uclim.2014.08.002.
Zartarian VG. et al., 2007. Basic concepts and definitions of exposure and dose. In: Ott Wr, Steinemann AC and Wallace LA,
editors. Exposure analysis. Boca Raton: Taylor & Francis.
Zuurbier, M. 2009. Minute ventilation of cyclists, car and bus passengers: and experimental study. Environmental Health 8,
48-58.

63
PROVIDING VERTICAL GRADIENT CONCENTRATION MEASUREMENTS FOR INTERCONNECTED
STUDIES ON AIR QUALITY AND CLIMATE CHANGE
A. Dvorská (1), K. Komínková (1, 2), M. Čampulová (1, 3) and V. Hanuš (1)
(1) Global Change Research Centre, Bělidla 4a, 60300 Brno, Czech Republic; (2) Masaryk University, Kotlářská 267/2,
61137 Brno, Czech Republic; (3) University of Defence, Kounicova 65, 602 00 Brno, Czech Republic
Presenting author email: [email protected]
Summary
The recently built Atmospheric Station (AS) Křešín u Pacova, central Czech Republic, is focused on the background
measurement of greenhouse gases, selected atmospheric pollutants and basic meteorological characteristics. The footprint of
the 250 m tall tower of the AS covers predominantly western and central Europe. The example of ozone is used to
demonstrate the usefulness of automated statistical procedures allowing for easy, fast and especially objective outlier
measurement identification during the validation of highly timely resolved concentration data.
Introduction
Air quality, composition and climate change are interconnected research areas as greenhouse gases are often emitted from
same sources as air quality parameters. Further, many chemical species are significant players in both climate change and air
quality. The environmental fate and cycling of persistent substances is likely to be changed due to climate change and
changes in air pollution meteorology in general. Well designed research infrastructures are needed in order to ensure high
quality measurement data for such multidisciplinary research.
Methodology and Results
The AS consists mainly of a 250 m tall atmospheric tower and is equipped with continuous gas (CO2, N2O, CH4, CO, O3, Hg)
and particle analyzers, a flask sampling system, meteorological sensors and a ceilometer. The station was built in 2013 and
equipped according to the recommendations of the Integrated Carbon Observation System. Air quality measurements follow
recommendations of ACTRIS, GMOS, EMEP and GAW. Air sampled at the AS originates predominantly from western and
central Europe as calculated by the STILT model (Lin et al., 2003) for individual seasons of the chosen representative year
2011 (Fig. 1). Ozone measurements are conducted by three Thermo Scientific 49i instruments located in air-conditioned
racks in 50, 125 and 230 m height on
the tower. In order to ensure an
objective criterion for identifying outliers in the highly variable measurements, advanced statistics (non-parametric kernel
regression, changepoint analysis) were applied to the 1 min measurement data series (Fig. 2) in an automated procedure.
Comparison with manually validated data proved it to be a useful tool helping the validator to objectively decide on flagging
outlier measurements.
Conclusions
Due to a broad spectra of monitored parameters, production of large unique datasets, ensuring of high quality measurements
and vertical concentration sampling design the AS Křešín u Pacova is a suitable infrastructure for conducting
multidisciplinary research in both air quality and climate change.
Acknowledgement
This work was supported by the Ministry of Education, Youth and Sports of the Czech Republic within the National
Sustainability Program I (NPU I), grant number LO1415.
References
Lin J.C., Gerbig C., Wofsy S.C., Andrews A.E., Daube B.C., Davis K.J., 2003. A near-field tool for simulating the upstream
influence of atmospheric observations: The Stochastic Time-Inverted Lagrangian Transport (STILT) model. J. Geophys.
Res., 108(D16), 4493.
Fig.1 Summer (Jun, Jul, Aug) 2011 footprint
of the AS Křešín u Pacova Fig.2 Measurement records of ozone concentrations in three heights on 13 February,
2014 with critical boundaries in blue and red values automatically flagged as outliers

64
MEASUREMENTS OF PM FLUXES AND SIZE SEGREGATED CONCENTRATIONS ABOVE THE CITY OF
NAPLES
D.Famulari(1), I. Russo(1), D.Piscitelli(1), P.DiTommasi(1), A.Esposito(1), M.Tosca(1), G. Agrillo(1), B.Gioli(2) ,
E.Magliulo(1), A.Zaldei(2), A. Riccio(4), A.Mazzarella(3), R.Viola(3), N. Scafetta(3), P.Toscano(2)
(1) Institute for Mediterranean Agriculture and Forest Systems (CNR-ISAFOM), Ercolano (Na), 80040, Italy; Institute
of Biometeorology (CNR-IBIMET), Firenze, 50145, Italy; (3) University of Naples “Federico II” (DISTAR), Largo S.
Marcellino 10 - Napoli, Italy; (4) University of Naples “Parthenope”, Department of Applied Science, Via De Gasperi 5,
80133 — Napoli, Italy
Presenting author email: [email protected]
Summary
A super-site for the measurement of atmospheric pollutants from urban sources has been established in Naples, Southern
Italy, within a project supported by the region Campania (AriaSaNa) targeting a better understanding – through observations
and modelling - of pollutants dynamics in the Mediterranean region of Campania, in order to improve support to policy
making. In this work the authors will present the results from the first year of activity for the measurements of PM.
Introduction
With a population of circa 4 million (around 1 million within the city), the metropolitan area of Naples(Campania, Southern
Italy), has one of the highest densities in Europe, with consequent impacts in terms of emissions associated with
diesel/gasoline exhaust, industrial emissions, agricultural burning and waste disposal problem. The area is characterised by
complex layout of the coast and surrounding mountains, which favour the development of combined sea breeze upslope
winds and the evolution of return flows with several layers of pollutants and subsidence. This study aims at detecting the
influence of the different sources of PM on the air quality in Naples.
Methodology and Results
The super-site, located at the meteorological observatory of Largo San
Marcellino (NA), consists of an eddy covariance tower on the rooftop of the
building: a fast response ultrasonic anemometer (Gill WindMaster) has been
mounted on a 10-m mast, alongside three insulated inlet lines through which
the air is sampled for reactive, non-reactive gases and particulate. The height of
the terrace is on average 35 m above the irregular street level, resulting in an
overall measuring height of 45 m. Mixing ratios of CO2, CH4 and H2O are
measured by an infrared spectrometer (10 Hz, Los Gatos Research); O3 mixing
ratios are measured by a fast analyser (10Hz, FOS Sextant) for the calculation
of fluxes, and referred to concentrations measured by a slower analyser (2B-
Technologies, 205). NO is continuously quantified (8 Hz) using an analyser by
Eco Physics (model CLD 88p, associated with a photolytic converter PLC
860). Size segregated aerosol are measured by gravimetric method at an
hourly/daily frequency through a SWAM 5A Dual Channel (PM10 and PM2.5,
FAI Instruments). A faster optical particle counter (4 Hz, FAI Instruments) is
set up for the estimate of fluxes - as well as concentrations – of 22 classes of
particles diameter. All analysers outputs are synchronised with the ultrasonic
anemometer through a common acquisition at 10 Hz using a CR3000
datalogger (Campbell Scientific). A full weather station is also available as
ancillary measurements at the site including two webcams to record
exceptional events to aid interpretation of the results. During the first year after
the installation of the supersite, size segregated particles concentrations and
fluxes were recorded. We could observe several events of pollution from
separate sources, and found that PM composition is mostly fine particulate: in
fact, PM1 explains >70% of PM10 variation.
Conclusions
The Largo San Marcellino supersite provided during its first year a continuous
dataset for several urban pollutants in terms of concentrations and fluxes.
The dataset allows to explore the effect of seasonality and meteorology for the measured pollutants over the city of Naples, as
well as the identification of the main urban pollution sources, presenting different characteristics among road, sea and air
traffic.
Acknowledgement
This work was supported by Regione Campania (under the AriaSaNa project). We acknowledge prof. P.Petrosino at the
Department of Earth Science of Federico II University, for the usage of the department laboratories, and the kind
collaboration.
Fig.1 The EC tower at Largo San
Marcellino, featuring the ultrasonic
anemometer, the inlet lines for the gasses and the sampling head for PM.

65
OPERATION OF A LOW-COST NO2/O3 SENSOR NETWORK IN ZURICH: PERFORMANCE ANALYSIS AND
APPLICATIONS
M.D. Mueller (1), Ch.Hueglin (1)
(1) Empa, Swiss Federal Laboratories for Materials Science and Technology, Laboratory for Air Pollution/Environmental
Technology, Duebendorf, Switzerland.
Presenting author email: [email protected]
Summary
We engineered together with Decentlab GmbH (Duebendorf, Switzerland) eight NO2/O3 measurement nodes. After a three
months lasting calibration period, the nodes were deployed in the city of Zurich forming a small sensor network starting in
June 2015. Our research focuses on the performance of the individual sensors in terms of calibration requirements, accuracy
and long-term stability as well as the development of efficient and effective algorithms for quality assurance and control
procedures in low-cost air quality monitoring networks. Moreover, it includes the assessment of urban air quality based on
data from low-cost sensors.
Introduction
Recent progress in gas sensor technology has yielded inexpensive devices (~100 $) which are sensitive to ambient pollutant
concentrations. This allows the deployment of sensor networks consisting of a large number of nodes (Mead et al., 2013).
The usefulness of such networks depends strongly on the value of the information they provide.
We identified two main research questions from this situation:
The first one addresses the generation of routines for the performance analysis of individual sensors w.r.t. calibration
requirements, accuracy and long-term stability. In addition, it includes the investigation and development of efficient and
effective algorithms for quality assurance and control (QA/QC) within a low-cost sensor network.
The second question focuses on the identification of application fields where dense sensor networks provide additional value
compared to existing measurement facilities. These may be found in highly resolved air quality assessment in urban
environments and the computation of exposure values. Both applications, however, require a sufficiently high accuracy of the
deployed sensors.
Methodology and Results
Decentlab GmbH and Empa engineered eight sensor nodes denoted as Aircubes (box 1: 2 Aeroqual
O3 SM50, GSM module; box 2: 3 Alphasense NO2 B42F, temperature and humidity; Fig. 1). At first,
the Aircubes were operated in parallel to reference instruments at air quality monitoring stations for
sensor calibration during 3 months. Since June 2015, they have been operating in a small sensor
network in Zurich. The network covers a wide range of urban pollution situations and complements
the six air quality monitoring stations in the city of Zurich operated for regulatory purposes by the
municipality and the federal authority.
The data from the sensor network is analysed in terms of accuracy and long-term stability of the
individual sensors. Algorithms for quality assurance and control within air pollution sensor networks
are developed and applied to the data. Such concepts are a prerequisite for minimizing manpower as
a substantial cost factor in network operation. Hereby, we make use of the dense reference networks
in Zurich which provide accurate information on the pollutant situation in Zurich. Moreover, two-
week NO2 passive sampler measurements at the sensor locations allow a direct assessment of the
sensor data. In addition, we present the usability of the sensor data for applications such as the
mapping of air pollution concentrations in urban environments (Mueller et al., 2015) focusing on
high temporal resolutions (~1h).
Conclusions
Dense sensor networks offer a unique potential for air quality monitoring, especially in cities.
However, the use of state-of-the-art low-cost sensors within sensor networks requires novel and
dedicated routines for sensor calibration and for quality assurance and quality control. Continued
operation of the deployed sensor network in Zurich will shed light on the long-term stability of the
sensors under field conditions and elucidate the quality of the obtained data and therefore its
usefulness for urban air quality assessment.
Acknowledgement
This work was supported by the Swiss State Secretariat for Education, Research and Innovation (SERI) within the COST
Action TD 1105 EuNetAir and the Swiss Federal Office for the Environment (FOEN).
References
Mead, M. I., O. A. M. Popoola, G. B. Stewart, P. Landshoff, M. Calleja, et al., 2013. The use of electrochemical sensors for
monitoring urban air quality in low-cost, high-density networks. Atmospheric Environment 70(0): 186-203.
Mueller, M. D., M. Wagner, I. Barmpadimos, Ch. Hueglin, 2015. Two-week NO2 maps for the City of Zurich, Switzerland,
derived by statistical modelling utilizing data from a routine passive diffusion sampler network. Atmospheric Environment,
106, pp. 1-10.
Figure 4: Aircube
mounted at a utility
pole in the city of
Zurich.

66
BIOTAIR: BIOFILTRATION FOR ROAD TRAFFIC EMMISSIONS, APPLICATION TO A ROAD TUNNEL
J-F. Petit (1), P. Barbe (1), M. Bouquet (1), C. Neaud (1), L. Meffray (1), J-F. Burkhart (2), B. Vidal (2), O. Borot (3),
B.Goussebayle (3), D.Muller (4)
(1) Centre d’Etudes et d’expertise sur les Risques l’Aménagement la Mobilité et l’Environnement (CEREMA) Dter Ile de
France, Trappes, 78190, France, (2) Centre d’Etudes des Tunnels (CETU), Bron, 69974, France, (3) Phytorestore, Paris,
75020, France, (4) Ecologie Microbienne de Lyon, Université Claude Bernard Lyon 1, Villeurbanne, 69622, France
Presenting author email: [email protected]
Summary
The objective of BIOTAIR was to assess the effectiveness and sustainability of biofiltration technology to treat road airborne
effluents. To this end, three scale reduced biofiltration devices, have been set up on a platform situated above a road tunnel
near Paris. Two of them were supplied with an air stream (1 to 3 m3/sec) extracted from the tunnel. The two biofilters had a
respective substrate thickness of 50 (BF50) and 100 cm (BF100). The third biofilter (thickness of 50 cm) was not supplied with
stale air and was assigned the role of the witness. The observation over 18 months and a complete meteorological cycle
shows a technique we can consider effective on many pollutants and with a predicted good durability.
Introduction
In order to reduce the impact of road emissions on the air quality in major cities, and to complete the actions on traffic and
new requirements on the motors exhaust, the original idea of this project was to adapt a reliable water treatment technology
to stale air extracted from a real road tunnel.
Methodology and Results
Four measurements campaigns were conducted on this site over the 18 months
During each period of measurements several air pollutants (nitrogen oxydes,
particulates, BTEX and ammonia) have been watched using different methods
(continuous measurements, passives tubes and samples). The target was to
indicate the reduction achieved for each pollutant between upstream and
downstream of biofilter. The chemical compositions of water (pH, NO3-) and
soil (Polycyclic Hydrocarbons Aromatics PHA, Total hydrocarbons, metals)
were also observed. A monitoring of the development of microbial activity was
conducted through analysis of DNA from the ground massive sequencing of 16
S DNA. A Life Cycle Analysis (LCA) completed the study. The results are
satisfaying for nitrogen dioxide with an average reduction during the project of
58% by the BF50 and 81% by the BF100, (dissolution of this pollutant in
aqueous phase) The level of NO3- in water is acceptable due to small volumes
of water released into the environment. The purification yields observed on
particles are satisfying. For the BF100 the purifyng rate is 61% for PM1, 93% for
particles between 1 and 2.5µm and 91% for them between 2,5 and 10 µm. Also,
for Ammonia and BTEX the yields are at least of 40% high. The monitoring of
the solid shows that for all compounds, the values observed after 18 months in
the 3 biofilters are similar and at the same order than in the initial substrate. The
monitoring of microbial indicate that all factors consider (sampling periods,
depths, or substrate thickness) the seasonality is the major influence factor to the
structuration of bacterial communities. Moreover, some species or microbial
genera well know for they bio-remediation activities were found in the two
active biofilters whereas they were not in the witness. Finally the LCA has
helped to clearly demonstrate the major impact of electric consumption (80%)
compare to the other criteria (construction, water consumption). The double
impact of the thickest biofilter compare to the small one was also observed on
the three majors categories (impact on human health, depletion of resources, and
impact on biodiversity).
Conclusions All the experimental data allow to conclude that the biofiltration treatment has a real potential to reduce air pollutants from
road traffic and a rather good predectible durability. An optimization of design, sizing, and implementation could further
significantly strengthen this potential and reduce the consummation of electricity for installation on an entire tunnel.
Acknowledgement
This work was supported by the ADEME (n° contract 1162c0010)
References
Petit J-F., Le Priol T., Bouquet M., Barbe P., Bernagaud C., Vidal B., Borot O., Muller D., Faugier F., 2014. BIOTAIR:
Evaluation de la Biofiltration pour le traitement des émissions atmosphériques routières, rapport final (convention
n°1162c0010), ADEME, 156 pages, www.ademe.fr
Fig.1 Overview of the experimental site with : the shelter receiving the extraction fan
module, the pipe carrying the exhaust
coming from tunnel, the biofilters fed from below with exhaust air and at the foreground
the witness biofilter. On the two actives
biofilters the sampling chambers linked with the equipments measurements and in the
background stand the water tanks used for
the irrigation of the biofilters

67
HOURLY REPARTITION OF HYDROGEN SULPHIDE FROM GAS MEASURE DOWNWIND OF A LANDFILL
V. Pierre-Georges (1), J. Molinie (2), C. Bassette (2), F. Bade (2), P. Nuiro (3)
(1) Universite d’Etat d’Haiti, Port au Prince, Haiti; (2) Laboratoire de Recherche en Géosciences et Energies (LARGE),
Universite des Antilles, Campus de Fouillole, 97159 Pointe-a-Pitre, Guadeloupe, French West Indies; (3) Laboratoire de
Mathematiques Informatique et Applications (LAMIA), Universite des Antilles, Campus de Fouillole, 97159 Pointe-a-Pitre,
Guadeloupe, French West Indies
Presenting author email: [email protected]
Summary
The main goal of this study is to determine the biogas impact of landfill on surround area. In absence of allowed
measurement, we have performed measurements downwind of the landfill position in order to found the point of maximum
concentration of the gas tracer H2S. We observed a behaviour revealing the influence of sun energy effect on gas emission.
Using the maximum value and the win data, we estimated the emission of the landfill. We obtained the calculated
concentration in H2S for the region downwind of the landfill and evaluated the impact of the biogas emit on neighbouring
populations.
Introduction
Household and similar wastes are become a real problem in modern society and the increasing quantities requiring disposal
led to the use waste incinerator and the open landfill for surplus. The open landfill, with flying plastic bags and biogas
emission, creates nuisance for the neighbouring environment and population. The main gases produced by waste
decomposition are VOCS (Volatile Organic Compounds) and hydrogen sulphide (H2S). In our study located in Guadeloupe,
a Caribbean island, we used hydrogen sulphide as a tracer gas to determine the impact of a landfill over the downwind
neighbouring lands.
Methodology and Results
We performed measurements in heigt positions determined along
three directions from the center of the landfill to the downwind
region (Fig.1). From April to May of 2015, we obtained the H2S
concentration values in a range between 0 to 5ppm. For every
measurement day, we have observed the maximum value positioned
at the same point. The analysis of the daily behavior of the H2S has
permitted to correlate the gas concentration levels and the hours.
From 0 ppm, in the night, until early morning hours, the H2S
concentration is increasing. Taking the value 1 ppm around 5 am,
the concentration reaches her maximum value around
midday(Fig.2). After, it decreases and returns to 0 ppm just before
the sunrise. This belt behavior, due to the H2S waste production, is
probably related to the thermal energy delivered by the sun. In
absence of available data from the landfill, we have calculated an
approximation of the emission value of the landfill with our
measures of H2S concentration and the wind data (speed, direction).
We find a flux emission of H2S close to 100 kg s-1. We used this
value of the landfill emission flux to determine, with the wind data, a
hourly repartition of H2S concentration over the neighboring area.
With this result we can evaluated the impact on population leaving
downwind of this biogas emiting point.
Conclusions
We find a dependence between sun hours and concentration of H2S
downwind of the landfill. The total emission flux of H2S has been
evaluated using wind speed and direction, and the maximum
concentration in one point. We calculated the hourly impact on
neighbouring population.
Acknowledgement
We acknowledge PR Olivier GROS for his help for the measurements on the “Rivière Salée”, which performed with the
Marine laboratory boat.
Fig.1 Landfill area and measure points
Fig.2 H2S daily behaviour concentration

68
LONG-TERM OIAP SPECTROSCOPIC DATASETS, TYPICAL AND ABNORMAL VARIATIONS AND
TEMPORAL TENDENCIES IN BACKGROUND AND URBAN CO AND CH4
E. Grechko1, A. Dzhola1, V. Rakitin1, E. Fokeeva1, G. Wang2
1. Obukhov Institute of Atmospheric Physics RAS, 3, Pyzhevsky per., Moscow, Russian Federation; 2. Institute of
Atmospheric Physics CAS, China, Beijing
Presenting author email: [email protected],[email protected]
Summary
Goal of present work is investigation of anthropogenic impacts on air quality and atmospheric composition in background
and urban regions. The results of regular ground-based spectroscopic measurements of CO and CH4 atmospheric total content
(TC) in Moscow, Beijing, Zvenigorod (ZSS station, Moscow region, 53 km west from the center of Moscow) and the station
ZOTTO (Central Siberia) are analyzed. For ZSS the longest in the world measuring data-set of these impurities TC (from
1970 for CO and from 1974 to present for CH4) was analyzed. Regional and local characteristics of CO and CH4 total
contents (TC) variability are discussed.
Introduction
Global climate changes always accompanied by regional and local changes in atmospheric composition. The relationships
between them especially in urban regions are different for different time-periods and sites. This work continues a series of
previous articles devoted to the study of air pollution in different regions of Russia and China (G. Golitsyn at al, 2015, E.
Grechko at al, 2009, V. Rakitin at al. 2011).
Results
Several characteristic periods of interannual variations of total CO at ZSS are highlighted: an increase in the 70-80s of last
century (0.8%/year), the stabilization in the 80s and a decrease since 2001 (1%/year for winter). The influence of the Moscow
metropolis on the CO content at the ZSS was small (Moscow's influence leads to a 10% increase in background columns less
than at 5 % of all ZSS measurements number), see Fig.1. The rate of decrease of CO TC Moscow anthropogenic portion is
1.4 % per year for 1992–2014 years in spite of multiple increase of the
motor vehicles number. There are no significant changes in CO TC
over Beijing during whole period of measurements (1992–2014 years),
see fig. 2. Relatively small CO decrease was observed in Beijing in
2006-2014 years comparing with time-period of 1992-2005. AIRS v6
satellite data has demonstrated CO TC stability in Moscow rural
region and it decrease over all Chinese regions in 2007-2014 years.
The variations of CO in the Moscow region (site ZSS) during the
wildfires of summer 2010 and in Central Siberia (station ZOTTO)
during the forest fires of 2011 and 2012 were Investigated. It’s found
that the total content of CO during these episodes of abnormal
disturbances exceed 2-5 times the typical background TC. CH4 content
on ZSS increased during the whole observation period (0.5 % / year in
1974-2014). Also some results of validation satellite and ground-based
spectrometers for background conditions and diurnal means of CO and CH4 TC are presented.
Conclusions
Typical levels of atmospheric CO and aerosols pollution in Beijing is 2–5 times stronger in comparison with Moscow ones.
Reasonably typical of atmospheric pollution events for Beijing with extreme values of CO TC and aerosols concentrations
were observed in Moscow during wild fires of 2002 and 2010 years
only. Trajectory cluster analysis using has allowed investigation of
location of CO and aerosols emissions sources. Relatively stronger
atmospheric pollution of Beijing partially due to the atmospheric
transportation from distant industry regions of China located at 100-
500 km from Beijing toward south, south-east and east directions.
Satellite observations (products AIRS v6 and IASI) demonstrates
good agreement with spectroscopic ground-based data in
background sites and underestimates CO TC in polluted conditions
(wild fires, Beijing region) at 1,5-3,8 times.
Acknowledgement This work was supported by the Russian Scientific Foundation under grant
№14-47-00049 and partially by the Russian Foundation for Basic Research
(grant № 14-05-91160).
References Grechko E. I., Dzhola A. V., Rakitin V. S., Fokeeva E. V., and Kuznetsov R. D. Variations of the Carbon Monoxide Total Column and Parameters of the Atmospheric Boundary Layer in the Center of Moscow //
Atmospheric and Oceanic Optics, 2009, V 22, №02, P.203-208.
V.S. Rakitin, E.V. Fokeeva, E.I. Grechko, A.D. Dzhola, R.D. Kuznetsov. Variations of carbon monoxide in the atmosphere of the
Moscow megacity // Izvestiya, Atmospheric and Oceanic Physics, 2011, V 47 , № 1, PP. 59-66
G. S Golitsyn, E. I. Grechko, Genchen Wang, Pusai Wang, A.V. Dzhola, A.S. Emilenko, V. M. Kopeikin, V. S. Rakitin, A. N. Safronov, E. V. Fokeeva. The investigation of CO and aerosols atmospheric pollution in Moscow and Beijing // Izvestiya, Atmospheric and Oceanic
Physics, 2015, V 51, № 1, PP.1–12
Fig.2. Annual variations in anthropogenic portion of
CO TC in Moscow and Beijing
Fig. 1. An impact of different sources on CO
TC in Zvenigorod.

69
STUDY OF CHEMICAL TRANSFORMATION IN A PHOTOCHEMICAL CHAMBER OF EXHAUST
EMISSIONS FROM SMALL BIOMASS BURNNING STOVES
F. Reyes (1,2), Y. Vázquez (1,2), 1, G. López (1), N. López (2,4), M. A. Rubio (2), E. Lissi (2), A. Cádiz (3), P. Oyola (1)
(1) Mario Molina Center Chile, Santiago de Chile, Chile; (2) Santiago University of Chile, Chile; (3) Vehicle’s Control and
Certification (3CV), Chile; (4) University of Chile, Chile
Presenting author email: [email protected]
Summary
Photochemical chamber experiments were conducted to investigate the chemical and physical transformations of secondary
aerosol formed from wood and pellet stoves emission. The ozone and particles concentration increase during UV irradiation
show that biomass emission are allow to occur, and the amount is depend of the initial NOx and particles concentration inside
the chamber. Pellet vs wood comparison shows that secondary particles formation takes more time on the former.
Introduction
Small combustion devices for heating purposes are one of the most important sources of particles in Chilean ambient air. The
emission from biomass stoves are an important source in Chile’s central and south part, hence there is a big concern about the
control’s politics to be implemented in the next years. Biomass combustion also emits significant quantities of organic gases
and vapours, those are also susceptible to react in the atmosphere and contribute as secondary aerosol. Photochemical
chambers offer good way to investigate secondary chemistry details under controlled conditions. Here, chemical
transformation of the particle emissions emitted from a pellet and wood stove were investigated on a photochemical chamber.
Methodology and Results
A Dynamic Photochemical Chamber (DPC) was developed by Harvard
University. DPC is a Teflon bag-style of 14 m3 cube-shape, mounted
inside of a wooden enclosure. 180 UV lights (340 nm) were used to
irradiate the fresh biomass emissions captured inside the chamber. In
order to fill the DPC with primary emission a small amount of
pollutants coming from pellet and wood stoves (once at a time) was
transport directly to the chamber for 5-10 minutes (without any
dilution). Pollutants captured inside the chamber were leaved on
darkness (UV lights OFF) for 30 minutes to have a homogeneous air
inside the chamber. After that, UV lights was turned ON. NOx, CO,
Ozone, PM2.5, DMPS (differential mobility particle measurement) and
ACSM (Aerosol Chemical Speciation Monitor) monitors was used to
measure gases and particles transformation. Monitors was always
measuring during all chamber process (cleaning, filling, darkness and
UV irradiation). During UV irradiation mass concentrations of particles
and gases showed very high variability among different experiments. To
see ozone concentration increase inside the chamber (Figure 1) it was
necessary to reach NOx concentration close to 1 ppm during the filling
process. A very high variability in secondary aerosol formation was
observed that was proportional to the high amounts of precursor
primary emissions concentrations. Secondary particles formation are
quenched on very high particles concentration. With the increase of UV
irradiation time the secondary particles are growing to higher diameters
(Figure 2), composed mainly of nitrates and organics particles. Pellet vs
wood comparison shows that secondary particles formation takes more
time on the former.
Conclusions
Secondary particles formation coming from biomass stoves emission occurs a very high NOx emission. With less initial
particles concentration secondary aerosol take less time to react, and reach higher values of secondary aerosol inside the
chamber. Pellet vs wood comparison shows that secondary particles formation takes more time on the former.
Acknowledgement
We acknowledge to Vehicular Control And Certification (3CV) and Energías del Sur enterprise for the their collaboration in
all the experiments.
References
Papapostolou, V., Lawrence J. E., Ferguson S. T., Wolfson J. M., Diaz E. A., Godleski J. J., Koutrakis, P.. 2013.
Development and characterization of an exposure generation system to investigate the health effects of particles from fresh
and aged traffic emissions. Air Quality Atmosphere & Health. 2013, Vol 6, Issue 2, pp 419-429
Figure 1: Ozone concentration inside the
chamber for five experiment
Figure 2: Particle number concentration during UV
irradiation.

70
HIGH RESOLUTION MAPPING OF THE TROPOSPHERIC NO2 DISTRIBUTION IN THREE BELGIAN CITIES
BASED ON AIRBORNE APEX REMOTE SENSING
F. Tack (1), A. Merlaud (1), T. Danckaert (1), C. Fayt (1), H. Yu (1), M.-D. Iordache (2), F. Fierens (3) K. Meuleman (2),
and M. Van Roozendael (1)
(1) BIRA-IASB, Belgian Institute for Space Aeronomy, Avenue Circulaire 3, 1180 Brussels, Belgium; (2) VITO-TAP,
Flemish Institute for Technological Research, Boeretang 200, 2400 Mol, Belgium; (3) IRCEL-CELINE, Belgian
Interregional Environment Agency, Kunstlaan 1, 1210 Brussels, Belgium
Presenting author email: [email protected]
Summary
An algorithm is presented to retrieve tropospheric nitrogen dioxide (NO2) vertical column densities (VCDs) and to map the
NO2 spatial distribution at high resolution, based on the DOAS analysis of Airborne Prism EXperiment (APEX)
observations. APEX, developed by a Swiss-Belgian consortium on behalf of ESA (European Space Agency), is a pushbroom
hyperspectral imager with a high spatial resolution and high spectral performance. APEX data has been acquired under clear
sky conditions over the three largest and most heavily polluted Belgian cities, i.e. Brussels, Antwerp and Liège, on April 14
and 15, and June 30, 2015. Additionally, a number of background sites have been covered for the reference spectra. The
APEX instrument was mounted in a Dornier DO-228 airplane, operated by Deutsches Zentrum für Luft- und Raumfahrt
(DLR). The presented work is performed in the framework of the BUMBA project (Belgian Urban NO2 Monitoring Based on
APEX remote sensing), which aims at the validation and improvement of the novel RIO-IFDM high resolution air quality
model (Lefebvre et al., 2013). The RIO-IFDM model is developed in order to provide a risk assessment service for air quality
and pollution.
Introduction
Nitrogen dioxide (NO2) is an atmospheric trace gas and a key pollutant that deserves considerable attention as it (1) indirectly
affects the climate system, (2) is assumed to be a proxy for air pollution in general and (3) can have a direct health impact.
The main anthropogenic sources of NO2 in an urban environment are industrial and traffic related activities. NO2 is a
pollutant with a strong local character and exhibits concentrations that can be highly variable in space and time. The global
scale and coarse resolution of typically several tens of kilometers make spaceborne observations inadequate to detect the
small scale variability and to resolve individual emission sources. For the reasons stated, the accurate monitoring and
mapping of the NO2 levels at high spatial resolution are of great relevance.
Methodology and Results
The VCD retrieval algorithm based on APEX spectra, being solar radiation backscattered by the atmosphere or ground
surface, consists of the following main steps: (1) spatial aggregation of the observed radiance spectra in order to increase the
signal-to-noise ratio (SNR), (2) spectral calibration based on a high resolution solar spectrum (425 - 600 nm) (3) DOAS
analysis of the pre-processed spectra in the visible wavelength region (458 nm - 510 nm), with reference spectra containing
low NO2 absorption, (4) air mass factor calculations based on the
VLIDORT 2.6 radiative transfer model, accounting for albedo, aerosol
and NO2 profile shapes and viewing and sun geometry, in order to
convert slant (DSCDs) to vertical columns, and (5) georeferencing and
visualization of the NO2 spatial distribution in a GIS environment.
Preliminary results for a flightline acquired above Antwerp are shown in
Fig. 1. The flightline, acquired on April 15 around 11:20 LT under clear-
sky conditions and moderate WSW wind (3-4 Bft), covers the Antwerp
city center and a small eastern part of the harbor. Clear patterns of
enhanced NO2 can be distinguished with a mean VCD of 2.3 x 10¹⁶
molec cm-2 and maxima up to 6 x 10¹⁶. The detection limit is
approximately 4.4 x 10¹⁵ on the slant columns and 2.2 x 10¹⁵ on the
VCD. The observed NO2 plumes are transported east-norteast from the
harbor area, consisting of some heavy industry.
Conclusions
This study demonstrates that the atmospheric NO2 distribution in an urban environment, and its fine scale variability, can be
mapped accurately with high spatial resolution and in a relatively short time frame. For example the Antwerp area (harbor +
city center) covering approximately 500 km2 is mapped in less than 90 minutes. In addition to the increased understanding of
trace gas distribution and related chemical processes in urban areas, the outcome of this study is very valuable for the
calibration and validation of satellite products, chemical transport models (CTM) and high resolution air quality models.
Acknowledgement
The Belgian Federal Science Policy Office is gratefully appreciated for funding the presented work and the BUMBA project,
through the STEREO III Research Programme for Earth Observation (SR/00/310).
References
Lefebvre, W., Van Poppel, M., Maiheu, B., Janssen, S. and Dons, E.: Evaluation of the RIO-IFDM-street canyon model
chain, Atmospheric Environment 77, 325-337, 2013
Fig.1 AMF, slant error and VCD for Antwerp
flightline 08, acquired on April 15 around 11:20LT

71
SPATIAL DISTRIBUTION OF PARTICULATE MATTER AND NO2 ALONG THE BUSY FEDERAL HIGHWAY
B14 IN THE CITY OF STUTTGART - RESULTS OF MOBILE AND DIFFUSIVE SAMPLER MEASUREMENTS
U. Vogt (1), U. Reuter (2)
(1) University of Stuttgart, Department of Air Quality Control, Pfaffenwaldring 23, 70569 Stuttgart, Germany
(2) City of Stuttgart, Office for Environmental Protection, Gaisburgstr. 4, 70161 Stuttgart, Germany
Presenting author email: [email protected]
Summary
For the first time mobile measurements of particulate matter and NO2 were combined with passive sampler measurements
and stationary measurements. The mobile measurements were carried out using a bicycle equipped with measurement
instruments along the busy main road B14 with a number of of 80,000 to more than 100,000 vehicles per day. The road leads
several kilometers through the city of Stuttgart. The NO2 / NOx diffusive samplers in combination with the steady-state
measurements were arranged so that both the horizontal and the vertical distribution of concentrations could be measured. To
determine the urban background concentrations of some measurements off the main road (in the adjacent park and in the
outlying market square) were per-formed.
Summary
Introduction
LUBW (State Institute for Environment, Measurements and Nature Conservation Baden-Württemberg) operate in the local
state of Baden-Württemberg a monitoring network to determine the ambient air pollution. Among others so called spot
stations are located at highly polluted sites. One station in Stuttgart, the station "Am Neckartor", has attained celebrity in
Germany through the last 10 years, because of its high number of exceedances of the limit values of PM10 and NO2
concentrations.. The measurement station is located right next to the already mentioned, busy main road B14 in the adjacent
walkway in about 3 meters from the edge of the roadway. There are only buildings on the road side where the measurement
station is located. The opposite road side is open to a park. The city center of Stuttgart is located in the so-called "Stuttgart
basin", surrounded by hills of 200 to 300m. Thus the average wind speed in the city is low and the ventilation is inhibited.
The mobile measurements were deliberately carried out with a bicycle rather than with a car, be-cause the bike was moving
on the sidewalk, so that the measuring results obtained were comparable with those at the measurement station. The diffusive
samplers locations along the road were accordingly (uniform height and uniform distance from the road), so that they were
comparable as well.
Results
The results showed a very high spatial variability. For NO2, the concentrations in the park, which can be considered as urban
background level, only 30 to 50% of the measured values directly on the kerbside. The vertical decrease of approximately 3
m as standard measuring height up to 15 m in height (height of the buildings close to the measurement station) also was about
50%. Comparison of PM10 and PM2.5 concentrations on the road with urban background concentrations showed a less
striking difference, however was still very clearly measurable. The mobile measurements along the road showed in addition a
very large variability, depending on the aeration of the corresponding road sections. At road crossings or larger gaps between
buildings in the otherwise almost seamless roadside, the concentrations decreased immediately strong; turn more of NO2
than for PM10 and PM2.5.
Conclusions:
The absolutely highest concentrations were determined at the spot measurement station "Am Neckartor", although there is
not the highest traffic numbers and in contrast to other road sections there are buildings only at one sided development Of the
road. This unexplained result is currently investigated in a further study, the results of which will also be presented.

72
BIOMONITORING OF PAHS AND OXYGENATED DERIVATIVES (OPAHS)
C. Walgraeve (1), F, Van der Elst (1), P. De Wispelaere (1), H. Van Langenhove (1)
(1) Research group EnVOC (Environmental Organic Chemistry and Technology), Faculty of Bioscience Engineering,
Ghent University, Coupure Links 653, 9000 Ghent, Belgium
Presenting author email:[email protected]/[email protected]
Summary
An analytical method for the quantification of the 16 priority US-EPA PAHs and 12 oxygenated PAHs in Taxus baccata
leaves was developed and optimized. This is the first method developed, which is able to quantify PAHs and Oxy-PAHs in a
plant species during the same analytical run. Emphasis is given to the optimization of the pressurized solvent extraction,
clean up using solid phase extraction and high resolution mass spectrometry. The developed method is used to quantify PAHs
and oxy-PAHs concentration levels in Taxus baccata leaves sampled in Ghent, Belgium during spring 2015.
Introduction
PAHs and their derivatives are widespread in the environment. They are formed during incomplete combustion processes
(including both natural and anthropogenic sources). Oxygenated PAHs are also formed by secondary reactions in the
atmosphere (Walgraeve et al., 2010). These persistent organic pollutants are harmful for humans and oxygenated PAHs
contribute to the generation of reactive oxygen species ROS) in lung cells. In Flanders, mainly non-substituted PAHs are
measured on particulate matter samples. The high volume sampling of particulate matter is however expensive, time
consuming and labour intensive. An alternative with respect to the conventional techniques is biomonitoring. Hereby, plant
species are investigated with respect to their PAHs/oxy-PAHs concentration levels, which are indicative for the pollutant
concentrations in the atmosphere. The more volatile PAHs and oxy-PAHs are absorbed, while less volatile PAHs and oxy-
PAHs are physically deposited on the plant surface.
Methodology and Results
Pressurized liquid extraction with dichloromethane as extraction solvent was applied. Different PLE extraction temperatures
(between 50 and 200 °C) were evaluated. The possibility for in-cell clean up with Florisil was checked. Based the recoveries
and matrix effects factors, an extraction temperature of 200 °C using 1 g Florisil in the cell was finally selected as the optimal
condition. The clean up was not sufficient and further clean up was necessary. For the purification step, elution over solid
phase extraction cartridge (Florisil) was optimised. Different solvents (cyclohexane, dichloromethane) and mixtures were
evaluated and breakthrough profiles were obtained. The obtained cleaned up extract was finally analysed with GC-HRMS
(mass resolution: 10 000). The mass spectrometer was run in multiple ion detection (MID-mode). This enabled to detect and
quantify the compounds with high confidence.
Recoveries of the target compounds were ranging from 29 % to 110 %. Matrix effects were determined and ranged from 60
% to 140 %. The method was applied to Taxus baccata samples obtained from several sampling locations (traffic congested
sites, background sites) in Ghent. This is the first biomonitoring study in Ghent for PAHs and oxy-PAHs. The concentration
levels were in the lower ng/g dw. The presence of significant amounts of Oxy-PAHs in Taxus baccata was confirmed. This
means that these oxygenated PAHs are important pollutants and should be included in future monitoring studies. Diagnostic
ratio’s showed the 16 US-EPA PAHs were the result of pyrogenic processes and traffic emissions in particular.
Conclusions
A new analytical method based on high resolution mass spectrometry was developed to determine trace concentration levels
in a common plant in the area around Ghent. The different steps in the analytical process were thoroughly investigated and
optimized. Recoveries and matrix effects were determined. The final method was applied in a measuring campaign conducted
in Spring 2015. The results indicate that oxy-PAHs concentrations are significant when compared with the PAHs
concentration levels.
Acknowledgement
This work was supported by the DA grant of Ghent University (UGent).
References
Walgraeve, C., Demeestere, K., Dewulf, J., Zimmermann, R., Van Langenhove, H. (2010). Oxygenated polycyclic aromatic
hydrocarbons in atmospheric particulate matter: molecular characterization and occurrence. Atmospheric Environment 44,
1831-1846.

73
SOURCE APPORTIONMENT AND EMISSION MODELS-
INVENTORIES

74

75
MEASURING LANDFILLS CH4 EMISSION WITH AIRCRAFT, EDDY COVARIANCE AND CHAMBERS
TECHNIQUES
S. Di Lonardo (1), S. Cappello (2), P. Carlucci (2), P. Di Tommasi (2), A. Esposito (2), D. Famulari (2), D. Gasbarra (2), V.
Magliulo (2), D. Piscitelli (2), L. Shindler (2), P. Toscano (1), C. Vagnoli (1), L. Vitale (2), A. Zaldei (1), R. Baraldi (3), O.
Facini (3), C. Belli (4), P. Stefani (4) and B. Gioli (1)
(1) Institute of Biometeorology (IBIMET), National Research Council (CNR), Firenze, 50145, Italy; (2) Institute for
Agricultural and Forest Systems in the Mediterranean (ISAFOM), National Research Council (CNR), Ercolano, 80056, Italy;
(3) IBIMET-CNR, Bologna, 40129, Italy; (4) TERRASYSTEM Srl, Viterbo, 01100, Italy
Presenting author email: [email protected]
Summary
We report on the combination of multiple techniques (aircraft, eddy covariance and chambers) to assess CH4 emissions of
several landfills in Italy. Chambers were able to characterize the spatial variability of the continuum of the landfill but not the
presence of preferred localized fugitive emissions. The deploying of light aircraft and payloads in remote access areas to
characterize large-scale emissions with the presence of multiple sources supported measures in areas not covered by the eddy
covariance tower footprint. Landfills emissions where biogas extraction was present were on average an order smaller than
landfill without any extraction, demonstrating the benefit of biogas extraction not only in terms of energy production but also
of avoided GHGs emissions.
Introduction
Landfills are high emitting hot spots but their contribution to total GHGs budget in Europe is largely unknown (e.g. Bogner et
al., 2008). Monitored landfills differ in terms of topography, presence of biogas extraction, age and type of waste, and
maintenance, resulting their actual emission to the atmosphere basically not deliverable from inventorial methods. Here, we
show the combination of multiple techniques to assess CH4 emissions of several landfills in Italy.
Methodology and Results
From the one hand landfills emissions can respond on short time-scales driven by controls such as atmospheric pressure and
temperature, on the other hand they exhibit high spatial variability that needs to be sampled. We developed an experimental
framework capable of integrating measurements at different spatial and temporal scales: (1) cavity ring down spectroscopy
(CRDS) coupled with soil chambers (monthly campaigns); (2) open-path CH4 laser devices on eddy-covariance stations (in
continuous); (3) open-path CH4 laser devices on a SkyArrow
ERA (Environmental Research Aircraft) platform to sample
atmospheric transport coupled to CH4 plumes (campaigns).
CH4 emission measured with eddy covariance were on
average 0.49 and 6.34 µmol m-2 s-1, while measured with
CRDS on the same landfill were on average ten times lower,
suggesting that chambers were able to characterize the
spatial variability of the continuum of the landfill but not the
presence of preferred localized fugitive emissions. Landfills
emissions where biogas extraction was present were on
average an order smaller than landfill without any extraction,
demonstrating the benefit of biogas extraction not only in
terms of energy production but also of avoided GHGs
emissions (Fig. 1).
Aircraft flights were designed to sample the plumes
developing downwind individual landfills, arriving to
quantify the emissions of a larger areas with five landfills in
Giugliano at an average of 33 µmol m-2 s-1 (Fig. 2).
Conclusions
We showed the benefit of deploying light aircraft and
payloads in remote access areas to characterize large-scale
emissions with the presence of multiple sources, not covered
by the eddy covariance tower footprint. The main limitation
of aircraft measurements remains the capability to fly very
close to ground not sampling part of the plume when flying
very close the emission source; this limitation will be
overcome with the integration of ground mobile
measurements and UAV equipped with low weight sensors.
References
Bogner J., et al., 2008. Mitigation of global greenhouse gas emissions from waste: conclusions and strategies from the
Intergovernmental Panel on Climate Change (IPCC) Fourth Assessment Report. Working Group III (Mitigation). Waste
Management 26, 11-32
Fig.1 CH4 emissions detected with chambers and eddy
covariance station.
Fig.2 CH4 emissions detected with aircraft (x=424426.4 m E).

76
COMPARING A NEW GIS-BASED APPROACH FOR CALCULATING AREA-BASED PM2.5 EMISSIONS
LOADS WITH RESULTS FROM THE GAUSSIAN AIR POLLUTION DISPERSION MODEL OML-HIGHWAY
P. Gaffron
Institute for Transportation and Logistics, Hamburg University of Technology, 21071 Hamburg, Germany
Presenting author email: [email protected]
Summary
This study documents a new approach to quantifying pollutant dispersion from road traffic a in a geographic information
system (GIS) environment. The method is based on a loaded road network (from a travel demand model) and emissions
factors. It aims to provide an easy-to-use tool for estimating emission loads that is more precise than using e.g. traffic density
and at the same time less resource intensive than line dispersion models using Gaussian plume equations. The results of this
method will be compared to outputs from the Gaussian dispersion model OML-Highway (Danish Centre for Environment
and Energy) to enable a relative assessment of the new approach compared to a more involved methodology. The study
focuses on the US 50 highway in the Sacramento Area Council of Governments (SACOG, CA) region.
Introduction
Studies relating road traffic emissions to issues such as environmental justice or public health require some measure of the
emission load that people are affected by in locations such as their residence or place of education. Proxy measures range
from distance to roadways over traffic loads (e.g. vehicles hr-1 or annual average daily traffic) to traffic densities (vehicle
kilometres travelled – VKT – per areal unit) within and around the land-use units of interests. These approaches require the
use of a GIS to calculate spatial parameters and also – for traffic loads or densities - information on vehicle loads of the
network. At the other end of the scale of resource intensity and data demand, we find line source dispersion models, which
generally rely on Gaussian plume equations. They require additional data on vehicle emissions (from e.g. emissions
inventories), background emissions (from e.g. monitoring stations), meteorological conditions and topography (e.g. road
widths and elevations or building heights along the network).
While proxy measures are relatively easy to calculate, they do not take into account variations in line source emission rates
caused by different traffic speeds and vehicle types, for example. Full-scale dispersion models, on the other hand, provide a
more differentiated view of emission loads but come with considerable data demand and require a high level of expertise
from their users. Furthermore, not all of these models include a GIS interface thus requiring extra steps to allow an
intersection with spatial population data. This study presents an intermediate approach using road network emission loads
allocated to land use parcels and comparing these to outputs from the OML-Highway line source dispersion model.
Methodology
The approach presented here uses loaded road network data from the SACOG travel demand model SACSIM and the
California Air Resources Board’s Emission Factor Model EMFAC2011 to calculate PM2.5 emission loads for land use parcels
in grams/1000m² of parcel area as 24 hour totals using the ArcGIS application. The process includes the following steps: (a)
calculating line source emission loads for each network segment based on traffic loads and speeds using EMFAC2011
emissions factors for the SACOG region, (b) normalising these loads to network buffer areas, (c) intersecting the buffers with
land use parcels and (d) calculating additive buffer loads for each land use parcel or fraction thereof which intersects the
network buffers. The OML-Highway Gaussian line source dispersion model is then used to calculated emission loads (in
μg/m3) for receptors in each parcel found along the US50 corridor in the region. The model runs as an extension in ArcGIS.
For further comparison, traffic density in VKT/1000m² will also be calculated as a proxy measure for the parcels concerned.
Appropriate (spatial) statistical methods will be used to assess how closely the results from the three methods are related.
Since they provide different units as their outputs, this assessment will focus on the relative variations of the emissions loads
at the different receptor locations rather than absolute values. The work is ongoing (e.g. Gaffron & Niemeier 2015) and final
results will be presented at the conference.
Applicability
The new method for calculating emission loads from road traffic is intended to serve as an intermediate approach to proxy
measures and Gaussian dispersion models. The study will show to what extent the method presented here provides a more
reliable picture of emission loads than the proxy measures often used in studies on environmental justice or public health
while being less resource intensive than dispersion modelling. Due to lower demand on data input, the new method can be
used to study large areas. It can also include non-exhaust emissions, as long as such information is provided by the relevant
emissions inventories.
Acknowledgement
This work was made possible by a research fellowship from the German Research Foundation (Deutsche
Forschungsgemeinschaft).
References
Gaffron P., Niemeier D., 2015. School Locations and Traffic Emissions — Environmental (In)Justice Findings Using a New
Screening Method. International Journal of Environmental Research and Public Health 12(2), 2009–2025

77
MAPPING OF PRIMARY AND SECONDARY AEROSOL IN THE PO VALLEY DURING WINTER
S. Gilardoni (1), M. Paglione (1), P. Massoli (2), M. Rinaldi (1), M. C. Pietrogrande (3), V. Poluzzi (4) C. Carbone (5), V.
Gianelle (6), C. Colombi (6), R. Hillamo (7), M. Aurela (7), E. Petralia (9), M. Berico (9), M. Bressi (8), C.A. Belis (8), F.
Cavalli (8), C. Facchini (1), S. Fuzzi (1)
(1) Italian National Research Council (CNR-ISAC), Bologna, 40129 Italy; (2) Aerodyne Research Inc., Billerica, 01821,
MA USA; (3) Department of Chemical and Pharmaceutical Sciences, University of Ferrara, Ferrara, 44100 Italy; (4) Arpa -
Agency for Prevention and Environment of Emilia-Romagna Region; (5) Proambiente S.c.r.l., CNR Research Area, Bologna,
Italy; (6) Arpa Lombardia, Settore Monitoraggi Ambientali, Milano, 20129, Italy; (7) Atmospheric Aerosols, Finnish
Meteorological Institute, Helsinki, Finland; (8) European Commission, Joint Research Centre, Institute for Environment and
Sustainability, Ispra, Italy; (9) ENEA, SSPT-MET, Atmospheric Pollution Laboratory, Bologna, Italy.
Presenting author email: [email protected]
Summary
In February 2014, the chemical composition of submicron aerosol was simultaneously measured during the PoAir experiment
with aerosol mass spectrometers at five sites in the Po valley: three urban background sites (Milano, Bologna, Padova) and
two rural background site (San Pietro Capofiume, SPC, and Ispra). The goal of the experiment was to investigate local and
regional sources, properties, and spatial distribution of submicron aerosol components and organic aerosol (OA) with high
time resolution and, for the first time, at the regional scale in one of the European pollution “hot-spots”.
Introduction
More than 20 million people living in the Po Valley are exposed to Particulate Matter (PM) levels well above the limit set by
the World Health Organization and by the European Air Quality Directive, especially during the colder season. Most of the
policy measures to limit air pollution and reduce pollution health effects focus on urban areas, where the largest fraction of
population lives. The aim of this study is to answer the question “Hot spots or the background, which should be the priority
for control of PM sources and precursors?”, specifically for the Po valley.
Methodology and Results
High Resolution – Time of Flight – Aerosol Mass Spectrometer (HR-
TOF-AMS) measurements of non refractory PM1 (nr-PM1) were
performed in Bologna and Milan, while Aerosol Chemical Speciation
Monitors (ACSM) were deployed in Padova and SPC. PM1 was measured
gravimetrically (Milan and Padova) and determined from beta attenuation
data (Bologna and SPC). Black carbon (BC) was measured with a Multi
Angle Absorption Photometer (MAAP) in Bologna, Milano, SPC, and
Ispra, while elemental carbon (EC) was measured at Padova with a
thermal-optical method. Co-located measurements included NOx, O3, off-
line polycyclic aromatic hydrocarbons (PAHs), and off-line levoglucosan,
as a tracer for biomass burning. The average PM1 concentration was close
to 10 μg m-3 in Bologna, SPC and Ispra, and about 25 μg m-3 in Padova
and Milan. PM1 chemical composition (Figure 1) was quite similar across
the basin, showing a slightly larger contribution of BC at the urban sites,
due to the proximity of traffic emission sources. Ammonium nitrate
aerosol accounted for up to 50% of PM1. The large emissions of nitrogen
oxides, mainly from traffic, and of ammonia, from agricultural activities,
are responsible for the elevated concentrations of ammonium nitrate
across the basin. OA accounted for 33-44% of PM1. OA sources were identified using the multi-linear engine (ME-2)
algorithm (Paatero, 1999) implemented with the toolkit SoFi, developed by Canonaco et al. (2013). Depending on the site,
we identified up to three primary OA sources, i.e. hydrocarbon like OA (10-20% of OA), biomass burning OA (14-36% of
OA), cooking OA (5% of OA), and up to two different types of oxidized OA (OOA1 and OOA2), proxy of
secondary/processed organics. OOA accounted for the largest fraction of OA (52-63%), highlighting the relevance of
secondary organic aerosol (SOA).
Conclusions
Secondary aerosol dominate over primary aerosol components. Effective air quality measures should aim at reducing PM
precursors and should focus on urban, as well as rural emissions.
Acknowledgement
This study was supported by the Regional Environmental Protection Agencies of Emilia Romagna, as part of the Supersito
project (DRG n. 428/10), Lombardia (contract n.17249/2012), and Veneto.
References
Canonaco, F., Crippa, M., Slowik, J., Baltensperger, U., and Prevot, A. (2013), Atmos. Meas. Tech., 6, 3649-3661.
Paatero, P. (1999) J. Comp. Graph. Stat., 8, 854-888.
Fig.1 Campaign average PM1 chemical composition at (a) Padova, (b) Milano, (c)
Ispra, (d) SPC, and (e) Bologna.
a) c) b)
e) d)
OA EC/BC Nitrate
Sulphate Ammonium

78
ESTIMATION OF THE CONTRIBUTIONS OF INDUSTRIAL AND RESIDENTIAL COMBUSTION SOURCES
TO THE PM10, PM2.5 AND B(A)P LEVELS OVER THE APULIA REGION (SOUTHERN ITALY)
R. Giua (1), A. Morabito(1), I. Schipa(1), A. Tanzarella(1), C. Silibello (2) and G. Assennato (1)
(1) Regional Environment Protection Agency (ARPA) Puglia, Bari, 70126, Italy. (2) ARIANET Srl, via Gilino 9, Milan,
20128, Italy
Presenting author email: [email protected]
Summary
The objective of this study was to evaluate the contributions to the PM10, PM2.5 and B(a)P levels over the Apulia region
(Southern Italy) of a large steel plant, a very powerful coal fired plant and of biomass burning for residential heating. The
corresponding contributions were estimated using the photochemical FARM Model. The results of the simulation indicate
that contribution of biomass burning is more relevant than those originated by steel and power plant activities.
Introduction
The results of air quality simulations, performed over the Apulia region for the 2013 year, and the experimental data
collected by the regional monitoring network evidence exceedances of EU air quality standards for PM10, PM2.5 and B(a)P in
some small towns, located in the Salento peninsula, having an agricultural vocation. According to the emission inventory, the
most relevant sources in this area are the largest steel plant in Europe (Taranto area), the second most powerful coal fired
plant in Italy (Brindisi area) and biomass burning for residential heating. In order to plan the most appropriate measures to
improve the air quality in these areas , it is therefore necessary to identify the actual contributions of the mentioned pollutant
sources to PM10, PM2.5 and B(a)P concentrations.
Methodology and Results
The modelling assessment over Apulia Region
has been carried out for 2013 with a modelling
system based on the Flexible Air quality
Regional model (FARM, Mircea et al., 2014).
FARM implements the SAPRC99 gas-phase
chemical mechanism and the AERO3 aerosol
module derived from CMAQ model. Simulations
have been performed on a 316 km x 248 km
domain covering the entire region with 4 km grid
spacing. The emission data were derived from
the regional INEMAR inventory, updated to the
year 2013, while the emissions from the
neighbouring regions were taken from the Italian
official inventory. Meteorological fields came
from RAMS prognostic model (Cotton et al.,
2003), while boundary conditions have been
provided by FARM simulations performed at
national scale. The comparison between the
baseline simulation and the experimental data,
provided by the regional monitoring network,
evidenced the capability of the modelling system to reproduce the PM10, PM2.5 and B(a)P levels across the region and
suggested its use for further source apportionment studies. Three emission scenarios have been considered in which the
emissions respectively from biomass burning for domestic heating, the steel plant and the coal power plant were turned off.
Figure 1 shows the contributions of these sources, highlighting the relevant contribution of biomass burning for domestic
heating to the PM10 annual mean concentrations.
Conclusions
In this study the FARM photochemical model has been applied to investigate the impact of important emission sectors to the
PM10, PM2.5 and B(a)P pollution over Salento Peninsula. This source apportionment study evidences that the contribution of
biomass burning from domestic heating is locally more relevant than those from the coal power plant and the steel plant
activities. According to this study, actions to reduce the emissions from biomass for residential heating represent an essential
control strategy aimed to improve the air quality within the Region.
References
Cotton WR, Pielke RA, Walko RL, Liston GE, Tremback CJ, Jiang H, McAnelly RL, Harrington JY, Nicholls ME, Carrio
GG, McFadden JP (2003) RAMS 2001: Current status and future directions. Meteorology and Atmospheric Physics, 82, 5-
29.
Mircea, M., Ciancarella, L., Briganti, G., Calori, G., Cappelletti, A., Cionni, I. Costa, M., Cremona, G., D’Isidoro, M.,
Finardi, S., Pace, G., Piersanti, A., Righini, G., Silibello, C., Vitali, L., Zanini, G. (2014) Assessment of the AMS-MINNI
system capabilities to predict air quality over Italy for the calendar year 2005. Atmospheric Environment, 84, 178-188.

79
IMPROVED MODELLING OF AMMONIA BY USING MANURE TRANSPORT DATA
C. Hendriks (1), R. Kranenburg (1), J. Kuenen (1), M. Schaap (1)
(1) TNO, Department of Climate, Air and Sustainability, P.O. Box 80015, 3508 TA, Utrecht, The Netherlands
Presenting author email: [email protected]
Summary
In this work, the use of manure transport data as a proxy for time profiles of ammonia emission from manure application was
explored. Manure transport data reflect national regulations as well as meteorological conditions influencing temporal
manure application patterns. We used manure transport data from Flanders (Belgium) to derive the emission variability of
emissions from manure application. This, combined with improved temporal variability for livestock housing and mineral
fertilizer based on Skjøth et al. (2011) strongly improves model performance for ammonia in north western Europe, mainly
by a better representation of the spring maximum. The impact on model performance for secondary inorganic aerosols (SIA)
is negligible.
Introduction
Accurate representation of ammonia emission patterns from agriculture in chemistry transport models (CTMs) is important
for the evaluation and prediction of particulate matter episodes. The temporal variability of ammonia emissions from manure
application is currently not well represented in CTMs. In this study we examine the use of Flemish manure transportation
data to model the temporal variability in ammonia emissions from manure application and assess the impact on model
performance for ammonia and SIA for CTM LOTOS-EUROS.
Methodology and Results
Manure transportation data were used as a proxy to estimate the variability
in ammonia emissions from manure application in Flanders. Figure 1 shows
the amount of manure transport reported on a daily basis for 2008.
Substantial differences in temporal pattern between years are observed. Air
quality simulations for north-western Europe for the period 2007-2011 were
performed with the CTM LOTOS-EUROS (Schaap et al., 2008) at 7x7 km2
resolution. A simulation using the standard time profiles in LOTOS-
EUROS was compared to one in which updated time profiles for ammonia
emissions from mineral fertilizer and livestock housing (Skjøth et al, 2011)
we implemented, as well as the updated profiles for manure application
based on manure transport data. Model performance was evaluated using
two-weekly passive sampler data from 20 locations in Flanders.
Model performance for ammonia improved by using meteorologically
dependent temporal variability for ammonia, which is reflected in smaller
bias and 15-20% higher temporal correlation for all stations (Figure 2).
Both improvements in temporal variability (livestock housing/fertilizer, and
manure application) are important to increase the agreement between model
and measurements. The comparison of modelled and measured
(Vercauteren et al., 2011) SIA components did not show a significant
difference between the model runs.
Conclusions
Using meteorological dependent temporal variability of ammonia emissions
from agriculture strongly improves ammonia modelling. Although the use
of manure transport data as proxy for emissions from manure application
comes with quite large uncertainties and simplifications, it is a good
starting point to improve representation of temporal variability of this
source.
Acknowledgement
The work presented here was financed by the Flemish Government, Department of Environment, Nature and Energy
(reference: LNE/OL201200017)
References
Schaap, M., Sauter, F., Timmermans, R.M.A., Roemer, M., Velders, G., Beck, J., Builtjes, P.J.H., 2008. The LOTOS-
EUROS model: description, validation and latest developments, International Journal of Environment and Pollution 32 (2),
270–290
Skjøth, C.A., Geels, C., Berge, H., Gyldenkærne, S., Fagerli, H., Ellermann, T., Frohn, L.M., Christensen, J., Hansen, K.M.,
Hansen, K., Hertel, O., 2011. Spatial and temporal variations in ammonia emissions – a freely accessible model code for
Europe. Atmos. Chem. Phys., 11, 5221–5236, doi:10.5194/acp-11-5221-2011
Vercauteren, J., Matheeussen, C., Wauters, E., Roekens, E., van Grieken, R., Krata, A., Makarovska, Y., Maenhaut, W., Chi,
X., Geypens, B., 2011. Chemkar PM10: An extensive look at the local differences in chemical composition of PM10 in
Flanders, Belgium. Atmospheric Environment 45 (1), 108-116
Fig.2 Temporal correlation modelled and measured ammonia concentrations for stations in Flanders
Fig.1 Temporal variability of manure transport in
Flanders in 2008

80
EMISSION FACTORS FROM RESIDENTIAL BIOMASS HEATING SISTEMS
F. Hugony (1), C. Morreale (2), G. Migliavacca (2), M. Zublena (3), L. Frassy (3), G. Pession (3),I. Tombolato (3)
(1) ENEA agenzia nazionale per le nuove tecnologie, l’energia, lo sviluppo sostenibile.; (2) INNOVHUB- Stazioni
Sperimentali per l’Industria – ssc; (3) Agenzia Regionale per la Protezione dell’Ambiente della Valle d’Aosta
Presenting author email: [email protected]
Summary The direct measure of the emission factors from different specific sources is of fundamental importance in the field of source
apportionment for atmospheric PM and other pollutants, mainly where a large variability is reported in the literature and
when the technological evolution rapidly changes these factors.
This study, financed by EU INTERREG ALCOTRA AERA project, provides important emission factors of total PM, Non-
methanic volatile organic compounds (NMetVOC), polycyclic aromatic hydrocarbon (PAH) and nitrogen oxides (NOx)
generated by three different automatic heating systems (a pellet stove, PS, a 25kW boiler, boiler25 and a 100kW boiler,
boiler100) fed with two types of fuels: certified pellet and non certified pellet. All the tests are performed in a laboratory test
rig.
Introduction
Biomass combustion, mainly when associated to small scale domestic appliances, is one of the main recognised sources of
PM and other pollutants in many areas of Europe including Alpine valleys and the north part of Italy and it is responsible for
huge outdoor pollution as pointed out in several publications as the recent document published by WHO on “Residential
heating with wood and coal” (2015). In addition wood combustion produces volatile organic compounds (VOC) with a high
content of various toxic and carcinogenic compounds such as PAH (Ravindra et al., 2008) and dioxins (Lavric et al., 2004).
Many different kinds of heating appliances and many different kind of wood fuels are used; the large variation in the
technical characteristics of the former and in the properties of the latter influence vary much the actual emission produced.
These pollutants emission factors strictly depend on the fuel quality and the type of appliances. For this reason specific
emission factors for the different pollutants released in the different combination of technologies and fuels are very important
to predict the impact of biomass heating systems on the local air quality.
Methodology and Results Appliances at different scale ranging from a pellet stove 9 kW to a 100kW boiler fed with two types of fuels: certified pellet
(CP) and non certified pellet (NCP) are tested in a laboratory test rig.
The boilers and the stove have been operated at
their maximum output for a time long enough to
reach their steady conditions before testing.
The NMetVOC and NOx have been measured in
the flue gases by means of continuous automatic
analysers based on FID and chemiluminescence
detection techniques respectively. PM has been
sampled on plane quartz fibre filters and
gravimetrically determined. The Benzo(a)Pyrene
(B(a)P) has been determined on the PM fraction,
in the gas phase using PUF sorbent and in the
condensed phase.
In the table the emission factors previously described are reported.
Conclusions Certified pellet has shown better performances in terms of NMetVOC, NOx and PM in most cases, while a clear correlation
with the pellet quality for B(a)P is not evident. The largest boiler shows a very good performance in terms of low B(a)P
emissions, compared to the others, while for the other pollutants not any evident difference is observed for these automatic
appliances. The study highlights the major effect of fuel quality for appliances having a similar technology even if the scale is
different
Acknowledgements
The study has been founded in the framework of EU INTERREG ALCOTRA AERA project
References
Lavric, E.D., Konnov, A., De Ruyck, J., 2004. Dioxin levels in wood combustion - a review. Biomass Bioenergy 26, 115-
145.
Ravindra K., Sokhi R., Van Grieken R., 2008. Atmospheric polycyclic aromatic hydrocarbons: source attribution, emission
factors and regulation. Atmos. Environ. 42, 2895-2921.
WHO, 2015. Residential heating with wood and coal
Pession G., Tombolato I., 2013. ALCOTRA projects AERA and RENERFOR technical Report: “Emissioni inquinanti da
apparecchi a biomassa legnosa”. (http://www.regione.vda.it/energia/renerfor/default_i.asp section Area Tematica ARIA)
NMetVOC NOx PM B(a)P
mg/MJ mg/MJ mg/MJ µg/MJ
Boiler100CP 3.0 54.3 8.5 0.005
Boiler100NCP 2.3 108.5 23.9 0.023
Boiler25CP 4.5 77.7 22.3 0.208
Boiler25NCP 8.5 120.4 28.8 0.218
PS9CP 2.2 43.0 10.4 0.322
PS9NCP 3.7 59.6 56.8 0.113

81
EMISSIONS FROM SHIPS IN PORTS
V. Matthias (1), A. Aulinger (1), J. Hulskotte (2), L. van Espen (3), J. de Rue (4)
(1) Helmholtz-Zentrum Geesthacht, Institute of Coastal Research, Max-Planck-Straße 1, 21502 Geesthacht, Germany, (2)
TNO, Princetonlaan 6, 3584 CB Utrecht, The Netherlands, (3) Port of Antwerp, Entrepotkaai 1, 2000 Antwerp, Belgium, (4)
Witteveen and Bos, Van Twickelostraat 2, 7400 AE Deventer, The Netherlands
Presenting author email: [email protected]
Summary
This study aims at quantifying the emissions from ships in ports, in particular for those times when the ships are at berth and
use their own auxiliary engines to provide heat and electricity to the ship. These emissions can make up a considerable
amount of a city’s total emissions, in particular for nitrogen oxides and particulate matter. However, they are rarely
considered because they are difficult to quantify. The method presented here is based on a survey on board of 195 ships
visited in 5 North Sea ports. It gives size dependent fuel use functions that can be further used to draw spatially resolved
emission maps for ports. These maps may serve as input data for city scale air quality model systems.
Introduction
Ships emit considerable amounts of pollutants, not only when sailing, but also during their stay at berth. This is of particular
importance for harbour cities because ship emissions can contribute a lot to regional air pollution and to the problem that
some of the EU standards (for PM and NO2) cannot be met there. It is difficult to estimate the emissions from ships in
harbours only from the technical specifications of the ships because their activities are not well known. We made a survey on
board of almost 200 ships in 5 different harbours in the North Sea region in order to get more information about the fuel use
in auxiliary engines and boilers. This approach follows an idea from Hulskotte and Denier van der Gon (2010).
Methodology and Results
The survey that was handed to the captain or chief engineer of the ship contained questions about the ship’s specifications,
the engines on board, the type and amount of fuel used and the time the engines were run while the ship was at berth. It was
also asked if the fuel was burned in boilers to produce steam or in generators to produce electricity. The data was then
grouped by ship category and ship size. These parameters are most frequently available from port authorities in their arrival
and departure lists and can therefore later be used to estimate the ship emissions in a certain harbour without further
knowledge about the individual ship characteristics.
The ships were visited in the harbours of Antwerp, Bergen, Bremerhaven, Hamburg and Rotterdam (Hulskotte et al., 2013).
The evaluation of the survey resulted in functional relationships between ship size and fuel use per hour at berth for each ship
type. For most ship types the number of ships that were surveyed was still small (around 20 ships), therefore a linear
regression was the main method to derive this relationship. Container ships could best be represented by a power law that
better represents the small ships. For cruise ships, the data base was too small, therefore typical numbers for the energy
demand per passenger and a relation between number of passengers and ship size were used to derive a comparable function.
The results of the survey have been combined with arrival and departure data from different harbours in the North Sea area to
calculate the fuel consumption of ships at berth. These values were divided into auxiliary engines and boilers. Combined with
emission factors for the most important species NOx, SO2, CO, CO2, hydrocarbons (VOC), and PM, the total emissions of
ships at berth were calculated. The emission factors were derived from test bed measurements of about 430 different engines
that were evaluated by Germanischer Lloyd within the Clean North Sea Shipping project (CNSS, 2014).
Finally, the emissions from ships entering and leaving the harbour were also taken into account. They were spatially
distributed according to the route the ship took inside the harbour area. A software has been developed that displays the
annual emissions on a 250 m x 250 m grid. These emissions can serve as input for city scale air quality model systems.
Conclusions
Emissions from ships in ports can be a significant fraction of the total city emissions in some harbour cities. Their estimation
is difficult because the activities of ships at berth are not well known. The approach presented here relies on a survey on
board of almost 200 ships in 5 North Sea harbours. It gives size dependent relationships of the average fuel use per hour for 9
different ship types. The data was used to calculate annual port emissions in the ports of Antwerp, Rotterdam and Hamburg.
For Antwerp and Hamburg, arrival, departure and manoeuvring of the ships inside the harbour were considered in addition to
construct spatially highly resolved emission maps for the harbour area.
Acknowledgement
This work was supported by the European Research and Development Fund within the INTERREG IV B North Sea program
in the project Clean North Sea Shipping.
References
Clean North Sea Shipping, 2014. Final report - Key findings and recommendations, Technical report, Clean North Sea
Shipping project, www.cnss.no, last accessed 13 October 2015.
Hulskotte, J. H. J. and Denier van der Gon, H. A. C., 2010. Fuel consumption and associated emissions from seagoing ships
at berth derived from an on-board survey, Atmospheric Environment 44(9), 1229 - 1236.
Hulskotte J. H. J., Wester, B., Snijder, A. M., Matthias, V., 2013. International survey of fuel consumption of seagoing ships
at berth, TNO 2013 R10472, 12 March 2013

82
HIGH RESOLUTION EMISSION ESTIMATION IN A HEAVILY TRAFFICKED URBAN AREA IN MADRID
(SPAIN)
C. Quaassdorff, R. Borge, D. de la Paz, J. Pérez, J.M. de Andrés, J. Lumbreras
Laboratory of Environmental Modelling, Technical University of Madrid (UPM). C/ José Gutiérrez Abascal 2, 28006
Madrid, Spain
Presenting author email: [email protected]
Summary
This work aims to obtain high resolution NOx and PM10 emissions related to traffic activity at a hot-spot in Madrid (Spain).
For that, twelve representative scenarios for a heavily trafficked roundabout are simulated with the traffic microsimulation
model VISSIM. Measured traffic data (fluxes and fleet composition) are used as input for the model to obtain speed-time
profiles for each vehicle. These profiles are used to predict representative emission factors for different vehicle classes in the
VERSIT+micro model, through the ENVIVER interface. The emission factors are compared with the ones of COPERT IV, a
widely used average-speed model, as a preliminary model assessment. The results are strongly influenced by low average
speeds due to saturated traffic situations.
Introduction
Since pollution levels exceed the legal limits in specific traffic-related urban locations it is necessary to develop emission
reduction measures on hotspots and highly contaminated micro-environments mainly in urban areas where traffic represents
one of the major contribution to emissions (Borge et al., 2012). On these specific points finer-scale tools are needed because
of the complexity of the processes that determine emissions from mobile sources (Borge et al., 2014). Therefore, there is a
need to test microsimulation models that may reproduce with great detail traffic activity in small areas and may provide
reliable emission to find out abatement options and to feed CFD microscale air quality models (Santiago et al., 2013).
Methodology and Results
The selected study area is Fernández Ladreda square, a roundabout with complex geometry, high traffic flow and a freeway
crossing through a tunnel in Madrid. An intensive field campaign with cameras was carried out to obtain accurate traffic data.
Twelve representative 1-hour length scenarios from a weekly pattern are selected and simulated with the VISSIM model. The
data for the speed-time profiles are introduced in the emission model VERSIT+micro and the different vehicle classes are
assigned, all through ENVIVER interface. The main results are twelve emission distributions with a resolution of 5m x 5m
aggregated to 1-hour and also the total
emission in the area for the different traffic
scenarios. The emission distribution results
of NOx and PM10 are influenced by average
speeds of the road section which is affected
by traffic intensity and congestion.
Scenarios with low traffic intensity (Fig. 1)
show fluid traffic conditions presenting
emissions in specific zones with low speeds.
This methodology is validated comparing
the emission factors with the ones of the
average-speed emission model COPERT IV.
Conclusions
A suitable combination of traffic and emissions micro-simulation models is needed to accurately define the emissions in a
specific area. The results obtained from this methodology are in agreement with the ones of COPERT IV and are promising
as inputs for CFD models that may be used to design and test microscale air quality abatement measures.
Acknowledgement
This work was funded by the Madrid City Council under the project TECNAIRE (S2013/MAE-2972). The traffic modelling
system VISSIM was made available by PTV Planung Transport Verkehr AG and the emission modelling system
VERSIT+micro/ENVIVER was made available by TNO.
References
Borge, R., de Miguel, I., de la Paz, D., Lumbreras, J., Perez, J., Rodriguez, E., 2012. Comparison of road traffic emission
models in Madrid (Spain). Atmos. Environ. 62, 461-471.
Borge, R., Lumbreras, J., Pérez, J., de la Paz, D., Vedrenne, M., de Andrés, J.M., Rodríguez, M.E., 2014. Emission
inventories and modeling requirements for the development of air quality plans. Application to Madrid (Spain). Sci. Total
Environ. 466-467, 809-819.
Santiago, J.L., Martín, F., Martilli, A., 2013. A computational fluid dynamic modelling approach to assess the
representativeness of urban monitoring stations. Sci. Total Environ. 454-455, 61-72
Fig1. Average speed, NOx and PM10 emission distribution for free flow conditions

83
MAX-DOAS MEASUREMENTS OF SHIPPING EMISSIONS
André Seyler (1), Folkard Wittrock (1), Lisa Kattner (1,2), Barbara Mathieu-Üffing (1,2), Enno Peters (1), Andreas Richter
(1), Stefan Schmolke (2), Volker Matthias (3), Armin Aulinger (3) and John P. Burrows (1)
(1) University of Bremen, Institute of Environmental Physics (IUP), Bremen, Germany; (2) Federal Maritime and
Hydrographic Agency (BSH), Hamburg, Germany;(3) Helmholtz-Zentrum Geesthacht (HZG), Institute of Coastal Research,
Geesthacht, Germany
Presenting author email: [email protected]
Summary
This study aims to analyse the influence of shipping emissions on the coastal air quality by evaluating ground-based remote
sensing measurements using the MAX-DOAS (Multi Axis Differential Optical Absorption Spectroscopy) technique. Within
the scope of the MeSmarT project (www.mesmart.de), measurements of the atmospheric trace gases nitrogen dioxide (NO2)
and sulphur dioxide (SO2) have been carried out in the marine troposphere at the measurement sites in Wedel and on
Neuwerk and on-board several ship cruises on the North and Baltic Sea. This study shows long term evolutions as well as
single ship measurements.
Introduction
Shipping traffic is a sector that faces an enormous growth rate and contributes substantially to the emissions from the
transportation sector, but lacks regulations and controls. Shipping is not enclosed in the Kyoto Protocol. However, the
International Maritime Organization (IMO) introduced sulfur limits for marine heavy fuels, nitrogen oxide limits for newly-
built ship engines and established Emission Control Areas (ECA) in the North and Baltic Sea as well as around North
America with the International Convention for the Prevention of Pollution from Ships (MARPOL 73/78 Annex VI).
Recently, on the 1st of January 2015, the allowed sulfur content of marine fuels inside Sulfur Emission Control Areas has
been significantly decreased from 1.0% to 0.1%. However, measurements of reactive trace gases and the chemical
composition of the marine troposphere along shipping routes are sparse and up to now there is no regular monitoring system
available.The project MeSmarT (measurements of shipping emissions in the marine troposphere) is a cooperation between
the University of Bremen, the German Federal Maritime and Hydrographic Agency (Bundesamt für Seeschifffahrt und
Hydrographie, BSH) and the Helmholtz-Zentrum Geesthacht. To estimate the impact of shipping emissions on the
atmospheric boundary layer chemistry, elevated signals (ship emission peaks) as well as background concentrations of
shipping-related trace gases and particles are monitored with various methods like in-situ measurements (Kattner et al., 2015)
and remote sensing.
Methodology and Results
Here we present MAX-DOAS observations of NO2 and SO2 carried out from two permanent sites close to the Elbe river
(Wedel, Germany) and on the island Neuwerk close to the mouths of Elbe and Weser river and on-board several regular
monitoring cruises of the BSH in the North and Baltic Sea since the year 2013. Mixing ratios of both trace gases have been
retrieved using different approaches (pure geometric and taking into account the radiative transfer) and compared to in-situ
observations, showing the advantages and disadvantages of both methods. Single day measurements show emission peaks
which can easily be allocated to the plumes of single ships. The capability of two-channel MAX-DOAS systems to do
simultaneous measurements in the UV and visible spectral range has been used to derive spatial distributions of ship
emissions and to analyse the movement of the exhausted plumes. Furthermore, simple approaches have been used to
calculate emission factors of NOx and SO2 for single ships and have been compared to recent studies. Long term time
evolutions have been evaluated to show the impact of recent sulfur emission regulations on the measured SO2 pollution
levels. The wind direction dependence of the measured trace gas concentrations has been analysed to quantify the fraction of
shipping emissions on the overall emissions and to identify additional sources of background pollution coming from the
coast. Moreover, a comparison of the measured concentrations with the model results of the chemistry transport simulations
done by the Helmholtz-Zentrum Geesthacht is shown.
Conclusions
MAX-DOAS measurements of the reactive trace gases NO2 and SO2 in the marine boundary layer at our MeSmarT
measurement sites can be used to evaluate the influence of shipping emissions on the local air quality. Single day
measurements can be used to analyse the composition, spatial distribution and movement of emission plumes that can be
allocated to single ships. Long term evolutions in the whole time series of measurements since 2013 show the wind direction
distribution of the measured pollution levels and the impact of sulfur emission regulations on the measured SO2
concentrations.
Acknowledgement
The research project which facilitated the reported study was funded in part by the German Federal Maritime and
Hydrographic Agency and the University of Bremen. The authors thank the Waterways and Shipping Office Hamburg for
their help and support.
References
Kattner, L., Mathieu-Üffing, B., Burrows, J., Richter, A., Seyler, A., Schmolke, S., Wittrock, F., 2015. Monitoring
compliance with sulphur content regulations of shipping fuel by in situ measurements of ship emissions. Atmospheric
Chemistry and Physics, 15, 10087-10092.

84

85
URBAN METEOROLOGY

86

87
THE EFFECT OF GEOMETRY MODIFICATION ON THE CONCENTRATION FIELD IN AN URBAN
ENVIRONMENT
Eva Berbekar(1), Frank Harms(1), Bernd Leitl(1)
(1) Meteorological Institute, University of Hamburg, Bundesstrasse 55, D-20146 Hamburg, Germany.
Presenting author email: [email protected]
Summary
Changes in the city structure have an effect on the transport and dispersion of contaminants in an urban environment. Wind
tunnel measurements were carried out to identify the impact caused by the modification of building geometry in the model of
Hamburg inner city. Results show that geometry simplification and modification has an effect on the concentration field.
Introduction
Numerical modelling is widely used to predict transport and dispersion in
urban areas (Lateb et al., 2015). However, the city geometries considered
by the models are simplifications of the full scale building structure. The
simplification is due to the low resolution of the input data and the
discretization of the modelled fluid volume.
The city structure is never static, it changes constantly due to construction
works. Buildings are destroyed or modified and new ones are erected. The
changes in the city geometry have an effect on the dispersion
characteristics.
Methodology and Results
Boundary-layer wind tunnel measurements were carried out to quantify
the effect of city geometry changes and simplifications on transport and
dispersion phenomena (Fig. 1).
Buildings in a 1:350 scale high-resolved model of Hamburg inner city
were substituted by Level of Detail 1 (LoD1) geometry. The LoD1
buildings have flat roofs and the outline is defined based on digital field
map measured by airborne laser scanning.
The buildings replaced by LoD1 models are highlighted on Fig. 2. With
each phase, the number of simplified buildings increases in the model.
A further test case was measured, where one building was entirely
removed from the high-resolution geometry.
Measurement gas was emitted from ground-level point sources in and
near the investigated area. Concentration resulting from continuous and
puff releases was measured with high temporal resolution.
The results show that geometry simplification has an effect, if the source
and the measurement point are located near the modified buildings.
When a building is removed from the city structure, significant
differences arise in the concentration field. Fig. 3 shows puff results
measured in the original city structure and in the model, when one
building was eliminated. Not only the peak concentration and the dosage,
but the arrival time and the duration of the puff are changing (Berbekar, et
al., 2015). The differences are significantly higher, than the repeatability
of the results.
Conclusions
Simplified geometry is considered, when modelling the transport and
dispersion numerically in an urban area. Geometry simplification has an
effect, if the source and the measurement point are located near the
modified buildings.
The structure of a city is constantly changing. The elimination of a
building has a significant effect on the concentration field, even if the
emission is not in the direct vicinity of the removed structure.
Acknowledgement
The financial support of the Behörde für Inneres und Sport in Hamburg is gratefully acknowledged. The authors would like
to thank Gopal Patnaik from the Naval Research Laboratory for the fruitful discussions.
References
Berbekar E., Harms F., Leitl B., 2015. Dosage-Based Parameters for Characterization of Puff Dispersion Results. Journal of
Hazardous Materials 283: 178–85.
Lateb M., Meroney R.N., Yataghene M., Fellouah H., Saleh F., Boufadel M.C., 2015. On the Use of Numerical Modelling
for near-Field Pollutant Dispersion in Urban Environments − A Review. Environmental Pollution. (In Press)
Fig.1 Wind tunnel model of Hamburg inner city
Fig.2 Phases of geometry simplification
Fig.3 Concentration time series resulting from puff releases. The building removed is indicated
with grey. A star represents the source and the
measurement point is marked with a circle.

88
ON THE ASSESSEMENT OF THE DRAG FORCE DUE TO CUBE ARRAYS EXPOSED TO DIFFERENT
BOUNDARY LAYERS
R. Buccolieri (1), H. Wigö (2), M. Sandberg (2), S. Di Sabatino (3)
(1) Dipartimento di Scienze e Tecnologie Biologiche ed Ambientali, University of Salento, S.P. 6 Lecce-Monteroni, 73100
Lecce, Italy; (2) Faculty of Engineering and Sustainable Development, University of Gävle, SE-80176 Gävle, Sweden; (3)
Department of Physics and Astronomy, University of Bologna, Viale Berti Pichat 6/2, 40127 Bologna
Presenting author email: [email protected]
Summary
This paper presents an analysis of drag force wind tunnel measurements pressure distribution obtained from CFD simulations
over idealized cubical building arrays for two different conditions of boundary layer and three wind velocities. The aim of the
research is to study the variation of the drag force within a large range of building packing density (the planar area index λp
ranges from 0.028 to 1) by using the standard load cell method that is novel for this type of applications.
Introduction
In the urban environment settlements are exposed to different approach flows due to different surroundings. The
surroundings may vary from a gradual transition from the rural area to the urban area to an abrupt change from the rural to
the urban area. There are various methods for determining the drag force on a settlement. Indirect methods are based on data
retrieved from the velocity above the obstacles. These methods require the existence of a constant-stress layer which gives
rise to a logarithmic velocity profile which is not always the case (Conceal and Belcher, 2004). One direct method is using a
balance (e.g. Zaki et al., 2011), which is considered suitable to provide an accurate measurement of the spatially-averaged
drag force for an array.
Methodology and Results
The aim of this study is to present wind tunnel measurements of the total
drag force recorded with the standard load cell method (direct method),
that is novel for this type of applications (Fig.1), for city-like ideal
objects located in an environment with an abrupt change from the rural to
the urban environment. The measurements were performed for two types
of boundary layers (with and without upstream roughness elements) and
three wind velocities (which correspond to different revolutions per
minute RPM of the fan that drives the wind tunnel) and for a large range
of packing densities, from λp = 0.028 representing a rural area to the
upper limit where the whole lot is covered by one single building (λp =
1). Results are combined with pressure distribution at building height
estimated by means of Computational Fluid Dynamics (CFD)
simulations.
Results show that at lower packing densities the drag force can be
expressed as the sum of the drag force of the individual buildings
generating an isolated roughness flow. The force increases with
increasing packing density and reaches its maximum value at λp = 0.25.
From this maximum value and further on there is a slight decrease until it
becomes almost constant. The force is no longer proportional to the
number of the buildings due to the wake interference or skimming flow
occurring at larger packing densities. Instead the array starts to behave as
one single unit and the drag distribution results in a higher value recorded
at the windward side of the array (see Fig.2 for preliminary results).
Shear stress (total force/total surface area) and the corresponding friction
velocity are also estimated and discussed. The drag force due to the cubes
is finally parametrized using the canopy-drag length scale and results are
discussed.
Conclusions
An experimental investigation of the drag force acting on surfaces of
arrays of cubical buildings characterized by different packing densities is
presented. The total drag force acting on the array was measured in wind
tunnel. The effect of building packing density on the drag force, estimated
shear stress, friction velocity and canopy-drag length scale is analysed.
References
Coceal O, Belcher SE., 2004. A canopy model of mean winds through
urban areas. Quarterly Journal of the Royal Meteorological Society 130,
1349-1372.
Zaki SA, Hagishima A, Tanimoto J, Ikegaya N, 2011. Aerodynamic
parameters of urban building arrays with random geometries. Boundary-
Layer Meteorology 138, 99-120
Fig.1 a) Side view of the drag force measuring principle. b) Picture showing an example of the
array built in the wind tunnel and attached to the
circular disc. c) Block diagram of drag force
measurement system
Fig.2 Drag force FD (N) as function of the planar
area index λp for the different RPM

89
WRF PBL MODELS COMPARISON AGAINST DATA MEASURED IN A URBAN ENVIRONMENT
Enrico Ferrero (1), Stefano Alessandrini (2), Francois Vandenberghe (2)
(1) Università del Piemonte Orientale, viale T. Michel, 11, 15121, Alessandria, Italy; (2) National Center for Atmospheric
Research (NCAR), PO Box 3000, Boulder, CO 80307-3000, USA
Presenting author email:[email protected]
Summary
We run different PBL models in the Weather Research and Forecasting model (WRF) and perform a validation with
measurements of wind profiles, temperature and turbulent kinetic energy . We use the UTP (Urban Turbulence Project,
Mortarini et al. 2013) date-set measured in the outskirts of Turin (Italy). It provides measurements performed by sonic
anemometers a three different heights (5, 9, 25 m). The data refer to mean wind, temperature and standard deviations of the
wind velocity fluctuation collected for more than one year. Results of the comparisons are presented and a model evaluation
in term of statistical index is shown and discussed.
Introduction
Air pollution and air quality models make use of numerical weather prediction (NWP) models in order to provide the input to
transport and dispersion models. Besides the wind and temperature fields, the diffusion coefficients are important for
characterizing the disperion processes . These quantities are estimated by the planetary boundary layer (PBL) scheme in the
NWP model. Nowadays the widest used NWP model is WRF which includes several PBL schemes coupled with different
surface layer models. For these reasons it is important to evaluate the performance of WRF in simulating not only the mean
temperature and wind fields but also the turbulent kinetic energy (TKE) from which the diffusion coefficients are derived.
Metodology and Results
We performed different simulations by changing the PBL models and consequently the surface layer model. We considered
the following PBL schemes: Option 2, MYJ, Janjic (1994, MWR); option 5, MYNN2, Nakanishi and Niino (2006, BLM);
option 8, BouLac, Bougeault
and Lacarrere (1989, MWR).
As far as the surface layer
model is concerned, we took
into account the option 2 Noah
Land Surface Model and option
5 CLM4 (Community Land
Model Version 4). Furthermore
for PBL 2 and 8 we run the
model with the urban model
Building Energy Model (option
3). The results of the model
evaluations are presented in the
following tables. In each Table
n indicates the PBL model, m the surface layer model and p the urban model. We considered the anemometer data at 25 m
and the period from the 1st to the 12th of January 2008.
Conclusions
The results show that the best performance for TKE is obtained with the option 2 for the PBL (and 2 for the surface layer) in
the case in which the urbal model is activated. The urban model is activated also in the PBL model 8 experiments. In this
case the agreement between
simulated and measured TKE is
better than the other except for
the simulation performed using
the PBL model 2 and the urban
model.
References
L. Mortarini, E. Ferrero, S. Falabino, S. Trini Castelli, R. Richiardone and D. Anfossi 2013, Low-frequency processes and
turbulence structure in a perturbed boundary layer, Q. J. R. Meteorol. Soc. 139: 1059 – 1072
WRF-ARW V3: User’s Guide
n=2 m=2 p=0 Mean data Mean model FB NMSE COR
U (m/s) 1.22 1.63 -0.29 0.45 0.14
T (K) 279 276 0.011 0.00014 0.78
TKE (m2/s2) 0.22 0.13 0.56 1.12 0.23
n=2 m=2 p=3 Mean data Mean model FB NMSE COR
U (m/s) 1.22 1.61 -0.27 0.38 0.27
T (K) 279 277 0.007 0.00008 0.78
TKE (m2/s2) 0.22 0.19 0.16 0.51 0.38
n=5 m=5 p=0 Mean data Mean model FB NMSE COR
U (m/s) 1.22 1.72 -0.34 0.67 0.065
T (K) 279 278 0.014 0.0002 0.67
TKE (m2/s2) 0.22 0.36 -0.45 1.05 0.22
n=8 m=2 p=3 Mean data Mean model FB NMSE COR
U (m/s) 1.22 1.84 -0.41 0.60 0.11
T (K) 279 276 0.008 0.00009 0.76
TKE (m2/s2) 0.22 0.32 -0.37 0.77 0.24

90
A CFD STUDY ON THE EFFECTIVENESS OF TREES TO DISPERSE ROAD TRAFFIC EMISSIONS AT A CITY
SCALE
A.P.R Jeanjean (1), G. Hinchliffe (2), W.A. McMullan (3), P.S. Monks (4), R.J. Leigh (1)
(1) Department of Physics and Astronomy, University of Leicester, Leicester, UK; (2) Bluesky International Limited, Old
Toy Factory, Jackson Street, Coalville, UK; (3) Department of Engineering, University of Leicester, Leicester, UK; (4)
Department of Chemistry, University of Leicester, Leicester, UK
Presenting author email: [email protected]
Summary
This paper focuses on the effectiveness of trees at dispersing road traffic emissions on a city scale. CFD simulations of air-
pollutant concentrations were performed using the OpenFOAM software platform using the k-ε model. Results were
validated against the CODASC wind tunnel database before being applied to a LIDAR database of buildings and trees
representing the City of Leicester (UK). Most other CFD models in the literature typically use idealised buildings to model
wind flow and pollution dispersion. However, the methodology used in this study uses real buildings and trees data from
LIDAR to reconstruct a 3D representation of Leicester City Centre. It focuses on a 2 x 2 km area which is on a scale larger
than those usually used in other CFD studies. Furthermore, the primary focus of this study is on the interaction of trees with
wind flow dynamics.
Introduction
Road transport is one of the largest contributors of air pollution in urban environments. By 2050, air pollution could account
for the largest portion of environmental deaths if no precautions are taken, ahead of unsafe water supply and sanitation
(OECD, 2012). Predicting the concentration of air pollutants is essential for monitoring air quality. During the last decade, a
number of studies have shown the importance of vegetation in the urban environment. Few of these studies have looked at
the dispersive impact of vegetation on the city scale.
Methodology and Results
This paper aims to investigate the effectiveness of trees at dispersing
road traffic emissions on a city scale. CFD simulations have been
performed with the OpenFOAM software platform using the k-ε model.
The CFD results were validated against data from the CODASC wind
tunnel study (CODASC, 2014). A 3D database of buildings and trees
was derived from airborne LIDAR data, and then integrated into the
study on a flat 2 x 2 km area around the City Centre of Leicester.
Idealised deciduous trees were modelled as porous bodies using a
momentum sink for the velocity. The dispersion of fixed traffic
emissions was simulated for a tree-free city (city without trees), and for
a city with trees for 12 wind directions. Although the assumption that
the volume of urban space occupied by trees in tree-free city is
negligible, this is not very close to reality. However, removing the trees
in the modelling stage is a useful way of specifically studying their
dispersive impact on air pollution.
Conclusions
It was found that in effect, trees have a regionally beneficial impact on
road traffic emissions by increasing turbulence and reducing ambient
concentrations of road traffic emissions by 7% at pedestrian height on average. This was an important result given that
previous studies generally concluded that trees trapped pollution by obstructing wind flow in street canyons. Therefore, this
study is novel both in its methodology and subsequent results, highlighting the importance of combining local and regional
scale models for assessing the impact of trees in urban planning.
Acknowledgement
The authors want to thank Dr C. Gromke for providing key wind tunnel data (CODASC) and to OpenFOAM Ltd for
providing the platform software used in this study. This work was supported by the Engineering & Physical Sciences
Research Council (EPSRC) and the European Space Agency (ESA) under the uTRAQ project for A. Jeanjean and the NERC
knowledge exchange fellowship for R. Leigh under grant NE/L002930/1.
References
Jeanjean, A. P. R., Hinchliffe, G., McMullan, W. A., Monks, P. S., & Leigh, R. J. (2015). A CFD study on the effectiveness
of trees to disperse road traffic emissions at a city scale. Atmospheric Environment, 120, 1-14.
OECD, 2012. Environmental Outlook to 2050.
Fig.1 Modelling results of the trees effect on the dispersion of road side traffic emissions in
Leicester (UK).

91
CFD STUDY OF INDUCED EFFECTS OF TRESS ON AIR QUALITY IN A NEIGHBORHOOD OF PAMPLONA
E. Rivas, JL. Santiago, F. Martin, B. Sánchez, A. Martilli
Atmospheric Pollution Division, Environmental Department, CIEMAT
Avda. Complutense 40, 28040, Madrid, Spain
Presenting author email:
Summary
Urban trees affect air quality by modifying pollutant dispersion and by acting as pollutant sink via deposition. Despite the
fact that these effects are well known, their exact quantification in an urban environment is still lacking. This study aims at
evaluating the effects of trees on dispersion of traffic emissions in a neighbourhood of Pamplona (Spain) for different
meteorological conditions. A CFD-RANS model has been used to simulate the air flow and pollutant dispersion in this urban
area. The results have been evaluated against the measurements obtained during an experimental campaign. This comparison
is used to improve the parametrization of the vegetation effects in the CFD model.
Introduction
Nowadays, urban air quality is one of the most important environmental problems. The interaction between atmosphere and
urban surfaces (buildings, trees, etc.) induces complex flow patterns reducing the ventilation in the streets. This fact, linked
with the high traffic emissions within urban canopy, generates very heterogeneous pollutant distribution with hot spots of
concentrations that make difficult to compute the real population exposure. In this context, one of the focus of the LIFE+
RESPIRA project is to demonstrate that by promoting sustainable mobility and bicycle use, it is possible to improve air
quality and reduce exposure to air pollution. To reach this goal, one of the main tasks consists in developing a specific tool
able to reproduce the maps of pollutant in Pamplona accurately and with the highest possible resolution, as function of the
meteorological conditions. For this purpose, a CFD-RANS model has been used for simulating the urban air pollution. This
work is focused on two of the most representative streets of a neighbourhood of Pamplona: San Fermin St. and Tafalla St.
(Fig.1), characterized by: a parallel disposition and the same length (approximately 800m), road traffic, and the presence of
trees along only one of them. This configuration makes possible to study the effect of trees on pollutant concentration maps,
comparing the results on both streets.
Fig.1 Satellite image (the dashed lines are the study streets), computational domain and mesh of the study neighbourhood of Pamplona. .
Methodology and Results
A 3D full-scale geometrical model including both the buildings and the trees has been built. The spatial domain comprises a
circle of about 1.3km (Fig.1). The geometrical model takes into account the height of each building. The mesh resolution is
around 2 m in the study area (Fig.1). The main emissions are from road traffic and are modelled in the streets close to the
ground. The trees effects are implemented in the CFD model taking into account the aerodynamical effects on wind flow and
the deposition of pollutants on the trees. The dynamical effects of the vegetation are modelled considering trees as porous
medium. In this way, sources/sinks terms in the momentum, turbulent kinetic energy and turbulent dissipation rate equations
were added in the numerical cells with trees (Santiago et al., 2013). The deposition is modelled by a sink term in the transport
of pollutant equation (Vos et al., 2012). These two mechanisms (decrease of ventilation and deposition on leaves) compete
and determine the air quality at pedestrian level as well as the amount of pollution leaving the urban/vegetation canopy. In
this work, we evaluate this issue in a real environment and compare with experimental data obtained in the project.
Conclusions
CFD technique is a powerful tool to provide the pollutant distributions within the streets. This study shows the vegetation
effects on air quality in a neighbourhood by using CFD-RANS simulations. As future work, this methodology will be applied
to the whole city of Pamplona.
Acknowledgement
The authors would like to acknowledge the E. U. through the LIFE programme for the financial support of this work under
the LIFE+ RESPIRA project with contract number: LIFE13 ENV/ES/000417.
References
Vos, P. E., Maiheu, B., Vankerkom, J., & Janssen, S., 2013. Improving local air quality in cities: to tree or not to tree?.
Environmental pollution, 183, 113-122.
Santiago, J. L., Martín, F., & Martilli, A., 2013. A computational fluid dynamic modelling approach to assess the
representativeness of urban monitoring stations. Science of the total environment, 454, 61-72.

92
COMPARISON OF TEMPORAL VARIATION OF MODIS DERIVED DUST CONCENTRATION AND
SURFACE OBSERVATION OVER AN URBAN AREA
S. Sabetghadam (1), M. Khoshsima (2) and M. Hafezi (1)
(1) Institute of Geophysics, University of Tehran, Iran; (2) Satellite Research Institute, Iranian Space Research Center,
Tehran, Iran
Presenting author email: [email protected]
Abstract
Increasing number of aerosols in the atmosphere has strong impact on human health. Aerosols are caused by natural sources,
such as dust, sea-spray and volcanoes and also by anthropogenic sources, such as combustion of fossil fuels and biomass
burning activities and from gas-to-particle conversion processes. Remote sensing of aerosols has been recently used to
understand the spatial and temporal variation of aerosols. Validating aerosol products obtained from satellite sensors may
need ground-based measurements. Satellites are able to yield timely information on the atmospheric conditions at the
regional and global scales inexpensively. Many researchers are focused on studying the correlation between satellite based
aerosol properties and groud-based mass concentration measurements around the world (Wang and Christopher, 2003; Filip
and Stefan, 2011; Barladeanu et al., 2012).
In this paper, dust concentration by the Moderate Resolution Imaging Spectroradiometer (MODIS) onboard Aqua and Terra
satellites and ground based measurements of PM10 concentration, averaged over urban stations, were compared over Tehran
urban area in Iran, from 2010 to 2013. The MODIS sensor captures the radiative energy from the target in 36 spectral bands
over the visible light, near infrared and infrared spectra. The raw imagery has a spatial resolution ranging from 250 m to 1
km. Ground-based measurements of PM10 were obtained from 13 air quality stations that were used the cyclic measurement
of PM10 by beta gauge. The dataset consists of daily average of PM10. Quality control tests were applied to all data to assure
their accuracy.
The monthly variation of PM10 is distinctly different from both satellite and ground-based measurements (see fig. 1). Results
indicate that MODIS measurements underestimate the mass concentration in the whole year. Dust concentration from
MODIS has a clear maximum in the warm months, from June to August. However, the ground-based concentration shows
two maximums; one in cold months and the other in the warm months. The monthly variation in MODIS dust concentration
is less marked than that of the ground-based measurements. Consequently, as shown in figure 2, the correlation between four-
year time-series of PM10 is low (0.24). The correlation is improved when the data is divided by the seasons. The monthly
variation of correlation coefficient between MODIS and ground based PM10concetration is likely due to the level that dust
particles were loaded. During cold season, dust localized in a confined region near the surface, therefore satellite may not
recognize the dust clearly. Another reason is the different character for the aerosol particles in different months.
References
Barladeanu, R., Stefan, S., & Radulescu, R., 2012. Correlation between the particulate matter (PM10) mass concentrations
and aerosol optical depth in Bucharest, Romania. Romanian Reports in Physics, 64(4), 1085-1096.
Filip, L., & Stefan, S., 2011. Study of the correlation between the near-ground PM 10 mass concentration and the aerosol
optical depth. Journal of Atmospheric and Solar-Terrestrial Physics, 73(13), 1883-1889.
Wang, J., & Christopher, S. A., 2003. Intercomparison between satellite derived aerosol optical thickness and PM2. 5 mass:
implications for air quality studies. Geophysical research letters, 30(21).
Fig.1 Monthly average variation of dust concentration over Tehran urban area from 2010 to 2014.
Fig.2 Average correlation of dust concentration between
MODIS and ground-based measurements over Tehran urban area from 2010 to 2014.

93
MIXING LAYER HEIGHT MEASUREMENTS DETERMINE INFLUENCE OF METEOROLOGY ON AIR
POLLUTANT CONCENTRATIONS IN URBAN AREA
K. Schäfer (1), B. Bonn (2), A. Geiß (3), H. Gerwig (4), C. Münkel (5), R. Nothard (6), E. von Schneidemesser (2) and M.
Wiegner (3)
(1) Karlsruhe Institute of Technology, Institute of Meteorology and Climate Research, Department of Atmospheric
Environmental Research, 82467 Garmisch-Partenkirchen, Germany; (2) Institute for Advanced Sustainability Studies, 14467
Potsdam, Germany; (3) Ludwig Maximilian University, Meteorological Institute, 80333 Munich, Germany; (4) Federal
Environment Agency, FG II, 4.4 Air Quality Standards and Monitoring Methods, 63225 Langen, Germany; (5) Vaisala
GmbH, Weather Instruments, 22607 Hamburg, Germany; (6) Senate Department for Urban Development and the
Environment, 10179 Berlin, Germany
Presenting author email: [email protected]
Summary
Local emissions alone cannot explain high air pollution episodes in urban areas. The influences of mixing layer height
(MLH) as well as advection and convection must be considered. Results of an air quality campaign with a focus on biogenic
emissions, conducted in Berlin during summer 2014 (BÄRLIN), are discussed here. MLH is determined continuously by
ceilometers at locations inside and outside of Berlin. Correlations of MLH with air pollutants and particle number
concentrations in different size modes indicate a variety of different influences on single air pollutants, also showing the role
of particle formation processes and gaseous chemistry. Furthermore, the spatial variation of the MLH is investigated.
Introduction
MLH is a key parameter to determine the influence of meteorological parameters on air pollutants near the surface. However,
greater possibilities to apply remote sensing methodologies to estimate MLH have been identified in recent years. Such a
method was set up during the BÄRLIN campaign (Bonn et al., 2015).
Methodology and Results
The concentrations of NO, NO2, O3, CO and about 70 volatile organic compounds (anthropogenic and biogenic of origin) as
well as particle number and particle mass concentrations in different size modes were measured at an urban background
station of the Berlin air quality network (BLUME) - Nansenstr./Framstr., Berlin-Neukölln. Ceilometers, which are
commercial mini-lidar systems, were applied: A Vaisala CL51 at that site and a Jenoptik CHM 15k at the Meteorological
Observatory Lindenberg of the Deutsche Wetterdienst, which is located about 50 km south-east of Berlin. Special software
provids estimations of MLH from vertical profiles of laser backscatter data. Correlation analyses were used to investigate the
coupling of air pollutants with MLH (see Table 1). Significant influences of MLH on NO, toluene, PM2.5 and PM1 as well as
particle number concentrations in the size modes 70 – 100 /, 100 – 200 / 200 – 500 nm were found (negative correlations).
Conclusions
Anthropogenic emissions of precursor gases with subsequent particle formation, coagulation and accumulation remarkably
influence particle size distribution in the urban atmosphere. This can be concluded from the medium positive correlation
coefficients between UFP and MLH declining with increasing particle sizes as particle-particle interactions decrease. The
MLH influence is most pronounced for the central accumulation mode size range N7, for which residence time is crucial.
Small particles (N2 - N5) are emitted directly by road traffic and combustion processes. Larger particles are influenced by
sedimentation, so that there is no influence of MLH on the upper size range N8. Diesel soot emission particles (N5, r= -0.5)
and accumulation mode particles (N7, r =-0.7) correlate well with MLH. MLH correlates with smallest particles (N1, N2)
probably because of cross-correlation with global radiation and new particle formation. The most appropriate correlation
analysis of the concentrations with nearly continuous MLH values is the investigation of averaged diurnal courses of hourly-
mean air pollutant concentrations (in our case one month) in comparison to correlation analysis on an hour-by-hour basis.
Acknowledgement
We like to thank the Deutsche Wetterdienst for providing us data of their ceilometer CHM 15k at Lindenberg.
References
Bonn B., von Schneidemesser E., Schmale J., Andrich D., Quedenau J., Nothard R., von Stülpnagel A., Kerschbaumer A.,
Schäfer K., Junkermann W., Grote R., Gerwig H., Kura J., Pietsch A., Lüdecke A., Klemp D., Ehlers C., Hellen H., Hakola
H., Leigh R., Peterson P., Frenzel W., Butler T., Lauer A., Churkina G., Lawrence M.G., 2015. Die BÄRLIN2014-
Kampagne: Messung des Vegetationseinflusses auf Luftqualität und Feinstaubbelastung in Berlin. Ann. Met. 47, 118.
August MLH PM 10 PM 2,5 PM 1 NO NO2 CO Benzene Toluene
MLH 1 -0.45 -0.85 -0.82 -0.60 -0.47 -0.40 -0.45 -0.65
PM 10 -0.45 1 0.72 0.55 0.85 0.48 0.65 0.36 0.33
PM 2,5 -0.85 0.72 1 0.97 0.72 0.77 0.74 0.62 0.77
PM 1 -0.82 0.55 0.97 1 0.59 0.83 0.73 0.65 0.83
NO -0.60 0.85 0.72 0.59 1 0.47 0.58 0.33 0.44
NO2 -0.47 0.48 0.77 0.83 0.47 1 0.92 0.80 0.85
CO -0.40 0.65 0.74 0.73 0.58 0.92 1 0.83 0.76
Benzene -0.45 0.36 0.62 0.65 0.33 0.80 0.83 1 0.85
Toluene -0.65 0.33 0.77 0.83 0.44 0.85 0.76 0.85 1
August MLH N1 N2 N3 N4 N5 N6 N7 N8
MLH 1 0.46 0.39 0.20 -0.29 -0.49 -0.37 -0.73 0.07
N1 0.46 1 0.92 0.75 0.48 0.25 0.25 -0.12 0.54
N2 0.39 0.92 1 0.93 0.69 0.48 0.51 0.10 0.75
N3 0.20 0.75 0.93 1 0.85 0.69 0.72 0.35 0.76
N4 -0.29 0.48 0.69 0.85 1 0.96 0.93 0.73 0.74
N5 -0.49 0.25 0.48 0.69 0.96 1 0.98 0.88 0.62
N6 -0.37 0.25 0.51 0.72 0.93 0.98 1 0.86 0.62
N7 -0.73 -0.12 0.10 0.35 0.73 0.88 0.86 1 0.32
N8 0.07 0.54 0.75 0.76 0.74 0.62 0.62 0.32 1
Table 1. Correlation matrix for all correlation coefficients r of air pollutant concentrations with MLH on the basis of averaged diurnal
courses in August 2014. Particle number concentrations in the size modes N1=10-20, N2=20-30, N3=30-50, N4=50-70, N5=70-100, N6=100-200, N7=200-500 and N8=500-1100 nm.

94
INFLUENCE OF URBAN HEAT ISLAND ON ATMOSPHERIC COMPOSITION
A. Skorokhod (1), N. Elansky (1), O.Lavrova (1), and N. Pankratova (1)
(1) A.M. Obukhov Institute of Atmospheric Physics (OIAP), Russian Academy of Sciences, Moscow, 119017, Russia
Presenting author email: [email protected]
Summary
This study aims to reveal interrelations between atmospheric composition over cities and atmospheric boundary layer (ABL)
thermal structure. Extensive database of TROICA train measuring campaigns which occurred in 1995-2010 and included
both direct in situ atmospheric composition and air temperature profile observations was used for analyses. Average data on
temperature, humidity, and on surface concentrations of main trace gases (O3, CO, NO, NO2, SO2) in ambient air over
Russian cities of different sizes for different seasons and different times of day were obtained. The most significant effect of
temperature increase was observed in the nighttime in the central part of large cities (1.9 ° C), in small towns excess of night
temperatures is somewhat higher than the average value in middle cities because of the low-rise buildings that leads to
greater warming of the surface air layer under nighttime temperature inversions. Temperature increase over cities central part
is well correlated to changes in non-organic atmospheric composition.
Introduction
The link between atmospheric composition and thermal
structure is supposed to be significant and is confirmed for
some megacities (Elansky et al., 2014). But lack of
comprehensive direct measurements makes evidences of this
mutual interrelations quite rare. It is clear that ABL thermal
structure implies accumulation of atmospheric constituents
that in its turn leads to additional heating of air through
absorption of radiation. Unique TROICA experiment when
about 110 urban settlements of different size have been
crossed many times providing continuous accurate
measurements gave valuable statistics for quantitative
assessment of heat island parameters and its influence on
atmospheric composition and air quality.
Methodology and Results
Method of superposed epochs was used to make
statistical analyses of TROICA data (see Fig.1).
When considering the magnitude of the heat
island, depending on the season, it is determined
that the greatest increase in temperature in urban
areas of all categories is observed at night in the
summer, the smallest - in the daytime in the
transitional seasons - spring and autumn. In some
temperature growth in city comparing to
surroundings may reach 3-4ºC, but in average it
is within 1.5 ºC for large cities and within 1 ºC
for smaller ones. Maximum of air temperature
usually corresponds to significant raise of
gaseous pollutants (NOx, SO2) and to decrease of
ozone (especially in winter when ozone
destruction strongly dominates over generation)
(see Fig. 2). Carbon dioxide that has both natural
and man-made sources revealed some decrease
in summer and evident growth by 1.5-2.0% in
winter.
Conclusions
The study shows that existence of heat island over cities may be accompanied by considerable deterioration of air quality.
Quantitative relation of air composition and temperature in urban areas that was found could help to simulate contribution of
measured thermal structure on air quality. Contribution of air pollution in ABL to the heat island intensity should be
estimated in later studies.
Acknowledgement
This work was supported by RSF (grant N14-47-00049).
References
Elansky N.F., Lavrova O.V., Rakin A.A., Skorokhod A.I. 2014. Anthropogenic Disturbances of the Atmosphere in Moscow
Region. Doklady Earth Sciences 454, № 2, 158–162, DOI 10.1134/S1028334X14020020
Fig.2 Spatial distribution of O3, NOx and CO2 surface concentrations and
surface air temperature T over different groups of cities in summer and winter
according to experiment TROICA database
temperain cities of various groups in Summer and Winter
Fig.1 Scheme of relative scaling for study urban air pollution in
cities of different size

95
SPECIAL SESSION – AIR POLLUTION METEOROLOGY
FROM LOCAL TO GLOBAL SCALES

96

97
VERTICAL TROPOSPHERIC DISTRIBUTION OF AEROSOL OVER THE PO VALLEY REGION, UNDER
DIFFERENT TRANSPORT REGIMES.
S. Bucci (1,2), F.Fierli (1), F. Cairo (1), F. Ravetta (3), J.C. Raut (3), P.Cristofanelli (4), S.De Cesari(4), J. Größ (5)
(1) Institute for Atmospheric Sciences and Climate of the National Research Council , (ISAC-CNR), Rome, 00133,
Italy, (2) Sc Dept. of Physics, Ferrara University, Ferrara, 44121, Italy (3) Université Pierre et Marie Curie, UPMC-
LATMOS-IPSL, Paris, 75005, France (4) Institute for Atmospheric Sciences and Climate of the National Research
Council , (ISAC-CNR), Bologna, 40129, Italy (5) Leibniz Institute for Tropospheric Research, Leipzig, 04318,
Germany
Presenting author email: [email protected]
Summary
This work aims to provide a characterization of the vertical aerosol and pollutants variability at tropospheric level over the Po
Valley area during summer 2012. The analysis is based on a novel comprehensive database of measures complemented with
model analysis from the Lagrangian transport system FLEXPART (coupled with emission databases) and WRF-Chem, the
Weather Research and Forecasting (WRF) model coupled with Chemistry. The meteorological analysis showed a succession
of different transport regimes during the season, resulting in a large variability of aerosol and pollution at different time and
spatial scales. An aerosol classification, based on optical properties from the lidar measurements, and reinforced with aerosol
in-situ observations and transport analysis, was adopted to follow the vertical evolution of particles of different nature. The
combination of the airborne and in-situ measurements with the output of the transport and chemical models allows to
establish and explain the processes responsible for the export of primary pollutants (using CO as a tracer) from the Po valley
to the Mediterranean basin. This study allows to individuate and quantify the extent of two dust events, with an intrusion of
dust and mixing with local pollution in the Planetary Boundary Layer (PBL), of two events of Po Valley pollution export
toward the Mediterranean Basin and to identify recurrent afternoon events of non-spherical aerosol (likely soil dust) uplift.
Introduction
The Po Valley basin, located in Northern Italy, is a region characterized by high concentration of both natural and
anthropogenic aerosol and trace gases. The relative proximity to the Sahara desert makes this region often subject to long
range dust transport (e.g. Pederzoli et al., 2010). At the same time high anthropogenic emissions, coupled to stagnant
atmospheric conditions, lead to unusually high concentrations of atmospheric pollutants. Such pollution, under some
particular condition, may flow toward the Mediterranean basin (Finardi et al., 2014). The presented study offer, for the first
time, information on the impact of such transport events on the vertical distribution inside the PBL, as well as a
characterization and quantification of the export events toward the West-North Mediterranean.
Methodology and Results
Lidar profiles at San Pietro Capofiume (SPC, 44°39'0'' N, 11°37'0'' E,11m a.s.l) are used to investigate the vertical
distribution of aerosol and their optical properties; measurements from Aerodynamical Particle Sizer (APS) at SPC and
Optical Particle Counter (OPC) at the Monte Cimone WMO/GAW Global Station (CMN; 44.12N, 10.42E, 2165 m asl)
provide information on the size distribution of aerosol at the ground (around 30 m a.s.l.) and at 2100m a.s.l respectively.
Particles were mostly individuated below 2000m, with a prevalence of spherical aerosol (50% of measurements). Two events
of dust advection from northern Africa were identified (19th-21th June and 29th June–2nd July), with intrusion and mixing
with local pollution in the PBL. Dust is found prevalently above 2000m, with a frequency of occurrence of about the 20%
during the season with a non-negligible occurrence (~7%) of individuation at the ground. Moreover, events of rapid
resuspension of particles likely originated from rural soil sources under conditions of developed PBL, were observed during
afternoon-evening hours with frequency of occurrence of around 22%. The combination of CO measurements from the
TRAQA flights with the transport and chemical model analysis allowed to individuate two episodes of easterly pollution
export from the Po basin (23th -24th June and 26th -27th June), impacting the North-Western Mediterranean with a
contribution up to 50 ppbv of CO over the local background value.
Conclusions
Air quality in the Po Valley appears to be largely affected by natural sources. Events of long range transport, as well as the
episodes of soil aerosol upflit, may significantly contribute on the PM concentration exceedances. On the other hand,
transport events assign to the Po Valley area a relevant role on the pollutant concentration of the surrounding regions.
Acknowledgement
Observations are performed in the framewok of the Supersito project by Regional Agency of Prevention and Environment,
from Emilia Romagna region (ARPA-ER, Italy www.supersito-er.it), TRAQA campaign (TRAnsport et Qualité de l'Air au
dessus du bassin Méditerranéen) and the european project PEGASOS (Pan-European Gas-AeroSOl-climate interaction
Study, pegasos.iceht.forth.gr ) and the Project of National Interest NextData.
References Finardi, S., Silibello, C., D’Allura, A., Radice, P., 2014. Analysis of pollutants exchange between the Po Valley and the
surrounding European region. Urban Climate. 10, 682-702.
Pederzoli A, Mircea M, Finardi S, Di Sarra A, Zanini G., 2010. Quantification of Saharan dust contribution to PM10
concentrations over Italy during 2003–2005. Atmos Environ. 44, 4181–4190

98
NORTH ATLATIC OSCILLATION MODEL PROJECTIONS AND INFLUENCE ON TRACER TRANSPORT.
S. Bacer (1), T. Christoudias (2), A. Pozzer (1)
(1) Atmospheric Chemistry Department, Max Planck Institute of Chemistry, Mainz, Germany; (2) Computation-based
Science and Technology Research Center, The Cyprus Institute, Nicosia, Cyprus
Presenting author email: [email protected]
Summary
We use a global climate circulation model to investigate the temporal variability of the North Atlantic Oscillation (NAO)
pattern, including multi-year to decadal trends from the recent past to the end of the century, and its relation to the spatial
variability of atmospheric pollutants. We analyze the NAO signal, the influence of the NAO on the pollutant transport over
the North Atlantic sector and scan for significant trends in the future projections. In our analysis, we consider the carbon
monoxide CO pollutant tracer, which is directly emitted by combustion sources.
Introduction
The NAO plays an important role in the climate variability of the Northern Hemisphere (Hurrell, Kushnir and Visbeck, 2001)
with significant consequences on pollutant transport (Christoudias, Pozzer and Lelieveld, 2012). We study the influence of
the NAO on the atmospheric dispersion of pollutants in the near past and in the future by considering simulations performed
by the ECHAM/MESSy Atmospheric Chemistry (EMAC) general circulation model.
Methodology and Results
We analyze two model runs: a simulation with
circulation dynamics nudged towards ERA-Interim
reanalysis data over a period of 35 years (1979-2013)
and a simulation with prescribed Sea Surface
Temperature (SST) boundary conditions over 150
years (1950-2099). The model is shown to reproduce
the NAO spatial and temporal variability and to be
comparable with observations (Fig.1). We find that the
decadal variability in the NAO, which has been
pronounced since 1950s until 1990, will continue to
dominate in the future considering decadal periods,
although no significant trends are present in the long
term projection (100-150 years horizon). We do not
find in the model projections any significant temporal
trend of the NAO for the future, meaning that neither
positive nor negative phases will dominate. Tracers
with idealised decay and emissions are considered to
investigate the NAO effects on transport; it is shown
that during the positive phase of the NAO, the
transport from North America towards northern Europe is stronger and pollutants are shifted northwards over the Arctic and
southwards over the Mediterranean and North Africa, with two distinct areas of removal and stagnation of pollutants.
Conclusions
Our results indicate that the NAO is influenced by natural climate variability rather than external factors. We find
confirmation that SSTs influence the NAO evolution. Since the NAO is strongly correlated with pollutant transport, the NAO
Indices may be used as indicators of (future) pollutant transport over Europe.
Acknowledgements
The authors wish to extend their gratitude to the MESSy Consortium and the international IGAC/SPARC Chemistry-Climate
Model Initiative (CCMI, 2013). The simulations used were carried out as part of the Earth System Chemistry integrated
Modelling (ESCiMo) project.
References
Hurrell, J. W., Kushnir, Y., Visbeck, M., “The North Atlantic Oscillation”, Science, 291, 603-602, 2001
Christoudias, T., Pozzer, A., and Lelieveld, J., “Influence of the North Atlantic Oscillation on air pollution transport”, Atmos.
Chem. Phys., 12, 869877, doi:10.5194/acp-12-869-2012, 2012.
Fig.1 Hatfield Tunnel and its sketch map
Fig.1: Observed and Modelled NAO index values

99
SIMULATING AEROSOL-CLOUD INTERACTIONS OVER SOUTHERN WEST AFRICA WITH COSMO-ART
IN THE FRAMEWORK OF DACCIWA
Deetz, K.(1), Vogel, B.(1)
(1) Institute for Meteorology and Climate Research, Karlsruhe Institute of Technology (KIT),
Hermann-von-Helmholtz-Platz 1, Building 435, 76344 Eggenstein-Leopoldshafen, Germany
Presenting author email: [email protected]
Summary
For a case study in June 2014, the atmospheric composition and the feedback between aerosols and clouds over Southern
West Africa (SWA) have been simulated with the integrated modelling system COSMO-ART (Vogel et al., 2009, Bangert et
al., 2012). The application of an interaction between aerosols and clouds leads to a significant increase in the extension of the
simulated low-level stratus and a reduction of their cloud base height over Togo and Benin.
Introduction
SWA is linked to rapid socio-economical changes including a strong population increase, enhanced urbanization, landuse
changes and increased anthropogenic emissions. Within the EU project DACCIWA (Dynamics-aerosol-chemistry-cloud
interactions in West Africa) we contribute with COSMO-ART to the understanding of the impact of the atmospheric
composition on the cloud microphysical and dynamical behavior across SWA.
Methodology and Results
COSMO-ART was used in the weather forecast mode with a grid mesh size of 3km, based on a double-nesting with 28km
and 5km grid mesh size. The model describes online the emission and the temporal development of aerosols and their
feedback on radiation and cloud formation. Furthermore the two-moment scheme of Seifert and Beheng (2006) was activated
instead of the standard bulk scheme which is usually used in COSMO for the operational weather forecast. The model
includes the variety of emission sources relevant for the research domain (e.g. sea salt, mineral dust, biogenic volatile organic
compounds, vegetation fire emissions, anthropogenic emissions). Additionally a parameterization of the gas flaring
emissions, which are emitted especially at the Niger Delta and the Nigerian coastal area, has been developed and applied.
With this model setup it was possible to simulate the air pollution contribution from the several sources and the interaction
especially with the so-called Nocturnal low-level stratus (NLLS) which frequently occurs in extended areas across SWA
during the West African Monsoon. As a case study we have selected a two day period from 7th to 8th of June 2014 which
was linked to a distinct NLLS layer. In comparison to a reference simulation without aerosol-cloud interactions a significant
increase in the extension of the NLLS and a reduction of the cloud base height over Togo and Benin can be seen.
Conclusions
By conducting a COSMO-ART aerosol-cloud interaction case study simulation, which considers the natural and
anthropogenic emissions in SWA, it can be shown that the aerosol has a strong influence on the SWA cloud characteristics.
However an analysis of further case studies is necessary for a better understanding of the underlying
local processes.
References
Bangert, M., Nenes, A., Vogel, B., Vogel, H., Barahona, D., Karydis, V. A., Kumar, P., Kottmeier, C., Blahak, U., 2012.
Saharan dust event impacts on cloud formation and radiation over Western Europe, Atmos. Chem. Phys., 12, 4045-4063.
Vogel, B., Vogel, H., Bäumer, D., Bangert, M., Lundgren, K., Rinke, R., Stanelle, T., 2009. The comprehensive model
system COSMO-ART - Radiative impact of aerosol on the state of the atmosphere on the regional scale, Atmos. Chem.
Phys., 9, 8661-8680

100
IMPACT OF REGIONAL CIRCULATION ON METEOROLOGY AND EXTREME EVENTS OVER ASIA FOR
PRESENT AND FUTURE CLIMATE
J.S.N. de Medeiros; R. Sokhi
Centre for Atmospheric and Instrumentation Research (CAIR), University of Hertfordshire, Hatfield, Hertfordshire, AL10
9AB, United Kingdom
Presenting author email: [email protected]
Summary
A numerical simulation of climate over the Asian region using WRF at a spatial resolution of 54 km, was performed for 3
representative years of present and future climate under the RCP 8.5 scenario using the HADGEM2-ES as the forcing global
model. The aim was to study the potential relationship between large and regional scale circulation and their influence on
regional meteorology and events of extreme weather over Asia. Extreme weather events are usually linked with persistent
synoptic anomalous circulation patterns over a region. Several of these events are also related with stable atmospheric
conditions that are known to be precursors of high pollutants concentration events. This study focusing on characterising the
Asian meteorology shows that the variation of persistent circulation patterns appear to influence regional events of extreme
weather such as heat waves, consecutive dry days, consecutive wet days and strong breeze days. Moreover, the variation of
the regional anomalous circulation could be linked with variations on the large scale circulation features.
Introduction
The link between circulation and regional weather has been well documented, especially over Europe (e.g. Cassou et al.,
2005). These studies highlighted the important role of some climate features such as the North Atlantic Oscillation (NAO),
atmospheric blocking, and extra tropical cyclones (ETC’s) and their influence on colder and wetter winters and hotter and
dryer summers. While much of the research has focussed on the European region, there are relatively less research
investigations for the Asian continent. Along with the previous climate features, the intertropical Convergence Zone (ITCZ),
Monsoonal Circulations, and the El-Niño Southern Oscillation (ENSO) play a role in the anomalous atmospheric circulation
patterns that influence the onset of severe weather episodes affecting several Asian regions (e.g. Park et al., 2013; Chen,
2013). This study focusses on the analysis of the temporal and spatial evolution of weather extremes as well as anomalous
circulation patterns and regional meteorology over the Asian region.
Methodology and Results
The general analysis of circulation patterns and meteorological events over Asia relied on the combined use of a global
climate model HadGEM2-ES and WRF modelling systems. For the definition of extreme weather events and meteorological
analysis, daily precipitation (Pr), 2-m mean, minimum and maximum temperature (Tmean, Tmin and Tmax), 10-m wind and
horizontal components (W10, U10 and V10) and mean sea level pressure (MSLP) were applied. Empirical Orthogonal
Functions (EOFs) were used to detect circulation patterns, and, climate indices defined by the European Climate Assessment
& Dataset (ECA) project, were computed regarding extreme events. The ERA-Interim (ERA-I) reanalysis was used for
model evaluation regarding the present climate. Increase of consecutive dry days and heat waves over Central, Southern and
Eastern Asia from 2000 to 2050 (Fig.1) appear to be in line with the increase of anticyclonic activity over the region during
summer. Also during summer periods, consecutive wet days are shown to decrease in South Asia and increase over the
Tibetan Plateau. The analysis also shows that the duration of the South Asian Monsoon decreases from May to September in
2000 to July to August in 2050. There is some evidence that this could be due to the decrease of the temporal predominance
of the cyclonic circulation during summer period over the years. Fig1. Consecutive 5 day periods and heat wave duration during the summer months (JJA) of the year of 2050.
Conclusions
This modelling study reports the impact of regional
circulation on meteorology and on events of extreme
weather over Asia. Variations in temperature and
precipitation, persistent anomalous circulation patterns
and regional features are shown to influence the
evolution of extreme weather events. Future changes in
the large-scale circulation, regional circulation patterns and meteorology, appear to influence the evolution of the extreme
events over several Asian regions.
Acknowledgement
This work was possible due to the global model HADGEM2-ES meteorological data provided by UKMO centre. Part of the
research involving climate and meteorology approach was developed as part of FP7 TRANSPHORM project.
References
Cassou, C. L. Terray and A.S. Phillips (2005): Tropical Atlantic influence on European heat waves. J. Clim. , 18, 2805-2811
Yang Chen and Panmao Zhai, 2014: Precursor Circulation Features for Persistent Extreme Precipitation in Central-Eastern
China. Wea. Forecasting, 29, 226–240. doi: http://dx.doi.org/10.1175/WAF-D-13-00065.1
Park, T, Yi Deng, C.H, 2013: A synoptic and dynamical characterization of wave-train and blocking cold surge over East
Asia. Climate Dynamics, August 2014, Volume 43, Issue 3-4, pp 753-770

101
COASTAL OZONE IN NAPLES: EPISODE ANALYSIS BY MEANS OF AIRCRAFT MEASUREMENTS AND
MESOSCALE MODELLING
S. Finardi (1), D. Gasbarra (2), G. Calori (1), A. D’Allura (1), B. Gioli (3), G. Agrillo (2), P. Carlucci (2), L. Shindler (2)
and V. Magliulo (2)
(1) ARIANET Srl, Via Gilino 9, 20128 Milano, Italy; (2) CNR/ISAFOM, via Patacca 85, 80040 Ercolano, Italy; (3)
CNR/IBIMET, via Caproni 8, 50145 Firenze, Italy
Presenting author email: [email protected]
Summary
Persistent high pressure ridges of African origin affecting the Mediterranean basin and continental Europe cause heat waves
in different areas of the continent and favour the occurrence of ozone episodes, as happened in July 2015. Airborne
observations have been performed on 15-16 July over the coastal region near Naples. Aircraft measurements have been
compared with high resolution meteorological and air quality model simulations to verify their reliability and to investigate
local circulation and pollutants dynamics. Sea breeze and local emissions gave rise to production of ozone inland of Naples
conurbation, causing high concentrations over the region located between the coast and the Apennine chain. Ozone was then
injected in the upper boundary layer and transported towards the sea by the wind rotation occurring above 500 m a.s.l.
causing a complex vertical layering of concentration over the coast, with maximum values between 500 and 800 m.
Introduction
Naples is one of the largest conurbations in the Mediterranean basin. Road
traffic, harbour activities and winter residential heating are the main air
pollutants sources. High ozone concentrations episodes affect the inland
region downwind of the densely inhabited coastal area. The project AriaSaNa
(http://www.ariasana.org/) has the objective to improve the knowledge of air
quality processes integrating innovative ground based and airborne
measurements with state-of-the–art meteorological and air quality modelling.
A forecast system based on the chemical transport model FARM (Mircea et
al., 2014) coupled with the meteorological model WRF (http://www.wrf-
model.org/) runs operationally since July 2014 with a horizontal grid spacing
of 1 km. Besides that, 2015 summer campaigns investigated air pollution
through measurements performed by the SkyArrow/ERA aircraft.
Methodology and Results
Airborne measurements were performed at an average height of 150 m a.g.l.
along a square track with side length of about 30 km enclosing Naples, its
gulf, and the Vesuvius. The airplane executed vertical profiles at the square
track vertexes up to a height of about 1500 a.s.l. The main atmospheric flow
features detected on July 15th are correctly reproduced by WRF (Fig.1). Differences
between modelled and measured wind are observed in the wake of Vesuvius, where
unsteady flow can occur. Observed and modelled ozone concentrations show a
general coherence, with higher spatial detail provided by airborne measurements.
The occurrence of elevated concentrations over the inland plains is confirmed. The
model predicts high concentrations over the sea due to the advection from the ozone
layer over the Tyrrhenian sea foreseen by continental scale models into which the
local simulation is nested. The aircraft detects reduced O3 concentration over the gulf
of Naples, that can be explained by titration effect of NOX emissions due to the
intense marine traffic during the touristic season, and can be underestimated by
modelled emissions. The comparison of ozone vertical profiles shows coherence of
measured and modelled concentrations near the surface and in the upper layers,
while the model apparently does not foresee the ozone rich layer visible between 500
and 1000 in the western (Fig 2) and northern profiles. A deeper exploration of model
results (relaxing the comparison pairing in space and time) allowed to confirm and interpret the observations. The ozone
produced inland is transported vertically in the upper boundary layer, where wind direction then turns counter clockwise,
carrying pollutants towards the sea and causing complex vertical layering of concentration over the coastal area.
Conclusions
Airborne measurement together with high resolution mesoscale model simulation allowed to analyse and explain the complex
atmospheric pollutants dynamic and its short term variability over the gulf of Naples. The analysis results can help to
improve the quantification of the population and agricultural areas exposure to high ozone concentrations.
References
Mircea M., Ciancarella L., Briganti G., Calori G., Cappelletti A., Cionni I., Costa M., Cremona G., D’Isidoro M., Finardi S.,
Pace G., Piersanti A., Righini G., Silibello C., Vitali L., Zanini G. 2014. Assessment of the AMS-MINNI system capabilities
to predict air quality over Italy for the calendar year 2005. Atmospheric Environment 84,178-188.
Fig.2 Measured (ascending and
descending leg; black) and predicted
(red) ozone (μg/m3) vertical profiles.
Fig.1 Measured wind (black) and WRF
forecast (red) along flight track

102
THE INFLUENCE OF MID-LATITUDE CYCLONE TRACKS ON SURFACE OZONE AT REMOTE EUROPEAN
COASTAL MONITORING SITES
K.E. Knowland (1, 2), R.M. Doherty (2), K.I. Hodges (3)
(1) NASA Goddard Space Flight Center, Greenbelt, MD, USA; (2) School of Geosciences, University of Edinburgh,
Edinburgh, UK; (3) Department of Meteorology, University of Reading, Reading, UK
Presenting author email: [email protected]
Summary
The role of the passage of mid-latitude cyclones on surface O3 in springtime was investigated by linking O3 measurements
from the EMEP database for ~20 years from two remote stations (far from major emission sources) on the west coast of
Europe – Mace Head, Ireland and Monte Velho, Portugal – to cyclone tracks that passed the surrounding region. O3
measurements at Mace Head and Monte Velho are influenced by cyclone tracks passing in different regions in the vicinity of
the observation sites, demonstrating the importance of the associated fronts and conveyor belts. Case studies examined in
detail the spatio-temporal influence at each location of strong cyclones on surface O3 as the cyclones evolved. Different
synoptic situations led to high and low O3 at the two surface stations.
Introduction
The spatiotemporal variability in meteorological factors -- wind speed and direction, humidity and temperature -- impacts the
temporal variability of pollutant concentrations. These meteorological factors are influenced by the large-scale atmospheric
pressure centers nearby. For Western Europe, this is mainly the location of the semi-permanent Icelandic Low, a
climatological feature due in part to the cumulative effect of many cyclones passing through the region between Iceland and
southern Greenland, and the semi-permanent Azores High. The seasonal variability in the frequency of cyclones can impact
surface O3 observations, whereby the frequent cyclones associated with the Icelandic Low can entrain air from different
source regions, primarily, Europe and North America. North American emissions are able to reach Europe both in the low-
level winds as well as lofted by frontal lifting to upper-levels, along the North Atlantic storm track region, where air can be
rapidly transported downwind.
Methodology and Results
Spring was chosen as it is typically the season of maximum intercontinental transport and stratosphere-to-troposphere
transport (STT) of O3 at these locations. Cyclones were identified in the ERA-Interim reanalysis and the MACC reanalysis
using the cyclone tracking algorithm, TRACK (Hodges, 1995, 1999). The two stations were chosen due to their location
within and slightly south of the major North Atlantic storm track, respectively. The causes of high and low O3 values
measured at each station in relation to the frequency and passage of mid-latitude cyclones was quantified. For Mace Head,
when cyclones tracked north of the station or the region was centered over Mace Head, there was a significant likelihood that
surface O3 measurements would be high (> the 75th percentile value). Conversely, more cyclones were associated with low
O3 measurements (< the 25th percentile) when they passed to the south of Mace Head. At the more southerly station, Monte
Velho, the relationship between the location of storm tracks and surface O3 is weaker and generally opposite to that at Mace
Head, whereby slightly more cyclones passing to the north (on the edge of the storm track) are associated with low surface O3
and slightly more cyclones to the south of the observation site (far from the storm track region) associated with high O3.
The MACC reanalysis was utilised to select the
strongest cyclones passing to the north and south of
each station that were associated with high O3 and
where measured surface O3 and MACC simulated O3
values were within 20% agreement. For the two
cyclones that passed to the north of Mace Head (N1;
Fig. 1) and Monte Velho (not shown), O3-poor
subtropical air arrived from the southwest, ahead of the
associated cold fronts. In all four case studies, following
the passage of the cold front, high surface O3 was
associated with air that originated in the stratosphere
being brought down to the mid and lower troposphere
within the dry intrusion airstream. However, a direct
connection with the stratosphere was not required as
aged, stratospheric O3-rich air from previous cyclones in
the region could become entrained and subsequently
descend within the strong cyclones (to the south of Mace Head and north of Monte Velho) and large-scale descent and
accumulation of O3-rich air could occur within a neighboring anticyclone (south of Monte Velho).
Conclusions
The temporal variability of O3 measurements are influenced by passing cyclones. The case studies highlight the importance
of the passage of a cyclone’s cold front to influence surface O3 measurements, the ability of cyclones to bring down O3 from
the stratosphere, and that nearby surface high pressure systems also play an important role in the variability of surface O3.
References
Hodges, K.I. 1995. FEATURE TRACKING ON THE UNIT-SPHERE. Mon. Wea. Rev. 123, 3458-3465.
Hodges, K.I. 1999. Adaptive constraints for feature tracking. Mon. Wea. Rev. 127, 1362-1373.
Fig. 1 MACC reanalysis O3 (color), MSLP (contours) and
horizontal winds at 1000 hPa on 4March 2007 00UTC. Approximate cold front indicated by blue line with triangles.Fig 1.

103
THE IMPACT OF LONG RANG AIR TRANSPORT ON THE SURFACE NH3 LEVELS AT A RURAL SITE IN
THE NORTH CHINA PLAIN IN SUMMER 2013
Z.Y. Meng (1), X.B. Xu (1), W.L. Lin (2), Y.L. Xie (3), S.H. Jia (1), R. Zhang (4), Y.A. Jiang (5)
(1) Key Laboratory for Atmospheric Chemistry, Institute of Atmospheric Composition, Chinese Academy of Meteorological
Sciences, Beijing, China; (2) CMA Meteorological Observation Centre, Beijing, China; (3) University of Science and
Technology Beijing, Beijing, China; (4) Beijing Municipal Research Institute of Environmental Protection, Beijing, China;
(5) China Railway Corporation, Beijing, China
Presenting author email: [email protected]
Summary
In-situ measurement of ambient ammonia (NH3), trace gases and the water-soluble ions in PM2.5 was conducted at Gucheng
(39°08′N, 115°40′E, 15.2 m a.s.l.), a rural site in the NCP in summer 2013. The mean hourly concentrations of NH3, SO2 and
NOx were 43.9, 4.3 and 13.2 ppb, respectively, and 19.77, 19.77 and 11.34 g/m3 for NH4+, SO4
2- and NO3- in PM2.5, at
Gucheng in summer 2013. The air masses from the North China Plain region contain the highest concentration of ammonia,
suggesting a potential contribution of air transport to our measurements. The result reveals that the NH3 concentrations are
influenced by meteorological conditions, atmospheric mixing, local and regional sources during summer 2013 in Gucheng.
Introduction
Ammonia is the primary alkaline trace gas in the atmosphere. Ammonia has both direct and indirect impacts on important
environmental issues including regional fine particles, acid rain and eutrophication (e.g. Meng et al., 2011). Ammonia and
other trace gases are observed by DLT-100 Ammonia Analyzer and a set of commercial instruments from TE during summer
2013. The hourly concentrations of the water-soluble inorganic ions in PM2.5 are also measured with the Ambient Ion
Monitor (URG 9000 Series, USA) in summer 2013.
Methodology and Results
The concentrations of NH3 at Gucheng site range from 0.9 to 862.9
ppb, with the average of 43.9±65.9 ppb. To identify the impact of
long-range air transport on the surface air pollutants levels, the 72-h
backward trajectories were calculated using the HYSPLIT 4.9 model.
The trajectory calculations were done for four times of each day in
summer 2013, with the four time points of 00, 06, 12, and 18 UTC,
respectively. The various back trajectories were grouped into 5
clusters. As can be seen in Fig. 1, Clusters 1, 2 and 3 represent
relatively low and slow moving air parcels, with cluster 2 coming
from northwest areas at the lowest transport height among the 5
clusters. The other two clusters represent air parcels mainly from the
northwest. These clusters of trajectories originated from clean regions
and travelled quickly from higher atmosphere to Gucheng site in the
North China Plain, which is expected to bring cleaner air masses into
surface. The cluster 2 from the North China Plain region was most
important for the rural site, contributing 56% of air masses. The
occurrence frequencies of each type of air masses arriving at
Gucheng in different months were calculated. The corresponding
mean concentrations of NH3 in different clusters of backward
trajectories are also analyzed in order to characterize the dependences of the pollutants concentrations on air masses. Large
differences in the concentrations of NH3 exist among the different clusters, with cluster 2 corresponding to the highest NH3
level (48.9 ppb), and cluster 3 corresponding to the second highest NH3 level (32.8 ppb). These two types of trajectories have
the shortest transport distances and lowest transport heights, which help the accumulation of NH3. The high NH4+ level (45.9
g/m3) in cluster 4 might be subject to the long rang transport from northwest sector.
Conclusions
The results indicate that transport of air masses from the North China Plain region might contributed to the atmospheric
ammonia variations in Gucheng, , a rural site in the NCP, while the NH4+ was contributed by both long-range transport and
local formation.
Acknowledgement
This work was supported by National Natural Science Foundation of China (21377165), China Meteorological
Administration (GYHY201206015) and Basic Research Fund of CAMS (2013Z003).
References
Meng Z Y, Lin W L, Jiang X M, et al., 2011. Characteristics of atmospheric ammonia over Beijing, China. Atmos. Chem.
Phys, 11: 6139–6151
Fig.1 72-h backward trajectories for 100 m above
ground level at Gucheng in summer 2013

104
SOURCE-RECEPTOR RELATIONSHIPS OF INTERCONINENTAL TRANSPORT USING THE UKCA
CHEMISTRY-CLIMATE MODEL FOR THE TF-HTAP PHASE 2 PROJECT.
G.Folberth (1), F O’ Connor (1), S.Turnock (1), R.Doherty (2), A.Archibald (3), O.Wild (4), W.Collins (5), D.Stevenson (2)
and S.Arnold (6)
(1) Met Office Hadley Centre FitzRoy Road Exeter EX1 3PB United Kingdom; (2) School of Geosciences, University of
Edinburgh, Crew building, King's buildings, Alexander Crum Brown Road, Edinburgh, EH9 3JN, United Kingdom; (3)
Cambridge Centre for Climate Science, Centre for Atmospheric Science, Cambridge University, Chemistry Department,
Cambridge, CB21EW, United Kingdom; (4) Lancaster Environment Centre, Lancaster University, Lancaster, LA1 4YQ,
United Kingdom; (5) Department of Meteorology, University of Reading, Earley Gate, PO Box 243, Reading, RG6 6BB,
United Kingdom; (6) Institute for Climate & Atmospheric Science,
School of Earth & Environment, University of Leeds, LS2 9JT, United Kingdom
Presenting author email: [email protected]
Summary This study presents results from source-receptor simulations performed with the United Kingdom Chemistry Aerosol
(UKCA) model as part of the Task Force on Hemispheric Transport of Air Pollution (TF-HTAP) phase 2 model
intercomparison. These simulations examined the effects of: a) a 20% emission reduction from a number of source regions on
their downwind continents; b) global perturbations to different emission sectors and c) global perturbations to different
pollutants. UKCA results from these different simulation sets are compared to further understand the impact of potential
control strategies in different world regions.
Introduction Currently, there are no international agreements that address the intercontinental transport of tropospheric ozone and its
precursors. However the contribution of upwind pollution to free tropospheric levels as well as to exceedances of surface air
quality standards over downwind regions have been reported e.g. from East Asia to the western United States (Lin et al.
2012). In TF-HTAP phase 1, an ensemble of 21 global and hemispheric chemistry transport models was applied to estimate
the spatially average surface ozone response over east Asia, Europe, North America, and south Asia to 20% decreases in
anthropogenic emissions of the ozone precursors: Nitrogen Oxides (NOx), Non-Methane Volatile Organic Compounds
(NMVOCs), and Carbon Monoxide (CO) (individually and combined), from each of these regions (Fiore et al. 2009). The
ensemble mean annual-mean surface ozone response to foreign emissions was largest in spring and late autumn (~1 ppbv)
when intercontinental transport tends to be strongest. In TF-HTAP phase 2 a larger number of source/receptor regions are
considered. Additionally, sector based emission perturbations as well as those of individual pollutants are evaluated.
Methodology and Results A large set of perturbation simulations were performed for the period 2008-2010 using the UKCA chemistry-climate model.
A base simulation was first undertaken and the results evaluated against observations. The main focus of these simulations
was to examine the effects of 20% emissions reductions globally and over 13 world regions (see Fig. 1) on pollutant
concentrations downwind. Further perturbation simulations
were performed to assess the effects of global emission
reductions from (i) anthropogenic sectors of transportation,
power and industry and residential and (ii) natural sources of
fires and dust. A final set of simulations examined the effects
of reducing global NOx, CO and CH4 levels. The results from
these simulation will be presented to further understand the
intercontinental transport within similar latitude bands e.g.
across mid-latitude regions, from the mid-latitudes to the
tropics and across hemispheres. Furthermore, the global
effects of emission reductions to various sectors/sources will
be outlined. Fig.1 World regions defined for the HTAP 2 intercomparison
Conclusions A large number of model perturbation experiments have been performed to quantify the role of intercontinental transport
from a diverse range of major emission source regions on their downwind receptor regions, and in particular to examine
transport within and across hemispheres. Source-receptor relationships for various sectors and sources are also quantified.
Acknowledgement This work was supported by the UK Met Office and the Task Force on Hemispheric Transport of Air Pollution
References Cooper et al. 2010, Increasing springtime ozone mixing ratios in the free troposphere over western North America, Nature,
463, 334–348.
Fiore et al. 2009, Multimodel estimates of intercontinental source-receptor relationships for ozone pollution, J. Geophys.
Res.,114, doi:10.1029/2008JD010816
Lin et al. 2012, Transport of Asian ozone pollution into surface air over the western United States in spring , J. Geophys.
Res.,117, doi:10.1029/2011JD016961.

105
FORECASTING LONG-RANGE AIR QUALITY IMPACTS OF WILDFIRE EMISSIONS
M. Parrington, A. Agusti-Panareda, A. Benedetti, R. Engelen, F. di Giuseppe, J. Flemming, A. Inness, L. Jones, S. Massart,
V.-H. Peuch
European Centre for Medium-range Weather Forecasts (ECMWF), Shinfield Park, Reading, RG2 9AX, United Kingdom
Presenting author e-mail: [email protected]
Summary
We present an overview of the Copernicus Atmosphere Monitoring Service (CAMS) and its application to monitor and
evaluate the long-range impact of North American wildfire emissions on European air quality in the summer of 2015.
Introduction
The Copernicus Atmosphere Monitoring Service (http://atmosphere.copernicus.eu/), implemented by ECMWF on behalf of
the European Commission, provides a unique perspective on global atmospheric composition and the transport and impact of
atmospheric pollution associated with wildfire emissions. CAMS utilises near real-time satellite observations of wildfire
locations and emissions of aerosols and trace gases. Five-day forecasts of global smoke aerosol and trace gases, produced on
a daily basis with the ECMWF Integrated Forecasting System (IFS), allow pollution plumes to be predicted to several days
ahead. European regional air quality forecasts are performed using a suite of state-of-the-art air quality models to calculate
multi-model ensemble products with boundary conditions from the global system.
Monitoring fire emissions and pollution transport
Wildfires are a significant component of the Earth system,
emitting large quantities of trace gases and aerosols which
perturb the chemical composition of the atmosphere and can have
impacts on surface air quality far from the emission source. The
2015 wildfire season in boreal North America was particularly
strong, exacerbated by persistent dry conditions in the west. More
than 5 million acres in Alaska and 9.7 million acres in Canada
were burnt, making 2015 the second most devastating fire year on
record for Alaska after 2004, with the most intensive three-week
period of burning on record. We evaluate the long-range transport
of emissions from these wildfires on European air quality,
analysing CAMS forecasts of trace gases and aerosols associated
with forest fires (e.g., carbon monoxide, PAN, and organic and
black carbon aerosol) in comparison against satellite and aircraft
observations.
The most intensive wildfires in boreal North America started in
Alaska and Canada in the second half of June, lasting into the
first half of July. The total amount of carbon monoxide emitted
by these fires over this period was estimated, using satellite
measurements of fire radiative power, to be 13 Tg(CO). Smoke
plumes were monitored during their transit to Europe via the
North Atlantic Ocean (as shown in Fig 1) and in one case via the
eastern Arctic Ocean. The CAMS global forecasts generally
performs well, correctly estimating the time of arrival of the
smoke plumes into the Europe domain. However, Fig 2 shows
that the CAMS global system can underestimate or cannot fully
resolve fine-scale vertical structures in the observations related to
the relatively coarse horizontal resolution of the IFS.
Fig 1 CAMS forecast CO (ppb) at 500 hPa averaged
between 1 and 15 July 2015. The white triangle
indicates the location of Frankfurt, Germany where
the smoke plume was observed in the free
troposphere.
Fig 2 CO profile over Frankfurt, Germany on 8 July
2015 observed in situ by IAGOS (black line) and
forecast by the CAMS global system (red line).
Conclusions
CAMS operationally produces a wide-range of products related to atmospheric composition including reactive gases,
greenhouse gases, and aerosols. These products are provided via a free and open data access policy for anyone to download.

106
THE INFLUENCE OF SYNOPTIC WEATHER REGIMES ON UK AIR QUALITY: REGIONAL MODEL
STUDIES OF TROPOSPHERIC COLUMN NO2
R. Pope (1, 2), N. Savage (3), M. Chipperfield (1, 2), C. Ordóñez (3) and L. Neal (3)
(1) School of Earth and Environment, University of Leeds, Leeds, LS2 9JT, United Kingdom; (2) National Centre for Earth
Observation, University of Leeds, Leeds, LS2 9JT, United Kingdom; (3) Met Office, Exeter, EX1 3PB, United Kingdom
Presenting author email: [email protected]
Summary
Previous studies have shown a relationship between observed satellite tropospheric column NO2 and synoptic meteorology.
In this study, we show that the UK Met Office Air Quality in the Unified Model (AQUM) can simulate tropospheric column
NO2 fields under cyclonic and anticyclonic conditions, as seen from space. The model is used to investigate the importance
of different controlling factors (e.g. chemistry and transport) to UK air quality. By using a range of idealised NOx-like tracers
with different e-folding lifetimes, we show that under different synoptic regimes the NO2 lifetime in AQUM is approximately
6 hours in summer and 12 hours in winter. Within a season (summer or winter) under different synoptic regimes, a large
proportion of the spatial pattern in the UK column NO2 fields can be explained by transport processes.
Introduction
Synoptic weather can significantly influence UK air quality through the transport and accumulation of atmospheric pollutants
over source regions and urbanised areas. Pope et al., (2014) was one of the first studies to use satellite data (NO2) to detect
enhanced air pollutant concentrations under stable conditions. Here, we see if the UK Met Office’s air quality model can
simulate these relationships and aim to better understand the factors governing UK air quality.
Methodology and Results
The Lamb Weather Types (LWT) are an objective
midday classification of UK circulation patterns.
Daily UK circulation is categorised under a specific
vorticity type (e.g. cyclonic) and flow (e.g.
northerly). Pope et al., (2014) used the LWT to
composite tropospheric column NO2 data from the
Ozone Monitoring Instrument (OMI - 13:00 LT
overpass) under winter and summer cyclonic and
anticyclonic conditions. Under anticyclonic
conditions, tropospheric column NO2 is larger over
the UK source regions when compared with the
seasonal average (positive anomalies in Figures 1b
& d). Cyclonic conditions reduced tropospheric
column NO2 over the UK as the unstable weather
transports it out over the North Sea. This is seen in
Figures 1a & c, from the negative (positive)
anomalies over the UK (North Sea).
We composite AQUM tropospheric column NO2
fields directly under the LWTs and show that
AQUM can successful simulate the LWT-NO2
relationships seen from space. NOx-like tracers
with fixed life-times were used to determine an
approximate life-time of tropospheric NO2 under the seasonal synoptic regimes. Depending on which tracer life-time
anomaly field (similar to Figure 1) matched the AQUM NO2 anomaly field indicated the approximate NO2 life-time. Overall,
summer (winter) NO2 has approximate lifetimes of 6 (12) hours.
Conclusions
This study shows that to a first-order approximation atmospheric chemistry is, as expected, more influential in summer than
in winter. By using NOx-like idealised tracers with fixed life times, we show that within seasonal synoptic regimes, transport
processes explain a large proportion of the spatial variability in UK tropospheric column NO2. This work also shows that the
Met Office AQUM can reproduce the large-scale accumulation of air pollution over the UK under anticyclonic conditions.
Acknowledgement
We acknowledge the use of the TEMIS (http://www.temis.nl/index.php) OMI dataset and the LWT data from the Climatic
Research Unit, University of East Anglia. This work was supported by the UK NERC National Centre for Earth Observation.
References
Pope et al., 2014, The influence of synoptic weather regimes on UK air quality: analysis of satellite column NO2:
Atmospheric Science Letters 15, 211-217.
Fig.1 OMI tropospheric column NO2 (x1015 molecules/cm2) anomalies from the seasonal average for a) summer cyclonic, b) summer anticyclonic, c)
winter cyclonic and d) winter anticyclonic conditions. Black polygonned
regions show statistically significant anomalies at the 95% confidence level.

107
A MULTI-SCALE MODELLING SYSTEM FOR STUDYING URBAN CHEMISTRY AND TRANSPORT
J.R. Stocker (1), C.M. Hood (1), I.A. Mackenzie (2), D.J. Carruthers (1), R.M. Doherty (2), T. L. Malkin (3), L.K. Whalley
(3), D.E. Heard (3) and M.Vieno (4)
(1) Cambridge Environmental Research Consultants, 3 Kings Parade, Cambridge, CB2 1SJ, United Kingdom; (2) School of
Geosciences, University of Edinburgh, Crew building, King's buildings, Alexander Crum Brown Road, Edinburgh, EH9 3JN,
United Kingdom; (3) School of Chemistry, University of Leeds, LS2 9JT, United Kingdom; (4) Centre for Ecology &
Hydrology, Bush Estate, Penicuik, Midlothian, EH26 0QB, United Kingdom
Presenting author email: [email protected]
Summary
This paper presents preliminary results from a coupled air quality modelling system comprising a Gaussian-type local air
quality model with a regional photochemistry transport model. Predicted modelled concentrations are compared to
measurements recorded in London, for a range of sites. This work forms part of the NERC project CureAir (Coupling Urban
and Regional processes: Effects on Air Quality) and an overview of the aims of this project will also presented.
Introduction
Despite substantial emission controls, the health burdens of the EU urban population attributable to exposure to air pollution
are substantial with fine particle matter (PM2.5) responsible for ~458 000 premature deaths in Europe in 2011 (EEA, 2014).
Hence, the capability to simulate the complex urban chemical environment is imperative for the development of policies
aiming towards improving poor air quality and human health. The chemical composition of the urban atmosphere is driven
by: pollutant emissions; transport and mixing; and deposition and chemical reactions acting on relatively short timescales and
influenced by regional background concentrations with driving processes occurring over longer timescales. These processes
can be investigated by coupling a regional chemical-transport model to a local urban Gaussian dispersion model which can
explicitly represent the near-field dispersion and chemical processes associated with sources such as road traffic and industry.
Methodology and Results
Stocker et al. (2012) describes the concept of coupling a Gaussian-type local air
quality model with a detailed regional photochemistry transport model, while
avoiding the ‘double counting’ of emissions when simulating the reducing
influence of local emissions with distance from source but the increasing
influence of the regional background. This method, which exploits the
advantages of both models, has been developed into a user-friendly and flexible
interface for coupling the local dispersion model ADMS-Urban (CERC, 2015),
which includes local chemistry and can represent the impacts of urban
morphology including street canyons and urban heat island effects, with
EMEP4UK (Vieno et al., 2014) or other regional chemistry transport models,
using meso-scale meteorology from WRF. This multi-scale system is being
used to model pollutant concentrations in the UK and London, at resolutions of
5 km and tens of metres respectively, for the 2002-2013 decade.
Validation of the system has been undertaken by comparing modelled NOx,
NO2, O3, PM10 and PM2.5 concentrations at kerbside, roadside and urban
background sites with measurements from the London Air Quality Network. Further, an analysis of how the dispersion and
chemical processes are accounted for at varying spatial and temporal scales in the different system components has been
performed.
Conclusions
The preliminary results from this coupled air quality modelling system demonstrate that the chemical processes occurring in
the urban atmosphere are well represented. Further, the analysis of particulate concentration data demonstrates the
importance of modelling long-range transport in addition to local emissions when modelling urban air quality. The impact of
the Urban Heat Island on air quality at the regional and local scales is of relevance to the future projections that are being
performed for this study.
Acknowledgement
This work was supported by NERC (NE/M003906/1).
References
European Environment Agency (EEA), 2014. EEA Report No 5/2014 http://www.eea.europa.eu/publications/air-quality-in-
europe-2014
Stocker J., Hood C., Carruthers D., McHugh C., 2012. ADMS-Urban: developments in modelling dispersion from the city
scale to the local scale. Int. J. Environment and Pollution 50, 308-316. DOI: 10.1504/IJEP.2012.051202
Vieno M., Heal M.R., Hallsworth S., Famulari D., Doherty R.M., Dore A.J., Tang Y.S., Braban C.F., Leaver D., Sutton M.A,
Reis S., 2014. The role of long-range transport and domestic emissions in determining atmospheric secondary inorganic
aerosol concentrations across the UK. Atmos. Chem. Phys. 14, 8435-8447. DOI: 10.5194/acp-14-8435-2014
Fig.1 Annual average PM10 concentrations
from the coupled EMEP4UK and
ADMS-Urban modelling system

108
METEOROLOGICAL CONDITIONS ASSOCIATED WITH EXTREME POLLUTION EVENTS OVER THE
NORDIC COUNTRIES
Manu Anna Thomas (1) and Abhay Devasthale (2)
(1) Air Quality Unit, Research and Development, Swedish Meteorological and Hydrological Institute (SMHI), Norrköping,
Sweden; (2) Atmospheric Remote Sensing, SMHI, Norrköping, Sweden
Presenting author email: [email protected]
Summary and background Improving our understanding of couplings of meteorology (including circulation patterns) and pollutant variability is critical
to eventually understand transport patterns and surface distribution of harmful pollutants. It further helps to carry out process-
oriented evaluation of CTMs and to realistically simulate these couplings in CTMs. From purely an observational
perspective, both top-down and bottom-up approaches can be employed to understand statistical linkages between
meteorology and pollutant distribution. For example, in a top-down approach, the focus could lie on a particular weather state
and how it impacts the pollutant distribution (e.g. as in Thomas and Devasthale, 2014). While in a bottom-up approach, the
focus directly lies on identifying extreme pollution events first and then investigating typical meteorological conditions
associated with those events. Both of these approaches have their advantages and limitations, esp w.r.t. the verticality of
atmosphere in question. Here, we present preliminary results from the second (i.e. bottom-up) approach to understand
possible linkages between extreme pollution events and weather states over the Nordic countries in general and over Sweden
in particular using satellite sensor data.
Methodology and preliminary results Data used: Carbon monoxide (CO) from AIRS-Aqua and MOPITT (2003-2014, 11-year), Ozone (O3) from OMI (2004-
2014), NO2 from OMI (2004-2014). CO and O3 are analyzed with focus on the free troposphere, while NO2 is analyzed with
focus on the near-surface.
Identification of extreme events: All pollution events exceeding 90 percentile values are investigated for each season and
trace gas species in question from 2003 to 2014.
Below, the figures 1-3 show an example of analysis to be presented in the conference. Fig. 1 shows histograms of CO over
southern Sweden at 500 hPa and 90 percentiles thresholds for different seasons with vertical lines. Fig. 2 further shows back
trajectories from FLEXTRA for events exceeding 90 percentile values during winter to understand dominant direction of
pollutant transport, which is confirmed by Fig. 3 to be from northwest based on ERA-Interim wind data. This analysis
highlights the importance of one pollution pathway originating from North America carrying CO over northern Europe.
Conclusion Identifying the dominant weather patterns during extreme pollution events helps in better understanding of the role of local
meteorology in governing the transport and distribution of pollutants in the atmosphere; the knowledge of which would help
to better constrain CTMs. Detailed investigations of the statistical linkages between meteorology and pollutant distribution
would be carried out and presented in the conference.
References Thomas, M. A. and Devasthale, A. 2014. Sensitivity of free tropospheric carbon monoxide to atmospheric weather states and
their persistency: an observational assessment over the Nordic countries, Atmos. Chem. Phys., 14, 11545-11555,
doi:10.5194/acp-14-11545-2014.

109
SOURCE APPORTIONMENT MODELLING OF OC AND NMVOCS IN THE BERLIN URBAN AREA
E. von Schneidemesser (1), B. Bonn (1), C. Ehlers (2), H. Gerwig (3), A.M. Villalobos (4), D. Klemp (2), C. Kofahl (2), J.
Kura (3), A. Lüdecke (3), A. Pietsch (3), R. Nothard (5), K. Schäfer (6), and J.J. Schauer (4)
(1) Institute for Advanced Sustainability Studies, 14467 Potsdam, Germany; (2) Forschungszentrum Jülich, IEK-8, 52425
Jülich, Germany (3) Federal Environment Agency, FG II, 4.4 Air Quality Standards and Monitoring Methods, 63225 Langen,
Germany; (4) University of WI-Madison, Environmental Chemistry and Technology Program, Madison WI 53706, USA; (5)
Senate Department for Urban Development and the Environment, 10179 Berlin, Germany; (6) Karlsruhe Institute of
Technology (KIT), Institute of Meteorology and Climate Research, Department of Atmospheric Environmental Research
(IMK-IFU), 82467 Garmisch-Partenkirchen, Germany.
Presenting author email: [email protected]
Summary
A 3-month measurement campaign (BAERLIN-2014) was carried out during the summer of 2014 in the Berlin/Potsdam
region of Germany. A variety of gas-phase, particle, and meteorology parameters were measured. Source apportionment
methods were applied to the PM10, specifically organic carbon, and higher time-resolution data collected, focusing on the
NMVOCs, to investigate source contributions, including the role of anthropogenic vs biogenic influence in the urban area.
Initial results indicate a significant influence of vegetation as well as traffic, but the largest contribution to OC from SOA.
The source apportionment analyses were complemented with air mass back trajectory data, and compared to the existing
understanding of sources based on local emission inventories. Inorganic contributions to PM10 mass were from sulfate,
nitrate, and ammonia.
Introduction
Urban areas typically have high population density and significant emissions, and therefore often struggle with air quality
exceedances. In Europe more than 90% of the urban population are exposed to levels of ozone and PM exceeding WHO air
quality guidelines (EEA 2014). Addressing this air pollution effectively requires sufficient knowledge of the sources and
origin of the pollutant emissions. To characterize air pollution in the Berlin/Potsdam region, a 3-month measurement
campaign was carried out from June-August 2014. As a large metropolitan area, traffic was expected to be a significant
source of emissions. Less typical and a specific aspect of the
BAERLIN-2014 campaign, was the investigation of the role
of vegetation on air quality, as for Berlin/Potsdam
specifically, some 40% of the area in the greater Berlin area is
either green space or water (BSV 2010).
Methodology and Results
In BAERLIN-2014, a variety of measurements were added to
an urban background monitoring station that is part of the
Berlin air quality monitoring network, in Berlin Neukölln
(station ID MC042), augmenting the existing measurement
capacity. High time resolution data was collected for a range
of air pollution parameters, including NO, NO2, O3, CO, ca.
70 NMVOC masses via PTR-MS, as well as particle number,
mass, and size distribution. In addition, PM10 filter samples
were collected. The PM10 filters were analysed for organic
carbon (including the water soluble fraction), elemental
carbon, ions, and organic tracer compounds. Chemical mass
balance (CMB) source apportionment was conducted for the organic carbon composition of the PM10 samples, grouped
based on HYSPLIT back-trajectory analysis, and an evaluation of the bulk chemical composition. For example, samples
GRB and GRC (Figure 1) were characterized by lower PM mass and OC, and a higher ratio of ions to OC. The GRB group
was characterized by air masses passing over northern France and central Germany before arriving in Berlin, while the air
masses from the GRC sample passed over the North Sea and northern Germany. In comparison, sample GRD air masses
came from the northeast, passing over the coastal regions of Poland, and the Baltic countries, and the ratio of ions to OC was
much lower. The OC CMB solution was characterized by contributions from vegetative detritus, diesel emissions, gasoline
vehicles, and wood burning, in addition to a significant contribution from SOA (Figure 1). In addition, PMF analysis was
carried out with a focus on the NMVOCs.
Conclusions
Results from the CMB analysis indicate that of the organic carbon fraction of PM10, a significant fraction was secondary
organic aerosol. Vegetative detritus and diesel emissions both contributed significantly to OC. Diesel emissions are also a
much more dominant contributor to OC than emissions from gasoline vehicles. Further details of the CMB results in the
context of secondary inorganics and results from the in-progress NMVOC-focused PMF analysis will also be discussed.
References
European Environment Agency (EEA), 2014. Air Quality in Europe – 2014. Publications Office of the European Union.
Berlin Senatsverwaltung (BSV), 2010. Flächennutzung und Stadtstruktur.
Figure 1. PM10 OC chemical mass balance source attribution.

110
BLACK CARBON AMBIENT CONCENTRATIONS AND SOURCES IN BANGKOK
P. Suwattiga (1), W. Sae Tung (1), W. Limpaseni (2) and W. Phairuang (3)
(1) Environmental Technology Program, Faculty of Applied Science, King Mongkut’s University of Technology North
Bangkok, Bangkok, 10800, Thailand; (2) Institute of Metropolitan Development, Navamindradhiraj University, Bangkok,
10330, Thailand; (3) Graduate School of Natural Science and Technology, Kanazawa University, 920-1192, Japan
Presenting author email: [email protected]
Summary
The objective of this study is to determine black carbon (BC) aerosol concentrations in Bangkok’s urban atmosphere. Results
showed diurnal variation of 1-hr BC concentrations with peaks in the morning and night related to traffic. Monthly 24-hour
BC concentrations during November 2013 to January 2015 had average values around 1.55 to 5.78 ug/m3 with maximum
concentration in January each year. BC concentrations in the dry season were higher than wet season when the wind direction
came from north to east of Bangkok. The ratio of char-EC to soot-EC for each particle size in January ranges from 0.4-3.1
showing the signature of traffic sources as well as biomass burning.
Introduction
Black carbon aerosol or elemental carbon in the atmosphere is formed by the incomplete combustion of fossil fuels, biofuels,
and biomass. It plays an important role as the solar absorber. It has the potential to cause global warming second to only
carbon dioxide. In addition, black carbon aerosol also affects human health. It is considered a carcinogen. Identification of
sources of black carbon aerosol in the atmosphere is important for air quality management.
The objective of this study is to determine black carbon aerosol concentrations in Bangkok’s urban atmosphere. Monitoring
location was on the roof-top of the 10th floor building occupied by the Faculty of Applied Science, KMUTNB. To determine
the BC ambient concentrations representative of urban air-shed, the sampling location was located away from specific
sources of air pollution including traffic and industrial emissions.
Methodology and Results
The air samples were collected continuously for 24 hours every
6 days from November 2013 to January 2015. BC
concentrations were measured by an aethalometer. A cascade
impactor was used for collection of various sizes of particulate
matter including PM<0.1, PM0.5-1.0, PM1-2.5, PM2.5-10 and
PM>10. The carbon compositions in particulate matter were
analyzed for organic carbon (OC), elemental carbon (EC)
separated to char-EC and soot-EC. Meteorological data: wind
speed, wind direction, rainfall were recorded at this site. Results
showed diurnal variation of 1-hr BC concentrations with peaks
in the morning and night related to traffic (Fig.1). Monthly 24-
hour BC concentrations have average values around 1.55 to 5.78
ug/m3 (Fig. 2). BC concentrations in the dry season were higher
than the concentrations in the wet season, especially in January
each year when the wind direction came from north to east of
Bangkok. The analysis results of carbonaceous components in
January 2015 showed that 20-50% of carbon in particulate
matter is organic carbon. The ratio of char-EC to soot-EC for
each particle size ranges from 0.7-4.1 with particle size 1.0-2.5
microns having the maximum ratio.
Conclusions
BC concentrations in Bangkok’s urban atmosphere were high in
the dry season especially in January. Ratio of char-EC/soot-EC in
particles in January showed signature of vehicle exhaust and biomass burning (Han et al., 2010). The January wind direction
showed that BC concentrations in Bangkok ambient air was affected by biomass burning from neighbouring provinces and
other countries to the north of Bangkok.
Acknowledgement
The Nano sampler and chemical analysis was supported by Prof. Dr. Masami Furuuchi and his colleagues from Kanazawa
University.
References
Han, Y.M., Cao, J.J., Lee, S.C., Ho, K.F. and An, Z.S., 2010, Different characteristics of char and soot in the atmosphere and
their ratio as an indicator for source identification in Xi’an, China. Atmos. Chem. Phys. 10, 595-607
Fig.2 Monthly 24-hr BC Concentration
Fig.1 Diurnal BC Concentration

111
IDENTIFYING THE MOST HAZARDOUS SYNOPTIC CONDITIONS FOR WINTER UK PM10 EXCEEDENCES
C. Webber (1), H. Dacre (1), W. Collins (1) and G. Masato (1)
(1) Department of Meteorology, University of Reading, Berkshire, RG2 7UR
Presenting author email: [email protected]
Summary
We investigate the relationship between synoptic scale meteorological variability and local scale pollution concentrations
within the UK. Synoptic conditions representative of atmospheric blocking highlighted significant increases in UK PM10
concentration ([PM10]), with the probability of exceeding harmful [PM10] limits also increased. Once relationships had been
diagnosed, The Met Office Unified Model (UM) was used to replicate these relationships, using idealised source regions of
PM10. This helped to determine the PM10 source regions most influential throughout UK PM10 exceedance events and to
test whether the model was capable of capturing the relationships between UK PM10 and atmospheric blocking. Finally, a
time slice simulation for 2050-2060 helped to answer the question whether PM10 exceedance events are more likely to occur
within a changing climate.
Introduction Atmospheric blocking events are well understood to
lead to conditions, conducive to pollution events
within the UK. Literature shows that synoptic
conditions with the ability to deflect the Northwest
Atlantic storm track from the UK, often lead to the
highest UK pollution concentrations. Rossby wave
breaking (RWB) has been identified as a mechanism,
which results in atmospheric blocking and its
relationship with UK [PM10] is explored using
metrics designed in Masato, et al., 2013. Climate
simulations facilitated by the Met Office UM, enable
these relationships between RWB and PM10 to be
found within the model. Subsequently the frequency
of events that lead to hazardous PM10 concentrations
([PM10]) in a future climate, can be determined,
within a climate simulation. An understanding of the
impact, meteorology has on UK [PM10] within a
changing climate, will help inform policy makers,
regarding the importance of limiting PM10 emissions, ensuring safe air quality in the future.
Methodology and Results
Three Blocking metrics were used to subset RWB into four categories. These RWB categories were all shown to increase UK
[PM10] and to increase the probability of exceeding a UK [PM10] threshold, when they occurred within constrained regions.
Further analysis highlighted that Omega Block events lead to the greatest probability of exceeding hazardous UK [PM10]
limits. These events facilitated the advection of European PM10, while also providing stagnant conditions over the UK,
facilitating PM10 accumulation. The Met Office UM was used and nudged to ERA-Interim Reanalysis wind and temperature
fields, to replicate the relationships found using observed UK [PM10]. Inert tracers were implemented into the model to
replicate UK PM10 source regions throughout Europe. The modelled tracers were seen to correlate well with observed
[PM10] and Figure 1 highlights the correlations between a RWB metric and observed (a) and modelled (b) [PM10]. A further
free running model simulation highlighted the deficiency of the Met Office UM in capturing RWB frequency, with a
reduction over the Northwest Atlantic/ European region. A final time slice simulation was undertaken for the period 2050-
2060, using Representative Concentration Pathway 8.5, which attempted to determine the change in frequency of UK PM10
exceedance events, due to changing meteorology, in a future climate.
Conclusions
RWB has been shown to increase UK [PM10] and to lead to greater probabilities of exceeding a harmful [PM10] threshold.
Omega block events have been determined the most hazardous RWB subset and this is due to a combination of European
advection and UK stagnation. Simulations within the Met Office UM were undertaken and the relationships seen between
observed UK [PM10] and RWB were replicated within the model, using inert tracers. Finally, time slice simulations were
undertaken, determining the change in frequency of UK [PM10] exceedance events within a changing climate.
References
Masato, G., Hoskins, B. J., Woolings, T., 2013; Wave-breaking Characteristics of Northern Hemisphere Winter Blocking: A
Two-Dimensional Approach. J. Climate, 26, 4535-4549.
Fig. 1, Correlation between a Rossby Wave Breaking metric
and (a) observed UK [PM10] and (b) modelled PM10 using the
Met Office UM. PM10 in both cases is lagged by 2 days
following the occurrence of Rossby Wave Breaking.
(a)
(b)

112

113
SPECIAL SESSION - AIR QUALITY IMPACTS OF THE
INCREASING USE OF BIOMASS FUELS

114

115
RESIDENTIAL WOOD COMBUSTION IN ATHENS SINCE 2010: IMPACTS ON AIR QUALITY AND
ATMOSPHERIC VARIABLES
E. Athanasopoulou (1), O. Speyer (1), D. Brunner (2), H. Vogel (3), B. Vogel (3) and E. Gerasopoulos (1)
(1) Institute of Environmental Research and Sustainable Development, National Observatory of Athens (IERSD/NOA),
Greece; (2) Swiss Federal Laboratories for Materials Science and Technology (EMPA), Switzerland; (3) Karlsruhe Institute
of Technology, Institute for Meteorology and Climate (IMK-TRO/KIT), Germany
Presenting author email: [email protected]
Summary
This study aims to quantify atmospheric aerosol emitted from residential wood burning (PM10-rwb) in Athens and their impact
on the state of the atmosphere by online-coupled photochemistry and meteorology modelling. The unique combination of a
7wl aethalometer (AE33) and an Aerosol Chemical Speciation Monitor (ACSM) was further deployed to record the temporal
variation and chemical composition of PM10-rwb emissions. Improved correlation was observed between COSMO-ART
outputs and measurements after the incorporation of the revised PM10-rwb emissions to the original TNO-MACCII database.
The concentration of total PM10 mass in the city center during a cold (<7°C), weekend exceeded 90 μg m-3, i.e. well above
the EU daily limit. Around 75% of this mass was organic (50%) and elemental carbon. The PM10-rwb fraction (above 60%) is
predicted to have caused a radiative cooling up to -0.7 W m-2. The health and climate related impacts of PM10-rwb sources call
for a revision of the current tax legislation for domestic heating oil prices.
Introduction
For the past 5 years, Greece has been experiencing a major financial crisis which, led to a shift in the fuel used for residential
heating towards bio-fuels (primarily wood). As a consequence, severe winter smog episodes became more frequent and
initiated large experiments for measuring mass concentrations, chemical composition and physicochemical properties of
aerosols in big cities of Greece (e.g. Paraskevopoulou et al., 2015). This is the first aerosol modelling study of a winter smog
event over Athens, quantifying the PM10-rwb and its feedback on radiation.
Methodology and Results
A high resolution (<3 km) COSMO-ART simulation was performed over Greece during
winter 2014 using TNO-MACCII anthropogenic emissions. Two months of hourly black
carbon (BCwb) measurements (decomposed time series from the AE33) were processed to
revise the temporal cycles of rwb emissions. The original chemical profile of aerosol
emissions from rwb was modified based on the chemical composition of aerosol spikes
measured during night time of the winters 2012-2015 with the ACSM measurements. The
applied changes resulted in significant improvements to the temporal evolution of aerosol
pollution, especially for days with minimum temperatures below 7°C. In particular,
hourly PM10 spikes exceeded 150 μg m-3 (as observed) and the mean correlation between
measurements and model outputs for BC and organics (OA) improved significantly (r2
from 0.43 to 0.54 and from 0.03 to 0.62, respectively). The 2-day average concentration
of total PM10 mass in the city center was higher than 90 μg m-3 (see Fig.1), i.e. well above
the EU daily limit. Around 50% of this mass was OA, while BC accounted for 25%. The
mean PM10-rwb was above 60% and is predicted to have caused a radiative cooling up to -
0.7 W m-2 (see Fig.1), leading to a reduction of 2-m temperatures by 0.2 K. These results
demonstrate the need to mitigate rwb emissions as an important source of PM10.
Conclusions
As the economic crisis continues in Europe, rwb will remain a significant source of
aerosol pollution during wintertime over the densely populated areas. Furthermore, these
particles include significant fractions of absorbers (e.g. BC) and refractors (e.g. OA) of
solar radiation, i.e. interfere with climate forcing from anthropogenic activities. Hence,
there is a need to introduce suitable legislation to regulate the prices of oil for domestic
heating.
Acknowledgement
The work is co-funded by the "Programme Agreements between Research Centers"
GSRT 2015-2017. Part of the current work was performed in the frame of the project
THESPIA- of the action KRIPIS, of GSRT, financed by Greece and the European
Regional Development Fund of the EU in the frame of NSRF and the O.P.
Competitiveness and Entrepreneurship and the Regional Operational Program of Attica. We acknowledge NOA colleagues
responsible for the operation of the aerosol site.
References
Paraskevopoulou D., E. Liakakou, E. Gerasopoulos, N. Mihalopoulos: Sources of atmospheric aerosol from long-term
measurements (5 years) of chemical composition in Athens, Greece, Science of The Total Environment, Vol. 527–528, pp.
165-178, ISSN 0048-9697
Fig.1 Spatial distribution of total PM10 (top, contours), PM10rwb (top, iso-
lines) and ΔRads (bottom) over Athens.

116
THE USE OF 14C MEASUREMENTS ON OC AND EC FOR WOOD BURNING SOURCE APPORTIONMENT
AT AN URBAN SITE IN NORTHERN ITALY.
V. Bernardoni (1), G. Calzolai (2), M. Chiari (2), M. Fedi (2), F. Lucarelli (2), S. Nava (2), A. Piazzalunga (3,*), F.
Riccobono (1, #), F. Taccetti (2), G. Valli (1), R. Vecchi (1)
(1) Department of Physics, Università degli Studi di Milano and INFN, Milan, 20133, Italy; (2) Department of Physics and
Astrophysics, Università degli Studi di Firenze and INFN, Sesto Fiorentino, 50019, Italy; (3) Department of Chemistry,
Università degli Studi di Milano, Milan, 20133 Italy; (*) now at: Department of Environmental and Territorial Sciences,
Università degli Studi di Milano-Bicocca, Milan, 20126, Italy; (#) now at: European Commission, Joint Research Centre,
Ispra, 21027, Italy
Presenting author email: [email protected]
Summary
This work aims to present the results of a carbonaceous fraction source apportionment carried out starting from 14C
measurements on the organic (OC) and elemental (EC) carbon fractions to distinguish the contributions of fossil fuels and
modern sources (wood burning, biogenic). A suitable thermal treatment was developed to perform the analysis.
Introduction
The carbonaceous aerosol is a main constituent of atmospheric aerosol and has adverse effects on health, air quality,
visibility, and Earth’s radiation balance. In this context, the development of analytical and modelling techniques aiming at the
identification of natural and anthropogenic contributions gains great importance. 14C measurements on organic and elemental carbon (OC and EC, respectively) allow a distinction between the wood/biomass
burning and the biogenic source, provided that the OC/EC emission ratio for wood/biomass burning is known. Drawbacks of
the approach are the need to isolate OC and EC for the 14C analysis and the difficulty in the assessment of the secondary
contribution from wood/biomass burning (Szidat et al., 2009).
Methodology and Results
The samples were prepared for the 14C analysis using a devoted sample
preparation line (Calzolai et al., 2011) following the methodology developed in
Bernardoni et al., 2013.
The samples were collected in a heavily polluted area (Milan, Italy) during
wintertime. The fraction of modern carbon values for OC, EC and TC were
used to attempt a source apportionment in the area (see figure 1). The wood
burning primary contribution to OC was evaluated from both 14C and
levoglucosan measurements using tailored emission factors (Piazzalunga et al.,
2011). A good agreement between the approaches was found and wood
burning primary contribution accounted for about 18 % of OC in Milan during
wintertime. Secondary OC from wood burning and the contribution from other
urban sources were tentatively identified following literature approaches, with
the aim of evaluating the biogenic contribution to OC in the area, which was
estimated to be about 18%.
Conclusions 14C measurements on OC and EC are a powerful tool for the source apportionment of the carbonaceous fraction of the
atmospheric aerosol.
Acknowledgement
This work was partially funded by the Ministry of University and Research in the frame of the PRIN2007 funding, by the
National Institute of Nuclear Physics in the frame of the NUMEN experiment, and by Regione Toscana within the TEMART
project. The authors are grateful to Paola Fermo (Department of Chemistry, University of Milan) for collaboration.
References
Bernardoni V., Calzolai G., Chiari M., Fedi M., Lucarelli F., Nava S., Piazzalunga A., Riccobono F., Taccetti F., Valli G.,
Vecchi R., 2013. Radiocarbon analysis on organic and elemental carbon in aerosol samples and source apportionment at an
urban site in Northern Italy. J. Aerosol Sci., 56, 88–99
Calzolai G., Bernardoni V., Fedi M., Lucarelli F., Nava S., Riccobono F., Taccetti F., Valli G., Vecchi R., 2011. The new
sample preparation line for radiocarbon measurements on atmospheric aerosol at LABEC. Nucl. Instr. Meth. Phys. Res. B,
269, 203–208
Piazzalunga A., Belis C., Bernardoni V., Cazzuli O., Fermo P., Valli G., Vecchi R., 2011. Estimates of wood burning
contribution to PM by the macro-tracer method using tailored emission factors. Atmos. Environ. 45, 6642-6649
Szidat S., Ruff M., Perron N., Wacker L., Synal H.-A., Hallquist M., Shannigrahi A.S., Yttri K.E., Dye C., Simpson D., 2009.
Fossil and non-fossil sources of organic carbon (OC) and elemental carbon (EC) in Göteborg, Sweden. Atmos. Chem. Phys.,
9, 1521–1535
Fig.1 TC source apportionment in the PM10
using 14C measurements

117
0
2
4
6
8
10
12
14
16
18
Metals Ammonium Potassium Nitrate Sulphate Levoglucosan and isomers
TC / 10
Co
ncen
trati
on
(μ
g/
sam
ple
)
RESULTS FROM A PILOT STUDY ON THE COMPOSITION AND TOXICITY OF ULTRAFINE PARTICLES
DUE TO WOOD BURNING
M. Dell’Acqua (1), S. Becagli (2), V. Bernardoni (1), L. Corbella (3), E. Corsini (4), A. Crespi (1), P. Fermo (3), R.
Gonzalez (3), C. L. Galli (4), G. Lonati (5), L. Marabini (4), M. Marinovich (4), S. Ozgen (5), S. Signorini (6), R. Tardivo (5),
G. Valli (1), R. Vecchi (1)
(1) Department of Physics, Università degli Studi di Milano and INFN - Sezione di Milano, Milan, 20133, Italy
(2) Department of Chemistry, Università degli Studi di Firenze, Sesto Fiorentino (Fi), 50019, Italy
(3) Department of Chemistry, Università degli Studi di Milano, Milan, 20133, Italy
(4) Department of Pharmacological and Biomolecular Sciences, Università degli Studi di Milano, Milan, 20133, Italy
(5) Department of Civil and Environmental Engineering - Environmental Engineering section, Politecnico di Milano, Milan,
20133, Italy
(6) Energy and Environment Laboratory Piacenza (LEAP), Piacenza, 29121, Italy
Presenting author email: [email protected]
Introduction
The intensive use of wood and biomass combustion for domestic heating raises issues on negative health effects that
particulate matter emitted by this source can have.
The inhalation of wood smoke effluents can alter the pulmonary immune defence mechanisms, with main damages to
macrophages and lung epithelial cells.
It is expected that ultrafine particles (UFP, d<100 nm) can be the major responsible for adverse health effects due to their
ability to penetrate deeply into the respiratory system, potentially having access to the central nervous system (Oberdörster et
al., 2005).
The TOBICUP (TOxicity of BIomass Combustion generated Ultrafine Particles) project aims at collecting and characterising
the UFP generated by wood/biomass combustion from domestic pellet and wood stove emissions and in ambient air in order
to assess the most relevant physical-chemical parameters influencing their toxicity. In this work only data from the ambient
air field campaign will be presented.
Methodology and Results
The TOBICUP project joined chemical and physical information (metals, ions, elemental/organic carbon, PAH content and
number concentration and size distribution – see Fig. 1) about emissions from wood/pellets stoves and in ambient air. Metals,
ions, and carbonaceous component were detected through ICP-AES, IC and TOT respectively.
UFP sampling was carried out using multistage cascade impactors, considering only particles collected on stages with
nominal cut-off <100 nm.
The collection of data was carried out during
winter and summer 2015. The sampling took place
in Morbegno (SO) – a town in the low Valtellina
Valley, an alpine valley in Northern Italy heavily
impacted by the use of wood/pellets stoves for
domestic heating. The choice of the two seasons is
aimed at comparing ambient UFP effects during
periods when wood/biomass burning is an important
source (Jan-Feb) and other periods, when
conversely it is very limited and almost negligible
(Jun-Jul).
A toxicological analysis was then carried out to characterise the UFP immuno-toxicity on respiratory system cells by in-vitro
models, using both laboratory-sampled UFP and ambient UFP.
In this presentation we will show results of the physical-chemical characterisation of particles collected during the winter and
summer field campaigns and the preliminary data on toxicological effects of such particles.
Acknowledgement
This work was supported by CARIPLO foundation (Grant 2013-1040). We acknowledge Comune di Morbegno for providing
the winter and summer sampling sites.
References
Oberdörster G., Oberdörster E., Oberdörster J., 2005. Nanotoxicology: An Emerging Discipline Evolving from Studies of
Ultrafine Particles, Environmental Health Perspectives 7, 113.
Fig. 1: Average composition in the winter samples (d < 100 nm)

118
BIOMASS BURNING CONTRIBUTION TO PAHS CONCENTRATION IN THE URBAN AREA OF ROME.
MAIN FINDINGS FROM THE LIFE+ EXPAH PROJECT AND FURTHER OBSERVATIONS.
C. Gariazzo (1), S. Argentini (2), C. Balducci (3), M.P. Bogliolo (1), A. Cecinato (3), G. Cesaroni (4), A. Cristofari (1), A.
D’Allura (5), S. Finardi (5), F.Forastiere (4), M.P. Gatto (1), M. Gherardi (1), A. Gordiani (1), O. Hänninen (6), M. Lamberti
(1), A. Pelliccioni (1), M. Perilli (3), C. Perrino (3), D. Porta (4), P. Radice (5), P. Romagnoli (3), F. Sacco (7), C. Silibello
(5), M. Stafoggia (4), L. Tofful (3).
(1) INAIL-Research Center, Via Fontana Candida 1, 00040, Monteporzio Catone (RM), Italy; (2) CNR-ISAC, Via Fosso del
Cavaliere 100, 00133 Rome, Italy; (3) CNR-IIA, Via Salaria km 29.300, CP 10, 00016 Monterotondo Scalo RM, Italy; (4)
Department of Epidemiology, Lazio Region Health Service, Rome, Italy; (5) ARIANET Srl, Via Gilino, 9 20128, Milan,
Italy; (6) National Institute for Health and Welfare, Finland, POB 95, 70701 Kuopio, Finland; (7) ARPA-LAZIO, Rieti, Italy.
Presenting author email: [email protected]
Summary
The main findings of EU LIFE+ EXPAH project, aimed to assess PAHs exposure and their health effects on the population
living in urban areas, are presented. Domestic heating and biomass burning were found to be the main contribution to PAH
levels observed in Rome urban area.
Introduction
Polycyclic Aromatic Hydrocarbons (PAHs) are a class of complex organic chemicals of increasing concern due to their
occurrence in the environment. They are ubiquitous in ambient air and some of them have been identified as carcinogens or
suspected carcinogens for human. Domestic heating, mobile sources and vehicles, are the largest contributors of PAHs in
highly urbanized areas. Therefore, population living in cities are particularly exposed to these pollutants. The EXPAH
project, funded by the EU LIFE+ program, aims to assess the population exposure to PAHs in the city of Rome and the
consequent health effects on the inhabitants by means of an integrated approach including measurements, modeling
techniques and epidemiologic investigations.
Methodology and Results
Several experimental field campaigns were carried out, during different
seasons, to investigate the ability of PAHs to penetrate living
environments (homes, schools, offices, cars and bus). Experimental results
evidenced that indoor PAHs levels were about one order of magnitude
higher in winter than in spring/summer due to domestic heating.
Benzo(a)pyrene (B[a]P), the most toxic PAH, was usually well below the
European guideline value in the warm season whilst it exceeded this value
during winter. The PAHs emission inventory, built for the Lazio Region
(Gariazzo et al., 2015), indicates that the domestic heating is responsible
for 28% and 96% respectively for PM10 and PAHs emissions in the city of
Rome (figure 1). Biomass burning systems are estimated to be responsible
for 99% and 90% of PAHs and PM10 emissions from residential heating, even if
the contribution of biomass burning to the overall heat production is small.
Environmental and health impacts were estimated based on one year of PAHs
simulated concentrations at urban level. Daily average concentrations indicated
that Rome urban area is exposed to high levels of PAHs during the winter with
B[a]P exceeding limit value. A 3.1% of increased in mortality was estimated for
1 ng/m3 variation in PAHs exposure occurring 2 to 5 days before deaths. To
evaluate the impacts of future emissions on PAH levels, the Current Legislation
(CLE) scenario for year 2020, based on the GAINS-Italy project, has been
simulated. A general reduction of 2020 emissions with respect to 2009 reference
values was obtained for all pollutants except for PAHs, as they show an increase
of 38% (figure 2). The increase of PAHs emission is influenced by domestic
heating and mainly due to the predicted increase of wood combustion
contribution. An Additional Measures (AME) scenario, forcing the substitution of
biomass with natural gas for domestic heating, has been considered as a possible
effective action leading to a potential PAHs emissions of more than 90%.
Conclusions
EXPAH LIFE+ project has highlighted the relevance of domestic heating and biomass burning on the environmental and
health impacts of PAHs at urban level. The analysis of future emission scenarios indicates that PAHs emissions are estimated
to increase during the next years claiming for the adoption of mitigation measures.
Acknowledgement
The LIFE+ EU financial program is acknowledged for the provision of funding for EXPAH project (LIFE09 ENV/IT/082).
References
Gariazzo, C., Lamberti, M., Hänninen, O., Silibello, C., Pelliccioni, A., Porta, D., Cecinato, A., Gherardi, M., Forastiere, F.,
2015. Assessment of population exposure to Polycyclic Aromatic Hydrocarbons (PAHs) using integrated models and
evaluation of uncertainties, Atmospheric Environment, 101, 235-245.
Fig.1 Contribution of the different source to the
emission of pollutants in Rome
Fig.2 Emission Scenarios: reference (2009); current legislations (2020 CLE);
additional measures (2020 AME)

119
INTEGRATED METHODOLOGY FOR ASSESSING DOMESTIC WOOD BURNER MUNICIPAL SHARE
A. Marongiu, E. Angelino
Department of Air Quality Modelling and Inventories, ARPA Lombardia, Milan, 20124, Italy
Presenting author email: [email protected]
Summary
This paper presents the experience of ARPA Lombardia in improving emission estimates from small domestic wood burners.
The uncertainty level of the share of biomass municipal consumption among different technologies strongly affects total
emissions. Starting from the huge amount of data available for Lombardy, this work presents the development of a procedure
for combining information from different sources. Local energy balance, CATI (Computer Aided Telephonic Interviews)
surveys, time series of the share of residential wood heaters effectively used and purchased in the region are processed for the
update of the local indicators. CATI surveys define for each sampling cell (identified by province, altitude and density of
inhabitants) percentage of frequently users and average amount of biomass burned. The propagation of these data to each
municipality is performed by the amount of inhabitants and data from regional energy balance. The update of the share of
burning technologies starts from the indicators of previous inventory editions and the declared production amount of the
technologies by the reconstruction of the time series of technology share. The resulting indicators seem to best fit and
harmonize all the possible data available for the emission inventory development.
Introduction
The heating sector, mainly due to fuelwood is the main emission source of PM,
CO, BaP and is also relevant in the emissions of Zn and Cd in Lombardy for
2012 as reported by the regional emission inventory (ARPA Lombardia, 2015).
As shown in figure 1, the contribution to heating sector emissions for PM10 and
BaP varies between fuel type, fossils and wood, and between wood burner’s
technologies. Many factors not only average temperatures can affect seasonal
biomass consumption and the technology share strongly affects pollutant
emission from domestic wood burning. The improving of definition of
activity indicators for the main appliances is relevant for increasing quality
emission estimate as documented by many international experiences during
TFEIP periodic meetings (http://www.tfeip-secretariat.org/) with particular attention to data provided by stakeholders (eg.:
producers, sellers, chimney sweepers). These latter are considered as relevant sources in monitoring technology evolution of
the devices. At the regional Italian level, many experiences in detecting quantity of wood burned detailed for technology
types are also reported by application of CATI.
Methodology and Results
Staring from a detailed analysis obtained for 2008 by CATI on diffusion in Lombardy of different domestic wood
technologies detailed for sampling cells defined on provinces, altitude and pop. density it is possible to obtain historical trend
of the indicators up to 2012 by mean of selling data as reported by ANFUS and CECED. Substitution rate of each technology
is estimated according to device average age and a substitution scheme defined on selling data. Technology distribution can
be defined as the number of appliances N:
𝑁𝑖,𝑚,𝑘 = 𝐷𝑖,𝑚 × 𝑈𝑗 × 𝐹𝑖 ×1
𝜎𝑚√2𝜋× 𝑒
−(𝑘−𝜇𝑚)2
2𝜎𝑚2 𝑅𝑖,𝑚,𝑦 ≅ ∑
1
100× (𝑘 − 1) × 𝑁𝑖,𝑚,𝑘,𝑦𝑘
with i=municipality, m=technology type (eg.: stoves, fireplaces, …); k=device age;
D=percentage diffusion of device type m stated by CATI; U=percentage of frequent
users by CATI; F=number of families in municipality; m=standard deviation of
average age, m=average age of device (eg.: according EC DG TREN, 2009). The
number of appliances can vary during the years because: obsolete systems are
renovated, appliances are installed or substituted. As a matter of facts the potential
number of obsolete devices for a year k can be defined as Ri,m,y. In Lombardy for 2008
can be calculated that 8-9% of the number of appliances could be potential substituted,
this value is in good agreement with other references (EC DG TREN, 2009) were the
renewal rate was in the range of 7-8%.
Conclusions
Figure 2, depicts the trend of technology distribution for domestic wood burners from 2008 to 2012. According to CATI for
2008 (JRC, 2010) in Lombardy the total number of appliances was in the range of 500 000 – 600 000 units. The simulated
increasing of pellets stoves is in good agreement with new national statistics (ISTAT, 2015) and with data from producers
(http://www.federforeste.it/)
References
ARPA Lombardia (2015). INEMAR, Inventario Emissioni in Atmosfera 2012.
EC DG TREN, (2009). Preparatoty studies for Eco-Design Requirements of EuPs (II) – Lot15
JRC, (2010). Collaborative Research Project for Air Pollution Reduction in Lombardia (2006- 2010)
ISTAT, (2015). I consumi energetici delle famiglie.
Fig.2 Appliances number trend
evolution for Lombardy.
Fig.1 Energy consumption and PM10, Bap
emissions in domestic heating, Lombardy 2012.

120
REACTIVE OXYGEN SPECIES FOUND IN URBAN PM2.5 AND PM10: CHEMICAL ANALYSIS AND SOURCE
APPORTIONMENT
Dimosthenis Α. Sarigiannis (1), Marianthi Kermenidou (1), Stavroula Kyriakou (1), Roxani Tzimou – Tsitouridou (2) and
Spyros P. Karakitsios (1)
(1) Aristotle University of Thessaloniki, Department of Chemical Engineering, Environmental Engineering
Laboratory, 54124, Thessaloniki, Greece
(2) Aristotle University of Thessaloniki, Department of Chemical Engineering, Analytical Chemistry Laboratory,
54124, Thessaloniki, Greece
Presenting author email: [email protected]
Summary
Ambient air particulate matter contains redox reactive constituents (organic substances, metals) that contribute to the
production of Reactive Oxygen Species (ROS). Linear regression between a marker of ROS (DTT activity) and aerosol
chemical components revealed strong associations between ROS-generation potential and biomass burning markers. ROS
activity was found to be associated with high concentrations of BC, metals, PAHs and K found in PM2.5 in urban settings.
Introduction
The concentrations of PM10 at urban sites increase during the winter due to the combination of strictly anthropogenic urban
emissions such as traffic and domestic heating, and meteorological conditions such as the prevalence of anticyclonic
scenarios. Over the last three years, biomass was used as heating source in the large metropolitan areas of Thessaloniki
affecting a large amount of the city population. At the same time the use of light heating diesel was heavily taxed (Sarigiannis
et al., 2014). In the same period Greece faces a financial crisis with significant repercussions on the average household
income. This combination resulted in reduced traffic loads but excessive biomass use for domestic heating during wintertime.
Methodology and Results
An extensive campaign was carried out over the last three winters from January to April 2013, from December 2013 to the
end of March 2014 and from December 2014 to March 2015, at two locations in the urban area of Thessaloniki. Two
sampling sites were used. The urban background site is located in the Ilioupoli district of western Thessaloniki, a densely
populated area where road construction and elevated buildings do not foster pollutants dispersion. PM samplers were placed
on the roof of a building at a height of approximately 9 m above the ground. No significant traffic sources were in close
proximity to the site. The traffic site is located at the campus area of Aristotle University of Thessaloniki, at six meters from
the ground, about 50 meters from the main highway of downtown Thessaloniki, Egnatia Street. For the collection of aerosols,
low volume samplers were used (TCR-Tecora). PM2.5 and PM10 samples were collected on PTFE filters (Pall Corporation, 47
mm diameter) for 24 h. Samples were analysed for black carbon, ionic species, metals, PAHs, levoglucosan and ROS
generation. Dithiothreitol (DTT)-based chemical reactivity is considered a quantitative method for the assessment of the
capacity of PM to catalyse ROS generation. The redox activity of a sample is based on the ability of the PM to catalyse
electron transfers between DTT and oxygen in simple chemical systems (Li et al 2008). PM2.5 and PM10 samples were stored
at -20 °C in the dark prior to use. For sample measurement, a cycle filter punch with a known mass of PM2.5 and PM10 was
added to the DTT vial and the rate of DTT loss was monitored over time. Ambient air data showed a high concentration of
PM10 (73.1 μg/m3) and PM2.5 (62.7 μg/m3) during the sampling period. While the contribution of traffic to ambient air PM is
reduced, during the sampling period the contribution of biomass heating increases up to 34%. At the traffic site Fe, Cu and
Zn had higher concentrations than at the urban background site. K, a key biomass tracer, had higher concentrations at the
background site indicating the presence of another strong combustion source beyond traffic. This was found to be the use of
biomass burning for space heating. The oxidative potential of PM2.5 was the highest, while the one of PM10 follows. The
same tendency was observed at both sampling sites. On mass basis, fine particles had higher oxidative potential than coarse
particles due to their higher active surface and, consequently, specific absorption capacity. PM2.5 has a higher surface area to
volume ratio than PM10. A simple linear regression was conducted between the measured concentrations of various chemical
components and volume based DTT activity. DTT activity was best correlated with BC and K.
Conclusions
Chemical analysis proved that the oxidative potential of PM is not correlated to its mass. On the contrary, a strong correlation
between chemical composition and oxidative capacity of PM exists. Thus the potential of chemical compounds of urban
atmospheric aerosols to generate reactive oxygen species (ROS) and identify major ROS-associated emission sources was
assessed. ROS activity was found to be associated with high concentrations of metals, PAHs and levoglucosan found in
PM2.5. PM2.5 is generated by combustion, such as diesel exhaust and biomass burning for domestic heating. Furthermore,
PM10 constituents comprise ground particles, such as dust and pollen. In addition, although at lower amounts than PM2.5,
PM10 may be derived from biomass combustion processes, too. Positive matrix factorization (PMF) was applied to apportion
the relative contribution of various sources to the ROS-generation potential of chemical species of PM2.5 and PM10.
References
Sarigiannis, D.A., Karakitsios, S.P., Kermenidou, M., Nikolaki, S., Zikopoulos, D., Semelidis, S., Papagiannakis, A.,
Tzimou, R. 2014. Total exposure to airborne particulate matter in cities: The effect of biomass combustion. Science of the
Total Environment 493, 795-805.
Li, N., Xia T., Nel A.E., 2008. The role of oxidative stress in ambient particulate matter-induced lung diseases and its
implications in the toxicity of engineered nanoparticles. Free Radical Biology and Medicine 44, 1689-1699.

121
OUTDOOR AND INDOOR MEASUREMENTS OF BIOMASS COMBUSTION INDUCED BLACK CARBON, CO
AND PAH IN A RESIDENTIAL AREA
J. Zheng, G. Baumbach, U. Vogt, G. Scheffknecht
Institute of Combustion and Power Plant Technology (IFK), Department of Air Quality Control, University of Stuttgart,
Pfaffenwaldring 23, 70569 Stuttgart, Germany
Presenting author email: [email protected]
Summary
Caused by complaints on bad air in the residential area of Dettenhausen in Southern Germany, this study aimed to investigate
to which extent the local air quality is affected by wood combustion smoke from domestic heating during the winter period.
Based on former studies (Bari et al. 2011) the air quality measurement campaign was carried out covering a winter period
from December 2014 to March 2015 in order to characterize worse air quality which might occur during inversion situations.
Besides meteorological parameters, the following air pollutants were measured: Black Carbon (BC), portion of Biomass
Burning BC (BB%)(with Magee AE33), CO, PM10 and particle-bound PAHs. Concentration profiles of the pollutants are
illustrated. The wood burning tracer levoglucosan was also determined and its correlations with the above mentioned
pollutants especially with BC and BB% are determined and discussed. During one “inversion week” in February 2015 the
influence of the outdoor smog on indoor air was investigated. The windows could not held open over night because of the
strong odour from wood combustion. The message is: Keep the windows closed under such conditions!
Introduction
Wood burning for room heating is one of the main sources of particulate matters in residential areas, which deteriorates the
local ambient air quality through the emission of incomplete combustion products, primary particulate matter and gas
pollutants like VOC, PAHs and CO. Studies aiming at the estimation of the wood burning contribution to PM, organic carbon
(OC), Black Carbon (BC) and toxic PAHs in ambient air are of worldwide interest.
Methodology and Results
Air quality measurement campaign: Particulate matters (PM10) were sampled from ambient air and subsequently chemical
analyses of the samples for the characterization of particle-bound PAHs and wood burning tracer levoglucosan were carried
out in lab. Meanwhile BC, CO and meteorological parameter were continuously measured. Indoor air quality measurement in
a residential apartment: PM10 was both sampled for periods from 24 hours to 48 hours using low volume samplers and
continuously measured with a laser aerosol spectrometer. Other pollutants BC, CO and temperature were continuously
monitored when the wood was burning in the stove in the living room.
The results show that ambient PM10 concentration presented fluctuations. During two periods one in Feb. und the other in
Mar., which are identified as inversion periods, PM10 was observed to be over 30 µg/m³. The 24 filters chosen for PAH
analysis were however not from inversion periods but certain amount of PAHs were still detected with some daily average
BaP over 1 ng/m³. Wood burning tracer levoglucosan was found in the PM10 samples and the portion to PM ranged from
0.08% to 12.7%. The ambient BC concentrations showed a fluctuated profile with an average of 1.5µg/m³, and a daily
average biomass burning contribution of 33%.
As to indoor measurement during the February inversion period, from the comparison of both integrated samples and online
measurements, the indoor daily average PM10
was significant lower than outdoor, with an
average indoor/outdoor ratio: I/O=0,35. Black
carbon profiles agreed well with that of PM10,
while the BB% showed relatively high portions
revealing BC mainly originated from wood
burning. During this event Co showed outdoor
higher concentrations than indoor.
Conclusions
In the studied area, PM10 appeared relative high
values during inversion periods and the share of
levoglucosan found in PM10 indicated that the
contribution of wood burning is significant.
Meanwhile, BC measurement also showed over
30% contributions from biomass burning to BC.
Indoor air quality measurement showed
however lower pollutant concentrations when
the windows kept closed during night.
Acknowledgement
This work was financial support by Alfred Teufel Stiftung, Nagold. We also thank the Landesamt für Natur, Umwelt und
Verbraucherschutz Nordrhein Westfalen for their kind help with the analysis of levoglucosan.
References
Bari M.A. et al., 2011. Characterisation of particulates and carcinogenic polycyclic aromatic hydrocarbons in wintertime
wood-fired heating in residential areas. Atmospheric Environment 45, 7627 – 7634
Fig.1: PM10, PAH and BaP profiles

122
Fig.1 PM10 source apportion result in Milan urban
background station (from AIRUSE LIFE+ project)
Traffic34%
Secondary nitrate5%
Secondary organic sulphate14%
Mineral dust7%
Industrial9%
Sea salt2%
Biomass burning24%
Unaccounted5%
THE IMPACT OF WOOD BURNING FOR RESIDENTIAL HEATING ON AIR QUALITY IN MILAN AND THE
PO VALLEY: ANALYSIS AND PERSPECTIVES
G. Lanzani, E. Angelino, C. Colombi, V. Gianelle, , A. Marongiu
ARPA Lombardia, Via Rosellini 17 20124 Milan, Italy
Presenting author email: [email protected]
Summary
Despite the common perception of people, wood burning in small domestic appliances has an important impact on air quality
in Milan and the Po Valley. The fraction of heat from residential heating using wood is increasing, due to the lower price of
this fuel compared to that of other ones and to the policies in favour of renewable sources. Emission inventory data show that
wood burning for residential heating is the first source of primary PM10 and B(a)P in Lombardia region and one of the
prevalent sources in Milan agglomeration, too. The higher values of B(a)P are not found in the city downtowns but in the
suburbs and in the valleys, where the use of wood is more widespread. All the source apportionment studies realized confirm
the importance of this source, both on the PM10 and B(a)P concentrations.
To implement effective actions to limit the impact of this source and to make compatible air quality and climate change
mitigation policies it is essential to consider all the aspects that can influence emissions from this source, starting from the
awareness and education of people, to the good installation and maintenance of the stoves and fireplaces, to the improvement
of the quality of the appliances and of the fuels (with particular reference to pellets constituents). Although the modern stoves
are much more performant compared to the old ones, further technological developments should be required.
Introduction
The Po Valley is surrounded on three sides by mountains exceeding 2500 m above sea level and it experiences
meteorological conditions that are often adverse to air pollution dispersion. More than 20 millions of people live in the basin,
whose 10 million in Lombardia, the largest region of the valley, with a population density of more than 3000 inhab/km2 in
Milan, in the centre of the area. The Po Basin represents an important area also in terms of produced wealth (more than 50%
of the Italian GDP). These features make it particularly difficult to achieve levels of air quality compatible with European
limits, in particular for particulate matter. B(a)P exceedances to EU standards are registered, too, above all in the areas where
the use of wood is more widespread, on the bottom of alpine and pre-alpine valleys.
Methodology and Results
In Lombardia, emission inventory data show that wood burning from residential heating is the first source of primary PM10,
accounting almost 40% of the regional PM10 yearly emissions, despite to the fact that the 87% of the energy required to heat
buildings is obtained from natural gas, and only 7% from wood. In the downtowns of the biggest cities the contribution of
wood combustion on PM10 total emissions decreases remaining anyway one of the main ones (22% in Milan municipality).
All these percentages increase during the cold season, when the higher PM concentration are registered. With 70% of the
regional emissions, wood burning in stoves and fireplaces is the principle source of B(a)P, too.
Different source apportionment studies were conducted based on the analysis of specific tracers like levoglucosan over the
collected gravimetric PM samples from the air. The results confirmed emission inventories data: in the Po Valley the
contribution of wood burning to PM10 mass varies from year and season,
arriving to 24% in urban stations (i.e. Milan), to 47% in rural plain stations (i.e.
Parona), and to 59% in alpine and pre-alpine stations (i.e. Darfo).
In the framework of the scenario studies supporting Regione Lombardia Air
Quality plan, different hypothesis have been investigated, showing that the
complete substitution of the obsolete stoves by stoves equipped with the Best
Available Techniques (BAT) could reduce the PM emission factors from this
source by one order of magnitude, still remaining two orders of magnitude higher
than those of natural gas, and one order than those of gasoil for domestic heating.
The introduction of regular good maintenance practices could contribute to
reduce emissions, too.
Conclusions
Wood burning is one of the most important sources of PM and one of the
toxicologically relevant compounds, such as B(a)P. Different actions are
possible to reduce the impact of this fuel, going from the improvement in
the maintenance operations to a replacement of oldest stoves with BAT models. To really make air quality compatible with
climate change mitigation policies, it is necessary to continue on the path of technological development in order to arrive to
appliances with emission factors comparable with those of other fuels normally used in modern cities together with a
reduction of energy needs.
References
AIRUSE, 2015. PM speciation and Source apportionment. Report of the LIFE+ project AIRUSE LIFE11 ENV/ES/584 PM,
March 2015

123
ENVIRONMENTAL IMPACT OF BIOMASS BURNING FOR CIVIL USES ONTO A MOUNTAIN AREA
F. Petracchini (1) , C. Balducci (1), M. Perilli (1), A. Cecinato (1), F. Liotta (1), M. Segreto (1), V. Paolini (1), L. Paciucci
(1).
(1) National Research Council of Italy, Institute of Atmospheric Pollution Research CNR-IIA, Via Salaria km 29.3, P.
O. Box 10, 00015 Monterotondo RM, Italy;
Presenting Author e-mail: [email protected]
Summary
The impact of biofuel combustion for civil uses onto the environment was investigated through determining a list of air
toxicants at Leonessa, a town lying in Apennines mountain region, Central Italy, and in its surroundings (Terzone). Attention
was focussed on suspended particulate matter (PM10), polycyclic aromatic hydrocarbons (PAHs) and regulated pollutants
(nitrogen dioxide, ozone and benzene).
Methodology and Results
Two in-field campaigns, each lasting two weeks, were carried out in summer 2012 and winter 2013. Contemporarily, air was
monitored in downtown Rome and in other localities of the province. In the summer all pollutants were more abundant in
Rome (e.g., PAHs, 0.93 ng/m3, vs. 0.37 ng/m3 at Leonessa and 0.14 ng/m3 at Terzone; benzene, 0.9 µg/m3 in Rome vs. 0.2
µg/m3 at Leonessa), apart from ozone (73 µg/m3 in Rome and >100 µg/m3 at Leonessa). By contrast, in the winter PAHs
were more at Leonessa (15.8 ng/m3) than in the capital city (7.0 ng/m3), and benzene was similar (2.3 µg/m3), despite
suspended particulates were less (22 vs. 34 µg/m3). Due to lack of other important sources and the scarce impact of transport
at mid (inter-regional) scale, biomass burning was identified as the major emitter of PAHs at Leonessa during the winter. Its
importance was confirmed by the molecular signatures, pictured by PAH concentration ratios distinct from those of Rome.
Other towns too experienced PM levels similar to capital city but higher PAH loads (~9.6 ng/m3), suggesting that
uncontrolled biomass burning contributed to pollution across the Rome province. Important differences among PAH
diagnostic ratios were observed at the sites also in the summer; nevertheless, in this case the ageing of air masses could play a
role.
Conclusion
PAH and PM10 were monitored in two in-field compaigns,. Biomass burning was identified as the major emitter of PAHs at
Leonessa during the winter. In summer period important differences among PAH diagnostic ratios were observed. Despite,
the suspended particulates were less than in Rome suggesting the lack of other important sources and the scarce impact of
transport at mid scale.
Acknowledgement
This work was supported by the Italian Ministry of Education, University and Research.
References
Benner, B.A., Wise, S.A., Currie, L.A., Klouda, G.A., Klinedinst, D.B., Zweidinger, R.B., Stevens, R.K., Lewis, C.W., 1995
Distinguishing the contributions of residential wood combustion and mobile source Emissions using relative concentrations
of dimethylphenanthrene isomers. Environ. Sci. Technol. 29, 2382–2389.
Borsella, E., Di Filippo, P., Riccardi, C., Spicaglia, S., Cecinato, A., 2004. Data quality of PAH determinations in
environmental monitoring. Annali di Chimica 94, 691-698.
Cecinato, A., Guerriero, G., Balducci, C., Muto, V., 2014. Use of the PAH fingerprints for identifying pollution sources.
Urban Climate 10, 630-643.
Di Filippo, P., Riccardi, C., Incoronato, F., Sallusti, F., Spicaglia, S., Cecinato, A., 2005. Characterization of selected
speciated organic compounds associated with particulate matter in ambient air of the outskirts of Rome. Polycyclic Aromatic
Compounds 25, 393-406.
Possanzini, M., Di Palo, V., Tagliacozzo, G., Cecinato, A., 2006. Physico-chemical artefacts in atmospheric PAH denuder
sampling. Polycyclic Aromatic Compounds 26, 185 – 195.

124
A CROWSOURCING TOOL TO IMPROVE THE ESTIMATE OF WOOD-BURNING EMISSIONS FROM
DOMESTIC HEATING
S. López-Aparicio, M. Vogt, L. Liu, H.V. Røen
NILU – Norwegian Instittute for Air Research, Instituttveien 18, Kjeller 2027 Norway
Presenting author email: [email protected]
Summary
Our study will present a new method to improve estimation of wood – burning emissions from domestic heating in Norway.
The method is being developed within the iResponse project that aims at improving and assessing information using
communication technologies (ICT)-based crowdsourcing tools for environmental research and decision making. The project
follows the principles of Responsible Research and Innovation (RRI), a concept gaining popularity among European policy
makers for emerging technologies like nanotechnology and ICT (e.g. EC, 2013). We will develop a crowdsourcing tool to
collect personal data about wood consumption for domestic heating, and we will use these data for estimating emissions. The
purpose of the crowdsourcing method is to obtain high space and temporal emission inventory of wood burning for domestic
heating. We will present the preliminary functionalities of the crowdsourcing tool and the methods to estimate wood burning
emissions.
Introduction
More than half of the global population currently live in cities and by 2050 around 70% will do it so. This puts pressure on
the urban environment and calls for smart urban development. ICT - enabled crowdsourcing has the potential to support
urban environmental research and enable citizen participation. However, societal concerns exist about crowdsourcing, and
especially regarding data protection, open access information and transparency in research results. As stated in the Science
Special Issue “The end of privacy” (Enserink & Chin, 2015) “there are ways to protect the private information hidden in big
data files, but they limit what scientists can learn; a balance must be struck”. Our study focusses on the development and
evaluation of ICT tools for citizen to be engaged in environmental research and decision making related to the urban
environment through a transparent process, and that respects data privacy and social concerns.
Wood burning is one of the main contributors to particulate matter (PM) in Norway. Addressing this problem requires better
knowledge of emissions and their contribution to pollution levels. Wood burning emissions in Norwegian urban
environments are currently estimated based on information regarding annual wood consumption at regional level, stove
technology, dwelling density and the corresponding emission factors. With data obtained through citizen participation and
crowdsourcing, we aim at improving the emission estimates for high spatial and temporal resolution. Hence, a tool will be
developed for gathering the needed input data from citizen participation. In addition, the potential social concerns from
crowdsourcing tools will be mapped in a process based on collaboration with stakeholders, citizens and, social and natural
scientist.
Methodology and Results
A tool and method for collecting data on wood consumption for house heating will be developed and, later, to be used for
emission estimates. The application will gather high-resolution wood consumption data based on citizen’s participation. The
development of the tool is carried out based on a co-designing process involving ICT designers, social and natural scientists,
and contributions from citizens and stakeholders. We will test the tool in urban areas during winter months when wood
burning occurs. Data analysis will focus on the geographical distribution of participating citizens, amount of wood consumed
and type of stove (open fireplace, new/old oven). Wood consumption data in Norway is available at relatively low
spatiotemporal resolution (yearly values, regional levels). The crowdsourced data will allow production of wood burning
emission maps at a hitherto unavailable high spatiotemporal resolution. The outcome of this application will improve the
input for air quality models, supporting regulatory process to reduce the exposure of people to harmful pollutant levels more
effectively. In our study, stakeholders were involved at the early stage of the development process. The results from
stakeholder workshops aiming at mapping of the key challenges and opportunities related to the crowdsourcing tool will also
be presented as an important output of the project.
Conclusions
Our study opens and promotes new ways of research, based on co-design and integration, and with possibilities to address a
wide range of societal challenges. Crowdsourcing is a powerful tool to obtain high space and temporal emission inventory of
wood burning emission from domestic heating. However, challenges and social concerns (data protection, transparency, open
access) need to be taken into account in the design of the method.
Acknowledgement
This work is supported by the Research Council of Norway (247884/O70).
References
EC, 2013 Options for strengthening responsible research and innovation. Report of the Expert Group on the State of Art in
Europe on Responsible Research and Innovation. European Commission, Directorate-General for Research and Innovation
(http://bookshop.europa.eu/en/options-for-strengthening-responsible-research-and-innovation-pbKINA25766/).
Enserink M., Chin G. (2015) The end of Privacy, Science, 30, 347, 490-491.

125
AIR QUALITY IMPACT OF THE DIFFUSION OF HIGH EFFICIENCY PELLET BOILERS AT EU LEVEL
G. Maffeis (1), S. Greco (1), A. Cherubini (1), M. Chiesa (2), B. Monteleone (2), ML. Venuta (2)
(1) TerrAria srl, Milano, 20125, Italy; (2) Università Cattolica del Sacro Cuore, Brescia, 25100, Italy;
Presenting author email: [email protected]
Summary
This research has been carried on in the framework of the EU FP7 Research Project “BioMaxEff” (Cost efficient biomass
boiler systems with maximum annual efficiency and lowest emissions, 2011-2014 - www.biomaxeff.eu) aiming at the
demonstration of ultra-low emissions and high efficiency small-scale pellet boilers. The work focuses on the environmental
impact assessment (through national emission scenarios, air quality modelling on local scale, LCA and LCC analysis) of
future market penetration scenarios of high efficiency pellet boilers [1].
Introduction
Due to biomass reduced costs and to Directive 2009/28/EU of 23/4/2009 on the promotion of the use of energy from
renewable sources, biomass consumption for residential heating is growing at EU level. Nonetheless, the environmental
impact due wood biomass combustion lead to higher emissions of particulate matter if compared to natural gas boiler, not
only due to the wood biomass combustion phase but even to other processes, as pellet production. In this research the
environmental impact of innovative pellet boilers is studied in terms of air emission, air quality and along the whole life
cycle, for substitutions of old biomass boilers.
Methodology and Results
CO, PM10, NOX, SO2 emission scenarios for 2 different EU case
studies representative of an alpine (Valdidentro, IT) and rural (Lunz
am See, AT) areas were developed. A spatial and temporal emissions
disaggregation have led to high resolution pollutant-specific emission
maps developed for the 2 case studies for the base case (2010) and
for two future scenarios: the Replacement scenario (2020), assuming
a “businesss as usual” substitution of old biomass boilers by
innovative pellet boilers tested, and the Market scenario (2030),
assuming a complete substitution of all biomass, coal and oil boilers
by the innovative ones.
Air quality impact assessment analysis of this local emission scenario
was performed using the dispersion model CALPUFF. In Figure 1
the Replacement scenario (2020) for PM10 in Valdidentro is shown.
In the Italian case study, the substitution of half of the already
installed wood biomass boilers with the new models would lead to
reductions of NO2 atmospheric concentrations in the range 0.3 -2.0
μg/m3 over the urbanized area. With reference to primary PM10
concentrations, relevant reductions are evidenced with contributions
to air quality in the range 0.4-2.2 μg/m3. In the Austrian case study
the same substitution would lead to a reduction of NO2 concentrations up to 7%. With reference to primary PM10
concentrations, reductions are in the range of 0.1-0.4 μg/m3.
In terms of emission impact assessment, different market penetration scenarios have been applied in the different EU27
States to estimate the emission reduction effect focusing on residential combustion. Energy efficiency scenarios for the EU
Countries (2020-2030) have been also considered. The Replacement scenario always leads to a reduction of EU emissions
(for all Countries and pollutants), while biomass Market Penetration reduces the impact only for some pollutants and some
EU Member States depending on current residential emission factors.
Finally, LCA and LCC were performed using the SimaPro (v.8.015.13), adopting the ReCiPe Midpoint Method (European
Hierarchist version) applied on three different high efficiency pellet boilers compared to traditional boilers (oil and gas).
Conclusions
Air quality could be improved in the short term (horizon: 2020) with the substitution of obsolete and end of life biomass
boilers with high efficiency pellet boilers in EU areas where biomass represents the main primary source for residential
heating. The results achieved in Valdidentro and Lunz am See have shown that a technology replacement for biomass
residential boilers could significantly improve air quality in terms of primary pollutants concentration reduction from 5% up
to 25% depending on the site and on the pollutant considered.
Acknowledgements
The research leading to these results has received funding from the European Union Seventh Framework Programme
FP7/2007-2013 under Grant Agreement n. 268217.
References
[1] E. Carlon et al. Efficiency and operational behaviour of small-scale pellet boilers installed in residential buildings,
Applied Energy 155 (2015) pp. 505–516
Fig.1 PM10 yearly average concentration for the
Replacement scenario (2020) in Valdidentro

126
USING A DISPERSION MODEL-BASED APPROACH FOR THE SPATIAL AND TEMPORAL
DISAGGREGATION OF PM EMISSIONS FROM BIOMASS COMBUSTION IN HEATING SYSTEMS IN
THESSALONIKI, GREECE
N. Moussiopoulos (1), G. Tsegas (1), Ch. Vlachokostas (1), C. Sioutas (2)
(1) Laboratory of Heat Transfer and Environmental Engineering, Aristotle University of Thessaloniki, 54124 Thessaloniki,
Greece; (2) Department of Civil and Environmental Engineering, University of Southern California,
Los Angeles CA 90089, USA
Presenting author email: [email protected]
Summary
Emissions from wood-burning devices used for heating have been recognised as one of the most significant sources of
ambient PM2.5 in several urban areas throughout Europe, particularly under unfavourable wintertime conditions. In this study,
a combined receptor modelling and dispersion modelling approach is introduced, with the aim of taking advantage of the
spatiotemporal information provided by an emissions database combined with the dispersion patterns as calculated by a
chemical dispersion model. The methodology is applied with the aim to obtain spatially and temporally disaggregated source
apportionment of PM in Thessaloniki, Greece. Results indicate a significant impact of wood smoke on PM2.5 ambient levels,
particularly in residential receptors around the city centre and most pronounced during the evening and early morning hours.
Introduction
Domestic wood-burning devices represent one of the dominant sources of PM2.5 emissions in residential areas. During the
last few years, a widespread substitution of domestic oil-burning heating systems with low-quality wood-burning units was
observed in the Greater Area of Thessaloniki, Greece. Combined with the typically unfavourable wintertime meteorological
conditions, this increase of PM2.5 emissions is considered to be largely responsible for an overall increase of up to 30% over
the 5-year average in the wintertime PM2.5 mass concentrations, observed at a residential measurement site in 2013, while an
increase of 20% was observed at the traffic-dominated centre of the city. At the same time, a distinct diurnal variation was
registered for wood smoke tracers throughout the urban area, with significantly higher concentrations in the evening hours of
the day compared to the morning. This work aims to quantify and spatiotemporally disaggregate the contribution of the
domestic heating emissions on the total observed PM, through a combined receptor-dispersion modelling approach.
Methodology and Results
A receptor-based source apportionment of ambient PM2.5 for the
Thessaloniki Greater Area has been previously performed based on
wintertime measurements at two urban sites and using the Robotic
Chemical Mass Balance (RCMB) receptor model (Argyropoulos and
Samara, 2011). In the present work, results of the RCMB model are
incorporated in a dispersion calculation with the aim of taking advantage of
the spatiotemporal information provided by the emissions database (see Fig.
1) combined with the detailed dispersion patterns as calculated by the
chemical dispersion model MARS-aero. Based on source composition
information from the RCMB source database, the chemical profile of
individual source categories is introduced in MARS-aero and a series of
simulations is performed using the zero-out method, revealing a refined
temporal and spatial allocation of source contributions for each receptor.
Mass closure of the time-resolved contributions is then obtained by
normalizing the calculated concentraion profiles at receptor points on the
basis of monitoring data. Calculated concentrations reproduce the observed
increase of wintertime maxima of over 60%, or 120mg/m3, compared to
previous years. Furthermore, the calculated diurnal concentration pattern
implies a strong impact of emitted wood smoke on the ambient PM2.5
levels, especially in residential receptors peripheral to the city centre..
Dyring both typical weekdays and weekends the most significant impact of
the heating sector occurs during the evening and early morning hours.
Conclusions
A combined receptor modelling and dispersion modelling approach is
developed for obtaining spatially and temporally disaggregated source
apportionment of ambient PM. Results obtained for the Thessaloniki area
reveal a dominant impact of domestic heating emissions on the wintertime
PM2.5 concentrations, especially in residential areas, with significant
contributions occurring during the evening and early morning hours.
References
Argyropoulos G., Samara C., 2011. Development and application of a robotic chemical mass balance model for source
apportionment of atmospheric particulate matter. Environmental Modelling & Software 26, 469-481.
Fig.2 Schematic illustration of the combined use of the RCMB and the MARS-aero models
for the apportionment of PM
Fig. 1 Spatial distribution and density (units per building block) of domestic wood-burning
installations in Thessaloniki

127
HEALTH AND MONETARY COST ATTRIBUTED TO AEROSOL AND GASEOUS EMISSIONS FROM
BIOMASS USE FOR SPACE HEATING
D.A. Sarigiannis (1,2,3), M. Kermenidou (1), D. Zikopoulos (1), S. Nikolaki (1) and S. Karakitsios (1,2)
(1) Environmental Engineering Laboratory, Department of Chemical Engineering, Aristotle University of Thessaloniki
Thessaloniki, GR-54124, Greece
(2) Centre for Research and Technology Hellas (CE.R.T.H.), Thessaloniki, 57001, Greece
(3) Chair of Environmental Health Engineering, Institute for Advanced Study, Pavia 27100, Italy
Presenting author email: [email protected]
Summary
Over the last years in Greece, the intense use of biomass for space heating resulted in increased ambient and indoor air
pollution and enhanced population exposure to particulate matter and genotoxicants in particle and gaseous form such as
polyaromatic hydrocarbons (PAHs). This study deals with the precise assessment of exposure to these pollutants and the
related health and monetary impact. To these goals, measured and modelled data of outdoor and indoor PM10 and PM2.5
were fed into an integrated exposure assessment framework that takes into account indoor air quality, time-activity patterns
of the exposed population and activity-based inhalation rates. Chemical analysis on the sampled PM allowed us to estimate
the contribution of biomass burning to PM mass concentration and the associated increase in genotoxicity (expressed in terms
of PAHs content and the respective toxicity equivalent quotient of the particle-adsorbed PAH mixture). Health impacts were
assessed adapting well-established exposure-response functions as well as mechanistic exposure models; monetary cost of
these impacts was calculated based on the valuation of the willingness-to-pay/accept to avoid/compensate for the loss of
welfare associated with these health impacts. Overall, exposure to PM and PAHs due to biomass use was significantly
increased and the estimated health burden was increased by more than 40%; the associated monetary cost rises to ca. €200m.
PM from biomass burning is finer and more genotoxic than PM from traffic or other urban sources.
Introduction
Specific human activities result in significantly increased PM levels in the ambient and in indoor air. A typical example is the
irrational use of biomass burning for space heating in Greece. Although the use of biomass for space heating was introduced
as a CO2-neutral means to foster global warming mitigation, a series of austerity measures combined with changes in the
taxation of light heating diesel, resulted in irrational use of biomass for residential heating in the winter of 2012-2013.
Methodology and Results
A composite methodology was developed, that included (a) measurements of different size fractioned PM at multiple sites of
the urban agglomeration, (b) chemical analysis of the respective particles for identification of sources contribution
(levoglucosan, manosan and galactosan), (c) indoor air, exposure and lung deposition modelling for identifying actual uptake
of PM across the different regions of the human respiratory tract and (d) health and monetary impact assessment. The
estimated mortality is shown in Fig. 1. Almost 170 additional deaths are attributed to PM during the cold period compared to
the cold period, although this refers to a period half of duration (4 months compared to 8 months). Similarly, an additional
number of 100 respiratory and cardiovascular hospital admissions is expected during the cold period. Among the health
endpoints of interest, the highest increase is related to the lung cancer estimated risk; although the overall incidence rate
remains low (lifetime individual risk c.a. 10-6),
this was actually increased up to almost 6 times
compared to the warm period. The associated
monetary costs of the observed health effects
are dominated by mortality costs, resulting in an
increase of c.a. €200m (potentially up to a
billion) in the cold period of the year compared
to the warm period. Morbidity costs increase
due to cardiovascular and respiratory hospital
admissions are in the range of €250,000, while
lung cancer risks costs (associated with
exposure to PAHs in both the particle and the
gaseous phases) are lower, mainly due to the
low incidence rate.
Conclusions
Generally, the transition to the cold period (mid-November to mid-March) is accompanied by increased mortality accounting
for ca. 200 deaths attributable to airborne particles (expressed on an annual basis) for a population of almost 900.000,
reflecting a marginal cost of almost 250 million euro. A very important conclusion of the current study is that biomass
emitted particles are i) more toxic in terms of PAH content compared to the ones related to other sources and ii) of lower
aerodynamic diameter; as a result, more refined exposure and risk characterization methods are needed so as to properly
account for their potential health effects.
Acknowledgement
The development of the risk assessment methodology was done in the frame of the LIFE+ ENV/GR/001040 project CROME
(Cross-Mediterranean Environment and Health Network).
Fig.1 Health impact assessment of the associated health endpoints

128

129
SPECIAL SESSION - AIR QUALITY MANAGEMENT FOR
POLICY SUPPORT AND DECISIONS

130

131
INFLUENCE OF AMMONIA EMISSIONS ON PARTICLE FORMATION IN EUROPE
A.M. Backes (1), A. Aulinger (1), J. Bieser (1, 2), V. Matthias (1), M. Quante (1)
(1) Helmholtz-Zentrum Geesthacht, Institute of Coastal Research, Max-Planck-Straße 1, 21502 Geesthacht, Germany
(2) DLR, Deutsches Luft und Raumfahrtzentrum, Münchener Straße 20, 82234 Weßling
Presenting author email: [email protected]
Summary
In this study the influence of ammonia emissions on inorganic aerosol concentration in central Europe is investigated.
Individual temporal profiles for fertilizer and manure application are calculated based on meteorological, livestock, and land
use data for each model grid cell. Comparisons to EMEP observations indicate that the new ammonia emission module leads
to a better agreement of modelled and observed concentrations of gaseous ammonia and particulate ammonium. In a scenario
analysis it has been found that the planned European emission ceilings have only a minor impact on the formation of
secondary particles. However, a reduction of NH3 emissions from animal husbandry through behavioural change leads to a
24% reduction of total PM2.5 concentrations in the model domain during winter, mainly driven by reduced formation of NO3-.
Introduction
The emission of reactive nitrogen into the atmosphere causes numerous problems ranging from eutrification to the formation
of secondary inorganic particles. The NH3 emissions in European are constantly increasing, as there has been little progress
in controlling agricultural ammonia emissions. The influence of different ammonia abatement strategies on the formation of
particles has been investigated through a scenario analysis where scenarios varying in intensity, release time, and temporal
variability of NH3 have been compared.
Methodology and Results
The emissions were processed by the SMOKE-EU model suitable for the
CTM CMAQ. The annual NH3 emissions have been temporally distributed
across the year on the basis of the meteorological variables wind speed and
surface temperature, resulting in individual ammonia emission data for every
grid cell and every hour (Skjøth et al., (2004) and Gyldenkærne et al.,
(2005). The evaluation with EMEP measurement stations indicated that the
model is suitable for a scenario study where NH3 is distributed differently in
amount and time of the year. A political scenario (NEC 2020), a scenario
representing the maximum technical feasible reduction (MTFR) (Amann et
al., 2011) and a behavioural scenario (RCAP) based on a reduced
consumption of animal products have been compared (Willett and Skerrett,
2005). The RCAP scenario shows a severe decrease in the PM2.5
concentrations, mainly noticeable in winter (-24%). The reduction of the
NO3- concentration found for the RCAP scenario in winter is -48%.
lxcxc
Conclusions
Through the implementation of dynamical time profiles the correlation between modelled and observed NH3 concentrations
has improved statistically significant at 14 out of 16 EMEP stations. It has furthermore led to an improvement of the NME
and NMB of NH3, NH4+ and NO3. The main conclusion of this study, however, is the remarkable potential for air quality that
a reduction of NH3 emission in the cold season bears during which the potential of reduction within the animal husbandry is
highest.
References
Amann, M., Bertok, I., Borken-Kleefeld, J., Heyes, C., Cofala, J., Höglund-isaksson, L., Klimont, Z., Rafaj, P., Schöpp, W., & Wagner, F. (2011).
NEC Scenario Analysis Report Nr. 8. Cost-effective Emission Reductions to Improve Air Quality in Europe in 2020. Gyldenkærne, S., Skjøth, C.A., Hertel, O. and Ellermann T. (2005). A dynamical ammonia emission parameterization for use in air pollution models.
Journal of Geophysical Research. doi:10.1029/2004JD005459
Schaap, M., Roemer, M., Sauter, F., Boersen, G., and Timmermans, R. (2005). LOTOS-EUROS: Documentation. http://www.lotos-
euros.nl/doc/LOTOS-EUROS-v11-documentation.pdf (17.11.2014).
Skjøth, C.A., Hertel, O., Gyldenkærne, S., and Ellermann T. (2004) Implementing a dynamical ammonia emission parameterization in the large-scale
air pollution model ACDEP. Journal of Geophysical Research, 109(D6), D06306. doi:10.1029/2003JD003895
Willett W.C. and Skerrett P.J.(2005). Eat drink and be healthy: the Harvard Medical School guide to healthy eating. Published by Free Press.
Fig.1: Annual variation of the daily NH3
emission. The Standard and Dynamical
Temporal Profile (STP) (Schaap et al., 2005)
and (DTP) (daily mean, all grid cells)
Fig. 2: NO3- reduction in winter in the Reference scenario, the political NEC2020 and the behavioral RCAP scenario in µg/m³

132
MICRO-SCALE MODELLING OF URBAN AIR QUALITY TO FORECAST NO2 CRITICAL LEVELS IN
TRAFFIC HOT-SPOTS
G. Carlino (1), L. Pallavidino (1), R. Prandi (1), A. Avidano (2), G. Matteucci (2), F. Ricchiuti (2), P. Bajardi (3) and L.
Bolognini (3)
(1) Simularia Srl, via Principe Tommaso 39, Torino, Italy; (2) CSP S.c.a.r.l. - Innovazione nelle ICT, Via Nizza, 150, Torino,
Italy; (3) Data Driven Innovation Dep., Aizoon Srl, Strada del Lionetto 6, Torino, Italy
Presenting author email: [email protected]
Summary
In this work we present a forecast modelling system implemented in the city of Torino to provide up-to-date hourly NO2
concentrations at vey high horizontal resolution (6 m) on a 6 x 7.2 km2 domain. Each day meteorological fields and
background regional concentrations are provided by the forecasting system "QualeAria" (Kukkonen, 2012) while bottom-up
traffic emissions are directly simulated with the three-dimensional parallel Lagrangian model PMSS, taking into account the
presence of obstacles (buildings), on a 16 core (dual) workstation (64 GB total memory). Comparison of so far simulated
values (about 3000 hours in the period April - September 2015) with measures in three monitoring sites (one urban
background, one roadside in LEZ and one roadside) shows good agreement in reproducing peaks, daily behaviour and long
term averages.
Introduction
NO2 concentrations in the urban environment have shown little improvements in past
years: monitoring stations, especially in road/kerbside sites, indicate that large urban
areas are not in compliance with the legal limits, based on WHO guidelines. While
atmospheric modelling systems are now routinely used both for assessment and
informative purposes on regional and local scales, modelling pollution at street level
on a city domain is still a challenging task, often demanded to gaussian-like models.
On the other hand, not-stationary three-dimensional models need to be employed if we
want to capture inhomogeneities in the ground level concentrations, forecast critical
levels and successfully plan effective actions for reducing air pollution in cities.
Methodology and Results
Micro-scale simulations are conducted on a 3d grid with 26 vertical levels, up to 1250
m. A parallelized 3d mass-consistent wind field model (Pswift) performs the
downscaling of meteorological forecasts down to 6 m, taking into account buildings
(filled grid cells). Bottom-up NOx traffic emissions on the main roads (Pallavidino,
2014) are complemented with diffuse emissions assigned to secondary streets, for a
total of 13060 linear sources. NO2 ground concentrations are computed hourly by
using a parametrised box model (Kiesewetter, 2014), employing modelled O3 and
NOx on a regional scale as a background, coherent with the meteorological forecast.
Average values in the first month of simulation (see Fig. 1) reproduce in a realistic way
observed differences between background and traffic sites. Compared with the regional
model, the micro-scale forecast system is able to improve the modelling of peak events
in traffic hot-spots as shown by the quantile-quantile plots in Fig. 2. In the considered
period (April - September 2015) the absolute bias was -5 μg/m3 (28 μg/m3 average
value) in the background station, 6.3 μg/m3 (36 μg/m3 average value ) in the LEZ
traffic station, -4.2 μg/m3 (53 μg/m3 average value) in the traffic station.
Conclusions
The forecast modelling system implemented for the city of Torino has so far proven to be in good agreement with measures
and provides a solid framework to the Elise Project, focused on participatory sensing. Simulation of winter months, usually
characterized by higher NO2 concentrations and few exceedances of the hour limit value, will supply a more complete set of
data for quality assessment in order to evaluate its suitability as informative tool and decision support system.
Acknowledgement
This work is part of the ELISE (Environmental LIve SEnsing) Project, partially supported by Regione Piemonte under
POR/FESR 2007-2013 programme. Helpful discussions were held with G. Tinarelli (Arianet Srl) and A. Bertello (Città
Metropolitana di Torino); Regione Piemonte and Città di Torino are kindly acknowledged for providing emission and
cartographic data.
References
Kiesewetter G. et al., 2014. Modelling NO2 concentrations at the street level in the GAINS integrated assessment model:
projections under current legislation. Atm. Chem. Phys., 14, 823-829.
Kukkonen J. et al., 2012. A review of operational, regional-scale, chemical weather forecasting models in Europe. Atm.
Chem. Phys., 12, 1-87.
Pallavidino L. et al., 2014. Compilation of a road transport emission inventory for the Province of Turin: advantages and key
factors of a bottom–up approach. Atm. Poll. Res. 5, 648-655.
Fig.2 qqplot of microscale (above) and regional scale (below) model results in
three monitoring sites (from the left:
background, traffic in LEZ, traffic).
Fig.1 Monthly averaged NO2
concentrations.

133
HIGH RESOLUTION FORECASTING OF AIR QUALITY AND EXPOSURE FOR HEALTHIER CITIES
(HIRAE)
A.R. Farrow (1) and R.S. Sokhi (1)
(1) Centre for Atmospheric and Instrumentation Research (CAIR), University of Hertfordshire, Hatfield, Hertfordshire, AL10
9AB, United Kingdom
Presenting author email: [email protected]
Summary
The HiRAE project is a collaboration between UK city authorities and researchers to make and exploit new high resolution
air quality forecast and exposure data. The project has be co-designed by researchers and practitioners so that it can develop
and implement new technologies that will directly aid progress towards compliance with EU air quality directives and reduce
the health impact of air pollution. The two complimentary aims of the project are; 1) To establish a robust engagement plan
with the Manchester and Bristol city authorities determining the best ways for the research and statutory communities to
work together, and 2) To develop and operate a High Resolution forecasting system that is designed to fully integrate with
local authority systems and requirements. The University of Hertfordshire-NCAS Air Quality forecast has been developed
and extended to produce high resolution air quality data and exposure forecasts of NO2, PM10 and PM2.5, mapped according
to street geometries and reflecting traffic and meteorological conditions. The output data has been designed to have
maximum impact for Air Quality authorities.
Introduction
In the UK Local Authorities have devolved responsibilities to manage and control air pollution in towns and cities to ensure
compliance with EU Air Quality Directive Limit Values. Despite implementing air quality action plans, many cities across
the UK are experiencing exceedances and do not comply with EU limit values especially for nitrogen dioxide (NO2) and
particulate matter (PM10 and PM2.5) (HoC EAC 2014). A major factor that hinders progress on Air Quality is the lack of
scientific expertise and the financial resources to develop air pollution modelling, exposure prediction or forecasting
capabilities. In this work we address this problem by working directly with local authorities to develop Air Quality modelling
tools that are directly applicable to their needs.
Through early and close engagement with city authorities this project provides insight into best practise for outreach work,
whilst also contributing novel Air Quality forecasting technologies that are fully integrated with local authority systems and
requirements.
Methods
The Forecast System is driven by WRF-
CMAQ. Simulations are performed for
Europe at 50km resolution with a nested
10km domain for the UK. Meteorological
boundary conditions are derived from NCEP
FNL and chemical boundary conditions are
from MACC II. The TNO emission inventory
is processed using SMOKE adapted for the
UK and Europe domains. Biogenic emissions
are generated with MEGAN and the CB05
chemical mechanism is used with tri-modal to
aerosol size distributions. Once the UK
simulation is complete a city scale simulation is
performed using the UH-OSCAR model and bespoke emissions inventories for Bristol and Manchester. Model interfaces
have been developed to link CMAQ to the urban scale model and a suite of online data distribution tools including Web Data
Dashboard and API provide access to the forecast and archive of data.
Discussion
By engaging with the local authorities in Bristol and Manchester from the outset of the project and maintaining a close
relationship with them we have been able to determine precisely how to proceed, whilst maximising mutual benefits. This has
been achieved through regular reporting of progress and frequent two-way discussion between all parties. The commitment to
engagement has delivered dividends by sharing resources and ideas. New concepts such as integration of forecast data with
city journey planners and traffic management systems are key examples of how the city authorities have been able to steer the
project goals to focus on their interests.
Acknowledgement
This work is supported by the UK Natural Environmental Research Council (NERC), the National Centre for Atmospheric
Science (NCAS), the Department for Environment, Food and Rural Affairs (DEFRA), Bristol City Council, Transport for
Greater Manchester, Salford City Council and Oldham Council.
References
HoC EAC 2014 (House of Commons Environmental Audit Committee), Action on Air Quality Sixth Report of Session 2014-
15
Fig.1 Ozone, NOx and PM2.5 forecasts for the UK domain

134
THE ROLE OF AIR QUALITY MODELLING WHEN MAKING MAJOR POLICY DECISIONS IN THE UK
Bernard Fisher
c/o Centre for Atmospheric and Instrumentation Research (CAIR), University of Hertfordshire, Hatfield, Hertfordshire,
AL10 9AB, United Kingdom
Presenting author email: [email protected]
Summary
A critique of modelling methods used to determine recent, major planning and infrastructure decisions in the UK is
presented.
Introduction
The role of air quality management within a number of topical, high profile decisions in the UK is discussed. The decisions
discussed encompass (1) the site of the next airport runway in southern England, (2) regional plans to comply with the
European Directive NO2 limit values, (3) the introduction of an Ultra Low Emission Zone in London, and (4) the
implementation of the Large Combustion Plant Directive in the UK. Each of these projects involves to a greater or lesser
extent an air quality assessment describing the air quality effects of different management options. As one is looking to the
future, this mainly requires modelling, with its inherent uncertainty, using the best scientific evidence available. The
modelling approaches leading to recommendations will be reviewed, and judged against what might be considered the
current, best available practice.
The air pollution effects are not fully understood and can occur over different scales. Future concentrations depend on
interactions between different kinds of sources and different pollutants, adding to the complexity of the decision making
process. In addition uncertainty regarding future weather, future emission totals, because of technical, economic and social
factors, and uncertainty with regard to future emission factors, such as those for diesel cars, suggest that a range of estimates
should be made but this is seldom done. These projects also involve an impact assessment which compares the health
benefits with costs to ensure that the decision avoids disproportionate social costs.
Conclusions
For the practical reasons these uncertainties have been ignored, or have been left to be implied, in the decision making
process. With these factors in mind the approaches used in each of the schemes is judged on practical and scientific grounds.
There is shown to be a considerable difference between what would be regarded as leading science and the methods adopted
for these major decisions. This gap is shown to be more acceptable if the nature of the uncertainties are made more explicit.
Whether the introduction of uniformly applied, recommended methods would help to close the gap is also discussed.

135
IDENTIFYING AIR QUALITY EPISODIC EVENTS AND SEASONAL CHANGES OVER THE UK USING
SATELLITE OBSERVATIONS OF TROPOSPHERIC NITROGEN DIOXIDE
R. H. Chaudhari (1), H. Gadhavi (3), V. Sethi (1), R. Kumar (4), A. Namdeo(2), M. C. Bell (2)
(1) Centre for Environmental Science and Engineering, Indian Institute of Technology Bombay, Mumbai, 400076, India; (2)
School of Civil Engineering and Geosciences, Newcastle University, Cassie Building, Claremont Road, Newcastle upon
Tyne NE1 7RU, United Kingdom; (3) National Atmospheric Research Laboratory, Department of Space, Gadanki, Andhra
Pradesh, 517112, India; (4) National Environmental Engineering Research Institute, Mumbai, 400018, India;
Presenting author email: [email protected]
Summary
This study presents the spatio-temporal patterns of tropospheric NO2 columnar density, derived from the Ozone Monitoring
Instrument (OMI) aboard AURA satellite, over UK from 2005 to 2014. The patterns have been used to identify the annual
trends, the NO2 episodic events and seasonal cycles. Temporal trends indicate that tropospheric density for the period 2005 to
2014 is within 1 to 3 x10¹⁵ molecules/cm2. During winter and spring of 2012 and 2013, exceptionally high densities (~1016
molecules/cm2) were observed, which will be investigated further using meteorological and inventory/ground measurement
datasets available from the UK automated urban and rural network (AURN).
Introduction
Air quality regulations require routine monitoring of surface concentrations of several species including NO2, and monitoring
networks have been established for the same (URL01). Measurements from ground-based monitoring networks represent
only relatively small areas in the vicinity of the stations, and are limited in coverage at regional to global scales. The purpose
of this study was to understand the usefulness of the data from a space-borne platform such as Ozone Monitoring Instrument
(OMI) located on on the Earth Observing System (EOS) AURA satellite, which provides a one hour near-daily global
pollutant measurement at a spatial resolution of 24×13 km2 at the same time each day.
Methodology and Results
The spatial and temporal patterns of tropospheric NO2 columnar density, given by OMI sensor aboard AURA, were analysed
(Boersma et al., 2011), over UK (grid: 49 to 61◦ N, -9 to 2 ◦ E ) for the period 2005-2014. The OMNO2 Level 2 (version 3)
data product (pixel size 24×13 km2) (Krotkov and Veefkind, 2012) was accessed and processed using DataFed (Husar et al.,
2008). The spatial patterns (annual, seasonal and monthly) were generated by temporal aggregation over the given time
period for each pixel in the grid. Annual patterns indicated high columnar loading (~5-7x10¹⁵ molecules/cm2) over south-east
UK, with major “hotspots” over the region around London, Sheffield and Liverpool. Though the tropospheric density does
not vary much from 2005-2014 (1 to 6 x10¹⁵ molecules/cm2); high columnar loading (~7-8x10¹⁵ molecules/cm2) was
observed for the years 2012 and 2013. Higher densities (1.5 to 3 x10¹⁵ molecules/cm2) were observed during spring and
autumn, as compared to winter and summer (1 to 1.5 x10¹⁵ molecules/cm2). Seasonal patterns for 2012 and 2013 show that
the winter and spring of 2012 and 2013 exhibit very high tropospheric densities (~8-9x10¹⁵ molecules/cm2) with levels
greater than 1x10¹⁶ molecules/cm2 being observed during Winter 2013. Further analysis of these initial observations in
conjunction with the UK emission inventory and meteorology datasets will provide a better understanding the winter/spring
episodes of 2012 and 2013.
Conclusions
This study shows much promise in the use of satellite data for air quality management and has delivered a first step in both
spatial and temporal domains. Seasonal episodic events of 2012 and 2013 provide an opportunity for further investigation
using ground measurements and meteorological datasets.
Acknowledgements
We acknowledge Professor Rudolf B. Husar and his team, Washington University in St. Louis, for access to DataFed; and the
free use of tropospheric NO2 column data from the Ozone Monitoring Instrument (OMI) sensor aboard AURA satellite, from
www.temis.nl. Funding from British Council through UKIERI project ‘NAMPSER’ between Newcastle University, UK and
IIT Bombay, Mumbai is acknowledged with gratitude.
References
Boersma, K.F., Eskes, H.J., Dirksen, R.J., R. J. van der A, Veefkind, J. P., Stammes, P., Huijnen, V., Kleipool, Q. L., Sneep,
M., Claas, J., Leitao, J., Richter, A., Zhou, Y. and Brunner, D., 2011. An improved retrieval of tropospheric NO2 columns
from the Ozone Monitoring Instrument, Atmos. Meas. Tech., 4, 1905-1928.
Husar R.B., Hoijarvi K., Falke S.R., Robinson E.M. and Percivall G.S., 2008. DataFed and Architecture for Federating
Atmospheric Data for GEOSS. IEEE Systems Journal, 2 (3), 366- 373.
Krotkov, N.A. and Veefkind, J.P., 2012. OMI/Aura Nitrogen Dioxide (NO2) Total and Tropospheric Column 1-orbit L2
Swath 13x24 km, version 003, NASA Goddard Space Flight Center, doi:10.5067/Aura/OMI/DATA2017.
DEFRA. http://uk-air.defra.gov.uk/ Accessed 1st March 2015.

136
FAIRMODE’S EU COMPOSITE MAPPING EXERCISE
S. Janssen (1) and Ph. Thunis (2)
(1) VITO, Boeretang 200, Mol, Belgium; (2) Directorate-General, Joint research Centre, Institute for Environment and
Sustainability, Ispra, Italy
Presenting author email: [email protected]
Summary
This study presents the first results of a new FAIRMODE capacity building initiative. National, regional or local air quality
assessment maps are collected in a “composite mapping exercise” with the objective to trigger discussions on the specific
choices in the modelling setup (selection of emission inventory, data assimilation scheme…) and to improve the overall
European modelling capabilities in support of the Air Quality Directive.
Introduction
FAIRMODE (Forum for AIR quality MODElling) has the aim to bring together air quality modellers and users in order to
promote and support the harmonised use of modelling practices in the framework of the Air Quality Directive. The forum is a
response action of the European Commission Joint Research Centre towards the new Air Quality Directive with support of
the Environmental European Agency and DG Environment. A recent survey completed by the National Contact Points
pointed out that modelling activities have a clear added value to the policy making process but there is still a lack of clarity in
legislation and a lack of common guidance on how to apply models in support of the implementation of the Air Quality
Directive. Over the last couple of years FAIRMODE-WG1 has focused on a QA/QC methodology (e.g. Model Quality
Objectives) and a Benchmarking process for air quality assessment. At present there is more and more consensus within the
community on the proposed methodologies and first steps towards a CEN standardization process have been made. Although
tackling the QA/QC problem is for sure a big step in the right direction to provide common guidance, it is not sufficient.
Remaining open questions within the modelling community are for example: when is a model fit for purpose (adequate
resolution, adequate assumptions…)? how best to combine modelling results with monitoring data…? Providing answers to
those questions is seen as the next challenge for WG1 and FAIRMODE in general.
Methodology and Results
In order to open the discussion on the questions mentioned above, FAIRMODE initiated an activity aiming at collecting and
assembling modelled air quality maps, following the work initiated in the ETC/ACM pilot study (De Smet et al, 2013). The
objective is to create a bottom-up composition map of air quality over Europe. National/regional agencies or modelling teams
are encouraged to provide their best available air quality map for their particular region and those maps are being compiled
into an (hopefully) EU-wide bottom-up composite map. This mapping exercise is used as common platform within
FAIRMODE and as a catalyst to trigger discussions on:
- Border effects becoming visible between neighbouring regions/countries
- Use of data assimilation or data fusion techniques to produce air quality maps
- Quality and consistency of underlying emission inventories
- Choice of an adequate spatial resolution for a particular application
- …
Furthermore, the exercise is also used to convince countries or regions that are not yet using models on a regular basis to
participate in the process.
So the objective of this exercise is in the first place capacity building. The platform improves comparability of assessment
methodologies and makes it easier to learn from each other. A long term objective of the initiative is also to contribute to the
formal e-Reporting process. Some Member States are already reporting modelling data in the official data flows and more
Member States are expected to do so in the future. However, also here is a clear lack of guidelines on the use of models and
reporting formats. It is not the objective of this initiative to deliver model data for the e-Reporting process but it is obvious
that FAIRMODE can prepare the ground for a possible harmonized approach and contribute to reporting guidelines.
Conclusions
More than 25 modelling teams from 17 European countries have provided national, regional or local air quality maps so far.
At present we only work with annual averages, but this could be extended in the future. All maps are collected in a
FAIRMODE platform which offers the opportunity to visualise and analyse the composite air pollution map. The platform is
used as a tool to discuss anomalies, choices for model resolution, explore the consequences of specific choices with respect to
data assimilation/data fusion schemes, use of underlying emission inventories… The exercise is open for any modelling team
in Europe using air quality models in support of the Air Quality Directive.
References
Peter de Smet et al., 2013, A European compilation of national air quality maps based on modelling, ETC/ACM Technical
Paper 2013/3

137
CHANGES IN AIR POLLUTION EXPOSURE CAUSED BY REDUCED EMISSIONS VERSUS CLIMATE
CHANGE IN STOCKHOLM, SWEDEN
C. Johansson (1,2), C. Andersson (3), B. Forsberg (3)
(1) Department of Environmental Science and Analytical Chemistry, Stockholm university, Sweden, (2) Environment and
Health administration, Stockholm, (3) Swedish Meteorological and Hydrological Institute, Norrköping, Sweden, (4)
Department of Public Health and Clinical Medicine, Umeå university, Umeå, Sweden.
Presenting author email: [email protected]
Objectives
The main objective of this work is to investigate the impact
on future population exposure of climate change versus
emission changes.
Introduction
Future climate change and control policies will alter the
urban air quality [2]. For NOx and PM-exhaust we compare
health benefits of three mitigation strategies - a motorway
bypass outside Stockholm [1], no exhaust emissions
(electric fleet), and a fossil free vehicle fleet - with climate
change effects on the exposure. For O3 we compare changes
in exposure due to European and local emissions. We take
into account effects of large-scale global climate change to
fine-scale local emission change.
Methodology
The effects on NOx and PM exposure are investigated using
a Gaussian dispersion model at 100m resolution. For surface
ozone, we used nested model calculations from global (50
km) to local scale (1 km over Stockholm). An Eulerian
chemistry-transport model (MATCH) was used to analyse
impacts on the air quality 2050 of climate change compared
with changing European and local emissions. MATCH
includes ozone- and aerosol-forming photochemistry with
60 species.
Results Figure 1 shows the potential reduction in NOx and PM-
exhaust exposure of introducing a fossil fuel free (FFF)
vehicle fleet compared to removing all exhaust emissions.
In the FFF fleet we assume that all diesel and gasoline
vehicles would be electric and the remaining emissions
(difference between no exhaust and fossil free) are due to
existing ethanol, biogas and biodiesel vehicle emissions.
Figure 1. Change in population weighted exposure
concentrations for the three emission scenarios and one
climate change scenario for the Greater Stockholm area (ca
1.6 million inhabitants).
It is seen that the planned bypass will be much less
beneficial for reduced population exposure compared to the
FFF scenario and that climate change alone has negligible
effect on the exposure.
Future O3 exposure in Stockholm will decrease due to
projected lower European precursor emissions (Figure 2). If
the emissions would be the same climate change alone is
predicted to cause lower ozone exposure, but the effect is
very small compared to lower European emissions.
Exchanging all vehicles to electric will cause increasing
ozone exposure in Stockholm (due to less NOx), but this is
a very small effect compared to the decrease of ozone
exposure in Stockholm due to climate change alone.
Figure 2. Change in population weighted exposure ozone
concentrations due to changes in precursor emissions in
Europe and Stockholm, climate change, and if all exhaust
emissions in Stockholm would be removed.
Conclusions
The European-wide emission change from present to mid-
century causes a strong decrease in particle and ozone
concentration, far exceeding the impacts of climate change
or local mitigation on the urban background scale in
Stockholm.
Acknowledgement
This project was funded by the Swedish Environmental
Protection Agency as part of the ERA-ENVHEALTH action
plan.
References
1. Orru, et al. Estimated health impacts of changes in air
pollution exposure associated with the planned by-pass
Förbifart Stockholm. Journal Of Exposure Science And
Environmental Epidemiology, 25:524-31, 2015.
2. Markakis et a., Mid-21st century air quality at the urban
scale under the influence of changed climate and emissions:
case studies for Paris and Stockholm, Atmos. Chem. Phys.
Discuss., 15, 27041-27085, 2015.

138
FUSION OF AIR QUALITY INFORMATION BASED ON THE COMBINATION OF STATISTICAL AND
DISPERSION MODELLING APPROACHES
L. Johansson (1) A. Karppinen (1) and J. Kukkonen (1)
(1) The Finnish Meteorological Institute (FMI), Erik Palmenin aukio 1, 00101 Helsinki, Finland
Presenting author email: [email protected]
Summary
A FMI-ENFUSER modelling system is presented, an application which utilizes both Land Use Regression and dispersion
modelling. With this combination of techniques the hourly concentration of particle matter (PM2.5 and PM10) and NO2 was
accurately predicted in several selected urban test sites in Finland. FMI-ENFUSER can be used also in other regions,
provided that an extensive training dataset and GIS-based information is available for the selected region. In the fusion of
information modelled background concentration data can be used simultaneously with a heterogeneous set of sensor
measurements that can be of variable quality. The system has been implemented in the city of Langfang, China, utilizing as
input data PM2.5 measurements from 5 sensors and online weather data for the area.
Introduction
The amount of environmental information that can be used for the assessment of air quality in urban areas has increased
substantially during the recent years. Low-cost sensors, disposable and wearable, are on their way to consumer markets and
regional air quality forecasts are freely available online. It therefore makes sense to fuse the available information. However,
the fusion of measured air quality data is especially demanding, since each data point is representative of the surrounding
environment, meteorological conditions, human activities and background concentrations. Furthermore, the individual sensor
quality must be considered.
Methodology and Results
In the assessment of expected hourly pollutant
concentrations, the model combines Land Use
Regression (LUR) and dispersion modelling
techniques; we call this approach ‘dynamic land use
regression’. We treat land use data (e.g., CORINE,
satellite images, OpenStreetMap) as proxies for
emissions and weight the contributions of the sources
based on the Gaussian Plume solution. The statistical
model estimates are substantially affected by
meteorology and the model operates three-
dimensionally (also accounting for the influences of
topography). As the approach is based on land Use
Regression, the model does not require an emission
inventory; instead, the training of the model requires
a large calibration dataset for each pollutant. For
instance, we have used more than 300 000 hourly
measurements of NO2 in Finland for the calibration of
the model.
The fusion of information has been described in detail
in (Johansson et al, 2015). The fusion can also
include modelled and forecasted regional air quality
data, for which we have used the FMI-SILAM model.
This facilitates the possibility to produce forecasts for urban air quality for the next couple of days. Additionally, emission
inventories, if available, can be added as additional layers of ‘land use’ data acting as area sources for emissions. In the
particular case of shipping emissions, we use data provided by FMI-STEAM emission model. The resolution of the FMI-
ENFUSER output can be as low as 10 x 10m2 and the model can detect individual buildings and street canyons.
Conclusions
The presented dynamic LUR-modelling can be used for the assessment of urban air quality on a high spatial resolution, when
local sensor measurements are available. The system has already been set up and evaluated for Finland, and implemented for
a Chinese city of Langfang, for predicting the PM2.5 concentrations. In cross validation studies conducted in Helsinki in 2011
it was shown that the model can outperform multi-source urban Gaussian dispersion modelling systems.
Acknowledgement
This work was supported and funded by TEKES SHOK/CLEEN MMEA project.
References
Johansson, L., Epitropou, V., Karatzas, K., Karppinen, K., Wanner, L., Vrochidis, S., Bassoukos, A., Kukkonen, J. and
Kompatsiaris I. Fusion of meteorological and air quality data extracted from the web for personalized environmental
information services. Environmental Modelling & Software, Elsevier, 64 (2015) 143-155.
Fig.1 A schematic figure of an air quality estimation and forecasting
system, utilizing a sensor network, regional air quality forecasts, weather
data and shipping emissions. The example output describes a selected hourly PM2.5 concentration in Helsinki, based also on local sensor
measurements.

139
MONITORING SHIPPING EMISSION REGULATIONS WITH IN-SITU MEASUREMENTS
Lisa Kattner (1,2), Barbara Mathieu-Ueffing (1,2), André Seyler (1), John Burrows (1), Stefan Schmolke (2), and Folkard
Wittrock (1)
(1) University of Bremen, Institute for Environmental Physics, Bremen, Germany; (2) Federal Maritime and Hydrographic
Agency, Hamburg, Germany
Presenting author email: [email protected]
Summary
With in-situ measurements of carbon dioxide (CO2) and sulphur dioxide (SO2) within plumes emitted from ships, it is
possible to calculate the sulphur content of the fuel the ships are using. Since January 1st, 2015, the regulations according to
MARPOL VI have limited the sulphur content within Emission control areas such as North and Baltic Sea from 1 % to 0.1
%. This change has been observed from a measurement station at the Elbe River near Hamburg harbour (Kattner et al. 2015).
Since then, a test station at this location for regular monitoring of compliance has been set up and further results from
additional measurement locations will be presented.
Introduction
In order to reduce air pollution from shipping, the International Maritime Organisation (IMO) adopted MARPOL Annex VI.
Since January 1st 2015, the allowed amount of sulphur in shipping fuel, which is responsible for SO2 emissions, has dropped
from 1% to 0.1% in Emission Control areas (ECA) such as the North Sea and Baltic Sea. This effectively excludes the use of
heavy fuel oils by ships in this area. However, there is no continuous monitoring system available to verify that ships are
complying with these new regulations. The project MeSMarT (Measurements of Shipping Emissions in the Marine
Troposphere) has been established as a cooperation between the University of Bremen and the German Federal Maritime and
Hydrographic Agency to estimate the influence of shipping emissions on the chemistry of the atmospheric boundary layer
and to establish a monitoring system for main shipping routes.
Methodology and Results
Within the project, thousands of ships have
been monitored with focus on their sulphur
fuel content, which is estimated by the ratio of
SO2 and CO2, both measured with in-situ
instruments from a measurement station at the
Elbe River near Hamburg harbour. It could be
shown that almost all ships have been
complying with the sulphur fuel content
regulation before the change in January 2015
and despite the large change in sulphur fuel
content, still 97 % are complying (see Fig.1).
Furthermore, this method can be used to
identify non-compliant ships and help
authorities to target those ships for
investigation. Additional measurements on the
island Neuwerk near the coast and on the open
sea from a research vessel are compared to
show if the distance to the coast has an effect on the fuel regulation compliance as well as to extend the methodology to more
complicated measurement situations. First results from Nitrogen oxide measurements are shown which are measured
simultaneously with SO2 and CO2 for each ship plume and which will be subject to future regulation objectives within the
Emission control areas according to MARPOL.
Conclusion
In-situ measurements of shipping emissions can effectively support the monitoring of compliance to the sulphur fuel
regulations within MARPOL IV Emission control areas. It could be shown that 97 % of all measured ships comply with the
new regulations and those that do not can be identified.
Acknowledgement
The research project which facilitated the reported study was funded in part by the German Federal Maritime and
Hydrographic Agency and the University of Bremen. The authors thank the Waterways and Shipping Office Hamburg and
the Institute for Hygiene and Environment, Hamburg, for their help and support.
References
Kattner, L., Mathieu-Üffing, B., Burrows, J., Richter, A., Seyler, A., Schmolke, S., Wittrock, F., 2015. Monitoring
compliance with sulphur content regulations of shipping fuel by in situ measurements of ship emissions. Atmospheric
Chemistry and Physics, 15, 10087-10092.
Figure 5: Sulphur fuel content of ships before and after the regulation change.
(Kattner et al., 2015)

140
RIAT+, AN INTEGRATED ASSESSMENT TOOL TO EVALUATE EFFECTIVE AIR QUALITY MEASURES AT
REGIONAL SCALE
G. Maffeis (1), M. Volta (2), P. Thunis (3), R. Gianfreda (1), F. Ferrari (1), C. Carnevale (2), E. Pisoni (3) G. Guariso (4)
(1) Terraria Srl, Milano, Italy,
(2) DIMI, University of Brescia, Italy
(3) European Commission, JRC, Air and Climate Unit
(4) DEIB, Politecnico di Milano, Milano, Italy
Presenting author email: [email protected]
Summary
RIAT+ (the Regional Integrated Assessment Tool, www.operatool.eu) has been developed in the last 5 years to support
regional/local authorities in the definition, application and evaluation of air quality plans, with the aim of reducing population
exposure to PM, NOx and O3, and to reach compliance with EU Air Quality Directive. Its main features and applications are
presented in this paper.
Introduction
Air quality in Europe is still facing continued and widespread exceedances, particularly regarding PM, NOx and O3. The EU
Air Quality Directive (2008/50) requests Member States (MS) to design local and regional plans and assess their impacts on
air quality and human health, in case of non-compliance. Managing environmental quality it is always a difficult task since it
is the result of human actions on one side and of the natural, unmanageable context, on the other side. The complexity of the
problem further increases when dealing with tropospheric pollutants, originated in the atmosphere from non-linear chemical
reactions and physical processes involving precursor emissions (VOC, NOx, NH3, primary PM and SO2). So, in recent years,
integrated assessment models (IAM) to deal with these problems have been developed at continental scale and then adapted
to the national scale.
Methodology and Results
RIAT+ system [1], partly developed during the
OPERA project (LIFE09 ENV/IT/092), is an
IAM tool designed to help regional decision
makers to select effective air pollution reduction
policies that improve the air quality, minimizing
the costs related to the application of emission
reduction technologies. It estimates:
health impacts and costs related to
mortality and morbidity due to population
exposure to PM10
CO2 emissions related to a set of policies.
Main input and output of the system are
described in the Figure.
RIAT+ has been already applied in different EU
Regions with various aims:
in Emilia-Romagna Region (IT) in the
optimization approach, to estimate the
effectiveness of measures (both technical and efficiency) to be included in the Air Quality Plan (AQP)
in Alsace Region (FR) in the optimization approach, to support the implementation of an action plan like SRCAE
(Regional Scheme on Climate, Air and Energy) identifying the most effective technical and efficiency measures
in Lombardy Region (IT) in the scenario approach, to estimate the costs and the benefits of both technical and
efficiency measures contained in the AQP (i.e. VALUTA project)
in Brussels Capital Region (BE) in the scenario approach to evaluate a reduced set of traffic and domestic heating
measures
in Porto Region (PT) in the optimization approach applied in Great Porto Area to focus the AQP on RIAT+
selected measures.
RIAT+ can be downloaded (free license) from the OPERA web-site (www.operatool.eu/download/). Finally SHERPA
project (Screening for High Emission Reduction Potential on Air currently) currently developed at JRC, is going to enable
RIAT+ tool to be used in a first guess approach, using input defined at EU level (both emissions and S/R receptor functions).
Acknowledgement
Thanks to Arpa Emilia Romagna (IT) ARPA Lombardia (IT), CNRS - Centre National de la Recherche Scientifique (FR),
Université de Strasbourg (FR), ASPA in Alsace - Association pour la Surveillance et l'étude de la Pollution atmosphérique
(FR), VITO - Flemish Institute for Technological Research (BE) and Aveiro University (PT) for their valuable contribution
and applications.
References [1] Carnevale C., Finzi G., Pisoni E., Volta M., Guariso G., Gianfreda R., Maffeis G., Thunis P., White L., Triacchini G., 2012a. An
integrated assessment tool to define effective air quality policies at regional scale. Environmental Modelling & Software 38, 306 - 315.

141
SUPPORTING DECISION-MAKING PROCESSES THROUGH POLICY ACCEPTABILITY ANALYSIS: THE
CASE OF AIR QUALITY POLICIES
M. Maione (1), E. Valeri (2), P. Polidori (1), D. Teobaldelli (1), M.L. Williams (3), V. Gatta (4) Y. Kazepov (5), V. Sergi (1)
(1) University of Urbino “Carlo Bo”, Urbino Italy; (2) European Commission Joint Research Centre, Seville, Spain; (3)
King’s College, London, United Kingdom; (4) PRAGMA Research, Rome, Italy; (5) University of Vienna, Austria
Presenting author email: [email protected]
Summary
While there is a broad consensus that public acceptability affects both the effectiveness and success of environmental
policies, still it has not been fully internalized in the econometric models used to support environmental policies’ adoption.
Special attention is devoted to air quality policies that imply a behavioural change of individuals. Exploring different quality
and quantitative approaches, we found that discrete choice analysis might offer a comparative advantage in supporting the
decision-making process in particular when the implementation process regards a behavioural policy.
Introduction
The SEFIRA (Socio Economic Implications For Individual Responses to Air Pollution Policies in EU27) EU FP7 project has
been conceived in order to support the review and implementation of the air quality legislation, improving its effectiveness
and acceptability. This task has to be achieved through the coordination of trans-disciplinary scientific and socio-economic
resources at the European scale. Air quality policies are not implemented in a social vacuum, they require a continuous
interaction with individuals, often implying significant changes in their lifestyles. Thus, the extent to which people endorse a
policy and find it acceptable is crucial in determining its effectiveness and success both at national and regional scales.
However, while there is a broad consensus that public acceptability affects both the effectiveness and success of
environmental policies, acceptability has not been fully studied and internalised in the models used to support the policies’
adoption.
Methodology and Results
In recent years, individual preferences have been increasingly used to analyse environmental aspects and, in particular,
Discrete Choice Experiments (DCEs) have become a popular stated preference method for environmental valuation since
their first application in the context of environmental resources. In the literature on DCEs, acceptability is synonymous with
preference. Accordingly, the most accepted solution is referred to as the most preferred policy alternative included in the
choice experiments. In fact, DCMs (Discrete Choice Models) investigate people’s preferences and their potential behaviour,
identifying variables affecting individual choices between two or more “choice alternatives” (M. Ben-Akiva and Lerman,
1985). They help in analysing and predicting how people’s choices are influenced by their personal characteristics and by the
available alternatives. Each alternative is described by a set of specific features, called attributes, which in turn are described
by attribute-levels. Making trade-offs between the various attributes-levels, the individual chooses the preferred alternative
that yields greatest satisfaction or ‘utility’. Within SEFIRA a choice experiment has been conceived made up by two
unlabelled policies (choice alternatives), described by selected attributes. In the DCE the social aspects related to individual
choices are taken into considerations and socio-economic data of respondents are used allowing to perform a segmentation
analysis and highlighting socio-economic differences in the air quality acceptability across the seven European countries.
Conclusions
A lack of decision-makers’ knowledge and awareness about how citizens would respond to a proposed policy can lead to
ineffective efforts and unplanned effects. Often, policy interventions are adopted without reliable forecasts of the effects of
the corresponding policy stimulus on the stakeholders. The results of our analysis are relevant in choosing measures
according to their acceptability ranking.
Acknowledgement
This project is funded by the European Union under the 7th Framework Programme; Theme: ENV 2013.6.5-2
ENV.2013.6.5-2 Mobilising environmental knowledge for policy and society Grant agreement: 603941
References
Ben-Akiva, M., Lerman, S., 1985. Discrete choice analysis: theory and application to travel demand. Cambridge, London:
The MIT Press.

142
THE FRENCH EXAMPLE OF TACKLING AIR POLLUTION FROM BIOMASS FUELS: AN ESSENTIAL
TIGHT RELATIONSHIP BETWEEN SCIENTIFIC RESEARCH AND PUBLIC POLICIES
A. Marzin, French Environment and Energy Management Agency, Air Quality Department
Presenting author email: [email protected]
Summary
While the European PM10 limit values are not complied with in 10 areas in France, studies on annual emissions show that
domestic wood-heating is the first emitting sector at a national scale. Therefore, acting on air pollutants emitted by biomass
fuels has to be a priority in order to improve air quality in our country. In order to efficiently tackle this issue, the French
Environment and Energy Management Agency (ADEME) works on strengthening the links between decision-makers,
scientists and professionals of the wood-heating industry.
Background
In France, as in many industrialized countries, increase in wood burning for domestic heating has been part of climate change
mitigation strategies. In addition to emitting very few CO2, biomass is locally abundant in many French territories, is a cheap
energy for households and represents 60 000 jobs in France. However, in the early 2000s, first scientists alerted ADEME on
potential negatives impacts of this renewable energy on air quality, especially in the Arve valley in the French Alps, where
the scientific program POVA showed an unexpected high participation of biomass burning to PM10 local concentrations.
Studies on emissions completed these results revealing that 98% of wood-heating PM10 emissions came from individual
systems. On the main time, great improvements had been made on technologies, especially with the development of the
French “Flamme verte” label, putting on the market efficient individual wood-heating systems that emitted much less
pollutants and had greater energy efficiency.
In France, domestic wood-heating currently emits 29% of PM10, 42% of PM2,5 and 67% of PAHs. These national emissions
trends are confirmed in 9 of the 10 French areas that do not comply with the European regulation on PM10 limit values, as
well as by local concentrations measures: in some areas and at certain times of year, biomass burning can be responsible of
more than 50% of the PM10 concentrations. Therefore, acting on air pollutants emissions from biomass fuels has to be a
priority in order to improve air quality in France.
Proposal for the presentation content
The presentation will illustrate the essential two-way relationship between scientific work and policy making, focusing on
how ADEME works with all wood-heating stakeholders (researchers, decision-makers, professionals, citizens…) in order to
reduce the negative impacts of biomass burning on air quality, while supporting the development of this attractive sustainable
energy when efficient. In doing so, it will address the main strategic stakes of that topic:
- Improving knowledge on the actual air quality impacts of wood-heating (progresses on emission factors including primary
and secondary pollutants, measures based on actual households use of wood-heating systems instead of official
protocols…) and the different households practices (in terms of wood humidity and species, ways of starting a fire…) ;
- Improving technologies by developing efficient wood-heating systems (example of the French label “Flamme verte”) ;
- Improving fuel quality by creating a network of quality wood supply (example of the French label “France bois bûche”)
and by strengthening public awareness ;
- Guaranteeing best practices among professionals by creating qualified professionals networks (example of the French
certification “Reconnu garant de l’environnement”) ;
- Designing efficient policies to reduce emissions from the fleet of individual wood-heating systems, acting both on
technologies and changing behaviours and social practices. To illustrate that point, the pilot operation in the Arve valley
(2013-2017) will be presented. It aims to reduce by 25% the local PM10 emissions of that source, by financially supporting
households to replace their inefficient wood-heating systems (open fireplaces and stoves built before 2002) by the most
efficient products available (5 stars “Flamme verte”). Communication campaigns to raise public awareness on the best
practices and strengthening the network of local stakeholders are also part of this operation. A scientific evaluation
(impacts on air quality and on local economy as well as studies on social determinants) is currently running and will be
introduced. This evaluation shall be of great interest for the future of public policy-making in that field. Based on the
success of the Arve valley fund, the French government mandated ADEME to reproduce this experience in other French
territories.
References
ADEME, 2015. Bois énergie et qualité de l’air – les avis de l’ADEME.
CITEPA, 2015. Inventaire des émissions de polluants atmosphériques et de gaz à effet de serre en France – format SECTEN.
Jaffrezo J-L and al., 2005, Pollution des vallées alpines – rapport final. Programme PRIMEQUAL 2 / PREDIT.

143
MODELED TRENDS IN BACKGROUND OZONE FOR THE UNITED STATES OVER FIVE DECADES FROM
1970 TO 2020
Uarporn Nopmongcol (1), Naresh Kumar (2), Jaegun Jung (1), and Greg Yarwood (1)
(1) Environ International Corp, 773 Bel Marin Keys Blvd Novato, CA 94998, USA; (2) Electric Power Research
Institute (EPRI), 3420 Hillview Ave, Palo Alto, CA 94536, USA
Presenting author email: [email protected]
Summary
In this study we conduct modelling experiments to show how the US Background ozone may have changed over time from
1970 to 2020. The purpose of the study is to investigate the effect of changing anthropogenic emissions outside the U.S. on
the background ozone and how that might impact the policy decisions regarding attainment of ozone standards.
Introduction
Estimates of the US Background (USB) for ozone (O3) are critical inputs to the regulatory process for setting and
implementing National Ambient Air Quality Standards (NAAQS) for ozone in the United States. USB is defined as the O3
concentration in the absence of anthropogenic O3 precursor emissions from the US. Analyses of trends in O3 at rural locations
near the west coast find that background O3 is rising in response to increasing emissions outside the US over recent decades
(Parrish et al., 2012).
Methodology and Results
First we used a global CTM, GEOS-Chem, to model global ozone and for several years between 1970 and 2020. The 2005
meteorology was used from the Goddard Earth Observing System Model, Version 5 (GEOS5). We developed year-specific
anthropogenic emissions for all source categories and conducted GEOS-Chem simulations for the years 1970, 1980, 1990,
2000, 2005 and 2020. We then used a regional CTM, CAMx, to simulate regional ozone within the continental United States
for the same years as the GEOS-Chem simulations, the results of which were used to provide boundary conditions to the
CAMx model. For the CAMx simulations we zeroed out the U.S. anthropogenic emissions to obtain the USB concentrations
of ozone.
Over five decades, from 1970 to 2020, estimated USB for the annual fourth highest maximum daily 8‐hour average O3
(H4MDA8) in the western US increased from mostly in the range of 40-55 ppb to 45-60 ppb, but remained below 45 ppb in
the eastern US. USB decreased in the northeast US after 1990 follow declining Canadian emissions. Figure 1 shows predicted
USB ozone for five representative cities in the USA. Background ozone concentrations in the western U.S. cities (Denver,
Los Angeles, and Phoenix) have been rising from 1970 and are predicted to continue to rise from 2005 to 2020, whereas
Philadelphia shows a decline after 2000 and Atlanta shows flattening of background ozone from 2005 to 2020.
Conclusions
In summary, U.S. background ozone concentrations have been steadily increasing in the western U.S., and is predicted to
continue to increase in the future due to rising emissions from Asia and Mexico. This has implications for increased difficulty
of attaining the revised ozone standards in the U.S., and must be taken into account.
References
Parrish, D. D., et al., 2012, Long-term changes in lower tropospheric baseline ozone concentrations at northern mid-latitudes,
Atmos. Chem. Phys., 12, 11,485–11,504, doi:10.5194/acp-12-11485-2012
Figure 1. 4th Highest Daily Maximum 8-hour Ozone Concentrations at Five Major U.S. Cities
30
50
70
1970 1980 1990 2000 2005 2020
pp
b
Year
US-background H4MDA8 ozone concentration at 5 major US cities
Denver
Los Angeles
Phoenix
Philadelphia
Atlanta

144
ENVIRONMENTAL ASSESSMENT OF LAST-MILE LOGISTIC OPTIMIZATION STRATEGIES
C. Pozzi (1), A.Nanni (1), E. Seregni (2)
(1) ARIANET srl, Milano, Via Gilino 9, Italy
(2) Project Automation S.p.A., Monza, Viale Elvezia 42, Italy
Presenting author email: [email protected]
Summary
This study aims to evaluate the effectiveness of different strategies involving last-mile logistic in urban areas. By means of
traffic, emission and atmospheric dispersion models it was possible to quantify the environmental effects of freight
transportation in city centres of two Italian cities, exploring the potential of different policies and scenarios in reducing the
impact of this human activity on air pollution levels.
Introduction
Air pollution levels strongly influence well-being and life quality in urban areas, therefore municipal policies aim to
increasingly act on sectors mainly responsible of pollutant emissions, like road traffic. Within it, commercial vehicles
represent a key factor: the concentration of human activities rises the need of goods delivery, causing also obstructions in
traffic circulation and increased rates of fuel consumption and pollutants releases due to vehicles weight and dimension. In
2014 a network of SMEs and Research centres promoted Opti-LOG project (http://www.optilog.it/en/home-eng.html) in
Lombardy region (N Italy), promoting a system for monitoring
sustainable mobility solutions concerning last-mile logistic and
investigating their environmental effects, quantified in terms of
emissions savings and related advantages on pollutants concentrations.
Methodology and Results
The assessment follows a “bottom-up” method, starting from the
characterization of the current situation in freight distribution for two
Lombard cities, Milano and Cremona, whose municipality were partners
of the project, being interested in exploring effects of new policies.
Alongside, the state-of-art alternatives in duty distribution involving
fleet changes, selective circulation bans, interchange facilities or other
experimental solutions like pack-stations and smart-platforms were
quantified in terms of transport modifications on every link of the city
road network. Then for each scenario the assessment of changed
vehicles emissions, by means of models based on official EU
methodologies (COPERT and HBEFA) of on-road emission factors for
toxic and greenhouse gases. These data finally fed air dispersion models,
together with meteorological data and detailed urban structure
information. The analysis was focused on two different spatial scales,
using different dispersion models: the whole historical center of
Cremona, employing a Gaussian model, and a smaller domain including
few street of Milano city centre, over which a micro-simulation was
carried out by means of a Lagrangian model (SPRAY) including
obstacles effects. Simulation results allowed to evaluate the absolute and
relative improvements on air quality levels, pointing out that optimal
logistic management in experimental area can lead to a reduction of
pollution from duty vehicles up to 40% in case of trips optimization or
20% introducing pack-stations in Cremona historical centre, with respect
to the business-as-usual scenario.
Conclusions
This work assessed the impact on traffic flows, emissions and air concentration of different last-mile logistic solutions. The
combined use of traffic, emission and dispersion models in evaluating the effectiveness of alternative transport scenarios
involving freight distribution and their contribution to urban air quality, allows to provide scientific bases for supporting
decision makers in choosing the best urban development planning, evaluating the alternatives, quantifying their effects, and
delineating their spatial extents.
Acknowledgement
Opti-LOG was cofunded by Regione Lombardia, Smart Cities and Communities call for proposals.
References
Gkatzoflias D., Ntziachristos L., Samaras Z. (2007). COPERT 4 Computer programme to calculate emissions from road
transport - Users Manual. ETC-ACC (European Topic Centre on Air Air and Climate Change).
Tinarelli G. et al.(2013) Analysis of the Differencies Between Pollution Levels Into a New and an Old District of a Big City
Using Dispersion Simulations at Microscale. 33rd NATO/SPS International Technical Meeting (ITM) on Air Pollution
Modeling and Its Applications, Miami, FL, US, August 26-30, 2013.
Fig.2 Vertical decay of NOx concentration in urban
canyon estimated with micro-scale simulation (Milano)
Fig. 1 Cremona road network assigned with commercial
vehicles fluxes

145
SCALE ISSUES IN REGIONAL AIR QUALITY MODELING FOR POLICY SUPPORT
S.T. Rao (1,2), C. Hogrefe (3), M. Astitha (2), H. Luo (2), and R. Mathur (3)
(1) North Carolina State University, Raleigh, NC, USA; (2) University of Connecticut, Storrs, CT, USA; (3)
U.S. Environmental Protection Agency, Research Triangle Park, NC, USA
Presenting author email: [email protected]
Summary
This study examines the issues relating to the use of regional photochemical air quality models for evaluating their
performance in reproducing the spatio-temporal features embedded in the observations and for designing emission control
strategies needed to achieve compliance with the relevant air quality standards. It is well known that various atmospheric
processes, operating on different time and space scales, affect the pollutant concentration levels (Hogrefe et al., 2008). In this
study, we apply a spectral decomposition method to observed and modeled pollutant concentration time series spanning a 21-
year period from 1990 to 2010 for discerning the scales of most interest for policy-making. The results reveal that the long-
term component (i.e. the sum of seasonal and inter-annual variations) and the synoptic component (i.e. weather-induced
variations) are particularly relevant to the air quality management decisions.
Introduction
In the United States, regional-scale air quality models are being used to determine the emission reduction needed to comply
with the national ambient air quality standards (NAAQS) for ozone and fine particulate matter. To address the ozone non-
attainment problem, regional models are applied for an ozone season or less to determine the top ten percent of modeled
ozone concentrations for the base case scenario. Then, emissions are reduced to assess how these high ozone concentrations
change in response to various emission reduction options. The relative change in the modeled high ozone concentrations for
different emissions control scenarios is then applied to the observed design value (i.e. the 4th highest ozone concentration)
until the estimated design value is in compliance with the ozone NAAQS. The focus on episodic high modeled days in the
regulatory application provides the motivation for this study, i.e., to gain a better understanding of the key processes and time
scales controlling episodic events as well as the time scales most affected by emission reduction policies.
Methodology and Results
We applied the Kolmogorov-Zurbenko (KZ) filtering (Rao et al., 1997) to the time series of observed and CMAQ-simulated
ozone concentrations to separate the long-term forcing (seasonal and inter-annual variations) and short-term forcing (intra-
day, diurnal, and synoptic variations). The following figure illustrates the long-term variation (baseline) embedded in ozone
time series for two years with substantial changes in emissions loading.
These four plots display the ozone levels at Beltsville, MD, for 1994 and 2009, two years distinguished by large differences
in emission loading. Ozone levels were very high in the summer of 1994, with 63 days exceeding 75 ppb; this is because the
baseline was very high. Given the same baseline but the weather conditions (synoptic forcing) that prevailed in 2009, also
reveals the prevalence of high ozone levels, with 62 days exceeding 75 ppb (Plot c). Note, ozone levels were substantially
reduced in 2009; a large decline in the baseline resulted in only 10 days exceeding the 75 ppb threshold (plot b). Given the
2009 baseline and the synoptic variation that prevailed in 1994, ozone exceeded 75 ppb on only 13 days (Plot d). For the
present study, we extend this preliminary work to 21 years of both observed and CMAQ- simulated ozone time series data.
Conclusions
Emission control policies focus primarily on reducing the emissions burden over longer time scales. Results of this study
clearly demonstrate that regional air quality models are most useful for evaluating the baseline (i.e. seasonal and long term
forcing) reduction needed to comply with the relevant NAAQS. Integrated observational-modeling approaches are needed
for the purposes of air quality forecasting, regulatory policy-making, and health risk assessments.
Acknowledgement
Although this work was reviewed and approved for publication by the U.S. Environmental Protection Agency, it does not
necessarily reflect Agency’s views or policies. Two of the authors (MA, HL) gratefully acknowledge EPRI’s support for this
project.
References
Hogrefe, C., J.-Y. Ku, G. Sistla, A. Gilliland, J.S. Irwin, P.S. Porter, E. Gégo, and S.T. Rao, 2008: How has model
performance for regional scale ozone simulations changed over the past decade?, In Air Pollution Modeling and its
Application XIX, C. Borrego and A.I. Miranda (Eds.), Springer, pp. 394 – 403.
Rao, S.T., I. G. Zurbenko, R. Neagu, P. S. Porter, J. Y. Ku, and R. F. Henry, 1997: Space and Time Scales in Ambient Ozone
Data. Bull. Amer. Meteor. Soc., 78, 2153–2166.

146
FORECASTING AND ANALYSIS OF PM2.5 EPISODES AFFECTING THE UK - CONTRASTING LOCAL AND
REGIONAL INFLUENCES
V. Singh (1,2) and R. S. Sokhi (1)
(1) Centre for Atmospheric and Instrumentation Research (CAIR), University of Hertfordshire, Hatfield, Hertfordshire, AL10
9AB, United Kingdom; (2) National Atmospheric Research Laboratory, Gadnaki, AP, 517112, India
Presenting author email: [email protected], [email protected]
Summary
A WRF-CMAQ based air quality forecasting (AQF) system has been developed at the University of Hertfordshire (supported
by NCAS). A 72 hours forecast of particulates and gaseous pollutants have been performed on multiple grids. The emissions
are based on the TNO inventory, which consists of anthropogenic emissions which are processed using SMOKE. MEGAN is
used to process biogenic gas emissions. Air quality forecast has been evaluated for year 2014 to test the performance of the
forecasting system. Measurement datasets from Automatic Urban and Rural Network (AURN) have been used to conduct
discrete and categorical forecast verifications. Special emphasis has been given on fine particulate matter (PM2.5)
concentrations and ozone. While the AQF system is able to capture the temporal variation of the particulate matter episodes,
it tends to underpredicts peak concentrations. It has been found that the urban PM2.5 forecast tends to be more biased than
the rural one. An analysis has been conducted to understand the evolution of particulate matter episodes across UK in 2014.
The associated uncertainties in the forecasts are analysed in terms of the representation of boundary layer mixing processes,
potentially missing emissions and chemical reaction rates for secondary pollutants.
Introduction
Ambient air quality is still a major problem in Europe because of adverse health impacts due to exposure to pollutants
exceeding the EU limit. In order to follow EU guidelines and prevent critical exposure, real time forecast has to be provided.
There is an increasing use of advanced meteorological and chemistry transport models to produce air quality forecasts.
Although weather forecasting has a long history, the field of air quality forecasting is relatively new (Kukkonen et al., 2012).
Over the last decade, there are significant developments in numerical weather prediction and chemistry transport modelling;
and improvements in emission inventories and chemical boundary conditions (eg: MACC). This work presents a WRF-
CMAQ based forecasting modelling system to investigate the causes of high air pollution episodes such as anticyclonic
conditions, long range transport and entrainment of secondary air pollutants and to improve modelling capabilities to forecast
air quality over urban to regional scales.
Methodology and Results
The AQF modelling system is based on CMAQ for chemical
transport, WRF model as the meteorological driver. The forecast
is set to run on multiple grids using one-way nests down from a
European domain with 50km grid size to a UK domain with
horizontal resolution of 10 km with 24 vertical levels up to 10
hPa. The emissions are based on the TNO inventory, which
consists of anthropogenic emissions which are processed using
SMOKE. MEGAN is used to process biogenic gas emissions.
Meteorological initial (ICs) and lateral boundary conditions
(BCs) of the outer domain are derived from the National Centers
for Environmental Prediction (NCEP) GFS data. The chemical
boundary conditions for CMAQ simulation will be derived from
MACC-II. The simulated concentrations are in good agreement with the measurements across UK. The analysis of episodes
suggests that there are two major episodes during 2014 when the PM2.5 concentration exceeded 50 μg/m3. Lower PBL height
and wind speeds were simulated and observed during these episodic events. The similar chemical composition of PM2.5
during episodes at urban and rural locations suggests the contribution of long range transport. The episode which occurred
near 11-14 March 2014 is mainly dominated by nitrate aerosols originating from Eastern Europe. The second episode 31
March-04 April 2014 shows maximum contribution from the dust aerosols arising from the Sahara region.
Conclusions
A WRF-CMAQ based operational AQF system has been developed to provide near real time short term forecast across UK.
Daily forecast has been compared with AURN network show satisfying agreement in terms of statistical indexes. While the
AQF system is able to capture the temporal variation of the particulate matter episodes, it tends to under predicts peak
concentrations. Urban PM2.5 forecast tends to be more biased than the rural one. The evolution of episode can be attributed
to lower PBL height, wind speed and contribution from long range transport sources. The analysis suggest that some of the
episodes were dominated by nitrate aerosols which are chemically produced due to ammonia emissions and some episodes
show contribution of the dust aerosols arising from the long range transport from the Sahara region.
Acknowledgement
This work was supported by NCAS.
References Kukkonen, J., Olsson, T., Schultz, D. M., Baklanov, A., Klein, T., Miranda, A. I., Monteiro, A., Hirtl, M., Tarvainen, V., Boy, M., Peuch, V.-H., Poupkou, A., Kioutsioukis, I., Finardi, S., Sofiev, M., Sokhi, R., Lehtinen, K. E. J., Karatzas, K., San José, R., Astitha, M., Kallos, G.,
Schaap, M., Reimer, E., Jakobs, H., and Eben, K., 2012: A review of operational, regional-scale, chemical weather forecasting models in
Europe, Atmos. Chem. Phys., 12, 1-87, doi:10.5194/acp-12-1-2012.
Figure 6: Composition of PM2.5 during episodes

147
SHORT TERM ACTIONS FOR ABATEMENT OF NO2: TRAFFIC AND AIR QUALTIY MODELING
I. Sundvor (1), T. W. Haug (2), B.A. Høiskar(1), G. Sousa Santos (1)
(1) NILU-Norwegian Institute of Air Research, PO BOX 100, 2027 Kjeller, NORWAY; (2) Urbanet Analyse AS, PO BOX
337 Sentrum, 0101 Oslo, Norway
Presenting author email: [email protected]
Summary
Norway is still not in compliance with the EU limit values and needs to apply more measures to reduce air pollution. In this
paper we do a comparison of examples of short term actions for reducing exceedances of the NO2 hourly limit value in the
city of Oslo. We used a traffic model and a dispersion model to estimate the effect of each measures. All measures gave a
reduction in NO2 levels, but will likely not be enough in strong inversion episodes.
Introduction
Urban air pollution is a challenge in several European cities. For most Norwegian cities the major challenge is the reduction
of the NO2 annual mean to comply with the limit value, but also too many high NO2 hourly values do occur during strong
inversions in cold winter periods. Such an event do not happen every year, but when it does the number of hours above 200
µg/m3 quickly passes the legal limits of 18 and has reached up to more than 200 hours. Norway was summoned by ESA for
air quality breaches and judged guilty by EFTA in September 2015. The legal process led to extra pressure on finding
effective short-term as well as long-term measures in Oslo and other cities in Norway. In Oslo the main source of the NO2
concentrations is diesel exhaust and hence the proposed short-term measures are targeting traffic.
Methodology and Results
Several examples of short-term measures were modelled for Oslo and surrounding areas. The 10 measures are variations of
bans and sharply increased tolls, also including the proposal of temporary free public transport. The effect on traffic was
evaluated with the use of a Regional Transport Model (RTM 23+) which is a transport and travel demand model calibrated
with the Norwegian Travel Survey. The results from the traffic model, giving change in traffic volumes, were used as input to
the Air Quality modelling system AirQUIS/Episode (Slørdal et al. 2008). The results from the example calculations were
analysed in terms of relative reductions of NO2 compared to the reference case. This was done for a week with high NO2
levels, at several receptor points at traffic sites.
Most measures including an increase in the toll, up to more than 30 Euros,
effectively reduced traffic over the toll passages, but increased the traffic
inside and outside of the perimeter delimited by the tolls. The NO2 reductions
of the highest hours were estimated to be 4-24 % at the selected sites.
Introducing a ban in a zone covering the central area of Oslo for diesel
passenger cars gave a traffic reduction both inside and outside the zone and
reduced NO2 levels by 7-22%. Introducing a ban for older heavy duty vehicles
(Low emission zone) as a permanent measure in combination with a short-
term measure for light vehicles gave good results assuming Euro VI do have
low emissions also in real driving. The effectiveness of a ban is hugely
dependent on the sanctions for breaking it. On the other hand, only talk of
introducing a diesel ban might already have changed people’s car purchase as
diesel fractions have decreased the last years. So even if short-term measures
will not affect the annual mean directly such behavioural changes might.
Previous studies have shown that traffic must be reduced to reach the annual
limit value, which in return will decrease the need of short-term actions.
We will describe the examples of measures and present both effects on traffic
and air quality. We will further discuss the limitations and challenges of introducing measures using the situation of Oslo as a
case study.
Conclusions
Short term measures have to be severe in Oslo for preventing exceedances according to the EU legislation in years with
episodes of strong inversions. All measures tested in this study will improve the air quality and hence protect a larger part of
the urban population from negative health effects, but without any further measures there will still be risk of braking the
hourly limit value.
Acknowledgement
This work was supported by Norwgian Public Road Administraions (NPRA). We acknowledge the working group, Oslo
municipality and TØI- The Institute of Transport Economics for valuable discussions and input to the project.
References
Slørdal, L.H., McInnes, H., Krognes, T. (2008) The Air Quality Information System AirQUIS. Info. Techn. Environ. Eng., 1,
40-47
Fig.1 Relative reductions of NO2
concentrations (in percent) for some of the modelled short-term measures, given at
several road site receptors.

148
CHINA’S REVISED AIR QUALITY INDEX (AQI) COMPARED TO OTHER AQI-S
S. van den Elshout (1), L. Blyth (2), Lei YU (3), Wei LIU (3), N. Veldeman (2)
(1) DCMR Environmental Protection Agency Rijnmond, Schiedam, the Netherlands; (2) VITO Flemish Institute for
Technology Research, Mol, Belgium; (3) CAEP (Chinese Academy for Environmental Planning), Beijing, China.
Presenting author email: [email protected]
Summary
China revised its air quality standards and its AQI in 2012. Air quality data is currently being published in real-time. We
compare the new Chinese AQI to several other AQI-s from across the world by applying the AQI to unvalidated Chinese air
quality data (obtained from online sources). Comparing different AQI-s is complicated as they differ widely in concept and
tend to use different scales and averaging times. We devised criteria that allow us to make a semi quantitative comparison of
different AQI-s if they were used in China. Secondly we look at the way the hourly PM AQI is implemented.
Introduction
Facing major challenges China revised its air quality legislation (amongst others): the national ambient air quality standard
(NAAQS): GB3095-2012, and the accompanying Technical Regulation on the Air Quality Index (AQI) (HJ633-2012 – on
trial). Real-time monitoring data is published by the Chinese authorities as well as non-government websites and apps. The
latter tap the official Chinese websites to obtain data. One of these sources was used to obtain a time-series of unvalidated
hourly air quality data. Time-series of monitoring data are not generally available for study purposes. The Chinese public had
demanded an update of the old air pollution index (API) and was critical about the new AQI. The AQI, still on trial,
underwent a further change in 2014 when the authorities started to publish hourly PM sub-indices (previously a 24-hour
moving average was used). The use of hourly PM data (on trial) is an improvement and innovation of the AQI. However, the
way in which it is currently implemented in China leads to inconsistencies in the communication.
Comparing AQI-s
AQI-s are a communication tool: making complex data understandable to the public and providing behavioural advice. AQI-s
are often linked to the prevailing air quality conditions: hence many different AQI-s exist and an AQI is not automatically
suitable in another context. From a communication point of view an AQI needs to change from time to time, else message
fatigue will occur and people will neglect the information. AQI-s can be compared by their calculation methodology and the
breakpoints between their bands. As averaging times for pollutants tend to differ, this kind of comparison is not
straightforward. Chinese monitoring data were used to calculate several different AQI-s. To compare the results the AQI
classes were divided in three groups: good/no health warning; classes with behavioural advice; the highest class. Frequencies
were calculated for each group. Also the ratio of the average AQI result to the highest AQI class was calculated. See table 1.
The Chinese and US AQI-s mainly differ at the lower end of their scales. The UK AQI, the CAQI and the HongKong AQI
are certainly more appropriate in areas with less air pollution. All AQI-s point to PM as the most relevant pollutant;
according to the US AQI it would be mainly PM2.5 whereas using the Chinese and UK AQI PM10 would dominate.
Table 1: Comparing different AQI-s: frequencies (%) of the state of the AQI (five city sample)
Criteria China hourly China Daily US UK HongKong CAQI
No health warning 68 60 33 13 21 n.a.*
Some, to severe health warnings 32 40 67 38 75 n.a.*
Maximum AQI class or above 0 0 0 49 9 21
Average AQI result/highest AQI class 0.19 0.21 0.26 0.90 0.73 0.78
Averaging times for PM
If providing behavioural advice is an objective, timely information is important. Information based on 24-hour moving
averages arrives late and might not reflect the perceived air quality. The Chinese public occasionally complained that
pollution was visible (haze) while reported AQI readings were still low (and vice versa). Hence, in 2014 the authorities
started issuing AQI calculations based on hourly PM concentrations. Other recently updated AQI-s use shorter averaging
times for PM as well (a.o. Canada, HongKong, the Netherlands). However, China uses the same AQI calculation grid for
hourly and daily PM readings, ignoring the lognormal nature of the concentration distribution. Occasionally very high hourly
PM AQI values occur, which are subsequently not reflected in the official daily report (using daily average measurements).
Conclusions
China has updated and modernised its air quality information supply by introducing a new AQI. The Chinese AQI calculation
grid (on trial) reflects the current air quality situation in China and hence differs from AQI-s from countries with lower air
pollution (US, Europe). The use of hourly PM monitoring values for AQI communication (on trial) is state of the art, though
its implementation could be improved and made more consistent with the daily AQI report.
Acknowledgement
This work was part of the AirINFORM project which was cofounded by EuropeAid (contract DCI-ASIE/2012/299-560).
Reference (supplementary information)
Van den Elshout. 2014.
www.researchgate.net/publication/282672962_The_Chinese_AQI_applied_to_Chinese_air_quality_data

149
FUGITIVE DUST: A REVIEW OF SUSPENSION PROCESSES AND CONTROL MEASURES
J.G. Watson (1), J.C. Chow (1), X.L. Wang (1), J. A. Gillies (1), V. Etyemezian (1)
(1) Desert Research Institute, Reno, Nevada, USA, 89512
Presenting author email: [email protected]
Summary
Minerals from fugitive dust constitute important fractions of PM10 and PM2.5. These emissions result from both mechanical-
and wind-generated forces. Fugitive dust emission factors are inaccurate, and emission inventories commonly overestimate
these emissions. Practical emission control measures include paving surfaces, decreasing trackout from unpaved to paved
surfaces, minimizing surface disturbances, applying suppressants, and constructing wind barriers.
Introduction
Fugitive dust (Watson et al., 2000) refers to small particles of geological
origin that are suspended into the atmosphere from non-ducted emitters.
Mining pits, open fields and parking lots, paved and unpaved roads,
agricultural fields, construction sites, unenclosed storage piles, and
material transfer systems are the major sources of fugitive dust. Large
dust plumes are often noticed over these sources when wind speeds are
high or when vehicles are moving. These visible plumes do not
necessarily correspond to significant amounts of PM10 or PM2.5 (particles
with aerodynamic diameters less than 10 µm and 2.5 µm, respectively)
measured by nearby air quality monitors. Fugitive dust emissions
depend on particle sizes, surface loadings, surface conditions, wind
speeds, atmospheric and surface moisture, and dust-suspending
activities. Emission rates and control measures are also closely related to
these properties. Little is known about the PM10 and PM2.5 in surface
dust deposits as these fractions are too small to be determined by simple
sieving methods. Modern technology allows these emissions to be better
characterized.
Methodology and Results
Portable wind tunnels (Fig 1) can be equipped with continuous PM size
monitors, such as the DustTrak DRX, to obtain real-time measurements
as a function of wind speed for various surfaces. Figure 2 illustrates
typical results from such an experiment. The monitors can also be
mounted in a vehicle with the inlet next to the tire to evaluate mechanical
suspension potential on roadways as a function of vehicle speed. This
technique identifies hot-spots, such as trackout from unpaved areas onto
paved roads. Trackout is a major fugitive dust source, as the traffic
grinds this dust to smaller particles, and transports it down the roadway
via vehicle wakes. Mitigation measures include: 1) reducing suspendable
dust reservoirs, 2) preventing its deposit, 3) stabilizing it, 4) enclosing it,
and 5) reducing the
activities that suspend it. These methods are applied with various degrees
of effectiveness and diligence. Surface watering is often applied on
disturbed land such as construction sites or unpaved surfaces to reduce
particle resuspension by vehicles. The application of chemical
suppressants and vegetation to unpaved surfaces is effective under some
circumstances, but not under others. Increasing the surface roughness reduces wind shear at the surface, which also lowers
suspension potential. Normal brush sweepers often raise more dust than
they collect. Vacuum sweepers are more effective for dust control, and several U.S. air quality districts have specified
collection efficiency tests that are required for emission reduction credits.
Conclusions
Fugitive dust is a large PM contributor, but effective control technologies exist to minimize its emissions.
References
Etyemezian, V.R., Nikolich, G., Ahonen, S., Pitchford, M.L., Sweeney, M., Purcell, R., Gillies, J.A., Kuhns, H.D., (2007).
The Portable In Situ Wind Erosion Laboratory (PI-SWERL): A new method to measure PM10 potential for windblown dust
properties and emissions. Atmos. Environ 41, 3789-3796.
Wang, X.L., Chow, J.C., Kohl, S.D., Yatavelli, R.L.N., Percy, K.E., Legge, A.H., Watson, J.G., (2015). Wind erosion
potential for fugitive dust sources in the Athabasca Oil Sands Region. Aeolian Research 18, 121-134.
Watson, J.G., Chow, J.C., Pace, T.G., (2000). Fugitive dust emissions, in: Davis, W.T. (Ed.), Air Pollution Engineering
Manual, Second Edition, 2nd ed. John Wiley & Sons, Inc., New York, pp. 117-13
Fig.2 Fugitive dust emission fluxes as a function of
wind speed (at 10 m AGL) for different surfaces in northern Alberta, Canada (Wang et al., 2015). These
can be coupled with land use maps and measured or
modelled wind speeds to provide more realistic
estimates of annual emissions.
Fig.1. The Portable In Situ Wind Erosion Laboratory
(PI-SWERL, Etyemezian et al., 2007), is used to
determine the windblown fugitive dust suspension potential of erodible surfaces. It is also used to
evaluate control strategy effectiveness.

150
SUPPORTING NATIONAL AIR QUALITY POLICIES WITH A CHEMICAL TRANSPORT MODEL: THE
ITALIAN EXPERIENCE WITH THE MODELLING SYSTEM MINNI
G. Zanini, M. Adani, G. Briganti, A. Cappelletti, L. Ciancarella, G. Cremona, I. D’Elia, M. D’Isidoro, M. Mircea, A.
Piersanti, G. Righini, G. Vialetto, L. Vitali
Atmospheric Pollution Laboratory, Italian National Agency for New Technologies, Energy and Sustainable Economic
Development (ENEA), Bologna, via Martiri di Monte Sole 4, 40129, Italy;
Presenting author email: [email protected]
Summary
This paper describes the development of the MINNI modelling system for Italy, centered on the Chemical Transport Model
FARM, developed by Arianet S.r.l. (Kukkonen et al., 2012), aimed to provide the Italian Ministry of Environment with a tool
able to link policy and atmospheric science. Starting from 2002, there have been many applications of the system supporting
policy decisions at different level: international negotiations (revision of the Gothenburg protocol; revision of the Thematic
Strategy on Air Pollution, etc.); air quality state and trends on Italian domain in different years; support to regional
administrations in charge of developing abatement measures and related plans; supporting data for requests to postpone
deadlines for national compliance with limit values of Directive 2008/50/EC (source apportionment, air quality scenarios),
and cost-effective analysis.
In recent years the model was applied to the design of the Italian Special Purpose Stations Monitoring Network (Italian
Legislative Decree 13/08/2010, n.155 for the compliance with Directive 2008/50/EC) having extended POPs and Hg gas-
phase chemical mechanism in FARM.
In this context, particular attention was dedicated to the development of methods to identify Spatial Representativeness (SR)
of air quality monitoring stations in terms of size and shape. A presentation of the SR method based on CTM model
simulations is given here.
Introduction
SR area of monitoring stations, allowing to extend the information retrieved in a site to a wider area surrounding it, is a
relevant issue in air quality assessment. From 2014, provisions for official reporting of air quality measures to EU request
Member States to provide a SR information for each reported station. According to scientific literature, the SR of a
monitoring site is related to the variability of concentrations around the site, so its assessment has to be based on additional
air quality data. CTM results are a cost-effective approach because models are fully capable to take the main atmospheric
pollutant processes into account with wide spatial coverage. We developed and applied a plain original method to assess SR,
based on MINNI data base time series analysis.
Methodology and Results
The CSF (Concentration Similarity Frequency) tool developed by ENEA for SR assessment (Piersanti et al., 2015) is based
entirely on MINNI data base, exploiting the completeness of a CTM with national coverage in Italy, hourly concentrations on
many reference years, calculation of all regulated pollutants, state-of-art description of atmospheric physical and chemical
dynamics, solid validation.
The implemented procedure recursively compares model concentration time series at the site of interest and at each grid point
in the model computation domain. The percentage difference between concentration values is compared with a threshold and
a frequency function, fsite(x,y), is so defined for the site of interest, counting positive occurrences of “concentration
similarity” at each grid point. According to Nappo et al., 1982, the representativeness area of each site of interest is finally
assessed as the area where the condition fsite(x,y)>0.9 is verified. A geo-referred data base has been finally realised,
describing SR areas for each site and each pollutant.
Conclusions
The application of the CSF approach, within the context of the design of the Italian Special Purpose Stations Monitoring
Network, evidences the reliability of the use of CTM results to detect the spatial representativeness by means of an advanced
statistical formulation. Such work is likely to be of interest for official air quality reporting to EU, for appropriately designing
new monitoring networks and for the improvement of exposure estimates.
Acknowledgement
This work is part of the Cooperation Agreement for the starting up the Italian National Network of Special Purpose
Monitoring Station, funded by the Italian Ministry for Environment and Territory and Sea, which the authors wish to thank
also for providing AMS-MINNI project results.
References
Kukkonen J. et al., 2012. A review of operational, regional-scale, chemical weather forecasting models in Europe.
Atmospheric Chemistry and Physics, 12 (1), pp. 1-87.
Nappo C. J. et al., 1982. The Workshop on the Representativeness of Meteorological-Observations, June 1981, Boulder,
Colorado. Bulletin of the American Meteorological Society 63, 761–764.
Piersanti A., Ciancarella L., Cremona G., Righini G., Vitali L., 2015. Spatial representativeness of air quality monitoring
stations: a grid model based approach. Atmospheric Pollution Research, doi 10.1016/j.apr.2015.04.005, in press

151
SPECIAL SESSION – CLIMATE CHANGE AND HUMAN
HEALTH

152

153
VARIABILITY IN TEMPERATURE-RELATED MORTALITY PROJECTIONS UNDER CLIMATE CHANGE
Tarik Benmarhnia
Institute for Health and Social Policy, McGill University Montreal, QC, Canada
Mailing address: Institute for Health and Social Policy, McGill University. Meredith, Charles, House, 1130 Pine Avenue
West Montreal, Quebec H3A 1A3, Canada. Tel: +15146384393
Presenting author email:: [email protected]
Background
Most studies that have assessed impacts on mortality of future temperature increases have relied on a small number of
simulations and have not addressed the variability and sources of uncertainty in their mortality projections.
Objectives
We assessed the variability of temperature projections and dependent future mortality distributions, using a large panel of
temperature simulations based on different climate models and emission scenarios.
Methods
we used historical data from 1990 through 2007 for Montreal, Quebec, Canada and Poisson regression models to estimate
relative risks (RR) for daily non-accidental mortality in association with three different daily temperature metrics (mean,
minimum, and maximum temperature) during June–August. To estimate future numbers of deaths attributable to ambient
temperatures and its uncertainty, we used 32 different simulations of daily temperatures for June-August 2020-2037 derived
from 3 global climate models (GCMs) and a Canadian regional climate model with three sets of RRs (one based on the
observed historical data, and two on bootstrap samples that generated the 95% confidence interval of the attributable number
of deaths), We then used an analysis of covariance (ANCOVA) to evaluate the influence of the simulation, the projected
year, and the sets of RRs used to derive the attributable numbers of death (ANs).
Results
We found that <1% of the variability in the distributions of simulated temperature for June-August of 2020-2037 was
explained by differences among the simulations. Estimated ANs for 2020–2037 ranged from 34 to 174 per summer (i.e. June-
August). Most of the variability in mortality projections (38%) was related to the temperature-mortality RR used to estimate
the ANs.
Conclusions The choice of the RR estimate for the association between temperature and mortality may be important to reduce uncertainty
in mortality projections.
Acknowledgements
The presenting author acknowledges co-authors on the published manuscript in Environmental Health Perspectives: Marie-
France Sottile, Céline Plante, Allan Brand, Barbara Casati, Michel Fournier, and Audrey Smargiassi

154
CAUSAL EFFECTS OF EXTREME HOT DAYS ON MORTALITY IN LOS ANGELES
M.-A. Bind (1), L. Miratrix (2), and M.-A. Bind (1)
(1) Department of Statistics, Harvard University (2) School of Education, Harvard University
Presenting author email: [email protected]
Summary
Health effects resulting from climate change, e.g., extreme temperature conditions, are unclear, but can be catastrophic.
Epidemiological studies have reported associations between temperature changes and mortality. This study aims to address
causality (instead of associations) by formulating the problem precisely. We consider a causal framework by reconstructing a
hypothetical experiment in which “Nature” randomizes “treatment”, i.e., exposure to hot days between 1999 and 2006 in Los
Angeles. This work aims to examine and quantify the causal effect of heat waves on daily counts of deaths.
Introduction
Exposure to extreme hot temperatures has been associated with cardiovascular mortality. However, evidence of causality still
needs to be demonstrated.
Methodology and Results
We obtained individual mortality data from the National Center for Health Statistics (NCHS) for the years 1999 to 2006.
Mortality files provided information on the exact date of death and the underlying cause of death. For this study, our primary
outcome of interest is cardiovascular disease (CVD, ICD-10: I01 through I59) and stroke (ICD‑ 10: I60 through I69) related
mortality. We capitalize on classical insights from experimental design and compare our novel approach to the standard
approach (i.e., based on Poisson regression model and time series) used in environmental epidemiology. We propose four
stages: 1) Approximation of a hypothesized randomized experiment from the observational data, in which Nature
“randomizes” daily maximum temperature (≥30°C) to one day of a matched pair of days. 2) We use a matching strategy to
recreate balance before “exposure” is assigned. We create pairs with “identical” background variables, e.g., day of the week,
dew point temperature, air pollution, etc. 3) We directly calculate the difference in daily cardiovascular mortality count and
the associate Fisher “exact” p-value underlying the random assignment. 4) We conclude whether there is a causal effect or
not under the transparent assumptions described in the 2nd matching stage. In Los Angeles, we found that the difference in
daily CVD death count (Tmax≥30°C vs. Tmax<30°C) is equal to 0.048 death/day.
Conclusions
If our assumptions are valid, the causal effects of maximum temperature over 30°C on cardiovascular mortality can be
substantial, especially among the growing elderly population that is known to be susceptible to extreme hot temperatures.
Acknowledgement
We thank the Ziff foundation at the Harvard University Center for the Environment.

155
REVIEW OF BLACK AND BROWN CARBON MEASUREMENTS AND EFFECTS
J.C. Chow (1), J.G. Watson (1), X.L. Wang (1), Guenter Engling (1), L.-W.A. Chen (2)
(1) Desert Research Institute, Reno, Nevada, USA, 89512; (2) University of Nevada, Las Vegas, Nevada, USA ;
Presenting author email: [email protected]
Summary
This review summarizes research on the multiwavelength light absorption
properties of suspended particulate matter (PM) and how they relate to PM
composition and adverse effects on human health, climate, visibility, and material
damage.
Introduction
Although PM light absorption spectra have been assigned to categories of black
carbon (BC) and brown carbon (BrC), filter deposits show a wide range of colors
that do not fall into these simple categories. Not all PM carbon compounds absorb
light, and not all light-absorbing aerosols are carbon. Saharan dusts, rich in iron,
have a reddish appearance, Asian dusts are bright yellow, while many ores are
black to brown. Although light absorption [babs(λ)] measurements are useful in
both the near ultraviolet (UV, 370 nm and near infrared (IR, 880 nm) spectral
regions. Fig 1 demonstrates that a wider range of wavelength measurements
provides distinctive profiles that can be related to chemical composition and
sources.
Methodology and Results
The chemical nature of the light absorbing species is not fully understood.
Polycyclic aromatic hydrocarbons (PAH) in fresh emissions, such as fluoranthene
(C16H10), chrysene (C18H12), retene (C18H18), perylene (C20H12),
benzo[a]pyrene (C20H12), indeno[1,2,3-cd]pyrene (C22H12), anthanthrene
(C22H12), and coronene (C24H12) exhibit UV absorption. Some secondary
organic aerosols (SOA) also absorb light, including -nitrophenol (C6H5NO3), 4-
nitrophenol (C6H5NO3), 2,4-dinitrophenol (C6H4N2O5), 4-nitro-catechol
(C6H5NO4), 3-methyl-4-nitrophenol (C7H7NO3), 3-methyl-5-nitrocatechol
(C7H7NO4), 3-methyl-6-nitrocatechol (C7H7NO4), 4-methyl-5-nitrocatechol
(C7H7NO4), 2,6-dimethyl-4-nitrophenol (C8H8NO3), and Humic-Like
Substances (HULIS). These can all be detected on filters currently acquired in
chemical speciation networks.
Two- and seven-wavelength aethalometers are most commonly used to obtain
multiwavelength PM absorption properties. Fig. 2 shows an example of how this
information can be used to map the spatial distribution of biomass burning. With
a larger wavelength span, other sources, such as fugitive dusts, can be identified.
A new development includes the addition of multiwavelength light absorption as
part of the thermal/optical carbon analysis currently applied in chemical speciation
networks. These data will be reported for the U.S. IMPROVE network beginning
with samples from 2016, and will migrate to other networks soon thereafter. A
large data base of such measurements should help to elucidate sources and
composition.
While much of the interest in BC and BrC has been climate-related, there is
growing evidence that some of the light-absorbing compounds cited above can
have adverse health effects. A more precise association of PM chemistry with
spectral properties holds potential to improve epidemiological relationships
between ambient exposures and health.
Conclusions
Since PM chemical speciation networks are being established in many countries, it
makes sense to add multiwavelength light absorption measurements to the analysis
suite to better evaluate sources, composition, and effects.
References
Drinovec, L., Mocnik, G., Zotter, P., Prevot, A.S.H., Ruckstuhl, C., Coz, E., Rupakheti, M., Sciare, J., Muller, T.,
Wiedensohler, A., Hansen, A.D.A., (2015). The "dual-spot" Aethalometer: an improved measurement of aerosol black carbon
with real-time loading compensation. Atmos. Meas. Tech 8, 1965-1979.
Chow, J.C., Wang, X.L., Sumlin, B.J., Gronstal, S.B., Chen, L.-W.A., Trimble, D.L., Kohl, S.D., Mayorgal, S.R., Riggio,
G.M., Hurbain, P.R., Johnson, M., Zimmermann, R., Watson, J.G., (2015). Optical calibration and equivalence of a
multiwavelength thermal/optical carbon analyzer. AAQR 15, 1145-1159. doi:10.4209/aaqr.2015.02.0106.
Fig.1. Spectral light absorption
coefficient per unit of elemental carbon
for flaming biomass, diesel exhaust,
and smoldering biomass determined by light transmitted through deposits on
Teflon-membrane filters. Differences in
these light transmission patterns can be used to distinguish the smoldering
phase that dominates biomass burning
emissions from other sources of carbonaceous aerosols. This non-
destructive method can also be applied
to samples related to fugitive dusts and SOA end-products using filters that are
commonly acquired in compliance
monitoring network.
Fig.2 Spatial distribution of BrC, in
µg/m3, asa marker for the smoldering phase of biomass burning, measured
with a 2 wavelength (880 nm and 370
nm) microaethalometer around a neighborhood-scale site (star) in
Sparks, Nevada, USA from ~8 pm to ~2
am. Data were spatially interpolated by kriging from average values assigned to
evenly-spaced grid squares.

156
EU POLICIES FOR AIR QUALITY: EXPECTED IMPACTS ON CLIMATE CHANGE IN THE
MEDITERRANEAN BASIN
C.Carnevale (1), G.Finzi (1), A.Pederzoli (1), E. Turrini (1), M.Volta (1)
(1) Department of Industrial and Mechanical Engineering (DIMI), University of Brescia, Brescia, Italy
Summary
This work presents an evaluation of the impact of future pollutant anthropogenic emission reductions, as foreseen from the
EU air quality policy, on summertime aerosol feedbacks over the Mediterranean basin. The fully coupled climate/chemistry
on line model Wrf/Chem has been used to simulate the aerosol feedbacks associated with the direct absorption and scattering
of solar radiation. A Base Case (BC) and a Maximum Feasible Reduction (MFR) scenario at 2020 have been simulated;
direct aerosols feedbacks for both BC and MFR have been computed and compared.
Introduction
The Mediterranean region is considered a critical area in air quality studies, as it plays a key role in the global interaction
between air quality and climate change. A correct assessment of the aerosol feedbacks over the region is therefore crucial for
air quality planning and for the application of different reduction and control emission strategies. This study attempts to
compute the summertime direct effects of aerosol particles over the Mediterranean basin, and quantitatively estimate their
variation due to the implementation of the EU air quality policies by means of the Wrf/Chem model. Numerical simulations
were performed in order to investigate the impact of the direct effects on downward short-wave solar radiation and
meteorological variables (namely temperature, short wave incident solar radiation, boundary layer height, albedo and cloud
fraction). The model domain is a 40x40 km2 resolution grid over the Mediterranean area; the simulation period covers a
summer month (July 2005). The aerosol feedback for a Base Case (BC) and a Maximum Feasible Reduction (MFR) scenario
at 2020 have been simulated.
Methodology
The computation of direct aerosol effects has been performed by running Wrf/Chem with two different configurations, as
suggested by Wang et al. (2014). Two simulations have been carried out for both MFR and BC; the features of the two tests
are summarized in table 1. S1 is the same simulation as BASE except that aerosol direct feedbacks are switched off; the
difference between BASE and S1 provides the impact of direct effects on Wrf/Chem predictions.
Table 1. Wrf/Chem simulations configurations Simulation Aerosol Emissions Cloud chemistry aerosol chemistry Aerosol direct feedbacks
BASE On On On On
S1 On On On Off
Aknowledgements
Authors would like to acknowledge EMEP for providing the emission datasets used in this study. This work has
been carried out in the frame of the COST Action ES1004 EuMetChem.
References
Wang, K., Zhang, Y., Yahya, K., Wu, S.Y., Grell, G., August 2015. Implementation and Initial application of new chemistry-
aerosol options in WRF/Chem for simulating secondary organic aerosols and aerosol indirect effects. Atmos. Environ. 115,
716e732. http://dx.doi.org/10.1016/j.atmosenv.2014.12.007.

157
SÃO PAULO MEGACITY: NARROWING THE UNCERTAINTIES ON AEROSOL AND CLIMATE CHANGES
IN SÃO PAULO (NUANCE) PROJECT
A. Fornaro 1, M.F. Andrade1, P.A. Dominutti1, T. Nogueira1, M.S. Vieira-Filho1, R.Y. Ynoue1, J.J. Pedrotti2, C. Neves1, Fabio
L. T. Gonçalves1, Bruna Segalin1, A. Vara1, S. Ibarra1, R. Astolfo1
(1) Depto. Ciências Atmosféricas, Universidade de São Paulo, IAG/USP, Rua do Matão, 1226, 05508-090, São Paulo,
SP, Brasil; (2) Escola de Engenharia, Universidade Presbiteriana Mackenzie, Rua Consolação, 896, 01302-907, São
Paulo, SP, Brasil.
Keywords: particulate matter, air quality, urban air pollution.
Presenting author email: [email protected]
Introduction
The megacity has been defined as a “metropolitan area with more than 10 million inhabitants”, and its air pollutants
emissions can cause serious impact not only in the air quality, but also on the climate at the regional to global scale (Folberth
et al., 2015). That said the knowledge about the interactions of the gases and particulate matter air pollutants emissions with
the natural atmospheric components and meteorological parameter has been a challenge. São Paulo megacity (MASP) is the
biggest and most populated in South America (Fig. 1), with more than 20 million inhabitants and a total vehicular fleet
surpassing 6.5 million units, including heavy-duty (HDV) and light-duty (LDV) vehicles. The NUANCE project started in
2010, involving continuous monitoring, special field campaigns (p. ex., tunnel) and modeling atmospheric chemistry (Brito et
al, 2013, Nogueira et al., 2015). The results of the gases monitoring, particulate matter (PM2.5 and PM2.5-10) and rainwater
chemical composition will be presented and highlighted. The proposal is to present a substantial view of the results already
published along with the consolidated new ones.
Methodology and Results The Picarro monitors were used for gases ammonia (NH3), carbon dioxide (CO2) and methane (CH4) analysis. Ethanol and
carbon monoxide (CO) were analyzed by Innova monitor. For systematic hourly measurement of more than 50 NMHCs was
optimized with a Perkin Elmer® system consisting of a sampling module, a thermal dessorption (ATD), a Clarus 500 gas
chromatography with two columns and two flame ionization detectors (FID). The particulate matter was sampled using
Thermo Partisol sampler and a cascade impactor MOUDI to evaluate size distribution, for 12h (day and night). The filters
mass were weighed using a balance with a precision of 1 µg, after remaining at least 24 hours inside the humidity and
temperature controlled room. Black Carbon (BC) concentrations were obtained by light reflectance. The filters were analysed
by Energy Dispersive X-ray Fluorescence (XRF-ED) technique, allowing the determination of the chemical elements with
atomic number (Z) greater or equal to 11 (Na) concentrations. For rainwater study, the wet-only sampler was used. Ion
chromatography (Metrohm model 851) was used to evaluate major inorganic ions in rainwater and aqueous phase of PM. The
São Paulo State Environmental Agency (CETESB) air quality network provided the O3, SO2, NOx (NO+NO2), CO, PM10 and
PM2.5 concentrations. Meteorological data were obtained from INMET (Instituto Nacional de Meteorologia), IAG
Meteorological Station, and CETESB. In Brazil, only HDVs run with diesel (3% biodiesel). The LDV and motorcycles
correspond to approximately 90% of this fleet, burning gasohol (75% gasoline with 25% of anhydrous ethanol), and being
40% of those flexible fuel vehicles running with hydrated ethanol besides gasohol. Ethanol burning reached the same
magnitude as gasoline after 2006 (Cetesb, 2015).
Figure 1. MASP localization.
Conclusions
In conclusion, although the air pollutants concentrations decreased, the air
quality has been seriously affected by traffic, despite the fact that the
emissions control program started 40 years ago. The high level of air
pollutants for the annual average and 24-hours peak concentrations exceeded
the WHO guidelines, mainly for PM and O3 (WHO, 2006).
Acknowledgement
The authors would like to thank for the data supported by São Paulo State
Environmental Agency (CETESB) and for the financial support of FAPESP,
CNPq and CAPES (PROEX, Post-Graduation Program of Meteorology,
IAG/USP).
References Brito, J., Rizzo, L. V., Herckes, P., Vasconcellos, P.C., Caumo, S.E.S., Fornaro, A., Ynoue, R.Y., Artaxo, P., Andrade, M.F., 2013. Physical-chemical characterization of the particulate matter inside two road tunnels in the São Paulo Metropolitan Area. Atmos. Chem. Phys. Discuss.
13, 20839–20883.
CETESB, 2015. Qualidade do Ar no Estado de São Paulo 2014. São Paulo, Secretaria do Meio Ambiente, Série Relatórios, ISSN 0103-4103, São Paulo (www.cetesb.sp.gov.br).
Folberth, G.A., Butler, T.M, Collins, W.J., Rumbold, S.T., 2015. Megacities and climate change – a brief overview. Environ. Pollut. 203,
235-242. Nogueira, T., Souza, K., Fornaro, A., Andrade, M. F., Carvalho, L.R., 2015. On-road emissions of carbonyls from vehicles powered by
biofuel blends in traffic tunnels in the Metropolitan Area of Sao Paulo, Brazil. Atmos. Environ. 108, 88-97.
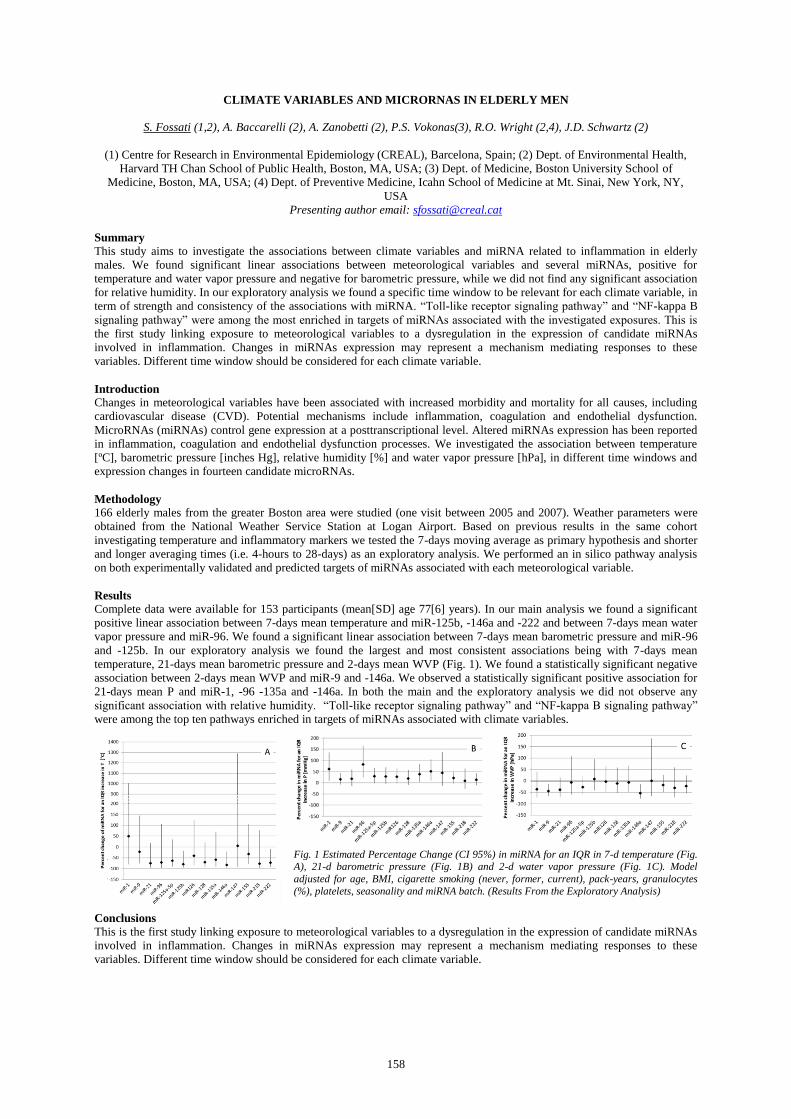
158
CLIMATE VARIABLES AND MICRORNAS IN ELDERLY MEN
S. Fossati (1,2), A. Baccarelli (2), A. Zanobetti (2), P.S. Vokonas(3), R.O. Wright (2,4), J.D. Schwartz (2)
(1) Centre for Research in Environmental Epidemiology (CREAL), Barcelona, Spain; (2) Dept. of Environmental Health,
Harvard TH Chan School of Public Health, Boston, MA, USA; (3) Dept. of Medicine, Boston University School of
Medicine, Boston, MA, USA; (4) Dept. of Preventive Medicine, Icahn School of Medicine at Mt. Sinai, New York, NY,
USA
Presenting author email: [email protected]
Summary
This study aims to investigate the associations between climate variables and miRNA related to inflammation in elderly
males. We found significant linear associations between meteorological variables and several miRNAs, positive for
temperature and water vapor pressure and negative for barometric pressure, while we did not find any significant association
for relative humidity. In our exploratory analysis we found a specific time window to be relevant for each climate variable, in
term of strength and consistency of the associations with miRNA. “Toll-like receptor signaling pathway” and “NF-kappa B
signaling pathway” were among the most enriched in targets of miRNAs associated with the investigated exposures. This is
the first study linking exposure to meteorological variables to a dysregulation in the expression of candidate miRNAs
involved in inflammation. Changes in miRNAs expression may represent a mechanism mediating responses to these
variables. Different time window should be considered for each climate variable.
Introduction
Changes in meteorological variables have been associated with increased morbidity and mortality for all causes, including
cardiovascular disease (CVD). Potential mechanisms include inflammation, coagulation and endothelial dysfunction.
MicroRNAs (miRNAs) control gene expression at a posttranscriptional level. Altered miRNAs expression has been reported
in inflammation, coagulation and endothelial dysfunction processes. We investigated the association between temperature
[ºC], barometric pressure [inches Hg], relative humidity [%] and water vapor pressure [hPa], in different time windows and
expression changes in fourteen candidate microRNAs.
Methodology
166 elderly males from the greater Boston area were studied (one visit between 2005 and 2007). Weather parameters were
obtained from the National Weather Service Station at Logan Airport. Based on previous results in the same cohort
investigating temperature and inflammatory markers we tested the 7-days moving average as primary hypothesis and shorter
and longer averaging times (i.e. 4-hours to 28-days) as an exploratory analysis. We performed an in silico pathway analysis
on both experimentally validated and predicted targets of miRNAs associated with each meteorological variable.
Results Complete data were available for 153 participants (mean[SD] age 77[6] years). In our main analysis we found a significant
positive linear association between 7-days mean temperature and miR-125b, -146a and -222 and between 7-days mean water
vapor pressure and miR-96. We found a significant linear association between 7-days mean barometric pressure and miR-96
and -125b. In our exploratory analysis we found the largest and most consistent associations being with 7-days mean
temperature, 21-days mean barometric pressure and 2-days mean WVP (Fig. 1). We found a statistically significant negative
association between 2-days mean WVP and miR-9 and -146a. We observed a statistically significant positive association for
21-days mean P and miR-1, -96 -135a and -146a. In both the main and the exploratory analysis we did not observe any
significant association with relative humidity. “Toll-like receptor signaling pathway” and “NF-kappa B signaling pathway”
were among the top ten pathways enriched in targets of miRNAs associated with climate variables.
Fig. 1 Estimated Percentage Change (CI 95%) in miRNA for an IQR in 7-d temperature (Fig. A), 21-d barometric pressure (Fig. 1B) and 2-d water vapor pressure (Fig. 1C). Model
adjusted for age, BMI, cigarette smoking (never, former, current), pack-years, granulocytes
(%), platelets, seasonality and miRNA batch. (Results From the Exploratory Analysis)
Conclusions
This is the first study linking exposure to meteorological variables to a dysregulation in the expression of candidate miRNAs
involved in inflammation. Changes in miRNAs expression may represent a mechanism mediating responses to these
variables. Different time window should be considered for each climate variable.

159
CARDIORESPIRATORY MORBIDITY AND MORTALITY DUE TO MULTIPLE EXPOSURES TO AIRBORNE
POLLUTANTS IN SANTIAGO DE CHILE
U. Franck (1), A. Leitte (1, 2) and P. Suppan (3)
(1) Core Facility Studies, Helmholtz Centre for Environmental Research - UFZ, Leipzig, Germany; (2) Department of
regional and environmental planning, Technische Universität Kaiserslautern, Germany; (3) Institute of Meteorology and
Climate Research (IMK-IFU), Karlsruhe Institute of Technology (KIT), Garmisch-Partenkirchen, Germany
Presenting author email: [email protected]
Summary
High concentrations of various air pollutants have been associated with hospitalization due to development and exacerbation
of cardiovascular and respiratory diseases and increased cardio-respiratory mortality. This study aimed to quantify
associations between airborne exposures by particulate matter as well as gaseous pollutants and morbidity as well as
mortality due to different cardio-respiratory disease groups in Santiago de Chile.
The study was performed in the metropolitan area of Santiago de Chile during 2004-2007. We applied a time-stratified case-
crossover analysis taking temporal variation, meteorological conditions and autocorrelation into account. We computed
associations between daily ambient concentrations of carbon monoxide (CO), nitrogen dioxide (NO2), particulate matter
(PM10 and PM2.5 - particulate matter with aerodynamic diameters less than 10 or 2.5 µm, respectively) or ozone (O3) and
health effects.
We found for CO, NO2, PM10 and PM2.5 adverse relationships to hospital admissions and mortality while effect strength
and lag depended on the pollutant and on the disease group. Adverse effects of O3 could not be detected.
Introduction
Santiago de Chile is surrounded by Andean Mountains in the east and the Cordillera of the Coast. The specific atmospheric
and geographic conditions cause high contamination levels due to relatively high anthropogenic and natural emissions.
Depending on season, the main contamination is due to primary emissions: particulate matter, sulphur dioxide (SO2) and
nitrogen dioxide (NO2) and carbon monoxide (CO) (Cakmak et al., 2009). Previous studies found health risks also for the
conditions of Santiago de Chile (Cakmak et al., 2009; Vera and Cifuentes, 2008). But, results on health effects of particulate
matter, CO, NO2, and especially O3 vary between studies.
Material and methods
In the city of Santiago live around 5.39 Mio inhabitants (census 2002) which is more than one third of the total population of
the country. The city lies in the center of the Santiago Basin, a large bowl-shaped valley between the Andes and the
Cordillera de la Costa mountains. This location limits ventilation and dispersion of air pollutants. High temperatures, high
pollutant concentrations and clear sky favor the formation of O3 through photochemical reactions. Health data were kindly
provided by the Departamento de Estadísticas e Información de Salud (DEIS). The data included all cases of hospital
admissions (in total 75,303) and all cardio-respiratory death cases (in total 25,687) from January 1, 2004 until December 31,
2007. Averages of concentrations measured by seven monitoring stations of the atmospheric pollution monitoring Network at
Santiago de Chile were used for the estimation of the exposure. In the present study we applied a time stratified case-
crossover analysis (CCO) using daily numbers of respiratory hospital admissions and daily mean values of the concentrations
of airborne pollutants.
Results
Depending on disease group, all investigated pollutants except O3 were adversely related to cardiovascular and respiratory
admissions. By trend, in 1-pollutant models of cardiovascular admissions most adverse pollutants were NO2 and particulate
matter (PM10 and PM2.5) followed by CO, while in 2-pollutant models effects of PM10 persisted in most cases whereas
other effects weakened. In 1-pollutant models most adverse respiratory effects were induced by CO and PM10 followed by
PM2.5, while in 2-pollutant models effects of NO2 persisted in most cases whereas other effects weakened and significant
effects remain for PM2.5, only. In 1-pollutant models cardio-respiratory mortality was found to be increased by exposure of 2
– 8 days to CO, NO2, PM10, and PM2.5. Effect strength increased if exposure concentrations were elevated for two or more
consecutive days. 2-pollutant models indicate that combined exposures may be responsible for the majority of observed
adverse effects on death cases rather than a single pollutant, only.
Conclusions
Our results provided evidence for adverse health effects of combined exposure to airborne pollutants. Different pollutants
accounted for varying adverse effects within different disease groups. Taking case numbers and effect strength of all
cardiovascular diseases into account, mitigation measures should address all pollutants but especially NO2, PM10, and CO.
NO2 and PM are adversely associated with respiratory health even if their effects were controlled for other air pollutants.
With respect to mortality, mitigation measures should address all pollutants but especially NO2 and also CO.
References
Cakmak S., Dales R.E., Vida C.B., 2009. Components of particulate air pollution and mortality in Chile. Int J Occup Environ
Health 15, 152-8.
Vera J., Cifuentes L., 2008. Association of Hospital Admissions for Cardiovascular Causes and Air Pollution (PM10, PM25
and O3) in Santiago, Chile. Epidemiology 19, S368.

160
SHORT TERM EFFECT OF EXTREME TEMPERATURES ON MORTALITY AND INTERACTION EFFECT
WITH AIR POLLUTION IN ITALIAN CITIES
P. Michelozzi (1), F.K. de’Donato (1), M. Scortichini (1) , M. Stafoggia (1)
(1)Department of Epidemiology Lazio Regional Health Service - ASL RME, Rome, Italy
Presenting author email: [email protected]
Summary:
The study aims to provide cause-specific estimates of the effect of heat and cold in 16 Italian cities, to evaluate inter-annual
variations, and to estimate the interactive effect of heat and cold with air pollutants. Extreme temperatures have a significant
effect on mortality in Italian cities, and are heterogeneous among cities. A temporal variation in the effect of summer extreme
temperatures was observed, with a declining trend in the effect of heat. When considering the interaction between
temperatures and air pollution an additional effect of PM10 was observed in most cities and for ozone in central and southern
cities. Future heat adaptation measures should include interventions to reduce air pollution during heat waves episodes.
Introduction:
Considering the increase in frequency and intensity of extreme events predicted under climate change scenarios for the
Mediterranean the future health threat for Italy is considerable. Although the effect of heat and cold on mortality are well
documented, the temporal variation of the effect need to be evaluated. Moreover there is still limited evidence on the
interaction between extreme temperatures and air pollution. The aim of the study was to provide cause-specific estimates of
the effect of heat and cold in 16 Italian cities, to evaluate inter-annual variations, and to estimate the interactive effect of heat
and cold with air pollutants.
Main Body format:
Methodology
The annual temperature-mortality relationship was modelled using Poisson distributed lag non-linear models (DLNM) with a
lag window of 14 days to account for both the short and long-term effects of heat and cold. The effect was estimated as the
RR of mortality for a change in temperature between the 90-95th percentile and the 10-5th percentile of the annual mean
temperature distribution for heat and cold respectively. City-specific and pooled results were estimated for total and cause
specific mortality (cardiac, ischemic heart disease, cerebrovascular, respiratory disease, COPD and asthma). Secondly the
combined effect of temperature and air pollution (PM10, NO2 and Ozone-summer only) was analysed using a GAM with a
tensor smooth in order to model both exposures with a non-parametric approach. Temperature effects were then estimated at
different pollution levels (low, medium, high). Lastly, time-varying coefficient regression models were used to assess the
temporal variation in the effect of extreme heat on mortality.
Results
Extreme temperatures have a significant effect on mortality in Italian cities, and heterogeneity among cities was observed for
both heat and cold. Cause specific effects were observed with a greater impact on respiratory causes during summer (pooled
results +17%) and cardiovascular causes in winter (pooled results +5% for circulatory causes).
A temporal variation in the effect of summer extreme temperatures was observed between 1995-2015. Overall, a declining
trend in the effects of heat was observed for high temperatures, while for less extreme summer temperatures 30-32°C no
change in the effect estimates was observed. Years with very high summer temperatures still have a significant impact on
mortality, such as summer 2006 and 2015. Heterogeneity was observed between cities, possibly also reflecting local dose-
response curves and adaptation measures introduced.
When considering the interaction between temperatures and air pollution, in summer we observed an additional effect of
PM10 in most cities and for ozone in central and southern cities. In winter no effect modification by air pollution was
observed.
Conclusions
Although a declining trend in the effects of heat was observed for high temperatures in Italian cities high and low extreme
temperature continue to represent a threat for health in Italian cities. In large Italian cities during summer PM10 and ozone
amplify the effect of heat exposure on mortality. Future heat adaptation measures should include interventions to reduce air
pollution during heat waves episodes.

161
EVALUATION OF THE AEROSOL-RADIATION AND AEROSOL-CLOUD INTERACTIONS IN AN ON-LINE
COUPLED MODEL OVER THE IBERIAN PENINSULA
L. Palacios-Peña (1), R.Baró (1), J. L. Guerrero-Rascado (2,3), L. Arboledas-Alados (2,3) and P. Jiménez-Guerrero (1)
(1) Department of Physics, Regional Campus of International Excellence “Campus Mare Nostrum”, University of Murcia,
Murcia, Spain (2) Andalusian Institute for Earth System Research (IISTA-CEAMA), Av. del Mediterráneo, 18006, Granada,
Spain (3) Dpt. Applied Physics, University of Granada, Fuentenueva s/n, 18071, Granada, Spain
Presenting author email: [email protected]
Summary
The effects of atmospheric aerosol on the Earth’s climate are produced mainly by their optical, microphysical and chemical
properties, which condition the radiative budget of the Earth. In this sense the objective of this work is to assess whether the
inclusion of aerosol radiative effects in the on-line coupled WRF-Chem model improves the modelling outputs over the
Iberian Peninsula. The methodology relies on the evaluation of modelled aerosol optical properties with remote sensing data
under diverse model configurations. The results indicate that although there is only a slight improvement in the results when
including the radiative feedbacks, the BIAS and the correlation coefficients are improved for some stations and regions.
Introduction
Atmospheric aerosols together with greenhouse gases and clouds are the main forcing agents of the climate system,
modifying the Earth’s radiative budget. The uncertainty of the aerosol effects over the aforementioned budget is much higher
than any other climate-forcing agent. With the aim of reducing this uncertainty and estimating the radiative forcing causes for
this forcing agent, the study of atmospheric aerosols by chemistry-climate models is needed. Hence, the object of this work is
to assess the representation of aerosol optical proprieties by an online-coupled model (WRF-Chem) and to determine whether
the inclusion of aerosol radiative feedbacks improves the modelling outputs over the Iberian Peninsula.
Methodology and Results
The evaluated data comes from regional air quality-climate
simulations performed using the WRF-Chem online-coupled
meteorology/ chemistry model (Grell et al., 2005). The
modelling domain covers all Europe, but for the purpose of this
work data from the Iberian Peninsula with a resolution around
0.2º has been extracted for two important aerosol episodes in the
year 2010 (a Saharan desert dust outbreak and a forest fires
episode). The simulations are run for two different scenarios
differing in the inclusion (or not) of aerosol radiative feedbacks,
denoted NRF and RF, respectively. The evaluation of the
simulations has been performed by using classical statistics. The
evaluated variables are aerosol optical depth (AOD) and
Angström exponent. (AE) The observational data used to
performance the evaluation are providing from different satellite
sensors as MODIS, OMI or SeaWIFS; or ground-based
instrument network as AERONET or EARLINET.
The results indicate a general slight improvement (around 0.3%
for MBE in both episodes) in the case of including the aerosol
radiative effects in the model and a slight worsening for the
Angström exponent. On the other hand, the model overestimates AOD for fire particles (see Fig. 1) and underestimates for
dust particles. Regarding the correlation coefficient, both episodes show similar values of this statistic, which are higher than
for Angström exponent. Generally, for the Angström exponent, the model tends underestimate the variability of this variable.
For the comparison between model output and EARLINET profiles, the results show a general improvement around 8% in
the representation of vertical aerosol distribution when the radiative feedbacks are taken into account.
Conclusions
For the spatial distribution the best-represented variable is AOD. For this variable the bias and correlation coefficient values
are better than for AE. Concerning the improvement of the simulation including feedbacks, although there is not a general
significant improvement, the BIAS, the MBE, the MAE and the correlation coefficient are improved for some stations and
regions, usually the nearest to the emission sources of aerosol particles, where the main aerosol radiative effects can be
found. The representation of aerosol vertical distribution improves when the radiative feedback simulation is included.
Acknowledgement
EuMetChem COST Action ES1004, AQMEII initiative and CGL2013-48491-R/CGL2014-59677-R (through European
Regional Development Fund –FEDER) projects are ackowledged.
References
Grell, G. A., Peckham, S. E., Schmitz, R., McKeen, S. A., Frost, G., Skamarock, W. C., and Eder, B. (2005). Fully coupled
“online” chemistry within the WRF model. Atmospheric Environment, 39(37): 6957-6975.
Fig.1 AOD at 550nm model output vs. data from Aqua Platform (left) for the 2010 fire episode: bias (central
column) and correlation coefficient (right column)

162
STREET-LEVEL MODELLING OF CLIMATE ADAPTATION MEASURES AND THEIR CONSEQUENCES ON
SUBJECTIVE BIOLOGICAL INDICES AND URBAN AIR QUALITY
J. Resler (1), N. Benešová (2), P. Juruš (1), P. Krč (1), M. Belda (3), O. Vlček (2), J. Lopata (2), P. Derbek (1), D. Srbová
(2), K. Eben (1), P. Bauerová (2), P. Hrubeš (1), J. Blumelová (1) and M. Kazmuková (4)
(1) Faculty of Transportation Sciences, Department of Transport Telematics, Czech Technical University in Prague, Prague,
Czech Republic; (2) Czech hydrometeorological institute, Prague, Czech Republic; (3) Institute of Computer Science, The
Czech Academy of Sciences, Prague, Czech Republic; (4) City Development Authority, Prague, Czech Republic
Presenting author email: [email protected]
Summary This study aims to quantify the effect of climate change urban adaptation strategies. We evaluate the effect of different
measures (planting trees, building wall paint colors) in respect of the thermal comfort of inhabitants and air pollution levels.
Introduction
Cities play an important role regarding potential climate change impacts. Urban areas are often vulnerable and poorly
prepared to respond to climate change impacts, such as heat waves, drought or floods. The project UrbanAdapt aims to
start the process of preparation of cities adaptation strategies, develop adaptation scenarios and test their effects and benefits
in the three pilot cities in the Czech Republic. In this study, we assess the impact of different adaptation measures on citizens
who live under the conditions of growing urban heat island effect. Different adaptation measures were proposed (planting
tree alleys, changing wall paint colors) which are orientated to lower the temperature in the streets during hot summer days.
We evaluate here the effectiveness of such measures. However, the question arises what is the impact of those measures on
pollutant dispersion. A tree represents an obstacle for turbulent flow in the street, further it can influence the temperature
through evapotranspiration, while wall paint color modifies radiation from buildings, thus changing the energy balance. All
these effects influence the resulting flow and have an effect on air pollutant distribution.
Methodology and Results The heterogeneity of urbanized land surface leads to a need for a very fine
resolution when modelling air flows and temperature near to the surface.
We have chosen the atmospheric model PALM [1, 2] as a tool for our
simulations. PALM is a LES model which includes parametrizations of
many atmospheric processes (e.g. land surface, plant canopy, solar radiation
and convective processes) and also enables to involve pollutant dispersion.
On the other hand, the parametrization of building surface energy balance is
not included in the model. We implemented a new module in the PALM to
account for those effects inspired by the wall heatflux treatment in TUF3D
model [3].
We performed a field experiment, during which temperature of building
facades and road surface on Prague crossroad were measured with infrared
camera, during a summer heat wave episode. The results of the
measurements show that temperature of the wall vary based on wall
material and paint colors (Fig. 1). Also, the difference between parts shaded
by trees and those exposed to direct sunlight can be substantial. Fig. 2
shows the time variation of temperature of four differently oriented walls.
The results will serve for verification of the radiation module.
To evaluate the connection between objective meteorological variables and
subjective biological indices we adopted the concept of Physiological
Equivalent Temperature (PET) and for its simulation a micro-scale model
RayMan [4] is applied. Our preliminary results show that tree alleys in the streets bring improvement in the PET which may
be up to 4°C.
Acknowledgement
Project UrbanAdapt (EHP-CZ02-OV-1-036-2015) is supported by the Iceland, Liechtenstein and Norway grants.
References [1] Raasch, S., Schröter M., 2001. PALM - a large-eddy simulation model performing on massively parallel computers.
Meteorol. Z. 10, 363–372.
[2] Maronga, B. et al., 2015: The Parallelized Large-Eddy Simulation Model (PALM) version 4.0 for atmospheric and
oceanic flows: model formulation, recent developments, and future perspectives, Geosci. Model Dev., 8, 1539-1637.
[3] Krayenhoff, E. S., and J. A. Voogt, 2007: A microscale three-dimensional urban energy balance model for studying
surface temperatures. Boundary-Layer Meteorol 123, 433-461.
[4] Matzarakis A., Rutz F., Mayer H., 2010. Modelling Radiation fluxes in simple and complex environments – Basics of the
RayMan model. Int. J. Biometeorol., 54, 131-139.
Fig. 1: snapshot from IR camera measurement
Fig. 2: temperature on different walls

163
GHG LANDFILL EMISSIONS DETERMINATION USING A FLUX CHAMBER
C. Sánchez ; A. Narros ; I. del Peso ; M.M. de la Fuente ; E. Rodríguez
Department of Chemical and Environmental Engineering, Technical University of Madrid, Spain
Presenting author email: [email protected]
Summary
Fugitive emissions from the surface of landfills constitute an important source of carbon dioxide and methane that are emitted
to the atmosphere and contribute to the greenhouse effects. Quantifying those emissions can give valuable information, not
only, on the amount of those gases which are released into the atmosphere but on their environmental consequences. They
can also help to evaluate another aspects related to the landfill management like the seal efficiency or the gas recovery.
Quantifying fugitive emissions is not an easy task, due to the heterogeneity of the waste into the landfills, their huge
dimensions and the influence of others factors like the site meteorology. Several measurement methods as well as prediction
models for determine this type of emissions can be found in the bibliography. In this study a flux box method has been used.
Material and methods For the implementation of this method a process in two steps, as
described on the Guidance on monitoring landfill gas surface emissions
(EA 2010), was followed in order to obtain the fugitive emissions of
two landfill sites in Madrid (Spain). The first step consists on a
walkover survey. At this stage the gas concentration close to the
surface is monitored and zones with equal concentrations are defined.
At the same time, significant emission sources and failures in the gas
collection system are identified. All this information is used to choose
the sample points for the second step, the flux box study. A flux box or
flux chamber is a well known volume dispositive that allows to
accumulate and to quantify over time emissions emanating from a
given area of the landfill. To measure the composition of methane
inside the flux box, a portable detector based on Infrared (IR)
Absorption Spectroscopy (Sensit PMD) in combination with an
electronic narrow band pass filter technology is being used. Carbon
dioxide emissions were obtained using a passive IR sensor for CO2
(Kimo HQ210). Some preliminary results show the possibility of
quantifying emissions rates from less than 1 mg/m2·h to 104 mg/m2·h
or even
Results and Conclusions
This method has been used in two landfills. The
first one is a closed landfill that has been exploited
for almost 40 years and was closed in 2000. In this
case the landfill gas extracted is being used to
generate electricity. The other one corresponds to
a landfill which is still in use and the extracted gas
is being burnt in a flare. Another critical difference
between the two landfills is the type of cover used.
In the closed landfill there is a high density
polyethylene film while in the other one there is
only a clay and sand barrier as cover. The
walkover survey results show lower
concentrations of methane on the closed landfill.
This is an evidence of the effectiveness of a good
seal combined with the active extraction and use
of the gas to reduce methane release.
References
Babilotte A., Lagier T., Fiani E., Taramini V., 2010. Fugitive Methane Emissions from Landfills: Field Comparison of Five
Methods on a French Landfill. Journal of Environmental Engineering. AUGUST 2010, 777–784
Di Trapani D., Di Bella G., Viviani G., 2013. Uncontrolled methane emissions from a MSW landfill surface: Influence of
landfill features and side slopes. Waste Management 33, 2108–2115
Figueroa V. K., Mackie K. R., Guarriello N., Cooper C. D., 2009. A Robust Method for Estimating Landfill Methane
Emissions. Journal of the Air & Waste Management Association 59, 925–935
y = 7.3335x + 120.27 R² = 0.9859
150
200
250
300
350
400
450
500
550
10 20 30 40 50 60
CH4 ppm vs time
Fig.1 Measure of surface gas emissions with a flux
chamber
Fig.2 Variation of methane concentration over time inside the flux chamer

164
THE IMPACT OF HEAT WAVES ON ISCHEMIC HEART DISEASES IN GERMANY – PRESENT SITUATION
AND CLIMATE CHANGE
S. Zacharias (1), C. Koppe (2) and H.-G. Mücke (3)
(1) until spring 2015 at Deutscher Wetterdienst/DWD (German Weather Service), Center for Bioclimatological Research,
Stefan-Meier-Str. 4, 79104 Freiburg, Germany; (2) Deutscher Wetterdienst/DWD (German Weather Service), Frankfurterstr.
135, 63067 Offenbach; Germany; (3) Umweltbundesamt/UBA (Federal Environment Agency) Dept. of Environmental
Hygiene, Corrensplatz 1, 14195 Berlin, Germany
Presenting author email: [email protected]
Summary
This is the first nation-scale study analyzing the relationship between the impacts of heat and morbidity/mortality of ischemic
heart diseases (IHD) in Germany - at present and in the climate changed future. The results show that (a) heat waves in
Germany are associated with increased IHD mortality rates; (b) heat wave characteristics are strongly modulating mortality
results; and (c) heat impacts are different concerning regions, gender, and diseases.
Introduction
Weather affects public health in many ways. Heat is one of the primary weather-associated threats to life, as dramatically
shown by the death toll of the 2003 heat waves in Europe with around 50,000 excess deaths. Heat waves are defined as
extended periods of extreme high temperatures, exert a stronger influence on health than isolated hot days. Elderly and
chronically predisposed people are the most vulnerable group to be at high risk, while the heat impact is highest e.g. on the
cardiovascular system. Heat-related studies frequently report that the temperature-mortality relationship is stronger than the
one for temperature-morbidity.
Methodology and Results
The impact of heat waves on ischemic heart disease (IHD) mortality and morbidity in Germany was analyzed for the decade
2001-2010. Heat waves are defined as periods of at least 3 consecutive days with daily mean temperature above the 97.5th
percentile of the temperature distribution. Daily excess mortality and morbidity rates are used from a nationwide database.
All calculations were performed separately for 19 regions to allow for the investigation of regional differences.
The results show that IHD mortality during heat waves is significantly increased (+15 % more deaths on heat wave days). In
stark contrast, no heat wave influence on hospital admissions due to IHD could be observed. Regional differences in heat
wave IHD mortality are present, with the strongest impact in the Western part, and weaker than average effects in the
Southeastern and Northwestern regions. The increase in mortality during heat waves is generally stronger for females (+19
%) than for males (+11 %), and for chronic ischemic diseases (+18 %) than for myocardial infarctions (+12 %). Longer and
more intense heat waves feature stronger effects on IHD mortality, while timing in season seems to be less important.
Furthermore, the influence of future climate change on the occurrence of heat waves in Germany is studied. Simulations of
19 regional climate models with a spatial resolution of 10-25 km are analyzed. All of the models use a moderate green house
gas forcing according to the SRES scenario A1B. Three model time slices of 30 years are evaluated, representing present
climate (1971-2000), near future climate (2021-2050) and remote future climate (2069-2098).
Based on the model simulations, future heat waves in Germany will be significantly more frequent and longer lasting. By the
end of the 21st century, the number of heat waves will be tripled compared to present climate. Additionally, the duration of
heat waves will increase by 25 %. Altogether, the number of heat wave days will be four times higher in the period 2069-
2098. Regional analyses show that stronger than average climate change effects are observed particularly in the Southern
regions.
Conclusions
The study demonstrated a significant increase in IHD mortality in Germany especially on days with high average
temperatures and heat-waves. A potential relationship between the atmospheric environment and IHD morbidity remains
unclear. The used methodology does not imply possible adaptations to climate change, but it is most likely that the individual
heat burden will increase considerably. The obtained results point to public and individual adaptation strategies to reduce the
future heat wave impact on mortality.
Acknowledgement
This study was funded by the Federal Ministry for the Environment, Nature Conservation, Building and Nuclear Safety as
part of the German Environment Research Programme (UFOPLAN; FKZ 3711 61238 “Climate change, bioclimatology and
health effects”), embedded in the National Adaptation Strategy to Climate Change.
References
Zacharias S., Koppe C., Mücke H-G 2014. Influence of heat waves on ischemic heart diseases in Germany. Climate, 2(3),
133-152; doi:10.3390/cli2030133.
Zacharias S., Koppe C., Mücke H-G 2015. Climate Change Effects and Future Heat Wave-Associated IHD Mortality in
Germany. Climate, 3(1), 100-117; doi:10.3390/cli3010100.

165
CHRONIC EFFECTS OF TEMPERATURE VARIABILITY ON MORTALITY IN SOUTH EASTERN UNITED
STATES: IMPLICATIONS FOR PUBLIC HEALTH RISK OF FUTURE CLIMATE CHANGE
L. Shi (1), I. Kloog (2), J. D. Schwartz(1), A. Zanobetti(1)
(1) Department of Environmental Health, Harvard T.H. Chan School of Public Health, Boston, Massachusetts, United States
of America; (2) Department of Geography and Environmental Development, Ben-Gurion University of the Negev, Beer
Sheva, Israel
Presenting author email: [email protected]
Summary
Global warming threatens human health, particularly in the South Eastern United States, because the elderly population who
are most vulnerable to climate change is rapidly growing in this area. Hence, it urges temperature-related health effect studies
in such areas. Here we demonstrate that both seasonal mean values and standard deviations (SDs) of temperature could
modify the long-term survival among the 13 million Medicare population (aged 65+) in the South Eastern USA. It is
important to separate the spatial and temporal variation in temperature, since the latter is more relevant to climate change.
Therefore we broke down the seasonal mean temperatures and temperature SDs into long-term geographic contrasts and
annual anomalies. For the anomalies, each 1 °C increase in summer mean temperature was associated with a 0.8% higher
death rate, whereas a rise in winter mean temperature of 1 °C corresponded to a 1.4% decrease in mortality. Increases in
within season temperature SDs in both summer and winter also contributed to more deaths. For future climate scenarios,
seasonal mean temperatures may in part account for the public health burden, but excess public health risk of climate change
may also stem from changes of within season temperature variability.
Introduction
The rapid buildup of greenhouse gases is expected to increase the Earth surface mean temperature, with unclear response of
temperature variability. This has added some urgency to better understand the direct effects of such changes on human health.
Many previous studies demonstrated that short term exposure to extreme temperatures were associated with increased
mortality. In addition to the seasonal mean temperature, its variability may also play a significant role in raising the risk of
mortality (Zanobetti et al, 2012). However the chronic effects of temperature are less clear. Recently we demonstrate that
long-term survival was significantly associated with both seasonal mean values and standard deviations of temperature in
New England (Shi et al, 2015). The objective of this study is to identify the chronic effects of seasonal mean temperature and
temperature variability on mortality in the South Eastern United States.
Methodology and Results We used a novel prediction model that incorporates land use terms, meteorological data, and satellite surface temperature to
generate high resolution (1×1 km) daily air temperature estimates. We applied Cox’s proportional hazard regression models,
adjusting for individual risk factors, to examine the chronic effects of mean temperature and temperature variability for both
summer and winter in the Medicare population (age>=65) across South Eastern states.
A rise in summer mean temperature of 1ºC was associated with a higher risk in mortality (HR=1.008, 95% CI=1.006-1.010)
while a 1ºC increase in winter mean temperature corresponded to a lower mortality risk (HR=0.986, 95% CI=0.985-0.987).
For a 1ºC increase in temperature standard deviation, hazard ratios of 1.040 (95% CI: 1.034-1.046) and 1.006 (95% CI:
1.004-1.008) for mortality were seen in winter and summer, respectively.
Conclusion
This study found a significant chronic effect of temperature on mortality for both mean values and variability. For future
climate scenarios, while the opposite effects of summer/winter mean temperatures may compensate each other, excess public
health risk of climate change may still stem from changes of within season temperature variability.
Acknowledgement This work was supported by NIEHS grants R21 ES024012-01A1, P30 ES000002 and R21ES020695. This work was also
made possible by USEPA grant (RD-83479801). Its contents are solely the responsibility of the grantee and do not
necessarily represent the official views of the USEPA.
References Shi, L., Kloog, I., Zanobetti, A., Liu, P., & Schwartz, J.D., 2015. Impacts of temperature and its variability on mortality in
New England. Nature Climate Change. http://dx.doi.org/10.1038/nclimate2704
Zanobetti, A., O'Neill, M. S., Gronlund, C. J. & Schwartz, J. D., 2012. Summer temperature variability and long-term
survival among elderly people with chronic disease. Proceedings of the National Academy of Sciences. 109, 6608-6613.

166
FINE SCALE SPATIAL AND TEMPORAL VARIATION IN TEMPERATURE AND ARRHYTHMIA EPISODES
IN THE VA NORMATIVE AGING STUDY
A. Zanobetti (1), B. A. Coull (2), I. Kloog (1,3), D. Sparrow (4), P. S. Vokonas (4), D. R. Gold (1,5), J. D. Schwartz (1)
(1) Department of Environmental Health, Harvard T.H. Chan School of Public Health, Boston, MA. (2) Department of
Biostatistics, Harvard T.H. Chan School of Public Health, Boston, MA, USA. (3) The Department of Geography and
Environmental Development, Ben-Gurion University of the Negev Beer Sheva, Israel. (4) VA Normative Aging Study, VA
Boston Healthcare System and the Department of Medicine, Boston University School of Medicine, Boston, MA. (5)
Channing Laboratory, Brigham and Women’s Hospital, Department of Medicine, Harvard Medical School, Boston,
Massachusetts, USA.
Presenting author email: [email protected]
Summary
Many studies have demonstrated that cold and hot temperatures are associated with increased deaths and hospitalization
rates; new findings indicate also an association with more specific cardiac risk factors. Most of these existing studies have
relied on few weather stations to characterize exposures; few have used residence-specific estimates of temperature, or
examined the exposure-response function. We investigated the association of arrhythmia episodes with spatial and temporal
variation in temperature, and we also evaluated the association between monitored ambient temperature (central) and the
same outcome. We found that increased levels of cold and warm temperature may increase the risk of ventricular
arrhythmia.
Introduction
Cardiovascular and cerebrovascular diseases are among the greatest causes of morbidity and mortality in adults in the United
States and world-wide. Ventricular tachycardia and ventricular fibrillation are common mechanisms of sudden cardiac death.
The recently released Intergovernmental Panel on Climate Change report provided strong evidence that CO2 emissions will
lead to warmer temperatures, and more extreme heat and cold events. Several studies have found associations between
temperature and temperature extremes and health. Most epidemiologic studies have relied on weather data from the major
city airport to characterize exposure, ignoring important factors that may influence temperature at individual residences
including urban heat islands, distance from water, and amount of impermeable surface, which can introduces substantial
exposure error. We have recently presented and validated a temporally-and spatially-resolved prediction model utilizing
satellite surface temperature data (Kloog et al 2014) to estimate daily ambient temperature at the participant’s home address.
In a previous study (Zanobetti et al 2013) we found that temporally and spatially resolved black carbon (BC) and PM2.5 were
associated with increased risk ventricular ectopy (VE) in the Veterans Affairs (VA) Normative Aging Study (NAS). In this
follow up we investigated the association between fine scale spatial and temporal variation in temperature and VE episodes
study in the same population residing in the greater Boston area. We compared the estimated health effect estimates based on
our spatio-temporal exposure prediction model to those based on a single local weather monitor located at Boston Logan
Airport.
Methodology and Results This longitudinal analysis included 701 older men participating in the VA Normative Aging Study. Arrhythmia episodes
were measured as ventricular ectopy (VE) (bigeminy, trigemini or couplets episodes) by 4min electrocardiogram monitoring
in repeated visits during 2000-2010. The outcome was defined as having or not VE episodes during a study visit. We applied
a mixed effect logistic regression model with a random intercept for subject, controlling for seasonality, weekday, medication
use, smoking, diabetes status, body mass index and age. We also examined effect modification by personal characteristics,
confounding by air pollution, and the exposure-response function.
For 1° C increase in the same day residence-specific temperature, the odds of having VE episodes was 1.10 (95%CI: 1.04-
1.17). The odds ratio (OR) associated with 1° C increase in central temperature was 1.05 (95%CI: 1.02-1.09). The exposure-
response function was non-linear for averages of temperature, presenting a J-shaped pattern, suggesting greater risk at lower
and higher temperatures.
Conclusion This study provides evidence that temperature is associated with increased risk of ventricular arrhythmias, and that the use of
spatially resolved temperature data reduces downward bias due to exposure error.
Acknowledgement This work was supported by National Institute of Aging R21 AG040027-01, NIEHS grants P01 ES009825, P30 ES000002,
R21 ES020194-01. This work was also made possible by USEPA grant (RD-83479801). Its contents are solely the
responsibility of the grantee and do not necessarily represent the official views of the USEPA.
References Kloog I, Nordio F, Coull BA, Schwartz J. Predicting spatiotemporal mean air temperature using MODIS satellite surface
temperature measurements across the Northeastern USA. Remote Sens Environ. 2014;150:132–139.
Zanobetti A, Coull BA, Gryparis A, et al. Associations between arrhythmia episodes and temporally and spatially resolved
black carbon and particulate matter in elderly patients. Occup Environ Med. 2013;71(3):201–7.

167
SPECIAL SESSION – MODELLING AND
MEASURING NON-EXHAUST EMISSIONS FROM TRAFFIC

168

169
NON-EXHAUST CONTRIBUTIONS TO PM10 AND PM2.5 AT FIVE EUROPEAN CITIES
F. Amato (1), F. Lucarelli (2), S. Nava (2), G. Calzolai (2), A. Karanasiou (1), C. Colombi (3), V.L. Gianelle (3), C. Alves
(4), D. Custódio (4), K. Eleftheriadis (5), E. Diapouli (5), C. Reche (1), A. Alastuey (1), M.C. Minguillón (1), M. Severi (6), S.
Becagli (6), T. Nunes (7), M. Cerqueira (4), C. Pio (4), M. Manousakas (8), T. Maggos (8), S. Vratolis (8), R.M. Harrison
(9,10) and X. Querol (1)
(1) Institute of Environmental Assessment and Water Research (IDAEA-CSIC), Barcelona, 08034, Spain; (2) Dep.
of Physics and Astronomy, Università di Firenze and INFN-Firenze, Sesto Fiorentino, 50019, Italy; (3)
Environmental Monitoring Sector, Arpa Lombardia, Via Rosellini 17, I-20124 Milano, Italy; (4) Centre for
Environmental & Marine Studies, Dep. of Environment, Univ. of Aveiro, 3810-193 Aveiro, Portugal; (5) Institute
of Nuclear and Radiological Science & Technology, Energy & Safety, N.C.S.R. Demokritos, 15341 Ag. Paraskevi,
Attiki, Greece; (6) Dep. of Chemistry, Università di Firenze, Sesto Fiorentino, 50019, Italy; (7) School of
Geography, Earth & Environmental Sci., University of Birmingham. Edgbaston, Birmingham B15 2TT, UK; (8)
Department of Environmental Sciences / Center of Excellence in Environmental Studies, King Abdulaziz
University, PO Box 80203, Jeddah, 21589, Saudi Arabia
Presenting author email: [email protected]
Summary
Results of the PM10 and PM2.5 source apportionment at 3 urban background sites (Barcelona, Florence and Milan, BCN-
UB, FI-UB, MLN-UB) 1 sub-urban background site (Athens, ATH-SUB) and 1 traffic site (Porto, POR-TR) during 2013 are
presented. Road traffic (sum of vehicle exhaust, non-exhaust and traffic-related secondary nitrate) was the most important
source of PM10 (23-38% at all sites) and PM2.5 (22-39%, except for ATH-SUB and BCN-UB). Non-exhaust fraction
represented 8-11% of PM10 and 1-9% of PM2.5. The non-exhaust/exhaust ratio varied from 0.4 (at POR-TR) to the range 0-
8-1.2 at the SUB and UB sites. Non-exhaust profiles from PMF were compared to local road dust, brake pads and tires
composition revealing a main road dust origin in BCN and ATH and brake origin in POR, FI and MLN, probably due t the
drier climate of BCN and ATH. In addition short campaigns with 1 hour resolution PM elemental composition allowed
investigating intra-daily variability of non-exhaust contributions.
Introduction
There are still few source apportionment studies reporting non-exhaust contributions rather than total road traffic
contributions. Separating exhaust from non-exhaust is important in order to design different mitigation measures and
investigate health effects from distinct sources. Moreover source apportionment studies are often distinct in procedures and
direct comparison is not possible. The AIRUSE LIFE+ project offers the first results of an harmonized source apportionment
study at 5 South European cities using the same protocol (Milan, Barcelona, Porto, Florence and Athens).
Methodology and Results
PM measurements were carried out from January 2013 to February 2014, simultaneously at five urban stations in Barcelona,
Porto, Florence, Milan and Athens. PM10 and PM2.5 samples were collected simultaneously over 24 hours, every third day,
on quartz microfiber and/or Teflon filters. Then filters were destined for several analytical determinations( PIXE, ICP-MS,
ICP-AES, XRF, IC, TOT for determination of over 60 components of PM. Hourly samples of PM2.5 and PM2.5-10 were
collected with the streaker sampler, and analyzed by PIXE. Non-exhaust emissions from traffic contributed 2.9, 2.6, 3.4, 1.9
and 1.8 µg/m3 at Porto, Barcelona, Milan, Florence, and Athens on annual basis respectively. Day-to-day, intra daily
variability and non-exhaust/exhaust ratios were explored.
The Vehicle non-exhaust source generally shows a mixed composition, including crustal species (Fe, Ca, Al, Si among
others), carbon compounds (EC generally higher than OC) and trace elements (Cu, Zn, Mn and occasionally Sn, Sb and Ba)
from brake wear. However, rather dissimilar chemical profiles were found comparing different cities. Although the
enrichment in Fe is common to all the cities, the main component of NEX can be either Ca (in BCN-UB), EC (in POR-TR
and MLN-UB), OC (in FI-UB), or S (in Athens-SUB). These differences can be due to several factors:
• the proximity to the source: at the traffic site (POR-TR) the NEX source is dominated by the brake wear (EC)
• the climatic conditions: Ca is higher in drier regions (BCN-UB and ATH-SUB) due to the enhanced
resuspension, when compared to POR-TR and MLN-UB
• the type of materials used for brakes and road pavement (the higher OC in Florence might be due to higher
road wear compared to other cities).
• the “rotational ambiguity” of receptor modeling which may produce false bias.
Conclusions
Non-exhaust emissions were responsible for 8-11% of PM10 and 1-9% of PM2.5 concentrations at five South European
cities, on annual basis. Contributions were higher during days of exceedances of the PM10 daily limit value. Chemical
profiles indicated a main relation to road dust resuspension and brake wear.
Acknowledgement
This work was funded by the AIRUSE LIFE+ EU project.

170
ADVANCED RECEPTOR MODELLING TO QUANTIFY EXHAUST AND NON-EXHAUST TRAFFIC
EMISSIONS: RESULTS FROM A CASE STUDY IN FLORENCE (ITALY)
V. Bernardoni (1), G. Calzolai (2,3), A. Crespi (1), F. Lucarelli (2,3), S. Nava (3), G. Valli (1), R. Vecchi (1)
(1) Department of Physics, Università degli Studi di Milano, Milan, 20133, Italy; (2) Department of Physics, University of
Florence, Sesto Fiorentino (FI), 50019, Italy; (3) National Institute of Nuclear Physics, INFN – Section of Florence, Sesto
Fiorentino (FI), 50019,Italy
Presenting author email: [email protected]
Summary
An advanced receptor modelling (i.e. constrained multi-time ME-2) approach has been implemented to perform a source
apportionment study combining particulate matter datasets with different time resolution (Crespi et al. 2016). Results from
the application of the enhanced modelling approach to a case study will be presented focusing on the separation between
traffic exhaust and non-exhaust emissions.
The implemented approach was tested on a PM2.5 dataset composed of 24-hours samples collected during one year and
hourly data sampled in parallel for two shorter periods in Florence (Italy). The daily samples were chemically characterized
for elements, ions and carbonaceous components while elemental concentrations only were available for high-time resolved
samples. The application of the advanced model revealed the major contribution from traffic and allowed an accurate
characterization and estimate of the exhaust and non-exhaust emissions. Moreover, the comparison with the results computed
by ME-2 base model applied to daily and hourly compositional data separately demonstrated the advantages provided by the
multi-time approach.
Introduction
The most recent developments in monitoring techniques allow aerosol components measurement with higher and higher time
resolution; in particular, besides 24-h resolution data carried out in compliance with regulatory purposes, hourly samples of
different PM fractions can be collected by higher resolution instruments. Traditional multivariate techniques need to reduce
all data to a single time schedule; either the modeller has to average high-time resolution data over the longest sampling
interval - typically 24-h - or to interpolate the low-resolution data to the shortest sampling period. Therefore, the source
apportionment modelling is typically limited to the separate analysis of high-time or daily samples thus either important
source markers given by the complete chemical speciation often available on daily samples or the high-time resolution
information get lost.
In order to properly take into account all the temporal details provided by experimental data without averaging or
interpolating, an advanced receptor model was developed (Zhou et al., 2004) using Multilinear Engine (ME-2) which is a
flexible algorithm program implementing a scripting language able to solve multivariate receptor problems (Paatero, 1999).
By the multi-time approach, apportionment problems can be solved inserting each data value in its original time schedule.
Methodology and Results
Advanced receptor models have been recently developed and tested in order to improve the resolution of apportionment
problems reducing rotational ambiguity of results and aiming at identifying a larger number of sources.
By means of the flexibility of ME-2 program, in this work the multi-time model has been expanded 1) to perform a
continuation run; and 2) to assess uncertainties on the solutions. More precisely, during the continuation run physically
meaningful constraints can be imposed on the resolved sources in order to reduce rotational ambiguity and enhance the
problem solution. Usually the constraints derive from a-priori knowledge on the features of sources influencing the
monitoring site. The ME-2 model implemented in this work was applied to PM2.5 samples collected at a traffic site in
Florence (Italy) both with daily and hourly time resolution in the framework of the regional project PATOS2 - Particolato
Atmosferico in TOScana 2. Constrained multi-time ME-2 resolved seven factors which were assigned to traffic exhaust (36%
as annual average) and non-exhaust emissions (7%), biomass burning (21%), soil dust (4%), sulphate (16%), nitrate (12%),
and aged sea salt (4%). It is noteworthy that the ME-2 application to the daily and hourly resolution data separately did not
give the same detailed source apportionment results and, in particular, exhaust and non-exhaust traffic emissions cannot be
singled out separately.
Conclusions
This application of the enhanced ME-2 revealed the importance of developing advanced receptor models which could lead to
a better understanding of the sources impacting on a studied area. In particular, the multi-time model can be considered an
advantageous tool to resolve apportionment problems as high-time details allow to take into account fine scale variations of
specific tracers improving identification of factors and resolving in certain situations a greater number of sources.
References
Crespi A., Bernardoni V., Calzolai G., Lucarelli F., Nava S., Valli G., Vecchi R., 2016. Implementing constrained multi-time
approach with bootstrap analysis in ME-2: An application to PM2.5 data from Florence (Italy). Sci. Total Environ. 541, 502-
511.
Paatero P., 1999. The Multilinear Engine - a Table-driven Least Squares Program for Solving Multilinear Problems,
Including the n-way Parallel Factor Analysis Model. J. Comp. Graph. Stat. 8, 4, 854-888.
Zhou L., Hopke P.K., Paatero P., Ondov J.M., Pancras J.P., Pekney N.J., Davidson C.I., 2004. Advanced factor analysis for
multiple time resolution aerosol composition data. Atmos. Environ. 38, 4909-4920.

171
TURBIDITY AS A PROXY FOR ROAD SURFACE DUST LOAD (DL180)
G.Blomqvist, M.Gustafsson, S. Janhäll and I.Järlskog
Swedish National Road and Transport Research Institute (VTI) 58195 Linköping, Sweden
Presenting author email: [email protected]
Summary
Understanding the spatial and temporal distribution of the road dust load in cross sections of city streets is of importance in
order to abate problems with traffic induced PM10 emissions related to road dust. Methods for determining the road dust loads
are however time consuming and tedious, why a simple proxy would be of big help. Turbidity showed to be a possible proxy
for the city streets tested (R2=0.95).
Introduction
The wear of road surfaces from the use of studded tyres during winter time contributes to high levels of PM10 during dry
spring periods in Nordic cities. Some of this PM10 is directly emitted and some is suspended from the road dust depot, which
may have different origins but mainly consists of road wear particles. Understanding the road dust depot behaviour is
therefore important in order to understand the processes responsible for high PM10 levels, and therefore also the ability to
mitigate PM10. Road dust has been sampled in the city of Stockholm since 2011 (Gustafsson et al., these proceedings) and the
dust load of wheel tracks and in-between wheel tracks areas has been determined. The involved sample analysis methods are
however tedious and time consuming, why a faster proxy method would be desirable in order to determine the dust load in
entire street cross-sections instead of just the two segments wheel track and in-between wheel tracks. Therefore turbidity is in
this paper tested and evaluated as a proxy for road surface dust load.
Methodology and Results
Road dust is sampled with the VTI Wet Dust Sampler (WDS) (Jonsson et
al. 2008), which is based on a high pressure water appliance where the road
dust is cleansed from a confined area of the road surface and then
pneumatically flushed from the road surface to a sampling bottle (Figure 1).
At the laboratory the samples are sieved in order to get rid of particles
>180µm and thereafter filtered in Büchner funnels. The pre-weighed filters
are dried, weighed with the sample and burned at 550°C in pre-weighed
pots and the remains are determined by weighing the pots after burning. To
compare with the gravimetrically determined dust load, the turbidity of the
samples was measured before sieving at the laboratory with an infrared
light scattering (90°) turbidity meter (Lovibond PCH). The turbidity of the samples showed a nonlinear relationship to the dust
load (DL180), where a bend in the curve seemed to occur at approximately 200 FNU, which corresponded to a dust load of
approximately 100 g/m2. The data was fitted by a Hoerl equation (y=a·bx·xc) with a R-square coefficient of determination of
0.95.
Conclusions
Turbidity showed to be a possible proxy for the load of road dust on a road surface. The method should, however, be
evaluated also for road dust of different origins and during different seasons since this may affect the optical properties of the
suspended particles in the sample bottle.
Acknowledgement
This work was supported by the Swedish Transport Administration. We acknowledge Emelie Karlsson and Måns Kyhlbäck
for their help during sampling and/or analysis.
References
Jonsson, P., Gustafsson, M., & Blomqvist, G. (2008) Wet Dust Sampler: Technological innovation for sampling particles and
salt on road surface. Transportation Research Circular E-C126, Transportation Research Board, National Research Council,
Washington D.C. pp 102–111.
Fig.1 Sampling road dust load with Wet Dust Sampler
Fig.3 Calculated dust load with turbidity as proxy Fig.2 Relation between turbidity and dust load DL180

172
CONCENTRATIONS AND EMISSION FACTORS FOR PM2.5 AND PM10 FROM ROAD TRAFFIC IN SWEDEN
M. Ferm and K. Sjöberg
IVL Swedish Environmental Research Institute Ltd, P.O. Box 53021, SE-400 14 Gothenburg, Sweden
Presenting author email: [email protected]
Summary
Emission factors for PM10 and PM2.5 were estimated using NOX as a tracer. Monitoring data from kerbside and urban
background sites in Gothenburg during 2006-2010 and in Umeå during 2006-2012 were used. NOX emissions were estimated
from the traffic flow and emission factors calculated from the HBEFA3.1 model. PM2.5 constitutes the finer part of PM10.
Emissions of the coarser part of PM10 (PM10 - PM2.5) are supressed when roads are wet and show a maximum during spring
when the roads dry up and studded tyres are still used. Less than 1 % of the road wear caused by studded tyres give rise to
airborne PM2.5 -10 particles. The NOX emission factors decrease with time in the used model, due to the renewal of the vehicle
fleet. However, the NOX concentrations resulting from the roads show no clear trend. The emission factors for PM10
decreased with time, and the average factor was 0.06 g km-1 vehichle-1. The emission factors for PM2.5 are very uncertain due
to the small increments in PM2.5 concentration at the thoroughfares, and were on average 0.02 g km-1 vehichle-1.
Introduction
Airborne particles of the size fractions PM2.5 and PM10 are associated with health problems, such as cardiovascular disease
and chronic obstructive pulmonary disease. However, health risks related to wear particles have not yet received much
attention (Denier van der Gon et al., 2013). The main source of PM2.5-10 and NOX in Swedish cities is the local urban traffic.
Long-range transport of particles belonging to the accumulation mode is, however, the main source of urban PM2.5 in the
southern parts of Sweden. A high background concentration of PM2.5 is not only an issue when measures to reduce the
particle concentration are to be taken, but also when PM2.5 emissions from the road are quantified.
Methodology and Results
Particle concentrations were measured with TEOM (Tapered Element Oscillating Microbalance) instruments. NOX was
measured using chemiluminescent instruments with Mo-converters. Two cities with thoroughfares belonging to the
international E-road network were selected for this study. The E6 runs through Gothenburg in the south-western part of
Sweden and the E4 runs through Umeå situated in the north-eastern part of Sweden. NOX, PM2.5 and PM10 concentrations
were measured on an hourly basis at the two thoroughfares and the corresponding urban background stations. The traffic flow
of different vehicle categories was measured by inductive- loop sensors embedded in the pavement. While this is not the most
accurate technique, it was chosen due to the fact that it requires very little maintenance. Hourly averages of the speed and
traffic flow were measured for each vehicle category in each lane in the two cities. The measurements started in 2006 in both
cities and ended in 2010 in Gothenburg and in 2012 in Umeå. Equation 1 was used to estimate the emission factors for PM10
and PM2.5. Average emission factors during a certain week day, month, year etc. was not calculated using the arithmetic
average of hourly calculated emission factors for particulate matter (EFPMX), but from average arithmetic average
concentration increase of NOX and PMX at the road. This calculation resulted in more consistent averages compared to
arithmetic averages of hourly calculated emission factors.
X
XNOxPMx
NOΔ
PMΔEF=EF (1)
The diurnal variation of the traffic flow was very similar during all workdays, but the concentration varied widely due to the
large variation in the air dispersion. Air dispersion was estimated from the traffic flow and the NOX emission for each vehicle
category and the increased NOX concentration at the road. The average air dispersion was about three times as high in the
summer compared to winter and about three times as high during midday compared to midnight. The road wear is mainly
caused by cars with studded tyres. The pavement rutting has been measured with a non-contact laser profilometer that was
placed on fixed devices cast in the roadway. To estimate the fraction of the road abrasion caused by studded tyres that will
give rise to PM10 particles, EFPM10-EFPM2.5 was calculated for the periods November-April and May-October. The difference
between the two periods was 0.05 g km-1 vehichle-1 in Gothenburg and 0.02 g km-1 vehichle-1in Umeå. These emission
factors for EFPM2.5-10 are only 1.5 % and 0.8 % of the total road wear caused by studded tyres in Gothenburg and Umeå
respectively. These percentages may also include emission of road salt and reemission of road dust and abrasion caused by
e.g. sand on the roads.
Acknowledgement
This project has been funded by the Swedish Transport Administration. We would like to thank the personnel at the
Environmental Administration in Gothenburg and Department of Environmental Health, Umeå municipality for operating all
the urban measuring stations. Swedish Environmental Protection Agency has funded the background stations.
Reference
Denier van der Gon H.A.C., Gerlofs-Nijland M.E., Gehrig R., Gustafsson M., Janssen N., Harrison R.M., Hulskotte J.,
Johansson C., Jozwicka M. Keuken M., Krijgsheld K., Ntziachristos L., Riediker M., Cassee F.R., 2013. The Policy
Relevance of Wear Emissions from Road Transport, Now and in the Future—An International Workshop Report and
Consensus Statement. Journal of the Air & Waste Management Association 63, 136–149.

173
ROAD DUST LOAD VARIABILITY IN STOCKHOLM, SWEDEN
M. Gustafsson (1), G. Blomqvist (1), S. Janhäll (1), C. Johansson (2,3), M. Norman (3)
(1) Swedish National Road and Transport Research Institute (VTI) SE-58195 Linköping, Sweden, (2) Department of
Environmental Science and Analytical Chemistry (ACES), Stockholm University, SE-106 91 Stockholm, Sweden; (3) SLB-
analys, Box 8136, SE-104 20 Stockholm, Sweden
Presenting author email: [email protected]
Summary
Road dust is a main source to PM10 in Nordic cities, mainly originating in studded tyre road pavement wear and winter road
operations and makes up an important contribution to PM10 exceedances. Effective PM10 mitigation is therefore depending on
knowledge on road dust sources, properties and the dynamics of the road dust depot. This study presents variability in road
dust data measured in Stockholm streets during four seasons and its causes.
Introduction
The Nordic countries Sweden, Finland and Norway are experiencing regular high PM10 peaks in springtime attributed to
suspension of road dust formed during the winter season when studded tyres are used and winter road operations are frequent.
EU limit values are exceeded in some cities and intensive abatement measures has been taken to reduce the concentrations.
Stockholm has been the city with highest and most pronounced exceedances in Sweden and has also worked with an
abatement program since 2005. As part of the follow-up program, road dust load has been regularly measured and studied
resulting in a unique road dust load time series, presented in this
abstract.
Methodology and Results
Road dust was sampled and presented as DL180 (dust load smaller
than 180 µm) using the VTI wet dust sampler (WDS) (Jonsson et
al., 2008, Figure 1). Samples were taken in left wheel track and
between wheel tracks of four streets in Stockholm city between
October and May. The results show an annual variation with road
dust load peaks normally occurring in mid-winter and low road dust
loads in October and May (Figure 2). The amounts vary between a
few g/m2 in wheel tracks in October and May, to around 200 g/m2
between wheel tracks in early spring. The onset of the studded tyre
season (1st of October), beginning of winter road operation and the
wetter road surfaces during winter, increases the accumulated dust
amounts, while the end of the studded tyre season (15th of April) and removal of accumulated wear dust and winter sand
causes the decrease in spring. The surface in between wheel tracks normally has a higher dust load than in wheel tracks due
to the cleaning effect of passing wheels. Variability between streets are high, which has previously been shown to relate to
differences in road surface texture (e.g. Blomqvist et al., 2014). A thorough overview of road surface texture would improve
the possibility to abate road dust load as source to PM10 emissions.
Conclusions
Road dust load, measured as DL180, varies from a few to
over 200 g/m2 in Stockholm streets during October to
May. The dust load has a regular seasonal pattern which
is similar from year to year and co-varies with studded
tyre use but also relates to winter operation and humid
road surfaces during winter.
Acknowledgement
This work was supported by the City of Stockholm and the
Swedish Transport Agency.
References
Blomqvist, G. et al., 2014: PM10 emissions and road
surface dust load is influenced by road surface macro
texture, Abstract presented at the NOSA Aerosol
Symposium.
Jonsson P, et al., 2008. Wet Dust Sampler: Technological
Innovation for Sampling Particles and Salt on Road
Surface. 7th International Symposium on Snow Removal
and Ice Control Technology, Transportation Research
Circular E-C126: 102-111.
Fig.1 Road dust sampling using the VTI wet dust sampler
Fig.2 Road dust variation in two Stockholm streets 2011 – 2015.
For Hornsgatan also studded tyre share is shown.

174
ROAD CLEANING ABATING ROAD DUST –TEST OF ROAD SWEEPERS IN TUNNEL AND STREET
S. Janhäll (1), M. Gustafsson (1), B. Snilsberg (2)
(1) VTI – Swedish National Road and Transport Research Institute, , SE-581 95 Linköping, Sweden; (2) Norwegian Public
Roads Administration, P.O. Postboks 8142 Dep, NO-0033 OSLO, Norway
Presenting author email: [email protected]
Summary
This study aims to quantify the changes in road dust load (DL180) in a tunnel and at a street from cleaning the surface with
three different road sweepers. Dust load (DL180) is measured using a Wet Dust Sampler (WDS) that collects the dust by high
pressure distilled water, and then analyse the weight and the particle size distribution. The analysis shows that there is a large
difference in the effect on dust load between different road sweepers, but also between the tunnel and the street. At the street
two of the sweepers reduce the dust load efficiently, while one road sweeper didn’t succeed in road dust removal. In the
tunnel the measured road dust load generally increased after the cleaning. The possible reasons for this is discussed in the
presentation.
Introduction
Particle pollution is closely related to health issues and in the Nordic countries the road dust is an important source of air
particle pollution. Thus, efforts are made to reduce the road dust load, in order to limit the emissions of road dust into the air.
The importance of road dust as a source of particle air pollution in other countries is growing as exhaust emissions of
particles is regulated and reduced. The abatement strategies used in the Nordic countries will then be of increasing
importance also to other countries with high dust loads.
Methodology and Results
Road dust is sampled using the Wet Dust Sampler (WDS), developed at VTI, Sweden (Jonsson et al, 2008) that has the
possibility to sample road dust equally efficient from a dry and a wet road surface. The sampler is used to collect road dust in
distilled water, which is analysed in laboratory for total weight per area and size distribution. The maximum dust size
analysed is 180 µm diameter and the size distribution is measured using a laser granulometer, Mastersizer 2000. During the
sampling the road lane is closed for
safety reasons. The measurement
campaign included many other
aspects of road cleaning in tunnel and
at street, but this presentation focus
on the effects on road dust.
Strindheimtunnelen, Trondheim, was
divided into three different test road
stretches, and the road dust load at
each of the stretches was analysed
using the WDS. Then each test
street was cleaned with one of three
machines and the road dust at each surface was analysed again, now shifted slightly in location in order not to sample road
dust where it was recently sampled. The same set up was used for the street campaign at Haakon VII Gate in Trondheim the
following night.
Figure 1 shows the measured road dust before (blue) and after (orange) the cleaning for one of the tested road sweepers. The
result was very convincing for the street study, while the tunnel study results were disappointing. The distribution of road
dust over the transect of the road is also shown in Figure 1, as the wheel tracks in both studies has a lower load of dust, due to
the transport of the dust from the wheel track by the movement of traffic. The reason for the very low road dust load on the
banquette is that this is an area close to the asphalt but made of concrete and thus without a large texture that can collect road
dust. On the street instead the dust can be collected at the road close to the walking path, as the dispersion of the dust is
limited close to the curbstone.
Conclusions
The different cleaning equipment did not have the same efficiency in removing road dust. At the street the road dust was
removed efficiently using two out of three tested road sweepers, while the tunnel cleaning was not successful for road dust
removal. For most of the sweepers the road dust concentration instead increased by cleaning.
Acknowledgement
This work was supported by Norwegian Public Roads Administration, Norway. We acknowledge Karl Andersson and
Thomas Lindström for their help during sampling and Ida Järlskog for analysis.
References
Jonsson P, Blomqvist G, Gustafsson M. 2008 Wet Dust Sampler: Technological Innovation for Sampling Particles and Salt
on Road Surface. Seventh International Symposium on Snow Removal and Ice Control Technology, Transportation Research
Circular; E-C126: 102-111.
Fig.1 Road Dust, DL180, before and after cleaning with the same machine; street and tunnel.

175
DUST EMISSIONS FROM HEAVY VEHICLE TRAFFIC ON PAVED INDUSTRIAL ROADS
U. Klenk (1), H. Holst (2)
(1) Institute of Particle Technology (IPT) at University of Wuppertal, 42097 Wuppertal, Germany; (2) North Rhine
Westphalian State Agency for Nature, Environment and Consumer Protection (LANUV), 45659 Recklinghausen, Germany
Presenting author email: [email protected]
Summary
To calculate emission factors for dust emissions from heavy vehicle traffic on paved industrial roads, Standard VDI 3790
Part 3 refers to a method of calculation of the US EPA. To check this method and possibly adapt, a working group within the
Association of German Engineers (VDI) was established. As objective of the Working Group a new Standard VDI 3790
Part 4 will be created. As a basis for testing and adaptation of the emission factors model the Institute of Particle Technology
at the University of Wuppertal completed a study on the verification of the US EPA model by field measurements in
cooperation with the North Rhine Westphalian State Agency for Nature, Environment and Consumer Protection (LANUV).
For this purpose, a measuring method has been developed which simplifies the measurement of the dust emissions. This
method and the results of the measurements are presented here.
Introduction
For the calculation of non-motor dust emissions of trucks on paved roads within industrial sites, the currently valid Standard
VDI 3790 Part 3 refers to the calculation method of the US EPA AP-42 directive (section 13.2.1). This method is based on
site-specific parameters (road surface silt loading, days with precipitation) and fleet-specific parameters (average weight of
the fleet).
E = k sL( )0.91
×W1.02éë
ùû× 1-
P
4 × N
æ
èç
ö
ø÷
E: particulate emission factor
k: particle size multiplier for particle size range
sL: road surface silt loading / g m-2
W: average weight (tons) of the vehicles traveling the road
(US short ton: 907.18 kg)
P: number of "wet" days with at least 0.254 mm (0.01 in) of
precipitation
N: number of days in the averaging period
The velocity of vehicles is not a factor in this model, but was used for
the calculation of the two exponents. This was point of criticism
(e. g. Venkatram 2000).
Methodology and Results
The EPA approach for the calculation of emission factors for paved
roads is based on a limited data collection (e. g. Klenk 2013). To
determine the applicability of the US EPA AP-42 calculation method
for European industrial sites, a method for the measurement of the
dust emissions was developed (Fig. 1) and used for two different kind
of trucks at four different weights and up to four different velocities.
Fig. 2 shows as an example the particle number concentration for a
scattering equivalent particle diameter > 2 µm for one truck at two
different weights and three different vehicle velocities. It can be seen,
that weight and velocity is an important factor for the calculation of
emission factors.
Conclusions
The calculation of emission factors for the test vehicles based on the measurements are for a vehicle velocity of 30 km h-1 at
the same order like the emission factors calculated based on the US EPA AP-42 equation. This shows, that the EPA-42
calculation method of emission factors from heavy vehicle traffic on paved roads within industrial sites is an applicable and
simple approach under usual conditions (Klenk 2013). But it has to be discussed, if more parameters should be used in the
equation, e. g. for the velocity and other methods of dust control. Another grouping of vehicle speeds (and masses, not shown
here) will lead to other exponents in the equation. This work will show the fundamentals for those further discussions.
References
Klenk U., 2013. Staubemissionen durch LKW-Verkehr auf befestigten Betriebsstraßen. Untersuchungen zur Anwendbarkeit
der US EPA AP-42 Richtlinie. LANUV Fachbericht 45.
US EPA AP-42, 2011. Fifth Edition, Volume I Chapter 13: Miscellaneous Sources.
VDI 3790 Part 3, 2010. Environmental meteorology - Emission of gases, odours and dusts from diffuse sources - Storage,
transhipment and transportation of bulk materials.
Venkatram A., 2000. A critique of empirical emission factor models: a case study of the AP-42 model for estimating PM10
emissions from paved roads. Atmos. Env. 34(1), 1-11.
Fig.1 Passage for dust measurements
Fig. 2 e. g. dust concentration depending on velocity

176
EVALUATION OF AIR POLLUTION BY PM10 AND PM2.5 ON ST. PETERSBURG RING ROAD: MOBILE
MEASUREMENTS AND SOURCE APPORTIONMENT MODELLING
O.V. Lozhkina, N.V. Nevmerzhitsky, V.N. Lozhkin
St. Petersburg University of State Fire Service of EMERCOM of Russia, 196105, Moskovsky, 149, St. Petersburg, Russia
Presenting author email: [email protected]
Summary
The aims of the present study were: 1) to estimate the level of PM10 and PM 2.5 concentrations in the air on St. Petersburg
Ring Road in spring 2015; 2) to evaluate the effect of rain and road washing on PM level; 2) to quantify exhaust / non-
exhaust emissions by combining experimental and calculating approaches. The study reveals that road dust resuspension in
combination with other non-exhaust emissions (brake wear, tire wear, road surface wear) may become a key source of
excessive PM concentrations at dry weather conditions in St. Petersburg. Thus, it demonstrates the need to proceed with
investigations in order to develop a suitable modelling approach for the calculation of traffic related non-exhaust emissions of
particulate matter.
Introduction
Despite, that weather conditions are mostly favourable for the precipitation of PM pollutants, the problem of excess PM10
and PM2.5 air pollution on the roads is significant for St. Petersburg in early spring when the roads are covered with huge
dust-deposits accumulated through the winter. In this case, road dust resuspension contributes considerably to particle
concentrations in the air. At the same time, a widely used national calculating methodology for the calculation of road
transport related air pollution considers only exhaust PM10 and underestimates, thus, the modelled PM concentrations in
comparison with the measured ones [1], highlighting the need to investigate non-exhaust emissions and their sources.
Considering this, we measured PM10 and PM2.5 concentrations and quantified exhaust / non-exhaust emissions at different
weather conditions using experimental and calculating approaches.
Methodology and Results
Two laser DUCTTRAK 8530 (TSI Incorporated / USA) spectrometers were used for the simultaneous mobile measurements
of PM10 and PM2.5 concentrations on St. Petersburg Ring Road (SPbRR) with traffic volume 7500-12000 vehicle per hour
and the share of heavy duty vehicles (HDV) ranging within 6-23%. The investigations were carried out at different weather
conditions in March, April and May 2015: (1) Dry sunny day after 8 dry days in March (high visible level of dusting); (2)
Dry sunny day after night drizzle in March (high visible level of dusting); (3) Dry sunny day after some rainy days and road
washing in April; (4) Rainy day after road washing in April; (5) Dry sunny day after some rainy days and road washing in
May.
Table 1. Average PM at different weather conditions on SPbRR
The measured PM10 concentrations exceeded LV24h (24
hours Limit Value) by 2.8-3.9 times and PM2.5 – by
2.4-3.3 times in March 2015. After some rainy days and
washing, the PM concentrations have fallen below LV.
At the same time, the share of PM2.5 has increased
from 49.6 % in March to 77.7 % in May, indirectly
Average PM,
µg/m3
Conditions of PM monitoring / date
1/19.03 2/20.03 3/06.04 3/14.04 4/24.05
PM10 236 167 59 38 27
PM2.5 117 84 31 25 21
PM2.5/PM10 0.496 0.503 0.525 0.657 0.777
showing the trend of the increasing share of exhaust PM. This trend
was confirmed by numerical experiments carried out using modified
versions of the National models MAGHISTRAL 3.0 and ECOLOG
4.0. The results have shown that the share of combined non-exhaust
PM10 emissions (52 %), including brake wear (6 %), tire wear (6.5
%), road surface wear (RSW) + resuspension emissions (39.5 %), was
higher than the share of exhaust PM10 (48 %) in the middle of March
2015 (Fig. 1). Road cleaning activities and rainy weather resulted in
the lowering of PM10 concentrations to 20-30 µg/m3 and in the
decline of the share of the resuspended PM10 to 14 % in May 2015.
As expected, the use of on-road PM measurements and data on the
real volume and structure of the traffic flows on SPbRR has
significantly improved the results of calculations. Fig.1 Source apportionment of PM 10 emissions.
Conclusions
The study has shown that non-exhaust emissions have a considerable air polluting effect in St. Petersburg, especially, in early
spring. Hence, there is a need to develop a model forecasting road resuspension emissions in order to contribute to the
optimization of environment quality management in the Russian Federation.
References
O.V. Lozhkina, V.N. Lozhkin, 2015. Estimation of road transport related air pollution in Saint Petersburg using European
and Russian calculation models. Transport. Res. Part D 36, 178-189.

177
MODELLING ROAD DUST EMISSION ABATEMENT MEASURES USING THE NORTRIP MODEL: VEHICLE
SPEED AND STUDDED TYRE REDUCTION
M. Norman (1), I. Sundvor (2), B.R. Denby (3), C. Johansson (1,4), M. Gustafsson (5), G. Blomqvist (5) and S. Janhäll (5)
(1) Environment and Health Protection Administration of the city of Stockholm, Sweden; (2) The Norwegian Institute for Air
research (NILU), Norway; (3) The Norwegian Meteorological Institute (MET), Norway; (4) Dep. of Applied Chemistry and
Environmental Sciences, (ACES) Sweden; (5) Swedish National Road and Transport Research Institute (VTI), Sweden
Presenting author email: [email protected]
Summary
We used the NORTRIP model to analyse the impact of real world abatement measures on non-exhaust traffic induced
particles. The model well reproduces the observed concentration including the effects of the measures. At RV4 in Oslo the
decrease in PM10 concentration could be attributed to the reduction in speed signage. At Hornsgatan in Stockholm a ban on
the use of studded tyres had the most significant effect in the reduction of observed PM10 concentrations.
Introduction
Non-exhaust traffic induced particle emissions are known to contribute significantly to the total concentrations of PM10. The
problem in Nordic countries is most related to studded tyre wear, the build-up of road dust during the wet winter period and
the subsequent suspension of this dust during the dry spring period. A number of abatement measures have been introduced
to reduce road dust emissions in the Nordic countries including speed regulations and regulations in the use of studded tyres.
Methodology and Results
The NORTRIP road dust emission model (Denby et al., 2013) is a coupled road dust and surface moisture model that
describes a range of processes related to the generation and removal of dust and salt on the road surface as well as their
subsequent suspension and emission. In this paper we apply the NORTRIP model to analyse real world abatement measures.
RV4 is a major arterial road into Oslo with an average daily traffic (ADT) of over 40 000 veh/day. Speed signage was
changed prior to the winter of 2005 which resulted in an observed change of average speed from 75 to 65 km/hr. Hornsgatan
is a street canyon in Stockholm with an ADT of 29 000 veh/day in 2007. From 2010 the Stockholm city council introduced a
studded tyre ban which reduced the maximum number of vehicles using studded tyres from 70% in 2009 to 27% in 2014. At
the same time traffic volume dropped significantly to 22000 in 2011.
Fig. 1 Left: Summary statistics of the calculations for Hornsgatan. Right: Changes in various traffic and meteorological parameters and their
separate influence on the net mean concentrations relative to 2007.
The NORTRIP model reproduces well both the mean and the 90th percentile concentration for both sites and for all years.
Sensitivity studies using the model found that for RV4 the reduction in speed and the studded tyre share are the major
contributors to the reduction in concentrations for 2005 while for 2006 the reduction is dominated by the meteorological
conditions. For Hornsgatan the combination of studded tyre share and traffic volume reduction are the major driving changes
in reducing the emissions in the years following the introduction of the studded tyre ban in 2010. However, the impact of
meteorology in the last four years tends to increase the concentrations, relative to 2007.
Conclusions
By using the NORTRIP model we could show that a reduction in speed was a major contributing cause for reduction in
observed PM10 concentration at RV4 in Oslo. It was also shown that the introduction of studded tyre ban on Hornsgatan in
Stockholm was the major cause for reduction in observed PM10, although the impact of meteorology enhanced the
concentrations.
Acknowledgement This project was founded by the Nordic council of Ministers.
References
Denby, B.R., et al., (2013). A coupled road dust and surface moisture model to predict non-exhaust road traffic induced
particle emissions (NORTRIP). Part 1: road dust loading and suspension modelling. Atmos. Environ. 77, 283-300.
0
10
20
30
40
50
60
70
80
90
100
2007 2008 2009 2010 2011 2012 2013 2014
Co
nce
ntr
atio
n (µ
g/m
3)
Year
Hornsgatan net mean and 90'th percentile concentration
Observed mean
Modelled mean (mod moisture)
Modelled mean (obs moisture)
Observed 90'th per
Modelled 90'th per (mod moisture)
Modelled 90'th per (obs moisture)
-80
-60
-40
-20
0
20
40
2007 2008 2009 2010 2011 2012 2013 2014
Rel
ativ
e ch
ange
co
mp
ared
to
20
07
(%
)
Year
Change in traffic parameters and meteorology
Speed
ADT
Studded tyre share
Total traffic
Modelled meteo (mean)
Modelled meteo (90 per)

178
CHARACTERIZATION OF PRIMARY PARTICULATE VEHICULAR EMISSIONS IN AN URBAN TUNNEL IN
NAPLES, ITALY
A. Riccio(1), E. Chianese(1), D. Monaco(1), M.V. Prati(2), M.A. Costagliola(2), G. Perretta(2), L. Shindler(3), G. Agrillo(3),
D. Gasbarra(3), A. Esposito(3), L. Carlucci(3), M. Tosca(3), A. Nanni(4), G. Brusasca(4), C. Pozzi(4)
(1) Università di Napoli “Parthenope”, Centro Direzionale, Isola C4, Napoli; (2) Istituto Motori (IM-CNR) Via Marconi 4,
Napoli; (3) Istituto per i Sistemi Agricoli e Forestali del Mediterraneo (ISAFoM-CNR) Via Patacca 85, Ercolano (Napoli);
(4) ARIANET Srl, Via Gilino 9, Milano
Presenting author email: [email protected]
Summary
The principal local source of particulate matter in many European cities is road traffic. Emissions from road traffic result in
enhanced levels of particulate matter in urban areas and in particular near trafficked locations. In general, trafficked sites are
the most likely locations for PM10 levels to exceed the European Union (EU) annual limit value of 40 g/m3.
Road traffic emissions consist of exhaust and non-exhaust components; non-exhaust component comprises emissions due to
tear/wear of vehicle parts such as brake, tyre and clutch, road surface abrasion and re-suspension of dust, and contribute
primarily to the coarse mode of PM (PM2.5-10), while exhaust emissions, e.g. emissions from the tailpipe, contribute
predominantly to fine PM (aerodynamic diameter < 2.5 m).
Until the early 1990s, road transport emissions were dominated (80-90%) by exhaust emissions. Since then, most of the
research, as well as policy action, has largely focused on exhaust emissions, and stringent regulations and technological
upgrades have resulted in a decline of the percentage contribution of vehicle tailpipe emissions to total ambient PM
concentrations. Presently, it has been estimated that non-exhaust emissions may contribute up to 50% of local road traffic
emissions.
In order to estimate the relative contribution of exhaust and non-exhaust emissions, on-road PM mass samples were collected
during an experimental campaign in March of 2015 in the ‘4 giornate’ tunnel in Naples, Italy. This tunnel is part of the
heavy-trafficked urban road network, connecting the city center to suburbs. Two sets of samples were collected at both sides
of the tunnel, each set representing the daily cycle at a 1 hour time resolution. Distance-based – mass per kilometer – and
fuel-based – mass per burned fuel – emission factors (EFs) were calculated using mass concentrations, traffic flow rates and
wind speed as a function of fleet composition. Also, chemical analysis was performed for polycyclic aromatic hydrocarbons
(PAHs) and trace elements.
Average particle mass concentrations in the tunnel atmosphere were more than 5 times higher than in the outside urban
background air, revealing its origins almost exclusively from fresh vehicle emissions.
While EFs for most of gas species were within the range of expected values, the present study found much higher EFs for
particulate matter. This suggests that the sampling methods employed in this campaign are more efficient at capturing
particles from sources such as resuspended road dust and wear from tires and brakes, which are usually not included in
traditional sampling methodologies for assessing vehicular emissions (e.g. dynamometer studies).

179
THE LOWBRASYS PROJECT: PARTICLE MEASUREMENT PROCEDURE FOR BRAKE EMISSION TESTS
F. Riccobono (1), T. Grigoratos (1), G. Perricone (2), G. Straffellini (3), J. Wahlström (4) and the LOWBRASYS Consortium
(1) Joint Research Centre, Ispra, 21027, Italy; (2) Brembo, Curno, 20035, Italy; (3) University of Trento, Trento, 38122,
Italy; (4) The Royal Institute of Technology, Stockholm, 10044, Sweden
Presenting author email: [email protected]
Summary
This study will present the overview of the Lowbrasys project and the particle measurement procedure developed within the
project to sample brake wear particles. The Lowbrasys project aims at demonstrating a novel and low environmental impact
brake system to reduce micro and nanoparticles emissions. In order to estimate an accurate emission reduction factor we
developed a solid repeatable, reproducible and representative of real driving brake emission measurement procedure.
Introduction
Road traffic contributes to the total anthropogenic PM emissions as exhaust and non-exhaust (e.g. tyre, brake and road wear,
resuspension) particles. Growing road traffic in Europe might entail detrimental effects on air quality, the environment and
public health. Due to increasingly stringent EU policies on vehicle exhaust emissions (e.g. Regulations (EC) No 715/2007,
No 459/2012, No 443/2009), fleet renewal and implementation of modern technologies (e.g. diesel particulate filter), exhaust
emissions have been constantly decreasing in the last decades. But while PM originating from exhaust gases emission have
been targeted by EU Legislation, the same cannot be said for PM emissions related to non-exhaust sources – including the
ones from vehicles’ brake systems by wear and friction phenomena - which are expected to rise in the future due to higher
volume of traffic, if current technologies apply. Brake wear is estimated to contribute approximately 16-55% by mass to non-
exhaust traffic-related emissions in urban locations (Grigoratos and Martini 2014). The large uncertainty on the figures is
mainly due to the intrinsic complexity of the underlying phenomena, the scarcity of data, while in other cases the results
reported in the publicly available studies are not consistent or even are contrasting as a consequence of the use of different
measurement techniques and sampling procedures. The challenge is therefore to demonstrate a new generation of
technologies that are capable of reducing traffic generated particle emissions and, at the same time, advancing the knowledge
and establish framework conditions for potential future legislations on vehicle generated particle emissions and EU air
quality.
Methodology and Results
The goal of demonstrating the novel and low environmental impact brake system is achieved through the following targets:
1. Novel materials formulations of the brakes pad and disc in order to reduce the total particle emissions (increased wear
resistance) and have a low-environmental impact at the same time.
2. Innovation of environmental friendly braking strategies (control systems) that optimise the vehicle braking action and
reduce the particle emissions, based on identified particle emission mechanisms.
3. New technology for capturing particles near
the PM source in order to further reduce PM
emissions.
4. System integration and testing of the novel
pad, discs, components and control systems in
vehicles, following an incremental approach,
from demonstration of single components to
testing on two types of vehicles in indoor
simulated test bench with realistic cycle up to
real world tests.
5. Improvement of the measurement
techniques and understanding of the brake
wear PM effects on health and the
environment through state-of-the-art non-in-
vivo techniques creating related policy
recommendations.
6. System analysis in terms of cost and environmental effects, through Life Cycle Costing, Life Cycle Assessment and full
cost-benefit analysis of the proposed solution vs. current situation to evaluate potential monetary benefit associated with the
targeted PM emission reduction.
The effect of the innovation on the emission reduction for different PM fractions is shown in Figure 1.
Acknowledgement
This project has received funding from the European Union’s Horizon 2020 research and innovation programme under grant
agreement No 636592.
References
T. Grigoratos and G. Martini; Non-exhaust traffic related emissions-Brake and tyre wear PM; JRC Science and Policy report;
ISBN 978-92-79-38303-8. doi:10.2790/22000, 2014.
Fig.1 contribution of LOWBRASYS innovations to PM fractions

180
THE ROLE OF DUST BINDING IN CUTTING DOWN PM10 CONCENTRATIONS IN URBAN AMBIENT AIR:
CASE HELSINKI CITY CENTRE
R. Ritola1, K. Kupiainen1,5, L. Pirjola2, J. Niemi3, A. Stojiljkovic1, A. Malinen2, J-P. Männikkö4
(1) Nordic Envicon Ltd, (2), Metropolia University of Applied Sciences, (3) Helsinki Regional Environmental Services
Authority, (4) Helsinki City Environmental Centre, (5) Finnish Environment Institute (SYKE)
Presenting author email: [email protected]
Summary
Concentrations of respirable particles (PM10) in Helsinki city centre have been declining during past ten years and one of the
main reasons is considered to be improved street maintenance actions against street dust, especially dust binding. Dust
binding can cut down acute emissions after treatment by up to 40-90% (REDUST, 2014). A trend study was carried out for
two different PM10 datasets from Helsinki city centre: (1) ambient air PM10 monitoring results and (2) street surface
emissions measured with mobile laboratory Sniffer from 2006 to 2014. For both datasets the trend is decreasing and
significant. Also the number of days when daily average PM10 concentration has exceeded the limit value (50 ug/m3) in
Helsinki city centre monitoring station has decreased.
Introduction
Street dust is a significant source of PM10 in urban traffic environments. This is the case especially in the Nordic countries
where mineral particles from pavement wear and traction control materials accumulate to street environment during winter
and are released in large quantities to urban ambient air during spring months. Additional measures are needed to mitigate
PM10 emissions from street dust. The number of exceedance days (air quality threshold value) of PM10 was exceeded in
Helsinki in 2006. In recent years both the concentrations of respirable particles (PM10) and the number of limit value
exceedance days have been declining in the Helsinki city centre. External factors (e.g. weather) affect the yearly variations,
but a significant part of the positive development is linked to improved street maintenance actions, especially dust binding.
Methodology and Results
PM10 emission levels close to the street surface (street dust emissions) were measured with mobile laboratory Sniffer (Pirjola
et. al 2009). Sniffer measures on a specific route in Helsinki city centre approximately once a week during spring months.
The official PM10 air quality data (FH 62 I-R monitor) in Helsinki city centre is measured by the Helsinki Region
Environmental Services Authority (HSY). A trend analysis for both ambient air and street surface concentrations was done
using the Microsoft Excel template MAKESENS developed at the Finnish Meteorological Institute for detecting and
estimating trends in the time series of annual values of atmospheric and precipitation concentrations (Salmi et al. 2002).
The use of dust binding in the Helsinki city center has increased significantly in recent years: from average three times in
2006 up to 35 times (in 2012). In the REDUST demonstration tests the effectiveness of dust binding was measured from the
street surface (Sniffer) and along the test street with six pairs of PM10 Osiris monitors. Results from the dust binding tests
show that it is possible to prevent dust emissions from the street surface and cut down acute emissions from 40% (targeted
spreading) to even 90% (solution spread throughout the lane) when the initial level of street dust is high. Reductions in the
PM10 emission levels were also detected with the streetside air quality measurements. (REDUST, 2014)
A trend analysis was done for PM10 air quality results and for Sniffer street surface PM10 emissions. For both data sets 95th
percentiles were used. The 95th percentile of the PM10 monitoring results is considered to be attributable to street dust (Anttila
et al. 2010). In the Sniffer data, 95th percentile excludes the lowest of the measuring results, which might be attributable to
rainfall or other seasonal or meteorological factors. For both datasets the trend is decreasing and significant during the
studied period. The number of exceedance days of PM10 daily limit value level (50 μg/m3) at the Mannerheimintie air quality
monitoring station is also decreasing. The decline is obvious especially for the spring period (Niemi et. al, 2014).
Conclusions
We have observed a decreasing trend in PM10 concentrations and resuspension emissions in the Helsinki city center. Dust
binding has been demonstrated to be very efficient in reducing PM10 emissions and the trends observed in the Helsinki center
have been linked with increasing use of dust binding (CaCl2) during the study period.
References:
Anttila P., Tuovinen J-P. 2010. Trends of primary and secondary pollutant concentrations in Finland in 1994–2007.
Atmospheric Environment 44 (2010) 30–41.
Pirjola L., Kupiainen K.J., Perhoniemi P., Tervahattu H. and Vesala H., 2009. Non-exhaust emission measurement system of
the mobile laboratory SNIFFER. Atmospheric Environment 43, 4703-4713.
REDUST 2014. Action 1 and 2 final report – Demonstration tests, main results and conclusions. Available on www.redust.fi.
Niemi J., Ritola R., Kupiainen K., Pirjola L., Kousa A., Männikkö J-P. 2014. REDUST Action 3 final report – PM10 dust
emission estimates for current measures and estimation of emission reductions due to additional measures.
Salmi, T., Määtta, A., Anttila, P., Ruoho-Airola, T., Amnell, T., 2002. Detecting Trends of Annual Values of Atmospheric
Pollutants by the Mann-Kendall Test and Sen’s Slope Estimates – the Excel Template Application MAKESENS.
Publications on Air Quality No. 31. Finnish Meteorological Institute, Helsinki.

181
NEW DEVELOPMENTS AND APPLICATIONS OF THE NORTRIP ROAD DUST EMISSION MODEL
B.R. Denby (1), M. Gustafsson, G. Blomqvist, S. Janhäll, M. Norman, C. Johansson, C. Bennet, M. Ketzel, I. Sundvor. K.
Kupiainen, A. Stojiljkovic, A. Karppinen, J. Kukkonen, M. Kauhaniemi, L. Pirojola, H. Parviainen
(1) Norwegian Meteorological Institute. PO BOX 43 Blindern, 0313 OSLO, Norway
Presenting author email: [email protected]
Summary
The NORTRIP model is an integrated road dust emission and road weather condition model developed in co-operation with
ten institutes in four Nordic countries. The model is used in a range of applications related to road dust emissions and road
surface conditions. In this paper an overview of the model and recent developments is provided along with a number of
example applications including the impact of traffic speed, studded tyre share and dust binding activities on road dust
emissions. In addition a comparison between observed and modelled road dust loading, road salt emissions and road surface
conditions is presented. The model is unique in its ability to quantify these parameters and processes, describing the intricate
coupling of non-exhaust emissions and road surface conditions.
Introduction
Non-exhaust emissions from traffic continue to be a significant source of PM emissions. Whilst exhaust emissions are
regulated by legislation there are currently no controls over non-exhaust emissions. Typical sources of non-exhaust include
road, brake and tyre wear but also other sources such as emissions of salt, used for de-icing of road surfaces in winter, can
also contribute. In order to better understand these emissions and to develop methods for optimal mitigation the NORTRIP
emission model, a coupled road dust and road condition model, has been developed (Denby et al., 2013). In this paper we
present an overview of the latest developments and show a range of recent example applications.
Methodology and results
Example applications of the model include:
Calculation of non-exhaust emissions and road surface dust loading for air quality assessment and forecasting
Assessment of measures, e.g. vehicle speed and studded tyre share reductions, for mitigating road dust emissions
Calculation of road surface salt loading and its contribution to PM10 emissions
Quantification of the impact of dust binding agents on surface conditions and PM10 emissions
Prediction of road surface temperature and conditions
Dust binding: An observational comparison of PM10 concentrations
near two roads in Stockholm, where dust binding was and was not
applied, showed that concentrations of PM10 were reduced be roughly
32% due to dust binding. Application of the model to these roads
shows that the model reproduces this reduction well, verifying that it
can quantify the impact of dust binding on PM10 emissions.
Salt emissions: A comparison of modelled and observed salt
concentrations in PM10 at four different road sites indicates that
the model can reproduce some, but not all, of the observed salt
concentrations. The results are shown to be primarily sensitive to
the road salting activity data used as input but also to a number of
the model parameterisations, concerning drainage and vehicle
spray, and the quality of the input meteorological data.
Dust loading: The model prediction of road dust loading is
compared to measurements of road surface dust a two streets in
Stockholm, where in wheel track and between wheel track
measurements have been performed. The results indicate that the
model can correctly predict road dust loading to within a factor of
two. Quantification of the road dust loading is unique to the
NORTRIP model.
Conclusions
The model has been shown to reproduce many of the processes related to road dust emissions and road surface conditions.
The model will be further developed and applied for both road weather and air quality management applications.
References
Denby, B.R., Sundvor, I., Johansson, C., Pirjola, L., Ketzel, M., Norman, M., Kupiainen, K., Gustafsson, M., Blomqvist, G.,
Kauhaniemi, M., Omstedt, G. (2013) A coupled road dust and surface moisture model to predict non-exhaust road traffic
induced particle emissions (NORTRIP). Part 2: Surface moisture and salt impact modelling. Atmos. Environ., 81, 485-503.
doi:10.1016/j.atmosenv.2013.09.003. http://www.sciencedirect.com/science/article/pii/S1352231013006912

182
THE RELATIVE IMPORTANCE OF TAILPIPE AND NON-TAILPIPE EMISSIONS ON THE OXIDATIVE
POTENTIAL OF AMBIENT PARTICLES IN LOS ANGELES, CA
Farimah Shirmohammadi1, Sina Hasheminassab1, Dongbin Wang1, James J. Schauer2, Martin M. Shafer2, Ralph J. Delfino3,
Constantinos Sioutas1
(1)University of Southern California, Department of Civil and Environmental Engineering, Los Angeles, CA, USA; (2)
University of Wisconsin-Madison, Environmental Chemistry and Technology Program, Madison, WI, USA; (3) University
of California, Irvine Department of Epidemiology, School of Medicine, Irvine, CA, USA
Presenting author email: [email protected]
Summary
This study examines the associations between the oxidative potential of ambient PM2.5 and PM0.18, measured by means of the
dithiothreitol (DTT) assay, and their chemical constituents and modelled sources in two sampling sites in Los Angeles (LA)
Basin. Multiple linear regression analysis (MLR) on DTT data and the identified Molecular Marker-Chemical Mass Balance
(MM-CMB) derived sources along with sources of vehicular abrasion, crustal material, sea salt and secondary ions,
demonstrated that vehicle tailpipe emissions is likely the main driver of oxidative potential in PM0.18 but not PM2.5 size
fraction. The DTT activity levels measured in this study were compared to several previous studies conducted at the same
sampling site in Central LA. This analysis of historical trends in ambient PM toxicity coupled with information on the impact
of major regulations on mobile source emissions enabled us to assess the relative importance of tailpipe and non-tailpipe
emissions on DTT activity.
Introduction
A large body of epidemiological and toxicological studies have investigated linkages between aerosol chemistry and health
effects associated with exposure to particulate matter (PM). Furthermore, recent studies have shown that PM generated by
specific sources have higher toxicity and, therefore, are strongly associated with health outcomes. In this study, association of
chemical components and sources of ambient PM2.5 and PM0.18 with DTT activity was investigated.
Methodology and results:
Time-integrated sampling was conducted every week between July 2012 and February 2013 in Central LA, and from
between July 2013 and February 2014 in Anaheim. Weekly samples were analysed to quantify the mass concentrations of
PM and its chemical constituents (i.e. elemental carbon (EC), organic carbon (OC), total elemental composition, water-
soluble inorganic ions). In addition, major sources of ambient PM2.5 and PM0.18-bound OC were identified using a novel
hybrid MM-CMB model described in a companion paper by Shirmohammadi et al. (2015). OC source apportionment results
from the CMB model were converted to PM2.5 and PM0.18 mass concentrations to evaluate the source contributions to total
mass. Univariate analysis indicated high association between the DTT activity and the concentrations of carbonaceous
species at both sites. The strongest correlations (R > 0.60) were observed between DTT and organic tracers of primary
vehicle tailpipe emissions including polycyclic aromatic hydrocarbons (PAHs), alkanes and hopanes, with higher correlations
for PM0.18 versus PM2.5 components. Moreover, metals such as Ba, Cu, Fe, Mn, Pb and Sb in both size ranges were also
associated with DTT activity. In Central LA, primary biogenic, SOC and vehicular abrasion sources contributed significantly
to PM2.5 DTT activity with R2 value of 0.69, while in PM0.18 size range, vehicle tailpipe emissions as well as vehicular
abrasion were the main drivers of the DTT activity (R2 = 0.50). Similarly, in Anaheim, SOC and vehicular abrasion in PM2.5
size range (R2 = 0.84) and vehicle tailpipe emissions as well as vehicular abrasion in PM0.18 (R2 = 0.80) were identified to be
the significant contributors of DTT activity. A steep decline in the oxidative potential of ambient PM0.18 DTT activity was
observed over the past decade in Central LA likely as a result of major reductions in emissions from these sources due to
stringent regulations. PM2.5 DTT activity, on the other hand, showed generally similar or even increased levels compared to
earlier studies in Central LA. This trend may be explained by the overall increase in the ambient levels of indicators of non-
tailpipe emissions (e.g. road dust, vehicular abrasions) over the past decade at this site.
Conclusion:
Our findings illustrated the relative importance of different traffic sources on the oxidative potential of ambient PM. Despite
rapid reduction of tailpipe emissions, the lack of similar reductions (and possibly an increase) in non-tailpipe emissions make
them an important source of traffic-related PM emissions in Los Angeles and of paramount concern for public health.
Acknowledgment:
The present project was supported by grant number ES12243 from the National Institute of Environmental Health Sciences,
U.S. National Institutes of Health. We acknowledge the staff of the Wisconsin State Laboratory of Hygiene (WSLH) for their
assistance with the chemical analysis.
Reference:
Shirmohammadi, F., Hasheminassab, S., Saffari, A., Schauer, J.J., Delfino, R.J., Sioutas, C., 2015. Fine and ultrafine
particulate organic carbon in the Los Angeles basin: Trends in sources and composition. Sci. Total Environ. 541, 1083–1096.
doi:10.1016/j.scitotenv.2015.09.133

183
Fig.1 Daily means during a road dust episode in spring
2015 at a road site in Drammen showing observed and calculated (using the existing road dust emissions)
concentrations
ROAD DUST MODELING FOR AIR QUALITY FORECASTING IN NORWAY
I. Sundvor (1), B. R. Denby (2), I. Vallejo (1), J. K. Süld (2 ), G. Sousa Santos (1)
(1) NILU-Norwegian Institute of Air Research, PO BOX 100 , 2027 Kjeller, Norway; (2) Norwegian Meteorological
Institute, PO BOX 43, 0313 Oslo, Norway
Presenting author email: [email protected]
Summary
Air quality forecasting has for several years been performed for cities in Norway, but a large challenge has been to predict the
non-exhaust emissions due to the complex underlying processes. The NORTRIP model is a unique coupled road dust and
road surface condition model which has been developed to handle the build-up of dust load and consequently the large
variability in the non-exhaust emissions. This study has applied, for the first time, NORTRIP in a forecasting system for
cities. The forecasting system will be presented together with the results from applying the NORTRIP model.
Introduction
Air quality prognoses of NO2, PM10 and PM2.5 are performed for several city agglomerations in Norway. The prognoses are
used to send out forecasts to the public as well as the decision makers in the municipalities during the months with the
highest concentration levels (October/November to end of April). A challenge has been to predict the non-exhaust
contribution to PM because of the large variability in these emissions and the underlying complex processes. The use of
studded tyres contributes to large road wear, and wet or icy winter conditions retain the dust on roads, building up a large
dust layer. This retained dust is later released during dryer periods, typically in the spring. The springtime road dust
emissions often cause several exceedances of the PM10 daily limit values (see figure 1), making it crucial to have a good
estimate of these emission to make a reliable and useful prognosis of PM.
Methodology and Results
The prognosis system consist of high-resolution meteorological, emission and dispersion models giving hourly concentration
values at street level for the next 48 hours in 7 city areas. In previous forecast seasons a road dust emission model which
lacked the possibility to include the build-up and suspension of road dust has been used. This has led to large under-
estimations in situations where road dust contributes to high PM levels (se figure 1). NORTRIP is a unique emission model
as it takes into account the processes all the way from wear and retention to suspension by coupling a dust model and a road
surface condition model. The model has performed well in several locations in Nordic countries (Denby et al., 2013). So far,
however, the complete NORTRIP model has only been used in single street applications. Our work is the first full city multi-
road NORTRIP model application.
The results for the forecast season 2014/2015 will be presented
both using the former road dust emissions as well as the newly
implemented NORTRIP model comparing the predicted values
with observations. We will provide an overview of the forecast
system and describe the use of the NORTRIP model in a multi-
road forecast application, addressing the challenges of
implementing winter activities like salting and dust binding in the
prognosis system. The evaluation of the model performance is
basis for further improvements of the system.
Conclusions
The NORTRIP model has previously been shown to predict the
non-exhaust emissions well for individual roads. Implementation
of the NORTRIP multi-road model is hence an important step to
improve the forecasts of PM in Norwegian cities. The use of
NORTRIP in the prognosis system will continue to be developed.
Acknowledgement
This work was supported by the Norwegian Public Road Administration (NPRA) and NMR- Nordic Council of Ministers
References
Denby, B.R., Sundvor, I., Johansson, C., Pirjola, L., Ketzel, M., Norman, M., Kupiainen, K. , Gustafsson, M., Blomqvist, G.
and Omstedt, G., 2013a. A coupled road dust and surface moisture model to predict non-exhaust road traffic induced particle
emissions (NORTRIP). Part 1: road dust loading and suspension modelling. Atmospheric Environment, 77, 283-300, DOI:
10.1016/j.atmosenv.2013.04.069

184
.

185
SPECIAL SESSION –TRANSPORT RELATED AIR POLLUTION PM AND ITS IMPACT ON CITIES AND
ACROSS EUROPE

186

187
AIR POLLUTION AT THE CHARILAOS TRIKOUPIS BRIDGE (GREECE)
D.A. Sarigiannis (1), E.J. Handakas (1), M. Kermenidou (1), P. Charisiadis, (2), K. Makris (2), A. Gotti (1) and S.P.
Karakitsios (1)
(1) Aristotle University of Thessaloniki, Department of Chemical Engineering, Environmental Engineering Laboratory,
University Campus, Thessaloniki 54124, Greece; (2) Cyprus International Institute for Environmental and Public Health in
association with Harvard School of Public Health, Cyprus University of Technology, Limassol, Cyprus
Presenting author email: [email protected]
Summary
This study aims to assess the atmospheric pollution level in the area of the Charilaos Trikoupis bridge (Greece). The bridge,
also known as bridge of Rio-Antirrio, is one of the world’s longest cable-stayed bridges with multiple openings and a total
length of 2,252 meters. It crosses the Gulf of Corinth near Patras, linking the town of Rio on the Peloponnese peninsula to
Antirrio on mainland Greece. In this paper an overview of air pollution levels in the area in 2013-2015 is presented and the
respective emission sources are identified. The study shows that overall the contribution of the Rio Antirrio bridge to the air
pollution levels in the area can be considered very low mainly due to the low traffic volume, the fleet composition and the
prevalent climatic conditions favorable to a rapid dispersion of the emitted pollutants
Introduction
Traffic is considered as one of the most important sources of air pollution in urban and periurban settings. However, only
rarely is the impact of trafficked bridges on local air pollution thoroughly assessed due to the complexity of the engineering
structure and the respective landscape. The Charilaos Trikoupis bridge is considered an engineering masterpiece with two
vehicle lanes per direction plus an emergency lane and acts as a major road artery at the national level. Obtaining a thorough
overview of its impact on air pollution taking into account seasonal variation is of both regulatory and scientific interest.
Methodology and Results
Six campaigns were performed in the course of the last three years covering both summer and winter periods. The exact
periods of the campaigns were selected taking into account the high traffic seasons after a careful examination of the bridge
traffic patterns. In each of the campaigns dynamic measurements of CO, NOX, SO2, PM2.5 and PM10 were continuously
executed over ten days near the edges of the bridge, i.e. in the urban areas of Rio and Antirrio. PM2.5, PM10 and TSP were
sampled every 24 hours using low-volume automatic sequential samplers. TSP was collected on quartz filters (203 mm × 254
mm) of high volume samplers (total volume of air sampled was approximately 2000 m3). These filters were used for
chemical analysis of particle-borne lead. Moreover, meteorological data (wind speed and direction, temperature, cloud cover
and humidity) were recorded. The pollution data were analyzed statistically and the quality of the air was characterized using
the US Environmental Protection Agency indices and the European Common Air Quality Index framework. Chemical
speciation results in PM2.5 and PM10 were used as input to Principal Component Analysis and Positive Matrix Factorization
in order to identify the contribution of various sources (including bridge traffic) to the overall particulate loading in the local
atmosphere.
Results show that air pollution levels are in generally under regulatory thresholds. PM2.5 and PM10 levels were below 25 and
50 μg/m3 on both sides of the bridge almost every day. These limits were exceeded only one day (5/12/2013) on the side of
Antirrio (26.4 and 52.2 μg/m3 for PM2.5 and PM10 respectively). Moreover, traffic emissions from the bridge are not the main
source of particulate pollution in the area. The low contribution from traffic emissions is exemplified by the low PM2.5/PM10
ratio, which is on the average 0.49 (σ = 0.12). Thus, long range transport of PM is more significant than local sources. During
the winter PM2.5 and PM10 levels are higher due to the use of light oil and biomass burning for space heating. Pb levels were
very low; the daily value recorded (4.2 ng/m3) is two orders of magnitude lower than the regulatory limit of 0.5 mg/m3.
Hourly average concentrations of CO, SO2, NO and ΝΟ2 in Antirrio were 4.0 mg/m3, 1.9 μg/m3, 6.8 μg/m3 and 38.9 μg/m3,
while in Rio the respective levels were 5.3 mg/m3, 4.5 μg/m3, 3.8 μg/m3 and 23.1 μg/m3. SO2 levels were reduced in 2013
compared to 2005, while they have been slightly increased for ΝΟ2. PM2.5 and PM10 samples were analyzed for black carbon
and different elements for source apportionment analysis. Factorization software (EPA PMF 5.0) was used in order to
determine the sources of PM2.5 and PM10. The analysis revealed that major emission sources for PM2.5 were biomass burning
(37.4%), traffic (23.5%) , shipping (19.2%), soil dust (11.2%), road dust (5.1%) and sea spray (3.6%). For PM10 the main
sources are biomass burning (33.8%), sea spray (19.3%), shipping (16.1%), traffic (11.3%), road dust (11.4%) and soil dust
(8%). Shipping, sea spray road and soil dust increased during the warm period of the year while biomass burning increased
during the cold season. Wind back-trajectories showed that emissions from residential space heating associated to biomass
burning come mainly from residential areas in the southeast. Shipping emissions come mainly from west and southwest and
they are connected with both local and Patra’s ports.
Conclusions
Overall the contribution of the Charilaos Trikoupis bridge to air pollution levels in the vicinity is very low. This is the result
of the relatively low daily volume of vehicles (~ 10,000 vehicles per day), the respective traffic fleet composition (~80% of
the traffic fleet are passenger vehicles) and the speed limit (80 km/h) which does not favor traffic emissions. In addition, the
strong and frequent winds further contribute to the rapid dispersion of the emitted pollutants. The higher levels of PM
observed during the winter period are attributed to local sources of space heating, as well as to the meteorological conditions
in the area, which are characterized by lower mixing height.

188
MODELLING AND MEASUREMENT OF URBAN AEROSOL PROCESSES FROM ROADSIDE TO AMBIENT
M. Karl (1,*), J. Kukkonen (2), M.P. Keuken (3), S. Lützenkirchen (4), L. Pirjola (5,6) and T. Hussein (7,6)
(1) Helmholtz-Zentrum Geesthacht, Department of Chemistry Transport Modelling, Geesthacht, Germany; (2) Finnish
Meteorological Institute, Helsinki, Finland; (3) TNO, Netherlands Organization for Applied Research, Utrecht, The
Netherlands; (4) City of Oslo – Agency of Urban Environment, Oslo, Norway; (5) Department of Technology, Metropolia
University of Applied Science, Helsinki, Finland; (6) University of Helsinki, Department of Physics, P. O. Box 64, FI-00014
UHEL, Helsinki, Finland; (7) The University of Jordan, Department of Physics, Amman 11942, Jordan
Presenting author email: [email protected]
Summary Particles from road traffic exhaust emissions are subject to complex dilution and transformation processes in the urban
environment. This model study evaluates the influence of aerosol processes on the particle number (PN) concentration on the
spatial and temporal range between the street scale, typically represented by measurements at a traffic monitoring site, and
the neighbourhood scale, with a characteristic length scale of 1–2 km. Measured particle size distributions in the cities of
Helsinki, Oslo and Rotterdam and modelling with the aerosol dynamics model MAFOR, was used to develop a simplified
parameterization of aerosol processes for use in Gaussian and Eulerian urban dispersion models. The simplified
parameterization of aerosol processes can predict particle number concentrations between roadside and the urban background
with an inaccuracy of ~10%, compared to the fully size-resolved MAFOR model.
Introduction Motor vehicle exhaust emissions constitute the major source of ultrafine particle pollution in urban environments. Particles
emitted from road transport, as they are transported from the emission sources, are subject to complex dilution processes
(turbulence generated by moving traffic, atmospheric turbulence) and transformation processes (nucleation, coagulation,
condensation, evaporation, deposition, and heterogeneous chemical reactions), acting on different time scales. Urban
dispersion modelling of particle numbers is challenging, because aerosol dynamic processes continuously change the number
and size distribution after the particles have been released into air. This model present study aims at (i) the quantification of
the impacts of relevant aerosol processes on the neighbourhood scale and (ii) the derivation of a reasonably accurate,
simplified parameterization of the most important aerosol processes, to be used in urban air quality models.
Methodology and Results The development of the particle size distribution with increasing distance from the roadside was modelled using the
multicomponent aerosol dynamics model MAFOR. Aerosol processes considered in this study were condensation and
evaporation of n-alkanes, coagulation of particles due to Brownian motion, and dry deposition. The evolution of vehicular
emissions from the engine to the roadside concentrations were not considered in this study, as the particle size distributions
measured at the roadside locations were used as a starting point. A simple treatment of horizontal dilution of particle numbers
was used to approximate atmospheric dispersion. Model runs were performed with different dispersion conditions to address
the influence of aerosol processes for a wide range of meteorological dispersion regimes. Coagulation was found most
efficient for the removal of nanoparticles (in this study particles of the sizes 8–25 nm), which accounted for 70 % of the total
PN of the mean traffic-related aerosol. The time scale of coagulation was similar to the time scale of dry deposition for
nanoparticles. The sensitivity of modelled PN concentrations towards dry deposition of particles on various surface types and
roughness conditions was studied. Typical time scale of dry deposition of particles with 8–25 nm diameter in the urban
environment using different deposition schemes was 0.5–3 hours. Average dry deposition velocities were in the range of 0.2–
0.9 cm s-1.
Conclusions Dry deposition and coagulation of particles were identified to be the most important aerosol dynamical processes controlling
the removal of particles from emitted from vehicular exhaust on the neighbourhood scale. Under inefficient dispersion
conditions, condensational growth contributed significantly to changes of the PN concentration. However, as expected, these
processes were less relevant in efficient dispersion conditions, for which dilution clearly dominated the change of total PN.
References Karl, M., J. Kukkonen, M.P. Keuken, S. Lützenkirchen, L. Pirjola, and T. Hussein, 2015. Modelling and Measurements of
Urban Aerosol Processes on the Neighborhood Scale in Rotterdam, Oslo and Helsinki. Submitted to Geoscientific Model
Development.

189
MODELLING OF THE PARTICLE NUMBER CONCENTRATIONS IN FIVE EUROPEAN CITIES
J. Kukkonen (1), M. Karl (2), M.P. Keuken (3), H.A.C. Denier van der Gon (3), B.R. Denby (2)(8), V. Singh (4), J. Douros
(5), A. Manders (3), Z. Samaras (5), N. Moussiopoulos (5), S. Jonkers (3), M. Aarnio (1), A. Karppinen (1), L. Kangas (1), S.
Lützenkirchen (6), Tuukka Petäjä (7), Vouitsis, I. (5), R. S. Sokhi (4)
(1) Finnish Meteorological Institute, (2) Norwegian Institute for Air Research, (3) TNO, Netherlands Organization for
Applied Research, (4) CAIR, University of Hertfordshire, (5) Aristotle University of Thessaloniki, (6) City of Oslo, (7)
University of Helsinki, (8) Norwegian Meteorological Institute
Presenting author e-mail: [email protected]
Summary
We present the modelling of particle number concentrations (PNC’s) in five major European cities, namely Helsinki, Oslo,
London, Rotterdam and Athens, in 2008. Novel emission inventories of particle numbers have been compiled both on urban
and European scales. We use atmospheric dispersion modelling for PNC’s in the five target cities and on a European scale,
and evaluate the predicted results against available measured concentrations. The concentrations of PN in the selected cities
were mostly influenced by the emissions originated from local vehicular traffic; however, in some of the cities, also harbour
and airport activities were significant. The predicted and measured annual average PNC’s in four cities agreed within
approximately ≤ 36 % (measured as fractional biases), except for one traffic station in London.
Introduction
While a large base of scientific information exists on particle mass, there are substantially less studies on particle number
(PN). This is particularly true on modelling in city environments. A number of studies indicate that UFP’s have specific
health effects.
Methodology and results All of the urban emission and dispersion modelling systems were locally or nationally developed ones; these were different
for each city. However, the regional background concentrations for all the urban scale modelling systems were computed
with the same model, the LOTOS-EUROS chemical transport model. A new European-scale emission inventory was
compiled for the EU-wide transport and non-transport activities. All the models included the emissions from vehicular traffic,
and some of the models included also the emissions from stationary sources and other sources. The shipping emissions were
explicitly included in the computations of Oslo and Athens, and the importance of primary shipping emissions was separately
evaluated for Helsinki. Measured PNC data was available in four of the cities, in three of these for a complete year; however,
only at one or two measurement stations for each city. In all cities, the spatial distributions of PNC were dominated by road
traffic emissions; the major traffic networks were clearly visible. Especially in Helsinki and London, the main ring roads
surrounding the city were clearly visible. In Oslo, the PNC’s were enhanced near road tunnel entrances and in the harbor
region. In Athens, there are substantially elevated PNC’s near the Athens International Airport and near the harbour regions.
Conclusions
Novel emission inventories of particle numbers have been compiled both on urban and European scales. We have presented
the results of the modelling of PNC’s in five European cities in 2008. It has not previously been possible to conduct such
computations on a European scale, due to the deficiencies of the previously available emission inventories. As expected, the
most important local source category in terms of the PNC’s was local vehicular traffic in all the target cities. The
concentrations were also elevated in city centers, especially for the megacities of London and Athens. The highest values of
the predicted PNC’s were relatively higher in the megacities, London and Athens, and also in Rotterdam, whereas these were
relatively lower in Helsinki and Oslo. The amount of experimental data for model evaluation was modest: only one or two
stations per city. More long-term hourly measurements of PNC’s would therefore be valuable for a more extensive model
evaluation in various urban locations.
References
Kukkonen, J., M. Karl, M.P. Keuken, H.A.C. Denier van der Gon, B.R. Denby, V. Singh, J. Douros, A. Manders, Z.
Samaras, N. Moussiopoulos, S. Jonkers, M. Aarnio, A. Karppinen, L. Kangas, S. Lützenkirchen, Tuukka Petäjä, Vouitsis, I.
and R. S. Sokhi, 2015. Modelling the dispersion of particle numbers in five European cities. Geoscientific Model
Development, Discussions.

190
Förändring avtrafikens bidragtill NOx-haltenfm rusningmån-fre, april-okt
> -20 %
-20 - -10 %
-10 - -5 %
-5 - -1 %
oförändrad halt
1 - 5 %
Figure 7. Calculated percent reduction in NOx
concentration due to traffic emission for the 30
minute scenario.
HEALTH RISK ASSESSMENT OF REDUCED AIR POLLUTION EXPOSURE WHEN CHANGING
COMMUTING BY CAR TO BIKE
B. Lövenheim (1), C. Johansson (1, 2), Lina Wahlgren (4), Hans Rosdahl (4), Jane Salier Eriksson (4), P. Schantz (4), Peter
Almström (5), Svante Berglund (5), A. Markstedt (5), Magnus Strömberg (3), Johan Nilsson Sommar (3) and B. Forsberg (3)
(1) Environment and Health Administration, SLB, Stockholm, Sweden; (2) Atmospheric Science Unit, Department of
Analytical Chemistry and Environmental Sciences, Stockholm University, Stockholm, Sweden; (3) Division of Occupational
and Environmental Medicine, Department of Public Health and Clinical Medicine, Umeå University, Umeå, Sweden; (4)
GIH – The Swedish School of Sport and Health Sciences, Stockholm, Sweden; WSP Civils, Stockholm, Sweden
Presenting author email: [email protected]
Summary
In this study we have assessed the reduction in traffic emissions and population
exposure assuming all potential car commuters would switch to biking if they
live within 30 minute travel by bike. The scenario would result in more than
100 000 new bikers and due to the reduced traffic emissions 42 premature deaths
would be avoided per year. This is almost twice as large effect as the congestion
tax in Stockholm.
Introduction
Regular physical activity has important and wide-ranging health benefits
including reduced risk of chronic disease, and physical inactivity is mentioned as
perhaps the most important public health problem of the 21st century. At the
same time, the direct effects of traffic emissions is a major health problem.
Transferring commuting by car to bike will increase physical activity and reduce
emissions and reduce population exposure to traffic pollution. The exposure of
commuters will also change; new bikers may get higher exposure whilst old
bikers and car drivers may get lower exposures, depending on commuting route
and distance.
Methodology
In this study we have calculated the potential number of car-to-bike switching
commuters depending on distance, travel time, age of commuters etc. We have
made calculations for a 30-minute biking scenario, i e transferring all car
commuters to bike if their travel time by bike is less than or equal to 30
minutes. The commuting distance depends on age and sex. For the travel and
traffic modelling the LuTrans model was used. It includes all different modes of
travel; walking, bicycling, public transport systems and car traffic. The model
was developed based on travel survey data and is regularly calibrated using traffic counts. Emissions from road traffic were
calculated based on HBEFA 3.2. A Gaussian dispersion model was used estimate exposures over the county of Stockholm.
Results The 30 min scenario resulted in 106 881 more bikers, an increase of 2.6 times compared to base scenario. Of all bikers 50%
were men and the mean age of all bikers was 42. The traffic emissions of NOx was reduced by up to 7%. Up to 20%
reduction in traffic contribution to NOx concentrations was calculated as shown in Figure 1. The mean reduction in
concentration for the whole area is 6% and the largest occur were most people live.
The population weighted mean NOx concentration for 1.6 million people in Greater Stockholm is estimated to be reduced by
0.41 µg m-3. Assuming that the premature mortality is reduced by 8% per 10 µg m-3 (Nafstad et al., 2004), this corresponds to
42 avoided premature deaths every year or 514 gained life years gained. This is even somewhat more beneficial than the
effects of the congestion charge in Stockholm (Johansson et al., 2009), which was estimated to save 27 premature deaths per
year. The gain in reduced mortality is almost as large as the gain in health of the increased physical activity.
Conclusions
Transferring car commuters to bike is not only beneficial for the physical activity, but will also lead to reduced traffic
emissions and reduced population exposure. Our estimates show that it may be even more beneficial for mortality due to air
pollution exposure than the congestion charge in Stockholm.
Acknowledgement
This project was funded by the Swedish Research Council for Health, Working life and Welfare.
References
Johansson, C., Burman, L., Forsberg, B. 2009. The effects of congestions tax on air quality and health. Atmos. Environ. 43,
4843-4854.
Nafstad, P., Lund Håheim, L., Wisloeff, T., Gram, G., Oftedal, B., Holme, I., Hjermann, I. andLeren, P. 2004. Urban Air
Pollution and Mortality in a Cohort of Norwegian Men. Environ. Health Perspect. 112, 610-615.
unchanged

191
HIGH-RESOLUTION SOURCE APPORTIONMENT MODELLING FOR AMSTERDAM AND ROTTERDAM
A. Manders, R. Kranenburg, S. Jonkers, M. Schaap and H. Denier van der Gon
TNO, Department of Climate, Air and Sustainability, P.O. Box 80015, 3508TA Utrecht, The Netherlands
Presenting author email: [email protected]
Summary
This study investigates the possibilities of using LOTOS-EUROS with the labelling technique for source apportionment at
city scale. The model was run at 3.5x3.5 km2 resolution over the Netherlands, which is higher than previously used
resolution, and using a high-resolution emission set. Labels were set to different sectors, with special attention to the
transport sectors by separating out road transport, shipping and other transport, and using labels for Rotterdam, Amsterdam,
rest of the Netherlands and rest of Europe. The year 2011 was modelled, with particularly high observed PM2.5
concentrations during several episodes in spring. The high resolution made it possible to label emissions more accurately and
to better model gradients in and around the cities.
Introduction
The transport sector makes an important contribution to NOx an PM concentrations in cities. For Rotterdam and Amsterdam,
not only road transport plays a role, but also shipping may contribute significantly. To investigate the relative contribution of
several sources and source areas, a high resolution simulation was performed over the Netherlands for 2011.
Methodology and Results
LOTOS-EUROS was run at 1/16x1/32° lon x lat resolution over the Netherlands (3-9 E, 49-55 N), which is higher than
previously used resolution. A high-resolution emission set was used for this domain. The run was nested in a simulation on
European domain using the default 1/2x1/4° lon x lat resolution. Labels were attributed to two rectangular regions closely
encompassing the Rotterdam Rijnmond area and encompassing Amsterdam (excluding Amsterdam Airport), to the rest of the
Netherlands and to the rest of Europe (Kranenburg et al 2013) and several source sectors (Fig.1). Analysis was done for total
PM2.5 and PM10, but also for the contributing species like elemental carbon (EC) and sulphate. PM2.5 (and PM10) results
were validated against observations from Airbase, and showed a fairly good correlation for PM2.5 (around R=0.8), with an
average bias of around -7μg/m3. The underestimations were most notable for two pollution episodes in March and October.
Analysis of the labelled concentrations revealed that in Rotterdam and Amsterdam road transport contributed in general more
to PM2.5 than shipping, but in particular for the highest and lowest concentration ranges the contribution of shipping nearly
equals that of road transport for these cities (Fig 1). The contribution of Rotterdam Rijnmond area to total PM2.5
concentrations in Rotterdam city centre varies around 20% for the different concentration bins, for Amsterdam the
contribution of the Amsterdam area to concentrations in the city centre is a few percent lower, which is consistent with the
smaller area that is assigned to Amsterdam, excluding Amsterdam Airport and nearby highways. The high resolution made it
possible to identify differences between the city centre and a suburban residential area. For example for Amsterdam the
absolute and relative contribution of the sector ‘other transport’ to EC concentrations is larger in the city centre than in the
suburbs IJburg and Sloten. Depending on the policy-relevant or science question, the most suitable presentation of the wealth
of information can be chosen.
Figure 1: Analysis of annual results for Rotterdam city centre (left) and summer episode for Amsterdam city centre (right).
Conclusions
The high-resolution simulation gives meaningful results and contributes to a better representation of the contributions of
several sources and source areas in space and in time. For example the contribution of shipping to PM2.5 is nearly as large as
the contribution of road transport for some episodes, indicating the relevance of this sector for local air quality policy.
Acknowledgement
This work was partly supported by the TNO knowledge investment programme 2015 under the TNO roadmap Environment
and Sustainability.
References
Kranenburg, R., Segers, A.J., Hendriks, C., Schaap, M., Source apportionment using LOTOS-EUROS: module description
and Evaluation, Geosci. Model Dev. 6, 721-733, 2013

192
OPERATIONAL APPLICATION OF AN EMPIRICAL APPROACH FOR DETERMINING CONCENTRATION
INCREMENTS AT THE STREET LEVEL
E. Chourdakis, N. Moussiopoulos, F. Barmpas and I.Douros
Laboratory of Heat Transfer and Environmental Engineering, Aristotle University of Thessaloniki,
54124 Thessaloniki, Greece
Presenting author email: [email protected]
Summary
This study aims to develop a simple approach for the accurate estimation of the local scale contribution on the air pollution in
urban areas. The method employs a functional relationship between the concentration increment, the local meteorological
parameters, the street characteristics, the traffic emissions and the urban background concentrations. The necessary pollutant
concentrations for the multiple regression process are derived both from measurements and model results. In order to explore
the applicability of this approach, the methodology was incorporated in the operational module of an Air Quality
Management System (AQMS). Although this specific approach can be used for a series of traffic emitted pollutants, within
the frame of the present evaluation the methodology is applied only for PM10 and NO2. Results demonstrate the capability of
this simple approach to reproduce the street-scale concentration increment with satisfactory accuracy, thereby confirming its
suitability as a reliable tool for operational air quality assessment at urban hotspots.
Introduction
The main objective of the methodology developed within the frame of this study is to determine on an hourly basis, the
contribution of road traffic emissions on air pollution at urban hotspots. To this end, a functional relationship associating the
estimated street increment with local meteorological parameters, street characteristics and traffic emissions on the basis of
measured or calculated increments in representative locations is determined. As part of the method’s validation, a
computational module based on this approach is implemented and incorporated as an enhancement in the computational core
of an existing operational AQMS, which was been developed and installed in the Department of Labour Inspection of the
Republic of Cyprus (Moussiopoulos et al., 2012). A previous evaluation of the baseline AQMS operational core had revealed
that short-term forecasts were in good agreement with the corresponding urban background measurements. Nevertheless, the
forecast accuracy in predicting air pollution levels at the local/street scale was consistently lower. The present study aims to
investigate the improvement in the accuracy of street-scale concentration calculations after the incorporation of the street
increment module in the AQMS computational core.
Methodology and Results
The procedure for the overall determination of the street increment
can be described as three step process. More specifically, these steps
include the selection of representative pairs of urban background
and street scale locations, a multiple regression analysis for the
determination of the functional relationship and the application of
the methodology on the basis of measured or calculated urban
background concentrations. The concentration sets used for the
definition of the statistical relationships are derived both from
measurements and the application of the OSPM model for several
traffic hot spots in the city of Thessaloniki during the calendar year
2013. These relationships are then incorporated in the computational
core of the AQMS as an effort to improve the AQMS’s performance
at the street scale. A two-month pilot evaluation of the methodology
was carried out whereby the AQMS’s operational estimates of
hourly urban background concentrations and meteorological
parameters were used to provide the required input data. The results
of this pilot application are compared against monitoring data. This
validation process indicates a notable improvement in the AQMS’s
ability to predict NO2 and PM10 concentration levels at the street scale (see Fig. 1). Additionally, a set of potential areas of
future improvement is identified within the methodological framework of the current approach.
Conclusions
The street increment methodology which was developed within the frame of this study relies on a functional relationship,
allowing for a correction of hourly street concentrations. This was achieved by establishing an operational correlation
between the street-scale concentration increment, the local meteorological parameters, the street characteristics, the traffic
emissions and the urban background concentrations. The methodology was incorporated operationally as an additional
module of an AQMS for a pilot period of two months. The results of this application reveal a distinct improvement in the
performance of the AQMS regarding the hourly status of air quality at the street scale.
References
Moussiopoulos N., Douros I., Tsegas G., Kleanthous S. and Chourdakis E., 2012. An air quality management system for
policy support in Cyprus, Hindawi Publishing Corporation, Advances in Meteorology 2012, doi:10.1155/2012/959280.
Fig.1 Indicative results for a hot spot in the city of
Nicosia.

193
INVESTIGATING THE NO2 EMISSIONS OF INDIVIDUAL VEHICLES UNDER REAL DRIVING AND ITS
CONTRIBUTION TO LOCAL AIR POLLUTION
D. Pöhler (1), F. Kanatschnig (1), M. Horbanski (1), A. Friedrich (2), J. Lampel (1,3) and U. Platt (1)
(1) Institute of Environmental Physics, University of Heidelberg, Germany; (2) International Transport Adviser, Berlin,
Germany; (3) now at MPIC, Mainz Germany
Presenting author email: [email protected]
Summary
The NO2 emissions of a large amount of individual vehicles under real driving conditions were investigate with measuring its
concentration in the emission plume. This allows investigating a large amount of different vehicles and quantifying their
contribution to the local NO2 air pollution. In an intensive study in Mainz, Germany, 2014, we observe a strong variability of
NO2 concentrations for similar type of vehicles (e.g. different cars or busses). Several vehicles show much higher NO2
emissions as expected and support current investigations that for some vehicles the emissions under real driving conditions
are much higher. 7.6% of the vehicles show NO2 >500ppb which were responsible for 45% of the total NO2. The
observations also show large errors in the emission models due to insufficient model data input. Thus different conclusions
about the main NO2 sources and recommendations for policy makers are made.
Introduction
Nitrogen Oxide (NOx=NO +NO2) emissions by road vehicles are the mayor contributor for poor air quality in urban areas.
High NOx concentrations, and especially NO2, are typically the most problematic pollutant in cities. However emissions vary
significantly depending on the type of vehicle, its engine, the age, condition of the vehicle, driving properties, modifications
and many more. Even if official NOx emission data of the manufacturer exist, these are sometimes wrong and reliable data
under real driving conditions are typically unavailable. Especially data showing the degree to which different cars contribute
to observed NOx levels in urban areas are missing. Significant reduction of NOx concentrations can be achieved by
identifying the strong emitting vehicles and excluding, replace or modify them.
Methodology and Results
With a specially developed high speed NO2 CE-DOAS (Cavity-Enhanced DOAS) instrument the NO2 concentration within
the emission plume of vehicles under real driving conditions are measured. The sampling was performed with a inlet at the
front of a car which was following the investigated vehicle. During the project in the city of Mainz, randomly chosen 734
vehicles were investigated and were related to the different types: cars (72,8%), buses (19.7%), trucks (4.4%) and
motorcycles (3.1%). The observed concentration is categorised according to Fig.1. A large variability in the observed NO2
can be found even within a vehicle type. Most vehicles, especially cars and motorcycles show concentrations below 200ppb.
However 7.6% show concentrations exceeding 500ppb. These are mostly (75%) older busses with Euro2 and 3 emission
norms but also several cars. However this small group makes up of 45% of the total NO2 and excluding these vehicles could
significantly improve the air quality. The cars with high emissions are mostly diesel engines including newer models of all
different brands. They feature much higher emissions under real driving than expected from their emission norm. A
comparison with the emission model show large differences to the measurements. They could be identified as insufficient
model data input of the real vehicle fleet and the emissions under real driving conditions.
Fig.1 No. of observed vehicles per NO2 concentration category separated in the different vehicle types.
Conclusions
It could clearly be found that real driving measurements provide a much better and more accurate picture of the NO2 sources
responsible for the high urban NO2 pollution. The reasons are poor data on the real driving vehicle fleet and large errors in
the real emission data. Thus the measurements come up with a different result of the main NO2 sources which has a large
impact on policy makers and developments in the future. To derive more accurate the total NOx emissions for each vehicle
the system will additionally be equipped with a NO and CO2 measurement system in the near future.
Acknowledgement
The measurements in Mainz were financed by the environmental department of the city of Mainz.
0
50
100
150
200
250
0-50 50-100 100-200 200-300 300-500 >500
no. o
f veh
icle
s
NO2 in the emission plume [ppb] (above background conc.)
7.6% of vehicles 45% of
total NO2
motorcycle
trucks
buses
cars

194
EXHAUST PARTICLES AND NOX EMISSIONS OF A SCR EQUIPPED HEAVY DUTY TRUCK IN REAL-
WORLD DRIVING CONDITIONS
S. Saari (1), P. Karjalainen (1), L. Pirjola (2), L. Ntziachristos (1,3), J. Keskinen (1) and T. Rönkkö (1)
(1) Department of Physics, Tampere University of Technology, Tampere, 33720, Finland; (2) Department of Technology,
Metropolia University of Applied Science, Helsinki, Finland; (3) Laboratory of Applied Thermodynamics, Aristotle
University of Thessaloniki, Thessaloniki, Greece
Presenting author email: [email protected]
Summary
This study provides information on the emission factors of the selective catalytic reduction (SCR) equipped heavy duty
vehicle in different real-world driving conditions. The particle number emission was bimodal and dominated by the
nucleation mode particles (diameter below 23 nm). The on-road emission performance of the vehicle was very close to the
expected levels, confirming the successful operation of the SCR system of the tested vehicle. Heavy driving conditions such
as uphill driving increased both the NOx and particle number emission factors whereas the emission factor for soot particle
number remains rather constant. The results are important in future emission regulation planning as well as a useful input in
urban air quality modelling studies.
Introduction
Both particulate matter (PM) and nitrogen oxides (NOx) emissions of heavy duty diesel vehicles contribute significantly to
the urban air quality. Traffic, in general, produces particulate and gaseous pollutants in the vicinity of people, leading to
exposure in relatively high concentrations of fresh combustion originating pollutants, which have been reported to negatively
affect human health. This is why NOx and PM emissions of vehicles are regulated within the European Union. One of the
technologies to reduce heavy duty diesel truck NOx emissions is the SCR aftertreatment system. However, there is very
limited information on the emissions of SCR equipped heavy duty vehicles in real-world driving conditions. Real-world
emission factors for NOx and PM emissions of typical SCR equipped vehicle are important parameters, e.g., in urban air
quality modelling. This study focuses on the real-world emissions of a modern SCR equipped heavy duty diesel vehicle. The
major objectives are to determine the real-world emission factors for NOx, soot and nucleation mode particles (down to 3 nm)
and to clarify the role of real-world driving conditions in pollutants formation.
Methodology and Results
The experiments were performed on the road by measuring the total and soot particle concentrations, particle size
distribution, and CO2 and NOx from the exhaust plume of an SCR-equipped EURO IV heavy duty diesel truck with a trailer.
Pollutant concentrations in the exhaust plume were studied by chasing the test vehicle with the “Sniffer” mobile laboratory
(Pirjola et al., 2004). Thus, in addition to driving conditions, also exhaust dilution and mixing corresponded to real-world
conditions. In this study, we present three different methods to calculate emission factors in real-world driving conditions.
First, real-time CO2 measurement enables time-resolved emission factor calculation for NOx and particle emissions, and
emission factor levels can be investigated during different driving conditions. Second, real-time data enables emission factor
calculation based on the slope between concentrations of pollutants over the CO2 concentration. Third, emission factors can
be calculated using average values over the whole measurement campaign. Results showed typically bi-modal particle size
distribution (nucleation mode and soot mode), and emission factors were calculated for the both modes. Interestingly, the
emission of the currently not regulated nucleation mode particles dominated the total particle number emission; for the
nucleation mode particles the average emission factor was 1.1x10¹⁵ #/kg(fuel), whereas for soot particles the emission factor
was 0.37x10¹⁵ #/kg(fuel). The average NOx emission factor during the whole test run was 3.55 g/kWh, whereas the emission
standard limit is 3.5 g/kWh for a EURO IV engine.
Conclusions
The nucleation mode dominated the total particle number emission of the SCR equipped heavy duty vehicle in different real-
world driving conditions. The nucleation mode particles are not controlled by current regulations in Europe. However, these
particles consistently form under atmospheric dilution in the plume of the truck and constitute a health risk for the human
population that is exposed to those. The on-road NOx emission performance of the vehicle was very close to the expected
levels, confirming the successful operation of the SCR system of the tested truck.
Acknowledgement
This work was supported by the TEKES project “TREAM”.
References
Pirjola, L., et al., 2004. “Sniffer”—a novel tool for chasing vehicles and measuring traffic pollutants. Atmos. Environ.
38(22), 3625-3635.

195
PHYSICAL CHARACTERIZATION OF AIRBORNE PARTICLES IN THESSALONIKI
Ι. Vouitsis, S. Amanatidis, L. Ntziachristos and Z. Samaras
Laboratory of Applied Thermodynamics (LAT), Aristotle University of Thessaloniki, PO Box 458 – GR 541 24,
Thessaloniki, Greece
Presenting author email: [email protected]
Summary The main objective of this study was to observe how the financial crisis has affected the air quality of Thessaloniki,
compared to previous measurements. A number of observations suggest a scenario of decrease in traffic activity and increase
in biomass burning for residential heating. To investigate the observations further, we conducted measurements at a busy
roadside and at a nearby urban background site of Thessaloniki. We also measured particulate emissions from three vehicles
in the laboratory and domestic heating emissions in a home burning both wood (fireplace) and diesel fuel (central heating).
The results seem to support the hypothesis of domestic heating as a significant contributor of particulate pollution.
Introduction
Although motor vehicle exhaust has been identified as the primary contributor to ambient particles, other sources may be
larger contributors in the overall regional inventory (Kumar et al., 2014). For example, domestic heating has been identified
as a significant contributor during the winter. The current study tries to provide more insights on the changes observed, by
studying a range of particulate properties at two different urban sites, at three different vehicles and at a home fireplace and
central heating.
Methodology and Results
Field measurements were conducted at two different sites: a
traffic-affected one in the centre of the city (23 study days) and a
residential location (14 study days). The vehicles tested included
one diesel Euro 5 (BMW X1 2 l), one diesel Euro 4 (Honda
Accord 2.2i-CTDi) and one gasoline Euro 4(Ford Mondeo 1.8 l) in
two configurations: properly operated and operated with
malfunctioned three-way catalyst. The measurement of the heating
emissions were conducted in a house located at the suburban area
of Thessaloniki. The total particle number concentration (PNC)
was measured with an ultrafine Condensation Particle Counter
(CPC, TSI model 3776) and the particle number size distribution
(PNSD) in the range of 14 nm to 710 nm was measured with a
Scanning Mobility Particle Sizer (SMPS, TSI model 3936L). The
PM mass concentrations in the field measurements were recorded
through the Beta-gauge method (Ambient Air Suspended
Particulate Analyzer, Model MP101M, Environnement SA).
Vehicles PM mass emission were measured according to the
legislation, while heating PM emissions were measured with
gravimetric sampling. The traffic – affected location was about
62% more polluted than the residential one in terms of PM2.5,
about 45% in terms of PNC but only 13% in terms of PM10. The
reduction in diesel emissions from Euro 4 to Euro 5 technology
was larger than 99% in both PM2.5 and PNC. On the other hand,
fireplace and central heating showed very low PNC (90% and 97%
lower than diesel Euro 5) but significantly higher PM2.5
concentration.
Conclusions
As traffic volume tend to decrease in Greece, wood-burning stoves
and fireplaces emissions started contributing significantly to
atmospheric particles. Furthermore, these emissions are associated
with several carcinogenic compounds causing adverse effects on
human health via several pathways.
Acknowledgement
This work was supported by the Operational Program "Education and Lifelong Learning" of the National Strategic Reference
Framework (NSRF) - Research Funding Program: THALES
References
Kumar, P., Morawska, L., Birmili, W., Paasonen, P., Hug, M., Kulmala, M., Harrison, R.M., Norfordj, L., Britter, R., 2014.
Ultrafine particles in cities. Envinron. Int., 66, 1-10
Fig.1 PM2.5 concentrations (mg/m3) in traffic-affected and
residential location and in the exhaust of various sources
Fig.2 PNC (#/cm3) in traffic-affected and residential location
and in the exhaust of various sources

196
.

197
PART TWO: POSTER SESSIONS

198

199
AIR QUALITY AND IMPACT ON REGIONAL TO GLOBAL SCALE

200

201
MODELLING TRENDS IN AIR QUALITY SENSITIVITY TO 20TH CENTURY CLIMATE VARIABILITY
ACROSS TROPICAL TO BOREAL CLIMATES
A.R. Farrow
Centre for Atmospheric and Instrumentation Research (CAIR), University of Hertfordshire, Hatfield, Hertfordshire, AL10
9AB, United Kingdom
Presenting author email: [email protected]
Summary
This paper investigates continental scale trends in a variety of particulate species, Ozone and Nitrogen Oxide concentrations
over a twenty year period. We compare separately the role of emissions and meteorological change during that period,
specifically investigating the varying trends in mid-lattitude, low latitude and equatorial regions where significant differences
in the meteorological setting lead to changes in the key processes involved in controlling surface Ozone and Nitrogen Oxide
concentrations. We evaluate model performance for GEOS-Chem across tropical to boreal climates and investigate the
geographically varying importance of climate and emissions on long-term air quality trends with two model simulations.
Introduction
Air pollutants and their precursors modify
the solar and terrestrial radiation budgets,
forcing changes to the climate system,
however regional climates are also a primary
controller of air-pollutant distributions.
Climate and air quality are inextricably
linked, to the extent that measures designed
to reduce air pollution or anthropogenic
climate change often have competing
interests.
There is significant regional variability in
air-quality trends and sensitivity to
meteorological change. This is due to
varying meteorology, industrialisation,
population change and urbanisation being
spatially heterogeneous over regional to
continental scales.
Methods
In this study we follow the methods of
Jeong et al (2013), who looked at changes in
particulate species, Ozone and Nitrogen
Oxides in East Asia over the past 2 decades. We expand the study to make inter-comparisons with two mid-latitude regions,
two low-latitude regions and two tropical regions. The GEOS-Chem model was driven by assimilated met data for 20 years
from 1986 to 2006 to create a baseline simulation (STD) and then run again to create a sensitivity simulation (FXD) where
emissions were fixed at 2006 levels. We analyse the sensitivity of model results to quantify the effect of the meteorological
variability on regional air quality over six key regions, two mid-latitude regions, North America and Europe, two low latitude
regions, East Asia and South Africa and two Equatorial regions, Brazil and Equatorial Africa.
Discussion
The STD and FXD experiments allow us to dissociate the impact of emissions and meteorological change on air quality and
how this varies between the six study locations. Meteorological variability has a significant impact on European and East
Asian NOx concentrations (Fig 1B), although changing emissions levels remain the most important factor (Fig 1A). Ozone is
a species highly sensitive to air temperature (Lin et al 2001). The relationship between surface O3 and meteorological
conditions may have influenced surface O3 concentrations (Fig1D). Surface ozone concentrations simulated in the STD
experiment closely resemble the trends driven by meteorology alone in each of the study areas. While it is likely that O3 concentration increases over the past two decades are due to increases in anthropogenic precursors emissions, the
contemporaneous trends in meteorology including higher temperatures, reduced cloud cover, stagnation events, elevated
photochemistry and secondary processes such as biogenic and wildfire emissions further enhance O3 increases.
Acknowledgement
This work is supported the Centre for Atmospheric and Instrumentation Research and the Science and Technology Research
Institute at the University of Hertfordshire, UK.
References
Jeong, J.I., and Park, R.J. 2013. Effects of the meteorological variability on regional air quality in East Asia. Atmospheric
Environment 69:46-55.
Lin, C-Y.C, Jacob, D.J and Fiore. A.M. 2001. Trends in exceedances of the ozone air quality standard in the continental
United States, 1980–1998. Atmospheric Environment 35.19:3217-3228.
Fig.1 Regional trends from 1986 to 2006 as simulated by the GEOS-Chem model for 24hr average surface level NOx (A. standard emissions & B. fixed emissions), Ozone
(C. standard emissions & D. fixed emissions) and SO2 (E. standard emissions & F.
fixed emissions)

202
CLIMATOLOGY OF AEROSOLS, CLOUD AND RAINFALL CHARACTERISTICS OVER MADURAI DURING
MONSOON AND DROUGHT PERIODS
G. Indira (1), B. Vijay Bhaskar (1)
(1) School of Energy, Environment and Natural Resources, Madurai Kamaraj University, Madurai -21, Tamil Nadu, India
Presenting author email: [email protected]
Summary
The paper presents aerosols, clouds and precipitation dynamics over a semi-arid region Madurai, India during drought and
normal monsoon years, based on satellite observations. Descriptive statistics and Pearson correlation analyses were carried
out to find the relationship between aerosols, cloud parameters and precipitation pattern. The minimum aerosol concentration
was in 2010 along with maximum precipitation. Besides the long-range transportation of aerosol particles by air mass from
the Arabian Sea, Bay of Bengal and from semi-arid region to the observing site, the high values of AODs have also been
influenced by biomass and agricultural burning and frequent incidents of forest fire at local regions.
Introduction
Atmospheric aerosols from natural and anthropogenic have strong influence on the climate system by reflecting, scattering,
absorbing and terrestrial radiation. Aerosol optical depth (AOD) is a dimensionless quantity which is defined as the
attenuation of direct solar radiation passing through the atmosphere by scattering and absorption due to aerosols. Aerosols
also involving in the formation of clouds and precipitation as cloud condensation and ice nuclei alter the microphysical
structure and the lifetime of clouds within the atmosphere (Rosenfeld et al., 2006). Nowadays satellite-based analysis has
been well established on globally to study the impact of aerosol and rainfall on cloud microphysics (Costantino and Breon,
2010).
Methodology
The Moderate Resolution Imaging Spectroradiometer (MODIS) launched on December 1999 and it is a key instrument
aboard the Terra (EOS AM) and Aqua (EOS PM) satellites. The MODIS sensor is onboard the polar orbiting NASA-EOS
Terra and Aqua spacecrafts with equator crossing times of 10:30 and 13:30 Local Solar Time (LST), respectively (Levy et
al., 2007). There are three different processing levels for the MODIS data level 1 is the geolocated & calibrated brightness
temperatures and radiances, level 2.0 gives the derived geophysical data products and level 3.0 gives the gridded time-
averaged products (King et al., 2003). There are 36 spectral bands with different spatial resolutions, 29 spectral bands with
1km, 5 spectral bands with 500m and 2 spectral bands with 250m, nadir pixel dimensions. In the present work daily mean
MODIS Terra derived Level 3 gridded 1º×1º aerosol optical depths (AOD), cloud optical depth (COD), cloud effective radius
(CER) and cloud fraction (CF) are derived with collection 5.1 versions at 550nm. 550nm is closest to the central part of the
whole spectral range. AODs which are above 0 and less than 1.0 are only considered due to cloud contamination (Chung et
al., 2005). Tropospheric Rainfall Measuring Mission (TRMM) was launched in 1997 it is a joint US-Japan program.
Precipitation Radar (PR), TRMM Microwave Imager (TMI), and the Visible and Infrared Scanner (VIRS) instruments are
inbuilt within the TRMM. Daily TRMM 3B42 with a collection version of C005 level 3 measures the tropical and subtropical
rainfall.
Conclusion
Aerosol, clouds and precipitation interactions are thought to nature the behaviour of the climate system. The study site was
affected by various types of aerosols as well as local biomass burning. The fossil fuel and biofuel combustion are increasing
over Madurai as a result of rapidly growing population and urbanization. In this work high aerosol conditions, due to biomass
burning and urban air pollution may be significantly suppress precipitation. The rise of societal problems such as inadvertent
weather and global climate change, acid rain, the nuclear winter, global climate change, ozone depletion and geo-engineering
activities, agricultural activities, industrialization, urbanization, transportation also came to recognition that awareness about
atmospheric aerosols is still quite limited and inadequate to complete any climate assessment. More research tools, alternative
techniques and alternative ways should implement for understanding the dynamics of climate system and to reduce
emissions.
Acknowledgement
We gratefully acknowledge the GES-DISC’s interactive online visualization and analysis infrastructure (Giovanni) as a part
of NASA’s Goddard Earth Sciences (GES) Data and Information Services Centre (DISC).
References
Rosenfeld D., Kaufman Y.J., Koren I., 2006. Switching cloud cover and dynamical regimes from open to closed Benard cells
in response to suppression of precipitation by aerosols. Journal of Atmospheric Chemistry and Physics 6, 2503–2511.
Costantino L., Breon F.M., 2010. Analysis of aerosol-cloud interaction from multi-sensor satellite observations. Journal of
Geophysical Research Letter 37, L11801.
King M.D., Menzel W.P., Kaufman Y.J., Tanre D., Gao B.C., Platnick S., Ackerman S.A., Remer L.A., Pincus R., Hubanks
P.A., 2003. Cloud and aerosol properties, precipitable water, and profiles of temperature and humidity from MODIS.
Geoscience and Remote Sensing 41, 442 – 458.
Chung C., Ramanathan V., Kim D., Podgorny I.A., 2005. Global anthropogenic aerosol direct forcing derived from satellite
and ground-based observations. Journal of Geophysical Research Letter 110, D24207.
Levy C., Lorraine A., Remer., Mattoo S., Eric F., Vermote., Yoram J., Kaufman Y.J., 2007. Second- generation operational
algorithm: Retrieval of aerosol properties over land from inversion of Moderate Resolution Imaging Spectroradiometer
spectral reflectance. Journal of Geophysical Research 112, D13211.

203
AEROSOL AND ENVIRONMENTAL CONTAMINATION IN A DENTAL HOSPITAL - EVIDENCE FROM
INDIA
S. Katpattil (1)
(1) Department of Public Health Dentistry Yenepoya Dental College and Hospital, Mangalore
Presenting author email: [email protected]
Introduction
Patients and operators are exposed during dental practice to an infective risk, which derives especially from microorganisms
suspended in aerosols. Environmental microbiological monitoring in dental settings represents a good instrument to detect
critical situations.
Methodology and Results
In order to investigate environmental microbial contamination level , we analyzed water, air and surfaces samples of a dental
hospital . Microbial contamination was assessed for 5 non-consecutive weeks during working days, before and at the end of
the daily activity. Air was sampled also during clinical activity, through both active and passive sampling
systems.Contamination of water showed a decrease during activities, while a decrease in air contamination was registered
only at the end of the day. Passive sampling values resulted more often above threshold values adopted. At the same time,
surfaces contamination increases at the end of the activity. It seems hospital that in the dental clinic analyzed microbial
buildup represents the higher critical element. No differences have been registered among the different days of the week.
Conclusions
Our study highlights the need to improve disinfection procedures and air treatment systems in the dental hospitals.
Microbiological monitoring could represent an important element to detect the presence of risk factors and to adopt control
Measures.
References
Pankhurst CL, Philpot-Howard JN. The microbiological quality of water in dental chair units. J Hosp Infect 1993; 23:167-74.
Atlas RM, William JF, Huntington MK. Legionella contamination in dental unit water. Appl Environ Microbiol 1995;
61:1208-13.
Challacombe SJ, Fernandes LL. Detecting Legionella pneumophila in water systems: a comparison of various dental units.
J Am Dent Assoc 1995; 126:603-8

204
IMPACT OF BIOMASS BURNING ON INDIAN AIR QUALITY DURING PRE-MONSOON SEASON
A.Nithin Kumar (1), Vikas Singh (2), Amit Kesarkar (2) and M. Sri Murali (1)
(1) Sri Venkateswara University, Tirupathi 517502, India; (2) National Atmospheric Research Laboratory, Department of
Space, Gadanki, Andhra Pradesh, 517112, India.
Presenting author email:[email protected]
Summary
This study aims to understand the impact of biomass burning on Indian air quality during a pre-monsoon season. One month
simulation for May 2015 has been carried out with and without Fire Inventory from NCAR (FINN) using WRF-Chem model
(Weather Research Forecasting coupled with chemistry) to obtain the concentrations of trace gases and fine and coarse
particulate matter. The model has been compared with the surface observation that shows that model is able to capture the
temporal variations for ozone and NO2 qualitatively but differs in terms of magnitude. An increase in the concentration
levels has been simulated with FINN emissions that show that biomass burning has significant impact on the air quality over
India.
Introduction
Biomass burning is the combustion of organic matter. This emits large amount of trace gases such as nitrogen oxides, carbon
mono oxide, methane, non-methane hydrocarbon, carbon dioxide and particulate matter in to atmosphere. Emissions of these
trace gases produce secondary pollutants and can impact the air quality, health and climate. Particulates emitted from
biomass burning can impact climate by altering radiation budget and can also affect human health when they are inhaled,
causing respiratory and cardiovascular problems. Also, it has effect on the photolysis rates which can alter the concentrations
of photo-chemically active species such as Ozone. Ozone can affect the crop production, health and also contributes to global
warming. The aim of this study is to understand the impact of biomass burning on Indian air quality during May month of
pre-monsoon season.
Methodology and Results
WRF-Chem modelling system has been used to simulate regional scale
air quality over Indian domain with and without fire emissions. The
input to this model includes NCEP-GFS Meteorological initial and
boundary conditions, EDGAR anthropogenic, MEGAN biogenic and
FINN fire emissions, Chemical initial and boundary conditions
(MOZART). FINN emission estimates are based on the framework
described by Wiedinmyer et al. (2011). FINN uses satellite
observations of active fires and land cover, together with emission
factors and estimated fuel loadings to provide daily, highly-resolved
(1x1 km) open burning emissions estimates for use in regional and
global chemical transport models. Fig.1 shows the FINN CO fire
emissions on 6th may 2015. Simulation has been carried out for a pre-
monsoon month May 2015 with a resolution of 27km. The gas-phase
chemistry is based on the CBM-Z mechanism having 67 species and
164 reactions. Rates for photolytic reactions are derived using the Fast-
J photolysis rate scheme. The aerosol module is the MOSAIC which
includes sulfate, nitrate, chloride, carbonate, ammonium, sodium,
calcium, black carbon, primary organic mass, liquid water, and other
inorganic mass (dust) with 8 Bin size. The simulated concentrations
have been compared with the surface observation. This validation
shows that model is able to capture the temporal variations for ozone
qualitatively but differs in terms of magnitude. Fig 2 is the simulated
mean CO concentration (ppbv) for May 2015 without FINN Fire
emissions.
Conclusions
Trace gases and particulate matter concentrations have been simulated over Indian region with and without FINN fire
emissions using WRF-Chem model for a pre-monsoon month May 2015. It has been found that inclusion of FINN emissions
increases the levels of simulated concentrations and also affects the radiation budged over India. The results show that
biomass burning has impact on the air quality over India. This work is ongoing and the detailed results will be presented.
Acknowledgement
This research work is being carried out and supported by NARL (National Atmospheric Research Laboratory), Gadanki,
India.
References Wiedinmyer, C., S. K. Akagi, R. J. Yokelson, L. K. Emmons, J. A. Al-Saadi, J. J. Orlando, and A. J. Soja. "The Fire Inventory from Ncar
(Finn): A High Resolution Global Model to Estimate the Emissions from Open Burning." Geoscientific Model Development 4, no. 3: 625-
41, 2011.
Fig.1 FINN CO fire emissions on 6th may 2015
Fig.2 Simulated mean CO concentration (ppbv) for
May 2015 without FINN Fire emissions.

205
SHORT-TERM VARIABIITY OF INORGANIC IONIC COMPONENTS IN FINE AEROSOLS OVER ATHENS,
GREECE.
D. Paraskevopoulou (1), P. Zarmpas (2), L. Fourtziou (2), N. Mihalopoulos (1,2)
(1) Institute for Environmental Research and Sustainable Development, National Observatory of Athens, I. Metaxa and Vas.
Pavlou, 15236, P. Penteli, Athens, Greece; (2) Environmental and Analytical Chemical Division, Department of Chemistry,
University of Crete, P.O. Box 2208, 71003 Heraklion, Greece
Presenting author email: [email protected]
Summary
To understand fine aerosol sources in Athens, Greece and the factors controlling their short and long-term variability,
inorganic ions were measured at Thissio station, from December 2014 to October 2015. Concentrations of Cl-, NO3- and SO4
-
2 ions were determined using particle-into-liquid sampler (PILS) and were in good agreement with corresponding
concentrations obtained by collocate filter analyses. The highest nss-SO4-2 values were observed in summer (average 2.46 ±
1.30 μg m-3) and the lowest in winter (average 1.56 ± 1.04 μg m-3) revealing the significant impact of intense photochemistry
during the warmest period of the year. On the other hand, maximum NO3- concentrations were observed during night-time in
winter, highlighting the importance of biomass burning for domestic heating during the coldest months of the year.
Introduction
Aerosol particles constitute a significant component of the atmospheric system. They are emitted in the atmosphere by
variable sources, through diverse formation and subsequent transformation mechanisms, resulting in a mixture of chemical
characteristics. Particulate matter aerodynamically smaller than 2.5 μm (PM2.5) is of particular concern because of the
significant contribution to detrimental health effects. As a consequence, one of the major challenges in aerosol science is the
understanding of fine particle chemical composition in cities and especially in big agglomerations such as Athens where the
half of the Greek population (4,5 M Inhabitants) is living. Athens is situated in the Eastern Mediterranean, an area that
constitutes a crossroad of three continents, being highly influenced by sources of both natural and anthropogenic origin, such
as Saharan desert and European mainland.
Methodology and Results
Atmospheric air was sampled using a particle-into-liquid sampler (PILS)
(Orsini et al., 2003), coupled with ion chromatography. Sampling was
performed through a 1μm cut-size impactor and a denuder, from
December 2014 to October 2015, at Thissio station (Paraskevopoulou et
al., 2015). In parallel, daily samples of fine aerosol were collected on
quartz fiber filters (4.7 cm, Whatman QMA), using a Dichotomous
Partisol sampler (R&P Co). All collected samples were analysed by ion
chromatography (IC) (Paraskevopoulou et al., 2015). The mean
concentration of Cl-, NO3- and SO4
-2 measured by PILS, was 0.29 ± 0.20,
0.69 ± 0.35 and 1.86 ± 1.6 μg m-3, respectively. These results were in good
agreement with the corresponding concentrations obtained by filter
analysis through ion chromatography (Figure 1). On a seasonal basis, the
highest nss-SO4-2 values were observed in summer (average 2.46 ± 1.30 μg
m-3) and the lowest in winter (average 1.56 ± 1.04 μg m-3). Higher summer
sulphate levels were the result of enhanced photochemistry associated with
more intense solar radiation, combined with less precipitation and higher
regional transport. On the other hand, the diurnal variability of NO3-
presents maximum values mostly during night-time, due to the thermal
instability of ammonium nitrate (Figure 2).
Conclusions
Fine aerosol ionic components were determined, using two different
techniques, allowing the study of their short and long-term variability, to
better understand the effect of biomass burning during the coldest period of
the year and, of intense photochemistry during the warmest months, in the Greater Athens area.
Acknowledgement
The authors acknowledge support by the European Project ACTRIS (Aerosols, Clouds, and Trace gases Research
InfraStructure Network) and by the “Program Agreements between Research Centers – GSRD” 2015-2017.
References
Orsini, D.A., Ma, Y., Sullivan, A., Sierau, B., Baumann, K., Weber, R.J., 2003. Refinements to the particle-into-liquid
sampler (PILS) for ground and airborne measurements of water soluble aerosol composition. Atm. Environ. 37, 1243-1259.
Paraskevopoulou, D., Liakakou, E., Gerasopoulos, E., Mihalopoulos, N., 2015. Sources of atmospheric aerosol from long-
term measurements (5 years) of chemical composition in Athens, Greece. Science of The Total Environment 527–528, 165-
178.
Fig.1 12-hour concentrations of SO4-2 (μg m-3)
calculated by both PILS and IC filter analysis, at
Thissio station.
Fig.2 Diurnal variability of NO3-1 concentrations
(μg m-3) and temperature (oC) at Thissio site.

206
PARTICLE NUMBER CONCENTRATION AND PARTICLE SIZE DISTRIBUTION MEASUREMENTS BY
MOBILE LABORATORY IN TAMPERE, FINLAND
O. Potila (1), K. Pihlava (1), H. Timonen (2), R. Hillamo (2), J. Kuula (2), H. Wihersaari (1), P. Simonen (1), M. Olin (1), M.
Dal Maso (1), J. Keskinen (1) and T. Rönkkö (1)
(1) Aerosol Physics Laboratory, Department of Physics, Tampere University of Technology, P.O. Box 692, FI-33101,
Tampere, Finland; (2) Finnish Meteorological Institute, Erik Palménin aukio 1, FI-00560 Helsinki, Finland
Presenting author email: [email protected]
Summary
In this study, we utilized a new mobile laboratory to produce information related to particle number concentration and size
distribution as well as gaseous pollution compounds in Tampere city center. Measurements consisted of on-road
measurements, dispersion measurements and road-side measurements in certain pollution hotspots. Preliminary results
indicate that particle number concentrations vary a lot depending on the environment, from 1000 1/cm3 in background area
measurements to higher than 100 000 1/cm3 near traffic. Particle number concentration was dominated by nanosized particles
(< 50 nm). In general, the study indicates that traffic emissions should be taken into account when evaluating the human
exposure to particles in Tampere city center.
Introduction
Particulate pollution cause severe health risks. Very high particle concentrations are typically measured in city centers and
other areas near traffic (Pirjola et al. 2012, Lähde et al. 2014). Vehicle exhaust particles have been reported to form different
modes in particle size distribution depending on the particle formation mechanism. Typically, vehicle exhaust particle
number is dominated by nucleation mode particles whereas the particulate mass is dominated by soot mode particles. The
existence of different modes depends on vehicle technologies, driving conditions and environmental parameters. In addition,
the real-world emissions of vehicles may differ from laboratory studies. Mobile laboratory measurements enable the
acquisition of reliable real-world data from traffic emissions and human exposure.
Methodology and Results
A two-week measurement campaign was conducted with the new
mobile aerosol laboratory of TUT in the fall 2015 (between 29th
September and 7th October). A wide range of aerosol instruments
were applied in the measurements, including ELPI+ (Dekati Ltd.),
EEPS (Model 3090, TSI Inc.), Ultrafine CPC (Model 3776, TSI
Inc.), NSAM (Model 3550, TSI Inc.), Pegasor M-Sensor (Pegasor
Ltd.) and a particle sensor setup from the Finnish Meteorological
Institute. In addition, the concentrations of gaseous components of
SO2, CO2 and NOx were monitored.
Three types of measurements were performed. Dispersion of the
traffic emissions were measured at three different locations in the
city. In roadside measurements, the emissions were measured at four
fixed locations, one day (roughly from 9 a.m. to 5 p.m.) at each
location site. On-road measurements were conducted by driving in
traffic on two measurement routes during rush hours.
The preliminary results indicate that the particle number
concentrations vary depending on the environment. The highest particle number concentrations (more than 100 000 1/cm3)
were measured in on-road measurements. High concentration peaks were observed also at roadside measurement sites as
heavy duty vehicles (such as local busses) drove by the measurement site.
Conclusions
A new mobile laboratory was utilized in air quality measurements in Tampere city center (Finland). Preliminary results
indicate that particle emissions of traffic should be considered in the evaluation of the human exposure to particles.
Acknowledgement
This work was conducted in the INKA ILMA/EAKR project funded by Tekes, European Union, Helsinki Region
Environmental Authority (HSY), City of Tampere, City of Kuopio, Dekati Ltd., Genano Ltd., Nordic Envicon Ltd., Pegasor
Ltd., Sandbox Ltd., Suomen Terveysilma, TreLab Ltd. and Vallox Ltd.
References
Lähde, T., Niemi, J.V., Kousa, A., Rönkkö, T., Karjalainen, P., Keskinen, J., Frey, A., Hillamo, R., Pirjola, L., 2014. Mobile
particle and NOx emission characterization at Helsinki Downtown: Comparison of different traffic flow areas. Aerosol and
Air Qual. Res. 14, 1372-1382.
Pirjola, L., Lähde, T., Niemi, J., Kousa, A., Rönkkö, T., Karjalainen, P., Keskinen. J., Frey, A., Hillamo, R., 2012. Spatial
and temporal characterization of traffic emissions in urban microenvironments with a mobile laboratory. Atmos. Environ. 63,
156-167.
Fig.1 Mobile aerosol laboratory of TUT on the
measurement site in Tampere city center.

207
STUDY OF THE RADIATIVE PROPERTIES OF AEROSOLS FROM SATELLITE DATA OVER AN URBAN
AREA: AIR QUALITY APPLICATION
Samaneh Sabetghadam (1), Masoud Khoshsima (2)
(1) Institutes of Geophysics, University of Tehran, Tehran, Iran; (2) Satellite Research Institute, Iranian Space Research
Center, Tehran, Iran
Presenting author email: [email protected]
Introduction
Aerosols are one of the most inconsistent components of the atmosphere. They affect the Earth’s radiative budget and
climate directly by absorbing and scattering the radiation, and indirectly by acting as cloud condensation nuclei. Atmospheric
aerosols can cause either cooling or warming of the atmosphere. Moreover, aerosols have been concerned in human health
and visibility reduction in urban areas.
Despite considerable development in understanding aerosol effect on climate, it is poorly quantified because of the lack of
adequate information on the temporal and spatial variability of aerosols around the world. Hence, it is important to study
aerosol properties across different using space technology, in order to understand their local climatic and environmental
impacts. Remote sensing of aerosols from satellite-based sensors has turn into an important instrument to monitor and
quantify the aerosol optical properties over the globe on a daily basis.
The fundamental aerosol properties which primarily determine the strength and sign of the radiative forcing are the aerosol
single scattering albedo (SSA), Aerosol Extinction Optical Depth(AEOD) and Aerosol Absorption Optical Depth(AAOD).
Data and Methodology
In this work, results of investigation four-year of AEOD, AAOD and SSA over Tehran urban area in Iran, using satellite
data from that of the Ozone Monitoring Instrument (OMI) aboard EOSAura and the Moderate Resolution Imaging
Spectroradiometer (MODIS) aboard EOS-Aqua are presented during the period from October 2004 to October 2014. We
follow a multi-satellite approach to estimate the aerosol radiative properties.
Results
Regionally 4-year averaged aerosol single scattering albedo over Tehran urban area shows variation in SSA from 0.90 to
0.96 depending on the wavelength. that shows aerosols are appear more absorbing in the region and emphasise on positive
warming effect. The lowest and highest value of SSA related to year 2014 and 2007. The minimum average value in the
period is observed in cold season over the area.
An analysis of the variability in AAOD products indicates that the absorption optical depth appears about 0.05, 0.04 and
0.02 at 354, 388 and 500 nm, respectively. It means absorbing aerosols are dominated over the populated and polluted city of
Tehran. It is in accordance with the studies in the literature for urban areas. The highest value is occurred in summertime,
which show the maximum aerosol load. Over this region, the smoke particles generated from burning activities are often
mixed with the dust aerosols transported from deserts.
Keywords: Aerosols, Optical properties, single scattering albedo, aerosol optical depth.

208

209
AIR QUALITY IMPACTS OF THE INCREASING USE OF BIOMASS
FUELS

210

211
IMPACT OF BIOMASS COMBUSTION ON THE URBAN AIR QUALITY OF ATHENS
M.Gratsea (1), E.Gerasopoulos (1), E.Liakakou (1), N.Mihalopoulos (1,2)
(1) Institute for Environmental Research and Sustainable Development, National Observatory of Athens; (2) Environmental
Chemical Processes Laboratory, Department of Chemistry, University of Crete
Presenting author email: [email protected]
Summary
Data derived from in situ measurements for the period 2000-2015 has been used for the evaluation of the extended biomass
burning phenomenon in Athens since 2011, when the economic recession affected the price of oil in Greece. We discuss the
impact of the financial crisis on the air quality of Athens, using measurements of black carbon (BC) carbon monoxide (CO).
Introduction
Satellite observations have shown a 30-40% reduction in nitrogen dioxide (NO2) tropospheric columns over Athens as a
result of a decline in fuel consumption due to the financial crisis which has engulfed Europe since 2008 (Vrekoussis et al.,
2013). Since 2011, when the price of oil in Greece was affected by the economic crisis, a great part of Athens’ population is
relying on wood stoves and fireplaces for domestic heating, resulting in severe air pollution episodes during winter months.
Carbon monoxide (CO) and black carbon (BC) being good indicators for combustion processes (Saurer et al., 2009), they are
used in this study in order to relate the evolution of air quality to the economic recession. CO and BC measurements are
strongly correlated (r2=0.94), so we have focused on CO measurements to study longtime trends (2000-2015).
Methodology and Results
Data was acquired from three monitoring stations (Marousi,
N.Smyrni, Athinas) of the National Network for Atmospheric
Pollution (EDPAR), and from the monitoring site of the National
Observatory of Athens at Thissio (Fig. 1). BC measured at Thissio
was acquired using a portable Aethalometer (AE-42, Magee
Scientific) operating at 7 wavelengths. The CO and nitrogen
monoxide (NO) measurements from EDPAR were conducted using
NDIR and chemiluminescence technique, respectively. An overview
of CO and BC data during 2014-15 wintertime (November 2014 –
February 2015), clearly shows the prevailing high values of BC and
CO during evening and night due to intense wood combustion.
Recorded BC mass concentrations in some cases reach 18 μg/m3.
The CO concentration throughout the day ranges from 200 to 3500
ppb, with high values again recorded during night time. Comparing
the mean diurnal cycle for each month, a late evening CO and BC
buildup during the transition from autumn to winter is revealed and a
restore of normal values towards spring. Calculation of the mean
integrals of morning (between 06:00 and 10:00 LT) and evening
(16:00 and 05:00 LT) peaks for winter (December-January) and
summer (July-August), reveals a gradual decrease over the years
(2000-2015) of the summer and the winter morning peaks. In
contrast, an increase in winter evening integrals is observed during
the last 4 years (e.g. 80% increase since 2012 for Athinas station)
due to intense biomass burning (Fig. 2).
Conclusions
Both the gradual replacement of old vehicles with ones having catalytic converter and the financial recession since 2008 have
resulted in a gradual decrease of gaseous and particle pollutants. However, since 2012 biomass combustion has prevailed
over fossil fuel for domestic heating, resulting in sharp increase of CO and BC during evening. Hence, there is a need for
suitable measures to be implemented both for the amelioration of the air quality and for the economic relief of the consumers.
Acknowledgement
The authors acknowledge the National Network for Atmospheric Pollution for providing data from its ground based stations.
The work was performed in the frame of the project THESPIA-KRIPIS, Greece and European Regional Development Fund
of the EU in the frame of NSRF and the O.P. Competitiveness and Entrepreneurship and the Regional Operational Program
of Attica. Part of the work is co-funded by the "Programme Aggreements between Research Centers" GSRT 2015-2017.
References
Saurer M., Prevot A.S.H., Domnen J., Sandradewi J., Baltensperger U., Siegwolf T.H., 2009. The influence of traffic and
wood combustion on the stable isotopic composition of carbon monoxide, Atmos. Chem. Phys., 9, 3147-3161.
Vrekoussis M., Richter A., Hilboll A., Burrows J.P., Gerasopoulos E., Lelieveld J., Barrie L., Zerefos C., Mihalopoulos N.,
2013. Economic crisis detected from space: Air quality observations over Athens/Greece, Geophys. Res. Lett., 40, 458–463,
doi:10.1002/grl.50118.
Fig.1 Locations of Thissio and EDPAR stations in
the Greater Area of Athens
Fig.2 Mean integrals of the winter evening CO
peaks for Marousi (black line), N.Smyrni (grey line) and Athinas (red line) stations
2000-1 2005-6 2010-11 2014-150
2
4
6
8
10
12
2000-1 2005-6 2010-11 2014-150
2
4
6
8
10
12
2002 2004 2006 2008 2010 2012 20140
1
2
3
2002 2004 2006 2008 2010 2012 20140
1
2
3
Marousi
N.Smyrni
Athinas
(b)(a)
(c) (d)
Summer 16:00-05:00Summer 06:00-10:00
Winter 06:00-10:00 Winter 16:00-05:00
2000-1 2005-6 2010-11 2014-150
2
4
6
8
10
12
2000-1 2005-6 2010-11 2014-150
2
4
6
8
10
12
2002 2004 2006 2008 2010 2012 20140
1
2
3
2002 2004 2006 2008 2010 2012 20140
1
2
3
Marousi
N.Smyrni
Athinas
(b)(a)
(c) (d)
Summer 16:00-05:00Summer 06:00-10:00
Winter 06:00-10:00 Winter 16:00-05:00

212
IMPACT OF EU CLIMATE AND AIR QUALITY POLICY ON OZONE DAMAGE IN EUROPE
C. Hendriks (1), W. Schöpp (2), M. Schaap (1), N. Forsell (2), G. Kiesewetter (2)
(1) TNO, Department of Climate, Air and Sustainability, P.O. Box 80015, 3508 TA, Utrecht, The Netherlands; (2)
International Institute for Applied Systems Analysis (IIASA), Schlossplatz 1, A-2361 Laxenburg, Austria
Presenting author email: [email protected]
Summary
Ground level ozone concentrations and damage in Europe under mid-21st-century emission and land use conditions are
explored for two PRIMES energy scenarios, including the possible effects of climate change. For both energy scenarios,
health damage because of high ground level ozone concentrations is projected to decline significantly towards 2030 and 2050
under current climate conditions. The projected change in anthropogenic ozone precursor emissions is more important than
land use change. However, the increase in ground level ozone caused by a warming climate might be higher than the
reduction achieved by cutting back ozone precursor emissions.
Introduction
In the EU28, ground-level ozone is associated with at least 16160 excess deaths each year (EEA, 2014). Ozone production is
driven by emissions of ozone precursor substances nitrogen oxides (NOx) and volatile organic compounds (VOC) and
availability of light. While NOx is mainly of anthropogenic origin, vegetation is an important VOC source. European energy
policy promoting bioenergy production can cause vegetation (land use) changes. Typical bioenergy crops (e.g. poplar,
willow) emit high amounts of VOC (of which isoprene is one of the most relevant), in this way energy policy influences
precursor emissions. Here we explore the combined effect of land use and direct anthropogenic emission changes on ozone-
related health damage, including the possible impacts of climate change.
Methodology and Results
A current legislation and a
decarbonisation energy scenario for the
EU28 developed with the PRIMES
energy model (Antoniou and Capros,
1999) were used as input to the
GAINS model to generate air pollutant
emissions for 2030 and 2050. The same
two energy scenarios were used to
drive the Global Biosphere Model
(GLOBIOM) (Havlik et al, 2014).
These emission and land use scenarios
were used to drive the 3D regional
chemistry transport model LOTOS-
EUROS to calculate ground level
ozone concentrations and related health damage. Meteorology for 2010 was used to represent the current climate and the
extremely warm year 2003 was used as representative for the future climate. For the decarbonisation scenario in 2050, a 50%
increase of isoprene emissions from vegetation is calculated. Anthropogenic ozone precursor emissions are projected to
decrease significantly (70% for NOx, 48% for NMVOC).
The land use and emission change projected for 2050 causes a decrease in ozone health damage (Relative Risk) of 10-50 %-
points, with especially large reductions over Italy where the ozone health damage is almost halved. Under future climate
conditions, however, this reduction is almost completely annulled and in north western Europe even an increase in health
damage is modelled (see Figure 1).
Conclusions
For both energy scenarios studied in this work, health damage because of high ground level ozone concentrations is projected
to decline significantly towards 2030 and 2050, especially for central and southern Europe where health damage due to ozone
might be halved in 2050. The differences in ozone impact between the two scenarios were limited. However, ozone damage
increases in a warming climate, which may cause total health damage in Europe due to ozone to increase towards 2050.
Strong European or global air quality policies are needed to prevent this.
Acknowledgement
This work was funded by the EU FP7 project DESIRE (grant agreement No 308552) and developed during the Young
Scientists Summer Program 2015 at the International Institute for Applied Systems Analysis, Laxenburg, Austria.
References
European Environment Agency (EEA), 2014. Air quality in Europe – 2014 Report. EEA report 5/2014, doi:10.2800/22775
Antoniou, Y., Capros, P., 1999. Decision support system framework of the PRIMES energy model of the European
Commission. International Journal of Global Energy Issues 12, 1-6
Havlik P, Valin H, Herrero M, Obersteiner M, Schmid E, Rufino MC, Mosnier A, Thornton PK, Bottcher H, Conant
RT, Frank S, Fritz S, Fuss S, Kraxner F, Notenbaert A (2014). Climate change mitigation through livestock system
transitions. PNAS, 111(10):3709-3714
Fig.1 Difference in Relative Risk (%) with the base scenario for 2010 for the
decarbonisation scenario in 2050 under current (left) and future climate conditions (right)

213
Fig.1 Experimental set-up
ULTRAFINE PARTICLE EMISSION CHARACTERISTICS OF A RESIDENTIAL PELLET STOVE
S. Ozgen (1), S. Becagli (2), V. Bernardoni (3), L. Corbella (4), A. Crespi (3), M. Dell'Acqua (3), P. Fermo (4), R. Gonzalez
(4), G. Lonati (1), S. Signorini (5), R. Tardivo (1), G. Valli (3), R. Vecchi (3), L. Galli (6)
(1) Department of Civil and Environmental Engineering, Politecnico di Milano, Milan, 20133, Italy, (2) Department of
Chemistry, Università degli Studi di Firenze, Sesto Fiorentino (Fi), 50019, Italy, (3) Department of Physics, Università degli
Studi di Milano and INFN - Milano, Milan, 20133, Italy, (4) Department of Chemistry, Università degli Studi di Milano,
Milan, 20133, Italy, (5) Energy and Environment Laboratory (LEAP) Piacenza, Piacenza, 29121, Italy, (6) Department of
Pharmacological and Biomolecular Sciences, Università degli Studi di Milano, Milan, 20133, Italy
Presenting author email: [email protected]
Summary
Two common types of pellet (beech - hardwood and fir - softwood) were burned in a commercial pellet stove (11 kW)
following a combustion cycle simulating the behaviour of a real-world user. The present study was a part of the TOBICUP
project (TOxicity of BIomass COmbustion generated Ultrafine Particles) designed to gain deeper insight on the possible
negative health effects of ultrafine particulate matter (UFP, dp<100 nm) by verifying the toxicological responses of UFP
samples collected directly from residential wood combustion the (RWC) emissions. Here are reported only the results for the
UFP physical-chemical characteristics.
Introduction
Currently RWC is increasing in Europe because of rising fossil fuel prices but also due to climate change mitigation policies.
However, especially in small-scale applications, RWC may cause high emissions of particulate matter (van der Gon et al.,
2015). A recent study (Díaz-Robles et al., 2014) suggests that UFP from residential wood combustion may be responsible for
increased morbidity in urban areas where biomass burning for residential heating is widely used. The size and chemical
composition of the particles are among the aspects related to health effects.
Methodology and Results
The experimental set-up is shown in Fig.1. UFPs were collected by means of three multistage cascade impactors in parallel.
The physical-chemical UFP characterization comprised the detection of elements (Al ,As, Ba, Cd, Co, Cu, Fe, Mn, Mo, Ni, P,
Pb, Sr, Ti, V, Zn) by inductively coupled plasma atomic emission spectroscopy, main inorganic ions by ion chromatography,
levoglucosan by high-performance liquid chromatography coupled to pulsed amperometric detection, and total carbon (TC)
by thermal-optical approach. Particle number size distribution was also performed by a fourth multistage cascade impactor.
The UFP mass concentration varies between 12 - 59 mg/m3
(@NTP,13%O2). A certain variability is observed especially in the fir
pellets samples. The chemical analyses resolve on average 51% of
the measured UFP mass. Up to 39% of the mass is water soluble
inorganic ions, mostly K+ and SO42−. The other major species is the
TC which accounts on average for about 8%. There are also minor
amounts (i.e., each more or less about 1%) of organic anions
(formate, acetate, propionate, oxalate), Cl-, NO2-, NO3- and Ca2+. The
elements account for about another 1% of the resolved mass, with the
major contribution from Zn and Al. Other measured cations (Na+,
NH4+, Mg2+) give a very limited contribution. As expected the
contribution of anhydro sugars (levoglucosan, mannosan, galactosan)
is nearly negligible (0.1‰). Consequently, levoglucosan, one of the
traditional wood combustion tracers is found unsuitable for pellets
combustion. Inorganic components of the UFP particles would serve
better as tracers for pellets appliances.
Conclusions
UFP mass emissions range in a relatively narrow interval (except for one fir sample); a slight difference is observed between
softwood and hard wood pellets emissions. Potassium salts are dominant in every sample. UFP compositional differences
between the pellets types are relevant only for TC and Cl-. The combination of multiple tracers may serve to discriminate
softwood vs. hardwood pellet combustion in the examined samples.
Acknowledgement
This project is funded by Fondazione Cariplo (Project TOBICUP - Ref. 2013-1040).
References
Denier van der Gon H.A.C., Bergström R., Fountoukis C., Johansson C., Pandis S.N., Simpson D., Visschedijk A.J.H., 2015.
Particulate emissions from residential wood combustion in Europe - revised estimates and an evaluation Atmospheric
Chemistry and Physics 15, 6503–6519.
Díaz-Robles L.A., Fu J.S., Vergara-Fernández A., Etcharren, P. Schiappacasse L.N., Reed, G.D. Silva. M.P,. 2014. Health
risks caused by short term exposure to ultrafine particles generated by residential wood combustion: A case study of Temuco,
Chile. Environment International 66, 174–181.

214
MODELLING OF THE IMPACT OF CONSUMPTION OF BIOMASS FOR HOME HEATING ON AIR QUALITY
IN A DISTRICT OF MADRID CITY
J.L. Santiago and F. Martin
Atmospheric Pollution Division, Centro de Investigaciones Energéticas Medio Ambientales y Tecnológicas (CIEMAT)
Avda. Complutense 40, ed 3, 28040 Madrid, Spain
Presenting author email: [email protected]
Summary
In this paper, a CFD model has been applied to analyse the concentration of PM10 at pedestrian level in a district of Madrid
City with a resolution of meters. Atmospheric flows and dispersion of pollutants emitted by road traffic and boilers for home
heating were simulated for a winter period. The results were compared with experimental data of PM10 concentration
recorded at a traffic-oriented air quality station located in the modelled domain. A good agreement between modelled and
measured data was obtained. Possible future emission scenarios were then simulated considering different partitioning of fuel
consumption (natural gas, gas oil, coal and biomass) for home heating. This study shows that an increased consumption of
biomass for home heating can produce a significant increase of PM10 concentrations but much less than in the case of coal.
The use of natural gas would reduce the PM10 concentrations. This study also shows the need of suitably regulating the use
of biomass fuels and promoting the use of cleaner fuels.
Introduction
In recent years, there has been an increase in the consumption of biomass for
home heating, which could have an impact on air quality. In addition, the
emissions of biomass boilers for home heating depend on the physical
characteristics of the biomass, the boiler technology and filtration systems.
Therefore, the use of biomass as a fuel for home-heating boilers in cities should
be regulated. Hence, studies for estimating the impact of using biomass for
home heating on urban air quality are needed. The aim of this study is to
estimate the effect on PM10 concentrations of several emission scenarios where
different degrees of implementation of the use of biomass as a fuel for home
heating with respect to the current situation. In addition, other scenarios
taking into account the consumption of other fuels (coal, gas oil and natural
gas) are analysed.
Methodology and Results
High resolution maps of average PM10 concentrations over a large period of
time (several months) were computed using a CFD model to assess how the pollution is distributed in the streets within a
domain of 700 m × 700 m in Madrid City. In order to avoid a large computational load, the approach of Santiago et al. (2013)
was adopted. This consisted of running only a set of scenarios (16 inlet wind directions) using steady-state CFD-RANS
simulations (STAR-CCM+ code from CD-Adapco). The road traffic emissions were modelled as tracers released from line
sources along every street (one for each street) and the emissions of home heating were located on building stacks. The final
map of average concentrations was made by combining (weighted average) the outputs of the simulated scenarios according
to the meteorological conditions that occurred during the study period (January-March 2011). The resulting PM10
concentration map is shown in Fig. 1. Several scenarios with varying degrees of implementation of the different fuel types
were simulated in order to estimate the impact on PM10 concentrations in the study domain. The results are summarized in
Table 1. Two emission limits for biomass boilers were adopted: the current one of 150 mg/m3 and the limit of 60 mg/m3 to be
implemented in the near future. Currently, biomass use is very low and its
contribution to PM10 levels is small. However, a high consumption of
biomass can produce a significant increase in PM10 levels enlarging the area
with exceedances of limit values. Natural gas and coal are the best and worst
fuels, respectively, with regards to their contribution to PM10 levels.
Conclusions
An intensive use of biomass as a fuel for home heating boilers is expected to
have a significant impact on the ambient PM10 concentrations in urban areas,
even in areas with high traffic intensities such as that studied in Madrid.
Acknowledgement
This work was supported by the Spanish Ministry of Agriculture, Food and
Environment
References
Santiago JL, Martín F, Martilli A (2013) A computational fluid dynamic
modelling approach to assess the representativeness of urban monitoring
stations. Science of the Total Environment 454-455, 61-72.
Fig.1 Average PM10 concentrations (µg/m3) at 3 m
above ground level for the period January-March 2011
considering road traffic and boiler emissions and the
background concentration. Areas with concentration
higher than 50 µg/m3are in white.
Table 1. Estimated impact on ambient PM10
concentrations of several scenarios of fuel usage in
home heating boilers in Madrid.
Scenario Fuel usage share in boilers
in buildings of the studied
domain (%)
Increase of the
Surface of área
exceeding 50 µg/m3
of PM10 respect to
base scenario
Maximum
contribution to the
PM10 concentrations
due to house heating
boilers (µg/m3)
0 (Base) Biomass=0.6%;
Natural Gas =76.6%;
Gas Oil=20.6%;
Coal=2.2%
0% 1.8
1.a Biomass(150 mg/m3)=25%
Natural Gas=75%
20% 6
1.b Biomass(60 mg/m3)=25%
Natural Gas=75%
3% 2.5
2.a Biomass(150 mg/m3)=50%
Natural Gas=50%
52% 11
2.b Biomass(60 mg/m3)=50%
Natural Gas=50%
14% 4.5
3.a Biomass(150 mg/m3)=75%
Natural Gas=25%
85% 16
3.b Biomass(60 mg/m3)=75%
Natural Gas=25%
24% 6.5
4.a Biomass(150
mg/m3)=100%
117% 21
4.b Biomass(60 mg/m3)=100% 38% 8.5
5 Natural Gas=100% -7% 0.5
6 Coal=100% 278% 55

215
TRANSFORMATION RATIOS OF PHENOLS AND NITRO-PAHS GENERATED BY STOVES WOOD
BURNING: A PHOTOCHEMICAL CHAMBER STUDY
Y. Vásquez (1,2), F. Reyes (1,2), N. Olivera (2), N. López (1), P. Oyola (1), E. Gramsch(2), M.Rubio(3), E. Lissi (3); A.
Cadíz (4); and Pérola de Castro Vasconcellos(5).
(1) Mario Molina Center, Santiago of Chile; (2) Department of Physics, Faculty of Science, University of Santiago, Santiago,
Chile; (3) Faculty ofChemistry and Biology, University of Santiago, Santiago, Chile; (4) Vehicle’s Control and Certification
(3CV), (5) Laboratory of Atmospheric Chemistry, Institute of Chemistry, University of Sao Paulo
Presenting author email: [email protected]
Summary
This study aims to determine formation potential of SOA within a photochemical chamber and compare concentrations of
Phenols and Nitro-PAHs of primary and secondary samples (with and without UV irradiation) of pellets wood stoves
emission. Analytical techniques HPLC-DAD and GC-MS were used to identify the phenols and Nitro-PAHs, respectively.
The ratios comparison shows the similar ratios transformation (90% of compounds) with except of 9-nitrophenol and 3-
nitrophenol.
With these ratios you can estimate what happens in the atmosphere of these substances (phenol and nitro-PAHs) resulting
from the combustion of biomass.
Introduction
The massive use of different types of stoves for residential heating in south of Chile, generated usually during the winter,
severe air quality problems, due to this is essential study the real contribution of these air quality and potential health effects
of the population and its contribution to climate change.
Methodology and Results
Photochemical Chamber (developed by Harvard T H
Chan School of Public Health) is a Teflon bag, cubic
shape of 14 m3. In order to have a clean air prior to
experiment, the chamber was flushed overnight using a
Clean Air System (a set of 2 HEPA filters, activated
carbon and acid and basic filters). Chamber clean air
was verified using continuous monitors (NOx, CO and
Particles).
In order to fill the Chamber with primary
emission, a small amount of pollutants coming
from pellet stove (Rika) was transported directly
to the chamber during a period of 5 minutes,
without any dilution. Throughout Chamber
filling's process, continuous monitors and filters
samples were also collected. Emission samples
were taken using a by-pass line as shown in Fig1. After 5 minutes, the filling process was stopped and pollutants captured
inside the chamber were leaved on darkness for 30 minutes (UV lights OFF), to have a homogeneous air inside the chamber
(diffuse process). Only continuous monitors were operating taking a small amount of samples (flow less than 5 l/min).
After 30 minutes UV lamps were turned on to start the photochemical transformation inside the chamber. Continuous
monitors were always measuring Chamber concentrations. After approximately two hours of UV lamps ON, secondary
samples were taking for two hours. Two Harvard Impactor with quartz filters and two LiChrolut Si® (Merck) cartridge for
phenols were installed in parallel in order to have duplicated for primary and secondary samples.
The results are shown in Table 1
Table 1: Transformation ratios of phenols and nitro-PAHs generated by pellets stove emission.
Conclusions
Primary vs secondary comparison shows secondary particles formation due to photochemical activity inside the chamber but
this formation is around twenty times more for all pollutants analysed (phenols and Nitro-PAHs) with except of 9-
nitrophenol and 3-nitrophenol analysed.
References
Papapostolou, V., Lawrence J. E., Ferguson S. T., Wolfson J. M., Diaz E. A., Godleski J. J., Koutrakis, P.. 2013.
Development and characterization of an exposure generation system to investigate the health effects of particles from fresh
and aged traffic emissions. Air Quality Atmosphere & Health. 2013, Vol 6, Issue 2, pp 419-429.
Type Ratio secondary/primary Type Ratio secondary/primary Type Ratio secondary/primary
9-Nitroanthr 1.29 2-Nitropyr 20.50 Catechol 7.96
9-Nitrophen 228.47 1-Nitropyr 6.00 Phenol 29.68
3-Nitrophen 131.86 4-Nitropyr 14.58 4-Methoxyphenol 17.86
2-Nitrophen 9.90 7-Nitrob(a)Anth 17.10 2-Methoxyphenol 19.65
2-Nitroanthr 19.68 6-Nitrochr 12.04 p-Cresol 20.09
3-Nitrofluor 14.20 3-Nitrobenzanthr 1.44 2,5 Dinitrophenol 24.83
2-Nitrofluor 15.16 6-Nitrob(a)pyr 2.90 4-Nitrophenol 11.92
Fig 8: System set-up of experiment. Yellow line is a bypass to continuous
monitors that allow to measure emission (upstream the photochemical
chamber). Black line is the flow that fill the chamber with emission. Orange line is the line that measure photochemical concentration inside the chamber
(downstream the chamber). Blue line represent the flushing line for clean the
chamber.

216

217
DEVELOPMENT APPLICATION EVALUATION OF AIR QUALITY
AND RELATED MODELS

218

219
EVALUATION OF AEROSOL OPTICAL PROPERTIES USING THE CAMX-AODEM MODELLING SYSTEM
A.Balzarini (1), L.Ferrero (2), B.Mazzini (2), T.C.Landi (3), G.Pirovano (1), A.Riccio (4)
(1) Ricerca sul Sitema Energetico RSE S.p.A., Milano, Italy; (2) POLARIS research center, Department of Earth and
Environmental Sciences, University of Milano-Bicocca, Milano, Italy (3) CNR - Institute for Atmospheric Sciences and
Climate, Bologna, Italy; (4) University Parthenope of Naples, Dept. of Science and Technology, Napoli, Italy;
Presenting author email: [email protected]
Summary
This work aims at evaluating the skill of the AODEM-CAMx modelling system in reconstructing the aerosol optical
properties in the polluted area of Milan. Results were compared to both ground-based and vertical profile measurements
collected in the city of Milan. Our analysis pointed out that the modelling system captures the AOD555 spatial patters, as
well as the aerosol distribution along the vertical profile.
Introduction
The lack of a detailed knowledge on aerosol optical properties is one of the major sources of uncertainties in climate forcing
assessment. Aerosol particles play a key role in determining Earth’s climate by both interacting with solar radiation (direct
effect) and acting as cloud condensation nuclei (indirect effect). Generally, such effects are investigated by means of
modelling tools. However, accurate quantification of direct aerosol forcing is strongly related to the ability of global and
regional models to describe physical and chemical properties of atmospheric pollutants. In order to assess the model skills in
reproducing the spatio-temporal variability of aerosol optical properties, the AODEM – CAMx modelling system has been
applied over the urban area of Milan and compared to ground-based and experimental vertical profiles collected during field
campaigns (Ferrero et al., 2014).
Methodology and Results
High-resolution simulations (i.e. horizontal grid size of 1.7 km) of aerosol mass
concentrations and aerosols optical properties were carried out for February 2010
by applying the AODEM-CAMx integrated modelling system over the urban area
of Milan.
The chemical and transport model (CTM) CAMx (ENVIRON, 2011), driven by
the meteorological model WRF and the local emission inventories (INEMAR;
http://www.inemar.eu), was used for this experiment. Such modelling system
allows an estimation of gaseous and aerosol concentrations in the polluted
environment.
Given the CTM outputs, aerosol optical properties at three different wavelengths
(470, 555 and 675 nm) were calculated by the AODEM post-processing tool
(Aerosol Optical DEpth Module; Landi, 2013).
Modelled data were compared to measurements both in terms of ground
concentrations and vertical profiles. Ground-based observations were retrivered
from AirBase network; while aerosol profile measurements were registered at the
Torre Sarca sampling site, in the Milano Bicocca University Campus, by means of
a helium-filled tethered balloon. Using these collected experimental data,
calculations of scattering and extinction coefficients were performed along the
vertical profiles (Ferrero et al., 2014).
As an example, Figure 1 shows the monthly mean of Aerosol Optical Depth at the
wavelength of 555 nm estimated by AODEM. Besides, Figure 2 shows the
vertical profiles of PM2.5 concentrations performed by CAMx over the city of
Milan.
Our findings suggest that the model can reproduce the AOD555 spatial patters, as
well as the aerosol distribution along the vertical profile.
Acknowledgement
RSE contribution to this work has been financed by the Research Fund for the
Italian Electrical System under the Contract Agreement between RSE S.p.A. and
the Ministry of Economic Development - General Directorate for Nuclear Energy,
Renewable Energy and Energy Efficiency in compliance with the Decree of
March 8, 2006.
References
ENVIRON 2011. CAMx User’s Guide Version 5.4. ENVIRON International Corporation, Novato, CA.
Ferrero et al., 2014, Impact of black carbon aerosol over Italian basin valleys: high-resolution measurements along vertical
profiles, radiative forcing and heating rate, Atmos. Chem. Phys., 14, 9641–9664.
Landi, 2013, AODEM: A post-processing tool for aerosol optical properties calculation in the Chemical Transport Models.
Book published by LAP - Lambert Academic Publishing ISBN: 978-3-659-31802-3.
Fig.1 Monthly mean of Aerosol Optical Depth at 555nm estimated by AODEM.
Fig.2 vertical profiles of PM2.5 concentrations estimated by CAMx in the
city of Milan (Torre Sarca site).

220
RECENT CFD MODELLING AND EXPERIMENTAL STUDIES OF AIR QUALITY AND THERMAL COMFORT
IN URBAN AREAS
R. Buccolieri (1), S.M. Salim (2), J.L. Santiago (3), F. Salamanca (4)
(1) University of Salento, Dipartimento di Scienze e Tecnologie Biologiche ed Ambientali, 73100 Lecce, Italy; (2) University
of Dundee, School of Science and Engineering, Dundee, Scotland, UK; (3) Research Centre for Energy, Environment, and
Technology (CIEMAT), Madrid, Spain; (4) Arizona State University, School of Mathematical and Statistical Sciences,
Tempe, AZ, USA
Presenting author email: [email protected]
Introduction
Six billion dwellers are projected to live in cities by 2050, implying that over 65% of world’s population will be concentrated
in urban areas. The consequence of increasing urbanization by means of replacement of natural land surfaces by buildings
and pavement (i.e. concrete jungles) extensively modifies the climate at local, regional and global scales. The parallel growth
in traffic, industrialisation, and anthropogenic heat emissions within cities continues to cause concerns about levels of air
pollution and health risks associated with periods with elevated ozone, NOx or particulate matter concentrations and
unusually high temperatures (e.g., during heat waves), resulting in alarming rates of mortality.
Over the years, there have been numerous investigations on the dispersion of pollutants in built-up areas. Due to complex
city-atmosphere interactions, the understanding of flow and turbulence processes is limited requiring more investigations, as
well as the assessment of efficient mitigation strategies to improve urban air quality and thermal comfort.
The importance and extent of this multi-disciplinary problem necessitates an integrated multiscale approach taking into
account field measurements, laboratory experiments, and numerical modelling.
Methodology and Results
The paper reviews the most recent studies on air quality and thermal comfort in urban areas, with particular attention to new
and novel measurement techniques and research methodology, and developments in urban meteorology (including thermal
effects) and air quality.
We present latest advances in Computational Fluid Dynamics (CFD) simulation complemented by experimental data from
new field and laboratory campaigns, paying particular attention to the presence and implication of vegetation on urban
climate and air pollution, thermal consequences of urban surfaces and the urban heat island effect, and traffic-induced
turbulence. This is in addition to the coupling of mesoscale and microscale models for meteorological and air pollution
applications and urban canopy parameterizations.
Finally, latest urban air quality application studies are visited, with focus on spatial representativeness of air quality
measurements, air quality issues related with legislation and population exposure to air pollutants and thermal comfort.
Mitigation strategies of urban air pollution and thermal stress, employing urban greening, photocatalytic materials, and urban
planning are also introduced and discussed.
Conclusions
This review attempts to summarise recent advances in CFD simulations, mesoscale modelling and experimentation of air
quality and thermal comfort in urban areas. The dynamics of the urban atmosphere is influenced by a number of factors
including building geometry and packing density, presence of trees and other urban vegetation, buoyancy effects as a result
of thermal exchanges between urban fabrics and the atmospheric boundary layer flow, and traffic-induced turbulence.
At microscale these effects are analysed using different modelling approaches to account for the turbulent dynamics: 1)
Reynolds-Averaged Navier-Stokes (RANS) models solves the flow and pollutant dispersion around the buildings but
parameterizes all the turbulent motions. 2) Large Eddy Simulation (LES) models provide more reliable and accurate
representation of the turbulent dynamics that dictates the mass and momentum transfers in the urban canopy. LES models
show promise despite its high computational demand and sensitivity to boundary conditions. On the other hand, RANS
models are the cheapest CFD models in terms of computational burden, hence they are frequently used in day to day
applications like urban air quality assessment.
It’s also worth noting that the aforementioned effects have been separately investigated and reported, and the review will
bring them together to enable an appreciation of their relative influences and how they interact with one another. The most
recent advances in urban canopy parameterizations for mesoscale models permit to evaluate the efficiency of commonly
proposed urban adaptation strategies (such as green and cool roofs, solar photovoltaic panels, hybrid approaches, etc) to
improve air quality, thermal comfort, and reduce urban energy demand. Within this context, the use of regional atmospheric
models is crucial because potential tradeoffs between different adaptation strategies can show geographic and seasonal
dependence, showing the need for geographically appropriate strategies rather than one strategy fit all solution.

221
EXPERIMENTAL INVESTIGATION OF THE INFLUENCE OF A CUBIC BUILDING ON THE WIND EROSION
OF A MIXING OF ERODIBLE AND NON-ERODIBLE PARTICLES
Maria Clara Caliman (1,2,4), Bruno Furieri (2), Jean-Luc Harion (3), Jane Meri Santos (2), Alexandre Valance (4), Ahmed
Ould El Moctar (5)
(1) Departement of Mathematics, Instituto Federal do Espírito Santo, Vitória, Brazil, (2) Department of Environmental
Engineering, Universidade Federal do Espírito Santo, Vitoria, Brazil, (3) Department of Industrial Energy, Mines Douai,
Douai, France, (4) Physics Institute of Rennes, Université de Rennes, Rennes, France, (5) Thermokinetic Laboratory,
Université de Nantes, Nantes, France
Presenting author email: [email protected]
Summary
In the present paper, we carried out wind tunnel tests of sand particles in an oblong stockpile shape. The sand stockpile is a
mixing of erodible and non-erodible particles due to their size distribution. The main objectives were to determine which case
(concerning the presence of a building upstream) is the most critical to air pollution events and how the non-erodible particles
indicate zones of high erosion in the case of placing an obstacle upstream to the pile. Several papers also reported and it is
very well settled in the literature, that the flow becomes very complex due to the interaction with obstacles even with the
simplest forms. The aims of the present study are to quantify the amount of emitted mass after wind tunnel exposure and to
comprehend the association between high erosion potential zones and non-erodible particles behaviour.
Introduction
Wind erosion of granular material stockpiles has been already studied by means of both numerical and experimental
approaches as shown by several works found in literature [Kok and Renno, 2009; Gousseau et al., 2013]. The non-erodible
particles have enormous influence on the temporal evolution of emissions and consequently on the total amount of particles
taken-off. Still many studies in a wind tunnel are required for a better understanding of the influence of these non-erodible
particles for different configurations. In the present study one observed an improvement in the previously published
methodology [Furieri et al., 2013]: the visual difference between black and white particles representing, respectively,
erodible and non-erodible particles is a new approach found in the present paper. A very remarkable qualitative analysis was
carried out for the visualization of the main areas of erosion on the stockpiles.
Methodology and Results
The experimental scaled-down model is placed at the test
section located approximately 6.20 m downstream the
entrance of the wind-tunnel enabling the development of a
turbulent boundary layer. High quality photographs were
taken each 30 seconds until the final covering of the
stockpile surface. The emitted mass from the stockpile
considerably increases due to the presence of the upstream
cubic obstacle. For the velocity of 7 m/s, we found out an
increase of approximately 83% of emitted mass due to
presence of the building. It takes place by the formation of
complex structures of the modified flow. Two main vortices
are formed downstream of a cubic building and directly
affect the pile (Figure 1). The effect of the main vortices
generated due to the cubic obstacle are clearly seen since the
first thirty seconds of exposure. The windward wall of the
upstream stockpile is not normally affected by the incoming
wind flow (perpendicular).
Conclusions
We have noticed an increase of emitted mass if there is a building modifying the incoming wind flow. The qualitative
analysis have helped us to identify on the stockpile surface the most eroded zones and their temporal evolution. The authors
are developing numerical simulations of the shear distribution on the surface of the stockpile to complement information
obtained experimentally. Required simulations were also never realized due to the fact that simulates the actual dimensions of
a sand stockpile (instead of coal stockpiles already investigated) and consider the existing rounded the crest.
Acknowledgement
FAPES, CNPq and CAPES/COFECUB financially supported this work.
References
J. Kok, N. Renno. A comprehensive numerical model of steady state saltation. Journal of Geophysical Research, 2009.
B. Furieri, S. Russeil, J. Santos, J.-L. Harion. Effects of non-erodible particles on aeolian erosion: Wind-tunnel simulations of
a sand oblong storage pile. Atmospheric Environment, 2013.
P. Gousseau, B. Blocken, G.J.F. van Heijst, Quality assessment of Large-Eddy Simulation of wind flow around a high-rise
building: Validation and solution verification, Computers & Fluids, 2013.
Fig. 1 Wind erosion of a sand stockpile: influence of a cubic
building

222
MATHEMATICAL MODELLING OF EMISSIONS FROM A BED OF GRANULAR MATERIAL EXPOSED TO A
TURBULENT FLOW
Maria Clara Caliman (1,2,4), Bruno Furieri (2), Jean-Luc Harion (3), Jane Meri Santos (2), Alexandre Valance (4), Ahmed
Ould El Moctar (5)
(1) Departement of Mathematics, Instituto Federal do Espírito Santo, Vitória, Brazil, (2) Department of Environmental
Engineering, Universidade Federal do Espírito Santo, Vitoria, Brazil, (3) Department of Industrial Energy, Mines Douai,
Douai, France, (4) Physics Institute of Rennes, Université de Rennes, Rennes, France, (5) Thermokinetic Laboratory,
Université de Nantes, Nantes, France
Presenting author email: [email protected]
Summary
A model was developed to estimate diffuse dust emissions due to wind erosion from a bed of particles with a wide particle
size distribution. The non-erodible particles, treated as roughness elements, create a protection to the erosion. To accurately
estimations it is important taking into account the influence of these larger particles. The model uses previous numerical
simulations that relate the mean friction velocity of an erodible surface with some parameters of the roughness element.
Introduction
Dust emissions from fugitive sources on industrial sites can represent a significant contribution on airborne particle pollution.
At several industrial sites, granular materials present a wide range of particle size distribution. The presence of coarse
particles creates a temporal decrease of the emitted mass flux. Their presence diminishes the wind erosion because they
protect surrounding erodible particles by covering a part of the surface or creating wake zones of low wind speed, leading to
a decrease of the shear stress on the erodible surface. As the surface is eroded, the coarser particles accumulate and protect
the bed surface from erosion, which is known as pavement phenomenon. Considering this, a computational program was
built in order to estimate the mass emitted, taking into account these effects.
Methodology and Results
To assess the shear stress partition between the roughness elements and
the erodible surface underlying we analyze the parameter 𝑅𝑓𝑟𝑖𝑐,
defined by 𝑅𝑓𝑟𝑖𝑐 = 𝑢𝑅∗ 𝑢𝑆
∗⁄ where 𝑢𝑅∗ is the mean friction velocity in the
erodible area of a surface with roughness and 𝑢𝑆∗ is the mean friction
velocity on a smooth surface. By means of numerical simulations with
roughness arrays of varying density, Turpin et al. (2010) proposed:
1 − 𝑅𝑓𝑟𝑖𝑐 = 𝐴. (𝐶𝑅)𝑀. (𝑆𝑓𝑟𝑜𝑛𝑡𝑎𝑙 𝑆𝑓𝑙𝑜𝑜𝑟⁄ )𝑁
𝐸𝑞. 1
where 𝐶𝑅 is the cover rate of non-erodible particles, 𝑆𝑓𝑟𝑜𝑛𝑡𝑎𝑙 and
𝑆𝑓𝑙𝑜𝑜𝑟 are the roughness element frontal and floor surface, respectively,
and A, M and N are constants. The program was built using Python
language and a synthesis of the algorithm is shown in Fig. 1. For each
size range, the amount of particles and the number of layers including
into the height of the bed is calculated. Thereby is possible to
characterize the progress of wind erosion following the evolution of the
parameter 𝑅𝑓𝑟𝑖𝑐. In each iteration, a layer of certain range of particles
is eroded according to the criterion obtained by Foucaut (1996). The
criterion determines the diameters 𝐷𝑐𝑟𝑖𝑡1 and 𝐷𝑐𝑟𝑖𝑡2 which limits the
granulometric slice liable to take-off. As the take-off occur, the roughness augments due to the increase of 𝐶𝑅 and the
parameter 𝑆𝑓𝑟𝑜𝑛𝑡𝑎𝑙 𝑆𝑓𝑙𝑜𝑜𝑟⁄ . The model accounts emissions for each size range until the friction velocity reaches the threshold
friction velocity (𝑅𝑓𝑟𝑖𝑐 = 𝑅𝑙𝑖𝑚). To validate, the experimental data of Descamps (2004) were used. Although the model
slightly overestimates the emissions, an overall good agreement was noticed, with a high correlation coefficient (𝑅2 = 0.98).
Conclusions
In this study, it was developed a model that estimates the total emitted mass from a particle bed exposed to turbulent flow.
The influence of the non-erodible particles was modelled analysing the partition of shear stress between the roughness
elements and adjacent erodible surface, previously obtained by numerical simulations. The increase of roughness
characterizes the pavement phenomenon. Comparisons with experimental data have shown a good agreement. The results
clearly show the protective effect of non-erodible elements on the entrainment of finer particles in the flow. The program
demands little computational resources and could be a useful contribution for practical situations found in industrial sites.
Acknowledgement
FAPES, CNPq and CAPES/COFECUB financially supported this work.
References
Descamps, I. 2004. Érosion éolienne d’un lit de particules à large spectre granulométrique. PhD Thesis. Université de
Valenciennes et du Hainaut Cambrésis. Douai, France.
Foucaut, J.M., Stanislas, M. 1996. Take-off threshold friction velocity of solid particles lying under a turbulent boundary
layer, Experiments in Fluids. 20, 377-382.
Turpin C., Badr T., Harion, J.-L. 2010. Numerical modelling of Aeolian erosion over rough surfaces. Earth Surface Processes
and Landforms. 35, 1418-1429.
Fig. 1 Algorithm of the program

223
Figure 2. Calculated NO2
concentration fields for Bergen
Figure 1. Scatter plots of
calculated and observed NO2
concentrations
IMPROVED REGRESSION METHODS FOR MAPPING TRAFFIC RELATED AIR QUALITY
B.R. Denby
Norwegian Meteorological Institute. PO BOX 43 Blindern, 0313 OSLO, Norway
Presenting author email: [email protected]
Summary
Maps of air quality are regularly used for health studies to determine long term home address concentrations. With pollutants
such as NO2, that are often dominated by traffic emissions, such maps must be provided at high resolution in order to capture
near road gradients. The heath community tends to favour the use of measurement data and spatial interpolation using land
use regression for producing such maps. The air quality modelling community, on the other hand, would prefer the use of
high resolution air quality modelling. In this paper a regression methodology using passive sampler measurements and a
predictor variable based on aggregated inverse distance from traffic sources, mimicking the dispersion process, is used to
produce high resolution spatial maps of annual mean NO2 concentrations in the city of Bergen, Norway. Concentration,
uncertainty and probability of exceedance maps are produced and home address exposures are calculated.
Introduction
Health and exposure studies investigating long term exposure to air pollution often use
estimates of concentrations at home addresses. Whilst air quality modelling can provide
such spatial information the health community tends to favour the use of land use
regression (LUR), fitting measured concentrations to a range of predictor variables
based on geographically distributed data. Such methods have been shown in many
cases to ‘over fit’ the observational data resulting in unrealistic and noisy maps,
particularly when a large number of predictor variables are ‘offered’ to the model
(Denby, 2014). If regression methods are to be used then the data needs to be
represented by far fewer predictors and these predictors should be physically based so
that the resulting maps provide realistic fields. Whilst air quality models offer this
information, they are not always available and may require substantial efforts for their
implementation. In this paper we apply a regression method that is more physically
based, when traffic emissions dominate, and requires far fewer fitting parameters than
are usually made available for LUR models.
Methodology and results
The method uses the Annual Daily Traffic (ADT) multiplied by the road link
lengths (ADT.L) as proxy for traffic emissions. This emission proxy is aggregated
in 25 x 25 m2 grids and is then distributed in space using a physically based pseudo
dispersion function (inverse distance to the power of -1.5). The validity of this
function was derived previously from high resolution air quality modelling (Denby,
2014). At each grid the contribution at all the other grids is summed using the
pseudo dispersion algorithm to obtain the total contribution. The influence of
terrain, based on change of height from source, is included in the algorithm.
Contributions from shipping emissions are also included and these are calculated in
a similar way based on 100 x 100 m2 shipping emissions obtained from AIS data.
Multiple linear regression of the model with observed annual mean concentrations
of NO2, obtained from 34 passive samplers distributed in the city, is then applied to
these two sources to obtain regression parameters. The resultant regression (Figure
1) is based on only two proxy data fields and has an R2 of 0.74. Ensemble methods
are used to determine the uncertainty of the regression parameters and of the
resulting concentrations fields. Maps are visualised as concentration fields (Figure
2), concentration uncertainty fields and probability of exceedance fields. Home
address exposure, and its uncertainty, is also calculated (Denby, 2015).
Conclusions
The study shows that even simple, but more physically based, traffic proxy data can
be effectively used for regression model mapping applications, removing the need
for non-physical multiple traffic predictors often used in land use regression. Even
so, the use of air quality models, combined with monitoring data, should provide
the best mapping results.
References
Denby B.R. (2015) Mapping of NO2 concentrations in Bergen (2012-2014). METreport No. 12/15.
http://www.met.no/Forskning/Publikasjoner/MET_report/
Denby B.R. (2014) Transphorm Deliverable D2.2.4. Spatially distributed source contributions for health studies: comparison
of dispersion and land use regression models.
http://www.transphorm.eu/Portals/51/Documents/Deliverables/New%20Deliverables/D2.2.4_v6.pdf

224
DEVELOPMENT OF AIR QUALITY FORECASTING SYSTEM IN THE EASTERN MEDITERRANEAN USING
THE WRF-CHEM MODEL
G. K. Georgiou (1), T. Christoudias (2), Y. Proestos (2), M. Vrekoussis (1,3), M. Pikridas (1), P. Hadjinicolaou (1), H.
Fischer (4), S. Kleanthous (5), J. Lelieveld (1,4)
(1) Energy, Environment and Water Research Centre (EEWRC), The Cyprus Institute, Nicosia, 2121, Cyprus; (2)
Computation-based Science and Technology Reasearch Centre (CaSToRC), The Cyprus Institute, Nicosia, 2121, Cyprus; (3)
Institute of Environmental Physics, University of Bremen, Germany; (4) Air Chemistry Department, Max Planck Institute for
Chemistry, Mainz, 55128, Germany; (5) Air Quality Sector, Department of Labour Inspection (DLI), Cyprus.
Presenting author email: [email protected]
Summary A regional air quality forecasting system is being established for Cyprus and the Eastern Mediterranean with a focus on
Cyprus. To that end, the WRF-Chem atmospheric chemistry model is configured to forecast the hourly atmospheric
concentrations of ozone (O3), Nitrogen Oxides (NOx), Carbon Monoxide (CO), Sulphate (SO42-) and particulate mater (PM10
& PM2.5). The model performance was evaluated by comparing model calculations to measurements from the CYPHEX
campaign, performed during Summer 2014. Initial results indicate that the calculated day-to-day and diurnal variations of the
aforementioned species show good agreement with observations.
Introduction The island of Cyprus is located in the north-eastern part of the Mediterranean Sea which is affected by dust transport
primarily from the Sahara and the Middle Eastern deserts (Pey et al., 2013). In addition, north and north-westerly winds
result in transport of air masses rich in ozone and/or its precursors from Middle East and Central/Eastern Europe towards
Cyprus (Kleanthous et al., 2014). For the purposes of this study we have employed the Weather Research and Forecasting
(WRF) model coupled online with chemistry (WRF-Chem).
Methodology and Results Atmospheric chemistry observational data from the CYPHEX campaign near Inia
village in Paphos, Cyprus (July 07-31, 2014) were used to test the model. The model
was set up with three nested grids (of 45km, 15km, and 5km resolutions respectively;
Fig.1). The meteorological boundary conditions were updated every three hours
throughout the simulation using the Global Forecast System (GFS), while chemical
boundary conditions were updated every 6 hours using the MOZART global
chemical transport model. The gas-phase chemistry and aerosol modules used in this
configuration are the Regional Acid Deposition Model, version 2 (RADM2) and the
Modal Aerosol Dynamics Model for Europe – Secondary Organic Aerosol Model
(MADE – SORGAM). No anthropogenic or biogenic emissions were included in the
simulation yet, but will be considered at a later stage. First results suggest that the
WRF-Chem model captures the daily and diurnal evolution of ozone relative
concentrations (Fig.2) with similar
results for the other modelled trace
gases.
Conclusions Preliminary results show good
agreement of the WRF-Chem air
quality model with observations
for the region of Cyprus. Some
discrepancies between the model
outcome and measurements can be
attributed to the local emissions
(biogenic & anthropogenic), not
currently included in the
simulation. Various combinations
of chemistry and aerosol modules
are still to be tested and local
emission inventories will be
included in future simulations.
References Kleanthous S., Vrekoussis M., Mihalopoulos N., Kalabokas P., Lelieveld J., 2014. On the temporal and spatial variation of
ozone in Cyprus. Science of the Total Environment 476-477, 677–687.
Pey J., Querol X., Alastuey A., Forastiere F., Stafoggia M., 2013. African dust outbreaks over the Mediterranean Basin
during 2001-2011: PM10 concentrations, phenomenology and trends, and its relation with synoptic and mesoscale
meteorology. Atmospheric Chemistry and Physics 13(3), 1395-1410.
Fig.1 Model domains
Fig.2 Observed (blue line) and simulated (red line) O3 relative concentrations

225
DEVELOPMENT OF ANFIS MODEL WITH OPTIMISED INPUTS TO REDUCE THE COMPUTATIONAL
COST AND TIME FOR GROUND LEVEL OZONE FORECASTING
Amit Kumar Gorai
Department of Mining Engineering, National Institute of Technology, Rourkela, Odisha 769008, India
Presenting author: Email: [email protected]
Summary
This study aims to develop adaptive neuro-fuzzy inference system (ANFIS) for forecasting of daily ozone (O3)
concentrations in the atmosphere of a mega city. The ANFIS model predictor considers the value of seven meteorological
factors (pressure, temperature, relative humidity, dew point, visibility, wind speed, and precipitation), NO2 concentration, and
previous day’s ozone concentration in different combinations as the inputs to predict the 1-day advance and same day ozone
concentration. Collinearity tests were conducted to eliminate the redundant input variables. A forward selection (FS) method
is used for selecting the different subsets of input variables. The method reduces the computational cost and time. The
performances of the models were evaluated on the basis of four statistical indices [(coefficient of determination (R2),
normalized mean square error (NMSE), index of agreement (IOA), and fractional bias (FB)].
Introduction
Environmental data are typically very complex to model due to the underlying correlation among several variables of
different type which yields an intricate mesh of relationships (Marino et al, 2001). Standard statistical techniques may fail to
adequately model complex non-linear phenomena (Moussiopoulos et al., 1995). In contrast, expert knowledge is becoming
widely used because they showed ability to model non-linear data and their non-reliance on previously assumed equations
(Marino et al., 2001).
Methodology and Results
A flowchart of ANFIS model development is presented is Fig. 1. The multi-collinearity test result shown in Table 1 clearly
indicates that the VIF values exceeded the recommended value (10) for both the temperature and humidity before removing
one of the variables. Also, the tolerance level of temperature and humidity are below the recommended limit (0.2) in each case.
After removing of redundant variables, the VIF values and tolerance level are well within the recommended limit for each
variable. Applying FS algorithm, all the explanatory variables (input variables) are ordered according to their correlation with
the dependent variable (from the most to the least correlated variable). The statistical indices shown in Table 2 indicate that
there is no significant influence of the number of input variables on different statistical indices (IOA, FB, NMSE, and R2).
There was a very slight change observed in the output in different input conditions in both the cases (same day and 1-day
advance forecasting). Thus, the best model can be selected on the basis of training error and testing error levels. M4 showed the
transition or stable input conditions where the error level is stable and thus suitable for forecasting the ozone concentration.
Fig. 1: Flowchart of ANFIS model development
Table 1: Collinearity Statistics
Before Removal of variables After removal of variables
Variables Signif. VIF Variables Signif. VIF
P- O3 0.847 1.180 P-O3 0.861 1.161
NO2 0.363 2.753 NO2 0.365 2.740
PRESS 0.404 2.472 PRESS 0.415 2.411
RH 0.015 65.55 RH 0.486 2.058
TEMP 0.005 197.35 TEMP 0.329 3.036
DP 0.003 299.23 VISI 0.717 1.395
VISI 0.711 1.407 WS 0.856 1.169
WS 0.853 1.173 PRECI 0.809 1.237
PRECI 0.764 1.309
Note: Variables Information
PRESS- Pressure, TEMP- Temperature, RH-Relative Humidity, DP-
Dew point, VISI-Visibility, WS-Wind speed, PRECI-Precipitation,
P-O3- Previous day Ozone.
Table 2: ANFIS model results
Conclusions
Neuro-fuzzy logic is a stochastic approach which is used in
the present study for forecasting of ozone concentrations. It
was seen that the statistical performance was good for all the
models, indicating that a lesser number of input variables
can be considered in order to forecast the model. The IOA
ranges from 91% to 95% indicating a good model, and
closer to ideal value. The present study helps in finding out
the input combination which would lower the computational
cost.
References Marino, D.; Morabito, F.C. (1999) A fuzzy neural network for
urban environment monitoring system: the Villa San Giovanni study
case, neural nets. Procd. of the WIRN workshop 323-328. Moussiopoulos, N.; Sahm, P.; Kessler, C.; Kunz, R. (1995)
Numerical Simulation of Photochemical Smog Formation in
Athens—A Case Study. Atmospheric Environment 29(24): 3619-3632.
Model R2 NMSE FB IOA R2 NMSE FB IOA
Same day forecasting 1-day advance forecasting
M1 0.80 0.02 0.014 0.95 0.68 0.08 0.012 0.91
M2 0.80 0.01 0.013 0.95 0.68 0.09 0.011 0.92
M3 0.81 0.01 0.014 0.95 0.68 0.07 0.010 0.91
M4 0.79 0.05 0.020 0.95 0.72 0.07 0.015 0.92
M5 0.82 0.05 0.017 0.95 0.73 0.07 0.019 0.92
M6 0.82 0.05 0.017 0.95 0.72 0.08 0.017 0.92
M7 0.82 0.05 0.016 0.95 0.72 0.08 0.014 0.92
M8 0.82 0.05 0.006 0.95 0.72 0.08 0.007 0.92
Note: Input combination of models
M1: P-O3, WS, Visi, RH, Temp, Preci, Press, NO2; M2: P-O3, WS, Visi,
RH, Temp, Preci, Press; M3: P-O3, WS, Visi, RH, Temp, Preci; M4: P-O3,
WS, Visi, RH, Temp; M5: P-O3, WS, Visi, RH; M6: P-O3,WS,Visi; M7: P-
O3,WS; M8: P-O3
Po
st
Per
form
ance
E
val
uat
ion
A
nal
yse
s
of
dat
a
Dat
a P
re-
pro
cess
ing
Mod
el
Run
Selection of Input and Output Variables
Collection of observed data
Normalisation of data
Assigning membership function and
number for each variable
Classify the data into training and testing
data sets
Model training and testing
Performance test of the model

226
HIGH-RESOLUTION MODELING OF URBAN AIR QUALITY IN THE BERLIN-BRANDENBURG REGION
WITH WRF-CHEM: A MODEL EVALUATION
F. Kuik (1), G. Churkina (1), A. Lauer (2), K. Mar (1), T. Butler (1)
(1) Institute for Advanced Sustainability Studies, Berliner Straße 130, 14467 Potsdam, Germany; (2) Deutsches Zentrum für
Luft- und Raumfahrt (DLR), Institut für Physik der Atmosphäre, Oberpfaffenhofen, Germany
Presenting author email: [email protected]
Summary
The WRF-Chem model was set up with high horizontal resolution (1kmx1km) and evaluated against observations for the
Berlin-Brandenburg area. First results show a reasonably good performance for the meteorology, and a reasonable skill in
reproducing observed chemistry and aerosols. This study focuses on urban areas, for which the model performs similarly well
as for non-urban areas. Still, it was more challenging to simulate the heat wave in 2006 for the urban stations. Sensitivity
studies include a new set of parameters for the urban scheme optimized for European cities as well as the implementation of
new high-resolution anthropogenic emissions. The model setup is then applied for air quality studies in Berlin and
Brandenburg.
Introduction
Air pollution is the number one environmental cause of premature deaths in Europe. Despite extensive regulations, air
pollution remains a challenging issue, especially in urban areas. With the aim of studying air quality in the Berlin-
Brandenburg region of Germany, the Weather Research and Forecasting Model with Chemistry (WRF-Chem, Skamarock et
al., 2008; Grell et al., 2005; Fast et al., 2006) is set up and optimized for this application. This study presents its evaluation
against meteorological and air quality observations from monitoring stations as well as from a field campaign (“BAERLIN”)
conducted in and around Berlin in summer 2014, which includes for example measurements of black carbon, VOCs, particle
size distribution, particle mass, NOx and O3. This evaluation provides a basis for future studies such as how heat waves affect
emissions of biogenic volatile organic compounds from urban vegetation and the impact of selected traffic measures, such as
replacing a share of car trips with bicycle trips, on air quality in the Berlin-Brandenburg area.
Methodology and Results
The model setup includes three nested domains with horizontal resolutions of 15km, 3km, and 1km, online biogenic
emissions (MEGAN 2.0), and anthropogenic emissions from the TNO-MACC_III inventory (Kuenen et al., 2014). The
MADE/SORGAM aerosol scheme and RADM2 chemistry are used. Urban areas are represented with the 3-category urban
canopy model. Simulations are done for the summers of 2006 and 2014. Preliminary results show that the model reproduces
the observed meteorology in the region reasonably well in both periods. An exception is the heat wave period in 2006, during
which the air temperature simulated at 3km and 1km resolutions is underestimated by 2°C at urban stations. WRF-Chem
simulates the mean concentrations of O3 in good agreement with observations. However, the 8-hr maxima are
underestimated, and the minima are overestimated. Mean NOx concentrations are modeled reasonably well at stations located
in green areas of the city, but underestimated compared to observations at urban background stations. This can partly be
explained with the coarser resolution of the emission input data compared to the model resolution. PM10 concentrations are
underestimated by the model by around 50%. Typically, simulated O3, NOx, and PM10 from the 1-km domain do not show a
significant improvement compared with the 3-km domain.
Conclusions
The performance of the WRF-Chem setup for Berlin and Brandenburg is similar to that from previously published WRF-
Chem studies for the European domain and has clearly some room for improvement. As an example, the default input
parameters for the urban scheme developed for application in the U.S. will be adapted for Berlin. In order to assess whether a
horizontal resolution of 1km is superior to a setup with 3km for air quality studies with this model we will include an updated
high-resolution emission inventory for Berlin and compare the performance of the different horizontal resolutions. The model
will then be applied to several studies on different aspects of air pollution in the Berlin-Brandenburg region.
Acknowledgement
We acknowledge TNO for the provision and advice on the use of the TNO-MACC emission inventory version 3. We thank
all participants of the BAERLIN measurement campaign for making the data available for the model evaluation.
References
Fast, J. D., Gustafson, W. I., Easter, R. C., Zaveri, R. A., Barnard, J. C., Chapman, E. G., Grell, G. A., and Peckham, S. E.:
Evolution of ozone, particulates, and aerosol direct radiative forcing in the vicinity of Houston using a fully coupled
meteorology-chemistry-aerosol model, J. Geophys. Res., 111, D21305, 10.1029/2005jd006721, 2006.
Grell, G. A., Peckham, S. E., Schmitz, R., McKeen, S. A., Frost, G., Skamarock, W. C., and Eder, B.: Fully coupled “online”
chemistry within the WRF model, Atmos. Environ., 39, 6957-6975, 10.1016/j.atmosenv.2005.04.027, 2005.
Kuenen, J. J. P., Visschedijk, A. J. H., Jozwicka, M., and Denier van der Gon, H. A. C.: TNO-MACC_II emission inventory;
a multi-year (2003–2009) consistent high-resolution European emission inventory for air quality modelling, Atmos. Chem.
Phys., 14, 10963-10976, doi:10.5194/acp-14-10963-2014, 2014.
Skamarock, W. C., Klemp, J. B., Dudhia, J., Gill, D. O., Barker, D. M., Duda, M. G., Huang, X.-Y., Wang, W., and Powers,
J. G.: A description of the Advanced Research WRF version 3, Mesoscale and Microscale Meteorology Division, National
Center for Atmospheric Research, Boulder, Colorado, USA, 2008.

227
EVALUATION OF THE DISPERSION OF ODOUR IN ITALY: MODELLING STUDIES COMPLYING WITH
THE NATIONAL REFERENCE GUIDELINE
A. Mantovani (1), M. Benzo (1)
(1) Osmotech Srl, Via Fratelli Cuzio, 42 – 27100 Pavia (Italy)
Presenting author email: [email protected]
Summary
This work aims to introduce odour dispersion modelling in Italy. The main legal reference in Italy so far, the "Guideline of
the Lombardy Region" standardized the procedure for modelling olfactive impact, enhancing the use of models as an
evaluation tool. Non-stationary Gaussian puff models (eg. Calpuff) are now widely used, as they give good results in most
cases: they can represent non-stationary conditions, such as variable emissions and variable meteorological conditions (calm
wind, wind gust, atmospheric turbulence), and they can represent the effect of orography. But Gaussian models have some
limitations: their dispersion algorithms can’t simulate the dispersion of odour in areas dense with obstacles. However,
Gaussian models are often improperly applied in urban areas or in very complex orography (eg. narrow valleys), thus
calculating unrealistic results or not useful results. For this reason, we decided to test a Lagrangian model: we evaluated the
olfactive impact in a complex area, with the atmospheric dispersion model MicroSpray (of Arianet Ltd.). The model gave
realistic results, even around obstacles. The evaluation was carried out in compliance with the mentioned "Guideline".
Introduction
The Guideline of the Lombardy Region concerns the evaluation of olfactive impact and the characterization of odour
emission (sampling of sources, odour measurement in ouE/m3 with olfactometry, calculation of odour emission rate in ouE/s).
The Annex 1 of the Guideline defines all requirements of the modelling studies for evaluation of the olfactive impact: every
detail is defined, such as which emissions have to be simulated, and which models should be used.
The olfactive impact both depends on the odour concentration at ground level and on the frequency of annoying events (when
concentration of odour exceed the tolerance threshold). Moreover, the odour concentration at ground changes quickly,
because it is driven by short-scale weather phenomena (calm winds wind gust, atmospheric turbulence) and by odour
emission rate, which typically is not steady. Thus, the olfactive impact is not represented by annual mean concentration: it
must be assessed in terms of the annual 98th percentile of hourly peak concentration of odour (ref. Guideline of the
Lombardy Region). The hourly peak concentration includes the fluctuations of hourly mean concentration due to
meteorological conditions. In the maps of 98th percentile calculated by the model, the contour lines of three "annoying
levels" 1 ouE/m3, 3 ouE/m3, 5 ouE/m3 include areas exposed to different olfactive impact (concentration > 5 ouE/m3 can be
perceived by 95% of people).
Methodology and Results
The Guidelines require to apply Gaussian models or Lagrangian models or
Eulerian models. Gaussian models allow to calculate the annual 98th
percentile, but can't simulate the buildings effects and urban canopy in a
realistic way. Thus, we decided to test the Lagrangian model MicroSpray: this
model is designed to simulate the effect of obstacles with a good accuracy, but
the increased complexity of calculation of MicroSpray penalizes the runtime,
the elaboration of annual statistics (98th percentile) requires hours of
computational time. To solve this issue, because the frequency of annoying
events is the criteria for assessing the olfactive impact, we applied the model
MicroSpray to calculate the olfactive impact in relation to most frequent
weather conditions: we defined the worst meteorological conditions (calm
wind, neutral atmosphere, wind blowing toward receptors) and we ran
some short scenarios (1 hour-long).
Conclusions
The model MicroSpray (of Arianet Ltd.) turned out as an
excellent tool, for its sensitivity and flexibility: it can
calculate the odour concentration at many heights from the
ground, allowing to assess the impact at the houses at various
floors, and representing the effect of mountain slopes and the
effect of barriers (trees, buildings,...). Plus, the model can
simulate many hourly meteorological conditions and
emission scenarios within a short runtime.
References
Guideline of Lombardy Region: act DGR no.3018, 15 February 2012. "Guideline for the characterization and the
authorization of gas emissions into the atmosphere from odorous activities ". (Italy)
Scire J.S., Strimaitis, D.G., Yamartino, R.J., 2000. “A User’s Guide for the CALPUFF Dispersion Model”. Exponent (USA).
Moussafir J., Oldrini O., Tinarelli G, Sontowski J, Dougherty C. (2004): “A new operational approach to deal with
dispersion around obstacles : the MSS (Micro-Swift-Spray) software suite”, 9th International Conference HARMO 2004.
Fig.2 Map of the hourly peak concentration of odour,
calculated with the model MicroSpray in the domain of fig.1
Fig.1 Domain of application of the model
MicroSpray: complex orography, urban area

228
MODELLING OF ARSENIC AEROSOL IN SOUTH-WEST SPAIN
C. Milford (1,2), C. Marrero (2), A. Sánchez de la Campa (1), R. Fernández-Camacho (1), J.J. Bustos(2), S. Rodríguez (2),
N. Castell (3), J. De la Rosa (1) and A.F. Stein (4)
(1) Associate Unit CSIC-University of Huelva ‘‘Atmospheric Pollution’’, CIQSO, University of Huelva, Huelva, Spain;
(2) Izaña Atmospheric Research Center, AEMET, Tenerife, Spain; (3) Norwegian Institute for Air Research (NILU), Kjeller,
Norway; (4) Air Resources Laboratory, NOAA, MD, USA.
Presenting author email: [email protected]
Summary
Concentrations of arsenic (As) in PM10 have been measured and simulated for an urban site in south-west Spain. The daily
variation at this site was captured reasonably well, although in general the model underestimated the concentrations. As
arsenic anthropogenic emissions continue to be reduced in Europe, the parallel measurement and modelling of Arsenic in
particulate matter constitutes a useful tool to monitor these emission changes and the consequent improvement in ambient air
concentrations.
Introduction
Arsenic is known to have adverse effects on human health and in January 2013 a mean annual target level of 6 ng m-3 of As
in PM10 was introduced by the European Directive (2004/107/CE). Anthropogenic emissions constitute the largest source of
As and Cu-smeltering is one of the largest anthropogenic contributions. The second largest Cu-smelter in Europe is located in
Huelva (south-west Spain) and consequently a measurement and modelling program was initiated to characterise the
behaviour of this species.
Methodology and Results
Concentrations of arsenic in PM10 were measured at an urban site (University Campus) in the city of Huelva at a distance of
about 5 km northeast of the Cu-smelter. Daily measurements of PM10 were conducted with a high volume sampler (68 m3 h-1)
on Munktell quartz filters which were subsequently analysed for As content in the laboratory by Inductively Coupled Plasma-
Optical Emission Spectrometry (see Sánchez de la Campa et al., 2011). The daily measurements were conducted for intensive
periods of 14 days at a time, followed by periods without measurement; this resulted in 196 measurement days. Arsenic in
PM10 concentrations were simulated using the Hybrid Single Particle Lagrangian Integrated Trajectory (HYSPLIT) model
(Stein et al., 2015) driven by the MM5 meteorological model with three nested domains of 18, 6 and 2 km horizontal
resolution. Emissions of As were provided for five stacks at the Cu smelter. Results of the measured and simulated PM10 As
concentrations for 2014 are shown in Fig. 1. This demonstrates that the modelling system was capable of capturing the daily
temporal variation reasonably well, although in general the model underestimated the concentrations. The mean and
maximum observed PM10 As concentrations were 2.6 ng m-3 and 23.0 ng m-3, while the mean and maximum modelled PM10
As concentrations were 0.8 ng m-3 and 11.1 ng m-3, resulting in a mean bias of -1.8 ng m-3.
Conclusions
Concentrations of As in PM10 were measured and simulated for an urban site in south-west Spain for 2014. The parallel
measurement and modelling of Arsenic in particulate matter constitutes a useful tool to monitor emission changes and the
consequent improvement in ambient air concentrations.
Acknowledgement
The authors gratefully acknowledge funding from the Department of Environment, Andalusian Regional Government
(project: 168/2011/C/00).
References
Sánchez de la Campa, A.M., de la Rosa, J., González-Castanedo, Y., Fernández-Camacho, R., Alastuey, A., Querol, X.,
Stein, A.F., Ramos, J.L., Rodríguez, S., García Orellana, I., Nava, S, 2011. Levels and chemical composition of PM in a city
near a large Cu-smelter in Spain. Journal of Environmental Monitoring 13, 1276–87.
Stein, A.F., Draxler, R.R., Rolph, G.D., Stunder, B.J.B., Cohen, M.D., Ngan, F., 2015. NOAA's HYSPLIT atmospheric
transport and dispersion modeling system. Bulletin of the American Meteorological Society.
02468
1012141618202224
01/01/14 31/01/14 02/03/14 01/04/14 01/05/14 31/05/14 30/06/14 30/07/14 29/08/14 28/09/14 28/10/14 27/11/14 27/12/14
As P
M10 c
onc (
ng m
-3)
Observation
Simulation
Fig.1 Observed and simulated PM10 As concentrations at University Campus, Huelva, 2014.

229
RELATIONSHIP BETWEEN MODELLED POLLUTION OF NITROGEN DIOXIDE AND TRAFFIC FLOW
A. Miškinytė (1), A. Dėdelė (1), G. Šidlauskaitė (1)
(1) Department of Environmental Sciences, Vytautas Magnus University, Vileikos Street 8, 44404 Kaunas, Lithuania
Presenting author email: [email protected]
Summary
The aim of this research was to assess the relationship between modelled concentration of nitrogen dioxide (NO2) in streets
with different traffic intensity and composition and to estimate the air pollution of NO2. ADMS-Urban dispersion model was
used to estimate a level of nitrogen dioxide in streets of Kėdainiai city. Strong positive correlation was observed between the
traffic flow and the concentration of NO2. The linear relationship between the heavy traffic flow and NO2 level was stronger
than between the light traffic flow and NO2. The median concentration of NO2 in streets with high, medium and low traffic
intensity was 14.27µg/m3, 10.34µg/m3 and 7.9 µg/m3, respectively. This study has shown that the level of nitrogen dioxide is
directly related with traffic flow, especially high traffic flow.
Introduction
The largest sources of air pollution in the cities are motor vehicle and industry (Levy et al., 2014). Road transport is one of
the biggest emitter of NO2. Increased concentration of NO2 irritates breathing system, reduces lungs immunity to infections,
can cause adverse health effects (Latza et al., 2009). In many Lithuanian cities the pollution of nitrogen dioxide is increasing
every year due to the increasing number of vehicles that are older than 10 years and their emissions have significant impacts
on local air quality. One method, which is widely used for estimating air pollution in the urban areas, is mathematical
modelling. Atmospheric dispersion modelling enables the assessment of air pollution dispersion in areas where air quality
measurements are not carried out.
Methodology and Results
The dispersion of NO2 was determined by ADMS-Urban modelling software,
which was developed by CERC (CERC, 2014).
Model requires the following input parameters: roads, stationary and grid
sources, meteorological and background concentrations data. We created
street network map, collected the data of traffic flow and composition in the
main streets, stationary sources and their characteristics that have been entered
to the model. For the analysis of the modelling results we grouped traffic
flows into three categories: < 4000, 4000-6000 and > 6000 vehicles per day.
ArcGIS software was used to enter air pollution data, for their visualization
and to crate air pollution of NO2 map. The average annual concentration of
NO2 was modelled using ADMS-Urban model in Kėdainiai city (see Fig.1).
The results of this study showed that the highest concentration of NO2 was
assessed in the central part of the city, near the main streets and intersections
where the traffic flow is intensive. The average annual NO2 concentration in
the main city streets varied between 15.8–19.8 µg/m3. The median
concentration of NO2 in streets with high, medium and low traffic intensity
was 14.27 µg/m3, 10.34 µg/m3 and 7.9 µg/m3, respectively (see Fig. 2). The
relationship between the concentration of nitrogen dioxide and traffic flows
was assessed. Strong positive correlation was observed between the level of
NO2 and total traffic flow (r = 0.77; p < 0.01). The highest correlation
coefficient was calculated between NO2 and high traffic flow (r = 0.84; p <
0.01).
This study has shown that the level of nitrogen dioxide is directly related with
traffic flow, especially high traffic flow.
Conclusions
The traffic growth rates in the main streets contribute significantly to the total
nitrogen dioxide pollution in the city. Motor vehicle exhaust emissions of
NO2 pose a threat to the environment and public health. Finding effective
ways to reduce air pollution arising from the use of vehicles therefore remains
important.
References
CERC, 2014. ADMS-Urban User Guide. Version 3.4. Cambridge, UK, p. 353
Levy I., Mihele C., Lu G., Narayan J., Brook J., 2014. Evaluating Multipollutant Exposure and Urba Air Quality: Pollutant
Interrelationships, Neighborhood Variability, and Nitrogen Dioxide as a Proxy Pollutant. Environmental Health Perspectives
122, 65-72.
Latza U., Gerdes S., Baur X., 2009. Effects of nitrogen dioxide on human health: Systematic review of experimental and
epidemiological studies conducted between 2002 and 2006. International Journal of Hygiene and Environmental Health 212,
271–287.
Fig.1 The average annual modelled
concentration of nitrogen dioxide (µg/m3) in
Kėdainiai city
Fig.2 The median concentration of NO2 (µg/m3)
in streets with different traffic flow

230
USE OF COMPLEMENTARY METRICS TO IMPROVE DATA ASSIMILATION PERFORMANCES
A.Nanni, C. Silibello, C. Pozzi, G. Calori
ARIANET srl, Milano, Via Gilino 9, Italy
Presenting author email: [email protected]
Summary
This study goes through an innovative methodology for combining information from air quality models and monitoring
networks. The Successive Correction Method (SCM) has been modified by introducing, in addition to the distance-based
metric, the geometric distribution of proxy variables (such as land use, built-up, emissions, etc.). The results obtained
considering these complementary metrics have been compared with those provided by the original SCM implementation
confirming the possible benefits coming from the adoption of this approach.
Introduction
A key requirement of the Directive 2008/50/CE on ambient air quality and cleaner air for Europe is the harmonization of
data, coming from air quality (AQ) models and monitoring networks, to have a coherent picture of AQ status over a given
area. Usually, the integration of AQ measurements and modelling fields is performed by means of data assimilation/fusion
techniques (SCM, Optimal Interpolation –OI-, …) that consider the error variances of measurements and predictions and the
location of monitoring sites and grid points. In their original formulations these techniques, derived from the meteorological
field, do not take into account other information (as inhomogeneities in territory use or pollution sources location) which
strongly affect the spatial distribution of pollutants. An example is given by so-called Land Use Regression (LUR)
techniques, often used by air pollution epidemiologists to enhance spatial details of available satellite Aerosol Optical Depth
(AOD) observations. In this perspective, the potential of different complementary metrics in improving the performance of
data fusion techniques has been explored. Yearly average concentration fields provided by an AQ model, over a portion of
Tuscany (Central Italy), have been combined with the observations coming from 44 monitoring stations and complementary
territorial and emission information.
Methodology and Results
SCM is based on the Bratseth technique (Bratseth, 1986) and is still useful because of
its low computational demands and its convergences to OI method due to the
inclusion of background and observation error statistics. SCM is initialized by a
background field (first guess modelled field) which is then iteratively modified by the
analysis of local data on the model grid. This method has been revised by including a
further metric, representing above mentioned inhomogenities, in terms of an
additional 2D theme. The themes considered were densities of built-up areas, road
network and population and pollutants emissions distribution on the target grid. The
results obtained by the application of the original and modified version of SCM have
been compared with raw model results. Figure 1 show an example of the results
obtained by the application of this version of SCM considering built up areas used as
a complementary metric. Several tests have been performed and NO2 and PM10
results have been evaluated considering six cross-validation sets of stations,
randomly selected, including 20%, 50% and 80% of the original dataset. Normalised
Mean Square Error (NMSE) and Fractional Bias (FB) have been considered as
performance evaluation indicators. This procedure evidenced that the use of the
considered complementary metrics improves the results provided by the original
SCM implementation. Small differences among the tested metrics have been found
depending on the selected pollutant and the considered air quality standard. The tests
also confirmed the strong influence played by the de-correlation horizontal length
scale, used in the error spatial correlation functions, and provided indications about
the better values to be used for this parameter.
Conclusions
Adopting complementary metrics, associated with factors influencing AQ may lead
to significant improvements in the geographical mapping of the pollutants and in the
estimation of the health risk. The application of data assimilation/fusion techniques
may also provide many other positive outcomes, like for example insights about the
optimal location of monitoring stations.
References
Bratseth AM (1986). Statistical interpolation by means of successive corrections.
Tellus, 38A,439-447.
Nordio F. et al. (2013). Estimating spatio-temporal resolved PM10 aerosol mass
concentrations using MODIS satellite data and land use regression over Lombardy, Italy. Atmospheric Environment 74
(2013) 227-236.
Zanini G. et al. (2010). Modeling air quality over Italy with MINNI atmospheric modeling system: from regional to local
scale. Proc. of 31st NATO/SPS International Technical Meeting on Air Pollution Modelling and its Application, Torino,
Italy, 27 Sept - 1 Oct, 2010.
Fig.1 NO2 annual average
concentration field provided by the AQ model (upper) and the modified version
of SCM (central) using built up areas
used as complementary metric (lower). Circles: monitoring stations.

231
A HYBRID MODELING SYSTEM FOR THE EVALUATION OF URBAN CONCENTRATIONS: CASE STUDY
FOR MILAN AREA
N. Pepe (1,2), G. Pirovano (1), A. Balzarini (1), A. Toppetti (1), G. M. Riva (1), G. Lonati (2) and M. Bedogni (3)
(1) RSE S.p.A, via Rubattino 54, 20134, Milano, Italy; (2) Department of Civil and Environmental Engineering, Politecnico
di Milano, Piazza Leonardo da Vinci 32, 20133, Milano, Italy; (3) AMAT s.r.l., via G. Deledda 9/A, 20127, Milano, Italy
Presenting author email: [email protected]
Summary
This study aims at reconstructing the spatial variability of concentration levels of pollutants within Milan urban area by
means of an integrated urban air quality hybrid modelling system (HMS) that integrates a Chemical and Transport Model
(CTM) and a Local Scale Model (LSM). The Comprehensive Air Quality Models (CAMx) (ENVIRON, 2011) was the
eulerian CTM model applied to consider chemical reactions and physical phenomena at basin scale; AUSTAL2000 (Janicke
Consulting, 2002) was the lagrangian LSM model applied to compute dispersion of pollutants at the urban local scale. The
HMS provided a detailed spatial reconstruction of pollutant concentrations that can be used to properly assess exposition
levels within the urban area
Introduction
CTMs are generally not able to reproduce the spatial gradient of pollutants within urban areas; conversely LSMs enable to
account for the features of the urban environment affecting pollutant transport and for the actual distributions of the emission
sources (e.g.: high emission roads). Coupling a CTM model with a LSM model in a HMS exploits their strength allowing a
more accurate reconstruction of the concentration pattern that points out the areas more exposed to pollution.
Methodology and Results
CAMx was applied to 3 nested domains downscaling from Italy to Milan
urban area. The last domain covered 85x85 km2 with a grid step size of 1.7
km. PSAT (Yarwood, 2008), a source apportionment algorithm implemented
into CAMx, was able to distinguish background contribution from local
sources contribution; however, this latter was specifically accounted by
means of the AUSTAL2000, which can handle different types of emission
sources (point, area, linear or volumetric) and the effect of the built
environment, thus being able to properly describe the complex urban pattern.
As an example, Figure 1 shows the NOx January mean, that describes the
spatial variability computed by AUSTAL2000. HMS output was then
composed by the sum of background concentration, computed by CAMx, and
of local contribution, computed by AUSTAL2000. Both models were driven
by the same meteorological input, outcomes of the WRF
meteorological model. HMS model was applied over a
portion of Milan city centre, covering roughly the same area
of one CAMx cell, 1.6x1.6 km2 with a 20m grid step size.
HMS results were compared with observations at two air
quality stations in Milan city centre. Figure 2 shows the
comparison between NOx modelled (HMS and total CAMx,
i.e.: background and local contribution) and observed hourly
time series in January 2010. A good agreement between
measurements and both modelled time series was observed,
except some episodes (11-13/01, 19-21/01) due to particular
meteorological conditions. Particularly, statistics (not
shown) pointed out a slight increase in model performance
when HMS is applied.
Conclusions
HMS model allows reproducing the spatial variability of pollutants within the urban area, not feasible by CTM alone. This
permits to compute a more accurate quantification of pollutants exposition levels. The HMS application to Milan city centre
also highlighted that background contribution can be prevailing even in highly emitting areas, confirming that the evaluation
of air quality in urban areas, as well as the definition of proper strategies for air quality management, cannot be limited only
to the urban local scale.
References ENVIRON 2011. CAMx User’s Guide Version 5.4. ENVIRON International Corporation, Novato, CA.
Janicke Consulting, 2002. AUSTAL2000 Program Documentation Version 2.6. Janicke Consulting, Überlingen, Germany
Yarwood G., RE Morris, GM Wilson. (2004). Particulate Matter Source Apportionment Technology (PSAT) in the CAMx
Photochemical Grid Model. Proceedings of the 27th NATO/ CCMS International Technical Meeting on Air Pollution
Modeling and Application. Springer Verlag
Fig.1 AUSTAL2000 - NOx January mean
Fig.2 NOx Measured and modelled time series at Verziere site.
Black and red lines represent observations and total CAMx estimation. Blue area indicates background contribution, that
added to AUSTAL outcome (green area) generates HMS result.

232
AIR POLLUTION FORECASTS COMPARED WITH DAILY MEASUREMENT AT THE ISLAND OF
LAMPEDUSA
F. Petracchini (1), E. Zampetti (1), L. Paciucci (1), F. Liotta (1), M. Segreto (1), P. Papa (1), V. Flammia (1)
(1) National Research Council of Italy, Institute of Atmospheric Pollution Research CNR-IIA, Via Salaria km 29.3, P. O.
Box 10, 00015 Monterotondo RM, Italy;
Presenting author e-mail: [email protected]
Summary
The impact of several pollution sources onto the environment was investigated through determining a list of air toxicants at
Lampedusa island, located in the South of the Sicily channel. Two advanced sensors systems were developed, one to measure
on site the suspended particulate matter (PM10), and the second to detect several regulated pollutants (nitrogen dioxide,
ozone, carbon monoxide, hydrogen sulphide and sulfur dioxide). The experimental measurements of suspended particulate
matter, nitrogen oxide and carbon monoxide were used to calibrate and validate the proposed model.
Methodology and Results
The system for the particulate monitoring was based on a QCM (Quartz Crystal Microbalance) sensor having 10 MHz of
fundamental resonating frequency and coated with a suitable high sticking trapping material. While the gas system used low
cost, low power, small dimensions and high performances electrochemical sensors.
Two in-field campaigns were carried out in spring and summer 2015. The pollution sources monitored were the i) one diesel
power plant, ii) vehicular traffic in Lampedusa city center, iii) airport and iv) two ports (commercial and touristic).
The pollution sources that resulted to have the greatest impact on air quality of Lampedusa island were touristic and
commercial ports in August (e.g., NOX, 28,7 ppb vs. 19,4 ppb at diesel power plant; SO2 107,4 ppb vs 97 ppb in the airport
area). In fact shipping emissions impact the levels and composition of all particulate and gaseous pollutants monitored. By
contrast, vehicular traffic in Lampedusa city center resulted to have the greatest emission of the suspended particulate matter
in August (eg. PM10, 47 ug/m3 vs. 14.5 ug/m3 in the touristic port.). The diesel power plants emissions resulted to have the
greatest impact on the air quality only for hydrogen suphide (80.40 ppb vs 50.5 ppb in the touristic port).
In this study a Gaussian air dispersion mathematical model has been used to simulate and forecast the air pollution episodes
in Lampedusa island. The model contains the main sources on the island: diesel power plant, airport, port and vehicular
traffic; the ‘EMEP Guide’ on air pollutants and all available information about sources (vehicular traffic, phase modulations
of the diesel power plant, arrivals and departures timetable and engine property of airplane and main ships) has been used to
assign emission rates to the sources. The meteorological conditions of measurement campaigns have been reproduced in the
program (BREEZE - Trinity Consultants) and the results have been compared with the measured values in the same places.
Once the model has reached a good agreement with the measures, various kind of different scenarios have been investigated,
altering sources and meteorological conditions parameters.
Conclusions
Two prototypes sensors systems were developed to monitorate gas (nitrogen dioxide, ozone, carbon monoxide, hydrogen
sulphide, sulfur dioxide) and particulate pollutants (and PM10 ) in different pollution sources in Lampedusa island. A
mathematical model was applied to simulate pollulant dispersion in different scenarios altering sources and meteorological
conditions parameters.
Acknowledgement
This work was supported by the Italian Ministry of Education, University and Research

233
INFLUENCE OF ATMOSPHERIC STABILITY ON THE ESTIMATION OF TRACE METALS
CONCENTRATIONS BY MEANS OF LINEAR STATISTICAL MODELS
G. Santos (1), S. Terán (1) and I. Fernández-Olmo (1)
(1) Chemical and Biomolecular Engineering Department, Universidad de Cantabria, Santander, Cantabria, 39005, Spain
Presenting author email: [email protected]
Summary
Atmospheric stability is a key attribute that influences the dispersion processes of pollutants in the atmosphere. The aim of
this work is to determine the influence of atmospheric stability related input variables on the performance of linear statistical
models - Multiple Linear Regression (MLR) and Partial Least Squares Regression (PLSR)- to estimate levels of lead (Pb),
arsenic (As), cadmium (Cd) and nickel (Ni) in ambient air. Four variables have been proposed to evaluate the atmospheric
stability: (i) quantitatively, mixing height and the Richardson number, and (ii) qualitatively, inversion and Pasquill-Gifford
stability classes.
Introduction
Air quality statistical models establish an empirical relationship between observed values of certain atmospheric variables
and pollutants immission concentrations and, therefore, are simpler than deterministic models, which require information
regarding emissions sources and dispersion/transformation of pollutants. Statistical models are usually developed for major
pollutants, but they are sometimes applied to minor pollutants, such as trace metals; thus, Arruti et al. (2011) successfully
developed a MLR model to estimate levels of Pb, As, Cd and Ni in three urban areas of Cantabria (Spain), based on major
atmospheric pollutants immission concentrations and basic meteorological data monitored by local air quality networks. In
particular, the performance of MLR models in Santander site was poor. Taking into account the availability of atmospheric
sounding data at Santander and the role that atmospheric stability plays in deterministic air quality models, this work aims at
including atmospheric stability related input variables in statistical linear models to improve their performance.
Methodology and Results
Mixing height (MH) was determined based on the Holzworth method from vertical temperature profiles of atmospheric
soundings. In addition, those cases where inversion (I) occurred (i.e. temperature increased with height) were also identified
(1: no inversion, 2: moderate inversion; 3: complete inversion). The dimensionless Richardson number (Ri) was calculated
for the air layer between the ground level and that corresponding to the mixing height. Subsequently, the corresponding
Pasquill-Gifford atmospheric stability class (PG) was determined according to the equivalence between these classes and Ri
values, as proposed by Woodward (1998), and coded as 1-6, where 1 is very unstable and 6, stable. Because two soundings a
day (at 0h and 12h) were available in Santander, two values of the atmospheric stability related input variables were
calculated: one in the morning and one in the evening.
The correlation matrix between the all the independent variables used (the former input variables - major pollutant
concentrations and meteorological parameters - and the new variables related to atmospheric stability) and metal
concentrations was calculated, so that the more significant inputs may be identified. For every pollutant in the period 2008-
2009, at least one of the four considered new input variables was among those statistically significant (90% confidence
level): I for Pb, I and PG for Ni, Ri for As and MH for Cd.
Results show that the consideration of these variables yield a better performance of MLR and PLSR estimation models for As
and Cd as they produced an increased correlation coefficient (from 0.5 to 0.6 for As and from 0.3 to 0.4 for Cd) and a slight
decrease in the uncertainty indices. Nevertheless, no significant improvements were found for Pb and Ni.
Conclusions
Atmospheric stability may be an important aspect to take into account for the development of linear statistical estimation
models of air pollutants. In this work, MLR and PLSR models that include meteorological variables related to atmospheric
stability as additional inputs exhibited better performances than those of previous models for the estimation of the As and Cd
levels. However, it has been proven not to be an equally effective strategy for the estimation of Pb and Ni levels.
Acknowledgement
This work was supported by the Spanish Ministry of Economy and Competitiveness (MINECO) through the Projects
CTM2010-16068 and CTM2013-43904R. The authors also acknowledge the Spanish State Meteorology Agency (AEMET)
for providing atmospheric sounding data for the period of study.
References
Arruti, A., Fernández-Olmo, I., Irabien, A., 2011. Assessment of regional metal levels in ambient air by statistical regression
models. Journal of Environmental Monitoring 13(7), 1991-2000.
Woodward, J.L., 1998. Improving the effect of atmospheric stability class for dispersion modeling. Process Safety Progress
17(1), 1-8.

234
ERROR APPORTIONMENT FOR AIR QUALITY MODELLING: ADVANCEMENTS IN MODEL EVALUTION
E. Solazzo, S. Galmarini
European Commission, Joint Research Centre, Institute for Environment and Sustainability, Air and Climate Unit, Ispra, Italy
Presenting author email: [email protected]
Summary
Scope of this investigation is to introduce methods for the diagnostic of the error originated in air quality (AQ) modelling
systems, for the sake of model evaluation and development. In this study we investigate the nature of the error through the
mean square error (MSE) of modelled time-series of ozone concentration. The MSE is decomposed into its components, the
bias, the variance, and the covariance. Each of the error components is analysed in isolation as function of the time scale of
the resolved processed (long scale LT, synoptic SY, diurnal DU, and intra-day ID) and of model complexity.
Introduction
The novel methodology proposed here (see Solazzo and Galmarini, 2015 for details) tackles the issue of diagnostic
evaluation from the angle of model/data signals spectral decomposition and error decomposition. When the analytical
decomposition of the error into bias, variance and covariance (and its re-organization into the so-called Theil’s coefficients)
is applied to the decomposition of the signals, into long-term, synoptic, inter diurnal and diurnal components revealing
information can be gathered that allow to reduce the spectrum of possible sources of errors, and knowing the list of processes
that are most active at a particular scale, pin point the latter that need attention and improvement. The procedure is denoted
here as error apportionment as it provides an improved and more powerful capacity of identifying the nature of the error and
associate it to specific part of the spectrum of the model/measurement signal. The AQMEII (Air Quality Model Evaluation
International Initiative) set of models and measurements have been used to exercise the evaluation procedure.
Methodology and Results
The time-series of hourly ozone mixing ratios produced by over fisteen modelling systems over Europa and North America
have been spectrally decomposed and the error (respect to surface observations) of each component broken-down to its parts:
bias (accuracy), variance (precision) and covariance (associativity) (Figure 1). We conclude that:
- The bias component of the error is by far the most important source of error and is associated to LT processes and/or input
fields (emissions or boundary conditions). From the model application viewpoint, any effort to improve the current
capabilities of AQ modelling systems might have little practical impact if this primary issue is not tackled and solved;
- Most relevant to model development, the variance is prevalently
associated to the DU component. At time scale of 1-2 days the
complexity of modelling systems increases exponentially and the
variance error (the discrepancy between modelled and observed
variance) drops dramatically, indicating that efforts of model
developments and this time scale are paying off;
- There is little variation in the SY and LT signal and this is the
reason why the error due to variance is little for these components
and becomes predominant only when the bias is negligible or the
total MSE is small;
- The ID component has little weight into the overall model
performance balance and ID time-scale need not to be the priority
for model improvements.
Conclusions
The new method outlined here is a breakthrough in the field of model
evaluation as it allows to diagnose the quality of the error and its
originating time-scale, thus returning important information to
modellers, restricting the analysis to the processes in that specific
time-scale. Analysis of the modelling results for the third phase of
AQMEII will be built on the aforementioned considerations and will
be devoted to the diagnosis of the error of the LT component with
respect to external forcing (emissions and boundary conditions) and
of the DU component with respect to the variance error. The
collaboration with the modelling groups, the design of specific
sensitivity studies and the use if the error apportionment and its sensitivity to model or input data modification, should
provide, after the diagnosis more precise information on possible cures.
Acknowledgments
The community of modellers and data providers of the third phase of AQMEII are thankfully acknowledged.
References
E.Solazzo, S. Galmarini, 2015. Error apportionment for atmospheric chemistry transport models: anew cut to model
evaluation. Atmospheric Chemistry and Physics, submitted.
Fig.1. Apportionment of error by spectral components and by error break-down for fifteen modelling systems
applied to European ozone for the year 2010

235
EVALUATION OF OZONE LEVELS FROM Α GLOBAL MODEL IN EASTERN MEDITERRANEAN SEA - THE
INFLUENCE OF ETESIAN WINDS
E. Solomou (1), A. Poupkou (1), P. Zanis (2) and D. Melas (1)
(1) Laboratory of Atmospheric Physics, Department of Physics, Aristotle University of Thessaloniki, Thessaloniki, Greece;
(2) Department of Meteorology and Climatology, School of Geology, Aristotle University of Thessaloniki, Thessaloniki,
Greece
Presenting author email: [email protected]
Summary
The aim of this work is to study the impact of local northerly winds over Aegean Sea on surface ozone in Eastern
Mediterranean Sea. For this reason, the performance of a global model from the atmospheric service MACC (Monitoring
Atmospheric Composition and Climate) is examined. The predicted ozone concentrations are evaluated against surface
measurements from three background stations, located in Malta, Greece (island of Crete) and Cyprus for a three year period
(2010-2012).
Introduction
Summertime ozone concentrations in Eastern Mediterranean Sea, an area with high ozone levels, are affected by
photochemistry due to increased solar radiation and meteorological factors (Kalabokas et al., 2008) such as the Etesian
winds, northerly strong winds, which blow over the Aegean Sea during summer and early autumn. Another important factor
contributing to high O3 values is the stratosphere-troposphere transport (Zanis et al., 2014). This paper focuses on the
comparison of the results of a global model with ozone observations over the Eastern Mediterranean Sea that is under the
influence of Etesian winds.
Methodology and Results
The Etesian winds are characterized by a wind direction of Northwest to Northeast and a wind speed that takes values greater
than or equal to 5 m/s (Poupkou et al., 2011). Based on the ERA-Interim wind data from the European Centre for Medium-
Range Weather Forecasts (ECMWF), two groups of days are identified in Central Aegean Sea i.e., the Etesian and non-
Etesian days. The global MACC Reanalysis data are based on the
ECMWF Integrated Forecast System (IFS). The evaluation has been
done separately for the Etesian and the non-Etesian days for both
models. High ozone values are found in Eastern Mediterranean Sea.
These values become more pronounced during Etesian days. Finokalia
(Crete) station presents the highest influence of Etesian winds. The
global model underpredicts O3 concentrations for Ag. Marina (Cyprus)
and Finokalia stations (Fig. 1). These results are in agreement with the
findings of Katragkou et al. (2015) that reported a similar
underprediction on average for the summer period. A relatively good
agreement with observations is found at Gharb (Malta) station (Fig. 1).
Correlation coefficients are higher for the non-Etesian days compared
to the Etesian days.
Conclusions
The results suggest that there is a strong variation of ozone concentrations in Eastern Mediterranean during Etesian days.
Performance metrics show that the global model better captures O3 levels during non-Etesian days. The best agreement
between model results and observations is obtained for Malta station.
Acknowledgement
This study is supported by the State Scholarships Foundation of Greece in the context of the “IKY Fellowships of Excellence
for Postgraduate studies in Greece – Siemens Program”.
We would like to acknowledge the EU Horizon2020 project MACC III (Monitoring Atmospheric Composition and Climate -
Interim Implementation).
References
Kalabokas, P.D., Mihalopoulos, N., Ellul, R., Kleanthous, S., Repapis, C.C., 2008. An investigation of the meteorological
and photochemical factors influencing the background rural and marine surface ozone levels in the Central and Eastern
Mediterranean. Atmos. Environ. 42(34), 7894–7906.
Katragkou E., Zanis, P., Tsikerdekis, A., Kapsomenakis, J., Melas, D., Eskes, H., Flemming, J., Huijnen, V., Inness, A.,
Schultz, M.G., Stein, O., Zerefos, C.S. 2015. Evaluation of near surface ozone over Europe from the MACC reanalysis,
Geosci. Model Dev., 8, 2299–2314.
Poupkou, A., Zanis, P., Nastos, P., Papanastasiou, D., Melas, D., Tourpali, K., Zerefos, C., 2011. Present climate trend
analysis of the Etesian winds in the Aegean Sea. Theor. Appl. Climatol. 106, 459–472.
Zanis, P., Hadjinicolaou, P., Pozzer, A., Tyrlis, E., Dafka,S., Mihalopoulos, N., Lelieveld, J., 2014. Summertime free-
tropospheric ozone pool over the eastern Mediterranean/Middle East,. Atmos. Chem. Phys., 14, 115–132.
Fig. 1 Box and Whisker Plot of observed and global
modeled hourly mean O3 concentrations for the
Etesian days (all stations).

236
MODELLING EXERCISES IN COST ACTION ES1006: LOCAL-SCALE MODELS FOR ACCIDENTAL
RELEASES IN BUILT ENVIRONMENTS
Silvia Trini Castelli (1), Kathrin Baumann-Stanzer (2), Bernd Leitl (3), Gianni Tinarelli (4), Maya Milliez (5), Eva Berbekar
(6), Anniko Rakai (6), Vladimir Fuka (7), Antti Hellsten (8), Anton Petrov (9), George Efthimiou (10) (11), Spyros
Andronopoulos (11), Richard Tavares (12), Patrick Armand (13), Claudio Gariazzo (14), Maxime Nibart (15) and all COST
ES1006 Members (16)
(1) Institute of Atmospheric Sciences and Climate, National Research Council, Torino, Italy; (2) Central Institute for
Meteorology and Geodynamics, Vienna, Austria; (3) Meteorological Institute, University of Hamburg, Hamburg, Germany;
(4) ARIANET Srl, Milan, Italy; (5) Universite Paris Est Electricite de France, Chatou Cedex, France; (6) Budapest
University of Technology and Economics, Budapest, Hungary; (7) Dept. of Meteorology and Env. Protect., Faculty of Math.
and Phys., Charles University, Prague, Czech Republic; (8) Finnish Meteorological Institute, Helsinki, Finland; (9) National
Institute of Meteorology and Hydrology-Bulgarian Academy of Sciences, Sofia, Bulgaria; (10) University of Western
Macedonia, Kozani, Greece; (11) National Centre for Scientific Research "Demokritos", Aghia Paraskevi, Greece; (12)
Laboratory of Hydrodynamics, Energetics and Atmospheric Environment and Institute for Research on Urban Sciences and
Techniques, Nantes, France; (13) CEA, DAM, DIF, Arpajon, France; (14) INAIL Research Center, Monteporzio Catone,
Italy; (15) ARIA Technologies SA, Paris; (16) http://www.cost.eu/domains_actions/essem/Actions/ES1006,
http://www.elizas.eu/
Presenting author email: [email protected]
Summary
Evaluating available local-scale models in built environments by model inter-comparison, as well as by comparison against
test data from qualified field and laboratory experiments was a main research task of COST Action ES1006. Assuming that a
typical emergency response model has already been validated with regard to local-scale dispersion modelling, the existing
model evaluation and validation strategies were extended towards task- and application-specific measures for accidental
release scenarios, such as extreme value prediction and exposure assessment. Both continuous and puff releases were taken
into account during the exercise. The model evaluation, here described, focuses on the output obtained by the different model
categories considered during the action.
Introduction
Three case studies were carried out as modelling exercises: (a) the Michelstadt case (see Fig. 1 for an example of
concentration output), based on flow and dispersion data gathered in a wind-tunnel experiment where an idealized urban
environment was modelled and both continuous and puff releases were reproduced; (b) a real-field campaign with continuous
and puff releases in a European harbour, named as CUTE 1 case, which was also reproduced in the wind tunnel, named as
CUTE 3, and (c) a real industrial accident occurred in a European Country, named as AGREE case. In all cases, ‘blind tests’
were conducted, that is only the minimum flow information and no information about measured concentrations was provided
to the modellers.
Methodology
The design of the experiment takes into account that hazardous releases may occur in very different locations in an urban or
industrialized area: in open squares, small or wide streets, perpendicular or parallel to the prevailing large-scale flow or even
in court yards. Given the varying airborne hazards flow and dispersion
modelling approaches which were used, models can be grouped to the
following three types according to their flow and dispersion approach
characteristics: models that do not resolve the flow between buildings; models
that resolve the flow diagnostically or empirically, although not resolving the
flow between buildings; models that resolve the flow between buildings. The
applied models ranged from Gaussian type, to Lagrangian and advanced
Eulerian CFD. It was observed that, in case of continuous releases, maximum
concentrations, dosages and the area affected by values above a relevant
threshold are usually the information expected from an emergency response
model. In case of puff releases, also the arrival time of the puff at given
locations, the duration of the puff passage and the peak concentration values are of interest.
Results and conclusions
In general, both from the Michelstadt and CUTE wind-tunnel experiments it can be concluded that the model performance
increases with increasing model complexity, as expected. Model performances are often influenced significantly by the
location of sources and receptor points. In a relative open space, the dispersion near the source can be well captured by all
models. When the release is located inside a complex building structure, an appropriate and accurate description of the
geometry in the model becomes fundamental for reproducing, for example, plume splitting and the resulting concentration
pattern. Puff releases are found to be far more complex than for continuous releases. In this case, specific test parameters
have been introduced to be considered as well. Also in such scenario more advanced models are clearly preferable.
References
Baumann-Stanzer, S. Trini-Castelli, S. Stenzel (Eds), 2015. COST ES1006 Model evaluation case studies: Approach and
results. Publisher: University of Hamburg, ISBN: 987-3-9817334-2-6
(http://elizas.eu/images/Documents/Model%20Evaluation%20Case%20Studies_web.pdf).
Fig.1 Example of concentration map in the Michelstadt exercise for source S2

237
GRAMM/GRAL: A COUPLED MODEL SYSTEM TO SIMULATE AIR POLLUTION AT THE CITY SCALE
K. Zink (1), A. Berchet (1), D. Brunner (1), J. Brunner (2) and L. Emmenegger (1)
(1) Empa, Swiss Federal Laboratories for Materials Science and Technology, Dübendorf, Switzerland; (2) UGZ, Umwelt-
und Gesundheitsschutz, Municipality of Zürich, Zürich, Switzerland
Presenting author email: [email protected]
Summary
We simulate air pollution at a very high resolution at the urban scale for two Swiss cities, Lausanne and Zurich. Combining a
very detailed emission inventory with high-resolution dispersion simulations, we compute air quality maps at an hourly
resolution. Contributions from different source categories such as traffic or heating are calculated separately to allow source
apportionment in each grid cell.
Introduction
Air pollution is one of the major issues that have to be dealt with in urban areas. Air pollutant concentrations vary strongly
within the city depending on the proximity to emission sources, meteorology, local dispersion, as well as on the background
air pollution. To accurately assess air pollution exposure of citizens it is necessary to provide maps of air quality in different
parts of the city at a very high horizontal resolution. Such maps can be used by policy makers for designing effective
mitigation measures or by sensitive persons to reduce their personal exposure. To date, models capable of simulating the
dispersion of air pollutants are usually one of two types: (1) Coarse mesoscale meteorological models where the
concentrations are averaged over the city. (2) Highly resolved CFD models that are too costly to be run on a regular basis for
long time-periods.
Within the Nano-Tera project OpenSense2 we aim to assess the impact of air pollution on the health of citizens living and
working in urban areas by combining dense sensor networks with high-resolution models. Using the model system
GRAMM/GRAL, we are bridging the gap between the two types of models by combining the strengths of each of them. The
final model product is a catalogue of air pollution maps for the two Swiss cities that can be used to provide hourly
information on air quality at a resolution of 5 m. These will be used for health studies by our partners in the OpenSense2
project.
Methodology and Results
We are using the mesoscale model GRAMM (Graz meteorological
model; Almbauer et al., 2009) to simulate wind fields for the greater
regions around the two cities. These wind fields are then modified by
the CFD model GRAL (Graz Lagrangian model; Oettl and Uhrner,
2010) to represent the flow at the building-resolving scale. The same
model GRAL is used to simulate the dispersion of primary emitted
pollutants such as NOx or PM. As the temporal and spatial variability of
emissions has a profound impact on the variability of the air quality in
urban areas, a detailed emission inventory is as important as the
dispersion model. A newly developed inventory for the city of Zurich
specifies the yearly amount of emitted air pollutants for 60 different
source categories (e.g. traffic, heating, industry) which are described as
point, line and area sources. The temporal variability of the emissions
(e.g. traffic hours, heating days) is accounted for using specified time
functions. The map in Fig. 1 is the output of a high-resolution
dispersion simulation using the detailed information from the
inventory. By computing separate maps for different source categories,
we can assess the sensitivity of the air quality to different emission
sources at specific locations.
Conclusions
Based on our extensive catalogue of fine-scale distribution maps for the two Swiss cities, we produce time series and spatial
plots of the air quality at an hourly resolution. We can identify the source groups that are mainly contributing to the
concentrations of air pollutants at a specific time and location. Using this tool, it is possible to assess the individual exposure
of people moving in the area or to give advice to policy makers regarding control measures or urban planning.
References
Almbauer, R. A., Oettl D., Bacher, M., Sturm, P. J., 2000. Simulation of the air quality during a field study for the city of
Graz. Atmos. Environ. 34, 4581-4594.
Oettl, D., Uhrner, U., 2010. Documentation of the Lagrangian Particle Model GRAL (Graz Lagrangian Model Vs. 4.10. Amt
d. Stmk. Landesregierung, FA17C, Technische Umweltkontrolle, Bericht: Lu-11-10. URL:
http://app.luis.steiermark.at/berichte/Download/Fachberichte/Lu_08_09_GRAL_Documentation.pdf.
Fig.1 NOx concentration map for Lausanne (example)

238

239
ENVIRONMENTAL AND HEALTH IMPACT RESULTING
FROM AIR POLLUTION

240

241
DISTRIBUTION OF PARTICULATE MASS CONCENTRATIONS IN A COMPLEX TRAFFIC HOT SPOT
B. Artíñano (1), E. Díaz Ramiro (1), F. J. Gómez-Moreno (1), S. Vardoulakis (2), C. Dimitroulopoulou (2), C. Yagüe (3),
G. Maqueda (3), C. Román-Cascón (3), M. Sastre (3), R. Borge (4), J. Lumbreras (4) and E. Latorre (5)
(1) Department of Environment, CIEMAT, Madrid, E-28040, Spain; (2) Centre for Radiation, Chemical & Environmental
Hazards, Public Health England, Chilton OX11 0RQ, UK; (3) Department of Geophysics and Meteorology, University
Complutense of Madrid, Faculty of Physical Sciences, E-28040 Madrid, Spain; (4) Department of Chemical and
Environmental Engineering, Technical University of Madrid (UPM), E-28006 Madrid, Spain; (5) Álava Ingenieros, E-28037
Madrid, Spain
Presenting author email: [email protected]
Summary
Two field campaigns were performed in 2015 during winter and summer in a complex traffic hotspot in Madrid. Apart from
gaseous species, the ambient particulate mass concentration levels (PM10, PM2.5 and PM1) were measured at different
atmospheric conditions. Several Optical Particle Counter instruments were deployed in the study area, two of them installed
at two points in the North –South axis. A DustTrak DRX measured the particle levels around the experimental area following
a dynamic measurement pattern. These instruments were previously intercompared against the reference gravimetric method
and against a TEOM instrument. Particle measurements were complemented with meteorological and microturbulence
parameters (friction velocity, sensible heat flux and turbulent kinetic energy) from two stations located in the study area (0.42
km2). The pedestrian flows were also characterized to obtain their exposure to ambient particles.
Introduction
The TECNAIRE project (Técnicas innovadoras para la evaluación y mejora de la calidad del aire urbano) aims to diagnose
the problems of air quality in urban environments by developing new measuring and modelling techniques able to evaluate
strategies for their resolution. Within this framework, two campaigns were designed and performed during the winter period
13 February-2 March and the summer period 25 June-20 July 2015 in a complex traffic hot spot (Plaza de Fernández
Ladreda) in Madrid. This spot frequently experiences the highest pollution levels for particles and gases of the city caused by
traffic influence. It is a site of enormous complexity in terms of sources, urban geometry and intense pedestrian activities.
Methodology and Results
Several Optical Particle Counters (Grimm and Eatough, 2009) were deployed in the study area. A Grimm 1107 instrument
was installed at 2.5 m high stand in the South of the square, next to a transport station, and a Grimm 365 at the roof of a 5 m
high building in the North side. Meteorological stations were installed at both locations, one of them providing
microturbulence parameters (measured by sonic anemometers). A TSI DustTrak DRX instrument (Tasić et al., 2012)
measured the particulate mass levels at 14 points around the experimental area in a dynamic pattern by moving the
instrument around the square and measuring at a mean adult height respiration level. Additional measurements in specific
spots such as bus stops and traffic lights were made. Local features variations (e.g. traffic lights changes) were recorded at
these locations to analyse their influence on the observed concentration values. Additionally, the traffic and pedestrian flows
were also measured.
During the winter monitoring campaign, local meteorological conditions varied giving well defined periods of strong to
moderate winds, in occasions accompanied by showers, alternating with wind calm periods which favoured pollutant
stagnant and accumulation. The most important episode lasted from 19th to 21st February and the highest concentrations of
pollutants were recorded at the air quality monitoring station. During this episode a daily cycle with two peaks linked to
traffic rush hours could be detected for the main pollutants. The nocturnal values remained high due to the atmospheric
stability associated with temperature inversion conditions. Turbulent kinetic energy was less than 1 m2s-2 during 19 and 20
February, with nocturnal values below 0.1 pointing out the low turbulence associates to these days, even during the diurnal
time. PM10 hourly concentrations higher than 50 µgm-3 were reached in occasions, as it was measured by the Grimm 365.
Measurements during the fast rounds confirmed that the maximum concentration values correspond to crosswalks, especially
during the car accumulation. This situation was studied in further detail in a bus stop where the highest concentrations were
measured when diesel buses were waiting during the red lights.
Conclusions
Local emissions had a great influence in the concentration field, which, even under higher wind speeds and turbulence, did
not follow a clear pattern dominated by the atmospheric dynamics. Most of the particulate matter mass was in the smaller
fraction, PM1, pointing to traffic as the main source in this hot spot. Nevertheless, the high complexity of this urban scenario
requires further studies to categorize the different impacts of local sources and activities under a wider range of conditions.
Acknowledgement
This work has been financed by Madrid Regional Research Plan through TECNAIRE (P2013/MAE-2972)
References
H. Grimm and D. J. Eatough (2009) J. Air Waste Ma., 59, 101–107.
V. Tasić, M. Jovašević-Stojanović, S. Vardoulakis, N. Milošević, R. Kovačević, J. Petrović (2012) Atmos. Environ., 54,
358–364.

242
CHILDREN EXPOSURE TO AIR POLLUTANTS IN INDOOR OF PRIMARY SCHOOLS
A. Ferreira (1), S.M. Cardoso (2)
(1) Polytechnic Institute of Coimbra, ESTeSC – Coimbra Health School, Environmental Health, Portugal; (2) Coimbra
University, Medical School, Portugal
Presenting author email: [email protected]
Summary
This work intends to contribute to the understanding of the impact on children's health of the exposure to indoor air in
primary schools in the municipality of Coimbra. This study evaluated the concentration of carbon monoxide (CO), carbon
dioxide (CO2), ozone (O3), nitrogen dioxide (NO2), sulfur dioxide (SO2), volatile organic compounds (VOCs), formaldehyde
(CH2O) and particulate matter (PM2,5 and PM10), temperature (T°) and relative humidity (Hr) in order to characterize the IAQ
of classrooms in primary schools of the Municipality of Coimbra and the ambient air quality, to estimate the current health
situation of students and to propose mitigation measures.
Introduction
The modern and growing pattern of consumption has environmental consequences which will inevitably reflect on human
health. Daily, air quality affects our well-being and may affect our future, which is why the indoor air quality (IAQ) has been
identified as a major environmental risk to public health. In Europe, air pollution is regarded as a pressing environmental
issue because it has a major impact on the health of citizens. Among these, children are considered to be a particularly
vulnerable group. The level of indoor air pollution can reach values 2 to 5 times higher than outdoor air. The levels of
contamination of indoor air become even more important when one considers that in modern society people spend about 80-
90% of their time inside buildings. Despite the existence of some epidemiological studies concerning IAQ in schools, little is
known about the IAQ in Portuguese schools. The perception of IAQ problems is relevant to assess the risks to the health and
performance of students and to propose measures to reduce exposure to unwanted pollutants.
Methodology and Results
We classified the study as a level II, of observational type and of cross-sectional nature. The sample was non probabilistic as
to the type and of convenience in what concerns the technique. To carry out this study, we assessed the air quality in 51
schools belonging to parishes moderately and predominantly urban and predominantly rural parishes, and we also assessed
the respiratory capacity of children in the 1st and 4th year of these schools in autumn/winter and spring/summer.
Parents/guardians were also asked about the signs, symptoms and pathologies of their children. The sample consisted of 82
classrooms and 1019 students, with an average age of 7 (standard deviation=1.54). The data collected were then processed
using the SPSS version 19.0 statistical software. The interpretation of statistical tests was based on a significance level of
p=0.05, with a confidence interval of 95%. We found that the average concentrations of pollutants in indoor air were higher
than the average concentrations recorded outside, which demonstrates the important contribution of indoor sources in
schools. Levels of CO2, VOCs, PM10, PM2,5, CH2O, Hr and Tº in several classrooms exceeded the maximum acceptable
levels for the health and comfort of occupants stated in the Portuguese legislation. These results have shown that poor
ventilation conditions were responsible for the accumulation of indoor air pollutants in various classrooms. However, also the
occupation and school activities were identified as determinants of IAQ. We also acknowledged that, from the parameters
that revealed concerning results and above the legislated value, CO2, VOCs and CH2O showed the highest average
concentrations outside predominantly in urban areas, whereas PM10, PM2,5 showed higher concentrations predominantly in
rural areas. We found that in classrooms with wooden flooring the average PM10 concentrations were higher than in
classrooms with a different type of flooring, which shows that the characteristics of the type of coating material of the floor
are related to a greater difficulty to clean, thereby causing an accumulation of dust between the material.
Conclusions
We found associations between some analyzed environmental parameters and signs, symptoms and diseases, as well as
changes in respiratory function in students. The results of the study reinforce the benefit of the study of the binomial
environment/health, namely in the area concerning the relationship between indoor air pollutants and the impact on children's
health. Effectively an increased risk occurrence of environmental problems can lead to an increased incidence of several
diseases. These results show the opportunity to take corrective measures, including reducing the emission sources and
promoting greater ventilation. It is crucial: the development of an investigation which is applied and integrated into the
causes, mechanisms and effects in all aspects of the binomial environment/health; the dissemination of results and
conclusions obtained in order to promote information, awareness, training and education; the establishing of guidelines for
the prevention, control and reduction of inherent risks.
References
Ferreira, Ana e Cardoso, S.M. Effects of indoor air quality on respiratory function of children in the 1st cycle of basic
education of Coimbra, Portugal. Occupational safety and Hygiene II – Arezes et al. (eds). 2015 Taylor & Francis Group,
London, ISBN 978-1-138-02765-7 pp.347-350.

243
POLLUTANT DATA MAPPING AT MUNICIPALITY LEVEL FOR EXPOSURE ASSESSMENT ON EUROPEAN
COUNTRIES
S. Ghigo (1), S. Bande (1), L. Ciancarella (2), M. Mircea (2), A. Piersanti (2), G Righini (2), X. Basagaña (3), D. Agis (3), M.
Rus(4), M. Gandini (1)
(1) Agenzia Regionale Protezione Ambiente (ARPA) Piemonte, Torino, Italy; (2) - ENEA Italian National Agency for New
Technologies, Energy and Sustainable Economic Development, Bologna, Italy; (3) Centre de Recerca en Epidemiologia
Ambiental (CREAL), Barcelona, Spain; (4) National Institute of Public Health (NIJZ), Ljubljana, Slovenia
Presenting author email: [email protected]
Summary This study aims to provide annual air pollution maps at municipality scale for exposure assessment on national basis. Maps
have been produced for each country involved in the European Union LIFE+ project MEDiterranean Health Interview Survey
Study (MED HISS) and for the main atmospheric pollutants (PM10, PM25 and NO2), combining two sources of information:
observed data and concentration fields from Chemical Transport Models (CTMs). In order to improve not already assimilated
CTMs output, we have post-processed them through Kriging with External Drift (KED). Then we have up-scaled pollutant
concentration data in order to obtain exposure assessment at municipality level, particularly useful for epidemiological
studies on air pollution health effects.
Introduction Within the MED HISS project, in order to evaluate health effects of long-term exposure to air pollution for the entire
population of countries involved in the project, it was necessary to provide an annual pollutant value at municipality level.
Available air quality data were observations from monitoring stations and CTMs concentrations fields. CTMs data were
output of the subsequent modeling systems running at national scale: for Italy, the National Integrated Modeling system for
International Negotiation on atmospheric pollution (MINNI1), for Spain, the CALIdad del aire Operacional Para España
(CALIOPE2), and for Slovenia the Comprehensive Air Quality Model with Extensions (CAMx)3. All the CTMs data are
available at a spatial resolutions representative of urban background pollution levels.
Methodology and Results In order to reduce model uncertainty CALIOPE includes assimilation of
observed data. Thus, to conform Italian results to Spanish ones and to
provide a more realistic representation of pollutant spatial distribution, a
KED procedure has been used to account for the observed data into
MINNI concentration fields. Specifically, the kriging is applied on the
observed data and the external drift is constituted by the MINNI model
output for years 2003, 2005, 2007 and 2010. Observations were
interpreted as realizations of a Gaussian spatial process following this
structure: Y(s) = μ(s) + w(s) + ε(s), where in the trend component we
introduce the MINNI model output, w(s) is a stationary Gaussian random
process and ε(s) is the error term. Only background stations have been
used in the KED procedure. We have carried out a leave-one-out cross-
validation analysis in order to evaluate KED performance: a comparison
between observations and KED output at monitoring station locations
showed a good agreement, also where the spatial coverage of monitoring
stations was low (as example, see the Taylor diagram in Fig. 1).
Following this data fusion approach, the exposure assessment was
carried out for all the MED HISS countries by up-scaling the gridded
data at the municipality level4. Using a weighted block averaging procedure accounting for built-up surface percentages,
annual exposure maps at municipality level for the three countries were obtained. Looking at resulting maps, concentrations
levels and main spatial patterns are well preserved.
Conclusions The adopted data fusion tecnique produced satisfactory results. Also the up-scaling provided consistent exposure estimates at
municipality level that account for the areas where people really live.
References
Mircea M., Ciancarella L., Briganti G., Calori G., Cappelletti A., Cionni I., Costa M., Cremona G., D'Isidoro M., Finardi S.,
Pace G., Piersanti A., Righini G., Silibello, C., Vitali L., and Zanini G., 2014. Assessment of the AMS-MINNI system
capabilities to predict air quality over Italy for the calendar year 2005. Atmospheric Environment, Vol. 84, February 2014,
Pages 178–188
Baldasano J.M., Pay M.T., Jorba O., Gassó S., Jiménez-Guerrero P., 2011. An annual assessment of air quality with the
CALIOPE modeling system over Spain. Sci Total Environ, 409(11):2163-78.
Rus M., Honzak L., Žabkar R., Rakovec J., 2013. Evaluation of ALADIN-CAMx and WRF/Chem operational air quality
forecasts: first results. Proceedings of HARMO 15, Madrid, Spain, 6-9 May 2013, str. 134-138
Ignaccolo R., Ghigo S., Bande S., 2013. Functional zoning for air quality. Environmental and Ecological Statistics, 20 (1):
109–127.
Fig.1 NO2 Taylor diagram for year 2007 where DMO (direct model output) is MINNI output, KED is the
assimilated output

244
ASSESSMENT BY MODELING OF THE ATMOSPHERIC DISPERSION THE EMISSIONS OF A THERMAL
POWER STATION IN DOUALA (CAMEROON)
Jean Roger Kaze Djamen (1), Robert Mbiake (2), Richard Leduc (3)
(1) IUC Institut Universitaire la Côte ; (2) University of Douala; (3) University of Laval
Presenting author email: [email protected]
Summary
Air quality in the vicinity of the thermal power station of Logbaba in the town of Douala was investigated in this study using
data collected in a 5 year period (2008-2012).The distribution of molecules such as SO2, NOx, CO and the particle matter
PM2.5 was analyzedusing numerical modeling, basedon physical andthermal characteristics,as well as the operating periods
of the power station. TheAERMOD was used for simulation, and wind rose and other NOAA in-situ data were used for
validation of the model. The pollutants distribution was evaluated at two locations: at the exit of the power station,considered
as reference point, and 330m away from the exit where the first houses exist. The results show that, at the exit of the power
station, the relative concentration for each contaminant is: 7.2% for the PM2.5 during 24 hours of emission, 45.96% for CO
over 8 hours of emission, and 17.5% for SO2 over one hour. The NOx is the highest pollutant with an emission of 259.1%
over an hour from emission and 51% over one year. After 330 m of the power station, only the NOx keeps a polluting
character with a relative rate of 100%. These results show that the pollution level of the power station is beyond the threshold
for air quality set by the World Health Organization (donner un chiffre si possible).Moreover, among all pollutants
investigated, NOx appears to be the most critical for the populations in the vicinity of the Logbaba thermal power station.
Therefore, this information is important for policyand decision markers in preventing the vulnerability of the population to air
pollutants from industrial settings.

245
THE METHODOLOGY OF DETAILED LINKING BETWEEN THE AIR POLLUTION MODELLING OVER A
COMPLEX TERRAIN AND RESPIRATORY DISEASES IN CHILDREN – THE ZASAVJE REGION, SLOVENIA,
CASE
A. Kukec (1), L. Zaletel-Kragelj (1), B. Grašič (2), P. Mlakar (2) and M.Z. Božnar (2)
(1) Public Health Centre, Faculty of Medicine, University of Ljubljana, Ljubljana, Slovenia; (2) MEIS Environmental
Consulting, Mali Vrh pri Šmarju, Slovenia
Presenting author email: [email protected]
Summary
One of the important objectives of air pollution dispersion modelling is to support the public health interventions. Effective
measures cannot be implemented without proper understanding of the association between air pollution and health
phenomena. To establish the relationship correctly, numerous methodological problems must be solved. Among them
possible deviations related to the modelling, as well as to the health data collection. The key steps of the detailed
methodology of linking the air pollution modelling over a complex terrain in the Zasavje Region, Slovenia, and respiratory
diseases in children, will be presented.
Introduction
One of the most polluted areas in Slovenia is the Zasavje region, located in the central part of the country. It is characterized
by three narrow valleys with more or less steep surrounding hills, where three urban and numerous rural settlements are
located. Consequently, there are specific meteorological conditions. In the region various different kinds of heavy industry is
placed. The complex terrain of the region complicates the assessment of the relationship between air pollution and health
phenomena. Methods for linkage health and environmental data at the population level were recommended by the World
Health Organization (Briggs et al., 1996; Corvalan et al., 1997).
Methodology and Results
To establish the relationship properly, firstly, the annual air pollution for the main pollutants in the best possible temporal and
geographical resolution (good enough to enable to separately examine the areas, where due to the complex terrain varied
pollution was expected and was confirmed by the measurements) had to be modelled, taking into consideration also structure
of the settlements. In the next step the basic spatial units had to be combined in observed small geographical units proper
for the analysis. Afterwards, the modelled data aggregated on the level of observed small geographical units had to be
linked to the georefferentiated health data, also aggregated on the level of observed small geographical units. In both,
environmental and health data, critical deficiencies had to be evaluated in order to minimize the possibility of wrong
conclusions. The results of our spatial analysis in Zasavje region of the association between respiratory diseases in children
and modelling air pollution showed a statistically significant positive relationship in the effect of the average annual SO2
concentration. The association with this pollutant in the athmosphere has been expected, because the input data in the
modelling system were relatively complete only for SO2. The moste important results of our study can be seen in the
presented methodology of linkage health and environmental data on a complex terrain. Small geographical units on the
complex terrain in fine resolution with urban and rural cases has been defined. Additionally, the metodology for spatial
analysis on complex terrains in fine resolution was improved and in the case of SO2 it was comfirmed.
Conclusions
We can conclude that the present study is in several ways important for the environmental health. An important benefit can
be seen in the presented methodology of establishing small spatial units with models of the air pollution dispersion for
linking to health data on a complex terrain in fine resolution. The presented methodology could be useful in creation and
management of health policy related to environmental health. In the future is necessary to improving the data quality, firstly
to change the system of collecting and reporting health and environmental data.
Acknowledgement
The authors would like to thank the Slovenian Research Agency and Ministry of Health for financially supporting the
V3-1049, L1-2082, L1-4154 and L2-5475 projects, as well as members of both project teams. We would also like to thank
the staff at the health centres for preparing and providing the health data, and companies for allowing us to use their emission
data.
References
Briggs D., Corvalan C., Nurminen M., 1996. Linkage methods for environment and health analysis. General guidelines.
Geneva: World Health Organization, Office of Global and Integrated Environmental Health.
Corvalan C., Nurminen M., Pastides H., 1997. Linkage methods for environment and health analysis. Technical guidelines.
Geneva: World Health Organization, Office of Global and Integrated Environmental Health.

246
HAVOC OF OUTDOOR AIR CONTAMINANTS - A CASE STUDY FROM INDIA
Dr. S.K. Sharma
Head, Environmental Education Department, Carman Residential & Day School, Dehradun 248007, India
Presenting author email: [email protected]
Summary
Due to excessive industrialization and unwarranted automobile growth the air resource has come under the catastrophic range
of pollution specially due the oxides of sulphur (SO2) and nitrogen (NO2) concentrations in the air, the effects of which is
devastating. One of the finest mausoleum, the Taj Mahal in Agra is surrounded by the number of smelters, foundries and
thermal power plants. Furthermore, the Mathura Oil Refinery established in its vicinity in 1972, is merely 40 Km away. All
these industries together with burning of fossil fuels by the vehicular circulation is emitting 25-30 tons of SO2 and NO2
gases. These pollutants are transported in the atmosphere over distances of hundreds of kilometres and eventually combine
with water vapour to form sulphuric acid (H2SO4) and nitric acid (HNO3) which washed down during rains to reach to the
earth surface as acid rain having a pH value of 4.0 or less which is effecting the monuments as well as the human health of
local people.
Introduction
Air pollution in India is a serious issue with the major sources being industries, fuel-wood and biomass burning, fuel
adulteration, vehicle emission and traffic congestion. India has a low per capita emissions of greenhouse and other gasses but
the country as a whole is the third largest after China and the United States. The Air (Prevention and Control of Pollution)
Act was passed in 1981 to regulate air pollution and there have been some measurable improvements. However, the 2012
Environmental Performance Index ranked India as having the poorest relative air quality out of 132 countries.
Methodology and Results
The monitoring of sulphur dioxide (SO2) and oxides of nitrogen as NO2 is carried out for 24 hours (4-hourly sampling) in
Agra with a frequency of twice a week, to have one hundred and four (104) observations in a year. Last year, the 24 hours
average concentration of the sulphur dioxide (SO2) and nitrogen dioxide (NO2) levels was recorded at 269μg/m3 and
217μg/m3 respectively as against WHO Guidelines for Ambient Air Concentrations of maximum 150μg/m3. These elevated
concentration of air contaminants are causing neurological, digestive disorders, eyes, throat and respiratory tract problems in
local human populations. Studies indicate that long-term exposure to NO2 levels currently
observed in and around Agra has decreased lung function
and increase the risk of respiratory symptoms such as acute
bronchitis and cough and phlegm, particularly in children (a
large number of children work in foundries). The adverse
effect is not limited to human beings but it is also effecting
the monuments. The Taj Mahal which was constructed
entirely in white marble in 1632, has four minaret besides
the main mausoleum. The above left picture show that the
pilasters of the Taj Mahal were once inlaid with white marble but now gone pale due to air
pollutants as seen in the above right picture (air pollution industry in the background).
The SO2 precipitation, together with humidity and low wind speeds has caused disfiguration of marble. The sulphuric acid
reacts with the CaCO3 in the marble to form CaSO4 – which causes pitting in the mausoleum. Discoloration of the white
marble has turned the Taj Mahal surface pale yellow, chipping and breaking of the edges of the marble slabs and formation
of cracks in marble are clear indication of deterioration of the monument.
Conclusions
In order to mitigate the environmental air pollution problems, the Government of India introduced the Air (Pollution
Prevention and Control of Pollution) Act, 1981 with an objective to provide prevention, control and abatement of air
pollution. The government has set up the Taj Trapezium Zone (TTZ), around the monument where strict emissions
standards are in place and closed down two thermal power stations at Agra, The government is also encouraging the
electric or human driven transport from the city to reach the monument instead of using the petrol/diesel vehicles. This
would not only save the Taj Mahal from further damage but would also help in restoring human health of local people and
plants.
Acknowledgement
This work was supported by the Carman School and the Central Pollution Control Board helped in sampling and analysis.
References
Shukla, P.R., Sharma, S.K., Ramana, P.V. (eds.) 2002 ‘Climate Change and India: Issues concerns and opportunities’ Tata
McGraw Hill, New Delhi.

247
SEASONAL DISTRIBUTION OF VIABLE BACTERIAL AEROSOL IN BENGALURU URBAN, KARNATAKA,
INDIA
S Sivasakthivel (1) and N.Nandini (2)*
(1) Research Scholar, Department of Environmental Science, Bangalore University, Bengaluru-56, Karnataka, India; * (2)
Professor and Chairperson, Department of Environmental Science, Bangalore University, Bengaluru-56, Karnataka, India
Presenting author email: [email protected]
Summary
Microbial air pollution causes major allergic respiratory disorders, in particular asthma, infections are increasing which is a
global phenomenon. Bacterial aerosol sampling was carried out during the year of 2010 to 2013. The microbial air quality
data of Bangalore urban recorded highest during the year 2011 and the minimum annual number was recorded during the
year 2010. Bacterial aerosol for the year of 2010, 2011,2012 and 2013 crossed the tolerance limit prescribed by Institut de
recherché Robert-Sauvé en santé et en sécurité du travail, Occupational Health and Safety Research Institute Robert-Sauvé
(IRSST, 2007). Bacterial aerosol was dominated during Pre-monsoon season. Majority of bacterial aerosols recorded were
genera of Aerococcus , Staphylococcus , Streptococcus, Corynobacterium, Bacillus, Enterococcus , Pseudomonas, Neisseria,
Actinomyces, Mycobacterium and E.coli. In Winter Bacillus sp., and Staphylococcus sp., dominated during winter season.
Atmospheric pollutants supported the bacterial aerosols as a platform, as nutrient for survival and transport. Bacterial
aerosols correlated with air pollutants like particulate matter and SOx. Bacterial aerosol had significant correlation with (r=
0.3266) with respirable suspended particulate matter size ≤10µm and less correlation with SOx (r= 0.1266). Aerosols of fine
particle size 0.4µm to 0.14µm correlated(r=0.441) with bacterial aerosol which indicates that bacterial aerosol prefers the
fine particle as a platform. Polluted water bodies, municipal solid waste dumping sites, open sewage drains and unscientific
disposal of garbage are major sources of bioaerosols perhaps harmful for the residents of Bengaluru Urban.
Introduction
Developing countries like India, the affluent urban population following Western lifestyle appears to be more prone to
allergic risk, resulting in increased incidence of allergic manifestations like asthma and adverse manifestation (Sneller 1984
and Jindal 2010) . In a study conducted as a part of the European Community Respiratory Survey, the prevalence of asthma
in adults aged 20 to 44 years in Mumbai was reported to be 3.5% using clinician diagnosis and 17% by a physician diagnosis
and broncho-provocation test. A recent study5 in school children from Delhi reported asthma prevalence of 10–13%
(Agarwal et al., 2010 and Ritesh 2011). Prevalence of asthma and bacterial pneumonia in Bangalore, hospital based study on
20,000 children under the age of 18 years in 2 decades from 1979,1984,1989,1992 and 1999 in the metropolitan city showed
9%, 10.5%, 18.5%, 24.5% and 29.5% respectively (Paramesh, 2000). The present bacterial aerosol study was carried to fulfil
the scientific reason behind the steady rise of airborne bacterial adverse effect on human.
Methodology and Results
The Aerobiological study was carried out at Municipal solid waste dump sites,
Polluted water bodies. Krishnarajendra market (K.R.Market), LalBagh botanical
garden and the Department of Environmental Science, Bangalore University,
Jnanabharathi campus. Air samples were collected using single stage impactor
operating at about 100 L/minute for 1 min, with a frequency of about twice in a
week during day light hours for all season, usually between 06.00 and 18.00 hrs
at about 1.5 m above the surface, to simulate the human breathing zone. Nutrient
agar media was used for cultivation of a wide variety of bacterial aerosol.
Selective isolation media for isolation of organisms belongs to the genus
Aerococcus, staphylococcus, streptococcus, Corynobacterium, Bacillus,
Enterococcus, Pseudomonas, Neisseria, Actinomyces, Mycobacterium and E.coli
species were prepared according to directions as per the manufacturer manual of
HiMedia laboratory, Mumbai, India. The average bacterial aerosol recorded
during the year 2010 as 27,209 CFU/m3, for the year 2011 as 37, 435 CFU/m3,
for the year 2012 as 37, 795 CFU/m3 and for the year 2013 was recorded as 43,
009 CFU/m3 (Fig.1). Premonson and winter recorded maximum bacterial aerosol
perhaps the risk of bacteria related adverse effect on humans during these seasons
(Fig 2).
Conclusions
The bioaerosol number revealed that 2013 recorded the highest bacterial aerosol pollution and minimum during the year
2010. The air quality during the year of 2012 and 2013 are moderately polluted by bacterial aerosol. The seasonal bioaerosol
records proved that maximum bacterial pollution occurred during premonsoon (summer) season. Bacterial aerosol namely
Streptococcus sp., Bacillus sp., Staphylococcus sp., and Escherichia coli were dominated during premonsoon. Minimum
bioaerosol pollution was recorded in monsoon season. It was discovered that polluted water bodies, municipal solid waste
dumping sites, open sewage drains and unscientific disposal of garbage in Krishnarajendra market are significant sources of
bioaerosol in Bengaluru urban.
References
Sneller,M. (1984). Mould Allergy and Climate Conditions. In: Al-Doory, Y., Domson,M.D. (Eds.), Mould Allergy. Lea & Febiger, Philadelphia, USA, 224–266.
Jindal, S.K. (2010). Indian study on epidomology of asthma, respiratory symptoms and chronic bronchitis (INSEARCH). Indian council of
medical research report (ICMR).
Ritesh Agarwal., Ajmal Khan., Dheeraj Gupta., Ashutosh N. Agarwal., Akshay K. Saxena & Arunaloke Chakrabarthi.
(2010). An Alternate Method of Classifying Allergic Bronchopulmonary Aspergillosis Based on High-Attenuation Mucus.
PLoS ONE 5(12), e15346, doi:10.1371.

248
AIR POLLUTION, HEALTH AND SOCIAL DEPRIVATION ASSESSMENT IN MUMBAI
Laksh Trehan (1), Harish C. Phuleria (1), Rashmi S. Patil (1), Anil Namdeo (2)
(1) Centre for Environmental Science and Engineering, IIT Bombay, Mumbai, 400076, India; (2) 2School of Civil
Engineering and Geosciences, Newcastle University, Newcastle upon Tyne, NE1 7RU, U.K
Presenting author email: [email protected]
Summary
The prime objective of this study is to investigate the relationship between the long and short term air pollution exposures
and measures of health and the effect of social deprivation on this relationship in the city of Mumbai. Our preliminary results
show a high coefficient of correlation i.e. 0.75 and 0.82 in the relationship between NOx concentration and socioeconomic
status in terms of HDI for the years 2013 and 2014 respectively.
Introduction
Several studies have indicated that more deprived population tend to live in the areas with higher levels of environmental
pollution, yet, time trends and geographical pattern of disproportionate distribution of environmental burden remains poorly
assessed particularly in a country like India. The prime objective of this study is to investigate the relationship between the
long and short term air pollution exposures and measures of health and the effect of social deprivation on this relationship in
the city of Mumbai.
Methodology and Results
Air quality data was taken from three
regulatory agencies for the period January 2013
to December 2014. Respiratory illness was
chosen as the health end point and the monthly
data of number of cases of upper respiratory
tract infection (URTI) were obtained from an
NGO working in Mumbai. Socioeconomic
status of people living in various wards of
Mumbai was considered in terms of Human
Development Index (HDI) score as well as
other parameters such as literacy attainment
and percent slum population in each ward. Data
processing and analysis was conducted using
statistical software, R. First, univariate analysis
was conducted to see the relationships between
NOx concentrations, URTI cases and HDI.
With the use of GIS mapping, layers of
information on pollutant concentration, HDI,
URTI cases were overlaid and spatially
analysed to develop composite effect. Multi
variate linear regression model has been to
assess the relationship between air pollution
and health effects with the variable for socio
economic status kept as a modifier. Our
preliminary results show a high coefficient of
correlation i.e. 0.75 and 0.82 in the
relationship between NOx concentration and
socioeconomic status in terms of HDI for the
years 2013 and 2014 respectively. This shows
that wards with lower HDI experience higher
NOx concentrations.
Conclusions
Our study indicated that in Mumbai there is a high correlation between socioeconomic status, health and air quality levels.
The study has found that population groups with lower socioeconomic status have exposure to higher level of pollution and
their also suffer from poor health.
Acknowledgement
This work was supported by British Council UK India Education and Research Initiative (UKIERI).
Fig.1 Relationship between NOx and URTI cases
Fig.2 Relationship between NOx and HDI

249
SPATIAL DISTRIBUTION OF NON-REGULATED BIOGENIC AIR POLLUTANTS (ALLERGENIC POLLEN)
ACROSS BERLIN, GERMANY
B. Werchan (1,2,3), M. Werchan (1,2), H.-G. Mücke (4) and K.-C. Bergmann (1)
(1) Foundation German Pollen Information Service, Charitéplatz 1, 10117 Berlin, Germany; (2) Department of Dermatology,
Venerology and Allergology, Charité-Universitätsmedizin Berlin, Charitéplatz 1, 10117 Berlin, Germany; (3) Institute of
Botany of the Czech Academy of Sciences, Zamek 1, 25243 Pruhonice, Czech Republic; (4) Department of Environmental
Hygiene, Federal Environment Agency of Germany, Corrensplatz 1, 14195 Berlin, Germany
Presenting author email: [email protected]
Summary
To gain information about distribution of allergenic pollen in towns a network of pollen traps was established at 14 localities
across Berlin, Germany. The measurements of airborne pollen (birch, grasses, mugwort) were running from March until
October 2014 using gravimetric traps of Durham type. The results show remarkable spatial variations of pollen sedimentation
across the town. In case of birch and grasses were the highest pollen sedimentations mostly observed closer to the outside of
the town. Substantial proportions of mugwort pollen in traps were influenced by nearby vegetation with mugwort plants. The
difference between the traps with the highest and the lowest amount of pollen was for birch 245%, for grasses 306% and for
mugwort 1.962%. These differences can probably lead to different health impacts on allergy sufferers in one city. Therefore,
pollen situation in big cities should be monitored as part of the natural air quality in different places.
Introduction
Between 10% to 30% of adults and 40% of children worldwide suffer from
allergic rhinitis and/or asthma; one of the most common causes is pollen
(Pawankar et al., 2013). Half of the world´s population lives in towns where
pollen allergies can be aggravated because of mostly higher living standards,
air pollution or inappropriate management of urban vegetation. Few studies
investigated spatial variation of pollen in cities. To gain insight into the
distribution of pollen across towns it is necessary to observe airborne pollen
by more pollen traps per town.
Methodology and Results
Berlin (3.4 million inhabitants, size 892 km²) lies in the northeastern German
lowlands and has a maritime temperate climate (Cfb). 14 gravimetric pollen
traps – similar to Durham trap (Durham, 1946) – were placed across the town
(see Fig. 1) on exposed rooftops of small houses or containers in heights
between 2 and 2.5 m above ground level. Pollen sedimentations were
measured weekly from 11th of March till 28th of October 2014 (33 weeks).
Betula (birch): The highest amounts of birch pollen were observed in traps
situated closer to outside of Berlin, the smallest amounts were found near the
inner city (see Fig. 2). The difference of birch pollen counts between the traps
with the highest and lowest amount was around 245%. During the peak
pollen week the difference reached 283%. Poaceae (grasses): The highest
overall grass pollen count was measured in a station situated in the southern
periphery of Berlin. The difference between the station with the highest and
lowest count in total grass pollen sum was 306%. Artemisia (mugwort): The
highest mugwort pollen sum was found at an inner city trap, where a rich
vegetation with mugwort plants was in close proximity. Overall difference
between the trap with the highest and lowest mugwort pollen sum was
1.962%.
Conclusions Within the city of Berlin there are big differences in the amount of airborne
allergenic pollen of birch, grasses and mugwort. Therefore, a net of pollen
traps is necessary to assess the impact of health. Allergenic pollen should be
accepted as an important factor for air quality needing the introduction of
suitable legislation to regulate measurement of allergenic pollen.
Acknowledgement
This work was supported by the Federal Environment Agency of Germany.
References
Durham O. C., 1946. The Volumetric Incidence of Atmospheric Allergens.
IV. A Proposed Standard Method of Gravity Sampling, Counting, and
Volumetric Interpolation of Results. Journal of Allergy. 17, 79-86.
Pawankar, R. et al., 2013. WAO White book on Allergy 2011-2012:
Executive Summary. World Allergy Organization.
Fig.1 Map of Berlin with locations of gravimetric pollen traps. White color: built-
up areas; light green: meadows and fields; dark green: forests; blue: water bodies.
Fig.2 Total sum of Betula pollen during 11th March to 28th October 2014. The circle size
corresponds with the pollen sum.

250
REGIONAL SCALE AMINE CHEMISTRY DISPERSION MODELLING WITH COSMO-MUSCAT
Ralf Wolke (1), Andreas Tilgner (1), Detlef Hinneburg (1), Roland Schrödner (1, 2), Claus Nielse (3), Hartmut Herrmann (1)
(1) Leibniz Institute for Tropospheric Research (TROPOS), Permoserstrasse 15, 04303 Leipzig, Germany ; (2) Centre
for Environmental and Climate Research, 22362 Lund, Sweden; (3) Department of Chemistry, University of Oslo, 0315
Oslo, Norway
Presenting author email: [email protected]
Summary
The present air pollution study focuses mainly on the regional scale modelling of the tropospheric fate and deposition of
monoethanolamine (MEA) and its oxidation products using the modelling system COSMO-MUSCAT. Both detailed
chemical process model studies are performed and complex 3-dimensional dispersion model investigations were carried out
focusing mainly on the multiphase chemical fate and lifetime of MEA and its reaction products such as amides, nitramines
and nitrosamines in the troposphere. The performed simulations were attended by extensive sensitivity and process studies to
evaluate the associated uncertainties. For this study, realistic concentrations of reactants (OH, NO3, NO2) for MEA
chemistry were provided by applying the RACM chemistry and anthropogenic emission inventories The physical loss
processes of dry and wet deposition are described in dependence on meteorological conditions and land use properties..
Introduction
CO2 capture and store (CCS) technologies, for example amine-based post-combustion CO2 capture techniques, are designed
to reduce anthropogenic CO2 emissions into the atmosphere and are thus an attempt to mitigate the climate change. At
present, amine-based post-combustion CO2 capture techniques of power plants will release discharged air into the
environment, which will contain a small but still significant amount of amines and their oxidation products. Moreover, it is
known that the atmospheric oxidations of amines can lead to the formation of harmful (potentially carcinogenic) compounds
such as nitramines and nitrosamines. Thus, an improved knowledge on the tropospheric chemical fate and physical removal
processes of released amines and its oxidation products is required in order to assess the environmental impact and risks
resulting from amine-based capturing operations. Recent box model studies performed at TROPOS have implicated the
importance of multiphase chemical interactions for the tropospheric processing of emitted amines from CCS techniques
Methodology and Results
The modelling department of the TROPOS has
developed the state-of-the-art multiscale model system
COSMO-MUSCAT (Wolke et al., 2012). Driven by
the meteorological model, the chemistry transport
model MUSCAT treats the atmospheric transport as
well as chemical transformations for several gas phase
species and particle populations. The transport
processes include advection, turbulent diffusion,
sedimentation, dry and wet deposition.
The dynamics of the plume was analysed for different
situations, where rotating, alternating, retrograde, and
fast variable wind leads to very complex structures
like evasion of the mountains, advance into the fjords,
transport of former plume fractions, and oscillating
plumes. Not only the spatial resolution plays an
important role in a realistic simulation of the plumes, but also the (fast) temporal development of the meteorological
situation. Such changes, e.g. of the dynamic stability of the atmosphere, can occur abruptly, which necessarily affords an
online-coupled combined treatment of all processes as is implemented in the applied model system.
The nitramine concentrations modelled by the explicit MEA chemistry mechanism were compared with two simplified
schemes, which provide upper limits for the nitramine concentrations. In the first approach, the product of the OH-reaction
(see Figure 1) gives an upper limit. In the second approach, the branching by the NOx and O2 reaction pathways of the
product is also taken into account. As expected, the explicit mechanism produces the smallest concentrations.
Conclusions
The present dispersion model study has revealed that based on the available emissions and the meteorological, the proposed
guidelines for long-term exposure in air for MEA and also the total amount of nitrosamines and nitramines should be not
exceeded. The results might allow future evaluations of possible environmental impacts and human health effects of
pollutants emitted from CCS processes
Acknowledgement
This project was gratefully funded by the Technology Centre Mongstad (TCM, http://www.tcmda.com). Furthermore, the
ZIH Dresden and the NIC Jülich supported this work. We gratefully acknowledge the DWD Offenbach for good cooperation.
References
Wolke R, Schroder W, Schrodner R, Renner E (2012) Influence of grid resolution and meteorological forcing on simulated
European air quality: A sensitivity study with the modeling system COSMO-MUSCAT. Atmos Environ 53: 110-130.
Fig.1 COSMO and MUSCAT grids for the M3 model simulations.

251
MEASUREMENT OF AIR POLLUTANTS AND PROCESS
STUDIES

252

253
A TWO-YEAR STUDY ON URBAN PARTICLE NUMBER (0.3-10 µM) AND MASS CONCENTRATIONS (<10
µM): LEVELS IN TIME AND WEEKLY VARIATION
Dayana M. Agudelo-Castañeda(1), Elba C. Teixeira(1),(2), Ismael L. Schneider(1), Felipe N. Pereira(2)
(1) Postgraduate Program in Remote Sensing and Meteorology, Universidade Federal do Rio Grande do Sul. Av. Bento
Gonçalves, 9500, Porto Alegre, RS, 91501-970, Brazil, (2) Research Department, Fundação Estadual de Proteção Ambiental
Henrique Luís Roessler, Av. Borges de Medeiros, 261, Porto Alegre, RS, 90020-021, Brazil.
Presenting author email: [email protected]
Summary
This work presents measurements of particle number (size range 0.3-10 μm) and particle mass (PM10, PM2.5, PM1), in a site
near a major highway at the Metropolitan Area of Porto Alegre, south Brazil. Measurements were carried out during two
years: 2012 and 2013. Particle number and mass concentrations were measured using an optical counter with a PM10
analyzer. Results showed that concentrations of N0.3-1 (0.3-1 µm) were the highest, although similar to N1-2.5 (1-2.5 µm).
Daily variability of the analyzed pollutants followed the traffic pattern. Moreover, particle number was higher during the day,
whereas particle matter showed higher concentrations during nighttime. Traffic influence was evidenced by the mean
concentrations of weekends and weekdays, being higher for the latter.
Introduction
Emissions from gasoline and diesel fuelled vehicles remain the dominant source of atmospheric particle number in polluted
urban environments, and heavy duty vehicles contribute more than 50% of particle number and PM1 emissions (Keogh et al.,
2009). Current ambient air quality standards for controlling particulate matter pollution are mass-bases and restricted to PM2.5
and PM10, but may be ineffective for controlling fine particles from mobile sources, which are very numerous in terms of
their numbers, but have little mass (weight) (Tittarelli et al., 2008). For this reason, this work is part of an attempt to
investigate the variability of particle number in size ranges N0.3-1 (0.3-1 µm), N1-2.5 (1-2.5 µm), and N2.5-10 (2.5-10 µm) and
mass concentrations (PM10, PM2.5, PM1).
Methodology and Results
Sampling site was located in the Metropolitan Area of Porto
Alegre near the BR-116 and BR-290 highways, which are
characterized by heavy traffic. Particles were measured using
a PM10 analyzer model MP101M (Environnement) with an
optical particle counter. Particle number and particulate
matter were measured continuously at an average of 15-min
interval during two years: 2012 and 2013. Means of daily
concentrations of particle number N0.3-1, N1-2.5, and N2.5-10
may be observed in Figure 1. Particle number concentrations
were higher for the fine fraction: N0.3-1 and N1-2.5. Probably
because number concentration generally increases as the
radius decreases, thus the lower radius limit is of great
importance in specifying the total number concentration.
Table 1 shows the mean particle number and particle matter
during weekdays (Monday–Friday) and weekends (Saturday-
Sunday). In weekdays, particle number reached the highest
concentrations principally in N0.3-1 reflecting increased levels
of vehicular emissions in rush hours. Higher
weekday/weekend ratio for particle number concentrations
were obtained for finer particle fractions, revealing that
during weekdays, higher concentrations of fine particles
characterized by their smaller diameter occurred due to
primary emissions from motor vehicles.
Fig. 1. Time series of particle number (N0.3-1, N1-2.5, N2.5-10) daily
concentrations in the studied period.
Table 1. Means of particle number and mass concentration (PM1,
PM2.5, PM10) during weekdays (Monday–Friday) and weekends,
(Saturday-Sunday).
Conclusions
The evaluation and study of the two-year data set of measurements at an urban site highly impacted by traffic confirmed that
traffic is the main source to particle number, especially of fine particles: N0.3-1 followed by N1-2.5. Traffic influence was also
confirmed by the weekday/weekend ratio, which was > 1 for all analyzed pollutants.
Acknowledgement
We would like to thank FAPERGS and CNPq for financial support
References
Kulmala, M., Vehkamäki, H., Petäjäa, T., Dal Maso, M., Lauri, A., Kerminen, et al. (2004). Formation and growth rates of
ultrafine atmospheric particles: A review of observations. Journal of Aerosol Science, 35(2), 143–176.
PM10 PM2.5 PM1 N0.3-1 N1-2.5 N2.5-10
(µg·m-3) (Particles·L-1)
Weekday 44.83 15.36 1.49 4.95 4.21 1.64
Weekend 40.36 13.38 1.33 4.09 3.60 1.49
Ratio 1.11 1.15 1.12 1.21 1.17 1.10

254
ASSESSMENT OF IMPACTS OF COARSE AND FINE PARTICLES FROM BUILDING DEMOLITION WORKS
ON SURROUNDING AREAS
F. Azarmi (1), P. Kumar (1) (2)
(1) Department of Civil and Environmental Engineering, Faculty of Engineering and Physical Sciences, University of Surrey,
Guildford GU2 7XH, United Kingdom; (2) Environmental Flow (EnFlo) Research Centre, Faculty of Engineering and
Physical Sciences, University of Surrey, Guildford GU2 7XH, United Kingdom
Presenting author email: [email protected]
Summary
A series of fixed-site and mobile measurements of PM10 (≤10 μm), PM2.5 (≤2.5 μm) and PM1 (≤1 μm) around a building
demolition site were carried out during 54 hours over 7 days to assess their impact on the air quality in surrounding areas.
The objectives were to understand the emission characteristics of PM emissions from the demolition activities, their physical
and chemical characteristics along with estimating the occupational exposure of site workers during the activities. The
increase in PM concentrations at the downwind monitoring stations suggested a need to design more appropriate risk
mitigation strategies to limit exposures to onsite workers and people who live in the surrounding areas.
Introduction
Building demolition in both developing and developed world is a common activity. However, impact of particulate matter
(PM) emitted in coarse, fine and very fine particle size range from such activities, which contains a wide variety of toxic
organic substances and may adversely affect the respiratory health of nearby residents, is yet poorly understood (Kumar et
al., 2012; Azarmi et al., 2014). Considering this, we determined the impact of PM10, PM2.5 and PM1 arising from a range of
outdoor demolition activities works in the UK.
Methodology and Results
Measurements were made at a fixed-site in the downwind of the demolition site in the UK. Also were made mobile
monitoring around a building demolition site and at different distances (sequentially) in downwind of the demolition site to
assess the PM decay. A GRIMM (model 1.107E) particle monitor was used to measure PM10, PM2.5 and PM1 fractions in the
0.1–10 µm size range along with a portable weather station (KESTREL 4500) for measuring the meteorological data. The
results show that PM2.5-10 contributed about 89, 83 and 78% of total particle mass concentration during activity periods at
fixed-site, mobile and at different distances over the values obtained during the background (pre-activity) values (see Fig.1).
The findings for demolition activity present that exposure to PM10, PM2.5 and PM1 inside the building excavator cabin were
up to 37-, 8- and 37-times higher for than those during the local background exposure level, respectively. Moreover, the
monitoring station in downwind direction illustrated a logarithmic decrease in the distances away from the construction and
demolition site, with R2 about 0.9 in PM10, PM2.5 and PM1 concentrations (see Fig. 2). Energy-dispersive X-ray spectroscopy
(EDS) and scanning electron microscopy (SEM) were used also to find physicochemical features of particles and attribute
these species to their likely sources. These analyses showed the existence of the elements such as Ca, Si, Cu, K, S, Zn and Al
on the collected samples.
Conclusions Our findings clearly suggest an increase in PM concentrations in the nearby downwind areas and that these concentrations
follow a logarithmic decay profile in the downwind of the demolition site. The results also highlight a much greater
contributions of coarse particles (i.e., PM2.5-10) compared with fine particles (PM2.5) from demolition works. Further analysis
of the data is currently in-progress.
Acknowledgement
The authors thank the University of the Surrey and CARA for supporting this work.
References
Azarmi, K., Kumar, P., Mulheron, M., 2014. The exposure to coarse, fine and ultrafine particle emissions from concrete
mixing, drilling and cutting activities. Journal of Hazardous Materials 279, 268-279.
Kumar, P., Mulheron, M., Som, C., 2012. Release of ultrafine particles from three simulated building processes. Journal of
Nanoparticle Research 14, 771, doi: 10.1007/s11051-012-0771-2.
50%33%
17%
89%
5%
6%
PM 2.5-10
PM1-2.5
PM1
0
20
40
60
80
100
120
140
PM10 PM2.5 PM1
Activity Background PM10 = -13.57ln(x) + 104.59 (R² = 0.94)
0
20
40
60
80
100
0 20 40 60 80 100
PM
10
(µ
g m
-3)
y = -12.02ln(x) + 85.67 (R² = 0.85)
y = -2.45ln(x) + 19.33 (R² = 0.93)
y = -2.11ln(x) + 14.20 (R² = 0.84)
0
20
40
60
80
100
0 20 40 60 80 100
PM10
PM2.5
PM1
Log. (PM10)
Log. (PM2.5)
Log. (PM1)
y = -12.02ln(x) + 85.67 (R² = 0.85)
y = -2.45ln(x) + 19.33 (R² = 0.93)
y = -2.11ln(x) + 14.20 (R² = 0.84)
0
20
40
60
80
100
0 20 40 60 80 100
PM10
PM2.5
PM1
Log. (PM10)
Log. (PM2.5)
Log. (PM1)
Downwind horizontal distance (m)
Fig.2 Decay of PM10 concentrations with the distance (in
meter) in the downwind direction of demolition site.
Fig.1 The concentrations of coarse, fine and very fine
particles at fixed site during demolition activity.

255
EVALUATION OF ARTIFACTS AFFECTING COLLECTION OF AIRBORNE PAHS
C. Balducci (1), A. Febo (1),M. Perilli (1), P. Romagnoli (1), A. Cecinato (1), C. Tortorella (2), S. Iacobellis (2)
(1) Italian National Research Council, Institute of Atmospheric Pollution Research, Monterotondo (RM), 00015, Italy; (2)
Enel Engineering and Research S.p.A., Tuturano - Brindisi, 72020, Italy
Presenting author email: [email protected]
Summary
Extensive laboratory experiments have been carried out aimed at determining the aftermaths of volatilization and oxidation
on atmospheric PAHs during the sampling phase. Eleven congeners were investigated, and implemented procedures allowed
to assess losses distinctly associated to each of the two processes. Results show that the good practices application during the
sampling phase is mandatory to assess the real PAH impact on health as well as emission sources affecting the study areas.
Introduction
Polycyclic aromatic hydrocarbons (PAHs) are organic compounds whose structure is formed by two or more condensed
aromatic rings and are produced by every combustion process. Due to the ascertained carcinogenicity of many congeners,
Directive 2008/50/EC regulates the PAH atmospheric concentrations. In particular, the concentration limit of benzo[a]pyrene
(BaP) in PM10 is fixed to 1 ng m-3 (mean over a calendar year) and six other congeners must be monitored in order to assess
the respective importance with regards to ambient air toxicity. The PAH determination in PM is affected by biases up from
the collection step. In fact, being semi-volatile they can evaporate from the filter, stripped by the air flow. Moreover, PAHs
can be decomposed by atmospheric oxidants such as ozone. These phenomena can result into significant losses that
undermine the representativeness of collected PAHs with regards to air composition. In the framework of the implementing
collection devices and procedures able to minimize the PAH sampling artifacts, important laboratory experiments have been
carried out in order to evaluate distinctly the effects of volatilization and oxidation on each of PAH compounds.
Methodology and Results
Twin pairs of samples were obtained by using a Hydra dual
sampler modified for the purpose. Filters for the particulate
collection were simultaneously exposed over 48 hours at a
flow rate equal to 2.3 m3/h, during the winter season. After
sampling one filter of each pair was analyzed, the latter was
treated to investigate oxidative degradation or volatilization
suffered by PAHs. To determine oxidative degradation
(ageing), filters were tested with an air flow spiked with
known concentrations of ozone; in this case, the losses due
to volatilization were minimized through using flow rates
one order of magnitude lower than those used in in-field
tests and the time of exposure was reduced to one hour.
Three ozone levels were chosen, i.e. 0.4 0.8 and 1.2 ppm*h.
To assess volatilization from filters, the second filter was
exposed to another sampling cycle (48h, 2.3 m3/h) at 19±2
°C. An absolute filter was located upstream of the PM-
loaded filter in order to allow zero air crossing the sample
and, by consequence, putting in the evidence the neat effects
of PAH stripping and evaporation.
Volatilization generated losses from negligible (e.g.,
indeno[1,2,3-cd] pyrene) up to 55% (benzo[a]anthracene),
while the benzo[a]pyrene losses associated to oxidative
degradation could exceed 50%.
Conclusions
Concerning the oxidative degradation, especially the BaP losses can
lead to underestimate the environmental toxicity associated to PAHs,
while differences between the congeners in the volatilization or in
the reactivity to ozone can originate differences between the real distribution pattern of PAHs in the atmosphere and those in
the collected samples. This phenomenon must be adequately taken in account whereas the statistical multivariate approach is
applied to determine the emission sources affecting any study area.
References
Brown R.J., Brown A.S., 2013. Assessment of the effect of degradation by atmospheric gaseous oxidants on measured annual
average benzo[a]pyrene mass concentrations. Chemosphere 90, 417-422.
Fig.2 Effects of oxidative degradation on PAHs
sampling
Fig.1 Effects of volatilization on PAHs sampling

256
CFD-URANS PREDICTION OF DOSAGE-BASED PARAMETERS FROM SHORT-TERM RELEASES (PUFFS)
OF HAZARDOUS AIRBORNE MATERIALS
J.G. Bartzis (1), G.C. Efthimiou (2) and S. Andronopoulos (2)
(1) University of Western Macedonia, Dept. of Mechanical Engineering, Sialvera & Bakola Str., 50100, Kozani, Greece; (2)
Environmental Research Laboratory, INRASTES, NCSR Demokritos, Patriarchou Grigoriou & Neapoleos Str., 15310, Aghia
Paraskevi, Greece
Presenting author email: [email protected]
Summary
One of the key issues of recent research on the dispersion inside complex urban areas is the ability to predict dosage-based
parameters of an airborne material which is released many times and consecutively under short time durations (puffs) from a
point source. The present work addresses the question whether the Computational Fluid Dynamics (CFD) - Unsteady
Reynolds Averaged Navier Stokes (URANS) methodology can be used to simulate such a complex phenomenon. The whole
effort is focused on the prediction of various key dosage-based parameters inside a complex real urban area. The capabilities
of the proposed methodology are validated against wind tunnel data. Sensitivity analysis for the turbulence closure modeling
is also performed. The reference data set was compiled by members of COST Action ES1006. The provision of reference
data is gratefully acknowledged.

257
CUSTOM MADE DUST MONITOR EQQUIPED WITH FAST GPS MODULE AND INTERNET CONNECTION
J. Bartyzel (1), L. Chmura (1,2), M. Galkowski(1), J.M. Necki (1), M. Zimnoch (1), K. Rozanski (1)
(1) AGH University of Science and Technology, Faculty of Physics and Applied Computer Science, al. Mickiewicza 30, 30-
059 Krakow, Poland; (2) Institute of Meteorology and Water Management, National Research Institute, IMGW-PIB, Branch
of Krakow, Piotra Borowego 14, 30-215 Krakow, Poland;
Presenting author email: [email protected]
Summary
In Krakow city, where the air pollution is the common problem there is a dire need to evaluate the sources of air polluting
dust particles. A lot of remedial programs are implemented. To optimise investment of social funds, precise information
about pollution sources are required. To meet this needs, custom made particulate matter monitor was build basing on
commercially available analyser. System capabilities allow to made mobile dust air pollution measurements with precise
positioning.
Introduction
Krakow air quality belongs to one of the lowest in Europe (EEA Report No 5/2014). Mostly in winter months dust particles
concentration in air exceed relevant norms indication several times. For many years there has been a debate about the sources
of air pollution in the City. As the main source of dust particles some scientists indicate road traffic, other coal burning in
households or industry. There are many analytical methods to identify dust sources, for example IRMS or PIXE. In this study
it was decided to approach of the problem from a different angle. Campaigns with mobile equipment was designed to cover
area of the Town centre, suburbs as well as a background of the City.
Methodology and Results
Custom made dust monitor was build based on TSI Dust Track II
8530 aerosol monitor (A) with analyser basing on measurement of
scattered laser beam intensity. Additional equipment including fast
GPS (5Hz) (B), GSM module (C), sample heater (D), external data
logger (C) and power supply working with 230V AC and 12V DC
(E) was combined to the full setup mobile device. Setup is able to
work as a stationary monitor powered with 230V AC or it can be
supplied with 12V DC car socket to be used in mobile campaigns.
Fast GPS module was used to precise positioning of the
measurement and subsequently to identify particulate matter source
location. Received data can be continuously previewed online by the
GSM data connection. To avoid interference of the liquid fraction of
the aerosol sample inlet was heated to stabilise the temperature of
intake line over the dew point. Setup was built on order and thanks to
funding of Krakow Smog Alert (KSA)
To justify the setup reliability and feasibility in
different weather conditions after the gravimetric
calibration the equipment was used in parallel
measurement campaign with certified instrument
according to PN-EN 14907 provided by the
Voivodeship Inspectorate for Environmental
Protection Agency. Typical test length was 72
hours, results were presented on figure 2. Hourly
mean differences were not greater than 5% of
measured value.
Conclusions
Precise, accurate and resistant to weather
conditions dust measurement system was
performed. Possibility to supply by 12V and fast
response allow to use in mobile measurements. The
comparisons performed with the reference methods
allow to use mobile system to elaborate the map of
dust pollution in the city of Krakow and to have a
try to evaluate sources of the pollution.
Acknowledgement
Voivodeship Inspectorate for Environmental Protection [http://www.krakow.pios.gov.pl/]
Krakow Smog Alert [http://www.krakowskialarmsmogowy.pl/en/]
Statutory funds of AGH University of Science and Technology
A
B
C
D E
Fig. 1. Explanatory figure of dust monitoring
custom made device.
Fig. 2. Parallel measurement of PM2.5 at EPA (Inspectorate for
Environmental Protection Agency) (in black) and Dust Trak monitor (in
blue). Round points indicates hourly means. Solid lines connects individual values.

258
DETERMINANTS OF PERSONAL EXPOSURE TO BLACK CARBON IN STOCKHOLM TRAFFIC
G. Bero Bedada(1), N. Andersson(1),T. Bellander(1,2), A. Georgellis(1,2), I. Sagán(1,2), C. Johansson (3,4), A. Merritt(1,2)
(1) Institute of Environmental Medicine, Karolinska Institutet, Stockholm, Sweden, (2) Centre for Occupational and
Environmental Medicine, Stockholm County Council, Sweden, (3) Environment and Health Administration, Stockholm,
Sweden, (4) Department of environmental science and analytical chemistry, Stockholm university, Stockholm.
Presenting author email: [email protected]
Summary
This study aims to identify the role of traffic and travel mode on personal black carbon (BC) exposure in Stockholm.
Personal BC was measured by a portable Aethalometer, on four busy streets in central Stockholm, in the morning, midday
and late afternoon using various travel modes (bus, cycling, car and on foot). The study identified background pollutants,
meteorology and travel mode to be the most important determinants of personal BC. Those travelling by bus were exposed to
higher BC concentrations in the ambient air than those using other travel modes. The personal BC concentration was on
average 3.4 times higher than urban background levels.
Introduction
Epidemiological studies have documented associations between BC exposure and various adverse health outcomes including
arrhythmias (1) and decrease in lung function (2). Although BC and other carbonaceous fractions are minor components of
PM2.5, studies have also shown that the carbonaceous fraction of PM is more strongly associated with adverse health effects
than the total PM2.5 mass (3), yet BC is normally not monitored routinely. The transport microenvironment is a key
contributor to total personal exposure4 and concentrations measured at background monitoring stations substantially
underestimate personal exposure to BC and other traffic related pollutants (4). The aim of this study was to identify the role
of traffic and travel mode on personal exposure to BC in Stockholm.
Methodology and Results
Personal BC was measured using a portable Aethalometer (MicroAeth Model AE51, AethLabs, San Francisco, CA, USA) in
two measurement campaigns (Jan 21-May 8 and Sep 16-Oct 24, 2013). The campaigns were undertaken during XX weeks,
along four inner-city streets during morning and afternoon traffic peak hours and at midday for 2 hours, respectively. The
measurements were performed using four transport modes; walking, cycling, bus and car. A linear regression was applied
using personal BC concentration as an outcome and predictors were pollutants from a background monitoring station (BC,
PM2.5, coarse particles and NOX), weighted daily traffic, and meteorology (wind speed, wind direction, temperature,
humidity, rain fall and global radiation). Average personal BC concentration during the study period was 2.29 µg/m3 (range:
0.03 to 37.19) while the background BC concentration averaged 0.67 µg/m3 (range: 0.07 to 6.09). Travelling by bus resulted
in the highest personal BC levels in the ambient air (2.69 ng/m3), while walking had the lowest concentrations (1.70 µg /m3).
BC concentrations were highest in the morning rush hours, followed by midday. Personal BC was moderately and positively
correlated with PM2.5 and BC from central monitors and negatively correlated with wind speed. In the regression analysis,
background pollutants (BC, PM2.5 and coarse PM), global radiation, temperature and humidity had significant positive
relationships with personal BC while wind speed had a significant negative relationship.
Conclusion
The level of personal BC is more than 3 times higher than the background level in this study, which implies that the use of
central monitors for traffic related pollutants is not fully representative of personal exposure. Background pollutants
(especially BC, PM2.5 and coarse PM) and meteorological parameters were important determinants of personal BC.
Acknowledgement
The study was supported by the Stockholm County Council.
References
Dockery DW, Luttmann-Gibson H, Rich DQ, Link MS, Mittleman MA, Gold DR, Koutrakis P, Schwartz JD, Verrier RL.
Association of air pollution with increased incidence of ventricular tachyarrhythmias recorded by implanted cardioverter
defibrillators. Environ.Health Perspect. 2005;113(6):670-674.
Suglia SF, Gryparis A, Schwartz J, Wright RJ. Association between Traffic-Related Black Carbon Exposure and Lung
Function among Urban Women. Environmental Health Perspectives 2008;116(10):1333-1337.
Bell ML, Ebisu K, Peng RD, Samet JM, Dominici F. Hospital admissions and chemical composition of fine particle air
pollution. Am J Respir Crit Care Med 2009;179(12):1115-20.
Kaur S, Nieuwenhuijsen MJ, Colvile RN. Fine particulate matter and carbon monoxide exposure concentrations in urban
street transport microenvironments. Atmospheric Environment 2007;41(23):4781-4810.

259
PARTICULATE MATTER MEASUREMENTS AT KASPROWY WIERCH MOUNTAIN STATION
AND ZAKOPANE CITY IN SOUTHERN POLAND – PRELIMINARY RESULTS
L. Chmura (1,2), J. Bartyzel (2), M. Zimnoch (2), J. Necki (2), M. Galkowski (2), D. Zieba(2), K. Rozanski (2)
(1) Institute of Meteorology and Water Management, National Research Institute, IMGW-PIB, Branch of Krakow, Piotra
Borowego 14, 30-215 Krakow, Poland; (2) AGH University of Science and Technology, Faculty of Physics and Applied
Computer Science, al. Mickiewicza 30, 30-059 Krakow, Poland
Presenting author email: [email protected]
Summary
In 2015 the particulate matter measurements was lunched at Kasprowy Wierch in Tatra Mountains. First, preliminary results
were compared to similar measurements provided by the Voivodeship Inspectorate for Environmental Protection Agency in
Zakopane City, located in the valley at the base of Tatra Mountains. Poster presents obtained results of this comparison.
Introduction
Kasprowy Wierch is a high-altitude meteorological station established in 1938 in north-western High Tatra mountain ridge,
Western Carpathians (49°14’N, 19°59’E, 1989 m a.s.l.), named after the peak on which the laboratory building is located. As
the station is situated in the convergence area of three large valleys, approximately 300m above the tree line, anabatic and
katabatic wind events are frequently observed. Wind statistics available for the station indicate prevalence of southerly and
north-easterly wind directions, caused by two of the valleys originating from Kasprowy Wierch summit (Gąsienicowa valley
and Dolina Cichej valley) channelling the air masses in these directions.
The nearest town is Zakopane located 6km to the north and about one kilometer below Kasprowy Wierch. This is the most
famous mountain holiday resort in Poland. Therefore the number of people residing in the Podhale region increases even
several times during the summer and winter holidays. In Zakopane and surrounding villages dominates low housing
construction, and homes in the vast majority are still heated by coal or wood stoves. Therefore, relatively large anthropogenic
emissions of PM1, PM2.5 and PM10 occurs in this region, especially during the winter months.
Methodology and Results
DustTrak™ II Aerosol Monitor 8530 was used
to measure size fraction of particulate matter
using light-scattering laser photometry
technique. The precision of this analytical
method is on the level of ±1µg/m3. Sample
inlet system was modified to provide reliable
measurements in extremely difficult conditions
(frequent freezing drizzle, high humidity and
high wind speed). Prior to measurement the
sample is heated to eliminate liquid fraction
interference in measurement chamber. Monitor
was installed at Kasprowy Wierch station in
June 2015 and it was settled to measure
fraction PM2.5. It is first available record of
particulate matter concentration measurements
in the air of Polish Carpathians Mountains.
Before installation DustTrak™ monitor was
gravimetric calibrated and subsequently
parallel measurements with normalized instrument according to PN-EN 14907 Polish National Standard was performed.
Parallel to the measurements at Kasprowy Wierch, continues monitoring program was conducted at the center of Zakopane
City. Data record was provided by the Voivodeship Inspectorate for Environmental Protection Agency.
During the measurement period the highest PM2.5 concentration level at Kasprowy Wierch was 40µg/m3, while in Zakopane
City it exceeded 80µg/m3. Relatively frequent temperature inversions and poor ventilation, observed inside this valley, can
induce accumulation of particulate matter originating from the so-called low emission in the lower troposphere. Usually
Kasprowy Wierch atmosphere is depleted in particulate matter (on average 25% less then in Zakopane city), however
occasionally opposite vertical gradient is observed. An example of episode of parallel measurements is presented on fig.1.
Conclusions
During the period of observations mean daily average value of PM2.5 was significant higher in Zakopane city then at
Kasprowy Wierch (15.2µg/m3 compared to 11.4µg/m3). Short time variability of PM2.5 at Kasprowy Wierch was at the level
of 6µg/m3 while Zakopane city record reviled 13µg/m3.
Acknowledgment
Voivodeship Inspectorate for Environmental Protection [http://www.krakow.pios.gov.pl/]
Krakowski Alarm Smogowy [http://www.krakowskialarmsmogowy.pl/en//]
Statutory funds of AGH University of Science and Technology
Fig.1. Parallel measurement of PM2.5 at Kasprowy Wierch (in red) station and in
Zakopane city (in black). Individual points indicates hourly means. Solid lines
connects daily mean values.

260
AIR POLLUTION ANALYSIS AND DEPENDENCE ON METEOROLOGY IN KLAIPĖDA CITY
A. Dėdelė (1), A. Miškinytė (1), M. Vilkaitė (1)
(1) Department of Environmental Sciences, Vytautas Magnus University, Vileikos Street 8, 44404 Kaunas, Lithuania
Presenting author email: [email protected]
Summary
The aim of this study was to analyze the changes of air quality in Klaipėda city and to assess the impact of meteorological
factors to the dispersion of air pollutants in Klaipėda city. The data from two automatic air quality monitoring stations and
the meteorological data from shore meteorological station were used in this study. The seasonal variation of nitrogen dioxide
(NO2), particulate matter (PM10) and carbon monoxide (CO) was analysed. The assessment of meteorological factors on the
dispersion of air pollutants showed a moderate, negative, statistically significant correlation between CO and temperature,
NO2 and wind speed and between PM10 and temperature.
Introduction
Air pollution is rapidly growing environmental problem in many countries and poses a threat not only to human health, but to
the natural environment as well (Han, Naeher, 2006; Marshal et. al., 2005; Yanga et. al., 2015). Weather and ambient air
quality synergistically influence human health and its condition. Therefore, it is important to observe, determine and predict
the air quality and its variability in time in order to avoid and prevent health problems (Cakmak et al., 2006).
Methodology and Results
The object of this study was air pollution of NO2, PM10 and CO in Klaipėda
city. The data were obtained from two automated air quality monitoring
stations, one of them is located in the city center and other is placed in Šilutė
highway. The seasonal analysis of air pollutants was performed. In order to
assess the influence of meteorological parameter on the dispersion of air
pollutants, the data of wind speed, air temperature and relative humidity
were used from Klaipėda Meteorological Station. The statistical analysis
was performed uing SPSS software. The results of this study showed that the
highest concentration of NO2 in Šilutė highway station was determined in
the spring 27.2 µg/m³, while in Center station it was observed in the winter
18.5 µg/m³ (see Fig.1). The lowest concentration of NO2 was observed in
the summer in both monitoring stations. Šilutė highway station represents
the air pollution arising mainly from traffic, while Central station represents
the air pollution from residential households and industry. PM10 was
observed in the spring (see Fig.2). The concentration of PM10 was 40.8 and
38.5 µg/m³ in Center station and in Šilutė highway station. The lowest
concentration of PM10 was found in Central station 23.1 µg/m³, while in
Šilutė highway station it was 26.6 µg/m³. The highest concentration of CO
was observed in the winter; in Šilutė highway station it was 0.39 mg/m³ and
in Center monitoring station it was 0.35 mg/m³ (see Fig.3). The lowest CO
level of 0.23 and 0.16 mg/m³ was determined in summer season,
respectively in Šilutė highway and in Central stations. The correlation
analysis revealed that there is a moderate negative statistically significant
relationship between CO and temperature (r = -0.55; p = 0.00), between NO2
and wind speed (r = -0.47; p = 0.00), and between PM10 and temperature. (r
= -0.33; p = 0.00).
Conclusions
Air pollution is an important environmental issue in urban areas, which
causes human health effects. Meteorological processes and conditions have
the influence on the occurrence of high pollution episodes; therefore,
understanding the effect of meteorological parameters on air pollution can
help to predict the future concentrations of air pollutants and to reduce the
air pollution in the cities.
References
Han X., Naeher L., P., 2006. A review of traffic-related air pollution exposure assessment studies in the developing world.
Environment International 32, 106–120.
Marshall J., Mckone T., E., Deakin E., Nazaroff W., 2005. Inhalation of motor vehicle emissions: effects of urban population
and land area. Atmospheric Environment, 39 (2), 283–295.
Yanga Y., Caob Y., Lia W., Lic R., Wanga M., Wua Z., Xua Q., 2015. Multi-site time series analysis of acute effects of
multiple air pollutants on respiratory mortality: A population-based study in Beijing. China Science of The Total
Environment, 508, 178–187.
Cakmak S., Dales R., E., Jedek S., 2006. Respiratory health effects of air pollution gases: modification by education and
income. Occupational and Environmental Health, 61, 5–10.
Fig.3 The seasonal variation of CO
concentration (µg/m3) in Klaipėda city
Fig.1 The seasonal variation of NO2
concentration (µg/m3) in Klaipėda city
Fig.2 The seasonal variation of PM10
concentration (µg/m3) in Klaipėda city

261
MODELLING HIGH RESOLUTION PM1 INDOOR CONCENTRATIONS USING CONTAM MODEL
C. Gariazzo (1), A. Pelliccioni (1), R. Ferrante (1), G. Cattani (2)
(1) INAIL-Research Center, Via Fontana Candida 1, 00040, Monteporzio Catone (RM), Italy; (2) ISPRA, Italian National Institute for Environment Protection and Research, Rome, Italy
Presenting author email: [email protected]
Summary
This study aims to assess the ability of CONTAM multi zone model in reconstructing high-resolution PM1 indoor
concentrations in residence houses and to evaluate at what extent the deposition and penetration processes contribute to the
overall reconstruction of the indoor particles number.
Introduction
Outdoor pollutants exhibits different abilities in penetrating into indoor depending of the type of pollutant (gaseous or
aerosol), building characteristics and its ventilation mechanisms. Infiltration factors based on contemporary I/O
measurements can estimate the penetration factors, but lack of information on key parameters such as air exchange rate, type
and characteristic of air leakages in indoor environment, does not allow analysing their contribution to final indoor
concentration. A modelling approach, able to simulate all the above impacts, is a possibility in the understanding of related
phenomena.
Methodology and Results
A field campaign to measure PM1
particles number concentrations in both
outdoor and indoor environments has
been carried out in a residential house
located in Rome, Italy. Two TSI 3007
condensation particle counter were used
for particles measurements. Windows and
doors were kept close during the test
experiment. As for meteorology, wind
speed and direction were measured by
means of a sonic anemometer located on
the terrace of the hosting building. Both
particles and meteorology data were
collected at one-minute time resolution
from 9am to 2pm. The multi-zone air
movement and contaminant transport
program CONTAM (Walton and Dols,
2005) was used for indoor modelling.
CONTAM is an established simulation
tool for predicting airflows and contaminant concentrations in multi-zone building airflow systems. The layout of the
apartment was model reconstructed. The leakage values for the various building components were used as model inputs to
represent the interconnectivity between outdoor and indoor spaces. The time-varying ambient weather data and outdoor PM1
concentrations were also used as inputs to calculate the temporal airflow and indoor PM1 concentrations in each of the
building zones. Indoor concentrations were simulating by including deposition and penetration factors. Figure 1 shows a time
series of observed and modelled indoor PM1 concentrations including or excluding deposition and penetration processes. In
can be seen that without the inclusion of these processes the model is far to reproduce the observed indoor particles
concentration. It is worth to notice the strong variability of observed outdoor concentration, the attenuated and delayed indoor
one and the model inability to reproduce these indoor variations, although the baseline behaviour is well reconstructed.
Conclusions
CONTAM simulations and experimental studies were performed for a residential test apartment. The results show that the
model needs to consider both size-resolved deposition and penetration to predict accurately the time-varying particle
concentrations in buildings. Particle deposition and penetration have significant effects in the model prediction. The model
validation indicates that CONTAM model can provide insight into the general trend of PM1 entry into buildings.
Acknowledgement
This work was supported by INAIL research funds.
References
Walton, G.N., Dols, W.S., 2005. CONTAM 2.4 User Guide and Program Documentation. National Institute of Standards and
Technology, Gaithersburg, MD.
Fig.1 Time series of observed and modelled indoor PM1 concentrations

262
MODELLING THE OZONE CONCENTRATION OVER MEDITERRANEAN MBL: ESTIMATION OF SHIP
EMISSIONS IMPACT
C. N. Gencarelli (1), F. De Simone (1), F. Carbone (1), I. M. Hedgecock (1), F. Sprovieri (1) and N. Pirrone (2)
(1) Division of Rende, CNR-Institute of Atmospheric Pollution Research, Rende 87036, Italy; (2) CNR-Institute of
Atmospheric Pollution Research, via Salaria km 29,300, Monterotondo 00015, Italy
Presenting author email: [email protected]
Summary Ozone concentrations in the Mediterranean area regularly exceed the maximum levels set by the EU Air Quality Directive
(2008/50/CE, a maximum 8-h mean of 120 µg·m−3) in the summer, with consequences for both human health and
agriculture. The particular geographical and meteorological conditions in the Mediterranean influences these high values, as
do anthropogenic ozone precursor emissions from around the Mediterranean and continental Europe. The WRF/Chem model
has been used to simulate tropospheric chemistry during the periods of the measurement campaigns in order to estimate the
contribution of maritime traffic in the Mediterranean to the anthropogenic emissions inventory. The differences in the model
output suggest that, in large parts of the coastal zone of the Mediterranean, ship emissions contribute to 5% and 15% to
ground level daily average ozone concentrations.
Introduction The Mediterranean Basin has a number of characteristics that favor Boundary Layer (BL) ozone formation, especially in the
summer. During the summer, the Mediterranean is under the descending arm of the Hadley circulation and, therefore, enjoys
long periods of anticyclonic weather, with high temperatures and intense sunshine. These conditions favor both ozone
formation and the natural production of VOC. The presence of major urban and industrial centers on the coasts and the
general north to south BL flow mean that anthropogenic ozone precursors are abundant. Elevated concentrations of ozone
have been observed at inland sites, coastal sites and during intensive field campaigns, as during measurements over the sea,
performed on-board the Italian Research Council’s R. V. Urania (Gencarelli et al., 2014).
Methodology and Results Measurements from six oceanographic campaigns (Med-
Oceanor, Sprovieri et al., 2003) and from EMEP network
monitoring stations have been used for validate the
modeled ozone concentrations.
Three model domains were used to model each
oceanographic campaign period to include the area
covered by the oceanographic campaign. Anthropogenic
emissions were obtained from the EMEP CEIP,
considering their specificity to the European region and
their availability for individual years. Versions of the
emission inventory for the years of oceanographic
campaigns were prepared in which all of the SNAP sector
8 emissions over the Mediterranean Sea were removed
(No_ships simulations). Comparing these model values
with Tot_emiss simulation it was possible estimate the
influences of ship emissions on Mediterranean basin and
surrounding areas (Fig. 1).
Conclusions Ship emissions mostly influence marine and coastal areas as a result of the low summer time Mediterranean MBL height and
the steepness of much of the Mediterranean coastline. However, the simulations with and without ship emissions showed
differences in ozone tens and even hundreds of km inland over the flatter coastal areas of North Africa. This suggests that
ship emissions could contribute to the ozone budget above the boundary layer, where, due to its role as a short-lived climate
forcer, it may have an impact on the regional radiation budget. Along the routes taken by the R.V. Urania, the simulations
indicate that ship emissions may contribute to the exceedance of the EU 8-h average concentration limit of 120 μg·m−3 .
Acknowledgement The authors gratefully acknowledge the financial support received from the GMOS (Global Mercury Observation System)
project, European Commission Seventh Framework Programme, ENV.2010.4.1.3-2
References Sprovieri, F.; Pirrone, N.; Gårdfeldt, K.; Sommar, J. Mercury speciation in the marine boundary layer along a 6000 km cruise path around
the Mediterranean Sea. Atmos. Environ. 2003, 37, 63–71. CN Gencarelli, IM Hedgecock, F Sprovieri, GJ Schürmann, N Pirrone, 2014. Importance of ship emissions to local summertime ozone
production in the mediterranean marine boundary layer: a modeling study. Atmosphere 5 (4), 937-958
Fig.1 The difference (ppb) in the ozone concentrations between the
Tot_emiss and No_ships simulations.

263
EXAMINATION OF THE SPATIAL DISTRIBUTION AND TEMPORAL VARIATION OF BLACK CARBON IN
SANTIAGO DE CHILE
E. Gramsch (1), F. Pardo (1), P. Oyola (2), and P. Pérez (1)
(1) Physics Department, University of Santiago de Chile, Av. Ecuador 3493, Santiago, Chile; (2) Centro Mario Molina
Chile, Antonio Bellet 292, Of 602, Providencia, Santiago, Chile
Presenting author email: [email protected]
Summary
In this study we have examined the black carbon (BC) data generated by a network of 6 stations in the years 2013 and 2014
in order to determine the spatial distribution and trends of this pollutant over a 6 month period each year. All but one station,
show a peak in BC at 8:00 indicating that during the rush hour there is a strong influence from traffic, however, this influence
is not seen during the rest of the day. In one section of the city, the BC concentration is related to transport from other
sections, while in the other section, BC is mostly related to emission from local sources. Cluster analysis was applied to the
data, and the results indicate that the city has four large sectors with similar pollution behaviour related to its location on the
city and to the origin of BC.
Introduction
During winter, it is common to observe an increase in the number of children’s hospitalizations due to respiratory diseases
following pollution events (Ostro et al., 1999), even an increase in daily mortality was observed (Cakmak et al, 2009).
Particle mass (PM2.5) and BC concentration are very high the western part of Santiago (Pudahuel, Quilicura). However, it is
very difficult to determine if these concentration levels are due to pollution transport from other parts of the city or local
emissions. This information is needed so that for authorities can make better informed decisions regarding pollution control
measurements. Considering this, an array of BC monitors was installed in order to determine BC temporal trends and its
spatial distribution over the city.
Methodology and Results
The measurements were made from April to November of
2013 in five sites and from May to November in other five
sites in 2014. The sampling sites are shown with an in Figure
1. Black carbon was measured with a low-cost instrument
(SIMCA) instrument developed at the University of Santiago.
The instrument measures the light absorption in a filter to
obtain BC concentration every 15 min. The stations towards
the east of the city (Huechuraba, Cerro and Puente Alto) show
lower dependence on direct emissions from traffic and higher
influence from transport of pollution from other parts of the
city. The stations on the west (Pudahuel and Quilicura) show
higher influence from local emissions and lower influence
from transport. At the same time these stations have very high
night level of BC. Cluster analysis of the data shows that the
stations form groups related to its location on the city and to
the origin of BC.
Conclusions
The results show one sector of the city with pronounced BC
concentration located in the west of the city. BC in this sector is also
related to local emissions rather than transport from other parts of the city. The eastern side of the city has lower BC levels
which, in turn are related partly to transport from other parts of the city and partly to local emissions. These results indicate
that in cities like Santiago, policies to reduce pollution have to consider local sources as well as transport from other parts of
the city.
Acknowledgement
This work was supported by Fondecyt, project Nº 1120672. We acknowledge Miguel Concha, Francisco Marín and Vanessa
Estroz for their help during sampling and analysis.
References
Ostro, B.D., Eskeland, G.S., Sanchez, J.M., Feyzioglu, T., 1999. Air pollution and health effects: A study of medical visits
among children in Santiago, Chile. Environmental Health Perspectives 107 (1), 69–73.
Cakmak S, Dales RE, Gultekin T, Blanco C., Fernandez M, Rubio MA, Oyola P. 2009, Components of particulate air
pollution and emergency department visits in Chile. Arch Environ Occup Health. 64(3):148-55
Fig.1 Measurement sites in Santiago
Usach
Parque
O'Higgins
Pudahuel
Quilicura
Cerro
Puente
AltoSan Bernardo
Huechuraba

264
HEAVY METAL EXPOSURE SOURCE IDENTIFICATION AND HEALTH IMPACT ASSOCIATED WITH
INDOOR PARTICULATE MATTER (PM10 & PM2.5) -A STATISTICAL ANALYSIS
Alfred Lawrence*, Tahmeena Khan, Seema Joshi
Department of Chemistry, Isabella Thoburn College, Lucknow, India Presenting author email: [email protected]
Summary-
The study was conducted in Lucknow city which is the third most polluted city of India to assess Indoor Air Quality (IAQ) in
urban houses by monitoring PM10 & PM2.5 from March ’13 – Feb’14. Sixteen houses were characterized in four different
microenvironments i.e. Well planned, Densely populated, Roadside and Livestock. Particulate concentration was found to
exceed than the WHO limit in each microenvironment. Fe, Zn, Cu, Pb, Mn, Ni and Cr were also analyzed in PM10 and PM2.5
samples. Fe was most and Cd was least abundant metal found in indoor environment. Major source responsible for heavy
metals indoors were house dust, fuel combustion and re-suspended outdoor dust. Occupants exposed to sudden elevated level
of particulate concentration complained more respiratory problems.
Introduction- In developing countries like India with the fast growing urbanization and development air quality is getting deteriorated at a
fast pace. With the sharp rise in the number of vehicles more research awareness should be implemented to control pollution
level, especially of the particulate pollutants, as increase in number of vehicles causes more emission of pollutants and also
changes the composition ratio of the pollutants especially the particulate matter (Lawrence et. al., 2013), which includes fine
and ultrafine particles. As In developing countries with warm climate ventilation is largely natural, the quality of indoor air
largely depends on the quality of the external environment. Most of the researches are still focused on outdoor pollution
management, lesser attention has been paid on indoor air quality specially in Northern India. The purpose of the study was to
present a clear picture of indoor air quality in urban city houses.
Methodology and Results-
Sixteen urban houses were selected for monitoring. RSPM- PM10 & PM2.5 were assessed through full day monitoring. PM10
and PM2.5 were measured using APM-550 Fine particulate Sampler (Envirotech) at a flow rate of 1m3/hr controlled by
critical orifice. The yearly average concentration (μg/m3) of PM10 and PM2.5 were 72 and 49 for well planned, 97 and 60 for
densely populated, 112 and 76.4 for roadside and 68 and 52.42 for livestock microenvironments respectively. The values
were higher than the WHO limits, highest for roadside houses. Fe, Zn, Cu, Pb, Mn, Ni and Cr were analyzed in PM10 and
PM2.5 samples. Fe was most and Cd was least abundant. A correlation was done among metals using SPSS 11 in order to find
common sources of these metals. Pb with Mn, Fe with Cr, Zn with Ni and Cr, Ni with Cr, Mn with Fe and Cu with Cr
showed significant positive correlation either at p<0.05 or p<0.01 level. Pb, Mn, Cr (p<0.01) and Cu (p<0.05) showed
positive correlation with PM10. Pb, Ni, Cr and Mn associated with PM2.5 samples showed positive correlation in roadside
microenvironment. Source identification of heavy metals was done through varimax rotated factor analysis. Three main
factors were analyzed in each sample representing the major sources of metals indoors. Major sources identified were house
dust, fuel combustion and re-suspended outdoor. Occupants exposed to sudden elevation in PM10 concentration reaching up
to 199 µg m3 and 169 µg m3 for PM2.5 complained more respiratory problems. Irritation of eyes was a common symptom for
concentration 148 µg m3 for PM10 and 122 µg m3 for PM2.5.
Conclusions-
The conducted study gave a clear insight of the indoor air quality in urban houses of Lucknow city. Concentration of RSPM
was found to be considerably making the exposed population more vulnerable for COPD, asthma, pulmonary tuberculosis,
prenatal mortality, low birth weight and cataract. Most of the exposed population was unaware about the hazards associated
with poor air quality. Government should conduct awareness programmes for the exposed population. The authors strongly
recommend policy implementations.
Acknowledgements-
The authors gratefully acknowledge the financial assistance received from the Council of Science and Technology (CST),
Uttar Pradesh, India under Young Scientist Scheme. We also thank Dr. (Mrs.) V. Prakash, Principal, Isabella Thoburn
College for her encouragement.
References-
Lawrence A, and N. Fatima, “Urban air pollution and its assessment of Lucknow city- the second largest city of North
India”., Sci Total Environ. 2013 Dec 4. pii: S0048-9697(13)01250-3, 2013

265
Fig.1 Percentage variation of size segregated particulate at
three locations in Durga Nagar Slum, Mumbai during A)
morning traffic rush hours, B) afternoon non-rush hours
SPATIAL DISTRIBUTION OF SIZE SEGREGATED PARTICULATE MATTER IN SLUMS SITUATED NEAR
HEAVILY TRAVELED TRAFFIC ROADS IN MUMBAI, INDIA
P. B. Panchal (1), R. S. Patil (1), R. Kumar (1, 2), H. C. Phuleria (1)
(1) Centre for Environmental Science and Engineering, IIT Bombay, Powai, Mumbai, 400076, India; (2) National
Environmental Engineering Research Institute (NEERI), Mumbai Zonal Centre, Mumbai, 400018, India
Presenting author email: [email protected]
Summary
Since slums in Mumbai are primarily located near legal or illegal industries, near heavily travelled major traffic roads, they
are exposed to air pollution from industrial and vehicular sources. The objective of this study is to understand spatial
distribution of size segregated particulate matter (PM10, PM2.5 and PM0.18) moving away from a major road in slums.
Monitoring of size segregated PM is done using a multi-stage cascade impactor for the sizes PM10-2.5 (coarse mode), PM2.5-
0.18 (accumulation mode) and PM0.18 (ultrafine mode) during weekdays near a major road in Mumbai, India. At kerbside
location, accumulation mode particles are about twice and four times than coarse and ultrafine mode PM, respectively during
rush hours, while ~ 1.5 and 5 times than coarse and nucleation mode PM, respectively, during non–rush hours. At a location
about 50 m away from kerbside, the concentration of PM in all size ranges is lower than at kerbside and a third location,
~100m away from kerbside. The first results suggest the traffic as well as within-slum activities as the major sources of
outdoor PM concentrations in the slums.
Introduction
Slums in Mumbai are mainly situated near heavily traffic road. Also, there are many unknown sources present in these slums.
Hence the people from these slums are exposed to air pollution not only from vehicular emissions but also from other outdoor
sources.
Methodology and Results
Monitoring of size segregated particulate matter was done by using MOUDI
(Micro-Orifice Uniform Deposit Impactor) for the sizes PM10-2.5 (coarse mode),
PM2.5-1.8 (accumulation mode) and PM0.18 (nucleation mode) during traffic peak
(8-11am) and non-peak hours (12-4pm) on weekdays near a heavily travelled
traffic road in Mumbai, India. This major road has traffic density of around
250,000 vehicles/day. Figure 1 shows that at kerbside location (S1), PM2.5-0.18
was about thrice and four times than PM10-2.5 and PM0.18, respectively during
peak hours, while ~ 1.5 and 5 times than PM10-2.5 and PM0.18, respectively
during non–rush hours. But at location about 50m from kerbside (S2), PM0.18 is
~ 1.5 times greater than PM2.5-0.18 during peak hours and almost equal with
PM2.5-0.18 during non-peak hours. Moving further, at another location, ~100 m
away from the road (S3), PM0.18 and PM2.5-0.18 are almost equal (about 30%
during peak hours and 20% during non-peak hours). Detailed chemical
characterization of the PM samples and additional measurements outside public
housing schemes are currently underway.
Conclusions
Slum residents are likely exposed to high levels of airborne PM from
traffic sources. At about 100 m away from the major road the impact
is lesser and may be dominated by other household/industrial sources
within the slums. There is a need to better identify the sources and
assess their contribution to ambient air pollution in the slums.

266
“NO GAS” PROJECT: EXHAUSTED DUMP EMISSIONS
L. Paciucci, C. Balducci, A. Cecinato, A. Imperiali, M. Perilli, M. Frattoni, F. Petracchini, M. Segreto, F. Vichi, P.
Romagnoli
Italian National Research Council, Institute of Atmospheric Pollution Research, Monterotondo (RM), 00015, Italy
Presenting author email: [email protected]
Summary
Two in-field campaigns have been carried out in Calabria region, Southern Italy, aimed at characterizing the release of
volatile hydrocarbons (VOCs) from exhausted dumps. The former experiment was conducted at two landfills (San Giovanni
in Fiore-SGF and San Martino di Finita-SMF), while the latter was performed at one only site (SGF). Volatile hydrocarbons
were collected from air by means of both active and diffusive sampling methods. Nitrogen dioxide, ozone, ammonia and
sulphur dioxide were collected in parallel. During the summer campaign, concentrations of NO2, SO2, and NH3 ranging from
2 µg/m3 to 6 µg/m3 were detected both inside and outside of the two dumps, while O3 reached ~120 µg/m3. Unlike other
toxicants, NO2 was more in dumps than outside. As for VOCs, usually both benzene and toluene were more out of dumps
whilst other substances were roughly equal or less; nevertheless, at one point inside SGF the concentrations of compounds
apart from benzene were higher. Similarly at SMF most VOCs were higher at a location rich in H2S release from soil. High
levels of isoprene and chlorofluorocarbons were estimated at all locations.
Introduction
A lot of air contaminants are released by dumps; in particular, important emission of volatile hydrocarbons takes place up to
several years after their run off. This phenomenon is somewhere exploited for production of methane as alternative fuel,
which allows reducing the global budget of green house gases emission. Nevertheless, the control of emission during and
after the dump life is mandatory to understand their long-term impact on environment and implement measures aimed at
optimizing the landfill management and preventing pollution.
Two in-field campaigns were conducted at SGF and SMF landfills during 2015, in June and October. Focus was on volatile
hydrocarbons VOCs, however regulated toxicants (i.e. NO2, SO2, O3 and NH3) were measured in parallel, to gain a more
complete overview of air composition at the two sites. In SGF, diffusive sampling devices were located at three points, while
active sampling (pump + cartridge) was applied occasionally at three further points (Fig. 1). Point No. 3 was outside landfill.
In SMF two points were chosen inside and outside the site, and a third point rich of H2S was analyzed with active sampling.
Methodology and Results
Air toxicants and VOCs were determined using Analyst® passive samplers,
allowing to collect compounds over some weeks. Inorganic species were solvent
extracted and analyzed through ion chromatography (IC). VOCs were extracted
with benzyl alcohol and analyzed through gas chromatography coupled with
mass spectrometry (GC-MS). Cartridges for active sampling were thermally
desorbed and characterized through GC-MS.
Figure 2 provides a synthesis of VOC measurements performed with active
sampling during the first campaign (June 2015). Compounds were usually more
abundant outside of dumps, the sole important exception consisting in toluene at
SMF (H2S rich location).
Toxic butadiene was ca. 3 times more outside of landfills than inside (~ 0.3-0.5
µg/m3 vs. 0.1-0.2 µg/m3, respectively).
Fig. 2. Mean VOC concentrations at SGF
and SMF landfills. EX = external locations;
IN = internal locations (mean).
As for the inorganic toxicants, the two landfills showed different trends. At SGF (still active with regards to biogas release)
SO2 and NH3 were more inside (4.2 vs. 2.1 µg/m3 and 6.0 vs. 3.5 µg/m3, respectively), while the reverse was observed at
SMF (1.7 vs. 2.3 µg/m3 and 2.6 vs. 3.9 µg/m3) in active for some 10 years now. NO2 was everywhere more inside than
outside of landfills (4.7 vs. 4.2 µg/m3 at SGF and 3.6 vs. 2.5 µg/m3 at SMF).
Conclusions
Two closed dumps were investigated for the release of VOCs and inorganic toxicants into the atmosphere in Calabria,
Southern Italy. The emission of aromatic compounds could be identified at one landfill, that of SO2 and NH3 at the other one;
NO2 seemed to be released by both of them.
0
4
8
12
Bz Tol EtB mpXy oXy TMBs
µg
/m3
SGF-EX
SGF-IN
SMF-EX
SMF-IN
old landfill
recentlandfill spl. point
No. 1
spl. pointNo. 2
spl. point No. 3
spl. pointNo. 4
spl. point No. 6
spl. pointNo. 5
Fig. 1. Map of SGF dump
with sampling points

267
APPLICATION OF DIGITAL IMAGE PROCESSING TECHNIQUE IN DETERMINING VISUAL AIR
QUALITY: A FEASIBILITY STUDY
Samaneh Sabetghadam
Institutes of Geophysics, University of Tehran, Tehran, Iran
Presenting author email: [email protected]
Introduction
Estimating the atmospheric visibility is of importance for air and ground transport safety, as well as for air quality. Visibility
reduction due to air pollutant is particularly severe in polluted and populated urban areas with pollution sources and
unfavorable meteorological condition. Atmospheric pollutants may cause visibility reduction by absorbing or scattering of
visible light. Both gases and particles scatter and absorb radiation and contribute to the light extinction in the atmosphere.
Several instruments have been developed to monitor visibility. However, in recent years the digital techniques on camera
images are rapidly applied in visibility monitoring. Digital image data can be characterized by illumination and reflectance
components and translated to specific brightness value.
Data and Methods
This paper an image processing technique has applied to estimate light extinction based on the visual content of images from
a static camera and to investigate the influence of air pollutants on extinction for the selected cases. A series of images
obtained by a digital camera from 2010 to 2011 in the urban area of Tehran. The approach to determining extinction includes
three steps: 1) Selecting a target in the digital images, 2) Computing the difference between the brightness of the target and
the background. 3) Calculating the inherent and apparent contrast ratios to determine image extinction for each image.
Measurements of air pollution concentration are also used for the selected cases, in order to find a mathematical modeling
approach to relate the pollutant loading and extinction of each image. Air pollution data are sampled using instruments
which are outlined in Table 1, consists of particulate matter and gaseous pollutants.
Table 1 Equipment used for pollutant sampling
Results
Clear days and polluted days were digitized and the extinction of each image is computed. The most polluted day with the
visibility of less than 3 km has the lowest contrast of -0.154 and the highest extinction of about 1.11 km-1that accompanied
with a highest concentration of Nox of about 346ppb.
Comparison between the image extinction and pollutants concentration on clean and polluted days, shows that the light
scattering by small particles that converted from gaseous air pollutants, is a major contributor to the extinction rather than by
large particles. More case studies should be investigated for a long-time period to propose the visual air quality indicator
based on image processing, to be use as a tool for an emission control program.
Keywords: extinction coefficient, visual air quality, image processing.

268
DETERMINATION OF 19 PAHS IN AIR SAMPLES USING GAS CHROMATOGRAPHY - MASS
SPECTROMETRY
D.A. Sarigiannis (1,2), S. Nikolaki (1), D. Zikopoulos (1), and M. Kermenidou (1)
(1) Department of Chemical Engineering, Aristotle University of Thessaloniki, Thessaloniki, Greece; (2) Institute for
Advanced Study, Environmental Health Engineering, 27100 Pavia, Italy
Presenting author email: [email protected]
Summary
The aim of our study was to develop an efficient and selective method for the determination and quantification of 19 PAH
compounds in the atmosphere of the Thessaloniki in Greece. Air samples were collected in two sampling sites during the cold
period, in year 2013. Nineeteen PAHs were analysed using gas chromatography/mass spectrometry. The calibration curves
were estimated using the internal standard calibration method. For the quality assurance and control, laboratory blanks and
field blanks were extracted and analyzed in the same way as the samples. The method detection limit (for an air volume of 55
m3) ranged from 0.008 to 0.27 ng/m3, depending on the PAH compound considered. Validation of the analytical procedure
was carried out by analyzing a standard reference material of urban particulate matter (NIST, SRM 1649b). This analysis was
in good agreement to the certified values (i.e. PAH recoveries above 80%). PAHs concentrations were higher in the urban
background station, due to the increase in biomass combustion.
Introduction
Over the last years, as a result of the economic crisis, there was an evident increase in biomass, which deteriorated the air
quality during the winter in the area of Thessaloniki, Greece (Sarigiannis et al, 2014). Biomass burning has been associated to
emissions of smaller fractions of PM. Moreover, PAHs of higher molecular weight, hence more toxic, are mostly adsorbed to
finer PM. Under this scope, it would be of particular interest the analysis of PAHs in an area significantly polluted by
biomass emitted PM.
Methodology and Results
A campaign of PM measurements in air was conducted between
January and mid April of 2013 in Thessaloniki, Greece. PM1.0, PM2.5
and PM10 particles were collected in an urban background site and a
traffic site. PAHs were extracted using dichloromethane in an
ultrasonic bath. Hexane was added and the extract was filtered and
cleaned in a chromatography column. The extract was concentrated to
0.4 ml and a known amount of internal standard solution was added.
Nineteen PAHs were analyzed by a gas chromatography/mass
spectrometer system (GC/MS) operated in the SIM mode. Total run
time was 60 min. The calibration curves were estimated using the
internal standard calibration method. Chromatographic peak areas were
fitted by linear regression. All calibration curves showed good linearity
(over 0.995). For the quality assurance and control, laboratory blanks
and field blanks were extracted and analyzed in the same way as the
samples. The method detection limit (for a volume of air of 55 m3)
ranged from 0.004 to 0.27 ng/m3, depending on the specific PAH. The
validation of the analytical procedure was carried out by analyzing a
standard reference material of urban particulate matter (NIST, SRM
1649b). This method showed good agreement to the NIST certified
values with PAH recoveries ranging from 83.2 to 109.3%, depending
on the specific PAH compound. The values found in this study indicate
that the analytic protocol presented good accuracy. Concentrations in
samples from the two monitoring stations showed variations both in
PM fractions and PAH compounds. PAHs concentrations were higher
in the urban background station, due to the increase in biomass
combustion.
Conclusions
The method developed showed good precision and accuracy and is able
to detect and quantify PAH compounds at very low concentration in the air. Estimated concentrations in the urban
background station found to be higher than the concentrations of the traffic background station due to the increase in biomass
burning.
References
Sarigiannis D.Α., Karakitsios S.P., Kermenidou M., Nikolaki S., Zikopoulos D., Semelidis S., Papagiannakis A., Tzimou R.,
2014. Total exposure to airborne particulate matter in cities: The effect of biomass combustion. Science of the Total
Environment 493, 795-805.
Fig.1 PAH concentrations in the urban station
Fig.2 PAH concentrations in the traffic station

269
MICROBIAL AIR QUALITY AND SURFACE CONTAMINATION IN HOSPITAL AMBULANCE SERVICES –
AN EXPLORATION
A. Sha (1)
(1) Department of Microbiology, PSM Dental College and Hospital, Thrissur, Kerala
Presenting author email: [email protected]
Introduction
Healthcare personnel working in the ambulances may be at risk to blood-borne, airborne, droplet, and direct contact
infections due to medical and health care practices administered to the patient in a closed air ventilation system and limited
air space. The objective of the study was to assess microbial air quality and bacterial surface contamination on medical
instruments and the surrounding areas among 15 ambulance runs during service.
Methods
A cross-sectional study of 53 air samples collected from 15 ambulances before patient services and 111 air samples collected
during patient services to assess the bacterial and fungal counts at the two time points. Additionally, 113 surface swab
samples were collected from medical instrument surfaces and the surrounding areas before and after ambulance runs. Groups
or genus of isolated bacteria and fungi were preliminarily identified by Gram’s stain and lactophenol cotton blue. Data were
analyzed using descriptive statistics, t-test, and Pearson’s correlation coefficient with a p-value of less than 0.050 considered
significant.
Results
The mean and standard deviation of bacterial and fungal counts at the start of ambulance runs were 318±485cfu/m3 and
522±581cfu/m3, respectively. Bacterial counts during patient services were 468±607cfu/m3 and fungal counts were
656±612cfu/m3. Mean bacterial and fungal counts during patient services were significantly higher than those at the start of
ambulance runs, p=0.005 and p=0.030, respectively. The predominant isolated bacteria and fungi were Staphylococcus spp.
and Aspergillus spp., respectively. Additionally, there was a significantly positive correlation between bacterial (r=0.3,
p<0.010) and fungal counts (r=0.2, p=0.020) in air samples and bacterial counts on medical instruments and allocated areas.
Conclusions
The study revealed high microbial contamination (bacterial and fungal) in ambulance air during services and higher bacterial
contamination on medical instrument surfaces and allocated areas after ambulance services compared to the start of
ambulance runs. Additionally, bacterial and fungal counts in ambulance air showed a significantly positive correlation with
the bacterial surface contamination on medical instruments and allocated areas.
References
Luksamijarulkul P, Kiennukul N, Vatthanasomboon P. Laboratory facility design and microbial indoor air quality in selected
hospital laboratories. Southeast Asian J Trop Med Public Health 2014 May; 45(3):746-755.
Luksamijarulkul P, Pipitsangjan S, Vatanasomboon P. Occupational risk towards blood-borne infections among ambulance
personnel in a provincial hospital network in Thailand. Southeast Asian J Trop Med Public Health 2014 Jul; 45(4):940-948.

270
NANOPARTICLES ASSESSMENT IN SAPIRANGA CITY, SOUTHERN BRAZIL
I.L. Schneider (1), E.C. Teixeira (1,2), L.F.S. Oliveira (1,3), M.D. Vargas (2), P. Krecl (4), and L. Gidhagen (5)
(1) Postgraduate Program in Remote Sensing and Meteorology, Universidade Federal do Rio Grande do Sul, Porto Alegre,
RS, Brazil; (2) Fundação Estadual de Proteção Ambiental Henrique Luis Roessler, Porto Alegre, RS, Brazil; (3) Centro
Universitário La Salle, Canoas, RS, Brazil; (4) Federal University of Technology, Londrina, Brazil; (5) Swedish
Meteorological and Hydrological Institute, Norrköping, Sweden
Presenting author email: [email protected]
Summary
The aim of this study was to evaluate the nanoparticles number concentration (PNC) and size distribution at two locations of
Sapiranga city, Southern Brazil. An average concentration of 3.14 x 10⁴ ± 1.89 x 10⁴ particles/cm³ was obtained in the city
center (site T), an area under traffic influence and residential biomass combustion. The background in this city (site B)
presented 1.00 x 10⁴ ± 0.67 x 10⁴ particles/cm³. Furthermore, the results indicated that nanoparticles, probably from biomass
combustion, increases especially on weekends, impacting in greater concentration than on weekdays and with larger particle
diameters.
Introduction
Atmospheric nanoparticles, especially those with a diameter <300 nm, can cause health effects because they can penetrate
more deeply into the human respiratory system and increase damaging toxicological effects. These particles are mainly
emitted by vehicles, but in certain conditions, biomass combustion can be an important anthropogenic source (Wardoyo et
al., 2006). Thus, the objective of this work was to study the concentration and size distribution of nanoparticles in an area in
southern Brazil that is under the influence of these two sources.
Methodology and Results
Atmospheric nanoparticles (10 to 420 nm) were measured
during the winter of 2014 in 2 locations of Sapiranga,
Southern Brazil, with a Scanning Mobility Particle Sizer
model 3910 (TSI Inc. Manufacturer). The area in the city
center (site T) was under traffic and domestic biomass
combustion influence and presented an average
concentration of 3.14 x 10⁴ ± 1.89 x 10⁴ particles/cm³,
whereas the background location in this city (site B)
presented 1.00 x 10⁴ ± 0.67 x 10⁴ particles/cm³. At site T,
daily variation shoes two well defined peak concentrations
at 9 h and 19 h, corresponding to periods when many
vehicles are in circulation. For the weekend stands out the
maximum PNC at 21 h.
Both locations (B and T) presented a trimodal size
distribution for the average nanoparticles concentrations.
Mode 1, centered on ~14 nm, can be attributed to the
particles formed in the atmosphere through the gas-to-
particle conversion from the vehicle exhaust gases. The
mode 2, centered between 32 and 36 nm, and mode 3,
centered on ~ 99 nm, may be attributed to particles formed
in the vehicle combustion chamber (or shortly thereafter) or
be associated with biomass combustion or other source not
related to vehicles emissions. If we consider the
measurements only made on weekends in the T site, when
little influence of vehicle traffic is expected, it can be
observed that the particles from modes 2 and 3 are still in
high concentration and the mode is observed at larger
diameters. Although the emissions of nanoparticles from
biomass combustion are not well characterized and they
depend on biomass type and combustion temperature
(Wardoyo et al. 2006), higher nanoparticles on weekends
could be related to biomass combustion for residential
purposes, or wood and charcoal combustion for barbecue,
which is quite common in the study area. This is consistent
with another study developed in this region which indicated
that at site T biomass combustion contribute to about 22% of
the PM2.5 level observed (annual average of 18.6 µg/m3) and
local traffic exhaust for 9%.
Fig 1. Mean nanoparticles size distribution.
Conclusions
In this study were evaluated the concentrations and size distribution of nanoparticles in two locations of Sapiranga, southern
Brazil. The city center presented an average concentration about 3 times higher than the background, probably due to vehicle
emission and biomass combustion. Higher concentrations of nanoparticles were obtained at site T at the weekend than during
the week, which was mainly related to the contribution of biomass combustion. This is confirmed by the fact of being
observed more particles with larger diameters.
Acknowledgement
We are grateful to CAPES, FEPAM, and the Swedish Meteorological and Hydrological Institute for cooperation in this study.
References
Wardoyo A.Y.P., Morawska L., Ristovski Z.D., Marsh, J., 2006. Quantification of particle number and mass emission factors
from combustion of Queensland trees. Environ. Sci. Technol. 40, 5696-5703.
0.0E+00
1.0E+03
2.0E+03
3.0E+03
4.0E+03
5.0E+03
6.0E+03
7.0E+03
10 100
PN
C (
#/cm
³)
Particle Diameter (nm)
Site T - Weekday Site T - Weekend Site B - Weekday

271
THE IMPACT OF SPEED AND CONGESTION ON TRAFFIC EMISSIONS WITH SPECIFIC ATTENTION TO
DATA ANALYSIS
S. van den Elshout (1) and S.M. Willers (1)
(1) DCMR Environmental Protection Agency Rijnmond, Schiedam, the Netherlands.
Presenting author email: [email protected]
Summary
Traffic maximum speed and congestion have an impact on traffic emissions. Often these relations are established under test
conditions. However, in practice the mutual effects of a reduced speed limit and its impact on congestion are site dependent
and hard to estimate. We assessed the impact of a change of speed limit (80 and 100 km/h) on traffic emissions, combined
with its secondary effect on congestion. The data were derived from a routine monitoring network and not from a dedicated
research monitoring set-up. Specific attention was given to data-analysis aspects of air quality time series data.
Introduction
An urban motorway had its speed limit changed from 80 to 100 km/h (and back again). The effect of the lower speed limit
was twofold: lower emissions and a more homogenous traffic flow and less congestion, which led to further emission
reduction. We studied the impacts of speed limits and congestion on the traffic emissions using a roadside monitoring site at
this urban motorway. Two routine city monitoring stations served as background. The data analysis specifically focused on
(a) the selection of an appropriate model that minimises the impact of changes in background concentrations that could
hamper the interpretation of the results; (b) testing regression techniques that account for the time-series nature of the air
quality data (data with autocorrelation).
Materials and Methods
Hourly air quality data (NO, NO2, Black Carbon) from two urban background and one roadside monitoring station were used.
Hourly traffic intensity and vehicle speed on the urban motorway as well as hourly local meteo data were obtained. The
average city background was calculated as a proxy for the precise local background, and subtracted from the hourly roadside
measurements to estimate traffic contribution. Hours with wind perpendicular to the road were used to study the traffic
contribution measured on the roadside station.
The model that was used, tested the change of the traffic contribution per unit of traffic rather than the change in
concentration as such: TrafficConcentration= α+β1·TrafficIntensity+ β2·TrafficIntensity·Δ (where Δ=0 default speed and
Δ=1 during the change). This is preferred over a simple model like TrafficConcentration= α+β1·TrafficIntensity+ β2·Δ. The
first model corrects (to some extent) for errors in the assumed background (α) and is less sensitive to other changes than the
traffic contribution whereas the second model might test positively for any change in concentrations, irrespective if it is due
to traffic or not. Congestion was defined as the difference between the observed vehicle speed and the maximum vehicle
speed (during quiet hours). This provided a continuous variable to test the impact of congestion on vehicle emissions.
Linear regression assumes the absence of autocorrelation. We tested several techniques (Newey-West standard errors, block-
bootstrapping) to correct for autocorrelation, leading to higher standard errors of the regression parameters.
Results and Conclusions
Speed limit reduction has a significant positive effect on the traffic emissions. We found that the speed limit increase from 80
to 100 km/h led to 20% and 17% increase in traffic concentration contribution of NOx and BC respectively. Our results
indicated that this effect mainly occurred during hours with congestion (see Willers et al. 2013, Fig.4) and were partly due to
the increased congestion. Table 1 shows that at a higher maximum speed, the drop in actual average speed during the rush
hours is higher, indicating higher congestion. The standard deviation of the vehicle speed, particularly during rush hours, also
decreased when the speed limit was reduced (see Willers et al. 2013, Fig.3a/b).
Table 1. Average observed vehicle speeds (km/h), direction into town, under different conditions.
Speed regime 100 km/h Speed regime 80 km/h
Free flowing speed rush hour Difference Free flowing speed rush hour Difference
87 63 24 74 56 18
The intercept (α) in the regression model showed that the city background underestimated the true local background but even
without a proper upwind/downwind research setup the effect of the speed limit change could be studied with the available
routine monitoring sites. A significant change in emissions per unit of traffic was observed.
Linear regression underestimates the standard errors of the regression parameters when applied to hourly air quality data. The
relative uncertainty of the effect estimator in OLS was 7%, increasing to 15% if Newey-West estimators are used (depending
on the numbers of lags included). Bootstrapping yielded a 15% relative uncertainty, going up to 45 % depending on the block
size. OLS is too optimistic and can lead to false positive outcomes. However, the other methods involve making assumptions
with major impact on the outcome. A proper time-series statistical treatment could be needed to obtain correct uncertainties.
Acknowledgement
We would like to thank Joost Wesseling for testing the impact of block size in block bootstrapping.
Reference
Willers et al, 2013: www.researchgate.net/publication/282672672_Snelheidsverhoging_A13_effect_op_de_luchtkwaliteit

272
CHARACTERIZATION OF INDOOR/OUTDOOR PM10, PM2.5, PM1 AND RADON
CONCENTRATIONS IN AN OLD MEDICAL CENTER
K.Verijkazemi (1), Gh.Bahmannia (2)
(1) Member of environmental faculty, Azad Islamic University of Tonekabon, Tonekabon, Mazandaran, Iran; (2) PhD. In
environmental Eng. And Manager of 4th gas processing plant Phases 6, 7, 8, Asaluyeh, Iran
Presenting author email: [email protected]
Summary
This study aims to quantify and analyse indoor and outdoor PM10, PM2.5, PM1 concentrations and [222]Rn emissions in an
old medical centre (Imam Khomeini Hospital) which is located in downtown district of Iran’s capital city. We investigated
these concentrations were monitored in six floors and three locations (nursery station, treating rooms, outdoors) with portable
analysers, in six days of every seasons through a year. At same time all ambient air temperature, pressure and humidity data
and air conditioning system arrangements and design basis collected to know what are the probable meaningful relations are
exist among particulate matters, [222]Rn, and air conditions. Finally some improvements for modelling are recommended.
Introduction
The significance of both particulate matter and Radon emissions in medical centres is underscored by the presence of a large
numbers of patients, visitors, and medical staffs. The link between increased particle pollution and health issues has been
well documented (e.g. Pope and Dockery, 2006). However, research has shown that Radon emissions also contribute
significantly to atmospheric particle concentrations, highlighting the need to investigate this kind of emissions and their
sources, relations, and health effects. Considering this, we quantified the indoor and outdoor PM10, PM2.5, PM1
concentrations and [222]Rn emissions at same time to assessment of probable risks.
Methodology and Results
Particulate matters analyser (Dust Trak 8520), Radon
meter (RADSTAR RS800), ambient air condition
analyser (Lutron MHB 38SD) were employed in the
medical centre for monitoring and recording data (see
Fig.1). The PM10 and PM2.5, PM1 average
concentration were 27.75, 20.05, 15.50 and varied
between 7-49 μg/m3, 6-37 μg/m3 and 5-33 μg/m3,
respectively. The records showed that the average of
Radon emissions in floors of building were 2.8 Bq m-3
, 1.8 Bq m-3 , 2.8 Bq m-3 3.2 Bq m-3 , 1.2 Bq m-3 ,
0.83 Bq m-3 and 0.53 Bq m-3respectively. The
statistical analysis between all dependant and
independent variables has done by SPSS and strong
positive correlation was observed between PM10
and PM2.5, PM1 changes in floors, seasons of year,
and locations based on ambient air conditions. The
concentration of [222]Rn and PM2.5 and ambient
pressure showed meaningful relations.
The outdoor/indoor parameter changes calculated in this study and a regression model established to analysing all variables.
The CONTAM software applied for modelling of all indoor areas with many type of conditioners for assessing of exposure
of PM and Radon as well. The current study has shown that the combined Radon and PM10 in 2nd floor and in summer time
have a little unhealthy potential for medical centre.
Conclusions
Radon will not contribute significant to atmospheric particles as unhealthy potential but we recommend that this study
continue in other sites and locations.
Acknowledgement
We acknowledge Dr. N.Mansouri and Mr. Sadrzadeh for their help during this study.
References
1. Pope C.A., Dockery D.W., 2006. Health Effects of Fine Particulate Air Pollution: Lines that Connect. Journal of Air and
Waste Management Association 56, 709-742.
2.Wilson Am, Salloway JC, Wake CP, Kelly T. Air pollution and the demand for the hospital services. A review. Environ
Int1118-1109 ;2004 و.
Fig.1 measuring devices

273
MEASUREMENTS OF OZONE AND RELATED TRACE GASES AT SEMI-ARID URBAN SITE OF INDIA:
DIURNAL AND SEASONAL VARIATIONS IN AIR QUALITY
Ravi Yadav (1), L.k. Sahu (1), G. Beig (2), S.N.A. Jaaffrey (3)
(1) Physical Research Laboratory, Ahmedabad, 380009, India; (2) Indian Institute of Tropical Meteorology, Pune, 411008,
India; (3) M. L. Sukhadia University, Udaipur, 313001, India
Presenting author email: [email protected]
Summary
Aim of the study is to characterize the temporal variations of trace gases. The relationships between trace gases and role of
meteorological parameters have been investigated. We have also used NCEP wind and back trajectory data to understand the
role of regional transport in the variations of trace gases. The study is based on the measurements of O3, CO and NOx along
with meteorological parameters at Udaipur in western India. The day time O3 mixing ratio varies from season to season with
highest in pre-monsoon season while lowest in monsoon season. The mixing ratios of both CO and NOx show very clear
seasonality with highest during winter season and lowest during the monsoon season. The mixing ratios of O3 were mostly
observed in the low CO and NO regimes.
Introduction
In recent years, the rapid urbanization and industrialization have resulted in substantial degradation of air quality in many
urban regions of India. The increasing level of air pollution is a major cause of concern and impact may extend from local to
global scale (Sahu et al., 2011). The large emissions of trace gases and aerosols from a variety of sources are one of the major
environmental issues in urban and industrial areas (Wang and Hao, 2012). The precursor gases emitted in this part of the
world can be transported to the longer distances due to strong convective dynamics. Therefore, urban emissions in the
tropical regions such as India can influence the O3 formation at remote regions (Brankov et al., 2003). The variations in
surface level temperature can strongly influence the kinetics of reactions producing O3 and also through the mixing with O3-
rich free tropospheric air (Wang et al., 1998).
Methodology and Results
The observational site and road map of
Udaipur city have shown in Fig. 1. This city is
located in the Arawali hill ranges in the
southern part of Rajasthan, a western state of
India. The surface level measurements of O3
and its precursors (CO, NOx) were performed
using online analysers. The meteorological
parameters were simultaneously measured
using automatic weather station. We have
used hourly data of trace gases on diurnal
scale
and Seasonal scale.
.
Conclusions The major sources of primary gaseous
pollutants are the emissions from
biomass/biofuel burning, vehicular exhaust and
small industries at Udaipur. The pattern of
diurnal dependence remained same but
strength of variability varied from season-to-
season. The seasonal changes in other
processes like PBL depth, photochemistry and
meteorology seem to play important role in the
observed distributions of trace gases at
Udaipur. The data presented in this study is useful to understand the regional air
quality and
atmospheric chemistry of in the western region
of India.
References
Brankov, E., et al., 2003. Assessing the effects of trans boundary O3 pollution between Ontario, Canada and New York, USA.
Environ. Pollut. 123, 403-411.
Sahu, L.K., et al., 2011. Seasonal and diurnal variations of black carbon and organic carbon aerosols in Bangkok. J.
Geophys.Res.116, D15302.
Fig.1 Observational site
Fig.2 Diurnal variations of O3 CO and
NOx

274

275
SOURCE APPORTIONMENT AND EMISSION MODELS-
INVENTORIES

276

277
PM1 mass closure - Milan, winter 2012
Sulphates
6%
Ammonium
11%
Nitrates
26%
Not detected
12%Elements
2%OM (OC*1.6)
36%
EC
7%
PM1 CHARACTERISATION AND SOURCE APPORTIONMENT AND AEROSOL SIZE DISTRIBUTION AT A
HOT-SPOT POLLUTION AREA (MILAN, ITALY).
V. Bernardoni (1), A. Bigi (2), M. Elser (1, *), P. Fermo (3), G. Ghermandi (2), A. Piazzalunga (3,**), G. Valli (1), R. Vecchi
(1)
(1) Department of Physics, Università degli Studi di Milano and INFN, Milan, 20133, Italy; (2) Department of Mechanical
and Civil Engineering, University of Modena and Reggio Emilia, Modena, 41125, Italy; (3) Department of Chemistry,
Università degli Studi di Milano, Milan, 20133 Italy; (*) now at: Paul Scherrer Institute, Switzerland; (**) now at:
Department of Environmental and Territorial Sciences, Università degli Studi di Milano-Bicocca, Milan, 20126, Italy
Presenting author email: [email protected]
Summary
This work aimed at a detailed physical and chemical characterisation of PM1 and at singling out major sources contributing
to the high concentrations observed in the urban area. Examples of number size distribution and of elemental, ionic and
carbonaceous fractions size distribution will be also presented.
Introduction
It is well known that the particle size plays a major role in determining the penetration of particles in the respiratory system
and their effects on the human health. Despite this fact, data on PM1 composition and sources are still relatively rare. Hot-
spot pollution areas are peculiar sites where source emissions and meteorological conditions foster particulate matter
accumulation and very high aerosol concentrations are often registered. The Po Valley is one of the main hot-spot pollution
areas in Europe, especially during wintertime. Despite the high levels of PM registered in the area, little knowledge on PM1
and ultrafine particles composition and sources is available, apart from a couple of studies carried out by our group in 2002
and 2004 in the same area.
Methodology and Results
PM1 was sampled at an urban background station in Milan,
Italy, during winter 2011-2012. Milan is the greatest urban area
in the Po Valley, a well-known hot-spot pollution area in
Europe, especially during wintertime. Parallel PM1 sampling
was carried out during daytime and night-time (07-16, 19-04) on
PTFE and quartz fibre filters using two low-volume samplers for
a total of about 250 samples. Mass concentration was
determined by the gravimetric technique and all the PM1
samples were chemically characterised for elements, inorganic
ions, levoglucosan, EC/OC and water soluble organic
compounds, allowing to perform the mass closure (see Fig.1).
BC determination was also carried out on both PTFE and quartz
fibre filters by a polar photometer (Vecchi et al., 2014).
Moreover, BC concentrations in PM1 were monitored with a 5 minute resolution by a Multi-Angle Absorption Photometer
(MAAP).
The aerosol number size distribution was obtained by an optical particle counter (range 0.25-32 μm in 31 size bins) and a
differential mobility particle scanner (8-700 nm in 31 size bins). The size-segregated mass, ionic and elemental
concentrations were obtained by analyses performed on samples collected using multistage cascade impactors. The aerosol
size distribution showed 3-4 modal distribution for both mass and chemical components in most cases. Two accumulation
sub-modes were often detected at 300 nm and 600 nm and they can be likely related to fresh and aged aerosol.
PM1 data were analysed by receptor modelling using Multilinear Engine ME-2 and 6 factors were identified. The most
relevant contributions to PM1 as daily averages were from ammonium nitrate (36%), ammonium sulphate (25%), and
biomass burning (about 21%) followed by traffic (9%) and industry (8%), and road dust (2%). It is noteworthy that only for
wood burning a higher contribution during night-time was detected.
Conclusions
The detailed chemical-physical characterisation of PM1 allowed performing the source apportionment through receptor
modelling evidencing major source contributions to this aerosol fraction.
The detailed chemical characterisation of size-segregated samples allowed to gain insight into atmospheric processes (e.g.
aging) impacting on aerosol particles.
References
Vecchi R., Bernardoni V., Paganelli C., Valli G., 2014. A filter-based light-absorption measurement with polar photometer:
Effects of sampling artefacts from organic carbon. J. Aerosol Sci. 70, 15-25
Fig.1 Source apportionment of PM1

278
CAN FLOATING CAR DATA HELP IMPROVING TRAFFIC EMISSIONS ESTIMATES?
N. Castell, M. Vogt, D. Vo Thanh, S. Lopez-Aparicio and I. Sundvor
Norwegian Institute for Air Research (NILU), Instituttveien 18, NO-2027 Kjeller, Norway
Presenting author email: [email protected]
Summary
Highly accurate traffic information can help to improve the estimates of traffic related pollutant emissions. In the last years
there has been an increase in the use of navigation devices (i.e smartphone applications, in-dash devices). Additionally, some
new vehicles are equipped with onboard diagnostic systems that collect data on time, position, speed and fuel consumption.
Data from these devices has been used by companies and governments to offer solutions on traffic flow in real-time. In this
work we explore how data obtained by navigation devices and on-board-systems can be used to improve traffic emission
estimates in urban environments.
Introduction
Traffic emissions are a major source of air pollution in urban areas all over the world. There are numerous scientific
evidences that air pollution possess a threat to human health (e.g. Lanki, et al., 2015). In order to manage air quality
effectively it is necessary to estimate accurately traffic emissions. The estimation of vehicle emissions at fine scale is mainly
challenging due to limitations in the availability and quality of traffic-related input data.
Traffic emissions depend, among other variables, on the vehicle speed and the traffic flow. Traffic models can be used to
estimate vehicle speed and traffic flow in different road segments (Zhou et al.,2015). The main challenge for the use of traffic
models is that they need to be calibrated for the local conditions. Another approach is the usage of automatic traffic recorders
(ATR) to obtain vehicle speed data. However, ATR systems are expensive and they are usually only located in main streets,
not providing a wide coverage of the city.
Nowadays, most drivers use navigation devices and most vehicles are equipped with onboard diagnostic systems. The data
obtained from these systems is usually referred as Floating Car Data (FCD), and it consist of data (i.e. GPS, fuel
consumption) collected from individual vehicles while moving in the city. The main focus of this technology is traffic
management, however it offers a great potential for other applications as for instance emission estimation as it provides high
temporal and spatial resolution of vehicle speed.
Methodology and Results
In this work we explore two approaches to estimate traffic emissions: (i) Buses equipped with onboard diagnostic system
(OBS) and; (ii) historical speed data collected by TomTom.
Two buses from the Oslo fleet were equipped with OBS and GPS to collect data on location, time stamp, speed and fuel
consumption with temporal resolution of 1 second. One of the buses is a diesel-fuelled vehicle and the other uses Compressed
Natural Gas (CNG). The buses cover and alternate between several line routes in Oslo offering a good spatial coverage of the
urban area.
Vehicle speed data collected by TomTom was acquired for the city of Oslo. TomTom uses multiple sources to collect GPS
data, as for instance, in-dash and on-dash devices, LIVE navigation devices, smarthphone navigation apps and fleet
management systems. The different sources are fused and GPS derived speed can be obtained in a temporal resolution of 15
minutes over a road segment. Information such as type of vehicle, technology, age and fuel is not available from the
TomTom database.
We have generated speed, fuel consumption and traffic emission maps for the city of Oslo using the detailed information on
FCD provided by the two methods tested in this work. The results show significant differences in the speed when it is
obtained using FCD versus other methods (i.e. speed limit, traffic models). These differences on speed have an impact on the
estimated traffic emissions.
Conclusions
FCD have advantages over other traditional methods to estimate traffic emissions (e.g. lower cost, higher resolutions). FCD
systems are becoming ubiquitous and nowadays most of the urban fleets (taxis, buses, god transport, etc.) and private
vehicles are equipped with navigation systems. The results obtained in Oslo show that FCD offer the possibility of estimating
more realistic speed profiles and fuel consumption at higher resolutions than conventional systems. The FCD has been
successfully employed in a traffic emission model in Oslo. The combination of aggregated data from TomTom with detailed
data from specific fleets offer the possibility to distinguish driving patterns (i.e. public transport uses dedicated lanes and
have more stops than private vehicles).
Acknowledgement
Citi-Sense-MOB is funded by The European Mobile and Mobility Industries Alliance (EMMIA).
References
Lanki, T. et al., 2015. Air Pollution from Road Traffic and Systemic Inflammation in Adults: A Cross-Sectional Analysis in
the European ESCAPE Project. Environ Health Perspectives 123, 785-791.
Zhou, X. et al. 2015. Integrating a simplified emission estimation model and mesoscopic dynamic traffic simulator to
efficiently evaluate emission impacts of traffic management strategies. Transportation Research Part D 37, 123-136

279
ESTIMATING THE AIR MANGANESE EMISSION IN THE SANTANDER BAY (NORTHERN SPAIN)
I. Fernández-Olmo (1), D. López (1), A. di Gianvito (1) and J.A. Fernández-Ferreras (1)
(1) Department of Chemical and Biomolecular Engineering, ETSII y T, University of Cantabria, Santander, Spain
Presenting author e-mail: [email protected]
Summary
The levels of atmospheric manganese in the Santander Bay (Northern Spain) are high, exceeding in some sites the WHO
annual guideline value (150 ng/m3) [1]. The air quality relative to the Mn exposure in the Santander Bay may be evaluated by
means of air quality models, which require reliable Mn emission rates from the identified sources. Because Mn is neither
included in the Spanish National Emission Inventory, nor in the European Pollutant Release and Transfer Register (E-PRTR),
the manganese emission needs to be calculated. Thus, the manganese emission inventory in the Santander Bay from 2008 to
2013 was carried out, and the manganese emission rate for each identified point and area source was calculated to be
implemented in future air quality models. Since Mn was not used as gasoline additive (methylcyclopentadienyl manganese
tricarbonyl, MMT) in Spain, the majority of the emitted manganese was attributed to local industrial activities.
Introduction
The presence of metals in air adversely affects the human health. Manganese is one of metals of concern; although it is
essential for humans and other species, it is neurotoxic at very high levels. When inhaled, it can produce significant
neurotoxicity, and people expose to high levels of Mn may suffer a disease called "manganism" [2]. The effects of the non-
occupational exposure to Mn are not clear enough at the moment, but the WHO recommends an annual guideline value of
150 ng/m3. This value has been exceeded in some sites of the Santander Bay, mainly in the town of Maliaño, where a
ferromanganese and silicomanganese plant is located [1]. So, the aim of this work is to evaluate the main emissions of
atmospheric manganese to the Santander Bay in order to have reliable input data for future air quality models to be
implemented in this area.
Methodology and Results
The manganese emission inventory considered only local industrial sources: a ferromanganese and silicomanganese plant, a
non-integrated steel plant and two iron foundries. Since the ferroalloys plant was the major Mn emitter, their emissions were
evaluated in two ways: (i) through emission factors developed by the US EPA[3] and energy consumption factors for SiMn
and FeMn, after considering several assumptions (efficiencies of the hooding systems and the particulate matter control
devices); (ii) and through the measured PM10 concentration data. Continuous PM10 monitoring data were available for the
gas stream exiting the main electric furnaces, EAF1 and EAF2 (see the point sources F1 and F2 in Figure 1); additionally,
discrete PM10 measurements in other point sources were also available in the Environmental Report published by the
company (e.g. F7 in Figure 1). Fugitive emissions were also considered through area sources, taking into account the
particulate matter emissions from the openings on the wall of the main buildings where electrical furnaces were located (see
D7 in Figure 1). Emissions from non-systematic point sources were also considered (see F13 and F14 in Figure 1). The
Figure 1. Diagram of the manganese emissions from a
ferromanganese alloy smelter
results show the high contribution of the ferroalloys plant
to the total Mn emissions in the Santander Bay followed
by the non-integrated steel plant. Considering the
efficiencies of the hooding systems given in the BREF
document of non-ferrous metallurgy, the contribution of
fugitive emissions is much higher than that of the point
sources, which are equipped with high efficiency
particulate matter control devices. The annual Mn
emissions (kg Mn/year) were also calculated as
instantaneous manganese emission rates (g Mn/s) for
weekend and non-weekend scenarios. This will allow to
implement such inputs into air quality models.
Conclusions
The evaluation of the atmospheric manganese annual emissions in the Santander Bay indicates the high contribution of a
ferroalloys plant to the total emissions and the importance of the fugitive emissions with respect to those of point sources.
Acknowledgement
This work was supported by the Spanish Ministry of Economy and Competitiveness (MINECO, CTM2013-43904-R). The
authors also thank the Regional Environmental Department of the Cantabria Government for providing PM10 emission data.
References
[1] Moreno T, Pandolfi M, Querol X, Lavín J, Alastuey A, Viana M, Gibbons W (2011) Manganese in the urban atmosphere:
identifying anomalous concentrations and sources. Environ Sci Pollut Res 18:173-183.
[2] Mergler, D. et al. (1994) Nervous system dysfunction among workers with long-term exposure to manganese. Environ
Res, 64:151–180.
[3] US-EPA (Environmental protection agency): Locating and Estimating Air Emissions from Sources of Manganese. United
States: Office of Air Quality Planning And Standards, 1984.
EAF1 EAF2
Ladle Ladle
Baghouse
F1 F2F13 F14F7
D7 D7
Wet scrubber Wet scrubber

280
QUANTIFICATION AND CHARACTERIZATION OF EMISSIONS FROM OPEN-FIELD AGRICULTURAL
RESIDUE BURNING IN MAHARASHTRA
M. Garg (1), C. Venkataraman (2), H. C. Phuleria (1)
(1) Centre for Environmental Science and Engineering, IIT Bombay, Powai, Mumbai, 400076, India; (2) Department of
Chemical Engineering, IIT Bombay, Powai, Mumbai, 400076, India
Presenting author email: [email protected]
Summary
This study aims to estimate and compare the total air pollutant emissions from open filed agriculture residue burning with
bottom up and top down approaches for India and assess its spatial distribution. A total of 980 Gg/yr CO emissions are
estimated for India using Global Fire Emissions Database (GFED). Western Indo-Gangetic Plain, Central India and Southern
India together contributes 80% of the total open agriculture residue burning emissions, which is bound to increase with
further mechanization of farming in India. Bottom up and top down comparison shows that there are uncertainties in
emissions estimation as top down underestimates and bottom up overestimates the emissions. All these uncertainties need to
be improved to get better estimation of the emission from agriculture residue burning depending upon the geographical area
and seasons by field survey and measurement of emission from actual field burning.
Introduction
Open biomass burning is the largest source of carbonaceous particles and second largest source of trace gases. In South Asia,
open field agriculture residue burning dominates the open biomass burning.In India, it contribute about 20% of carbonaceous
aerosol emissions (Venkataraman et al., 2006). Bottom up and top down estimates have uncertainty in emission estimation.
Considering this, emission from bottom up and top down approaches have been estimated and compared.
Methodology and Results
The state wise emissions from open field
agriculture residue burning were calculated using
bottom up and Top down methodology.A
geographical information system (GIS)-ArcGIS
was applied to allocate emissions in different
regions of India and the spatio-temporal
comparison of emissions between both
methodologies (Bottom up and Top down) was
done. From top down approach, total 980 Gg/yr
CO emissions were estimated for India using
GFED database.Western Indo-Gangetic Plain
(IGP), Central India and Southern India
contribute 60%, 12% and 10% of total open
agriculture residue burning emissions,
respectively, which is bound to increase with
further mechanization of farming in India. Spatio-
temporal distribution of CO emissions shows
maximum emissions in October-November from
IGP followed by March-June and December-
February. The comparison between bottom up and top down estimation
shows an average factor difference of 11.95. Also, the state-wise CO
emissions had shown different pattern as maximum emission from Top
down approach (GFED) were calculated for Punjab followed by Haryana
and Uttar Pradesh but maximum emissions for Uttar Pradesh were
calculated from bottom up methodology. Thus, there are uncertainties in
emissions estimation as top down underestimates and bottom up
overestimates the emissions. Field surveys to understand the crop residue uses and distribution and measurement campaigns
to characterize the emissions from open burning of different agricultural crop residues is currently underway.
Conclusions
The open agriculture residue burning is highly variable in different states of India. There are uncertainties in the estimation of
emissions from both bottom and top down methodology. The emission calculation uncertainty are related to the amount and
type of agriculture residue burned in the field, proportion of crop residue burned in the field, burn efficiency and the EFs. All
these uncertainties need to be improved to get better estimation of the emission from agriculture residue burning depending
upon the geographical area and seasons
References
Venkataraman, C., G. Habib, D. Kadamba, M. Shrivastava, J. F. Leon, B. Crouzille, O. Boucher, and D. G. Streets (2006),
Emissions from open biomass burning in India: Integrating the inventory approach with high-resolution Moderate Resolution
Imaging Spectroradiometer (MODIS) active-fire and land cover data, Global Biogeochem. Cycles, 20(2), 1–12
Table1. Monthly CO
emissions from open field
agriculture residue burning
Figure 1. Spatial distribution of CO emissions in India
Table 2. Comparison between top down (GFED)
and bottom up CO emissions (Gg)estimation
and bottom up CO emissions (Gg) estimation

281
ATMOSPHERIC PARTICULATE POLLUTION TO NEARBY BIZERTE LAGOON (MEDITERRANEAN
LAGOON)
Essia Hamdi (1), Dalila Taieb(2)
(1) Faculty of Sciences Bizerte, Department of Biology Sciences, 7021 Jarzouna -Tunisia; (2) Applied Thermodynamics
Research Unit (99/UR/11-21), National Engineering School of Gabès, Rue Omar Ibn-Elkhattab 6029 Gabès, Tunisia, Gabès
University.
Presenting author email: [email protected]
Summary
Town of Bizerte are exposed to a atmospheric particulate pollution due to automobile traffic, industrialization, but also to soil
dusts. Monitoring networks and data about air pollution are still rare. This study is a preliminary work about particulate and
heavy metals pollution, at around the lagoon of Bizerte (North Tunisia, Mediterranean lagoon). Aerosols had been collected
with a PM10 sampler. Analytical technique ICP-AES was used to identify the metallic composition of PM10. Experimental
results and statistical analysis with Particulate Matter data identify the different sources of emissions. The major sources are
traffic and industrialization. It is necessary to develop monitoring network and sanitary and environmental impact studies in
these cities.
Introduction Studying the problem of air pollution has become a priority of the globe interest, especially, to determinate the air quality,
the pollutant effects and to find solutions to ameliorate the situation which, unfortunately, become worse and worse every
day. The suspended particles or particulate matter is an air pollutant consisting of a complex mixture of organic and inorganic
substances suspended in the air, solid and / or liquid. These particles vary in size, composition and origins (Hashisho and El-
Fadel, 2004). In the last few decades, the phenomenon of Particulate Matter pollution has been analyzed extensively. Many
researchers have been developed in this context and especially on the relationship between particulate matter (PM) and health
effects ( Strawa and al., 2010). In Tunisia, many regions suffer from high concentrations levels of PM, the most affected ones
are Bizerte. Hence, regarding the air quality problem, the identifying sources of emissions are early warning system for
providing air quality information towards the citizen becomes an obvious and imperative need.
Methodology and Results
This article presents the results of a first study of particulate air
pollution heavy metals on to nearbyof lagube of bizerte for which there
is currently no data (see Fig. 1). The filters were mineralized by an
attack by HNO3 in microwave. The solutions were then were analyzed
by ICP AES. Chemical analysis of the dust deposited on filter (PM10)
was performed on 11 samples of different receptor sites around the
lagoon of Bizerte. The elements analyzed are divided into four groups:
(1) NO3-, Cl-, Ca ++, Mn and Zn with an average concentration is
between 111.75 and 528.48 mg/Kg. (2) Cd, Co, Se, As, NTK, Mg +,
Na+, K+, and PO4 with an average concentration of between 1.71 and
6.08 mg / kg. (3) Cu, Pb, Ni and Cr with average concentrations
between 27.89 and 86.90 mg/kg.
(4) Fe with an average concentration 7716.50mg/kg. The application
of Principal Components Analysis allows to distinguish and distribute
the PM10 sources based on correlations between measured chemical
compounds. Five PM10 sources were identified that are allocated to
traffic in the mineral (marine aerosol), industry, and natural source
terrigenous, port activity (see Fig.2).
Conclusions
The PM10 in ambient air in the region of Bizerte come from many
sources and is a complex heterogeneous mixture. The chemical
composition of this mixture may change in space, according to the
emission sources.
Acknowledgement
This work was supported by Agency for Environmental Protection
(ANPE).
References
Hashisho, Z., El-Fadel, M. (2004). Impacts of traffic-induced lead
emissions on air, soil and blood lead levels in Beirut. J. Env. Mon.
Asses. 93, 185–202.
Strawa, A. W., Kirchstetter, T. W., Hallar, A. G., Ban-Weiss, G. A.,
McLaughlin, J. P., Harley, R. A., et al. (2010). Optical and physical
properties of primary on-road vehicle particle emissions and their
implications for climate change. Journal of Aerosol Science , 41, 36-50.
Fig.1 sampling map
Fig.2. Identify emission sources of PM10 (PCA)
SA
SB
SC
SD
SK
SL
SM
SN
SE
SH
SI
SF
NH4
Cl Cd
Co
Cu
Fe Pb
Mn
Ni
Zn
Cr
Se
As
NTK
Ca
Mg Na
K
PO4
F2 (
18
,77
%)
F1 (29,13 %)
Biplot (axes F1 et F2 : 47,90 %)

282
FUGITIVE PARTICULATE MATTER EMISSIONS AT CONSTRUCTION SITES
H. Hassan (1), K. Kakosimos (1), P. Kumar (2)
(1) Department of Chemical Engineering, Texas A&M University at Qatar, 23874, Doha, Qatar; (2) Department of Civil and
Environmental Engineering, Faculty of Engineering and Physical Sciences, University of Surrey, Guildford GU2 7XH,
United Kingdom
Presenting author email: [email protected]
Summary
This study aims to examine the fugitive Particulate Matter (fPM) emissions from loose, owe to construction activities,
Calcisols (soils with substantial accumulation of secondary carbonates), widespread in arid and semi-arid regions. A two
months field campaign was conducted at a construction site, at rest, within the city of Doha (Qatar) to measure number
concentrations of PM over a size range of 0.25-32 µm using light scattering based monitoring stations. The fPM emission
fluxes were calculated using the Fugitive Dust Model (FDM) in an iterative manner and were fitted to a power function,
which expresses the wind velocity dependence. The outcome of this study contributes to the improvement of PM emission
inventories, since it focuses on an overlooked but significant pollution source, especially in dry and arid regions, and often
located very close to residential areas and sensitive population groups.
Introduction
A major source of airborne pollution in arid and semi-arid environments, i.e. North Africa, Middle East, Central Asia, and
Australia, is the fugitive Particulate Matter (fPM), which is a frequent product of wind erosion (Tsiouri et al., 2014).
However, accurate determination of fPM is an ongoing scientific challenge (Neuman et al., 2009). Up to date, the vast
majority of studies on fPM emissions modelling covers the wind erosion of typical soils and bare land of North America and
Europe. Therefore, we focus in this study on the modelling of fPM emissions from a common soil – the Calcisols - in dry and
a semi-dry regions to understand the behaviour and obtain the emission factors of fPM produced by a specific type of soil and
surface conditions. We consider the wind erosion of loose soil owe to human activities i.e. construction earthworks.
Methodology and Results
A two months field campaign was conducted at a construction site within
the city of Doha (Qatar) to measure PM concentrations over a size range of
0.25 to 32 µm using Grimm 365 air quality monitoring stations. The time
period of the campaign was chosen deliberatively when the construction
site was at rest and the only source of particles was wind erosion of the
loose soil. FDM was implemented to calculate PM concentrations and
obtain their emission rates in an iterative procedure. The model results
were fitted to a power function, which expresses the wind velocity
dependence. The power factors were estimated as 1.87, 1.65, 2.70, and
2.06 for the four class sizes (≤2.5 µm, 2.5-6 µm, 6-10 µm, and ≤10 μm) of
particles, respectively. Overall, fitting is considered good with an adjusted
R2 varying from 0.13 for the smaller particles and up to 0.69 for the larger
ones. These power factors are in the same range of literature values for
similar sources (USEPA, 1995) as shown in Fig.1.
Conclusions
The release of PM from loose soil is poorly characterized in the literature
and widely used inventories. This is a unique study focusing on the
development of fPM emission factors from construction areas, and a specific
soil type in dry and a semi-dry regions. However, further campaigns are
necessary to reduce the uncertainty, include more fPM sources (e.g. earthworks) and other types of soils.
Acknowledgement
This work has been carried out under the jointly awarded grant to Texas A&M University (Qatar) and University of Surrey
(UK) by the Qatar National Research Fund (a member of The Qatar Foundation; grant number: NPRP 7-649-2-241). The
statements made herein are solely the responsibility of the authors.
References
Neuman, C.M., Boulton, J.W., Sanderson, S., 2009. Wind tunnel simulation of environmental controls on fugitive dust
emissions from mine tailings. Atmospheric Environment 43, 520-529.
Tsiouri, V., Kakosimos, K.E., Kumar, P., 2014. Concentrations, sources and exposure risks associated with particulate matter
in the Middle East area-a review. Air Qual Atmos Health, 1-14.
USEPA, 1995. Emissions factors & AP 42, compilation of air pollutant emission factors U.S. Environmental Protection
Agency.
Fig.1 Hatfield Tunnel and its sketch map
Fig.1 Comparison between this study (estimated emission fluxes), the proposed function and
USEPA’s AP-42 emission rates for PM10
283
SOURCE APPORTIONMENT USING PMF RECEPTOR MODEL OF AIRBORNE PM10 IN THE PORT-CITY OF
RIJEKA (CROATIA)
B. Mifka (1) and A. Alebić Juretić (1, 2)
(1) Teaching Institute of Public Health, Krešimirova 52a, 51000 Rijeka, Croatia; (2) Faculty of Medicine, Uni. of Rijeka,
Braće Branchetta 20, 51000 Rijeka, Croatia;
Presenting author email:[email protected]
Summary
This study was a part of MED project POSEIDON, with aim to compare air pollution by particulates in 4 ports: Brindisi,
Patras, Venice and Rijeka. PMF receptor model was used for apportionment of principal air pollution sources. The receptor
model was applied to existing data on air pollution with PM10, Cd, Pb, Cu, Zn, Fe, Cl-, NO3-, SO4
2-, NH4+, Na+, K+, Mg2+,
Ca2+ and 12 species of PAHs from 2008 to 2010. These constituents formed only 44 % of total PMF mass. Results obtained
from the PMF model indicated 5 principal air pollution sources/factors in Rijeka: Biomass Combustion (4%), Secondary
Inorganic Aerosols (21 %), Metal Industry (5 %), Sea Spray (8%) and Soil/Road Dust (6%). Conditional Probability Function
was used to show connection between wind directions and factors in order to determine particulate sources of PM10 air
pollution: shipyards, oil refineries, waste yards, roads, domestic heating, sea, and port.
Introduction
The air quality monitoring programme began in Rijeka in early 1970s, following the construction of new industrial facilities
in the city’s eastern industrial area (new petroleum refinery, oil burning power plant, coke plant). For this reason, the
monitoring programme has focused on air pollution caused by these industrial sources. In this study the receptor model was
therefore used to determine and quantify the impact of other sources, especially those coming from harbour and maritime
traffic.
Methodology and Results
Sampling of PM10 on quartz filters were carried by HV sampler (flow: 1 m3/min) on the roof of the Institute building. After
preconditioning and weighting the PM10 were analysed on metals (Pb, Cd, Fe, Zn, Cu) by AAS, major ions (Cl-, NO3-, SO4
2-,
NH4+, Na+, K+, Mg2+, Ca2+) determined by IC and PAHs determined by HPLC with coupled UV/Fluorescence detector (Phe,
Anth, Py, Flo, Chr, BaA, BbF, BkF, BaP, IP, BghiPe, DBA). A total of 180 samples were collected from 2008 to 2010. In
order to identify possible sources of PM10 the US EPA PMF 5.0 software was used (Cesari et.al., 2014). The input data were
concentrations and uncertainties of chemical species contained in PM10. For the analysis of the source contribution regarding
the wind directions, the daily values of the wind speed and prevailing direction were used for calculation of Conditional
Probability Function-CPF (Ashbaugh et. al., 1985). CPF estimates the probability that a given source contribution from a
given wind direction will exceed predetermined threshold criterion. The 44 % of PM10 mass was explained by measured
species, and after PMF analysis 5 factors were determined. The Metal Industry factor contribution was 5%, determined by
high Cd, Pb, NO3-, Fe and Zn concentrations and according to CPF the most possible sources of this factors were shipyards.
The most abundant factor (21 %) is Secondary Inorganic Aerosols (SIA) determined by high SO42- and NH4
+. It originated
from Oil refineries and the most common path of ships towards the harbour. The factor of Sea Spray which contributed 8%
was determined by high concentrations of ions characteristic for sea salt (Cl-, Na+, Mg2+) but also nitrate, as a result of
nitrate-chlorine depletion in aged sea salt. The Biomass Burning contribution was 4%, determined by high concentrations of
K+ ion and PAH which is characteristic for domestic heating in urban residential areas. The Dust factor contribution was 6%,
determined by high concentrations of Ca2+, Fe, Zn and Cu originating both from harbour where the metal waste and
fertilizers are reloaded and from inland metal waste recycling deposit. There is also possibility that this factor is originating
from the north-west part of city, because of resuspended road and construction site dust.
Conclusions
Combining the receptor model results with wind direction data by use of simple probabilistic function indicated possible
sources of PM10 in the city of Rijeka. The harbour contribution was found in SIA and biomass burning (fuel combustion), as
well as dust factors (fertilizer reloading in the port). Further proofs of port impact were obtained from vanadium
concentration, as well as and V/Ni ratio.
Acknowledgement
The work presented is a part of MED project POSEIDON – Pollution monitoring of ship emission: An integrated approach
for harbours of the Adriatic Basin. We acknowledge Veljko Zubak for technical assistance.
References
Ashbaugh, L.L., Malm, W.C., Sadeh, W.Z., 1985. A residencetime probability analysis of sulfur concentrations at Grand
Canyon National Park. Atmospheric Environment 19, 1263–1270.
Cesari D, Genga A, Ielpo P, Siciliano M, Mascolo G, Grasso F.M., Contini D.: Source apportionment of PM2.5 in the
harbour–industrial area of Brindisi (Italy): Identification and estimation of the contribution of in-port ship emissions.
Science of the Total Environment 497–498 (2014) 392–400,

284
TAXI TIMES EFFECT ON AIRCRAFT EMISSIONS AND POLLUTANTS DISPERSION
E. Pecorari (1), E.Innocente (1), A. Mantovani (2), D. Bassano (3), G. Rampazzo (1), L. Palmeri (4)
(1) Department of Environmental Science, Informatics and Statistics, Ca' Foscari University Venice, Calle Larga Santa Marta
2137, Dorsoduro 30123 Venezia, Italy; (2) OSMOTECH S.r.l., via Marzolo, 9 - 35131 Padova, Italia; (3) SAVE S.p.A.,
Marco Polo Venice Airport Viale G. Galilei 30/1, 30173 Tessera-Venezia, Italy; (4) Department of Industrial Engineering,
University of Padova, v. Marzolo 9, 35131 Padova, Italy
Presenting author email: [email protected]
Summary
In order to study aircraft emission impact in a very delicate ecosystem, the Venice lagoon, a study has been performed for the
Marco Polo Airport, Tessera, Venice. Emissions have been calculated with the EDMS (Emissions and Dispersion Modeling
System) andpollutants dispersion with the lagrangian particle model SPRAY5. This study was aimed to understand the
impact of taxi times on emission dispersion. Marco Polo Airport is characterized by lower taxi times respect to the EDMS
default values that are generally used. Using real times instead of deault ones both emissions and concentrations decrease.and
impact area diminishes.
Introduction
In recent years, studies that focused in aviation emissions had increased in importance, due to their impact in air quality and
public health impact. Demand for air travel has been increasing in Europe and is expected to further increase in upcoming
years. This demand is foreseen to exceed airport capacity by 2.3 million flights in the most-likely growth forecast European
scenario for 2030. Most studies highlighted that aircraft emissions have an impact on air quality in the airports (Carslaw et
al., 2006; Herndon et al., 2004) and in their surroundings (Hu et al., 2009). As a consequence an increase of aircraft
movements can affect airports air quality. The ability to quantitatively predict the effects of airport operations is of
importance for assessing the impact on air quality and health. Air pollution risk is of considerable concern for airports that
are sited near urban areas and current emission regulations had focused on local air quality in surroundings of airports.
Methodology and Results
Main exhausts have been calculated using a dedicated software, EDMS (EDMS, 2013). A special attention has been paid to
the quantity of emission emitted during the taxi phases of the LTO (Landing and Take Off) cycle that are the most impacting
phases affecting directly working people, passengers inside the airport and surroundings areas. Taxi times affect emission
factors and consequently pollutant concentrations. Average taxi times variability has been evaluated and their relative
emissions have been calculated for several time modulation.
A Lagrangian particle model, SPRAY5, (Tinarelli et al, 2000) was used to
calculate PM10 dispersion from Marco Polo Airport. It has been estimated
that changing in taxiing times from default to real can cause a 40÷60%
decrease of the PM10 concentration. It also reduces the impacted areas
predicted in the sorroundings of the airport.
Conclusions
Taxi times variation strongly depend on delays, weather conditions or airport
runaway management. Among the LTO phases, taxies seem to be the most
impacting mode. Taxi times changes can strongly affect aircraft emissions and
dispersion. A better knowledge on taxi times effects can help better managing
airports air quality impact.
References
Carslaw, D. C., Beevers, S. D., Ropkins, K., Bell, M. C., 2006. Detecting and quantifying aircraft and other on-airport
contributions to ambient nitrogen oxides in the vicinity of a large international airport. Atmospheric Environment 40, 5424–
5434.
Herndon, S.C., Shorter, J.H., Zahniser, M.S., Nelson, D.D., Jayne, J., Brown, R.C., Miake-Lye, R.C., Waitz, I., Silva, P.,
Lanni, T., Demerjian, K., Kolb, C.E., 2004. NO and NO2 emission ratios measured from in-use commercial aircraft
during taxi and takeoff. Environmental Science & Technology, 38, 6078–6084.
Hu, S., Fruin, S., Kozawa, K., Mara, S., Winer, A.M., Paulson, S.E., 2009. Aircraft emission impacts in a neighborhood
adjacent to a general aviation airport in Southern California. Environ. Sci. Technol. 43, 8039-8045.
Tinarelli G., D. Anfossi, M. Bider, E. Ferrero, S. TriniCastelli, 2000: A new high performance version of the Lagrangian
particle dispersion model SPRAY, some case studies. In Air Pollution Modelling and its Applications XIII, S.E. Gryning and
E. Batchvarova eds., Kluwer Academic / Plenum Press, New York, 499-507.
CO2
(t/y)
H2O
(t/y)
CO
(t/y)
THC
(t/y)
NMHC
(t/y)
VOC
(t/y)
TOG
(t/y)
NOx
(t/y)
SO2
(t/y)
PM10
(t/y)
Fuel
Consumption
(t/y)
Default 89563 35115 384,54 70,96 82,04 81,618 82,04 331,73 33,24 2,51 28387
Real 72209 28311 249,46 49,27 56,97 56,675 56,97 308,37 26,80 2,06 22887
Diff% 19 19 35 31 31 31 31 7 19 18 19
Fig.1 Differences in percentage between emissions calculated with Default and Real Taxi times.
Fig.2 PM10 dispersion in Marco Polo
Airport
calculated with real (left) and default (right)
values

285
INTEGRATED SOURCE APPORTIONMENT IN SUPPORT OF AOSTA VALLEY AND PIEMONTE AIR
QUALITY PLANS
G. Pession (1), T. Magri (1), G. Calori (2), M.P.Costa (2), S. Bande (3), F. Bissardella (3), M. Clemente (3)
(1) ARPA Valle d’Aosta, loc. Grande Charrière 44, Saint Christophe (AO), Italy; (2) ARIANET s.r.l., via Gilino 9, Milano,
Italy; (3) ARPA Piemonte, via Pio VII, 9, Torino, Italy
Presenting author email: [email protected]
Summary The knowledge of the origin of the main contributions to ambient concentrations is a key precondition for the elaboration of a
coherent and effective air quality plan, to focus control actions on emission sources most affecting the pollutant levels,
especially in areas where ambient air quality standards are not respected. Model-based source apportionment performed over
Aosta Valley and Piemonte regions (NW Italy) allowed to relate main emission sectors, pollutants and affected areas, thus
giving precious information to regional planners.
Introduction The attribution of contributions given by multiple emission sources to air concentrations can be achieved by using different
methodologies, either receptor-oriented or source-oriented. In the case of Aosta Valley and Piemonte regions, the need of
covering different part of the territory, together with the existence of well-established regional modelling systems fed by
regularly updated emission inventories, both routinely used for yearly assessments and daily forecasts, has determined their
use also to apportion sources contributions to ambient concentrations.
Methodology and Results The two regional modelling systems, based on FARM chemical-transport model, also includes the FARM/BFM facility,
allowing to apportion sources contributions on ambient concentrations of any target pollutant using the so called "brute force
method" (Burr and Zhang, 2011). According to it, precursors emissions are cyclically altered by the desired combinations of
sectors and geographic areas, multiple model sensitivity runs are then performed and results are finally combined with the
one from a reference run to give contributions estimates. This approach was applied to a modelling domains 90*60 km wide
with 1 km resolution (Aosta Valley) and 220*284 km wide with 4 km resolution (Piemonte), covering each region and the
adjacent parts of Italy, France and Switzerland. Fig. 1 shows as an example the variation of PM10 yearly concentrations over
Aosta Valley resulting from the sensitivity run for domestic heating emissions, evidencing the role played by the built-up
areas in the central valley as well as the smaller centers in the lateral valleys, as a result of region morphology, meteorology,
population distribution and related heating emissions. The combination of similar runs for the other sectors allowed to
estimate their relative contributions to ambient concentrations, as shown in the example of Fig. 2 for PM10 at different
locations in the region. Peculiarities were evidenced for the different pollutants and areas: the heating sector is the dominant
sector for PM10 concentrations over most of the region (also due to the use of biomasses) and for NO2 concentrations in the
lateral valleys; road traffic otherwise plays the dominant role for NO2 in the main valley (also linked to the presence of a
major highway connecting Italy and France), and is by far the main contributor to benzene concentrations; the few industrial
activities in the region give limited contributions to NO2, PM10 and SO2 concentrations in parts of the main valley; other
sectors (painting activities, off-road transport, animal husbandry) play local roles for specific pollutants.
Fig.1 Variation of PM10 concentrations produced by sensitivity run
on domestic heating sector Fig.2 PM10 main sources contributions at selected locations
Conclusions Source apportionment allowed to obtain a clearer picture of contributions from main emissions sectors to ambient
concentrations. Specificities found by area and pollutant will help the regional stakeholders in focusing the actions of their
plans aimed at improving the air quality levels of the territories of competence, as also requested by EC.
References
Burr M.J., Zhang Y., 2011. Source apportionment of fine particulate matter over the Eastern U.S. Part I: source sensitivity
simulations using CMAQ with the Brute Force method. Atmospheric Pollution Research 2, 300‐317.

286
THE IMPORTANCE OF MOTOR VEHICLE EMISSIONS ON THE PM2.5 POLLUTION OF THE CITY OF
MEDELLÍN AS DEDUCTED FROM THE HOURLY VARIATIONS IN PM2.5 CONCENTRATIONS AND FROM
CHEMICAL ANALYSIS OF PM2.5 MATERIAL
E. Posada (1), M.Gómez (2)
(1) INDISA S.A. Carrera 75 # 48 A 27, Medellín, Colombia; (2) Politécnico Colombiano Jaime Isaza Cadavid, Carrera 48 #
7-151, Medellín, Colombia
Presenting author email: [email protected]
Summary
A complete analysis of hourly time data for PM2.5 concentrations in set of sampling stations in the city of Medellín,
Colombia, shows that there is a distinct cyclical trend in the behaviour of the data; with the appearance of two peaks clearly
distinguished form the average and the lower value data. This behaviour is clearly related to the influence of vehicle traffic.
This influence was confirmed by an independent chemical analysis of PM2.5 collected in samples.
Introduction
The city of Medellín, with its growing population and vehicular traffic, is experiencing PM2.5 atmospheric concentrations that
are higher than the established standards. There are important local efforts to mitigate and solve this situation. In this sense, it
is important to clarify and stablish what are the real sources for this type of pollution. This study analyses the importance of
vehicle related emissions as a means to contribute a real knowledge of the situation and so help design solutions for it.
Methodology and Results
A complete analysis of hourly time data for PM2.5 concentrations in set of sampling stations in the city of Medellín,
Colombia, with more than 14.000 data points per station were taken into account, obtained during three years, in six sampling
stations distributed through the city. There is a distinct cyclical trend in the behaviour of the data, with the appearance of two
peaks clearly distinguished form the average and the lower value data (figure 1). This behaviour is clearly related to the
influence of automotive traffic, as industrial sources (usually is boilers and furnaces) are operated, in general, continuously.
Statistical analysis of the data and its two peaks, indicate that here is a basic background concentration, significantly affected
by variations that repeat at certain times, which coincide with the peak traffic hours and the expected atmospheric reactions
and aerosol formation associated with such emissions (which are rich in sulphate, ammonium and nitrates).
Variations contributed between 48% and 64%
to the total values.
The importance of vehicle emission was
confirmed by an independent chemical
analysis of PM2.5 collected in samples as
compared to chemical compositions of
automobile and vehicle emissions and their
associated sources (pavement, tire and brake
wear; resuspension of deposited materials on
streets and ionic materials resulting from
atmospheric side reactions).
Conclusions
It was concluded, based in the two approaches used, that motor vehicle direct and associated emissions are responsible for the
larger part of the PM2.5 concentrations in the city, with influence factors between 75% and 84 % according to the studied
site.
Acknowledgement
This work was supported by POLITÉCNICO COLOMBIANO JAIME ISAZA CADAVID and AREA METROPOLITANA
DEL VALLE DE ABURRÁ. We acknowledge the DRI Institute for the analytical assistance.
References
Posada E., Gómez M., The Effect of The Diesel Fuel Sulphur Content on the PM2.5 Pollution Problem in The Aburrá Valley
Region Around Medellín, Colombia , 8th International Conference, Air Quality - Science and Application, Athens, 19 - 23
March 2012
Evangelista M., Investigation of 1-hour PM2.5 Mass Concentration Data from EPA-Approved Continuous Federal Equivalent
Method Analyzers , April 5, 2011
Brake and Tire Wear Emissions from On-road Vehicles in MOVES2014 – EPA-420-R-14-013, December 2014
Dall’Osto M., et al, Hourly elemental concentrations in PM2.5 aerosols sampled simultaneously at urban background and road
site during SAPUSS – diurnal variations and PMF receptor modelling, Atmos. Chem. Phys., 13, 4375–4392, 2013
Fig.1 PM2.5 hourly concentrations in all sites
Hatfield Tunnel and its sketch map
0
20
40
60
80
100
120
1 2 3 4 5 6 7 8 9 10 11 12 13 14 15 16 17 18 19 20 21 22 23 24
PM
2.5
Co
nce
ntr
ati
on
s ,
mic
rog
ram
s/m
3
Hour in the dayFor all data Median, µgr/m3= 24,7 Average, µgr/m3= 26,9 Standard Deviation (SD), µgr/m3= 12,4AverageAverage +1 DSAverage - 1 DSPolynomial correlation for all data coeficiente R2 = 0,24

287
VISIBILITY IMPAIRMENT SOURCE APPORTIONMENT ANALYSIS IN AN URBAN AREA DURING 2007 TO
2009
Samaneh Sabetghadam (1), Masoud Khoshsima (2)
(1) Institutes of Geophysics, University of Tehran, Tehran, Iran; (2) Satellite Research Institute, Iranian Space Research
Center, Tehran, Iran
Presenting author email: [email protected]
Abstract
Visibility is an excellent indicator of air quality because its impairment results from light scattering and absorption by
atmospheric particles and gases. In this study, principal component analysis (PCA) method was used to analyze variations in
visibility compared with variations in meteorological variables (including wind speed, temperature, relative humidity) and air
pollutant concentrations (including SO2, CO, O3, NO2 and PM10) between 2007 and 2009, to identify the emission sources on
visual air quality over the urban city of Tehran, Iran.
Whereas the average value of mid-day visibility is around 10 km, the poor visibility is not exceeded 6 km at three stations
within Tehran urban area during the study period. PCA identified two significant components with eigenvalues greater than
one, which account for about 60% of the variance in the poor visibility data base. The poor visibility is mainly related to
PM10 concentration and industrial pollution as well as traffic emissions throughout the area. The results revealed that much of
the first principal component is based on PM10 variability, suggesting that PM10 concentration is the major contributor to
visibility deterioration in the studying area.
Keywords: Visual air quality, Air pollutant, Meteorological variables, Tehran

288
SOURCE APPORTIONMENT ANALYSIS OF ATMOSPHERIC PARTICULATE AIR MATTER OVER A
SOUTHERN MEDITERRANEAN COAST
D.Taieb (1), A.Ben Brahim (1)
(1) Applied Thermodynamics (99/UR/11-21), National Engineering School of Gabes, Omar Ibn El Khattab Street 6029
Gabès, Gabès University, Tunisia.
Presenting author email: [email protected]
Introduction
The Mediterranean basin is considered as one of the most controversial regions for aerosol transportation due to its location
at the intersection of air masses circulating among the three continents.
The Mediterranean basin is characterised by a cross road of different kinds of atmospheric PM, due to the variety of the
region around it.
In Tunisia, the industrialisation policy has started to impose some problems of pollution and the degradation of the urban
environment especially in Gabès in south Tunisia. Gabès is one of the biggest industrial cities in Tunisia. Most industries are
chemical oriented; the fast growing numbers of factories has resulted in fairly serious air pollution (Taieb and and Ben
Brahim, 2012, 2013b, 2013a). That is why, this study will provide a comprehensive report on mass concentrations and
characterisations of PM in the Gulf of Gabès, in south Tunisia.
Methodology and Results
In order to identify the source apportionment of particulate matter PM10
in the southern Mediterranean coast of Gabès (Tunisia), .The chemical
characterization included a gravimetric determination of atmospheric
particles mass concentration, measurements of the major anions (SO42–,
NO3–, Cl–) and cations (Ca2+, Mg2+, K+, NH4+) concentrations in the
aerosol samples by ion chromatography and analysis of 18 elements by
energy dispersion X-ray fluorescence. Aerosol ion balance of various
PM10 constituents are used to identify possible sources of the particulate
matters. Thanks to these
analysis, the particulate masses were reconstructed from the main
possible constituents: crustal matter, marine aerosols and anthropogenic
source.
Conclusions
Knowledge of source strengths and locations is also a valuable aid for
interpreting observations and model results and ultimately choosing
appropriate mitigation strategies.
For these reasons we have identified the qualitative composition of PM10 atmospheric aerosols in the region of Gabes, using
chemistry and mineralogy analysis.
Acknowledgement
We are thankful to the National Agency for Environmental Protection (ANPE) in Tunisia for providing the air quality data.
Also we would like to thank Mr. Remy BOUSCAREN, for his encouragement.
References
Taieb D., Ben Brahim A. « An eco-friendly process for cleaner hydrogen production: Description and evaluation», Global
journal on technology and optimization GJTO, Vol.3, No.2, June 2012, ISSN: 2229-8711 pp. 122-131.
Taieb D. and Ben Brahim, A. (2013) ‘Methodology for developing an air quality index (AQI) for Tunisia’, Int. J. Renewable
Energy Technology, Vol. 4, No. 1.
Taieb D., Ben Brahim A. « Electrochemical method for sulphur dioxide removal from flue gases: Application on sulphuric
acid plant in Tunisia » In Press, Corrected Proof, Available online 20 September 2012;
Taieb D., Ben Brahim A. « Chemistry and mineralogy studies of PM10 atmospheric aerosols in the Gulf of Gabès, South
Tunisia». Int. J. Energy Technology and Policy, Vol. 10, No. 2, 2014.
Fig.1 Source apportionment of PM10 composition

289
APPLICATION OF AERMOD FOR DETERMINATION OF AIR QUALITY IN AN INDUSTRIAL REGION,
TURKEY
Gizem Tuna(1), Hicran Altuğ (2), Tolga Elbir (1), Eftade Gaga(2)
(1) Dokuz Eylul University, Faculty of Engineering, Department of Environmental Engineering, Buca/İzmir-Turkey; (2)
Anadolu University, Faculty of Engineering, Department of Environmental Engineering, Eskişehir-Turkey
Presenting author email: [email protected]
Summary In this study, a comprehensive emission inventory was prepared including all anthropogenic pollutant sources in Kutahya
region which is located in the inner western part of Turkey. The region has many industrial facilities such as two major power
plants, mining facilities especially one of them is important lignite mine of the region and many food industry. Besides, high
PM10 and SO2 concentrations are observed in the region due to lignite with low calorific value 6280kcal/kg use in residential
areas in winter.
AERMOD was used to determine the contributions of all pollutant sources to air quality in the region. Emission inventory
and modeling studies were carried out for four primary air pollutants (SO2, PM10, NOx and CO) in the area of 140 km × 110
km for the year of 2014. In the study, pollutant sources were classified as industrial plants, residential heating and traffic.
Finally, for testing the performance of the model, model predictions and observations from the air quality monitoring stations
located in the region were compared statistically. According to comparison of the model results with observations obtained
from central station, index of agreement was found as 0.80 for SO2. There is also a passive sampling campaign conducted in
this study in 110 points for two weeks period. Addition to monitoring stations concentrations obtained from passive sampling
points was used for statistical analysis of model results.
Introduction
Because of the increase in energy use and population as well as the rapid development on industrialization, it has been
unavoidable to experience air-pollution problems in many cities around the world. Monitoring and management air quality in
the cities are the key parameters to deal with air pollution problems (Fu et al., 2013). Kütahya has high PM10 concentrations
despite natural gas mainly used in industrial plants in the city. Therefore, this study was carried out in this region.
Methodolgy and Results
Data on facilities of the industrial plants, fuel consumptions and
passing numbers of vehicles, natural gas and coal consumption
statistics in residential areas were obtained from the relevant
institutes and prepared emission inventory for SO2, PM10, NOx and
CO. According to the results of emission inventory, while
industrial plants are the most polluting sector for SO2, PM10 and
NOx, traffic is the most polluting sector for CO. There were almost
no contribution coming from traffic sector for SO2 and PM10. For
the model study, AERMOD dispersion model was used.
Considering maximum annual average SO2 concentrations, it was
dominated by thermal power plant located in Tavşanlı district.
Spatial distributions of air quality levels originating from all
pollutant sources in the region were presented as pollutant
distribution maps. According to the maps, higher SO2
concentrations were observed around thermal power plants (see
Fig.1).
Conclusion
Industry sector especially thermal power plants main reason of high SO2 concentrations in the region, but PM10
concentrations are mainly coming from mining facilities. While traffic is the most polluting sector for CO emissions,
residential heating is another important pollutant sector for CO emissions with 44% contribution value. Index of agreement
was found high according to the result of comparison of model results with the observations from central station for SO2. It
could be said that despite the uncertainties in emission inventory, model predictions are relatively good.
Acknowlegment
This research was carried out with support from the TÜB 112Y305 project, funded by the TÜBİTAK.
References
Borge, R., Lumbreras, J., Perez, J., de la Paz, D., Vedrenne, M., 2014. Emission Inventories and Modeling Requirements for
the Development of Air Quality Plans. Application to Madrid (Spain). Science of the Total Environment, 466, 809-819
Fig.1. Spatial distributions of annual average SO2
concentrations from all sources

290

291
URBAN METEOROLOGY

292

293
WIND TUNNEL EXPERIMENTS FOR DEVELOPING STREET NETWORK PARAMETERISATIONS
M. Carpentieri (1), P. Hayden (1), A. Robins (1), Z.-T. Xie (2) and O. Coceal (3)
(1) Environmental Flow Laboratory (EnFlo), University of Surrey, Guildford, GU2 7XH, United Kingdom; (2) University of
Southampton, United Kingdom; (3) University of Reading, United Kingdom
Presenting author email: [email protected]
Summary
Street network models of urban dispersion have proved successful in predicting the effect of building and street geometry on
short range dispersion. However, there remain numerous issues that limit their general applicability. DIPLOS addresses some
of these issues by focussing on the dispersion of localized releases within urban street networks, and on dispersion processes
at short range.
Introduction
The accidental or deliberate release of hazardous airborne materials
in densely populated areas is a contemporary threat that poses new
scientific and modelling challenges. The dispersion modelling
community is faced with the task of providing first responders with
models that allow for a fast but accurate prediction of plume
pathways, enabling to make informed decisions for evacuation and
sheltering procedures.
DIPLOS (Dispersion of Localised Releases in a Street Network) is a
collaborative project between institutions in the UK and France that
aims to develop and improve dispersion parameterizations in
emergency response tools like the street-network based dispersion
model SIRANE.
The specific objectives of the project are:
1) To perform detailed wind tunnel experiments, large eddy
simulations (LES) and direct numerical simulations (DNS) of
dispersion from continuous and short-duration releases in simulated
urban arrays for different geometries and wind directions under
neutral stability. This will generate a comprehensive high-quality
dataset of simultaneous flow and concentration data that will enable
fulfilment of two further objectives:
2) To quantify and parameterise the main exchange processes at
intersections and in streets of finite extent, including the effects of
secondary sources, three-dimensional flow structure, tall buildings
and wind direction.
3) To implement the new parameterisations in the SIRANE
dispersion model, to apply the model to simulate realistic case
studies in central London and to evaluate the model runs against
data from the wind tunnel and LES.
Results and discussion
The work presented here concentrates on the EnFlo wind tunnel
experiments, discussing the difficulties faced in obtaining
sufficiently high quality simulations, the results so far obtained and
the plans for further experiments.
The wind tunnel measurements include flow and concentration
profiles, flux measurements and flow visualisation experiments.
Mean velocities and turbulence were measured by means of Laser
Doppler Anemometry (LDA), while tracer concentration
experiments were conducted using two fast response flame
ionisation detectors (FFID) simultaneously.
Acknowledgement
This work was supported by EPSRC (EP/K040731/1).
Fig.1 The DIPLOS array in the EnFlo wind tunnel
Fig.2 Concentration measurements results

294
.

295
SPECIAL SESSION – AIR POLLUTION METEOROLOGY
FROM LOCAL TO GLOBAL SCALES

296

297
URBAN NEAR-GROUND LEVELS OZONE PROFILE IN THAILAND
T. Apichattam (1), S. Bualert (1)
(1) Department of Environmental Science, Faculty of Environment, Kasetsart University, Ladyaow, Chatuchuk District,
Bangkok, 10900, Thailand;
Presenting author email: [email protected]
Summary
The tendency near ground ozone concentration is toward increasing in Bangkok, Thailand and it can harmful on human
health. This study shown vertical profile of ozone and precursor gases (NOX, NO, NO2) concentrations including the
relationship between ozone and precursor gases. Ozone significant remark on highest level (110 meters) diurnal variation of
hourly average ozone was increasing after sunrise by photochemical reaction from precursor gases.
Introduction
Nowadays, the tendency near ground ozone concentration is toward increasing in Bangkok Metropolitan region of Thailand
(Pollution Control Department, 2014), where is located on the central Thailand. However ozone is occurred from Nitrogen
(NOX) which is Nitrogenoxcide (NO1) and Nitrogendioxcide (NO2) these are from vehicle and instruction by photochemical
reaction
Methodology and Results
In this study, to examine, the near ground ozone were
measured by ozone analyzer and also vertically measured
the precursor gases that are NOX, NO and NO2 by Nitrogen
oxides analyzer on three levels (30, 75 and 110 meters) at
Micrometeorological and quality monitoring station. The
station is 117 meters tower that is located at Faculty of
Environmental Kasetsart University where is a part of an
urban in Bangkok, Thailand (13.85º N, 100.34ºE) (see
Fig.1). However the result as shown in Fig.2 ozone
significant remark on highest level (110meters) was
maximum point on February that was 138 ppb. Furthermore,
diurnal variation of hourly average ozone was toward
increasing after sunrise and most time ozone was maximum
in the afternoon especially 1-3 pm (13.00-15.00) on the 110
meters of tower (60.34 ppb.). The hourly average ozone was
almost as same as in 110 meters (60.32 ppb.). Then hourly
average ozone was decreasing in the nocturnal and was
minimum in the early morning 6-8 am (6.00-8.00) at the 30
meters (6.59 ppb.) while precursor gases were increasing in
the early morning and were decreasing in the afternoon,
alternately.
Conclusions
Ozone concentration were highest concentration at 110
meters, maximum in the afternoon 1-3 pm (13.00-15.00) and
minimum in the early morning 7 am (7.00) while Nitrogen
(NOX) which is Nitrogenoxcide (NO1) and Nitrogendioxcide
(NO2) were highest concentration at 30 meters, minimum the
afternoon 1-3 pm (13.00-15.00) and maximum in the early
morning 6-8 am (6.00-8.00)
Acknowledgement
The author is deeply appreciated to Ph.D. Surat Bualert who has supported the knowledge and gave me advice. This study
could not complete if without the data from Monitoring of Meteorological and Air Quality in Thailand Station that is
supported the finance by Hydro and Agro Information Institute
References
Pollution Control Department. (2015, September). The annual report pollution of Thailand 2014. The annual report of
Pollution Control Department 2014. Abstract retrieved from
http://infofile.pcd.go.th/mgt/report2556.pdf?CFID=3944215&CFTOKEN=81647349
Fig.1 Study area in Bangkok, Thailand
Fig.2 Diurnal variation of NOx NO NO2 and Ozone
concentrations on 3 levels (30, 75, 110 meter)

298
MIXING AND DEPOSITION PROCESSES DURING LONG-RANGE TRANSPORT OF SAHARAN DUST
B. Heinold (1), K. Schepanski (1) and I. Tegen (1)
(1) Leibniz Institute for Tropospheric Research (TROPOS), Permoser Str. 15, 04318 Leipzig, Germany
Presenting author email: [email protected]
Summary
This study focuses on the important role of mixing and deposition processes on the distribution, lifetime, and particle
properties of mineral dust transported from the Saharan desert towards Europe and across the Atlantic Ocean. Regional dust
modelling is used to address the questions of (1) how the Saharan dust export towards Europe and the Caribbean region is
influenced by the atmospheric circulation over North Africa, (2) which role the different removal and mixing processes play
during long-range transport, and (3) what is the impact of dust radiative forcing on atmospheric dynamics and transport?
Introduction
As the largest fraction of particulate aerosol mass, aeolian dust from arid and semi-arid regions represents an important factor
in the Earth system. It can affect the climate directly by aerosol-radiation interactions or indirectly by modifying cloud
properties, atmospheric dynamics, and the biogeochemical cycle. In addition, soil dust has an impact on air quality and
visibility with potentially adverse effects on human health, transportation, and the solar energy production. The Sahara desert
is the most important dust source worldwide, which contributes at least 50% to the global dust load. In particular, the
Mediterranean and Southern Europe are frequently affected by Saharan dust storms, and large amounts of dust are carried
towards the Caribbean within the Saharan Air Layer (SAL), with maximum transport in late boreal spring and early summer.
During long-range transport, the dust particles are transformed by aging and mixing, which may have significant but as yet
unquantified effects on the dust impact on radiation, cloud properties, and the biogeochemical processes of ecosystems.
Methodology and Results
Aerosol transport modelling is used to investigate the export of Saharan dust towards Europe and across the Atlantic Ocean,
which are the main transport pathways. The emission, transport, dry and wet deposition of Saharan dust as well as the effect
of dust radiative forcing are simulated with the regional model COSMO-MUSCAT (e.g., Heinold et al., 2011). In addition to
the potential importance of sporadic downward mixing, a particular focus is on the effect of non-sphericity on gravitational
settling of dust particles. The COSMO-MUSCAT simulations are combined with trajectory analysis to study particle aging
and dust-cloud interactions. The model results are compared against various standard observations over Europe. In the
Caribbean region and across the
tropical Atlantic, field
measurements are available for
model evaluation from the
transatlantic cruise of the
research vessel Meteor in May
2013 (Kanitz et al., 2014) and
from the Saharan Aerosol Long-
Range Transport and Aerosol-
Cloud Interaction Experiment
(SALTRACE) at Barbados
Island in June to July 2013. First
results show that as the source
activity, dust deposition is
driven by the atmospheric
circulation patterns over North
Africa (Fig. 1). Convective mixing controls dry deposition in the tropics and can explain sporadic deposition events in the
subtropics, whereas dust transport and deposition over Europe is largely related to mid-latitude synoptic disturbances.
Conclusions
Mixing and deposition are important aspects of the atmospheric life-cycle of mineral dust, which control the distribution and
properties of dust particles. Combing 3D dust simulations and trajectory analysis, gives new insights into the different
processes associated with dust removal and ageing. Overall, this study provides an improved model-based assessment of the
varying contribution of Saharan dust to the aerosol burden in Europe and across the Atlantic Ocean.
References Heinold, B., Tegen, I., Schepanski, K., Tesche, M., Esselborn, M., Freudenthaler, V., Gross S., Kandler K., Knippertz, P.,
Müller, D., Schladitz, A., Toledano, C., Weinzierl, B., Ansmann, A., Althausen, D., Müller, T., Petzold, A., and
Wiedensohler, A., 2011, Regional modelling of Saharan dust and biomass-burning smoke Part 1: Model description and
evaluation, Tellus B, 63, 781-799, doi:10.1111/j.1600-0889.2011.00570.x.
Kanitz, T., Heinold, B., Baars, H., Skupin, A., Ansmann, A., 2014, Tracking the Saharan Air Layer with shipborne lidar
across the tropical Atlantic, Geophys. Res. Lett., 41, 1044-1050, doi: 10.1002/2013GL058780.
Fig. 1 (a) Modelled total deposition of Saharan dust accumulated over the period 1 June – 15 July 2013 and (b) relative importance of dry and wet deposition for the Atlantic.

299
MODELLING URBAN HOURLY WIND SPEEDS BASED ON MEASURED NEARBY AIRPORT WIND SPEEDS
T.-B. Ottosen (1,2), M. Ketzel (3), O. Hertel (3), J. Brandt (3), H. Skov (1,3), Sven-Erik Gryning (4), Ekaterina
Batchvarova(4,5), and K. E. Kakosimos (2)
(1) Department of Chemical Engineering, Biotechnology, and Environmental Technology, University of Southern Denmark,
Odense, Denmark; (2) Department of Chemical Engineering, Texas A&M University at Qatar, Doha, Qatar; (3) Department
of Environmental Science, Aarhus University, Roskilde, Denmark, (4) DTU Wind Energy, Risø Campus, Technical
University of Denmark, Roskilde, Denmark, (5) National Institute of Meteorology and Hydrology, Sofia, Bulgaria
Presenting author email: [email protected]
Summary
In the present study a model for the relationship between urban and rural wind speed is set up and validated against three
anemometer measurement stations. In the model, the effect of the upwind terrain is taken into account using an internal
boundary layer approach. The results show that it is possible to model the wind direction dependency of this relationship, but
major biases exist in the model.
Introduction
In semi-empirical air quality models, such as the Operational Street Pollution Model (OSPM), the urban wind speed has been
shown to be one of the most sensitive model parameters (Ottosen et. al. 2015). An accurate model for the roof level wind
speed could thus contribute greatly to the accuracy of this type of models. The urban wind speed has been extensively studied
(e.g. Fisher et. al. 2005) and many models for the urban wind speed have been developed. However, only a few model
comparisons have been performed due to a lack of urban wind speed measurements. In the present study a model is set up
and validated against three sets of anemometer data from Copenhagen, Denmark. In all cases, the input wind speed is
measured at Kastrup Airport, approximately 10 km South of Copenhagen.
Model development and measurements
In the model, the urban boundary layer is represented as a series of layers on top of each other. In each of these layers, the
neutral Monin-Obukhov Similarity Theory (MOST) profile is assumed to be valid (Hanna and Britter, 2002), but with
different roughness length and displacement height for the individual layers. The roughness length and displacement height is
calculated using morphological methods based on input regarding land use and building geometry from a Geographic
Information System (GIS). The impact of the upwind roughness length and displacement height at the receptor is modelled
using an internal boundary layer approach. The model is validated
against three sets of anemometer data: One long time series spanning 16
years and two six month campaigns. The long time series uses a cup
anemometer, whereas the two shorter campaigns use sonic anemometers.
Results
The modelled and measured relative wind speed between the airport and
the long time series station is shown in Fig. 1. The results show that the
model represents well the overall average wind speed reduction at the
urban location and some of the qualitative features of the measurements,
whereas others are significantly underestimated. A similar trend is seen
in the other measurement stations.
Conclusions
In the present study a model for the relationship between urban and rural
wind speed was set up and validated against measurements from three
stations. The results show that it is possible to reproduce the wind
direction dependency of this relationship, but that more knowledge is needed to accurately model the urban wind speed.
Acknowledgements This publication was made possible by a NPRP award [NPRP 7-674-2-252] from the Qatar National Research Fund (a
member of The Qatar Foundation). The statements made herein are solely the responsibility of the authors.
The HPC (High Performance Computing) resources and services used in this work were provided by the IT Research
Computing group in Texas A&M University at Qatar. IT Research Computing is funded by the Qatar Foundation for
Education, Science and Community Development (http://www.qf.org.qa).
References
Fisher B., Joffre S., Kukkonen J., Piringer M., Rotach M., Schatzmann M. (Eds.) 2005. Meteorology Applied to Urban Air
Pollution Problems – Final Report Cost Action 715. Demetra Ltd Publishers
Hanna S. and Britter R. E., 2002. Wind Flow and Vapor Cloud Dispersion at Industrial and Urban Sites, American Institute
of Chemical Engineers, New York.
Ottosen T.-B., Ketzel M., Skov H., Hertel O., Brandt J., Kakosimos K.E., 2015. A Parameter Estimation and Identifiability
Analysis Applied to a Street Canyon Air Pollution Model. Environmental Modelling & Software (submitted).
Fig.1 Modelled and measured median relative wind speed between the airport and the long time series as
a function of wind direction.

300
MODELING THE ASH DISPERSION AND DEPOSITION FROM THE COTOPAXI VOLCANO:
THE AUGUST 14TH 2015 ERUPTION
R. Parra (1), B. Bernard (2)
(1) Colegio de Ciencias e Ingeniería, Universidad San Francisco de Quito - Ecuador; (2) Instituto Geofísico, Escuela
Politécnica Nacional – Quito - Ecuador
Presenting author email: [email protected]
Summary
Potentially affected regions by volcanic ash should rely on information regarding the possible ash dispersion trajectories and
ground deposition patterns. On August 14, 2015, Ecuador’s Cotopaxi volcano awoke with its first significant eruption in
more than 70 years. The ash dispersion and deposition of this eruption was simulated coupling the Weather Research and
Forecasting (WRF) and the FALL3D models. Although working with preliminary Eruption Source Parameters (ESP), ash
fallout results were consistent with measurements. Modeling can be used for forecasting the ash dispersion and deposition
under defined scenarios of eruption. The approach can also be used to build ash fallout maps, as basic information for
planning and environmental management.
Introduction
Volcanic ash can cause air pollution events and have other impacts, such as damage to buildings and crops, health issues
caused by inhalation of particles, and air traffic disruptions. Regions potentially affected should rely on information regarding
the possible ash dispersion trajectories and ground deposition patterns. On August 14, 2015, Ecuador’s Cotopaxi volcano
awoke with its first significant eruption in more than 70 years. The volcano is about 50 km south of Quito (capital of
Ecuador). There were two short-duration explosions (09:30 and 19:00 UTC) with plumes of 7.8 and 9.3 km above the crater,
respectively. Ash affected towns and villages at the NW of the volcano. Based on records from a network of ash meters, the
erupted mass was estimated between 1.66± 0.24×10⁸ kg (Bernard et al., 2015).
Method and Results
The ash dispersion and deposition of this eruption was numerically simulated coupling the WRF model with the FALL3D
volcanic ash dispersion model. Preliminary ESP were used, based on the grain size distribution of the coarse fraction of
collected ash. Durations of plumes were adjusted to obtain a modeled value of the erupted mass (1.69×10⁸ kg) into the
expected range. The simulated deposit (Fig. 1) shows dominant ash fallout on the NW side of the volcano, in agreement with
observations. The comparison of ash load measurements with simulations at 14 stations of the monitoring network (Fig. 2)
gives a correlation coefficient (R2) of 0.67.
Fig.1 Modeled ash fallout (kg/m2)
Fig.2 Comparison of measurements and modeled results (R2=0.67)
Conclusions
Although working with preliminary ESP, ash fallout modeling results were consistent with measurements. Exploring
parameterization schemes and the updating of the ESP could improve the performance of numerical models This approach
can be used for forecasting the ash dispersion and deposition under defined scenarios of eruption. The approach can also be
used to build ash fallout maps and as basic information for planning and environmental management.
Acknowledgement
Simulations were performed at the High Performance Computing system at the Universidad San Francisco de Quito.
References
Bernard B., Proaño A., García J., 2015. Informe sobre dispersión y caída de ceniza asociada a la actividad del volcán
Cotopaxi durante agosto 2015. Instituto Geofísico. Escuela Politécnica Nacional.

301
MODELING THE WIND DIRECTION AND SPEED AT DIFERENT FLIGHT LEVELS OVER THE COTOPAXI
VOLCANO DURING THE ERUPTIVE PERIOD OF AUGUST 2015
R. Parra (1), H. Brumberg (2)
(1) Colegio de Ciencias e Ingeniería, Universidad San Francisco de Quito - Ecuador; (2) Earth & Environmental
Sciences, Wesleyan University – CT, USA
Presenting author email: [email protected]
Summary
Regions that are potentially affected by volcanic ash should rely on information regarding the possible dispersion trajectories.
On August 14, 2015, Ecuador’s Cotopaxi volcano awoke with its first significant eruption in more than 70 years. During this
day, the plumes reached 9.3 km above the crater (km ac). During the following days, the emissions were variable with
heights up to 3.2 km ac. The Weather Research and Forecasting (WRF) model was used for simulating the meteorology of
the period of August 14-30, 2015. Wind Direction (WD) and Wind Speed (WS) results for heights up to FL500 over the
Cotopaxi volcano were compared with data of ash plumes identified by the Washington Volcanic Ash Advisory Center
(VAAC). In comparison with observations, modeled WD was in better agreement than modeled WS. The influence of
parameterization schemes should be explored to improve the performance in modeling the WS.
Introduction
Volcanic ash can cause air pollution and other impacts, such as damage to buildings and crops, health issues and air traffic
disruptions. Potentially affected regions should rely on information regarding the possible ash dispersion trajectories. For this
purpose, the availability of historic wind roses at different heights over volcanoes could be very useful. On August 14, 2015,
Ecuador’s Cotopaxi volcano awoke with its first significant eruption in more than 70 years. There were explosions with
plumes of 7.8 and 9.3 km ac. During the following days, there were variable emissions with heights up to 3.2 km ac.
Methods and Results
Using the WRF model, meteorology of the period of August 14-30, 2015 was simulated with high spatial (4 km) and time (1
h) resolutions. Using the computed wind components for the cells over the Cotopaxi’s crater, the WD and WS were obtained,
for 15 heights varying from 1 to 15 km ac. Results were compared with 55 pairs of WD and WS of ash plumes identified in
satellite imagery by the Washington VAAC. These pairs correspond to flight levels between FL220 (FL220=220 hundreds
feet above sea level≈6.7 km asl) and FL500 (Fig. 1). The comparison of WD (Fig. 2) gives a correlation coefficient (R2) of
0.84. The value of the Gross Error is 20.6°, lower than 30°, which is considered as benchmark for meteorological mesoscale
model evaluation (EEA, 2011). The Root Mean Square Error for WS is 3.5 m/s, larger than 2 m/s, the benchmark for WS.
(a)
Fig.2 Comparison of VAAC’s and modeled WD (R2=0.84,
Gross Error=20.6°)
VAAC (b)
WRF (c)
Fig.1 (a) Ash plumes (FL300) identified by VAAC (August 14-30, 2015).
(b),(c) Wind roses from VAAC data and WRF model (FL300)
Conclusions
In comparisons with observations, computed WD was in better agreement than WS. In spite of the WS uncertainty, modeled
information is valuable to foresee the volcanic ash dispersion trajectories. The influence of parameterization schemes should
be explored to improve the performance in modeling the WS. The shown approach can be used for generating wind roses for
a representative year, under defined scenarios of eruption.
Acknowledgement
Simulations were performed at the High Performance Computing system at the Universidad San Francisco de Quito.
References
EEA, 2011. The application of models under the European Union's Air Quality Directive. A technical reference guide.
European Environmental Agency . ISSN 1725-2237.

302
INFLUENCE OF URBAN SENSIBLE HEAT FLUX ON TROPICAL ATMOSPHERIC STABILITY, BANGKOK
THAILAND
M.Putkhong1,T. Rungratanaubon1, S. Bualert1
1Department of Environmental Science, Faculty of Environment, Kasetsart University Thailand 10900.
Presenting author email: [email protected]
Summary
This study describes the relationship between temperature profile and sensible heat flux in tropical urban area. The
measurement has been operated on Kasetsart Tower (KU Tower) located in Bangkok, Thailand. The ambient temperature
was measured at three levels (30, 75 and 110meter),The sensible heat flux was measured by using Integrates open-path
analyzer and sonic anemometer (IRGASON).The meteorological parameters such as wind, humidity etc. also used to
evaluate atmospheric stability including theirs effects on vertical air pollutant concentrations. PM10 were collected at three
levels. They were used to describe the effect of atmospheric stability. The result shows that PM10 was found maximum at
110meter and minimum at 30meter.
Introduction
Bangkok is the dominant urban area, which the increase population. It is found that the pollutant can be generating by fuel
energy and combustion from traffic jam. Synoptic proxy for risky area illustrates urban heat Inland phenomena. Those effects
conduct the increase of the positive temperature gradient of the cool spot. In April, 2012 Bangkok has been maximized
temperature is 40C0 be comparable in 1979’s summer estimate by Bangkok’s microclimate station. (Queen Sirikit National
Convention Center). However, research has shown that the meteorological measuring near of Kasetsart University;
representative of a large city zones areas. The sample was collected during the summer from April to May.
Methodology and Results
In this study, we have a technique lately developed
for stability classification using ADR-1500 and
Irgason. Collected in air pollutants and Microclimate
factors are described in 2sections were estimated
between the vertically in the urban area. The
Particulate matter is evaluating against the Pasquil-
Giffort “Heat flux” PGH design, and assigns
pollution concentrations more underestimates all
peak pollutant concentrations. The PM10
concentration varied between 5.6-14 μg/m3,
respectively. Database between temperature gradient
3levels (30,75and 110meter) and sensible heat
comparing with R-Square and estimate distinction
R2 as 0.494 (temperature gradient 30/110) which
was constantly at the daytime (Q4) 07:00-18:00
am. Temperature and sensible heat flux were
respectively 34.26% and 98.89 % were exhibited
highly Unstable Class the stability class begins
turbulent-movement.
Conclusions
The temperature profile can be decrease with the
vertically height and the maximum at the ground
level (30metre). Duration in daytime the
temperature was highest in the afternoon 13.00-
14.00am. Concurrent data between Sensible Heat
flux and Temperature were increase together.
Acknowledgement
This study could not complete if without the data from Monitoring of Microclimate and Air Pollutants in Thailand. And the
author is deeply appreciated to Ph.D. Surat Bualert, who has supported the knowledge and gave me advice.
References
Queen Sirikit National Convention Center. (2013). Urban heat Island.
http://www.weatherquestions.com/What_is_the_urban_heat_island.htm.
R² = 0.4946 -40.000
-20.000
0.000
20.000
40.000
-200 -100 0 100 200 300 400
H (m/w2)
T (C0)
Fig.1 Relationship R2 between temperature gradient 30/ 110 meters and sensible heat flux
0.004.008.00
12.0016.00
1.00
3.00
5.00
7.00
9.00
11.00
13.00
15.00
17.00
19.00
21.00
23.00
PM10(µ/m)
Time
30m
75m
110m
Q2
Fig.2 Concentrations of particulate matter at 3levels

303
INFLUENCE OF TEMPERATURE INVERSIONS ON AIR QUALITY OVER TEHRAN, IRAN - A CASE STUDY
S. Torbatian (1), M. Naderi (1), V.Hosseini (2)
(1) Air Quality Control Company (AQCC), Tehran, Iran; (2) Assistant Professor of Mechanical Engineering Department,
Sharif University of Technology, Tehran, I.R. Iran
Presenting author email: [email protected]
Summary
The present study aims to examine the association between pollutant concentrations and meteorological variables throughout
a surface temperature inversion occurred over Tehran during 26th December 2014 – 3rd January 2015, which exceeded the
national standard levels for PM2.5 concentrations. During such polluted episode, the daily averaged concentration of PM10,
PM2.5, and nitrogen oxide (NO) were about three times higher than a typical day, while carbon monoxide (CO) and nitrogen
dioxide (NO2) increased by a factor of two. The hourly variations in pollutant concentrations and meteorological parameters
were analysed and the observed relationship was statistically evaluated by using the Pearson correlation coefficient. The
results indicated a negative moderate correlation (r = -0.40) with wind speed and all pollutants but ozone (O3). The effects of
other weather elements were variant depending on the pollutant .The findings highlighted the effective role of wind speeds in
comparison to other parameters in causing elevated air pollutants in Tehran, as well as their dispersion.
Introduction
Tehran’s air quality is highly influenced by meteorological parameters as well as anthropogenic emission sources. Due to the
geographic characteristics of Tehran, temperature inversions are one of the main causes of its air pollution; meteorological
factors play a significant role in increasing or decreasing the pollutant concentrations during such phenomenon (Bahari et al.,
2014). Considering this, the importance of evaluating the effects of meteorological conditions on air pollutant levels during a
polluted episode is therefore stressed.
Methodology and Results
The hourly and daily variations of PM10, PM2.5, CO, NO2, NO, and O3
concentrations were analyzed with respect to the changes in some
meteorological parameters such as wind speed, wind direction,
temperature, and relative humidity (see Fig.1). The air monitoring
measurements of Sharif station as well as meteorological measurements
of Mehrabad station were used for this study. The PM10 and PM2.5
concentration which are the critical pollutants in Tehran, varied between
25-229 μg/m3 and 10-123 μg/m3, respectively. The average wind speed
during the study period was 3 m/s (measured at 1km height) with
various directions mostly north-west to south-west. The Pearson
correlation coefficient was applied to estimate how pollutant
concentrations were related to the weather parameters during this
period. The findings revealed that PM2.5 had the highest negative
correlation (r = -0.43) with wind speed, while NO2 appeared to have the
lowest negative correlation (r = -0.30) with temperature. The vertical
temperature profile was also analyzed for the investigation of maximum
mixing height and atmospheric stability. According to the analysis, the period of study was the result of an anticyclonic high
pressure condition, which provided the stable atmospheric condition.
Conclusions
As the number of air pollution episodes in Tehran continues to increase, understanding the weather conditions and variations
in meteorological elements becomes important. The analysis of meteorological parameters could be helpful to improve the
current models for air quality forecasting, and to take effective measures in order to reduce adverse impacts of air pollution.
Acknowledgement
This work was supported by Air Quality Control Company of Tehran, which provided the air monitoring measurements.
References
Bahari, R. A., Abbaspour, R. A., and Pahlavani, P., 2014. Prediction of PM2.5 Concentrations Using Temperature Inversion
Effects Based on an Artificial Neural Network, Int. Arch. Photogramm. Remote Sens. Spatial Inf. Sci., XL-2/W3, 73-77, doi:
10.5194/isprsarchives-XL-2-W3-73-2014
Fig.1 The effects of the temperature inversion on the levels
of PM10 and PM2.5

304

305
SPECIAL SESSION – AIR QUALITY MANAGEMENT FOR
POLICY SUPPORT AND DECISIONS

306

307
LIFE-SAVING INFORMATION: MORTALITY RISK REDUCTION FROM AIR QUALITY FORECASTS
J. Aldy (1) and M.-A. Bind (2)
(1) John F. Kennedy School of Government, Harvard University; (2) Department of Statistics, Harvard University
Presenting author email: [email protected]
Summary
Fine particulate matter air pollution resulting from the combustion of fossil fuels account for about 200,000 annual premature
mortalities in the United States. We investigate how individuals seek out information regarding air quality, adjust their
behaviour in light of adverse air pollution information, and thereby mitigate pollution-related mortality risk. We focus on the
U.S. EPA air quality index forecast program (AQIF), a systematic approach to communicating day-ahead air quality forecasts
for large metropolitan areas nationwide. First, we find that online search intensity for pollution information is associated with
higher pollution levels and more adverse pollution forecasts. Second, we find that adverse pollution forecasts reduce
attendance at Major League Baseball games, conditional on realized air quality and a rich set of baseball controls. Third, we
employ two statistical approaches, one based on accurate forecasts and one based on forecast errors, to estimate the mortality
risk reduction delivered by the pollution forecasts. In the former approach, the design of the AQIF motivates a regression
discontinuity model in which we compare mortality outcomes in the neighbourhood around the thresholds that determine one
of the six color-coded categories for informing the public about the next day's expected air quality. In the latter approach, we
effectively compare mortality outcomes for a given PM2.5 concentration on days with accurate forecasts with days on which
the forecast had been for a cleaner air quality index category than was realized. In our analysis of nearly 20 major U.S. cities
over 2004-2009, we and that the program reduces about 130 premature mortalities annually associated with higher PM2.5
concentrations, which would scale to about 950 premature mortalities avoided nationally.
Introduction
Fine particulate matter air pollution resulting from the combustion of fossil fuels account for about 200,000 annual premature
mortalities in the United States ([6]). This level of pollution-related mortality reflects significant improvements in air quality
since 1970 resulting from regulations that reduce particulate matter pollution and prevented more than 180,000 premature
mortalities each year. Additional regulations to lower particulate matter-induced mortality will likely be expensive. For
example, the recently promulgated Mercury and Air Toxics Standards by the U.S. EPA would impose annual costs of about
$10 billion to prevent 4,000 - 10,000 particulate matter-related mortalities. The potentially large human health benefits and
increasing regulatory costs suggest an opportunity to explore and exploit all low-cost ways of reducing particulate matter-
related mortality.
Methodology and Results
We selected the following 18 U.S. cities based on population and air pollution levels: Atlanta, Bakersfield, Baltimore,
Boston, Charlotte, Chicago, Dallas, Denver, Detroit, Fresno, Houston, Los Angeles, Philadelphia, Pittsburgh, Riverside,
Sacramento, San Diego, and Washington DC. Cities with relatively high air pollution are more likely to have air pollution
alerts and would allow us to have more power to detect an impact of AQI forecast error on mortality. During the 2004-2009
period, these urban cities varied in population, mortality, and air pollutant concentrations. We obtained individual, daily
mortality data from the National Center for Health Statistics (NCHS) for the years 2004 to 2009. We obtained daily air
pollution concentrations of CO (ppm), NO2 (ppm), ozone (ppm) PM2.5 (µg/m3) and PM10 (µg/m3), as well as day-ahead
AQI forecast from the U.S. EPA between 2004 and 2009. We calculated the daily AQI associated with the air pollution
concentration using the AQI formula. In addition, we reviewed old newspapers for the cities in our sample to confirm that
local weather forecasts included air quality index forecast information. Note that U.S. EPA guidance on the AQIF program
includes suggested ways of communicating forecast color-coded information in newspapers, radio, and television. AQI
forecast was reported differently across time, season, and cities. For some cities, the EPA forecast data consisted of the
maximum of the six pollutant-specific AQIs or consisted of individual AQIs related to major pollutants, such as PM2.5 and
ozone. The nature of the AQI forecast data was determined by a systematic investigation in local newspapers (on January 1st
and July 1st of each year between 2004 and 2009). We then could calculate the error of AQI forecast, which corresponds to
the categorical difference between the day-ahead forecasted AQI and the actual AQI. We employ regression discontinuity
techniques to evaluate the potential impact of air quality index forecasts on various health outcomes.
Conclusions
We analyze the potential impacts that providing individuals with information about future air quality could have on
premature mortality in 18 metropolitan areas in the United States. While we find mixed evidence in city-specific time series
analyses, our panel-based analyses suggest that accurate air quality forecasts of adverse PM-2.5 pollution reduce premature
mortality. When extrapolated nationwide, our estimate of nearly 1,000 premature mortalities avoided is on par with the lower
end of the range of premature mortalities avoided from the promulgated Mercury and Air Toxics Standards regulation. This
regulation carries an estimated annual cost of about $10 billion, orders of magnitude more costly than a pollution forecast
program.
Acknowledgement
We thank Napat Jatusripitak for excellent research assistance and John White and Dianne Miller for providing air quality
index forecast data. Seminar participants at Harvard and the World Congress of Environmental and Resource Economists
provided useful feedback on an earlier version of this paper. We thank the Ziff foundation at the Harvard University Center
for the Environment.

308
ASSESSING THE ECONOMIC VALUE OF A REGIONAL AIR QUALITY PLAN
E. Angelino (1), C. Carnevale (2), F. Ferrari (3), R. Gianfreda (3) G. Guariso (4), G. Lanzani (1), G. Maffeis (3), E.
Turrini(2), M. Volta (2)
(1) ARPA Lombardia, Milano, Italy (2) DIMI, University of Brescia, Italy (3) Terraria Srl, Milano, Italy (4) DEIB,
Politecnico di Milano, Italy
Presenting author email: [email protected]
Summary
When developing an air quality plan, regional authorities usually devise a number of individual actions, constituted by the
application of both technical (end-of-pipe) and energy efficiency measures. They may range from the incentives to buy less
polluting vehicles, to the enforcement of stricter rules on domestic heating. The assessment of the economic effectiveness for
society as a whole of the individual measures and of the overall plan requires a flexible support system able to quickly
perform air quality impact evaluations on the specific area. One such systems is RIAT+, a software package developed
during a series of European research projects, that has been used to evaluate costs and benefits of the Lombardy Region Air
Quality Plan (PRIA). The paper discusses the basic issues dealt with during this evaluation and critically reviews the results.
Introduction
As it clearly emerges from the preamble to Air Quality Directive 2008/50/EC (AQD), European air quality legislation puts
the main emphasis on protecting human health and the environment as a whole and stresses that “it is particularly important
to implement the most effective emission reduction measures at local, national and Community level.” It is thus required that
an air quality plan is adopted, particularly by all the regions suffering for air quality conditions that are considered poor with
respect to the European standards. Possible reduction measures may fall in a very wide range and involve many different
sectors. It is thus important that those finally included in the plan are not only effective from the point of view of reducing air
pollution, but also constitute the most efficient ones from the viewpoint of public investment. Such an analysis has been
conducted within the recent plan of Lombardy region using an Integrated Assessment Modelling (IAM) package (Carnevale
et al., 2012a).
Methodology and Results
The overall approach followed for the assessment is sketched in fig. 1.
The definition of a specific scenario (some or all PRIA measures) is
split into energy efficiency one (entailing a certain benefit representing
the energy savings) and end-of-pipe ones, the adoption of which has a
certain cost. The adoption of each measures means a certain change in
the emission, which is distributed over the regional territory in
different way, depending on the type of measure. A shift of the car
fleet to a different EURO class, for instance, means an emission
reduction only on the road network, while better heating system reduce
emission on urban areas.
To evaluate the effects of these emission changes, instead of
implementing a full chemical transport model, which will be computationally
too heavy, RIAT+ (www.operatool.eu) adopts a surrogate model, calibrated on
few CTM results (Carnevale et al., 2012b). From the results of the surrogate
model (see fig. 2), using the well-known impact pathway approach, it is possible
to evaluate the improvements in the health of the population and the consequent
reduction of external costs.
The final economic assessment is thus obtained by comparing the sum of energy
savings and external cost reductions with the implementation costs of the
corresponding measures.
Conclusions
Assessing the economic value of an air quality plan is a complex task, that
requires the estimation of the costs and the benefits of both end-of-pipe and efficiency measures. These measures must be fed
into a decision support system including a calibrated air quality model to understand the efficiency of each single measure
and of the overall plan. The application of the RIAT+ system to the Lombardy Region air quality plan showed that it has a
positive economic balance.
Acknowledgement
This work was supported by “Progetto VALUTA” of ARPA Lombardia.
References
Carnevale C., Finzi G., Guariso G., Pisoni E., Volta M., 2012a. Surrogate models to compute optimal air quality planning
policies at a regional scale. Environmental Modelling & Software 34, 44 - 50.
Carnevale C., Finzi G., Pisoni E., Volta M., Guariso G., Gianfreda R., Maffeis G., Thunis P., White L., Triacchini G., 2012b.
An integrated assessment tool to define effective air quality policies at regional scale. Environmental Modelling & Software
38, 306 - 315.
Fig.2 Average yearly PM10
concentration adopting PRIA measures
Fig.1 Scheme of the overall assessment procedure

309
INTEGRATED EFFECTS OF NESTING, HORIZONTAL RESOLUTION AND LOCAL INFORMATIONS ON
AIR QUALITY FORECAST PERFORMANCE AT DIFFERENT SCALES
A. D’Allura (1), A. Bolignano (2), F. Stel (3), G. Pession (4)
(1) ARIANET Srl, Via Gilino 9, 20128 Milano, Italy; (2) Arpa Lazio, via Garibaldi 114, 02100 Rieti, Italy; (3) Arpa Friuli
Venezia Giulia, Via Cairoli 14, 33057 Palmanova, Italy; (4) ARPA Valle d’Aosta, loc. Grande Charrière 44, Saint
Christophe, Italy;
Presenting author email: [email protected]
Summary
The integrated forecasting system QualeAria (www.qualearia.eu) is up and running since 2007 with the main aim to provide
meteorological and air quality fields to drive regional/urban modelling downscales. This is currently performed through the
forecast systems of some of the Italian Regional Environmental Agencies, that fed by QualeAria products are used to provide
information to the public and support daily air quality management. The comparison of forecasts against observations, made
across scales and system, has evidenced the role of phenomena generated at regional/global scales, along with the key role of
fine grained information available at local scale (e.g. improved emission inventory, topography and land use description).
Introduction
According to European Directives, incorporated as well by the Italian legislation, air quality models have been adopted by
some of the Regional Environmental Agencies (among the others ARPA Lazio, ARPA Friuli Venezia Giulia and ARPA
Valle d’Aosta) as support for assessments and monitoring of the state of the atmosphere. Their use in predicting high
concentrations episodes two or more days in advance has become a key factor in defining new mitigation strategies and
communicating to the population. Their accuracy is progressively improved by implementing state of the art models, fed by
proper dynamic boundary conditions accounting for larger context along with accurate emissions inventories. The last
element is especially relevant when increasing the modelling spatial details over the target area of interest, as is the case of
Rome (http://www.arpalazio.net/main/aria/), Valle d’Aosta (VdA) (http://www.arpa.vda.it/) and Friuli Venezia Giulia (FVG)
(http://www.arpa.fvg.it/), where innermost nests reach 1 km of resolution.
Fig.1 Modelling downscaling from global to local. Fig.2 Integrated air quality forecast system
framework.
Methodology and Results
QualeAria and local air quality forecast systems are based on FARM (Flexible Air quality Regional Model), a 3D Eulerian
model simulating dispersion and chemical reactions of atmospheric pollutants, and share the same modelling framework as
shown in figure 2, but with different meteorological driver. The prognostic meteorological models, that provide the
downscaling of synoptic weather forecast on the computational domains of interest are RAMS for QualeAria and Rome,
WRF for FVG and COSMO for VdA. A meteorological interface module (GAP+SURFPro) then matches the standard output
from the meteorological driver with the needs of FARM (grid adaptations, diffusion parameters, deposition velocities, etc.);
EMMA (Emission Manager), prepares gridded hourly emissions of all the pollutants considered starting from detailed
inventories. Updated and consistent boundary conditions are provided by the cascade of larger scale systems: ECMWF
MACC C-IFS-TM5 (part of the Copernicus Atmosphere monitoring service) at global level, and then QualeAria over Italy,
up to 5 days ahead. The comparison of modelled concentrations against the values measured at air quality stations of the
regional monitoring networks, for specific episodes and on a statistical basis over a year, is part of the periodical activities of
forecast services. Results across the scales of the different systems have evidenced as the increase in resolution and an
accurate description of emissions from local inventories can lead to better forecast performances, especially for NO2 and PM
maxima; on the other side, a correct reproduction of ozone maxima and a proper PM background is strongly linked to an
appropriate downscaling from the continental scale.
References
Kukkonen J, Olsson T, Schultz M, Baklanov A, Klein T, Miranda I, Monteiro A, Hirtl M, Tarvainen V, Boy M, Peuch V.-H.,
Poupkou A, Kioutsioukis I, Finardi S, Sofiev M, Sokhi R, Lehtinen J, Karatzas K, San Josè R, Astitha M, Kallos G, Schaap
M, Reimer E, Jakobs H, Eben K (2012). A review of operational, regional-scale, chemical weather forecasting models in
Europe. Atmospheric Chemistry and Physics, vol. 12, p. 1-87, ISSN: 1680-7316, doi: 10.5194/acp-12-1-2012

310
MODELLING AMBIENT AIR QUALITY USING A SECTOR BASED LAND USE REGRESSION TECHNIQUE
Aoife Donnelly1*, Owen Naughton2, Bruce Misstear1, Francesco Pilla1, Brian Broderick1
1Department of Civil, Structural and Environmental Engineering, University of Dublin Trinity College, Dublin, Ireland;
2Department of Civil Engineering, National University of Ireland Galway, Galway, Ireland *Corresponding author: [email protected]
Summary
This paper describes the development of a land use regression (LUR) model for the estimation of background air quality
across the Republic of Ireland for the criteria pollutants NO2, PM10, PM2.5, SO2 and O3. This study forms part of an integrated
collection of air quality forecast models and spatial mapping tools which require only simple input data and low
computational resources, collectively known as the Irish Air Quality Modelling Suite (EirQMS). The LUR model has been
spatially refined by calculating predictor variables within wind-dependent sectors or “wedges”, and comparing against long-
term average pollutant concentrations within each sector.
Introduction
Poor ambient air quality can affect public health; result in increased mortality rates and impact on sensitive ecosystems. The
importance of ambient air quality to environmental and health policy thus led to the introduction of the Ambient Air Quality
and Cleaner Air for Europe (CAFE) Directive (2008/50/EC), a legislative framework promoting good air quality. Member
states are required to demonstrate compliance with limit values and also to interpret pollution levels in terms of geographical
distribution and collective population exposure. This work presents a novel statistical method of utilising air quality data
collected as part of the regulatory process to produce national scale maps of ambient air quality for Ireland.
Methodology and results
Within a setting of relatively limited monitoring and emission data availability, LUR
was selected as the most appropriate technique to elucidate the spatial variation of
pollutant concentrations and its relationship to local and regional emission sources.
Circular buffers were delineated around monitoring sites at varying distances (50m –
5km), and further subdivided into wind direction sectors (e.g. N, NE, E, etc.).
Geospatial datasets representing key emission sources were identified for each
pollutant (e.g. traffic, land-use, coal burning houses). LUR predictor variables were
then derived within each sector. Annual mean concentrations from each of 45 (active
and closed) air quality monitoring sites were calculated for each of the wind sectors
by pairing measured meteorological data with the relevant air quality monitoring
point. The division of a concentration time series at a point into 8 sectors maximises
the number of data points available for the LUR; however, it also reduces data points
available for long-term mean value calculation. Diurnal and seasonal concentration
variations may lead to a biased annual sector average estimate when calculated from
sub-annual datasets. A kernel regression based correction technique was thus
employed correct the data for such biases (Donnelly et al., 2015). NO2, O3 and PM2.5
results were highly satisfactory with model r values of 0.89, 0.82, and 0.71,
respectively. A limited number of monitoring stations together with a bias in the
monitoring network (which was identified as part of this work) resulted in poorer fits for PM10 and SO2 (0.46, 0.58,
respectively). However, for all pollutants the work has contributed to an increased understanding of the role of natural and
anthropogenic emission sources on local and regional scale air quality in Ireland.
Conclusions
The output from this modelling work is a set of annual mean maps for each of NO2, PM10, PM2.5, Ozone and SO2. The NO2
maps shows the dominant influence of traffic emissions on national (and urban) NO2 concentrations. PM10 shows increases
near coastal regions and also in regional towns due to the effects of solid fuel burning. PM2.5 increases near major roads due
to fine particulate emissions. As expected, ozone shows increases near coastal regions and decreases in heavily traffic areas
where there are elevated NO emissions. The SO2 map was limited by the number of monitoring stations available within each
air quality zone. However, the clear influence of the coal ban zones can be observed in the final map.
These annual mean maps can be used for a variety of purposes:
Direct analysis of air quality anywhere in Ireland
For Assistance in determining appropriate areas to locate future air quality monitors (minimise monitor placement bias)
Personal exposure studies.
This methodology is being explored to provide real-time regional air quality forecasts, through integration with a statistical
forecast model which currently provides predictions of daily pollutant concentrations at selected monitoring sites.
Acknowledgements
This work has been funded by the Irish Environmental Protection Agency under the Strive 2006-2013 research programme.
References
Donnelly, A., Naughton, O., Misstear, B. and Broderick, B. (2015). Maximising the spatial representativeness of monitoring
data using a combination of local wind-based sectoral division and seasonal and diurnal correction factors. In preparation.
Figure 9 Annual mean PM2.5
map

311
STATISTICAL ESTIMATION OF LOCAL AMBIENT AIR QUALITY
I. Matyasovszky (1) and K. Labancz (2)
(1) Department of Meteorology, Eötvös Loránd University, Budapest, P.O.Box 32., H-1518, Hungary; (2) Hungarian
Meteorological Service, Budapest, P.O.Box 39., H-1675, Hungary
Presenting author e-mail: [email protected]
Summary
Estimation of the level of ambient air pollution is a complicated task, which includes concentration measurements, modelling
of dispersion and transport of air pollutants and estimation of possible effects of a large number of different local sources.
Understanding of spatiotemporal variability in ambient air pollutant concentrations in urban areas is useful in many contexts
and needs additional, mainly statistical estimation tools. This study presents a newly developed statistical method, which can
be a useful tool in planning an aimed measurement campaign to estimate the local ambient air quality around a new source.
By the aid of this method the necessary time length and the best starting date of the measurement campaign can be estimated.
Introduction
Observation of mean concentrations and possible exceedances of short term limit values around local point sources needs a
large number of measurement points. In absence of a dense monitoring network, the best way is to combine targeted
measurements and statistical estimation methods. This work presents a new statistical method for calculating the necessary
time length of a measurement campaign to be carried out to estimate the local ambient air concentrations around a source. There are two practical problems which make the estimation difficult: one is that often there are no measurements previously
performed at the area nearby a source, the other is that the time disposable for performing necessary measurements is highly
restricted, no more than a few months. In this study, the length of the measuring period is optimised by two different
estimation methods, followed by a method for estimating the number of limit value exceedances.
Methodology and Results
A suitable dataset to conduct the statistical modelling was obtained from the National Urban Air Quality Monitoring
Network. This ambient air monitoring program continuously observes the hourly and daily means of concentrations of 12
pollutants and 5 meteorological parameters. Data of 8 monitoring stations located in downtown and suburban areas of
Budapest were available for the period of 1991– 2013. To estimate the optimal length of a measuring campaign, two
important concentration measures – daily mean and limit value exceedance – were examined. The first question addressed
was how many daily measurements are needed to ensure that the mean of these daily mean measured values lies within a
specified interval of the expected value with a large probability. A much simpler and practically useful approach is to take the
background concentration as the average concentration of a given particular year, hence the second question is how long
measuring period shorter than one year is necessary to form an average (within-year average) enough close to the annual
average. The answer for the second question depends on the starting date of measurements due to the annual course of
pollutants concentrations. Fig.1 shows the minimum necessary measurement lengths for daily mean SO2 concentrations.
Months in the horizontal axis refer to the starting date of the measurements. The most appropriate start of the measurement
campaign is in August (40 days) and July (85 days), or in February (120 days) in case of a winter starting. These measuring
periods satisfy practical possibilities.
In addition to the average concentrations, the limit value exceedance should be examined in the prevailing measurement
campaign. New statistical formulae developed for this purpose are being tested currently. The core of the method is to join
typical meteorological conditions accompanied by possible limit value exceedances.
References
Marshall J.D., Nethery E., and Brauer M., 2007. Within-urban variability in ambient air pollution: Comparison of estimation
methods. Atmos. Environ. 42, 1359-1369.
Fig.1 Necessary measurement length in days for estimating daily average concentration of SO2.

312
THE USE OF SODAR MEASUREMENTS IN ASSESSING ANEMOLOGICAL CONDITIONS OF KRAKOW
L. Osrodka, E. Krajny
Department of Monitoring and Modelling of Air Pollution, Institute of Meteorology and Water Management National
Research Institute (IMWM-NRI), Branch in Cracow, Bratkow 10, 40-045 Katowice, Poland
Presenting author email: [email protected]
Introduction
Geographical location of Krakow in the terrain with diverse surface features with dominant parallel course in the valley of
deep valley the Vistula river causes development of specific local climate conditions. Almost all meteorological elements are
subjects of considerable modifications a result of mutual impact of topographical conditions and urbanization. Additionally,
considerable municipal, traffic and part industrial emissions, put the city in risk of episodes with high concentration of air
pollutants. The main causes responsible for such situation are air temperature and wind (particularly vertical its profile).
Methodology and Results
Existing results from studies on anemological conditions in Krakow obtained mainly from land stations, but also from sodar
measurements conducted at the turn of 20th and 21th century in the station in Czyzyny, show that air flow in near-ground
layer air in Krakow is determined mostly by general atmospheric circulation of atmosphere. Location of Krakow in the
Vistula valley in direction W - E, surrounded by hills from its northern and southern side determines the shape of wind rose.
On the area covering Krakow wind from western directions dominates, but wind from eastern directions occurs very often.
Characteristic feature of anemological conditions in Krakow is a frequent the occurrence lack of weather calm wind during
ayear (approx. 20-30%), as well as occurrence of very weak gentle wind (approx. 40%) of speed lower than 2 m/s during a
year. Measurement experiments with the use of sodars of different class which were conducted in previous years proved
usefulness of such devices in evaluating anemological conditions of the city, but the measurement technologies made it
difficult to use results for modelling purposes. Therefore, after many years and with different technological opportunities a
new type of sodar was used to support studies on wind field in Krakow.
The sodar purchased under the project (Sound Detection And Ranging) PCS.2000-24 produced by METEK® is an active
surface-based remote sensing device Its operating principle is based on the Doppler effect, therefore it is called a Doppler
sodar. It is used to measure physical properties in vertical profile of boundary layer of atmosphere, in particular speed and
direction of wind, class of atmospheric stability and identification of inverse inversion layers. Working parameters of the
METEK® Sodar PCS.2000-24 are as follows: frequency 1.5 … 2.6 kHz, minimum measuring height ≥ 15 m, vertical
resolution height resolution ≥ 5 m, standard measuring height up to 500 m.
As it was mentioned before sodar measurements made in the framework of the project MONIT-AIR “Integrated monitoring
system of spatial data to improve air quality in Krakow” (http://www.ekocentrum.krakow.pl/742,a,monit-air.htm), are used
mainly to study ventilation conditions of the city and to provide specialised empirical data for calibration and verification of
the wind field model in the city. Therefore they require proper preparation and development of data necessary for modelling.
Some measurement data obtained directly from measurement can be useful without prior processing. These are:
determining wind vector above 30 - 500 m,
with vertical resolution of 10 m,
determining thermal and dynamical properties of atmosphere through parameterisation to so called atmosphere
stability classes,
assessment of altitude on which inversion layers occur.
Conclusions
Measurement of vertical physical properties of atmosphere with the use of such device for the very first time took place in
December 2014. Since then two three measurement campaigns were conducted: at the III Campus of the UJ (meteorological
station of the Institute of Geography and Spatial Management at Gronostajowa str.) and at Municipal Water Supply and
Sewerage Company, Water Treatment Plant “Bielany” at Ks. Jozefa str. and reservoir of Krzemionka at Swoszowicka 8 str.
Upon further continuation of the project it is planned to conduct sodar measurements in next few points in the city.
Preliminary results of studies on physical properties of near-ground layer of the with the use of sodar in places of its present
localization will be shown in the presentation. They were referred to meteorological conditions occurring in land stations as
well as in upper atmosphere indicating importance of air masses inflow on shaping wind profile in ground level atmosphere
and in various topographic conditions.

313
A METHODOLOGICAL APPROACH INQUANTIFYING UNCERTAINTIES OF AIR QUALITY HEALTH
IMPACT ASSESSMENTS
D. A. Sarigiannis (1), P. Kontoroupis (1) , C. Schieberle (2), B. Miller (3), V. P. Singh (4)
(1) Environmental Engineering Laboratory, Department of Chemical Engineering, Aristotle University of Thessaloniki, GR-
54124, Thessaloniki, Greece; (2) Institute for Energy and Economics and the Rational Use of Energy (IER), University of
Stuttgart, Stuttgart, Germany; (3) Institute of Occupational Medicine, Edinburgh, United Kingdom; (4) Centre for
Atmospheric and Instrumentation Research (CAIR), University of Hertfordshire, Hatfield, United Kingdom
Presenting author email: [email protected]
Summary
Evaluation of uncertainty in complex health impact assessment of air pollution is usually disregarded regardless of its
importance. The reasons behind this arise due to the inherent complexity in the processes involved, the lack of knowledge on
the parameter distribution and most importantly due to the lack of a framework to assess the uncertainty. This paper presents
a methodological framework to estimate explicitly the uncertainty associated with the health impact from exposure to PM2.5
in the city of London.
Introduction
Uncertainty in atmospheric transport and dispersion is usually associated with the modelling input (e.g. the emissions and the
meteorological input), the parameterization (e.g. the vertical turbulent mixing, the wet scavenging, the horizontal turbulent
mixing, the dry deposition) and the practical solution of transport and diffusion equations (Dabberdt and Miller, 2000; Diez et
al., 2014). In all cases uncertainty is computed in accordance to the modelling components, since the chemical and physical
processes modelled are not linear and some of the uncertainties present may compensate each other.
Methodology and Results
A methodological framework to explicitly estimate
uncertainties associated with the health impact from
exposure to pollutants is generated. The proposed
uncertainty framework consists of a combination of
qualitative and quantitative assessment tools categorized
into three tiers. Tier 1 corresponds to the qualitative
part, where all sources of uncertainty are tabulated in a
matrix, annotating uncertainty’s direction, level and
appraisal of the knowledge-base; tiers 2 and 3 involve
the quantitative evaluations of those sources of
uncertainty with the highest degree of influence to the
final result(s), provided sufficient information and
resources are available.
The statistical methods employed include screening
methods utilizing the local and global sensitivity
algorithms (tier 2), the Bayesian theory and Monte Carlo
Simulation methods (tier 3). In order to conduct an
uncertainty assessment, a flow chart of calculations needs to be decided upon which analysis is based. In particular, the chain
of calculations required to conduct the health impact assessment due to PM2.5 exposure is depicted in figure 1. This flowchart
is subjective as it is based on the scope of the assessment, the data availability and the available modelling resources.
Conclusions
This paper presents a holistic approach to identify and quantify the uncertainties arising across the process of
assessing the health impact. The main relevant uncertainty sources include emissions in transportation, the associated
urban PM2.5 concentration and exposure modeling. The uncertainty approach employed depends on the limitations
imposed by the complexity of the models and the scientific soundness.
References
Dabberdt Wf, Miller E. Uncertainty, ensembles and air quality dispersion modeling: Applications and challenges.
Atmospheric Environment 2000; 34: 4667-4673.
Diez S, Barra E, Crespo F, Britch J. Uncertainty propagation of meteorological and emission data in modeling pollutant
dispersion in the atmosphere. Ingenieria e Investigacion 2014; 34: 44-48.
Figure 1. Framework (a) full chain health impact and (b)
tiered uncertainty assessment

314
EFFECT OF OZONE ENRICHED WATER AS BIOCIDE ON AIRBORNE BACTERIAL AND FUNGAL
CONCENTRATION IN INDOOR ENVIRONMENT
Sivasakthivel S (1) and N.Nandini (2)
(1) Research Scholar, Department of Environmental Science, Bangalore University, Bengaluru-56, Karnataka, India; (2)
Professor and Chairperson, Department of Environmental Science, Bangalore University, Bengaluru-56, Karnataka, India
Presenting author email: [email protected], [email protected]
Summary
Application of Ozone in gas form is considerably a risk of ozone related respiratory health problem for humans. The
microbicidal activity of Ozone enriched water was studied against indoor bioaerosol. In this investigation, the effects of
ozone enriched water concentration; contact time and relative humidity (RH) on inactivating airborne bacteria and fungal
aerosols by ozone were evaluated in a public toilet. It was observed that the survival fraction of airborne bacterial and fungal
aerosol decreased exponentially with increasing ozone dose and exposure time. Airborne bacteria and fungi required ozone
doses of 1.4 mg/L to 2.0 mg/L for 80.2% and 90% inactivation, within 30 mins respectively. The results indicate that the
0.8mg/L ozone concentration resulted 47.3% of the microbial free environment within 30minutes exposure which is ideal
for indoor application and it may control the bioaerosol for longer time and exhibit the ozone in tolerable limit. 0.8mg/L
concentration of ozone water, perhaps releases ozone in the form of gas as 0.016mg/m3 which falling within the permissible
limit of ambient air quality standard (AAQM) prescribed by the Central pollution control board, India and US-EPA air
quality standard. The detailed study confirms that application of ozone in liquid form may be the appropriate method for
improving indoor air quality.
Introduction
Microbial contamination includes bacteria, fungal spores and pollens, algae, proteins and viruses in indoor air air play
important roles in public health and climate (Despres et al., 2012; Fiegel et al., 2006; Sun and Ariya (2006). Indoor air quality
is affected by many factors like accumulation of microorganisms in
air conditioning systems, microorganisms from outdoor source,
contamination of building materials and poor hygiene (Aakash
Khurana, 2003). Microbiological air quality management in indoor
environment is an important criterion that people spent more time
in an indoor environment. Periodic cleaning of the indoor
environment, common disinfectant does not eliminate all
microorganisms which can cause variety of health problems
including hypersensitivity, pneumonitis, sick building syndrome,
legionnaire’s disease, asthma and allergies in humans. The present
study was made an attempt to develop a novel method using zone water to provide a microbial free environment.
Methodology and Results
Ozone enriched water was prepared following bubble diffusing method by passing oxygen through an Ozone generator
model TL03 at a fixed voltage (230 V), and a constant flow rate of 20 L h-1 (Langlais et al., 1991). The generated ozone was
passed through Teflon tube into double distilled water under cold condition, because a fall in the temperature of the aqueous
medium increases ozone solubility, augmenting its availability in
the medium (Fig 1). The active ozone concentration in liquid
(55.2 mg/L =0.05mg/ml) was determined by modified Indigo
method (Bader and Hoigne, 1980) and stored in a dark room. The
ozone water was diluted to 100ml of double distilled water in
different concentration like 0.2mg/L, 0.4mg/L, 0.8mg/L, 1.0mg/L,
1.2 mg/L, 1.4 mg/L, 1.6 mg/L, 1.8 mg/L and 2.0 mg/L nd sprayed
in pubic toilets.Bioaerosol samples were trapped on bacterial and
fungal media. The experimental results showed that ozone water
used in these experiments effectively cleared the microbial
pollution in indoor air. Ozone contains molecules of three unstable
oxygen atoms (O3) and will break down quickly and form radicals, have a high oxidation potential or redox makes it a strong
oxidizer and disinfectant. The 0.8mg/L concentration of ozone water, perhaps releases ozone in the form of gas as
0.016mg/m3, which falling within the permissible limit of ambient air quality standard (AAQM) prescribed by the Central
pollution control board, India. The permissible limit for ozone is 180 µg/m3 (0.18mg/m3). The results indicate that the
0.8mg/L ozone concentration resulted 47.3% of the microbial free environment within 30minutes exposure, which is ideal
for indoor application and it may control the bioaerosol for longer time and exhibit the ozone in tolerable limit.
Conclusions
The present study revealed that Ozone enriched water significantly reduced the bioaerosol in indoor environments.
Application of Ozone water concentration ranges from 0.2mg/L to 2.0mg/L are within the safer zone prescribed by USEPA,
USA and AAQM, India . The detailed study confirms that application of ozone in liquid form may be the appropriate
method for improving indoor air quality.
References
Chun-Chieh Tseng., Chih-Shan Li. (2006). Ozone for Inactivation of Aerosolized Bacteriophages. Aerosol Science and Technology, 40:683–
689. Yang-Le Pan., Joshua L.Santarpia., Shanna Ratnesar-Shumate., Elizabeth Corson., Jonathan Eshbaugh., Steven C.Hill., Chatt C.Williamson.,
Mrk Coleman., Christopher Bare., Sean Kinahan. (2014). Effects of ozone and relative humidity on fluorescence spectra of octapeptide
bioaerosol particles. Journal of Quantitative Spectroscopy & Radiative Transfer. (133), 538-550.
Fig 2: Total aerosol reduction at different ozone water
exposure time
Fig 1: A- Schematic diagram of Ozone water
generation; B- Laboratory set up for ozone water
0
100
0.2 0.6 1 1.4 1.8% A
ero
sol
red
uct
ion
Ozone concentraton mg/L
5mins
10mins
15mins
20mins

315
APPRAISAL, A FP7 PROJECT ON INTEGRATED ASSESSMENT MODELING FOR REGIONAL AIR
QUALITY POLICY
M. Volta1, G. Guariso17, J.M. Baldasano15, C. Belis2, N. Blond5, C. Bouland14, C. Carnevale1, A. Clappier6, J. Douros7, G.
Finzi1, A. Graff16, S. Janssen3, K. Juda-Rezler11, N. Karvosenoja4, G. Maffeis12, A. Martilli13, A. Miranda8, Z. Nahorski10, E.
Pisoni2, M. Rasoloharimahefa14, E. Real9, H. Relvas8, P. Thunis2, E. Turrini1, P. Viaene3, L. White18
1 DIMI, University of Brescia, Brescia, Italy; 2 European Commission, JRC, Institute for Environment and Sustainability, Air
and Climate Unit, Ispra (VA), Italy; 3 VITO, Mol, Belgium; 4 Finnish Environment Institute (SYKE), Helsinki, Finland; 5
CNRS, Laboratoire Image Ville Environnement, Strasbourg, France; 6 University of Strasbourg, Strasbourg, France;
Department of Mechanical Engineering, Aristotle University of Thessaloniki, Thessaloniki, Greece; 8 University of Aveiro,
Aveiro, Portugal; 9 INERIS, National institute for industrial safety and environmental protection, Verneuil-en-Halatte,
France; 10 Systems Research Institute, Polish Academy of Sciences, Warsaw, Poland; 11 Faculty of Environmental
Engineering, Warsaw University of Technology, Warsaw, Poland; 12 Terraria Srl, Milano, Italy; 13 CIEMAT, Institute for
Environment, Madrid, Spain; 14 Research Center of Environmental Health and Occupational Health, Université Libre de
Bruxelles, Bruxelles, Belgium; 15 BSC-CNS, Earth Sciences Dept., Barcelona, Spain; 16 Umweltbundesamt, Dessau-Roßlau,
Deutschland; 17 DEIB, Politecnico di Milano, Milano, Italy; 18 Aeris Europe, West Sussex, United Kingdom
Presenting author email: [email protected]
Summary
According to World Health Organization (WHO), poor air quality causes thousands of premature deaths in Europe each year.
The measures adopted by the European Union are not sufficient to solve this issue in the most critical areas of the Member
States. So, regional and local authorities are required to design air quality plans, to complement the EU level policies. The
FP7 APPRAISAL project identifies the current European best practices and proposes an integrated methodological approach
to support local authorities in designing Air Quality (AQ) plans.
Introduction
Exceedance of air quality limit values in urban areas in Europe remains widespread, particularly for PM, NOX and O3. This is
not only an issue of compliance; it also has significant implications on European citizens’ health and well-being. In response
to this issue, EU regions have to devise “air quality plans and programmes” as requested by the European Commission
96/62/EC Directive, updated in the 2008/50/EC Directive and in the Commission Implementing Decision 2011/850.
APPRAISAL project (www.appraisal-fp7.eu), funded within of the Seventh Framework Programme (FP7), aims at
supporting the regions' activities by providing a survey of the current state-of-the-art in Europe and a framework for an
integrated approach to this problem.
Methodology and Results
The APPRAISAL results are:
1. The overall review, and collection in an online database, of the Integrated Assessment methodologies used in different
countries at regional and local scale, from the simple (scenario analysis) to the more comprehensive (cost-benefit, cost-
effectiveness analysis). This includes evaluating both top-down and bottom-up approaches to systematically analyse their
strengths and weaknesses and to identify key areas to be addressed by further research.
2. The design of an Integrated Assessment Modelling framework, based on the information collected during the review
process, for different policy-maker requirements, model capabilities and levels of data completeness (AQ plans taxonomy). It
is based on the DRSIR framework (EEA 2007) and defines two decision pathways:
Scenario analysis. The emission reduction measures are defined based on expert judgment or source apportionment, and
their effect is tested through simulation of foreseen emissions. Though being the most commonly used, this approach does
not guarantee that cost-effective measures are selected, and only allows for “ex-post analysis” of costs and other impacts
(health effects, ecosystems exposure, climate change).
Optimization approach. This approach determines cost-effective measures for air quality improvement by solving a
suitable optimization problem. A “feedback” is provided on the “effectiveness” of the measures, in terms of both costs and
effects. This helps the decision-makers by highlighting the set of measures that can provide the best results in terms of
health effects, ecosystems exposure, climate change or other target impacts.
3. The definition of general guidelines on how to implement the defined Integrated Assessment Modelling framework,
based on identified strengths and weaknesses and best practice examples among the Integrated Assessment systems in
place within MS.
4. The design and the assessment of AQ plans for Porto and Brussels regions based on such guidelines.
5. The communication to key stakeholders, and in particular to policy-makers, of the state-of-the-art scientific knowledge
on emission abatement assessment and the contribution to the Air Quality review.
References
EEA (2007). http://ia2dec.SGe.eea.europa.eu/knowledge_base/Frameworks/doc101182

316

317
SPECIAL SESSION – CLIMATE CHANGE AND HUMAN
HEALTH

318

319
CLIMATE CHANGE AND ITS IMPACT ON HUMAN HEALTH
A. Alebic-Juretic
Teaching Institute of Public Health/ School of Medicine, University of Rijeka, HR-51000 Rijeka, Croatia
Presenting author email: [email protected]
Summary
Last 25 years are the warmest since the beginning of meteorological measurements. Meteorological parameters for Rijeka
indicate annual mean temperature increase of approx 1.5oC, as well as maximum temperature increase of 10o C for the period
1977-2013. In the same time, the number of rainy days increased by 50, while the precipitation depth showed practically no
linear trend, but periodic behaviour. At the same time reduced emissions from point sources resulted in steep decline of air
pollutants like SO2, NO2 and particulates. Airborne O3 is following the same trend (Alebic-Juretic, 2012) in spite of expected
increase due to temperature rise. Such condition may represent threat to human health, either by introducing some insects-
vectors of infectious disease or suffering from exposures to higher ambient air temperatures and/or pollutants (ozone and
PM). The hospitalization rate because of asthma (caused by allergy) and gastrointestinal diseases including diarrhea in the
recent period (2000-2013) do not support yet the thesis of climate change impact on human health. For such a purpose more
precisely statistic records and longer periods might be needed. Introduction
Air pollution is strongly influenced by weather conditions, and subsequently very sensitive to climate change. The
interrelationship between climate and air quality is highly dynamic. Generally, change in climate affect air quality by
perturbing ventilation rates (wind speed, mixing depth, convection, frontal passage), precipitation scavenging, dry deposition,
chemical production and loss rates, natural emissions (methane, VOC) and background concentrations. Altered atmospheric
chemistry/composition (PM, NOx, ozone) and warmer climate, in combination with the prolonged seasonal presence of
allergenic pollens is likely to further increase allergic respiratory diseases and bronchial asthma among urban population (d'
Amato et al., 2010). Trends in meteorological parameters and air pollutants in the period 1977-2013 are presented in this
work. Rate of allergic respiratory and gastrointestinal diseases in the period 2000-2013.are analysed in respect to temperature
increase.
Methodology and Results
Analyses of long term meteorological data since 1977 indicate annual mean temperature increase in the city of Rijeka of
approx. 1.5oC, as well as maximum temperature rise of 10oC. The last two decades appear to be the warmest with average
temperature of 14.5oC, while the last decade (2001-2010) has the highest average temperature of 14.7oC, with temperature
anomaly of +1.1oC (Alebić-Juretić, 2012a) above climate normal 1961-1990 (Reviews, 2001) confirming the warmest decade
worldwide. The anomaly is even higher ('+1.25oC) if the period 2001-2013 is considered. In the whole time period, the
number of rainy days increased by 50, while trend in the precipitation depth is almost constant, though exhibiting a certain
periodicity. Air pollution data for the same period 1977-2013 indicate high pollution by SO2 and NO2 and moderate pollution
by NH3, PM and PAHs. In spite of air quality improvement (lowest air pollution ever) within the Rijeka Bay Area the global
warming is still overwhelming. From the hospitalization records in Rijeka Clinical Hospital two diagnosis codes were selected for conditions that might be
affected by global warming: asthma caused by allergy (code J.45.0) due to prolonged period of blossom, and diarrhea and
gastroentheritis with infectious origin (code: A 09) due to increased possibility for food poisoning in warmer climate. Though
the hospitalization rate because of asthma caused by allergy showes a slight increase with temperature, this is not
significant. Correlation temperature vs. diarrhea and gastrointestinal diseases with infectious origin is also insignificant.
Conclusions
There is no evidence of significant impact of increased warming on human health (allergic asthma or gastrointestinal diseases
with infectious origin) since 2000, a year when present disease coding is introduced. For such a purpose more precisely
statistic records and longer periods might be needed.
Acknowledgement
Technical assistance of Mrs. Vlatka Čulev is gratefully acknowledged. References
Alebić-Juretić, A. 2012. Ozone levels in the Rijeka bay area, Northern Adriatic, Croatia, 1999-2007, Int. J Remote Sensing,
33, 335-345.
Alebić-Juretić, A. 2012a. Climate variation or climate change? Evidence in favour in the Northern Adriatic Area, Croatia. in
Natural Security and Human Health Implications of Climate Change. Fernando, H.J.S., Klaić, Z., and McCulley J.L. Eds,
The NATO Science for Peace and Security Programme, Springer Science+Bussiness Media B.V. pp.75-83.
d’ Amato, G., Cecchi, L., d’Amato, M., Liccardi, G. 2010. Urban air pollution and climate change as environmental risk
factors of respiratory allergy: An update. J Investig Allergol Clin Immunol, 20, 95-102
Reviews No 21 (2011) Climate monitoring and assessment for 2010, Zagreb, January 2011, p.1-3 (in Croatian),

320
STUDY OF PERSONAL EXPOSURE TO ATMOSPHERIC PARTICLES BY VOLUNTEERS FROM EDUCATION
SECTOR IN SOUTHERN BRAZIL
D. S. De Almeida, L. D. Martins
Master Program in Environmental Engineering, (UTFPR) Federal University of Technology -Paraná, Pioneiros Avenue,
3131, 86036370, PR-Brazil.
[email protected], [email protected]
Summary
Measurements of the personal respirable particles concentrations are important to assess personal exposure to atmospheric
particles and it is essential to evaluate the health effects. To measure the dose intake, pilot measurements were performed in
individuals who work in education sector in southern Brazil. Mass concentrations of particles with aerodynamic diameter of
1.0, 2.5 and 10 µm were measured using personal monitor.
Introduction
Exposure to ambient air pollution is largely determined by the concentrations of pollutants existing in air where people stay
and length of stay. The determination of the total exposure is essential for the assessment of health effects, and in populous
regions, the problem of air pollution has constituted one of the most serious threats to the quality of life of its population
(Olmo et. al., 2011). This pilot study aimed to evaluate the viability of measurements of real personal exposure to
atmospheric particles by adults from education sector living in a medium-sized city in southern Brazil.
Methodology and Results
Five adults, non-smoking, non-alcoholic and non-hypertensive from education sector of the Londrina city, were selected to
evaluate the viability of the personal exposure measurements and the performance of equipment used. Sampling was carried
out during 8 hours, starting when the volunteers were getting out home to go work, all going to the same institution, using
different modes of transportation. For the mass concentration of the particles, we used the monitor brand Met One
Instruments, Aerocet 831 model, which provides mass concentration of PM10, PM2.5 and PM1.0 with temporal resolution of 1
minute. This equipment was in a backpack, with inlets out of it, at shoulder height, as shown in figure 1; the flow of the
equipment pump was 2.83 L min-1. A Global Positioning System DG-100 (Global Sat) with data logger registered the
movement of volunteers was also used. The received doses were calculated using the following equation:
𝑅𝑒𝑐𝑒𝑖𝑣𝑒𝑑 𝐷𝑜𝑠𝑒𝑠 =𝑀𝑃𝑀10
∗ 𝐼𝑅 ∗ 𝐹𝐸 ∗ 𝐷𝐸
(𝐵𝑀 ∗ 𝑀𝑇)
where MPM10 is the average mass concentration of PM10 intake (mg L-1); IR is
the intake rate (L hour-1); FE is the frequency of exposure (hour day-1); DE is
the duration of exposure (day); BM is the body mass (kg); MT is the average
time season which measurements occurred (hour). Averages concentrations of
8 hours were calculated for PM1.0 and PM 2.5 for each volunteer, which are
shown in Figure 2. Only the V5 volunteer took out bus to go to the institution,
and he had the lowest concentrations; the others used car. The highest
concentration was for the volunteer V4, which may be because he lives near
airport.
The mean received dose of PM10 for the five volunteers was 47,108 mg kg-1
hour-1.
Conclusions
The PM2.5 concentrations were on average 30% higher than those of
PM1,0, as expected. The received doses mean may be considered
relatively low, but it should be noted that the education sector is even
less exposed than other economic sectors. This pilot study has
demonstrated that personal exposure monitoring is a viable method for
improving knowledge about individual level exposure to atmospheric
particles. Future studies are needed to evaluate the personal exposure, as
this provides a better understanding of the damage that fine particles
causes on human health.
Acknowledgements
This work received funding support from CNPq (Conselho Nacional de
Desenvolvimento Científico e Tecnológico, process 404104/2013-4,
CAPES (Coordenação de Aperfeiçoamento de Pessoal de Nível
Superior) and Araucária Foundation.
References
Olmo, N. R. S., Saldiva, P. H. N., Braga, A. L. F, Santos, U. De. P., Pereira, L. A. A.. 2011. A Review of Low-level Air
Pollution and Adverse Effects on Human Health: Implications for Epidemiological Studies and Public Policy. Clinicis, 66, 4,
681-690.
Fig.2 Average mass concentrations of PM1.0 and
PM2.5 for volunteers.
Fig.1 Backpack with the equipment for particulate matter measurements.
PM1.0 PM2.5

321
MID-21ST CENTURY AIR QUALITY AT THE URBAN SCALE: CASE STUDIES FOR PARIS AND
STOCKHOLM
K. Markakis (1), M. Valari (1), M. Engardt (2), G. Lacressoniere (3), R. Vautard (3) and C. Andersson (2)
(1) Laboratoire de meteorology dynamique, IPSL Laboratoire CEA/CNRS/UVSQ, Ecole polytechnique, 91128 Palaiseau
CEDEX, France, (2) Swedish Meteorological and Hydrological Institute, Norrköping, Sweden, (3) Laboratoire des Sciences
du Climat et de l’Environment, IPSL Laboratoire CEA/CNRS/UVSQ, Orme des Merisiers, 91191 Gif/Yvette CEDEX,
France
Presenting author email: [email protected]
Introduction
There is a growing body of literature on the projected effects of climate and emission reduction scenarios on future air quality
for the regional and global scale. The fact that today most of the world’s population lives in cities stresses the need to resolve
the variability of pollutant concentrations and provide predictions of future air quality at the urban scale. It has been
repeatedly shown that coarse resolutions are inadequate to resolve fine scale features. In the present assessment, Stockholm
and Paris cities are used as illustrative examples of large urban agglomerations that have very different origins of influence
therefore particularly interesting to compare; Paris is largely affected by local emissions while Stockholm experiences
significant contribution by non-local sources.
Methodology
Ozone, PM10 and PM2.5 concentrations over Paris, France and Stockholm, Sweden were modeled at 4 and 1 km horizontal
resolutions respectively for the present and 2050 periods employing decade-long simulations simulated with the Eulerian
chemistry-transport models CHIMERE and MATCH in nested simulations. We account for large-scale global climate change
(RCP-4.5) and fine resolution bottom-up emission projections developed by local experts and quantify their impact on future
pollutant concentrations.
Results and conclusions
We identify biases related to the implementation of regional scale emission projections over the study areas by comparing
modeled pollutant concentrations between the fine and coarse scale simulations. We show that over urban areas with major
regional contribution (e.g., the city of Stockholm) the bias due to coarse emission inventory may be significant and lead to
policy misclassification. Our results stress the need to better understand the mechanism of bias propagation across the
modeling scales in order to design more successful local-scale strategies. We find that the impact of climate change is
spatially homogeneous in both regions, implying strong regional influence. The climate benefit for ozone (daily average and
maximum) is up to −5 % for Paris and −2 % for Stockholm city. The joined climate benefit on PM2.5 and PM10 in Paris is
between −10 and −5 % while for Stockholm we observe mixed trends up to 3 % depending on season and size class. In
Stockholm, emission mitigation leads to concentration reductions up to 15 % for daily average and maximum ozone and 20
% for PM and through a sensitivity
analysis we show that this
response is entirely due to changes
in emissions at the regional scale.
On the contrary, over the city of
Paris (VOC-limited photochemical
regime) local mitigation of NOx
emission increases future ozone
concentrations due to ozone
titration inhibition. This
competing trend between the
respective roles of emission and
climate change, results in an
increase in 2050 daily average
ozone by 2.5 % in Paris. Climate
and not emission change appears
to be the most influential factor
for maximum ozone concentration
over the city of Paris, which may
be particularly interesting in a
health impact perspective.
Acknowledgement
This work was funded by the European network ERA-ENVHEALTH and its participating partner organizations (ADEME
and ANSES in France, BelSPO in Belgium, Swedish EPA in Sweden and UBA in Germany).
Fig.1 Surface ozone in Paris (top row) and Stockholm (bottom row). Current levels (first
column), change due to climate change (second column), change due to emission change
(third column) and change until 2050s (fourth column).

322
CLIMATE, AIR QUALITY, AND HEALTH BENEFITS OF OFFSHORE WIND IN THE USA
J. Buonocore (1), P. Luckow (2), B. Biewald (2), J. Fisher (2), J. Levy (3)
(1) Center for Health and the Global Environment, Harvard T.H. Chan School of Public Health, Boston, MA USA (2)
Synapse Energy Economics, Cambridge, MA, USA (3) Department of Environmental Health, Boston University School of
Public Heath, Boston, USA
Presenting author email: [email protected]
Summary
This study evaluates the health climate and benefits of offshore wind energy projects in two areas being developed for
offshore wind, off the coast of New Jersey and Maryland, USA. This study finds that there are substantial climate, air quality,
and health benefits to offshore wind. These benefits do not scale linearly with the size of the project, indicating the value of
detailed modelling. Offshore wind, with other energy efficiency and renewable energy projects, can be a useful tool not only
for climate mitigation, but could also be a useful tool for air quality management.
Introduction
Energy efficiency (EE) and renewable energy (RE) can be a tool for mitigating climate change, since these projects can
reduce the use of fossil fuels and reduce greenhouse gas emissions (Buonocore et al. 2015). These projects can also have “co-
benefits’ by reducing emissions of air pollutants, improving air quality, and benefitting health. Recently, two areas in the
Atlantic Ocean on the continental shelf off the coast of the USA have been opened for development of offshore wind, one off
the coasts of Maryland and Delaware, and one off the coast of New Jersey. Here, we estimate the climate, air quality, and
health benefits of different sizes of offshore wind facilities in each location.
Methodology and Results
To simulate the health and climate benefits of offshore wind, we employed a multi-step model framework (Buonocore et al.
2015). First, we estimated electricity production based on turbine characteristics and local meteorology. We then used an
electrical dispatch model, PROSYM, to simulate how additional generation from the simulated offshore wind facilities would
affect electrical generation, and emissions of SO2, NOx, and CO2 throughout the power grid in Eastern North America. We
then apply an impact assessment model to estimate the economic value of the public health benefits of the NOx and SO2
reductions, and estimate the value of the CO2 reductions using the social cost of carbon. Our results show that offshore wind
is able to substantially reduce emissions of NOx, SO2, and CO2, with substantial benefits to climate and health. The results
also show that location is an important determining factor for emissions reductions and benefits – the 1100 MW project off
New Jersey displaces much more emissions than the 1000 MW project off the coast of Maryland. Size is also an important
factor, however, the emissions reductions and benefits do not scale linearly with size, largely due to the local power mix and
grid conditions.
Conclusions
This study shows
that offshore wind
is capable of
displacing
substantial
emissions of CO2,
NOx, and SO2 from
fossil fueled
electricity sources.
Offshore wind is
capable of
mitigating
substantial
emissions of CO2
emissions, while
also having
substantial benefits
for air quality and health. Offshore wind is useful as a climate change mitigation plan, but offshore wind, along with other
energy efficiency and renewable energy projects and policies, could also be useful tools for air quality management as well.
Acknowledgement
This work was supported by a grant from The Heinz Endowments (Grant number C2988), the Charles F. Wilinsky award at
Harvard School of Public Health, and funds from the Mark and Catherine Winkler Foundation.
References
Buonocore JJ, Luckow P, Norris G, Spengler JD, Biewald B, Fisher J, et al. 2015. Health and climate benefits of different
energy-efficiency and renewable energy choices. Nat. Clim. Chang.; doi:10.1038/nclimate2771.
Project Total
Generation
per Year
(GWh)
Total SO2
per Year
(1000 tons)
Total NOx
per Year
(1000 tons)
Total CO2
per Year
(1000 tons)
Premature
Deaths
Avoided
per Year
Total
Benefit
per
Year
(million
$)
1100 MW
New Jersey
3701 2.44 1.4 2200 13 200
3000 MW
New Jersey
10092 12.0 3.7 6100 52 690
1000 MW
Maryland
3239 3.95 1.4 2200 18 240
200 MW
Maryland
648 1.47 0.6 460 7 75
300 MW
Maryland
972 1.45 0.6 610 7 82
400 MW
Maryland
1295 1.47 0.7 800 7 92

323
ESTIMATION OF POTENTIAL ADVERSE HEALTH EFFECTS IN ASSOCIATION WITH WEATHER
PARAMETERS, AMBIENT AIR POLLUTANTS AND POLLEN IN THE AUGSBURG REGION
J. Cyrys (1,2), C. Beck (3), K. Wolf (1), S. Breitner (1), T. Kusch (2), K. Berger (1), A. Schneider (1) and A. Peters (1)
(1) Institute of Epidemiology II, Helmholtz Zentrum München, German Research Center for Environmental Health,
Neuherberg, Germany; (2) Environment Science Center, University of Augsburg, Augsburg, Germany; (3) University of
Augsburg, Institute of Geography, Physical Geography and Quantitative Methods, Augsburg, Germany
Presenting author email: [email protected]
Summary
The region of Augsburg provides a unique opportunity to assess the health impacts of changes in living conditions and
health-related behaviour. Specifically, through the Helmholtz Research Network REKLIM and the Environmental Health
Research portfolio, temporal-spatial variation in micro-climates and air pollution concentrations have been monitored during
the last two years and can now be analysed with newly collected health data which has become available in summer 2015.
Introduction
The Helmholtz Research Network REKLIM (Regional climate changes, http://www.reklim.de) will improve the knowledge
of regional effects of global climate change. One important research topic is the interaction between health effects of weather
and ambient air pollution which may be essential for predicting the consequences of climate change on population health,
especially in urban areas. So far, both environmental stressors have most often been assessed separately. Within the REKLIM
initiative, we study the associations between exposures to air temperature as well as air pollution and health data in the region
of Augsburg, Germany.
Methodology and Results
Measurements of air temperature and relative humidity were
conducted at 55 monitoring locations (thereof 35 in the city of
Augsburg and 20 in the two adjacent rural counties) resulting in
on average 250,000 observations in the city of Augsburg and
92,000 in the rural counties (readings every 4 minutes). The
monitoring sites were chosen based on the spatial spread of the
home addresses of the study participants as well as the expected
spatial variation of the meteorological variables. The sampling
campaign started in May 2013 and ended in May 2015.
Currently, exposures to air temperature, relative humidity and
air pollution (particulate matter in different size fractions, black
smoke, nitrogen oxides, and ozone) are estimated at the
residential addresses of approximately 2,300 individuals
participating in the Cooperative Health Research in the
Augsburg Region (KORA) study, by applying land-use
regression (LUR) models. It is planned to use seasonal and
annual averages for assessing the effects of weather and air
pollution on cardiovascular and respiratory function.
At first we modelled air temperature at the 35 sites located in
the City of Augsburg by use of land-use characteristics as
predictor variables. After model evaluation via cross-
validation appropriate statistical models are applied to
gridded land-use data to derive spatial urban air temperature
distributions. Various models were tested and applied for
different seasons and times of the day and also for different synoptic conditions (e.g. clear and calm situations, cloudy and
windy situations). Preliminary results of the analyses confirm the general applicability of the selected statistical approach, but
also highlight pronounced variations concerning the contribution of the predictor variables with respect to season, time of the
day and synoptic situation. Figure 1 shows an example of the results of the modelling for July, at 04:00 (before sunrise) and
for a calm and clear weather situation. We modelled the deviations from the temperature measured at the reference station
“Augsburg-Airport”.
The re-examination of the KORA cohort (FF4) from June 2013 until September 2014 fell into the study period of this project.
In total, data of 2,279 participants (39-88 years) was collected at the KORA study center in Augsburg (response rate: 69%).
Data from questionnaires and health modules as well as biosamples are available now and will be associated with the data of
the modelled environmental exposure data.
Acknowledgement
The sampling of the meteorological data was funded by the Helmholtz Climate Initiative REKLIM (Regional Climate
Change), a joint research project of the Helmholtz Association of German research centres (HGF). The collection of the air
pollutant was funded by the European Community’s Seventh Framework Program (FP7/2007e2011) under grant agreement
number 211250 (ESCAPE project) as well as by Helmholtz Zentrum München, German Research Center for Environmental
Health through the Environmental Health Research portfolio. The examination of the KORA cohort was funded by
Helmholtz Zentrum München, German Research Center for Environmental Health.
Fig.1 Modelled spatial air temperature distributions (June, 04:00, “calm and clear” synoptic condition).Fig.2 Spatial distribution of
BrC, in µg/m3, asa marker for the smoldering phase of biomass
burning, measured with a 2 wavelength (880 nm and 370 nm) microaethalometer around a neighborhood-scale site (star) in
Sparks, Nevada, USA from ~8 pm to ~2 am. Data were spatially
interpolated by kriging from average values assigned to evenly-
spaced grid squares.

324
Fig. 1A
INDOOR CLIMATE VARIABLES AND ENDOTHELIAL FUNCTION IN ADULTS
S. Fossati (1,2), E. Pasqual (1,2), A. Spinazzè (3), A. Cattaneo (3), D. Cavallo (3), P. Carrer (2)
(1) Centre for Research in Environmental Epidemiology (CREAL), Barcelona, Spain; (2) Dept. of Biomedical and Clinical
Sciences, University of Milan, Milan, Italy; (3) Dept. of Science and High Technology, University of Insubria, Como, Italy
Presenting author email: [email protected]
Summary
This study aims to investigate the association between indoor climate variables, i.e. temperature and relative humidity, and
endothelial function in office workers. We found significant linear associations between the 5-minutes averaged climate
variables and endothelial function, measured as reactive hyperemia index. The association was positive for temperature and
negative for relative humidity. In our exploratory analysis looking at longer time windows (up to 4-hours) we confirmed the
same direction of the associations. Our findings suggest a potential role of short term changes in indoor temperature and
relative humidity in endothelial function in adults and needs to be replicated in larger samples and using outdoor climate
variables ad exposure.
Introduction
Endothelial dysfunction is a pathological state of endothelium characterized by a failure in performing its homeostatic
function considered to be one of the first steps of the atherosclerotic process. Potential risk factors for endothelial dysfunction
include climate variables. Endothelial function could be measured as reactive hyperemia index (RHI), investigated
noninvasively using a technique based on pulse wave amplitude measurements by finger plethysmography. We investigated
the association between indoor climate variables, i.e. temperature and relative humidity, and endothelial function in office
workers.
Methodology
Data were collected in the frame of an intervention study, the intervention consisting in changing the cleaning products in use
with low volatile organic compounds (VOCs) and aldehydes emissions ones, therefore not relevant for climate variables. 82
volunteers were visited twice, before and after one month of intervention. Visits were conducted in Wednesday to Friday of
the week before and after the intervention and included the measurement of RHI. Smoking history and self-reported medical
history were collected in the frame of an online questionnaire. Continuous monitoring of temperature [°C] and relative
humidity [%] was conducted at a 1 minute sampling rate five days of each campaign week (Monday to Friday) during
working hours (from 9AM to 5PM). In our main analysis we investigated the 5 minutes mean temperature and relative
humidity before the visit took place. We also ran exploratory analyses on longer averages (30 minutes to 4 hours). RHI
values were ln-transformed to achieve normality and homogenize variance. We fit mixed effects model with random
intercept for each participant. We first ran single exposure models for our exposures. Confounders to be included in the
models were selected a priori: age, gender, BMI and smoking history (current, former and never). Since we used data from an
intervention study, we included a dummy variable for the intervention campaign (before/after) and the intervention area
(intervention/sham). Moreover, since visits took place at different time of the day we included time of the day as continuous.
Results Data on RHI, medical history, smoking status and microclimate variables were available in 44 workers (n obs = 68). Baseline
mean(SD) age was 48(8) years and the sex ratio was 1.08, approximately one third of participants were overweight or obese
(BMI ≥ 25 Kg/cm2). Participants were mainly never or former smokers (76%). We found abnormal ln(RHI) levels, i.e. equal
or lower than 0.57, in 8% (n = 6) of participants. 5-min averaged temperature was inversely correlated with relative humidity
(Spearman’s rho -0.367 [p = 0.002]). In our models adjusted for age, gender, BMI, smoking history, intervention campaign,
intervention area and time of the day we found temperature and relative humidity exposure to be associated with RHI. An
IQR decrease in room averaged temperature in the previous 5 minutes (-1.62 °C) was associated with a significant 12.1%
(C.I. 95% -1.9% to -23.4% p = 0.033) decrease in RHI. We also found a slightly significant decrease in RHI for an IQR
increase in room averaged relative humidity in the previous 5 minutes (8.2%) (-9.2% [C.I. 95% -17.2% to -0.4%]; p = 0.058).
In our exploratory analyses looking at different
time windows (moving averages) and lags we
confirmed the same direction of the associations
observed with the 5 minute moving averages,
particularly for relative humidity. Fig. 1 Estimated % Change (CI 95%) in RHI for an
IQR Decrease in T (Fig. 1A and Increase in RH (Fig.
1B) in Different Time Windows (Results from the Exploratory Analysis).
Conclusions
Our findings suggest a potential role of short term changes in indoor temperature and relative humidity in endothelial
function in adults. Further research is needed to confirm our findings in larger samples and with outdoor climate variables.
Fig. 1B

325
SPECIAL SESSION –MODELLING AND
MEASURING NON-EXHAUST EMISSIONS FROM TRAFFIC

326

327
0
5
10
15
20
25
30
0
20
40
60
80
100
120
140
160
conc_
NK
(ng/m
3)
con
c_B
R(n
g/m
3)
Cu_coarse_BR
Cu_coarse_NK
HIGH TIME RESOLUTION MEASUREMENTS TO IDENTIFY NON-EXHAUST EMISSIONS FROM ROAD
TRAFFIC: A PILOT STUDY IN LONDON (UK)
M. Dell’Acqua (1), D. C. S. Beddows (2), V. Bernardoni (1), G. Calzolai (3), G. Fuller (4), D. Green (4), R. M. Harrison
(2,5), F. Lucarelli (3), S. Nava (3), G. Valli (1), R. Vecchi (1)
(1) Department of Physics, Università degli Studi di Milano and INFN – Sezione di Milano, Milan, 20133, Italy; (2) National
Centre for Atmospheric Science, University of Birmingham, Edgbaston, Birmingham B15 2TT, UK; (3) Department of
Physics, Università di Firenze and INFN – Sezione di Firenze, Via Sansone 1, 50019, Sesto Fiorentino, FI, Italy; (4)
Environmental Research Group, King’s College London, Franklin Wilkins Building, 150 Stamford Street, London SE1 9NH,
UK; (5) Department of Environmental Sciences – Center of Excellence in Environmental Studies, King Abdulaziz
University, PO Box 80203, Jeddah, 21589, Saudi Arabia
Presenting author email: [email protected]
Introduction
Several studies assessed the importance of the characterisation of particulate matter emitted by road transports. There are still
uncertainties about its impact on human health, but adverse effects have been issued, like the increasing number of
heart/pulmonary diseases after the exposure to high concentrations (i. e. emissions from high traffic roads). It is then
important to quantify these emissions, in particular in urban areas, in order to abate them through new regulations.
The results we are going to show are part of a pilot study inserted in a collaborative project about the characterisation of non-
exhaust emissions from road traffic. Non-exhaust emissions are defined as the emissions due to traffic and produced by tyre
abrasion, clutch, brake and road surface wear, and resuspension of road dust.
High resolution samplings were carried out simultaneously at two
sites in London (UK) during June and July 2014. One of the chosen
sites, Brent, is located on a highway of the mega-city, with high traffic
volumes. The second site, North Kensington, is located in a residential
area.
The campaign provided the hourly elemental composition of fine and
coarse particulate matter giving very useful information about the
main emission sources in the urban area. The contribution of traffic
was estimated through the Lenschow approach applied to the two sites
(Fig. 1).
Methodology and Results
At each site hourly samplings were carried out using the
Streaker Sampler. It performs a continuous sampling for
one week and collects separately the coarse (particles
with aerodynamic diameter 2.5 µm < d < 10 µm) and
fine (d < 2.5 µm) particulate matter fractions through an
impaction stage. Thanks to hourly resolution it was
possible to identify emission sources even if active only
for a few hours.
The deposits of collected particles were analysed in
order to determine the elemental concentrations in the
two fractions through the PIXE (Particle Induced X-ray
Emission) analysis.
Hourly concentrations were mostly higher in heavily traffic congested site for the coarse fraction (an example is reported in
Fig. 2), while they were similar at the two sites as far as the fine fraction is concerned. We observed higher coarse
concentrations during day-time (in respect to the night-time ones) and in weekdays (in respect to weekends), most likely due
to the action of mechanical resuspension of road dust and to non-exhaust emissions.
Acknowledgement
We acknowledge King’s College London and the Council of Brent for the availability of sampling sites’ cabins and ancillary
data.
References
Lenschow P., Abraham H. J., Kutzner K., Lutz M., Preuß J. D., Reichenbächer W., 2001. Some ideas about the sources of
PM10, Atmospheric Environment 35 Supplement No. 1, S23-S33.
Fig. 1: Profile scheme of PM ambient
concentrations (Lenschow et al., 2001)
Fig. 2: Streaker sampler data for the coarse fraction of Cu detected at
the two sites

328
Fig.1 Model predicted changes in PM10 emissions
in Hämeentie 2007-2009 and 2014
APPLICATION OF TWO ROAD DUST EMISSION MODELS TO ASSESS THE AIR QUALITY IMPACT OF
OPTIONS FOR REDUCING NON-EXHAUST PM10 EMISSIONS
Ana Stojiljkovic (1), Mari Kauhaniemi (2), Jaakko Kukkonen (2), Kaarle Kupiainen (1, 7), Ari Karppinen (2), Liisa Pirjola
(3), Anu Kousa (4), Jarkko Niemi (4), Matthias Ketzel (5), Bruce Rolstad Denby (6)
1. Nordic Envicon Oy, Finland, 2. Finnish Meteorological Institute, 3. Metropolia, Finland, 4. Helsinki Region
Environmental Services Authority, Finland, 5. Århus University, Denmark, 6. Norwegian Meteorological Institute, 7. Finnish
Environment Institute (SYKE)
Presenting author email: [email protected]
Summary
The aim of this study is to assess the sensitivity of modelled non-exhaust emissions of respirable particulate matter (PM10) to
changes in the use of studded tyres and different road maintenance measures. The NORTRIP (Denby et al., 2013) and FORE
(Kauhaniemi et al., 2011) road dust emission models were combined with the street canyon dispersion model OSPM
(Berkowicz, 2000) to evaluate the air quality effect of emissions and to compare with kerbside measurements. Both models
demonstrate significant impact of studded tyres emissions with the FORE model predictions being slightly more sensitive to
this parameter. The FORE model indicates a higher impact of sanding. Inter-annual variation of impact was influenced by the
changes in meteorological conditions and associated road maintenance input data.
Introduction
Development and regulations regarding car engines and exhaust cleaning systems have resulted in a significant decrease of
exhaust particulate emissions of modern vehicular traffic fleet. However, non-exhaust traffic emissions remain a concern and
are still unregulated. In northern parts of the world studded tyres as well as traction and dust control measures used during
winter and spring months have a significant impact on non-exhaust particulate emission. Quantification of this impact using
modelling tools can support the formulation of strategies for reducing the emissions and consequent air quality effects.
Considering this, we applied two emission models in order to assess sensitivity of PM10 emissions to different measures.
Methodology and Results
Assessment was carried out for a segment of Hämeentie,
a street canyon located in central Helsinki, Finland, for
four years (2007-2009 and 2014). Two emission models,
NORTRIP and FORE, were applied using available input
data for traffic, meteorology and road maintenance
activities to calculate PM10 emissions which were
subsequentl implemented in the OSPM dispersion model.
Evaluation of model predictions against measurements
was done for years with available kerbside PM10
concentrations (2009 and 2014). Modelled mean annual
concentrations agreed reasonably well with the measured
ones. The concentrations estimated with the NORTRIP
model were slightly lower compared with the FORE
results. Both models were used to examine sensitivity of predicted PM10 emissions to reductions in the number of vehicles
with studded tyres and use of traction sand. The effect of application of traction and dust binding salts was studied using the
NORTRIP model. Impact of different measures is presented as relative change compared to the reference case in Fig. 1.
Reduction of studded tyre traffic share from the current 80% to 50% (“st 50%” in Fig. 1) would reduce PM10 by about 7 to
16% depending on the year and model. Further reductions in studded tyre use would reduce PM10 by 30-40% (NORTRIP) or
40-50% (FORE) in the theoretical case with no studded tyres in traffic (“no st” in Fig. 1). The emissions predicted by FORE
were more sensitive to the use of sand. The NORTRIP model results indicate that dust binding can have an important role in
reducing PM10 emissions. Meteorological conditions had a significant influence on emissions.
Conclusions
Both models demonstrate a significant impact of studded tyre use on the emissions. Traction sanding was identified as a
potentially important source of emissions. The possibility to quantify the impact of different measures before implementing
them into the abatement strategies for the non-exhaust PM10 emissions is an important asset for the air quality management.
References
Berkowicz, R., 2000. OSPM-a parameterised street pollution model. Environmental Monitoring and Assessment 65, 323-331.
Denby, B.R., Sundvor, I., Johansson, C., Pirjola, L., Ketzel, M., Norman, M., Kupiainen, K., Gustafsson, M., Blomqvist, G.,
Kauhaniemi, M., Omstedt, G. (2013) A coupled road dust and surface moisture model to predict non-exhaust road traffic
induced particle emissions (NORTRIP). Part 2: Surface moisture and salt impact modelling. Atmos. Environ., 81, 485-503.
Kauhaniemi, M., Kukkonen, J. Härkönen J., Nikmo J., Kangas L., Omstedt G., Ketzel M., Kousa A., Haakana M., and
Karppinen A.(2011) Evaluation of a road dust suspension model for predicting the concentrations of PM10 in a street canyon,
Atmos. Environ., 45, 3646-3654.

329
SPECIAL SESSION –TRANSPORT RELATED AIR POLLUTION PM AND ITS IMPACT ON CITIES AND
ACROSS EUROPE

330

331
AIR QUALITY IMPACT ASSESSEMENT FOR RINGLAND
B. Maiheu, S. Vranckx, W. Lefebvre and S. Janssen
Flemish Institute for Technological Research (VITO), Boeretang 200, 2400 Mol, Belgium
Presenting author email: [email protected]
Summary
“Ringland” (www.ringland.be) is a civilian spatial planning initiative led by a consortium of spatial planners in Antwerp,
Belgium, which aims to cover the city’s busy ring road (R1) in an attempt to create more greenspace and improve the quality
of living for the local residents. The initiative crowd-sourced over a 100 kEUR from enthusiasts to fund a number of
environmental, health and economic impact assessment studies. This contribution will report on the air quality impact of the
envisaged tunnel-complex. Given the multiple entrance and exits of the Ringland tunnel system, a tunnel model was created
to estimate emission losses from the several portals. The redistributed emission estimates were fed to a Gaussian dispersion
model, IFDM (Lefebvre et al., 2013), to estimate the impact on annual averaged NO2 and PM2.5 concentrations at high spatial
resolution. The results, indicating a substantial reduction of the NO2 and PM2.5 concentrations except at the tunnel exits,
were subsequently used by epidemiologists to estimate the health outcome for the project.
Introduction
The busy Antwerp ring road has been at the centre of a major public/political debate in Flanders for more than a decade,
featuring many local civilian initiatives. The tunnel complex which the Ringland initiative proposes, separates the R1 into a
local traffic tunnel and a tunnel for through traffic, with several entrances and exits as well as a number of surface-level
interchanges along the way. A good estimation of the redistribution of traffic emissions from the tunnel portals is therefore
essential for any air quality impact assessment.
Methodology and Results
To redistribute the traffic emissions to the different tunnel
portals, the Hardy-Cross method (Cross, 1936), typically used
for hydraulic network calculations, was used. In this method a
network of pipes (traffic tunnels in our case) can be solved
iteratively for total pressure in its nodes and flow speed in its
pipe segments when the pressure losses (or gains) are known in
each segment. Next to friction losses near the walls, a pressure
gain is induced by the vehicle piston effect (Bring et al., 1997;
Okamoto et al., 1998), allowing us to compute the flow in the
complete tunnel system depending on tunnel geometry and
traffic intensity/composition.
The model estimated respectively 14.6 % of the total R1 traffic
emissions are released near the western exit/entrance of the
tunnel complex, 21 % to the north and 10.1 % to the south and
15.7 % to the eastern main exit/entrance. The remainder of the
emissions are released along the several exits along the
trajectory (with a maximum of 7 % of the total near the busiest
section of the R1).
The IFDM dispersion model (Lefebvre et al., 2013) was used to compute the redistributed emissions on the ambient annual
averaged concentrations for the whole agglomeration. Sizeable reductions were found, not only near the original location of
the R1, but also in the urban background. The tunnel portals remain hotspots, with significant increases, however limited to a
few 100 m from the portal. Overall, 97 % of the population see a reduction in concentrations levels, whereas only 3 % see an
increase.
Acknowledgement
This work was supported by the Ringland initiative and the contributing citizens of Antwerp.
References
Bring, A., Malmström, T.-G., Boman, C.A., 1997. Simulation and measurement of road tunnel ventilation. Tunn. Undergr.
Sp. Technol. 12, 417–424. doi:10.1016/S0886-7798(97)00031-X
Cross, H., 1936. Analysis of flow in networks of conduits or conductors. Eng. Exp. Stn. 34, 1–29.
Lefebvre, W., Van Poppel, M., Maiheu, B., Janssen, S., Dons, E., 2013. Evaluation of the RIO-IFDM-street canyon model
chain. Atmos. Environ. 77, 325–337. doi:10.1016/j.atmosenv.2013.05.026
Okamoto, S., Sakai, K., Matsumoto, K., Horiuchi, K., Kobayashi, K., 1998. Development and Application of a Three-
Dimensional Taylor-Galerkin Numerical Model for Air Quality Simulation near Roadway Tunnel Portals. J. Appl.
Meteorol. 37, 1010–1025.
Fig 1. NO2 concentrations in 2020 in one of the likely future
scenario’s for Antwerp (left), right: ringland NO2 map.

332
Author Index
Aarnio M., 189
Adani M., 150
Adhikari A., 43
Agis D., 243
Agrillo G., 64, 101, 178
Agudelo-Castañeda D., 253
Agusti-Panareda A., 105
Alastuey A., 169
Aldy J., 307
Alebic-Juretic A., 283, 319
Alessandrini S., 4, 89
Almström P., 190
Alpfjord H., 17
Altuğ Hicran., 289
Alves C., 169
Amanatidis S., 195
Amato F., 169
Ambelas C., 8
Anand A., 59
Andersen M.S., 5
Andersson C., 7, 17, 137, 321
Andersson N., 258
Andrade M.F., 157
Andreas, 49
Andronopoulos S., 236, 256
Angelino E., 119, 122, 308
Apichattam T., 297
Arboledas-Alados L., 161
Archibald A., 104
Argentini S., 118
Armand P., 236
Arnold S., 104
Arsic M., 44
Artíñano B., 241
Assennato G., 78
Astitha M., 145
Astolfo R., 157
Athanasopoulou E., 115
Aulinger A., 36, 81, 83, 131
Aurela M., 77
Avidano A., 132
Azarmi F., 254
Baccarelli A., 158
Baccini M., 45
Bacer S., 98
Backes A.M., 131
Bade F., 67
Bahmannia Gh., 272
Baier F., 20, 28
Bajardi P., 132
Baklanov A., 31
Baldasano J.M., 23, 315
Balducci C., 118, 123, 255, 266
Balis D., 55
Balzarini A., 31, 219, 231
Bande S., 243, 285
Baraldi R., 75
Barbe P., 66
Barkley M.P., 18
Barmpas F., 192
Baró R., 29, 31, 161
Bartyzel J., 257, 259
Bartzis J.G., 33, 256
Basagaña X., 243
Bassano D., 284
Bassette C., 67
Batchvarova E., 299
Bauerová P., 162
Baumann-Stanzer K., 236
Baumbach G., 121
Becagli S., 117, 169, 213
Beck C., 323
Bedada B., 258
Beddows D.C.S., 327
Bedogni M., 231
Beig G., 273
Belda M., 162
Belis C.A., 77, 315
Bell M.C., 135
Bellander T., 258
Belli C., 75
Ben Brahim A., 288
Benedetti A., 105
Benedictow A., 38
Benešová N., 162
Bengalli R., 50
Benmarhnia T., 153
Bennet C., 181
Bennett I., 60
Benzo M., 227
Berbekar E., 87, 236
Berchet A., 27, 237
Bergemann C., 20, 28
Berger K., 323
Berglund S., 190
Bergmann K.-C., 249
Berico M., 77
Bernard B., 300
Bernardoni V., 116, 117, 170, 213, 277, 327
Bero G., 258
Bertazzi P.A., 45
Bhaskar B., 202
Bianconi R., 29
Bieser J., 19, 36, 131
Biewald B., 322
Biggeri A., 45
Bigi A., 277
Bijelovic S., 44
Bind M.-A., 154, 307
Bissardella F., 285
Blomqvist G., 171, 173, 177, 181
Blond N., 315
Blumelová J., 162
Blyth L., 148
Bogliolo M.P., 118
Bolignano A., 309
Bolognini L., 132
Bønløkke J., 5
Bonn B., 93, 109
Borge R., 39, 82, 241
Borot O., 66
Bouarar I., 30

333
Bouland C., 315
Bouquet M., 66
Bove M.C., 61
Božnar M.Z., 245
Brandt J., 5, 8, 32, 35, 299
Brasseur G., 30
Breitner S., 323
Bressi M., 77
Briganti G., 150
Broderick B., 310
Brotto P., 61
Brumberg H., 301
Brunner D., 27, 29, 31, 115, 237
Brunner J., 237
Brusasca G., 47, 178
Bualert S., 297, 302
Bucci S., 97
Buccolieri R., 88, 220
Buonocore J., 6, 322
Burchett M., 24
Burkhart J-F., 66
Burman L., 46
Burrows J., 83, 139
Bustos J.J., 228
Butler T., 226
Cádiz A., 69, 215
Cairo F., 97
Caliman M.C., 221, 222
Calori G., 47, 101, 230, 285
Calzolai G., 116, 169, 170, 327
Camatini M., 50
Čampulová M., 63
Capasso L., 50
Cappelletti A., 150
Cappello S., 75
Carbone C., 77
Carbone F., 262
Cardoso S.M., 242
Carlino G., 132
Carlucci L., 178
Carlucci P., 75, 101
Carnevale C., 140, 156, 308, 315
Carpentieri M., 293
Carrer P., 324
Carruthers D,J., 107
Carugno M., 45
Cassola F., 61
Castell N., 62, 228, 278
Cattaneo A., 324
Cattani G., 261
Cavalli F., 77
Cavallo D., 324
Cecinato A., 118, 123, 255, 266
Cerqueira M., 169
Cesaroni G., 118
Chapizanis D., 53
Charisiadis P., 187
Chaudhari R.H., 135
Chen L.W.A., 155
Cherubini A., 125
Chianese E., 178
Chiari M., 116
Chiesa M., 125
Chipperfield M., 106
Chmura L., 257, 259
Chourdakis E., 192
Chow J.C., 149, 155
Christensen J.H., 5
Christoudias T., 98, 224
Churkina G., 226
Ciancarella L., 150, 243
Clappier A., 315
Clemente M., 285
Coceal O., 293
Collins W., 104, 111
Colombi C., 77, 122, 169
Consonni D., 45
Corbella L., 117, 213
Corsini E., 117
Costa M.P., 285
Costagliola M.A., 178
Cotta H.A.C., 51
Coull B., 9
Coull B.A., 166
Cremona G., 150
Crespi A., 117, 170, 213
Cristofanelli P., 97
Cristofari A., 118
Curci G., 29
Custódio D., 169
Cyrys J., 323
D’Allura A., 47, 101, 118, 309
D’Elia I., 150
D’Isidoro M., 150
Dacre H., 111
Dai HC., 56
Dal Maso M., 206
Danckaert T., 70
Dastoor A., 19
De Almeida D.S., 320
de Andrés J.M., 82
de Castro Vasconcellos P., 215
De Cesari S., 97
De F., 262
de la Fuente M.M., 163
de la Paz D., 39, 82
De la Rosa J., 228
de Medeiros J.S.N., 100
de Rue J., 81
De Simone F., 19, 262
De Wispelaere P., 72
de’Donato F.K., 160
Dėdelė A., 229, 260
Deetz K., 99
DeFries R., 6
del Peso I., 163
Delfino R.J., 182
Dell’Acqua M., 117, 213, 327
Delle Monache L., 4
Denby B.R., 177, 181, 183, 189, 223
Denier van der Gon H.A.C., 29,189, 191
Derbek P., 162
Devasthale A., 108
Di Benedetto C., 50
di Gianvito A., 279
di Giuseppe F., 105
Di Lonardo S., 75
Di Sabatino S., 88
Di Tommasi P., 75
Diapouli E., 169
Díaz E., 241
Diaz Ramiro E., 241
Dimitroulopoulou C., 241
Dimopoulos S., 55

334
DiTommasi P., 64
Djalalova I., 4
Djamen K., 244
Doherty R,M., 102, 104, 107
Dominutti P.A., 157
Dong HJ., 56
Donnelly A., 310
Douros I., 192
Douros J., 189, 315
Dragic N., 44
Dvorská A., 63
Dzhola A., 68
Eben K., 162
Efthimiou G.C., 236, 256
Ehlers C., 109
Elansky N., 94
Elbir T., 289
Eleftheriadis K., 169
Ellermann T., 5, 35
Elser M., 277
Emmenegger L., 27, 237
Eneroth K., 46
Engardt M., 17, 321
Engelen R., 105
Engling G., 155
Engström Nylén A., 46
Erbertseder T., 20, 28
Eriksson J.S.N., 190
Esposito A., 64, 75, 178
Etyemezian V., 149
Facchini C., 77
Facini O., 75
Fagerli H., 38
Famulari D., 64, 75
Fan Q., 30
Farrow A.R., 133, 201
Fayt C., 70
Febo A., 255
Fedi M., 116
Ferm M., 172
Fermo P., 117, 213, 277
Fernández-Camacho R., 228
Fernández-Ferreras J.A., 279
Fernández-Olmo I., 233, 279
Ferrante R., 261
Ferrari F., 140, 308
Ferreira A., 242
Ferrero E., 89
Ferrero L., 219
Fierens F., 70
Fierli F., 97
Finardi S., 7, 47, 101, 118
Finzi G., 156, 315
Fischer H., 224
Fisher B., 134
Fisher J., 322
Flammia V., 232
Flassak T., 37
Flemming J., 105
Fokeeva E., 68
Folberth G., 104
Forastiere F., 118
Forkel R., 29, 31
Fornaro A., 157
Forsberg B., 52, 137, 190
Forsell N., 212
Fossati S., 158, 324
Fourtziou L., 205
Franck U., 159
Frassy L., 80
Frattoni M., 266
Friedrich A., 193
Fuka V., 236
Fuller G., 327
Furieri B., 221, 222
Fuzzi S., 77
Gadhavi H., 135
Gaffron P., 76
Gaga E., 289
Galkowski M., 259
Galli C.L., 117
Galli L., 213
Galmarini S., 234
Gandini M., 243
Garcia-Castro A., 12
Garg M., 280
Gariazzo C., 118, 236, 261
Gasbarra D., 75, 101, 178
Gatta E., 61
Gatta V., 141
Gatto M.P., 118
Gauss M., 38
Geels C., 5, 8
Geiß A., 93
Gencarelli C.N., 19, 262
Georgellis A., 258
Georgiou G.K., 224
Gerasopoulos E., 115, 211
Gerwig H., 93, 109
Gherardi M., 118
Ghermandi G., 277
Ghigo S., 243
Gianelle V.L., 77, 122, 169
Gianfreda R., 140, 308
Giannadaki D., 48
Giannaros T.M., 55
Gidhagen L., 270
Gilardoni S., 77
Gillies J.A., 149
Gioli B., 64, 75, 101
Giua R., 78
Gold D.R., 166
Gómez M., 286
Gómez-Moreno F.J., 241
Gonçalves Fabio L.T, 157
Gonzalez R., 117, 213
Gordiani A., 118
Gotti A., 187
Goussebayle B., 66
Graff A., 315
Gramsch E., 215, 263
Granier C., 30
Grašič B., 245
Gratsea M., 211
Grechko E., 68
Greco S., 125
Green D., 327
Grigoratos T., 179
Größ J., 97
Gryning S.-E., 299
Gualtieri M., 50
Guariso G., 140, 308, 315
Guerrero-Rascado J.L., 161
Gustafsson M., 171, 173, 174, 177, 181

335
Hadjinicolaou P., 224
Hafezi M., 92
Hamdi E., 281
Hanaoka T., 56
Handakas E.J., 187
Hänninen O., 8, 118
Hansen K.M., 5
Hanuš V., 63
Harion J.L., 221, 222
Harms F., 87
Harrison R.M., 169, 327
Hartmut H., 250
Hasheminassab S., 182
Hassan H., 282
Haug T.W., 147
Hayden P., 293
Heard D.E., 107
Hedgecock I.M., 19, 262
Heinold B., 13, 298
Hellsten A., 236
Hendriks C., 79, 212
Hense A., 34
Hertel O., 5, 35, 299
Hillamo R., 77, 206
Hinchliffe G., 90
Hinneburg D., 250
Hirtl M., 29, 31
Hodges K.I., 102
Hogrefe C., 11, 145
Høiskar B.A., 147
Holme J.A., 50
Holst H., 175
Honzak L., 29, 31, 50
Hood C.M., 107
Horbanski M., 193
Hosseini V., 303
Hrubeš P., 162
Hubbell B., 9
Hueglin Ch., 65
Hugony F., 80
Hulskotte J., 81
Hussein T., 188
Iacobellis S., 255
Ibarra S., 157
Im U., 5, 32, 35
Imperiali A., 266
Indira G., 202
InnessL A., 105
Innocente E., 284
Iordache M.-D., 70
Jaaffrey S.N.A., 273
Jacob D., 6
Janhäll S., 171, 173, 174, 177, 181
Janssen S., 136, 315, 331
Järlskog I., 171
Jeanjean A.P.R., 90
Jensen S.S., 5, 32, 35
Jhun I., 9
Jia S.H., 103
Jiang Y.A., 103
Jiménez-Guerrero P., 29, 31, 161
Johansson C., 46, 52, 137, 173, 177, 181, 190, 258
Johansson L., 138
Jonkers S., 189, 191
Jonson J.E., 10
Jorba O., 31, 50
Joshi S., 264
Juda-Rezler K., 315
Jung J., 143
Junk J., 49
Juretić ., 283
Juruš P., 162
Kaffashzadeh N., 34
Kakosimos K.E., 35, 282, 299
Kanatschnig F., 193
Kang D., 11
Kangas L., 189
Karakitsios S., 53, 127
Karakitsios S.P., 120, 187
Karanasiou A., 169
Karjalainen P., 194
Karl M., 188, 189
Karppinen A., 138, 181, 189, 328
Karvosenoja N., 315
Katpattil S., 203
Kattner L., 83, 139
Kauhaniemi M.K., 181, 328
Kazepov Y., 141
Kazmuková M., 162
Kermenidou M., 120
Kermenidou M., 127, 187, 268
Kesarkar A., 204
Keskinen J., 194, 206
Ketzel M., 328
Ketzel M., 5, 32, 35, 181, 299
Keuken M.P., 188, 189
Khan T., 264
Khoshsima M., 92, 207, 287
Kiesewetter G., 212
Kleanthous S., 224
Klemp D., 109
Klenk U., 175
Kloog I., 165, 166
Knowland K.E., 102
Kofahl C., 109
Komínková K., 63
Kontoroupis P., 53, 313
Koplitz S., 6
Koppe C., 164
Kousa A., 328
Koutrakis P., 9
Koutsourakis N., 33
Krajny E., 312
Kranenburg R., 79, 191
Krč P., 162
Krecl P., 270
Krein A., 49
Kuenen J., 79
Kuik F., 226
Kukec A., 245
Kukkonen J., 138, 181, 188, 189, 328
Kumar Gorai A., 225
Kumar N., 143
Kumar P., 254, 282
Kumar R., 135, 265
Kupiainen K., 180, 181, 328
Kura J., 109
Kusch T., 323
Kuula J., 206
Kyriakou S., 120
Labancz K., 311
Lacressoniere G., 321
Lahoz W., 62
Lamberti M., 118

336
Lampel J., 193
Landi T.C., 219
Lansø A.S., 8
Lanzani G., 7, 122, 308
Latorre E., 241
Lauer A., 226
Lavrova O., 94
Lawrence A., 264
Leduc R., 244
Lefebvre W., 331
Leigh R.J., 90
Leitl B., 87, 236
Leitte A., 159
Lelieveld J., 48, 224
Levy J., 322
Liakakou E., 211
Limpaseni W., 110
Lin W.L., 103
Liotta F., 123, 232
Lissi E., 69, 215
Liu L., 124
LIU W., 148
Løftstrøm P., 32
Lokys H.L., 49
Lonati G., 117, 213, 231
Longhin E., 50
Lopata J., 162
López D., 279
López G., 69
López N., 69, 215
López-Aparicio S., 124, 278
Lövenheim B., 190
Lozhkin V.N., 176
Lozhkina O.V., 176
Lucarelli F., 116, 169, 170, 327
Luckow P., 322
Lüdecke A., 109
Lumbreras J., 82, 241
Luo H., 145
Lützenkirchen S., 188, 189
Machado M., 51
Mackenzie I.A., 107
Maffeis G., 125, 140, 308, 315
Maggos T., 169
Magliulo E., 64
Magliulo V., 75, 101
Magra G., 12
Magri T., 285
Maier W., 12
Maiheu B., 331
Maione M., 141
Makris K., 187
Malinen A., 180
Malkin T.L., 107
Manders A., 29, 189, 191
Männikkö J-P., 180
Manousakas M., 169
Mantovani A., 227, 284
Maqueda G., 241
Mar K., 226
Marabini L., 117
Marinovich M., 117
Markakis K., 321
Markatos N.C., 33
Markstedt A., 190
Marlier M., 6
Marongiu A., 119, 122
Marrero C., 228
Martilli A., 39, 91, 315
Martin F., 39, 91, 214
Martins L.D., 320
Marzin A., 142
Masato G., 111
Massabò D., 61
Massart S., 105
Massoli P., 77
Masui T., 56
Mathieu-Üffing B., 83, 139
Mathur R., 11, 145
Matteucci G., 132
Matthias V., 19, 36, 81, 131
Matyasovszky I., 311
Mavroidis I., 51
Mazzarella A., 64
Mazzini B., 219
Mbiake R., 244
McMullan W.A., 90
Meffray L., 66
Melas D., 55, 235
Meng Z.Y., 103
Merlaud A., 70
Merritt A., 258
Meuleman K., 70
Michelozzi P., 160
Michelsen L.N., 32
Mickley L., 6
Mifka B., 283
Migliavacca G., 80
Mihalopoulos N., 205, 211
Milford C., 228
Miller B., 313
Milliez M., 236
Minguillón M.C., 169
Miranda A., 315
Miratrix L., 154
Mircea M., 150, 243
Miškinytė A., 229, 260
Misstear B., 310
Mlakar P., 245
Molinie J., 67
Mollerup S., 50
Monaco D., 178
Monks P.S., 90
Monteleone B., 125
Morabito A., 78
Morreale C., 80
Moussiopoulos N., 126, 189, 192
Mücke H.-G., 164, 249
Mueller M.-D., 65
Muller D., 66
Münkel C., 93
Myers S., 6
Naderi M., 303
Nahorski Z., 315
Namdeo A., 135
Namdeo A., 248
Nandini N., 247, 314
Nanni A., 144, 178, 230
Napelenok S., 11
Narros A., 163
Naughton O., 310
Nava S., 116, 169, 170, 327
Neal L., 29, 106
Neaud C., 66

337
Necki J., 259
Necki J.M., 257
Neumann D., 36
Neves C., 157
Nevmerzhitsky N.V., 176
Nibart M., 236
Nielse C., 250
Nielsen O.-K., 5
Niemi J., 180, 328
Nikolaki S., 127, 268
Nilsson J., 190
Nithin Kumar A., 204
Nogueira T., 157
Nopmongcol U., 143
Norman M., 173, 177, 181
Nothard R., 93, 109
Ntziachristos L., 12, 194, 195
Nuiro P., 67
Nunes T., 169
Nyiri A., 38
O'Connor F., 104
Odhiambo G.O., 21
Olin M., 206
Oliveira L.F.S., 270
Olivera N., 215
Olstrup H., 52
Ordóñez C., 106
Osrodka L., 312
Öttl D., 37
Ottosen T.-B., 35, 299
Ould El Moctar A., 221, 222
Øvrevik J., 50
Oyola P., 69, 215, 263
Ozgen S., 117, 213
Paciucci L., 123, 232, 266
Paglione M., 77
Palacios-Peña L., 29, 161
Pallavidino L., 132
Palmeri L., 284
Panchal P.B., 265
Pankratova N., 94
Paolini V., 123
Papa P., 232
Paraskevopoulou D., 205
Pardo F., 263
Parenti P., 50
Parodi F., 61
Parra R., 300, 301
Parrington M., 105
Parviainen H., 181
Pasqual E., 324
Patil R.S., 248, 265
Pay M.T., 23
Pecorari E., 284
Pederzoli A., 156
Pedrotti J.J., 157
Pelliccioni A., 118, 261
Pepe N., 231
Pereira F.N., 253
Pérez J., 82
Pérez J.L., 31
Pérez P., 263
Perilli M., 118, 123, 255, 266
Perretta G., 178
Perricone G., 179
Perrino C., 118
Pession G., 80, 285, 309
Petäjä T., 189
Peters A., 323
Peters E., 83
Petit J-F., 66
Petracchini F., 123, 232, 266
Petralia E., 77
Petrik R., 37
Petrov A., 236
Peuch V.-H., 105
Phairuang W., 110
Phuleria H.C., 59, 248, 265, 280
Piazzalunga A., 116, 277
Pierre-Georges V., 67
Piersanti A., 150, 243
Pietrogrande M.C., 77
Pietsch A., 109
Pihlava K., 206
Pikridas M., 224
Pilla F., 310
Pio C., 169
Pirjola L., 180, 188, 194
Pirjola L., 328
Pirojola L., 181
Pirovano G., 31, 219, 231
Pirrone N., 262
Piscitelli D., 64, 75
Pisoni E., 140, 315
Platt U., 193
Plejdrup M.S., 5
Pöhler D., 193
Polidori P., 141
Poluzzi V., 77
Pommier M., 38
Pope R., 106
Popovic T., 44
Porta D., 118
Posada E., 286
Potila O., 206
Poulsenand M.B., 35
Poupkou A., 55, 235
Pozzer A., 48, 98
Pozzi C., 144, 178, 230
Prandi R., 132
Prati M.V., 178
Prati P., 61
Proestos Y., 224
Putkhong M., 302
Quaassdorff C., 39, 82
Quante M., 36, 131
Querol X., 169
Radice P., 47, 118
Rakai A., 236
Rakitin V., 68
Rampazzo G., 284
Rao S.T., 145
Rasoloharimahefa M., 315
Raut J.C., 97
Ravetta F., 97
Real E., 315
Reche C., 169
Reis N.C., 51
Reisen Jr V.A., 51
Relvas H., 315
Resler J., 162
Reuter U., 71
Reyes F., 69, 215
Ricchiuti F., 132

338
Riccio A., 64, 178, 219
Riccobono F., 116, 179
Richter A., 83
Righini G., 150, 243
Rinaldi M., 77
Ritola R., 180
Riva G.M., 231
Rivas E., 39, 91
Robins A., 293
Rodríguez E., 163
Rodríguez S., 228
Røen H.V., 124
Roger J., 244
Rolstad Denby B., 328
Romagnoli P., 118, 255, 266
Román-Cascón C., 241
Rönkkö T., 194, 206
Roozendael ., 70
Rosdahl H., 190
Rozanski K., 257, 259
Rubio M., 215
Rubio M.A., 69
Rungratanaubon T., 302
Rus M., 243
Russo I., 64
Saari S., 194
Sabetghadam S., 92, 207, 267, 287
Sacco F., 118
Sae Tung W., 110
Sagán I., 258
Sahu L.K., 273
Salamanca F., 220
Salim S.M., 220
Samaras Z., 12, 189, 195
San José R., 31, 50
Sanchez B., 39, 91
Sánchez C., 163
Sánchez de la Campa A., 228
Sandberg M., 88
Santiago J.L., 39, 91, 214, 220
Santos G., 233
Santos J.M., 51, 221, 222
Sarigiannis D.A., 53, 120, 127, 187, 268, 313
Sarwar G., 11
Sastre M., 241
Savage N., 29, 106
Scafetta N., 64
Schaap M., 29, 79, 191, 212
Schäfer K., 93, 109
Schantz P., 190
Schauer J.J., 109, 182
Scheffknecht G., 121
Schepanski K., 13, 298
Schieberle C., 313
Schipa I., 78
Schlünzen K.H., 37
Schmolke S., 83, 139
Schneider A., 323
Schneider I.L., 253, 270
Schneider P., 62
Schöpp W., 212
Schröder S., 34
Schrödner R., 250
Schroeder W., 31, 50
Schultz M.G., 34
Schwartz J., 6, 9
Schwartz J.D., 158, 165, 166
Schwarze P.E., 8
Scortichini M., 160
Segalin B., 157
Segreto M., 123, 232, 266
Selin N.E., 19
Seregni E., 144
Sergi V., 141
Sethi V., 135
Severi M., 169
Seyler A., 83, 139
Sha A., 269
Shafer M., 182
Sharma Dr.S.K., 246
Shi L., 165
Shindler L., 75, 101, 178
Shirmohammadi F., 182
Shultz M., 10
Šidlauskaitė G., 229
Signorini S., 117, 213
Sigsgaard T., 5
Silibello C., 78, 118, 230
Simonen P., 206
Simpson D., 22
Singh V., 146, 189, 204
Singh V.P., 313
Sioutas C., 126, 182
Sivasakthivel S., 247, 314
Sjöberg K., 172
Skjøth ., 8
Skorokhod A., 94
Skov H., 299
Snilsberg B., 174
Sokhi R.S., 100, 133, 146, 189
Solazzo E., 234
Solomou E., 235
Song S., 19
Sousa Santos G., 147, 183
Sparrow D., 166
Speyer O., 115
Spinazzè A., 324
Sprovieri F., 262
Srbová D., 162
Sri Murali M., 204
Stafoggia M., 54, 118, 160
Stefani P., 75
Stein A.F., 228
Stein O., 34
Stel F., 309
Stevenson D., 104
Stocker J.R., 107
Stojiljkovic A., 180, 181, 328
Straffellini G., 179
Strömberg M., 190
Süld J.K., 183
Sundvor I., 147, 177, 181, 183, 278
Suppan P., 159
Suwattiga P., 110
Syropoulou P., 55
Taccetti F., 116
Tack F., 70
Taieb D., 281, 288
Tanzarella A., 78
Tardivo R., 117, 213
Taubenböck H., 20
Tavares R., 236
Tegen I., 13, 298
Teixeira E.C., 253, 270

339
Teobaldelli D., 141
Terán S., 233
Theobald M.R., 22
Thomas M.A., 108
Thunis P., 140, 315
Thunis Ph., 136
Tilgner A., 250
Timonen H., 206
Tinarelli G., 236
Toffolo S., 12
Tofful L., 118
Tombolato I., 80
Toppetti A., 231
Torbatian S., 303
Torpy F., 24
Tortorella C., 255
Tosca M., 64, 178
Toscano P., 64, 75
Travnikov O., 19
Trehan L., 248
Trini Castelli S., 236
Tsegas G., 31, 50, 126
Tuccella P., 29
Tuna G., 289
Turnock S., 104
Turrini E., 156, 308, 315
Tzimou – Tsitouridou R., 120
Vagnoli C., 75
Valance A., 221, 222
Valari M., 321
Valdes C., 12
Valeri E., 141
Valiyaveetil S., 10
Vallejo I., 183
Valli G., 116, 117, 170, 213, 277, 327
Valverde V., 23
van den Elshout S., 148, 271
Van der ELST F., 72
van Espen L., 81
Van Langenhove H., 72
Van Roozendael M., 70
Vandenberghe F., 89
Vara A., 157
Vardoulakis S., 241
Vargas M.-D., 270
Vásquez Y., 215
Vautard R., 321
Vázquez Y., 69
Vecchi R., 116, 117, 170, 213, 277, 327
Veldeman N., 148
Venetsanos A.G., 33
Venkataraman C., 280
Venuta ML., 125
Verijkazemi K., 272
Vialetto G., 150
Vichi F., 266
Vidal B., 66
Vieira-Filho M.S., 157
Vieno M., 22, 107
Vigo V., 61
Vijay B., 202
Vilkaitė M., 260
Villalobos A.M., 109
Viola R., 64
Vitale L., 75
Vitali L., 150
Vlachokostas Ch., 126
Vlček O., 162
Vo Thanh D., 278
Vock C., 12
Vogel B., 115
Vogel B., 99
Vogel H., 115
Vogt M., 124, 278
Vogt U., 71, 121
Vokonas P.S., 158, 166
Volker V., 83
Volta M., 140, 156, 315
von Schneidemesser E., 93, 109
Vouitsis I., 12, 189, 195
Vranckx S., 331
Vratolis S., 169
Vrekoussis M., 224
Wagner R., 13
Wahlgren L., 190
Wahlström J., 179
Walgraeve C., 72
Wang D., 182
Wang G., 68
Wang L., 30
Wang X., 30
Wang X.L., 149, 155
Watson J.G., 149, 155
Webber C., 111
Werchan B., 249
Werchan M., 249
Werhahn J., 29, 31, 50
Whalley L.K., 107
White L., 315
Wiegner M., 93
Wigö H., 88
Wihersaari H., 206
Wilczak J., 4
Wild O., 104
Willers S.M., 271
Williams M.L., 141
Wind P., 38
Wittrock F., 83, 139
Wolf K., 323
Wolke R., 31, 50, 250
Xie Y., 30, 56
Xie Y.L., 103
Xie Z.-T., 293
Xing J., 11
Xu X.B., 103
Yadav R., 273
Yadav R.., 273
Yagüe C., 241
Yarwood G., 143
Ynoue R.Y., 157
Yu H., 70
YU L., 148
Žabkar R., 29, 31
Zacharias S., 164
Zaldei A., 64, 75
Zaletel-Kragelj L., 245
Zampetti E., 232
Zang X., 19
Zanini G., 150
Zanis P., 235
Zanobetti A., 158, 165, 166
Zarmpas P., 205
Zavattaro M., 24
Zhang R., 103

340
Zheng J., 121
Zieba D., 259
Zikopoulos D., 127, 268
Zimnoch M., 257, 259
Zink K., 27, 237
Zublena M., 80