Air quality forecasting system for Southeastern Brazil
14
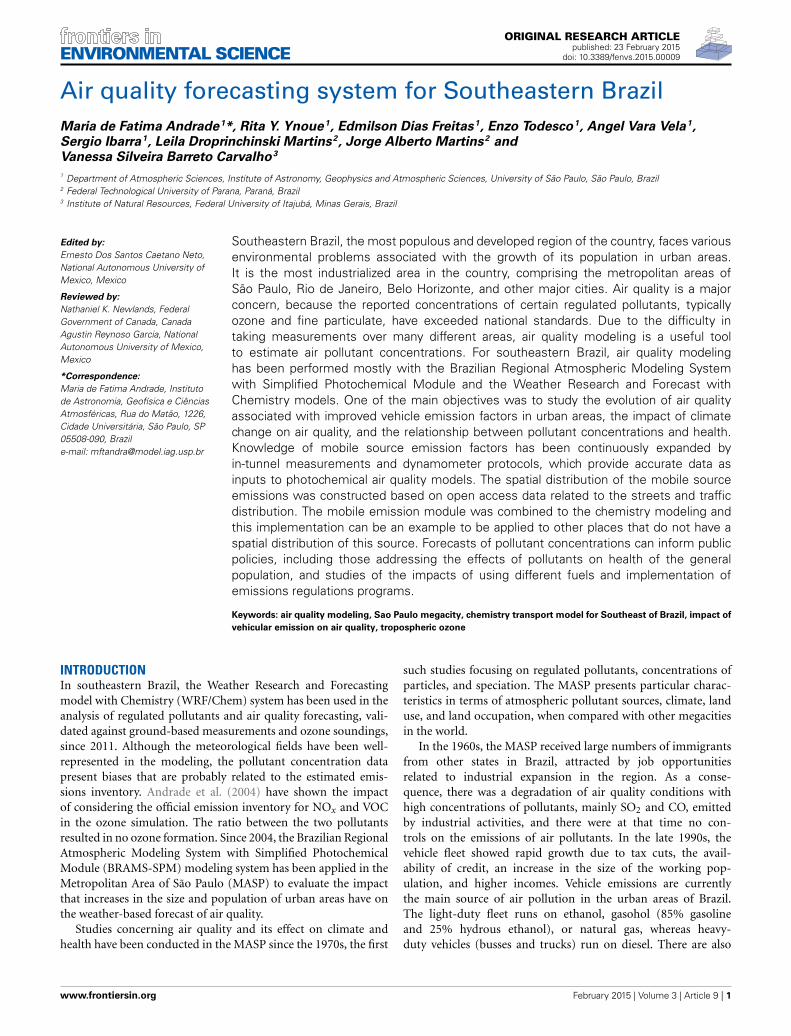
ORIGINAL RESEARCH ARTICLE published: 23 February 2015 doi: 10.3389/fenvs.2015.00009 Air quality forecasting system for Southeastern Brazil Maria de Fatima Andrade 1 *, Rita Y. Ynoue 1 , Edmilson Dias Freitas 1 , Enzo Todesco 1 , Angel Vara Vela 1 , Sergio Ibarra 1 , Leila Droprinchinski Martins 2 , Jorge Alberto Martins 2 and Vanessa Silveira Barreto Carvalho 3 1 Department of Atmospheric Sciences, Institute of Astronomy, Geophysics and Atmospheric Sciences, University of São Paulo, São Paulo, Brazil 2 Federal Technological University of Parana, Paraná, Brazil 3 Institute of Natural Resources, Federal University of Itajubá, Minas Gerais, Brazil Edited by: Ernesto Dos Santos Caetano Neto, National Autonomous University of Mexico, Mexico Reviewed by: Nathaniel K. Newlands, Federal Government of Canada, Canada Agustin Reynoso Garcia, National Autonomous University of Mexico, Mexico *Correspondence: Maria de Fatima Andrade, Instituto de Astronomia, Geofísica e Ciências Atmosféricas, Rua do Matão, 1226, Cidade Universitária, São Paulo, SP 05508-090, Brazil e-mail: [email protected] Southeastern Brazil, the most populous and developed region of the country, faces various environmental problems associated with the growth of its population in urban areas. It is the most industrialized area in the country, comprising the metropolitan areas of São Paulo, Rio de Janeiro, Belo Horizonte, and other major cities. Air quality is a major concern, because the reported concentrations of certain regulated pollutants, typically ozone and fine particulate, have exceeded national standards. Due to the difficulty in taking measurements over many different areas, air quality modeling is a useful tool to estimate air pollutant concentrations. For southeastern Brazil, air quality modeling has been performed mostly with the Brazilian Regional Atmospheric Modeling System with Simplified Photochemical Module and the Weather Research and Forecast with Chemistry models. One of the main objectives was to study the evolution of air quality associated with improved vehicle emission factors in urban areas, the impact of climate change on air quality, and the relationship between pollutant concentrations and health. Knowledge of mobile source emission factors has been continuously expanded by in-tunnel measurements and dynamometer protocols, which provide accurate data as inputs to photochemical air quality models. The spatial distribution of the mobile source emissions was constructed based on open access data related to the streets and traffic distribution. The mobile emission module was combined to the chemistry modeling and this implementation can be an example to be applied to other places that do not have a spatial distribution of this source. Forecasts of pollutant concentrations can inform public policies, including those addressing the effects of pollutants on health of the general population, and studies of the impacts of using different fuels and implementation of emissions regulations programs. Keywords: air quality modeling, Sao Paulo megacity, chemistry transport model for Southeast of Brazil, impact of vehicular emission on air quality, tropospheric ozone INTRODUCTION In southeastern Brazil, the Weather Research and Forecasting model with Chemistry (WRF/Chem) system has been used in the analysis of regulated pollutants and air quality forecasting, vali- dated against ground-based measurements and ozone soundings, since 2011. Although the meteorological fields have been well- represented in the modeling, the pollutant concentration data present biases that are probably related to the estimated emis- sions inventory. Andrade et al. (2004) have shown the impact of considering the official emission inventory for NO x and VOC in the ozone simulation. The ratio between the two pollutants resulted in no ozone formation. Since 2004, the Brazilian Regional Atmospheric Modeling System with Simplified Photochemical Module (BRAMS-SPM) modeling system has been applied in the Metropolitan Area of São Paulo (MASP) to evaluate the impact that increases in the size and population of urban areas have on the weather-based forecast of air quality. Studies concerning air quality and its effect on climate and health have been conducted in the MASP since the 1970s, the first such studies focusing on regulated pollutants, concentrations of particles, and speciation. The MASP presents particular charac- teristics in terms of atmospheric pollutant sources, climate, land use, and land occupation, when compared with other megacities in the world. In the 1960s, the MASP received large numbers of immigrants from other states in Brazil, attracted by job opportunities related to industrial expansion in the region. As a conse- quence, there was a degradation of air quality conditions with high concentrations of pollutants, mainly SO 2 and CO, emitted by industrial activities, and there were at that time no con- trols on the emissions of air pollutants. In the late 1990s, the vehicle fleet showed rapid growth due to tax cuts, the avail- ability of credit, an increase in the size of the working pop- ulation, and higher incomes. Vehicle emissions are currently the main source of air pollution in the urban areas of Brazil. The light-duty fleet runs on ethanol, gasohol (85% gasoline and 25% hydrous ethanol), or natural gas, whereas heavy- duty vehicles (busses and trucks) run on diesel. There are also www.frontiersin.org February 2015 | Volume 3 | Article 9 | 1 ENVIRONMENTAL SCIENCE
-
Upload
independent -
Category
Documents
-
view
2 -
download
0
Transcript of Air quality forecasting system for Southeastern Brazil
ORIGINAL RESEARCH ARTICLEpublished: 23 February 2015
doi: 10.3389/fenvs.2015.00009
Air quality forecasting system for Southeastern BrazilMaria de Fatima Andrade1*, Rita Y. Ynoue1, Edmilson Dias Freitas1, Enzo Todesco1, Angel Vara Vela1,
Sergio Ibarra1, Leila Droprinchinski Martins2, Jorge Alberto Martins2 and
Vanessa Silveira Barreto Carvalho3
1 Department of Atmospheric Sciences, Institute of Astronomy, Geophysics and Atmospheric Sciences, University of São Paulo, São Paulo, Brazil2 Federal Technological University of Parana, Paraná, Brazil3 Institute of Natural Resources, Federal University of Itajubá, Minas Gerais, Brazil
Edited by:
Ernesto Dos Santos Caetano Neto,National Autonomous University ofMexico, Mexico
Reviewed by:
Nathaniel K. Newlands, FederalGovernment of Canada, CanadaAgustin Reynoso Garcia, NationalAutonomous University of Mexico,Mexico
*Correspondence:
Maria de Fatima Andrade, Institutode Astronomia, Geofísica e CiênciasAtmosféricas, Rua do Matão, 1226,Cidade Universitária, São Paulo, SP05508-090, Brazile-mail: [email protected]
Southeastern Brazil, the most populous and developed region of the country, faces variousenvironmental problems associated with the growth of its population in urban areas.It is the most industrialized area in the country, comprising the metropolitan areas ofSão Paulo, Rio de Janeiro, Belo Horizonte, and other major cities. Air quality is a majorconcern, because the reported concentrations of certain regulated pollutants, typicallyozone and fine particulate, have exceeded national standards. Due to the difficulty intaking measurements over many different areas, air quality modeling is a useful toolto estimate air pollutant concentrations. For southeastern Brazil, air quality modelinghas been performed mostly with the Brazilian Regional Atmospheric Modeling Systemwith Simplified Photochemical Module and the Weather Research and Forecast withChemistry models. One of the main objectives was to study the evolution of air qualityassociated with improved vehicle emission factors in urban areas, the impact of climatechange on air quality, and the relationship between pollutant concentrations and health.Knowledge of mobile source emission factors has been continuously expanded byin-tunnel measurements and dynamometer protocols, which provide accurate data asinputs to photochemical air quality models. The spatial distribution of the mobile sourceemissions was constructed based on open access data related to the streets and trafficdistribution. The mobile emission module was combined to the chemistry modeling andthis implementation can be an example to be applied to other places that do not have aspatial distribution of this source. Forecasts of pollutant concentrations can inform publicpolicies, including those addressing the effects of pollutants on health of the generalpopulation, and studies of the impacts of using different fuels and implementation ofemissions regulations programs.
Keywords: air quality modeling, Sao Paulo megacity, chemistry transport model for Southeast of Brazil, impact of
vehicular emission on air quality, tropospheric ozone
INTRODUCTIONIn southeastern Brazil, the Weather Research and Forecastingmodel with Chemistry (WRF/Chem) system has been used in theanalysis of regulated pollutants and air quality forecasting, vali-dated against ground-based measurements and ozone soundings,since 2011. Although the meteorological fields have been well-represented in the modeling, the pollutant concentration datapresent biases that are probably related to the estimated emis-sions inventory. Andrade et al. (2004) have shown the impactof considering the official emission inventory for NOx and VOCin the ozone simulation. The ratio between the two pollutantsresulted in no ozone formation. Since 2004, the Brazilian RegionalAtmospheric Modeling System with Simplified PhotochemicalModule (BRAMS-SPM) modeling system has been applied in theMetropolitan Area of São Paulo (MASP) to evaluate the impactthat increases in the size and population of urban areas have onthe weather-based forecast of air quality.
Studies concerning air quality and its effect on climate andhealth have been conducted in the MASP since the 1970s, the first
such studies focusing on regulated pollutants, concentrations ofparticles, and speciation. The MASP presents particular charac-teristics in terms of atmospheric pollutant sources, climate, landuse, and land occupation, when compared with other megacitiesin the world.
In the 1960s, the MASP received large numbers of immigrantsfrom other states in Brazil, attracted by job opportunitiesrelated to industrial expansion in the region. As a conse-quence, there was a degradation of air quality conditions withhigh concentrations of pollutants, mainly SO2 and CO, emittedby industrial activities, and there were at that time no con-trols on the emissions of air pollutants. In the late 1990s, thevehicle fleet showed rapid growth due to tax cuts, the avail-ability of credit, an increase in the size of the working pop-ulation, and higher incomes. Vehicle emissions are currentlythe main source of air pollution in the urban areas of Brazil.The light-duty fleet runs on ethanol, gasohol (85% gasolineand 25% hydrous ethanol), or natural gas, whereas heavy-duty vehicles (busses and trucks) run on diesel. There are also
www.frontiersin.org February 2015 | Volume 3 | Article 9 | 1
ENVIRONMENTAL SCIENCE

Andrade et al. Air quality forecasting for Brazil
the so-called “flex-fuel” vehicles that can run on gasohol orethanol.
In comparison with other urban areas of Brazil, the MASP hasthe best network of air quality monitoring stations, which there-fore provide data with the highest spatial resolution. Air qualitymonitoring began in the late 1970s with the measurement of par-ticulate matter of less than 10 µm in diameter (PM10) and SO2
by the São Paulo State Companhia de Tecnologia de SaneamentoAmbiental (CETESB, Environmental Protection Agency). Orsiniet al. (1986) were the first to analyze the composition of par-ticulate matter in the MASP, using particle-induced X-ray emis-sion analysis of polycarbonate membranes sampled with cascadeimpactors and sequential samplers. Sources were identified byreceptor modeling, vehicle emissions being identified as the mainsource of fine particles, which remains the case. The receptormodeling approach has been applied for many years, produc-ing significant results related to source apportionment in theMASP. In other regions of Brazil, air quality issues have onlyrecently come to be considered a major concern. The WorldHealth Organization (WHO) recently evaluated the worldwideimpact of particulate matter on health and estimated that, in2011, 7 million people died as a result of high atmospheric con-centrations of particles, mainly in developing countries such asChina and India, which are the most populous countries andhave high concentrations of pollutants, 4.3 million of those deathsbeing associated with indoor pollution and 3.7 million being asso-ciated with atmospheric pollution from rural and urban sources(WHO, 2014).
The application of air quality models is considered to be apowerful tool for the study, description and forecasting of air pol-lution in areas affected by urban pollution, biomass burning, andresuspended soil dust, as described by Krzyzanowski et al. (2014).According to those authors, the concentrations of pollutants canbe estimated through the use of three-dimensional models, com-bined with direct measurements and analysis of satellite images.The three-dimensional air quality models describe the chem-istry, emissions, and transport of pollutants. The representationof emissions on a grid of adequate size provides a great deal ofcertainty. The modeling approach taken in different cities in thesoutheastern region of Brazil has been evolving, and most of theefforts have been focused on the construction of a comprehen-sive emissions inventory. In the MASP, the emissions inventory isbased on vehicle emission factors (dynamometer measurements)and tunnel measurements performed in the city of São Paulo in2001 and 2004 (Martins et al., 2006; Sánchez-Ccoyllo et al., 2009),as well as on experiments conducted in 2011 (Nogueira et al.,2014; Pérez-martínez et al., 2014).
Due to a lack of information from CETESB and fromthe Brazilian National Department of Transplantation(DENATRAN), various strategies have been employed inorder to determine the spatial distribution of emission sourcesin the MASP. One such strategy is the use of nocturnal satellitedata to describe the distribution of sources by their density, onthe basis of pixel density, as described in Martins et al. (2012).After the changes in fuel composition that occurred between2004 and 2011, that approach was used in regional studies aimedat analyzing the impact that those changes have had on the
behavior of ozone concentrations (Vara Vela, 2013). Mazzoli(2013) analyzed how tropospheric ozone concentrations in theMASP would respond to the climate change scenarios describedin the Fourth Assessment Report by the Intergovernmental Panelon Climate Change, as well as to projected changes in the localemissions of pollutants, showing that, in 2030 and 2050, changesin the size of the vehicle fleet and in vehicle emission factorswould have an effect of greater magnitude than that related to thepredicted changes in temperature and humidity.
Although many photochemical modeling studies have beenperformed in Brazil, most have been conducted in the MASP,although some have been conducted in the city of Rio de Janeiro.Godoy et al. (2009), using receptor modeling, found that vehicleemissions constitute the main source of pollutants in the city ofRio de Janeiro. Luna et al. (2014), using neural network analysis,developed a system for ozone prediction. In all such initiatives,one important objective is to provide a tool that can be used bygovernmental agencies to predict events of high pollutant concen-trations, which will make it possible to issue alerts and prepareemergency rooms to receive cases related to the poor air quality.Other cities in South America, such as Santiago, Chile, have actionplans for such eventualities (Saide et al., 2011). In Brazil, there arenational air quality standards for regulated pollutants. However,the state of São Paulo has changed its standards to be more restric-tive, in accordance with the WHO guidelines (CETESB, 2014).The state standards will be changed gradually, in three phases, thelast of which involves setting the maximum allowable concentra-tions of regulated pollutants to the values recommended by theWHO.
Air quality modeling can be an effective tool to meet the chal-lenge of describing the chemistry of secondary pollutant forma-tion, specifically that of ozone and fine particles. In the MASP, thestudy of the formation of ozone and other gaseous photochem-ical compounds started with the off-line use of the CaliforniaInstitute of Technology air quality model (McRae et al., 1982). Intwo studies employing that model (Andrade et al., 2004; Vivancoand Andrade, 2006), the atmosphere of the MASP was found tohave a high potential to form ozone and that the concentrationsof nitrogen oxides (NOx) in the official emissions inventory aretwice as high as those that would be expected on the basis ofmodeling results and the concentrations measured at air qual-ity monitoring stations. Important aspects of ozone formation inthe MASP were studied by Martins et al. (2006), who identifiedthe main precursors of tropospheric ozone, and by Martins andAndrade (2008a), who demonstrated an increase in the reactivityof the ozone precursors in the region.
The impact of meteorological conditions on ozone forma-tion in the MASP was evaluated by Sánchez-Ccoyllo et al. (2006,2007), who used the California Institute of Technology air qualitymodel under NOx- or volatile organic compound (VOC)-limitedatmospheric conditions. Martins and Andrade (2008b) analyzedvarious scenarios of the use of pure ethanol, gasohol, and diesel inthe MASP, concluding that an increase in the use of ethanol, witha consequent decrease in the use of the gasohol currently avail-able in Brazil, would reduce ozone formation. However, when theanalysis involved “better” gasohol (with lower fractions of olefins,aromatics, and benzene) the difference between two scenarios
Frontiers in Environmental Science | Interdisciplinary Climate Studies February 2015 | Volume 3 | Article 9 | 2
Andrade et al. Air quality forecasting for Brazil
(ethanol vs. standard gasohol and ethanol vs. better gasohol) wassmall and shifted between positive and negative values, indicatingthat the use of gasohol containing fewer olefins and aromat-ics would be more efficient in decreasing ozone concentrationsthan would be a shift toward greater ethanol use. The model-ing capability has been increased by experimental studies aimedat improving the emissions inventory and describing the atmo-spheric processes. Such experiments consist of measurements ofozone precursors (Nogueira et al., 2014); fine and ultrafine parti-cles (Almeida et al., 2014); and emission factors (Nogueira et al.,2014; Pérez-martínez et al., 2014). Combining all the efforts thathave been applied to the representation of pollutants with airquality models in the MASP, an operation was implemented inorder to forecast the concentrations of ozone, carbon monox-ide, and particles. The forecasts are run daily and are availablefor consultation at the site: http://www.lapat.iag.usp.br/aerossol/wrf9/index.php. The air quality modeling platform establishedfor southeastern Brazil represents efforts to meet a variety ofchallenges in the atmospheric sciences: the description of thechemistry of reactive species; the characterization of transport byadvection and diffusion; and the development of reliable emis-sions inventories. Air quality is being forecast with two differenttools: the WRF/Chem (Grell et al., 2005); and the BRAMS-SPM (Freitas et al., 2005, 2009). The modeling is an example ofcombination of measurements of emission factors and ambientconcentrations, and the spatial representation of emission usingthe traffic and street maps as a proxy, to construct the module ofmobile emission. This modeling approach can be considered forother places impacted by the pollutants emitted by the vehicularfleet that do not have the spatial and temporal distribution of themobile sources.
MATERIALS AND METHODSThe approach adopted to provide the air quality forecasting forthe Southeast region of Brazil was the use of eulerian photo-chemical modeling. Two modeling systems are being used: WRF-Chem [Weather Research and Forecasting System with Chemistry,described in Grell et al. (2005)] and BRAMS-SPM [Braziliandevelopments on the Regional Atmospheric Modeling Systemwith Simplified Photochemical Module, described by Freitas et al.(2005) and Freitas et al. (2009)]. The implementation of themodeling system had the objective of forecasting regulated pollu-tants and the study of secondary pollutants formation and healthimpacts. The photochemical modeling system was integrated toan emission module developed to describe the real conditions oftraffic distribution over the modeled area.
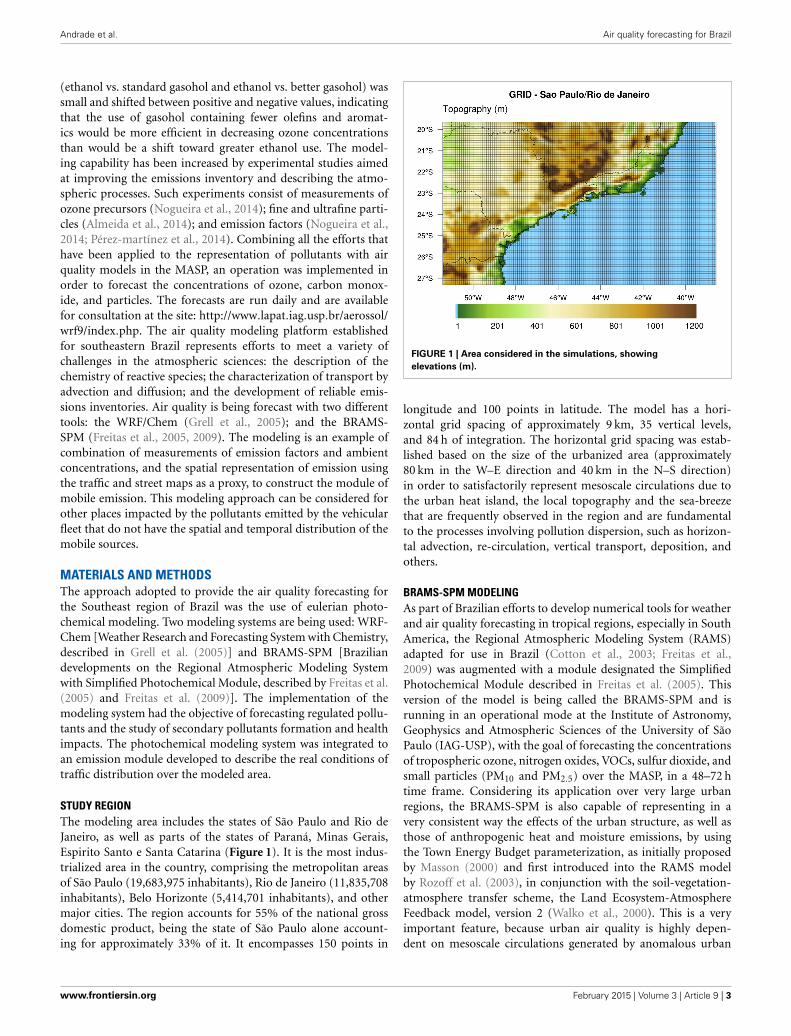
STUDY REGIONThe modeling area includes the states of São Paulo and Rio deJaneiro, as well as parts of the states of Paraná, Minas Gerais,Espirito Santo e Santa Catarina (Figure 1). It is the most indus-trialized area in the country, comprising the metropolitan areasof São Paulo (19,683,975 inhabitants), Rio de Janeiro (11,835,708inhabitants), Belo Horizonte (5,414,701 inhabitants), and othermajor cities. The region accounts for 55% of the national grossdomestic product, being the state of São Paulo alone account-ing for approximately 33% of it. It encompasses 150 points in
FIGURE 1 | Area considered in the simulations, showing
elevations (m).
longitude and 100 points in latitude. The model has a hori-zontal grid spacing of approximately 9 km, 35 vertical levels,and 84 h of integration. The horizontal grid spacing was estab-lished based on the size of the urbanized area (approximately80 km in the W–E direction and 40 km in the N–S direction)in order to satisfactorily represent mesoscale circulations due tothe urban heat island, the local topography and the sea-breezethat are frequently observed in the region and are fundamentalto the processes involving pollution dispersion, such as horizon-tal advection, re-circulation, vertical transport, deposition, andothers.
BRAMS-SPM MODELINGAs part of Brazilian efforts to develop numerical tools for weatherand air quality forecasting in tropical regions, especially in SouthAmerica, the Regional Atmospheric Modeling System (RAMS)adapted for use in Brazil (Cotton et al., 2003; Freitas et al.,2009) was augmented with a module designated the SimplifiedPhotochemical Module described in Freitas et al. (2005). Thisversion of the model is being called the BRAMS-SPM and isrunning in an operational mode at the Institute of Astronomy,Geophysics and Atmospheric Sciences of the University of SãoPaulo (IAG-USP), with the goal of forecasting the concentrationsof tropospheric ozone, nitrogen oxides, VOCs, sulfur dioxide, andsmall particles (PM10 and PM2.5) over the MASP, in a 48–72 htime frame. Considering its application over very large urbanregions, the BRAMS-SPM is also capable of representing in avery consistent way the effects of the urban structure, as well asthose of anthropogenic heat and moisture emissions, by usingthe Town Energy Budget parameterization, as initially proposedby Masson (2000) and first introduced into the RAMS modelby Rozoff et al. (2003), in conjunction with the soil-vegetation-atmosphere transfer scheme, the Land Ecosystem-AtmosphereFeedback model, version 2 (Walko et al., 2000). This is a veryimportant feature, because urban air quality is highly depen-dent on mesoscale circulations generated by anomalous urban
www.frontiersin.org February 2015 | Volume 3 | Article 9 | 3
Andrade et al. Air quality forecasting for Brazil
heating and roughness, creating the so called urban heat islandeffect, mentioned in studies conducted in various countries (Oke,1987; Yoshikado and Tsuchida, 1996; Ichinose et al., 1999; Baiket al., 2001; Cenedese and Monti, 2003; Gedzelman et al., 2003;Childs and Raman, 2005; Jonsson, 2005; Freitas et al., 2007; Roth,2007). Urban traffic behavior is simulated by considering pol-lutants and anthropogenic fluxes (of heat and moisture). Rushhours are taking into account by superposing two normal distri-butions, each centered on the peak hours during the morning andthe afternoon, respectively, as described by Freitas et al. (2007).
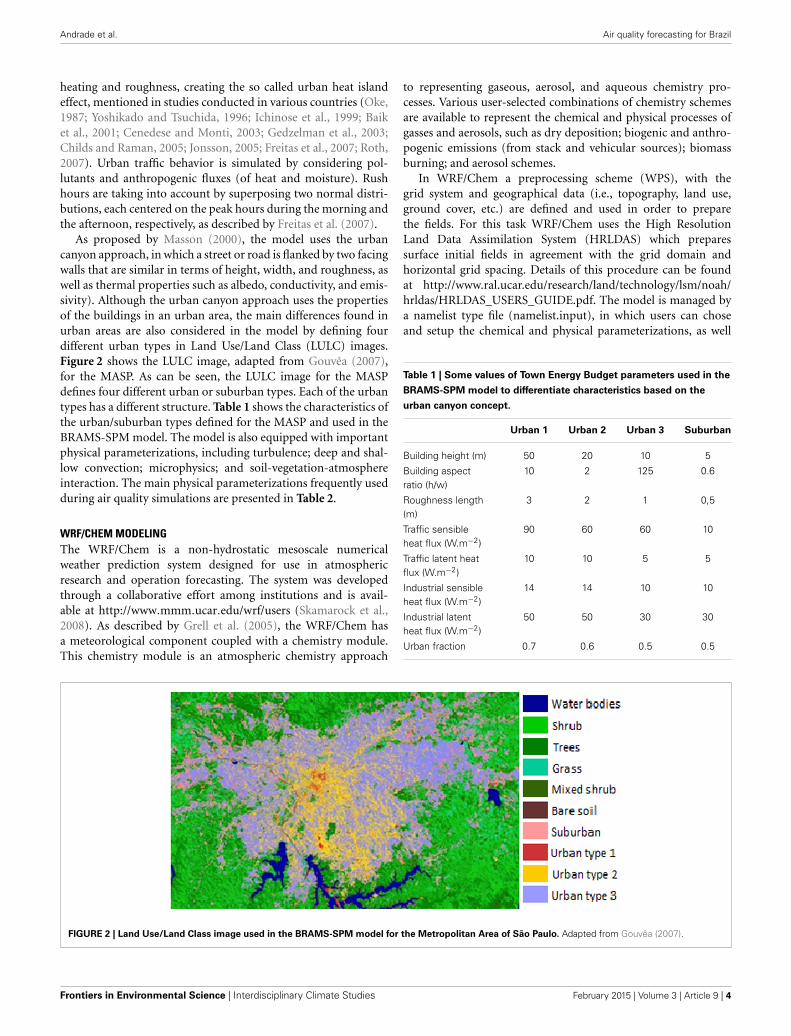
As proposed by Masson (2000), the model uses the urbancanyon approach, in which a street or road is flanked by two facingwalls that are similar in terms of height, width, and roughness, aswell as thermal properties such as albedo, conductivity, and emis-sivity). Although the urban canyon approach uses the propertiesof the buildings in an urban area, the main differences found inurban areas are also considered in the model by defining fourdifferent urban types in Land Use/Land Class (LULC) images.Figure 2 shows the LULC image, adapted from Gouvêa (2007),for the MASP. As can be seen, the LULC image for the MASPdefines four different urban or suburban types. Each of the urbantypes has a different structure. Table 1 shows the characteristics ofthe urban/suburban types defined for the MASP and used in theBRAMS-SPM model. The model is also equipped with importantphysical parameterizations, including turbulence; deep and shal-low convection; microphysics; and soil-vegetation-atmosphereinteraction. The main physical parameterizations frequently usedduring air quality simulations are presented in Table 2.
WRF/CHEM MODELINGThe WRF/Chem is a non-hydrostatic mesoscale numericalweather prediction system designed for use in atmosphericresearch and operation forecasting. The system was developedthrough a collaborative effort among institutions and is avail-able at http://www.mmm.ucar.edu/wrf/users (Skamarock et al.,2008). As described by Grell et al. (2005), the WRF/Chem hasa meteorological component coupled with a chemistry module.This chemistry module is an atmospheric chemistry approach
to representing gaseous, aerosol, and aqueous chemistry pro-cesses. Various user-selected combinations of chemistry schemesare available to represent the chemical and physical processes ofgasses and aerosols, such as dry deposition; biogenic and anthro-pogenic emissions (from stack and vehicular sources); biomassburning; and aerosol schemes.
In WRF/Chem a preprocessing scheme (WPS), with thegrid system and geographical data (i.e., topography, land use,ground cover, etc.) are defined and used in order to preparethe fields. For this task WRF/Chem uses the High ResolutionLand Data Assimilation System (HRLDAS) which preparessurface initial fields in agreement with the grid domain andhorizontal grid spacing. Details of this procedure can be foundat http://www.ral.ucar.edu/research/land/technology/lsm/noah/hrldas/HRLDAS_USERS_GUIDE.pdf. The model is managed bya namelist type file (namelist.input), in which users can choseand setup the chemical and physical parameterizations, as well
Table 1 | Some values of Town Energy Budget parameters used in the
BRAMS-SPM model to differentiate characteristics based on the
urban canyon concept.
Urban 1 Urban 2 Urban 3 Suburban
Building height (m) 50 20 10 5
Building aspectratio (h/w)
10 2 125 0.6
Roughness length(m)
3 2 1 0,5
Traffic sensibleheat flux (W.m−2)
90 60 60 10
Traffic latent heatflux (W.m−2)
10 10 5 5
Industrial sensibleheat flux (W.m−2)
14 14 10 10
Industrial latentheat flux (W.m−2)
50 50 30 30
Urban fraction 0.7 0.6 0.5 0.5
FIGURE 2 | Land Use/Land Class image used in the BRAMS-SPM model for the Metropolitan Area of São Paulo. Adapted from Gouvêa (2007).
Frontiers in Environmental Science | Interdisciplinary Climate Studies February 2015 | Volume 3 | Article 9 | 4
Andrade et al. Air quality forecasting for Brazil
Table 2 | Physical parameterizations used in the BRAMS-SPM.
Parameterization Reference(s)
Short- and long-wave radiation Chen and Cotton, 1983
Cumulus Kuo, 1974; Grell, 1993; Grell andDevenyi, 2002
Shallow cumulus Souza and Silva, 2003
Microphysics Walko et al., 1995; Meyers et al.,1997
Turbulence (anisotropic deformation) Smagorinsky, 1963; Smagorinsky,with modifications based on Hill(1974) and Lilly (1962).
Soil-vegetation-atmosphere transfer Walko et al., 2000
Urban features Masson, 2000; Rozoff et al.,2003; Freitas et al., 2007
as the time step, simulation period, grid configuration, outputtime, and types of emissions (such as biogenic, anthropogenic,biomass burning, dust, and industrial stack emissions). The laststep is the post processing, which can be done using the ARWprogram or a similar program in order to visualize the outputs.The computer system used is an SGI Altix XE 1300 Cluster. Thesystem is composed by 8 computing nodes, each of them having2 Intel Xeon 6 core 2—12 threads @ 3.07 GHz processors. Duringthe simulations, we use 48 threads (2 nodes—4 processors)and the mean computational coast is approximately 13 min ofprocessing for each simulated hour. In order to simulate 84 fourswe spend about 18 h of processing.
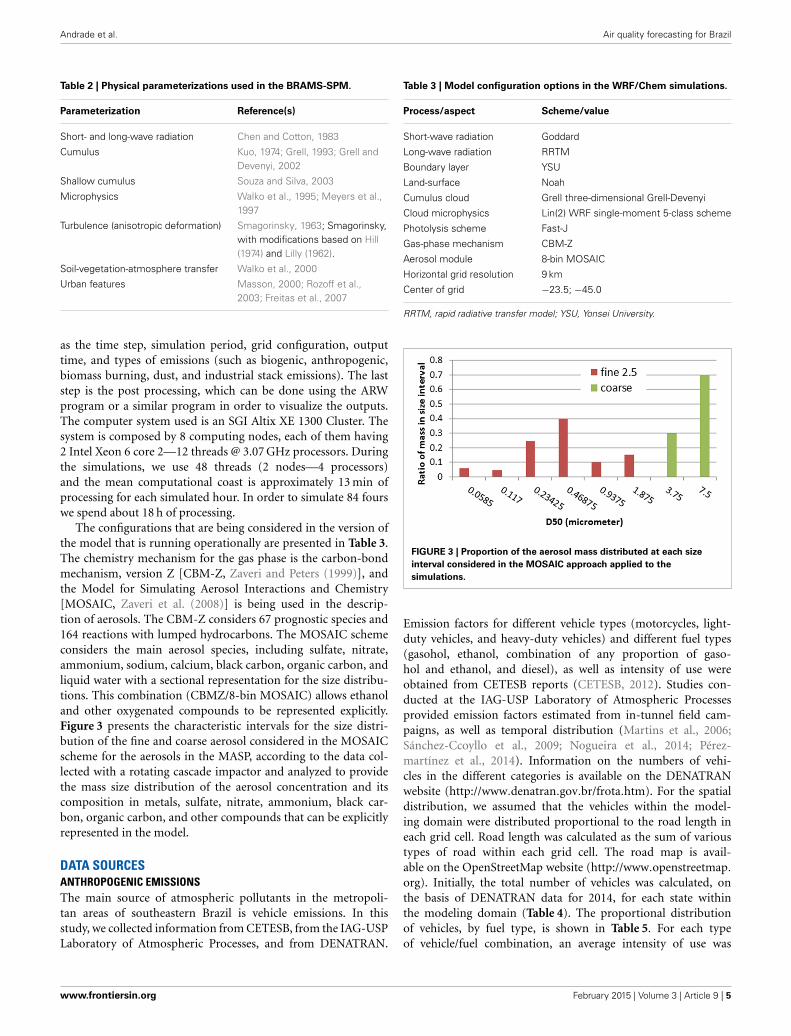
The configurations that are being considered in the version ofthe model that is running operationally are presented in Table 3.The chemistry mechanism for the gas phase is the carbon-bondmechanism, version Z [CBM-Z, Zaveri and Peters (1999)], andthe Model for Simulating Aerosol Interactions and Chemistry[MOSAIC, Zaveri et al. (2008)] is being used in the descrip-tion of aerosols. The CBM-Z considers 67 prognostic species and164 reactions with lumped hydrocarbons. The MOSAIC schemeconsiders the main aerosol species, including sulfate, nitrate,ammonium, sodium, calcium, black carbon, organic carbon, andliquid water with a sectional representation for the size distribu-tions. This combination (CBMZ/8-bin MOSAIC) allows ethanoland other oxygenated compounds to be represented explicitly.Figure 3 presents the characteristic intervals for the size distri-bution of the fine and coarse aerosol considered in the MOSAICscheme for the aerosols in the MASP, according to the data col-lected with a rotating cascade impactor and analyzed to providethe mass size distribution of the aerosol concentration and itscomposition in metals, sulfate, nitrate, ammonium, black car-bon, organic carbon, and other compounds that can be explicitlyrepresented in the model.
DATA SOURCESANTHROPOGENIC EMISSIONSThe main source of atmospheric pollutants in the metropoli-tan areas of southeastern Brazil is vehicle emissions. In thisstudy, we collected information from CETESB, from the IAG-USPLaboratory of Atmospheric Processes, and from DENATRAN.
Table 3 | Model configuration options in the WRF/Chem simulations.
Process/aspect Scheme/value
Short-wave radiation Goddard
Long-wave radiation RRTM
Boundary layer YSU
Land-surface Noah
Cumulus cloud Grell three-dimensional Grell-Devenyi
Cloud microphysics Lin(2) WRF single-moment 5-class scheme
Photolysis scheme Fast-J
Gas-phase mechanism CBM-Z
Aerosol module 8-bin MOSAIC
Horizontal grid resolution 9 km
Center of grid −23.5; −45.0
RRTM, rapid radiative transfer model; YSU, Yonsei University.
FIGURE 3 | Proportion of the aerosol mass distributed at each size
interval considered in the MOSAIC approach applied to the
simulations.
Emission factors for different vehicle types (motorcycles, light-duty vehicles, and heavy-duty vehicles) and different fuel types(gasohol, ethanol, combination of any proportion of gaso-hol and ethanol, and diesel), as well as intensity of use wereobtained from CETESB reports (CETESB, 2012). Studies con-ducted at the IAG-USP Laboratory of Atmospheric Processesprovided emission factors estimated from in-tunnel field cam-paigns, as well as temporal distribution (Martins et al., 2006;Sánchez-Ccoyllo et al., 2009; Nogueira et al., 2014; Pérez-martínez et al., 2014). Information on the numbers of vehi-cles in the different categories is available on the DENATRANwebsite (http://www.denatran.gov.br/frota.htm). For the spatialdistribution, we assumed that the vehicles within the model-ing domain were distributed proportional to the road length ineach grid cell. Road length was calculated as the sum of varioustypes of road within each grid cell. The road map is avail-able on the OpenStreetMap website (http://www.openstreetmap.
org). Initially, the total number of vehicles was calculated, onthe basis of DENATRAN data for 2014, for each state withinthe modeling domain (Table 4). The proportional distributionof vehicles, by fuel type, is shown in Table 5. For each typeof vehicle/fuel combination, an average intensity of use was
www.frontiersin.org February 2015 | Volume 3 | Article 9 | 5
Andrade et al. Air quality forecasting for Brazil
Table 4 | Total number of vehicles in each of the states within the
modeling domain.
State Number of vehicles
São Paulo 25,141,442
Rio de Janeiro 5,736,428
Minas Gerais 9,147,282
Espírito Santo 1,632,057
Paraná 6,523,727
Santa Catarina 4,312,896
Source: DENATRAN, 2014.
Table 5 | Vehicle types and proportional use of fuels.
Vehicle type Fuel burned Proportion of the total number
of vehicles
Light-duty vehicles Gasohol 0.4253
Ethanol 0.0320
Flex 0.3602
Trucks Diesel 0.0260
City busses Diesel 0.0290
Intercity busses Diesel 0.0008
Motorcycles Gasohol 0.1181
Flex 0.0086
Table 6 | Intensity of use, by vehicle type.
Vehicle type Use (km/day)
Light-duty vehicles 41
Trucks 110
Busses 165
Motorcycles 140
estimated from CETESB data (CETESB, 2012), as shown inTable 6.
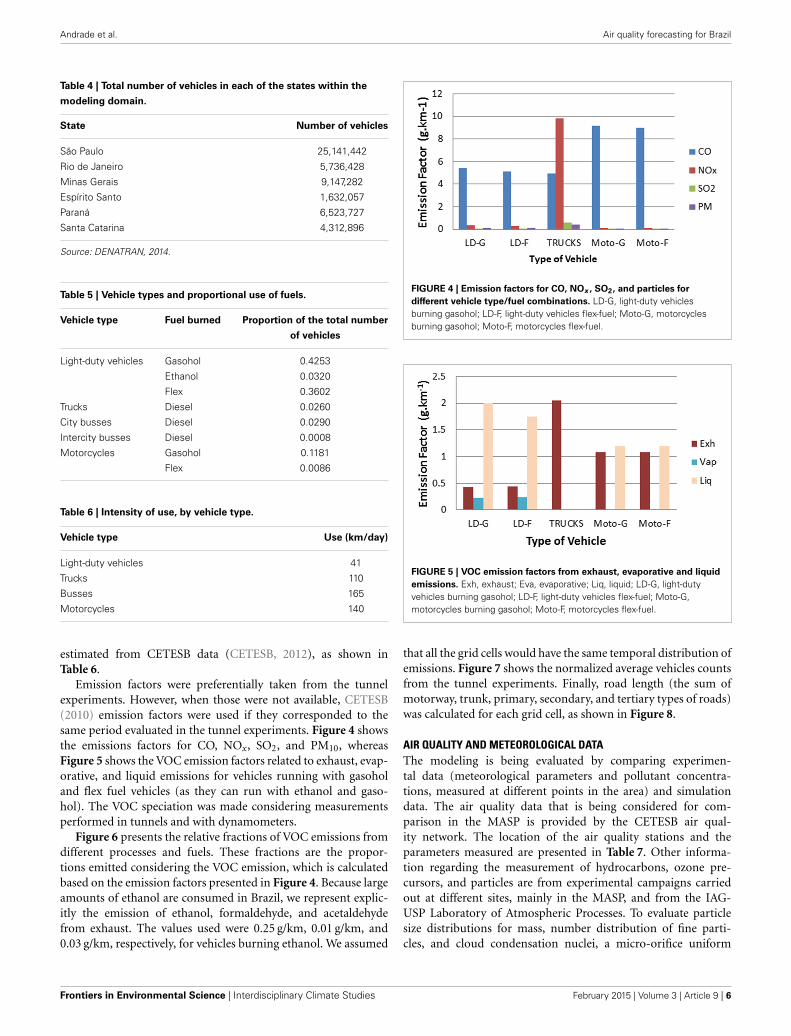
Emission factors were preferentially taken from the tunnelexperiments. However, when those were not available, CETESB(2010) emission factors were used if they corresponded to thesame period evaluated in the tunnel experiments. Figure 4 showsthe emissions factors for CO, NOx, SO2, and PM10, whereasFigure 5 shows the VOC emission factors related to exhaust, evap-orative, and liquid emissions for vehicles running with gasoholand flex fuel vehicles (as they can run with ethanol and gaso-hol). The VOC speciation was made considering measurementsperformed in tunnels and with dynamometers.
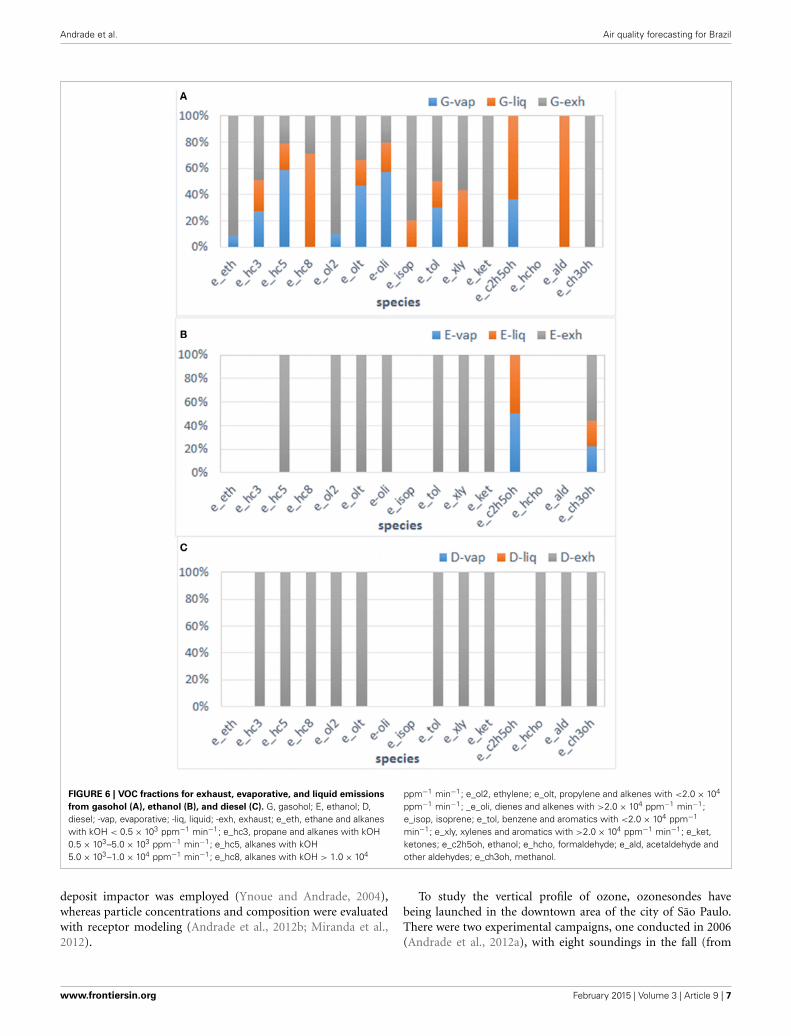
Figure 6 presents the relative fractions of VOC emissions fromdifferent processes and fuels. These fractions are the propor-tions emitted considering the VOC emission, which is calculatedbased on the emission factors presented in Figure 4. Because largeamounts of ethanol are consumed in Brazil, we represent explic-itly the emission of ethanol, formaldehyde, and acetaldehydefrom exhaust. The values used were 0.25 g/km, 0.01 g/km, and0.03 g/km, respectively, for vehicles burning ethanol. We assumed
FIGURE 4 | Emission factors for CO, NOx , SO2, and particles for
different vehicle type/fuel combinations. LD-G, light-duty vehiclesburning gasohol; LD-F, light-duty vehicles flex-fuel; Moto-G, motorcyclesburning gasohol; Moto-F, motorcycles flex-fuel.
FIGURE 5 | VOC emission factors from exhaust, evaporative and liquid
emissions. Exh, exhaust; Eva, evaporative; Liq, liquid; LD-G, light-dutyvehicles burning gasohol; LD-F, light-duty vehicles flex-fuel; Moto-G,motorcycles burning gasohol; Moto-F, motorcycles flex-fuel.
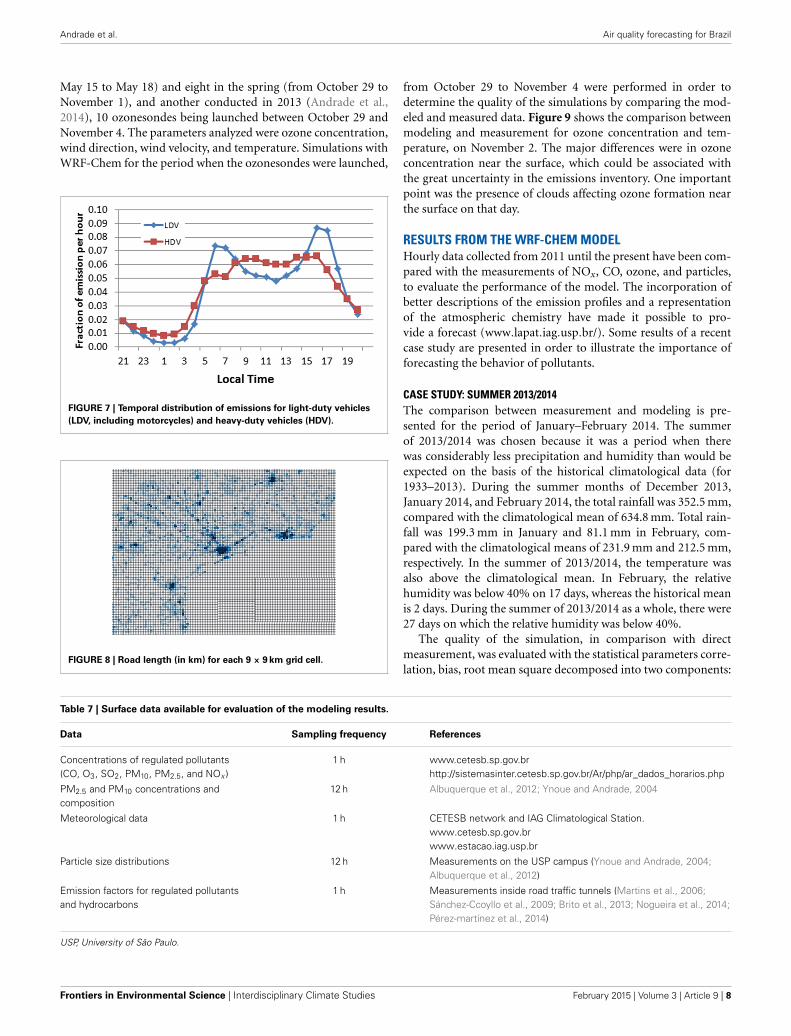
that all the grid cells would have the same temporal distribution ofemissions. Figure 7 shows the normalized average vehicles countsfrom the tunnel experiments. Finally, road length (the sum ofmotorway, trunk, primary, secondary, and tertiary types of roads)was calculated for each grid cell, as shown in Figure 8.
AIR QUALITY AND METEOROLOGICAL DATAThe modeling is being evaluated by comparing experimen-tal data (meteorological parameters and pollutant concentra-tions, measured at different points in the area) and simulationdata. The air quality data that is being considered for com-parison in the MASP is provided by the CETESB air qual-ity network. The location of the air quality stations and theparameters measured are presented in Table 7. Other informa-tion regarding the measurement of hydrocarbons, ozone pre-cursors, and particles are from experimental campaigns carriedout at different sites, mainly in the MASP, and from the IAG-USP Laboratory of Atmospheric Processes. To evaluate particlesize distributions for mass, number distribution of fine parti-cles, and cloud condensation nuclei, a micro-orifice uniform
Frontiers in Environmental Science | Interdisciplinary Climate Studies February 2015 | Volume 3 | Article 9 | 6
Andrade et al. Air quality forecasting for Brazil
FIGURE 6 | VOC fractions for exhaust, evaporative, and liquid emissions
from gasohol (A), ethanol (B), and diesel (C). G, gasohol; E, ethanol; D,diesel; -vap, evaporative; -liq, liquid; -exh, exhaust; e_eth, ethane and alkaneswith kOH < 0.5 × 10³ ppm−1 min−1; e_hc3, propane and alkanes with kOH0.5 × 103–5.0 × 10³ ppm−1 min−1; e_hc5, alkanes with kOH5.0 × 103–1.0 × 10⁴ ppm−1 min−1; e_hc8, alkanes with kOH > 1.0 × 10⁴
ppm−1 min−1; e_ol2, ethylene; e_olt, propylene and alkenes with <2.0 × 10⁴
ppm−1 min−1; _e_oli, dienes and alkenes with >2.0 × 10⁴ ppm−1 min−1;e_isop, isoprene; e_tol, benzene and aromatics with <2.0 × 10⁴ ppm−1
min−1; e_xly, xylenes and aromatics with >2.0 × 10⁴ ppm−1 min−1; e_ket,ketones; e_c2h5oh, ethanol; e_hcho, formaldehyde; e_ald, acetaldehyde andother aldehydes; e_ch3oh, methanol.
deposit impactor was employed (Ynoue and Andrade, 2004),whereas particle concentrations and composition were evaluatedwith receptor modeling (Andrade et al., 2012b; Miranda et al.,2012).
To study the vertical profile of ozone, ozonesondes havebeing launched in the downtown area of the city of São Paulo.There were two experimental campaigns, one conducted in 2006(Andrade et al., 2012a), with eight soundings in the fall (from
www.frontiersin.org February 2015 | Volume 3 | Article 9 | 7
Andrade et al. Air quality forecasting for Brazil
May 15 to May 18) and eight in the spring (from October 29 toNovember 1), and another conducted in 2013 (Andrade et al.,2014), 10 ozonesondes being launched between October 29 andNovember 4. The parameters analyzed were ozone concentration,wind direction, wind velocity, and temperature. Simulations withWRF-Chem for the period when the ozonesondes were launched,
FIGURE 7 | Temporal distribution of emissions for light-duty vehicles
(LDV, including motorcycles) and heavy-duty vehicles (HDV).
FIGURE 8 | Road length (in km) for each 9 × 9 km grid cell.
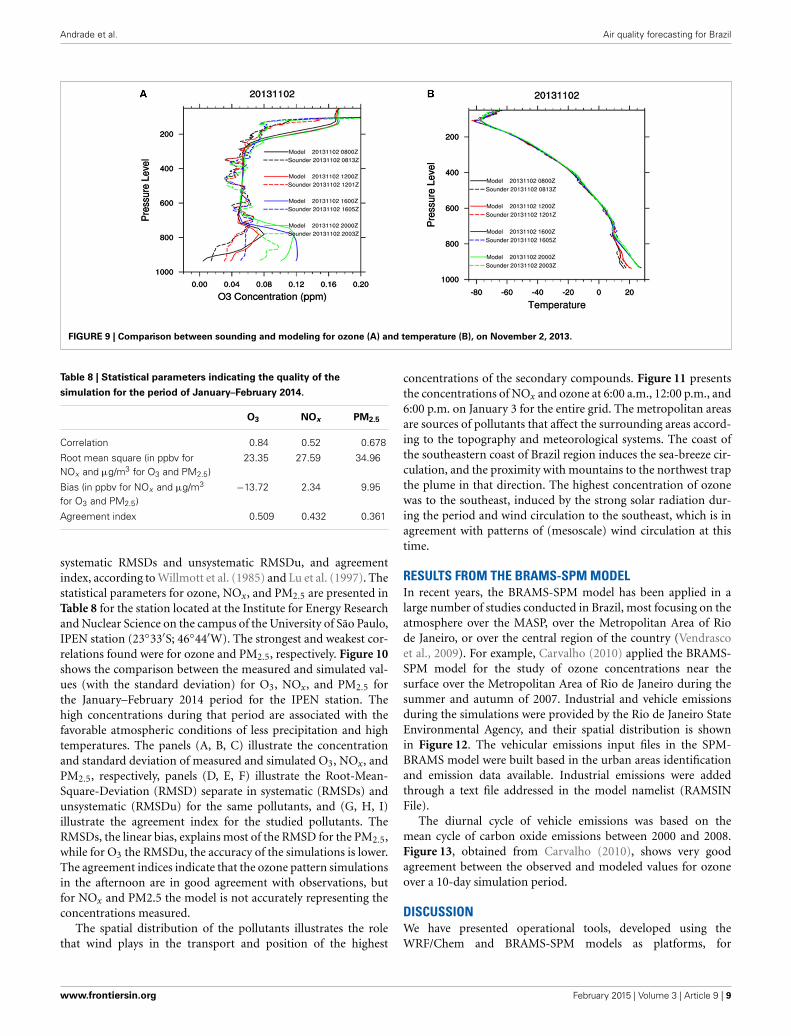
from October 29 to November 4 were performed in order todetermine the quality of the simulations by comparing the mod-eled and measured data. Figure 9 shows the comparison betweenmodeling and measurement for ozone concentration and tem-perature, on November 2. The major differences were in ozoneconcentration near the surface, which could be associated withthe great uncertainty in the emissions inventory. One importantpoint was the presence of clouds affecting ozone formation nearthe surface on that day.
RESULTS FROM THE WRF-CHEM MODELHourly data collected from 2011 until the present have been com-pared with the measurements of NOx, CO, ozone, and particles,to evaluate the performance of the model. The incorporation ofbetter descriptions of the emission profiles and a representationof the atmospheric chemistry have made it possible to pro-vide a forecast (www.lapat.iag.usp.br/). Some results of a recentcase study are presented in order to illustrate the importance offorecasting the behavior of pollutants.
CASE STUDY: SUMMER 2013/2014The comparison between measurement and modeling is pre-sented for the period of January–February 2014. The summerof 2013/2014 was chosen because it was a period when therewas considerably less precipitation and humidity than would beexpected on the basis of the historical climatological data (for1933–2013). During the summer months of December 2013,January 2014, and February 2014, the total rainfall was 352.5 mm,compared with the climatological mean of 634.8 mm. Total rain-fall was 199.3 mm in January and 81.1 mm in February, com-pared with the climatological means of 231.9 mm and 212.5 mm,respectively. In the summer of 2013/2014, the temperature wasalso above the climatological mean. In February, the relativehumidity was below 40% on 17 days, whereas the historical meanis 2 days. During the summer of 2013/2014 as a whole, there were27 days on which the relative humidity was below 40%.
The quality of the simulation, in comparison with directmeasurement, was evaluated with the statistical parameters corre-lation, bias, root mean square decomposed into two components:
Table 7 | Surface data available for evaluation of the modeling results.
Data Sampling frequency References
Concentrations of regulated pollutants(CO, O3, SO2, PM10, PM2.5, and NOx )
1 h www.cetesb.sp.gov.brhttp://sistemasinter.cetesb.sp.gov.br/Ar/php/ar_dados_horarios.php
PM2.5 and PM10 concentrations andcomposition
12 h Albuquerque et al., 2012; Ynoue and Andrade, 2004
Meteorological data 1 h CETESB network and IAG Climatological Station.www.cetesb.sp.gov.brwww.estacao.iag.usp.br
Particle size distributions 12 h Measurements on the USP campus (Ynoue and Andrade, 2004;Albuquerque et al., 2012)
Emission factors for regulated pollutantsand hydrocarbons
1 h Measurements inside road traffic tunnels (Martins et al., 2006;Sánchez-Ccoyllo et al., 2009; Brito et al., 2013; Nogueira et al., 2014;Pérez-martínez et al., 2014)
USP, University of São Paulo.
Frontiers in Environmental Science | Interdisciplinary Climate Studies February 2015 | Volume 3 | Article 9 | 8
Andrade et al. Air quality forecasting for Brazil
FIGURE 9 | Comparison between sounding and modeling for ozone (A) and temperature (B), on November 2, 2013.
Table 8 | Statistical parameters indicating the quality of the
simulation for the period of January–February 2014.
O3 NOx PM2.5
Correlation 0.84 0.52 0.678
Root mean square (in ppbv forNOx and µg/m3 for O3 and PM2.5)
23.35 27.59 34.96
Bias (in ppbv for NOx and µg/m3
for O3 and PM2.5)−13.72 2.34 9.95
Agreement index 0.509 0.432 0.361
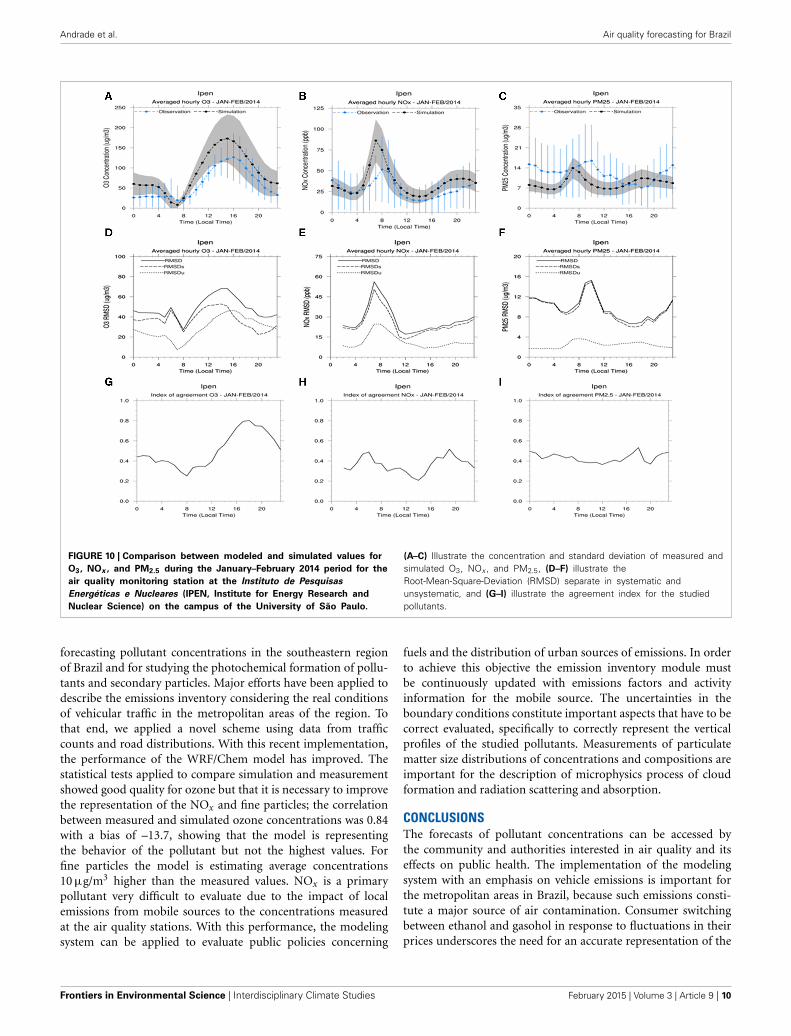
systematic RMSDs and unsystematic RMSDu, and agreementindex, according to Willmott et al. (1985) and Lu et al. (1997). Thestatistical parameters for ozone, NOx, and PM2.5 are presented inTable 8 for the station located at the Institute for Energy Researchand Nuclear Science on the campus of the University of São Paulo,IPEN station (23◦33′S; 46◦44′W). The strongest and weakest cor-relations found were for ozone and PM2.5, respectively. Figure 10shows the comparison between the measured and simulated val-ues (with the standard deviation) for O3, NOx, and PM2.5 forthe January–February 2014 period for the IPEN station. Thehigh concentrations during that period are associated with thefavorable atmospheric conditions of less precipitation and hightemperatures. The panels (A, B, C) illustrate the concentrationand standard deviation of measured and simulated O3, NOx, andPM2.5, respectively, panels (D, E, F) illustrate the Root-Mean-Square-Deviation (RMSD) separate in systematic (RMSDs) andunsystematic (RMSDu) for the same pollutants, and (G, H, I)illustrate the agreement index for the studied pollutants. TheRMSDs, the linear bias, explains most of the RMSD for the PM2.5,while for O3 the RMSDu, the accuracy of the simulations is lower.The agreement indices indicate that the ozone pattern simulationsin the afternoon are in good agreement with observations, butfor NOx and PM2.5 the model is not accurately representing theconcentrations measured.
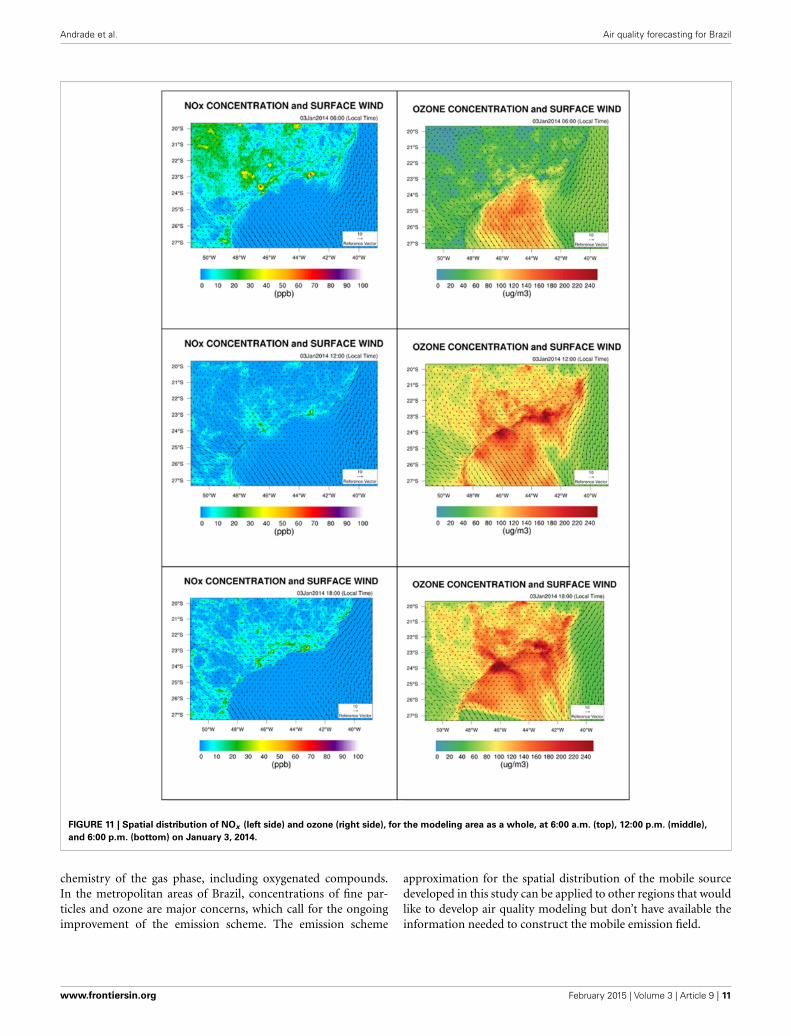
The spatial distribution of the pollutants illustrates the rolethat wind plays in the transport and position of the highest
concentrations of the secondary compounds. Figure 11 presentsthe concentrations of NOx and ozone at 6:00 a.m., 12:00 p.m., and6:00 p.m. on January 3 for the entire grid. The metropolitan areasare sources of pollutants that affect the surrounding areas accord-ing to the topography and meteorological systems. The coast ofthe southeastern coast of Brazil region induces the sea-breeze cir-culation, and the proximity with mountains to the northwest trapthe plume in that direction. The highest concentration of ozonewas to the southeast, induced by the strong solar radiation dur-ing the period and wind circulation to the southeast, which is inagreement with patterns of (mesoscale) wind circulation at thistime.
RESULTS FROM THE BRAMS-SPM MODELIn recent years, the BRAMS-SPM model has been applied in alarge number of studies conducted in Brazil, most focusing on theatmosphere over the MASP, over the Metropolitan Area of Riode Janeiro, or over the central region of the country (Vendrascoet al., 2009). For example, Carvalho (2010) applied the BRAMS-SPM model for the study of ozone concentrations near thesurface over the Metropolitan Area of Rio de Janeiro during thesummer and autumn of 2007. Industrial and vehicle emissionsduring the simulations were provided by the Rio de Janeiro StateEnvironmental Agency, and their spatial distribution is shownin Figure 12. The vehicular emissions input files in the SPM-BRAMS model were built based in the urban areas identificationand emission data available. Industrial emissions were addedthrough a text file addressed in the model namelist (RAMSINFile).
The diurnal cycle of vehicle emissions was based on themean cycle of carbon oxide emissions between 2000 and 2008.Figure 13, obtained from Carvalho (2010), shows very goodagreement between the observed and modeled values for ozoneover a 10-day simulation period.
DISCUSSIONWe have presented operational tools, developed using theWRF/Chem and BRAMS-SPM models as platforms, for
www.frontiersin.org February 2015 | Volume 3 | Article 9 | 9
Andrade et al. Air quality forecasting for Brazil
FIGURE 10 | Comparison between modeled and simulated values for
O3, NOx , and PM2.5 during the January–February 2014 period for the
air quality monitoring station at the Instituto de Pesquisas
Energéticas e Nucleares (IPEN, Institute for Energy Research and
Nuclear Science) on the campus of the University of São Paulo.
(A–C) Illustrate the concentration and standard deviation of measured andsimulated O3, NOx , and PM2.5, (D–F) illustrate theRoot-Mean-Square-Deviation (RMSD) separate in systematic andunsystematic, and (G–I) illustrate the agreement index for the studiedpollutants.
forecasting pollutant concentrations in the southeastern regionof Brazil and for studying the photochemical formation of pollu-tants and secondary particles. Major efforts have been applied todescribe the emissions inventory considering the real conditionsof vehicular traffic in the metropolitan areas of the region. Tothat end, we applied a novel scheme using data from trafficcounts and road distributions. With this recent implementation,the performance of the WRF/Chem model has improved. Thestatistical tests applied to compare simulation and measurementshowed good quality for ozone but that it is necessary to improvethe representation of the NOx and fine particles; the correlationbetween measured and simulated ozone concentrations was 0.84with a bias of –13.7, showing that the model is representingthe behavior of the pollutant but not the highest values. Forfine particles the model is estimating average concentrations10 µg/m3 higher than the measured values. NOx is a primarypollutant very difficult to evaluate due to the impact of localemissions from mobile sources to the concentrations measuredat the air quality stations. With this performance, the modelingsystem can be applied to evaluate public policies concerning
fuels and the distribution of urban sources of emissions. In orderto achieve this objective the emission inventory module mustbe continuously updated with emissions factors and activityinformation for the mobile source. The uncertainties in theboundary conditions constitute important aspects that have to becorrect evaluated, specifically to correctly represent the verticalprofiles of the studied pollutants. Measurements of particulatematter size distributions of concentrations and compositions areimportant for the description of microphysics process of cloudformation and radiation scattering and absorption.
CONCLUSIONSThe forecasts of pollutant concentrations can be accessed bythe community and authorities interested in air quality and itseffects on public health. The implementation of the modelingsystem with an emphasis on vehicle emissions is important forthe metropolitan areas in Brazil, because such emissions consti-tute a major source of air contamination. Consumer switchingbetween ethanol and gasohol in response to fluctuations in theirprices underscores the need for an accurate representation of the
Frontiers in Environmental Science | Interdisciplinary Climate Studies February 2015 | Volume 3 | Article 9 | 10
Andrade et al. Air quality forecasting for Brazil
FIGURE 11 | Spatial distribution of NOx (left side) and ozone (right side), for the modeling area as a whole, at 6:00 a.m. (top), 12:00 p.m. (middle),
and 6:00 p.m. (bottom) on January 3, 2014.
chemistry of the gas phase, including oxygenated compounds.In the metropolitan areas of Brazil, concentrations of fine par-ticles and ozone are major concerns, which call for the ongoingimprovement of the emission scheme. The emission scheme
approximation for the spatial distribution of the mobile sourcedeveloped in this study can be applied to other regions that wouldlike to develop air quality modeling but don’t have available theinformation needed to construct the mobile emission field.
www.frontiersin.org February 2015 | Volume 3 | Article 9 | 11

Andrade et al. Air quality forecasting for Brazil
FIGURE 12 | Spatial distribution of industrial emissions of SO2 (A) and vehicle emissions of CO (B) over the Metropolitan Area of Rio de Janeiro in
2007. Sources: Rio de Janeiro State Environmental Agency; Carvalho (2010).
FIGURE 13 | BRAMS-SPM-simulated values for ozone over two sites in
the Metropolitan Area of Rio de Janeiro between March 5 and March
14 2007. Sources: Rio de Janeiro Instituto Estadual do Ambiente (INEA),State Environmental Agency; Carvalho (2010).
ACKNOWLEDGMENTSThe authors thank the CAPES (Coordenac̨ão de Aperfeic̨oamentode Pessoal de Nível Superior) and FAPESP (São Paulo StateResearch Foundation), Research Program on Global ClimateChange, for the financial support of this work (Processes2008/58104-8). We also thank the State Company for theEnvironment CETESB. Finally the authors thank Mr. JeffersonBoyles for the revision of the text.
REFERENCESAlbuquerque, T. T., Andrade, M. F., and Ynoue, R. Y. (2012). Characterization
of atmospheric aerosols in the city of São Paulo, Brazil: comparisons betweenpolluted and unpolluted periods. Environ. Monit. Assess. 184, 969–984. doi:10.1007/s10661-011-2013-y
Almeida, G. P., Brito, J., Morales, C. A., Andrade, M. F., and Artaxo, P. (2014).Measured and modelled cloud condensation nuclei (CCN) concentration inSão Paulo, Brazil: the importance of aerosol size-resolved chemical composition
on CCN concentration prediction. Atmos. Chem. Phys. 14, 7559–7572. doi:10.5194/acp-14-7559-2014
Andrade, M. F., Fornaro, A., Freitas, E. D., Mazzoli, C. R., Martins, L. D., Boian,C., et al. (2012a). Ozone sounding in the Metropolitan Area os São Paulo,Brazil: wet and dry season campaigns of 2006. Atmos. Environ. 61, 627–640.doi: 10.1016/j.atmosenv.2012.07.083
Andrade, M. F., Miranda, R. M., Fornaro, A., Kerr, A., Oyama, B., André,P. A., et al. (2012b). Vehicle emissions and PM2.5 mass concentrations insix Brazilian cities. Air Qual. Atmos. Health 5, 79. doi: 10.1007/s11869-010-0104-5
Andrade, M. F., Quintão, D. A., Biazon, B., Nogueira, T., Lopes, F., Todesco, E., et al.(2014). “The impact of local pollutants emissions to the vertical ozone profile inthe Metropolitan Area of São Paulo,” in 13th IGAC Science Conference and 13thQuadrennial iCACGP Symposium (Natal).
Andrade, M. F., Ynoue, R. Y., Harley, R., and Miguel, A. H. (2004). Airquality model simulating photochemical formation of pollutants: the SaoPaulo Metropolitan Area, Brazil. Int. J. Environ. Pollut. 22, 460–475. doi:10.1504/IJEP.2004.005681
Baik, J. J., Kim, Y. H., and Chun, H. Y. (2001). Dry and moist convection forcedby an urban heat island. J. Appl. Meteorol. 40, 1462–1475. doi: 10.1175/1520-0450(2001)040<1462:DAMCFB>2.0.CO;2
Brito, J., Rizzo, L. V., Herckes, P., Vasconcellos, P. C., Caumo, S. E. S., Fornaro,A., et al. (2013). Physical-chemical characterization of the particulate matterinside two road tunnels in the São Paulo Metropolitan Area. Atmos. Chem. Phys.Discuss. 13, 20839–20883. doi: 10.5194/acpd-13-20839-2013
Carvalho, V. S. B. (2010). O Impacto Das Megacidades na Qualidade do ar emEscala Local e Regional: os Casos Das Regiões Metropolitanas de São Paulo e doRio de Janeiro. Ph.D. Thesis, University of São Paulo, Institute of Astronomy,Geophysics and Atmospheric Sciences (IAG), 237.
Cenedese, A., and Monti, P. (2003). Interaction between an Inland UrbanHeat Island and a sea-breeze flow: a laboratory study. J. Appl. Meteorol. 42,1569–1583. doi: 10.1175/1520-0450(2003)042<1569:IBAIUH>2.0.CO;2
CETESB. (2010). Relatório de Qualidade do ar no Estado de São Paulo 2009 (AirQuality Report in São Paulo State 2009). Série Relatórios/CETESB, CETESB.
CETESB. (2012). Emissões Veiculares no Estado de São Paulo 2011 (VehicularEmissionsin Sao Paulo State, 2011). Séries Relatórios/CETESB, CompanhiaAmbiental do Estado de São Paulo (Environmental Agency for São Paulo State).
CETESB. (2014). Qualidade do ar no Estado de São Paulo 2009 (Air Quality in SãoPaulo State 2013). Série Relatórios/CETESB, CETESB.
Chen, C., and Cotton, W. R. (1983). A one-dimensional simulation of thestratocumulus-capped mixed layer. Bound. Lay. Meteorol. 25, 289–321. doi:10.1007/BF00119541
Childs, P. P., and Raman, S. (2005). Observations and numerical simulations ofUrban Heat Island and sea breeze circulations over New York City. Pure Appl.Geophys. 162, 1955–1980. doi: 10.1007/s00024-005-2700-0
Cotton, W. R., Pielke, R. A., Walko, R. L., Liston, G. E., Tremback, C. J., Jiang, H.,et al. (2003). RAMS 2001: current status and future directions. Meteorol. Atmos.Phys. 82, 5–29. doi: 10.1007/s00703-001-0584-9
Frontiers in Environmental Science | Interdisciplinary Climate Studies February 2015 | Volume 3 | Article 9 | 12
Andrade et al. Air quality forecasting for Brazil
Freitas, E. D., Martins, L. D., Silva Dias, P. L., and Andrade, M. F. (2005). Asimple photochemical module implemented in RAMS for tropospheric ozoneconcentration forecast in the metropolitan area of Sao Paulo, Brazil: couplingand validation. Atmos. Environ. 39, 6352–6361. doi: 10.1016/j.atmosenv.2005.07.017
Freitas, E. D., Rozoff, C. M., Cotton, W. R., and Dias, P. L. S. (2007). Interactionsof an urban heat island and sea-breeze circulations during winter over themetropolitan area of Sao Paulo, Brazil. Bound. Lay. Meteorol. 122, 43–65. doi:10.1007/s10546-006-9091-3
Freitas, E. D., Silva Dias, P. L., Carvalho, V. S. B., Mazzoli, C. R., Martins, L. D.,Martins, J. A., et al. (2009). “Factors involved in the formation and developmentof severe weather conditions over the Megacity of São Paulo,” in Proceedings ofthe 89th AMS Annual Meeting, 2009 (Phoenix, AZ).
Gedzelman, S. D., Austin, S., Cermak, R., Stefano, N., Partridge, S., Quesenberry,S., et al. (2003). Mesoscale aspects of the urban heat Island around New Yorkcity. Theor. Appl. Climatol. 75, 29–42. doi: 10.1007/s00704-002-0724-2
Godoy, M. L. D. P., Godoy, J. M., Roldão, L. A., Soluri, D. S., and Donagemma,R. A. (2009). Coarse and fine aerosol source apportionment in Rio deJaneiro, Brazil. Atmos. Environ. 43, 2366–2374. doi: 10.1016/j.atmosenv.2008.12.046
Gouvêa, M. L. (2007). Scenarios of Surface Properties Impacts over the HumanThermal Comfort in the City of São Paulo. Master Degree Dissertation, Universityof São Paulo, Institute of Astronomy, Geophysics and Atmospheric Sciences(IAG), 87.
Grell, G. A. (1993). Prognostic evaluation of assumptions used by cumulus param-eterizations. Mon. Wea. Rev. 121, 764–787.
Grell, G. A., and Devenyi, D. (2002). A generalized approach to parameterizingconvection combining ensemble and data assimilation techniques. Geophys. Res.Lett. 29, 38-1–38-4. doi: 10.1029/2002GL015311
Grell, G. A., Peckham, S. E., Schmitz, R., McKeen, S. A., Frost, G., Skamarock, W. C.,et al. (2005). Fully coupled “online” chemistry within the WRF model. Atmos.Environ. 39, 6957–6975. doi: 10.1016/j.atmosenv.2005.04.027
Hill, G. E. (1974). Factors controlling the size and spacing of cumulus clouds asrevealed by numerical experiments. J. Atmos. Sci. 31, 646–673.
Ichinose, T., Shimodozono, K., and Hanaki, K. (1999). Impact of anthro-pogenic heat on urban climate in Tokyo. Atmos. Environ. 33, 3897–3909. doi:10.1016/S1352-2310(99)00132-6
Jonsson, P. (2005). Urban Climate and Air Quality in Tropical Cities. Göteborg:Göteborg University.
Krzyzanowski, M., Apte, J. S., Bonjour, S. P., Brauer, M., Cohen, A. J., and Prüss-Ustun, A. M. (2014). Air pollution in the mega-cities. Curr. Environ. Health Rep.1, 185–191. doi: 10.1007/s40572-014-0019-7
Kuo, H. L. (1974). Further studies of the parameterization of the influence ofcumulus convection on large-scale flow. J. Atmos. Sci. 31, 1232–1240.
Lilly, D. K. (1962). On the numerical simulation of buoyant convection. Tellus 14,148–172. doi: 10.1111/j.2153-3490.1962.tb00128.x
Lu, R., Turco, P., and Jacobson, M. Z. (1997). An integrated air pollution modelingsystem for urban and regional scales: 2. Simulations for SCAQS 1987. J. Geophys.Res. 102, 6081–6098. doi: 10.1029/96JD03502
Luna, A. S., Paredes, M. L. L., de Oliveira, G. C. G., and Corrêa, S. M. (2014).Prediction of ozone concentration in tropospheric levels using artificial neuralnetworks and support vector machine at Rio de Janeiro, Brazil. Atmos. Environ.98, 98–104. doi: 10.1016/j.atmosenv.2014.08.060
Martins, J. A., Uzêda, T. R., Brand, V. S., Bernardo, N. M. R., Martins, L. D.,Hallak, R., et al. (2012). Development of High-Resolution Motor Vehicle EmissionInventories for South America, 8th International Conference on Air Quality Scienceand Application. Hatfield: University of Hertfordshire, Athens, Greece.
Martins, L. D., and Andrade, M. F. (2008a). Emission Scenario Assessment ofGasohol Reformulation Proposals and Ethanol use in the Metropolitan Areaof Sao Paulo. Open Atmos. Sci. J. 2, 166–175. doi: 10.2174/1874282300802010166
Martins, L. D., and Andrade, M. F. (2008b). Ozone formation potentials of volatileorganic compounds and ozone sensitivity to their emission in the megacity ofSão Paulo, Brazil. Water Air Soil Pollut. 195, 201–213 doi: 10.1007/s11270-008-9740-x
Martins, L. D., Andrade, M. F. D., Freitas, E., Pretto, A., Gatti, L. V., Junior, O. M.A., et al. (2006). Emission factors for gas-powered vehicles traveling throughroad tunnels in Sao Paulo, Brazil. Environ. Sci. Technol. 40, 6722–6729. doi:10.1021/es052441u
Masson, V. (2000). A physically-based scheme for the urban energy bud-get in atmospheric models. Bound. Lay. Meteorol. 94, 357–397. doi:10.1023/A:1002463829265
Mazzoli, C. R. (2013). Numerical Study of Climate Change and Urban EmissionsInfluence over Tropospheric Ozone in the Metropolitan Area of São Paulo.PhD Thesis, University of São Paulo, Institute of Astronomy, Geophysics andAtmospheric Sciences (IAG), 162.
McRae, G., Goodin, W., and Seinfeld, J. (1982). Development of a second-generation mathematical model for urban air pollution- I. Model formulation.Atmos. Environ. 16, 679–696. doi: 10.1016/0004-6981(82)90386-9
Meyers, M. P., Walko, R. L., Harrington, J. Y., and Cotton, W. R. (1997). New RAMScloud microphysics parameterization. Part II: the two-moment scheme. Atmos.Res. 45, 3–39. doi: 10.1016/S0169-8095(97)00018-5
Miranda, R. M., Andrade, M. F., Fornaro, A., Astolfo, R., Andre, P. A., andSaldiva, P. (2012). Urban air pollution: a representative survey of PM2.5 massconcentrations in six Brazilian cities. Air Qual. Atmos. Health 5, 63–77. doi:10.1007/s11869-010-0124-1
Nogueira, T., Dominutti, P. A., Carvalho, L. R. F., Fornaro, A., and Andrade, M.F. (2014). Formaldehyde and acetaldehyde measurements in urban atmosphereimpacted by the use of ethanol biofuel: Metropolitan Area of Sao Paulo (MASP),2012–2013. Fuel 134C, 505–513. doi: 10.1016/j.fuel.2014.05.091
Oke, T. R. (1987). Boundary Layer Climates, 2nd Edn. Methuen, MA: RoutledgeKegan & Paul.
Orsini, C., Tabacniks, M., Artaxo, P., Andrade, F., and Kerr, A. (1986).Characteristics of fine and coarse particles of natural and urban aerosolsof Brazil. Atmos. Environ. 20, 2259–2269. doi: 10.1016/0004-6981(86)90316-1
Pérez-martínez, P. J., Miranda, R. M., Nogueira, T., Guardani, M. L., Fornaro, A.,Ynoue, R., et al. (2014). Emission factors of air pollutants from vehicles mea-sured inside road tunnels in São Paulo: case study comparison. Environ. Sci.Technol. 11, 2155–2168. doi: 10.1007/s13762-014-0562-7
Roth, M. (2007). Review of urban climate research in (sub)tropical regions. Int. J.Climatol. 27, 1859–1873. doi: 10.1002/joc.1591
Rozoff, C. M., Cotton, W. R., and Adegoke, J. O. (2003). Simulation of St. Louis,Missouri, Land use impacts on thunderstorms. J. Appl. Meteorol. 42, 716–738.doi: 10.1175/1520-0450(2003)0422.0.CO;2
Saide, P. E., Carmichael, G. R., Scott, N. S., Gallardo, L., Osses, A., Mena-carrascp,M., et al. (2011). Forecasting urban PM10 and PM2.5 pollution episodes invery stable nocturnalconditions and complex terrain using WRFeChem COtracer model. Atmos. Environ. 45, 2769–2780 doi: 10.1016/j.atmosenv.2011.02.001
Sánchez-Ccoyllo, O. R., Martins, L. D., Ynoue, R. Y., and Andrade, M. F. (2007). Theimpact on tropospheric ozone formation on the implementation of a programfor mobile emissions control: a case study in São Paulo, Brazil. Environ. FluidMech. 7, 95–119. doi: 10.1007/s10652-007-9018-7
Sánchez-Ccoyllo, O. R., Ynoue, R., Martins, L., and Andrade, M. F. (2006).Impacts of ozone precursor limitation and meteorological variables on ozoneconcentration in Sao Paulo Brasil. Atmos. Environ. 40, S552–S562. doi:10.1016/j.atmosenv.2006.04.069
Sánchez-Ccoyllo, O. R., Ynoue, R. Y., Martins, L. D., Astolfo, R., Miranda, R.M., Freitas, E. D., et al. (2009). Vehicular particulate matter emissions inroad tunnels in Sao Paulo, Brazil. Environ. Monit. Assess. 149, 241–249. doi:10.1007/s10661-008-0198-5
Skamarock, W. C., Klemp, J. B., Dudhia, J., Gill, D. O., Barker, D. M., Duda, M. G.,et al. (2008). A Description of the Advanced Research WRF Version 3, NCAR/TechNotes. Boulder, CO: National Center for Atmospheric Research (NCAR). doi:10.5065/D68S4MVH
Smagorinsky, J. (1963). General circulation experiments with the primitive equa-tions: 1. The basic experiment. Mon. Wea. Rev. 91, 99–164.
Souza, E. P., and Silva, E. M. (2003). Impacto da implementação deuma parametrização de convecção rasa em um modelo de mesoescala.Descrição e testes de sensibilidade do esquema. Rev. Bras. Meteorol. 18,33–42. Available online at: http://www.rbmet.org.br/port/revista/revista_artigo.php?id_artigo=20
Vara Vela, A. (2013). Avaliação do Impacto da Frota Veícular na Formação deOzônio e Partículas Finas na Atmosfera da Região Metropolitana de São Paulo:Comparação Entre 2004 e 2011. Master Dissertation. Master Thesis, Universityof São Paulo, Institute of Astronomy, Geophysics and Atmospheric Sciences(IAG), 96.
www.frontiersin.org February 2015 | Volume 3 | Article 9 | 13
Andrade et al. Air quality forecasting for Brazil
Vendrasco, E. P., Dias, P. L. S., and Freitas, E. D. (2009). A case study of the directradiative effect of biomass burning aerosols on precipitation in the EasternAmazon. Atmos. Res. 94, 409–421 doi: 10.1016/j.atmosres.2009.06.016
Vivanco, M. G., and Andrade, M. F. (2006). Validation of the emission inven-tory in Sao Paulo. Atmos. Environ. 40, 1189–1198. doi: 10.1016/j.atmosenv.2005.10.041
Walko, R. L., Band, L. E., Baron, J., Kittel, T. G. F., Lammers, R., Lee, T.J., et al. (2000). Coupled atmosphere-biophysics-hydrology models for envi-ronmental modeling. J. Appl. Meteorol. 39, 931–944. doi: 10.1175/1520-0450(2000)039<0931:CABHMF>2.0.CO;2
Walko, R. L., Cotton, W. R., Meyers, M. P., and Harrington, J. Y. (1995). New RAMScloud microphysics parameterization Part I: the single-moment scheme. Atmos.Res. 38, 29–62. doi: 10.1016/0169-8095(94)00087-T
WHO. (2014). Global Health Observatory [Internet]. Geneva: World HealthOrganization (WHO, 2014). Available online at: http://apps.who.int/gho/data/node.main.134?lang=en. (Accessed November 10, 2014).
Willmott, C. J., Ackleson, S. G., Davis, R. E., Feddema, J. J., Klink, K. M., Legates,D. R., et al. (1985). Statistics for the evaluation and comparison of models.J. Geophys. Res. 90, 8995–9005.
Ynoue, R. Y., and Andrade, M. F. (2004). Size resolved mass balance of aerosol par-ticles over São Paulo Metropolitan Area, Brazil. J. Aerosol Sci. Technol. 38, 52–62.doi: 10.1080/02786820490466756
Yoshikado, H., and Tsuchida, M. (1996). High levels of winter air pollution underthe influence of the urban heat island along the shore of Tokyo Bay. J. Appl.Meteorol. 35, 1804–1813.
Zaveri, R. A., Easter, R. C., Fast, J. D., and Peters, L. K. (2008). Model forSimulating Aerosol Interactions and Chemistry (MOSAIC). J. Geophys. Res. 113,2156–2202. doi: 10.1029/2007JD008782
Zaveri, R. A., and Peters, L. K. (1999). A new lumped structure photochemicalmechanism for large-scale applications. J. Geophys. Res. 104, 30387–30415. doi:10.1029/1999JD900876
Conflict of Interest Statement: The authors declare that the research was con-ducted in the absence of any commercial or financial relationships that could beconstrued as a potential conflict of interest.
Received: 30 November 2014; paper pending published: 12 January 2015; accepted: 03February 2015; published online: 23 February 2015.Citation: Andrade MF, Ynoue RY, Freitas ED, Todesco E, Vara Vela A, Ibarra S,Martins LD, Martins JA and Carvalho VSB (2015) Air quality forecasting system forSoutheastern Brazil. Front. Environ. Sci. 3:9. doi: 10.3389/fenvs.2015.00009This article was submitted to Interdisciplinary Climate Studies, a section of the journalFrontiers in Environmental Science.Copyright © 2015 Andrade, Ynoue, Freitas, Todesco, Vara Vela, Ibarra, Martins,Martins and Carvalho. This is an open-access article distributed under the terms ofthe Creative Commons Attribution License (CC BY). The use, distribution or repro-duction in other forums is permitted, provided the original author(s) or licensor arecredited and that the original publication in this journal is cited, in accordance withaccepted academic practice. No use, distribution or reproduction is permitted whichdoes not comply with these terms.
Frontiers in Environmental Science | Interdisciplinary Climate Studies February 2015 | Volume 3 | Article 9 | 14