Key Issue Report on Air Quality
67
, I . I The Hongkong Electric Company Limited I , ENVIRONMENTAL IMPACT ASSESSMENT (EIA) STUDY FOR UNITS L7 AND L8 AT LAMMA POWER STATION Key Issue Report on Air Quality I , ; Consultants Kennedy & Donkin International In Association with • Ashdown Environmental Ltd. • BMT Fluid Mechanics Ltd. - . j
-
Upload
khangminh22 -
Category
Documents
-
view
1 -
download
0
Transcript of Key Issue Report on Air Quality
, I . I
The Hongkong Electric Company Limited
I ,
ENVIRONMENTAL IMPACT ASSESSMENT (EIA) STUDY
FOR
UNITS L7 AND L8 AT LAMMA POWER STATION
Key Issue Report on Air Quality
I , ;
Consultants Kennedy & Donkin International In Association with • Ashdown Environmental Ltd. • BMT Fluid Mechanics Ltd.
- .
j
o ()
()
o o o o o ()
n )
)
)
)
)
)
)
)
o o o (
r
r
The Hongkong Electric Company Limited
ENVlRONMENTAL IMPACT ASSESSMENT (EIA) STUDY
FOR
UNITS L7 AND L8 AT LAMMA POWER STATION
Key Issue Report on Air Quality
1 8 MAR 1992
Consultants Kennedy & Donkin International In Association with • Ashdown Environmental Ltd. • BMT Fluid Mechanics Ltd.

o o o o o o o o o o o o o o o o o o o o o o o o o o o o o o o o o o
THE HONG KONG ELECTRIC COMPANY LIMITED
Key Issue Report:Air Quality Impact of Proposed L7,1.8 Extension to Lamma Power Station
CONTENTS
1. Executive Summary
2. Introduction
2.1 Initial Assessment Report 2.2 Objectives
3. Derivation of Further Air Quality Data
3.1 Further Analysis of Wind Tunnel Results 3.2 Estimates of Long Term Concentrations 3.3 Assessment of Background
4. Review of Development Plans
5. Impact of Lamma .Station Emissions on Other Developments
6. Impact of Development Plans on Power Station Configuration
7. References
2
o o o o o o o o o o o o o o o o o o o o o o o o o o o o o o o o o o
1. EXECUfIVE SUMMARY
1.1 The draft IAR on the EIA for the proposed new units, L7 and LS, was presented in December 1990. Chapter 5 dealt with the aspects of air quality impacts. This report was supported by the detailed report on wind tunnel modelling of Lamma Power Station emissions conducted by BMT Fluid Mechanics in late 1990.
1.2 The IAR concluded that the one hour concentrations due to the Power Station emissions were generally well below the relevant AQO. This was predicted to be the case for all areas for nitrogen dioxide and total suspended particulates and true for sulphur dioxide on Hong Kong Island and Cheung Chau. On rare occasions on parts of Lamma Island, SO:! concentrations might exceed the 800JLg/m3 limit, but it was shown that the likely probability and frequency was sufficiently small to render exceedance of the AQO most unlikely.
1.3 As a result of the discussions between EPD, HEC and its consultants, some further analysis was requested and this is reported here. The objective of the work was :
* To derive further estimates of concentrations at certain elevated positions on Hong Kong Island.
* To consider impacts on a daily and annual basis.
* To quantify background levels of air pollution and AQO margins in areas where developments are planned on Western Hong Kong Island.
* To consider any planning constraints or mitigation measures which may be suggested by the analysis.
lA The report contains detailed tables and annotated maps for the worst cases of ground level and elevated concentrations. Generally no significant variation with height for these worst cases is found.
1.5 A method for converting the wind tunnel measured 1 hour concentrations to hourly concentrations not exceeded on average more than three hours per year and to daily concentrations not exceeded on average more than one day per year is described. It is argued that this method is conservative.
1.6 Background air quality was assessed from the EPD and HEC network of monitoring stations. An assessment of the likely correlation of high background and worst case Larnma Power Station impact was made and the likelihood of combined incidence is considered highly unlikely in view of the high wind conditions leading to the greatest concentrations. The estimates of background were made on a conservative basis.
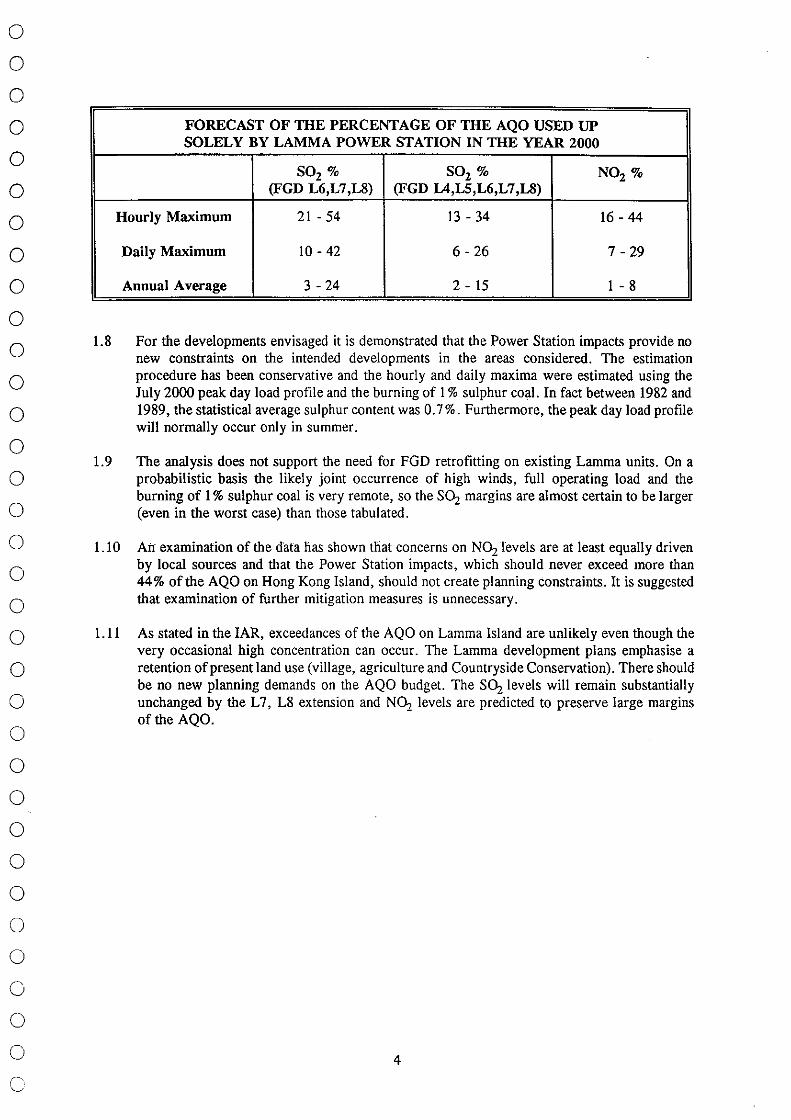
1.7 The zoning plans for the West and South Hong Kong districts of Kennedy Town, Mount Davis, Central, Pok Fu Lam, Mid-Levels West, Peak Area, Aberdeen, Ap Lei Chau, and N.E. Lamma were addressed. In these areas, the percentage of AQO used up solely by the Lamma Power Station is predicted to be small and is on average conservatively estimated to be:
3
o o o o o o o o o o o o o o o o o o o o o o o o o o o o o o o o o c
FORECAST OF TIlE PERCENTAGE OF THE AQO USED UP SOLELY BY LAMMA POWER STATION IN TIlE YEAR 2000
SOz % SOZ % NOZ % (FGD L6,L7,LS) (FGD lA,LS,L6,L7,LS)
Hourly Maximum 21 - 54 13 - 34 16 - 44
Daily Maximum 10 - 42 6 - 26 7 - 29
Annual Average 3 - 24 2 - 15 1 - 8
1.8 For the developments envisaged it is demonstrated that the Power Station impacts provide no new constraints on the intended developments in the areas considered. The estimation procedure has been conservative and the hourly and daily maxima were estimated using the July 2000 peak day load profile and the burning of 1 % sulphur coal. In fact between 1982 and 1989, the statistical average sulphur content was 0.7%. Furthermore, the peak day load profile will normally occur only in summer.
1.9 The analysis does not support the need for FGD retrofitting on existing Lamma units. On a probabilistic basis the likely joint occurrence of high winds, full operating load and the burning of 1 % sulphur coal is very remote, so the SO:, margins are almost certain to be larger (even in the worst case) than those tabulated.
1.10 Ail examination of the data has shown that concerns on NOz revels are at least equally driven by local sources and that the Power Station impacts, which should never exceed more than 44% of the AQO on Hong Kong Island, should not create planning constraints. It is suggested that examination of further mitigation measures is unnecessary.
1.11 As stated in the IAR, exceedances of the AQO on Lamma Island are unlikely even though the very occasional high concentration can occur. The Lamma development plans emphasise a retention of present land use (village, agriculture and Countryside Conservation). There should be no new planning demands on the AQO budget. The SOz levels will remain substantially unchanged by the L 7, L8 extension and NOz levels are predicted to preserve large margins of the AQO.
4
o o o o o o o o o o o o o o o o o o o o o o o o o o o o o o o o o o
2. INTRODUCTION
2.1 Initial Assessment Report
2.1.1 The draft IAR on the EIA for the proposed new units, L 7 and L8, [ref.1] has been submitted. Chapter 5 dealt with the aspects of air quality impacts. This report contained conclusions and extracts from the report on wind tunnel modelling of Lamma Power Station emissions conducted by BMT Fluid Mechanics in late 1990 [ref.2].
2.1.2 The IAR concluded (paragraphs 5.203 - 5.206) that the one hour concentrations due to the Power Station emissions in the areas studied, were generally well below the relevant AQO. This was predicted to be the case for all areas for nitrogen dioxide and total suspended particulates and true for sulphur dioxide on Hong Kong Island and Cheung Chau.
2.1.3 On rare occasions on parts of Lamma Island at the worst case with all eight coal-fired units and maximum number of gas turbines operating continuously at the rated output and with burning 1 % sulphur coal, S02 concentration might exceed 800"gim3 limit, but it was shown that the likely probability and frequency was sufficiently small to render exceedance of the AQO most unlikely.
2.1.4 It was predicted that FGD retrofitting to L4 and L5 would guarantee SOz level below 800"gim3, but at unjustifiably excessive cost considering that concentration values exceeding 800"gim3 only occur for wind speeds (at !Om) above around Ilmis, an extremely rare event for the wind directions in question. For the worst direction (SSW), the frequency of occurrence of such winds was calculated to be 3.5 hours per year. Even rarer still, is the condition of high winds blowing in the right direction together with all eight coal-fired units and maximum number of gas turbine operating continuously at the rated output.
2.1.5 A further case against FGD retrofitting is that the wind tunnel modelling simulated the worst scenario where all eight generating units are operating continuously at the rated output (Le. peak load) with the burning of 1 % sulphur coal. Between 1982 and 1989, however, the statistical average sulphur coal burned at the Lamma Power Station was 0.7%. Furthermore, peak load would occur only in summer and normally only for a few minutes in a day.
2.1.6 In response to the IAR [ref.l] and the wind tunnel report [ref.2], EPD produced comments and discussions took place at the SMG meeting on 6th March 1991. As a result of the discussions between EPD, HEC and its consultants, some further analysis was requested and is the subject of this Key Issue Report.
2.2 Objectives
2.2.1 The primary objective is to study more precisely the need for FGD retrofitting and in so doing, address the issues raised by EPD. EPD expressed concern about the coverage both in terms of wind speeds and number of receptors, plume height simulation, accuracy of measurements, and the margin between the maximum concentration and the AQO. They also wanted further information on the enhanced scaling technique.
2.2.2 In order to address EPD concerns and to achieve the primary objective stated above, the aims of this Key Issue Report are:
5
o o o o o o o o o o o o o o o o o o o o o o o o o o o o o o o o o c
(i) Derive further estimates of concentrations at elevated positions at: Sandy Bay (sensor [1,4]) Pok Fu Lam (sensor [2,5]) Wah Fu Estate (sensor [3,3])
and Ap Lei Chau (sensor [4,4]) and generally assess the impact at receptors in Aberdeen (and hence Wong Chuk Hang*).
(ii) Consider impacts on a daily and annual basis.
(iii) Quantify background levels of air pollution in areas where developments are planned on Western and Southern Hong Kong Island.
(iv) Estimate the margin of AQO remaining in the areas studied in (i) above, in order to assess the likelihood of constraint on the proposed Development Plans.
(v) In the light of any identified constraints, review the contribution of the Lamma Power Station and the need or otherwise to consider mitigation measures.
2.2.3 Plume height simulation is discussed in Appendix B.
2.2.4 The accuracy of measurements have been discussed in the final wind tunnel report.
* The wind tunnel data indicate that Lamma Power Station generates similar concentrations at Aberdeen and Wong Chuk Hang. Hence in this report, data are presented only for Aberdeen.
6

o o o o o o o o o o o o o o o o o o o o o o o o o o o o o o o o o
3. DERIVATION OF FURTHER AIR QUALITY DATA
3.1 Further Analysis of Wind Tunnel Results
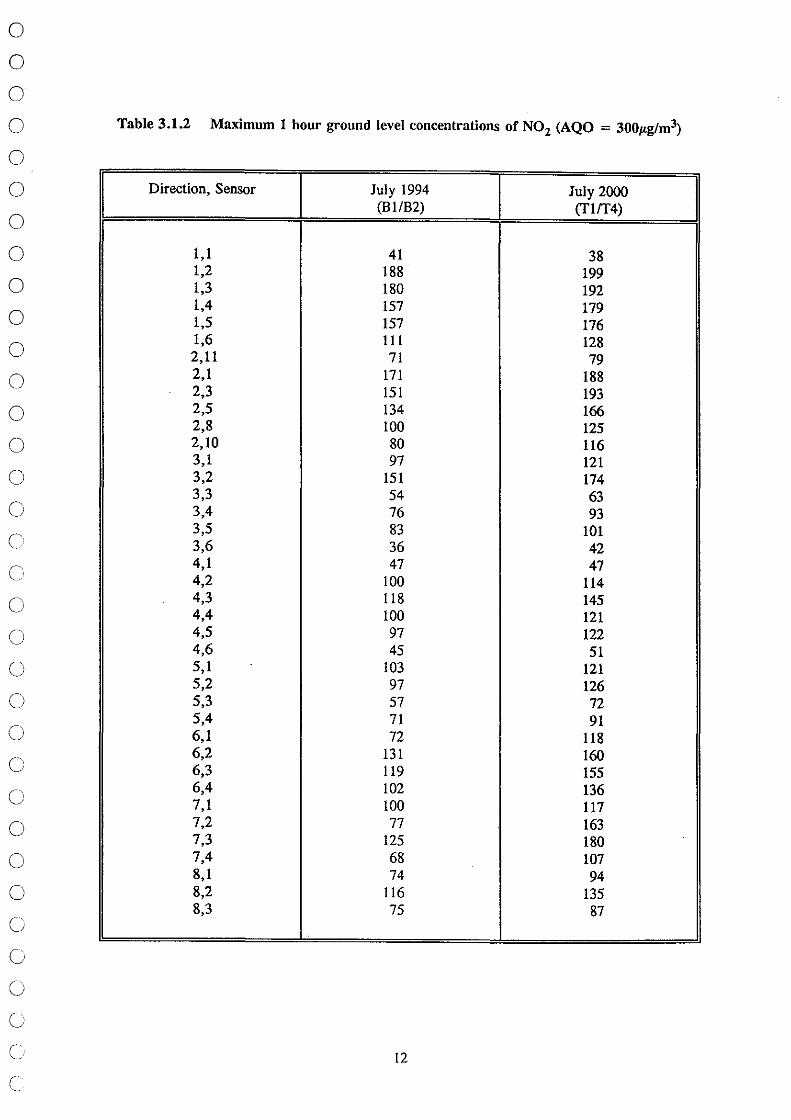
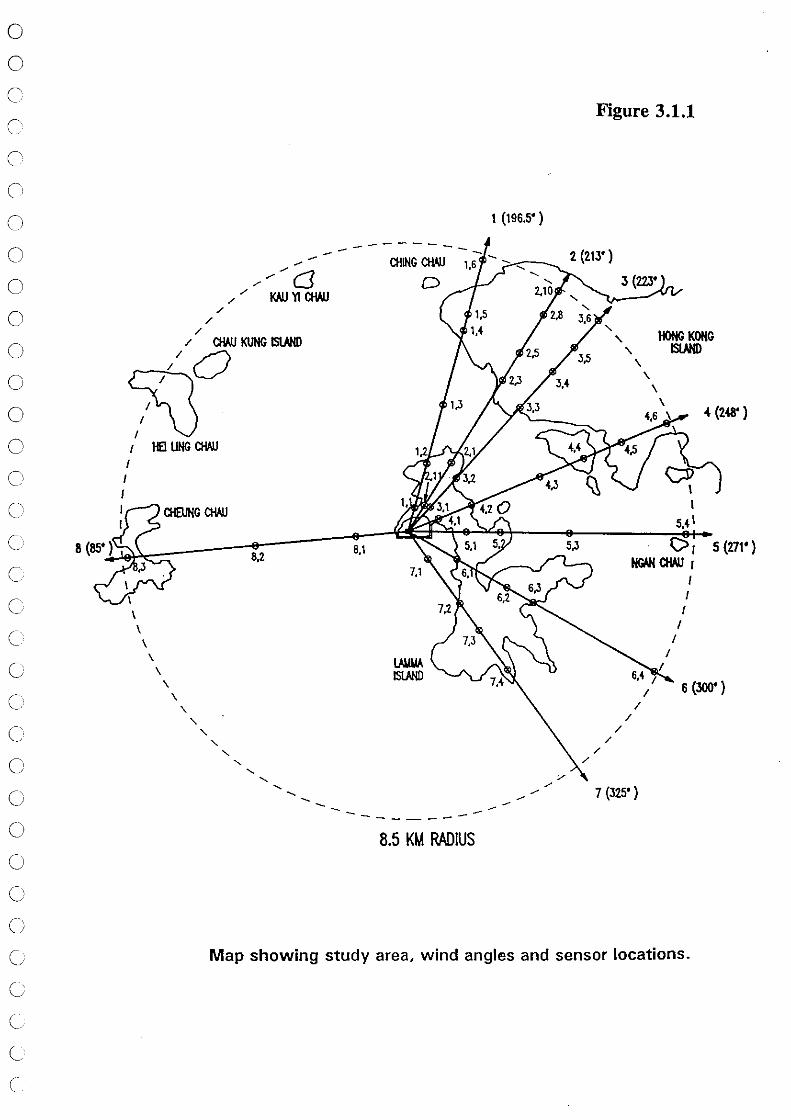
3.1.1 The wind tunnel test programme covered wind directions and sensors as shown in Figure 3.1.1 (equivalent to IAR Figure 5.28). The maximum ground level concentrations of SOz and N02 (with minor corrections) are repeated here as Tables 3.1.1 and 3.1.2.
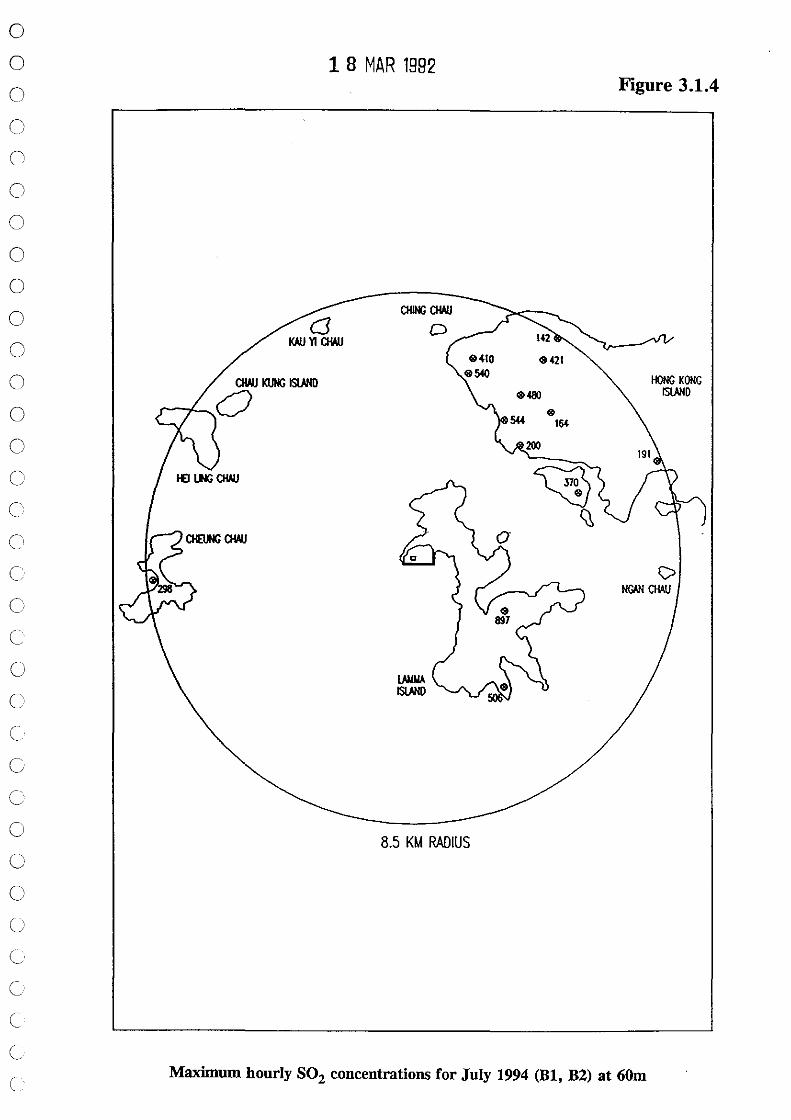
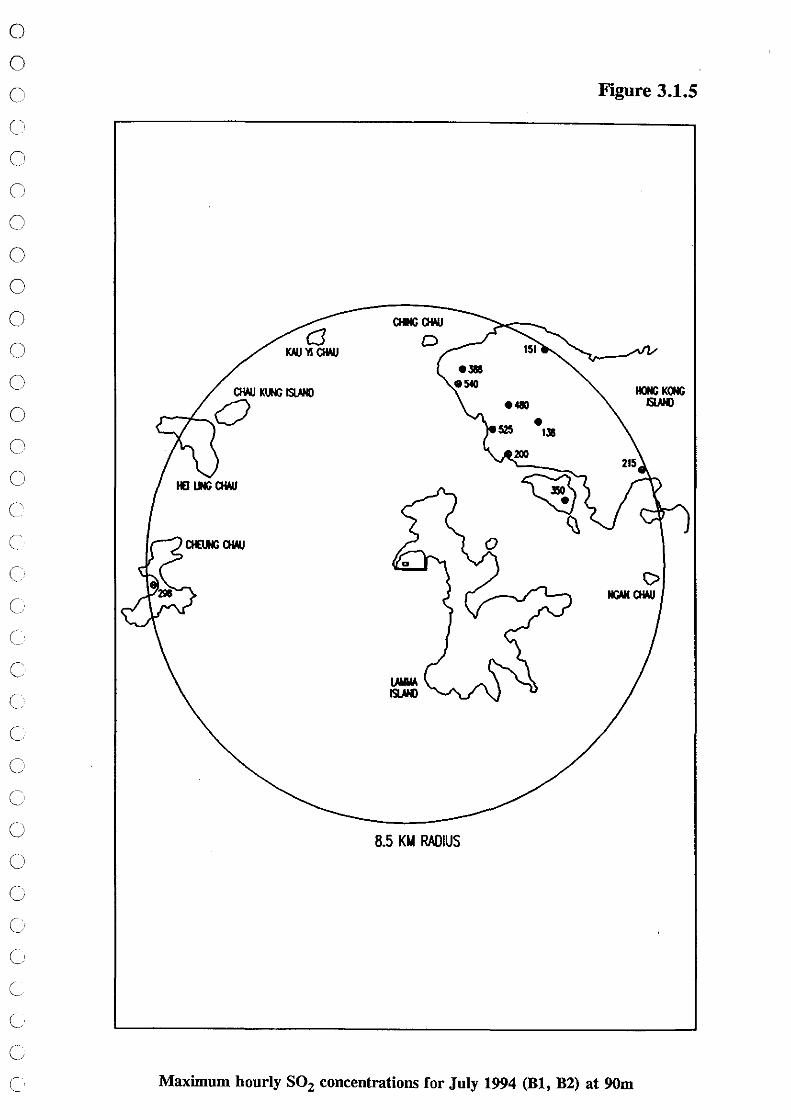
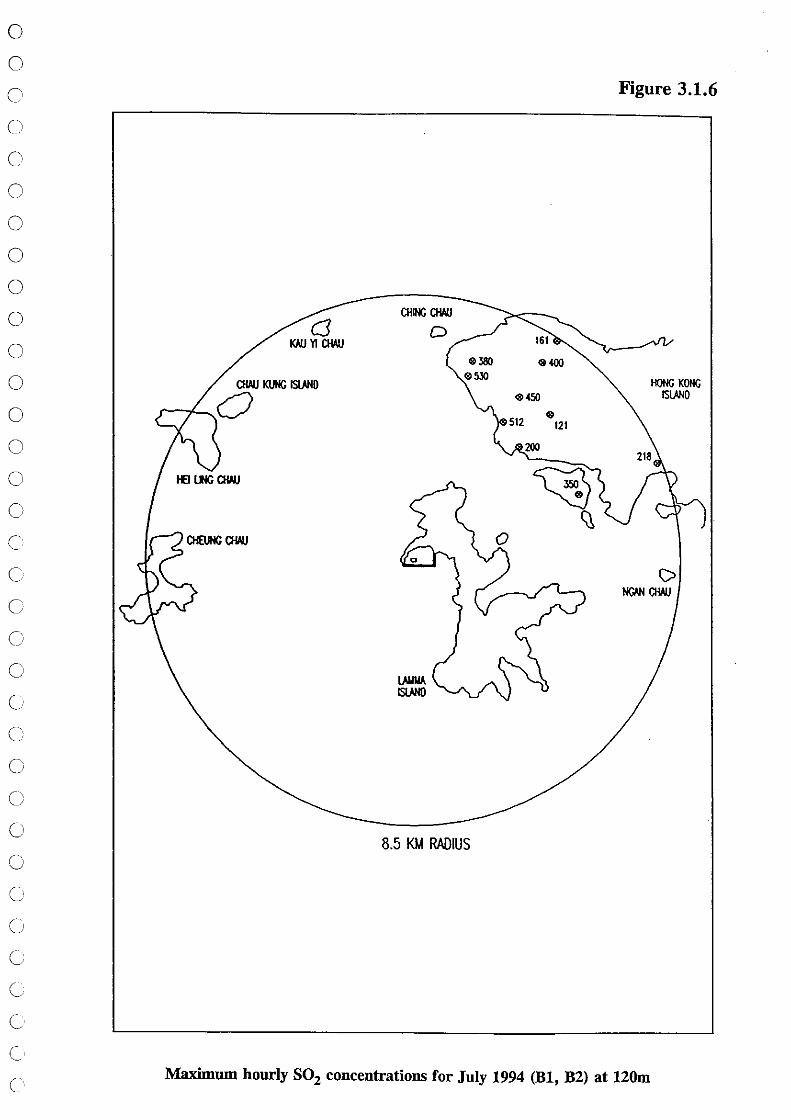
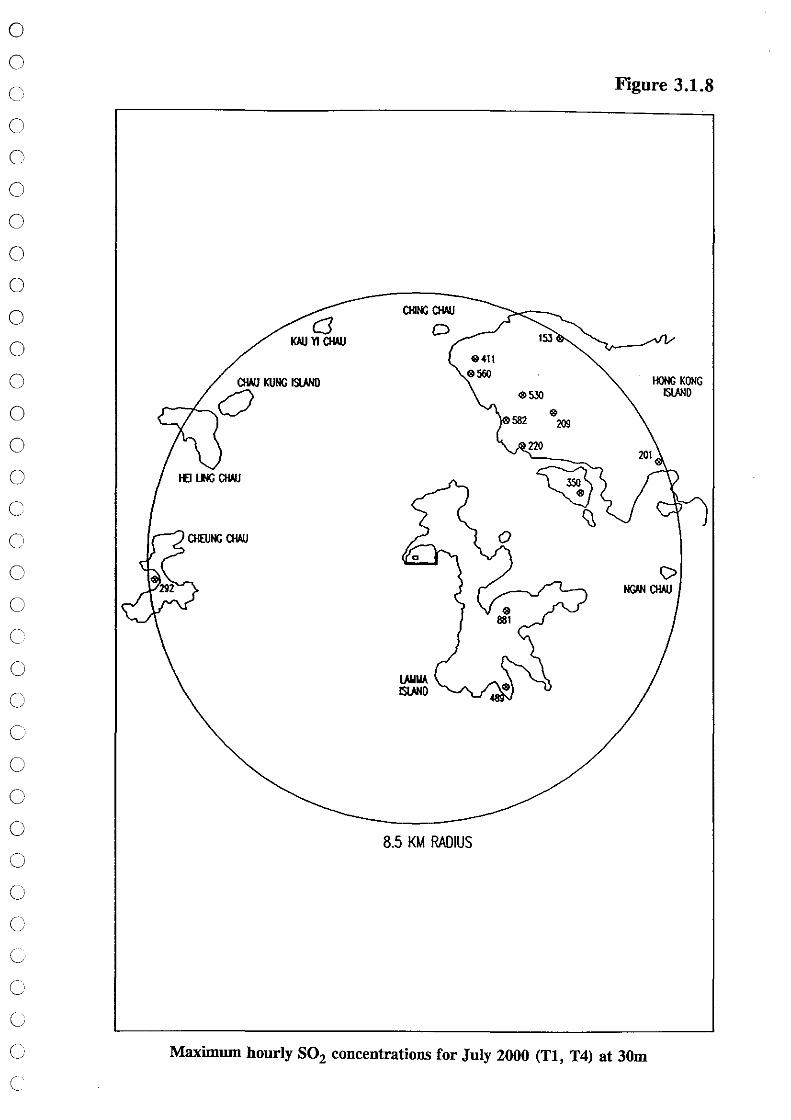
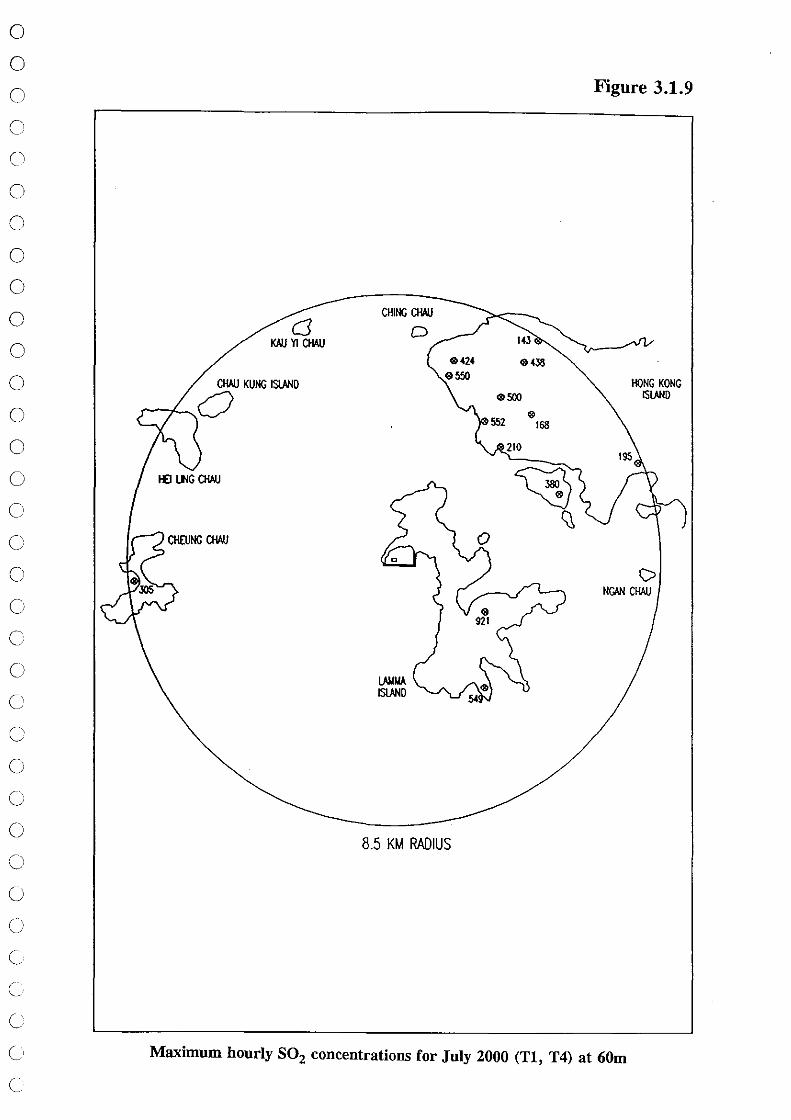
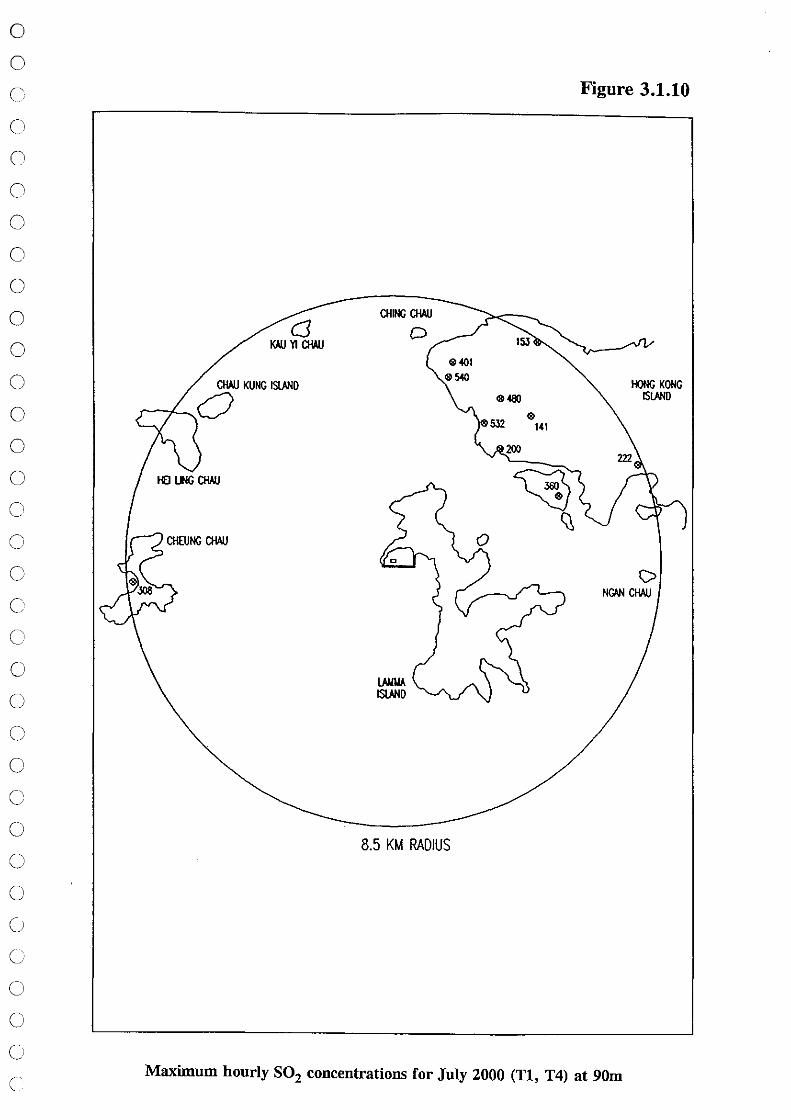
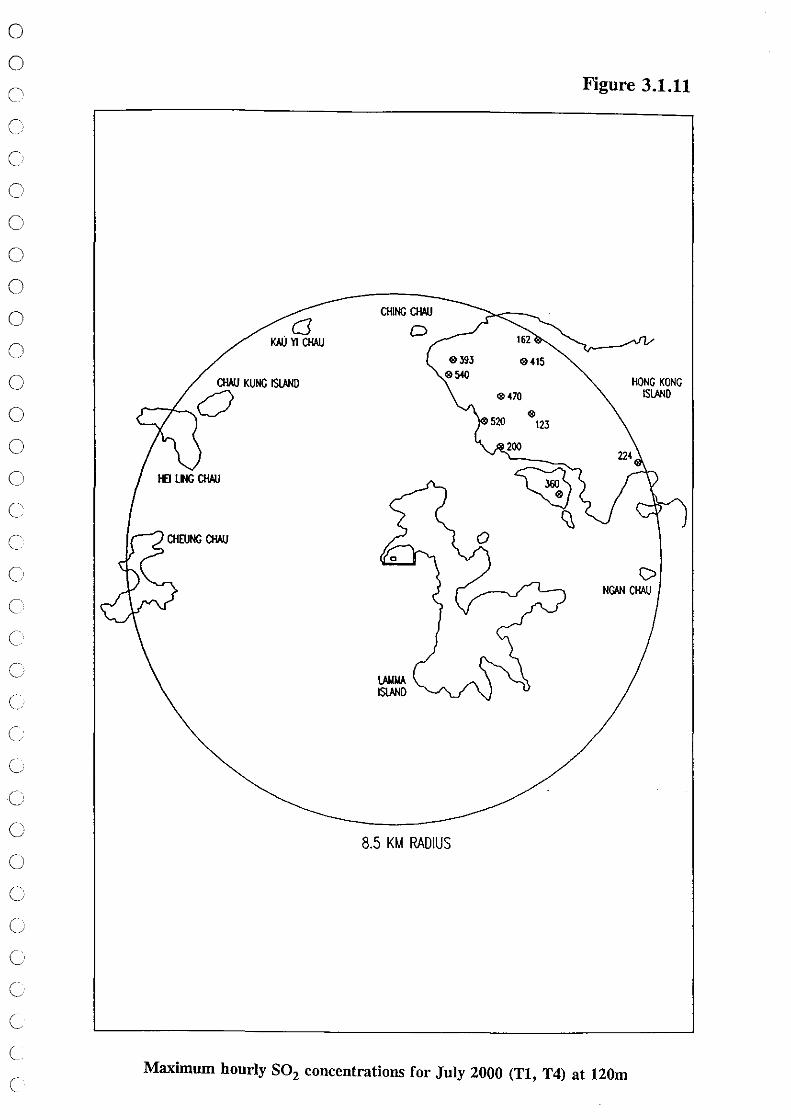
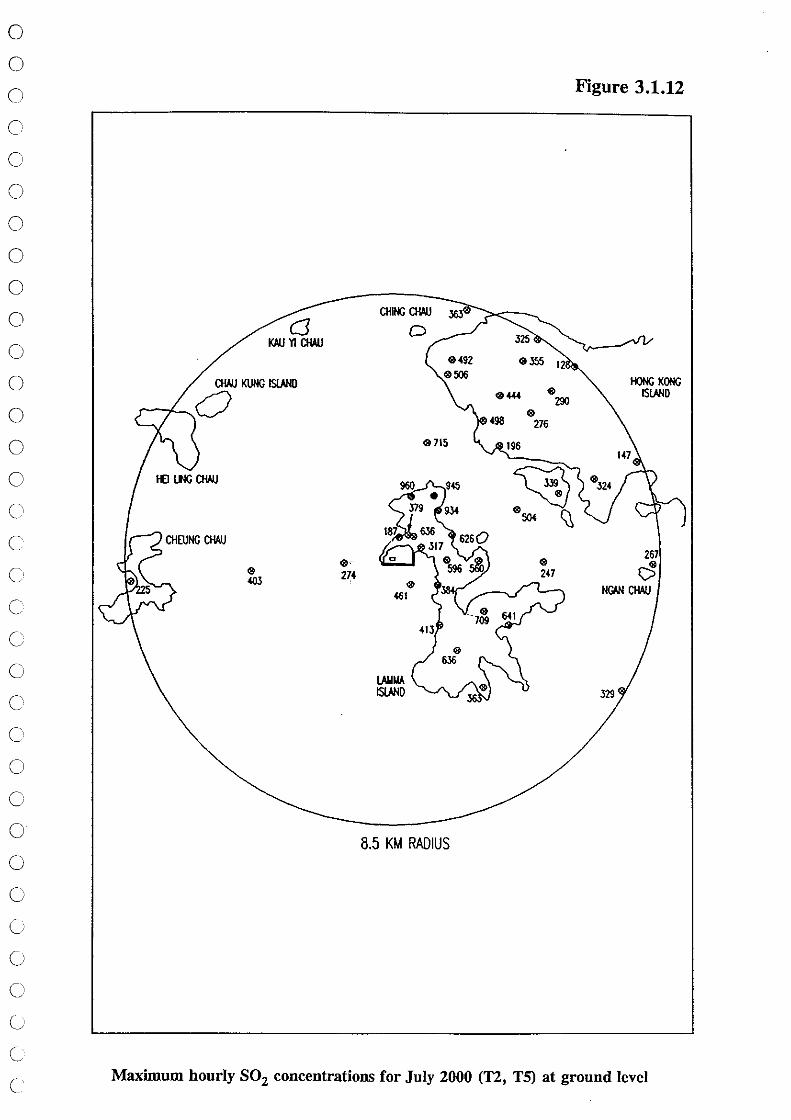
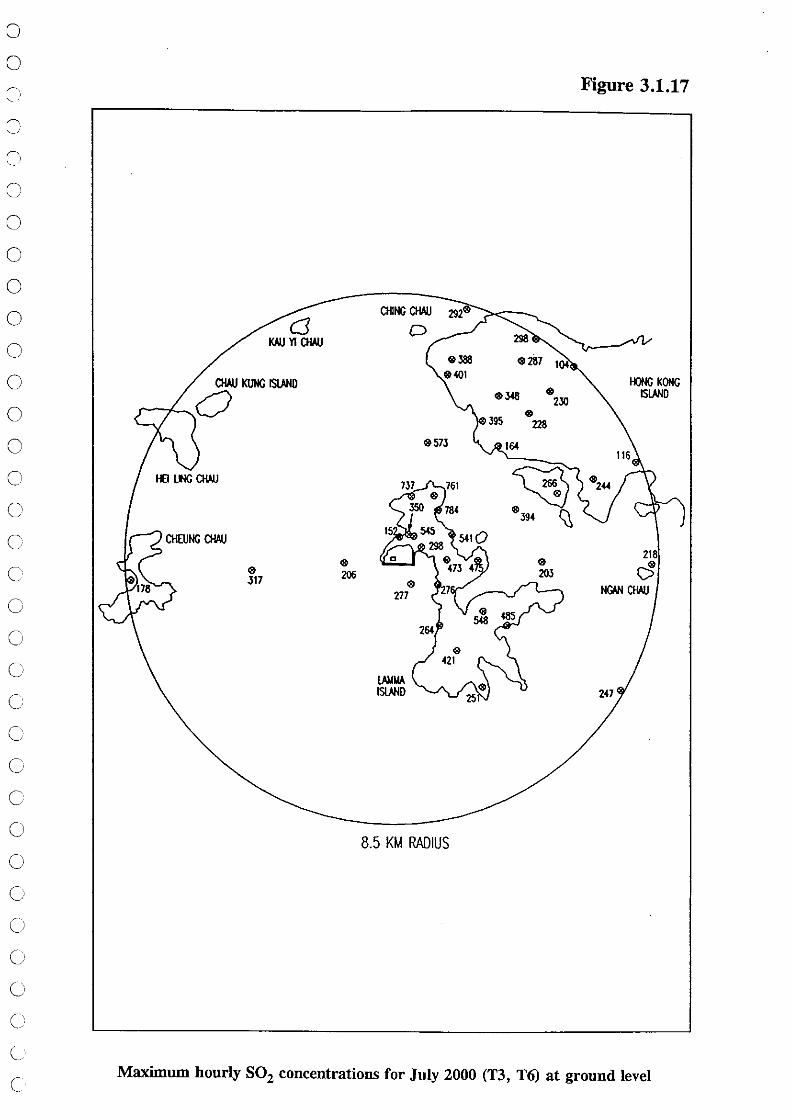
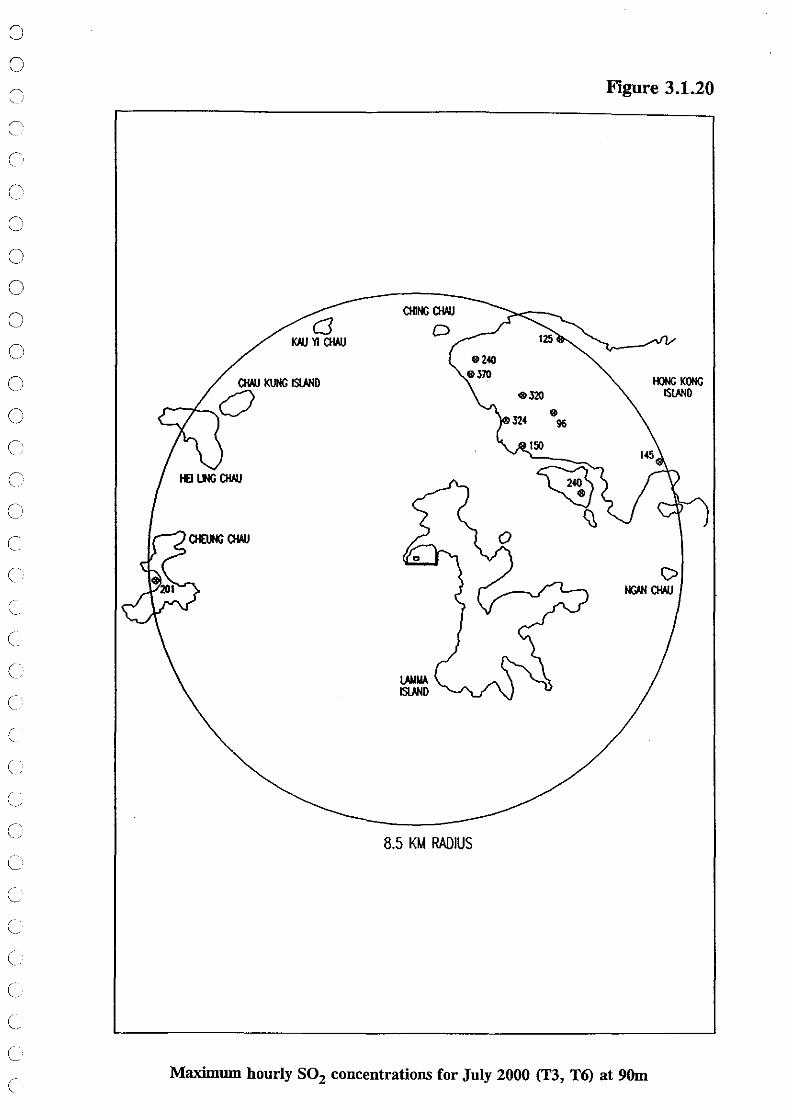
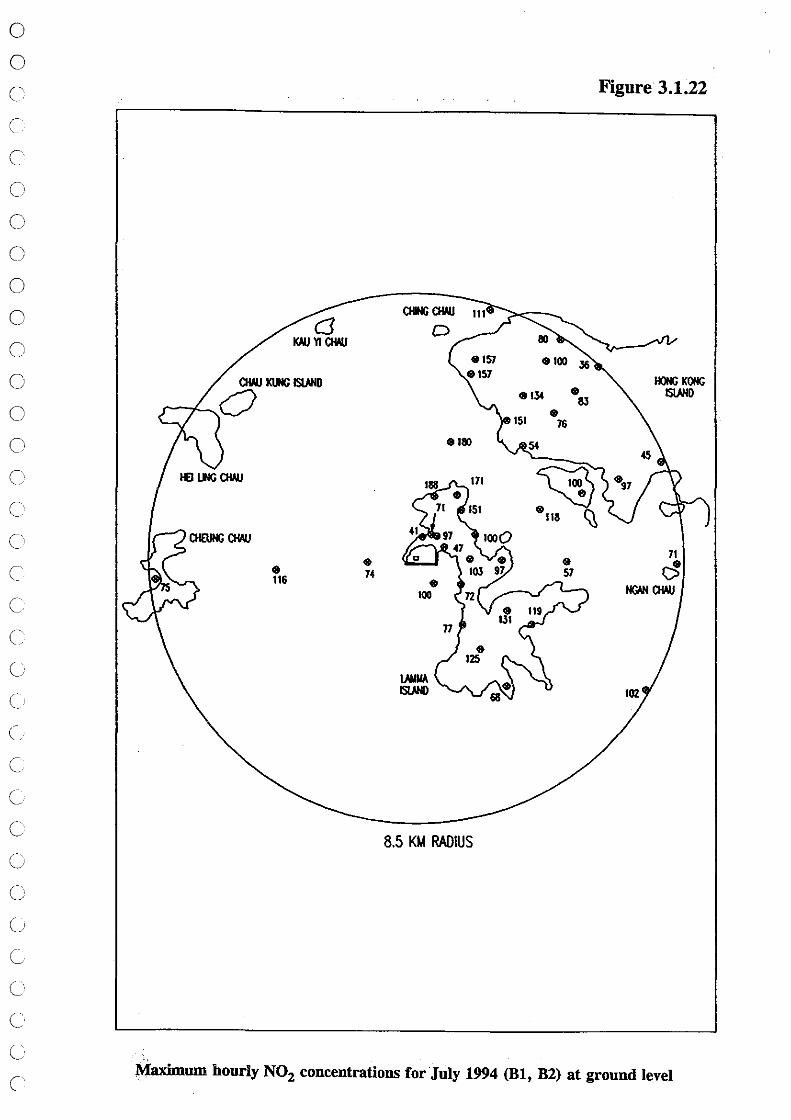
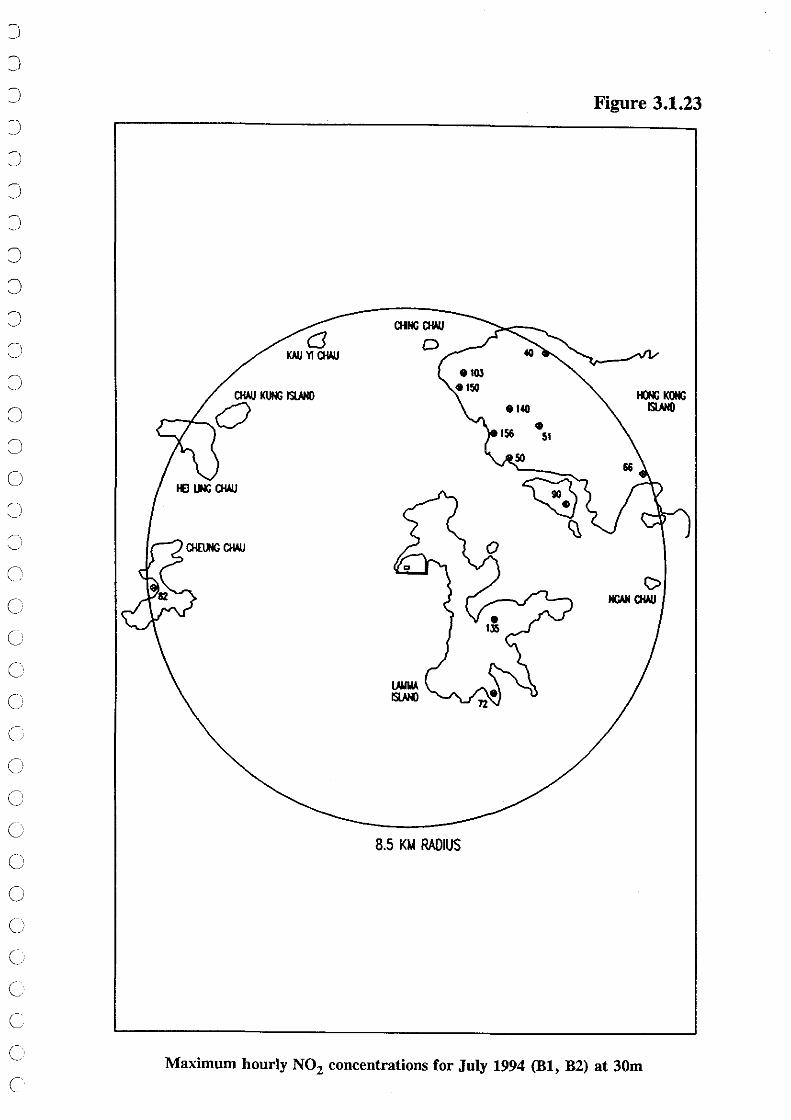
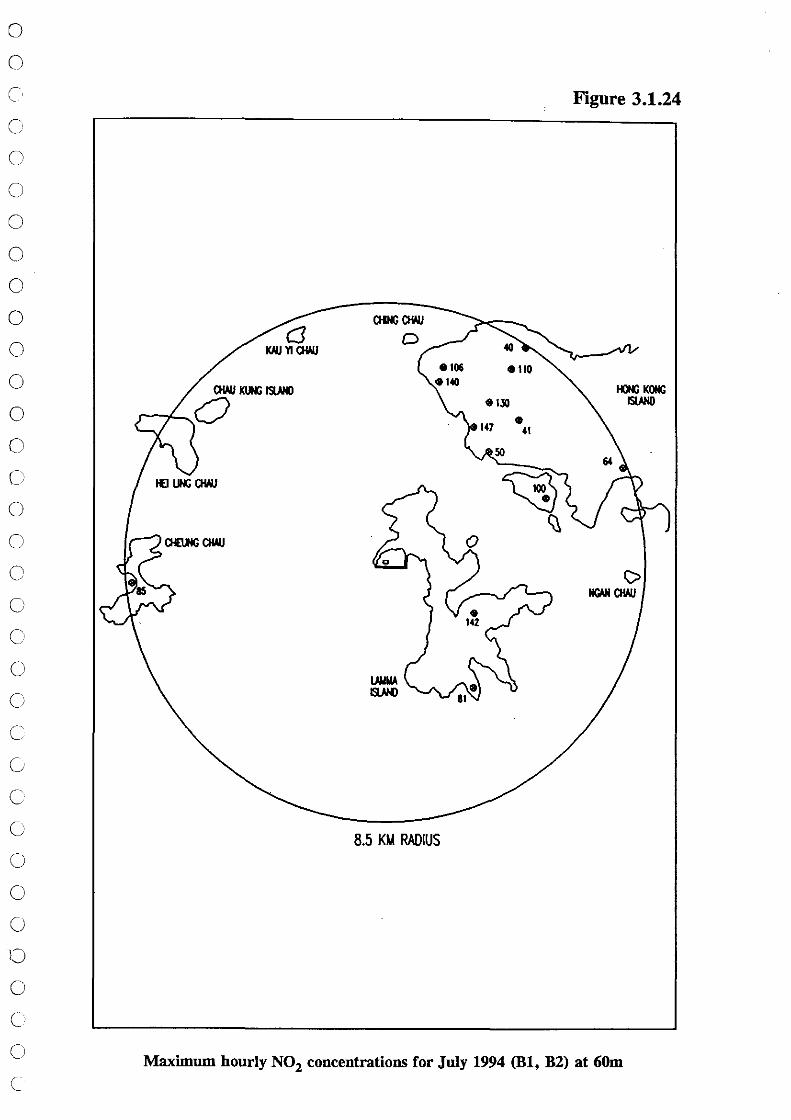
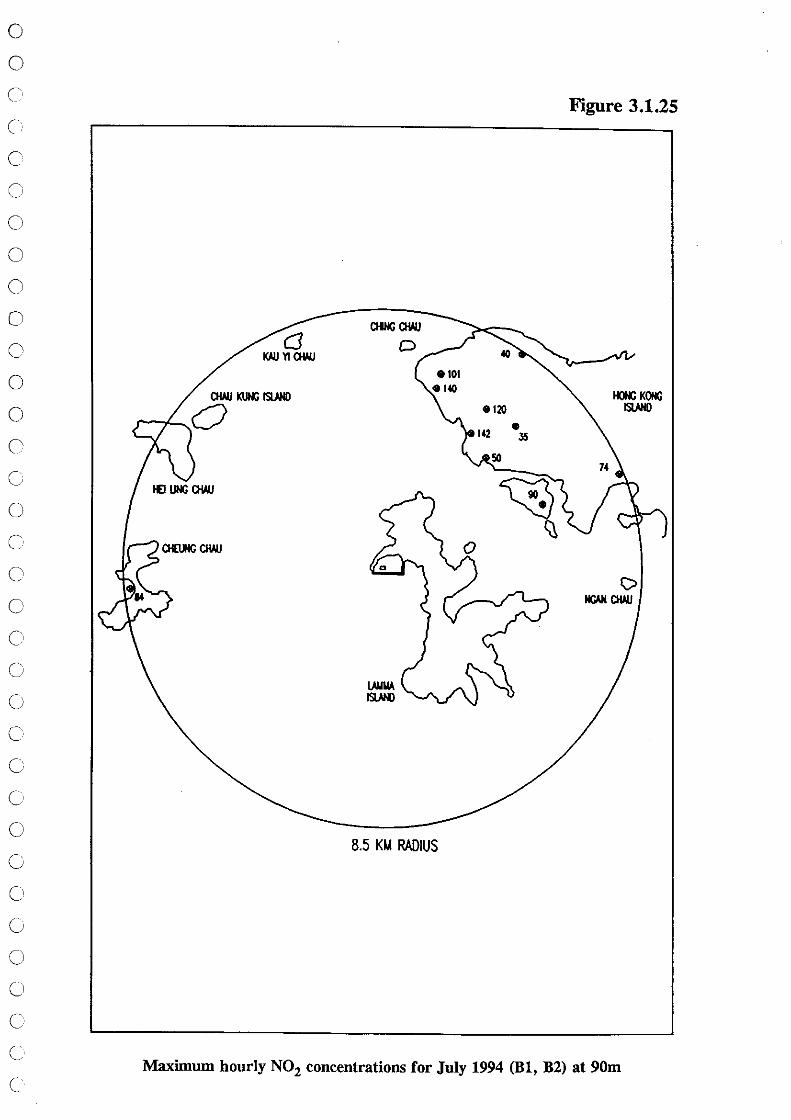
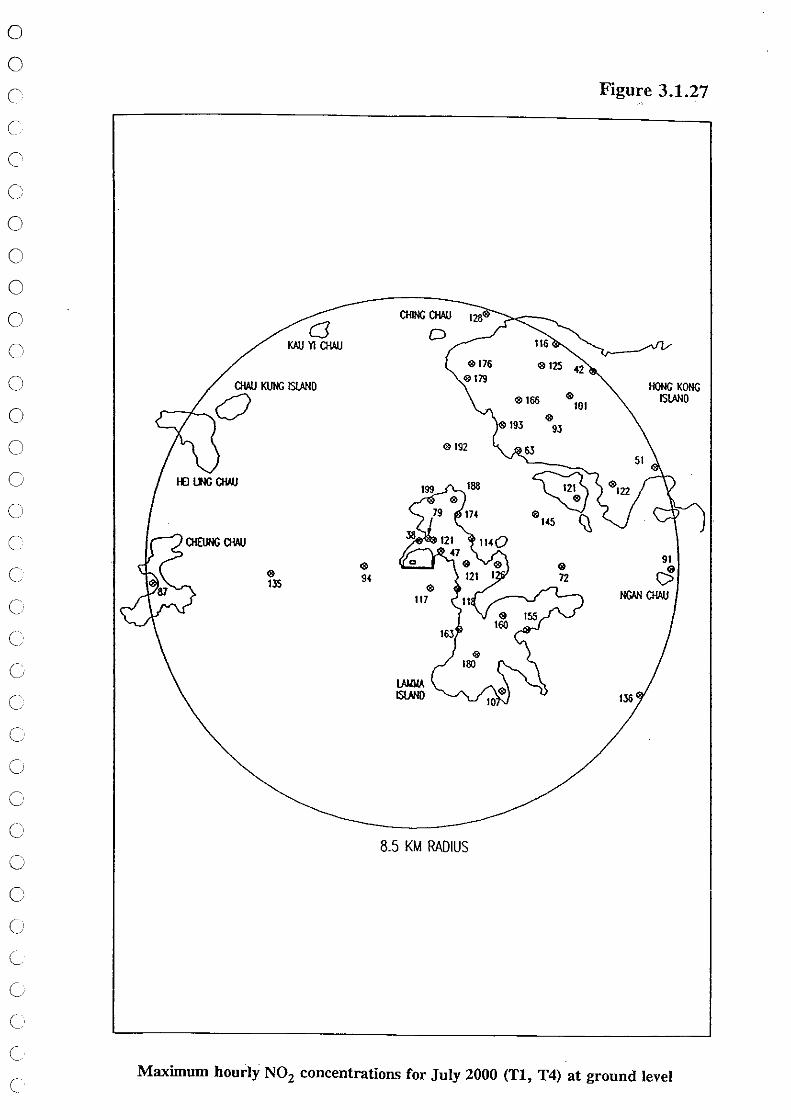
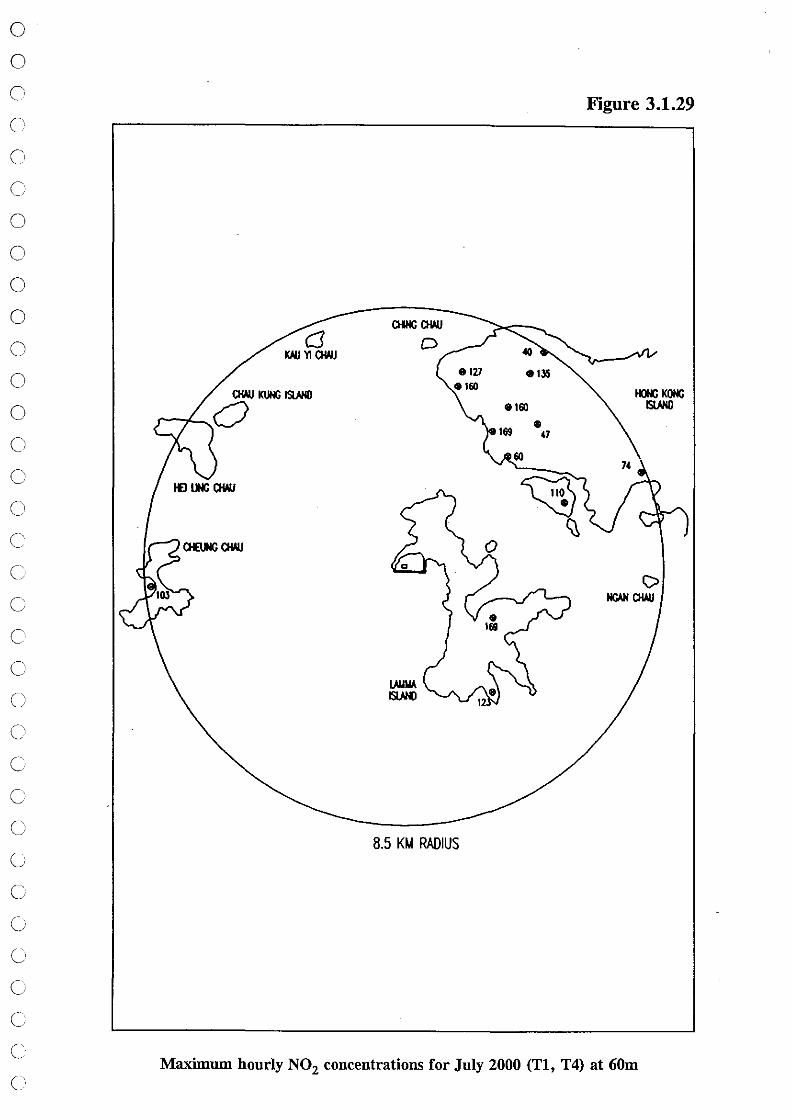
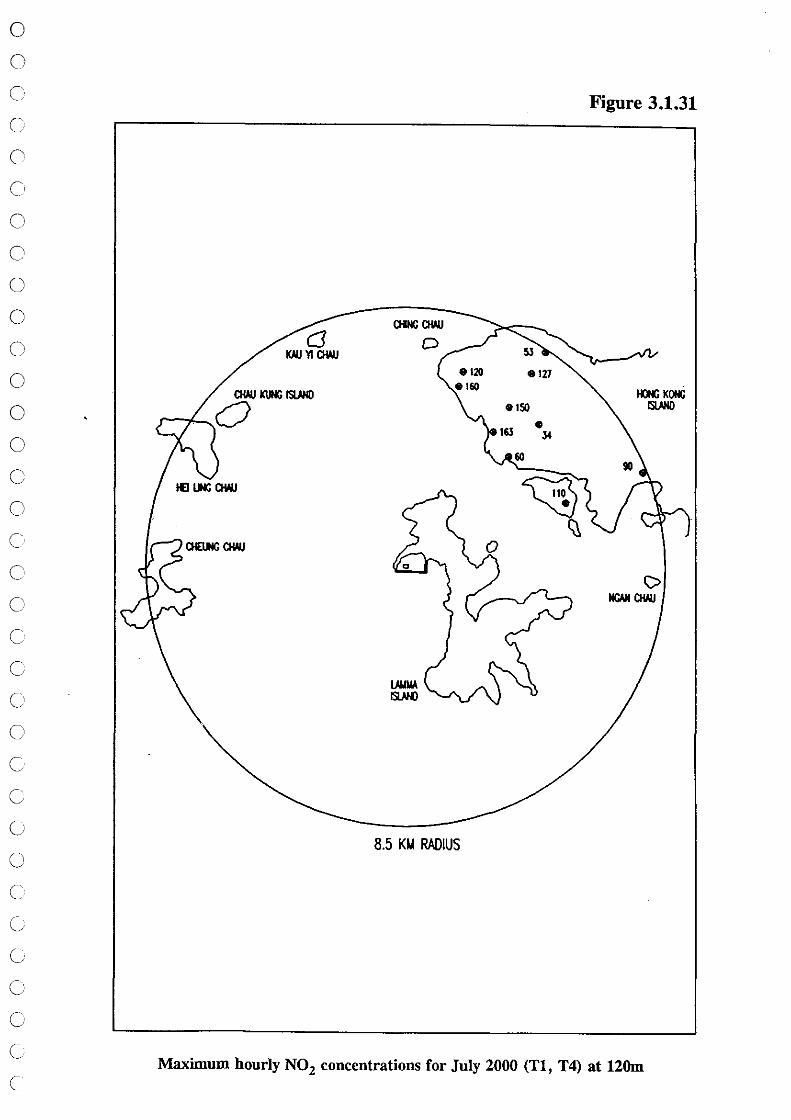
3.1.2 Following EPD's request, the elevated concentration data is similarly presented in Tables 3.1.3 and 3.1.4. The associated graphical representations are provided as Figures 3.1.2 -3.1.6 (S02, 1994); 3.1.7 - 3.1.21 (S02, 2000); 3.1.22 - 3.1.26 (N02, 1994) and 3.1.27 -3.1.31 (N02, 2000) for ground level and different elevations. Generally, in the worst case high wind conditions, the vertical protiles are relatively flat and the plume is well mixed near the ground. Sensor (2,10), east of Victoria Peak, exhibits a somewhat different behaviour in terms of vertical protile. It should be noted, however, that the ground level concentration maxima derive from measurements at 12 m/s, whereas elevated measurements were only made at 15 m/s.
3.1.3 Included in the tables and figures for the elevated sensors are the positions referred to in paragraph 2.2.2. These have been estimated by interpolation within the measured elevated data and via the measured ground level concentrations at these locations together with representative non-dimensional vertical profiles. The interpolation is further described in Appendix A.
3.2 Estimates of Long Term Concentrations
3.2.1 The potential development areas on Western and Southern Hong Kong Island to be considered are Kennedy Town, Mount Davis, Central, Pok Fu Lam, Mid-levels West, Peak Area, Aberdeen and Ap Lei Chau. They can be affected by Lamma Power Station when the wind is in the 90° sector between 180° (i.e. S) and 270° (i.e. W), as also are the N.E. Lamma Island areas which potentially suffer the greatest impact.
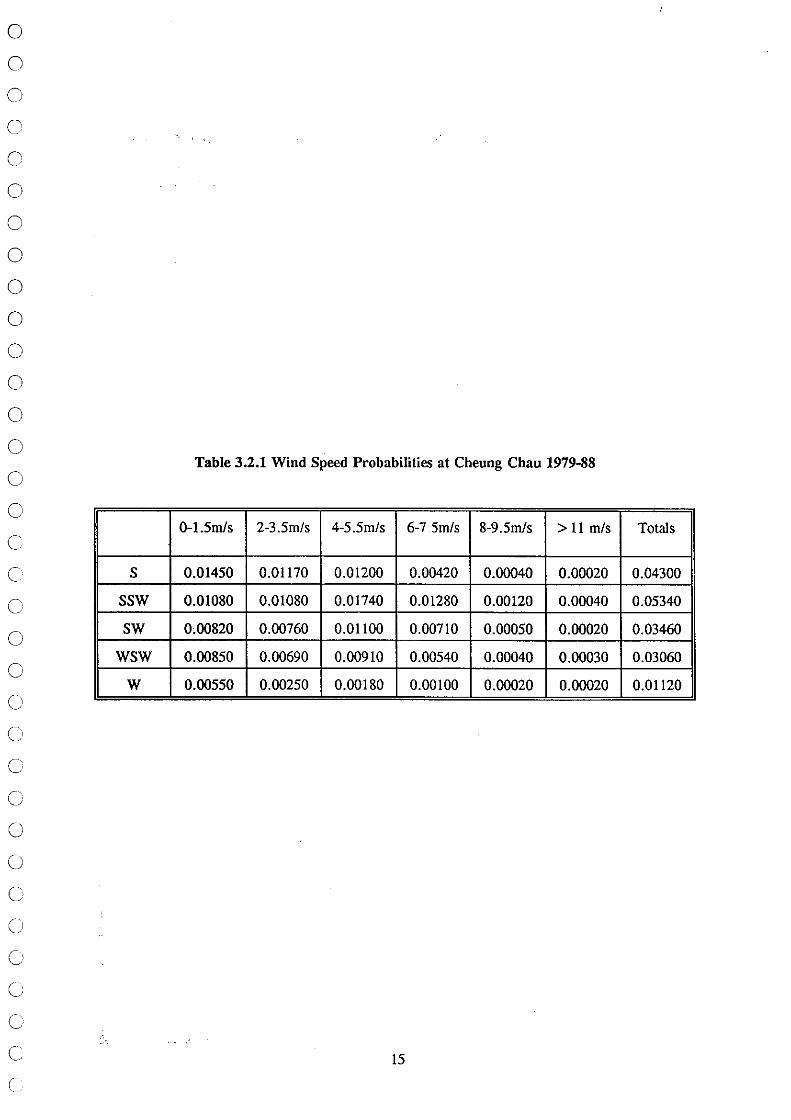
3.2.2 Table 3.2.1 shows the long term probabilities of wind speed at Cheung Chau for the sector between 180° and 270°. The observation period was ten years, and probability of occurrence is shown for each 22.5° sector. Within the sector 180°-270°, (he SSW sector has the highest probability of occurrence.
3.2.3 In Table 3.2.1 wind speeds greater than 11 m/s form a class while lower wind speeds have been separated into the following bands 0-1.5m/s, 2-3.5m/s, 4-5.5m/s, 6-7.5m/s and 8-9.5m/s. Overall, the dominant band (i.e. the bands that occur most commonly) is 4-5.5m/s. The annual frequency of occurrence of the dominant band is 105 hours, 152 hours, 96 hours, 80 hours, and 16 hours for S, SSW, SW, WSW and W sectors respectively.
3.2.4 The wind tunnel measurements have shown that at low wind speeds « 5 m/s), ground level concentration in the study area is low because the plume is borne aloft. By contrast, the plume is downwashed at high wind speeds (i.e. > 8 m/s), and high ground level concentrations occur.
3.2.5 Full-scale hourly, daily, and yearly concentrations were derived from the wind tunnel measured I hour concentration by using values of Cheung Chau's wind speed and wind direction measured every hour over the ten years from 1981 to 1990. The wind data was provided by the Royal Observatory, Hong Kong.
7

o o o o o o o o o o o o o o o o o o o o o o o o o o o o o o o o o o
3.2.6 The peak day Io.ad pro.file fo.r July 2000 was used fo.r the analysis. This is presented in the IAR (ref. I) as Table 5.4. Fo.r a given ho.ur, let the wind speed be u and the wind directio.n be 0w' If I 0,-0", I is less than o.r equal to. 11 0
, where 0, is the angular bearing o.f a particular senso.r, po.llutant co.ncentratio.n asso.ciated with u is read from the curve o.f the variatio.n o.f co.ncentratio.n with wind speed measured in the wind tunnel fo.r the particular senso.r. The co.ncentratio.n was multiplied by the Io.ad facto.r fo.r that ho.ur o.f the day, the Io.ad facto.r being o.btained fro.m the peak Io.ad profile fo.r July 2000. If I O,-Ow I is greater than 11 0
, the co.ncentratio.n is set to. zero.. Thus the time histo.ry o.f co.ncentratio.n was built up o.ver ten years fo.r each senso.r. Fo.r N~ it was assumed that co.nversio.n fro.m NOx was 30% in the near field o.n Lamma Island and 50% in the far field o.n Ho.ng Ko.ng Island. No.te that I O,-Ow I ,,; 11 0 implies a wind secto.r o.f abo.ut 22.5 0
• It was stated in the final Wind Tunnel repo.rt (Reference 2) that altho.ugh an individual plume has a smaller angular influence, this wind secto.r is appro.priate to. co.ver the influence o.f the different chimneys.
3.2.7 Daily and yearly average co.ncentratio.ns were calculated and the fifty largest ho.urly and daily co.ncentratio.ns o.bserved o.ver the ten years perio.d were sto.red.
3.2.8 With regard to. the AQO, the value o.f ho.urly co.ncentratio.n, which is no.t exceeded o.n the average mo.re than three ho.urs per year (Le. the 99.97th percentile) is the 31st largest ho.urly co.ncentratio.n measured o.ver the ten years perio.d. The daily average co.ncentratio.n, which is no.t exceeded o.n the average mo.re than o.ne day per year (Le. the 99.7th percentile), is the 11th largest daily co.ncentratio.n measured Qv er the ten years perio.d.
3.2.9 The impact o.f Lamma Po.wer Statio.n at the po.tential develo.pment areas listed in 3.2.1 has been assessed by calculating the ho.urly co.ncentratio.n no.t exceeded o.n average mo.re than three ho.urs per year,. the daily co.nc.entratio.n no! exceeded o.n average mo.re than o.ne day per year, and the yearly co.ncentratio.n. The results are presented bo.th in p.g/m3 and as percentage o.f the AQO. Data fo.r S~ are presented in Tables 5.1, 5.2, and 5.3. N~ data are presented in Tables 5.4, 5.5, and 5.6.
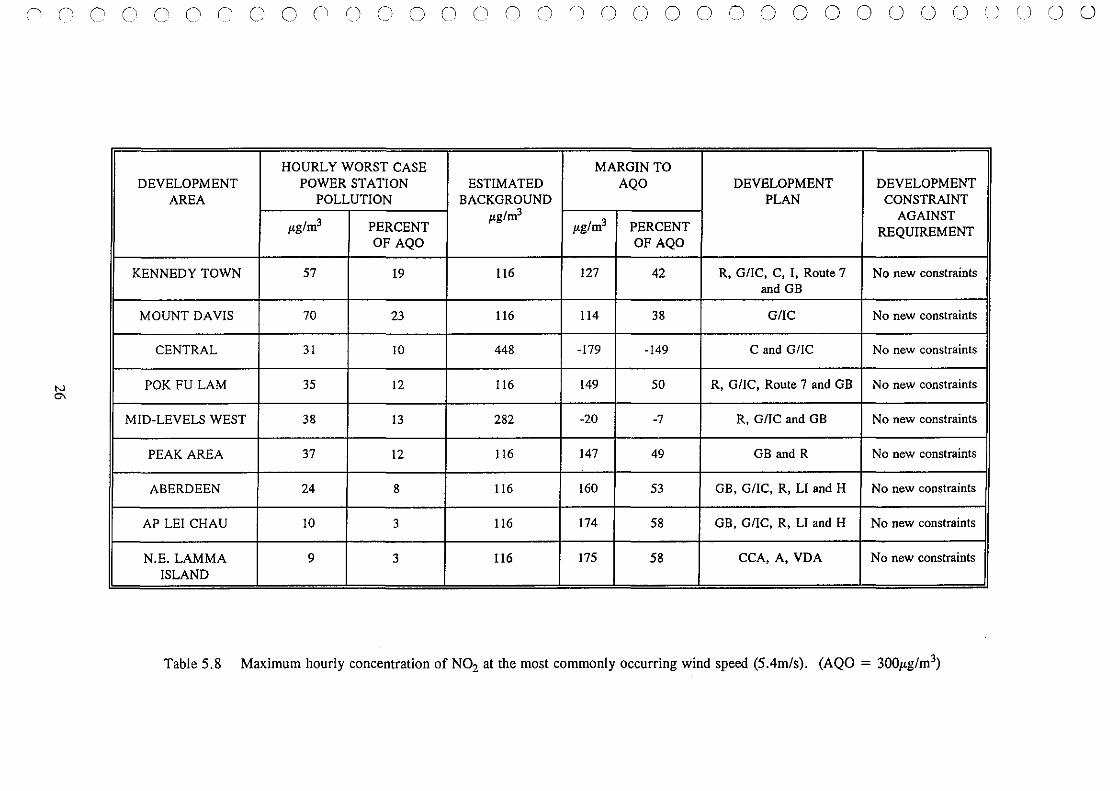
3.2.10 As repo.rted in 3.2.3, the wind speed band that o.ccurs mo.st co.mmo.nly is 4-5.5m/s. The co.ncentratio.n measured in the wind tunnel at a wind speed o.f 5.4m/s (IOm height) is therefo.re a co.nservative estimate o.fthe typical maximum ho.urly co.ncentratio.n. These results are presented in Tables 5.7 and 5.8.
3.2.11 Lamma Po.wer Statio.n impacts presented in Tables 5.1 to. 5.8 are deemed to. be co.nservative due to. the assumptio.ns that the statio.n o.perates co.ntinuo.usly at the peak day Io.ad pro.file fo.r July 2000 with 1 % sulphur co.aL Acco.rding to. present fo.recast, in the year 2000 the po.wer statio.n will o.perate at the peak day Io.ad pro.file o.nly in summer. Furthermo.re, between 1982 and 1989, the statistical average sulphur co.al burned at the Lamma Po.wer Statio.n was 0.7%.
3.2.12 It sho.uld be no.ted that all results sho.wn are based o.n I % sulphur co.al and the peak daily profile. The co.nclusio.ns drawn use these results and do. no.t depend o.n reduced sulphur content o.r seaso.nal adjustments to. the dail y Io.ad profile. The qualifying statements in 3.2.11 are expressed o.nly to. emphasise that the results are likely to. be co.nservative.
8
o o o o o o o o o o o o o o o o o o o o o o o o o o o o o o o o o o
3.3 Assessment of Background
3.3.1 In order. to consider the margin remaining within the AQO after account has been taken of the Power Station and other sources, an assessment of the background concentration at the various locations of interest is required.
3.3.2 Measurements from the HEC and EPD network of monitoring stations were analysed and discussed in the IAR (paragraphs 5.05 - 5.17).
3.3.3 Ideally, it would be desirable to analyse the data for background as a function of location, wind speed, direction and averaging time, with the effect of the existing Lamma Power Station emissions removed.
3.3.4 Clearly this is not entirely possible, so rather more generalised arguments must be used.
3.3.5 Annual figures for existing levels of S02' N02 and TSP are readily available from the EPD and HEC sources, though inevitably contaminated by any contribution from Lamma Island.
3.3.6 The EPD data for 1989 suggests an annual average for SCl.2 levels of around 15 to 20jLg/m3
for Central and Causeway Bay and the HEt Hong Kong Island measurements for 1990 are in the range of 5 to 18jLg/m3. The lowest value derives from Chung Hum Kok, on the southern part of the Island. NO? annual averages were 35 (1988) and 60 (1989) in Central and 45jLg/m3 in 1989 at Causeway Bay. As shown in the IAR, the HEC Hong Kong Island data for 1989/1990 provides annual averages around 40 to 50jLg/m3• No air quality measurements exist for Lamma Island but generally good air quality is expected.
3.3.7 Values of the annual background concentration presented in Tables 5.3 and 5.6 are in fact the monitored annual averages. The background concentration is clearly conservative because it contains the influence of the existing Lamma Power Station. Note, however, that the process of long term averaging and, particularly, the relative infrequency of westerly winds, means that the values, though probably slightly pessimistic, are reasonable.
3.3.8 As discussed in the IAR, dust levels (TSP) can be unacceptably high in many areas and AQO's are frequently exceeded. The sources are generally local traffic and construction activity and it was shown in the IAR that even the maximum 1 hour TSP concentration carried in the plume was only 28jLg/m3 with values closer to 10jLg/m3 predicted for Hong Kong Island. On an annual basis the Power Station TSP contribution is estimated to be completely negligible. Any problems remain the locally generated existing problems, so TSP will not be treated further in this report.
3.3.9 For daily maximum and hourly maximum background estimates a somewhat different view is required.
3.3.10 The EPD 1989 data for Central/Western show daily maxima of 80jLg/m3 for S02 and 329jLg/m3 for N02, whilst the HEC data for Southern Hong Kong Island show occasional 1 hour peaks around 300jLg/m3 for both S02 and N02, with N02 daily maxima up to 150jLg/m3 .
3.3.11 On Western and Southern Hong Kong Island the maximum SO:! concentrations are likely to be due to the Power Station itself and certainly, for the worst cases of high winds from the SW it is difficult to imagine any other significant So, source upwind of the receptors. It is arguable, therefore, that the "background" to the worst case pollution from the Power Station should be taken as zero.
9
o o o o o o o o o o o o o o o o o o o o o o o o o o o o o o o o o o
3.3.12 For NOz, the larger short term peaks are more pronounced in winter time. The contribution from the Power Station is likely to be small, due to the prevailing wind and as discussed in the IAR such peaks (paragraph 5.12) are probably found in still, winter conditions. Certainly there should be no correlation with the higher wind speed SW conditions which will cause the greatest impact from Lamma Power Station.
3.3.13 Therefore, when assessing the impacts of Lamma Power Station on Western and Southern Hong Kong Island, a case can be made for taking the background concentration as zero. While the principle involved is sound, zero background concentration may, however, not be acceptable on psychological grounds and can also be criticised for being unconservative. Hence, a more acceptable estimate of background concentration is required.
3.3.14 An analysis of monthly I-hour SOz data measured by HEC in July 1989 at Aberdeen, Queen Mary Hospital, Ap Lei Chau, and Victoria Road indicated that the value of the corresponding 99.97th SOz percentile is 84, 140, 121, and 1051'g/m3 respectively. For the same locations the computer analysis of the wind tunnel data described in 3.2.5 indicates that the contribution of units Ll-L5 to the 99.97th SOz percentile is 60, 180, 37, and 471'g/m3
respectively with the burning of 1 % sulphur coal and 42, 126, 26, and 331'g/m3 respectively with the burning of statistical average of 0.7% sulphur coal. Hence it was estimated that hourly background concentration of S02 ranges from about 0 to 951'g/m3. Hence a conservativ~' estimate of the hourly background concentration of S02 is 951'g/m3•
3.3.15 Following reasoning similar to those described above, the daily average background of S02 was estimated to be 331'g/m3•
3.3.16 In the case of NOz, the hourly and daily average background was estimated in the manner described above to be between 41 and 531'g/m3 . Hence consistent application of the principle of conservative estimation gives a daily average N02 background concentration of 531'g/m3•
For CentrallWestern, however, EPD has reported that in 1989 maximum daily concentration ofN02 of 3291'g/m3 occurred. Since the computer analysis suggests that at Central, units LlL5 produce a daily average concentration of NOz of only 121'g/m3 , the hourly background is estimated to be 3171'g/m3. Such a high background is probably caused by vehicle traffic and construction activity. Since significant traffic is expected at Mid-Levels West, a background concentration, which is the average of the value used for Aberdeen and Central, is considered appropriate. Thus for development areas, daily average background concentration was estimated to range from 531'g/m3 to 317l'g/m3 - see Table 5.5.
3.3.17 Following arguments similar to those described above and applying the principle of conservative estimation, an hourly N02 background concentration ranging from 80 to 461Jlg/m3 (Table 5.4) was estimated.
3.3.18 The background hourly concentration at a wind speed of 5.4m/s, which is the sort of value that occurs most commonly, was estimated by using the wind tunnel and full-scale data as described above. The hourly background concentrations of S02 and N02 (Tables 5.7 and 5.8) are estimated to be higher than in Tables 5.1 and 5.4 because at lower wind speeds the pollutant concentration generated by the power station is smaller.
10

o o o o o o o o o o o o o o o o o o o o o o o o o o o o o o o o o o
Table 3.1.1 Maximum 1 hour ground level concentrations of S02 (AQO = 800l-'g/m3)
July 1994 July 2000 July 2000 July 2000 Direction, Sensor (BIIB2) (Tl/T4) (T2IT5) (T31T6)
FGD:L6 FGD:L6·L8 FGD:L5-L8 FGD:L4-L8
1,1 223 218 187 152 1,2 1156 1156 960 737 1,3 841 840 715 573 1,4 589 598 506 401 1,5 573 583 492 388 1,6 418 427 363 292 2,11 421 427 379 350 2,1 1063 1107 945 761 2,3 560 590 498 395 2,5 502 528 444 348 2,8 389 415 355 287 2,10 309 350 325 298 3,1 655 717 636 545 3,2 1012 1067 934 784 3,3 216 225 196 164 3,4 303 319 276 228 3,5 327 344 290 230 3,6 143 150 128 104 4,1 335 333 317 298 4,2 683 702 626 541 4,3 578 601 504 394 4,4 389 403 339 266 4,5 376 394 324 244 4,6 172 175 147 116 5,1 675 704 596 473 5,2 590 669 560 475 5,3 275 285 247 203 5,4 297 309 267 218 6,1 439 486 384 276 6,2 827 851 709 548 6,3 745 779 641 485 6,4 382 402 329 247 7,1 605 623 461 277 7,2 464 545 413 264 7,3 767 825 636 421 7,4 420 462 363 251 8,1 287 334 274 206 8,2 480 480 403 317 8,3 261 267 225 178
II
o o o o o o o o o o o o o o o o c c o o o o o o o o o o ()
o ()
()
C
C
Table 3.1.2 Maximum 1 hour ground level concentrations of NOz (AQO = 3001tg/m3)
Direction, Sensor July 1994 July 2000 (BI/B2) (f11T4)
1,1 41 38 1,2 188 199 1,3 180 192 1,4 157 179 1,5 157 176 1,6 III 128 2,11 71 79 2,1 171 188 2,3 151 193 2,5 134 166 2,8 100 125 2,10 80 116 3,1 97 121 3,2 151 174 3,3 54 63 3,4 76 93 3,5 83 101 3,6 36 42 4,1 47 47 4,2 100 114 4,3 118 145 4,4 100 121 4,5 97 122 4,6 45 51 5,1 103 121 5,2 97 126 5,3 57 72 5,4 71 91 6,1 72 118 6,2 131 160 6,3 119 155 6,4 102 136 7,1 100 117 7,2 77 163 7,3 125 180 7,4 68 107 8,1 74 94 8,2 116 135 8,3 75 87
12
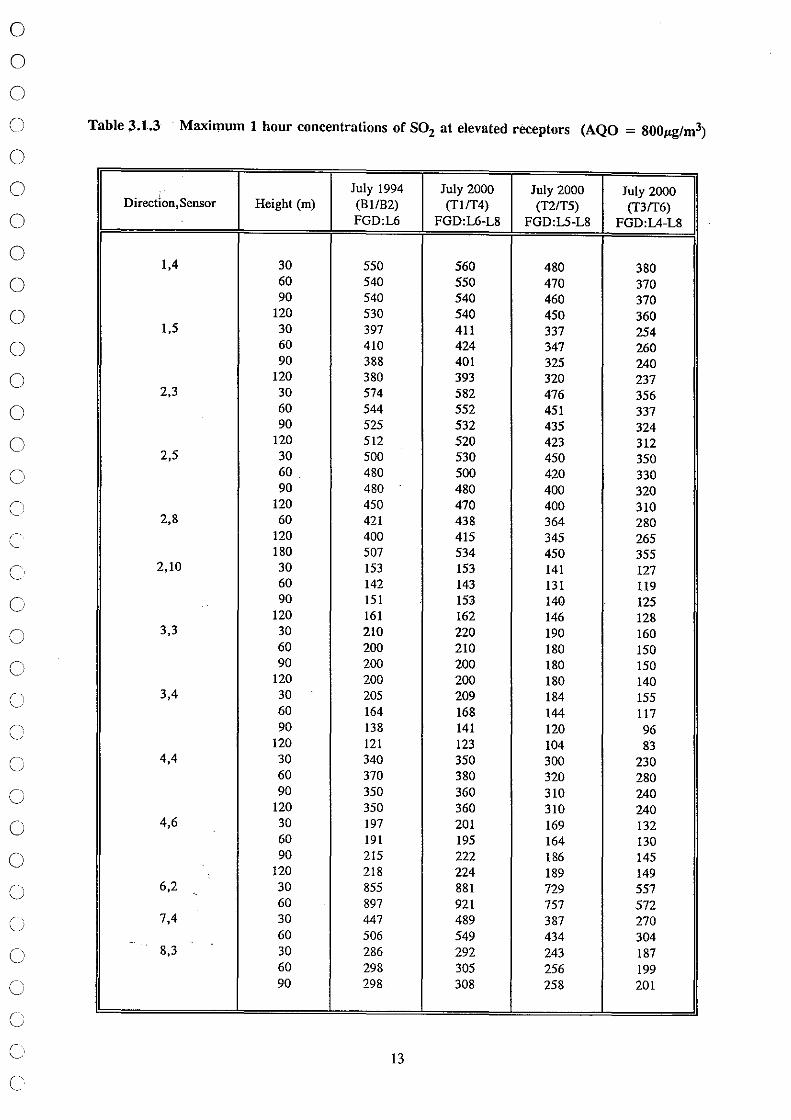
o o o o Table 3.1.3 Maximum 1 hour concentrations of S02 at elevated receptors (AQO = 800JLg/m3)
o o o o o o o o o o o o c c o o o o c o o o o o (;
o (;
c c c
Direction,Sensor
1,4
1,5
2,3
2,5
2,8
2,10
3,3
3,4
4,4
4,6
6,2
7,4
8,3
Height (m)
30 60 90
120 30 60 90
120 30 60 90
120 30 60 90
120 60
120 180 30 60 90
120 30 60 90
120 30 60 90
120 30 60 90
120 30 60 90
120 30 60 30 60 30 60 90
July 1994 (BIIB2) FGD:L6
550 540 540 530 397 410 388 380 574 544 525 512 500 480 480 450 421 400 507 153 142 151 161 210 200 200 200 205 164 138 121 340 370 350 350 197 191 215 218 855 897 447 506 286 298 298
13
July 2000 July 2000 July 2000 (TlFf4) (TI/T5) (T3Ff6)
FGD:L6-L8 FGD:L5-L8 FGD:L4-L8
560 480 380 550 470 370 540 460 370 540 450 360 411 337 254 424 347 260 401 325 240 393 320 237 582 476 356 552 451 337 532 435 324 520 423 312 530 450 350 500 420 330 480 400 320 470 400 310 438 364 280 415 345 265 534 450 355 153 141 127 143 131 119 153 140 125 162 146 128 220 190 160 210 180 150 200 180 150 200 180 140 209 184 155 168 144 117 141 120 96 123 104 83 350 300 230 380 320 280 360 310 240 360 310 240 201 169 132 195 164 130 222 186 145 224 189 149 881 729 557 921 757 572 489 387 270 549 434 304 292 243 187 305 256 199 308 258 201

o o o o Table 3.1.4 Maximum 1 hour concentrations of NOz at elevated receptors (AQO = 3001Lg/m3)
o o o o o o o o o o o o c c c o c c C'
C'
o o o c
c
Direction, Sensor
1,4
1,5
2,3
2,5
2,8
2,10
3,3
3,4
4,4
4,6
6,2
7,4
8,3
Height Cm)
30 60 90
120 30 60 90
120 30 60 90
120 30 60 90
120 60
120 180 30 60 90
120 30 60 90
120 30 60 90
120 30 60 90
120 30 60 90
120 30 60 30 60 30 60 90
July 1994 July 2000 (BIIB2) CT1/T4)
150 170 140 160 140 160 140 160 103 123 106 127 101 121 99 120
156 178 147 169 142 163 129 163 140 170 130 160 120 150 120 150 110 135 105 127 87 172 40 43 40 40 40 44 43 53 50 60 50 60 50 60 50 60 51 57 41 47 35 40 30 34 90 110
100 110 90 110 90 110 66 77 64 74 74 89 76 90
135 165 142 169 72 112 81 123 82 99 85 103 84 104
14
o o o o o o o o o o o o o o o o c c c o o o o o o o o o o o CJ
o c c
S
SSW
SW
WSW
W
Table 3.2.1 Wind Speed Probabilities at Cheung Chau 1979-88
0-1.5m1s 2-3.5m/s 4-5.5m/s 6-7 5m/s 8-9.5m/s > 11 m/s Totals
0.01450 0.01170 0.01200 0.00420 0.00040 0.00020 0.04300
0.01080 0.01080 0.01740 0.01280 0.00120 0.00040 0.05340
0;00820 0.00760 0.01100 0.00710 0.00050 0.00020 0.03460
0.00850 0.00690 0.00910 0.00540 0.00040 0.00030 0.03060
0.00550 0.00250 0.00180 0.00100 0.00020 0.00020 0.01120
15

o o o o o o o o o o o o o o c c'
c c r '-.
c
c o o c ()
c c c c
4. REVIEW OF DEVELOPMENT PLANS
The outline Zoning Plans for Kennedy Town and Mount Davis (S/H 1/2); for Central (S/H4/3); for Pok Fu Lam (S/HI012); for Mid-Levels West (S/HI114); for the Peak Area (SIHI0/2) and for Aberdeen and Ap Lei Chau (S/HI5/5) and the Outline Development Plan for Lamma Island (D /1 -LI/l) have been examined.
Major changes to the character of development in these areas is not planned and for the purposes of Section 5, the areas have been classified as follows:
Kennedy Town Mostly Residential (R), Government/Institution/Community (G/IC), Commercial (C), very limited Industry (I), New Highway (Route 7) and Green Belt (GB)
Mount Davis G/IC
Central C and G/IC
Pok Fu Lam R, G/IC I, Route 7, GB
Mid-Levels West R, G/IC and GB
Peak Area GB and R
Aberdeen
Ap Lei Chau
Lamma Island
GB, G/IC, R, Light Industrial (LJ) and Highway (H)
GB, G/IC, R, LJ and H
Countryside Conservation Area (CCA), Agricultural (A), Village Development Area (VDA)
16
o o o o o o o o o o o o o o o o c C)
o o o c o o o o o o o o o o o c
5. IMPACT OF LAMMA STATION EMISSIONS ON OTHER DEVELOPMENTS
5.1 From the categorisation of zoning and development plans in Section 4, together with the estimates oflonger term average concentration and background levels in Section 3, it is possible to assess the likely impact of the Lamma Power Station in terms of Constraints to the development plan envisaged.
5.2 This analysis is set out in Tables 5.1 - 5.3 for SOz and Tables 504 - 5.6 for NOz. As discussed in paragraph 3.3.8, the contribution ofTSP from the Power Station is negligible by comparison with locally generated background levels.
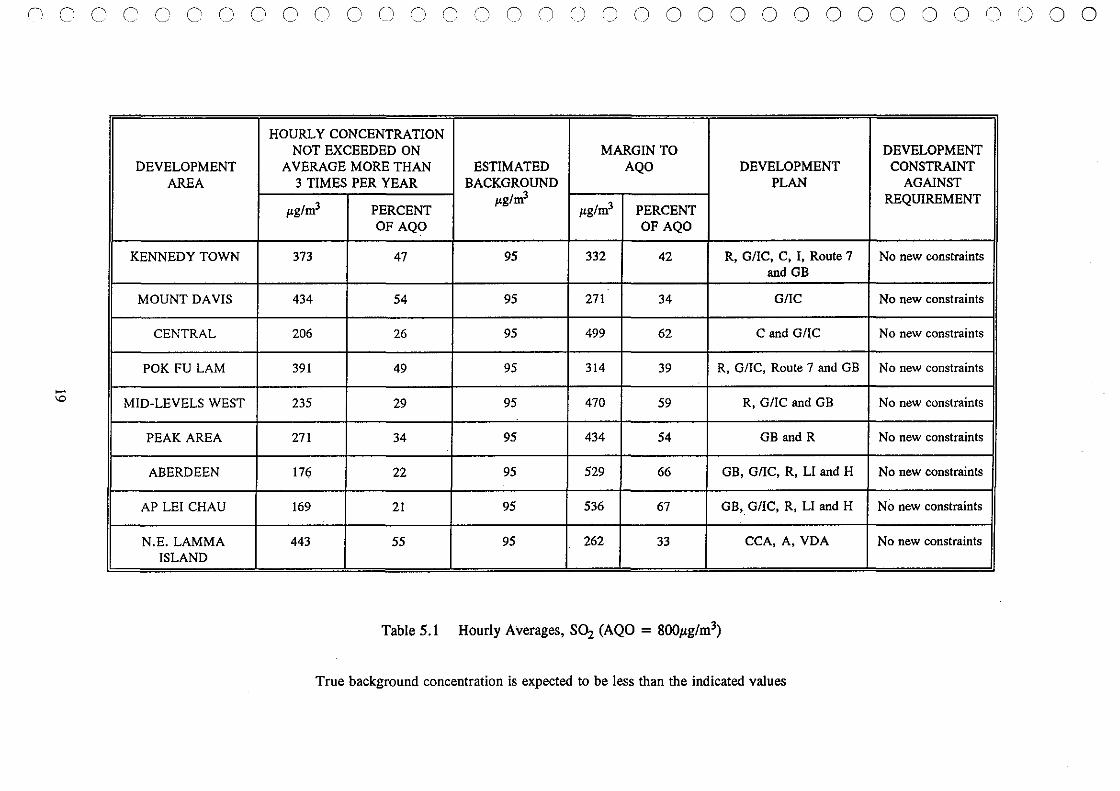
5.3 Hourly Maxima for S02 (Table 5.1)
The I-hour SOz 99.97th percentile (i.e. the hourly concentration not exceeded on average more than 3 times per year) generated by Lamma Power Station in the year 2000 is predicted to be 443/Lg/m3 (Le. 55% of the AQO) for the worst case (N.E. Lamma) and about 170/Lg/m3 (Le. 21 % of the AQO) in the development areas of Aberdeen and Ap Lei Chau. The background concentration for these areas is conservatively estimated to be 95/Lg/m3 (Le. 12% of the AQO). Subtracting the impact of the Power Station plus the background still leaves a margin of 262/Lg/m3 even for the worst case (N.E. Lamma) with around 530/Lg/m3 (66% of the AQO) in the development areas of Aberdeen and Ap Lei Chau. Hence even on Lamma, no planning constraint to the village and agricultural land use is implied by the Power Station impact.
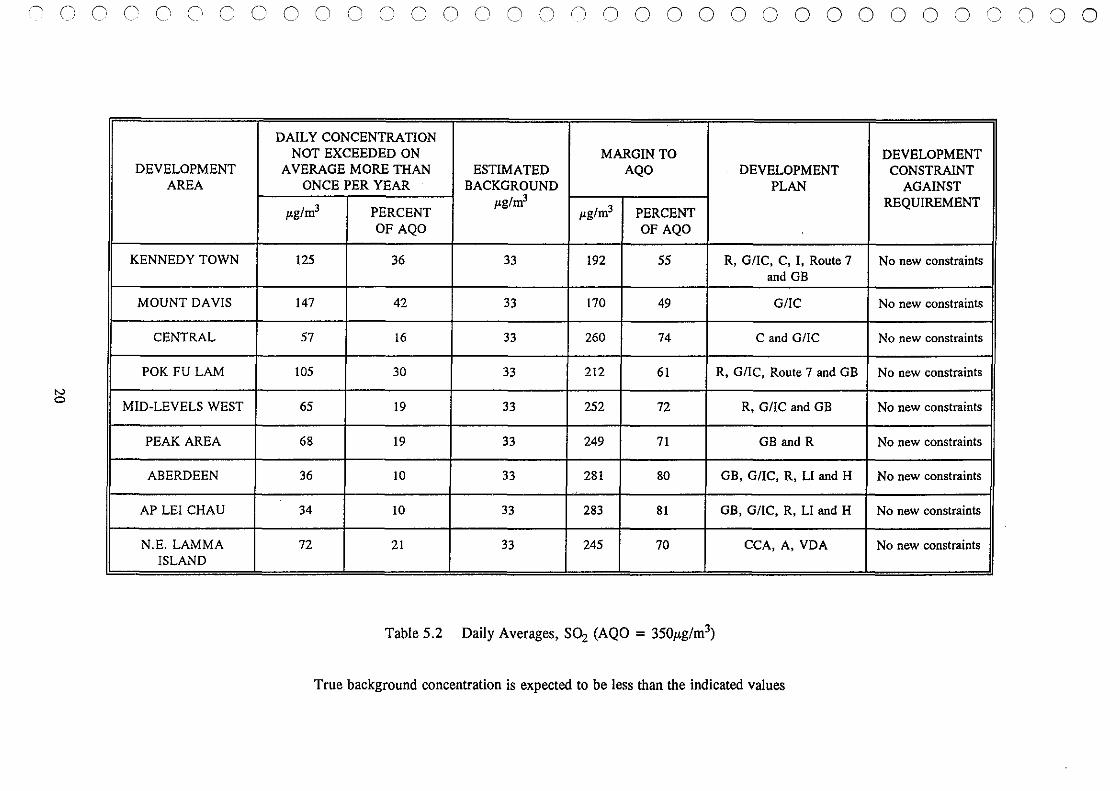
5.4 Daily Maxima for S02 (Table 5.2)
A .similar situation to the hOl!rly maxima exists. Subtracting the im~acts of the Power Station and the background from the AQO leaves a margin of 170-212/Lg/m at Mt. Davis and Pok Fu Lam. This margin should be more than adequate in conditions of high winds from the South West for all planned developments.
5.5 Annual Averages for S02 (Table 5.3)
The Table suggests an entirely satisfactory situation particularly as a very conservative approach has been used. The present background must include the impact ofLI-L5 and the proposed S02 emission increase by the year 2000 is only about 7 %. In the Table, it is seen that even for the worst case (Mount Davis), subtracting the impacts of the Power Station and the background from the AQO still leaves a margin of 55% of the AQO.
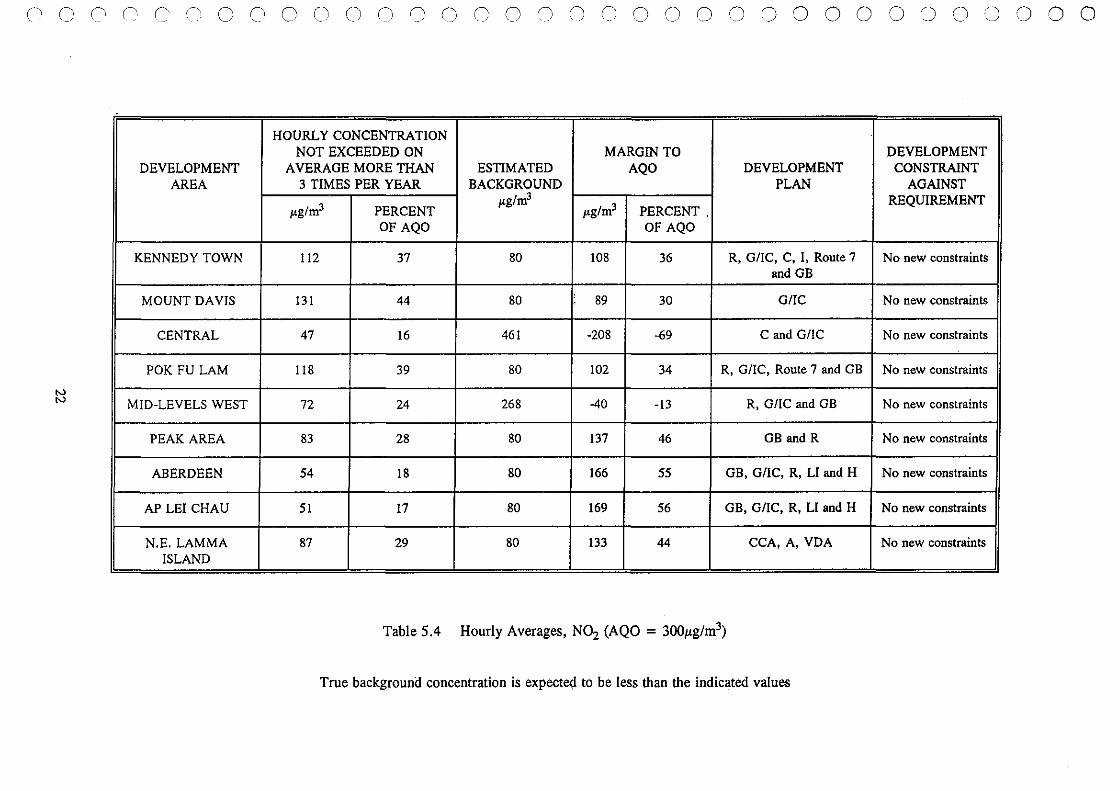
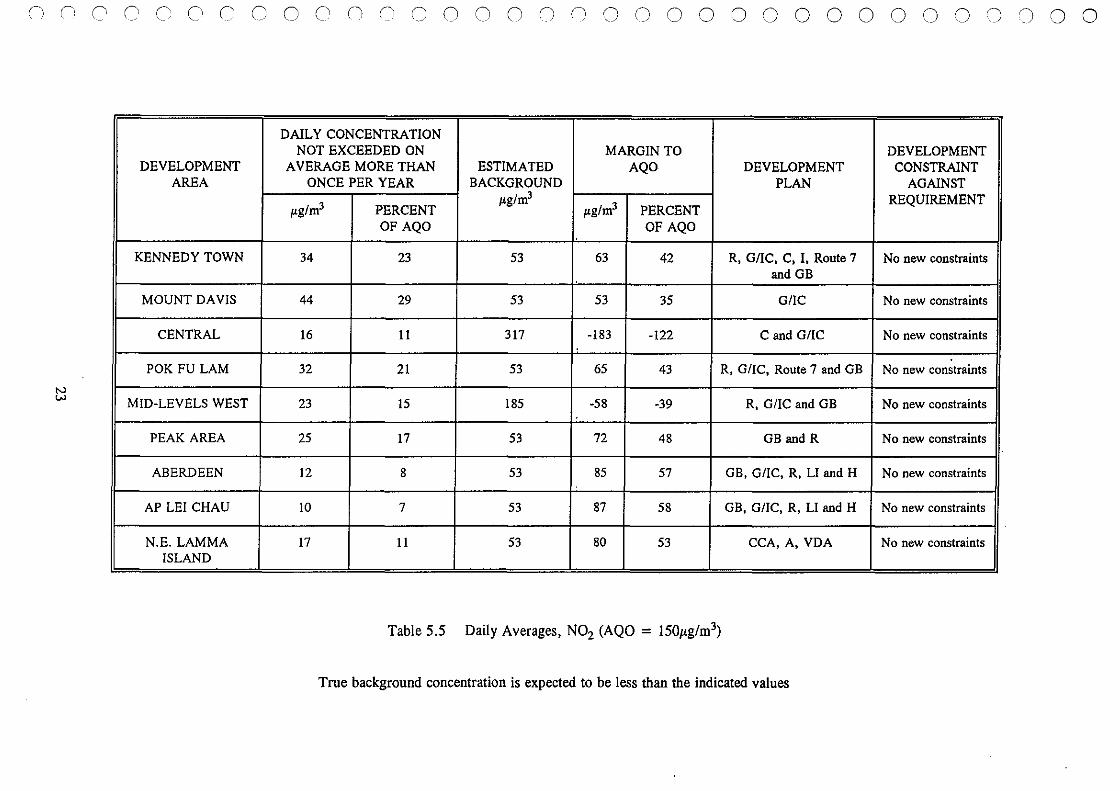
5.6 Hourly and Daily Maxima for N02 (Tables 504 and 5.5)
With the exception of Central and Mid-Levels West a margin of at least 30% of the AQO is available. AQO exceedance is predicted at Central and Mid-Levels West mainly because of the pollution generated by other sources such as traffic and construction activity. Unlike SOz increased local development of the type planned could produce significant increases in NOz. Fortunately, these are likely to be readily dispersed in the high wind conditions giving rise to the maximum Power Station impact. For Pok Fu Lam, Kennedy Town and the Aberdeen area, new highway developments could produce N02 sources upwind of the receptors and aligned with the Power Station plumes. Detailed traffic pollution calculations cannot be undertaken at this stage.
5.7 Under calm winter conditions high N02 concentrations may arise, of course, as discussed earlier and in the IAR, but these should be uncorrelated with significant Power Station pollution.
17
o o o o o o o o o o o o o o o o c
c
c c (;
c c ()
o c c c c c
5.8 Annual Averages for N02 (Table 5.6)
The Power Station makes a negligible impact to the annual N02 average values. The margin is dictated by the existing background levels (determined from the EPD and HEC measurement network) and no new constraint on development is imposed by the Lamma Power Station.
5.9 Elevated Receptors
In Tables 5.1 - 5.6, the ground level concentrations predicted from the wind tunnel tests were used. It was checked, however, that the similar conclusions would be drawn if the concentration at any height in the lowest 120m relative to local ground level were used. The reason is because maximum hourly and daily concentration are usually associated with high winds (usually about 15m/s). For such winds, the plume is blown down and is generally well mixed. Consequently the variation of concentration with height tends to be small, and maximum concentration tends to occur near the ground.
18
n 0 C C C C C C C C C C n '~/ C C) n '-- /
() () o o o o o 0 o o o o o o o o 0 o
- ---- ----
HOURLY CONCENTRATION NOT EXCEEDED ON MARGIN TO DEVELOPMENT
DEVELOPMENT AVERAGE MORE THAN ESTIMATED AQO DEVELOPMENT CONSTRAINT AREA 3 TIMES PER YEAR BACKGROUND PLAN AGAINST
Jlg/m3 PERCENT Jlg/m3
Jlg/m3 PERCENT REQUIREMENT
OFAQO OFAQO
KENNEDY TOWN 373 47 95 332 42 R, G/IC, C, I, Route 7 No new constraints and GB
MOUNT DAVIS 434 54 95 271 34 GIIC No new constraints
CENTRAL 206 26 95 499 62 C and G/IC No new constraints
POK FU LAM 391 49 95 314 39 R, G/IC, Route 7 and GB No new constraints
-'-0 MID-LEVELS WEST 235 29 95 470 59 R, GIIC and GB No new constraints
PEAK AREA 271 34 95 434 54 GB and R No new constraints
ABERDEEN 176 22 95 529 66 GB, G/IC, R, LI and H No new constraints
AP LEI CHAU 169 21 95 536 67 GB,_ GIIC, R, LI and H No new constraints
N.E. LAMMA 443 55 95 262 33 CCA,A,VDA No new constraints ISLAND
Table 5.1 Hourly Averages, SCh (AQO = 800/Lg/m3)
True background concentration is expected to be less than the indicated values
n 0 0 0 0 0 0 0 0 0 0 0 0 0 0 0 0 n 0 0 0 0 0 0 0 000 000 000
N o
DEVELOPMENT AREA
KENNEDY TOWN
MOUNT DAVIS
CENTRAL
POK FU LAM
MID-LEVELS WEST
PEAK AREA
ABERDEEN
AP LEI CHAU
N.E. LAMMA ISLAND
DAILY CONCENTRATION NOT EXCEEDED ON MARGIN TO DEVELOPMENT
AVERAGE MORE THAN ESTIMATED AQO DEVELOPMENT CONSTRAINT ONCE PER YEAR BACKGROUND PLAN AGAINST
I'g/m3 PERCENT I'g/m3
I'g/m3 PERCENT REQUIREMENT
OF AQO OF AQO
125 36 33 192 55 R, GIIC, C, I, Route 7 No new constra,ints and GB
147 42 33 170 49 G/IC No new constraints
57 16 33 260 74 C and G/IC No new constraints
105 30 33 212 61 R, G/IC, Route 7 and GB No new constraints
65 19 33 252 72 R, GIIC and GB No new constraints
68 19 33 249 71 GB and R No new constraints
36 10 33 281 80 GB, G/IC, R, LI and H No new constraints
34 10 33 283 81 GB, G/IC, R, LI and H No new constraints
72 21 33 245 70 CCA,A,VDA No new constraints
Table 5.2 Daily Averages, SOz (AQO = 350!-,g/m3)
True background concentration is expected to be less than the indicated values

o o
N ~
" \~~ c o c o o
DEVELOPMENT AREA
KENNEDY TOWN
MOUNT DAVIS
CENTRAL
POK FU LAM
MID-LEVELS WEST
PEAK AREA
ABERDEEN
AP LEI CHAU
N.E. LAMMA ISLAND
o o o o o 0 o 0 o o o 0 o o o o 0 o 0 o o o o o o o
YEARLY AVERAGE MARGIN TO DEVELOPMENT CONCENTRATION ESTIMATED AQO DEVELOPMENT CONSTRAINT
Jlg/m3 BACKGROUND Jlg/m3 PLAN AGAINST
PERCENT Jlg/m3 PERCENT REQUIREMENT OF AQO OF AQO
16 20 17 47 59 R, G /1 C, C, I, Route 7 No new constraints and GB
19 24 17 44 55 G/IC No new' constraints
7 9 15 58 73 C and GIIC No Dew constraints
12 15 13 55 69 R, GIIC, Route 7 and GB No Dew constraints
9 11 17 54 68 R, G/IC and GB No new constraints
9 11 17 54 68 GB and R No new constraints
3 4 13 64 80 GB, GIIC, R, LI and H No new constraints
2 3 14 64 80 GB, G/IC, R, LI and H No Dew constraints
8 10 13 59 74 CCA,A, VDA No new constraints
Table 5.3 Annual Averages, S02 (AQO = 80/Lg/m3)
True background concentration is expected to be less tban tbe indicated values
n 0 0 0 COO 0 0 0 000 0 0 0 0 000 0 0 0 0 0 0 0 0 0 0 0 0 0
HOURLY CONCENTRATION NOT EXCEEDED ON MARGIN TO DEVELOPMENT
DEVELOPMENT AVERAGE MORE THAN ESTIMATED AQO DEVELOPMENT CONSTRAINT AREA 3 TIMES PER YEAR BACKGROUND PLAN AGAINST
p.g/m3 PERCENT p.g/m3
p.g/m3 PERCENT. REQUIREMENT
OF AQO OF AQO
KENNEDY TOWN 112 37 80 108 36 R, GIIC, C, I, Route 7 No Dew constraints and GB
MOUNT DAVIS 131 44 80 ,
89 30 G/IC No new constraints
CENTRAL 47 16 461 -208 -69 C and G/IC No new constraints
POK FU LAM 118 39 80 102 34 R, GIIC, Route 7 and GB No new constraints
~ MID-LEVELS WEST 72 24 268 -40 -13 R, G/IC and GB No new constraints
PEAK AREA 83 28 80 137 46 GB and R No Dew constraints
ABERDEEN 54 18 80 166 55 GB, G/IC, R, LI and H No Dew constraints
AP LEl CHAU 51 17 80 169 56 GB, G/lC, R, LI and H No new constraints
N.E. LAMMA 87 29 80 133 44 CCA,A,VDA No Dew constraints ISLAND
"------- -----
Table 5.4 Hourly Averages, NOz (AQO = 300/-tg/m3)
True background concentration is expecte9 to be less than the indicated values
n r 0 000 C COO n n 0 0 0 0 0 0 0 0 0 0 0 0 000 0 000 000
N w
DEVELOPMENT AREA
KENNEDY TOWN
MOUNT DAVIS
CENTRAL
POK FU LAM
MID-LEVELS WEST
PEAK AREA
ABERDEEN
AP LEI CHAU
N.E. LAMMA ISLAND
DAILY CONCENTRATION NOT EXCEEDED ON MARGIN TO DEVELOPMENT
AVERAGE MORE THAN ESTIMATED AQO DEVELOPMENT CONSTRAINT ONCE PER YEAR BACKGROUND PLAN AGAINST
",g/m3 PERCENT ",g/m3
",g/m3 PERCENT REQUIREMENT
OFAQO OF AQO
34 23 53 63 42 R, GIIC, C, I, Route 7 No new constraints and GB
44 29 53 53 35 GIIC No new constraints
16 11 317 -183 -122 C and GIIC No new constraints
32 21 53 65 43 R, GIIC, Route 7 and GB No new constraints
23 15 185 -58 -39 R, GIIC and GB No new constraints
25 17 53 72 48 GB and R No new constraints
12 8 53 85 57 GB, GIIC, R, LI and H No new constraints
10 7 53 87 58 GB, GIIC, R, LI and H No new constraints
17 11 53 80 53 CCA,A, VDA No new constraints
Table 5.5 Daily Averages, N02 (AQO = 150jtg/m3)
True background concentration is expected to be less than the indicated values

(\ (1 (\ C (\ C (\ 0 0 (! o (1 0 0 0 o (I '-_/
I) o o o o o 0 o o o
N ....
DEVELOPMENT AREA
KENNEDY TOWN
MOUNT DAVlS
CENTRAL
POK FU LAM
MID-LEVELS WEST
PEAK AREA
ABERDEEN
AP LE! CHAU
N.E. LAMMA ISLAND
- - - - - ---
YEARLY AVERAGE MARGIN TO CONCENTRATION ESTIMATED AQO DEVELOPMENT
p.g/m3 BACKGROUND p.g/m3
PLAN PERCENT p.g/m3 PERCENT OFAQO OF AQO
5 6 50 25 31 R, G/IC, C, I, Route 7 and GB
6 8 50 24 30 G/lC
2 3 60 18 23 C and G/lC
4 5 40 36 45 R, G/!C, Route 7 and GB
3 4 50 27 34 R, G/lC and GB
3 4 50 27 34 GB and R
1 1 43 36 45 GB, G/lC, R, Ll and H
1 I 43 36 45 GB, G/lC, R,Ll and H
2 3 43 35 44 CCA,A,VDA
---------
Table 5.6 Annual Averages, N02 (AQO = 80/-tg/m3)
True background concentration is expected to be less than the indicated values
o o o o n ,_J o o
DEVELOPMENT CONSTRAINT
AGAINST REQUIREMENT
No new constraints
No new constraints
No new constraints
No new constraints
No new constraints
I
No new constraints
No new constraints
No new constraints
No new constraints

n 0 0 ( 000 0 0 0 n n 0 0 0 0 0 n 0 0 000 0 0 0 0 0 0 0 0 000
N VI
HOURLY WORST CASE MARGIN TO DEVELOPMENT POWER STATION . ESTIMATED AQO DEVELOPMENT DEVELOPMENT
AREA POLLUTION BACKGROUND PLAN CONSTRAINT
I'g/m3 I'g/m3 p.g/m3
AGAINST PERCENT PERCENT REQUIREMENT OF AQO OF AQO
KENNEDY TOWN 193 24 98 509 64 R, G/IC, C, I, Route 7 No new constraints and GB
MOUNT DAVIS 235 29 98 467 58 G/IC No new constraints
CENTRAL 84 11 98 618 77 C and GIIC No new constraints ,
POK FU LAM 115 14 98 587 73 R, GIIC, Route 7 and GB No new constraints
MID-LEVELS WEST 98 12 98 604 76 R, G/IC and GB No new constraints
PEAK AREA 93 12 98 609 76 GB and R No new constraints
ABERDEEN 70 9 98 632 79 GB, G/IC, R, Ll and H No new constraints
AP LEI CHAU 26 3 98 676 85 GB, G/IC, R, Ll and H No new constraints
N.E. LAMMA 33 4 98 669 84 CCA,A, VDA No new constraints ISLAND
Table 5.7 Maximum hourly concentration of S~ at the most commonly occurring wind speed (5.4m/s). (AQO = 800",g/m3)
n r C C C C Coo (I 0 0 0 0 0 n (I (j 0 0 0 0 0 0 0 0 0 0 0 0 ') () 0 0
N 0>
HOURLY WORST CASE MARGIN TO DEVELOPMENT POWER STATION ESTIMATED AQO DEVELOPMENT DEVELOPMENT
AREA POLLUTION BACKGROUND PLAN CONSTRAINT
p.g/m3 p.g/m3
p.g/m3 AGAINST
PERCENT PERCENT REQUIREMENT OF AQO OFAQO
KENNEDY TOWN 57 19 116 127 42 R, G/IC, C, I, Route 7 No new constraints and GB
MOUNT DAVIS 70 23 116 114 38 G/IC No new constraints
CENTRAL 31 IO 448 -179 -149 C and G/IC No new constraints
POK FU LAM 35 12 116 149 50 R, G/IC, Route 7 and GB No new constraints
MID-LEVELS WEST 38 13 282 -20 -7 R, G/IC and GB No Dew constraints
PEAK AREA 37 12 116 147 49 GB and R No new constraints
ABERDEEN 24 8 116 160 53 GB, G/IC, R, LI and H No new constraints
AP LEI CHAU IO 3 116 174 58 GB, G/IC, R, LI and H No new constraints
N.E. LAMMA 9 3 116 175 58 CCA,A,VDA No new constraints ISLAND
--_.- -
Table 5.8 Maximum hourly concentration of N02 at the most commonly occurring wind speed (S.4m/s). (AQO = 300p.g/m3)
o o o o o o o o o o o o o o o o c' c o o o c c o c o o
L
C
C
C
C
6. IMPACT OF DEVELOPMENT PLANS ON POWER STATION CONFIGURATION
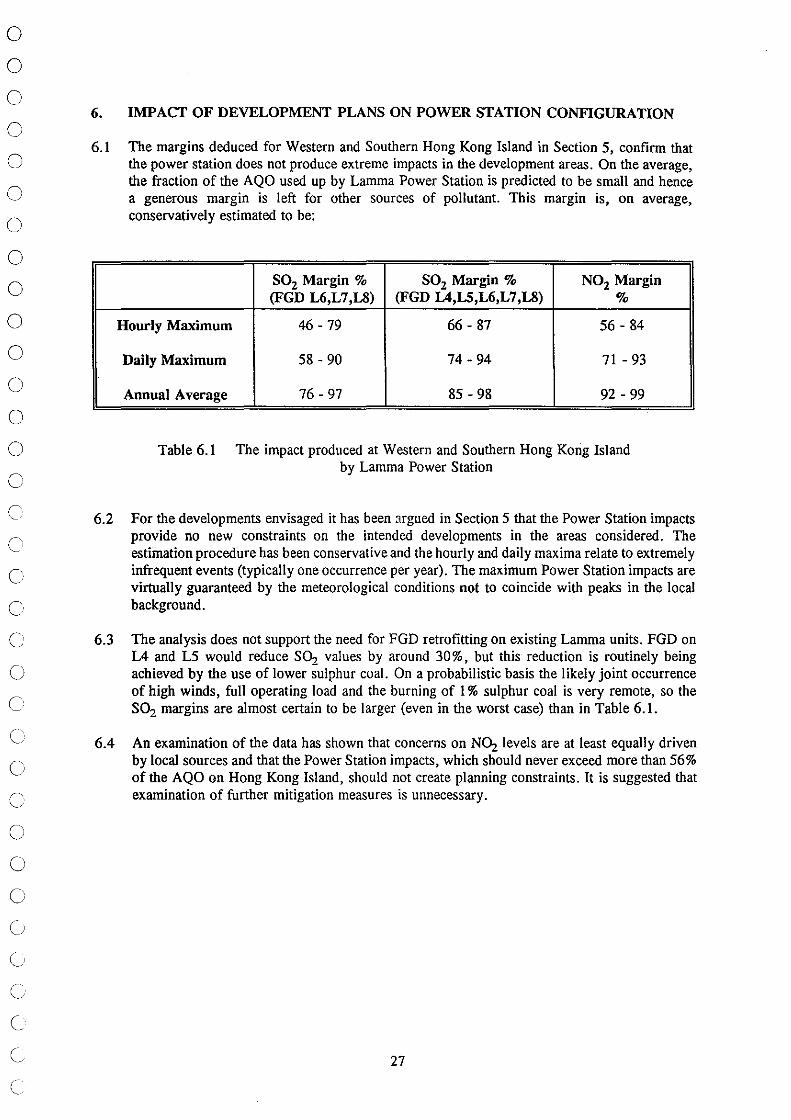
6.1 The margins deduced for Western and Southern Hong Kong Island in Section 5, confirm that the power station does not produce extreme impacts in the development areas. On the average, the fraction of the AQO used up by Lamma Power Station is predicted to be small and hence a generous margin is left for other sources of pollutant. This margin is, on average, conservatively estimated to be:
SOz Margin % SOz Margin % NOz Margin (FGD L6,L7,LS) (FGD L4,LS,L6,L7,LS) %
Hourly Maximum 46 - 79 66 - 87 56 - 84
Daily Maximum 58 - 90 74 - 94 71 - 93
Annual Average 76 - 97 85 - 98 92 - 99
Table 6.1 The impact produced at Western and Southern Hong Kong Island by Lamma Power Station
6.2 For the developments envisaged it has been 3rgued in Section 5 that the Power Station impacts provide no new constraints on the intended developments in the areas considered. The estimation procedure has been conservative and the hourly and daily maxima relate to extremely infrequent events (typically one occurrence per year). The maximum Power Station impacts are virtually guaranteed by the meteorological conditions not to coincide with peaks in the local background.
6.3 The analysis does not support the need for FGD retrofitting on existing Lamma units. FGD on L4 and L5 would reduce SOz values by around 30%, but this reduction is routinely being achieved by the use of lower sulphur coal. On a probabilistic basis the likely joint occurrence of high winds, full operating load and the burning of 1 % sulphur coal is very remote, so the S02 margins are almost certain to be larger (even in the worst case) than in Table 6.1.
6.4 An examination of the data has shown that concerns on NOz levels are at least equally driven by local sources and that the Power Station impacts, which should never exceed more than 56% of the AQO on Hong Kong Island, should not create planning constraints. It is suggested that examination of further mitigation measures is unnecessary.
27

o o o o o o o o o o o o o o
o c c c c c
c c c o o ()
o o o o c c
7. REFERENCES
1. Hong Kong Electric Company "Environmental Impact Assessment (EIA) Study for Units L 7 and L8 at Lamma Power Station." Initial Assessment Report, December 1990.
2. BMT Fluid Mechanics Limited "The Hong Kong Electric Company Limited Lamma Power Station EIA for Units L7 & L8: Wind. Tunnel Assessment of Air Quality." April 1991.
28

Figure
o o c c c c' o o o o o o o o c c c c c c c c c c c o c c
c C
l.
C
C.
/
.,...././ C3 -' -' KAU YI CHAlJ
-' -'
-' / CHAU KUNG ISlAND
!J0
I HE! UNG CHAU I
\ \ ,
\. \.
\. \.
" "
8,2
-------
8,1
-----8.5 KM RADIUS
1 (196.5' )
Figure 3,1.1
2 (21J')
-'
"
/ -'
3 (223')
....
/
\. \.
\.
HONG KONG ISlAND
\. \
5,4'
\:>,
4 (248')
5 (271') lIGAN CHAlJ ,
/ /
/
I I
7 (325')
Map showing study area, wind angles and sensor locations.

o o c o c o o o o o o o o o o o c c o o c c c c c o o o o c o o c (
Figure 3.1.2
CHING CHAU
C3 KAU YI CHAU
p JOg
9573 9J89 14
CHAU KUNG ISlAND IKJNC KONG
a 9502 9 ISWlD 327
5$l 9
JO.l
216
I£J ~CHAU
~ 9 578 \),
297 <& c3 <& 287 4SO <& NGAN CHAU 605
:182
8.5 KM RADIUS
Maximum hourly 802 concentrations for July 1994 (Bl, B2) at ground level

o o
o o o o o o o o o o o
c c c c c ()
c c c c o o ()
o c c c c c
C3 KAlJ YI CHAIJ
CHAIJ KUNG ISLIND
~a
8.5 KM RADIUS
153
@soo
574
210
@
205
Figure 3.1.3.
HONG KONG ISlAND
(;> NGAN CHAIJ
Maximum hourly S02 concentrations for July 1994 (B1, B2) at 30m
o o o o
o o o o o o o o o o c o c o c o o c o c o o o ()
C
o C
C
C
18 MAR 1982
8410
8.5 KM RADIUS
8421
8 164
Figure 3.1.4
HONG KONG ISlAND
C> NG.IN CIW!
Maximum hourly S02 concentrations for July 1994 (B1, B2) at 60m
o o o c o o o o o o o o o o o
c c c (
c (
c o C'
o ()
o c c c c c c
Figure 3.1.5
8.5 KM RADIUS
Maximum hourly S02 concentrations for July 1994 (Bl, B2) at 90m
HONG Kale ISINO
o o c
o o o o o o o o o o o o c c o o o c c o o o
OWlKUNG~O
r--T--.O
CHiNe OWl
D
8.5 KM RADIUS
411 121
Figure 3.1.6
HONG KONG ISlANO
Maximum hourly 802 concentrations for July 1994 (Bl, B2) at 120rn

o o c c' c c o o o o c ()
o ()
o c (
c c c
c c c c c c c c (
l
l
(
l
CHAIJ KUNC ISLINO
~a
• 480 • J34
CHING CHAlJ
D
• 623
.840
8.5 KM RADIUS
FIGURE 3.1.7
Maximum hourly S02 concentrations for July 2000 (Tl, T4) at ground level
o o o o o o o o o o o o o o o c o o o c o o o o o o o o o c c c c c
Figure 3.1.8
153
9411 9560
HONG KONG 95.JO ISlANO
9 209
220
~ \1
C> NGAN CHAU
8.5 KM RADIUS
Maximum hourly S02 concentrations for July 2000 (Tl, T4) at 30m
o o o o o o o o o o o o o o o o c o o o o o o o c o c o o c c c c c
C3 KAIJ Yl CHAU
CHAU KUNC ISlAND
-----,--0
CHiNe CHAU
D
8.5 KM RADIUS
«>500
552
210
«> 168
Figure 3.1.9
HONG KONG ISlAND
C;> NGAN CHAU
Maximum hourly 802 concentrations for July 2000 (Tl, T4) at 60m
o o c c o o o o o o o o o o o o o o c o o o c o o o o o (j
(j
o
c
C3 KAU"II CIWJ
CIWJ KUNC ISlAND
~a
CHING CIWJ
P
8.5 KM RADIUS
153
200
o 141
Figure 3.1.10
HONG KONG ISlAND
\> NGm CfWJ
Maximum hourly S02 concentrations for July 2000 (Tl, T4) at 90m
o o
c c o o o o o o o o o
c c c c c c c c c o o o c
c c c c c
CHAU KUNG ISlAND
~a
CHING CHAU
C> 162
0.193 0.15 0~
8.5 KM RADIUS
0.70
o 123
Figure 3.1.11
HONG KONG ISlAND
C> NGAN CHAU
Maximum hourly S02 concentrations for July 2000 (Tl, T4) at 120m
o o o o o o o o o o o o o o o o c c c c c o o o o o o o c o C
G
C
C
Figure 3.1.12
ClIING CHAlJ C] 0 325 KAU'I1 CHAlJ
<8355 12
CHAlJ KlmG ISlAND HONG KONG
0 <8 ISlAND
290 <8
276
196
~ <8504 \I,
CHEUNG CHAlJ 267
<8 e
r3 <8 274 403 <8 NGIN CHAlJ 461
329
8.5 KM RADIUS
Maximum hourly S02 concentrations for July 2000 (TI, T5) at ground level
o o o o o o o o o o o o o o o o c c o o ()
o o o o o o
o c o
c c
CIllNG CHAIJ
Cl
ell1 e~
8.5 KM RADIUS
9450
416 e
184
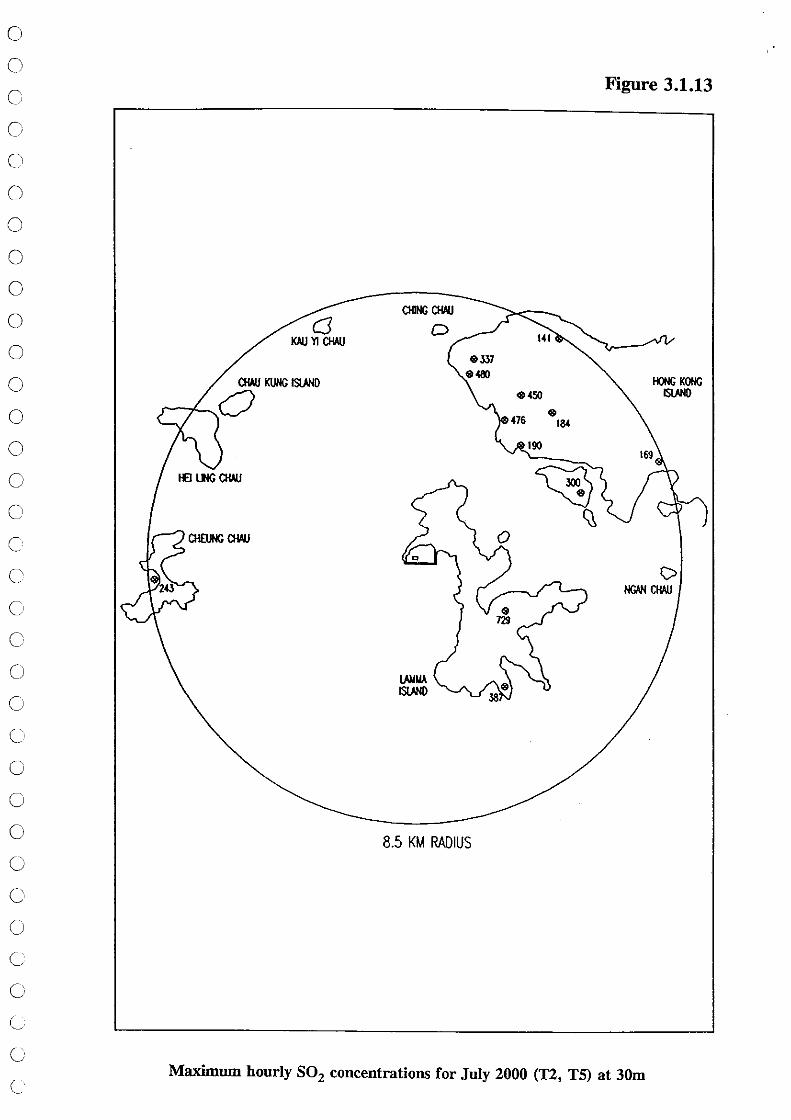
Figure 3.1.13
HONG KO!lG IS~O
C> NGIoN CHAU
Maximum hourly S02 concentrations for July 2000 (1'2, TS) at 30m
o o
o o o o o o o o o o o o o c o o o o o c o o o o o o o ()
c
CIWJ KUNG ISLIND
r--r--..O
CHING CIWJ
P
8.5 Kt.! RADIUS
<8> 420
<8> 144
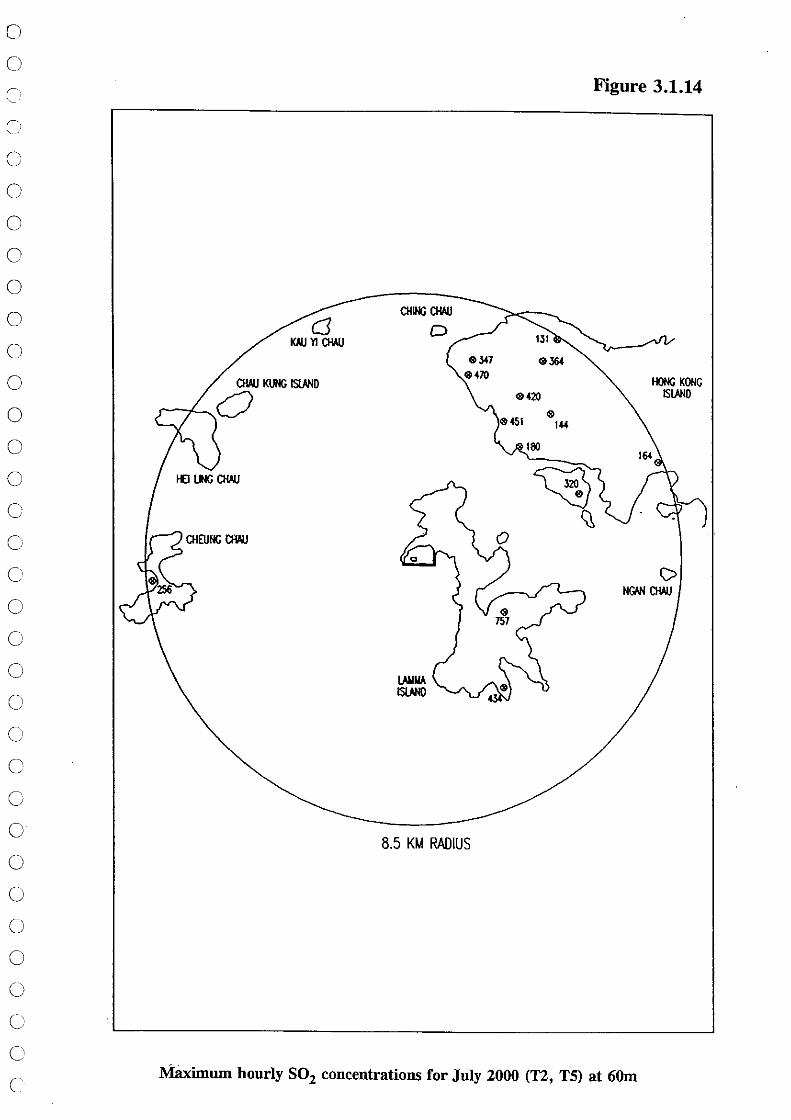
Figure 3.1.14
HONG KONG ISlAND
Maximum hourly S02 concentrations for July 2000 (T2, T5) at 60m
o o c c c o o o o o o o o o o o c C'
"
c c
c
G
C
C
G
C
c c c c c
CIWJ KUNC ISlAND
r----f'-. a
CHING CIWJ
o
85 KM RADIUS
180
41> 120
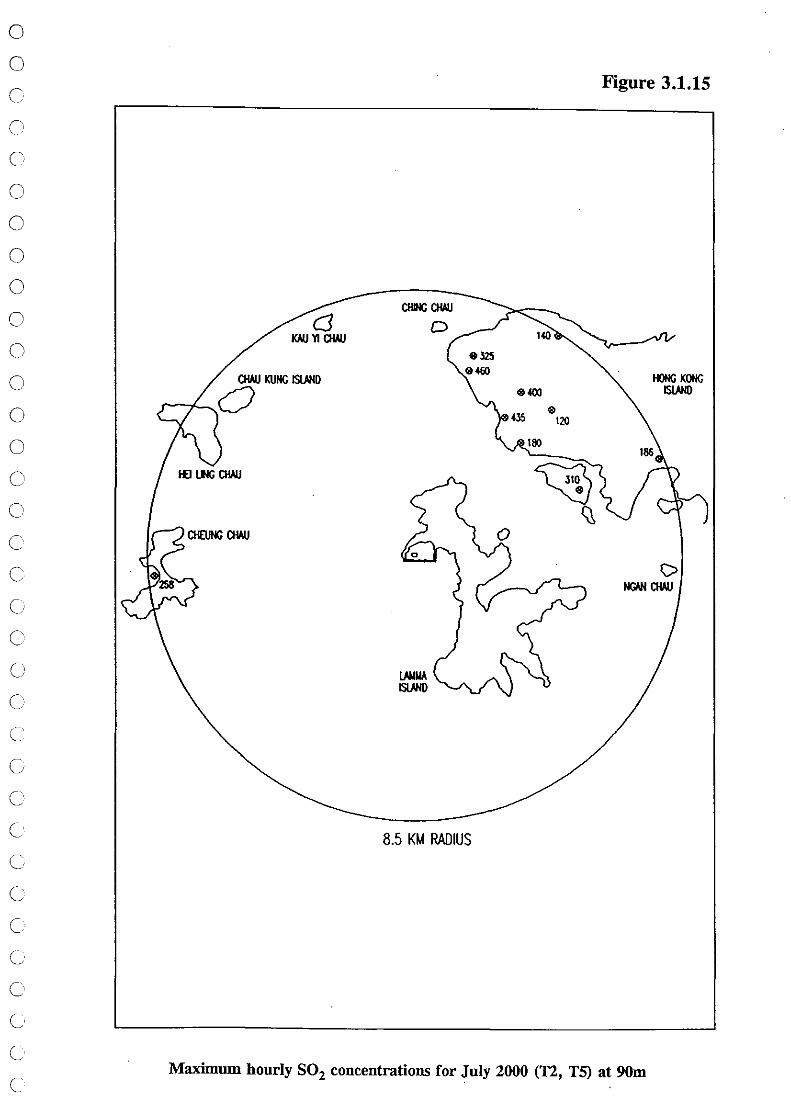
Figure 3.1.15
HONG KONG ISlAND
C> NC.IN CIWJ
Maximum hourly S02 concentrations for July 2000 (T2, T5) at 90m
o
o o o o o o o o o
c c o o o o c o o o o o o c o c
c
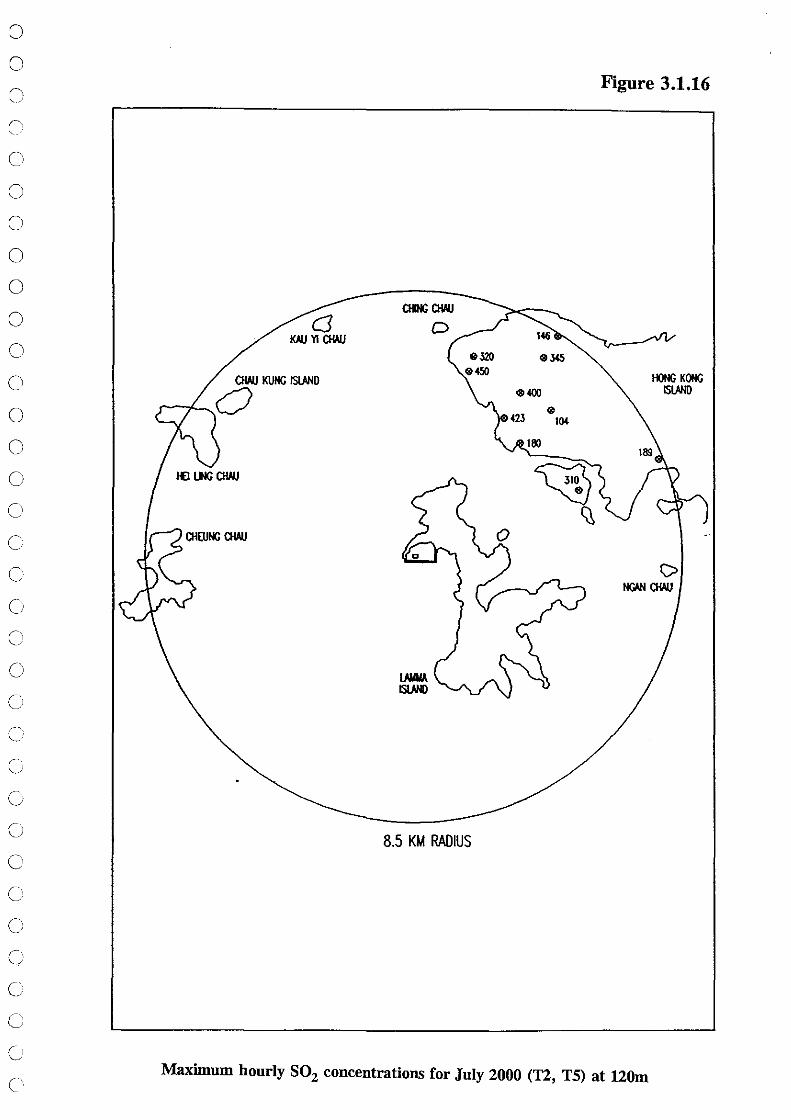
Figure 3.1.16
146 C3
100 YI CHAU
0345
CHAUKUNC~D 0450
HONG KONG 0400 ISlAND
0 ~a 104
~ \),
(> NGNl CHAU
8.5 KM RADIUS
Maximum hourly S02 concentrations for July 2000 (1'2, T5) at 120m
o o ~,
o o o o o o o o o o o o o c o C'
o C
C
o C
o o o o o o c c c
CIWJ KUHG ISlAND
r----A-..O
08 J17
08 206
ClUNG CIWJ (:)
08 277
0857J
8.5 KM RADIUS
395
08287 I
164
08 230
08 228
Figure 3.1.17
HONG KONG ISlAND
218
cJ NG\N CHAU
Maximum hourly 802 concentrations for July 2000 (T3, T6) at ground level

o o o o o o o o o o o o o o o o c c o o c o c c c
()
c C
Q
C
C
C
C
CHAU KUNG ISlNIO
~O
8.5 KI.I RADIUS
127
• 155
Figure 3.1.18
I«JNG KONG ISlNIO
Maximum hourly S02 concentrations for July 2000 (T3, T6) at 30m

o o c o o o o o o o o o o o o o c c o c o o c c o o o c c c o o o c
Figure 3.1.19
8.5 KIA RADIUS
Maximum hourly S02 concentrations for July 2000 (T3, T6) at 60m
HOt«: KONG ISlAND
o o
r. "-- "'
o o o o o o c c c' c c c c c (
c (
C
u c c C
l
l
l
C
C3 100 YI CHAU
CHAU KUNG ISlAND
r---r-..O
CHIt«; CIWJ
D
8.5 KM RADIUS
Figure 3.1.20
IfJNC KONG ISlAND
C> NGAN CIWJ
Maximum hourly S02 concentrations for July 2000 (T3, T6) at 90m

o o c c o o o o o o o o o o o C)
c o o
cJ KAU VI CHAU
CHAU KUNG ISlAND
~a
CHING CHAU
D
&237
&360
8.5 KM RADIUS
128
&265
&310
& 83
140
~ \1
Figure 3.1.21
HONG KONG ISlAND
C> NGIN CHAU
Maximum hourly S02 concentrations for July 2000 (T3, T6) at 120m
o o c c c o o o o o o
o
c c C'
C
C
C
C
C
C
C
C
C
o C
G
C
C
C
G
C
C3 K.IlJ VI CIWI
• 74
8.5 KM RADIUS
.100 J6
• 83
Figure 3.1.22
HONG KONG 1S1NID
.Maximum hourly N02 concentratious for Iuly 1994 (Bl, B2) at ground level
:]
J
J
J
:J
:J
Cl
c C'
.'
c Cl
Cl
C
o o Cl
o o c c o c c c
CH.\U K\JNG ISL\IIO
r---r---..O
8.5 KI.I RADIUS
Figure 3.1.23
10«: KONG ISlANO
Maximum hourly N02 concentrations for July 1994 (Bl, B2) at 30m
o o c ()
o o o o o o o o o o c o o c o o o o C
G
C
o o o o o o c o c
8.5 KM RADIUS
Figure 3.1.24
IfJNG KONG ISlAHO
Maximum hourly N02 concentrations for July 1994 (Bl, B2) at 60m
o o c c c o o o o o o o o o c o o o o o o o o c o c G
G
Cl
G
G
C
CItHG CIWJ
o
8.5 KM RADIUS
Figure 3.1.25
HOt«: KONG WHO
Maximum hourly N02 concentrations for July 1994 (Bl, B2) at 90m

o o c c c ()
o o o o o o o o c c c c c c c c
o o
o G
C
C
C
C
C
Figure 3.1.26
8.5 KM RADIUS
Maximum hourly NOz concentrations for July 1994 (Bl, B2) at 120m
o o c c c o o o o o c o o c o o c c c c c c C
G
G
C
o o C) C
G
C
C
C
C3 KAU'I1 CIWJ
CIWJ KUNG ISIJND
r---r-...O
o 135
o 94
o 117
0179
0192
8.5 KM RADIUS
0125 42
0166
0193 o
93
o 101
Figure 3.1.27
HONe KONG ISlAND
91
r3 NGAN CIWJ
136
Maximum hourly NOz concentrations for July 2000 (Tl, T4) at ground level

o o c c c c o o o o o o o o o c c c o c ()
c C
G
G
G
G
C
C
C
C
C
C
8.5 KM RADIUS
Figure 3.1.28
10«: KONG ISlAND
Maximum hourly N02 concentrations for July 2000 (T!, T4) at 30m
o o c c o c o o o o o o o o o
c o o o o o c o G
G
CHHC CIWJ
D
8127
8.5 Kt.! RADIUS
Figure 3.1.29
8135
Maximum hourly N02 concentrations for July 2000 (Tl, T4) at 60m

o o c c c c o o o o o o o o o o c c c c c c c c c o c c c c' c c c c
CIWJ KUtli ISLIHO
r--.t-O
ClltIi CIWJ
P
8121
8.5 KM RADIUS
• 40
Figure 3.1.30
I()t(; KOtIi ISLIHO
Maximum hourly N02 concentrations for July 2000 (TI, T4) at 90m
o o c c c c' c o o o c o o o c o c c o c c c c c c c c c c c c c c c
Figure 3.1.31
c3 100 'tI OWl
8.5 KIA RADIUS
Maximum hourly N02 concentrations for July 2000 (T1, T4) at 120m

o o
o o o o o o o o o o o o c c c c C
G
C
C
C
C
C
o C
G
C
C
C
C
C
APPENDIX A
Interpolation or Maximum Concentrations at Elevated Positions
In response to a request from EPD, measured vertical concentration profiles were used as a basis for interpolation of the concentration at a number of locations at which only ground level concentrations had been measured.
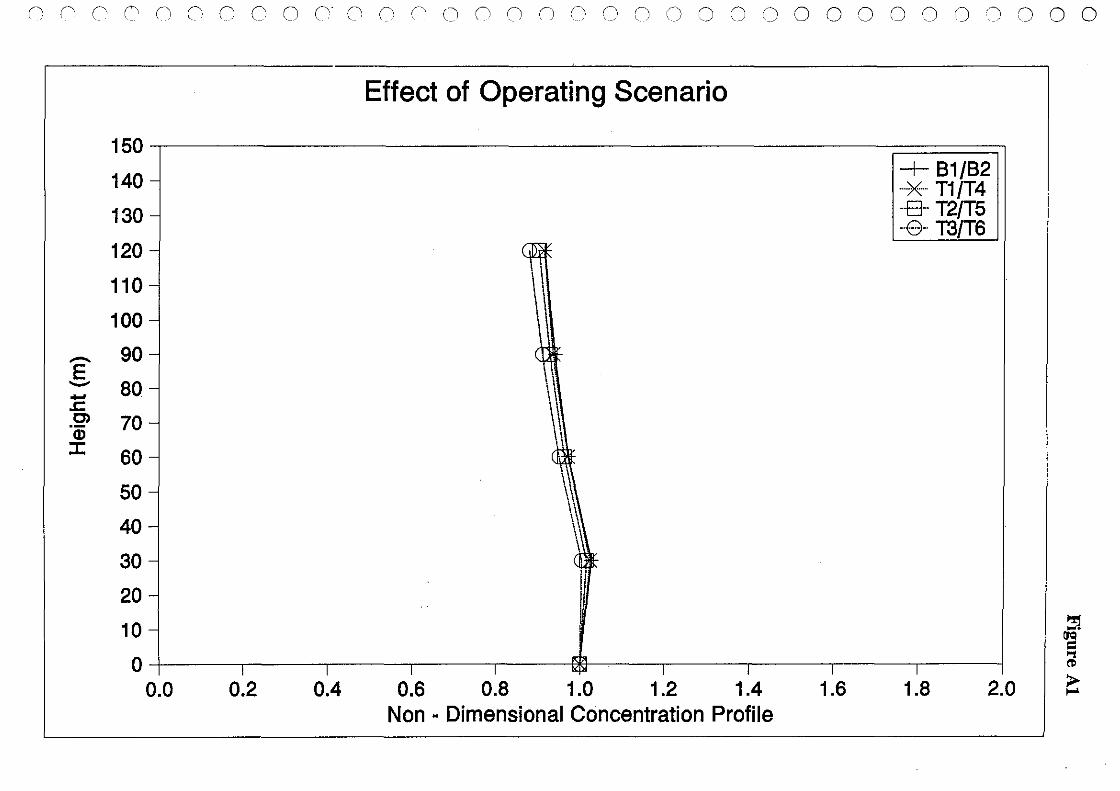
Figure Al shows the vertical concentration profile for the 4 different operating scenarios nondimensionalised by the ground level concentration. The profiles are at Sensor 2,3 and the wind speed is ISm/s. It is clear that there is little variation between the concentration profiles for the different conditions. The figure is an illustrative example. The same behaviour was evident at other wind speeds and locations.
On the basis of this conclusion it is necessary to establish the concentration profile for only one operating condition for each location and wind speed, as the same profile could be used for the other conditions.
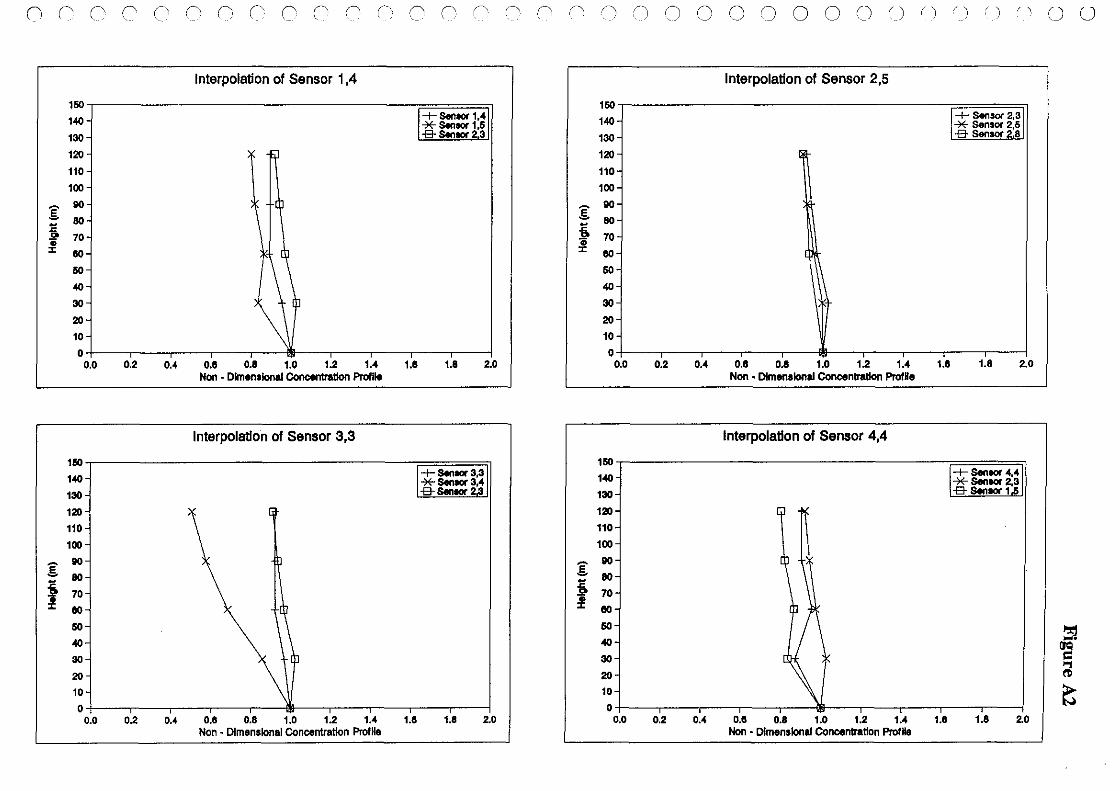
The interpolated concentration profiles are presented in Figure A2. In the interpolation of the concentration profiles allowance was made for downwind distance and local topography. The measured profiles in Figure A2, are illustrative of similar profiles to those interpolated, but do not form the basis of the interpolation. As a function of downwind distance all measured elevated profiles were converted to a non-dimensional form and used asa reference set for the interpolation. On a judgemental basis profiles measured on terrain dissimilar to the sensor under study, were eliminated in producing the interpolated values.
In terms of absolute values precise downwind distance and topography were automatically included at ground level, as each interpolated profile had a ground level measurement. Using the ground level concentration measurements at the locations of the interpolated non-dimensional concentration profiles, estimates of the elevated concentration could be made.
Due to the nature of the interpolations it is difficult to be systematic in assessing the accuracy of the interpolations. A judgement made from examining the profiles presented in Figure A2 would suggest that the profile for Sensors 1,4, 3,3 and 4,4 are accurate to ± 10% and Sensor 2,S accurate to ±S%.
App A
n n non G G 0 0 G n n G 0 G 0 n 0 0 0 0 0 000 0 0 0 0 0 0 000
-E -+-' J:: C> Q)
J:
150
140 -
130 -
120 -
110 -
100 -
90 -
80 -
70 -
60 -
50 -
40 -
30 -
20 -
10 -
o _ 0.0
I I
0.2 0.4
Effect of Operating Scenario
G
( t-
\ \ \ d~ ~ '\ \1
\\ q~
~
I I ~. I I
0.6 0.8 1.0 1.2 1.4 Non - Dimensional Concentration Profile
-j- 81/82 --x-- T1/T4 -B-- T2/T5 --e-- T3/T6
I
I I I
1.6 1.8 2.0
~ ~ "'I (!)
e
n n 0 C n c n r 0 r r n n n n n n n n o 0 0 0 0 0 (J () ( ) (j () 'i CJ U
Interpolation of Sensor 1,4 Interpolation of Sensor 2,5
150 ::j 140 I:-+- s.n"", 1,4 I-+- Sensor 2,3 *s.n..,1.6 "* Sensor 2,5
130 -8-s.n.., 23 130 -8- Sensor 2.8
120 120 I 110 110
100 100
E 90 E 90
l: eo - eo
~
~ 70 ~ 70 J:: eo ~ J:: 80
50- 50
40 40
30
\~ p 30
20- 20
10 10
0 0 0.0 0.2 0.4 0.8 0.' 1.0 1.2 1.4 1.0 1.8 2.0 0.0 0.2 0.4 0.8 0.' 1.0 1.2 1.4 1.0 1.8 2.0
Non • Olmonslonal Concontratton """1'- Non • DImensional Concentration ProIHe
Interpolation of Sensor 3,3 Interpolation of Sensor 4,4
160 160 j
140 140 [-+- Sen"", 4.4 '* Sen"", 2.3 130 130 -8- Sensor 1.6
120 120
110 110
100 100
E 90 - 90
eo .s. eo
t -70 ~ 70
80 J:: 80
60 60 ~
40 40 ~ 30 30 "1
20 20 tI>
10 10 ~ 0 0
0.0 0.2 0.4 0.8 0.8 1.0 1.2 1.4 1.0 1.8 2.0 0.0 0.2 0.4 0.8 0.8 1.0 1.2 1.4 1 .• 1.8 2.0 Non· Dimensional Concentration Profile Non • Dimensional Concentratlon ProIHa
o o c c c c c c o c o o o o o o c c c c o o c c c o c c c c c c c c
APPENDIXB
Detailed Response to EPD Comment on Plume Height Versus Downwind Distance
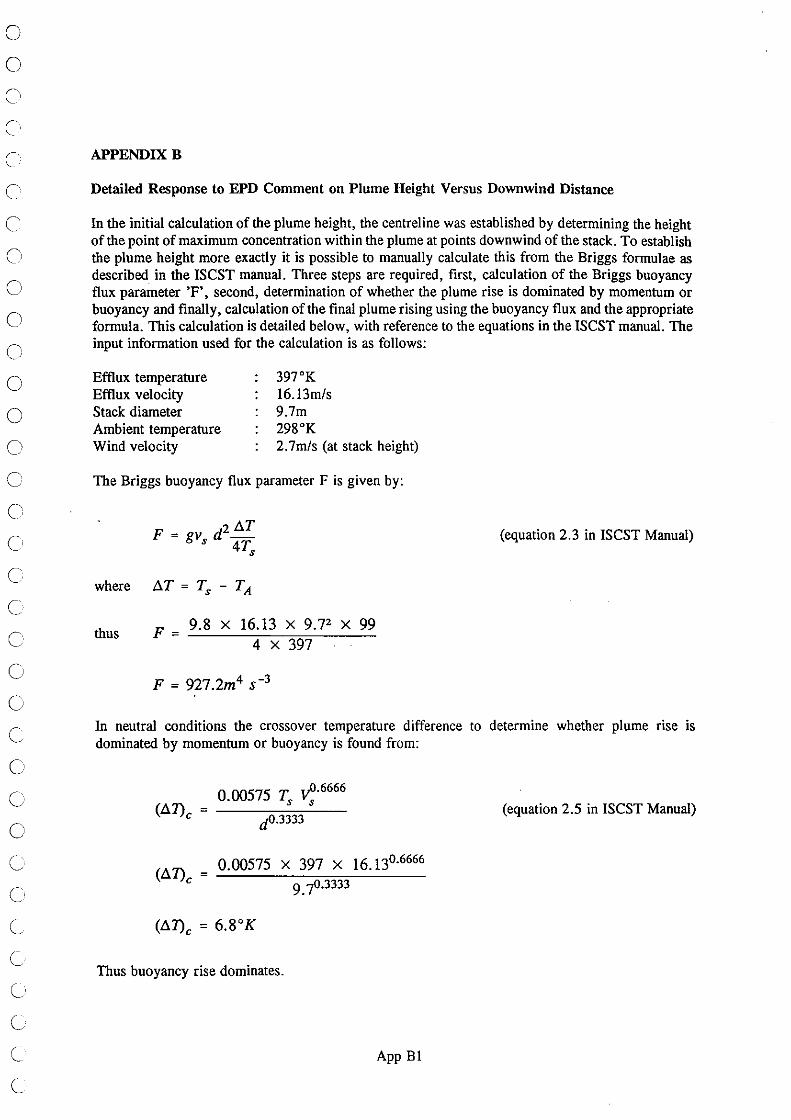
In the initial calculation of the plume height, the centreline was established by determining the height of the point of maximum concentration within the plume at points downwind of the stack. To establish the plume height more exactly it is possible to manually calculate this from the Briggs formulae as described in the ISCST manual. Three steps are required, first, calculation of the Briggs buoyancy flux parameter 'F', second, determination of whether the plume rise is dominated by momentum or buoyancy and finally, calculation of the final plume rising using the buoyancy flux and the appropriate formula. This calculation is detailed below, with reference to the equations in the ISCST manual. The input information used for the calculation is as follows:
Efflux temperature Efflux velocity Stack diameter Ambient temperature Wind velocity
397°K 16. 13m/s 9.7m 298°K 2.7m/s (at stack height)
The Briggs buoyancy flux parameter F is given by:
where
thus
2t:..T F=gv ds 4T s
F = 9.8 X 16.13 X 9.72 X 99 4 X 397
(equation 2.3 in ISCST Manual)
In neutral conditions the crossover temperature difference to determine whether plume rise is dominated by momentum or buoyancy is found from:
0.00575 Ts ~.6666
dO.3333
0.00575 X 397 X 16.13°·6666
9.7°·3333
Thus buoyancy rise dominates.
App B1
(equation 2.5 in ISCST Manual)
o o o o o o o o o o o o o o o o c o o o o o o o o o o c o G
o C
G
G
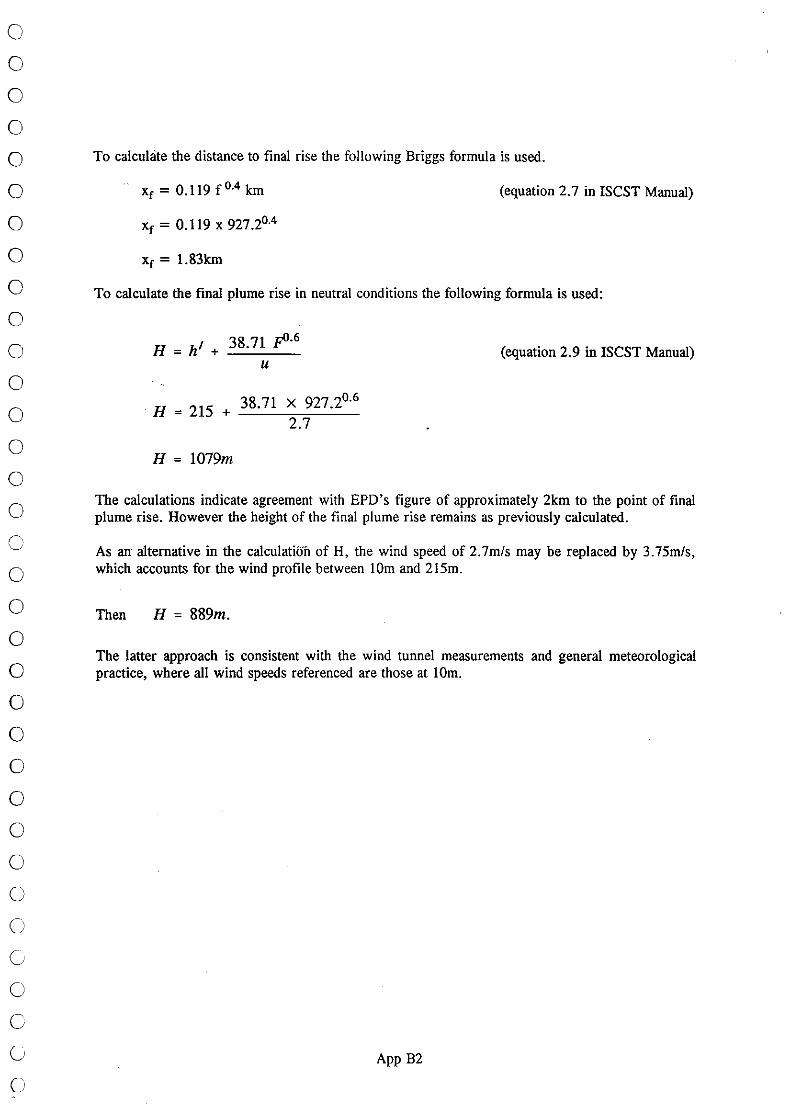
To calculate the distance to final rise the following Briggs formula is used.
Xf = 0.119 f°.4 km
xf = 0.119 x 927.2°.4
Xf = 1.83km
(equation 2.7 in ISCST Manual)
To calculate the final plume rise in neutral conditions the following formula is used:
H = h' + 38.71 jIl.6 u
38 71 X 927.2°·6 H = 215 + -.-~;:;----
2.7
H = 1079m
(equation 2.9 in ISCST Manual)
The calculations indicate agreement with EPD's figure of approximately 2km to the point of final plume rise. However the height of the final plume rise remains as previously calculated.
As an alternative in the calculati6il of H, the wind speed of 2.7m/s may be replaced by 3.75m/s, which accounts for the wind profile between 10m and 2l5m.
Then H = 889m.
The latter approach is consistent with the wind tunnel measurements and general meteorological practice, where all wind speeds referenced are those at 10m.
App B2

•
KENNEDY & DON KIN INTERNATIONAL LTD. 1301·1307, 13TH FLOOR, NEW TOWN TOWER, 10·18 PAK HOK TlNG STREET, SHATIN, N.T., HONG KONG. TELEPHONE: 6010822 TELEX: 45789 KDINT HX TELEGRAMS: KAYNDEE HX FACSIMILE: 6924527
A MEMBER OF THE KENNEOY & DONKIN GROUP
KENNEDY & DON KIN GENERATION AND INDUSTRIAL LTD. International Consulting Engineers CHATSWORTH HOUSE, 19 LEVER ST MANCHESTER M1 3LT, ENGLAND, TEL: 061 228 6282. TELEX: 668972 KD MAN G. FACSIMILE: 061 228 3031.
A member of the Kennedy & Oonkin Group Founded 1889 Registered in England No. 20600259 Registered Office: Westbrook Mills, Godalming, Surrey, GU7 U,;z..