W80819 759 - DTIC
373
**..'- NASA Conference Publication S035 Fart 1 Lai Siv li yi il i i^i i s.c* s #«j» *"*>"> .ffe ;=**k 'Rs^ '!*" J*' '*>*ä *=Sv«^ w» " ? pv *""^ i. ft .** ***^ "w* /*^fe ^ s ""^ *'• *** j>^ I i w y ;»'i iL^s i i Cxi i &-., ^ # 85 S! |'^ I 1 ^n«, «ys? 0T g% ff^ g*% ??% u -I (iASl-CP-3035-Pt-l) IISA/SD1C SSICI lITIBCHBtBIAL IÜICTS CM fllliUli-S BOSKSHCf, t-ISI 1 (VISA. langlej Bescatcfa Center) 356 p CSCt 11G HI/23 2)89 —t 1)89 Uoc 020 -23528 aao— -235«6 las 6372 gapwfwyyj»^»*''^ %mm.itwuii' MI|p^^t<i!l'W.^rg'>JW*» 4 ^ l r'«- - 1BTg* ""3 r? • k s. 3. / "*§% „."^S*" fanf i- nr- -' .... .... -.. -*.^.^«^--JJ ji&ii^Wr SbttJ? W80819 759 Proceedings of a workshop held at NASA Langley Research Center Hampton, Virginia June 28-July 1, 1988 o 4 PLEASE RETURN TO: V BMD TECHNICAL DMLUISllLI'MISU'lL't iit ft ££££ FS? Sh ORGANIZATION 7100 DEFENSE PENTAGON WASHINGTON D.C 20301-7100 Joo4i fc rf
-
Upload
khangminh22 -
Category
Documents
-
view
0 -
download
0
Transcript of W80819 759 - DTIC

■**..'-
NASA Conference Publication S035 Fart 1
Lai Siv li yi il i i^i i s.c* s
#«j» *"*>"> .ffe ;=**k 'Rs^ '!*" J*' '*>*ä *=Sv«^ w»
"? pv*""^ i. ft .** ***^ "w* /*^fe ^ s ""^ *'• *** j>^ I i w y ;»'i iL^s i i Cxi i &-.,
^ # 85 S! |'^ I1 ^n«, «ys? 0T g% ff^ g*% ??%
u
■-I
(iASl-CP-3035-Pt-l) IISA/SD1C SSICI lITIBCHBtBIAL IÜICTS CM fllliUli-S BOSKSHCf, t-ISI 1 (VISA. langlej Bescatcfa Center) 356 p CSCt 11G
HI/23
2)89 —t 1)89 Uoc 020
-23528 aao— -235«6 las 6372
■gapwfwyyj»^»*''^ %mm.itwuii' MI|p^^t<i!l'W.^rg'>JW*»4^lr'«--1BTg* ""3
r? • k s.
3. / "*§% ■„."^S*"
fanf i- nr- ■ ■ -' ■ ■....■■.... -.. -*.^.^«^--JJ ji&ii^Wr SbttJ?
W80819 759 Proceedings of a workshop held at
NASA Langley Research Center Hampton, Virginia
June 28-July 1, 1988
■ o
4 PLEASE RETURN TO:
VBMD TECHNICAL DMLUISllLI'MISU'lL't iit ft
££££ FS?
Sh ORGANIZATION 7100 DEFENSE PENTAGON
WASHINGTON D.C 20301-7100
Joo4i fcrf

NASA Conference Publication 3035 Part 1
IMASA/SDiO Space Environmental Effects
on Materials Workshop
Compiled by Louis A. Teichman and Bland A. Stein
NASA Langley Research Center Hampton, Virginia
Proceedings of a workshop jointly sponsored by the National Aeronautics
and Space Administration and the Strategic Defense Initiative
Organization, and held at NASA Langley Research Center
Hampton, Virginia June 28-JuIy 1, 1988
Office of Management Scientific and Technical
Information Division
1989
t
NASA National Aeronautics and %
Space Administration \
*. -A-***^:*^».* .TC^f- ~ „x- : £

4. CONTENTS
PREFACE "I
PART I
SECTION I - THE TUTORIALS
SESSION 1: Overview: Environments and Materials Effects Chairman: B. Stein - NASA Langley Research Center
Overview of Environmental Factors 5 C. K. Purvis - NASA Lewis Research Center
Structural Materials for Space Applications 25 Darrel R. Tenney - NASA Langley Research Center
Radiation Effects in Spacecraft Electronics 53 James P. Raymond - Mission Research -Corporation
Environmental Effects on Spacecraft Materials 75 J. W. Haffner - Rockwell International
Surface Treatment Using Metal Foil Liner 87 Ray Garvey - Oak Ridge National Laboratory
The Long Duration Exposure Facility Material Experiments 101 William H. Kinard and James L. Jones, Jr. - NASA Langley Research Center
SESSION 2: SPACECRAFT EXPERIENCE Chairman: J. Triolo - NASA Goddard Space Flight Center
Some Examples of the Degradation of Properties of Materials in Space 109 Frederick E. Betz and Joseph A. Häuser - Naval Research Laboratory
Trends in Environmentally Induced Spacecraft Anomalies 123 Daniel C. Wilkinson - National Oceanic and Atmospheric Administration
Returned Solar Max Hardware Degradation Study Results 133 Jack J. Triolo and Gilbert W. Ousley - Goddard Space Flight Center
EnviroNet: Space Environment for Strategic Defense Initiative Experiments 161 Michael Lauriente - NASA Goddard Space Flight Center
tpaper not available at time of publication. '|
i »^ ..»~*~*

SESSION 3: ATOMIC OXYGEN M,aArrnen: L- Le9er and J. Visentine NASA Lyndon B. Johnson Space Center
Environmental Definition of the Earth's Neutral Atmosphere i7a James T. Visentine - NASA Lyndon B. Johnson Space Cente? 179
Atomic Oxygon Effects on Materials .. BiZrt !' pan5S anc Sharon Rut1edge - NASA Lewis"Reseärch'center Joyce A. Brady - Sverdrup Technology, Inc. James E. Merrow - Ohio University
Atomic Oxygen Effects Applications to Spacecraft .. Ann Whitaker - NASA George C. Marshall Space Flight'center f
A^tTf 0°uTKnowlfefdgeS.On.SPa?"raft MateHalS " The 5tate °f the
Steven L. Koontz - NASA Lyndon B.' "Johnson'space'center ' 241
SESSION 4: HICROMETEOROIDS AND DEBRIS Chairman: Andrew Potter - NASA Lyndon B. Johnson Space Center
The Long-Term Effects of the M<crometeoroid and Orbital Debris Environments on Materials Used in Space ,„
Burton G. Cour-Palais - NASA Lyndon B. Johnson'space'center""'
Orbital Debris Environment and Data Requirements ,B1 Donald J. Kessler - NASA Lyndon B. Johnson Space Center *
ShSuiPari!tnpJ^a^tS !" Spa^e ■ Results From So1ar MAX Satellite and 5nuttie Witness Plate Inspections .. David S. McKay - NASA Lyndon B. Johnson*Späce'center
SESSION 5: CONTAMINATION Chairman: C. Maag - Jet Propulsion Laboratory
S/C Contamination Environments Overview L. Bareiss - Martin Marietta Corporation ' f
Spacecraft Contamination Experience E. N. Borson - The Aerospace Corporation 331
EfCar?VfM^n Co^an,ination.Environment on Surfaces and Materials 353 tar 1 K. Maag - Jet Propulsion Laboratory
VI

PART II*
SESSION 6: TRAPPED RADIATION Chairmen: W. K. Stuckey and A. L. Vampola
The Aerospace Corporation
.. , r . . 367 The Space Particle Environment
A. L. Vampola - The Aerospace Corporation
Effects of Space Radiation on Electronic Microcircuits 383
W. A. Kolasinski - The Ae-ospace Corporation
The Radiation Belt Mission on CRRES * D. Hardy - Air Force Geophysics Laboratory
SESSION 7: SOLAR RADIATION Chairman: Wayne S. Slemp - NASA Langley Research Center
Space Vehicle Thermal Testing: Principles, Practices, and Effectiveness 395 Donald F. Gluck - The Aerospace Corporation
425 Ultraviolet Radiation Effects Wayne S. Slemp - NASA Langley Research Center
Effects of Thermal Cycling on Composite Materials for Space Structures 447 Stephen S. Tompkins - NASA Langley Research Center
SESSION 8: SPACECRAFT CHARGING Chairman: N. John Stevens - TRW
Dielectrics for Long Term Space Exposure and Spacecraft Charging - ^ A Briefing yyr:'"l "
A. R. Frederickson - Air Force Geophysics Laboratory
495 An Overview of Charging Environments S. B. Gabriel and H. B. Garrett - Jet Propulsion Laboratory
Surface Phenomena in Plasma Environments ;•:••; C. K. Purvis and D. C. Ferguson - NASA Lewis Research Center
Influence of Charging Environments on Spacecraft Materials and System Performance • •
N. John Stevens - TRW Space and Technology Group
WORKING GROUP ORAL PRESENTATIONS
SECTION II-A
543
♦Part II presented under separate cover. * "J
vi i ■■% ■»
', **
%

Atomic Oxygen r.r
Micometeoroids and Debris 553
Contamination „q
Trapped Radiation 565
Appendix: Trapped Particle Flux Modeis'atNSSDC/WDC-Ä-R&S 5SQ D. Bilitza, D. M. Sawyer, J. H. King
Solar Radiation 573
Spacecraft Charging 577
SECTION II-B
WORKING GROUP WRITTEN PRESENTATIONS 585
Atomi c Oxygen 587
Meteoroid/Orbital Debris Effects on Materials 589
Contamination #
Trapped Radiation Effects 5g7
Solar Radiation _ 607
Spacecraft Charging 60g
SECTION II-C
Conclusions and Recommendations to NASA and SDIO 621 As summarized by William Hong - Institute for Defense Analysis
vm
* \
<i

.•5I2CTION I
THE TUTORIALS
\
4

SESSION 1: OVERVIEW: ENVIRONMENTS AND MATERIALS EFFECTS
Chairman: B. Stein NASA Langley Research Center
PRECEDING PAGE BLANK NOT FILMED 4
j
ö

\ V:
HHH m
v
. ■ ..... , ;:.,-, -^■■^■^■^,:^..-..^-J-^^i-!
IBS
ass&Ki aSäs
ft

TT
OVERVIEW OF ENVIRONMENTAL FACTORS* N 8 9 " 23 52 9
C. K, Purvis • NASA Lewis Research Center
Cleveland, Ohio
Original figures not available at time of publication.
J PRECEDING PAGE BUNK NOT FILMED
9.. a

THE ENVIRONMENT
Near-Earth space is a complex, dynamic environment. The energies, densities, and constituents of the natural orbital environment vary with portion (attitude, latitude, longitude), lccal time, season, and solar activity. The presence and activities of space systems modify many of the natural environment constituents (such as neutral particles and plasmas) so that the local environment may be quite different from the natural one. The local environment will interact with the system, its subsystems, surfaces, and structures. The impact of the^e interactions on the system must be assessed to ensure successful operation. Effects of the environment on the surface and structural materials play a crucial role in determining system function, reliability, and lifetime.
NEAR EARTH SPACE IS NOT EMPTY
So'ar vrf'nti
THE EARTH'S MAGNETOSnHERE
IT CONTAINS
0 NEUTRAL ATOMS 0 PLASMAS 0 FIELDS 0 RADIATION
0 PARTICULARS VARIES WITH
0 LOCAL TIME (DAY/NIGHT) Ü SOLAR CYCLE
SYSTEM PRESENCE AND OPERATIONS ALTER
LOCAL ENVIRONMENT
SYSTEM-ENVIRONMENT INTERACTIONS 0 INCREASE WITH SYSTEM SIZE- POWER
AND ACTIVITY 0 IMPACT SYSTEM/SUBSYSTEM
- FUNCTIONAL - OPERATIONS - RELIABILITY - LIFETIME

*w>- \ <■ ■
■13
THE TERRESTRIAL SPACE ENVIRONMENT
The terrestrial space environment comprises many factors, each of which can have important effects on space systems. These effects must be accounted for to ensure successful designs. This chart summarizes the natural environment factors (debris is included, though not truly a "natural" factor, because it is important and not generated by the system being considered) and their effects, and notes the importance of system-generated components. The "enhanced" or threat environment is noted for completeness, but it is not considered further here. Many of the effects listed are materials related. It is the environment factors associated with these effects on which we now focus. These are solar radiation, meteoroids and debris, neutral atmosphere, plasmas, trapped radiation, and system-generated contaminants. In what follows, each of these environments is overviewed briefly. More details will be found in the individual "environment" sections of the Workshop's focus sessions.
■EFFECTS ON SPACE SYSTEMS-
ENVIRONMENTAL FACTOR
GRAVITY
SUNLIGHT & ALBEDO
METEOROIDS & DEBRIS
NEUTRAL ATMOSPHERE
FIELDS
PLASMAS
FAST CHARGEO PARTICLES
SYSTEM GENERATED
ENHANCED
EFFECTS ACCELERATION. TORQUES
HEATING. POWER. DRAG. TORQUES. PHOTOEMISSION.
MATERIAL DAMAGE. SENSOR NOISE
MECHANICAL DAMAGE. ENHANCED PLASMA INTERACTIONS
DRAG. TORQUE. MATERIAL DEGRADATION. HEATING
TORQUES. DRAG. SURFACE CHARGES. POTENTIALS
CHARGING. INDUCED ARCING. POWER LOSSES.
POTENTIALS. ENHANCED CONTAMINATION. CHANGE OF
E-M REFRACTIVE INDEX, PLASMA WAVES 8 TURBULENCE
RADIATION DAMAGE. ARCING. SINGLE EVENT UPSETS.
NOISE. HAZARD TO MAN
SYSTEM DEPENDENT: NEUTRALS. PLASMAS. FIELDS VIBRATION, TORQUES, RADIATION, PARTICULATES
EflP 8 RELATED
' *
n

r~
,'\
THE SOLAR SPECTRUM
This chart gives an overview of the solar spectrum, from the gamma ray out to the far infrared. Some 99.5% of the Sun's radiant energy is in the 1200A to 10 urn wavelength (2.5 x 10⁻¹⁵ - 3 x 10-13 Hz) range. The flux levels in the visible and near-ultraviolet (UV) are relatively stable, whereas those in the extreme ultraviolet (EUV), X, and gamma ray region are highly variable and depend on solar activity.
V
< a: I- u ul n. 10
10"
1DG
104
103
1112
10
1 in u z < 5 < K S 10-
10 -1
10"
10
10-
-4
2H Fl.AHE
POS r-ni.AHE V — ^*
~ 113 FLAnE-^X./
LAHME -
uunsr (3U FLAUE, J 8/4/72IIWUH- ' IIIEIIMALI
"yy, 1U21 1()20 H)19 I018101710,H ll)15 HI1'1 II)13 1012
FREOUENCY (Hz) GAMMA-HAY X-IIAY ULTRA-
VIOLET INFRARED
NASA-nnoDAnn SPACE FLIGHT CENTER GHEENUELT, MARYLAND AUGUST, 1Ü7U

"~~- ■
^'**33
SOLAR IRRADIANCE
0.24 Tho Solar Spoctnim
■ Outltilr Ejrthi Almntnhtrt (Are« undtr cur» - 0 1353 W em'2)
-i SM Lt«il in «cry Clear Atmoiphm
/ (ArtJunUrjr curtt-O.nmvcm 2|
I? 1.4 1.6 WAVELENGTH Um)
2.2 2.4 2.6
outside «h? Ä «p,,^'"nP, T'AU1''0",,;? SbX°" Ty.-.'"V"• "'«• •*•«"» -radiance
i/£

'V
METEOROID ENVIRONMENT
Meteoroids are an obvious potential source of mechanical damage to spacecraft materials. Total mass influx of meteoroids is estimated as 10 u gm/year. Average velocity of meteoroids is considered in the models to be ^U km/second and density is considered to be approximately .5 gm/cm3 for cometary meteoroids and approximately 2 gm/cm3 for asteroidal ones. The fiqures show one-year average estimates of cumulative number fluxes from various sources In modeling this environment, N is taken to be of the form N = Const/ma where a 1s a slowly varying parameter of order unity (see right-hand figure)
IE I i
'MOimo mux»» mm
-a
-16
. • oco m ]
» mtti i / ms» Q «USUS I, B. HI; [IflO![l ML HHL
lUUHlNI ll!i(l O «Al«l( WHO«; HICSOUT ll'UI + AfOUO OUKIS; IHITIU l«l|
' ' ' I
/IKJDUJtt, Mult OUCIS
.KOMM) MtUYf OMCIS
■HAWIIHS. SI0«S II9UI
"*••.. ROCKIT OCT -7]'«.COLLECTION
• •'*** SiKVue '.jicos': S^i"'
«oit.3t*"-../*"-rjv LUNAR ROCKI * •W*w
11054 ™ LUNAIIfPH
O 8 LOG|0 MASS, g
TarreatrlaJ maaa-lnriiu rut« of mtttoroids. N Is lh« flui of partlclaa with nan grtalir than m |2-2t|.
iu III
_1_ a. '•»■'■■
LUNAR nuMoQRAna'
I I I I •'« " » •» ■• -4 I a ,1
Cumulatlvo parllcla fluxia fnim various data, aourcea
10
a

■■«»«»IWMMi
METEOROIO IMPACTS j i
Estimates of frequency of meteoroid impacts can be made using formulas given in NASA SP-8013 and SP-8042. These models are old but are still used for design.
NASA SP-8013 GIVES COMETARY METEOROID FLUX W AT 1AU AS:
LOG1QN- -14.37 -1.213 LOG^M 10 £M-10
LOG10N- -14.34 -1.584 LOG^M -0.063 (LOG^M)2 10_12£- MSIO"6
N= // OF IMPACTS OF MASS M GRAMS AND LARGER PER SQUARE METER PER SEC.
MULTIPLY BY DEFOCUSING FACTOR G AND EARTH SHIELDING FACTOR j'(K)
EXAMPLES:
M(GM) NlAU(m"2s_1) R(R )
e NR(m"
2s_1) N (m yr )
1 3.9xl0-15 1.05 2.1xlO"15 6.6xl0-8
1.5 2.9xlO"15 9.1xl0-8
6 2.5xl0-15 7.9xl0"8
ID"6 7.9xl0~8 1.05 4.3xlO~8 1.4
1.5 5.8xl0-8 1.8
6 5.1xl0~8 1.6
IQ"12 A.OxlO"5 1.05 2.2xlO~5 6.9xl02
1.5 3.0xl0~5 9.4xl02
6 2.6xl0"5 8.2xl02
[SEE ALSC ) NASA SP-8042 "METEOROID DAMAGE ASSESSMENT", 1970]
I 0
I
M
11
A IK.

n \3
DISTRIBUTION OF DEBRIS IN EARTH ORBIT
orbit ^L0«^ nh0WS ? rePresentation of the distribution of debris in Farth
"• ' * ' . : • ..." . %"'V/.
*..
•I
i y'
v •
..«• •. •»: ••
12
?l &

CLOSER VIEW OF DEBRIS DISTRIBUTION
A closer view illustrating the relative uniformity of debris distribution in low Earth orbit (LEO). Density of the debris falls off at altitudes >1500 kn.
13

ORBITAL DEBRIS MEASUREMENTS COMPARED TO METEOROID FLUX
This shows a comparison of meteoroid and debris fluxes for various particle diameters. Debris is a more serious threat than meteoroids at the small and large extrema. Data on debris fluxes in the 1-mm to 1-cm diameter range is lacking.
F L U X
linpucU
Croil-Secllonal M'-VR
10«.
0.0(101
SOLAR MAX DATA
-ORBITER WINDOWS (1981 •8n,:iO».KM ALTITUDE 05%CONFIOENCE
r-CALCULATED FOR ONE HYPERVELOCITY COLLISION
r-G ROUND TELESCOPE (MIT)
GROUND EXPLOSION DATA
rNORAD CATALOG
0.01 0.1 I PARTICLE DIAMETER (cm)
100
North American Air Defense Command
14

■f "■nrr'TTWfi
NEUTRAL ATMOSPHERE
Atmospheric pressure and density decrease rapidly in suborbital regions (^200 km), while kinetic temperature increases. At orbital altitudes, the residual atmosphere is tenuous enough to be essentially collisionless.
N*
DENSITY, kB/m* '•" IQ*» io-"> itf« 10-« ,„-• ltf2 10o
10' 10- lO* 10* 10° 102 10* 108
r-HESSURE, N/m2
Total pressura and man density as a function of ieo- «•trie altltuda
uuu c«
— COESA iwei-c« —— COESA I1H2I-C
MO
— :
WO
400 I 200
i* ■^ i i i i ■ i 200 400 BOO MO 1000 1200 1400 1100 1M0 200t,
KlMlla Tunptfilura IK)
Kinetic tamperatura veraua altltuda
15
a

%'
STANDARD ATMOSPHERE
The density, composition, and temperature of the residual atmosphere vary with solar activity. In recent years the reactivity of atomic oxygen, which is the dominant constituent of the residual atmosphere at LEO, has been recognized as a serious threat to materials exposed to its ram flow. The motion of spacecraft through the residual atmosphere in LEO at velocities of the order 7.5 to 8 km/sec results in an equivalent impingement energy for 0 of 4.5 to 5 eV. Rapid degradation of some materials in this environment has been observed on STS.
1000 1000
10 10 10 12 10 14 10 16 10
I 18
NUMBER DENSITY, m"3
Ar
10 10 1012 1014 1016 1018
NUMBER DENSITY, m'3
Relative concentrations of atmospheric constituents during periods of'minimum sola/ activity
Relative concentrations of atmosphere constituents during periods of maximum solar activity
16

ENVIRONMENTAL INTERACTIONS
i„6/Ne3C"^arth P1a?ma regi,mes delude the cold (-.1 eV) relatively dense (to Zl L + l i°w°Sp eriC P1asmas wnose densities gradually fall off with altitude; the hot (~KeV to-10's of KeV), tenuous (<l/cm3) plasmas observed at geosynchronous and associated with geomagnetic substorm activity; and the fluxes of hotelectrons due to these geosynchronous plasma injections which travel down magnetic field lines and precipitate in the auroral zones. The latter two plasma environments can charge spacecraft surfaces to kilovolt potentials; the cold ionospheric component interacts strongly with spacecraft power systems.
NEAR EARTH PIASMS
10» SYNCHRONOUS 0RGIT
1
10« "A t 1 1 1
10» "i/\
1 V 1 V i \ 1
PLASMA10« NUMBER 0ENSITY,10> cirr'
-
\ 1
\ V 10» - 1 *
10 11
it
1 i ill i 100 100010000100000 1000000 •
ALTlTU0E.km II«, M
^fe^giSf^
JMS!?*» «• »" KKf^Plfi
lsv^|3^g^yyBjg^a£ SB .' .'-.._"••—^ £.*,;*.:_•. V.j-J'i*"' ,_..lllfj
IONOSPHERIC PLASMAS
GEOSYNCHRONOUS MODEL SUBSTORM
AURORAL PLASMAS HIGH LATITUDES
ORIGINAL PAGE IS OF POOR QUALITY
17
it

PLASMA DENSITY AND COMPOSITION IN THE IONOSPHERE
Plasma density and composition in the ionosphere vary daily, seasonally, latitudinally, and with solar activity, as is illustrated in these figures.
IONOSPHERE
MUUttHhm*
Ionic enapotlllon of lh» Mlir mlrimum ••jnlM ulrnw tonoiphor« |1-UI.
» >• 1« moantmc i ou*to« —J
UTITUOI I*«!
>• «• IOUTH MtOMITK IOU» tM
OayllM •qiHl-ilwim^tiullx MWI IValtai ll'/aa') |l-lt|.
,— daytime l\ \ \
' •• nighttime \\ * \JMIIMUMO»
3 8 m ■J 4
i
1V \ IHMfOTfCUX S \
-»A..,. )n
• It" W> U4 M>
IIICTHON COUCIKTMTIO» M
Normal electron distribution
18

S'-" *m*rT-' -i,--;.:»r:-^«t-<ir i "* ll
DIURNAL VARIATION IN ION DENSITY AND COMPOSITION
This figure illustrates the diurnal variation in ion density and composi- tion for solar maximum at mid-latitude.
MID.LATITUDE ION COMPOSITION
SOLAR MAXIMUM
0AYT1MC POSITIVE ION COMPOSITION
J |RtG ION j^ JO-Ukm
,„ NIGHTTIME POSITIVE ION COMPOSITION 1000, r
m CONCENTRATION I» 'I
Üj» 50-IS km
ION CONCENTRATION (en ')
19 \

i \z
4 ,
GEOSYNCHRONOUS PLASMA ENVIRONMENT
This figure shows histograms of the occurrence frequencies of the electron and Ton temperatures and current at geosynchronous orbit measured by Applications Technology Satellite (ATS)-5 and ATS-6. T(AVG) is two-third's th* ratio of energy density to number density; T(RMS) is one-half the ratio of particle energy flux to number flux. *
The hot plasmas were observed to charge the ATS-5 and ATS-6 spacecraft to kilovolt potentials in eclipse and to hundreds of volts in sunliqht. Similar TU 1!?2 effects are anticipated for large spacecraft in auroral"zones at LFO. The DMSP spacecraft (900 km) has been observed to charqe to approximately 700 volts during auroral passage. Charging potentials are negative because electron fluxes dominate the process.
■ cuamr DIHiITT
«T1-« MM mw«*ruM narauru«
it
la
8"
5 » U
* it '
• - 4
—»r»-«
I K 4*«*/«*1)
M
m- u
■ 5» it •• * it
• *
iLfcraoa euaMHT ocNttrr
— m-t
. 1.
0 • W II
Histograms of the Occurrence Frequencies of the Electron and Ion Temperatures and Current at Geosynchronous Orbit as Measured by ATS-;5 and ATS-6. T(AVG) is 2/3's the ratio of energy density to number density: T(RMS) is one-half the ratio of particle energy flu* to number flux
20

Mtar;..
TRAPPED RADIATION: THE VAN ALLEN BELTS
This figure shows Van Allen's first map of the radiation belt, showing the inner and outer zones of high count rate. The contours are labeled by the count rate of a Geiger counter of about 1 cm"? area covered by 1 gm/cm? of lead.
p/C 10« I I I I I I I «
to htHM. £#>» Mrr
El«ro«ii.fc>l.«Mt»
VM AtWi flru flu». «f ih« riUlaiiiMi belt, ituminf ihc Inmr »n4 om» IM« of Hl|h «mi« fli*. Ttn conioun art libeled by ihc C0uM m« of • 0«|tr «oufttef of about I cm' arta covtrcd b» I im/cm* •floXlDl
21
i

r-n+rmftrtaf&rf;* .'•»»I
NSSDC TRAPPED RAOIATION MODELS
Trapped radiation models are available from the National Space Sciences Data Center (NSSDC).
AP8MIN OMNIDIRECTIONAL flUX (PROTONS/CM'-SEC)
APflMIN ft - A plot of corwtint Intrrmlty Dux contours alth an ttwrfy of ; 1.0 M«V.
ORiGflMAL PfiQZ (S OF POOR QUALITY
/
22

SYSTEM GENERATED ENVIRONMENT
The system-generated environment is system-specific and may be quite
canPimpäct theSsystemally COnSidered to be the main source of contaminants which
DEPENDS ON SYSTEM CHARACTERISTICS
0 NEUTRALS: OUTGASSING, THRUSTER EJECTA, DUMPS, RAM/WAKE CHEMICAL REACTIONS: DEGRADATION, CONTAMINATION LOCALLY ENHANCED PRESSURES
0 PLASMAS: PHOTOIONIZATION OR CHARGE EXCHANGE OF NEUTRALS, DIRECT, RAM/WAKE
ENHANCED PLASMA INTERACTIONS COUPLING TO AMBIENT: POTENTIAL CHANGES
. *
y
ENERGETIC CHARGED PARTICLES: ELECTRON OR ION BEAMS BEAM-PLASMA INTERACTIONS: HEATING, WAVES, EML INTERACTIONS WITH NEUTRALS: EXITATION, IONIZATION, BPD +
ENHANCED PLASMA INTERACTIONS CURRENT BALANCE ALTERATIONS: POTENTIAL CHANGES
ELECTRIC AND MAGMETIC FIELDS: EXPOSED V's, CURRENTS, RESIDUALS, VxB TORQUES AND FORCES: ATTITUDE CONTROL PLASMA SHEATH EFFECTS: PLASMA INTERACTIONS STIMULATION OF WAVES, INSTABILITIES: EMI, PLASMA INTERACTIONS
♦Electromagnetic interference tBeam plasma discharge
23
i m
1

'JT-{
•>».■
If SUMMARY ?
j The orbital environment is complex, dynamic, and comprised of both natural >' and system-induced components. Several environment factors are important for i materials. Materials selection/suitability determination requires consideration 7. or each and all factors, including synergisms among them. Understanding and > evaluating these effects will require ground testing, modeling, and focused fliqht
• experimentation. a
i
t
ORBITAL ENVIRONMENT IS COMPLEX
0 NATURAL 0 SYSTEM-INDUCED
ENVIRONMENT FACTORS IMPORTANT FOR MATERIALS INCLUDE:
0 SOLAR RADIATION 0 METEOROIDS AND DEBRIS 0 NEUTRAL ATMOSPHERE 0 PLASMAS 0 TRAPPED RADIATION 0 SYSTEM-GENERATED CONTAMINANTS
MATERIALS SELECTION/SUITABILITY DETERMINATION REQUIRES CONSIDERATION OF ALL FACTORS
24 i


N89-23530 1 /
STRUCTURAL MATERIALS FOR SPACE APPLICATIONS
Darrel R. Tenney Materials Division
Langley Research Center
!
25
fl

ABSTRACT
issssrä-sssr is expected to provide a wealth of data on atomic oxygen erosion In «Sri
plasticize the matrix at elevated temperatures and embrittle the matH* It ?n?
Trrlluttl ?aCSnr-?i t«j?e|-«'«"J.»'">st,nt).lly higher'than those pSicte £
=S^ISSS SIS', Sr -
26
:tti

TYPICAL SPACECRAFT MATERIALS
Research on advanced materials development for spacecraft applications has generally been focused on three classes of materials: polymer films, coatings, and composites. High-perfor- mance polymer films such as Kapton and Mylar are widely used on current spacecraft (fig. 1). The recent concern about atomic oxygen degradation of polymer materials on spacecraft placed in low-Earth orbit (LEO) has focused attention on the development of new polymer films or coatings which are resistant to atomic oxygen erosion. Another area of research at Langley has been the development of transparent polyimide films which have very good UV and electron radiation resistance. Highlights of this research will be covered in a later section of this paper.
Coatings consist of a variety of organic-base paints, metallic materials, and ceramic materials. An extensive data base exists on the development and testing of paints that range in color from black to white. The degradation in oprical properties of white paints by U V, electron and proton radiation was extensively studied in the 1960's and early 1970's. The white paint designated S13GLO is generally considered to be the best white paint available today for spacecraft applications where a low solar absorptance and high emittance are required. Atomic oxygen degradation of coatings is an area of considerable interest within NASA because space durable materials are required for Space Station (30 year design life time). Aluminum foil bonded to composite tubes has been shown to have resistance to atomic oxygen erosion. However, other metals such as silver which has been used for silver interconnects on lightweight flexible solar arrays must be protected from atomic oxygen.
Composite materials have been extensively used for spacecraft structural applications because of their combination of lightweight, high stiffness, and low thermal expansion. Compos- ites of interest for spacecraft applications include Gr/Polymer, Gr/Al, Gr/Mg, and Gr/glass. Some of the issues and concerns with these materials will be discussed in subsequent charts.
Types of Materials
Polymer Films
Spacecraft Application
Thermal Blanket
CfF?^,,
^Spacecrafts | Thermal ^-^ :£ Control 5'^""
Grapf'tcGlASS
Structural Elements
Figure 1
ORIGINAL PAGE BLACK AND WHITF PHOTOGRAPH
27
£

I 1
STRUCTURAL MATERIALS FOR SPACE APPLICATIONS
ctr,,^,,?0 t*°.n?aJor ?Pics t0 be covcrcd in this paper are space environmental effects on * structural materials, and new materials development (fig. 2). Highlights of on-goingNASSA research will be presented to illustrate the type of issues currently being addresÄ NASA missions Examples of new materials development will also be presented to illustrate some of the approaches being pursued to develop improved materials for space applications
Topics
• Examples of space environmental effects on structural materials
- Composites
- Films
- Coatings
• New materials development
- Research focus
- Testing issues
- Long-life certification
Figure 2
J I i
28 \
i

SPACE ENVIRONMENT
The space environment is a hostile environment. It consists of atomic oxygen, ultraviolet radiation, high-energy electron, and proton radiation as well as solar flare protons, and micro- meteoroids and space debris (fig. 3). For spacecraft located in low Earth orbit, atomic oxygen erosion of polymeric materials is a primary concern. This, of course, is a function of the ambient density of die atmosphere which varies with sunspot activity. Atomic oxygen degradation is a significant issue for Space Station,* which is expected to operate for 20-25 years in low Earth orbit. This topic will be covered in detail by other speakers at this symposium and therefore will not be further discussed in this paper.
Another concern for structures placed in low Earth orbit is micrometeoroids or space debris impact Predictions based on models of the space debris environment indicate that the population density of small particles is expected to get progressively worse over the next several years. In the smaller diameter sizes the population density of space debris is expected to exceed that of micrometeoroids.
Spacecraft placed in geosynchronous earth orbit or in a high polar orbit will be subjected to high doses of electron and proton radiation. For long life missions (25-30 years) die total absorbed dose to typical composite structural elements may exceed the threshold level for damage (10^ rads) for most polymeric materials. Of particular concern are changes in mechanical and physical properties of structural composites and optical properties of thermal controlled coatings or polymeric films.
Altitude, km
ATOMIC OXYGEN
900
700
500
300 1012 1014 1016 1018
-2 -1' Oxygen atom flux, m sec . v8km/sec
\ \- \ \ \ \ \ \ \
- \ \ \ - \ \ \ -Sunspot minimumX, x \
atmosphere^-^\\ ' Standard Sunspot maximum — ^vNA
I i >>v x,
RADIATION
Protons
Electrons
SOLAR RADIATION
cm.urn
.2 .6 L0 1.4 L8 2.2 lb Wavelength, urn
Solar flare
protons
.001 .1 10 Energy, MeV
METEOROI PS/DEBRIS
900-1100 km
10 "z [-800 ^Meteoroids
1995 predicted
debris
10"3 10"1 101 103
Diameter, cm
S s
Figure 3
*Space Station Freedom
2S
;

MATERIALS TECHNOLOGY NEEDS FOR SPACE SYSTEMS
The development of long-life space materials must strongly consider the dominant environmental conditions expected for the orbit where the spacecraft will be displayed. Some of the key differences for materials to be used on spacecraft placed in low Earth orbit (LEO) and Geosynchronous Orbit (GEO) are listed in figure 4. To successfully design for long-life space missions, space materials durability must be treated as a critical design requirement in the same way as requirements for mechanical, physical, or optical properties. One of the most difficult challenges in trying to engineer long life is the uncertainty associated with accelerated testing. This issue will be further discussed in a later section of this paper.
I i
i
Space Station - LEO Antenna - GEO
• Atomic oxygen stability • Radiation stability (UV, e"andp+)
• Damage tolerance and toughness • Low expansion-high precision
e Stable optical properties • High stiffness and damping capacity
• Low outgassing • Low outgassing
Figure 4
-1
As
JO

\
COMPOSITE TUBE AS A SYSTEM
The successful development of long-life structures in space must be based on a thorough understanding of the loads and environments that the structure will be subjected to during design lifetime. For a composite truss structure this means that the performance of composite tubes used to build the structure must be understood. The basic composite tube may be considered as a system (fig. 5) composed of: (1) the fiber-matrix composite laminate, (2) coatings for UV and atomic oxygen protection and for thermal control, (3) end fittings to attach to joints in the structure, (4) adhesives used to bond end fittings to composite laminate, and in some cases to bond coating to composites (i.e., Al foil to composite tube).
The long term thermal and mechanical response of the tube is dependent on the performance of each of these elements. Factors which can lead to changes in the thermal response of the tube include: (1) changes in solar absorptance or emittance of coating either due to contami- nation or radiation degradation will alter the maximum and minimum thermal cycle that the tube will experience, loss of coating could result in UV and/or atomic oxygen erosion of composite laminate; (2) matrix microcracking resulting from thermal fatigue will change the coefficient of thermal expansion (CTE) of the composite laminate; (3) thermal fatigue failure of adhesive joints would affect both thermal and mechanical properties of the tube; (4) contaminating of coating surfaces, matrix microcracks, and coating separation from the composite laminate would change the thermal conductivity properties which could alter the temperature distribution of the composite tube as the structure goes into and out of the Earth's shadow. The long-term mechanical perfor- mance of the composite tube is obviously dependent on the properties of the composite laminate coatings, adhesives, and end fittings.
• Major Components
- Composite Laminate - Coating
- End Fittings
- Adhesives - End Fittings
- Coatings
• Response - Thermal
- Coating optical properties
- CTE of composite laminate and end fittings
- Thermal conductivity of coatings and composite
- Mechanical
- Composite properties
- Adhesive strength
- End fittings properties
Figure 5
31

CTE MISMATCH IN ADHESIVE JOINTS
Coefficient ofthermal[expansion (CTE) mismatch in adhesive joints can result in high residual stresses and thermal fatigue failure The truss structure of Space Static* S te Slrmallv cycled between approximately 150° and -100°F 175,000 times during 30 Jem in l™ EuSt The current baselmefor this structure is high-stiffness graphite/epoxy compSte tutes wkh Al end fittings and joints. Thermal cycling tests are currently being conducted on TepK^üZcomws SÄET H
CV^ate ^themaI fatigue resistilce- CTE and daSicSSSfSS X composites, high- and low-temperature adhesives, and Al and Ti are tabulated in figure 6
ALUMINUM ADHESIVE
COMPOSITE
MATERIAL MMC
(GR/AL) CerMC
(GR/GL) PMC
(GR/EP) L.T. ADHESIVE (350FEPOXY)
H.T. ADHESIVE (PI)
AL TI
CTE, IN/IN/?
-6 X10
0.8* (15)**
-0.3 (3.6)
•0.6 (18)
30 20 13 5
ELASTIC MODULUS,
-6 PSIXIO
47 31 39 0.6
05 10 17
•LONGITUDINAL "TRANSVERSE
Figure 6
32

LOW EXPANSION POLYMER RESINS
Residual stresses in composites are a function of the differences in coefficients of thermal expansion of the matrix resin and fibers, the elastic modulus of the matrix and fibers, and the AT, temperature change between the cure temperature of the composite and the use temperature of the composite. The coefficient of expansion (CTE) of some typical state-of-the-art polymers, high performance polymers, and an experimental polyimide are shown in figure 7. This chart shows that the potential exists to synthesize very low CTE (0.5 x 10⁻⁶/°C) polymers. However, the aromatic thermoplastics and the dense rod-like aromatic thermoplastics must be processed at much higher temperatures than the typical 177°C cure epoxies typically used for space structures. Also the modulus of the rod-like polymers can be much higher (l-2msi) than that of the typical epoxy (0.5msi).
The combination of higher processing temperatures and higher modulus may more than offset the benefit of lowering the CTE of the polymers. Research is needed to establish the degree to wiiich each of these properties can be varied and experimental lots of material synthesized for composite fabrication and testing. Research of this nature is currently underway at NASA Langley. The near term focus of this research is directed at understanding the structure-property relationships that determine the coefficient of thermal expansion of polymers. Promising concepts will be further explored to synthesize enough resin to fabricate composites for testing.
© State-of-the-art polymers
Teflon® (TFE) 350° F cure epoxy Kapton® polymide
o High performance polymers
Hitachi polymide LaRC-TPI oriented
o Experimental polymers
New polymide
CTE PPM/°C
0.5
Structure/property relationships
Aliphatic thermoplastics
Aliphatic thermosets
Aromatic thermoplastics
Dense, rod-like aromatic
%m-LTasti— Low CTE
U—D- Very low CTE thermop,asitJCS
Conclusion: Potential exists for synthesizing very low CTE resins
Figure 7
33
i*

PRECISION SEGMENTED REFLECTOR
During FY 88 NASA initiated a Precision Segmented Reflector Technology program at Jet Propulsion Laboratory (JPL) and Langley Research Center (LaRC) as part of NASA's new Civil Space Technology Initiative. The primary reflector shown in figure 8 is made up of hexagonal panels, each two meters in size. The panels are supported by a deployable or erectable truss backup structure and surrounded by a sunshield to keep direct solar radiation from the primary surface. Significant technical challenges exist in the areas of lightweight deployable structures, lightweight structural composite mirrors, and the control of pointing, vibration, and figure (ref. 1).
The development of lightweight, low-cost reflector panels that demonstrate high surface precision and thermal stability is considered a critical enabling technology for precision reflectors. Some of the key requirements for the reflectors panels are: aerial density £10 Kg/m2; surface roughness <3 \im; out-of-plane CTE £2 ppm/K; long-term stability in orbit <1 Jim; low outgassing; good radiation stability. Much of the work to date has focused on the fabrication of lightweight honeycomb panels wiih Gr/Epoxy face sheets. Both E-glass and standard aluminum honeycomb core have been utilized. Coatings and polishing techniques have also been developed to improve a fabricated surface precision from 3 |im to approximately 1 urn.
V
Figure 8
-4 ORIGINAL PAGE BLACK AND WHITE PHOTOGRAPH
34
Ö

EFFECT OF MATRIX CTE ON LAMINA PROPERTIES
A significant part of the Precision Segmented Reflector (PSR) program is the development of lightweight (<10 Kg/m2) low-cost composite panels with a surface roughness less than 0.03 Urn RMS. These panels must be thermally stable during long-term (10-year) service at cryogenic temperatures in space. To accomplish these objectives research is underway to develop low expansion resins for resin matrix composites and establish fabrication procedures which minimize residual stresses in composites. Reducing through-the-tnickness CTE of polymer matrix compos- ites would help to minimize distortions in composite panel face sheets. Figure 9 shows that a reduction of CTE by an order of magnitude (CTE EP/10) would reduce the through thickness expansion of a typical graphite/epoxy laminate to approximately 1/3 the value of a Gr/Ep laminate fabricated with a typical 350°F cure epoxy. Tne results of figure 9 also show that the modulus of the graphite reinforcement fiber does not affect the through-the-thickness (T-T-T) CTE. Graphite/glass also has a very low T-T-T CTE which makes it a candidate material for PSR applications.
20 xlO"
15
THROUGH-THE- THICKNESS CTE/F"1
10
O T300 6R/EP D P75 6*/EP O P100 6«/EP A HHS GR/GLASS
BASELINE
£
-D-
CTE EP/2
CTE EP/10
CTE EP/100
10 20 30 40 50
LONGITUDINAL hODULUS. PSI
60 -1 6 70x10
Figure 9
/■
35
t

MCROSTRUCTURES OF HMS Gr/BOROSILICATE GLASS
»h«* „SÄte"rei-nf0rfed $?S is *lea5?n8 candidate composite material for space applications where good dimensional stability and radiation resistance are important design considerations The microstructure of a typical Gr/glass laminate (ref. 2) fabricated by United TäSESlSSch Center is shown in figure 10. Each ply of continuous fiber material is separated?BS-of S2^R^S.WhlS W"S "Z* '■ ™POve,»«ndleabaiiy of the plies prior to composite c^nsoHda £u£ Ä TSfiS £rteiliCa,e gLa-SS (type 7740) "* ^ «WbSng fiber was Hercules HMS, a 55 msi modulus PAN base graphite fiber. The fiber volume fraction of this laminate was approximately 0.45 ± 0.03. ««ui« ir*uon or uus
Graphite
scrim
-\i JS.I--
V^Y-^H HMS Gr/Glass
ply
i 1
0.01 inch
Figure 10
ORIGIAlAfc-PAGE BTACK AW-WMwa '"^*'a*:^w=:CLf> I? fl FN. |
36 ORIGINAL' PAGE
BLACK AND WHITE PHOTOGRAPH

i in *itm*>nwmmi\m*m*pmm iwrni ™MUII'""'P.'—m ^»w^^yWr^^^y^W^I^^^^JSi^ll^3^
THERMAL EXPANSION OF (0/±60)s HMS/BOROSILEATE GLASS LAMINATE
The thermal expansion behavior in the x-direction of a quasi-isotropic Gr/glass laminate measured in the dimensional stability laboratory at NASA Langley (ref. 2) is shown in figure 11. The near zero CTE is evident from the slope of the stress-strain curve. Thermal cycling did not have a significant effect on the thermal expansion behavior. However, the strain hysteresis loop of 25-30xl0"6 was unexpected. This behavior is generally believed to be associated with either damage development in the graphite paper interply layers or changes in residual curing stresses in the laminates. Similar hysteresis phenomena was also observed for chopped fiber mat Gr/glass composites (fiber vol. fraction of 33 ±3%). The magnitude of the hysteresis was on the order of 15-25X10"6. Thermal cycling of unidirectional Gr/glass samples showed that in the longitudinal direction the expansion behavior was linear and did not change with thermal cycling (100 cycles). Values of residual strain were quite low and did not change with thermal cycling. The residual strain was much more pronounced in the transversely oriented specimens. Large values were noted on the first cycles but tended to decrease in magnitude in later cycles. However, the specimen increased in length (transverse direction) during each cycle and net cumulative strains of up to 200X10"6 were observed after 100 cycles. The reason for this behavior has not been estab- lished but could be associated with the development of micro damage in the composite laminate. However, microscopic and x-ray examination of the specimens after testing did not reveal any cracks.
X-Direction
100 x10-6
50
Strain o
-50 h
-100
Cycle 1 Cycle 100
Start -
-200-150-100-50 0 50 100 Temperature, °F
Figure 11
37
%

THERMAL EXPANSION OF (±8)s P100-AZ91C/AZ61A LAMINATES
Graphite reinforced magnesium composites are of interest for space structures because of their high specific stiffness, low thermal expansion, no outgassing, and excellent radiation resis- tance. The thermal expansion behavior of a typical Gr/Mg composite (ref. 2) is shown in figure 12. The composite laminate was fabricated with layers of precursor wires (Union Carbide P100 graphite fibers infiltrated with magnesium alloy AZ91C) separated by interply foils of 1.7 mil thick AZ61A Mg alloy and AZ61A Mg surface foils 2.5 mil thick. The finished panel was 80 mils thick with a fiber volume fraction of 0.47. The fiber orientation was ±8°.
The thermal expansion measurements shown in figure 12 were made in a high precision Fritzeau type laser interferometric dilatometer which had a strain resolution of lxlO"6. The results for the first thermal cycle were made by thermally cycling the specimen in the dilatometer by heating from room temperature to 100°F, then cooling to -200°F then reheating to room tempera- ture. After the first cycle, the specimen was removed from the dilatometer, thermally cycled in a separate chamber and then reinserted into the dilatometer for thermal expansion measurements.
The nonlinear thermal strain behavior is attributed to plastic deformation of the matrix alloy due to thermal stress created by differential thermal expansion between the fibers and matrix alloys. The first thermal cycle produced a permanent residual strain in the specimen of 103X10"6. The residual strain produced on the 5th thermal cycle was SxlO-6 and on the 100th thermal cycle 8xlO-6. The cumulative strain after 100 cycles was 167X10*6. The coefficient of thermal expansion was small (-.MxlO-6 to O.^xlO-6/0^ at room temperature.
The large hysteresis loop and permanent residual strains produced in the composite clearly show that this composite could not be used for applications where it would be cooled to -200°F. Tests of this composite over a reduced temperature range of 70°F to -100°F showed that a small hysteresis loop was still present but there was no evidence of residual strain following cycling. The linear thermal expansion range of this composite can be increased by heat treating the compos- ite to increase the yield strength of the matrix alloy or by using a higher yield strength alloy for the matrix.
X-Direction
120x10%-
Strain
-80
Cycle 1 Cycle 5 Cycle 100
-200 -150 -100 -50 0
Temperature, °F
Figure 12
50 100
\
38

—■-*■? T*fl!5W 1 ELECTRON DOSE RATE IN GRAPHITE EPOXY COMPOSITE
The high energy electrons and protons present in the trapped radiation belts of the Earth can cause significant property changes in many polymer materials if the total cumulative dose exceeds approximately lxlO9 rads. The calculated electron dose rate for a typical graphite/epoxy composite in rads/day is plotted as a function of attitude (circular orbit at zero inclination) in figure 13. The dose rate at the surface, and at 3, 6, and 15 mils below the surface are plotted. For low Earth orbit applications, such as Space Station (~550 KM), the cumulative dose over even a 30 year lifetime would not be expected to effect composite properties. However, for spacecraft placed in high Rirth orbit (above 1000 KM) the absorbed dose at the surface would be approximately 7xl09 rads in 20 years and approximately 1010rads in 30 years. Because these levels are above the known damage threshold levels of many polymeric materials radiation damage is a significant environment factor which must be considered in material selection for long-life structures to be placed in high Earth orbits.
Selected highlights of an ongoing research program on radiation degradation of polymer matrix composites conducted at NASA Langley Research Center will be presented in subsequent figures.
Circular orbits at zero inclination
Depth, mil
Dose rate,
rad/day
10 103 104
Altitude, km 10:
Figure 13
r
39

EFFECT OF ELECTRON RADIATION ON AXIAL RESPONSE OF [45°] OFF-AXIS Gr/Ep COMPOSITES
1TW, Tte effect of high energy (I MeV) electron radiation on the shear properties of a typical oViSfS/?^ TXy conVOBte (T300/934) is shown in figure 14. Composite specimens * r£ y ?«eS 1(?ng werc cut fr001 a ^P'y unidirectional composite laminateTuch that the fibers were at a 45° angle to the axis of the specimen. The specimens were dried and Mated in vacuum (2x10⁻⁷ Torr) to 1 MeV electrons at a dose rate of 5x10? rad/h and a total dose of 10» raas. unirradiated and irradiated specimens were tested at room temperature, +121 °C and -157°C.
mrnnncS?aK?Ul? {Tf\?^ figUre 14 show ** Ta^3tüon ch™S<* the stress strain behavior of the
composite laminate at aU three temperatures examined. At low temperature (-15?°C) the strength SS SY^"5 of ^^Posjte are significantly reduced At loom temperature the streng and modulus are increased by irradiation and the strain-to-failure was only sightly reduced it elevated temperature (+121°C) radiation damage of the epoxy matrix caused Sgereductions fa strength and stiffness and a significant increase in strain-to-failure. rcaucnons in
raHinrin^f,l!fnge\in mechanica][properties are consistent with changes expected if the primary radiation damage mechanism were chain scission. Chemical characterization teste revealed the presence of low molecular weight species in irradiated composites not found in unirradiated 3v°t; f !?e l0W ^«darweight species, resulting from chain scissions, plasticize the matrix at elevated temperatures and embrittle the matrix at low temperatures. They can also have a significant effect on thermal expansion behavior which will be illustrated in subsequent figures
125
100 HI (0
Q.
X
w CO
05
I Rm. temp. 157°C y'Rm. temp.
121°C
+121°C
T300/934, Gr/Ep. [45°]4
Non-irradiated 1.0x10¹⁰rads
1 1 I •2 .4 .6 .8 1.0 1.2 1.4
Strain ex (%)
Figure 14
40

■ff* +m l-Wfyy^..
EFFECT OF ELECTRON RADIATION ON COMPRESSIVE RESPONSE OF Gr/Ep COMPOSITES AT ROOM TEMPERATURE
TUT«Se2 effeCt °f ^f °" f ^ compressive response of [0]8 and [90]8 laminates of T300/93412 was measured (ref. 3) at -157°C, RT, and 121°C. Irradiation had very little effect on
-10 -15 -2 0 -2.5 AXIAL STRAIN (•/.)
o) 90° Response
-30 -3 5 -0.3 -1.0 -1.3
AXIAL STRAIN (%)
b)0° Response
-1600
-1200 ; c
•800 1 b a »- v
-400\
-20
Figure 15
41

THE EFFECT OF ELECTRON RADIATION AND THERMAL CYCLING ON MICROCRACK FORMATION IN T300/934 Gr/Ep
The effects of sequential radiation and thermal cycling on induced microdamage in the T300/934 Gr/Ep (ref. 4) are presented in figure 16. This figure shows typical X-ray radiographs of 4-ply [0/90/90/0] laminates after (1) 500 thermal cycles, after (2) 500 cycles followed by irradi- ation (104 Mrads), and after (3) irradiation followed by 500 thermal cycles. In each case the thermal cycles consisted of cycling the specimen between -156°C and 121°C using a 20-minute cycle period. The specimens that were thermally cycled only and thermally cycled and then irradiated had approximately 7 cracks/cm in the 0° and 90° directions. However, the specimen that was irradiated and then thermally cycled developed approximately 30 cracks/cm.
The effect of radiation on matrix microcracking was found to be even a worse problem in an elastomer-toughened 121°C epoxy system (CE 339). Exposure to 1 MeV electrons caused severe degradation of the matrix at moderate doses of radiation (ref. 5). At a total dose of 1010
rads ihe residual ultimate tensile strengths of irradiated fiber-dominated specimens were about 50 percent of those of unexposed specimens. Microcracking in irradiated and thermal cycled specimens was extensive. The elastomer used to toughen the matrix in this composite system was found to be extremely sensitive to radiation and underwent crosslinking at low (107 -108 rads) total doses.
T300/934 10/901.
Thermal cycled: 500 cycles, -156°C — +121°C
30
Crack density, racks/cm
15
Thermal cycled and irradiated: in
500 cycles (- 156+oc - +121°C) - 101U rads
Ni r: :{j}l.:tf pi. !(!.' .«frtlt-friri -
Irradiated and thermal cycled: irradiated (1010 rads) — 500 cycles (-156°C - + 121<>C)
... j Thermal Thermal Radiation cycle cycle followed by only followed thermal
by rad cycling
Figure 16
42 ORIGINAL PAGE BLACK AND WHITE PHOTOGRAPH
i
!

EFFECT OF THERMAL CYCLING ON CTE IN THE 0° DIRECTION
During thermal cycling of graphite epoxy composites microcracking can result as illustrated in figure 16 from the combination of residual fabrication stresses and the thermal stresses induced by the mismatch in thermal expansion between the fibers and matrix and between adjacent plies of different orientations. Radiation damage to the resin matrix can further contribute to microcracking by creating low molecular weight polymer products which embritde the matrix at low temperatures. The combined effect of thermal cycling and radiation damage on the CTE of a [0,90,90,0] T300/934 composite laminate is shown in figure 17. The composite was cycled up to 500 times between -156°C and 121 °C in a baseline (or unirradiated) condition and after exposure to 1 MeV electrons for a cumulative exposure of 1010 rads. The CTE of the baseline material was essentially unchanged after 500 thermal cycles indicating that no significant damage was developed in the composite as a result of thermal cycling. However, the CTE of the irradiated composite laminate was substantially reduced by thermal cycling indicating development of damage in the composite.
X-ray microgradiography of the composites showed that the crack density in the 90° plies was approximately 30 cracks/cm after 500 cycles. Microcracks in the 90° plies reduce the CTE of the laminate in the 0° direction because the 0° plies have a more dominant role than when there are no cracks in the 90° plies.
T300/934
« x10" 3r-
CTE, o o Irradiated (1010rads)
[0,90, 90,0] Range of CTE measurements -150°Cto+25°C
I I I I I 100 200 300 400
Number of thermal cycles
500
Figure 17
43

EFFECTS OF RADIATION ON THERMAL EXPANSION
Radiation degradation of matrix resins combined with a cyclic thermal environment can affect the dimensional stability of polymer matrix composites in two ways. Radiation-induced chain scission can produce degradation products that plasticize the matrix at elevated temperatures which can change the way in which residual curing stresses are relayed in the composite, and degradation products can embrittle the matrix at low temperatures, resulting in matrix micro- cracking. Irradiation can also result in additional cross-linking which can embrittle the matrix resin.
Figure 18 shows the effects of radiation degradation products on the thermal expansion behavior (ref. 6) of a typical 177°C cure Gr/Ep composite ([02/902]s T300/5208). The irradiated specimen shows a pronounced nonlinearity at elevated temperature and a permanent negative residual strain of approximately -67x10-6 at room temperature after one thermal cycle to -157°C Repeated cycles over the same temperature range give a strain response parallel to the unirradiated curve, but displaced by the permanent residual strain present after the first cycle. However if the specimen was cycled to a higher maximum temperature, an additional change in slope of the thermal strain curve occurs which results in an additional permanent residual strain.
T300/5208 (02/902)s Laminate
300 xl0"6
200 Baseline
100
Thermal strain 0
6xl09RADS
s s s
-100
-200
-300
-400 1 —J 1 1 | | 1 -200 -150 -100 -50 0 50 100 150
Temperature, °C
Figure 18
44
Ü

1 j i
DYNAMIC MECHANICAL ANALYSIS OF T300/5208 GRAPHITE EPOXY
The elevated temperature nonlinear strain response and subsequent permanent residual strain at room temperature shown in figure 18 are related to radiation degradation products plasti- cizing the matrix and can be explained by the DMA results (ref. 7) presented in figure 19. The damping data for the irradiated composite show that the Tg is lowered by approximately 22°C and a broad "rubbery region" is produced compared to the unirradiated composite sample. During the thermal cycling tests the specimen was lifted into the region where the matrix could flow, thus relieving residual tensile curing stresses resulting in a more fiber-dominated response at high temperature (nonlinear region) and permanent negative residual strains at room temperature. On subsequent thermal cycles no additional changes were measured. The reason for this behavior may be related to the procedure used to run the thermal expansion tests. The heating process in these tests occurred slowly in 22°C increments, with 30-minute holds at each temperature. In the 107°- 138°C temperature range, chemical changes apparently took place resulting in a movement of the "rubbery region" back to higher temperatures out of the thermal expansion test range. Thus on subsequent thermal cycles to the same temperature no additional changes were measured.
Young's Modulus
Loss .Modulus
Unirradiated
Unirradiated
L— Maximum temp, in CTE test Mil!
-200 -100 0 100 200 300 400 500 600 Temperature, °F
Figure 19
45
i

FLEXIBLE SECOND-SURFACE MIRROR (SSM) THERMAL CONTROL COATING
Polymeric second-surface mirror coatings are so named because the reflecting coating is on the second surface (non-sun-facing side) of the polymeric film as illustrated in figure 20 To obtain a high reflectance (low solar absorptance) the polymeric film must be highly transparent to the solar spectrum from.250 to 3000 nanometers since sunlight passes through the film and is reflected back through the film into space. The reflecting coating is typically an opaque thickness of silver or aluminum with a thin over-coating of stainless steel to provide corrosionprotection An adhesive is apphed to the stainless steel side of the SSM for bonding the SSM to a spacecraft.
Although the polymeric film is transparent in the solar wavelength region, it possesses infraica absorption bands characteristic to all polymers. These IR absorption bands give rise to the thermal emittance characteristics needed for this SSM to perform as a thermal control coating As the thickness of the polymeric film increases, the emittance also increases to some limiting value near 0.9. Solar absorptances as low as 0.08 with emittance values of 0.92 have been obtained with polymeric second-surface mirror coatings.
Sunlight
Thickness (mils)
\x~ Transparent -y Polymeric I \ Film
Reflecting Metal
Adhesive J^^Jjyrtm"i!!-. *7"' "T'JF ^»'-"'■TJ—™!"' ■ i >I,I«™I» 91,1111 WJI ■!!■■
Figure 20
ORIGINAL PAGE BLACK AND WHITE PHOTOGRAPH
46
fi

4 ORIGINAL PAGE BLACK AND WHITE PHOTOGRAPH
TRANSPARENT POLYIMIDE FILMS
Space durable polymeric films which have high optical transparency in the 300-600 nm range of the electromagnetic spectrum are needed for applications such as second-surface thermal control coatings, solar cell covers, and multilayer insulation blankets. Although several classes of polymers which are transparent/colorless are available, such as polyesters, aliphatic polyimides and FEP Teflon, these materials have limited long-term stability in the space environment, especially in orbits where high energy ionizing radiation is present. Aromatic polyimides have good toughness and flexibility, good thermal stability, high mechanical strength, and good radiation resistance but these polymers generally have poor transparency in the visible range. Commercial aromatic polyimide film is approximately 70% transparent (depending on thickness) in the 500 nm wave- length range which is the wavelength of interest for space applications. The transparency will also decrease with exposure time in space.
A new series of highly optically transparent linear aromatic polyimide films has been synthesized (refs. 8-9) with variations in the polymer molecular structure aimed at reducing electronic interactions between polymer chains to increase optical transparency. Polymerizations were performed with highly purified monomers with the result that several polymers were produced with good optical transparency compared to commercially available polyimide films such as Kapton as illustrated in figure 21. The more transparent films were evaluated for use in the space environment and typical results are shown in figure 22.
iM^^@c«3nHM(Mi
JiM'HH
Kapton 6F-DDS0, 6F-BDAF 6F-APB 0DPA-APB
/ 5
Figure 21
47

EFFECT OF ELECTRON RADIATION ON TRANSMISSION OF TRANSPARENT POLYIMIDE FILMS
Several series of linear aromatic polyimide films have been synthesized and characteri7ftH nl?£Trl
afler SimUlated sPfce«P°s^ Orf. 10). To maximize opTSp^ncyTgWy 52^ T0n?erS ^uere USed ^ scveRd chanSes were made i" the molecdar^S to reduce rhe color intensity. The propemes of the films were fully characterized indudingdSSSSSnS S,J^S^°^temperatUr^ ^ Polymer decomposition temperature, transmifsbn ™Se spectra infrared spectra and sofubility in selected organic solvents. Tj^icd UV-Ssible säcS of A i S Tmg fdmS bff0re and "*" ^ fdmS were exP°sed to J MeV electron^for a toS dose
of 5x10* rads representative of 20-25 years in an orbit in the trapped radiation belts such as ^SSfT °-US ffh MAt (GE0) ^ Sh0wn fa fiSure 22' TrSmissionsSa of 6F dianhy- dende-contaimng films are compared to -ommercially available Kapton H filmte 0 5-mSck films were approximately 95% transparent at 500 nm before electron exposure and were 85 to 95% transparent after exposure to 5x10* rads. The 6F+3,3"-ODA polyimide was esneciallv radarion stable and showed only a 2% reduction in transparency at 5W™ after eTeS^ Äfleremained flexible after radiation exposure and no changes in molecX sSS w^e ™Sc£5 ^HT^^T ^^dspectroscopy. The combination of good radiation(W and electron) stability good thermal stability, high optical transparency, and solubihtv nSce the« polymers very attractive for space applications either as polyme? films^r%ray coarSgs
Transmission percent
100 r- 6F + AP3
80 _ 6F + 3-3'-ODA 6F + BDAF
6F + DDS02-^' 601" 6F + 3.3--6F '
40
20
300 400 500 Wavelength, nm
100 400 Wavelength, nm
Figure 22
48
aassa

SPACE MATERIALS DEVELOPMENT
sPj*ce materials research and development is a continuing research thrust (fig. 23) within NASA. The objectives of this work are to develop new and improved materials for future NASA space science instruments and spacecraft for the civil space industry. The desire to increase design bfeumes combined with stringent requirements on precision, structural weight and performance have established guidelines for development of new long-life materials. However, materials development is a long-lead activity and requires long-range research programs to not only develop the materials but also conduct simulated space exposure testing to establish the long-term durability of these materials in the space environment. Short-term (2-3 yrs) "Advanced Development Programs" similar to that conducted for Space Station are not adequate to develop, test, and certify long-term space durability on new materials.
u
NASA's charter is to develop technology to advance the civil space program
NASA's customers are the civil space industry and space science community
Materials focus should be on development of new and improved materials and long-life certification of selected existing materials
Materials development needs to be a long-term continuing R&D effort - 2 to 3 years "Advanced Development Programs" are generally not adequate
Figure 23
49
&

NEW MATERIALS DEVELOPMENT
One of the most fundamental needs in new materials development is a clear definition of the material requirements (fig. 24) and the relative importance of each requirement. These require- ments need to be as specific as possible. For example, simply to specify high strength and stiff- ness for structural composites is not very useful to the materials engineer. He reallv needs to have target mechanical, physical, opticai, and electrical properties so that he can select the appropriate fibers, resins, layups, and coatings to achieve high stiffness, low CTE, good compressive strength, high resistance to thermal fatigue, low outgassing, and other critical properties as required. It is also important to define the service environment to insure that service life simuk • tions are conducted in realistic exposure conditions. A fresh new look is needed to develop test standards for space qualification of materials for long-term (20-25 yrs.) service in space.
■-*
*-
Testina Issues
Mechanical, physical, optical property requirements
Material property data base - What is required and when is it developed?
Test standards - Are existing space qualification guidelines adequate?
Figure 24
50
*

LONG-LIFE CERTIFICATION
Established test procedures for long-life certification of space structures do not exist. Spacecraft have been designed and built for relatively short lifetimes, 3-8 years, based on limited test data. Nearly all of the environmental effects data in the literature are for exposure tc a single environmental parameter such as ultraviolet radiation, electron radiation, micrometeoroid impact, etc. Very little combined exposure data exist. Also the chemical formulation of many of the polymers and composites of interest for space hardware have changed over the past decade.
For long-life (20-25 yrs.) certification acceleration methodologies (fig. 25) are required for realistic combined exposure conditions. These methodologies must be based on a fundamental understanding of damage mechanisms in the materials. Benchmark flight experiments are required to verify ground-based simulations to insure that damage mechanisms observed under accelerated exposure conditions are the same as produced in space. Space environmental effects testing is very time consuming and expensive and new approaches are required to insure that data generated on existing materials will be useful for certification of tomorrow's materials.
• Acceleration methodology - must be based on knowledge of damage mechanisms
• Benchmark flight experiments are required to verify ground-based simulations
• Long-life certification process must be cost effective
How do we accomplish this?
Figure 25
1 i
51
i

7.
9.
10.
52
REFERENCES
23Ä«MlM9aT RePOrt °f ^ ASÜOmar m LDR Worksh°P. JPL Publication 88-
Tompkins, Stephen S.; Ard, K. E. and Sharp, G. Richard: Thermal Expansion Behavior of GraphiWGlass and Graphite/Magnesium. Presented at 18th InterrmtiSsAMPE Technical Conference, October 7-9,1986. «"">»«» o/\mrc
Reichmanis, Elsa, and ODonnell, James H., editors: The Effects of Radiation on Hish- Technology Polymers, Chapter 14: Radiation Durability of Polymeric Matrk cWosites by Darrel R. Tenney and Wayne S. Slemp. ACS Symposium Series 381? 1989? P
W^i?" ST Sy^-S' G- f •ua°ä?owles« D- E: Composite Materials for Space F™?™^;^e^ngSo°f ** ^ E^°Pean SymPOsium on Space Materials in Space Environment European Space Agency SP-232, Nov. 1985, pp. 9-15. P
sSÄf/" aüd B^1CS' D^vid ?•" !?ace Radiation Effects on Ac Dimensional Jul>'1986,pF^39-45 ^ ^ CornPosite' SAMPEOn.rt.rlv vol. 17, no. 4,
Bowles D. E.; Tompkins, S. S. and Sykes, G. F.: Electron Radiation Effects on the STSS^ÄÄö^
COmpOSiteS- ^SPWWn^ndRnrfcm, vol. 23,
Tenney, Darrel R.; Tompkins, Stephen S. and Sykes, George F.:NASA Space Materials Research. Large Space Antenna Systems Technology Conference - 1984?Dec4-6i, 1984.
SL Clair, A. K.; St. Clair, T. L. and Shevket, K. I.: Proceedings of the Division of Polymeric Materials Science and Engineering, vol. 51, p. 62,1984. U1V1S1°n or
?i^,*AniÜ- h™* SleAmP',.Wayne S.: Evaluation of Colorless Polyimide Film for
Thermal Control Coating Applications. SAMPJJojmiaL July/August K, pP ?8-33..
St Clair A K ; St Clair, T. L. and Slemp, W. S.: Optically Transparent/Colorless
/

«UPVWSWPÄWIIJit ■""•"
,"U .UJI.IHI. .win.
f
*£'$• i
'Es lift
■•■»•
id *•"- 1{-eS4 ' f'
S^Ä*
l# :#■
Ü
■',. •.:« ■
MSP
■-*$
■ j^^^^^ISi
"' p&$gpssp
M:
■a*.^..*. fc-j^ltj^.'jafc.^Aj Illlliiiii
::*ä

""* L '"*" •— m■'" -■■*■»■ iniiiiiiiw»—in m »i—»■ Mwmijin,favmMMmryjaJMt'jAjiy.'
N89-23531 RADIATION EFFECTS IN SPACECRAFT ELECTRONICS* * ~
James P. Raymond Mission Research Corporation
San Diego, California
al . In this Presentation effects on the internal sDacecraft electron.cs due to exposure to the natural and enhanKS space on iS1^ enY1"nMnt will be reviewed. The emphasis will be placed on the description of the nature of both the exposure environment and failure mechanisms in semiconductors. Understandinrr hTfh fh! f environment and device effects is IritlS?S tneIseof laborltorv" simulation environments to obtain the data necessary to des °gn and qualify components for successful application. aesign and
*Work was partially supported by MRL under Contract N00014-85-C-2642
53
5

<;
,J "
Energy Deposition
For the internal electronics of a spacecraft the radiation exposure is characterized in terms of the energy deposited in critical regions of the piece parts, m modern electronic systems, the most sensitive pieceparts of the discrete semiconductor devices and microcircuits. It follows, therefore, the critical materials of interest are silicon and silicon-dioxide.
The absorbed energy is described in units of radiation absorbed dose for the material, or rad (Silicon) in this case, as shown in Figure 1. The energy can be absorbed in the semiconductor material by either ionizing or nonionizing means. For exposure by x- or gamma- rays (important principally in laboratory simulation environments) the energy deposition is almost exclusively by ionization. For the high energy electrons of the space radiation environment, energy deposition is principally by ionization. For the high energy electrons of the space radiation environment, energy is deposited by both ionization and nonionizing atomic displacements. For neutron exposure (important in laboratory simulation of displacement damage) the absorbed energy is almost exclusively in displacement damage, although the neutron exposure is always associated by concomitant ionizing gamma rays. It will be shown that ionizing radiation effects, both by accumulated effects and that of a single particle, are of principal concern to the internal spacecraft electronics.
■ Absorbed Energy - rads(Silicon)
-One rads(Si) = 100 ergs/gram (Silicon)-
■ X-/Gamma Rays: Ionization Exclusively
■ Electrons: Principally Ionization
■ Protons: Ionization and Atomic Displacement
■ Neutrons: Principally Atomic Displacement
FIGURE 1
54

System/Simulator Exposure Environments
BlenfJpf.e radiation environments can be initially scoped by the
enJironSänf UCa^ aCCUn,Ula^ed ioriz^ radiation for both the natural environment and an environment enhanced (i.e., pumped-up) by the trapped electrons of a high-altitude nuclear weapon detonation as shown m Figure 2. Also shown is the range of expoSSe levelsT typical fonizinSS^S-ng \iaborat°ry Cobalt-60 source for the simulation of ionizing radiation effects.
100 mif16 iymS^U^tr0nit1nuS rePresent the absorbed dose behind a
100 mil semi-infinite slab of aluminum, for orbital altitudes 60n9angH fcfn°mH150 t0 6°'000 km' and for orbital inclinations assumed ovJ^TV YSt^ exPosure to the "»tural environment was assumed over the range of one to thirty years. The enhanced environment is summarized for an exposure of Lo days [courtesy or Mr. S.C. Rogers, JAYCOR, and the Defense Nuclear Agency]. LCOUrCesy of
The lower ranges of exposure are representative of the environments at low earth or geosynchronous orbit, while the peak StiES? areÄ|°^.
environment roughly between 1,000 'and 20,OoS to in liJiS H.,*
Addh1-tl1°".
al shieldi»g will further reduce the exposure i^Si!;. bUt^ shleldin<? of the electron dose is limited b? the production of gamma rays by bremsstrahlung. Y
It should be noted that the exposure rate for the natural SSSKf iS substantially lower than that typical of CoSalt-eJ simulation exposures, and that the levels of exposure for the enhanced S£r2Ze™*are, b°th- substantially greater and
P at a higher inSns^ty than the natural environment exposure. x«i.c.iaj.i.y
0 2 4 6 8 Exposure Time, log (seconds)
10 \,
FIGURE 2
55
a

Summary of Semiconductor Device "Total Dose" Susceptibility
There has been extensive characterization of the permanent damage effects of ionizing radiation exposure of semiconductor microcircuits and devices for evaluation and qualification in systems required to survive space or nuclear weapon radiation exposure. The estimated ranges of observed hardness on a variety of semiconductor devices are shown in Figure 3 (Refs. 1,2).
In summary, the minimum level of concern for ionizing radiation exposure is on the order of 1,000 rads(Si) for the most sensitive devices; virtually all microcircuit technologies may be suspect at
S??"re 1;velS °-f 10'°00 rads(si>' an<*' with hardening and performance downscoping, an electronic system can be realized that can perform after exposure to greater than 1 Mrad(Si).
TECHNOLOGY 2 3
10 10 I—'—T '247'
10
n-MOS
Bulk CMOS, Commercial/Hardened
CMOS/SOS, Commerical/Hardened Junction-Isolated Bipolar
TTL Low—Power TTL ECL
Oxide-Seporated Bipolar Commercial Analog Bipolar
1 MHz f-j Bipolar Transistor
2 4 7
10 10 n f—r 2*7 2 4 7
10
2 4 7
^>W<XXXX)000W00W<1
kyxyy^w^^^yvvxvvv)^
56
2 47, 2 47, 247, 2 47, 2 47, J L_lJ 1 LJJ | III l ill
I 2 ♦ 7I I I I I I
10' 10- 10" 10-
Tetal Ionizing Dose, rads(Si)
FIGURE 3
10c 10'
P

Accumulated Ionization Failure Mechanisms
The basic failure mechanisms of accumulated ionization damage t in semiconductor devices, as summarized in Figure 4, are the result of
r hole-electron pair generation in critical silicon-dioxide isolation £ layers. The first failure mechanism is the result of holes being ■I trapped in the oxide layer after the electrons are swept out by the V applied electric field. The second failure mechanism is the result j of an increased density of interface states formed at the active-
silicon: silicon-dioxide interfaces. The manifestations of these basic failure mechanisms in the microcircuit elements include threshold voltage shift of the MOS transistors, gain degradation of the bipolar transistors, and a general increase in junction leakage currents (Ref.
» 3). At the overall circuit level, the result is degradation of ; overall performance such as drive capability and switching speed.
Eventually, with sufficient exposure, the damage becomes sufficient to ,v cause functional failure of the microcircuit.
Accumulated Ionization
- Oxide Trapped Charge
- Interface States
a Threshold Voltage Shift
a Increased Leakage Current
Parameter Degradation
Functional Failure
FIGURE 4 I
!
57 I
e

CMOS inverter Failure Modes
The nature of the observed failure of even simple microcircuits in application can be relatively complex. For example, considering a hypothetical illustration of the threshold voltage shift of the n-MOS and p-MOS transistors of an inverter pair, as shown in Figure 5, circuit failure can occur in at least three different ways depending on the circuit application. In the first case, if the application is very sensitive to power supply leakage current, failure will be observed as soon as the threshold voltage of the n-MOS transistor becomes less than zero. If the design is tolerant to power supply leakage current, at a higher exposure level (in this example) failure may be the result of an unacceptably large shift in the p-MOS transistor threshold voltage. Finally, if tolerant to the first two, functional failure in the inverter will inevitably result when the sum of the n-MOS and p-MOS threshold voltages exceeds the power supply voltage.
To further complicate the situation, the threshold voltage shifts of the MOS transistors are functions of the applied bias during radiation exposure as well as the intensity (or dose rate) of the exposure. The point here is that to interpret the observed effects in a complex microcircuit it is necessary to understand the basic nature of the effects in the individual element technology.
«3 5 -
>
o o >
o <n v
Q
N-MOS
Accumulated lonizaticn, rads(Si)
-5 -
FIGURE 5
58
a

<1
N-MOS Transistor Threshold Voltage Shift
^ u T° i:i-lustrate, consider the basic nature of variations in the 6 t°ltJ?ltar Shl-ft °f an n"M0S transistor, illustrated in Figure t' ?;a^H
10K Prev"Vsiy' the two basic failure mechanisms involved are trapped charge and interface states (Ref. 3). As it turns out in
lLn't^SJ^ZSiSt^' thS ?apped Charge «««Its ift a negatSS shift or the threshold voltage and the interface state buildup results in a exSosSe ^bo'th l^ ^«f1"»1* ^tage. During ionfzing "radiation exposure, both trapped charge and interface states are created continuously. Also during a long exposure (e.q qreat-rthan tendf^o thS tr?P.ed Charge ^-lsgand Pthe interne sYate denXS sSif? ^h
aC0CUmUlate-- A? a reSUlt' the ob^rved threshold voltagj
trillJ iSfiJBxposur1e. ls »»trong function of the time dependencies of
trapped hole annealing and interface state buildup. As shown, only the relative rate of interface state buildup is varied. If the interface state buildup is rapid, the effects of trapped charge are Sell? compensated and the minimum threshold voltage of the transistor remains greater than zero. Conversely, if the Äterface^tatfEulldup is slow the negative excursion of the threshold voltaae is substantial. It should be noted that, at least in this hypothetical example for sufficiently long exposures, eventually the interface state buildup will dominate and the threshold 4ltage shift will increase above its initial value. 9 irx: Wlil
:ii
12-
10-
VI
% 8 >
o
-4-
Moderate
Interface State Buildup
Fast —^ / v
1k 10k _2J_ Accumulated lonization, rads(Si) \
Slow /--
FIGURE 6
9 P
59

Variations in Microcircuit Hardness
As an example of the significance of the exposure environment on the effective microcircuit hardness, consider a hypothetical (and somewhat contrived) example of the effective failure level of three different microcircuits (Figure 7) . It will be assumed that each of the three types was measured at an effective hardness of 100,000 rads(Si) for a 10,000 second exposure in a Cobalt-60 source. If the microcircuit hardness is essentially determined by interface states (as might be the case for some MOS microcircuits) , the failure level will be highest for high-intensity exposures at short times following radiation exposure. As the exposure time increases, the effect of the interface states will increase and the effective hardness will monotonically decrease. On the other hand, if the effective hardness is essentially determined by trapped charge in the oxide, annealing effects (as might be the case in advanced recessed-oxide bipolar microcircuits (Ref. 4)), are small for high-intensity exposures and at short times following exposure, will limit the hardness. As the exposure time is increased, annealing of the trapped charge becomes more effective and the effective hardness increases. Finally, in what perhaps is the worst-case, if both interface states and trapped charge are important, the effective failure level can be lower than that observed in the Cobalt-60 characterization at either higher-intensity or longer-duration exposures (Refs. 5,6).
6
0) m 0 Q
i a ^
CO s_*
7 *d 4 to ca * £h 'fl to •a s a
o H
Interface Spates
L
\
I? *
£ *\
i $ M- -
>
0 2 4 6 8 Exposure Time, log (seconds)
10
60
FIGURE 7

Rl W.MI i Jl «in. M.I1 - '.UlWii ip* #w:«ff^^C-tw»^w^iu»n.i^ nxj-^-KW* :wivimr>n>»ri*y! .'"'if-y. 1
Displacement Damage Failure Mechanisms
In addition to accumulated ionizing radiation effects, exposure to the high-energy space proton environment causes atomic displacement damage in semiconductor devices and microcircuits, summarized in Figure 8. The basic failure mechanism of the atomic displacements is an accumulated reduction in the silicon minority carrier lifetime which, in turn, degrades the current gain of bipolar transistor elements and increases junction leakage currents (Ref. 3). The observed effects of the element degradation are accumulated performance degradation of the microcircuit and, eventually, functional failure.
Displacement Damage
- Minority Comer Lifetime Degradation
a Bipolar Gain Degradation
o Increased Leakage Currents
Parameter Degradation
Functional Failure
FIGURE 8
1 i
)
61
6

)
Range of Neutron Damage Susceptibilities
Almost all the data on semiconductor device susceptibility to radiation-induced atomic displacement d?mage have been obtained by exposure to the neutron environment of nuclear reactors. This work has been done to support the hardened design of military systems that must survive a nuclear weapon radiation environment. Shown in Figure 9 are the estimated ranges of neutron damage susceptibility for the same semiconductor device technologies shown previously for accumulated ionization damage (Refs. 1,2). In terms of relative susceptibility, the MOS technologies, not critically dependent on high minority carrier lifetime for performance, are very tolerant to neutron exposure. Those technologies depending critically on high minority carrier lifetime such as the wide-base power transistor, commercial analog microcircuits using wide-base lateral pnp transistors, and older digital microcircuits are relatively susceptible to displacement damage. Modern digital microcircuits (and hardened analog microcircuits) use very fast bipolar transistor elements and are much less susceptible to displacement damage.
TECHNOLOGY io11 io12 io13 iou io15 io16
I—i—i—n—i—rrn—i—rri—i—r~n i rri 1 2- 4 7 ' 2 471 2 + " ' 2 471 2 471
n-MOS
Bulk CMOS, Commercial/Hardened
CM OS/SOS, Commerical/Hardened
Junction—Isolated Bipolar
TTL
Low—Power TTL
ECL
Oxide—Separated Bipolar
Commercial Analog Bipohr LT
1 MHz f-. Transistor I ]
2 47, 2 47, 2 47, 247, 2 47 l 111 I 111 I 111 I I I I I L_l_ L
1011 io12 io13 io14 io15 • 1016
Ne utron Huence, n/cm , 1 MeV equivalent
FIGURE 9
62
\ \

Schematic Representation of Device Susceptibility
Determination of the dominant failure mechanisms in electronics piece parts is important in the determination of the laboratory facilities required to evaluate and qualify candidates. Through careful analyses and experimental validation, the relative effects of ionization and displacement damage have been established for both the ?pÄIeiT?T pr£Ü°n£? a"d- electrons °f the space radiation environment («ets. 7,8). The ionizing contribution can then be related to device 7,tl / oVt S^3S observed in laboratory exposures such as with the Sho« I a ? f S't° s°"rce- . The displacement damage contribution can then be related to the device failure levels resulting from nuclear reactor exposure. Shown in Figure 10 are the device failure ranges. S2,^lnef relr.elent the ratio °f displacement damage and ionization damage for high energy protons and electrons. with a little reflection, it can be seen that if the device failure range falls a^TL^S Pa^icle equivalent line, the dominant failure mechanism is if?iZ U°n ( ??', 2)* .Conversely/ if the device failure range falls below the particle equivalent line, the dominant failure mechanism is displacement damage. As shown, ionization is the dominant failure mechanism for virtually all semiconductor technologies for high energy electron exposure. The exception is the susceptibility of the solar cells that are very sensitive to displacement damage and insensitive iZJ?*+? °? damage. For proton exposures, either displacement and ionization failure mechanisms can be dominant, but only for those technologies most susceptible to displacement damage. For virtually ™iih,«°- • d^qitali. «icrocircuit technologies, the dominant failure mechanism is ionization.
-Power
Solar Cell
103 10+ 105 ■ 106 1Q7 108
Ionizing Dose. rads(Si)
FIGURE 10
63

Single Particle Interactions in a P-N Junction (Ref. 9)
Single event effects in semiconductor devices, as shown in Figure 11, are the result of the intersection of the particle lomzation path with a p-n junction. The result is a junction transient current that determines the overall device effect The lomzation track of the particle is characterized by its Linear*Energy Deposition and range. For a high-energy cosmic ray (such as a 100 MeV lithium ion) the particle range is long compared to the semiconductor device dimensions. On the other hand, high energy proton effects are the result of energy deposition produced by the atomic product of a nuclear interaction between the proton and an atom of the semiconductor material such as a silicon recoil or product alpha particle. ^ ^
. Because the junction transient current is a very fast pulse (typically less than 1 ns) the circuit or device effect can be characterized in terms of a critical charge. The charge collected is determined by the particle LET and the effective collection volume of the junction. The overall susceptibility of the device or circuit is characterized by a cross section, typically in units of inverse square centimeters (i.e., cnT-2). The probability of observation of the effect is the product of the particle fluence and the cross section.
50 MeV Proton
100 MeV
200 urn
FIGURE 11
64

Single Particle Failure Mechanisms (Refs. 10-14)
The basic failure mechanisms of a single particle in a semiconductor device, summarized in Figure 12, are the ionization produced by the primary or secondary particles. The failure mechanisms observed in the overall device include the upset of stored data and potential damaging effects of latchup or device burnout. The data upset can be the result of a particle-induced change-of-state (i.e., flip) in a memory cell or flip-flop, or an electrical transient that can be interpreted as valid data by a latch. The most sensitive devices to bit upset effects are dynamic random-access memories, which are generally unacceptable for space applications. Bit upset r-ate<= for very sensitive semiconductor memories in space can be as great as 1E-4 upsets per bit-day, that is an average of one bit upset for every 10,000 bits of stored data in a single day, to less than 1E-8 upsets per bit-day in hardened semiconductor memories.
Latchup has been observed as a result of high-energy heavy-ion (i.e., cosmic ray) exposure in a number of junction-isolated CMOS memories. Dielectric-isolated memory technologies such as CMOS/SOS or CMOS/SOI can be designed to be latchup immune. .
Single particle-induced burnout has been observed in n-channel power MOSFET transistors and electrically-alterable programmable read- only memories. The burnout susceptibility of the n-Power MOSFETs is a strong function of margin between the operating voltage and the d-c junction breakdown voltage. The burnout susceptibility of the EEPROMs has been observed only during the application of high-voltage durinq the write cycle when altering the stored data.
Single Event Effects
- Particle lonization Track
- High-LET Particle Production
Memory Bit Upsets
Latch Data Upsets
Parasitic Latchup
Burnout - Power MOSFET's
- Dec. Er. PROM's FIGURE 12
65
*

5 -/
y
/
Bit Upset in a Read/Write Semiconductor Memory
The n. .oer of bit upsets in a read/write memory increases with particle exposure, as shown in Figure 13, until the memory is reset. Typically, the upset is that of a single memory cell. However, depending on the memory design, a single hit at specific locations can cause either clusters of upsets, or upsets along a row or column of the memory.
increasing Fluence
FIGURE 13
66
a

Bit Upset in a Complex Microcircuit
An important issue in the characterization of single-particle- induced upsets in complex microcircuits is that of the observability of the effect. Figure 14 illustrates cases where the induced upset can either be unobservable or can result in a large number of observed data errors.
The observed effects of an upset in the scratch-pad memory or data latches of a complex microcircuit are a strong function of the location of the upset and subsequent processing of the erroneous data. As the data is processed, the error can propagate down multiple paths. In some cases, these paths never reach an observable output and no upset is observed. The error was present, but under the test conditions used, was simply not observed.
On the other hand, the propagation of the original single upset can result in a multiplicity of paths, each of which, in the worst- case, produces errors at a number of microcircuit outputs. From the observable data, the determination of the actual number of internal upsets can be very challenging but is essential to determine the basic susceptibility of the microcircuit. In practice, careful modeling of the basic cells and a comprehensive selection of test conditions must be used.
Y 1ST CLOCK
(A) BENIGN
2ND CLOCK
HIT 1ST CLOCK
■(B) MALIGNANT
2ND CLOCK
FIGURE 14
67
1

Single T^/ent Upset Rate vs Altitude for Circular Orbits
The observed bit upset rate of microcircuits is a function of the satellite orbit as well as the microcircuit technology, as shown in Figure 15 (Ref. 9). At low and high altitudes, the bit upset rate is dominated by the cosmic ray environment. At altitudes from approximately 700 to 3,000 nautical miles, the bit upset rate is dominated by high-energy protons (for a circular orbit). The orbital dependence as shown, scales with the fundamental bit upset rate of a given microcircuit technology. A highly susceptible technology might have a bit upset rate on the order of 1E-4 upsets per bit-day. On the other hand, a less susceptible (nr hardened) technology might have a bit upset rate on the order of 1E-8 upsets per bit-day or less.
o I m k_ - <u Q.
Q.
10
10
10
s-4
10 -7-
10 ,-8
Coamfc Rays
i
100 300 1000 3000
Altitude, Nautical MHes
10,000 20,000
FIGURE 15
68
S

1 Microcircuit Parasitic PNPN Latchup Path
The mechanism of single-particle-induced latchup in a microcircuit is the regenerative action of an internal parasitic pnpn path when triggered by the particle-induced transient current pulse, as shown in Figure 16. Latchup will result when the transient current pulse is sufficiently large to initiate regenerative switching, and if there is an allowable current operating point at a dc current above the I-V characteristic holding current. The most susceptible microcircuit to single-particle-induced latchup is junction-isolated CMOS (Ref. 11). Latchup is also possible in junction-isolated bipolar, but has not yet been observed. Dielectric isolated technologies such as CMOS/SOS or CMOS/SOI are latchup-free.
R.
en
ep
■^ /
>J Load Li ■f c ~'ii N. y 3 v o
i /
T5 •H ■ •" — _
o s \ H
Anode-Cathode Voltage
R W
50 100 150 200
FIGURE 16
69

Power MOSFET Cross Section
The single-particle-induced burnout susceptibility of a Power MOSFET (shown in cross section in Figure 17 courtesy of John Adolphson, NASA Goddard) is the result of avalanche multiplication of carrier generated in the ionization track which results in current- mode second-breakdown (Ref. 12). Burnout will occur if the drain bias voltage is above the second-breakdown sustaining voltage (which can be substantially lower than the dc drain-source breakdown voltage).
Source Metal Gate Metal
Channels
N+ Substrate
&
FIGURE 17
\
70

Cosmic Ray LET Spectra with Device Failure Mechanism Thresholds
Cosmic ray effects in semiconductor devices and microcircuits can be characterized by the energy deposition of the particle in the bulk semiconductor (i.e., Linear Energy Transfer or LET), and the cross section which is the probability of the effect normalized by particle fluence. Figure 18 shows the LET spectrum of cosmic rays (Ref. 15) with estimated thresholds for the various failure mechanisms presented. Clearly, bit upsets are quantitatively of greatest concern. The LET threshold for latchup is much greater than that for bit upset, and that for burnout is even greater than that of latchup. While latchup and burnout are much less likely that bit upset, it should be noted that the consequences of these effects on system performance can be much more severe.
LATCHUP
°- 10"
BURNOUT
10 0 10 10^ 10^ 10^ LET, MeV/g/cm2
10'
*NRL Memorandum Report 4864, August 1982
FIGURE 18
71
3

} Hardening Approaches
i There are three basic hardening approaches that can be used for * spacecraft electronics, as summarized in Figure 19. The first, of ( course, is the selection of components of minimum susceptibility. 1 unfortunately, however, it is very difficult to realize both very high i hardness and very high electrical performance. j Shielding, for some aspects of the environment, can be very | effective. Careful placement of the sensitive components can take
advantage of the shielding of existing, less sensitive, spacecraft j materials. Additional shielding can be added as necessary (until a
fundamental limit is reached) at either the individual semiconductor device or the subsystem electronics box. It is important to note that while shielding is very effective for electrons and low-energy protons, the shielding to electrons is limited by the generation of bremsstrahlung gamma rays which are much more difficult to shield. Shielding is generally quite ineffective to reduce the effects of
I high-energy protons, and can be counter-effective for the shielding of { cosmic rays. For the cosmic rays, shielding tends to be ineffective I and even somewhat counttr-productive. j Hardening techniques can be employed that include well known j redundancy and error detection and correction techniques to reduce the , effect of bit upsets. Hardening techniques for latchup and burnout
effects on the system level can include current limiting, but hardener", device selection is probably the preferred approach.
■ Component Selection -
■ Shielding - Self-Shielding
~ Spot Shielding
~ Box Shielding
- Note: Shielding Limitations
Electrons - Bremsstrahlung limit
High-energy Protons
Cosmic Rays
■ System Hardening -Redundancy
- Error Detection and Correction
" Current Limiting (Latchup/Burnout) FIGURE 19
72
5

1
References
- 1. Electronics Radiation Response Information Center, Kaman TEMPO, •£. P.O. Drawer QQ, Santa Barbara, CA 93102
2. "Comparison of Neutron, Proton, and Gamma Ray Effects in * Semiconductor Devices, J.P. Raymond and E.L. Petersen, IEEE Trans. fC on Nuclear Science, vol. NS-34, no. 6, pp. 1622-1628; December, 1988
;. 3. "Basic Mechanisms of Radiation Effects in Electronic Materials and } Devices," F. Barry McLean and Timothy R. Oldham, Harry Diamond
Laboratories Report HDL-TR-2129; September, 1987
4. "Total Dose Effects in Recessed Oxide Digital Bipolar Microcircuits," R.L. Pease, R.M. Turfler, D. Platteter, D. Emily and
1 R. Blice, IEEE Trans, on Nuclear Science, vol. NS-30, no. 6, pp. 4216-4223; December, 1983
-. 5. "Super Recovery of Total Dose Damage in MOS Devices," A.H. ! Johnston, IEEE Trans, on Nuclear Science, vol. NS-31, no. 6, pp. ;. 1427-1433; December, 1984
.' 6. "Physical Mechanisms Contributing to Device 'Rebound'," J.R. Schwank, P.S. Winokur, P.J. McWhorter, F.W. Sexton, P.V. Dressendorfer and D.C. Turpin, IEEE Trans, on Nuclear Science, vol. NS-31, no. 6, pp. 1434-1438; December, 1984
7. "Correlation of Particle-Induced Displacement Damage in Silicon," G.P. Summers, C.J. Dale, E.A. Burke, E.A. Wclicki, P. Marshall, M.A. Gehlhausen and M.A. Xapos, IEEE Trans, on Nuclear Science, vol. NS- 34, no. 6, pp. 1134-1139; December, 1987
8. "High Energy Electron Induced Displacement Damage in Silicon, C.J. Dale, P.W. Marshall, E.A. Burke G.P. Summers and E.A. Wolicki, presented at the 1988 IEEE Nuclear and Space Radiation Effects Conference, Portland, Oregon; July 12-15, 1988
9. "Single Effect Phenomena in the Space and SDI Arenas," Edward Petersen and Paul Marshall, to be published in the Journal of Radiation Effects: Research and Engineering, vol. 6-2, November, 1988.
10. "Suggested Single Event Upset Figure of Merit," E.L. Petersen, J.B. Langworthy and S.E. Diehl, IEEE Trans, on Nuclear Science, vol. NS-30, no. 6, pp. 4533-4539; December, 1983
' 11. "Recent Trends in Parts SEU Susceptibility from Heavy Ions," D.K. k- Nichols, L.S. Smith, W.E. Price, R. Koga and W.A.Kolasinski, IEEE
Trans, on Nuclear Science, vol. NS-34, no. 6, pp. 1332-1337; December, r* 1987
12. "Burnout of Power MOS Transistors with Heavy Ions of Californium- 252," A.E. Waskiewicz, J.W. Groniger, V.H. Strahan and D.M. Long,
I 73

IEEE Trans, on Nuclear Science, vol. NS-33, no. 6, pp. 1710-1713• December, 1986
i j 13- "SEU Sensitivity of Power Converters with MOSFET's in Space,"
G.J. Brucker, P. Measel, D. Oberg, J. Wert and T. Criswell, IEEE j Trans, on Nuclear Science, vol. NS-34, no. 6, pp. 1792-1795; December.
1987 ' i | 14. "Cosmic Ray Induced Permanent Damage in MNOS EAROMs," J.T. i Blandford, Jr., A.E. Waskiewicz and J.C. Pickel, IEEE Trans, on
Nuclear Science, vol. NS-31, no. 6, pp. 1568-1570; December, 1984
15. "Calculation of Cosmic-Ray Induced Soft Upsets and Scaling in VLSI Devices," p. Shapiro, E.L. Petersen and J.H. Adams, Jr., NRL Memorandum Report 4864; August 26, 1982
v
74
C<

JWWH
üü
»w
WIR
■f "" " Ü
m
ira^
aää&»llli&^ «irit'iitfirfitttiil-li Malfe^^frJmSfffflSai^ffi
N89-23532 ENVIRONMENTAL EFFECTS ON SPACECRAFT MATERIALS
J. W. HAFFNER ROCKWELL INTERNATIONAL SEAL BEACH, CA 90740
This is a summary of some results of Phase I work on an AFGL* contract to study the effects on the natural space environments on materials which may be used for SDI+applications. Phase I was a study of the current state-of-the-art knowledge of those effects, and was carried out by a literature search, a question- naire mailing, and some visits to NASA and Air Force research facilities. Phase II will be a study of what materials may be used for SDI applications and to what natural space environments they may be vulnerable. Deficiencies in knowledge of the effects of the natural space environments on these materials are to be identified and recommendations are to be made to eliminate these knowledge deficiencies.
* Air Force Geophysics Laboratory
t Strategic Defense Initiative
ENVIRONMENTAL EFFECTS ON SPACECRAFT MATERIALS
PHASE I - STUDY EFFECTS
LITERATURE SEARCH QUESTIONNAIRE MAILING FACILITY VISITS
PHASE II - STUDY APPLICATIONS
ISSUE IDENTIFICATION DEFICIENCY DETERMINATION RECOMMENDATIONS
75
£

76
Permanent Material Effects Due To Environments
The space environment includes several components - vacuum, residual gasses, solar ultraviolet light, energetic charged (Van Allen, solar flare, and cosmic ray) particles, hot and/or cold electrical plasma and solid objects (micrometeoroids and space debris). The results of the Phase I work showed that these environments produce various effects on different types of material. For example, the space vacuum permits materials to outgass, the residual atomic oxygen erodes ram-facing exposed organics, ionizing radiation decreases mechanical strength (in most materials) and electrical conductivity (in non-insulators), etc. Other effects are surface electrical charging (due to hot plasma) electrical charge- neutralization (due to ionosphere), and surface erosior. and punctures (due to micrometeoroids and debris objects). While effects due to the space vacuum, solar photon radiation, and micrometeoroids are not greatly dependent on spacecraft altitude, atomic oxygen and ionospheric effects are significant only at low altitudes; hot plasma and solar flare particle effects are high altitude/latitude phenomena, while Van Allen and space debris effects have their own altitude dependences.
PERMANENT MATERIAL EFFECTS DUE TO ENVIRONMENTS
ENVIRONMENT MATERIAL EFFECTS
VACUUM ALL, ESP. ORGANICS OFFGASSING, OUTGASSING RESIDUAL GASSES (ATOMIC OXYGEN)
ORGANICS SURFACE EROSION, GLOW
RESIDUAL GASSES (ATOMIC OXYGEN)
SOME METALS EMBRITTLEMENT
SOLAR U.V. ORGANICS SURFACE DISCOLORATION VAN ALLEN BELTS ALL, ESP. ORGANICS DISCOLORATION, WEAKENING SOLAR FLARE PARTICLES
CONDUCTORS, SEMICONDUCTORS
THERMAL, ELECTRICAL RESISTIVITY
IONOSPHERE INSULATORS CHARGE NEUTRALIZATION HOT PLASMA INSULATORS HIGH VOLTAGES, DISCHARGES HOT PLASMA CONDUCTORS ELECTRIC CURRENT, HEATING MICROMETEOROIDS & DEBRIS
ALL, ESP. OPTICS SURFACE EROSION, PITS. PUNCTURES
»

Synergistic Effects Involving Sunlight (Including UV)
Based upon the Phase I work, a summary has been compiled of the synergistic effects on materials due to combinations of two environments. This ia a summary of those effects which involve sunlight.
Sunlight effects include thermal cycling (for many spacecraft surfaces) as well as discoloration and mechanical damage in many organics. Sunlight pressure can also produce torques on a spacecraft if the center of pressure is not in line with the center of mass. The combination of sunlight with other torque - producing environments (the gravitational and magnetic fields of tne earth, the residual atmospheric gasses) can produce unusual spacecraft rotations and/or require special attitude control measures. Sunlight plus vacuum increases organic outgassing and cross-linking (a major effect) while sunlight heating helps anneal out the damage caused by nuclear radiation (especially in semiconductors). Photoelectric currents due to sunlight decrease the voltages and currents due to hot plasma charging, while both sunlight and solid objec.s can act to change the solar absorptancfi <*s and/or reflectivity of radiators and mirrors. For exposed coatings, the thermal cyclina du<* to sunlight poses the threat of coating damage/decoloration especially for substrates vulnerable to any of the other environments.
SYNERGISTIC EFFECTS INVOLVING SUNLIGHT (INC UV)
ENVIRONMENTS EFFECTS MATERIALS/PARTS
SUNLIGHT + G. FIELD TORQUES MODIFIED ENTIRE SPACECRAFT SUNLIGHT .+ B. FIELD TORQUES, DRAG MODIFIED ENTIRE SPACECRAFT
"~ "~ EXPOSED ORGANICS SUNLIGHT + VACUUM
SUNLIGHT + NUCLEAR RADIATION SUNLIGHT + SOLID OBJECTS SUNLIGHT + IONOSPHERE SUNLIGHT + HOT PLASMA
INCREASED OUTGASSING, CROSS-LINKING INCREASED ANNEALING
DECREASED REFLECTIVITY LOWER VOLTAGE, INCREASED DISCHARGES DECREASED CHARGING
SUNLIGHT + NEUTRAL INCREASED EROSION, GASSES TORQUES
EXPOSED SEMICONDUCTORS
EXPOSED RADIATORS, MIRRORS EXPOSED CONDUCTORS
EXPOSED INSULATORS
RAM-EXPOSED ORGANICS
77

Synergistic Effects Involving The Gravity Field
The Earth's gravity field not only controls the orbit parameters of a spacecraft (position and velocity as functions of time) but also affects the orientation (spacecraft like to have their principal axis aligned with local vertical). Thus, the other torque-producing environments (magnetic field, residual gasses) can combine with the gravity field to modify the stable orientation. The space vacuum permits orientation changes to persist since it provides no damping. The gravity-modified spacecraft orientation affects the drag due to the inosphere and the residual gasses, while the impact of a solid object can change the velocity and the orientation/spin of a spacecraft. There does not appear to be any obvious synergistic effect due to the combination of the gravity field and nuclear radiation, since the ambient nuclear radiations in space (Van Allen belts, solar flare particles) are quasi-isotropic and produce essentially zero torques on spacecraft. Conversely, the nuclear radiation effects on materials and parts are not affected by the presence or absence of the Earth's gravity field.
SYNERGISTIC EFFECTS INVOLVING THE GRAVITY FIELD
ENVIRONMENTS EFFECTS MATERIALS/PARTS
G. FIELD + B. FIELD G. FIELD + VACUUM G. FIELD + NUCLEAR RADIATION G. FIELD + SOLID OBJECTS G. FIELD + IONOSPHERE
G. FIELD + HOT PLASMA
G. FIELD + NEUTRAL GASSES
TORQUES MODIFIED ENTIRE SPACECRAFT NO TORQUE DAMPING ENTIRE SPACECRAFT NO OBVIOUS EFFECT
PROJECTED AREA/ VELOCITY MODIFIED IOMOSPHERIC DRAG MODIFIED
EXPOSED MIRRORS, RADIATORS
SUNLIGHT EXPOSURE MODIFIED TOROUES, RAM EXPOSURE MODIFIED
ENTIRE SPACECRAFT
EXPOSED INSULATORS
EXPOSED ORGANICS
i 78
4

Synergistic Effects Involving The Magnetic Field
The major effects of the geomagnetic field will be to produce potentials and torques on current loops. Thus, the voltages produced will have a modification (small) on the voltages produced by other space environments (hot plasma, ionosphere) and will modify the torques produced by other environments (sunlight, gravity gradient, residual neutral gasses). In addition, the geomagnetic field limits the energies as a function of direction which solar flare and galactic particles can reach a given spacecraft orbit. If the torques modify the orientation of the spacecraft, the impacts rates due to stream meteoroids and orbiting debris particles will be modified. Finally, the presence of the geomagnetic field will modify the ionospheric drag.
SYNERGISTIC EFFECTS INVOLVING THE MAGNETIC FIELD
ENVIRONMENTS EFFECTS MATERIALS/PARTS
B. FIELD + VACUUM NO TORQUE DAMPING B. FIELD + NUCLEAR RADIATION
SOLAR, GALACTIC CUTOFF MODIFIED
B. FIELD + SOLID OJBECTS
PROJECTED AREA/ VELOCITY MODIFIED
B. FIELD + IONOSPHERE
IONOSPHERIC DRAG MODIFIED
B. FIELD + HOT PLASMA
SUNLIGHT EXPOSURE MODIFIED
ENTIRE SPACECRAFT SEMICONDUCTOR ELECTRONICS EXPOSED MIRRORS, RADIATORS ENTIRE SPACECRAFT
EXPOSED INSULATORS
B. FIELD + NEUTRAL GASSES
TORQUES, RAM EXPOSURE EXPOSED ORGANICS MODIFIED
79

Synergistc Effects Involving Space Vacuum
In addition to facilitating outgassing, the vacuum of space does not limit many environmental parameters (speed, temperature, voltage, etc.) as the earth's atmosphere does. Thus, solid objects hit at higher velocities, the temperatures produced by sunlight (or its absence) are more extreme (no convective cooling), and the electron densities in hot or cold plasmas are greater than would be the case in air. Many materials exhibit increased tolerance for ionizing radiation in vacuum (broken chemical bonds have time to reform) but some atomic oxygen effects are enhanced (ions and radicals live longer). Since organic materials outgass more and have weaker chemical bonds than most inorganic materials, they tend to be the most vulnerable to these effects. Finally, space vacuum and hot plasma can combine to produce more surface contamination than the vacuum would produce alone.
SYNERGISTIC EFFECTS INVOLVING SPACE VACUUM
ENVIRONMENTS EFFECTS MATERIALS PARTS
VACUUM + NUCLEAR RAD. INCREASED RADIATTON RESISTANCE
EXPOSED ORGANICS, TEFLON
VACUUM + OBJECTS
SOLID INCREASED IMPACT DAMAGE
EXPOSED SURFACES
VACUUM + IONOSPHERE INCREASED DISCHARGING (MORE ELECTRONS)
EXPOSED VOLTAGES, INSULATORS
VACUUM + HOT PLASMA INCREASED CONTAMINATION
EXPOSED INSULATORS
VACUUM + GASSES
NEUTRAL IONS, RADICALS LIVE LONGER
EXPOSED ORGANICS, SENSORS
80
a

Synergistic Effects Involving Nuclear Radiation
The major effect of nuclear radiation is to randomize the structure of materials, decreasing their ability to transmit stress (some materials become brittle), electrical current, and thermal energy. However, electrical insulators become more conductive, decreasing the discharge rate in hot plasma. Fluid containers are more easily punctured by solid objects if they have been weakened by nuclear radiation. The presence of residual gasses (atomic oxygen) at low altitudes increases the surface damage produced by ionizing nuclear radiation, especially in organic materials on the front (ram) side of the spacecraft.
SYNERGISTIC EFFECTS INVOLVING NUCLEAR RADIATION
ENVIRONMENTS EFFECTS MATERIALS/PARTS
NUCLEAR RAD. OBJECTS
+ SOLID DECREASED PUNCTURE RESISTANCE
FLUID CONTAINERS (ORGANICS)
NUCLEAR RAD. IONOSPHERE
+ DECREASED DISCHARGE RATE
EXPOSED INSULATORS
NUCLEAR RAD. PLASMA
+ HOT DECREASED DISCHARGE RATE
EXPOSED INSULATORS
NUCLEAR RAD. GASSES
+ NEUTRAL DECREASED RADIATION RESISTANCE
RAM-EXPOSED ORGANICS
81

E
Synergistic Effects Involving Solid Objects
Solid objects (micrometeroids and space debris) not only erode and puncture surfaces (affecting mirrors, radiators, fluid containers, etc.;, but also can produce changes in spacecraft orientations and orbit. If the erosion, punctures, or reorientations expose surfaces or substrates to environments for which they were not designed, additional effects can follow. Thus, a hole in an insulating coating can expose a high voltage substrate to the ionosphere with considerable consequent current leakage, while a hole in an oxide coating can expose a non-oxide substrate to atomic oxygen attacks, and a hole in a conducting coating can increase discharge rates due to hot plasma. On the other hand, the voltages produced by solid object impacts will be reduced by the presence of the ionosphere.
SYNERGISTIC EFFECTS INVOLVING SOLID OBJECTS
ENVIRONMENTS EFFECTS MATERIALS/PARTS
SOLID OBJECTS + IONOSPHERE
IMPACT VOLTAGES DECREASED
EXPOSED SURFACES
SOLID OBJECTS + HOT PLASMA
EXPOSE SUBSTRATES INSULATING SUBSTRATES
SOLID OBJECTS + NEUTRAL GASSES
EXPOSE SUBSTRATES ORGANIC SUBSTRATES
82

%
m
Synergistic Effects Involving The Ionosphere
, \ Since the ionosphere is a cold plasma, it acts to limit the £] effects of electric or magnetic fields produced by spacecraft.
At low altitudes the deBye lengths are measured in millimeters y so the ionosphere can "see" small spacecraft features. At high j altitudes the ionosphere is much less dense and has meter-sized
, * deBye lengths so it can be overwhelmed by hot (kev) plasma. * Nevertheless, the ionosphere does act (along with sunlight) to '.-< decrease the hot plasma charging rate. The ionosphere also
co-exists with the residual gasses (at low altitudes) and with the Van Allen belts (at high altitudes) where it acts to produce more ions and radicals than would otherwise be present.
SYNERGISTIC EFFECTS INVOLVING THE IONOSPHERE
ENVIRONMENTS EFFECTS MATERIALS/PARTS
IONOSPHERE + PLASMA
HOT DECREASED CHARGING RATE
EXPOSED INSULATORS
IONOSPHERE + GASSES
NEUTRAL MORE IONS, RADICALS PRODUCED
EXPOSED ORGANICS
83

Syneirgistic Effects Involving Hot Plasma
Since all other combinations of two environments have been discussed, the only combination left is that of hot plasma and neutral gasses. The presence of the neutral gasses (principally atomic oxygen) will increase the electrical discharge rate, due to the hot plasma, by providing additional atoms and ions. This increased discharge rate will be observed on ram-facing organic insulators in the dark. Since hot plasma is primarily a high altitude environment, while neutral gasses occur primarily at low altitudes, this effect will be small.
SYNERGISTIC EFFECTS INVOLVING HOT PLASMA
ENVIRONMENTS EFFECTS MATERIALS/PARTS
HOT PLASMA + INCREASED DISCHARGE RAM-FACING ORGANIC NEUTRAL GASSES INSULATORS
84

Summary Of Synergistic Effects On Materials
This matrix lists each environment along both the vertical (left side) and the horizontal (top) axis. The spacecraft (s/c), the types of surfaces (e.g. exposed, high voltage, etc.) and the types of materials (e.g. organics, conductors, semiconductors, or insulators) most affected by the environmental combinations are listed in the boxes. Thus, the combinations of gravity and magnetic fields will affect the entire spacecraft by producing torques, while the combination of sunlight and solid objects will be especially severe on optical surfaces (mirrors, radiators). Neutral gasses plus almost all other environments primarily affect ram-facing organics while hot plasma plus other environments affect insulators. The zero for the combination of gravity field and nuclear radiation indicates the absence of any obvious synergistic effect.
SUMMARY OP SYNERGISTIC EFFECTS ON MATERIALS
z ÜJ cc
(— 0 0 LU 3Z >- Oi 1—1 IE _j es 1— 1— 2: <t h- h- Q. ' «* «C co »—» >-H O LU a LU ZD LU cC OO zc en LU _i—» > _l z: 1 O Z3 _l 1—1 CD CO \— CO 2: > cC LU <_3 LU < O CJ 0 Z 1— < ^ CO ID ■=> CtL 1—1 <X. —1 a. «c ZD < O 0 _l LU cc CO-—' C3 U- s: u. co s» Z OS '—' 3: Q- ■z. cs
SUNLIGHT (INC UV) s/c S/C ORG SEMI OPTICS COND INS ORG GRAVITY FIELD S/C S/C 0 OPTICS S/C INS ORG MAGNETIC FIELD S/C SEMI OPTICS S/C INS ORG SPACE VACUUM ORG EXP HV INS ORG NUCLEAR RADIATION ORG INS INS ORG SOLID OBJECTS EXP INS ORG IONOSPHERE INS ORG HOT PLASMA ORG NEUTRAL GASSES
S/C = SPACECRAFT COND = CONDUCTORS HV = HIGH VOLTAGES
ORG = ORGANICS SEMI INS = INSULATORS EXP ■
■■ SEMICONDUCTORS EXPOSED SURFACES
85
G

Summary - Conclusions
Based on the work carried out to date, it is possible to conclude that the effects of a single space environment are either currently understood or currently being investigated. Thermal cycling, ultraviolet light degradation and radiation pressure have been studied for over two decades. The torques and v x B effects of the earth's gravity and magnetic fields are studied in freshman college physics courses. Contamination, especially that due to rocket exhaust plumes and organic material outgassing/offgassing/shedding is an active research field. Nuclear radiation, which is primarily of interest to semiconductor electrical engineers and thermal control coating specialists, produces generally well-known effects. Solid objects (especially debris) environments are under active investioation, as are the effects of neutral atomic oxygen. Plasma effects are a maturing technology after a decade of intense work.
It is the effects of multiple space environments that will probably hold some surprises, since all of the problems of studying single environments in the laboratory (energy, flux, and angular distribution simulation plus accelerated testing) are compounded. It is expected that exposed organics, optical surfaces and insulators will be especially vulnerable. This paper was an attempt to indicate some of these effects of multiple space environments and a call for more attention to them.
SUMMARY - CONCLUSIONS
EFFECTS DUE TO SINGLE ENVIRONMENTS (EITHER UNDERSTOOD OR BEING STUDIED)
- SUNLIGHT (INC UV) - EFFECTS BEING STUDIED - FIELDS (GRAVITY, MAGNETIC) - ENVIRONMENT, EFFECTS KNOWN - VACUUM (INC CONTAMINATION) - EFFECTS BRING STUDIED - NUCLEAR RADIATION
(VAN ALLEN, S. FLARE, GALACTIC) - EFFECTS BEING STUDIED - SOLID OBJECTS (MICROMETEOROIDS, DEBRIS) - DON'T KNOW
ENVIRONMENT YET - PLASMA (IONOSPHERE, HOT) - ENVIRONMENT OUITR VARIABLE - NEUTRAL GASSES (ESP ATOMIC 0) - DON'T KNOW EFFECTS YET
(MANY NOT UNDERSTOOD EFFECTS DUE TO MULTIPLE ENVIRONMENTS (FEW BEING STUDIED
ORGANICS ) INSULATORS ) ESPECIALLY VULNERABLE IP EXPOSED OPTICS )
86
e


N89-23533 SURFACE TREATMENT USING METAL FOIL LINER
RAY GARVEY OAK RIDGE NATIONAL LABORATORY
C- 2_ 87

FOIL LINER TECHNOLOGY
A metal foil liner ran be used to seal large area surfaces. Tills will provide all the characteristics of a metal structure even when using organic matrix composites.
3 V
I
SEALING LARGE AREA SURFACES
PROTECTION FROH ATOMIC OXYGEN OR OTHER HOSTILE
ENVIRONMENTS
CONTAMINATION CONTROL
THERMAL MANAGEMENT USING ANODIZEO FOIL
88
< ' v
a

LINER CONFIGURATION (U) 1 l
(U) It has been proposed that two 0.001-in.- thick layers of aluminum foil which are intimately bonded to the composite laminate will provide the desired liner performance. This schematic diagram shows two layers of foil with two helical seams. The visible seam is offset the maximum distance from hidden seam. Seam gaps are minimized, and overlaps are not permitted.
(U) The two-layer configuration which is shown has high reliabil- ity because flaws in the foil are prevented from exposing the compos- ite. An alternate configuration using a helical overlap will trade reliability for weight savings.
(U) HYDROGEN EXPOSED SURFACE
(U) TWO FOIL LAYERS
(U) VISIBLE SEAN
(U) FOIL-TO-FOIL ADHESIVE
(U) HIDDEN SEAN
(U) FOIL-TO-COMPOSITE ADHESIVE
ORIGINAL PAGE BLACK AND WHITE PHOTOGRAPH
89
J

PRODUCIBILITY DEMO - VARIOUS PARTS (U)
I I /
(U) The aluminum foil liner is easily fabricated into shapes with a uniform axial cross section. This photograph show? that the liner can be installed on the inside and outside of surfaces. Flat plates have also been successfully lined.
(U) It is reasonable to expect that a part with uniform taper can also be successfully lined with current materials and modified tech- niques. However, double-curved shapes, such as corners and fillets, present problems that will take time to overcome. This is a critical area for future development.
(U)
(U)
(U)
(U)
14-IN.-DIAH IM6/ERL2258 CYLINDER WITH ID LINER
6-IN.-DIAM IM6/ERL2258 CYLINDER WITH OD LINER
6-IN.-DIAM IM6/ERL2258 CYLINDER WITH ID AND 00 LINERS :
IM6/ERL2258 ELLIPSE WITH 2-IN.-DIAM CORNERS AND
180-IN.-DIAM SIDES HAVING
ID LINER
ORIGINAL PAGE BUCK AND WHITE PHOTOGRAPH
90
y

LINER CHARACTERISTICS - FOIL (U)
(U) Rol.it ivelv pure aluminum alloys, such as AA 1100, can be rolled Into high-quality foil, which can be coated and silt for liner applications. It has boon shown that the 1119, half-hard, or dead-soft conditions can all bo used with varying degrees of handling difficulty. A small effort was spent considering alternate alloy foil materials. The metals shown are considered to be good candidates for coating and slitting. They will have varying degrees of bond strength. Copper is likely to be the best with, aluminum second, in bond characteristics.
(U) The foil thickness and foil quality must be ^elected to meet aerial weight, quality, and processing requirements. It. is fortunate t hat: there is a variety of commercially available foils that will satisfy the needs for impermeability and chemical compatibility. One would find it quite difficult to get a special product made bv the metal foil supplier due to small tonnage quantities needed for this applicat ion.
(U) BASELINE FOIL -- AA1100 H19 OR HALF HARD OR DEAO SOFT.
<U> ALTERNATE FOIL (NOT EVALUATED) -- INVAR, ZIRCONIUM, COPPER, NICKEL, TITANIUM, OR
STAINLESS STEEL.
(U) BARE FOIL THICKNESS --
(U) MINIMUM TO ELIMINATE INCLUDED PINHOLES IN ALUMINUM IS 0.001 IN.
(U) MINIMUM TO HANDLE IN DEAD SOFT CONDITION IS 0.002 IN.
<U> FOIL QUALITY --
<U> ACCEPTABLE EDGE CURL - SLITTING RELATED.
(U) ACCEPTABLE EDGE WAVINESS - SLITTING RELATED.
(U) ACCEPTABLE WEB DEFLECTION - CLEANLINESS AND HEAT TREAT RELATED.
<U> NO SURFACE TREATMENT REQUIRED FOR CERTAIN UL0YS.
1
91

FOIL-TO-FOIL AND FOIL-TO-COMPOSITE (U)
(U) This micrograph shows the cross section of two 1-mil layers of nA 1100 H19 aluminum bonded to each other and to the graphite/epoxy composite substrate with adhesive. In each of the micrographs in this report, the bottom of the cross section will be the innermost region (ID) and the top will be the outermost region (OD). The sample was cut from an IM6/KRL2258 cylinder which had been cured at 350°F. It was then dipped ill liquid helium (lOx for most samples). It was also sprayed with liquid helium on the foil surface in the vicinity of the seams to impose a thermal gradient through the laminate. The samples which are labeled "EXPOSED" in this report have been through this sequence.
(U) This photomicrograph shows that there is no breach in the integrity of the two adhesive bond lines in spite of the severe thermal shock of liquid helium exposure.
5
EXPOSED
tmmxm K.f
1.000X
UNCLASSIFIED
D4830
1).001 in.
BLACK WHITE PhtQTOOMPH
92
ti

FOIL-TO-FOIL (U)
(U) This photomicrograph shows a close-up view of the epoxy foil- to-foil adhesive layer. The very small (<10"5 in.) separation in the adhesive is damage caused by heating the electron microscope beam. Both surfaces of foil are completely wetted, and there was no breach of foil-to-foil bond integrity even after liquid helium exposure.
1
FOIL-TO-FOIL (Ü)
EXPOSED
Jtitfäki. ***** * ' _ UNCLASSIFIED
5.000X 04833
0.001 in.
ORIGINAL PAGE BLACK AND V/HiTE PMOTOftPAPM
93

FOIL-TO-COMPOSITE (U) (
(U) These photomicrographs show a magnified view of the foil-to- composite interfaces. Compatibility (chemical and cure cycle) between the adhesive coating on the foil and the laminate resin is directly related to bond performance.
Y
CONTROL EXPOSED .■Hiii«iiiiijuii.i.i,i,»i;.i|Mi|ijq i.■*■»,'" m,i,wwi||
•*8f-
UNCLASSIFIED 5.000X D4821
p.j.HH.iini.m, ip>lii.,iii.jijip,j),>,iii>Wi.iWiai.i
UNCLASSIFIED
5.000X D4831
0.001 in
ORIGINAL PAGE BLACK AND WHITE PHOTOGRAPH
/
94

VISIBLE SEAM (U)
f. K
(
(U) These four photomicrographs show the visible and hidden seams for control and exposed samples. Observing the seams on the left half of the viewgrnph, one will notice an 0.010-in.-wide gap in the upper picture and an 0.023-in.-wide gap in the lower one. In the double layer foil configuration, overlaps are not permitted, and gaps are
permitted to be <0.030 in.
(U) The visible seam tends to draw a lot of attention. However, this should not be of much concern because this seam is entirely backed up by the second layer of foil. One should be more concerned about the quality of the hidden seam addressed later in this report.
(U) It is not unusual for the foil-to-foil interface in the vicin- ity of the visible seam to be unbonded for a region 0.005 to 0.020 in. away from the seam. This is caused by contamination during processing. Areas such as this have been unchanged through 0 psig liquid helium immersion. One may speculate that liquid hydrogen at 25 psig is a worse case. Pressurized liquid hydrogen testing is being performed at Arnold Engineering Development Center (AEDC) using a permeation test cell which is described later in this report.
(U) The distance from the visible seam to the hidden seam is maximum of one-half the width of the foil. Seams were separated by 1 and 2 in. for this study to include both in a single test specimen. The next figure will magnify the visible seam before addressing the
hidden seam.
SEMS (U)
VISIBLE SEAM CONTROL
UNCLASSIFIED
100X D5116
EXPOSED UNCLASSIFIED ;W1^ ■ - ' "*■ *"'»■..<?% *,
rS*i
HIDDEN SEAM
CONTROL UNCLASSIFIED
100X
UNCLASSIFIED
05115
100X D5118 100X
ORIGINAL PAGE BLACK AND WHITE PHOTOGRAPH
\
95
>. /
5

VISIBLE SEAM (U)
(U) The higher magnification of these pictures shows the impor- tance of foil edge condition to foil liner performance. Aluminum tends to stretch and to smear very easily at the edges during slitting. if precision shearing is not performed, the edge of the foil will not be successfully bonded, and the second layer of foil may get damaged as well. One will notice that the foil-to-foil adhesive flows to accom- modate small imperfections in the foil edge condition.
(U) Both the control and exposed samples appear to have inclusions in the foil. (However, it is possible that this is damage resulting from the polishing operation.) Aluminum foil 0.0003-in. thick has frequent pinholes resulting from material .flaws such as inclusions. It is generally accepted that 0.001-in.-thick foil will not have any pin- holes resulting from material microstructure. Pinholes in 0.001-in. and thicker foils are normally the result of debris in the rolling and winding equipment.
CONTROL
1.500X
UNCLASSIFIED
D4838
EXPOSED
^■VAj1
'■Tl-
v£"*a5p» ;>
i»
1.500X
I UNCLASSIFIED
D4852
0001 in.
ORIGINAL PAGE BLACK AND WHITE PHOTOGRAPH
96
i

s. HIDDEN SEAM (U)
(U) The hidden seam is the most critical zone in the liner. Defects in this region lead directly to the underlylng ««Posit^ The performance of the liner in this area is strongly affected by_fo tdg. quality, adhesive flow, gap control, composite quality, and material
compatibility.
(U) The photomicrographs on the right half of th~ viewgraph are typical cross sections of hidden or subsurface seams. Note that the poking compound in the bottom of the picture has separated from the foil surface leaving the black line below the inside surface of the foil Once again. 8the seam gaps are different for the two samples (0.005 and 0.018 in.). Like the visible seam, the hidden seam may not
overlap and may have up to 0.030-in. gap.
(U) As fabricated, the hidden seam will normally be unnoticeable except at the ends of the composite. Defects in the hidden seam will become visibly obvious immediately following a.thermal cycle without backing support (die or mandrel). The defect will show up as a pucker or a seriesP of puckers following the path of the hidden seam These local puckers will not spread but will crack as a result of cyclic
plastic strain.
SEAMS (U)
VISIBLE SEAM
CONTROL UNCLASSIFIED r^l
>;i..\V ->\.• - ?• fir 2lm$Mm:*:
V •»Vc't^\<,Ä'f'
100X D5116
EXPOSED JUNCLASSIFIED '
100X D5118
HIDDEN SEAM
CONTROL UNCLASSIFIED /gäW«-
100X D5115
EXPOSED UNCLASSIFIED W,
100X ft*"*'"". D5112
ORIGINAL" PAG£ BLACK AND WHITE PHOTOGRAPH 97
5)

HIDDEN SEAM (U)
(U) These photomicrographs show a close-up view of the subsurface or hidden seam. Although there is evidence of some edge curl, the liner performed well through thermal exposure.
CONTROL
IH«J11^J4WWWW^| UNCLASSIFIED
1.000X D5090
EXPOSED
WHi^a UNCLASSIFIED ?
1.000X D5113
^)001 in.
ORIGINAL PAGE BLACK AND WHITE PHOTOGRAPH
98

PERMEATION TEST CELL (U)
(U) Permeation testing is currently under way at AEDC using a fixture similar to thit which is shown to test 14 - in.-dinm curved composite specimens. The test cell shown is operated in a vacuum chamber. Leakage around the indium seal on the inside contour should not influence the downstream measurements. AEDC personnel have elected to flow gaseous hydrogen into the fixture and then condense it on the test specimen at -425°F using gaseous helium.
(
GHE CHILLER
25 PSIG GH2 AT -425°F, -321'F, 75°F, AND 300°F 10-IN.2 EXPOSED AREA ON 14-
IN.-DIAM CURVED SPECIMEN (PRECONDITIONING INCLUDES 10 LHE CYCLES) 2 INDIUM SEALS
4 TEMPERATURE SENSING DIODES
HARD VACUUM TO MASS SPEC-- COMPARE TO STANDARD LEAKS
99


N89-23534 THE LONG DURATION EXPOSURE FACILITY
MATERIAL EXPERIMENTS
William H. Klnard and
James L. Jones, Jr. NASA Langley Research Center
Hampton, Virginia
PRECEDING PAGE BLANK NOT FILMED 101
\
,r*.
't
Si

LONG DURATION EXPOSURE FACILITY
MATERIALS EXPERIMENTS
INTRODUCTION
In the early 1970's, the NASA Office of Aeronautics and Space Technology (OAST) approved the Long Duration Exposure Facility (LDEF) Project. The LDEF prolect provided NASA and other U.S. and foreign research organizations with opportunities tLPSnf?r\w^ technology and science experiments in space using the LDEF and the Space Shuttle. Many of the experiments which were developed and are flying on the first LDEF mission are experiments to investigate the effects of the space
experiments ^ materlalS' Thls paper Provides an overview of these materials
«rMt^MJf'wl?1 1SJhOWnJ:"rflying ln the Ph°Wph below, was placed in orbit by the shuttle orbiter Challenger in April 1984, and it was to have been thprr»r? approximat^y ) vear la'er. The Challenger accident, however, has delayed J T i Jooo "el6 than * yearS* The LDEF "trieval ** ™" manifested on Flight 32 in July 1989 Since the facility and experiments will have been in space a most
tlcbnology dlta? y Sre retrleVed' thGy Wil1 be 3 natl0nal tr°Ve 0f sclen« and
LDEF IN ORBIT
102 ORIGINAL PAGE BLACK AND WHITE PHOTOGRAPH
M

DESCRIPTION OF THE FACILITY
The LDEF is an 8,000 pound cylindrical structure, 14 feet in diameter and 30 feet in length, on which approximately 12,000 pounds of tiay mounted experiments can be transported to space, exposed for long periods of time, and retrieved using the Space Shuttle. The reusable LDEF structure is gravity gradient stabilized in three axes when free-flying with the cylindrical axis Earth pointing and one edge always facing in the direction or the velocity vector. Eighty-six experiment trays are mounted on the facility.
The LDEF experiments are self-contained in trays. Many are completely passive, depending on postflight laboratory investigation for data results. The active LDEF experiments have individual power and data systems incorporated in their respective trays. The LDEF provides signals to initiate the active experiment systems once in orbit.
The LDEF structure and a typical LDEF experiment tray are shown below and on the following page.
LDEF STRUCTURE
ORIGINAL' PAGE BLACK AND WHITE PHOTOGRAPK
103

LDEF EXPERIMENT TRAY N
%^ti»^^
■"afv.v.
■'■■£' i
V*si*#
\ *" <*. . a . **\ ' ''
i-^Mk
[^^m^
sJSijjift1 *&&#wä^&3v;,*äs&
^f;- r-^^ywffWff ffrrs&T
•■; * ' ii .I. Sinn ii n in I«." '■ *" i n" n * t-ff~r**™"Mlrl JT """*''
M
104
ORIGINAL PAGE BLACK AND WHITE PHOTOGRAPH
ii s

wi^yww*w<fw i i ■■ — -j.., „ —|Tr- .^-^..^ r .n ^ .lT.l( j-jupj-j, u^imii "W»^*"l""T«w»'-f 1^v^w^^f^r0^^y^rf-^<-
FIRST LDEF MISSION EXPERIMENTS
are iSJ7h!?^nCe^aPPllCatl?n' and 'echnolo8y experiments now flying on the LDEF are listed below. Those experiments whose objectives are to provide data on soace ofVtvr:fal •"•«%« «t.rl.1. have been marked with an asterisk. MscLions of typical examples of the materials experiments are presented in the following
ad^ndu"» to'th? ^ ^'STl f MCh °f thC materla'S «*«*■«*. Presen?L in the on ISEF are Trd ItTJ'^ ^"^f Investl8at0« ^ the materials experiments Zilll <l< ™? ?A! * D0D' °ther U*S- 8°ver^nt organizations and from U.S.
JetaiLY l!fyr J3' F?rel8n PrinclPal investigators are also involved. «,„«.. 1 postflight investigations of the retrieved LDEF hardware and LDEF systems and experiment hardware will also provide additional data on the effects of
Sf.2^rP08Ure '? the SPa" envl"nment- A discussion of the plans for such investigations ara also presented in the following material.
CRYSTAL GROWTH ATOMIC OXYGEN OUTGASSING ATOMIC OXYGEN INTERACTION HIGH-TOUGHNESS GRAPHITE EPOXY RADAR PHASED-ARRAY ANTENNA COMPOSITE MATERIALS FOR SPACE STRUCTURES EPOXY MATRIX COMPOSITES COMPOSITE MATERIALS METALLIC MATERIALS UNDER ULTRAVACUUM GRAPHITE-POLYIMIDE AND GRAPHITE-EPOXY POLYMER MATRIX COMPOSITE MATERIALS SPACECRAFT MATERIALS BIOSTACK BALLON MATERIALS DEGRADATION THERMAL CONTROL COATINGS SPACECRAFT COATINGS THERMAL CONTROL SURFACES TEXTURED AND COATED SURFACES VARIABLE CONDUCTANCE HEAT PIPE VACUUM-DEPOSITED OPTICAL COATINGS
TRAPPED-PROTON ENERGY SPECTRUM HEAVY COSMIC RAY NUCLEI SOLAR ARRAY MATERIALS MICROABRASION PACKAGE METEOROID IMPACT CRATERS DUST DEBRIS COLLECTION CHEMISTRY OF MICROMETEOROIDS MEASUREMENTS OF MICROMETEOROIDS INTERPLANETARY DUST SPACE DEBRIS IMPACT INFRARED MULTILAYER FILTERS METAL FILM AND MULTILAYERS SOLAR RADIATION ON 6LASSES SPACE ENVIRONMENT EFFECTS HEAVY IONS
ULTRA-HEAVY COSMIC RAY NUCLEI COATINGS AND SOLAR CELLS SOLID ROCKET MATERIALS RULED AND HOLOGRAPHIC GRATING OPTICAL FIBERS AND COMPONENTS
105 I

/ SESSION 2: SPACECRAFT EXPERIENCE /
Chairman: - J. Triolo. NASA Goddard Space Flight Center
PRECEDING PAGE BLANK NOT FILMED
X:
107
V

i s
\
\
Us
-----"•"•;^^i^tj
fill

">—ry»X'~i»''»3.T~^»-»-.—— j , > ».„,.. ..
SOME EXAMPLES OF THE DEGRADATION OF PROPERTIES OF MATERIALS IN SPACE
Frederick E. Betz and
Joseph A. Häuser Naval Research Laboratory
Washington, D.C. 20375-5000
PRECEDING PAGE BLANK NOT FILMED
J N89-23535 !
i i
/
109
<7s

SOLRAD 11 SPACECRAFT
An artist's conception of one of the two Naval Research Laboratory (NRL) SOLRAD 11 satellites that were launched on 14 March 1976 from Cape Canaveral is shown in figure 1. These spacecraft, the 65th and 66th launched by NRL, were in a 63,000 nautical mile circular orbit, spin stabilized and sun pointing. The prime power was provided by four deployed solar panels and four body mounted panels insulated from the body with a multi-layer insulation blanket.
,(
f-Wf»«fP
5J,----
v _ . . , . t *. { 1A *
.- "0.-.», <*it '»•«,<?%
?«»?: $$&$§
/O &#&'■■ -;.:r •'5'-«» * ■■.'
üH 'is*;**?' i^WäV£$$$£\^j;;;»'^
'life /•'••<"•Oa#lteS.^i^fe/i''-i'»^}Wf!iS^^^<^vi
?>&\ ?•'•*«- TtiS lii>f-»(.-"/,~i.*j<ftfef,»y.*,,lr • ws
ORIGINAL PAGE BLACK AND WHITE PHOTOGRAPH
Figure 1
110
^

SOLAR CELL AND SILVER TEFLON PANEL LAYOLTT
One of the four body mounted panels is depicted in figure 2. Overall dimensions of the panel were 25.4 cm (10.0 in) by 33.0 cm (130 in). On the panel was mounted an 80 cell series circuit of 2 an by 2 on solar cells and the non-cell area was covered with .13 mm (.005 in) thick silver teflon for thermal control. The solar cells, terminals, etc., accounted for 42.1%, and silver teflon 57.9% of the panel area. As I recall, the desiqn operating temperature was about 50 C.
SOLAR CELL CIRCUIT SILVER TEFLON UNCOATED DELRON
Figure 2
111

SOLRAD 118 SOLAR PANEL TEMPERATURE
Figure 3 is a smoothed plot of the insulated solar panel temperature versus time in orbit. The "waves" are caused by the annual variation in solar intensity due to the Earth's slightly elliptical path around the sun. Solar panel electrical output was reduced due to a non-optimum operating voltage resulting from the elevated temperature. Mission -Impact was minimal since higher voltage was only needed to recharge batteries after eclipses, which occurred about 30 times each year. Understanding the increase in temperature was a greater concern.
200 400 600 800 1,000
DAYS IN ORBIT
1,200 1,400 1,600
Figure 3
112

vor?- m^pv^m ^•tvrfv trim.i II Jl 'Uli. lip«]
s ESTIMATED CHANGE IN SILVER-TEFLON SOLAR ABSORBTANCE
It is reasonable to assume that the temperature increase is driven by an increase in the solar absorbtance of the silver teflon. I am not aware of changes occurring in material emmittance. Inorganic silicon solar cell aljsorbtance, already high, should not increase; and the reduction in solar cell efficiency is negligible. A least squares fit of the absorbtance value, derived from panel temperature, is shown in figure 4 over a period of 1500 days in orbit.
0.24
0.20
LU O 0.16 < I- m DC
8 0.12 CO <
O 0.08
0.04
ft I
-1 1—1—1 1 1 111 1 1—1—1 1 11 1—1 1 1 11 11 rp—1—1 1 1 1 1 1 1 /
■ ' ' 1 1 i 111 j 1 i I 1 1 111 J I I I Mill L 1 1 I I I I I 10 100
DAYS IN ORBIT
1,000 10,000
Figure U
113

WJ*X
NAVIGATION TECHNOI/X3Y SATELLITE-2 (NTS-2)
While data was accumulating from SOLRAD 11, NRL was preparing NTS-2 for launch. Thermal design and engineering was contracted to the A.D. Little, Inc. Both Optical Solar Reflections (03R) and silver teflon were incorporated for thermal control. Additionally, NASA Goddard Space Flight Center had a thermal control coatings experiment aboard with eight sample materials including OSR's and silver teflon. Internal deck temperatures exceeded the worst case temperature based on predicted degraded optical properties and maximum solar constant after less than two months on orbit.
^■/^#*3*3äS
iKif^K1 B&i 9K
■- ■1fijfo,jfi^#^^ üi'isäka ^Jk^S&icä&J $&&&
Figure 5
114
ORIGINAL PAGE BLACK AND WHITE PHOTOQRAPht
rs

MEASURED DEGRADATION IN SOLAR ABSORBTANCE OF OSR AND SILVER TEFLON ON NTS-2
analv^fnf ^<?5i,>5S datl frcm,the NASA-<3SFC experiment and thermal n^ Vt\L? /I f^ff^^ equipment, deck, and radiator temperatures. ^'^° °KtD- Lltt^' Inc-' deluded that the nonlineafnature of SL •^SpJgöSted «»"t^ination and, in an internal technical report, described four conceivable contamination mechanisms. Three mechanisms were based principally on "desorptive transfer". The solar panels were folded
tne intermediate transfer surface. (The figure is from D.W. Alaqren's
r
0.3
SILVERIZED TEFLON
o A EXPERIMENT DATA
• A PREDICTIONS USING THERMAL COMPUTER MODEL OF NTS-2
80 160 240 320
DAYS FROM FIRST EXPOSURE
Figure 6
400 1 A.
115
si
ii i ■■.min «L-j < 'mi i imi «■ i. -,J¥. i.... „...i-tm, ^ , ,m.n,,xnne^ii ji i.i<m!!»i.nim^.n.i.iiyii. 11 KM ypiyyj njli #PW» gmgn,'.

TEMPERATURE OF A SILVER TEFLON COVERED, EARTH FACING, RADIATOR FOR SEVEN YEARS IN LOW EARTH ORBIT
Thermal analysis of the change in temperature of an Earth facing radiator over a seven year period, as shown in figure 7, resulted in an estimated change in solar absorbtance of 0.27. Assuming an initial 0.08 absorbtance, the final value totaled 0.35. A similar vehicle with only 4.5 years in orbit has shown an increase in absorbtance of only 0.13 based on thermal analysis. Interestingly, the thermal analyst findinq these results displeasing, performed a "sensitivity" analysis, adjusting heat flow and temperature change interpretation to reduce the change in absorbtance by more than a factor of two.
(/> 3 C/3 _l UJ Ü w UJ UJ □c CD UJ o
I
LU cr 3 I- < cc UJ Q.
UJ
50 100 150 200
TIME - REVS (x 100)
Figure 7
250 300 350
116
4
i

• ÜWiHM»» TT«y ww.'i ■—nu 11 gnim i infMiwwrr* i '.■ »' J i ■«
EXPERIMENTS 3 AND 4, SOLAR CELL SHORT CIRCUIT CURREOT DEGRADATION
NTS-2 also carried solar cell experiments. Shown in figure 8 is the difference in percent of initial on orbit short circuit current of identical solar cell and cover slide circuits. The only difference was that experiment 3 coverslide had anti-reflective coating and ultra-violet filters and was bonded with space quality organic adhesive DC 93-500, while experiment 4 cover slide had no coatings or filter and was bonded with fluorinated ethylene propylene (FEP) teflon. The data is from NRL Memorandum Report 4580 (ref 1).
100
HI ü CC
z go 111
cr
Ü
Ü DC O
cc o I
80
70
EXPERIMENT 4
i—i—i | i i 111 1—i—i | i i 11
> 7.90%
_j i i I 1111 ' i i L_i_ t ' i I i i 111 t ' i l i i t i
10 100
DAYS IN ORBIT
1,000 10,000
Figure 8
117

«««»IS 1 «D 13 SOLA* CELL S^KT CI«*IT o*^ «^
Exper?SÄeÄ identical cells, while experiment 13 hS Its ^S Sj£ »Jth «g^ adhegive • any other adhesive, is it pSsibllJha? ^f^ticaUy bonded without available solar power because dearaSnTJh -hrCWing awa* 5% to 10% of It is noted that these data tref lTStSSFSS ?S°Ur *rray covers?
tions Technology Satellite (ATCJ-6 sSr ~n data.taken on the Applica- orbit (ref 2). {AB>) 6 Solar cel1 experiment in geostationary
EXPERIMENT 13
n ' r I i i i r
J-U^ L ■ '""■..I n ■ 10 100
DAYS IN ORBIT 1,000
14.0%
J ' ' ' ■ Ml
10,000
Figure 9
118

SHUTTLE LAUNCH DISPENSER (SLD) SPACECRAFT SHOWING PROPELLANT TANKS
Although, to our knowledge, NRL has not experienced debris or meteoroid damage, the threat is a design consideration for our space platforms. As an example, when designing the Shuttle Launch Dispenser (SLD), shown in figure 10, the design requirement was that there be greater than 0.99 probability that the propellant tanks would survive the expected meteoroid environment. This was accomplished by performing an analytical study that addressed the problem. First, using perforation equations, the minimum size particle that would penetrate the tank was determined. Then using a flux equation for our orbit, the probability of encountering a particle of this size or larger was determined. Using this approach the tank wall thickness was evaluated. Also, because Multi Layer Insulation thermal blankets were being used, it was decided to use a one-inch standoff for the blankets which produced a "Whipple Meteoroid Bumper" effect and provided additional protection for the tanks. Based on this analysis our tanks have a survival probability of greater than 0.999.
F"WPf!fS»SSP>I ...... jn*l,)iip|HLilJPWWtfl. fwj.uj.jinfai B.I^ ..^imi^^yi^ upu ti ,A™ ri * •(, , A- a t A t
'MiM>Mt]&
Figure 10
•;.:•<;•.:,;■•:AL' PAGE HO^.CK AM3 'A'hiTF- PHOTOGRAPH 119
i A

RELATIVE SOLAR PANEL AND SOLID ROCKET MOTOR POSITIONS
A rough correlation of the contamination of solar panels from solid rocket motor plume has been attempted. A comparison is made from pre-launch solar panel calibration output and post plume exposure data. Data samples are from several satellites. When the data was consolidated and normalized, panel 1, located behind the nozzle, was assigned 100%. Panel 2 averaged 97.0% and panel 3 averaged 97.9% of the panel 1 value.
SRM
SRM
TOP VIEW
SRM
1
TZ
SRM
SIDE VIEW
Figure 11
120
Ü

'*■"'''"»"'»"'»»«WWWW'WHW^BW.^1»»^^
REFERENCES
1# WaÜS-2 ät:n^f^nC^°f ^ Sölar Cel1 Ewi»nts Aboard the
2. ^hamrner L J ; AIS-6 solar WI Experi^nt/Improvement. Final Report, NAS Contract NAS 5-22873, 31 January 1977.
121
i i
i
l.
\
J

L '£'<-.
'■■■
ss«
S*H' JK
^■rfaaiu^ai

N89-23536 TRENDS IN ENVIRONMENTALLY INDUCED SPACECRAFT ANOMALIES
Daniel C. Wilkinson
National Oceanic and Atmospheric Administration National Geophysical Data Center Solar-Terrestrial Physics Division
Boulder, Colorado 80303
PRECEDING PAGE BLANK NOT FILMED 123
M

ABSTRACT
The Spacecraft Anomaly Data Base maintained at NOAA's National Geophysical Data Center has been useful in identifying trends in anomaly occurrence. Trends alone do not provide quantitative testimony to a spacecraft's reliability, but they do indicate areas that command closer study. An in-depth analysis of a specific anomaly can be expensive and difficult without access to the spacecraft. Statistically verified anomaly trends can provide a good reference point to begin anomaly analysis.
Many spacecraft experience an increase in anomalies during the period of several days centered on the solar equinox, a period that is also correlated with sun eclipse at geostationary altitude and an increase in major geomagnetic storms.
Increased anomaly occurrence can also be seen during the local time interval between midnight and dawn. This local time interval represents a region in Earth's near space that experiences an enhancement in electron plasma density due to a migration from the magnetotail during or following a geomagnetic substorm.
THE SPACECRAFT ANOMALY DATA BASE
The National Oceanic & Atmospheric Administration (NOAA) is the main U.S. civilian agency responsible for the operation of monitoring spacecraft. Its responsibilities include the (GOES)* series of geostationary weather and space environment monitoring satellites and the lower altitude, polar orbiting NOAA/TIROS satellites. Long and productive spacecraft lifetimes are of major importance to NOAA.
NOAA also operates a system of national data centers. The National Geophysical Data Center (NGDC) in Boulder, Colorado has responsibility for collecting, archiving, analyzing, and disseminating solar- terrestrial data and information. NGDC, under the auspices of World Data Center A for Solar Terrestrial Physics, services a worldwide interest in data and information about the origin of solar activity, the transfer of energy from the Sun to Earth, and its effects in interplanetary and near-Earth space. In line with these services, NGDC has made a deliberate effort to apply these data resources to the problem of spacecraft interaction with the the near space environment.
A data base of spacecraft anomalies is maintained at the Solar-Terrestrial Physics Division of NGDC in Boulder, Colorado. It includes the date, time, location, and other pertinent information about incidents of spacecraft operational irregularity due to the environment. These events range from minor operational problems which can be easily corrected to permanent spacecraft failures. It currently contains 2779 anomalies from 1971 to the present with contributions from seven countries: Australia, Canada, Germany, India, Japan, United Kingdom, and the United States. Data suppliers are asked to provide the anomaly type and diagnosis.
♦Geostationary Operational Environmental Satellite
124
\s

**w»w «'v*—;■—.f^f-^--^-^-;---. »»T--p^'-^y-^t»«-^^ryN'yT ji^yi [irwmwffj!. a nt,y.?.*»«w>»y^-';?'*'a',-<; TV"*"***^
The data base is maintained on an IBM compatible personal computer. To facilitate access to the information, software has been written to perform a full range of functions for managing and displaying the contents. Satellite users can use the Spacecraft Anomaly Manager (SAM) software to create a data base containing only their anomalies and forward the data to NGDC on floppy disk for inclusion in the archive. In order to preserve confidentiality, when necessary, spacecraft may be identified by aliases.
SAM also includes two important functions to test anomaly collections for environmental relationships. Histograms of local time and seasonal frequency show distinct patterns for spacecraft susceptible to static charge build-up and subsequent discharge. The current version of the software does not perform statistical validation but the user may convert the data to a standard ASCII file that can be uploaded to any computer and processed by user supplied software.
STATISTICAL METHODS
Grajek and McPherson (ref. 1) point out the value of using statistical methods for analyzing apparent trends in anomaly occurrence. The Chi-square test for randomness can determine the probability that a given histogram, or one with similar deviations from the mean, could occur randomly.
The Pearson Product-moment Correlation Coefficient can determine both the strength of a correlation and the probability of error in establishing a correlation where none exists. A coefficient of 1 indicates perfect correlation, 0 indicates no correlation, and -1 indicates perfect anticorrelation.
These two methods were used to analyze each of the following histograms with the help of public domain software (ref. 2) . The results are reported in the discussions that follow.
125

r.-7"* AS
SEASONAL TRENDS
Figure 1 shows the basic definition of 'seasonal'. The histogram displays the apparent solar declination on the 15th of each month in whole degrees . The cartoon shows the sun-earth geometry that causes a variety of environmental effects on spacecraft in near-Earth-space. This distribution is used to test for seasonal correlations in the anomaly data.
Apparent Solar Declination in |Degrees|
1
f H m
si £ -
s -
>i 1
■'■1 - t:.
a $ :|j m
^1 jj
I aMm Jan Feb Mar Apr May Jun Jui Aug Sep Oct Nov Dec
Sun
FIGURE 1" .
One effect of the variation in apparent solar declination on spacecraft is the periods of eclipse that occur at spacecraft in reostationary orbit as shown in figure 2. These periods of earth- shadowing occur at the spring and fall equinox near midnight local time. The periods of darkness cause an interruption in the charge balancing phenomenon that relies on the photoelectric boiling off of electrons. During equinox a spacecraft at geostationary altitude will encounter magnetotail plasma boundaries more often.
Apparent Solar Declination in |Degrees|
i onn Jan Feb Mar Apr May Jun Jul Aug Sep Pel Nov Dec
Minutes of 1500 Eclipse for 1000
Geostationary Orbits
Jan Feb Mar Apr May Jun Jul Aug Sep Oct Nov Dec
5C0
FIGURE 2
126
T>

nrjsz^-
The distribution of major magnetic storms is shown in figure 3. It has a very low probability of being random (.00042) and a moderately high anticorrelation to the histogram of declinations (-.89) with a very small probability that the correlation is wrong (.00011).
Seasonal Distribution of Major Magnetic Storms 1932 -1987
Sun
FIGURE 3
Figure 4 displays the seasonal distribution of all 2779 data base anomalies and shows a distinct increase around the spring and fall solar equinoxes. This anomaly distribution has a very low probability of being random (.0000018) and a moderately high anticorrelation to the histogram of declinations (-.86) with a very small probability that the correlation is wrong (.00011).
Seasonal Distribution of all Anomalies
1900 Jan Feb Mar Apr May Jun Jul Aug Sep Oct Nov Dec
Minutes of Eclipse at Geostationary Altitude 500
1500 r
iooo r
m
i
Jan Feb Mar Apr May Jun Jul Aug Sep Oct Nov Dec
FIGURE 4
127

• .— -J-..-- f-fl*'f} IT, r< f
The GOES-4 & -5 phantom command anomalies shown in figure 5 are a prime example of a seasonal dependence. The phantom commands have been diagnosed as a surface charging problem which is consistent with the seasonal phenomenon. These charging events have a moderately high anticorrelation to the histogram of declinations (-.72) with a very small probability that the correlation is wrong (.0073)
The GOES-4, -5, and -6 telemetry anomalies also shown in figure 5 have been diagnosed as Single Event Upsets (SEUs). This anomaly distribution has a good probability of being random (.26) and a weak anticorrelation to the histogram of declinations (-.23) with a large probability that the correlation is wrong (.47). Since galactic cosmic ray fluxes are random in the seasonal context, the statistics validate the SEU diagnosis made for the GOES telemetry errors.
24
GOES-4 & -5 Surface Charging 16 Anomalies Mar 1981 - Sep 1987
GOES-4 & -5 SEU Anomalies Jun 1981 - Apr 1988
Jan Feb Mar Apr May Jun Jul Aug Sep Oct Nov Dec
FIGURE 5
Tracking and Data Relay Satellite System (TDRSS-1) anomalies shown in figure 6 show no distinct seasonal variation in anomaly occurrence. This anomaly distribution has a very good probability of being random (.44) and a moderately weak anticorrelation to the histogram of decli- nations (-.55) with a small probability that the correlation is wrong (.062). However, the TDRSS SEUs show twice the seasonal correlation the GOES SEUs do.
Seasonal Distribution of TDRSS-1 Anomalies April 1983 - September 1987
Jan Feb Mar Apr May Jun Jul Aug Sep Oct Nov Dec
~W~ tfc ~W Sun
FIGURE 6
128
i^N

^^^PW^*'jyi->lNW(^i'«^w^»w<,yyij|l|.iy »iiiBw<Wtti>?pRf^Vff ^P^^»f ^^tfWW.WJTJ^IBM'Wft^l'iM^1 tljlf* - ^TJJW.V.^'Wyfl'^'^fjyf'JBWiyS
LOCAL TIME TRENDS
Figure 7 shows the local time distribution of the 2272 anomalies in the data base that have sufficient information for a local time calculation. This anomaly distribution has a small probability of being random (.00035). There is the expected midnight to dawn bump and two additional bumps, one centered at 12 LT* and one centered at 17 LT. The smaller enhancements may be explained later when a Sun-Vehicle- Earth (SVE) angle calculation is added to the anomaly entries. For specific spacecraft designs there are SVE angles that allow parts of a spacecraft to cast shadows on itself, causing a partial eclipse situation. *
140 T
Local Time Distribution of ail Anomalies in Data Base
00 02 04 06 08 10 12 14 16 18 20 22
Satellite Local Time
FIGURE 7
In figure 8 the GOES surface charging anomalies show a classic ? n™™^ d!Wn grouping with a small probability of being random (.0000022). The GOES SEU anomalies show no such grouping and have a very high probability of being random (.94), consistent with SEUs.
Local Time Distribution of GOES-4 & -5 8
Surface Charging Anomalies
o
Local Time Distribution of 3
GOES-4 & -5 2 SEU , Anomalies
00 02 04 06 08 10 12 14 16 18 20 22
BÖBIE 00 02 04 06 08 10 12 14 16 18 20 22 Satellite Local Time
FIGURE 8
"Local Time
129
V

Figure 9 shows a clock face plot that distinctly displays the grouping of GOES surface charging anomalies between midnight and dawn. This type of grouping is due to a migration of KeV electrons from the magnetotail during magnetically disturbed periods and illustrates the extremely low probability of randomness (.0000022).
Noon
Midnight
FIGURE 9
TDRSS-1 anomalies show no increase of anomaly occurrence during the midnight to dawn local time interval and have a very high probability of being random (.97), consistent with SEUs.
Local Time Distribution of TDRSS-1 Anomalies
00 02 04 06 08 10 12 14 16 18 20 22
Satellite Local Time
FIGURE 10
CONCLUSION
There is value in studying the trends, or their absence, in populations of spacecraft anomalies. This is only possible if there is a systematic recording of operational spacecraft anomalies and a willingness to merge those records with a common body of data for correlative study. The Spacecraft Anomaly Data Base and software for managing and studying the data are available from NGDC for these purposes.
130

;■* .,m Mil(g»i
REFERENCES
spacecraft Envircn^ent. N^lf N^-Am! °" "lth the LOCal
" *■l£^SgIti•.•^SS?,a.l•*•fil.■,V0•1 packa9e for the *»
131
\A \ i
i
i
)
i i
t


N89-23537 j<^ RETURNED SOLAR MAX HARDWARE
DEGRADATION STUDY RESULTS f
Jack J. Triolo Gilbert W. Ousley
Goddard Space Flight Center
PRECEDING PAGE BUNK NOT FILMED
i
t
1
1
i
i i *
i
1
133 i
•»

ABSTRACT ^
• S The Solar Maximum Repair Mission returned with the replaced •
hardware that had been in low Earth orbit for over four years. The materials of this returned hardware gave the aerosace community an opportunity to study the realtime effects of atomic oiygen, solar radiation, impact particles, charged particle radiation.and molecular contamination. The results of 16 participants in these studies are summarized.
134

INTRODUCTION
The Solar Maximum Mission (SMM) spacecraft, built at the Goddard Space Flight Center, was launched in February 1980 with solar flare research its primary objective. Launched near the peak of the 11-year solar cycle, the SMM was put in a 310 nm, nearly circular orbit with 28.5° inclination. The spacecraft's longitudinal axis was pointing at the Sun in a 3-axis stabilized mode, so that the seven instruments aboard the spacecraft could monitor the activities of the Sun. Some of the instruments required very fine pointing accuracy and stability to obtain high-resolution data. During the initial period, the pointing accuracy of the SMM was better than 2 arc-sec with stability less than 1 arc-sec.
The following instruments were carried by the SMM spacecraft:
Active Cavity Radiometer Irradiance Monitor Coronagraph/Polarimeter (C/P) Gamma Ray Spectrometer Hard X-Ray Burst Spectrometer Hard X-Ray Imaging Spectrometer Ultraviolet Spectrometer/Polarimeter X-Ray Polychromator
Six of the instruments were designed to observe solar flares in regions of the electromagnetic spectrum ranging from visible light through ultraviolet and x-ray emission to gamma rays. The seventh instrument, the Active Cavity Radiometer Irradiance Monitor, monitored the Sun's total radiation.
Equipment and Instrument Failures
The first months of the mission were very successful. The spacecraft and the instruments operated flawlessly with hundreds of flares monitored and recorded. In September 1980, about 6 1/2 months after launch, one of the three gyro channels (Channel C) of the NASA Inertial Reference Unit failed. The required attitude control was maintained, however, without performance degradation by the two remaining gyro channels (A and B) until November 1980, when three fuses burned out in the reaction wheel control circuits. In December 1980, a yaw magnetic torquer also failed. A coarse attitude control mode was established using the remaining magnetic torquers. The spacecraft was spin stabilized at a rotation rate of 1 deg/sec with a coning motion that moved the Sun pointing spacecraft axis up to 15° off the Sun line. Only two of the seven instruments were 100% operational (Gamma Ray Spectrometer and Hard X-Ray Burst Spectrometer) since they did not require precise pointing. One instrument functioned with limited capability (Active Cavity Radiometer Irradiance Monitor). Two of the instruments were not able to operate due to the backup attitude control mode (Ultraviolet Spectrometer/Polarimeter and X-Ray Polychromator) and two others had failed and were inoperative (Coronagraph/Polarimeter and Hard X-Ray Imaging Spectrometer).
135
iJ

™-~»»»-»i.J ii- !U> (iMKld
136
Solar Maximum Repair Mission
The Solar Max spacecraft was the first spacecraft designed to be serviced and repaired in space by the Space Shuttle crew. The Modular Attitude Control System (MACS) module was designed to be an orbital replacement unit, but the instrument repair was more complex because the Instrument Module (IM) was not designed to be repaired or replaced in orbit. Of the two failed scientific instruments, only the C/P was considered repairable. An identical spare MACS module was available from the Landsat program and a new C/P Main Electronics Box (MEB) was built specifically for the repair mission.
The Solar Maximum Repair Mission (SMRM) was performed by the crew of the STS flight 41-C in April 1984. By this time the SMM orbit altitude had decayed to 265 nm. Attempts by the astronaut using the Manned Maneuvering Unit (MMU) to dock to the spacecraft and to stop its rotation failed. The docking attempts imparted to the spacecraft uncontrollable roll, pitch and yaw rates. After the spacecraft was stabilized using specially uplinked software, the spacecraft was grappled by the Orbiter's Remote Manipulator System (RMS) and placed on the Flight Support System (FSS) located in the Orbiter Bay.
The MACS module was removed from the SMM and placed on its temporary storage fixture ( / on the FSS. After the new module was mounted on the SMM, the old module was secured in ' its landing location on the lower starboard side of the FSS. The entire MACS module replacement took less than an hour.
The replacement of the Main Electronics Box of the Coronagraph/Polarimeter was the next repair operation. The MEB was replaced successfully, even though it was not designed for servicing. The faulty MEB was stowed in a storage area in the FSS tool locker for return to Eaith.
i
After the replacement of the faulty equipment, the SMM was checked out and deployed to provide mere data near the Sun's least active solar flare period. The Orbiter landed two days later on April 14, 1984.
i
Post-Flight Handling of Returned Equipment
After landing at Edwards Air Force Base in California, the Orbiter and its returned payload were flown on the 747 to the Kennedy Space Center (KSC). After three days in the Orbiter Processing Facility (OPF), the FSS with MACS attached was removed from the Orbiter and f transported to the Operations and Checkout (O&C) building.
Because of concern that contamination may mask the environmental effects on the returned equipment, the MACS and the MEB were bagged while in the O&C building and under QA control with rigid handling limitations. The MACS and MEB were removed from the FSS and placed in their respective storage containers. A one square foot wash plate and a fallout grid/surface had been attached to the MACS in the OPF before removal from the Orbiter to monitor molecular and paniculate contaminants deposited from the time the MACS was taken out of the Orbiter bay to when it was unpacked at GSFC. The same procedure was used with MEB but the sequence started at the O&C building where the MEB was removed from the FSS }. tool locker.
/
4 i i x

War**i *"."* ??:"* , . .~T *.. ". j i ■■■ ■■! ■ -. _. ■ ■■-! ii'-r-i- i "■ TIT'"ii ' i
Clean room attire was used by the handling personnel at all times. Except for the time when the units (MACS & MEB) were packed in their separate shipping containers, the units were protected from contamination by bagging made of Capran 518. When the wash plates and fallout plates were removed after unpacking the units at the GSFC, analyses indicated that the protected surfaces were in better condition than required by Mil Std 1246A level 100A.
The returned hardware was stored in a class 10,000 cleanroom at the GSFC. Thermal blankets were carefully cut and removed, then stored in display containers.
Post-Flight Analysis
The returned MACS unit and the MEB of the Coronagraph/Polarimeter offered an opportunity to examine the hardware in an effort to determine the causes of the failures and to study the effects of 50 months exposure to the Low Earth Orbit (LEO) environment. Natural orbital environments, such as solar ultraviolet radiation, charge particles, atomic oxygen, and micrometeroids have been demonstrated to degrade thermal radiative properties like solar absorptance, and material mechanical properties such as elongation and tensile strength. More subtle effects on surface electrical properties have also been observed. Similar effects can be caused by self-induced environments, such as molecular and paniculate contamination and by space debris carried into orbit (or created) by the launch vehicle, the spacecraft, or the payload.
The atomic oxygen and space debris effects were for the most part noted from experiments on STS-3 to 8. The contrasts in effects should provide a gauge to assess the reliability of Orbiter based testing of materials for higher altitude and longer term predictions.
HARDWARE ANALYSES
Main Electronic Box
The Main Electronic Box (MEB) provides the control and data handling functions for the Coronagraph/Polarimeter (C/P) instrument. The coronagraph creates an artificial total eclipse of the Sun by using a series of external disks to prevent direct sunlight from falling on the objective lens of the telescope. The C/P operated successfully taking pictures of Sun's corona for 5 months after launch before the first failure occurred. Fortunately, the failed microcircuit could be bypassed by ground software. The second failure in the electronics occurred about a month later, August 8, 1980, but the instrument was kept operating with only an occasional loss of data. The third electronics failure occurred in early September, but a solution to prevent unnecessary shutdowns was found by modifying the onboard software. The terminal failure in the electronics occurred on September 23, 1980, which rendered the instrument inoperative.
Subsequent post-flight analysis showed that all the failures occurred in one type of integrated circuit MM54C161J/883B manufactured by National Semiconductor. There were a total of 21 such microcircuits in use of which three failed. Electrical testing of two of the devices isolated the failures to short circuited transistors. The third device could not be tested because of damage during removal from the PC board. The short circuits were caused by defects in the gate oxide material as a result of time, temperature and applied bias voltage. Several oxide defects were also observed in the third device.
t t ,
137

In addition, nine National Semiconductor MM54C161J microcircuits were removed from the MEB and tested. All nine devices had been operating properly on the MEB. Two of the devices failed marginally the initial electrical tests. One device failed catastrophically a static burn-in test at 125°C for 24 hours. The failures were similar to the in-orbit failures of the parts of the same type. Also the parts had similar defects in the gate oxide material, which indicates a lot related problem. There is some question about the burn-in of these devices before delivery. A proper burn-in is an accepted determinant of a parts reliability and will usually weed out weak devices.
Radiation Effects of Selected MEB Electronic Parts
A total of 29 parts of 9 different types were submitted to static, dynamic and functional electrical tests. The tested parts included flight parts and residual parts from the same date code lot as the original flight parts. The flight parts had been under power or bias for the first 8 months and about 10«7o of the time thereafter. These parts also had a year to anneal at ambient room temperatures on the ground.
The flight electronic parts showed no adverse effects due to the low Earth orbit radiation environment. Complex linear devices (/»A108A) begin to degrade at low doses and dose rates and will be susceptible to failure at higher altitudes and/or longer exposures. More detailed evaluation of electronic parts in orbit will be possible from the CRRES mission planned for 1986 and from the Space Station. Radiation detectors will then actually measure the environment experienced by electronic parts which will be simultaneously monitored for electrical performance.
Selected Hardware Studies
The evaluation was performed on the returned module retension system preload bolts, MEB honeycomb panel epoxy film adhesive and the thermal louver blade polyimide adhesive.
The two returned bolts were tested for yield strength and ultimate tensile strength. The tests showed no degradation in either category and the results were comparable to those of an unflown bolt.
The MEB honeycomb panel evaluation produced a conclusion that there was no degradation in room temperature bond strength of the epoxy film adhesive.
The returned louver polyimide blade adhesive was tested for lap shear strength and compared with unflown specimens. The results showed an average of 659b reduction in shear strength as compared to the unflown specimens. However, the reduction was not considered a severe one as evidenced by the bonding which survived the action and environments in good condition.
The returned thermal louver blades had red nodules on both sides of the blades. Evidence suggests that the red nodules represent regions of pure polyimide resin cured in space.
Infrared reflectometer measurements were performed on the returned louver blades and compared with those of unflown spare louver blades. The results showed no degradation of infrared reflectivity. Also the louver blade open and close temperature settings showed no degradation. The measured post-flight settings were well within the specification limits.
\(
138
CN

s NASA Standard Inertial Reference Unit (DRIRU II) \ »
The returned unit was the first production DRIRU II (S/N 1001) used as one of the ' subsystems of the Modular Attitude Control System (MACS). The DRIRU is a self contained, strapdown, three axis, dual redundant attitude rate sensing unit. Three orthogonally mounted, two-degree-of-freedom gyros and a triplication of electronic modules and power supplies are used to provide full operational capability with any two of the three channels. The gyros in the DRIRU II are Teledyne SDG-5 Dynamically Tuned Gyros.
The investigation concluded that gyro channel C failed because of an intermittent electrical short in the motor control logic. Because the failure occurred near the South Atlantic Anomaly, much effort was devoted to determine if the failure could have been caused by radiation. After extensive tests, it was concluded that radiation was not a probable cause of the failure. Subsequent tests at the GSFC Parts Analysis Laboratory showed that the failures occurred in three logic devices. Two of the devices failed because of an electrical overstress. As of this date, the cause of the overstress has not been determined. The third device most likely failed because time, temperature, and an out-of-tolerance logic supply voltage created a short at a latent defect of the device. The defect apparently was caused by an irregularity in the manufacturing process. (See 'DRIRU II Electronics Parts Analysis.') .
i i
After the system was reassembled with two substitute electronic modules, a full series of tests were performed to evaluate the stability o. the unit over the full operating temperature range. Also the repeatability of the parameters as compared to the delivered state was investigated. The test series were designed to repeat the complete 1978 acceptance tests.
The physical condition of the system was excellent with no apparent materials degradation. There was no evidence of system performance degradation due to operational and other environments. The system had excellent long-term stability of performance parameters over the launch, orbital operation and retrieval environments during a 74-month period.
There was no measurable degradation of the shock/vibration isolators as evidenced by the excellent alignment stability of the gyro axes through launch environments and over an extended time period.
There was no evidente of structural or mechanical changes and no apparent outgassing or degradation of exposed surfaces. ,
Examination at Teledyne found that the gyro ball bearings showed no excessive wear to ! raceways, balls, or retainers. However, there was some dark colored, viscous residue mainly in the ball tracks and the retainer ball pockets. (See 'DRIRU Bearings and Lubricant' for summary of GSFC analysis.) '
DRIRU Bearings and Lubricant
One of the DRIRU gryoscopes was disassembled and the bearings were returned to GSFC for examination. The gyroscopes had been running continuously in orbit for 4 years at 6000 RPM.
139
r>

The bearings showed some wear in the form of tiny pits and scratch-line deformations. Numerous tiny particles were observed clinging to the bearing parts after the case and the hysteresis ring were removed. The particles had originated from the pits of the bearing races
and the balls.
The lubricant for the bearings is contained in the retainers which are made from a porous, phenolic material. Examination showed that the bearings were lubricated.
The conclusion was that the bearings showed little wear and had a sufficient amount of lubricant left to perform without problems for their predicted life of 5 years.
DRIRU II Electronics Parts Analysis
The failed part in the gyro channel C of the DRIRU II unit was an RCA CD40I7AK microcircuit, a decade counter. The part was submitted to the GSFC Parts Analysis Laboratory for failure analysis. The tests determined that the failure was due to a short circuit through an oxide defect underneath the output metalization. The defect was the result of a manufacturing irregularity during processing.
Two other devices, an RCA CD4049AK and a CD4081BK, both microcircuits of the DRIRU II gyro motor control logic, were submitted to the GSFC Parts Analysis Laboratory for failure analysis. Both devices had failed in flight due to a fused open die metalization track. A pin on each of the devices was open circuited to all other pins. The fused open metalization was a result of electrical overstress.
Remote Interface Unit
The Remote Interface Unit (RIU) was designed and built by the Fairchild Space Company. The first application of the RIU was on the SMM spacecraft. The unit provides two-way communications between electronic packages on the spacecraft and a central command and telemetry unit (CU) which decodes and distributes commands and generates telemetry formats. The CU communicates with the On-Board Computer (OBC) through the Standard Interface and with the ground via the RF equipment.
The standard MACS module carries two redundant RIU's which have three operational modes: 'OFF,' 'Standby 1,' and 'Standby 2.* The last two are sub-modes of the 'ON' mode. During the flight, Unit A was operating in the full 'ON' mode (Standby 2). Unit B was operating in the 'OFF' mode (only Bus Receiver/Control Logic and Power Converter continuously powered). Throughout the flight, no malfunctions of the Units were indicated.
The RIU's were returned to Earth with the MACS module and Unit B underwent a post- flight engineering evaluation from Decembet 1984 until April 1985. The pre-flight tests were performed in 1979.
Post-flight external and internal visual inspection revealed no degradation. Besides the visual inspection, RIU B underwent two other kinds of engineering tests. Automated test equipment was used to qualify the unit as a whole ('GO - NO GO'). In the other test, a parametric test,
140
i <
1 *

each parameter was evaluated separately. The parametric evaluation includeduser telemetry interface orcuitry (active and passive analog linearity), phase lock loop performance, pulsed output current and width, serial digital commands, serial digital telemetry, and power dissipation. F
The tests were performed at ambient temperature, -20°C, and +60°C. The cold and hot temperatures are the qualification limits. AH parameters evaluated were found to be within specification. When compared to pre-flight test data, in many categories the post-flight data showed some improvement. The test results qualify the unit foi reuse in another mission.
Three Axis Magnetometers
Tw^ THet0TterSKr USCd t0 SCnSe SPaCCCraft attitUde With resPect to Earth'* magnetic field. Two Three Axis; Magnetometers, designated as the primary and secondary magnetometer are
dTete/r MfCS m0dU,C- ThC ma^°met- - ««P* magnetometers wm^h pro- duce three analog signals proportional to the magnetic field components along their input axes.
The magnetometers together with the magnetic torquers provided an important function dur- ing one part of the SMRM when they were used to stabilize the spacecraft's attitude Only one of the magnetometers was used during the SMM. The other, serving as a backup unit, was never used because the primary unit did not malfunction.
After the magnetometers were returned to the manufacturer, they were subjected to the same
nXnTT ^.^rT ^formed bef°" the flight. The post-flight tests showed tha " magnetome ers still satisfied the original specification requirements. The post-flight test data nearly duplicated the pre-flight data.
Standard Reaction Wheels
attInH f°Ur f T0^ R!a,ai0n Whee,S arC comP°nents of the MACS module and are used for a« tude control and stabilization. They are essentially flywheels and work on the principle o? ex-
ed wf/h^3"8 U,arm°mentUm wkh <he sPac^ft body. Normally, three of the wheels a^e align ed with the principal axes of the spacecraft. The fourth, a redundant skewed wheel, is used to replace any of the orthogonal wheels in case of a wheel failure. In normal operation t is run at a bias speed to keep the other three wheels away from zero speed and to maximize belrTng Hfe
After the return of the wheels to the manufacturer on January 24, 1985, they were subiectedto visual examination, preliminary electrical checks, performance tests It ambient, hot and cold
nZvTr enVi:Teif' and internaI Pressure measurements. One wheel, which showed a slightly deteriorated performance, was selected for teardown.
Visual examination found the wheels in good condition. Preliminary electrical tests, continui- ty, bonding, and isolation were satisfactory. The bonding resistance for two of the four units was shghtly above the requirements but was not considered excessive.
The internal pressure measurements indicated that the pressures were far below atmospheric confirming that the vacuum seal was still intact. »uspner.c,
141
r?N

WxX
All four units successfully passed the performance tests with the exception of the 500 RPM torque noise test using a .1 rad/sec high pass filter. However, the units met the torque noise test with the 0.3 rad/sec high pass filter in the test circ lit.
Individually, two of the units showed very similar performance results as compared to pre- flight tests. One unit showed decreased bearing drag torques and extended coastdown times. Another unit had a 45% increase in drag torques and reduced coastdown times, although it met all requirements. It had been exposed to a no-load overtemperature (60°C) for approximately 3 hours due to a software problem.
Teardown analysis of the overtemperature-exposc. unit showed an 'as new' appearance of the internal components and surfaces. The lubrication analysis showed a greater lubrication loss in the floating cartridge system than in the fixed cartridge system. An investigation package in- cluding contamination wipes, lubricant samples, bearing components and photographs of some items was sent to NASA GSFC for analysis
NASA Standard Star Trackers
The MACS module includes two Fixed Head Star Trackers (FHST) which are used together with the inertial reference unit and the on-board computer to determine and maintain the spacecraft's attitude with the required accuracy. Because the star tracker is a very sensitive in- strument, its image dissector tube must be adequately protected from high level light sources such as the Sun. This was done by providing light shades and a shutter operated by a bright ob- ject sensor. At the time of the grappling attempt, the trackers and the shutter were powered-off. They remained in this condition until recovery.
The cathode of the image dissector tube detector was extensively damaged by the Sun follow- ing the attempts by the astronaut to dock with the spacecraft using the Manned Maneuvering Unit (MMU). The spacecraft was tumbling out of control for many hours before it was finally stabilized so that it could be grappled by the Remote Manipulator System. The tumbling expos- ed the sensitive cathode to the Sun causing permanent degradation. This prevented proper operation of the tracker after return to Earth and made comparison with pre-flight characteristics impossible. Otherwise, the tracker functioned nominally during testing at the GSFC and the Kennedy Space Center.
The trackers performed flawlessly during the Solar Maximum Mission. Because of inconsisten- cies in the flight data, some questions arose about the position calibration and alignment. The inconsistencies were attributed partly to a new calibration method and partly to the scarcity of flight data.
During the period from the spacecraft failure to just prior to recovery, the trackers were used occasionally, but were always adequately protected by the shutter.
The tests discovered that the 'tracks' made by the Sun across the cathode were insensitive regions which could not produce an adequate signal to track a star. It was also discovered that the lens of tracker S/N 001 had on its surface large peelings from the lens coating.
142

■ >
MATERIALS ANALYSES
Materials analyses have been performed on materials retrieved from the Solar Max thermal control system, and on various impact particles that were imbedded in the thermal control materials. The materials analyzed were aluminized Kapton and Mylar, and Dacron netting from the multilayer insulation (ML1) blankets, and silver Teflon used on a thermal radiator and as trim on louver assemblies.
MLI is used to thermally insulate various spacecraft components. The portions of the MLI returned to Earth are primarily from the blankets used to insulate the MACS. Other pieces are from the blanket that covered the Main Electronics Box of the Coronagraph/Polarimeter. Aluminized Kapton is used for the top layer of the MLI. Other layers of the MLI are aluminiz- ed Kapton (MACS) or aluminized Mylar (MEB) separated by Dacron netting. A summary of the analyses is reported in the following section.
Silver Teflon is used on spacecraft components to increase the thermal radiation performance of exposed surfaces. The silver Teflon removed from the MACS is from the thermal louver assembly.
The chemistry of various impact particles, both natural and man made, has been analyzed. These impact particles were found imbedded in the MLI and in the thermal louvers. A summary of these analyses is reported in section 'Impact Particles.'
Insulation Materials
There are two different forms of MLI insulation blankets returned to Earth from the Solar Max. In both forms, the top layer is made of Kapton with an aluminum layer vapor deposited on the inside surface. The bottom layer, the layer facing the spacecraft systems, is also made of aluminized Kapton, with the aluminum facing the inner layers of the MLI. In both forms, every layer is separated and supported by a Dacron mesh.
The MLI blankets that covered the MACS are composed entirely of aluminized Kapton. The top and bottom layers are made of 2 mil Kapton. There are six to ien inner layers of 1/4 mil Kapton, aluminized on both sides. The MLI taken from the Main Electronics Box is made of aluminized Kapton and aluminized Mylar. The top layer is 3 mil Kapton and the bottom layer is 1 mil Kapton. There are fifteen inner layers of 1/4 mil Mylar, aluminized on both sides.
The MLI materials have been analyzed by various investigators primarily using optical microscopes and Scanning Electron Microscopes (SEM). In addition, infrared spectroscopy was used to detect potential changes in the Kapton polymer structure, and a solar reflectometer measured solar absorptance. Measurements have been made of Kapton samples by exposing them to low pressure atomic oxygen discharge, to a microwave discharge rich in ultraviolet and to a 3 Kv argon ion beam under high vacuum conditions.
V1
143
2?

v ^
Aluminized Kapton Degradation
The most apparent change in the MLI is the dull appearance of the top Kapton layers as compared to the shiny surface of new Kapton samples. Thus, studies of the MLI samples have concentrated on a possible degradation of the Kapton material. Observations show the outer Kapton surface to be eroded, thereby creating the dull appearance. This finding is similar to the results of tests performed on-orbit during the STS-8 mission. Findings on STS-8 as well as SMM indicate that changes in the Kapton are most likely due to the presence of atomic oxygen.
Degradation of the Kapton surface appears to be greater in areas cleaned during preflight operations with an alcohol based solvent. The same study has revealed tunnel-like substructures under the Kapton surface in the region of the interface between the alcohol wiped and non- wiped areas. It- is believed that this is caused by the diffusion of atomic oxygen through the surface and reaction with the underlying polymers. Associated with the thin tunnel surfaces are small holes believed to be the result of atomic oxygen and UV interaction.
Infrared spectroscopy indicates that while there is obvious degradation in the Kapton, the actual polymer structure has not changed. Measurements of thickness of the top Kapton layer from the front of the MACS indicate that the Kapton suffered mass losses ranging from 0.54 percent to 31.4 percent. One sample fiom the bottom of the MACS suffered a 41 percent mass loss.
In order to more specifically determine the cause of the Kapton mass losses, Kapton samples were exposed to a variety of atomic oxygen sources, ion sources and ultraviolet (UV) sources. These tests suggest that the greatest surface etching is due to a combination of atomic oxygen coupled with exposure to UV. The angle at which the surface is exposed to these elements is probably significant.
Studies of the back side of the top Kapton layer from the MEB have revealed areas where the 'deposited aluminum is missing. These areas include scratches most likely caused by the handling of the MLI. Other areas are pinhole in size in a regular pattern, causing the illusion of penetrations in the transparent Kapton layer. These transparent pinholes appear to correspond with the knots in the underlying Dacron mesh, leading to the speculation that the knots have rubbed the aluminum off. While some surface holes appear to be the result of atomic oxygen and UV interaction or the illusion of transparent Kapton, other surface holes appear to be the result of particle impacts. Not all of these holes show a total penetration. The subject of particle impacts is discussed in section 'Impact Particles.'
The significance of the Kapton degradation to spacecraft designers lies in potential changes in the MLI performance. Measurements have been made of solar absorptance of the Kapton material. The solar absorptance of the Kapton material is typically 0.37 to 0.41 prior to on-orbit exposure. The post-flight measurements indicate that the solar absorptance of the SMM Kapton samples has increased by 0.03 to 0.04. This increase is probably due to the optical scattering effect of the degraded Kapton surface. This small increase should have little effect on the performance of the MLI insulation blankets. However, greater degradation of the top Kapton layer that may significantly affect the performance of the MLI, cannot be ruled out in future missions.
1 .'I
144
r-

Inner Layer Material Degradation
An examination has been made of the aluminized Mylar films and the Dacron mesh from the inner layers of the MLI which was used to cover the MEB. Optical microscopes of up to 400 power have revealed no erosion in these materials. The only apparent damage to these materials ' was caused by the impact particles (see 'Impact Particles').
; i Silver Teflon
Silver Teflon is a thin Teflon film on which a layer of silver is vapor deposited. A layer of Inconel is deposited on the silver for protection from the environment. The Teflon film used on ' the SMM spacecraft is 5 mils thick with a 1500 Angstrom thick layer of silver and a 100 Angstrom thick layer of Inconel. Silver Teflon is used in the thermal protection system to increase the thermal radiative performance of various exposed surfaces. The film is normally applied so that the Teflon side is exposed to the orbit environment. j
I
All silver Teflon samples given to investigators for analyses were exposed to the orbit \ environment on the Teflon side. Some material was also exposed on the silver/Inconel side, due , i to its unique application as trim on the MACS louver system (see 'Post-Flight Photographs'). It - j has been found in both cases that the surfaces were affected by the long duration exposure.
The silver Teflon has been analyzed, as in the case of aluminized Kapton, primarily with s optical and Scanning Electron Microscopes. The absorptance of exposed samples has been ] * measured and Energy Dispersive X-Ray Analysis (EDAX) has been used in conjunction with '■ V
SEM to detect the presence of trace elements. Some samples have been tested with exposure to low pressure atomic oxygen discharge, and other samples have been subjected to tensile strength testing. j
Teflon Surface Degradation ' '
Observations of Teflon exposed surfaces show evidence of a reaction to the orbit > , environment. Unexposed Teflon is smooth in appearance, while the exposed Teflon has been ' 1 described as having a 'bristle-like' reaction pattern. »
The bristle-like structures in exposed Teflon have also been described as cone-like structures. • These adjacent cones are easily visible in magnified views of Teflon samples exposed io atomic oxygen and UV. The cause of this Teflon degradation has been studied by exposing a new sample of silver Teflon to atomic oxygen alone. Although the Teflon surface was no longer smooth, it did not have the deep cone structures of the SMM samples. There is speculation that a combination of atomic oxygen fluence and UV exposure will cause a more severe Teflon { reaction than atomic oxygen alone, resulting in the cone structures. ', 1
Teflon is a fluorocarbon polymer. It has been found that exposure to atomic oxygen depletes Teflon of fluorine. This is evidenced by an increase in the detected carbon/fluorine ratio. Further study is required to determine if longer on-orbit exposures would result in any further breakdown of Teflon.
145

146
I Silvcr/Inconel Surface Degradation M
The samples exposed on the silver/Inconel surface also show reaction to the orbit / environment. Reactions range from cracks in the Inconel layer to a total depletion of s.lver and Inconel. In the later case, the exposed Teflon surfaces of some samples have developed the cone
structures discussed earlier.
Many samples show the whole range of reactions. Between the extremes, a grain pattern of silver/Inconel was formed. Nearing the silver depleted regions, the gram bod.es become smaller
with the pattern of cracks more widespread.
The cracks in the Inconel surface may be due to temperature cycling under varying orbit conditions. Other evidence has indicated that the reaction of Inconel with atomic oxygen causes removal of the Inconel layer. Silver oxide deposits have been found on sample surfaces TTie silver oxide may have come to the Inconel surface through the apparent cracks after the exposed
iver reacted with atomic oxygen. Exposure tests indicate that the silver/Inconel depleüon may be caused by exposure to atomic oxygen alone, or to a combination of atomic oxygen and UV. This suggests a mechanism for the loss of Inconel and silver. First, the atomic oxygen and temperature cycling causes the loss of Inconel and the formation of cracks. Silveroxide,and perhaps silver peroxide) forms and then flakes off in response to temperature cycling. Th.s cycle continues until Teflon is exposed, and the Teflon reacts to atomic oxygen and UV resulting in
the formation of the cone structures. i
Tensile strength tests have shown that samples with eroded surfaces have no resilience. , Abrupt breaks appear to have occurred in the same direction as thermal expansion/contraction. It was found that the tensile modulus of silver Teflon exposed to atomic oxygen decreased by about 15%, while the modulus of samples exposed to atomic oxygen and UV decreased by
about 30%. I
Measurements have been made of solar absorptance of the returned Teflon material. The solar absorptance of the Teflon film is typically 0.05 to 0.07 prior to on-orb.t exposure. _ The Teflon samples having the greatest absorptance change, appear to be those exposed to the orbit environment on both sides of the film, and those contaminated by spa<*craft outgassmg. In (
these samples, the solar absorptance has increased by as much as 0.22 to 0.29. This large ■ change in absorptance indicates a potentially large change in the performance of the Teflon , film. The solar absorptance of Teflon film samples with non-eroded silver/Inconel surfaces had ;
increased by a maximum of 0.04. ] I
Impact Particles .
A survey of approximately one-half square meter of MLI has revealed over 1500 impact sites. j Of these 432 impacts resulted in craters in the Kapton greater than 40 microns in diameter. In the 75-micron thick Kapton (MEB). craters greater than 100 microns in diameter are
>«

B perforations through the Kapton layer. In the 50 micron Kapton (MACS), craters larger than 70 1 \ microns m diameter penetrate through the Kapton. When the survey totalled approximately 0 7 ' \ square meters of Kapton surface, about 160 impact craters penetrating the Kapton layer were ' found.
A number of particles completely penetrated all of the MLI layers. One particle penetrated the MLI near a star tracker, making an impression in the star tracker's aluminum shield Approximately half of the particles that impacted the MACS louvers penetrated the first of the two aluminum sheets, as evidenced by impressions in the second sheet.
Chemical analyses of a number of the impacts has shown that sources of the particles fall into one of four groups. The first group of particles is meteoric material, evidenced by the elements silicon, magnesium, iron, calcium, aluminum with minor amounts of iron-nickel sulfide. The second group of particles is paint particles. This is characterized by titan-um and zinc, and the chemistry includes potassium, silicon, aluminum and chlorine. The third group of particles is aluminum droplets, probably from the MLI. The fourth group of particles is waste particles as evidenced by one impact that penetrated three layers of MLI. The chemistry includes sodium, potassium chlorine, phosphorus and minor amounts of sulfur. Investigators believe that this particle may have come from the Orbiter's waste management system.
Two of the large impacts have been investigated in more detail. In both cases, the impact particle apparently disrupted upon impact with the outer Kapton layer of the MLI The disrupted material was sprayed inward in a cone shaped pattern, lodging on the second layer of ; the MLI. I
In the case of the first impact particle, a small portion of disrupted material penetrated the second layer of the MLI. This impact particle caused a hole 280 microns in diameter with a raised rim. The second MLI layer has a ring of tiny holes and craters surrounding a roughed up ! area of about 5 millimeters in diameter. Particles from the back of the first layer and from the front of the second layer have been analyzed showing that about 75% are fragments or melted droplets of Kapton. Of the non-Kapton particles, most are composed of magnesium, silicon and iron. Next in number were aluminum particles. Investigators believe that the aluminum is derived from the MLI. Other particles are composed of iron, sulfur and nickel.
The second reported impact particle caused a crater 355 microns in diameter with a raised rim in the Kapton layer. The second layer has a wedge shaped pattern of concentric, elongated holes. Particles of the second impact are composed primarily of iron, sulfur and nickel
147
m • i
i

SMM FLEW FOUR YEARS IN LEO PRIOR TO REPAIR - LAUNCHED TO 310 NM - REPAIRED AT 265 NM
SMRM RESULTED IN THE RETURN OF: -ATTITUDE CONTROL SUBSYSTEM MODULE -CORONOGRAPH/POLARIMETER MAIN ELECTRONICS BOX
THIS PRESENTATION DESCRIBES FLIGHT HISTORY, OBSERVATORY ELEMENTS AND ATTITUDES, RECOVERED HARDWARE, AND STUDIES PERFORMED ON THE RETURNED HARDWARE, ELECTRONICS, AND THERMAL MATERIALS
148
1 INTRODUCTION V
\t
SMM FLIGHT HISTORY
LAUNCH TO 310 N.M. FEBRUARY 1980
3-AXIS STABILIZED SUN-POINTING
ATTITUDE CONTROL FAILURE NOVEMBER 1980 j
WOBBLE UP TO 15° OFF SUN ' ROTATING AT 1°/SEC j
i
SMM REPAIR AT 265 N.M. APRIL 1984 j
ACS, MEB RETURNED \ ■\
i i
%

-ai. ■ ii'Miita
INSTRUMENT ENCLOSURE
SOLAR MAXIMUM MISSION (SMM) OBSERVATORY
SOLAR ARRAY SYSTEM ISAS)
MULTI-MISSION MODULAR
SPACECRAFT (MMS)
INSTRUMENTS
PRIMARY STRUCTURE
HIGH GAIN ANTENNA SYSTEM (HGAS)
1
ymmmmimsmtm m^w-mmm
afi: m
Mi
iMtt 't^«T^'iiM^ini'V'^r^*L:'^™:'-'*1;
SMM as seen by the Sun in the post-failure attitude (15° wobble),
ORIGINAL PAGE BLACK AND WHITE PHOTOGRAPH
149
m

View of MACS module after unsuccessful dock attempt. Jjjst louvers _ are closed. Degradation of the bottom-facing trim (Teflon) can be seen.
ORIGINAL PAGE BLACK AND WHITE PHOTOGRAPH
f
150

n ■t
SMM in-bay after repairs completed.
ORIGINAL PAGE BLACK AND WHITE PHOTOGRAPH
■MM*«*«
# ' •
\
151
!
fc'

DEGRADATION STUDY WORKSHOP CHRONOLOGY
1 'S >i
MAY 1984:
JUNE 1984:
ISSUED INVITATION ON ALL AEROSPACE COMPANIES, NASA CENTERS, DOD ORGANIZATIONS AND UNIVERSITIES
FIRST WORKSHOP MEETING WITH INTERESTED PARTICIPANTS
- RESEARCH TASKS PROPOSED AND DISCUSSED - RESPONSIBILITIES ASSIGNED - BEGAN DISTRIBUTION OF MATERIAL AND HARDWARE
JULY 1984 TO APRIL 1985: RESEARCH INVESTIGATIONS CARRIED OUT BY WORKSHOP
PARTICIPANTS
MAY 1985: STUDY RESULTS PRESENTED BY PARTICIPANTS AT GSFC
JUNE/JULY 1985: FINAL DETAILED REPORT SUBMITTED BY EACH PARTICIPANT
SMRM STUDIES SUMMARY
SURFACE„MATERIAL_STUD1ES
PRINCIPAL INVESTIGATOR ORGANIZATION
W. STUCKEY R. FRISTROM
AEROSPACE APPLIED PHYSICS LAB ]
R. LIANG JPL
A. WHITAKER J
MSEC ]
M. MCCARGO J
LOCKHEED
B. SANTOS LANGLEY
D. KESSLER JSC
J. PARK GSFC
SUBJECT
TEFLON ANALYSIS KAPTON OXYGEN EROSION AND OTHER SURFACE EFFECTS TEFLON BULK PROPERTY DEGRADATION BY OXYGEN KAPTON EROSION RATES AND MECHANISMS TEFLON, KAPTON SURFACE AND BULK EFFECTS TEFLON, KAPTON SURFACE CHEMISTRY, THERMAL EFEECTS BLANKETS, LOUVERS SPACE PARTICLE IMPACTS TEFLON, KAPTON, CONTAMINATION
152
J.

a
SMBM gTtinTps gUMMflRY ■r
PARTS criMPOMFMTfl HAPn^AftF,
EEINCIEÄL IMVESTIOATOfl
C UPTON
H. FRANKEL
J. RITTER
J. ÜBER
R. LEE A. ANSTEAD
R. MAURER
C SUTTER
P. NEWMAN
0RC?ANT7ATTnN
SHONSTEDT
FAIRCHILD
TELEDYNE
GSFC - METALLURGY
GSFC/HAO GSFC - PARTS
APL
SPERRY
GSFC - ACS
SUBJECT-
MAGNETOMETER ELECTRICAL AND MAGNETIC PERFORMANCE RIU ELECTRICAL; MEM; HONEYCOMB LOUVERS MECHANICAL DRIRU ELECTRICAL, MECHANICAL PERFORMANCE DRIRU BEARING WEAR AND OIL DEGRADATION MEB BOX EAILURE ANALYSIS DRIRU AND MEB PARTS MICROSCOPIC ANALYSIS COMPARISON OF IRRADIATED "NEW" PARTS TO FLOWN PARTS WHEEL TORQUE AND POWER STUDIES- MEASURE LUBRICANT LOSS STAR TRACKER SENSITIVITY AND ELECTRICAL PERFORMANCE
VERIFICATION OF TW-FT.T^T ANnMAT.TF|f?
POST-LANDING ACS FUNCTIONAL TEST - DETECTED OPEN FUSE ON 28V SUPPLY TO DRIRU CHANNEL C " W^EELSED SYMPT0MS °E EUSE EA*^ THlTDfsAB^fREACTION
C/P MEB - BADLOT OF NATIONAL MM54C161 MICROCIRCUITS
- DEF?CT??SEn?i5TL^.MEB' °E miCK 3 EA1LEI> ON-ORBIT DEFECTS IN GATE OXIDE MATERIAL CAUSED TRANSISTOR SHORTS
DRIRU CHANNEL C FAILURE ANALYSIS
- E^CTO?™ ^S^f^I CAUSED SH0RT IN A RCA MICROCIRCUXT ELECTRICAL OVERSTRESS CAUSED FAILURE OF TWO OTHER RCA PARTS
153
£>

if<?T,;-'.:"^L.:.:^-"^: J_.:— -~ — " ^t^
\ C ftTWBP F.T.ECTKONIC BOXES ! ,
ACS MAGNETOMETER AND REMOTE INTEREACE UNIT SHOWED NO ELECTRICAL DEGRADATION
DRIRU CHANNELS A & B HAD NO SI GNI El CANT CHANGES IN MECHANICAL OR ELECTRICAL PEREORMANCE
STAR TRACKER ELECTRONICS HAD NO CHANGES IN PEREORMANCE DETECTOR CATHODES DAMAGED DURING REPAIR MISSION
KftPTATTON r*VKCTfi ON PARTS
DYNAMIC AND FUNCTIONAL TESTS PERFORMED ON 27 PARTS OF 7 DIFFERENT
TYPE- COMPARISON OF FLOWN PARTS TO RESIDUAL INVENTORY - SOME RESIDUAL PARTS WERE IRRADIATED AND RETESTED
NO ADVERSE EFFECTS FOUND ON 6 PART TYPES, INCLUDING CMOS
COMPLEX LINEAR DEVICE (LM 108 OP AMP) SHOWED SLIGHT RADIATION
DEGRADATION^ ^ SUSCEPTIBLE T0 FAILURE AT HIGHER DOSES
WFAKTNtt ANT> T.TTBRTCATF.D COMPONENTS
DRIRU BEARING SHOWED MINIMAL WEAR AETER TEN BILLION REVOLUTIONS - SOME SCRATCHES AND FINE METAL PARTICLES - GYRO MECHANICAL PERFORMANCE SHOWED NO DEGRADATION
ALL FOUR REACTION WHEELS REMAINED WITHIN SPEC „MM„ - THREE WHEELS SHOWED NO DEGRADATION IN DRAG TORQUE
ROLL-AXIS WHEEL DRAG TORQUE INCREASED BY 45 PERCENT - HAD EXPERIENCED TEMPERATURE > 60oC DURING FLIGHT - DISASSEMBLY SHOWED 10 PERCENT LUBE LOSS AFTER 4 YEARS
IN SPACE
154
5N

DEGRADATION OF MFrw^icAT. PPnPFT?TTff,
MODULE PRELOAD BOLTS HAD NO CHANGE IN REMOVAL TORQUE - NO DEGRADATION IN YIELD OR ULTIMATE STRENGTH
MEB HONEYCOMB PANEL ADHESIVE BOND STRENGTH WAS UNCHANGED
ACS LOUVERS SHOWED NO CHANGES IN ACTUATION TEMPERATURES
SPACE PARTTCT.B TMPt^
1500 PARTICLE IMPACTS FOUND IN 1/2 U2 OE BLANKET - 10 PERCENT OE PARTICLES PENETRATED ONE LAYER OF KAPTON
SPACE DEBRIS IMPACTS OUTNUMBERED MICROMETEOROIDS BY 2 TO 1 - PAINT PARTICLES, ALUMINUM, WASTE PARTICLE - ONE PARTICLE PENETRATED 17-LAYER BLANKET
ALUMINUM LOUVER BLADES (1M2) HAD 64 PENETRATIONS - NO PARTICLES PENETRATED BACK SIDE OE BLADE
JSC SPONSORED CONSORTIUM HAS BEEN STUDYING REMAINDER OF MATERIAL
QXYGEN/UV FFFFCTS OM TWFPMAT. STTPFAPFfl
KAPTON MASS LOSS SIMILAR TO STS EXPERIENCE - EROSION PATTERN MUCH SMOOTHER - MATERIAL STRENGTH UNAFFECTED - SOLAR ABSORPTANCE INCREASE BY 10%
REACTIONS OF UNSUPPORTED SILVER TEFLON - THERMAL CYCLING CAUSED CRACKS IN SILVER LAYER " ?? ™?555J!!;ECT °N raERMAL PROPERTIES WHEN SILVER is WUl EXPOSED - SILVER WAS REMOVED BY OXYGEN REACTION WHEN EXPOSED
TEFLON SIDE ALSO EXPERIENCED SOME EROSION - MUCH MORE EROSION WHEN EXPOSED TO UV - SOME EROSION DUE TO REACTION OF HYDROCARBON IMPURITY
155

1 Close up of the degraded silver Teflon louver trim on the "bottom" side to solar radiation and the atomic oxygen fluence on the silver/Inconel side of the silver Teflon.
ORIGINAL PAGE BLACK AND WHITE PHOTOGRAPH
,>
156
/7\

3 SELF-INDUCED CONTAMTNATTOM
ACS MODULE SAW FOUR THERMAL VAC CYCLES AT MODULE QUALIFICATION - TEMPERATURE lOoC MORE EXTREME THAN FLIGHT
WHITE SUBSTANCE ON FINE SUN SENSOR, COMPOSITION UNKNOWN - CONDENSED ON COLD SURFACE FROM WARM INTERIOR OF MODULE
SILICA BASED RESIDUE ON LOUVER FRAME NEAR MODULE VENT - OUTGASSING DEPOSIT FROM OIL, THERMAL GREASE, STAKING, ETC, - SIMILAR CONDENSATE AROUND VENT BETWEEN STAR TRACKERS
White powder residue from unintentional vent on sun sensor radiator.
ORIGINAL PAGE BLACK AND WHITE PHOTOGRAPH
157
I*

?!
Silica based residue (circled) on louver frame.
158
ORIGINAL PAGE BLACK AND WHITE PHOTOGRAPH
f
■ I
w

CONCT.ITSTnN
N™SLf0MALIES WERE VERIEIE^ OTHER ELECTRONICS BOXES DID
RADIATION DEGRADATION WAS DISCOVERED IN ONE PART TYPE
GYRO AND WHEEL BEARINGS. IN GOOD SHAPE
™EEUT^ETS^cgR^TPARTICLE IMPACTS mST 3E CONSIDERED IN DESIGN
WM5?XT^NTE INDICAT-D A NEED FOR AWARENESS OF UNINTENTIONAL VENTING IU CONTAMINATION CONTROL DESIGN CONI I DERATES
??^^IS0N 0F SMM ^ STS RESULTS DEMONSTRATED VALIDITY AMn STUDIEI
I0NS 0F PREDICTING LONG-TERM S^ESS^OS^S^SED
159
ai

f,JW«f!
...iritii

— , —.■■,., ■»■»■■in » iii.iii,M^l»:»«,>rw?ffi-'^-V^-|,fy^i.!j!!i-t.|<'iW'iif|.
N89-23538 EnviroNET: SPACE ENVIRONMENT
FOR STRATEGIC DEFENSE INITIATIVE EXPERIMENTS
MICHAEL LAURIENTE NASA GODDARD SPACE FLIGHT CENTER, MD 20771
4 l - IS
s i I
I • *
PRECEDING PAGE BUNK NOT FILMED 161
\*

-/
INTRODUCTION
EnviroNET is a service/facility intended to provide users with oa-line, dial-up technical information concerning environmental conditions likely to be encountered by instruments and experimental arrangements carried aboard the Space Shuttle and the Space Station Freedom. The database also has wider applicability for information on environments encountered by other satellites in both low altitude and high altitude (including geosynchronous) orbits. This information—which is DISTINCT FROM «REQÜIREMEMTS-—is intended to help scientists and engineers design equipment to operate successfully in the (somewhat hostile) space environment (fig .1).
ENVIRONET CENTRALIZED COMPUTER-BASED INFORMATION ON NATURAL AND INDUCED ENVIRONMENTS OF SHUTTLE AND SPACE STATION
BASED ON MEASURED DATA (SHUTTLE) AND EMPIRICAL MODEL VALIDATED BY DISCIPLINE PANELS
FOR SCIENTISTS AND ENGINEERS USE IN THE DESIGN AND DATA ANALYSIS OF FLIGHT HARDWARE
MAINTAINED CURRENT BY NASA THROUGH COOPERATIVE EFFORTS OF INDUSTRY, OTHER GOVERNMENT AGENCIES, THE EUROPEAN SPACE AGENCY, ACADEMIA, AND THE NASA COMMUNITY
Figure 1
EnviroNET incorporates at present a combination of expository text and numerical tables amounting to about two million characters (bytes), plus FORTRAN programs that model the neutral atmosphere, magnetic field and ionosphere. This text is under continuous review, correction, and augmentation by ten subpanels of technical experts • one for each of the database's main topics. The information contained in EnviroNET is shown in Figure 2. The aim is to keep information as accurate and current as possible. The EnviroNET files are stored on a MicroVAX II computer at GSFC and may be accessed on a 24 hour dial-up basis, at 1200 baud with ordinary telephone connections and at 9600 baud for users on the Space Physics Analysis Network, SPAN (ref. 1) SPAN is available via more than 1000 space science computer systems throughout the U.S.,Canada and Europe.
1 1 i / 1 /
162

BACKGROUND
Early in the development of the Space Shuttle, payload planners recognized the need for a detailed picture of environmental impacts on Shuttle payloads. The extreme complexity and size of the Shuttle made it very difficult to characterize these environments by computation. At the urging of the NASA payload community, the Shuttle Program agreed to fly instruments (in early Orbital Flight Tests) that would measure various elements of payload environment. In the fall of 1982, NASA conducted its first Shuttle Environment Workshop (ref. 2) to describe what had been learned from these measurements. This led to concerns voiced with regard to the need for information, on a continuing basis, about these and new concerns. To address the issues, NASA's Office of Space Science and Applications (OSSA) requested that a focal point be established for this environmental information, and that the activity be coordinated with other NASA centers, government agencies and the user comrr.unity. As might be expected, initial tests did not answer all the questions and concern« raised by the payload community.
In mid 1983, Shuttle Payload Engineering Division asked that Goddard Space Flight Center(GSFC) lead an Agency-wide effort to identify Shuttle environment data that could be used by Shuttle payload planners and developers. It also suggested that the data obtained from this activity be put into an electronic database which could be accessed by any interested user.
n
Figure 2
THE WORKING GROUP
^r ^ y
ENVIRONET MAIN TOPICS
Section Chapter Page 1.0 INTRODUCTION 1-1 •2.0 THERMAL AND HUMIDITY 2-1 3.0 VIBRATION AND ACOUSTICS 3-1 4.0 ELECTROMAGNETIC INTERFERENCE 4-1 5.0 LOADS AND LOW FREQUENCY DYNAMICS 5-1 6.0 MICROBIAL AND TOXIC CONTAMINANTS 6-1 7.0 MOLECULAR CONTAMINATION 7-1 8.0 NATURAL ENVIRONMENT 8-1 9.0 ORBITER MOTION 9-1 10.0 PARTICULATE ENVIRONMENT 10-1 11.0 SURFACE INTERACTIONS 11-1
. 12.0 DEFINITIONS AND ACRONYMS 12-1
, ^
As a consequence, a multi-center Shuttle Environment Working Group was organized through the efforts of OSSA and GSFC, with the Working Group establishing the charter and framework within which this group would function (fig. 3).
163
ii

J
SHUTTLE/SPACE STATION WORKING GROUP
NASA
HEADQUARTERS
SPACE STATION
SHUTTLE/SPACE STATION ENVIRONMENT WORKING GROUP
ADJUNCT GROUP IOUTSIDE NASA)
EXOFFCO: COO NOAA INDUSTRY
ACADEMIA OTHERS AS REQUIRED
CHAIRMEN: JSC MEMBERS: KSC
GSP3 MSfC JPL
EX OFFICIO: PANEL CHAIRMEN
NATURAL AND INDUCED ENVIRONMENTS PANEL
USER PANEL
i: INFORMATION
MANAGEMENT PANEL
IT
Figure 3
The goal of the Working Group was to have a comprehensive database established of current information regarding the Shuttle Environment, readily accessible in a user- friendly format. Specific objectives for the Shuttle Environment Working Group included:
1) Assessing the user requirements for environmental data at all stages of the experiment definition and development.
2) Obtaining and distilling the available and pertinent environmental data from the sources.
3) Working with the sources to obtain a common database that is acceptable and will be reviewed by those concerned.
4) Developing an information accessing system that is user-friendly. 5) Providing a network accessible by a wide variety of existing computer
terminals and peripherals. 6) Coordinating these activities with other NASA centers, government, agen-
cies, and the user community.
With these objectives in mind, the Working Group began organizing in late 1983 and on into early 1984. A structure of panels and subcommittees wa3 established and the task of staffing began. Three major panels were established with the functions and duties as follows:
164
•tf

IM'" >iii Wß i « i ^ Jj^l»»'
1)
2)
The Natural and Induced Environments Panel (fig. 4) gathers and organ- izes data for input into the database, titles: Make preliminary assess- ment of the reliability and traceablity of the data for the database; assess the state of the data and determine if it is directly useful to the user.
The User Panel (fig. 5) provides for interaction between disciplines and users. Duties: Identify user requirements and needed environmental data; provide an interface between the scientific community and the environmental data panel; and identify gaps in the information base, also noting the urgency of the requirements for this data.
NATURAL AND INDUCED ENVIRONMENTS PANEL
LOADS AND LOW-FREQUENCY
DYNAMICS
ORBITER
MOTION
VIBRATION AND
ACOUSTICS
^
THERMAL AND
HUMIDITY
ELECTRO- MAGNETIC
INTERFERENCE
PARTICULATB ENVIRONMENT
MOLECULAR CONTAMINATION
NATURAL ENVIRONMENT
SURFACE INTERACTIONS
MICROBIAL ANDTOXX;
CONTAMINANTS
Figure 4
3) The Information Management Panel (fig. 6) provides the database structure and manages the database. Duties: Create a system for compiling, stor- ing, and cataloging the information in the database; edit information- and coordinate network activities.
lls7i^lTl,\heTrkin9G,0OUP' ^in«d by the European Space Agency (ESA) , sponsored !! fhuttle Environment Workshop, and the process of gathering data for the
requested database began in earnest (ref. 3). The database was arranged by sections (or chapters ) along the key disciplines and named "EnviroNET." Also, database management procedures were outlined: The subpanels decide what data to collect; obtain
vaUdftion rhtatwa;vanCi rUbmit * t0 ^ W°rkin9 Gr°Up f0r validation. Following validation, the Working Group gives the data to the Information Management Panel for inclusion in the electronic database. As a result of these considerable effort, EnviroNET has evolved into a reasonable, mature and comprehensive database.
165
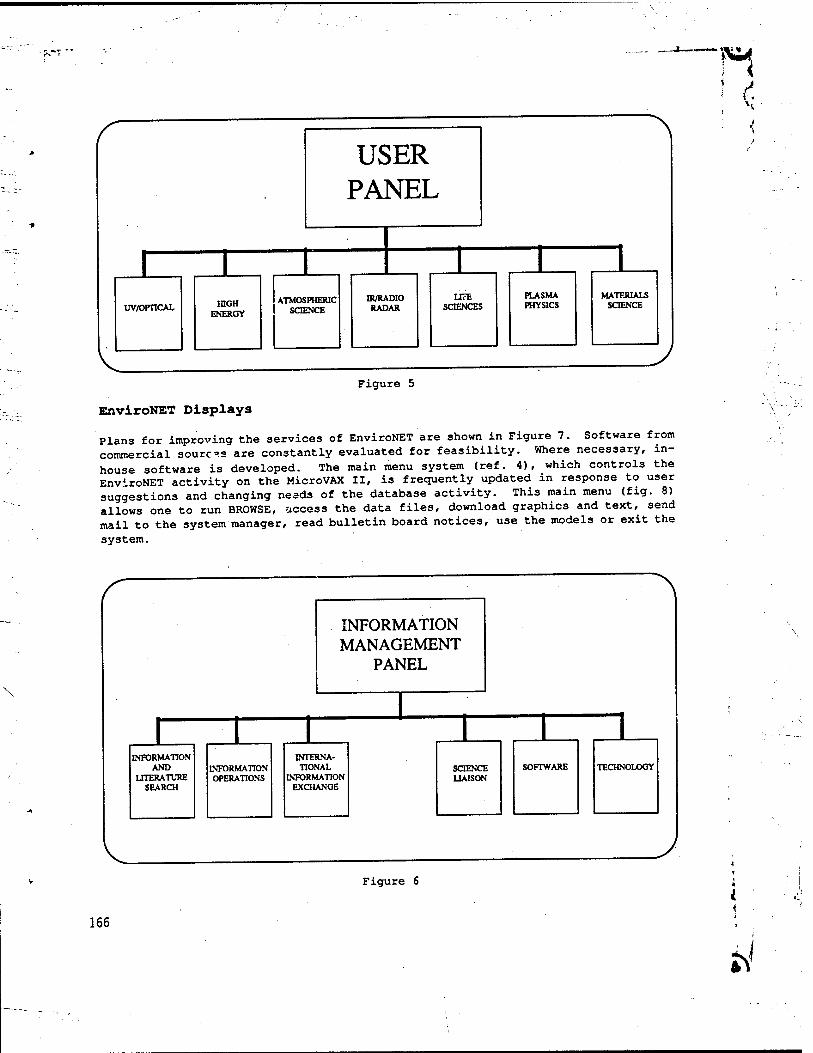
Figure 5
EnviroNET Displays
Plans for improving the services of EnviroNET are shown in Figure 7. Software from commercial sources are constantly evaluated for feasibility. Where necessary, in- house software is developed. The main menu system (ref. 4), which controls the EnviroNET activity on the MicroVAX II, is frequently updated in response to user suggestions and changing needs of the database activity. This main menu (fig. 8) allows one to run BROWSE, access the data files, download graphics and text, send mail to the system manager, read bulletin board notices, use the models or exit the
system.
i \
i t.
INFORMATION MANAGEMENT
PANEL
INFORMATION AND
LITERATURE SEARCH
INFORMATION OPERATIONS
INTERNA- TIONAL
INFORMATION EXCHANGE
SCIENCE LIAISON
SOFTWARE
1 TECHNOLOGY
Figure 6
166
a

! (
PLANS • Consider options for improving service
-Software -Graphics -Modeling -Network Servers (NSSDC, SPAN...)
• Newsletter • Telescience • Workshops
Figure 7
ENVIRONET MAIN MENU
B -> BROWSE - Text Retrieval Subsystem (Requires VT100 emulation)
U —> User Message Service - Leave messages for other users
N -> Bulletin Board Notices - Changes to the database
D -> Download Specific Chapter
M —> Mail System - Mail us your comments about the system
F -> Function Calculation System - Natural Environment Models
G —> Graphics - Download high resolution graphs
L -> Logoff - End ENVIRONET session
Enter appropriate letter, followed by RETURN :
Figure 8
167
>

The principal retrieval program, called BROWSE, is continually being updated in response to user and subpanel suggestions. With BROWSE, simple command choices allow one to page through the EnviroNET database sequentially, or jump to points of interest. To use BROWSE, one must have a VT100 compatible terminal or emulation. BROWSE has three menus: Main Topics, Data and Table of Contents/Index. One can move among the three menus to any part of the database, or back to the EnviroNET main menu with a single keystroke. As you BROWSE about the database and change menus, the information on the terminal screen will change, but the basic layout of the screen will remain the same. Information is displayed in three "windows": the page window at the top right, the data window at the center, and the option window at the bottom (fig. 9).
>*
K Pg 9- 2 as a platform for mlcrogravity experiments or for astronomical observations which require fine pointing accuracy. Ideally, one wishes
for these activities a platform in a perfect state of free fall. In practice, the orbiter is prevented from attaining any such state of
tranquility by several perturbing forces. The forces may be classified into ttuse types:
9.2.1 TYPES OF DISTURBANCE FORCES
1. Steady or Slowly Time-Vatying Forces
Examples of this type are the gravity gradient over the length of the orbiter and the residual atmospheric drag on the orbiter.
These forces are characterized entirely by their magnitude and direction; information on frequency content or duration
would be meaningless.
2. Periodic Forces
y
(A)head page
H (B)ackpage
KlHiBH
(T)OC
(I)ndex
[P>age/section
(M)alntoplcs (R)eturn (H)elp
(Y)memory (F)indword (E)xlt
• Page Window
Data Window
Option Window
Figure 9
GRAPHICS
Graphics display of database figures is slowed because of the high number of bits in the bit map and the 1200 baud rate of the communication system. All possible avenues for circumventing or coping with this problem are under continuing investigation. In the interim, the text is designed for minimal dependence upon graphics, although "text graphics" are displayed when suitable. The immediate graphics effort is to deliver high resolution graphical data accompanied with textual data to the user with a minimum of user effort and familiarity with the system. A near-term goal is to provide graphical data in an easy and convenient format. To accomplish this objective, certain components-such a3 POPGRAPH-are being developed. POPGRAPH is a user friendly program being written in-house to facilitate easier access to the graphical data while viewing the textual data. It resides in memory and can be invoked instantly by pressing
\
168
Xi

!JS" °f ^hree keys- ™m finished viewing the graphical data, the user can immediately return to the text with a single keystroke.
usedEonathfiBMapriCSHAdaPter,(BGA) la * at*nd*** high-resolution graohics adapter Pixels sLce th« r11? CO"pat;bles- Ifc Prides a resolution of 640 pixels by 350 20^« ~ix- 1 Graphics Adapter (CGA,, has a resolution of 640 pixels by 200 pixels, which is not always sufficient for some of the more detailed graphs there is a need to upgrade to the EGA. Currently, the EGA image size is 28 kilobytes Dow" srs^^s^rthe MiorovAx to a pc wm —e - a~- —- I"00, ?aUd' the download time will increase proportionately, thus comoaction protocol to squeeze the 28 kilobyte image down to about 10 kilobytes will be undertaken
orTiew^rfi'r'S,1"1;^ aS T aS 60%- A tyPiCal hi*h—°^ion graph^ilab e first ta™0H*, contamination during ascent. The long-term goals are first, to accommodate more users by expanding to different graphics cards on the IBM PCs and by expanding to different machines, such as Macintosh computersTand second to integrate textual data and graphical data into one format so that a user will nJ
comL°hritCh frÜm °ne t0 the °ther " at PrSSent- To »™ UP» n,03t IBM PCs and compatibles use one of the three following graphics cards. They either have IcoJor
CITWG» Z (CGf,'anEnha-^ Graphics Adapter (EGA,, or a^ideo Graphics trlly card (VGA), or compatibles of these adapters. Currently, only CGA and EGA user, are
Figure 10
169
tt

24
supported. Eventually, the system will support users of the VGA adapters as well as users of the Macintosh computer. Currently, if a user of EnviroNET is reading textual data, and he sees a reference to a piece of graphical data, he must log off, run the display program to view the graphical data, and log in again to continue viewing textual data. Thi3 is a very inconvenient and time-consuming process. POPGRAPH makes things easier by allowing the user to 3witch between textual data and graphical data and vice versa.
MODELS
EnviroNET has expanded its activity by adding interactive models of the natural environment. The models include neutral atmosphere density and temperature(refs. 5, 6), ionosphere, electron temperature and density, the magnetic field vector, and energetic particle or radiation flux. These models are based on data from satellites which orbit the Earth in the thermospheric and exospheric regions of the atmosphere. The thermosphere is the region above approximately 85 Jem (depending on season and other factors) where temperature increases sharply with altitude, turbulent mixing of different molecular species ceases, and ultraviolet (UV) and extreme ultraviolet (EUV) flux from the sun dissociate the molecules and ionize the constituents to form the ionosphere. Above roughly 500 km, the thermosphere gradually merges into the exosphere where the mean free path of molecules is longer than the vertical scale height. The temperature in the upper thermosphere and lower exosphere aoproaches an asymptote called the exospheric temperature. The ineffectiveness of mixing processes above about 105 km results in a situation called diffusive equilibrium, where the individual atmospheric constituents decrease with a scale height inversely proportional to their individual molecular weights, and the mean molecular weight decreases monotonically with altitude. Atomic oxygen is a major constituent of the upper thermosphere along with molecular nitrogen and helium. Hydrogen becomes a major constituent in the exosphere. Argon, molecular oxygen, and atomic nitrogen are minor constituents in the upper thermosphere. The structure of the thermosphere has been determined by a number of satellite, rocket, and ground based techniques and the data summarized in various empirical models. The density, temperature, and composition of the thermosphere are found to depend on time (year, day of year, and time of day), position (latitude, longitude, and altitude), solar generated or triggered energy inputs (solar UV and EUV, magnetospheric particles, and magnetospheric electric fields and currents), and to some degree on the state of the lower atmosphere upon which the thermosphere rests.
Winds are an important part of the environment at orbital altitudes. Wind speeds may reach 1000 meters per second at high latitudes, driven indirectly by magnetospheric electric fields, but are usually less than 100 meters per second at low latitudes. Wind measurements have only recently been summarized in the same fashion as density and temperature measurements. There are five major types of variations in the thermosphere at orbital altitudes. The temperature and densities of all the constituents except hydrogen increase strongly with increases in solar EUV flux. Total density has a diurnal maximum in the early afternoon, but temperature and the various constituents all have diurnal maxima at different times of the day. The temperature and individual constituents have strong seasonal variations which are out of phase for the heavier and lighter constituents, resulting in only a minor seasonal variation for total density. A significant global semiannual variation, with density maxima near the equinoxes, is present for all constituents and varies from year to year for unknown reasons. Magnetospheric energy input in the auroral regions (magnetic storms) increases total density and temperature over the whole globe, but preferentially at high latitudes, while the lighter constituents decrease at high latitudes.
170
V
^

Zlly^V^lt^ in ?" aUr°ral Z°ne and al3° the l0W« ^sphere is present 1 v«iaSn3 up to 15% ^03P 6' bUt primarily at ^ latitudes with density 1?
r «. uoja aiiu ±i years. Both the daxlv value of i-ho m i _ », . a several month average of the flux havo r,™,,^ T , . ^ tne 10-7 cm £lux and
heats the atmosphere (particularly ,t high latitude», bot*,??* »"hour, not only
indices for future times is subi^ ►„ i,. elfter the 10.7 cm flux or magnetic
retraces T^rT^^Jr ?" "* B>9netlC lndlee8 Ca" be f0Und in standard . taken as 70 150 „ t ' " ^ r0Ugh estimates, the 10.7 cm flux index can be
high magnetic activity respectively. ' ' ' 1<>W' medlUm' 3nd e*tr^ly
directly on total densities deriu.d ,™ JIT ? Station. This model is based
R.rerenc. Atmosphere ThL! LHT" J °? S""" **""ch (COSPAH) International
composition' aTeti,e/,htu„ 0.:.s"^„ts "'Z'^LZ b 1' T -=»»-"' !
a space shuttle or space station ^1?,, ?f°V1^ parameters a* given points along
of the model parameSs along given orbits Till TlsT^lT^ T"' GraPhiCS diSpUy display for the MSIS model is shown £ rLurenw,d6Vel0ped- The computer screen ; entered, the computer calculated IZ ZgZ £,£? ^*£™" ^ « ,
NETWORK SERVERS
al^ay paii ^byT^ ^^TurnT^ COmPUter3 " ^^ n°d6S "»""* combination of Teased circuit switch ^ 0f„mis3ions>' ™* communicates over a protocol. The SPStopology(flo 5? ?nd P*«**' ««itching lines using the DECnet 5FAN topology, (fig. 12) features four primary routing centers in the
171 \
,t :♦,,

MS IS MODEL
Input Ranges Day number 1 to 365 Local solar time (hrs) 0 to 24 Altitude (km) 85 to 1000 Average F10.7 flux 65 to 300 Geodetic latitude (deg) -?0 to 90 Current F10.7 flux 65 to 300 Geodetic longtitude (deg).. -180 to 180 Magnetic index AP.... 0 to 400
Input Parameters Day of year 44 Altitude 100 Latitude 40 Longtitude -75 Local time 12 Average F10.7 100 Current F10.7 200 Magnetic index AP 300
Output Values (Number/cm3) 1.41E+07 (Number/cm3) 6.54E+05 <Number/cm3> 9.64E+07 (Number/cm3) 4.03E+11 :Number/cm3) 7.85E+12 (Number/cm3) 2.02E+12 (Number/cm3) 1.19E+11
Total (gm/cm3) 4.91E-10 TN(INF) (deg K) 1300.8 TN (deg K) 194.0
H N HE C N2 02 AR
Do you want to (R)un the model with the current values, change some
(1 through 8) or (A)11 the values, or (Q)uit?
Figure 11
UCLA Lockheed
STARLAB UCB
THE SPAN TOPOLOGY
JPL GSFC
ROUTER
DECnet DDCMP Tail Circuits
• • • •
DECnet DDCMP ROUTER
ROUTER 56 kB/s
DECnet DDCMP Till Circuit*
ROUTER
JSC MSFC • • • •
Figure 12
172

Si T1 o , fddardSPaceFli^ Center (GSFC), Johnson Space Flight Center <JSC), the Jet Propulsion Laboratory (JPL), and Marshall Space Flight Center, (MSFC) as
G™an3v°neTh0Utlng CSnter at,the EUr0P6an SpaCe °Pe«tions Center (ESOC) i'n DarSadt? Germany There are approximately 1200 registered SPAN nodes. EnviroNET may be accessed via modem-eguipped terminals, SPAN, or network servers at tne rotting
n 2liZZ*Z J I v •cl«tifie community together in a common working Dati anTGra;hi^% f W° "K^^3 th- transmis3i°" a"<* reception of manuscripts Data and Graphics files can be transferred between network nodes. SPAN now supports Te7LTeS ? netwo^-to—twork connections which provide accesT to SP^(ref
nodes Uef 1, n " ^ "' ^ °"1 r€preSents an enti~ network of computed
ACCESSING SPAN FROM NON-SPAN NODES
Figure 13
TELESCIENCE
laboratories ^^ ****** '?' investi^tors to cooperate from their «remote» home laboratories and computers with their colleagues by computer networking. This is an expansion of the concept started with the Atmosphere Explorer and Dynamics Explored programs when many scientists were connected over dedicated phone lines to a cental remote» computer site containing their data and computer programs. WUh the advent
173

of SPAN, the remote Dynamics Explorer scientists could communicate with one another directly and offload calculations and data analysis to their home systems, thereby improving productivity with simultaneous analysis on remote, distributed computer systems. EnviroNET is being upgraded to permit the users to conduct teleanalysis, i.e., perform analyses using Space Shuttle/Space Station environment data and the models on computers at remote institutions. EnviroNET has always drawn on the NASA centers, other government laboratories, industry, and universities. The academic community is especially involved because it provides important opportunities for testing and evaluating new ideas, techniques and concepts before they have reached the state of maturity considered by contractors and project mangers suitable for implementation. A testbed program like EnviroNET provides a valuable way of training graduate students who represent the future scientists and engineers of the nation, and who need to be at the leading edge of our SPAN technology.
WORKSHOPS
Workshops are conducted periodically for the panel leaders and subpanels. The results of these workshops are printed as informal documents for the purpose of feedback of information essential to the improvement of the services to users and to take advantage of the advancements in communications. These documents are available upon request.
CONCLUSION
EnviroNET is an operational system available to the SDI experimenters who have access to a terminal or dial-up port. It is a tail node on SPAN accessible directly or through the national networks via NPSS.
Some of the benefits to using EnviroNET include:
1) Validated NASA environmental information and interactive space models 2) Facilitating the payload integration process 3) Easy access to expert assistance 4) Potential for time and cost savings
ACKNOWLEDGMENTS
.A
>•■
, /
The information on modeling was contributed by D. Bilitza, J. Green, A. Hedin, and J. Vette of NASA/GSFC. The author acknowledges indirect but valuable contributions gained from the Working Group through many telecons, meetings, and general exchange of unpublished information. Funding was provided by NASA Headquarters, the Air Force Geophysical Laboratory (AFGL) Space Systems Environmental Interaction Technology Office, and by the U.S. Air Force Systems Command, Space Division.
; /
174
■A

REFERENCES
1. Green, James L. The Space Physics Analysis Network. Computer Physics Communication 49, pp. 205-213, North-Holland, Amsterdam, 1988.
2. Proceedings: The Shuttle Environment Workshop. Prepared for NASA by Systematics Corp., Contract NAS5-27326, Feb. 1983.
3. Wilkerson, Thomas D., Michael Lauriente,and Gerald W. Sharp. Space Shuttle Environment. Library of Congress Catalog No.: 85-81606, ISB No-939204-28-2
4. The EnviroNET User's Guide. Code 410.1, NASA/GSFC, Greenbelt, MD 20770.
5. Johnson, D .L. and R. E. Smith. The MSFC/J70 Orbital Atmosphere Model and the Data Bases for the MSFC Solar Activity Prediction Technique. NASA TM-86522, 1985.
6. Hedin, Alan E. The MSIS-86 Thermospheric Model, J. Geophys. Res., vol. 92, pp. 4648-4662, 1987.
7. Solar-Geophysical Data Part I (prompt reports), issued monthly by National Geophysical Data Center, NOAA/NESDIS, E/GC2, 325 Qroadway, Boulder, CO 80303.
8. Journal of Geophysical Research (Space Physics), issued monthly by American Geophysical Union, 2000 Florida Ave, N.W.»Washington, D.C. 20009.
9. Accessing SPAN From Non-SPAN Nodes, National Space Science Center (NSSDC)/Work Data Center-A for Rockets and Satellites (WDC-A-RSS), NASA GSFC, Grsenbelt, MD 20771.
175
■ 'ÜJ"**»k.SS.*«*>,f.3»»iV**- •
f s

SESSION 3: ATOMIC OXYGEN
Chairmen: L. Leger and J. Visentine NASA Lyndon B. Johnson Space Center
PRECEDING PAGE BLANK NOT FILMED
r
i f 177 i
I
S!

m m

N89-23539
ENVIRONMENTAL DEFINITION OF THE EARTH'S NEUTRAL ATMOSPHERE
I
JAMES T.VISENTINE NASA LYNDON B. JOHNSON SPACE CENTER
HOUSTON, TEXAS
FP.ZZ'LV'.;><. J-AU ri^Vf V3T" .nLVri)
179
al

180
H ENVIRONMENTAL DEFINITION OF THE EARTH'S NEUTRAL
ATMOSPHERE ) • ALTHOUGH DUMBER DENSITIES ARE LOW (106-109 PARTICLES/cm3) AT
ALTITUDES WHERE SPACECRAFT TYPICALLY OPERATE. HIGH ORBITAL SPEEDS (8 km/S) RESULT IN INCIDENT FLUXES (1014-1015 atoms/S cm2) AND COLLISIONAL ENERGIES (TRANSLATIONAL ENERGIES EQUIVALENT TO ~ 60,000 °K) LARGE ENOUGH TO INTERACT WITH AND DEGRADE MATERIAL SURFACES
• DURING PREVIOUS STS MISSIONS (STS-5, -8. AND -41G), SURFACE RECESSIONS AS HIGH AS 0.5 „m PER ORBIT HAVE OCCURRED FOR ORGANIC MATERIALS EXPOSED TO THE FLIGHT ENVIRONMENT
• SIMILAR EFFECTS HAVE BEEN OBSERVED FOR SOME METALS. MOST NOTABLY OSMIUM AND SILVER. WHICH BECOME HEAVILY OXIDIZED DURING LEO (LOW-EARTH ORBIT) EXPOSURE
• STS POST-FLIGHT RESULTS ARE CONSISTENT WITH AN ATOMIC OXYGEN- BASED MECHANISM
ATOMIC OXYGEN PRODUCTION MECHANISM
• EARLIER SATELLITE MEASUREMENTS HAVE SHOWN ATOMIC OXYGEN IS THE PREDOMINANT SPECIES IN THE UPPER ATMOSPHERE (200 TO 600 km) - IT IS FORMED AT ORBITAL ALTITUDES THROUGH THE DISSOCIATION OF 02 BY ULTRAVIOLET (100 TO 200 nm) RADIATION:
O2 + hi/ ■—j—* O + O (99 + %)
'•—» 0+ +0 (<<1%)
• DIURNAL AND SEASONAL VARIATIONS IN ATOMIC OXYGEN NUMBER DENSITY MAY BE PREDICTED USING GLOBAL MODELS OF THE EARTH'S UPPER ATMOSPHERE
(*>

View of the Earth and Its Atmosphere as Observed from Space
The visible atmosphere shown in this photograph was obtained from Shuttle Mission 61-B during December 1985. In this photograph, Mission Specialists Jerry L. Ross and Woody Spring are shown assembling the EASE (Experimental Assembly of Structures in Extravehicular Activity) flight experiment. The lower atmosphere appears as a thin glow above the surface of the Earth. This glow results from emissions produced as excited oxygen molecules decay to their ground state, and extends upward to the edge of the mesosphere, or mesopause. The Earth's upper atmosphere begins above the region where the visible glow disappears, or about 85 km in altitude.
!>
181

.AHM i
Vertical Temperature Distribution in Earth's Atmosphere from Surface to 100 km Altitude, Giving Nomenclature of Atmospheric Regions
The Earth's atmosphere is divided into specific regions. In the most commonly used system, these regions are differentiated by thermal stratification. The lowest region, extending from sea level to the first temperature minimum, is called the troposphere. The stratosphere, or second region, extends upward to the level of highest temperature. The upper atmosphere may be defined as the region above the mesopause, or upper temperature minimum, and extends from about 85 km to geostationary altitudes. Global thermospheric models are designed to operate within this region of the atmosphere. Their specific formulations give accurate estimates of temperature, density, and composition and are based on in situ measurements from the Atmospheric Explorer and Dynamics Explorer satellites. The upper atmosphere may be further divided into the thermosphere (85 to 500 km), and the exosphere (500 km and above). Spacecraft normally operate in the upper atmosphere at altitudes above 300 km to reduce drag effects, which are significant at lower altitudes, and minimize requirements for re-boost propulsion systems.
0.0001 -
E
0£ O
1.000
10 MT. EVEREST 29.141 ft.
180 200 220 240 260 280 300 (deg K)
TEMPERATURE
-120 -80 -40 0 30 40 80
i ' i ' i ' i ' 'r^-H (de9F)
-140 -100 -60 -20 32 60
TEMPERATURE
182

GLOBAL THERMOSPHERIC MODELS
MOST RECENT GLOBAL MODELS INCLUDE J77 (JACCHIA, 1977), AND MSIS-86 (MASS SPECTROMETER AND INCOHERENT SCATTER, 1986)
EARLIER JACCHIA MODELS (J70) WERE BASED SOLELY ON SATELLITE DRAG DATA AND DID NOT ACCURATELY REPRESENT CONSTITUENT DENSITY VARIATIONS ASSOCIATED WITH GEOMAGNETIC DISTURBANCES
• THESE VARIATIONS WERE ASSUMED TO BE UNIFORM OVER THE GLOBE, WHILE MORE RECENT DATA HAVE SHOWN THEY HAVE VERY SIGNIFICANT GLOBAL STRUCTURE, MAINLY IN RELATION TO GEOMAGNETIC LATITUDE
• J77 RESOLVED EARLIER DISCREPANCIES BY INCORPORATING SATELLITE MASS SPECTROMETER MEASUREMENTS AND INCLUDING A HIGH-RESOLUTION MODEL OF GEOMAGNETIC VARIATIONS IN THE THERMOSPHERE (85-500 km) AND OUTER ATMOSPHERE, OR EXOSPHERE (500 km AND ABOVE)
IN FORMULATING MSIS-86, TERMS WERE ADDED TO MSIS-83 TO BETTER REPRESENT SEASONAL VARIATIONS !N THE POLAR REGIONS UNDER BOTH QUIET AND MAGNETICALLY DISTURBED CONDITIONS
MSIS-86 AND J77 AVERAGE TEMPERATURE AND TOTAL DENSITY ESTIMATIONS AGREE TO WITHIN 10% OF ONE ANOTHER
MSIS 86 THERMOSPHERIC MODEL
' IuLw?^mcEcL'cSoVeEuL0PED BY GSFC 'S FR"WENTIY USED TO PREDICT CONSTITUENT
STUDIES DENSIT,ES F0R SHUTTLE AND SPACE STATION ATOMIC OXYGEN INTERACTION
' ^nSt5f5f«^vm ««'I0 DATA FR0M SATELLIT". SUCH AS ATMOSPHERIC EXPLORER AND DYNAMICS EXPLORER, AND GROUND-BASED INCOHERENT SCATTER STATIONS:
• OUTPUT DATA INCLUDE BOTH TEMPERATURE PROFILES AND CONSTITUENT (N2 N OJ O He, H. Ar) NUMBER DENSITIES WITHIN A 85-750 km ALTITUDE RANGE
• MODEL ASSUMES TURBULENT MIXING OCCURS BELOW THE TURBOPAUSE (NOMINALLY 105 km), AND DIFFUSIVE EQUILIBRIUM EXISTS AT HIGHER ALTITUDES: - MESOSPHERE-50-85 km
- THERMOSPHERE-85-500 km
- EXOSPHERE-500-km
HEAVIER GASES (N2, 02, Ar) HAVE SMALLER SCALE HEIGHTS AND DECREASE MORE RAPIDLY
SKiS^i^Y^SSSÄ**,H'He-0) HiVE URGE"SCiLE HE,SHTS AND
CONSTITUENT CONCENTRATIONS ARE STRONGLY INFLUENCED BY SOLAR ACTIVITY CONDITIONS AND GEOMAGNETIC DISTURBANCES WHICH VARY WITH THE 11-YEAR SOLAR
183
f?V

\i*
184
SOLAR ACTIVITY VARIATIONS IN CONSTITUENT NUMBER DENSITIES
• EXOSPHERIC TEMPERATURE AND NUMBER DENSITY OF ALL CONSTITUENTS. EXCEPT HYDROGEN AND MOLECULAR OXYGEN, INCREASE WITH SOLAR ACTIVITY
• AS SOLAR ACTIVITY INCREASES. ATMOSPHERE EXPANDS AND REGIONS OF HIGH DENSITY RISE TOWARD HIGHER ALTITUDES TO REPLACE REGIONS OF LOWER DENSITY
• GEOMAGNETIC STORMS OCCUR WHEN CLOUDS OF CHARGED PARTICLES INTERACT WITH THE EARTH'S MAGNETOSPHERE - DENSITY INCREASES PRIMARILY IN THE POLAR REGIONS, BUT EFFECTS ARE ALSO SEEN AT LOWER LATITUDES
• UNDER MAGNETICALLY QUIET CONDITIONS, N2. 02, AND Ar DENSITIES INCREASE TOWARD THE POLES WHILE O, N, He. and H DECREASE IN DENSITY
•4
as

V*. <
Plot of Constituent Number Density in Earth's Atmosphere from
100 to 1,000 km Altitude
At altitudes where LEO (low-Earth orbital) spacecraft typically operate (300 to 500 km), constituent number densities vary in direct proportion to solar activity. Higher atomic oxygen number densities result in higher fluxes incident on spacecraft surfaces and, consequently, in higher surface recession rates for reactive materials. During conditions of high solar activity (Curve OMAX shown in the figure below), the 0-atom number density varies from 109 to 10° atoms/cm3 over an altitude range of 300 to 500 km. During conditions of low solar activity, variations over these altitudes are reduced to 108 to 106 atoms/cm3. Consequently, spacecraft launched during times of minimum solar activity experience less exposure to the neutral 0- atom environment than spacecraft launched during times of high activity. Typically, a Space Shuttle mission is flown at an altitude near 300 km. For these missions, the atomic oxygen number density varies between 108 and 109 atoms/cm3 during the 11-year solar cycle. Spacecraft flown at a higher altitude of 500 km would encounter much lower number densities (106 to 103 atoms/cm3) during the same exposure period.
E -X I-"
<
1000
900
800
700
600
500
400
300 -
200
100
He MIN
1 101 102 103 10« 105 106 107 108 1091C10101110U10*31014
CONSTITUENT CONCENTRATION, cm-3
MIN SOLAR CONDITIONS: 0400 hr USING F10 7 = 70 & Äp = 0
MAX SOLAR CONDITIONS: 1400 hr USING F,0 7 = 230 & Äp = 35
185

<
< .
Solar Activity Predictions for Cycle 22
In the thermosphere, the density is strongly influenced by changing levels in solar activity. Both radiant energy and charged particles are emitted by the Gun's surface. It is largely the ultraviolet (IT/) and extreme ultraviolet (KUV) radiation emitted by the Sun that heats the upper atmosphere and pro-^ duees changes in the constituent number density. One component of this radia- tion relates to the active regions on the solar disk and varies from day-to- day in direct proportion to the ebb and flow of sunspot activity. The other component relates to the solar disk Uself and moves more slowly with the 11-vcar solar cycle. The intensity of this component is measured directly by th-' F ., number, which is shown in the figure below. This number represents the raSiA flux density (in units of 101* Jansky, or 10"22 watts/m2/S/bandwidth) at 10.7 cm wavelength, and is used as a measure of solar activity because it correlate:-, well with radiation absorbed by the upper atmosphere. The A~ num- ber, also shown in this figure, is a measure of variations in the Earth s iT.-jpinetic field intensity. Charged particles emitted by the Sun spiral along th>> Earth's magnetic field lines and also contribute to heating of the atmo- sphere, but to a much lesser extent that the Sun's radiant energy. Increases iii the A„ number (geomagnetic index) result in higher number densities at any
given altitude.
LEGEND 1 = SOLAR FLUX F10.7 + 2 SIGMA, (10E4 JANSKY) 2 = SOLAR FLUX F10.7(10E4 JANSKY) PREDICTED 3 = GEOMAGNETIC INDEX MEAN
186
2500
2000
I| 1500
3C
51 U << 100.0
u
50.0
00
V ^*^"
f 1 l
,2 /
86.7 88.0
\
-V \
2>:: I*~A
90.0 92.0 940
SOLAR CYCLE, 1R
96.0 98.7
C-7 J.

SEASONAL VARIATIONS IN CONSTITUENT NUMBER DENSITY
• ALL CONSTITUENTS HAVE A SIGNIFICANT (5-10%) SEMIANNUAL VARIATION IN NUMBER DENSITY DUE TO SUN BEING ABOVE THE EQUATOR DURING SUMMER MONTHS. AND BELOW THE EQUATOR DURING MONTHS OF WINTER
• ATOMIC OXYGEN HAS A SUMMER MAXIMUM AT HIGHER ALTITUDES, AND A WINTER MAXIMUM AT LOWER ALTITUDES
• BOTH ATOMIC OXYGEN AND ATOMIC NITROGEN UNDERGO A SEMIANNUAL VARIATION IN NUMBER DENSITY
• AND AT HIGHER ALTITUDES. THEIR MAXIMUM DENSITIES OCCUR NEAR THE EQUINOXES
• HEAVIER SPECIES (02. N2. Ar) EXPERIENCE LOWEST DENSITIES DURING WINTER MONTHS, AND HIGHEST DENSITIES DURING SUMMER MONTHS
• CONVERSELY, HIGHEST DENSITIES FOR THE LIGHTER SPECIES (H, He) OCCUR DURING WINTER MONTHS
7< It '1 \
: \
187
Ü

Contour Plots of Diurnally Averaged Number Densities of 02, N2, 0 and He at 400 km Altitude during Nominal Solar Activity Conditions
All constituents in the upper atmosphere have a significant (5 to 10 percent) semiannual variation in number density, which results from the Sun being above the equator during summer months and below the equator during the months of winter. Atomic oxygen behaves differently than the other species in that it experiences a winter maximum at lower altitudes and a summer maximum at higher altitudes. During months of summer, 0 (as well as N) exhibits maximum density near the equinoxes'. In the northern hemisphere, 02 and N2 have highest densities during summer months and lowest densities during winter months. Conversely, HP, which is a lighter species, has its highest density during winter months. These results from the MSIS-86 model are consistent wl*;-. data obtained from the Explorer Satellites, which have demonstrated helium experiences a winter density bulge in the exosphere. The formation of this bulge near the polar region may be attributed to seasonal winds in the thermosphere. The mechanism of this bulge and its variation with latitude are, however, still under investigation.
UJ 0 D t-
45
0 ''J \-
T
"v •
< ~~-.. / •■
1 "*'" -45
.an ^\ (:/ m ..•J
a z>
90
45
-45
-90 0
J \ Y
Vn\ n)f, .—=
00 91.25 182.50 273.75 365.00 DAY OF YEAR
90
45
0
-45
,.y \)
u\\ ;/■
i m\ \, 4 Aw
0.00 91.25 182.50 273.76 365.00
DAY OF YEAR
(LOGARITHM TO BASE 10) OF 02. N2. O AND He AT 400 km ALTITUDE DURING NOMINAL SOLAR CONDITIONS. NOTE O (AS WELL AS N) EXHIBITS MAXIMUM DENSITY NEAR THE EQUINOXES. IN NORTHERN HEMISPHERE, 02 AND N2
HAVE HIGHEST DENSITIES DURING SUMMER MONTHS; He. WHICH IS A LIGHTER SPECIES, HAS ITS HIGHEST DENSITY DURING WINTER MONTHS (SOURCE: NASA/GSFC: H. HEDIN, 1987)
188
S

DINURAL VARIATIONS IN CONSTITUENT NUMBER DENSITIES
• NEAR EQUATORIAL LATITUDES, A DENSITY BULGE DURING DAYLIGHT HOURS IS PRODUCED BY SOLAR HEATING OF THE ATMOSPHERE
• DIURNAL WINDS IN THE THERMOSPHERE CAUSE TOTAL DENSITY INCREASES TO LAG SUB-SOLAR POINT - BULGE OCCURS ABOUT 30° EAST OF SOLAR NOON AND MIGRATES NORTH AND SOUTH AS SUN'S DECLINATION ANGLE CHANGES
' FSÄ?J!J.!£NT NUMBER DENSITIES DO NOT EACH MAXIMIZE AT SAME LOCAL TIME
• HELIUM EXPERIENCES A MORNING MAXIMUM IN NUMBER DENSITY
}
• ATOMIC OXYGEN (AO) REACHES MAXIMUM DENSITY APPROXIMATELY 40° EAST OF SOLAR NOON
• AT ANY GIVEN HEIGHT ABOVE 120 km, MAXIMUM DENSITY OCCURS WITHIN THE CENTER OF DENSITY BULGE - SATELLITES MOVING THROUGH THIS REGION PERIODICALLY EXPERIENCE ENHANCED AO
189
a
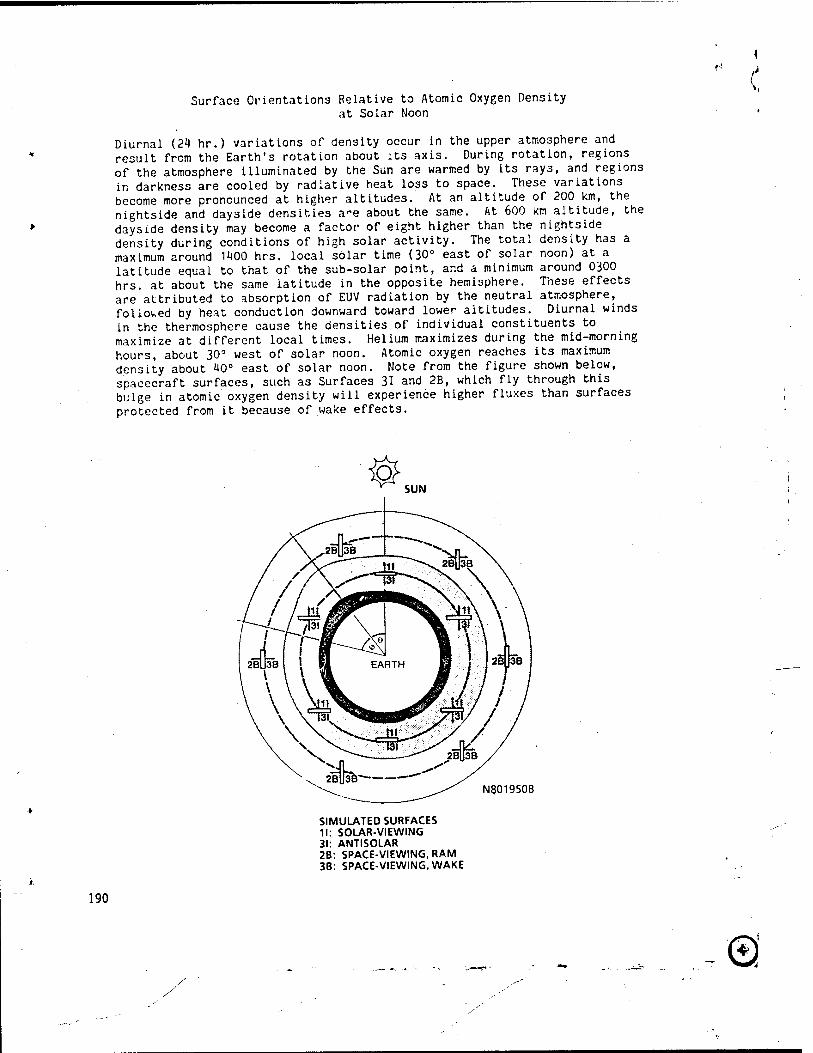
Surface Orientations Relative to Atomic Oxygen Density at Solar Noon
Diurnal (24 hr.) variations of density occur in the upper atmosphere and result from the Earth's rotation about its axis. During rotation, regions of the atmosphere illuminated by the Sun are warmed by its rays, and regions in darkness are cooled by radiative heat loss to space. These variations become more pronounced at higher altitudes. At an altitude of 200 km, the nightside and dayside densities a-e about the same. At 600 km altitude, the dayside density may become a factor of eight higher than the nightside density during conditions of high solar activity. The total density has a maximum around 1H00 hrs. local solar time (30° east of solar noon) at a latitude equal to that of the sub-solar point, and a minimum around 0300 hrs. at about the same iatitude in the opposite hemisphere. These effects are attributed to absorption of EUV radiation by the neutral atmosphere, followed by heat conduction downward toward lower altitudes. Diurnal winds in the thermosphere cause the densities of individual constituents to maximize at different local times. Helium maximizes during the mid-morning hours, about 30° west of solar noon. Atomic oxygen reaches its maximum density about 40° east of solar noon. Note from the figure shown below, spacecraft surfaces, such as Surfaces 31 and 2B, which fly through this bulge in atomic oxygen density will experience higher fluxes than surfaces protected from it because of wake effects.
950B
SIMULATED SURFACES 11: SOLAR-VIEWING 31: ANTISOLAR 2B: SPACE-VIEWING, RAM 3B: SPACE-VIEWING, WAKE
190

SDIO DELTA STAR FLUENCE PREDICTIONS ALT • 120NMI.INCL • 50 OEG, EXPOSURE: 6 ORBITS
50
30
10
IEGENO 1 • DID-HE NUMBER DENSITY (CM3) 4. D<4) ■ OJ NUMBER DENSITY (CM 31 1 . D(J) O NUMBER DENSITY (CM 3t 5 ■ D(S1-AR NUMBER DENSITY (CM)) 3 . DU1-NJ NUMBER DENSITY (CM 3) i • D(7) • M NUMBER 01NSITY (CM-3)
■V
\> r
*—i-frh"-^
/<■
A1
-\ ■•/
Zf*-
*\: V S&-
V 7*
S=i ~1 -SI"*- I -»-fT • 6~ V f- 'a N801954B
^0- V 7°
JO 3 0 4 0 NUMBER OF ORBITS
SO 60
ATOMIC OXYGEN SURFACE INTERACTION STUDIES
• PREVIOUS STS EXPERIMENTS HAVE SHOWN SURFACE RECESSION OF TYPICAL SPACECRAFT MATERIALS IS DIRECTLY RELATED TO FLUENCE, OR TOTAL INTEGRATED FLUX, DETERMINED OVER THE EXPOSURE PERIOD:
• FLUX = NUMBER DENSITY TIMES ORBITAL VELOCITY
• FLUENCE = FLUX TIMES EXPOSURE PERIOD
• ATOMIC OXYGEN NUMBER DENSITY MAY BE DETERMINED FOR EACH ORBITAL PASS USING GLOBALTHERMOSPHERIC MODELS
• SPACECRAFT VELOCITY IS DERIVED USING ORBITAL MECHANICS EQUATIONS
• FLUENCE PER ORBIT IS OBTAINED BY MULTIPLYING PRODUCT OF VELOCITY AND DENSITY TIMES THE ORBITAL PERIOD (NOMINALLY, 90 MINUTES) EXPRESSED IN SECONDS
• TOTAL FLUENCE IS THEN DETERMINED BY SUMMING FLUENCE OBTAINED DURING EACH ORBITAL PASS OVER THE TOTAL NUMBER OF ORBITS MADE DURING THE MISSION - CALCULATIONS ARE STRAIGHTFORWARD FOR RAM-ORIENTED EXPOSURES
• DIFFICULTIES ARISE. HOWEVER, WHEN THE INCIDENT FLUX IS NOT ALWAYS NORMAL TO THE SURFACE, SUCH AS FOR SOLAR INERTIAL OR SUN-SYNCHRONOUS SATELLITES
191

(
FLUENCE COMPUTATIONAL MODEL
• COMPUTATIONAL PROGRAMS ARE AVAILABLE TO COMPUTE FLUENCES INCIDENT ON SPACECRAFT SURFACES IN LOW-EARTH ORBIT FOR A VARIETY OF EXPOSURE ATTITUDES
* S«!tGw»RALIZED AND INCLUD" CONDITIONS OF EITHER NORMAL OR OBLIQUE KH\G) ,MPINGEMENT " SURFACE ORIENTATIONS AND INITIAL ORBITAL CONDITIONS DEFINED PRIOR TO PROGRAM EXECUTION:
• SURFACES ARE SPECIFIED BY: (1) SPACECRAFT ALTITUDE, (2) ORBIT INCLINATION (3) EARTH LONGITUDE AND LATITUDE OF FIRST NODAL CROSSING, (4) LOCAL SOUR TIME (5) YEAR, MONTH, AND DAY SIMULATION WILL BEGIN, AND (6) MISSION DURATION
• SPACECRAFT IS PERMITTED TO ADVANCE THROUGH ITS ORBIT IN DISCRETE STEPS -- AVFRAGE AO DENSITY MIDWAY THROUGH PATH DISTANCE TRAVELED IS OBTAINED USING MSIS-86 THERMOSPHERIC MODEL
• |EmnAI'?TNS ARE USE° T° DETERMINE ORBITAL VELOCITY NORMAL TO EACH SURFACE UnfUtK b IUUY
• AO FLUENCE IS DETERMINED USING VALUES OF AVERAGE DENSITY, RELATIVE VELOCITY AND EXPOSURE DURATION ALONG EACH PATH-LENGTH TRAVELED
• INCREMENTAL EXPOSURES OBTAINED DURING PROGRAM OPERATION ARE THEN SUMMED OVER DURATION OF SIMULATION TO OBTAIN TOTAL FLUENCE INCIDENT ON EACH SPACECRAFT SURFACE UNDER STUDY
SPACECRAFT FLUENCE PREDICTIONS
SPACECRAFT PROGRAM
EXPOSURE ALTITUDE, NMI
ORBIT INCLINATION
MISSION DURATION
ATOMIC OXYGEN FLUENCE,
ATOMS/cm2
ESTIMATED SURFACE
RECESSION, MILS (KAPTON)»
DELTA STAR 120 so- 7 DAYS 1.5X10²¹ (RAM) 1.8 DELTA STAR 176 so0
3 MONTHS 9.0X10²⁰ (SI) 1.1 DELTA STAR 176 50° 1YEAR 3.5X10²¹(SI) 4.1
SPACE TELESCOPE 320-260 28.5° 5 YEARS 4.0x10²¹ (RAM) 4.7
SPACE TELESCOPE 320-260 28.5° 5 YEARS 1.4x10²¹ (SI) 1.7
SPACE STATION 250-180 28.5° 30 YEARS 1.5X10²³ (RAM) 177 SPACE STATION 250-180 28.5° 20 YEARS 5.5X10²² (SI) «
* SURFACE RECESSION = "MATERIAL REACTION EFFICIENCY (cm3/atom) X AO FLUENCE <atoms/cm2). WHERE
" KAPTON^ EFF,CIENCY ■ V0LUME 0F MATERIAL LOSS PER INCIDENT OXYGEN ATOM (3.0 X 1C"24Cm3/atom FOR
192

Space Station Freedom Altitude Strategy for Surface Interaction Studies
During conditions of high solar activity, the atmosphere expands and the drap on spacecraft surfaces increases substantially. Spacecraft flying at low altitudes during solar maximum experience higher deceleration forces and must be re-boosted to higher altitudes to remain in stable orbit about the Ear-h. Not only does drag often dictate requirements for re-boost capability, but it usually restricts use of sensitive microgravity experiments. As is illustrated in this figure, a variable altitude strategy has been baselined for Space Station Freedom which reduces the amount of atmo- spheric drag it will experience during the next solar cycle. During periods o" high solar activity, Space Station Freedom will be operated et high alti- tudes" (220 to 250 nmi) to minimize deceleration forces on its sensitive micro- gravity experiments. As solar activity decreases, the altitude of Space Sta- tion Freedom will be reduced to maintain number density constant. Since variations in orbital velocity over this altitude range are very small, con- stant density will result in constant aerodynamic drag. At Solar_minimum, Srace Station Freedom will have attained its lowest (l80 nmi) altitude. As solar activity increases to its maximum level, aerodynamic drag will once ar-in be controlled by boosting Freedom to higher altitudes at rates which maintain the number density constant. This strategy will result m signifi- cant savings in STS operations costs - it will reduce the number of ohuttle re^unrly flights for S<:uce Station Freedom because the Orbiter can deliver more'payload weight to lower altitudes than it can to higher altitudes. However, when compared to a constant altitude strategy, the constant density strategy will increase the atomic oxygen fluence on Space Station surfaces by about a factor of four. Thus, when compared to a constant altitude strategy, the need for protective coatings to limit A0 surface interactions becomes even more significant.
\
160 1993 1995 1997 1999
SOLAR CYCLE, YEAR
NOTE: SPACE STATION ALTITUDE TO BE MAINTAINED SLIGHTLY ABOVE + 2« ALTITUDE PROFILE TO ACCOUNT FOR TEMPORAL VARIA- TIONS IN SOLAR ACTIVITY
J
2001 2003
/
193
. 4 . ..>. —-J V - -*M * ©

Hubble Space Telescope Predicted and Constrained Orbital Altitudes
1
t
The Hubble Space Telescope (HST) is a Shuttle-launched and serviced satellite designed to have an operational life over many years. To meet these lifetime requirements, on-orbit maintenance is planned, with major refurbishment accomplished by retrieval and return to Earth. The HST is designed to operate in a 28.5° inclined circular orbit at altitudes from 320 to 215 nmi (593 to 398 km). The satellite will be deployed at an altitude Just high enough so that "worst case" aerodynamic drag will not cause it to decay below 215 nmi at the end of a 5-year period. Lifetime predictions are strongly dependent on assumptions made about the degree of solar activity, as high activity increases the atmospheric density at a given altitude, thereby increasing the drag force and shortening vehicle life. Given current solar activity predictions (see constant density curves shown below), the HST must be reboosted twice by the Space Shuttle during its 5-to 7-year lifetime. The first reboost will occur approximately 1 year after launch, and is required to maintain the satellite above the 6.3 x 10_12 kg/m3 density curve encountered early-on during its mission. Assuming a reboost flight is delayed by several months, reaction wheels aboard the HST will have to spin at higher speeds to maintain attitude control within the high aerodynamic drag environment, and excessively long times will occur between target acquisitions. Even longer delays would saturate the reaction wheels, and attitude control would then be lost altogether. To avoid these problems, NASA will dedicate a Shuttle flight to reboost the HST early in its mission. Also note from this figure, a second reboost flight will occur approximately 4 years after the HST is delivered to orbit, during which time its batteries and solar arrays will be changed out to extend its lifetime.
STS LAUNCH DATE OF 8/31/89, F10.7 (PEAK) = 245 ALTITUDE VARIATIONS FOR DENSITIES OF S.O X 10-12 AND 6.3 X 10⁻¹² kg/m* (+ 2<T DENSITY CURVES)
320
300
£ 280
5 260 1-
< Z Z 240 UJ a => t t 220 <
200 AT 5.0 X 10¹² kg/m3 • CD. ALTITUDE
AT 6.3 X 10⁻¹² kg/m3 ■ ■ ■ 1 ■ ■ ■ i ■ 180 1 1 ■ ■ ' 1
1989 1991 1993 1995 1997 DATE IN YEARS
■ ) ' ■ '
1999 2001
194
SOURCE: NASA/MSFC; V. BUCKEIEW
^

CONCLUSIONS
• ATOMIC OXYGEN IS THE MOST ABUNDANT CONSTITUENT IN THE LOW-EARTH ORBIT * ENVIRONMENT:
• AT ORBITAL ALTITUDES, NEUTRAL ATMOSPHERE CONSISTS PRIMARILY OF 80% ATOMIC t OXYGEN AND 20% MOLECULAR NITROGEN
J • INCREASES IN SOLAR ACTIVITY LEAD TO HIGHER ATOMIC OXYGEN NUMBER DENSITIES
• OXYGEN DENSITY DECREASES EXPONENTIALLY WITH INCREASING ALTITUDE
• GLOBAL THERMOSPHERIC MODELS, WHEN COMBINED WITH ORBITAL MECHANICS MODELS MAY BE USED TO PREDICT ATOMIC OXYGEN FLUENCE, OR TOTAL INTEGRATED FLUX, iNCIDENT ON SPACECRAFT SURFACES:
• RAM-ORIENTED SURFACES RECEIVE MORE FLUENCE THAN SOLAR INERTIAL SURFACES
• MISSIONS OF LONG DURATION MORE SEVERELY AFFECTED THAN MISSIONS OF SHORT DURATION
• MISSIONS CONDUCTED DURING PERIODS OF LOW SOLAR ACTIVITY LESS SEVERELY AFFECTED THAN MISSIONS DURING HIGH ACTIVITY
• FLUENCE PREDICTIONS, WHEN USED WITH STS MATERIAL REACTIVITY MEASUREMENTS PROVIDE RELIABLE ESTIMATES OF THE OXIDATIVE EFFECTS ON SPACECRAFT SURFACES
195


N89-23540 ATOMIC OXYGEN EFFECTS ON MATERIALS *
Bruce A. Banks, NASA Lewis Research Center Sharon K. Rutledge, NASA Lewis Research Center
Joyce A. Brady, Sverdrup Technology, Inc. Cleveland, Ohio
James E. Merrow, Ohio University Athens, OMo
♦Original photographs not available at time of publication.
PRECEDING PAGE BLANK NOT FILMED 197
■Nil

ATOMIC OXYGEN SURFACE INTERACTION PROCESSES
Atomic oxygen with an energy level of 4 - 5 eV may initiate numerous chemical and physical events on the surface it impacts. The atomic oxygen may simply be scattered or it may chemically react with nitrogen, also incident upon the surfacp to form nitrous oxide in an exited state, which can de-exite to produce a qlow If atomic oxygen reacts with an organic material, volatile fragments, such as short chain oxidation products, may leave the surface. The surface may also be populated with exited state fragments, radicals, or polymeric molecules with oxygen-contafnina functionalities. The oxygen may also, as in the case of silver, diffuse into the 9
deexcitatlon "glow"
NO,
*N02*
\
N2
WW RO# /OH^ROR'^-ROH
■■.•.•.>*.v.".v.'.*A'.'-V ;■•.?•••••. .-.Ov..-'.
>..•.;■.'•..».•-■-:.■'!••;.;.•:>■:■;■.■..;..».•.••;••.-kr,-■>•.••.':.•■■••. ■.•'...•■..•.• ?.■':?:■.•«:•-.■•..
.-_ *. v». ■='_-•; .•■■; ','■', ■-.•■■;■.• '. ;,.•;• - T- •'.••. v.v_■- •,■".''■■"■■-."• '=« . ■'-: _°.
198
^ ©'

-»v*K.i
QUANTIFICATION OF ATOMIC OXYGEN EFFECTS CN MATERIALS
hPPn Iorf™HihiCati0n °f a^umic 0xvgen inaction with materials has generally been performed by measuring the atomic oxygen flux and multiplying it by the dura- tion of exposure, which results in an atomic oxygen fluence in erms of atoms oer anTthVnl^r; yjef
materia1 is «»ally measured in t rm so we gh , and the probability that oxygen will react with the material can be measured for' sow materials m terms of reaction probability. The chemistry of the surface S c1 reaCtr9 W1th the incident ox^en may cause the formation of o ?o 1 r°asP? ytheScaspr^-?nd °iWiml °r °XideS wMch are not adherent and* tend oviH« iX -i\ f e 0f Sllver« may form- Both of these types of surface
o0tnUte t0 "Pt £!:0Si0n 0f the surfäl-e- If th* surface mater albino impinged by atomic oxygen forms an adherent oxide, such as aluminum form nq alumi-
num oxide ors. icones forming silicon dioxide on the surface, then the surface mav ¥£\n ?* Chemslr* f ** remaining or reacted surface may be ana yzed by ur- * IfL "? yS1S^ ^^.characterization, and mechanical characterization (in erms of modulus and elasticity). If net erosion of the material surface occurs the
An?" ma" T iS quant!tied and used t0 calculat* an erosio o? ec ss on per incident oxygen atom, generally in units of cubic centimeters per Incident"lygen
Volatile Oxide (from polymers, C, Os)
Erosion
0 + Material -> Oxide Nonadherent Oxide / (from Ag)
Adherent Oxide (from Al, silicon)
Growth
atoms cm«?
cm3 or gin
reaction probability Surface analysis: SEM, ESCA
RBS, SIMS, FTIR-ATR Optical characterization, t,
P » o , e Mechanical characterization,
199
(7

ATOMIC OXYGEN REACTION PROBABILITIES
i,fDHTpe pr°babili*y of atomic oxygen reacting with a given material can be calcu-
lated for those materials which form known or simole oxides. Using erosion yield numbers from space tests, one finds that atomic oxygen has a rather low probabi itv approximately 13%) of reacting with carbon to form carbon monoxide. HoEJeJ^n
the case of silver, a very high fraction of the incident atomic oxygen reacts wth tne silver to form silver oxide. Because the silver oxide may tend9?! shield from further oxidation or be a catalyst surface for recombination of atomic oxygen on tne surface, the reaction probability for silver is expected to drop as 32degree of oxidation on the surface becomes higher. degree
MATERIAL
Carbon
Silver
EROSION YIELD, cm3/atom
-24 1.2 x 10
10.7 x 10 -24
REACTION PROBABILITY. %
13
62
200

>lv
ATOMIC OXYGEN REACTION MECHANISMS WITH POLYMERS
Various mechanisms have been suggested for the reactions of atomic oxygen with polymers based on studies with simple organic compounds. Basic processes are labeled as abstraction, addition, elimination, insertion, and replacement reac- tions. Abstraction is the process by which atomic oxygen "abstracts" an atom, such as hydrogen, from the compound. "Addition" describes the process by which an oxygen atom adds or attaches itself to an organic compound. This has been observed for the reaction with a typical alkene, and the initial product is a vibrationally excited molecule which can then undergo "elimination" of a hydrogen atom. Atomic oxygen has also been observed to "insert" between two bound atoms, such as carbon and hydrogen in an organic molecule. "Replacement" is the mechanism by which an oxygen atom attaches to the molecule and a portion of the original molecule departs (usually as a radical). Oxygen, in pffect, replaces a group originally present on the molecule producing an alkoxy radical and an alkyl radical.
ABSTRACTION R + o > R'- + OH-
ADDITION R ♦ O ■ > [R'O-1 *
ELIMINATION [R0']# —■► R'O- + H-
INSERTION R + O —-► [R'OH]"
REPLACEMENT R + O > R'. ♦ R"0«
201
ß

ATOMIC OXYGEN REACTION MECHANISMS
Reactions of atomic oxygen with polymers have been shown to occur by various mechanisms. Under thermal energy conditions, it is known that ground state atomic oxygen 0(3p) abstracts hydrogen from saturated organic molecules. Singlet atomic oxygen 0(1D) at thermal energy, inserts into C-H bonds in saturated organic molecules to form alcohols. Another suggested mechanism is replacement to form alkyl radicals and alkoxy radicals. These primary faction products undergo fur- ther reactions which lead to fragmentation of the reactants. The fragmentation products form weakness of bonds. Under high vacuum conditions, moderate molecular weight oligomers and fragments are volatile.
Unsaturated organic molecules show different pathways leading to formation of fragments and volatiles. 0(3p) adds to carbon-carbon double bonds, forming metastable triplet biradical intermediates which can undergo further reaction to form epoxide, aldehyde, and ketone products. The favored pathway for the reaction of the triplet biradical is hydrogen elimination to form a carbonyl-containing radical. O^D) inserts into C-H bonds in alkenes and the resulting metastable species undergoes further reaction. At high temperatures, hydrogen abstraction may compete with 0 atom insertion.
It is important to note that at high energy, 0(3p) acts similary to O^D) and it is more difficult to distinguish between them.
ALKANES flCH2
CH0 RCH2CH2. ♦ OH >• 2 RCH2CH2- ♦ HOH
fplicamanl ̂ - R'O- ♦ B'CH-CH,
'[RC^CHJOHJ*
^ recombination/further reaction/fragmentation"
Iraomentallon (volatile»)
-^-volatiles
ALKENES
B^ ^H
t > re« recombinatlon/turlher .^.volatiles
cllon/fragmenlallon "
^- fragmentation (volatiles)
^> recomblnallon/furlher m reaction/fragmentation ->-volatiles
Mfi-jinH1»' •— * srconverilon/ I p - ij ptMidt formation,^ I V Qy
trif>l«1-s,ngl«t H' yQy "*H
\_ Inltrconvtfiion/ L
fRCCH-l* .
fragmentation (vojalBes)
fragmentation (volatiles)
202
£

ESCA ANALYSIS OF POLYETHYLENE SURFACE
Surface chemical analysis by means of ESCA has been performed on polyethylene surfaces exposed to atomic oxygen in low Earth orbit. Such analyses performed by Coulter Liang, Chung, Smith, and Gupta have indicated that olefin formation is not an important process in atomic oxygen interaction with polyethylene.
*
Cl c2 1
^3 0
Theoretical 100.0 — — —
Control 99.2 — — 0.8
Exposed 81.5 4.5 1
1 3.1 9.9
© © © -c-c- 0
II -c-
0 II
-C-OH
-c = c- -c-o-c-
-C-0-H
203 i ■ i
pi

EROSION YIELDS OF VARIOUS MATERIALS EXPOSED TO ATOMIC OXYGEN IN LOW EARTH ORBIT
% t \
time.
204
MATERIAL
EROSION YIELD, x 10-2* cm3/AT0M REFERENCE
Aluminum (150 A) 0-0
Aluminum-coated Kapton 0.01
Aluminum-coated Kapton 0.1
Carbon
Carbon (various forms)
Carbon/Kapton 100XAC37 1.5
401-C10 (flat black)
1
2
2
A1203 <0-025 3
A1203 (700 I) on <0.02 4
Kapton H
Apiezon grease 2^m >0.625
Aquadag E (graphite in an 1.23 aqueous binder)
1.2 ?. 1. 8. 9
0.9 - 1.7 10
11
0.30 '2
W

MATERIAL EROSION Y
x 10"24 cm IELO, J/ATOH REFERENCE
Chromium (123 A) partia lly eroded 14
Chromium (125 X) Kapton H
on 0.006 15, 16
Copper (bulk) 0.0 17
Copper (1,000 A) sapphire
on 0.007 15, 16
Copper (1,000 X) 0.0064 14
Diamond 0.021 17
Electrodag 402 (s a silicone bin
ilver in der)
0.057 6
Electrodag 106 (graphite in an epoxy binder)
1.17 6
Epoxy 1.7 10, 16
Fluoropolymers:
FEP Kapton 0.03 18
Kapton F <0.05 6
Teflon, FEP 0.037 5
Teflon, FEP <0.05 10
MATERIAL EROSION YIELD,
x lO"24 cm3/AT0M REFERENCE
Teflon, TFE <0.05 10, 6
Teflon, FEP and TFE 0.0 and 0.2 15, 19
Teflon, FEP and TFE 0.1 15
Teflon 0.109 19
Teflon 0.5 15
Teflon 0.03 15
Teflon <0.03 9
Gold (bulk) 0.0 17
Gold appears resistant 20
Graphite Epoxy:
1034 C 2.1 10
5208/T300 2.6 10
GSFC Green 0.0 1
HPS-875 (bare and preox) 0.0 1
Indium Tin Oxide 0.002 15, 16
Indium Tin Oxide/Kapton (aluminized)
0.01 2
Iridium Film 0.0007 17
205

MATERIAL
EROSION YIELD, x 10-24 cn^/ATOM REFERENCE
Lead 0.0 1
Magnesium 0.0 1
Magnesium Fluoride on glass 0.007 15, 16
Molybdenum (1,000 A) 0.0056 4
Molybdenum (1 ooo h 0.006 15, 16
Molybdenum 0.0 1
Mylar 3.4 10
Mylar 2.3 15, 19
Mylar 3.9 15, 19, 9
Mylar 1.5 - 3.9 15
Mylar A 3.7 18
Mylar A 3.4 21, 6
Mylar A 3.6 6
Mylar 0 3.0 6
Mylar D 2.9 21
Mylar with Antiox heavily attacked 22
Nichrome (100 h 0.0 1
\
MATERIAL
EROSION YIELD, x 10"24 cm3/ATOM REFERENCE
Nickel film 0.0 17
Nickel 0.0 8
Niobium film 0.0 17, 1.
Osmium 0.026 10
Osmium heavily attacked 20
Osmium (bulk) 0.314 17
Parylene, 2.5 Jim eroded away 22
Platinum 0.0 1
Platinum appears resistant 20
Platinum film 0.0 17
Polybenzimidazole 1.5 10, 7
Polycarbonate 6.0 8
Polycarbonate resin 2.9 17
Polyester - 7X Poly- silane/93X Polyimide
0.6 10
Polyester heavily attacked 10, 22
Polyester with Antiox heavily attacked 10, 22
Polyester (Pen-2,6) 2.9 23
Polyethylene 3.7 10, 21, 16, 15
206
x*

MATERIAL EROSION YIELD,
x 10-" cm3/ATOM REFERENCE
Polyethylene 3.3 18, 6
Polylmldes:
BJPIPSX-9 0.28 23
BJPIPSX-9 0.071 24
BJPIPSX-11 0.56 23
BJPIPSX-11 0.15 24
BTDA-Benz1dene 3.08 23
BTDA-DAF 2.82 23
8T0A-0AF 0.8 24
BTDA-fmwDD502 2.29 23
BTDA-mm-MDA 3.12 23
BTDA-pp-DABP 2.91 23
BTDA-pp-OABP 3.97 23
Kapton (black) 1.4 - 2.2 15, 12
Kapton (TV blanket) 2.0 15
Kapton (TV blanket) 2.04 19
Kapton (OSS - 1 blanket) 2.55 15
Kapton (OSS - 1 blanket) 2.5 15
it 5> \
MATERIAL EROSION YIELD,
x IQ-24 cm3/AT0M REFERENCE
Kapton H 3.0
Kapton H - 2.4
Kcpton H 2.7
Kapton H 1.5 - 2.8
Kapton H 2.0
Kapton H 3.1
ODPA-m-DABP 3.53
PMDA-pp-DABP 3.82
PMDA-pp-MDA 3.17
PMDA-pp-ODA 4.66
Polymethylmethacr ylate 3.1
25% Polyslloxane Polyimlde
45% 0.3
25X Polysiloxane- Polyimide 0.3
Polystyrene 1.7
Polysulfone 2.4
Polyvlnylidene Fl uorlde 0.6
10, 15, 19, 4, 6, 9
15, 19
15, 18
15
18
18
23
23
23, 24
23
16
10
10, 16, 9
10, 16
9
/■■
207
fr 1*-

MATERIAL EROSION YIELD,
x lO-24 cmJ/ATOM REFERENCE
Pyrone:
PMDA-DAB 2.5 23
S-13-GL0, white 0.0 12
S102 (650 I) on Kapton H 0.00103 4
SiOx/Kapton (aluml nized) 0.01 2
Silicones:
DC1-2577 0.055 21
0Cl-2755-coated Kapton 0.05 15
DCl-2775-coated Kapton <0.5 15
DC6-1104 0.0515 20
Grease 60 /im Intact but oxidized 25
RTV-560 0.443 21
RTV-615 (black, conductive)
0.0 20
RTV-615 (clear) 0.0625 5
RTV-670 0.0 1
MATERIAL EROSION Y]
x 10-?4 cm- ELD, /ATOM REFERENCE
RTV-S695 1.48 11
RTV-3145 0.128 1
T-650-coated Kapton <0.5 15
Siloxane Polyim de (25X Sx) 0.3 7
Siloxane Polyim de (7X Sx) 0.6 7
Silver 10.5 5
Tantalum appears resistant 20
Tedlar 3.2 10
Tedlar (clear) 1.3 and 3.2 15
Tedlar (clear) 3.2 18, 6
Tedlar (white) . 0.4 and 0.6 15
Tedlar (white) 0.05 15
TiOj, (1,000 A) 0.0067 5
Trophet 30 (bare and preox) 0.0 1
Tungsten 0.0 8
Tungsten Carbide 0.0 8
YB-71 (ZOT) 0.0 7
208
£

EROSION YIELD TABLE REFERENCES
T
1. Marshall Space Flight Center
2. Smith, K. A. Evaluation of oxygen interaction with materials (EOIM) - STS-8 atomic oxygen effects. AIAA-85-7021. November, 1985.
3. Ourcanin, J. T., and Chalmers, 0. R. The definition of low earth orbital environment and its effect on thermal control materials. AIAA-87-1599. June, 1987.
4. 8anks, B. A., Mirtich, M. J., Rutledge. S. K., and Nahra, H. K. Protection of solar array blankets from attack by low earth orbital atomir n»«n»n. Iflth TFFF Photovoltaic Specialists Conference. Octocer, 1985.
5. Purvis, C- K., Ferguson, D. C, Snyder, 0. 8., Grier, N. T., Staskus, J. V., and Roche, J. C. Environmental interactions considerations for space station and solar array design. Preliminary - December, 19t6.
6. Visentine, J. T., Leger, L. G., Kuminecz, J. F., and Spiker, I. K. NASA JSC STS-8 atomic oxygen effects experiment. AIAA 23rd Aerospace Sciences Meeting. January, 1985.
7. Langley Research Center
8. University of Alabama at Huntsville
9. Coutler, D. R., Liang, R. H., Chung, S. H., Smith, K. 0., and Gupta, A. 0-atom degradation mechanisms of materials. Taken from Proceedings of NASA Workshop on Atomic Oxygen Effects. J"ne 1, 1987, p. 42.
10. Leger, L. G., Santos-Mason, B., Visentine, J. T., and Kuminecz, J. F. Review of LEO flight experiments. Proceedings on the NASA Workshop on Atomic Oxygen Effects. November, 1986, p. 6.
11. British Aerospace
12. Whitaker, A. F. LEO atomic oxygen effects on spacecraft materials.
13. Martin Marietta
14. Lewis Research Center
15. Leger, L. J., Spiker, I. K., Kuminecz, J. F., Ballentine, T. J., and Visentine, J. T. STS Flight 5 LEO effects experiment - Background description and thin film results. AIAA-83-2631-CP. October, 1983.
16. Jet Propulsion Laboratory
17. Gregory, J. C. Interaction of hyperthermal atoms on surfaces in orbit: The University of Alabama Experiment. Proceedings of the NASA Workshop on Atomic Oxygen Effects. November, 1986, p. 31.
IS. Letier, L. J., Visentine, J. T., and Kuminecz, J. F. Low earth orbit.
19. Leger, L. J. Oxygen atom reaction with shuttle materials at orbital altitudes - Data and experiment status. AIAA-83-0073. January, 1983.
20. Goddard Space Flight Center
21. Johnson Space Center
22. Washington University
23. Slemp, W. S., Santos-Mason, B., Bykes, G. F., Jr. and Witte, W. S., Jr. Effects of STS-8 atomic oxyqen exposure on composites, polymeric films and coatings. AIAA-35-0421. January, 1985.
24. Santos, 8. The dependence of atomic oxygen resistance on polyimide structures. (Preliminary results of STS-3). NASA Headquarters. January 23-24, 1984.
25. Aerospace Corporation
209
s f

ATOMIC OXYGEN ATTACK OF PYROLYTIC GRAPHITE, A-PLANE (STS-8)
Atomic oxygen attack of both polymers and graphite tends to cause the develop- ment of microscopic cone-like surface structures. Such cone-like structures deve- lop in the "A" or prismatic plane direction for pyrolytic graphite. Pronounced structures are evident for RAM-only attack. However, only minor roughening occurs under sweeping atomic oxygen incidence.
•A* DIRECTION
STRONG COVALENT BONDS
BASAL PLANE
WEAK VAN DER WAALS BONDS
1.417 A 2.455 A
$ Sjgr* ^mftrnkfa ̂ ^f!!« % wwH t. SSs. ■■$HH
2!J * .jtf J^**ACJÖ* fttäikfeuäsfl
lum prafltght
210
1 urn postlllght

ATOMIC OXYGEN ATTACK OF PYROLYTIC GRAPHITE, C-PLANE (STS-8)
Atomic oxygen bombardment of the C-plane or basal plane of graphite also causes the formation of surface texture, even though there is no apparent rationale for such development with respect to differential erosion yields for amorphous compared to graphitic regions, as may occur in polymeric materials such as Kapton, Mylar, and fluoropolymers.
•C' DIRECTION
6.74 A
STRONG COVALENI-/ J I . B0N0S A 1455 A
BASAL PLANE
WEAK VAN DER WAAIS BONDS
1«m PREFLIOHT POSTFLIQHT
211

Um
f(
CARBON FIBERS IN EPOXY MATRIX EXPOSED TO ATOMIC OXYGEN (STS-8)
Differences in erosion yield for graphite or carbon fiber epoxy composites result in exposure of the carbon fibers because of more accelerated erosion of the epoxy matrix material.
212

PAN FIBERS IN EPOXY EXPOSURE TO ATOMIC OXYGEN (STS-8)
PAN fibers (polyacrylonitrile derived) also develop a cone-like microscopic surface morphology. In fact, pitch and PAN based fibers both develop a cone-like morphology upon RAM attack by atomic oxygen. In general, all bulk materials with volatile oxidation products tend to develop cone-like surface morphology upon RAM attack.
PREFLI3HT POSTFLIQHT 1 um
213
&

KEVLAR POLYIMIDE FIBERS IN EPOXY EXPOSURE TO ATOMIC OXYGEN (STS-8)
Kevlar polyimide fibers develop a surface texture very similar to Kapton polyimide.
214
2 urn PREFUGHT 2 um POSTFLIGHT
.(♦>

OXYGEN ATOM REFLECTOMETER FLOWN ON SHUTTLE STS-8
face SJ°Sec!!i3i!! 512 doeLn?J reaCt with a surface ™* accommodate to the sur-
DIRECTION OF SPACECRAFT MOTION
10 cm
■THIN (600AI ILVER FILM
DEPOSITED ON Cfl-39 PLASTIC STRIP
ALUMINUM HOUSING
215
to

THE JENKINS MODEL OF THE STRUCTURE OF GLASSY CARBON
The vitreous carbon target used for this experiment does not have a preferen- tial direction or plane because it is a woven tangle of graphine ribbons of random orientation.
216

*; r SCATTERED ATOMIC OXYGEN
Atoms of oxygen which do not react with the glassy carbon target surface appear to be ejected with a slight preferential forward specular scattering, indi- cating that at least a certain portion of the atoms do not totally accommodate to the surface. The facts that the ejection occurs at wide angles and that the proba- bility of reaction is low on the first bounce contribute to a general concern that we must deal with atomic oxygen not only from the RAM direction, but from multiple bounce arrival to assure durability of reactive surfaces.
1.3 — NOCILLA MODEL
0 (NOCILLA)«40°jSr"0.2 1.2
y—" "JSPAV. — COSINE DISTRIBUTION s ~ c **r>^0&5v WITH RESPECT TO
' VKV 3UHFACE NORMAL /• °fi ' Jc
/ rfi T&\ 1.0 / /& \A
.9 / / \\ / / °A
.a / / / / A a / / \\ ° .7 / /
/ / <9 \\ Id .6 .g.
L / / / / ***K .5 - / /
/ / .4 / / o \ / /
/ / aA .3 / /
/ / .2 - 1 / I /
I / -I / 1 /
a ' /1 i i i i i i i i i i i i i i i \
-90 -80 -70 -60 -50 -40 -JO -20-10 0 10 20 30 «0 SO 60 70 80 SO
SCATTERING ANCLE
217
&

SURFACE RECESSION DEPENDENCE UPON ATOMIC OXYGEN IMPACT ANGLE
The angle of impact of the atomic oxygen affects the rate of surface erosion with an angular sensitivity proportional to the cosine of the angle with respect to the surface normal to the 1.5 power as opposed to the cosine to the 1 power, as would normally be expected. This may be an indicative that highly inclined sur- faces may have a higher probability of specular scattering. The role that the microscopic cone formation on the surface plays with respect to this angular sensi- tivity is not clearly understood.
W
13 r-
OXYGEN BEAM
O KAPTON A MYLAR A D MYLAR D
10 20 30 IMPINGEMENT ANGLE. DEGREES
218

ATOMIC OXYGEN EROSION YIELD TEMPERATURE DEPENDENCE
Atomic oxygen erosion is a function of the temperature of a material as shown in this activation energy expression. The activation energies for several mater- ials tested in space are shown on this chart.
- AL Erosion Yield OC 6 ^T
AE = Activation Energy, calories/mole
R = Gas Constant, 1.986 calories/(mole K)
T = Absolute Temperature, K
MATERIAL ACTIVATION ENERGY A E. CALORIES/MOLE
Vitreous carbon 1,200
Graphite 1,400
CR-39 (bisallyi diglycol carbonate, an optical plastic)
CR-39 (bisallyi 1,050 diglycol carbonate,
219
P)

EFFECT OF TEMPERATURE ON OXIDATION RATE OF CARBON ON STS-8 (
Heated vitreous carbon and single crystal graphite samples on STS-8 were used to make an Arrhenius plot to determine the activation energies for these materials.
(a) oE ■ I"" cal »oil
(b) «E - 1200 Cll «ol»~
O'C
220

POLYMERIC FILMS AT VARIOUS TEMPERATURES ON STS-8
Efforts to measure the effect of sample temperature on erosion yield of Kap- ton, Mykr A, Mylar D, and clear Tedlar on STS-8 have not resulted in the discovery of measurable dependencies greater than the uncertainty of the temperatures used for the experiment.
MATERIAL THICKNESS, Ulli
(MILS)
KAP TON 12.7 (0.5)
KAPTON 25.1 (1.0)
KAPTON 50.Ü (2.0)
MYI.AI! A 12.7 (0.5)
MYLAR A 10.6 (1.6)
MYLAR tl 50.f! (2.0)
CLEAR TEDLAR 12.7 (0.5)
EXPOSED SIDE
AIR ROLL
AIR ROLL
AIR ROLL
AIR
AIR
AIR ROLL
AIR
SUREACE RECESSION, urn
STRIP SAMPLES
121 C
0.5 u.a
9.a 9.9
ii. i li.i
12./
12.1
9.9 11.0
10.9
65 C
10.5 10.3
10.7 9.0
10.f. II.I
12.3
11.9
10.2 10.1
ll.5
221
£

ACTIVATION ENERGY,A E, CALORIES/MOLE
This table compares activation energies calculated from space experiments with laboratory experiments performed by various researchers. The data may suggest that the level of understanding of activation of energies in space and in the laboratory simulation of space is rather low. However, data obtained in ground experiments occasionally are consistent with the results obtained in space experiments.
MATERIAL SPACE LABORATORY
Graphite 1400A 2300C
3580'
1437:
Kapton H 72B
Kapton HN 1325
FEH- Indeterminate 369
SOURCES:
A-J. Gregory, STS-8 B-0. Visintine, STS-8 C-C. Park 0-G. Arnold and D. Pepl inski-lev E-S. Rutledge - RF Asher
222
f

ATOMIC OXYGEN EROSION DEPENDENCE UPON POLYMER FILM THICKNESS (STS-5)
Measurements taken on STS-5 indicate a slight erosion yield dependence of polymer thickness on Kapton and Mylar.
4.50
4.00
3.50
3.00
VI
J3 I 2.50 z ■ x (/> ü «> I O 2.00
1.50
1.00
.50
O KAPTON
D MYLAR
NOTE: BANDS SHOW 1» VARIATIONS IN MEASUREMENTS
I I
10 20 30 40
SPECIMEN THICKNESS, pm
50 SO
223

EROSION YIELDS AS A FUNCTION OF POLYMER FILM THICKNESS (STS-8)
Measurements taken on STS-8 indicate a far smaller sensitivity to polymer film thickness than was previously observed on STS-5. Film thickness may play an indi- rect role because of film processing materials which may be present on the surface of polymers to varying degrees depending upon the thickness of the specific poly- mer. Such surface contaminants may act as atomic oxygen barriers until suffi- ciently large fluences remove them.
Kapton H Mylar A (X1Ö24)
12.7 *0-8
(0.5) <>•«>
Thickness;»m, (mills) Thickness) »m, (mills)
224

EFFECT OF SOLAR RADIATION ON EROSION YIELD
The question of whether or not atomic oxyqen is svneraisticallv afford h„
calculations based on fluence estimates, the ratio of erosion Jleld in She dav to erosion yield at night appears to close to 1 or slightly pos?t^e indicatingthat
Se[he^certI?:tevSlight Syner9l$t1c 6ff6Ct' but oAueitfowMTiaJntSrSlX
DAY CR05I0» YIELD NlliHI tKUSION YIELD
MATJRIAt ,, ASSUMING GRAPHITE REACTIVITY p.cm n>, ^^ IS IMPENDENT OF SOI AR RADIATE ErrFrT. FLUE^cf E^ATF.S
Graphite
Polyethylene
Kapton H 1.0-1.5
Mylar A 1.0-1.5
Kapton F Indeterminate i„, .
Indeterminate
S,-° 1.2-1.7
°'8 0.9-1.3
u
225
&

ATOMIC OXYGEN EROSION YIELD FOR KAPTON H AS A FUNCTION OF FLUX
nf fh2nfT?a5i7a£f 3 Pl°- °f.the er0sion yield versus the avera9e ^"x for several of the STS flight experiments to find that there is significant data scattPr h.it
that some trend of reduced erosion yield as a function Vceag flux c n be observed. However, it is very difficult to draw any definite conclusion because rnlllZa9VlU*-^y be ,the r6Sult 0f avera9ing a high flux and near zSJo flS lid comparing that with a moderate flux from another flight. One can make arauments that erosion yield should increase with flux due to interaction Sf radicals anS metastables with each other, and also that erosion yield should decrease with increasing flux due to increases in nonreactive scattering of the incident atomic oxygen upon oxygen resident at the surface. The effects of RAM versus sweeping atomic oxygen impingement may also contribute to difficulty in data interpretation.
3 -T x 10'
E o
2 2.5-
> c o '3 o
-24 STS-8
STS-4
STS-3 STS-& *
3 1 j r Average Flux atoms/cm2 sec
~i 14 7 x 101*
226

EROSION YIELD OF KAPTON H AS A FUNCTION OF ATOMIC OXYGEN FLUENCE
cuJlrllT. yin'?hrc«eÄ°,0?^?;?,a'S0 W'de" S"»^ """«tins *> 5-*«.. i^ÄTrÄÄ^«'^
' 3 - • •
1 1 1 o- o
E • o a
E A u A
I 2 A ~~ a -i \a > o STS-8 EOIM o A STS-3 CO
r? 1 A STS-5 EOIM
"1 n
»
1
• STS-4 IECM
i i ' 2 3
ATOMIC OXYGEN FLUENCE. 1020cm-2
227
*

KAPTON MASS LOSS RATES VS. OXYGEN ENERGY
The erosion yield may also be dependent upon energy, as shown in this plot, which combines space data with low energy thermal beam data. As one can see, there appears to be a yield with kinetic energy.
asher data and high energy ion very definite increase in the
1000
E o
3 E nj
L»RC HIGH ENERGY ION BEAD RF PLASMA ASHER AEROSPACE CORP. ATOMIC BEAN L«RC STS-fl FLIGHT RESULTS LeRC BIASED RF PLASMA LaRC/CWRU LOW ENERGY ION BEAK
228
ä

DEPENDENCE OF EROSION YIELD ON PRESENCE OF ATMOSPHERIC OXYGEN IONS
The dependence of erosion yield on whether or not oxygen is charged has been addressed by Gregory using carbon, and by Gull using osmium. Because the charge population of atomic oxygen is so low in low Earth orbit, one would not expect to see any measurable dependence. Although no effect was seen on STS-8, the question is very relevant with respect to simulation systems where either ions or neutrals may be chosen for low Earth orbital simulation.
No measureable effect on STS-8
LEO ionic oxygen population too low (/J.+'vl0~4) to measure a dependence 0
229

EFFECT OF ATOMIC OXYGEN ON TOTAL REFLECTANCE OF BACK ALUMINIZED KAPTON H (STS-8)
Polyimide Kapton H shows only a slight reduction in total reflectance as a result of atomic oxygen exposure. reneciance as a
1.0 I—
9 t(j
.2
.8 1.0 1.2 1.4
Wavelength, »m
1.6 2.0 2.2
230

EFFECT OF ATOMIC OXYGEN ON ABSORPTANCE OF BACK ALUMINIZED KAPTON H (STS-8, FLUENCE = 3.5 x 10²⁰ atoms/cm2)
Similarly, there is a slight increase in absorptance as a result of atomic oxygen exposure. Much of this may be due to the fine cone-like structures on the surface contributing to a slight reduction in reflectance and an increase in absorptance.
Surface for optical characterization
-0 1.2 1.4 1.6 1.8 2.0 2.2 Wavalsngth.^un
231
(♦)'

EFFECT OF ATOMIC OXYGEN ON DIFFUSE REFLECTANCE OF BACK ALUMINIZED KAPTON H (STS-8)
The dominant optical change for Kapton and all polymers is the optical conse- quence of the microscopic surface structures contributing substantially to the diffuse reflectance and subsequent reduction in specular reflectance. It is the increase in diffuse reflectance that makes all the polymer surfaces appear matte- like and diffuse with respect to transmittance as well as reflectance.
• ör-
Exposed sample — Unexposed sample
Wavelength, um
232
a

EFFECT OF LEO ATOMIC OXYGEN ON OPTICAL PROPERTIES OF MATERIALS
The changes in solar absorbtance and reflectance of various materials are listed in this table. As can be seen, the most significant changes occur for those materials which allow organic surfaces to be exposed to atomic oxygen. Thermal blanket materials such as aluminized Kapton or aluminized FEP Teflon display changes in solar absorptance and thermal emittance which would alter their performance as thermal blankets or radiator materials.
Change in Optic;! Properties due to A/O
Material Solar
Absorptance Emittance Reflectance
Kapton H (aluminized) 0.041 - -0.051
Urethane (black, conductive^ 0.042 0.55 - 2853, yellow -0.34 - Chemglaze Z302 (glossy, black) 0.011 - •0.01
Chemglaze A276 (white) -0.005 0.03 -0.039
Silicone RTV-670 -0.004 - 0.001
Silicone (black, conductive^ 0.0 -0.005 - GSFC (green) -0.002 - - Aluminum (ISO A) 0.0 0.0 0.0
S102 (650 A on Kapton H) 0.0 0.0 0.0
Silicone RTV-650+Ti02 0.001 -0.01 -
Aluminum (chromic acid oxidi zed) 0.0 0.0 0.0
AlMgF2 - - 0.0
Silicone S1023 -0.022 -0.02 - Chemglaze A276 (w/modifiers -0.006 to
0.016 0.02 -
Chromium (123 Ä") 0.0 0.0 0.0
d
*
i i
233
&

Material
AI2O3
SlUc te MS-74
Urethane inhib A-276
FEP Teflon with silver undercoat
Bostic 463-14
Indium Tin Oxide coated Kapton H Mith aluminized backing
Kapton with aluminized backing
Nickel
Polyurethane A-276
Silicone RTV-602/Z302
S13 - GIO
YB-71
Z306 (flat black)
Black, carbon-filled PTFE impregnated fiberglass (0.127 mm th;ck)
Aluminized Kapton, second surface mirror, uncoated (0.052 mm thick)
Aluminized FEP Teflon, second surface mirror (0.025 mm thick)
Siloxane coating, P.TV 602/ 0 on aluminized Kapton. second sur- face mirror substrate (0.008.mm thick coating) (0.052 mm thick Kapton)
Solar Absorptance Emittance Reflectance
0.0 - 0.0
0.01 0.0 -
0.3 0.01 -
0.006 0.0 -
0.01 0.0 -
0.006 0.004 -
0.048 0.018 -
0.005 0.0 -
0.023 0.01 -
-0.004 - -
-0.005 0.0 -
0.005 0.0 -
-0.022 0.0 -
-0.16 -0.05
-0.23
0.05
0.0
-0.59
-0.19
0.0
234

DIMENSIONAL CHANGES DUE TO ATOMIC OXYGEN REACTION
of «ASKS? "s t^Ji™?ir^ri?uü 0eitrt
rthe s-fa« - «« »* However, significant oxidation with H^'• ?ht ox1datlon can be tolerated, an oxide whfch expands and does no? ell? nZlr nVIn T C3USeS the fo™"™ of the case of silicone, the bombarded sSa«lendftn ?. ' u"reacted si^r. In loss of surface organic groups so that surfJfrnnJ ?™ SlllCOn dioxide with the Depending on the thickness of the silica ,mrtS? 10n a"d Crackin9 occ^- coating may become exposed ?o atomic oxyjen U"derly1n9 or*™ic Serial below the
•Silver + 0 - Silver Oxide (expansion spelling)
•Silicone + 0 -+ surface Oxidation (contraction + cracking)
235

ATOMIC OXYGEN UNDERCUTTING - STS-8
Atomic oxygen undercutting has been observed in samples on STS-8 as shown in this scale drawing of a cross section of a defect which was initially on the sur- face prior to atomic oxygen exposure in space. The wide undercutting could be a problem depending on the population density of surface defects, whether caused by fabrication procedures, handling, micrometeoroids, or debris.
Atomic Oxygen Fluence
atoms/cm2
AUQ, (700 A) m NW«MBl
Kapton H (0.127 mm
PREFLIGHT
3.5 X 10²⁰
( , POSTFLIGHT
0.1 mm
236
£

JP
Measurement for defects in thin film protective coatings over polyimide Kapton have disclosed approximately 22,000 atomic oxygen transparent defects per square centimeter. If undercutting occurs without end, bulk failure of tensile-loaded polymeric blankets would eventually occur. However, as can be seen in this plot, in simulation tests performed in laboratory plasma ashers, undercutting tends to terminate. Thus, the survivability of atomic oxygen protective coatings may per- haps more depend on defect density than the fluence.
<{
ATOMIC OXYGEN UNDERCUTTING OF DEFECTS
40-
Z o a. <j I <o 3 a < e a z
50 100
TIME IN PLASMA (HRS)
237
l"**

/.fr- -■■-■*-"^f*^|
PROTECTIVE COATING FAILURE MODE
llillllliSliliP
Duration of Atomic Oxygen Exposure
t = 0
Side View Front View
«a <»ii )
238
(3

SUMMARY ■
at a ver^eKntarflevl.^Lever^surel'nf V^'' ,nteräctio" ,s «"««* phology, and optical pZ%k\"Tfor)ZfZT^\° VS,°? y1e,ds- surfa« "»>•- in the past decade Understlnrtinnthf fl"e"«s have brought about much progress iTrta„Pt for ro p^r S ' £ "r h^tls ST,"??" th?t =re
understanding. The abilitv tn u» bh««! • , s-at a mch lower leve1 of tifiably address the function^! nfJ^t0ry VmUtions with confidence to quan- Earth orbit w? be nee slrV toZlurT^t^ durabim* <* materials in lo2 space environment. neCSoSary to assure long-term survmbility to the natural
239

Alt
3SÄ

)
N89-23541 ATOMIC OXYGEN EFFECTS ON SPACECRAFT MATERIALS
THE STATE OF THE ART OF OUR KNOWLEDGE
Steven L. Koontz NASA Lyndon B. Johnson Space Center
Houston, Texas
PRECEDING PAGE BLANK NOT FILMED 241

SPACE EXPOSURE DATA BASE - ATOMIC OXYGEN EFFECTS ON SPACECRAFT MATERIALS
THREE SPACE SHUTTLE FLIGHT EXPERIMENTS ONE RECOVERED SATELLITE
X: ■)
M
Flight Altitude (Inclin.) Exposure Ti lme Fluence* (Attitude)
STS - 5 222 km(28.5°) 44 hours 1 x 10²⁰(VAR)
STS - 8 222 KM(28.5°) ' 41.75 hours 3.5 x 10²⁰(RAM)
STS - 41G 225 km(57°) 38 hours 3 x 10²⁰(RAM)
SMRM 574 - 491 km 50 months 2 x 10²¹(VAR)
* Fluence is in atoms/cm2
• Detailed descriptions of the flight experiments can be found in References 1 through 21.
242

SHUTTLE FLIGHT EXPERIMENT ATOMIC OXYGEN EFFECTS DATA BASE
About 300 different materials have been evaluated and several mechanism studies have been conducted during STS-5, STS-8, and STS-U1G.
Atomic Oxygen Effects were determined by post flight measurements on returned samples; no real time rate data was obtained; only limited variable exposure time data is available.
Reaction efficiency obtained from flight experiment data provides a measure of material susceptibility to atomic oxygen attack.
• Reactivity is expressed as the volume or mass of material lost per incident oxygen atom.
• If the atom fluence is known for a future mission, then surface recession or mass loss can be estimated.
RECESSION = FLUENCE * REACTIVITY
Atomic oxygen effects data obtained from Space Shuttle flight experiments can be found in References 1 through 20. Oxidation reactions, not sputtering, are responsible for reactivity.
• Polymeric materials containing C-H bonds, diamond and graphite have reactivities on. the order of 10-24 cm3/atom.
• Of the metals, only silver and osmium are rapidly attacKed by formation of volatile reaction products or surface oxides layers which spall (peel off) readily.
• Silicones and teflon appear inert.
• Silicones react to form a protective surface oxide laver (Si02).
• Teflons (pure fluorocarbons) shov/ very low reactivities; The C-F and C-C bonds in these materials appear inert.
Surface temperature can influence reactivity.
Organic materials show a characteristic surface damage morphology.
243
u
i

REACTION EFFICIENCIES OF SELECTED MATERIALS WITH ATOMIC OXYGEN IN LOW EARTH ORBIT
MATERIAL REACTION EFFICIENCY,
cm3/ATOM MATERIAL REACTION EFFICIENCY,
cm3/ATOM
KAPTON 3 x 10⁻²" SI LI CONES MYLAR 3.1 RTV-560 0.2» TEDLAR 3.2 DC6-1104 0.2» POLYETHYLENE 3.7 T-650 0.2» POLYSULFONE 2.4 DC 1-2577 0.2» GRAPHITE/EPOXY BLACK PAINT Z306 0.3-0.1» 1031C 2.1 WHITE PAINT A276 0.3-O.H» 5208/T300 2.6 BLACK PAINT Z302 2.03» EPOXY 1.7 . PERFLUORINATED POLYMERS POLYSTYRENE 1.7 TEFLON, TFE <0.05 POLYBENZ IMIDAZOLE 1.5 TEFLON, FEP <0.05 25? POLYSILOXANE/115* POLYIMIDE 0.3 CARBON (VARIOUS FORMS) 0.9-'.7 POLYESTER 7? POLYSILANE/93? POLYIMIDE 0.6 S'LVER (VARIOUS FORMS) HEAVILY ATTACKED POLYESTER HEAVILY ATTACKED OSMIUM 0.0?6 POLYESTER WITH ANTIOXIDANT HEAVILY ATTACKED
•UNITS OF mg/cn.2 FOR STS-8 MISSION. LOSS IS ASSUMED TO OCCUR IN EARLY PART OF EXPOSURE; THEREFORE, NO ASSESSMENT OF EFFICIENCY CAN BE MADE.
244

SURFACE DAMAGE MORPHOLOGY FROM LEO EXPOSURE
("carS »«SSM materials devel°P a characteristic surface damage morphology Fluenof^r f I ^ when.exP°sed *<> atomic oxygen ram flux in low Ear?h orbit.
I\ not sell toeaffectntShS " ^ T^" °f the CarPet have be- observed b^ ao not seem to affect the reactivity of the material. At high fluence the decth of the carpet is much less than the loss in thickness of the Serial!' "
COMPARISONS OF STS-8 KAPTON SPECIMENS (12 7 urn) BEFORE AND AFTER ATOMIC OXYGEN EXPOSURE
NORMAL IMPINGEMENT
UNEXPOSED. SEM: 10 000X EXPOSED. SEM. 10 000X
ORIGINAL PAGE BLACK AND WHITE PHOTOGRAPH
245

i ( LIMITATIONS OF CURRENT SPACE SHUTTLE FLIGHT EXPERIMENT DATA BASE
• Atom fluences were not measured during flight but calculated using the MSIS model of the thermosphere (Ref. 19); it follows that model errors
f are included in the flight experiment data base.
• The data base provides only limited basis for understanding the kinetics and mechanism of hyperthermal atom - surface reactions.
V • Reaction efficiencies have been obtained at low fluence.
• STS flights: 1019 to 1020 atoms/cm2 in about 40 hours at 222 to 225 km altitude
• Space Station: 1022 to 1023 atoms/cm2 in 30 years (2.6 x 10⁵ hours at 340 to 475 km altitude)
• The data base provides only a limited basis for evaluating effects of other space environment factors on oxygen reactivity.
• Solar ultraviolet (UV) radiation (especially Lyman alpha at 121.6 nmi) and high energy charged particles should influence the magnitude of atomic oxygen effects in some materials through photochemical and radiochemical mechanisms.
• At 222 km altitude, the high atomic oxygen flux may wash out synergistic effects.
• Synergistic effects cannot be evaluated with the available data base.
• No data is available in the polar orbit environment.
• The validity of extrapolation to high fluence conditions or radically different orbital environments is unknown at this time.
• Components of the Solar Maximum Satellite (altitude 574 to 491 km, inclin. 28.5°) recovered in April 1984 showed surface recession in crude agreement with predictions made using the data base. Teflon appeared to be more reactive than
/ anticipated; kapton reactivity was in agreement with data / base (Ref. 20).
246
#

V H
LABORATORY SIMULATION AND MODELING OF ATOMIC OXYGEN EFFECTS ON SPACECRAFT MATERIALS
Ground based simulation and test systems are needed to support (1) interpretation and understanding of environmental effects and (2) development and flight qualification of long life spacecraft materials and components.
A complete understanding of the kinetics and mechanism of hyperthermal atom surface reactions does not exist. Without the understanding produced by laboratory simulation and modeling studies, we cannot develop accelerated test methods with high confidence, and we cannot understand synergistic effects.
An ideal laboratory test and simulation system would provide a pure, well collimated beam of neutral oxygen atoms with a kinetic energy of 5 eV (8km/sec) and an atom flux greater than 1011 atoms/cm2*sec. No such system exists at this time.
• Nearly all the neutral atom test methods under development fall into one of four categories.
1. Thermal atom sources: Oxygen atoms are produced in radio frequency (RF) or microwave discharges to produce high oxygen concentrations at thermal or near thermal energies.
2. Plasma torch, atomic beam sources: Oxygen atoms are generated in a high temperature plasma; then, free jet or supersonic expansion converts sensible heat to velocity: Atom energies of 1 to 2 eV (possibly 4 eV) have been achieved.
3. Ion beam methods: Positive or negative atomic ion beams are produced, accelerated, and focused to proper velocity, then neutralized to give a nominal 5 eV oxygen atom beam.
4. Laser sustained plasma, atomic beam sources: Lasers are used to produce high temperature/high pressure plasmas which expand as free jets or supersonic beams. Atom kinetic energies of 1 to 12 eV have been reported with atom fluxes of 1015 to 1018 atoms/cm2»sec.
247

f4
BEAM SOURCES UNDER DEVELOPMENT
Type Location, PI Species Energy
Ion beam LeRC, Furgeson 0+(02) 0 - 50 eV
Ion beam JPL, Chutjian Boing, Rempt
0 5 e.V
Ion beam MSFC, Carruth Martin(Denver)
0+ 5 eV
Ion beam Vanderbilt, Tolk 0+ 100 eV
Ion beam G.E., Amore 0+/02+ 3 - 10 eV
Ion beam LeRC, Banks 0+,0,02 3 - 15 eV
Ion beam Princeton U. G,02,N,N2 10 eV
Ion beam Aerospace, Mahadaven 0,02,N,N2 3 - 100 eV
ESD LaRC, Outlaw 0 5 eV
All the above sources produce fluxes of less than 10^ atoms/cm2*sec at 5 eV. Those below produce greater fluxes.
Plasma torch, atom beam
UTIAS, Tennyson 0,02)He 1 - 4 eV
ECMD, atom beam
Aerospace, Arnold 0,02>He 0.2 eV
Plasma torch, atom beam
ARI, Freeman 0,02,He 1.3 eV
Laser Disch. atom beam
PSI, Caledonia 0,02 2 - 14 eV
Laser Disch. LANL, Cross 0,02,He 1 - 5 eV atom beam
Laser Disch. JPL, Brinza 0 2 - 7 eV atom beam
248
©

•
•
LABORATORY SIMULATION AND TEST SYSTEM EVALUATION
The following data are necessary for a nomp'.ate evaluation of the test system:
• Direct measurement of atom flux and velocity
• Direct measurement of beam purity
• Reaction efficiency measurements on materials in the flight experiment data base
• Reaction efficiency measurements on the LeRC "round robin" materials set
No ideal, completely characterized system exists; however, the laser sustained plasma, atomic beam systems offer the best approximations.
• Los Alamos National Laboratory (Ref. 21)
• Continuous beam (CW laser sustained discharge)
• 1.5 to 5 eV 0 atoms; 1015 to 1017 atoms/cm2»sec
• Beam purity varies; in situ diagnostics measure 02, inert gas and UV radiation content; ions and electrons and 0 atom excited states are negligible.
• Kapton reactivity and surface damage morphology are in reasonable agreement with the flight data base.
• Teflon appears more reactive than in flight.
• Physical Sciences Incorporated (Ref. 22)
• Pulsed beam (Pulsed laser sustained discharge)
• 2 to 14 eV 0 atoms; 1015 to 1017 atoms/cm2»Sec (instantaneous fluxes much higher, about 1021)
• Beam purity measured with in situ diagnostics; 98£ 0 atoms negligible UV, ions, electrons, and 02; 0 atom excited states negligible
• Kapton and teflon reactivities and surface damage morphology in reasonable agreement with flight data base
249
1 1
■r
»

SURFACE DAMAGE MORPHOLOGY FROM LAJTL BEAM
Samples of organic materials exposed to the atomic oxygen beam at Los Alamos National Laboratory (LANL) develop carpet morphology similar to that developed in low Earth orbit. As the three SEM images shown below demonstrate, the appearance
TO, «tZVe, ,depend!non the, fluence- **°* top to bottom these samples experienced
7.2 x 10¹⁹, i.k x 1020, and i^o x 1020 atoms/cm2. The atom flux was 8 x 1&-5 atoms/cm sec with a nominal atom kinetic energy of 1.5 eV.
esifv-xaiae?" tflu I?»*5
250
ORIGINAL PAGE BLACK A.ND WHITE PHOTOGRAPH
£

SUMMARY
• In flight materials exposure data base
• Extensive quantitative data is available from limited exposures in a narrow range of orbital environments.
• More data is needed in a wider range of environments as well as longer exposure times.
• Synergistic effects with other environmental factors
• Polar orbit and higher altitude environments
• Real time materials degradation data is needed to understand degradation kinetics and mechanism
• Laboratory simulation and modeling
• ?l™°st no lab°ratory data from high fidelity simulations of the LEO environment; simulation and test system under development- data base scanty
e
•
Theoretical understanding of hyperthermal atom surface reactions in the LEO environment not good enough to support development of reliable accelerated test methods
The laser sustained discharge, atom beam sources are the most promising high fidelity simulation-test systems at this time
251
F

REFERENCES
1. Leger, L.J. Oxygen Atom Reaction With Shuttle Materials at Orbital Altitudes, Nasa TM-58246, May 1982.
2. Leger, L.J. Visentine, J.T., and Schliesing, J.A., A Consideration of Atomic Oxygen Interaction with Space Station, AIAA Paper 85-0476, AIAA 23rd Aerospace Sciences Meeting, Reno, Nevada, January 14-17, 1985.
3. Leger, L.J., et al., STS Flight 5 LEO Effects Experiment - Background Description and Thin Film Results, AIAA Paper 83-2631, AIAA Shuttle Environment and Operations Meeting, Washington, DC, October-November 1983.
4. Whitaker, A.F., et al., LEO Oxygen Effects on Spacecraft Materials, AIAA Paper 83-2632, AIAA Shuttle Environment and Operations Meeting, Washington, DC, October-November 1983.
5. Park, J.J., et al., Effects of Atomic Oxygen on Paint and Optical Coatings, AIAA Paper 83-2634, AIAA Shuttle Environment and Operations Meeting, Washington, DC, October-November 1983.
6. Zinner, E., et al., Erosion of Mylar and Protection by Thin Metal Films, AIAA Paper 83-2636, AIAA Shuttle Environment and Operations Meeting, Washington, DC, October-November 1983.
7. Liang, R. and Gupta, A., Mechanistic Studies of Kapton Degradation in Shuttle Environments, AIAA Paper 83-2656, AIAA Shuttle Environment and Operations Meeting, Washington, DC, October-November 1983.
8. Visentine, J. T., et al., STS-8 Atomic Oxygen Effects Experiment, AIAA Paper 85-0415, AIAA 23rd Aerospace Sciences Meeting, Reno, Nevada, •January 14-17, 1985.
9. Whitaker, A.F., Orbital Atomic Oxygen Effects on Thermal Control and Optical Materials STS-8 Results, AIAA Paper 85-0416, AIAA 23rd Aerospace Sciences Meeting, Reno, Nevada January 14-17, 1985.
10. Banks, B.A., et al., Ion Beam Sputter-Deposited Thin Film Coatings for Protection of Spacecraft Polymers in Low Earth Orbit, AIAA Paper 85- 0420, AIAA 23rd Aerospace Sciences Meeting, Reno, Nevada January 14- 17, 1985.
11. Liang, R.H., and Gupta, A., Mechanistic Studies of Interaction of Materials With Energetic Oxygen Atoms in Low Earth Orbit, AIAA Paper 85-0422, AIAA 23rd Aerospace Sciences Meeting, Reno, Nevada January 14-17, 1985.
12. Gull, T.R., et al., Effects of Optical Surfaces at Shuttle Altitudes, AIAA Paper 85-0418, AIAA 23rd Aerospace Sciences Meeting, Reno, Nevada January 14-17, 1985.
252

13. Gregory, J.C. and Peters, P.N., Measurement of Reaction Rates and } i Activitation Energies of 5 eV Oxygen Atoms With Graphite and Other Solid Surfaces, AIAA Paper 85-0417, AIAA 23rd Aerospace Sciences Meeting, Reno, Nevada, January 14-17, 1985.
14. Smith, K., Evaluation of Oxygen Interaction with Materials (EOIM) - STS-8 Atomic Oxygen Effects, AIAA Paper 85-7021, AIAA Shuttle Environment and Operations II Conference, Houston, Texas, November 1985.
15. Whitaker, Ä.F., et al., Protective Coatings for Atomic Oxygen Susceptible Spacecraft Materials - STS41-G Results, AIAA Paper 85- 7017, AIAA Shuttle Environment and Operations II Conference, Houston, Texas, November 1985.
16. Frcmr.old, A.T., et al., Reaction of Metals in Lower Earth Orbit During Space Shuttle Flight 41-G, AIAA Paper 85-7018, AIAA Shuttle Environment and Operations II Conference, Houston, Texas, November 1985.
17. Zimcik, D.G. and Maag, C.R., Results of Apparent Atomic Oxygen Reactions With Spacecraft Materials During Shuttle Flight 3TS41-G, AIAA Paper 85-7020, AIAA Shuttle Environment and Operations II Conference, Houston, Texas, November 1985.
18. Peters, P.N., Gregory, J.C., and Swann, J.T., Effects on Optical Systems From Interactions With Oxygen Atoms in Low Earth Orbits, Applied Optics, Vol. 25, No. 8, April 15, 1986.
19. Visentine, J.T. and Leger, L.J., Material Interactions With the Low Earth Orbital Environment: Accurate Reaction Rate Measurements, AIAA Paper 85-7019, AIAA Shuttle Environment and Operations II Conference, Houston, Texas, November 1983.
20. Proceedings of the SMRM Degradation Study Workshop. The Satellite Servicing Project, Goddard Space Flight Center 408-ShRM-79-0001, May 9-10, 1985.
21. Visentine, J.T. and Leger, L.J., Atomic Oxygen Effects Experiments: Current Status and Future Directions, NASA TM, JSC, May 18, 1987.
22. Caledonia, G.E., Krech, R.H., and Green, B.D., A High Flux Source of Energetic Oxygen Atoms for Material Degradation Studies, AIAA J. 25, 59 (1987); also Caledonia, G.E., and Krech, R.H., Energetic Oxygen Atom Material Degradation Studies, AIAA-87-0105, 25th Aerospace Sciences Meeting, Reno, Nevada, January 1987.
■ J
253

i
SESSION 4: MICROMETEOROIDS AND DEBRIS
Chairman: Andrew Potter NASA Lyndon B. Johnson Space Center
PRECEDING PAGE DLANK NOT FILMED
255
■HMJIFI:« —'. I*)


N8 9- 23 542 ^ THE LONG-TERM EFFECTS OF THE MICROMETEOROID AND ORBITAL
DEBRIS ENVIRONMENTS ON MATERIALS USED IN SPACE
Burton G. Cour-Palais NASA Lyndon B. Johnson Space Center
Houston, Texas
^ * PRECEDING PAGE BLANK NOT FILMED
257
■V-JäT—
o
1 ,

Introduction
The purpose of this report is to discuss the long-term effects of the orbital debris and micrometeoroid enviroments on materials that are current candidates for use on space vehicles. In addition, the limits of laboratory testing to determine these effects are defined and the need for space-based data is delineated. The impact effects discussed are divided into primary and secondary surfaces. Primary surfaces are those that are subject to erosion, pitting, the degradation and delamination of optical coatings, perforation of atomic oxygen erosion barriers, vapor coating of optics and the production of secondary ejecta particles. Secondary surfaces are those that are affected by the result of the perforation of primary surfaces, for example, vapor deposition on electronic components and other sensitive equipment, and the production of fragments with damage potential to internal pressurized elements. The report defines the material properties and applications that are required to prevent or lesser the effects described.
258
m.

7 4
(
Encounter Dynamics and Typical D-image
In dealing with the long-term effects of the micrometeoroid and orbital debris enyiroments on materials used in space, we have to know something about these solid particles that pack so much energy. Kessler, (Reference 1), presented a detailed look at these enviroments, but let us look at what an encounter with a micrometeoroid or an orbital debris particle means.
Micrometeoroids, as most of you know, can have Earth encounter velocities of 11 to 73 km/sec. However, the most probable encounter velocity for a spacecraft in Earth orbit is about 17 km/sec. For modeling Purposes, the^ meteoroid cumulative flux-mass curve given for NASA use (SP 8013) is tied to an average velocity of 20 km/sec. Similarly, the average mass density ot meteoroids given by the same model is 0.5 gm/cc. The flux of these particles is altitude dependent, and they are omni-directional.
Orbital debris particles by definition, have a relative encounter velocity of 0 to 16km/sec for a spacecraft in Earth orbit. In fact, there is a velocity distribution and the average encounter velocity is 11 km/sec. Most orbital debris particles are postulated to be aluminum fragments from explosions in space, and therefore have a mass density of 2.8 gm/cc. What do these velocities and mass densities mean for the surface of an object in space that encounters a micrometeoroid or an orbital debris particle? First, these particulates are very energetic. The specific kinetic energy for a micrometeoroid at 20km/sec is 2 x 10⁵ joules/gm, and for orbital debris at km/sec 6 x 10⁴. So micrometeoroids are several times more energetic than orbital debris particles, but we must also be concerned with the relative number of particles of each that are encountered.
Table 1 lists the number of micrometeoroids and orbital debris particles encountered per square meter of surface area in 10 years. For the particle sizes of interest in this study, the fluxes of the two enviroments cross over to make one or the other dominant. However, we are concerned with the total,
number of impacts.
10
Table 1
NUMBER OF MICROMETEOROIDS AND ORBITAL DEBRIS PARTICLES ENCOUNTERED IN 10 YEARS (1996 - 2005)
DIAMETER (cm)
0.001
0.01
0.10
ORBITAL DEBRIS (number/sq.meter)
385-475km
5100
16
0.051
800km
12000
37
0.120
MICROMETEOROIDS (number/sq.meter)
385-475km
■ 2400
49
0.019
800km
2600
53
259

;V
Secondly, a characteristic of an encounter with these particles is the very high impact pressures and shocks associated with them. For a micrometeoroid the average impact pressure is 2.5 megabars and for the orbital debris 1 9* megabars, a megabar being equal to 14.5 x 10⁶ psi. Figure 1 shows a graphical means of determining the initial impact pressure as a function of the particle or shocked material velocity. The intersections of the left-running projectile curves and the right-running target curves denote the impact pressure Three aluminum projectiles are shown at 8, 12 and 16 km/sec, and the target materials are graphite-epoxy, aluminum and a ceramic.
• /
Initia! Shock Pressure Effect of Shield Material Density
D Aluminum O Fiberglass O Ceramic V Aluminum projectile, V = 8 Km/S O Aluminum projectile, V = 12 Km/S A Aluminum projectile, V = 16 Km/S
6 8 10
Particle velocity, Up (km/sec)
Graphical Solution for the Initial Impact Pressure.
Figure 1
260

These very high pressures decay rapidly but remain well above the material strength so that the elements close to the impact point flow like a liquid In addition, the impact process of instantaneous compression followed by slower release of pressure causes the projectile and target material to be locally heated due to an increase of entropy. The temperatures generated are always high enough to melt the materials in contact, and quite often to vaporize them. Table 2 shows some metallic materials of interest with their melting and vaporization temperatures, and the impact pressures and velocities required to achieve these states, (Reference 2).
\ v. -/ /
Table 2
IMPACT SHOCK HEATING
MATERIAL TEMPERATURE INCIP. MELT COMP. MELT INCIP. VAPOR Melt0C Vap0C Mbar Km/s Mbar Km/s Mbar Km/s
Aluminum 660 2057 0.65 5.6 0.90 6.6 1.67 10.2
Cadmium 321 767 0.40 3.0 0.60 3.9 0.88 5.2
Steel 1535 3000 1.80 7.9 2.10 8.8 »9
Lead 327 1620 0.30 2.0 0.35 2.6 0.90 4.8
Titanium 1800 >3000 1.30 7.6 »8
> 261

/
Figure 2 shows a cross-section of a laboratory impact crater formed in an aluminum 1100-0 alloy plate by a 45 milligram aluminum projectile at just over 6 km/sec. The near hemispherical shape and raised lip is characterisic of a hydrodynamic impact crater. In this case, the impact shock pressure is 0.8 megabars, and from Table 2 one would expect the material to have been melted. Another feature illustrated in Figure 2 is the near spallation of the rear surface. A thin segment of the aluminum plate has separated due to the tensile stress induced by the shock after reflection. The rarefaction or release stress wave reflected off the rear surface was still high enough to cause this alloy to fail in tension. Incidentally, the specific KE was about 2 x 10⁴ joule/gm.
*^:-^fmm^\
ft *V '^^YvfnkV'fl^
-■;* "\ ts *? - ■-• .,** täi'i -*t ■*>< «■>:'*€& AS
m
i(
26*
Hypervelocity Impact Cross-section: 1100-F Aluminum Alloy Plate.
Figure 2
ORIGINAL PAGE BUCK AND WHITE PHOTOGRAPH
D'

In Figure 3, we see a cross-section of an impact into laminated aluminum plates held together mechanically. It is a useful illustration of the impact forces that cause the problems seen in hypervelocity encounters with the first surface of a spacecraft. We see delamination of the upper layers, peeling under the influence of shearing forces at edges of the crater, shock compression in the layers and the rebound of a significant proportion of the target.
ORIGINAL" PAGE BLACK AND WHITE PHOTOGRAPH
Side View Sectioned Hypervelocity Impact into an Aluminum Alloy Laminate
Figure 3
263

In Figure 4, the top view, we see the splitting of the material in the process of peeling back of the upper layers" These^wo views are important in understanding the basic processes taking place in delamination and ejecSon of surface materials such as coatings and atomic oxygen barriers, etc j examples of which will be shown shortly. This impact occurred at 7 km/sec us g
2 5 x Jo^uWgm PaCt PreSSUre W3S °Ver X mCgabar and the «P5clf£ 5.
tmmmmmmmmm
-. :V: -*' 1A i.'i:'-.^:
IMPF
■/
Top View of Figure 3.
Figure 4
ORIGINAL PAGE BLACK AND WHITE PHOTOGRAPH

The target described previously is a reasonable analogue of the front surface of a glass or similar brittle material that has been impacted by a hypervelocity projectile. In this aluminum target there is a residual crater as is usually seen in glass targets, (Figure 5) and there are two levels of ejected spall rings, also seen in the glass target. Also the deeper layer of the aluminum stack separated from the main body is analogous to the sub-surface fracture zone present in most glass targets at laboratory impact velocities. The glass target was impacted by a 0.16 cm glass (2.3 gm/cc) projectile at 7.3 km/sec. This is approximately the same impact pressure as for the aluminum laminated target.
This completes our quick look at the dynamic characteristics of hypervelocity impacts and some of the typical effects on the spacecraft first surface.
ORIGINAL PAGE BLACK AND WHITE PHOTOGRAPH
Damage to a 2 cm thick Glass Target by a 0.15 cm Projectile at 7.3 km/sec.
Figure 5
265
s

Long-term Damage Effects
Let us now discuss the long-term effects of the micrometeoroid and orbital debris environments on typical materials used in space. Impact effects will be divided into those that could cause a problem to the first or outer surface of a spacecraft, and those that can also affect the surface or region behind it.
First surfaces are primarily affected by the smaller particles in both environments, and Table 3 lists the penetration depths and diameters that can be expected for orbital debris in aluminum and glass. The equations used were developed during the Apollo program, (Reference 3), and the spall diameters are consistent rfith the target shown in Figure 5. For typical large spacecraft that have aluminum first surface thicknesses of 0.16 to 0.25 «^ as bumper shields, particles under 1 mm would not penetrate.
PENETRATION DEP1HS AND CRATER DIAMETERS IN ALUMINUM AND GLASS SURFACES.
MATERIAL PROJECTILE CRATER INNER SPALL OUTER SPALL CRATER DIAMETER DEPTH DIAMETER DIAMETER DIAMETER
(cm) (cm) (cm) (cm) (cm)
Aluminum 0.001 0.0017 0.0034 (2024T3)
0.010 0.0194 0.0390
0.100 0.2210 0.4420
Aluminum 0.001 0.0025 0.0050 (1100-F)
0.010 0.0287 0.0570
0.100 0.3271 0.6540
Glass 0.001 0.0012 0.012 0.024 (7940)
0.010 0.0138 0.138 0.276
0.100 0.3615 3.620 7.230
266
Table 3
^

The types of impact problems to be expected on first, or for that matter any single surface such as solar panel or radiator paddles, are discussed next.
Erosion, pitting and degradation of optical transmissibility as shown in Figure 6. This impact damage resulted from a 0.4 mm glass projectile (2.3 gm/cc) at 7.4 km/sec. The shock damage diameter is 7 mm which gives an obscured diameter of about 0.4 sq.cm. Although there would only be between 2 and 3 impacts of this size per square meter in ten years for the combined environments, the summation of the crater areas for this size and all smaller sizes could present a problem.
^&*&ft&
1 '"y^y***
*>.#.y»^W» **WV/*
Impact Damage Area caused by a 0.04 cm Projectile at 7.4 km/sec.
Figure 6
]
\
ORIGINAL PAGE BLACK AND WHITE PHOTOGRAPH
267
3

Ejection of mirror surfaces and optical coatings by impact spallation is shown in Figure 7. The particular target shown resulted from a double impact of 0.17 mm tungsten-carbide projectiles at over 6 km/sec and it is illustrative of the effect of impacts on mirrored surfaces. The actual damage areas will be similar to the values quoted for pitting discussed previously.
Impact Damage to a Mirrored Gla:;s Surface by Hypervelocity Impact.
Figure 7
268 ORIGINAL PAGE
BLACK AND WHITE PHOTOGRAPH
*JL

Delaminatlon of composite materials by shock effects. Figures 8a (entry) and 8D (exit) show the results of a 2.4 mm aluminum proje^H« i-P"ting a tr^hite-eDOXv tube at 7.48 km/sec. The entry side breaks up the projectile
u a he impact of the debris plume causes the extensive damage en on the exit side. This size of impact has a 70% chance of occurring at
least once in 10 years for a tubular structure area the size of the Phase 1
Space Station Freedom.
vtf&^X^I'y"^? «i#f6fÄ?ff
- ■■:■:■■■■■ ■';.^t<:'.
£**
Graphite-Epoxy Tubular Strut: Hypervelocity Impact Entry.
Figure 8a ORIGfNA' P^E
BLACK AND WHifc .-.,_.;%RAPt{
v
I Graphite-Epoxy Tubular Strut: Hypervelocity Impact Exit.
Figure 8b
ORiGINAL PArtE ELACK AND WHITE. PHOTOOPAPH
269
3

Perforation and peeline of barrier i =,r^„ J _ to atomic oxygen erosion. These illalt Ifflll u Pr°t6Ct materials subject smaller one is the result n i * *" Sh0Wn in Fi^ure 9- The
and the larger one is due to a llnT f pr°JeCtile imPact « 4.7 Ion/sec, barrier layfr was a ..O^thi k'all^^o^/S^^j^ «5 6 •7 W-ec. The modulus tube. Orbital debris OWMT. ^-T3 bonded sleeve on a 35 x 10* expected to impact the 1 ^valent to these sizes can be 10 year period ^ Statl°n Freedora several times in a
P*T^KP
^
Wiffri'&rfr
*> 0' -4; :/L?':;^^^2^&a;Ä SPfli^^amsSÄ *■...*.-.. - .... .-
Aluminum-coated Graphite-Epoxy Strut: Impact Damage to Coating.
Figure 9
270 ORIGINAL PAGE BLACK AND WHITE PHOTOGRAPH
i

Flammability, vapor deposition and toxicity. Figure 10 is a view of a space-suit element with the outer thermal barrier material folded back to reveal the large hole in the aluminized mylar insulation layer, the hole and blackening of a kapton felt layer and the delamination of a fiberglass laminate. The projectile in this test was a 1.75 mm nylon projectile that impacted at 8.6 km/sec.
i
I NYLON PROJECTILE (L/D « 0.5) DIAMETER: 1.75 m
i DENSITY: l.H gm/cc ! VELOCITY: 8.6 km/sec
Space-suit Element showing Damage to Materials in the Layup.
Figure 10
ORIGINAL PAGE BLACK AND WHITE PHOTOGRAPH
271
SH ggggs"-

Impacts, molten splatter and vapor deposition result from an impact on a first surface. Oblique impacts are the norm and there will be ejecta from tha impact site that will affect other spacecraft components or sensors in the line of flight. Figure 11 is an illustration of secondary impacts on solar cell elements bonded to an aluminum L-section. The damage to the cells is extensive, and the magnification factor for brittle materials can be seen by comparison with the impacts on the aluminum substrate. One impact by a micrometeoroid or an orbital debris particle can result in thousands of secondary impacts on another surface in the way.
f!
M-ir.Ai.V-".'
S*
uri
.».,..--#.»•/■.■»
Effect of Impact Ejecta on Solar-cell Bonded to Aluminum Substrate.
Figure 11
272 ORIGINAL PAGE BLAQK AND WHITE PHOTOGRAPH
»*-t» ^m^.

Second or subsequent surfaces are those that are exposed to the results of perforation of the first surface. The high-speed photograph, Figure 12, from Reference 4. It shows a projectile debris plume generated by an impact on the first sheet of a dual -sheet target and illustrates how the second sheet and the void between can be affected. The plume can be a vapor, molten droplets or even solid fragments. Generally, the second surface is the component that is being protected, but in some instances it could be vulnerable system components.
I
/
FLIGHT D
3.18mm Cd SPHERE IMPACTING AT 6.43 km/sec 1.22mm Cd SHIELD 5.08cm SPACING 7usec AFTER IMPACT
Flash X-Ray ShnwiHi; Effect of Oblique Impact
Oblique Impact in Two-sheet Target showing Debris Plume.
Figure 12
ORIGINAL PAGE PLACK AND WHITE PHOTOGRAPH
273

Some of the effects of impacts by micrometeoroids or orbital debris particles are as follows:
a. Shield and projectile fragment damage to pressure vessels, wire bundles and sensitive electronic packages.
In Figure 13, a wire cable has been impacted by a large fragment from a debris plume resulting in significant damage.
/
f ^^^S^^:-^^i^»^^mm0^S^S»
£«ö*= y^0^iMi
/" NYLON PROJECTILE (L/D DIAHETER: 1.75 nw DENSITY: 1,14 gm/cc VELOCITY: 5 km/sec
.- X) /.
Electrical Cable Impacted by a Hypervelocity Projectile.
Figure 13
ORIGINAL PAGE BLACK AND WHITE PHOTOGRAPH
274

b. Molten droplet and vapor deposition on electronic components could cause shorts.
Examples of these can be seen in the next three figures. Figure 14 shows vapor deposited on the rear surface of the first sheet. A molten aluminium droplet adhering to an aluminum second sheet surface is shown in Figure 15. In Figure 16, a molten aluminum splash and vapor deposit is shown coating a copper second sheet surface.
ORIGINAL PAGE BLACK AND WHITE PHOTOGRAPH
Rear View of First Sheet Impacted showing Vapor Deposited.
Figure 14
275
)'

f^^lfS^^^f''-tTi9*'}'9l&:^' WfSQf*® • (
^S*b« »%f»"
Molten Aluminum Droplet on Aluminum Second Sheet Surface.
Figure 15
tttfftigspiff*; 7^3*$"F£?7'??rf-'
276
Molten Aluminum Splash and Vapor Deposit on Copper Second Sheet Surface.
Figure 16
ORIGINAL PAGE BLACK AND WHITE PHOTOGRAPH
'tGL

i
c Destruction of a large area of multi-layer thermal insulation (MLI) : y barriers often placed in the void behind the first surface to protect the
second surface.
This effect can be seen in Figure 10, where the aluminized MLI is part of
the thermal protection in a space suit.
d. Thermal effects such as burning, charring and toxic by-products.
These effects are also visible in Figure 10.
277
3

Material Properties and Practices for Space Durability
The information presented above should lead to a better understanding of how some of the material properties and environmental shielding practices can be improved upon or avoided for long-term space applications. However, the following list of avoidable materials is offered as a starting point:
a). Brittle materials such as glass for mirrors and uncovered windows or lenses, and monolithic ceramic shields. Tough, transparent, optically acceptable synthetic materials respond very well to laboratory hypervelocity impacts.
b). Deposited optical coatings will be easily delaminated and ejected over an area 20 to 30 times the size of the impacting particle. The use of tinting in conjunction with the suggested materials in (a) above would be a solution.
c). Laminated materials can be used provided that impact-caused delaminations do not present a problem. The nonmetallic laminates would be beneficial first surfaces from the secondary impact effects standpoint.
d). Low vaporization temperature materials to avoid vapor coating components that would malfunction.
e). Glass mirrors. Metal mirrors should be the rule as far as possible.
f). Laminated first surfaces with oriented fibers dictated by strength requirements should have an external layer of basket-woven fibers bonded to it. Thii prevents the peeling along the oriented fibers that "esults from a hypervelocity impact.
g). Electronic and electrical components should be protected by a double shield to prevent short circuits due to molten droplets or vapor from a first surface impact debris plume.
278
v3

Spaceflight Experiment Requirements
There is a definite need for in-situ experiments to determine the long-term effects of micrometeoroid and orbital debris impacts on materials used in space As is indicated by the numbers of impacts as a function of size given in Table'1, test panels required to obtain data on particles 1 mm and larger would be prohibitively large. For instance, a 100 sq.meter test panel exposed for 10 years would collect between 7 and 14 total impacts of this size, depending on orbital altitude. It is however, reasonable to consider flight testing materials subjected to the smaller particles. A 10 sq.meter panel would collect a total of 630 to 900 impacts of the 0.1 mm particle size, and probably 1 or 2 of the 1 mm size, in 10 years of exposure. Obviously, shorter durations of 2 or 3 years would still yield useful data for the 0.1 mm and all smaller sizes. Laboratory hypervelocity impact facilities cannot launch projectiles in the range of sizes between 0.1 mm and 0.01 mm at velocities greater than 6 km/sec.
Although it is not reasonable to expect dedicated flight experiments for micrometeoroid and orbital debris impacts for sizes larger than 2 mm, it should be possible to use reserved areas of the Space Station Freedom truss structure to
attach test panels requiring a long exposure.
Laboratory hypervelocity impact facilities have successfully launched 0.2 mm projectiles when required, although normal testing calls for 0.8 to 3.2 mm. The velocity ranges most readily obtained for all these sizes are between 5.5 and 7 5 km/sec. As a result, ground-based hypervelocity testing of new materials for space use could be a part of an overall plan to develop space Uurability for the impact environments.
279

:<
X'
Conclusion
The long-terra effects of the micrometeoroid and orbital debris environments on materials that are commonly used in space are dominated by the particles smaller than 1 mm in size. These particles are numerous enough to cause erosion of surface layers, optical degradation by pitting and vapor deposition, the destruction of coated and mirrored glass surfaces, the delamination and penetration of anti-atomic oxygen coatings and impact ejecta effects on surrounding structure. If a penetration of an outer layer of a spacecraft occurs, the impact debris plume can cause damage to electrical and electronic elements by solid particulate matter, molten droplets, and vapor deposition. Some materials are more susceptible to be damaged than others, and some are worse from the standpoint of secondary effects. This report presents information that could lead to enhanced long-term performance of current materials and the development of new materials designed to mitigate the effects
described.
REFERENCES
1. Kessler, Donald J.; Orbital Debris Environment and Data Requirements. Space Environmental Effects on Materials - 1988. NASA CP , 1988
2. Swift, Hallock F.; Hypervelocity Impact Mechanics. Impact Dynamics. John
Wiley and Sons., p. 226
3. Cour-Palais, Burton G.; Hypervelocity Impact Investigations and Meteoroid Shielding Experience Related to Apollo and Skylab. NASA CP 2360, 1982
4. Gehring, John W.; Impact of Thin Targets and Shields: Theory and Experiment. High-Velocity Impact Phenomena. Academic Press., p. 109
280


N89-23543 ORBITAL DEBRIS ENVIRONMENT
AND DATA REQUIREMENTS
Donald J. Kessler NASA Lyndon B. Johnson Space Center
Houston, Texas
281 •
s>

s V
ORBITAL DEBRIS, CURRENT NASA INVOLVEMENT
NASA is involved with orbital debris in 4 major areas: 1. Characterizing the environment. This is accomplished with a program of measurements and modeling. This work is mostly conducted at JSC. 2. Examining implications of the environment. This is accomplished by conducting hypervelocity impact tests, determining possible failure modes for spacecraft systems, and evaluating the required shielding to obtain a desired spacecraft reliability. This work is conducted at MSFC, JSC, ARC. and LaRC. In addition, other agencies and contractors conduct independent research. 3. Developing an Agency technical plan. JSC has put together a technical plan for the review of other centers. 4. Developing Policy. NASA Headquarters has the responsibility of developing policy, with other centers providing the technical background.
• CHARACTERIZING THE SPACE ENVIRONMENT
o EXAMINING IMPLICATIONS FOR FUTURE USE OF SPACE
• DEVELOPING AN AGENCY TECHNICAL PLAN
• DEVELOPING AGENCY POLICY
282
t)

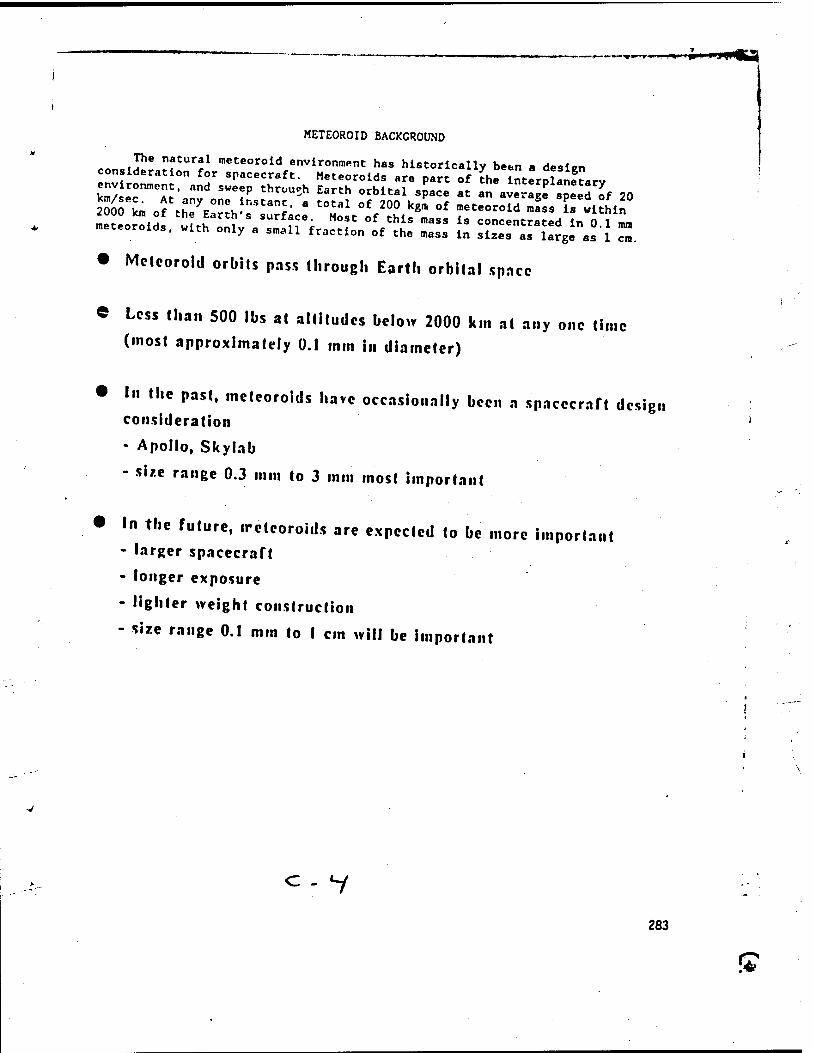
fr~w i i m i pi" P
METEOROID BACKGROUND
conSiSraM^rf1.n,ete0r0id/nViron,,,ent has hi»torically been a design consideration for spacecraft. Meteoroids are part of the interolanetarv
• Mclcoroid orbits pass through Earth orbital space
© Less than 500 lbs at altitudes below 2000 km at any one time
(most approximately 0.1 mm in diameter)
• In the past, meteoroids have occasionally been a spacecraft design consideration
- Apollo, Skylab
- size range 0.3 mm to 3 mm most important
• In the future, iretcoroids are expected to be more important - larger spacecraft
- longer exposure
- lighter weight construction
- size range 0.1 mm to I cm will be important
c- V 283
!*

METEOROID FLUX
As a result of measurements by Pegasus and Explorer satellites and photographic and radar meteors, the meteoroid flux has been defined at 1 AU for about 20 years. When used ^or Earth orbit, both an Earth shielding factor and a gravity concentration factor must be applied to give the flux shown here, published in Planetary and Space Sciences, July, 1970, Vol. 18. No. 7. on 953-964. vv'
Ptt
1* r-
C >
< Z O
o (/»
O <r o a. ut CL
tA
O < a. S
X 3
0.0001 0.001 0.01 0.1 1
PARTICLE DIAMETER. CM
10 100
284
£

I
ORBITAL DEBRIS POPULATION
Within 2000 Ion of the Earth's surface, there is also an estimated 3,000,000 kgm of man-made orbiting objects. These objects are in mostly high incliration orbits, and sweep past one another at an average speed of 10 km/sec. Most of this mass is concentrated in about 3000 spent rocket stages, inactive payloads, and a few active payloads. A smaller amount of mass, about 40,000 kgm, is in the remaining 4000 objects currently being tracked by US Space Command radars. Most of these objects are the result of over 90 on-orbit satellite fragmentations. Consequently, from these considerations alone, it is likely that smaller satellite fragments exist in low Earth orbit in sufficient quantities to exceed the meteoroid flux.
• Over 6000 objects catalogued by NORAD and "permanently" in Earth orbital
• space (over 16,000 injected into orbit to date)
• Approximately 4,000,000 lbs at altitudes below 2000 km (most approximately
3 meters in diameter)
• High intersection angles produce high collision velocities
• If only a small fraction (0.01%) of the mass were in a smaller size range,
the resulting environment would exceed the meteoroid environment in that
size range. Possible sources of smaller objects arc:
- explosions
- hypervelocity collisions
- degradation of spacecraft surfaces
- solid rocket motors firing in space
y
* North American Air Defense Command
285
I

I-' THE MAY 30, 1987 CATALOGUE AS OBSERVED FROM A POINT IN SPACE
The position of about 7000 objects cataloged by US Space Command is shown. Most objects are at altitudes less than 2000 km, and are nearly randomly distributed over the surface of the Earth. Consequently, collision probabilities are nearly independent of a spacecraft's orbital inclination, and collision velocities are hi/'h, averaging about 10 km/sec. The dots representing orbiting objects are not to the same scale as the size of the Earth; consequently, collision probabilities with the catalogued population are low, unless the spacecraft is larger than about 100 meters in diameter.
•'-■'•• •'•:\*''Alf *''??■' ■ 'if r* :" -'- • *•
286
a

it« i» i'imw iiii-W,.-Hf|IHIIi-
CATALOGUED EARTH SATELLITE POPULATION, 1 JANUARY 1987
Only about 5% of the catalogued population Is active payloads. The remaining Is orbital debris, with the largest percentage coming from on-orbit fragmentation events. Of the more than 90 events, only about 25 events contribute to more than 90% of the fragments. Because of new operations procedures, since 1981, only 1 US event has made any contribution to the accumulation of fragments in orbit; the USSR has been the major contributor in recent years.
ACTIVE PAYLOADS
(5%)
OPERATIONAL DEBRIS 113%)
ROCKET BODIES 115%)
FRAGMENTATION DEBRIS (46.5%)
INACTIVE PAYLOADS 120.5%)
V
287

US SPACE COMMAND OPERATIONAL CAPABILITY TO DETECT SATELLITES
Because the US Space Command radars use a radar wavelength that is about 70 era, their ability to detect and catalogue objects smaller than about 10 cm is very limited, even at low altitudes. At higher altitudes, they use optical techniques to catalogue objects. Note that an extrapolation of the optical technique to low altitudes would allow the detection (but not cataloguing) of 1 cm objects at 500 km. This technique has been experimentally used by MIT's Lincoln Labs.
("1
100.000
20. oco
10.000
° 5.000
2.000
1.000
500
?co
UNDETECTED OBJECTS
DETECTED OBJECTS
OPTICAL
_L .1 .2 2 5 10
LIMITING DIAMETER 500
288
I

US SPACE COMMAND CATALOGUED OBJECTS-JANUARY 1987
In January, 1987, the OS Space Command was tracking about 6300 catalogued oblects The flux of the objects was calculated by the technique described In the publication Icarus, Vol. 48, 1981, pp. 39-48. To calculate the collision probability with a spacecraft, multiply the flux by the cross-sectional area of the spacecraft. For example, a very large spacecraft, 100 meters in diameter, at 500 km would have about a .015 probability per year of collision with a catalogued object. However, typically several hundred additional objects are awaiting catalogue, and these objects usually significantly increase the collision probabilities at altitudes below 500 km.
500 lOOO altitude [km]
1500 2000
289

r 1
,«. .ii it m»jmu»
* * 1987 SATELLITE BREAKUPS
During the year of 1987, a large number of breakups occurred. Most of these breakups occurred at altitudes below 500 km. At these lower altitudes, it is very difficult to maintain an accurate catalogue because the orbits are changing rapidly and because the objects do not pass over radar sites as frequently. Typically, more than a year is required to catalogue most of the fragments following a major breakup.
Cataloged fragments as of January 10, 1988
Y
Breakup Orbital Orbital Orbital Trackable Breakup Satellite Altitude Perigee Apogee Inclin. Fragments
Date Name (km)
1-28-87 COS1813 390
7-26-87 COS1866 243
9-18-87 ARIANE ?
9-21-87 COS1769 333
11-20-87 COS1646 406
(km) (km) (deg.) Estimated Catalogued
359 417 73 1000 190
167 361
246 36523
310 444
401 434
12-17-87 COS1823 1485 1477 1523
67
7
65
65
74
1000
>15
150
150
>60
9
1
4
25
43
The estimated number of fragments was determined from radar data from individual radar sites.
290

i
i
0!
US SPACE COMKAND CATALOGUED OBJECTS-JANUARY 1988
Although most of the fragments from the 1987 breakups were not catalogued, there was still a very large Increase In the flux at altitudes below 500 km due to these breakups. At these lower altitudes, most of the fragments will reenter soon, and the flux-should return to near its 1987 values within a year, assuming new breakups do not occur. However, the large increase at 800 km, which was due to the belated cataloguing of a breakup that occurred in November,
1986, will remain for 50 to 100 years.
10 c
> I (U * t E S
X D J IL
< UJ d <
J < z o H \- u 111 en i X
-8 10
-7 10
-B 10
-9 lO
\
J I—J L J I 1 L J I I L. J I I L 500 lOOO
altitude [km] 1500 2000
■4 «^
I— ■
&1 w
291

'S *; NASA'S ACTIVITIES TO DEFINE ENVIRONMENT
ft better determine this environment Ss ac/r"8""1/" the laBt 10 ***" to used to better understand th a ure f °7,?? gr°Und "dar dat* h« been
I' better Predictions could be Lde coLr„ .J * fragmentation so that \ generated. Ground telescopes have b^u^* ?tal nUmber °f ^agments A orbital debris and has found about 5 tV.lL **'?* 16th Vlsual -«nitud. f IR measurements of satellite £«»««,- Ü" ^ cataloS«ed number of objects [ dark, having an albedo'of rt^tT W^rffT"^ ^ th*" f"^" a"
orbital debris growth as . „rix^^ScÄ-^SSiSK^jSi^-^SSSt^^
:; • Analysis of NORAD/ground radar data k"
• Acquire and analyze ground telescope data
- predict consequences of various activities in space
292
k

r 1
's
%
r
EXISTING ORBITAL DEBRIS MEASUREMENTS COMPARED TO METEOROID FLUX
All orbital debris measurements to date show an orbital debris flux that £ i , nearly as larSe asi- or greater than, the meteoroid flux The chemical composition of material found «n hypervelocity pits on the Apollo/Skylab windows, the orbiter windows, and Solar-Max surfaces was used to tl* UP ? °fbital debris from meteoroids. Directionality was used to make hLf SC,u on Explorer 46. The MIT telescopes were likely detecting 2 cm SJtrJwi i"g h^rvelocity «llisions and ground explosions predict the distributions shown. However, no measurements have been made in the critical 1 mm to 1 cm size range. Modeling predicts that the amount of debris in this size range will increase significantly as the result of random collisions.
SKYLAB CM WINDOWS (1973-74,435-KM ALTITUDE)
-SOLAR MAX DATA
(1980-1984, 500 to 570km altitude)
ORBITER WINDOWS (1981-83,300-KM ALTITUDE; 95-PERCENT CONFIDENCE)
CALCULATED FOR ONE HYPERVELOCITY COLLISION
p GROUND TELESCOPE (MIT) (600 to 1100km)
GROUND EXPLOSION DATA
NORAD CATALOG (600 to 1100km)
0.0001 0.01 0.1 1
PARTICLE DIAMETER, cm 100
293
S

MODELING
nredi^H = f ???! * USlng Varl°US SpaCe traffic models- ^ing past and predicted satellite fragmentation events to predict the future orbital debris environment. Such modeling consistently predicts that even if small debris did Sin'V?"' ?C WiU S°0n 6XiSt l" !"*a I-»««.. Sue to random *"
I c«n i J iüT uarger orbitinS objects. The most probable type of ! ^ellite ^aU
gment.betWeen " °ld "^ ^ °' lnaCtiVe I»^, - - ^rge
INPUTS
• DOD, NASA, ESTIMATED USSR TRAFFIC MODEL
• SATELLITE BREAKUP MODELS
OUTPUTS
• FLUX AS FUNCTION SIZE, ALTITUDE, TIME
• VELOCITY, DIRECTION DISTRIBUTIONS
CONCLUSIONS
CASCADING EFFECT OF SATELLITE COLLISION FRAGMENTATION COULD
PRODUCE AN EXPONENTIAL GROWTH IN THE 1 MM TO 1 CM POPULATION
WITHIN THE NEXT 20 YEARS, DEPENDING ON
• TRAFFIC MODELS
• SATELLITE BREAKUP MODELS
294
i -A i
b
i

MWiflmwuH
DEBRIS FLUXES FROM OBJECTS 4 MM ,0R LARGER, AT 1000 KM ALTITUDE
By assuming a yearly percentage increase" in the current launch rate, and that future small debris originates only from random collisions between orbiting objects (i.e., no future accidental or intentional explosions), a prediction of the future environment is made. As a result of cascading collisions, the small debris increases at a much faster rate than the launch rate alone would predict. Eventually, a critical density of larger objects would be reached, causing a very rapid increase in the rate of satellite collisions, generating small debris at a rate that would be independent of the launch rate. A 5% per year increase in the current launch rate could cause this critical density to be reached by the year 2060, while a 10% per year increase in the launch rate could cause the critical density to be reach by 2030. See the publication Advances in Space Research, Vol. 6. No. 7 1986 DD
2150
Debris fluxes from objects with diameter 4 mm or larger at 1000 km altitude with different increase rates of yearly traffic input.
295

BiS m^i**
1 TECHNIQUES TO OBTAIN DATA ON DEBRIS--1 CM AND LARGER
Various studies and experiments have shown that techniques to statistically sample the orbital debris environment at sizes smaller than catalogued by US Space Command can be conducted from either space based or ground based experiments. In both cases, remote sensing techniques must be used in order to provide a large effective collecting area. The cost of constructing a space based instrument is larger than a ground based instrument, and does not include the cost of launch, or the spacecraft; consequently, ground based measurements are more cost effective. Although ground telescopes have provided excellent data, they are limited by lighting constraints...for example, most sun synchronous orbits cannot be observed from latitudes closer to the equator than 45 degrees. However, a single X-band radar near the equator could sample all orbits. NASA plans to have such a radar operational by 1991. r
! *
TECHNIQUE COST* TECHNOLOGY
RISK
DATA
RETURN
COMMENTS
.SPACE BASED ALTITUDE LIMITED TO SPACECRAFT ALTITUDE RADAR1. HIGH LOW LOW RADAR NOT OPTIMIZED FOR PERFORMANCE LIDAR1 HIGH HIGH LOW OPTICAL1 MED LOW HIGH IR2 HIGH LOW HIGH
GROUND BASED ALTITUDE LIMITED TO LESS THAN SOOKM i^> RADAR5 LOW LOW HIGH X BAND RADAR
OPTICAL4 LOW LOW LOW TWO 30 INCH TELESCOPES, ASSUMING HIGH ALBEC
LIGHTING CONSTRAINTS LIMITS DATA RETURN
1. G.E. STUD Y, 1982; BATTELLE STUDY 1983; JPL 1987 «COST 2. IRAS EXPE RIENCE LOW LESS J2"M 3. BATTELLE. TELEDYNE BROWN ENG., JF >L, JSC STUDIES, 1987 MED J20M TO J50M 1. HIT DATA; INHOUSE EXPERIENCE HIGH GREATER J50M
296
r.

TECHNIQUES TO OBTAIN DATA ON DEBRIS--1 KM AND LARGER
The cost of building a ground based system which could sample the 1 mm environment is considerably higher than th6 system to sample the 1 cm environment. In addition, the technology risk is higher for the required K- band radar. Consequently, the most cost effective technique of obtaining this data is a space based optical detector. JPL proposed earlier this year a configuration, called "Quicksat", which would orbit a pair of 25 cm telescopes, each with sensors consisting of 8X16 CCD "macropixels". The spacecraft and instrument would cost $100M-- more than NASA can currently afford.
?
TECHNIOIIE COST* TECHNOLOGY DATA COMMENTS
RISK RETURN
SPACE RASEP ALTITUDE LIMITED TO SPACECRAFT ALTITUDE
RADAR1 HIGH LOW LOW RADAR NOT OPTIMIZED FOR PERFORMANCE
LIDAR1 HIGH HIGH LOW
5- OPTICAL1 MED LOW HIGH
IR? HIGH LOW HIGH
GROUND RASED ALTITUDE LIMITED TO LESS THAN 500 KM
RADAR3 HIGH HIGH HIGH K BAND RADAR
OPTICAL" HIGH LOW LOW TWO 300 INCH TELESCOPES, ASSUMING HIGH
ALREDO; LIGHTING CONSTRAINTS LIMITS DATA
RETURN
1. G.E. STUDY, 1982; RATTELLE STUDY 1983; JPL 1987
2. IRAS EXPERIENCE
3- JPL, 1987,' JSC, 1987
H. UNIV. TEXAS PROPOSAL, 1985
•COST
LOW LESS $20M
MED *20M TO S50M
HIGH GREATER J50M
297

mm
1* TECHNIQUES TO OBTAIN DATA ON DEBRIS--1 MM AND SMALLER
Meteoroi'ls smaller than 1 mm have been measured using satellite "impact" sensors since tlio 1960's. However, only recently has consideration been given to determining the trajectory of the impacting meteoroid. Being able to discriminate between orbital debris and meteoroids is essential to any type of sensor. By obtaining trajectory information, one can determine which objects are in Earth orbit. If the surface is planned to be returned for analysis, then chemiciil composition of material found associated with.the impact can be use to determine if the object is natural or man-made. Both techniques can be used on a single experiment; that is, the trajectory could be measured, and the impact surface later returned for analysis. Such experiments may be used on the Space Station Cosmic Dust Facility.
SPACE BASED SENSORS
Techniques Technology Risks
Debris, Meteoroid Discriminator
Telemeter Data i
Intrinsic Charge Sensing : HIGH Impact Plasma Sensing LOW Capaeitive Sensing j LOW
Returned for Analysis
capture cell j LOW Low* density Foam ! LOW
Trajectory
i Chemical Composition
Flight Experience
No trajectory configurations:
Lab experiment only Pioneer 8, 9, Helios, Heos, Giottf Vega, Pegasus
Solar Max, LDEF Flights scheduled
ORIGINAL PAGE IS OF POOR QUALITY
298

»]K ^IW I' ■'■'■■ «"—' ■•- - •" " —- — ' ' ' f v »1
»_,.^._ —■.,,.■ un»f <
If
CONCLUSIONS
Orbit.il
* ?: i
Freedom' ^iZ'il^'l^^^^™^™*** for Space Station Mathematical models predict the environment Si i UTUBanned sP*cecraft. amount it increases is dependent on 7 , nC"aSe Vith time- The operations are conduced. Th f e °P««ions In space, and how these of debris and which operations will minimize H^"*"' C° understand the sources that debris be monitored. Currently 2 , f S generation. This requires capability to monitor 1 cm debri! at'soo L?l ?oo? haVe an °Pe«tional currently no plans to monitor rh! • y 1991< Howev«. there are important to 1»^™%««^ S..S"0n"er,t °f SmaUer debris whl<* »"1 be
• . Existing measurements indicate the current OrWf.i Debris Environment in Low Earth OrWt is more
^nvTronment0 "**""* **» ^ -teorolT*
0 fattTSSSä ^°hd-IS P^dictS ******* * 5—ases Sture. 1S environm^t within the near^
€ o^J°d^°\e™™™»* «f 1 cm and smaller
299

■i
iA® Sgfep
SfSätSJt
AI :v&
m «
M—CSSJ—.,-»j,~ —.- -
ZT ~ *$|«sHl Wm^^^^ssM, %mSkm §m

N89-23544 MICROPARTICLE IMPACTS IN SPACE
RESULTS FROM SOLAR MAX SATELLITE AND SHUTTLE WITNESS PLATE INSPECTIONS
David S. McKay NASA Lyndon B. Johnson Space Center
Mail Code SN14 Houston, TX 77058
PRECEDING PAGE BLANK NOT FILMED
301
^4
/

T-3H
J-h
retrieved the ..t.lllLTE'JhrSit.J-cl £"£" pKcefSSl:«1"10" STS"41C and re-deployed the repaired satellite into orbit £! £2 dffective components, returned to Earth for study Scientists ! ? ', ^ defective components were Johnson Space Center in Houston have „1 Solar System Exploration Division at
approach and objectives' IlT^'S^jr^i^^T""- SUrfaC6S- ""
MICROPARTICLE IMPACT ON RETURNED
SOLAR MAXIMUM HARDWARE
Approach and Objectives:
1. Document morphology of impact.
2. Find and analyze projectile residue.
3. Classify impact by origin.
4. Determine flux distribution.
5. Determine implications for space exposure.
I Figure 1 {
302 i

.WZA^UBJ-hr^ «pr»w>
'•I
Figure 2 illustrates the geometry and positioning of the Attitude Control Systems Box as seen before recovery and repair of the satellite. Thermal blankets and louvers exposed to space were retrieved by Shuttle astronauts during Solar Max repair mission STS-41C. These louvers and blankets have been inspected by means of scanning electron microscopy in order to determine fluxes and origins of impacting
projectiles.
Attitude Control Systems Box before recovery and repair of satellite,
Figure 2
ORIGINAL PAGE BLACK AND WHITE PHOTOGRAPH
303

►C^s^ =*
The Attitude Control Systems Box was returned from the Solar Maximum Satellite after spending 50 months in low-Earth orbit. One side of this box contained 84 aluminum thermal control louvers. These louvers had been penetrated by 64 impacts which made holes ranging from 180 micrometers to 820 micrometers in diameter The location of these holes is shown in Figure'3. Most of these holes were made by micrometeorites as identified by chemical analysis of projectile residue associated with each hole. Micrometeorite holes are shown by open circles in this Figure. Seven of the holes were made by small particles of orbital debris. These holes are shown as filled circles on Figure 3.
^
Hole Locations in Louvers
0 C o c
O o 0
c • • 0# c O
o
•
0 0
c o o
D ~
0 c 0 0
O O
D i c
o •
• o
O
O o
• c y n
0
0
o
o
o o o
c D % o 0
o J 1 o o o
C
O 0
Attitude Control Systems Box
Figure 3
304

0 1 4!
'"»"JH
M
Figure 4 shows the structure of the aluminum louver and the morphology of a typical impact hole. The louver consists of two sheets of aluminum, each 125 micrometers thick, separated by a 3-millimeter space except at the edges and along a central support rib. A typical hypervelocity impact has three major morphologic features. The entry hole (Figure 4.1) is generally quite circular and has an upturned rim of aluminum which usually contains traces of residue from the projectile. The exit hole (Figure 4.2) also contains an overturned rim which is usually more jagged and less regular than the entry rim. All penetration holes are also associated with a spray pattern (Figure 4.3) on the second layer. This spray pattern is always much larger than the diameter of the hole, usually an order of magnitude larger in diameter and two orders of magnitude larger in area. The spray pattern is formed by the combined material from the projectile and the aluminum from the hole, usually the aluminum from the hole is the primary constituent of the spray. The spray pattern consists of large numbers of small irregular craters which are sometimes arranged in loops and chains. Some of these small irregular craters on the second layer completely penetrate the aluminum layer, but most do not. Sometimes a secondary spray is created at the second layer which sprays tiny aluminum droplets back up to coat the bottom of the first layer (Figure 4.2) or which completely exit through the hole and create many more orbital debris microparticles in space.
i t
LOUVER
v///////y/m^A
* <£ 1 Figure 4.
305

■'Kl ,1
95£&ai
jg* ralMal^ll^äMaf^iWtBrifll BWffl
Figure 4.1 - Entry hole.
HK Mf
^*'-'.: ^n^$ ^ta
Figure 4.2 - Exit hole.
306 ORIGINAL PAGE
BLACK AND WHITE PHOTOGRAPH

i i i
t
te&x&iv&m mm^mnmggfmm ZS-
ORIGINAL PAGE BUCK AND WHITE PHOTOGRAPH
Figure 4.3 - Spray pattern.
307

i"1»»11
Tüi
Figure 5 shows the size distribution of holes in the aluminum louvers. Most of the holes are in the size range of 180 micrometers to 400 micrometers. Below 180 micrometers, impacts produced craters rather than holes in the 125-micrometer thick louver material. Also shown in this figure is the distribution between identified micrometeorite holes and identified orbital-debris holes. Orbital-debris holes clearly are a minority of the population in this size range. However, that is somewhat misleading. Orbital debris particles have a mean velocity relative to a satellite in low-Earth orbit of about 10 km/sec, but raicrometeorites have a mean velocity of about 20 km/sec relative to the satellite. Therefore, debris particles of equal mass and density as micrometeorites are likely to make smaller holes or even craters rather than holes. Consequently, the difference between the abundance of micrometeorite holes and orbital debris holes does not accurately reflect the difference in flux between these two populations; the fluxes are more nearly equal than is indicated by the hole data.
FLUX OF LOUVER HOLES
m
V)
o
u c
1
V\
I
1
i V
VA
y/s
%
1 '/,.
4 180
■ i i i ! ' i ■'' "rr"ri 200 220 240 260 280 300 320 340 360 380 420 440 460 500 520 540 560
!
^
600 760 820
Hole Diameter (micrometers) Wm MICR0METE0RITIC EX53 MAN-MADE DEBRIS
Figure 5
308

"7^1,
T, j
. I
In Figure 6, the mass of the impacting projectile has been calculated usine experimental penetration data on the louvers (Reference 1) and assumed velocities ^approximately 20 km/sec for micrometeoroids, and approximately 10 km/sec for orbital-debris particles). Over most of the range, the projectile flux difference is only about a factor of three rather than the order of magnitude suggested by the hole data alone. At lower masses the two flux curves begin to diverge because the lower velocity debris microparticles are beginning to make craters rather than holes so that the flux dropoff is an artifact of the transition from holes to craters for these particles.
CUMULATIVE FLUX OF LOUVER HOLES
en o
Log of Particle Mass (g)
-9- Man-made Debris Micro-meteoritic
Figure 6
309

mmm
This diagram (Figure 7) of the louvers shows 15 areas which we selected for more detailed higher magnification study. In these selected areas we scanned the surfaces at a magnification of 10.000X designed to reveal all craters larger than 1 micrometer and, in selected subareas, all craters larger than 0.1 micrometer. The smallest observed crater was 50 nanometers in diameter. Examples of some of these craters are illustrated by Figures 7.1 - 7.5.
Regions of Extensive Examination
Attitude Con+rol Systems Box
Figure 7
Example of Crater
, -AB
Sä iiii Figure 7.1
fa* '4
! *
310 ORIGINAL" PAGE
BLACK AND WHITE PHOTOGRAPH

Examples of Craters
Figure 7.2
Figure 7.3
ORIGINAL PAGE BUACK AND WHITE PHOTOGRAPH
311

^■ä
Examples of Craters (cont.)
Figure 7.5
312 ORIGINAL PAGE
BLACK AND WHITE PHOTOGRAPH
/

Figure 8 shows the abundance of small craters (0.1 - 0.5 micrometers) in several of the regions examined at high magnifications (Figure 7). The abundance of small craters are higher in regions 4, 5, and 6 compared to regions 9, 10, 14, and 15. Shielding calculations (Reference 2) show that regions 4, 5, and 6 have a higher proportion of the solid angle field of view obstructed by the nearby solar panel. This correlation would support an interpretation that many of these small impact craters are caused by high velocity secondary ejecta from primary impacts into the backside of the nearby solar panel while the smallest craters (less than 1 micrometer) do not contain enough detectable residue for chemical identification; the larger craters (5 - 100 micrometers) often contain detectable residue and many of these craters contain residue rich in titanium, oxygen, and sometimes zinc. These compositions are typical of pigments used in chemglaze paint on the solar panels and other parts of the spacecraft. Consequently, some of these impacts could be from secondary projectiles generated at other Solar Max surfaces, although other compositions including potassium and silicon-rich and aluminum oxide have originated on other spacecraft or from solid rocket exhaust.
/
CM E £
a.
O c 4)
cr
LOCAL SUBMICR0N CRATER FLUX
0.2 0.4
■* t
0.3 Crater Size (microns)
Regions 9,10,14,15 + Regions 4, 5 and 6
0.5
Figure 8
313

Figure 9 shows the abundance of adhering particulate contamination on the various examination regions of the aluminum louvers as shown in Figure 7. These particles are mostly titanium dioxide and are typically 0.2 - 0.5 micrometers in diameter. The particles occur individually and in clumps (Figure 9.1). Abundance of these particles is not random but increases systematically from regions 14 and 15 to regions 4, 5, and 6. As stated previously, regions 4, 5, and 6 shielding calculations have shown that regions 4, 5, and 6 have the largest solid angle field of view for the nearby solar panel. Consequently, we suggest that many of the surface particulates come from the solar panel and are in fact paint pigment particles. The particles are clean-appearing and lack the binder typical of unfiown cheaglaze paints. We suggest that the near-surface binder of this paint has been eaten away by atomic oxygen erosion and the included pigment particles have been released by thermal cycling or other mechanisms and have drifted to the louvers and have been deposited on their surfaces. Self-contamination from released paint pigment may be a widespread particulate contamination on other spacecraft.
PAINT PIGMENT CONTAMINATION FLUX 15.000 "
14.500 -
14.000 -
13.500 ■
13.000 -,
12.50J ■ "'"». 12.000 -
11.500 ■
''».... «...
11,000 _ •■■■■■
10,500 ■
10.000 .
I 3 9
Region of Examination
Figure 9
Example of adhering particulate contamination
Figure 9.1
314
ORIGINAL PAGE BLACK AND WHITE PHOTOGRAPH

r&'trr?'j?™y^i\&93£JS!!&!aL
Figure 10 shows the overall flux of holes and craters on the aluminum louvers over the size runge from 10 micrometers to 1 millimeter. For the size region dominated by hOi.es, the micrometeorite curve is clearly higher than the orbital- debris curve as discussed previously (Figures 4 and 5). The transition region between holes and craters is clearly shown in the region around 200 micrometers. While not shown on this figure, chemical data indicate that a high proportion of the smaller craters are formed by debris projectiles rather than micrometeorites. Therefore, the flux curves must cross over, probably in the crater region between 50 and 100 micrometers. As pointed out elsewhere in this report, the population of large (centimeters to meters) projectiles is dominated by orbital debris. Thus, based on Solar Max results, small projectiles (approximately those which make less than 50 micrometers crater diameters on aluminum) are dominated by orbital debris (mainly paint pigments with lessor aluminum oxide solid rocket exhaust), the larger projectiles (centimeters to meters) are dominated by orbital debris, and only the narrow region between (projectiles making holes or craters in aluminum from about 0.1 mm to possibly 1 cm) is still dominated by natural meteoroids.
SIZE DISTRIBUTION LOUVER CRATER AND HOLES
-4.5 -
-5 -
3 -5-5 H fc.
^T„ -e -|
5 'E u- "-6.5 u o
-7.5 -
■ Craters
o Debris Holes
+ Meteoritic Holes
10 20 40 60 80 100 200
IMPACT DIAMETER (Micrometers)
400 600 800 1000
Figure 10
.z.

i t. t
Figure 11 shows some of the major conclusions which have emerged from the study j of Solar Maximum space-exposed surfaces having more than four years exposure to ! micrometeorites, atomic oxygen erosion, and orbital debris microparticle abrasion. <
316
CONCLUSIONS
1. On Solar Max louvers, the flux of micrometeoritic holes
is three times greater than orbital debris holes.
2. The majority of smaller impacts (< 20um in diameter)
are produced by man-man debris projectiles.
3. A significant proportion of the smallest impacts j
are caused by secondary ejecta originating !
from the solar panel. ' i
4. Low velocity projectiles (particles and clusters of
paint pigments) are abundant. These most likely originate from the nearby solar panel.
i
5. Atomic oxygen erosion is a contributing factor to ■ low velocity surface contamination. I
i * 6. Hardware exposed to space will be impacted by a
broad mass range of both micrometeorite and ■ orbital debris projectiles and may be further degraded \
by atomic oxygen erosion and effects of secondary ejecta. [ i
Figure 11

p
Jf Figure 12 shows the outline of a Shuttle experiment of material abrasion by ' solid rocket exhaust particles.
* \: : ■ SHUTTLE WITNESS PLATE RESULTS
aaiiijM»
r
..* . -; : — i**
PURPOSE
DETECT IMPACTS FROM PAM D2 SOLID ROCKET MOTOR
DETERMINE FLUX AND SIZE DISTRIBUTION OF PARTICLES
DETERMINE ABRASION EFFECTS ON VARIOUS
CONDITIONS
PAM D2 ROCKET WAS 17 KM FROM SHUTTLE ORBITER
BURN DURATION WAS 96 SECONDS
RESULTS
ALUMINUM SURFACES
COPPER SURFACES
STAINLESS STEEL SURFACES
INCONEL SURFACES
QUARTZ GLASS SURFACES
Figure 12
317

*
Figure 13 shows the ratio between the diameter of the retained aluminum oxide projectile and the diameter of the resulting crater or pit in the stainless steel (15-5) witness plate. This witness plate retained 62% of the impacting projectiles. The mean projectile/pit diameter for stainless steel is 0.90 + 0.09. Figure 13.1 illustrates a fractured SRM projectile in a stainless steel
target.
STAINLESS STEEL TARGET
9
8
7
6
5 -
4 -
3 -
2 -
1 -
0 T 1 1 1 1 1 1 1 1 1— 2 4 6 S 10
Pit Diameter (|jm)
Figure 13
Fractured SRM projectile in a stainless steel target
Figure 13.1
318 ORIGINAL PAGE BLACK AND WHITE PHOTOGRAPH

MNM |yi»'jü"w*-,ji»ui»mjnm..j$'flja'«
•%f
Figure 14 shows the projectile to pit ratios for the inconel target from the Shuttle Orbiter witness plate experiment. The mean projectile/pit diameter for this target is 0.9 + 0.09. The inconel target retained 482 of the impacting aluminum oxide particles, the least of any of the targets.
r INCONEL TARGET
3.
c 0) 4J 0) E to
01
u u •*■■»
o c Q.
Pit Diameter (pm)
*
Figure 14
319

is 15.4
Table 1
MEAN IMPACTS/mm2 RANGING FROM 1 um TO >10 um IN DIAMETER FOR ALL TARGETS
TARGET TOTAL IMPACTS SURFACE AREA IMPACTS/mm2
SCANNED (mm2)
COPPER 111+/. 10.34 9>88 li2+/_ iQ5
ALUMINUM 63 +/- 7.94 6.37 lo.O +/~ 1.25
QUARTZ _23_V- 4.80 2.97 7.7 +/- 1.61
Total 197 19.22
MEAN IMPACTS/mm2 = 197/19.22 = 10.25
320

*Sw jpm*|i
1 A I
"■'■ n
'I
Fieure 15 shows the relationship between measured depth/diameter ratios for a number of pits (lacking retained projectiles) and the calculated impact velocity. An emperically determined relationship between stereometically measured pit depth and projectile diameter is used (Hermann & Jones, 1962), Reference 3.
P/d Kx x Ln (1 + K2V )
where P d Kl
K2
=■ depth of penetration = diameter of projectile » 0.604, constant determined for aluminum projectile and target
- 0.593, constant determined for aluminum projectile and target
= velocity (km/s)
\ \
+■ fcJ
c u 4J E (O •r* a *>. JUl Q. 0) a
O.B
0.7 -
0.6 -
0.5
0.4
0.3
0.2
0.1 H
DEPTH/DIAMETER vs. VELOCITY
V *+
—i 1 1 1 1 1 1 1 1 1 1 1 i i i r 0.4 0.6 0.B 1 1.2 1.4 1.6 1.8 2
Estimated Velocity (km/s)
■ CU + AL o INC0NEL
Figure 15
321
K

if^^w^^**^"
The size distribution of aluminum oxide particles impacting targets on the Shuttle Orbiter witness plate experiment is shown in Table 2. This distribution is strongly peaked at 1 to 5 micrometers. The smallest pit observed was 0.8 micrometers in diameter and the largest pit observed was 14 micrometers.
Table 2
SIZE DISTRIBUTION FOR IMPACT FEATURES
TARGET
Copper
Aluminum
Quartz*
Total
SIZE RANGE (um) TOTAL IMPACTS
<1 1-5 6-10 >10
69 105 6 0 180
20 57 6 0 83
10 21 1 1 33
99 183 13 1 296
DISTRIBUTION BY SIZE (%) 33.4 61.8 4.4 (All Targets)
0.34
Dimension refers to pit diameter, not spall diameter
322
i i

Table 3 shows the calculated eroded area for metal targets (aluminum, copper, stainless steel, and inconel). The calculations show that approximately 0.01% of the surfaces were eroded or destroyed by impingement of particles from the plume of
the solid rocket.
Table 3
PERCENTAGE OF SURFACE AREA EROSION ON METALLIC TARGETS
Diameter Average Average Surface Arga Eroded Range (um) Diameter (um) Radius (um) Impact (mm )
<! 0.9* 0.4 6.4E-7 !_5 3.0 1.5 7.1E-6
6-10 8.0^ 4.0 5.0E-5 >10 12.0** 6.0 1.1E-4
2 Surface Area Eroded/Impact x Average Impact Density x Size Frequency3 x Total Surface Area = Surface Area Eroded (mm )
6.4E-7 mm2 x 15.2/mm2 x 0#339 x 3354.3 mm2 = 0.011
7.1E-6 mm2 x 15.2/mm2 x 0.613 x 3354.3 mm; = 0.221 5.0E-5 mnr x 15.2/mm2 x 0.0445 x 3354.3 mm; = 0.114 1.1E-4 mm2 x 15.2/mm2 x 0.0034 x 3354.3 mm" = 0,020
Total Surface Area Eroded (mm") = 0.366
Total Metallic Surface Area Exposed to the Plume = 3354.3 mm
Area Eroded (%) = 0.366/3354.3 X 100 =0.011
*Smallest observed size was approximately 0.8 urn Largest observed size was approximately 14.0 um 2
approximate Surface Area Eroded/Impact = sphere = 3.14159r 2Table 2 3Table 1
*• <i
323

JWWII. I
^
Table 4 shows the calculated eroded area for the quartz glass target. The cal- culations show that approximately 0.34% of the glass surface was eroded or destroyed by the particle impacts. This area is more than 30 times that for the metal surfaces subjected to the same flux of aluminum oxiue particles.
Table 4
PERCENTAGE OF SURFACE AREA EROSION ON NON-METALLIC TARGETS
t Diameter Range
Ave. Pit Diameter
Ave. Pit Radius
Ave. Spall to Pit Ratio1
Ave. Spa Radius
(um) (um) (um) (um)
<1 1-5
6-10 >10
0.9 3.0
12.C**
0.4 1.5 4.0 6.0
1/5.55 1/5.55 1/5.55 1/5.55
2.5 8.3
22.2 33.3
Surface Area Eroded/ Impact (mm2)2
1.96E-5 2.18E-4 1.55E-3 3.48E-3
Surface Area Eroded/Impact x Average Impact Density3 x Size Freguency4 x Total Surface Area = Surface Area Eroded (mm2)
1.96E-5 mm2 x 15.2/mm2 x 0.339 x 1570.5 mm2 = 2.18E-4 mm2 x 15.2/mm2 x 1.55E-3 mm? x 15.2/mm2 x 0.0445 x 1570
613 x 1570.5 5
2 mm~ = mm2 =
3.48E-3 mnr x 15.2/mmz x 0.0034 x 1570.5 mm2 =
Total Surface Area Eroded (mm2) = 5.278
0.159 3.190 1.646 0.283
Total Non-Metallic Surface Area Exposed to the Plume = 1570.5 mm2.
Area Eroded (%) = 5.278/1570.5 x 100 = 0.336
^mallest observed size was approximately 0.8 um Largest observed size was approximately 14.0 um
^Table 8 Approximate Surface Area Eroded/Impact = sphere = 3.14159r2 ^Table 2 4Table 1
324

Figure 16 shows modeled orbital decay times and settling times (after reaching zero horizontal velocity) for small particles. For example, a 0.5 micrometer (radius) particle released from a spacecraft at 500 km altitude will lose all of its orbital velocity in 2.2 hours as a result of air drag. During this time the particle loses altitude to about 380 kilometers. The particle then falls or settles over 6.8 more hours to the stratosphere below 100 km where the particle slows down considerably as it encounters significant air. Equation used for orbital decay is from Mueller (1981) Reference 4 and equation used for settling times is from R. ■ Reynolds (1987), (Lockheed, JSC), [personal communication].
E
QJ "O =3
600
500 -
400
300 -
DECAY AND SETTLING TIMES In Hours
r-i 200 "
100 -
T r 0.32 0.50
i r 2.00 3.16
Particle Radius (um)
Figure 16
325
\

Figure 17 (Zolensky et aL, 1988, Reference 5) shows measured abundance for aluminum-rich stratospheric dust particles in the stratosphere as collected by the NASA cosmic dust collection program. Most of these aluminum-rich particles are interpreted to be from spacecraft and rockets. The abundance of these spacecraft- derived particles increased more than an order of magnitude between 1981 and 1984, the most recently analyzed sample. Additional analysis of existing samples is needed to determine if the abundance of these particles is still increasing. Recent (June 1988) deployment of the large area collectors will greatly increase the amount of sampled stratospheric dust available for analysis.
NUMBER DENSITY OF PARTICLES IN THE STRATOSPHERE
DC
< U. O u> DE Ui i- IU 2 u S 3 U
DE u & 4 > 53 z UI o DE 2 UI 03 2 3 Z
AI-RICHI
1976 1981 1984 YEAR
Figure 17
326

REFERENCES
1. Carey, W. C: Properties and Interactions of Interplanetary Dust, pp. 131-136,
2. Warren, J.: Optical Observations of Impact Features on Solar Max Ihermal Blankets and Louvers. Lunar and Planetary Science XIX, 1988.
3. Hermann, W.: Correlation of Hypervelocity Impact Data. Proceedings of the Fifth Symposium of Hypervelocity Impact (Colorado), #G-0020-62, Vol. 1, Part 2, 1962.
4. Mueller, A. C.: The Decay of the Low Earth Satellite for the Orbital Debris Study. J. 0. 69-067, Lockheed 17520, 1981.
5. Zolensky, M. E.: Stratospheric Particle Abundance and Variations Over the Last Decaae. Lunar and Planetary Science Conference XVII, pp. 969-970, 1986.
327

SESSION 5: CONTAMINATION
Chairman: C. Maag Jet Propulsion Laboratory
PRECEDING PAGE BLANK NOT FILMED 329

ni^iHl^n!
I

IE« I
3*
N89-23545 Spacecraft Contamination Experience
E. N. Borson > | Materials Sciences Laboratory £'■ The Aerospace Corporation f; El Segundo, California
1
PRECEDING PAGE BLANK NOT FILMED 331

f I
..-—..«* ;.W
OUTLINE
Definitions Introduction
Design Factory Operations
Launch Site Ground Operations Launch and Ascent Orbitai Operations /
Flight Measurements Conclusions and Assessments
References
332

i
Üb tm■*«■ - ■>'< —.—— ■-• - —■— - - •• ... -._ -. .
Contaminant '' This definition for contaminant is very broad and could include items such as radio
,\ frequency, other forms of electromagnetic irradiation, particulate irradiation, meteoroids and '& debris, and atmospheric effects including atomic oxygen as well as the molecular and
-. particulate materials that are usually considered. t The primary concern in this presentation is the molecular and particulate material that y. affects spacecraft system performance as a result of deposition on surfaces or being in the t' field of view of sensors. The contamination of sealed, internal fluid systems, gas and liquid, I is not included because these subsystems are governed by well established standards and f;- procedures. Exceptions to this are the deliberate introduction of material into the '■ environment such as occurs during the operation of propulsion, evaporation, and other fluid ! systems that vent. Another area of concern is the unintentional leaking of contaminants into
the environment. It is important to consider contaminants that can deposit on spacecraft throughout the
life of the hardware, from factory to the end of mission life. Spacecraft hardware may be exposed to ground environments for many years before exposure to the flight environments.
The contaminants that affect spacecraft systems are deliberately and accidentally put j. in or on spacecraft hardware and then can interact with the space environment even when t these contaminants are added during ground environment exposures. A contaminant for one |. system or component may be a necessity for another. An example is the lubricant required in v a bearing but that would degrade the performance of an optical system. Other examples
include materials that contain molecular species that improve the processing or performance but outgas excessively. Contamination Control
The process of achieving the required cleanliness levels requires a contamination control program that starts during the preliminary design phase and continues through to the end of mission life.
DEFINITIONS
Contaminant:
Any material, substance, or energy which is unwanted or adversely affects components and systems.
Contamination Control:
The planning, organization, and implementation of all activities needed to determine, achieve, and maintain a required cleanliness level.
333
Pi

> si- •95*.
4.-
{
Particle Particles may be either solid or liquid. Airborne particles (aerosols) are usually small
solid and liquid particles. The sizes of particles that can be carried in the air and their settling rates depend upon factors such as the particle density, shape (drag), and air velocity. Typically particles under 5 urn in size stay airborne for long periods of time, and particles over a few hundred u.m in size settle out quickly. Molecular Contaminant '
Non-particulate matter (solid, liquid, or gas) has no definite shape and may exist on surfaces as uniform or non-uniform films. These contaminants may also be found as sorbed (absorbed and adsorbed) matter. The materials may also change state between solid, liquid, and gas. Particles may also change state, depending upon temperature and pressure, as well as changing to a molecular form. NVR ' . , ^ NVR is usually considered to be a molecular contaminant that is found on surfaces or in liquids after evaporation of the liquid. Various test procedures are used to measure the NVR on spacecraft surfaces or on plates exposed to the ground environments. MIL-STD- 1246 and NASA SN-C-0005 define NVR levels for hardware that have been in general use; however, other definitions are also used depending upon the requirements.
DEFINITIONS
Particle (Particulate Matter) Matter of miniature size with observable, length, width, and thickness
Molecular Contaminant Non-particulate matter, may be in a solid, liquid, or gaseous state
NVR (Non-Volatile Residue) Soluble material remaining after the evaporation of a volatile liquid or determined by special purpose analytical instruments.
334


i ;
A
N89-23546 INTRODUCTION
Effective contamination control must encompass all aspects of ground and flight from design of
the system through the end of mission life.
Therefore, Contamination control is a systems engineering function,
i
f and, i a review of experience with space systems should include
phases of activity from design to the end of life.
335
m

j»WM'-U«
Contamination control activities should start during the preliminary design phase of a project. This includes the initial selection of materials and preliminary analyses of the sensitivities to contamination and quantities of contaminants. If the contamination control work is delayed, required design changes will increase costs, cause schedule delays, or compromise system performance.
DESIGN 1
It is necessary to include contamination control in the design trade off studies and to initiate operational planning activities that affect the design.
336

uaMh^lMMfcdMahiiaWMBggSSCSiw-« 11 iiiT' iii«iiJViri'iiiiiim«i^
Each design activity has an impact on the contamination control program and there are iterative processes that contribute to the development of the design.
The determination of system performance requirements leads to a definition of the sensitivity of the system to contaminants.
The configuration of the system defines the relationship between the elements that are sensitive to contamination and the sources of contamination. This configuration can be changed to eliminate or, at least, minimize the contamination. The sources of contaminants include materials and components on the surface of the spacecraft as well as materials and components inside the spacecraft that get out thrcjgh intentional and unintentional vents. The locations of these vents are frequently a critical factor in the contamination of sensitive components.
The configuration also has a bearing on how easy or difficult it is to clean sensitive elements during the various phases of ground operations.
The selection of the materials, components, and subsystems so as to minimize outgassing and generation of particles involves tradeoffs with the need to meet the other functional requirements. These other functional requirements include temperature and radiation stability, mechanical and electrical properties, and resistance to atomic oxygen.
As the design develops it is possible to consider preliminary planning for ground and flight operations including those procedures that will minimize contamination. In this way design changes can be implemented early.
DESIGN 2 Activity Impact on Contamination Control
Determination of Performance Defines system sensitivities Requirements
Definition of Configuration Defines relationship between sensitive elements and sources of contamination
Ease of cleaning and protection
Selection of Materials, Affects outgassing, particle, Components, Subsystems generation, end other functions
Planning of Operations for Affects the ability to meet Factory, Launch Site, requirements and minimize cost and Flight
337

The contamination analyses are used to determine if the materials, components and subsystems can be expected to meet the performance require* ents for the system When the analyses are performed early in the design process it is possible to make necessary changes with a minimum impact on schedule and cost. As the design develops, the analyses can be "fine tuned for critical items.
The contamination control plan is a summary of the requirements and the procedures to be used to meet these requirements. The contamination control plan should start early in the design phase of a project. There may be many unresolved issues and blanks in the plan but these indicate work that must be accomplished andtoiallow schedules to be set for implementation. One important purpose of the contamination control plan is to assure that the requirements and procedures are implemented in the working documents. It also allows all parties to review it and reach a consensus on the approaches to be followed startinq early in the design activity. '
Development tests should be used to get data that are needed in the design of the new space system. Typical development tests include outgassing tests on materials and components where there is a lack of data in the literature or special test conditions are required.
Activity
DESIGN 3
Impact on Contamination Control
Perform Contamination Determines if the configuration, Analyses materials, components, and
subsystems that are used are likely to result in the cleanliness levels needed to meet system performance requirements.
Prepare a Contamination Summarizes the requirements, goals, Control Plan and procedures and is used to
provide guidance to all activities that impact contamination control.
Perform Development Tests
Tests should be performed early enough to affect designs without increasing costs.
i 338
.fc

It is important to clean the hardware as it goes through the factory operations. It is especially critical to remove all oils and chips following machining, drilling, forming, and similar manufacturing operations. It is critical because paniculate and molecular contaminants become trapped in enclosed (but not sealed) areas and can be released by exposure to the vibro-acoustic, vacuum, and elevated temperature environments during flight.
During the assembly operations, particles, debris, and oils should be removed before areas are closed out because it may not be possible to inspect or clean these areas again.
Many areas on a spacecraft are inaccessible even when they are not enclosed. The possibility of damaging sensitive components by performing cleaning operations late in the assembly phase may outweigh the benefits of the cleaning.
Spraying operations are particularly hazardous. Oils, paints, and solvents are frequently sprayed. Aerosols from spraying operations can be carried over long distances because the aerosols are very small, usually less than 1 u,m in size.
Areas where spacecraft and components are tested have not always been cleanrooms; however, the current trend is to build new facilities, or modify old ones, to be cleanrooms. This makes the contamination control process much easier.
FACTORY OPERATIONS
Manufacturing Clean hardware to remove oils and chips before assembling. Clean and protect hardware through all operations.
Assembly Clean areas that are being closed out. Protect the hardware.
There may be no way to access areas for inspection and cleaning.
Test Test areas should be clean facilities
Vibro-Acoustic, Thermal, Thermal-Vacuum
339

Thermal-vacuum tests have frequently been a cause of contamination. There has been a tendency to blame the vacuum system for many of the problems; however, outgassing from the spacecraft and test equipment have been major causes of contamination.
The design of the chamber and vacuum pumping equipment is important, but the use of operating procedures that minimizes the probability for contamination are also necessary. The pumpdown, temperature changes, and return to one atmosphere are critical procedures for protecting the spacecraft from self contamination as well as contamination from the chamber and test equipment.
Equipment failures and accidents have also caused actual or possible contam.nation problems. Equipment should be fail-safe so that damage can not occur as a result of a failure. Typical problems have been electrical power and cooling water failures. When vacuum pumps fail or overheat contamination is likely to occur if there is no automatic, controlled shut down and manual restart system.
Errors by personnel have also resulted in problems. Although it is not possible to prevent human errors it is possible to human-engineer a system to reduce the probability of error and to have fail-safe controls installed.
Even if it turns out that no actual contamination occurred as a result of an accident, the time spent investigating and analyzing the failure increases costs and schedule times.
THERMAL VACUUM TESTS 1
Problem Corrective Action
Contamination from Verify prior to test equipment Proper design and procedures
Self contamination Proper operating procedures Monitor contamination
Equipment failure & Design should be "fail safe" personnel error Proper operating procedures
Power & cooling water Pump failure Accident
340

^r~—*—«- - - • ) ^
v
*
Many measurements and tests can be performed during the thermal vacuum test to enhance the confidence and reliability of a system. These include the measurement of outgassing rates, the measurement of contaminant deposition and effects, and evaluation of performance under simulated flight conditions.
. Outgassing rates and contaminant deposition from the Inertial Upper Stage (IUS) were measured during the thermal vacuum test program at the Boeing Company. The data were compared with the results of the contamination analyses and were used to improve the models and assumptions used in the analyses.
Outgassing rates from typical electronic boxes used on the Centaur upper stage were measured at the NASA White Sands Test Facility. The results were used to determine if the outgassing exceeded the predicted maximum allowable rates, based on contamination levels predicted from the contamination analyses. From the test results it was determined that the boxes should be subjected to a vacuum bakeout to reduce outgassing rates to acceptable levels.
There have also been many instances where contamination problems were encountered during thermal vacuum tests, and corrective actions were taken prior to flight. There have also been situations where problems were encountered but not corrected before flight, often because the cause was not understood.
THERMAL VACUUM TESTS 2
Activities to Enhance Confidence and Reliability
Measure Outgassing of Equipment and Spacecraft
Compare with the values used in the contamination analyses
Look for Potential Flight Problems
Evaluate the performance under simulated flight conditions
341

Facilities for handling space systems do not always get adequate attention in comparison with the hardware which go through these facilities. The state of the art with respeci to contamination control has shown a great advance since the design and construction of the older, existing facilities. Also, the cleanliness requirements for spacecraft have become more demanding. The microelectronics industry has been forced to go to Class 10 and Class 1 cleanrooms, with commensurate improvements in procedures, as solid state devices have become smaller and more sensitive to smaller particles.
Although spacecraft do not require the degree of contamination control that is necessary for the fabrication of electronic and optical devices, the technology that has been developed in areas such as air filtration, measurement, garments, procedures, and facility construction are applicable to spacecraft facilities. Greater thought in the design and planning of these facilities is necessary to protect the expensive space hardware being produced.
It appears to be cost effective to design the protection and controls into a facility that is commensurate with the cost of the hardware and cost of schedule slips.
FACILITIES
The cost of building and launching space systems is expensive. Damage, failures, and delays can result in significant cost increases.
Therefore, it is cost effective to design and construct facilities that minimize operating costs and provide fail-safe protection.
Some Problems That Have Been Observed
Overhead water pipe breaks over a long, holiday weekend and is discovered by a guard when water is seen leaking under a wall. Overhead fire sprinkler system leaks or is turned on accidentally.
Local fire generates smoke with the potential for contaminating other hardware in the room, and the local sprinkler sprays
water on some hardware. Air conditioning system ingests outside contaminants.
Oil vapor leaks in from adjacent machine shop. Corrossive vapor from adjacent metal processing room.
342 i
■ /
i
/

■*i
Delays at the launch site are especially costly because all elements of payload-launch vehicle system are affected even when only one of the elements has a problem. All elements must wait for the problems to be resolved. This ties up personnel and facilities.
The Tracking and Data Relay Satellite (TDRS) on Shuttle flight STS-6 experienced a number of problems. These problems included facility and procedural failures.
LAUNCH SITE OPERATIONS 1 Problems during launch site operations have a greater impact on
cost and performance than those during factory operations.
Example: TDRS (Tracking and Data Relay Satellite) on STS-6
Problems:
High winds breached the seals resulting in the ingestion of contaminants into the Payload Changeout Room (PCR).
/ Installation work on the forward bulkhead of the Orbiter
resulted in particulate fallout on to the TDRS.
/ /
343
n

NB2
i t Examples of some contamination problems occurred with the TDRS on STS-6 One event was the breach of the seals between the Orbiter and the PCR during high winds in
>i a storm. Although this was potentially a serious event, analyses of the data showed that the - fnn°nnn ^f? ^ w^EPf^80 Cl3SS 100'000 0nly 0ne time durin9 tn© Storm. Class 100,000 as defined by FED-STD-209, means that there are 100,000 particles per cubic foot >' La!fl°n'
sizes °5 ^ and lar9er- A Class 100,000 cleanroom must never exceed Class £ ISSfrth dUIS9 n0Hmn' °P?rati0?s- The HEPA (High Efficiency Paniculate Air) filters provide I ?n nnn KCifSS 100 air ,nt0 the facility' and cleanrooms can be expected to have a Class I I« ri~ °r ■■ environment during normal operations; therefore, Class 100,000, although
the maximum allowable, is considered very high for a cleanroom. i^o^ As a^sult of .the TDRS event and greater concerns for contamination control at NASA KSC, considerable improvements have been made in facilities and procedures that have reduced the probability of similar problems in the future. ♦wn0,-her p.ü0i?le.m that occurred with STS-6 was the discovery of paniculate nrSlf"at,0nwa!!dl
d!br,5 0nuthe TDRS- Some occurred wnen work «as performed on the £S «n^E?SSc kheaJ1, ab.°Vtth^ TDRS> resultin9 in fallout- Some was found to have been on the TDRS previous to the Orbiter work and the storm. The procedures now reflect niri6 t0, 9r°}e0l {ue. PaVloads when Orbiter work must be pertormed and require
; inspection of payloads before NASA will accept them into the launch site processing.
LAUNCH SITE OPERATIONS 2 TDRS on STS-6
Conclusions:
Significant paniculate contaminants were observed on the TDRS prior to the above events.
Airborne particle counts exceeded Class 100,000 only once during the high winds.
Cleaning in place was limited because of possible damage to the spacecraft, and return to the factory was a major impact to the program.
Corrective Actions:
Clean TDRS as well as possible under the circumstances I because the risk from contamination was low. p. \
e Improvements in facilities and procedures were started at KSC.
344

vaSBLi
»rjs
I
The launch and ascent environments potentially are the greatest contamination hazard for exposed hardware. The vibro-acoustic environment will remove particles from Ser p%ad bay surfaces, or payload fairing surfaces on expendable launch vehicles SoadsancI airoörne support equipment will also be sources of particles dunng ascent. The ÄXt l£w of veS gases and the vehicle acceleration will transport the particles scHt is iSJSÄ wnslder the cleanliness and placement of all hardware within the bay or oavload fairing relative to the contamination sensitive components. /(n.affl.an(c t PY Venting of gases from within hardware may also carry molecu ar contaminants to sensitive componlnts, and aerodynamic heating will increase the outgass.ng rates from payload fairing materials. ^^ mc used & ^ "JV to wal
oarticulate Contaminants within the faying surfaces;, however, it is better o eliminate a» SSSnSSnte from faying surfaces of structures during manufacture to significantly reduce problems du^p ascent. atJons use thrusters> |osive devices and
mechanicKments. These generally produce molecular and particu.ate_con am.nants. Measurements, using a QCM (quartz crystal m.crobalance), on the P74- mission on a
Titan IIIC showed approximately 4 W/cm2 deposition in the payload area from the solid propellant retromotor on Stage 2.
LAUNCH AND ASCENT
The vibro-acoustic environment during ascent will remove particles from surfaces.
Orbiter payload bay
Spacecraft, experiments, and airborne support equipment
Payload fairing on expendable launch vehicles
Aerodynamic heating may increase outgassing rates.
Separation and deployment activities produce molecular and particulate contaminants.
Separation techniques that use explosive devices and/or that cause materials to fracture
Thruster operation Operation of mechanical elements
345
•1

um in«* «uMB ,
f
Spacecraft in low Earth orbits are exposed to an ambient atmosphere that will affect the contaminant deposition and performance. Molecular contaminants that outgas or vent from the spacecraft can be scattered back to the spacecraft as a result of collisions with the atmosphere. This adds to the deposition from direct line of sight transport.
Solar ultraviolet irradiation will enhance contamination as a result of a photochemical deposition process.
Atomic oxygen will remove contaminants, such as hydrocarbons, that produce volatile species during oxidation. Contaminants, such as silicones, that produce solid oxides will remain. The net contaminant deposition, or removal, rate will depend upon the rates of each mechanism.
Spacecraft going to higher orbits will go into a transfer orbit. They may only spend a short time in low Earth orbit , so atmospheric effects may not be significant. There will be exposures to contaminants from additional thruster firings and separation activities.
Examples of contamination problems include the following: Heat soaking back into the Kevlar-epoxy motor case on the IUS (Inertial Upper Stage)
results in higher outgassing rates, and measures were taken to prevent the outgassing products from reaching sensitive components on spacecraft.
A contamination/collision avoidance (C/CAM) maneuver was designed for the separation of the spacecraft from the IUS to prevent outgassing products from the hot solid propellant motor from being emitted towards the spacecraft.
ORBITAL OPERATIONS 1 Low Earth Orbits
Long Exposure Times Self-Contamination Atmospheric Effects
Molecular back scatter increases molecular deposition. Atomic oxygen will remove some molecular deposits.
Solar ultraviolet will enhance the molecular deposition Micro-debris Impacts
Transfer Orbits Atmospheric Effects
This is usually a short exposure. Venting and Outgassing Thrusters Separation
>.\,
346
r.

» irjwr^TTW 'v\' v
j I? As with most spacecraft contamination, the spacecraft is the primary source. Line of
';'• sight transport of molecular contaminants, directly from sources or reflection/emission from secondary surfaces, is the primary mechanism for contamination. Spacecraft electrostatic
£ charging will also result in a return flux of molecular contaminants. This effect was predicted ^; by analyses and then verified by the ML-12 experiment on the SCATHA (Spacecraft
Charging at High Altitudes) spacecraft. fr" As in low altitude orbits, solar ultraviolet irradiation will enhance the deposition of £ molecular contaminants. This effect has been demonstrated on the ML-12 experiment and in I' laboratory experiments.
The electron and proton irradiation does not appear to have a large effect on contaminant deposition based on the ML-12 results. The QCM exposed only in the shadow of the spacecraft did not show the deposition that the QCM exposed to solar irradiation did.
t
ORBITAL OPERATIONS 2
High Earth Orbits
Long Exposure Times
Self Contamination
Spacecraft Charging There is a return flux of charged molecular contaminants that originated from the spacecraft.
Solar ultraviolet will enhance molecular deposition.
The impact of electrons and protons on contaminant buildup is uncertain.
347

Contamination data can be secured from two types of measurements in flight. One type is the experiment or measurement dedicated to contamination. The other involves the use of data from spacecraft housekeeping instruments or from some payload performing another mission related measurement.
Dedicated contamination instruments have flown on Skylab, Shuttle, Titan IMC, LDEF (Long Duration Exposure Facility), SCATHA, NOAA-7, GPS (Global Positioning Satellite), DSP (Defense Support Program), and others. The instruments have included QCMs (quartz crystal microbalances), TQCMs (temperature controlled quartz crystal microbalances), calorimeters (ratio of solar absorptance to total hemispherical emittance), and radiometers.
The performances of spacecraft and components have also revealed the effects of contamination. Temperature measurements combined with analyses using thermal models of spacecraft have shown changes in solar absorptances and thermal ernittances that have been traced back to contamination.
Data from optical sensors have also shown that contamination has affected performances, and analyses of solar array power output has shown evidence of contamination.
The problem with using data from spacecraft housekeeping, sensors, and power systems arises from the fact that there may be many things that affect performance besides contamination and the usually poor precision and accuracy of the measurement.
However, if more spacecraft flight data were analyzed, better contamination information useful for future design and operation would be available. Unfortunately, flight data usually is only analyzed when problems are encountered.
FLIGHT MEASUREMENTS 1 Dedicated Instruments
Skylab: QCMs, Solar Coronagraph
Shuttle: IECM (Induced Environment Contamination Monitor), NASA MSFC, on STS-2,3,4,9
CMP (Contamination Monitor Package), NASA GSFC, on STS-3 IOCM (Interim Operational Contamination Monitor),
AFSD/JPL, on STS-51C PACS (Particle Analysis Camera for Shuttle), AFGL, on STS-51C
Recoverable: LDEF Expendable: QCM on P74-1 (Titan NIC)
ML-12 on SCATHA
TQCM, calorimeter, & UV detector on NOAA-7 Calorimeters en GPS & DSP
Performance Analyses Thermal analyses/Optical Sensor Changes/Electrical Power Analyses
348
if

»mmfwmw-'nAjiiJßmm*
i
Future contamination data in flight will come from the same type of measurements as in the past, dedicated instrumentation and analyses of the performance of spacecraft and payloads.
There are plans for instrumentation on Shuttle flights. The IOCM (Interim Operational Contamination Monitor) was developed by JPL for the Air Force Space Division and is planned to fly on future Shuttle flights. It consists of separate modules that can be attached to the sides of the Orbiter bay and contains both active and passive sensors. Data are recorded in flight and analyzed after the mission. Typical active sensors are TQCMs, radiometers, and calorimeters. Passive witness plates can also be flown on an IOCM module. The IOCM has the flexibility to incorporate new active sensors to perform special measurements.
The APM (Ascent Particle Monitor) was designed and built by Martin Marietta Aerospace for the Air Force Space Division. There are three modules that can be programmed to open and close during the ascent of the Shuttle Orbiter in order to capture particles in the bay. The particles will be counted and analyzed after the return of the Orbiter. The Aerospace Corporation Materials Sciences Laboratory is responsible for the experiment, \ and Rockwell International is responsible for Shuttle integration activities. The NASA Goddard Space Flight Center is providing significant support to the APM experiment. The j first flight of the APM is now planned to be on STS-30, the Magellan Mission, scheduled for launch in April 1989. . ' i
NASA GSFC also has a Contamination Monitor Package (CMP) that has flown on STS-3, will fly on the EOIM-III (Effects of Oxygen Interaction with Materials) experiment, and could be available for future Shuttle flights. ]
The IBSS/SPAS (Infrared Background Signature Survey/Shuttle Pallet Satellite) ] experiment planned for a Shuttle flight will provide some data on contamination in the bay and during deployment and recovery. ;
Unfortunately there appear to be fewer opportunities for flights on spacecraft that are I not recovered. The P-888 mission contains the IAPS (Ion Auxiliary Propulsion System) | experiment sponsored by the NASA Lewis Research Center, The diagnostic instrumentation j includes a QCM and solar cells that will provide general contamination data as well as data * on deposition and effects of the mercury ion thrusters' effluents. !
FLIGHT MEASUREMENTS 2 ! Some Planned Flights \
Shuttle: IOCM (Interim Operational Contamination Monitor) ]
APM (Ascent Particle Monitor) 3
CMP (Contdamination Monitor Package) {
Spacecraft: IAPS (Ion Auxiliary Propulsion System) diagnostic instrumentation on P-888
349

T-W^T^!V. i n^y» ^3L
upon k'o^Ä *%%£> and f «* depends instrumentation and more analvS& nf no^rmlS 5 9ht" Preater use of contamination develop the models fo?^inH0in DeJormance for operational spacecraft are needed to
_ CONCLUSIONS & ASSESSMENTS
fTrotCtHntlml"atl?n Contro1 Prögram must cover the project from the beginning to tr.e end.
easSe9Cf\ySnV° mJnlmiZe sensitjvity to contamination, ease of cleaning, and contaminant production.
XSnSnl an. procedures ar* critical to maintaining Jeanliness during ground operations.
Flight operations should be planned so as to minimize contamination.
More data from flights are required to assess the adequacy of designs and operations.
Standards and specifications should include contamination control requirements.
350

Bibliography
Bareiss, L.E., et. al., "Shuttle/Payload Contamination Evaluation (SPACE) Program Version II, User's Manual", NAS9-15826, MCR-81-509, Martin Marietta Aerospace, 30 Jan. 1981
Borson, E.N. « Peterson, R.V., "Spacecraft Contamination from Propulsion Systems", AFRPL TR-84-068, 31 Aug. 1984
Curran D.G.T. & Millard, J.M., "Contamination/Degradation Measurements on Operational Satellite Thermal Control Surfaces", Progress in Astronautics & Aeronautics, Vol. 60, 1978
DoD, "Product Cleanliness Levels and Contamination Control Program", MIL-STD-1246B, 4 Sept'. 1987
Ehlers H K.F.; Jacobs, S.; Leger, LJ; &.Miller, E, "Space Shuttle Contamination Measurements from Flights STS-1 Through STS-4",.Journ?J of Spacecraft & Rockets, Vol. 2., No. 3, May-June 1984
General Services Administration, "Clean Room and Work Station Requirements, Controlled Environment", FED-STD-209C, 27 Oct. 1987
Ha!! D F ■ Stewart, T. B.; & Hayes, R. R., "Photo-Enhanced Spacecraft Contamination Deposition", Proceedings, 3rd European Symposium on Spacecraft Materials in Space Environment, 01-04/10/85
Hall, D.F., "Flight Experiment to Measure Contamination Enhancement by Spacecraft Charging",'SPIE Vol. 216, Optics in Adverse Environments, 1980
Hall, D.F. & Fote, A.A., "(XS/£H Measurements of Thermal Control Coatings Over Four Years at Geosynchronous. Altitude", Progress in Astronautics & Aeronautics, Vol. 91, 1984
D F Hall, T. B. Stewart, & R. R. Hayes, "Photo-Enhanced Spacecraft Contamination Deposition" Proceedings, 3rd European Symposium on Spacecraft Materials in Space Environment", 1-4 Oct. 1985, ESA SP-232, Nov. 1985
Hetrick M A & Hoffman, R.J., "CONTAM Data Analysis and Model Improvement Study (CONTAM II!): Review & Asses V II: S/C Flight Data", AFRPL-1R-79-13, Apri! 1979
Hetrick MA & Romine, G.L, "Payload Contamination Environment for Titan MIC Launch Vehicle's Using Launch Complex 40", MCR-75-118, Martin Marietta, Jan. 1975
Huanq S & Hetrick, M. A., "Preliminary Correlation of Spacecraft Contamination Flight Data with the Modified SPACE II Computer Model", AIAA-86-1357, Thermophysics Conf., 2-4 June 1986
IES, "Compendium of Standards, Practices, Methods and Similar Documents Relating to Contamination Control", IES-CC-009-84, 1984
351
rJWT.TT:-aa::.- •-"T*.-
P
Jarossy, F. J.; Pizzicaroli, J. C; & Owen, N. L, "Shuttle/Payload Contamination Evaluation (SPACE) Program Improvements", Shuttle Optical Environment, Prcc. SPIE, V 287, pp 78-85, (1981)
Lynch, J.T., "Quartz Crystal Microbalance (QCM) Monitor of Contamination for LES-8/9, 9th Space Simulation Conference, NASA CP-2007, 26-28 April 1977
Lyon, W.C., "Thruster Exhaust Effects Upon Spacecraft", NASA-TMX-65427, Oct. 1970
Maag, C.R. & Millard, Ü.M., "NOAA Contamination Monitoring Instrument, Design and Performance of a Contamination Monitoring Instrument on a NOAA Satellite", AFRPL-TR-85- 065, Sept. 1985
Mc Keown, D.; Fountain, J.A.; Cox, V.H.; & Peterson.R.V., "Analysis of TQCM Surface Contamination Absorbed During the Spacelab 1 Mission", AIAA-85-7008-CP, 13-15 Nov. 1985
Miller, E.R., ed., "IECM Preliminary Results from the Spacelab 1 Flight", NASA TM-86461, Aug. 1984
Rantanen, R.O. & Gordon, T.D., "Contaminant Buildup on Ram Facing Spacecraft Surfaces", Proc. SPIE V777, pp 26-33, (1987)
J. J. Scialdone, "An Estimate of the Outgassing of Space Payloads and Its Gaseous Influence on the Environment", Journal Spacecraft & Rockets, Vol. 23, No. 4, July-Aug. 1986
Scialdone, J.J., "Paniculate Contaminant Relocation During Ascent", NASA TM 87794, June 1986
Scialdone, J.J., "Redistribution of Particulates During Launch", Space Simulation Conference, NASA CP 2446, 3-6 Nov. 1986
Simpson, J.P.& Witteborn, F.C. "Effect of the Shuttle Contaminant Environment on a Sensitive Infrared Telescope", Applied Optics, Vol. 16, No. 8, Aug. 1977
Stewart, T.; Arnold, G.; Hall, D.; Marvin, D.; Hwang, W.; Chandler, R.; & Martin, H., "Photochemical Self-Contamination", AIAA 88-2728, Thermophysics Conf., 27-29 June 1988.
352
-.-.I

EFFECTS OF THE CONTAMINATION ENVIRONMENT ON SURFACES AND MATERIALS
CARL R. MAAG JET PROPULSION LABORATORY
PASADENA, CALIFORNIA
Wi
353

CONTAMINATION CAN BE CONSIDERED AN INDUCED ENVIRONMENTAL EFFECT. CONTAMINATION, BOTH MOLECULAR AND PARTICULATE, HAS CAUSED DEGRADATION IN BOTH OPTICAL AND THERMAL CONTROL SYSTEMS.
INTRODUCTION
IN ADDITION TO THE ISSUES THAT HAVE ALWAYS EXISTED, NEW DEMANDS ARE BEING PLACED ON SPACE SYSTEMS FOR INCREASED CONTAMINATION PREVENTION/CONTROL
OPTICAL SURVEILLANCE SENSORS ARE REQUIRED TO DETECT LOW RADIANCE TARGETS. THIS INCREASES THE NEED FOR VERY LOW SCATTER SURFACES IN THE OPTICAL SYSTEM. PARTICULATE CONTAMINATION LEVELS TYPICALLY EXPERIENCED IN TODAY'S WORKING ENVIRONMENTS/HABITS WILL MOST LIKELY COMPROMISE THESE SENSORS
CONTAMINATION (MOLECULAR AND PARTICULATE) CAN ALSO AFFECT THE SURVIVABILITY OF SPACE SENSORS IN BOTH THE NATURAL AND HOSTILE SPACE ENVIRONMENTS
354

i~ " • i i r ' l> n n i'unJaH
1
.-T j
DI-OCTYL PHTHALATE (DOP) IS A TYPICAL SPACECRAFT CONTAMINANT. DOP IS USED AS BOTH A PLASTICIZER IN POLYMERIC MATERIALS AND AS A MATERIAL TO CHECK THE EFFICIENCY OF HEPA FILTERS IN CLEAN ROOMS. IT HAS BEEN OBSERVED TO BE CARRIED DOWNSTREAM IN THE AIR FLOW OF A CLEAN ROOM AND COAT CRITICAL OPTICS. AN IR SPECTRA OF A THIN FILM IS SHOWN BELOW.
/■".
INFRARED ABSORPTION SPECTRA OF DI-N-OCTYL PHTHALATE
n
6 ; » X 405A
WAVtNUftt|f*£MI
355

-UM
IN ADDITION TO HAVING S1P.0NG ABSORPTION BANDS IN THE IR WAVELENGTH REGION, DOP ABSORBS STRONGLY IN THE ULTRAVIOLET WAVELENGTH REGION. ABSORPTION AS A FUNCTION OF THICKNESS IS SHOWN BELOW.
>
ULTRAVIOLET ABSORPTION SPECTRA OF DI-N-OCTYL PHTHALATE
,V* <»I»|M1»1|'*W!«IMW>»*'
^
356
a

V5F*V"
OUTGASSING PRODUCTS CAN ABSORB STRONGLY EVEN BEFORE PHOTOLYSIS CAN CAUSE ADDITIONAL DARKENING. THE FIGURE BELOW SHOWS THAT APPROXIMATELY 500Ä OF RTV 560 OUTGAS PRODUCTS CAUSED A 0.03 INCREASE IN SOLAR ABSORPTANCE ON AN ALUMINIZED SECOND SURFACE MIRROR.
CHANGE OF SOLAR ABSORPTANCE BY RTV560 OUTGAS PRODUCTS
.;
u 2 <
< 10
5 o
o z
10
A Al/OSR
O AsAOS*
10 10
DEPOSIT SURFACE DENSITY (a/c«0 10
357
fe

r ■ U»ll>»,. I>—
t THE REFRACTIVE INDEX OF AN ORGANIC FILM CAN CAUSE GIGANTIC VARIATIONS IN REFLECTANCE IF DEPOSITED ON A MIRROR. BELOW ONE CAN SEE THE DIFFERENCES ON A FRONT SURFACE VIS/IR MIRROR.
V
REFLECTANCE AS A FUNCTION OF THE INDEX OF REFRACTION OF A CONTAMINANT FILM (550A) DEPOSITED ON A VIS/IR MIRROR
10 15 2.0 2.5 30
W&LX Of 8EFHACTI0N 3.5 40
358

:5ff »j-rjw> 'Pnnww^-'wmM^ffffiBnc»- ^'«ftyiw^»'^^»» X
4
BELOW SHOWS EXAMPLES OF BO^H raLRET?rIrIC^MnR°PERTIES- THE CHART DEPOSITED ON A GOLD MIRROR. THEORETICAL AND EMPIRICAL DATA AS
REFLECTANCE OF A GOLD MIRROR (MID IR) AS A FUNCTION OF WATER ICE THICKNESS
(
THICKNESS OF ICE. fun
A = ESTIMATED AVERAGE B = WORST CASE
359

fMSSmZaZZ,
™™»™ES„ CAN CAUSE CHANGES IN THE RADIATIVE PROPERTIES OF THERMAL CONTROL SURFACES. AS CAN BE SEEN FROM THE FIGURE BELOW, CARBON PARTICLES ARE ONE OF THE MORE DELETERIOUS FORMS CARBONPARTICLE DEPOSITS FROM SOLID ROCKET MOTORS (SRM'S) HAVE BEEN SEEN TO HAVE SIMILAR EFFECTS WHEN DEPOSITING ON THERMAL SURFACES.
CHANGE OF SOLAR ABSORPTANCE BY CARBON PARTICLE DEPOSI
1.0
0.8
\ 0.6
1 0.4 o
0.2
-i i—i—r
O ON Al/FOSR A O & ON ALCLAD 7075-T6 ALUMINUM
CARBON PARHCLE SIZES-0.16 TO 0.08 jan
CLEAN Al a » 0.191
10
CLEAN Al/FOSR . a =0.137
I I I 10 10
CARSON DEPOSIT [a/cm1) V
360
c

4 *
i"ji-iiMin« WJWHI »»WPmm MS«
f ^i
^ 3
AS CAN BE SEEN, LARGER PARTICLE SIZES CAUSE GREATER CHANGES IN RADIATIVE PROPERTIES. THIS IS DUE PRINCIPALLY TO OBSCURATION. SMALLER PARTICLES, ALTHOUGH HAVING LESS IMPACT IN ANY CHANGE OF SOLAR ABSORPTANCE, CAUSE INCREASED SCATTERING.
EFFECT OF PARTICLE SIZES ON CHANGE OF SOLAR ABSORPTANCE
1-0
0.8 -
u z , < 0.6
3"
1 1
CARBON PARTICLE SUES:
1 i
O 0.16 TO 0.08 „m A 0.0I2-*.« AVERAGE
O
x^A
/A -
/" —
"
CLEAN S-I3CLO, a^ » 0.24
•
i i 1
0.2 -
,o-6 >o-s 2 CARBON PARTICLE DEPOSIT (i^cm )
10 -4
361

r PARTICLES FIVE (5) MICROMETERS AND ABOVE CAN CAUSE SIGNIFICANT OBSCURATION AS EXHIBITED BELOW.
OBSCURATION RATIO OF A SURFACE VERSUS NUMBER OF PARTICLES PER FT2(>5>iM)
*
10'
10
oa
10
10 '
10' 101 10 10' 10' 107 10s
PWIKI« Fallout pw h">5 Jim
\
362

mv-mwmn"* —>MU W mi w- «w<nwf"«ivw«i«|u
f
i
THE J3I-DIRECTI0NAL REFLECTANCE JDISTRIBUTION FUNCTION (BRDF) , A METHOD OF DESCRIBING SCATTERING ON OPTICAL SURFACES, CAN BE SIGNIFICANTLY ALTERED BY SMALL PARTICLES.
BRDF OF AN ALUMINUM MIRROR
h
10u
.«•1
t
• CONTAMINATfO: 0.0ft OIS
10
..2
!
10'
E
i ^^.
^ 10 o E m
| ^W -CLEAN
10 : ^^:
10 1 i
4 • • I 2 4 • ■ 10 20 40 CO
SCATTER ANCLE. DEGREES
\
363

r ■•■»I
IN ADDITION TO INDUCED CONTAMINATION FROM OUTGASSING PRODUCTS OH PARTICLE DEPOSITION, THE EFFLUENTS FROM PROPULSION SYSTEMS CAN BOT-* DAMAGE SURFACES AND/OR CHANGE THEIR OPTICAL AND THERMAL PROPERTIFS
>
PRODUCTION AND TRANSPORT OF PLUME EFFLUENTS
I _! SWOKELIivt UtPUJIli 1 2 micron*
UNBURNED VAPOH 3% TOTAL PROPELLANT
SMALL FAST MOVING DROHLCTS 10 &Ü0 microns 100 S00U It/sec 3fl* TOTAL PROPELLANT (TRANSIENT)
*"*«». «^. ABRASION AND i "*"■—» DEPOSITION DAMAUt
LAHGE SLOW MOVING / DROPLETS
y 1000 4000 miciunj ' DEPOSITION DAMAGE
0.1% TOTAL PROPELLANT (WALL FILM SPLATTER)
\
\ \
1 V
364

ä
K
NASA Setter -vjwrtsi'acn
Report Documentation Page
1. Report No.
NASA CP-3035, Part 1
2. Government Accestion No.
4. Title and Subtitle
NASA/SDJO Space Environmental Effects on Materials Workshop
7. Authorlsl
Louis A. Teichman and Bland A. Stein, Compilers
9. Performing Organization Name and Address NASA Längley Research tenter Hampton, Virginia 23665-5225
12. Sponsoring Agency Name and Address National Aeronautics and Space Administration Washington, DC 20546-0001 and Department of Defense - Strategic Defense Initiative Organization, Washington, DC 20301-7100
15. Supplementary Notes
3. Recipient's Catalog No.
5. Report Date
May 1989
6. Performing Organization Code
8. Performing Organization Report No.
L-16575 10. Work Unit No.
506-43-21-04
11. Contract or Grant No.
13. Type of Report and Period Covered
Conference Publication
14. Sponsoring Agency Code
The National Aeronautics and Space Administration (NASA) and the Strategic Defense Initiative Organization (SDI0) cosponsored a workshop on Space Environmental Effects on Materials at the NASA Langley Research Center from June 28 to July 1, 1988. The joint workshop was designed to inform participants of the present state of knowledge regarding space environmental effects on materials and to identify knowledge gaps that prevent informed decisions on the best use of advanced materials in space for long-duration NASA and SDI0 missions. Establishing priorities for future ground-based and space-based materials research was a major goal of the workshop. The end product of the workshop was an assessment of the current state-of-the-art in space environmental effects on materials in order to develop a national plan for spaceflight experiments. The workshop was intended for participation by expert applied researchers, systems technologists, and program managers for spacecraft systems.
17. Key Words (Suggested by Aumorls»
Space environmental effects on materials Atomic oxygen Micrometeoroids and debris Contamination Thermal and ultraviolet (UV) radiation Particulate radiation and cosmic rays
19. Security Classif. lof this reportl
Unclassified
18. Distribution Statement
Unclassified - Unlimited
Subject Category 23
20. Security Claisif. (of this page)
Unclassified 21. No. of pages
373
22. Price
A16
NASA FORM 1628 OCT 86 For sale by the National Technical Information Service, Springfield, Virginia 22161-2171
NASA-Linflay, IMS
£