
Voyager 2 at Neptune: Imaging Science Results
28
Voyager 2 at Neptune: Imaging Science Results B. A. SMITH, L. A. SODERBLOM, D. BANFIELD, C. BARNET, A. T. BASILEVKSY, R. F. BEEBE, K. BOLLINGER, J. M. BOYCE, A. BRAHIc, G. A. BRIGGS, R. H. BROWN, C. CHYBA, S. A. COLLINS, T. COLVIN, A. F. COOK II, D. CRisp, S. K. CROFT, D. CRUIKSHANK, J. N. Cuzzi, G. E. DANIELSON, M. E. DAVIES, E. DE JONG, L. DONES, D. GODFREY, J. GOGUEN, I. GRENIER, V. R. HAEMMERLE, H. HAMMEL, C. J. HANSEN, C. P. HELFENSTEIN, C. HOWELL, G. E. HUNT, A. P. INGERSOLL, T. V. JOHNSON, J. KARGEL, R. KIRK, D. I. KUEHN, S. LIMAYE, H. MASURSKY, A. MCEWEN, D. MORIUSON, T. OWEN, W. OWEN, J. B. POLLACK, C. C. PoRco, K. RAGES, P. ROGERS, D. RUDY, C. SAGAN, J. SCHWARTZ, E. M. SHOEMAKER, M. SHOWALTER, B. SICARDY, D. SIMONELLI, J. SPENCER, L. A. SROMOVSKY, C. STOKER, R. G. STROM, V. E. SuoMI, S. P. SYNOTr, R. J. TERRILE, P. THOMAS, W. R. THOMPSON, A. VERBISCER, J. VEVERKA Voyager 2 images of Neptune reveal a windy planet characterized by bright clouds of methane ice suspended in an exceptionally clear atmosphere above a lower deck of hydrogen sulfide or ammonia ices. Neptune's atmosphere is dominated by a large anticyclonic storm system that has been named the Great Dark Spot (GDS). About the same size as Earth in extent, the GDS bears both many similarities and some differences to the Great Red Spot of Jupiter. Neptune's zonal wind profile is remarkably similar to that of Uranus. Neptune has three major rings at radii of 42,000, 53,000, and 63,000 kilometers. The outer ring contains three higher density arc-like segments that were apparently responsible for most of the ground-based occultation events observed during the current decade. Like the rings of Uranus, the Neptune rings are composed of very dark material; unlike that of Uranus, the Neptune system is very dusty. Six new regular satellites were found, with dark surfaces and radii ranging from 200 to 25 kilometers. All lie inside the orbit of Triton and the inner four are located within the ring system. Triton is seen to be a differentiated body, with a radius of 1350 kilometers and a density of 2.1 grams per cubic centimeter; it exhibits clear evidence of early episodes of surface melting. A now rigid crust of what is probably water ice is overlain with a brilliant coating of nitrogen frost, slightly darkened and reddened with organic polymer material. Streaks of organic polymer suggest seasonal winds strong enough to move particles of micrometer size or larger, once they become airborne. At least two active plumes were seen, carrying dark material 8 kilometers above the surface before being transported downstream by high level winds. The plumes may be driven by solar heating and the subsequent violent vaporization of subsurface nitrogen. VO OYAGER 2 ACQUIRED MORE THAN 9000 images of Neptune, its rings, and its satellites during a 6-month interval surrounding the spacecraft's closest approach to the planet on 25 August 1989. B. A. Smith, S. K. Croft, V. R. Haemmerle, J. Kargel, C. C. Porco, R. G. Strom, University of Arizona, Tucson, AZ 85721. L. A. Soderblom, R. Kirk, H. Masursky, A. McEwen, E. M. Shoemaker, U.S. G.S., Flagstaff, AZ 86001. D. Banfield, G. E. Danielson, E. De Jong, C. Howell, A. P. Ingersoll, J. Schwartz, California Institute of Technol- ogy, Pasadena, CA 91125. C. Barnet, R. F. Beebe, D. I. Kuehn, New Mexico State University, Las Cruces, NM 88003. A. T. Basilevsky, Vernadsky Institute for Cosmochemis- try, USSR Academy of Science, Moscow. K. Bollinger, R. H. Brown, S. A. Collins, D. Crisp, J. Goguen, H. Hammel, C. J. Hansen, T. V. Johnson, W. Owen, D. Rudy, S. P. Synnott, R. J. Terrile, Jet Propul- sion Laboratory, Pasadena, CA 91109. J. M. Boyce and G. A. Briggs, NASA Headquarters, Washington, DC 20546. A. Brahic, I. Grenier, B. Sicardy, Observatoire de Paris, Meudon, Paris, France. C. Chyba, C. P. Helfenstein, C. Sagan, D. Simonelli, P. Thomas, W. R. Thompson, A. Verbiscer, J. Veverka, The combination of the very low light levels experienced at Neptune [30 astronomical units (AU) from the sun] and the low albedo of its rings and inner satellites, how- ever, made it necessary to employ uncom- Cornell University, Ithaca, NY 14853. A. F. Cook II, Center for Astrophysics, Cambridge, MA 02138. T. Colvin and M. E. Davies, P. Rogers, Rand Corpora- tion, Santa Monica, CA 90406. D. Cruikshank, J. N. Cuzzi, D. Morrison, J. B. Pollack, C. Stoker, NASA Ames Research Center, Moffett Field, CA 94035. L. Dones, University of Toronto, Toronto, Ontario M5S lAl, Canada. D. Godfrey, National Optical Astronomy Observatories, Tucson, AZ 85726. G. E. Hunt, Logica International, Ltd., 64 Neisman Street, London, England WIA 4SE. S. Limaye, L. A. Sromovsky, V. E. Suomi, University of Wisconsin, Madison, WI 53706. T. Owen, State University of New York, Stony Brook, NY 11794. K. Rages, Mycol, Inc., Sunnyvale, CA 94087. M. Showalter, Stanford University, Stanford, CA 94305. J. Spencer, Institute for Astronomy, University of Ha- waii, Honolulu, HI 95822. fortably long exposure times for many of the sequences. This, in turn, required the use of a special sequence design to compensate for image smear caused by spacecraft motion. In addition, spacecraft engineering teams modi- fied the attitude control software to provide further reduction of random spacecraft mo- tion over that achieved earlier at the Uranus encounter (1). The success of these techniques is aptly demonstrated in the striking photo- graphs that Voyager 2 has sent back to Earth from the very edge of our planetary system. The Atmosphere of Neptune Neptune's atmosphere provided many surprises during the Voyager encounter. The high wind speeds, the persistence of large oval storm systems, and the hour-to- hour variability of small-scale features were unexpected in an atmosphere that receives 1/20 as much energy (power per unit area) from internal heat and absorbed sunlight as Jupiter and only 1/350 as much energy as Earth. Large features near the equator move westward relative to the interior at speeds up to 325 m s-l, making Neptune one of the windiest planets (with Saturn) in the solar system. Small-scale features appear to move at twice this speed. The Great Dark Spot (GDS), a weather system comparable to Earth in size, stretches and contracts as it rolls in a counterclockwise direction with a 16-day period. Bright clouds cast shadows on the main cloud deck 50 to 100 km below. At some latitudes, the bright clouds re- semble mountain lee waves, where large- scale patterns remain fixed while small-scale elements move through them. Such patterns were not seen on the other gas giant planets. Although the atmospheres of the giant plan- ets do exhibit some common phenomena- colored clouds and hazes, latitudinal band- ing, strong winds, for example-there re- main many differences and they do not follow obvious rules. Discrete cloud features and banded structure. The largest discrete feature in Neptune's atmosphere is the GDS, which resembles Jupiter's Great Red Spot (GRS) in several respects. Neptune's GDS has an average extent of 38° and 150 in longitude and latitude, respectively (Figs. LA, 2, and 3A), compared with 30° and 200 for the GRS (2). The GDS is located at about the same latitude as the GRS (20°S) and seems to have a similar anticyclonic circulation sense (counterclockwise in the southern hemi- sphere). Evidence for the anticyclonic rota- tion of the GDS is based primarily on visual impressions gained from a time-lapse se- quence, rather than on cirect measurement SCIENCE, VOL. 246 1422
-
Upload
independent -
Category
Documents
-
view
0 -
download
0
Transcript of Voyager 2 at Neptune: Imaging Science Results

Voyager 2 at Neptune: Imaging Science Results
B. A. SMITH, L. A. SODERBLOM, D. BANFIELD, C. BARNET, A. T. BASILEVKSY,R. F. BEEBE, K. BOLLINGER, J. M. BOYCE, A. BRAHIc, G. A. BRIGGS,R. H. BROWN, C. CHYBA, S. A. COLLINS, T. COLVIN, A. F. COOK II,D. CRisp, S. K. CROFT, D. CRUIKSHANK, J. N. Cuzzi, G. E. DANIELSON,M. E. DAVIES, E. DE JONG, L. DONES, D. GODFREY, J. GOGUEN, I. GRENIER,V. R. HAEMMERLE, H. HAMMEL, C. J. HANSEN, C. P. HELFENSTEIN,C. HOWELL, G. E. HUNT, A. P. INGERSOLL, T. V. JOHNSON, J. KARGEL,R. KIRK, D. I. KUEHN, S. LIMAYE, H. MASURSKY, A. MCEWEN,D. MORIUSON, T. OWEN, W. OWEN, J. B. POLLACK, C. C. PoRco, K. RAGES,P. ROGERS, D. RUDY, C. SAGAN, J. SCHWARTZ, E. M. SHOEMAKER,M. SHOWALTER, B. SICARDY, D. SIMONELLI, J. SPENCER, L. A. SROMOVSKY,C. STOKER, R. G. STROM, V. E. SuoMI, S. P. SYNOTr, R. J. TERRILE,P. THOMAS, W. R. THOMPSON, A. VERBISCER, J. VEVERKA
Voyager 2 images of Neptune reveal a windy planet characterized by bright clouds ofmethane ice suspended in an exceptionally clear atmosphere above a lower deck ofhydrogen sulfide or ammonia ices. Neptune's atmosphere is dominated by a largeanticyclonic storm system that has been named the Great Dark Spot (GDS). About thesame size as Earth in extent, the GDS bears both many similarities and somedifferences to the Great Red Spot of Jupiter. Neptune's zonal wind profile isremarkably similar to that of Uranus. Neptune has three major rings at radii of42,000, 53,000, and 63,000 kilometers. The outer ring contains three higher densityarc-like segments that were apparently responsible for most of the ground-basedoccultation events observed during the current decade. Like the rings of Uranus, theNeptune rings are composed ofvery dark material; unlike that ofUranus, the Neptunesystem is very dusty. Six new regular satellites were found, with dark surfaces and radiiranging from 200 to 25 kilometers. All lie inside the orbit ofTriton and the inner fourare located within the ring system. Triton is seen to be a differentiated body, with aradius of 1350 kilometers and a density of 2.1 grams per cubic centimeter; it exhibitsclear evidence of early episodes of surface melting. A now rigid crust of what isprobably water ice is overlain with a brilliant coating of nitrogen frost, slightlydarkened and reddened with organic polymer material. Streaks of organic polymersuggest seasonal winds strong enough to move particles of micrometer size or larger,once they become airborne. At least two active plumes were seen, carrying darkmaterial 8 kilometers above the surface before being transported downstream by highlevel winds. The plumes may be driven by solar heating and the subsequent violentvaporization of subsurface nitrogen.
VO OYAGER 2 ACQUIRED MORE THAN9000 images of Neptune, its rings,and its satellites during a 6-month
interval surrounding the spacecraft's closestapproach to the planet on 25 August 1989.
B. A. Smith, S. K. Croft, V. R. Haemmerle, J. Kargel, C.C. Porco, R. G. Strom, University of Arizona, Tucson,AZ 85721.L. A. Soderblom, R. Kirk, H. Masursky, A. McEwen, E.M. Shoemaker, U.S. G.S., Flagstaff, AZ 86001.D. Banfield, G. E. Danielson, E. De Jong, C. Howell, A.P. Ingersoll, J. Schwartz, California Institute of Technol-ogy, Pasadena, CA 91125.C. Barnet, R. F. Beebe, D. I. Kuehn, New Mexico StateUniversity, Las Cruces, NM 88003.A. T. Basilevsky, Vernadsky Institute for Cosmochemis-try, USSR Academy of Science, Moscow.K. Bollinger, R. H. Brown, S. A. Collins, D. Crisp, J.Goguen, H. Hammel, C. J. Hansen, T. V. Johnson, W.Owen, D. Rudy, S. P. Synnott, R. J. Terrile, Jet Propul-sion Laboratory, Pasadena, CA 91109.J. M. Boyce and G. A. Briggs, NASA Headquarters,Washington, DC 20546.A. Brahic, I. Grenier, B. Sicardy, Observatoire de Paris,Meudon, Paris, France.C. Chyba, C. P. Helfenstein, C. Sagan, D. Simonelli, P.Thomas, W. R. Thompson, A. Verbiscer, J. Veverka,
The combination of the very low light levelsexperienced at Neptune [30 astronomicalunits (AU) from the sun] and the lowalbedo of its rings and inner satellites, how-ever, made it necessary to employ uncom-
Cornell University, Ithaca, NY 14853.A. F. Cook II, Center for Astrophysics, Cambridge, MA02138.T. Colvin and M. E. Davies, P. Rogers, Rand Corpora-tion, Santa Monica, CA 90406.D. Cruikshank, J. N. Cuzzi, D. Morrison, J. B. Pollack,C. Stoker, NASA Ames Research Center, Moffett Field,CA 94035.L. Dones, University of Toronto, Toronto, OntarioM5S lAl, Canada.D. Godfrey, National Optical Astronomy Observatories,Tucson, AZ 85726.G. E. Hunt, Logica International, Ltd., 64 NeismanStreet, London, England WIA 4SE.S. Limaye, L. A. Sromovsky, V. E. Suomi, University ofWisconsin, Madison, WI 53706.T. Owen, State University of New York, Stony Brook,NY 11794.K. Rages, Mycol, Inc., Sunnyvale, CA 94087.M. Showalter, Stanford University, Stanford, CA 94305.J. Spencer, Institute for Astronomy, University of Ha-waii, Honolulu, HI 95822.
fortably long exposure times for many ofthesequences. This, in turn, required the use ofa special sequence design to compensate forimage smear caused by spacecraft motion. Inaddition, spacecraft engineering teams modi-fied the attitude control software to providefurther reduction of random spacecraft mo-tion over that achieved earlier at the Uranusencounter (1). The success ofthese techniquesis aptly demonstrated in the striking photo-graphs that Voyager 2 has sent back to Earthfrom the very edge of our planetary system.
The Atmosphere of NeptuneNeptune's atmosphere provided many
surprises during the Voyager encounter.The high wind speeds, the persistence oflarge oval storm systems, and the hour-to-hour variability of small-scale features wereunexpected in an atmosphere that receives1/20 as much energy (power per unit area)from internal heat and absorbed sunlight asJupiter and only 1/350 as much energy asEarth. Large features near the equator movewestward relative to the interior at speedsup to 325 m s-l, making Neptune one ofthe windiest planets (with Saturn) in thesolar system. Small-scale features appear tomove at twice this speed. The Great DarkSpot (GDS), a weather system comparableto Earth in size, stretches and contracts as itrolls in a counterclockwise direction with a16-day period. Bright clouds cast shadowson the main cloud deck 50 to 100 kmbelow.At some latitudes, the bright clouds re-
semble mountain lee waves, where large-scale patterns remain fixed while small-scaleelements move through them. Such patternswere not seen on the other gas giant planets.Although the atmospheres of the giant plan-ets do exhibit some common phenomena-colored clouds and hazes, latitudinal band-ing, strong winds, for example-there re-main many differences and they do notfollow obvious rules.
Discrete cloud features and banded structure.The largest discrete feature in Neptune'satmosphere is the GDS, which resemblesJupiter's Great Red Spot (GRS) in severalrespects. Neptune's GDS has an averageextent of 38° and 150 in longitude andlatitude, respectively (Figs. LA, 2, and 3A),compared with 30° and 200 for the GRS (2).The GDS is located at about the samelatitude as the GRS (20°S) and seems tohave a similar anticyclonic circulation sense(counterclockwise in the southern hemi-sphere). Evidence for the anticyclonic rota-tion of the GDS is based primarily on visualimpressions gained from a time-lapse se-quence, rather than on cirect measurement
SCIENCE, VOL. 2461422
of the displacement of small features. How-ever, there are significant differences be-tween the GDS and the GRS. The circula-tion of the GRS modifies its surroundingenvironment, forming a turbulent-wake re-gion to the west ofthe feature (2). Althoughthe GDS on Neptune also appears to influ-ence its immediate environment, the regionssurrounding it appear morphologicallymore uniform compared to those on Jupiter.Furthermore, the GDS drifts rapidly west-ward at speeds over 300 m s- I relative to theplanetary radio rate (3, 4), while the GRSdrifts westward at an average rate of only 3ms-' (5).The bright companion along the southern
edge of the GDS (Figs. 1 and 3A) wasdetected in January 1989; it was the firstdiscrete feature observed on Neptune byVoyager 2, and was also seen in ground-based images (4, 6). This feature persistentlyappeared on the southern edge of the GDS,although its brightness and precise shapevaried with time. In Fig. 3A, the brightcompanion is resolved into east-west linearstructures.
Time-lapse images of the GDS and itsvicinity (Fig. 4) suggest that the brightcompanion may be similar to orographicclouds observed on Earth, that is, cloudscreated by air being forced upward by thepresence of a mountain. Specifically, the
smallest features appeared to move relativeto the structure as a whole. The role oftopography, necessary for the formation ofterrestrial orographic clouds, may be playedby temperature and pressure anomalies asso-ciated with the GDS.A bright feature near the southern pole
(71°S) was first seen in April 1989 (Fig.1B). This south polar feature (SPF) appearsto be not one discrete feature but rather anactive arc extending over some 900 of longi-tude and constrained to a latitudinal bandspanning less than 5°. The intensity anddistribution of brightness along this arc wasseen to vary significantly during a singlerotation of the planet.The third bright feature discovered by
Voyager (after the bright companion to theGDS and the SPF) was the "Scooter," abright compact feature centered near 42°S(Fig. 1A); despite its name, however, it isnot the fastest moving feature (4). The"Scooter" is composed ofmany small streaksstacked in latitude (Fig. 3C) rather thanbeing a single round or oval storm system.The number and length of these streaksvaries (causing the feature to change shapefrom round to square to triangular), but thecomposite structure identified as the "Scoot-er" persisted as a unit throughout the 80-day encounter period.Soon after the discovery of the "Scooter,"
a second dark feature (D2) was identified inthe southern hemisphere at a latitude of550S (Figs. 1, A and B). Several weeks afterits discovery, a bright core developed at thecenter of the dark feature. The core re-mained visible for the remainder of theencounter, although its brightness varied.Small-scale cloud features were clearly visi-ble within the bright core (Fig. 3B). Figure5 shows three high-resolution images of thecloud structure in the core of D2. The sizeand shape of the local details varied on timescales of hours. On Jupiter, features similarto D2 rotate anticyclonically, but the senseof circulation has not yet been detected inD2.Voyager images of Neptune's atmosphere
(Fig. 1, A and B) revealed a banded zonalstructure with the brightest region locatednear 20°S. Bands of lower reflectivity in thenorthern and southern hemispheres werelocated at 6°N to 25°N and 45°S to 70°S,that is, the brightness variation was notsymmetrical about the equator. This asym-metry is also seen in Fig. 2, where the effectof viewing geometry was removed to showthe brightness at normal incidence (7).Bright ephemeral streamers were seen bothat the latitude of the GDS (Fig. 6) and atabout 27N. These streamers were highlyvariable in both time and brightness. Meth-ane-band images of the southern hemi-
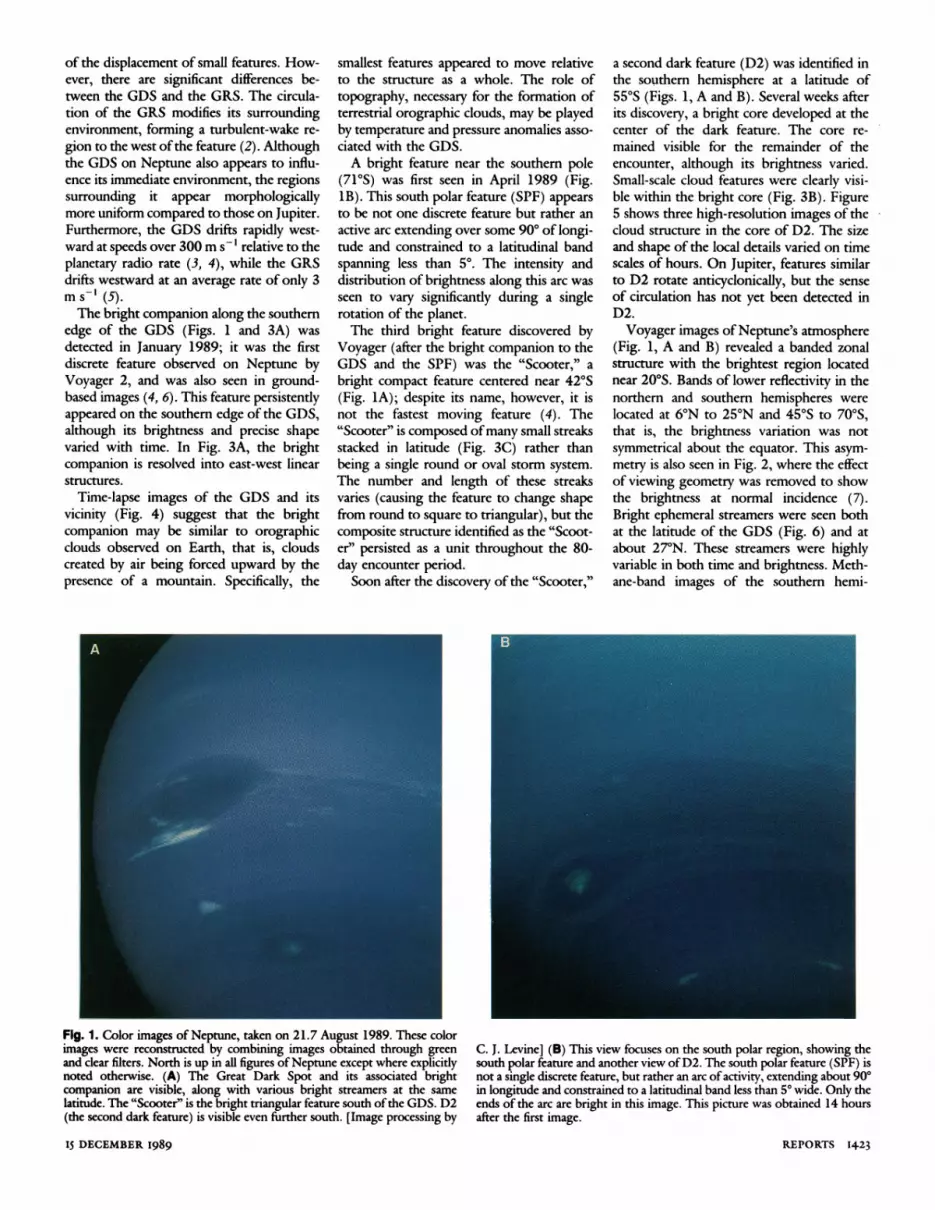
Fig. 1. Color images of Neptune, taken on 21.7 August 1989. These colorimages were reconstructed by combining images obtained through greenand clear filters. North is up in all figures ofNeptune except where explicitlynoted otherwise. (A) The Great Dark Spot and its associated brightcompanion are visible, along with various bright streamers at the samelatitude. The "Scooter" is the bright triangular feature south ofthe GDS. D2(the second dark feature) is visible even further south. [Image processing by
15 DECEMBER I989
C. J. Levine] (B) This view focuses on the south polar region, showing thesouth polar feature and another view ofD2. The south polar feature (SPF) isnot a single discrete feature, but rather an arc of activity, extending about 900in longitude and constrained to a latitudinal band less than 50 wide. Only theends of the arc are bright in this image. This picture was obtained 14 hoursafter the first image.
REPORTS 1423

sphere revealed a bright band within 150 ofthe south pole. To within an uncertainty of10, a small feature lies at the south rotationalpole (Figs. 7 and 8). This structure suggestsa well-organized polar circulation that hasno analogue in the polar regions ofthe othergiant planets.
Vertical structurefrom feature contrast. Analy-ses of ground-based observations of Nep-tune (8-11) and analogous studies of Ura-nus (11, 12) indicated the presence of threemajor particulate layers in the observableatmosphere of Neptune (Fig. 9). A photo-chemical smog layer was predicted at pres-sures starting at about 5 mbar in the lowerstratosphere and extending to lower alti-tudes in the stratosphere and upper tropo-sphere (8, 10, 13). This layer, composed oflower order hydrocarbons such as ethane,acetylene, and diacetylene, results from pho-tochemistry of methane driven by solar ul-traviolet radiation within the lower andupper stratosphere.
Two condensation cloud layers arethought to occur in the upper troposphere.Methane should begin condensing at aboutthe 1.5-bar level (8-10, 14) while a moreoptically thick cloud appears to exist nearthe 3-bar level (8-10). This deeper cloudmay be made of hydrogen sulfide ice parti-des (8, 10), but ammonia also is present(14).The Voyager images provide both vertical
and horizontal structural information (Fig.1, A and B). We used several complemen-tary approaches for estimating the absoluteand relative heights of these features. In thefirst approach, we studied the wavelengthdependence of the contrast of features. Asshown in Figs. 8 and 10, the contrast ofbright and dark features varies markedlywith wavelength. For example, the "Scoot-er" displays the greatest contrast in theorange-filtered image and much lower con-trast in both the UV and longer wavelengthmethane filter (designated MeJ, with center
wavelength 619 nm). On the other hand,most other bright features, such as thebright companion to the Great Dark Spot,show an enhanced contrast in the MeJ bandrelative to orange. The Great Dark Spot hasits maximum negative contrast in the bluefilter.We interpret the contrast variations in the
following way: molecular Rayleigh scatter-ing in the upper layers tends to mask deep-lying features at the shortest wavelengths(the Rayleigh scattering optical depth isabout 5 above the 3-bar cloud in the UVfilter), while absorption by gaseous methanetends to mask deep features in the methanefilters (especially the MeJ filter). Thus, thedoud tops of the major bright features arenot all located at the same altitude. Inparticular, the "Scooter" is situated at amuch lower altitude than the bright com-panion of the GDS, as evidenced by the"Scooters" decreasing contrast at methane-band wavelengths relative to blue. Further-
3000 24001 . I
I I I I I I I I I I
-30
-0
--30
--60
-30
-0
--30
--60
I . .I .a . I
I I I I I I I I I I* I I I I Il* I*..I I I
300 2400 1800 120° 600 0° 3000Fig. 2. Simple cylindrical projection mosaics of narrow-angle images takenthrough the blue (top) and green (bottom) filters on 17-18 August 1989.Latitude is planetocentric and longitude is based on a rotation period of 17hours 52 min, the "predict" period used to plan Voyager observationsequences. This is longer than the 16.1 hour period derived from thePlanetary Radio Astronomy investigation (3). For each mosaic, approxi-mately ten images were shuttered, during which time the planet rotatedthrough slightly more than one rotation. Thus features visible near the right
1424
edge of the mosaic appear one rotation later near the left edge. Differentialrotation is evident near longitudes of 3000 and latitudes of -41° (410S) and-460 (460S). Feature evolution is evident at +260 (26°N) and -68° (680S).An inverse photometric function was applied to each image to reduce limbdarkening. A digital filter was applied to the completed mosaics to reduce thecontrast of the large-scale bands and bring out the small-scale features.[Image processing by J. R. Yoshimizu]
SCIENCE, VOL. 246
1O 1200 6O0° O0 3000
30-
0-
-30-
-60-
30-
0-
-30-
-60-
I I I II I I I

more, the "Scooter" must be located belowthe base of the methane cloud, because it ismasked in the MeJ filter (assuming there islittle methane above the base ofthe methanecloud). Preliminary radiative transfer calcu-lations that approximately reproduce mea-sured contrasts substantiate these conclu-sions (8, 15). The generally negative contrastof the GDS and the fact that its blue andMeJ contrasts are comparable might indicatethat the atmosphere is relatively clear abovethe GDS; that is, the amount of scatteringabove the top of the 3-bar cloud is low(corresponding to a lower optical thicknessof the methane cloud). If so, there is agradual change from the outer to innerregions of the GDS, with the clearest atmo-sphere occurring toward its center. Altema-tively, the negative contrast might indicatethat the "3-bar" cloud is actually at a deeperlevel in the center of the GDS.With the exception of the "Scooter," the
discrete bright features are probably meth-ane condensation clouds. These features areprominent, localized, and dynamically ac-tive. In contrast, a photochemically pro-duced haze is likely to be spatially uniformand inactive. Such a haze layer is visible atthe limb in the images taken through theMeJ and MeU filters (the latter with centerwavelength 541 nm) (Fig. 6) and was in-ferred from ground-based observations ofcenter-to-limb brightness profiles (8). In the
troposphere, methane gas is probably abun-dant enough to produce a prominent local-ized cloud. The deep (labeled H2S?) con-densation cloud (Fig. 9) is not a candidatefor features that are bright in the MeJ filter,because that cloud has too much absorbingmethane gas above it to appear bright at thiswavelength.
Figure 7 shows D2 and the SPF visible onNeptune's crescent in all filters from UV toorange. Such visibility of features on thecrescents was not apparent at Jupiter, Sat-umr, or Uranus, and this is consistent withthe idea that the bright white features onNeptune extend to considerable heightsabove most of the haze and atmosphericgases.
Vertical structure from limb scans and cloudshadows. Images obtained at high phase an-gles provide evidence for the existence of astratospheric haze and also place constraintson its properties. Such images are particular-ly effective for detecting the presence ofoptically thin stratospheric hazes, since thesubmicronmeter-sized haze particles prefer-entially scatter sunlight at small scatteringangles (large phase angles). Particle visibilityis also enhanced by the long slant pathsthrough the atmosphere that occur underthese viewing conditions. Figure 11A showsseveral radial line scans across the planet'slimb. The scans reach a nearly constantbrightness at lower altitudes where the slant-
path optical depth exceeds unity (or thevertical optical depth exceeds several hun-dredths).On the basis of experience with similar
images obtained at Uranus (11), we suspectthat the transition to constant brightness(400 km relative alitude in Fig. 1LA) occurswithin the bottom scale height ofthe strato-sphere (80 to 100 km altitude in Fig. 9).Light scattered by a combination ofaerosolsand gas molecules is detectable to altitudesabove 550 km in Fig. 11A at least 150 kmabove the constant brightness portion. Thesharp increase in brightness with decreasingaltitude just above the constant brightnessregion indicates the existence of particles inthis region of the stratosphere, since thebrightness increases more rapidly thanwould be expected from molecular Rayleighscattering alone. This point is further dem-onstrated in Fig. 1 1B, which shows anextinction profile derived by inverting oneof the limb scans of Fig. 11A (11, 13, 16).The region with a rapid increase in theextinction coefficient may mark the altitudewhere temperatures become cold enoughfor gaseous ethane to condense into iceparticles (13).Cloud shadows provided additional data
about vertical structure. As shown in Fig.12, some discrete clouds that were observed
Fig. 3. High-resolution images ofNeptune's largest discrete features. (A) Inthis high-resolution image of the GDS and its bright companion taken 45hours before closest approach, the companion is resolved into many brightE-W linear streaks. [Image processing by C. L. Stanley] (B) Our highestresolution image of D2 was obtained during an IRIS observation on 24.4
I5 DECEMBER I989
August 1989. (C) This image taken on 23.3 August 1989 reveals the detailedstructure ofthe "Scooter." It is composed ofmany bright streaks which varyon time scales of days, causing the "Scooter" to sometimes appear square ortriangular (for example, see Fig. LA).
REPORTS 1425

'v t~~ ~2

sis were consistent for observations made atboth high and low phase angles (about 140and 20 degrees, respectively), where theviewing geometry is quite diffcerent.
Large-scale variability offeatures. All of thelarger-scale features tracked during observa-tory phase exhibited latitudinal drifting as-sociated with changes ofwind speed (4). D2exhibited the largest change ofwind speed.When first measured, it was located at 550Sand had a rotation period of 16.0 hours(Figs. 1 and 5). Then D2 drifted northwardto 51°S, and its period increased to 16.3hours. When the feature returned to 550S,the rotation period decreased to 15.8 hours.Twenty-five days after the start of the cycle,the feature again drifted north with an asso-ciated increase of rotation period (4). Therange of rotation periods spanned by D2indudes the 16.05 hour period of planetaryradio emissions (3).The latitudinal drift of the "Scooter" was
small in amplitude (less than 2 degrees) andwas neither monotonic nor periodic. Thefeature was initially detected at 420S, where
its rotation period was 16.74 hours; it re-mained at this latitude for more than threeweeks. Then over the course of a week, the"Scooter" drifted north to 40°S, with a newrotation period of 16.76 hours. The "Scoot-er" then remained at this latitude for theremainder of the observations (Fig. 1A).The Great Dark Spot drifted steadily
northward at a rate of about 0.110 per dayduring most of the encounter period. Dur-ing this time, its rotation period increasedmonotonically from 18.28 to 18.38 hours.For comparison, Jupiter's Great Red Spotdisplayed sinusoidal motion in longitudewith a 90-day period and peak speeds be-tween -1 and 5 m s-1 (17).The Great Dark Spot exhibited a "rolling"
motion around its circumference; the mo-tion is anticyclonic and is best seen in time-lapse sequences (Fig. 4A). The boundarybetween the darker blue of the oval and thelighter blue outside the oval (Fig. 1A)changed shape as if a two-lobed structurewere rotating inside it. Every 10 or 11rotations of Neptune the long axis of the
structure pointed east-west, and the GDSreached its maximum longitudinal extent.This configuration appeared twice duringeach rotation ofthe structure, whose funda-mental period is therefore about 21 Nep-tune rotations (21 x 18.3 hours at the lati-tude ofthe GDS, or approximately 16 Earthdays).A rough estimate of vorticity within the
GDS is 4'r divided by the fundamentalperiod, or 0.9 x 10⁻⁵ s-1. In contrast, thevorticity of the ambient shear flow at thelatitude of the GDS (assuniing a differencein velocity of 100 m s- over 10* oflatitude)is 2.3 x 10⁻⁵ s-1. The vorticity ofthe GDSappears to be less than that of the ambientshear flow-the opposite situation from thatof the Great Red Spot of Jupiter.The interpretation of the rolling motion
as wind (that is, fluid motion) is ambiguous.For example, it may represent the propaga-tion of a wave around the edge of the GreatDark Spot. Associated with the rolling mo-tion, the Great Dark Spot exhibited othermorphological changes. For example, dur-
Flg. 4. Time-lapse sequences ofthe Great Dark Spot (GDS). (A) The "roling motion ofthe GDS canbe seen in this 32-rotation sequence ofclear-filter images (top to bottom, left o right). The longitudinalextent ofthe GDS varies from 20 to 400 during a roll, while the latitudinal extent.can vary by 5°. Thelast three images are the first three images ofFig. 4B. Black regions on the right and in the upper right-hand corners ofsome images are regions where no data were available. (B) This seveni-rotation sequenceofviolet images shows the dissipation of a large western extension into a "string ofbeads" which moveswestward relative to the GDS. The first image was taken on 13.3 August 1989, and the rotation periodofthe GDS is about 18.3 hours. Each imagc is centered near 22°S and extends ± 15° north and south ofthis latitude. Each frame includes 60° of longitude. (C) These six images represent our best high-resolution tine sequence ofthe GDS (top to bottom, left to right). The first image was acquired at 20.3August 1989. The time interval between images is one rotation. In the last two frames, a subde darkband appears extending horizontally across the center ofthe GDS. Each image extends in latitude from7°S to 370S and covers 600 of longitude.
REPORTS I427IS DECEMBER 1989

Fig. 6. False-color view ofNeptune. This color-en-hanced image was createdwith images taken on 22.7August 1989 through theorange, MeU, and MeJ fil-ters. The images were as-signed to the blue, green,and red channels of thefalse-color image, respec-tively. High clouds appearred, while low clouds appearblue. The companion to theGDS is bright in all filtersand is a high cloud, al-though its appearance hereis distorted by saturationduring image processing (asis the appearance of thenorthern cloud band nearthe western limb). Thehigh-altitude haze layershows up as a red region onthe limb; the haze is trans-parent when viewed at nor-mal incidence. Subtle shadesofblue and green may repre-sent differences in altitude,optical thickness, or compo-sition of the cloud particles. [Image processing by L. K. Wynn]
Fig. 5. Short-term variability in the core of D2.These three images ofD2 are taken at intervals ofone rotation (about 16 hours), beginning at 23.0August 1989. They show the remarkably rapidgrowth and dissipation ofdetail in the core ofD2.
ing one particular rotation, a series of darkcloud features (a "string of beads") devel-oped after the maximum western extensionof the Great Dark Spot occurred (Fig. 4, Band C).Ground-based images have shown bright
cloud features on Neptune for more than adecade (18). By comparing spacecraft im-ages with near-simultaneous ground-basedimages, we identified the discrete brightfeature seen this year in 890-nm ground-based images as the bright companion at330S associated with the southern edge ofthe Great Dark Spot (Fig. 8B). The GDSitself is not visible in the ground-basedimages. The bright features seen in previousyears in ground-based images were locatedat 30S in 1988 and 38°S in 1986 and 1987(18, 19). Since the Great Dark Spot appearsto drift in latitude by about 0.10 per day (4),
1428
it may have moved significantly over the last3 years. If this is indeed the case, observersmay have been detecting the Great DarkSpot companion as it drifted north andsouth, giving the Great Dark Spot a lifetimeof more than 5 years. All ground-basedimages obtained prior to 1985 showed mul-tiple bright features in both the northernand southem hemispheres (18).The Great Dark Spot was not detected in
ground-based images obtained at 550 nm,but a future search at 400 to 500 nm mayhave more success (see Fig. 10A). The Hub-ble Space Telescope should have sufficientresolution and wavelength coverage to de-tect the Great Dark Spot or any similarfeatures. Other cloud systems that have beencorrelated with features in current ground-based images (6) are the south polar feature,the core of D2, some ephemeral brightstreamers at the latitude of the Great DarkSpot and in the northern hemisphere, andthe bright band surrounding the south pole(seen in MeJ images).
Zonal velocity profile. Hammel et al. (4)discussed the rotation period and zonal ve-locities of the four largest features visible inthe Voyager images during the 80 daysprior to encounter. Here we discuss themotions of smaller features observed duringthe last few days before closest approach. Ifthe small-scale measurements and large-scalemeasurements were to disagree, we wouldsuspect either that different altitudes wereinvolved or that the patterns move relativeto the wind, as with a propagating wave. AtJupiter and Saturn, the winds derived from
tracking small features over short time inter-vals generally agree with those derived fromthe larger features when allowance is madefor the tendency of larger features to movewith the average flow in a latitude band. Themeasurement ofvelocity seemed to convergewith smaller spatial and time scales. This
Fig. 7. Neptune's bright crescent taken in sixfilters (from bottom to top: UV, violet, blue,clear, green, orange) on 31.3 August 1989 (7).The images were shuttered in temporal order:violet, blue, UV, clear, green, orange. Theseimages show the bright core of D2, the southpolar feature, and the symmetric structure imme-diately surrounding the south pole. The relativelyhigh contrast of the features in these imagesindicates that they extend above most of thescattering haze and absorbing methane gas inNeptune's atmosphere. [Image processing by D.A. Alexander]
SCIENCE, VOL. 246
agreement suggests that cloud displace-ments are indicators of the wind at roughlythe same altitude for both of these planets.On Neptune, the small-scale features
evolve rapidly and disappear quickly, so theinterpretation of cloud displacements is lessstraightforward (Fig. 4C). Because of therapid evolution of small-scale features, thebest measurement strategy must be a com-promise. On the one hand, reducing thetime interval over which displacements aremeasured reduces the effects of evolution ofthe features, and this ensures that they arerecognized on successive time steps. On theother hand, the error in velocity goes up asthe time interval is reduced. This error isproportional to the resolution in kilometersper line pair divided by the time interval(in other words, the speed of a featurethat moves 2 pixels in one time step). Byusing sequences of three or more images,we can shift the focus from one rapidlyevolving feature to another while broaden-ing the time base. Although the error isreduced by this technique, there is still noguarantee that one is measuring actual fluidmotion.Not all regions on Neptune have small-
scale features suitable for tracking. At scalesof50 to 200 km per line pair, there are eightgeneral ypes ofdisernible cloud structures;(i) structure in the polar cloud feature at-71°S, (ii) variable brightening within thecentral region of D2 near 55°S, (iii) stna-tions in the "Scooter" at 420S, (iv) smalbright features similar to the "Scooter" thatappear in the latitudinal range from 400to 500S, (v) individual bright structuresaround the perimeter ofthe GDS, (vi) struc-ture within the large-scale banding to theeast ofthe GDS, (vii) details within the hazybright equatorial patch located north of theGDS, and (viii) structure within the cloudbands at about 27N.
Figure 13, A and B, gives the rotationperiods and zonal velocities derived fromboth small-scale and large-scale features.Figure 13 reveals that measurements overdifferent time intervals do not agree. Thedisagreement is particularly evident near200S and 700S. The +'s and x's, for whichthe resolution per time step is less than 50km per line pair, show less dispersion amongthemselves and better agreement with thesolid curve. The diamonds, which use threeor more images in a sequence, generallyshow less dispersion among themselves thanthe squares, which use image pairs only.The measurements of the south polar
feature (70°S in Fig. 13) provide an exampleof how the dispersion arises. The measure-ments fall into three groups. Those withrotational periods near 16.0 hours are de-rived from data with 49-hour time separa-
tion. Those with periods near 17.5 hourshave 16-hour separation, and those withperiods from 12 to 14 hours are fromimages separated by less than 2 hours. Thisgrouping suggests that the observations inthe first set track the large-scale structuremeasured during observatory phase (4),while the observations in the short-intervalgroup track small-scale features that movethrough the larger structures.
Simple measurement error attributable tolimited resolution is not the main source forthe dispersion, particularly when three ormore images are used in sequence. Thedispersion is of order 300 m s-1, whereas
the error is only 50 m s- at 70°S (Fig.13B). Wind shear with respect to altitude isone possible source. However, the infraredinterferometer spectrometer (IRIS) obser-vations of temperature as a function oflatitude (20) suggest that the vertical windshear is small, on the order of 30 m s perscale height. For wind shear to be impor-tant, the structures must be distributed overa range of altitudes extending ten scaleheights. The other possible source for thedispersion is propagation, either of thelarge-scale features or the small-scale fea-tures, relative to the fluid.One interpretation is that the diamonds in
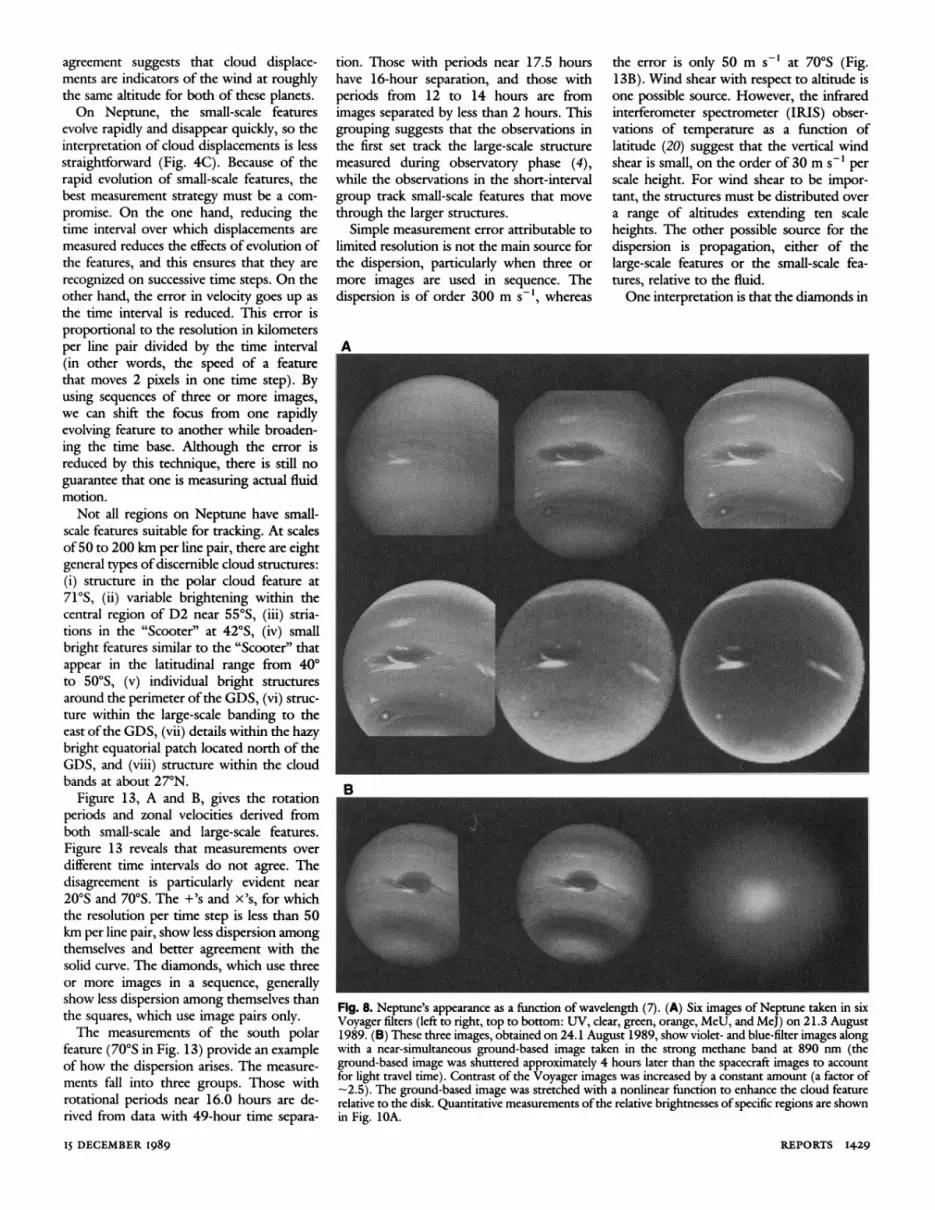
Fig. 8. Neptunes app e as a funion ofwaveilngth (7). (A) Six images of Neptume taken in sixVoyager filters (left to righ top to bottom: UV, dear, green, orange, MeU, and MeJ) on 21.3 August1989. (B) These three images, obtained on 24.1 August 1989, show violet- and blue-filter images alongwith a near-simultaneous ground-based image taken in the strong methane band at 890 nm (theground-based image was shuttered approximately 4 hours later than the spacecraft images to accountfor light travel time). Contrast ofthe Voyager images was increased by a constant amount (a factor of-2.5). The ground-based image was stretched with a nonlinear function to enhance the doud featurerelative to the disk. Quantitative measurements ofthe relative brightnesses ofspecific regions are shownin Fig. 1OA.
IS DECEMBER 1989 REPORTS I4.29

Fig. 13 represent the true motion of thefluid, making Neptune the windiest planetin the solar system. Wind speeds would thenbe close to the speed of sound, which isabout 560 m s-' at T-60K (Fig. 9). Thesolid curve might represent the slower mo-tions at deeper levels or perhaps a large-scalewave. The other interpretation is that thediamonds and squares represent short-livedfeatures that propagate relative to the flow.The solid curve, perhaps including thepoints at 5°N with periods near 19.5 hoursand those at 27°N with periods near 17.5hours, would then be our best estimate ofthe zonal wind. This is the most conserva-tive interpretation, since the velocities of thelarge-scale features are the most certain.
Regardless of the interpretation of thepoints in Fig. 13, the periods of rotation atthe equator are longer than both the radioperiod (3) and the periods at high latitudes.This fact puts Neptune in a class, withUranus and Earth, ofequatorial subrotators.Venus, Jupiter, Saturn, and the sun are allequatorial superrotators, since the periods ofthe equatorial atmospheres are shorter than
160
4120
40
/X'/ C2H2
//yCHH
6 26
\ I
+>H
[ -X<(~~~~~~~~~?)O s...............- . . . . I... -... ... .i40 60 80 100 120 140
Temperature (K)
those of the interiors. Neptune is by far themost extreme subrotator, as measured bothby the speed of the atmosphere relative tothe interior and by the fractional difference
0.8
Ao Bright companion
X Scooter
^ GDS (outer region)
GDS (central region)0.4 0
00
0.0- a-
UV VIO BLU MeU ORA MeJ-0.4 i-
0.30 0.40 0.50 0.60
Wavelength (gm)
between the angular velocity of the interiorand that of the equatorial atmosphere.
In general, subrotation at the equator iseasier to understand than superrotation.
v. 3v
0.30 0.40 0.50Wavelength (gm)
0.60
Fig. 10. (A) Contrast as a function ofwavelength between discrete features and the nearby atmosphere.Contrast is defined as (IJlIb - 1), where If and Ib are the brightnesses of a feature and its surroundingbackground, respectively. For the Great Dark Spot, two regions were measured, the central region andthe outer edges. The contrast shown here for the bright companion was measured in low-resolutionimages. In higher resolution images, the feature was resolved into thin streaks (Fig. 3A), each ofwhichhas even higher contrast than that measured for the overall feature. The Voyager filter passbands areindicated along the bottom axis. (B) Reflectivity as a function ofwavelength for the main cloud deck atdifferent latitudes. The three curves show the wavelength-dependent absolute reflectivity (I/F) atlatitudes 22°S, 33°S, and 42°S. The regions are at the same latitudes but different longitudes as theGDS, its bright companion, and the "Scooter," respectively. The feature contrasts shown in Fig. lOAwere measured relative to these values. There are no significant differences between the measuredreflectivities at these latitudes. Small differences in the reflectivity ofother latitude regions give Neptunea banded appearance. The Voyager filter passbands are indicated along the bottom axis.
10 e0
.0
10
a.
1000
Fig. 9. Vertical aerosol structure of Neptune'satmosphere. The zero of altitude corresponds tothe 4-bar pressure level. The existence ofthe maincloud deck near the 3-bar level was first inferredfrom ground-based spectroscopic observations ofhydrogen quadrupole lines (9). The large tropo-spheric concentrations of methane gas derivedfrom ground-based visible and infrared observa-tions suggest the presence ofa methane condensa-tion cloud near the 1.2-bar level, but there is littledirect observational evidence of a global methanecloud at this level. The bright cloud features seenin Voyager images may provide evidence forsmaller-scale methane condensation clouds there.The existence of the high-altitude hydrocarbonaerosol layers was first predicted by theoreticalmodels of Neptune's atmospheric chemistry (13).Brightness variations seen in limb scans of high-phase-angle Voyager images also suggest the pres-ence of these aerosols.
1430
500 400Relative altitude (km)
10-2
195
10-4
600 550 500 450Relative altitude (km)
400 350
Fig. 11. Limb profiles of Neptune. (A) Radial scans across crescent images of Neptune's limb provideevidence for high-altitude stratospheric aerosol layers. These limb scans were extracted from a narrow-
angle clear-filter image taken at a phase angle of 158°. The altitude resolution is approximately 1.9 kmper line-pair. Image motion compensation prevented the spacecraft's translational motion fromsignificantly smearing this image. The constant-brightness region extends from the main cloud top to a
point near the tropopause (400 km on this plot; the zero of altitude is arbitrary). Brightness variationsabove this level indicate the presence of aerosols. (B) The steep slope of the vertical aerosol extinctionprofiles derived from the limb brightness scans in Fig. lA indicates the presence of a discrete aerosollayer located almost 150 km above the tropopause (the stippled area encloses the uncertainty). Thishigh-altitude aerosol layer may be related to the hydrocarbon condensation clouds predicted bytheoretical models of Neptune's atmospheric chemistry (13).
SCIENCE, VOL. 246
v.Ov B
0.60 l.
ALAT = 220S;;0.40 D- A=3° ,
oLAT = 335S
x LAT= 42°S0.20
0.00 -UV VIO BLU MeU ORA MeJ
B

Without dissipation, rings of fluid circlingthe planet at a given latitude tend to con-
serve their angular momentum as they movefrom one latitude to another. Maintainingequatorial subrotation merely requires tak-ing rings of fluid from higher latitudes andmoving them to the equator. Maintainingequatorial superrotation requires some
pumping of angular momentum into theequator by organized waves or eddies.The stability of a zonal flow depends not
only on the velocity profile, but also on thedensity structure of the atmosphere. At themoment, we do not know the density fieldof Neptune's atmosphere over a sufficientrange of depths and latitudes to do a com-
prehensive stability analysis. One necessary
condition for stability, however, is that theangular momentum per unit mass, Qr2cos2p, should decrease monotonically fromequator to pole. Here Ql is the atmosphericangular velocity, r is the planetary radius,and up is the latitude. On Neptune, as on
Earth and Uranus, the decrease of cos2wpoutweighs the increase of Ql with latitude,and the condition is satisfied. This conclu-sion holds for all interpretations of Fig. 13for which the equatorial period is less than20 hours (21).One of the most remarkable aspects of
Neptune's zonal wind profile is its similarityto that found on Uranus (1). That these twoplanets, which have such different internalenergy sources and such different obliqui-ties, should have the same pattern of zonalwinds requires an explanation that will cer-
tainly add to our understanding of atmo-spheric dynamics.
Fig. 13. Rotation periods (A) and zonal velocities(B) as a function of latitude. Velocity is measuredwith respect to the 16.1-hour period derived fromthe planetary radio emissions (3). The solid linerepresents the motion of the largest features over
the longest time intervals (4). It is composed ofnine individual measurements, two from ground-based observations and seven from the four larg-est features seen in the early Voyager images (3 ofthese were measured at two different latitudes).The symbols are measurements of individualsmall-scale features, often at time steps less than 2hours and resolutions better than 100 km per linepair. The diamonds and crosses are values calcu-lated with software developed at the University ofWisconsin in which displacements are measuredin a sequence of three or more images. Thesquares and +'s use software developed at JPL inwhich displacements are measured in pairs ofimages only. The resolution (in km per line pair)divided by the time step (in hours) is less than 50for the crosses and +'s and is greater than 50 forthe diamonds and squares. The error estimates arein the same units as the figures and are computedfrom the statistics of the observations.
The Neptune Ring SystemPrior to the Voyager reconnaissance of
Neptune, very little was known of its ringsystem. By August 1989, about 50 stellaroccultations had been observed fromground-based observatories, representing100 separate scans through the system. Al-though more than 90% of these observa-tions yielded no detection, at least five oc-
cultations observed between 1981 and 1985demonstrated with high confidence thepresence of material in orbit around Nep-tune (22).One of these observations was a detec-
Fig. 12. Cloud shadows in
the northern hemisphere.Bright cloud bands near theterminator at latitude 27°Nappear to cast shadows onthe main cloud deck. Mea-surements of these shadowsindicate that the tops ofthese cloud bands are 10050 km above the back-ground cloud deck. Similarshadows were seen forclouds in the south polarregion. This image was cre-ated by combining violet-,green-, and orange-filter im-ages acquired near closestapproach at 25.1 August1989. [Image processing byG. W. Gameau]
1$ DECEMBER I989
G vI
= -20
-40
-60
--VU22 20 18 16 14 12
Period (hours)
la
-i
+ c'o
R 0 -
)r1.Error
40 I .... ... ...
20 oo ° B- ++°c00)8-3
-20 S o1
0 c~~~~~~
-700 -500 -300 -100 100 300 0 140
Zonal wind (m/s) Error
tion, observed by more than one telescope,of either a small satellite or an opticallythick, azimuthally incomplete ring of about80 km radial width. Several other detec-tions, two ofwhich were confirmed, indicat-ed narrower (approximately 15 to 25 km)but also discontinuous rings. Minimum in-ferred lengths were 100 km. Thus, the exis-tence of relatively narrow "ring arcs" orbit-ing between 41,000 and 67,000 km fromNeptune was commonly accepted.On the basis ofthese ground-based obser-
vations alone, however, it was impossible todistinguish between a family of permanentor transient arcs around Neptune or contin-uous rings of highly variable optical depth.Neptune's ring features became members ofa sparsely populated class of ring structuresincluding the narrow, azimuthally incom-plete rings in Saturn's ring system [in theEncke gap, the Cassini Division, and aroundthe F ring; see, for example, (23)] andpossibly in the Uranian ring system as well(24).The presence of short evolutionary time-
scales in ring systems is a well known and as-
yet unsolved puzzle (25). The time requiredfor longitudinally localized material 20 kmin radial width to spread 3600 as a result ofdifferential rotation is only about 5 years.Stable, non-transient ring arcs would obvi-ously require a longitudinal confinementmechanism (26, 27); transient arcs requirethe continual creation, dispersal, and replen-ishment of local concentrations of ring ma-
terial. We present here the initial results onthe nature and dynamics of Neptune's ringsfrom analyses of Voyager imaging observa-tions, discuss the various theories suggestedfor the existence of arcs in light of our
findings, and compare Neptune's system
REPORTS 1431
40
20 Ao +in
000 .p + x0 0
0 + 0 C)o2

with the other ring systems we see in theouter solar system.
Radial distribution ofring material. The Nep-tune ring system, as seen in Voyager images,contains two narrow rings, 1989N1R and1989N2R, at radial distances of 62,900 kmand 53,200 km, respectively; a broad ring,1989N3R, at a radial distance of 41,900kin; a second broad ring, 1989N4R, extend-ing outwards from 1989N2R to a distanceof nearly 59,000 km; and an extended sheetof material that may fill the inner Neptunian
system. (We will alternatively refer to1989N1R, 1989N2R, and 1989N3R as theN63, N53, and N42 rings.) The N63 ring isoutermost and includes three arcs of sub-stantially greater optical depth than the ringaverage. The three arcs are clustered togeth-er within a total range of 33 degrees inlongitude. 1989N1R and 1989N2R lieabout 1000 km outside the newly discov-ered satellites 1989N3 and 1989N4, respec-tively.
Neptune's rings were most easily visible at
the moderately high phase angles obtainedafter closest approach to the planet, andthree images at these phase angles best char-acterize the overall distribution of material.Figure 14, a 111-second exposure, and Fig.15, a composite of two 591-second expo-sures taken 1.5 hours apart, were all imagedthrough the clear filter of the wide anglecamera and show the ring system at forwardscattering phase angles of about 1350. Fig-ure 14 clearly shows the arcs which are 12data number units (DN, out of a total rangeof 255 DN) above background. In compari-son, Fig. 16 is also a 111-second exposuretaken through the clear filter of the Voyagerwide angle camera, but at a phase angle ofonly 15.50. It shows the same three arcswithin the optically thin N63 ring; the sec-ond, even fainter N53 ring is also visible.Though Fig. 16 is one of the best Voyagerimages taken ofNeptune's ring system at lowphase, the average brightness in the arcs mea-sured only about 2.5 DN above background.The arcs were not captured in Fig. 15
because of the 50 degrees of orbital motionbetween the two frames. However, one caneasily see the N63 and N53 rings as well as
Fig. 14. This Voyager 2 image (FDS 11412.51), a 111-s exposure obtained through the clear filter ofthe wide angle camera, shows the ring system in forward scattering geometry (phase angle of 1340).Clearly seen are the three ring arcs and the N53 and N63 rings. The direction of motion is clockwise;the longest arc is trailing. The resolution in this image is about 160 km per line pair; the trailing arc wasimaged at this same time at a higher resolution of about 20 km per line pair (Fig. 18).
Fig. 15. This pair ofVoyager 2 images (FDS 11446.21 and 11448.10), two 591-s exposures obtainedthrough the clear filter ofthe wide angle camera, shows the fill ring system with the highest sensitivity.The ring arcs seen in Fig. 14, however, were at an unfortunate orbit longitude and were not captured ineither of these frames taken 1.5 hours apart. Visible in this figure are the bright, narrow N53 and N63rings, the diffuse N42 ring, and (faintly) the plateau outside ofthe N53 ring (with its slight brighteningnear 57,500 km). [Image processing by L. A. Wainio].
1432
Fig. 16. This Voyager 2 image (FDS 11350.23),aI11-s exposure obtained through the clear filterof the wide angle camera, shows the N53 andN63 rings faintly in backscattered light (phaseangle of 15.50). Relatively prominent in the N63ring are the three Neptune ring arcs. The satellite1989N2 can be seen in the upper right corner,streaked by its orbital motion; the other brightobject is a star. The arcs are unresolved in thisimage (resolution of 37 km per line pair); theirapparent width is due to image smear.
SCIENCE, VOL. 246

N42 (1989N3R). This latter ring, which isseen at low phase angles only with greatdifficulty, is clearly resolved and has a fullwidth at half maximum of about 1700 km.Also faintly visible in Fig. 15 is a sheet ofmaterial beginning midway between thetwo outer rings at approximately 59,000 kmand possibly extending down to the planet.(We discuss this further below.) There areidentifiable features within this sheet. Themost prominent among them is the plateau,1989N4R. A distinct feature or ring at57,500 km, 1989N5R, on the outer edge ofthe plateau, can be seen above and below theansa in Fig. 15. In addition, there are hintsof other radial structure in the plateau.Although one gets the impression from
Fig. 15 that material extends continuouslyinward from 59,000 km, this is difficult toconfirm because of the uncertainty in thedistribution of scattered light. Figure 17 is aradial profile of the intensity seen in the lefthand frame of Fig. 15. In this scan, asmooth function has been subtracted toremove the scattered light from the planet;this has the effect of tapering off the bright-ness distribution to zero at small radii.Though this removal of scattered light isuncertain, the N42 ring does appear to beembedded in material which extends out tothe N53 ring, with brightness only slightlyless than that of the plateau region buthaving a local minimum at 52,000 km,approximately the orbit of 1989N3. A simi-lar configuration was observed in the Urani-an system between Cordelia and the A ring(1986U1R) (1).
In other high-phase frames, a narrow,clumpy ring (as yet unnamed) is also visiblejust interior to 1989N1R. This feature isnot seen in any low phase angle images, andappears to lie at about the same radius assatellite 1989N4. Imaging observations ofthe arcs and the satellites within the ringregion indicate beyond doubt that the direc-tion of orbital motion is prograde. Becauseof remaining uncertainties in the Laplacianplane pole orientation, we cannot at thepresent time completely rule out very smallring eccentricities and inclinations relative tothis plane, which presumably is identical tothat of the inner, regular satellites.Voyager observations have put strong
constraints on the existence of a potentialpolar ring system (28); several high and lowphase angle images of Neptune's north andsouth polar regions, covering a radial rangeout to several hundred thousand kilometersfrom the planet, reveal nothing. Althoughthe upper limiting optical depth for broadsheets of material is roughly 10-5, it is stillimpossible to rule out the existence of nar-row clumps in polar orbits with somewhathigher optical depths.
15 DECEMBER I989
10FDS 11446.21
z95
,,,,1,,,1,,,,1,, ,,30 40 50 60 70 80
Orbital radius (103 km)
Fig. 17. This radial profile ofthe brightness oftherings as seen in Fig. 15, in units of DN (datanumber) above background as a fimction oforbit-al radius, was obtained by averaging all pointslying within narrow radial bins and excluding thestars. A smooth background has been subtractedout to account for glare from the planet; since thetrue background is uncertain, it is not possible tosay whether the rings extend all the way in to theplanet.
High-resolution imaging coverage of therings, excluding the arc retargeting that isdiscussed below, was made mostly at skyplane resolutions of 15 and 40 km per linepair. Due to the smear resulting from thelong exposures, we have been unable toresolve in the radial direction either the N53ring or the non-arc part of the N63 ring.Our highest resolution images, obtainedwithin 13 hours ofclosest approach, were ofthe arcs and were retargeted approximately4 days before closest approach, based onearlier imaging observations of arc locationsand orbital motion.The single highest resolution frame, FDS
11386.17, has a sky plane resolution ofonly3.0 km per line pair. At the geometry of thisobservation, radial foreshortening results ina ring-plane resolution of 15 km per linepair. The trailing arc has a full radial widthat half maximum that is close to the resolu-tion of the camera. However, in our narrowangle outbound retargetable image (Fig.18), measurements of variations in the ringwidth indicate that the ring may be justbarely resolved, implying a radial width ofabout 15 km. This value is in good agree-ment with the groundbased and Voyagerphotopolarimetry stellar occultation mea-surements (22, 29).
Longitudinal distribution ofmaterial. On lon-gitudinal scales of a radian, all three ringsand the plateau region are continuousaround the planet. This is very clearly seen inforward-scattering geometry (Fig. 15), butit is also evident, though with greater diffi-culty, in backscattered light for the N53 andN63 rings. On intermediate scales, the onlyprominent structures are the three brightarcs seen in the N63 ring (Figs. 14 and 16).The azimuthal lengths of these arcs, mea-sured to be the distance between the half-
Fig. 18. This narrow angle, clear filter image(FDS 11412.46) was part of the outbound (highphase angle) retargetable sequence along withFig. 14 and shows a portion of the trailing arc.The sky plane resolution is about 14 km per linepair and the phase angle is about 1350. Thecombination ofuncompensated spacecraft motionand ring orbital motion causes points to streak inthe image. However, the width and separation ofthe streaks reveal the scale size and longitudinaldistribution ofclumps in the rings. In addition tothe fine scale information revealed in the streakedclumps, this image seems to show width varia-tions which would imply that the arc may beresolved (see text).
intensity points in azimuthal brightnessscans in Fig. 14, are approximately 40, 40,and 100 for the leading, middle, and trailingarcs, respectively. The distances between themidpoints of these features are about 140(leading-middle) and 120 (middle-trailing).To within the measurement uncertainties,the same values are obtained from low phaseimages. Given the signal-to-noise ratio ofthe data, we find no convincing evidence atthis time for longitudinal structure on scalesgreater than about 50 in either of the tworemaining rings or in the remainder of theouter ring in either forward or backscatter-ing geometry.
Small-scale azimuthal structure is mosteasily seen in the retargeted image of thetrailing arc taken at high phase (Fig. 18).Several long linear features are apparent,which we believe are formed by discreteclumps in the ring, trailed out by a combina-tion oforbital motion along the ring and themotion of the spacecraft across the ring.
REPORTS I433

These features are unresolved and appear tobe associated with microscopic particles be-cause of their enhanced brightness in for-ward scattered light (phase angle of 135degrees). One of the retargeted images takenof the trailing arc at low phase shows struc-ture similar to that seen in Fig. 18 when theimage contrast is strongly enhanced.Though it is not yet certain if these are thesame clumps seen in Fig. 18, it is notewor-thy that the typical separation between theseclumps, approximately 0.10 to 0.20, is thesame in both frames. A similar object withinthe leading arc is seen in another low phaseimage not reproduced here. These featuresmay be large embedded ring particles orassociated clumps of debris similar in mor-phologv to the discrete features found in theF-Ring or Encke gap ringlet of Saturn (23).
Moon/let search. A search for additionalsmall satellites orbiting near the rings ofNeptune is still being conducted (30), butthe lack of confirmed sightings implies thatfew or no additional satellites larger than 12km in diameter with assumed geometricalbedo of 0.05 are orbiting in the ringregion. To discriminate actual sightingsfrom noise, we required each candidate ob-ject to be in a circular, equatorial orbit.Because of this requirement, our limitingradii are roughly twice as large for satelliteswith orbits inclined by more than 100 oreccentric by more than 0.1.
Ritng photometry atnd particle properties. Theability of spacecraft to observe a system overa range of viewing angles is of great impor-tance to our understanding of planetary ringsystems, since the scattering behavior ofparticles of microscopic and macroscopicsizes differs dramatically with phase angle.Observations at high phase angles (>1500)have been important in establishing that themicroscopic "dust" particle fractional area inthe main rings of Saturn and Uranus is quitesmall-between 0.01 and 0.001 by area(31). In other rings, the dust fraction can beconsiderably larger; for example, Saturn's Fring, a narrow, clumpy ring, and Saturn's Ering, a broad, diffuse ring, are both visibleprimarily because of microscopic particles-dust fractions greater than 80% (32). In thecase of Neptune, the spacecraft trajectorydid not allow any extremely high phase-angle observations; however, the ringsthemselves compensated for this lack of ob-servational sensitivity by being extremely"dusty."Our preliminary photometric analysis re-
lies on only twvo phase angles (approximate-ly 140 and 1350) for the following regions:the middle arc of 1989N1R, wide azimuthalaverages in the N42, N53, and N63 rings(excluding the arc material) and the constantbrightness region ranging between 54,500
'434
and 57,500 km from Neptune. In order tosuppress the effects of possibly variablesmear in the long exposures that wereused, the radial integral of the brightnessprofile, or "equivalent width," was em-ployed (33).
Figure 19 shows the observations for thedifferent regions, converted to the quantity(,PfTdr, as functions of phase angle (33).The fact that all regions are more reflectiveat high phase angles is direct evidence for asubstantial dust population, since thebrightness of macroscopic objects dependsprimarily on the fraction of the visible illu-minated area and decreases by an order ofmagnitude as phase angle increases over thisrange. We have modeled the particle proper-ties in these regions to obtain the opticaldepth of macroscopic and microscopic ma-terial, using assumptions as to the individualparticle properties based on prior experi-ence. We have assumed that the large macro-scopic particles in the Neptune ring systemhave the Uranus ring particle phase functionand a Bond albedo between 0.01 and 0.02,which brackets the Uranus ring particles,Phobos, Diemos, and Amalthea. This com-
0.10
0.08
a~-
0.06
0.04
0.02
on0 50 100 150
Phase angle (degrees)
Fig. 19. In this figure, observations of the radiallyintegrated brightness of different regions of theNeptunian rings are shown as functions of phaseangle. The brightness has been converted to the"equivalent width" product .a0PfTdr, in units ofkilometers, where fTdr is the "equivalent depth"and T is the normal optical depth. The regions arethe N42, N53, and N63 rings (not including thering arcs), the plateau region averaged between55,000 and 58,000 km, and the middle ring arc
(plotted at one-third of its actual values).
bination results in a geometric albedo ofabout p = 0.05, similar to that seen for thenewly discovered Neptune satellites.To bound the properties of the micro-
scopic dust component, we chose coal dust(which is used to model the Uranus rings)and a typical silicate (which is used to modelthe Jupiter ring). Mie scattering, as modi-fied by a simple irregular particle algorithm,was used to obtain the range of dust particlealbedo and phase functions for material withthis range of composition. We assumed apower law size distribution with index of2.5, such as has been observed to character-ize the dust in the Uranus and Jupiter rings;microscopic dust in ring systems tends tohave a somewhat flatter size distributionthan typical comminution products due tothe size dependence of removal processes.The results of this preliminary photometricmodeling are shown in Fig. 20.The N42 ring and the plateau are clearly
low optical depth structures, although twoorders of magnitude more substantial thanthe Jupiter ring or the E and G rings ofSaturn and about one order of magnitudemore substantial than the Uranus dustbands. The optical depth of the middle arc,about 0.04 to 0.09, is in excellent agreementwith ground-based values when appropriatediffraction corrections are made. Within theuncertainties, the N42, N53, and arc re-gions have the same dust fraction (0.5 to0.7), which is about twice as large as thefraction found in the N63 ring and theplateau regions, and significantly larger thanfound in the main rings of Saturn or Uranus(10-3 to 10-2).
Comparison ofground-based and Voyager ob-servations. Re-analysis of the geometries forthe most reliable ground-based stellar occul-tation tracks by means of the improvedVoyager Neptune pole position has indicat-ed that the observations of 22 July 1984, 7June 1985, and 20 August 1985 are allconsistent with occultation by material nearthe radius of 1989N1R (34). These are alsothe only three observations which yieldequivalent widths of up to 2.0 km, consist-ent with the abundance of material that wefind in the three Voyager arcs (Figs. 19, 20)when diffraction effects are appropriatelyaccounted for. Although this suggests thatthe Voyager arcs are the same as thoseobserved from Earth in 1984 and 1985, amuch more stringent test of this hypothesis,and one that could rule out the notion oftransient and evolving arcs, would be thesuccessful prediction of longitudinal loca-tion at the time of the Voyager encounter byuse of the observed arc locations in bothground-based and Voyager observationsand the mean motion derived from Voyagerimages.
SCIENCE, VOL. 246
arc/3
N53
< 4 N63PL
N42
I I II
A precise determination of the arcs' meanmotions must necessarily await careful arcposition measurements in images spanningas large a temporal range as possible, and thefitting of such measurements with a generalmodel describing an eccentric and inclinedorbit, as well as an evaluation of the pole ofNeptune's Laplacian plane, which is inde-pendent of the assumed ring arc model. Apreliminary value was obtained, however, byassuming the arcs' orbits to be identical,circular, and equatorial [Neptune rotationalpole orientation, (a, 8)1950 = (298.904,+42.841)], and by measuring the beginningand ending longitudes of each arc insmoothed, radially averaged, azimuthalscans taken from at most five images span-ning a total of about 6.5 days. For each ofthe three arcs, a weighted least-squares fit tothe measured locations versus time was usedto determine the mean motions; the finalvalue and its uncertainty, 820.12 ± 0.06,are the mean and the standard error of themean, respectively, of these three numbers.Using this value, we projected forward fromthe longitudes of arc detection in the threereliable ground-based stellar occultations inthe N63 region mentioned above (35), cor-recting for light travel time, to the epoch ofour best single image (FDS 11412.51, Fig.14): for 22 July 1984, the precessed longi-tude is 227°; for 7 June 1985, 238°; and for20 August 1985, 2240. The large uncertain-ty in the rate, 0.06° per day, maps into alongitude uncertainty at the time of Fig. 14of approximately ± 1000. Nonetheless, theagreement found with the use of the nomi-nal rate is astonishingly good: the ground-based observations fall within about 150 ofeach other and comfortably intercept thelongitude range, 2060 to 2400, subtended bythe three arcs in Fig. 14. (Although theground-based longitudes are measured inthe Neptune-Triton invariable plane, andthe Voyager longitudes in the Neptuneequator plane, the difference amounts to atmost a few degrees.)We consider these results convincing evi-
dence that the Voyager arcs themselves werethe occulting material for all ground-basedoccultations at this radius and, therefore,that the arcs are stable over intervals of atleast 5 years. Future work in this area, takinginto account the geometrical considerationsmentioned above, may in fact allow us todetermine with high probability which ofthe three arcs was observed in each of thesethree ground-based occultations and to pre-dict the locations of these features at thetimes of upcoming Neptune stellar occulta-tions observable from the ground or fromthe Hubble Space Telescope. It is not sur-prising that ground-based observations, ingeneral, do not detect material in the non-
iS DECEMBER i989
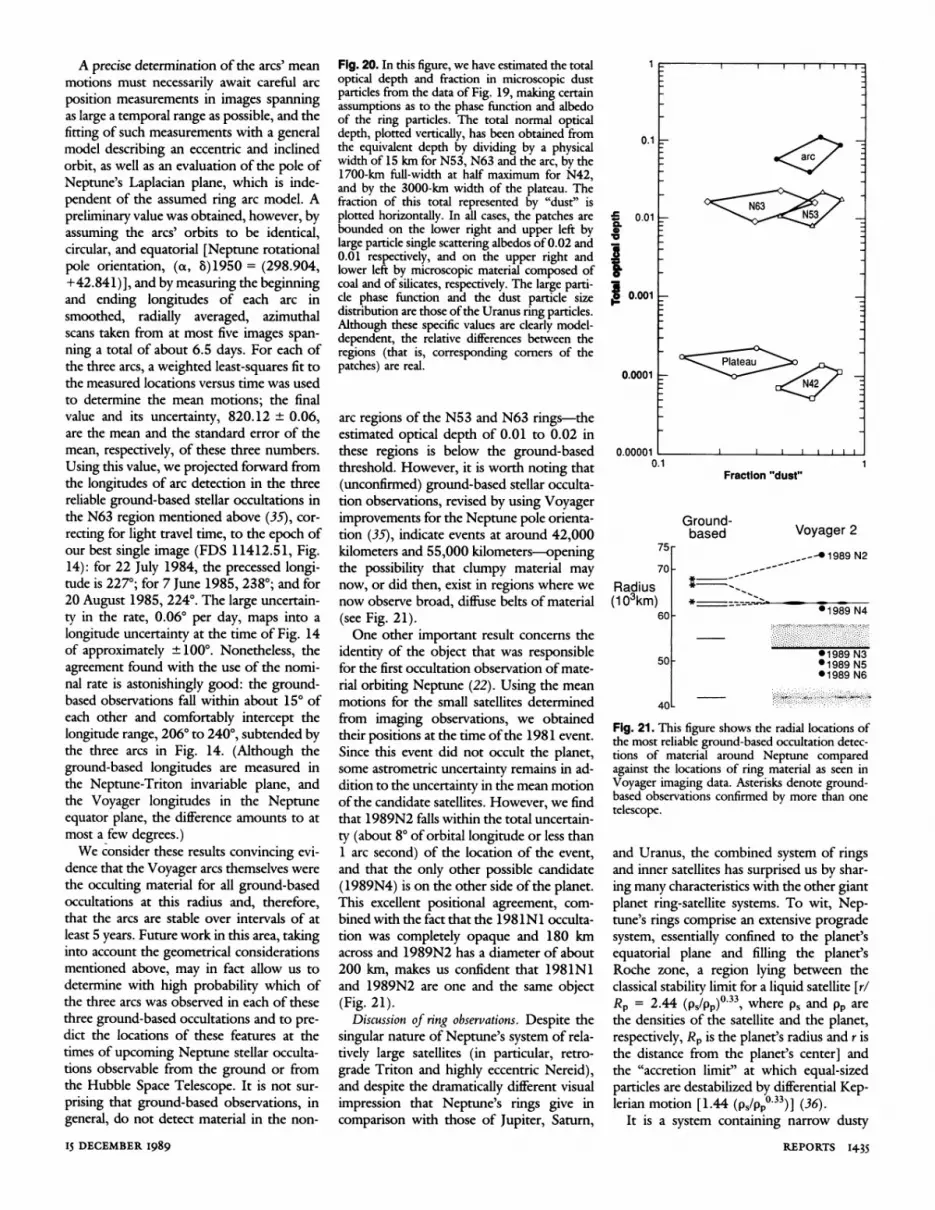
Fig. 20. In this figure, we have estimated the totaloptical depth and fraction in microscopic dustparticles from the data of Fig. 19, making certainassumptions as to the phase function and albedoof the ring particles. The total normal opticaldepth, plotted vertically, has been obtained fromthe equivalent depth by dividing by a physicalwidth of 15 km for N53, N63 and the arc, by the1700-km full-width at half maximum for N42,and by the 3000-km width of the plateau. Thefraction of this total represented by "dust" isplotted horizontally. In all cases, the patches arebounded on the lower right and upper left bylarge particle single scattering albedos of0.02 and0.01 respectively, and on the upper right andlower left by microscopic material composed ofcoal and of silicates, respectively. The large parti-cle phase function and the dust particle sizedistribution are those ofthe Uranus ring particles.Although these specific values are clearly model-dependent, the relative differences between theregions (that is, corresponding corners of thepatches) are real.
arc regions of the N53 and N63 rings-theestimated optical depth of 0.01 to 0.02 inthese regions is below the ground-basedthreshold. However, it is worth noting that(unconfirmed) ground-based stellar occulta-tion observations, revised by using Voyagerimprovements for the Neptune pole orienta-tion (35), indicate events at around 42,000kilometers and 55,000 kilometers-openingthe possibility that clumpy material maynow, or did then, exist in regions where wenow observe broad, diffuse belts of material(see Fig. 21).One other important result concerns the
identity of the object that was responsiblefor the first occultation observation of mate-rial orbiting Neptune (22). Using the meanmotions for the small satellites determinedfrom imaging observations, we obtainedtheir positions at the time ofthe 1981 event.Since this event did not occult the planet,some astrometric uncertainty remains in ad-dition to the uncertainty in the mean motionof the candidate satellites. However, we findthat 1989N2 falls within the total uncertain-ty (about 8° of orbital longitude or less than1 arc second) of the location of the event,and that the only other possible candidate(1989N4) is on the other side of the planet.This excellent positional agreement, com-bined with the fact that the 1981N1 occulta-tion was completely opaque and 180 kmacross and 1989N2 has a diameter of about200 km, makes us confident that 1981N1and 1989N2 are one and the same object(Fig. 21).
Discussion of ring observations. Despite thesingular nature of Neptune's system of rela-tively large satellites (in particular, retro-grade Triton and highly eccentric Nereid),and despite the dramatically different visualimpression that Neptune's rings give incomparison with those of Jupiter, Saturn,
0.01
0.1
(1- o3km)
E.0
I0.001 :
0.0001=
0.00001
0.1
7
71
Radius
(10Okm)61
'5
;0
50O
40
Fraction "dust"
Ground-based Voyager 2
__-41989 N2
* __ __ __ __ _
1989 N4
01989 N3*1989 N501989 N6
Fig. 21. This figure shows the radial locations ofthe most reliable ground-based occultation detec-tions of material around Neptune comparedagainst the locations of ring material as seen inVoyager imaging data. Asterisks denote ground-based observations confirmed by more than onetelescope.
and Uranus, the combined system of ringsand inner satellites has surprised us by shar-ing many characteristics with the other giantplanet ring-satellite systems. To wit, Nep-tune's rings comprise an extensive progradesystem, essentially confined to the planet'sequatorial plane and filling the planet'sRoche zone, a region lying between theclassical stability limit for a liquid satellite [r/Rp = 2.44 (Ps/Pp)033, where Ps and pp arethe densities of the satellite and the planet,respectively, Rp is the planet's radius and r isthe distance from the planet's center] andthe "accretion limit" at which equal-sizedparticles are destabilized by differential Kep-lerian motion [1.44 (Ps/Pp033)] (36).
It is a system containing narrow dusty
REPORTS I435
II Ill
I I I
1

Table 1. Small satellites of Neptune, where a is the semimajor axis.
a Mean radius Geometric Best resolutionSatellite (10+3 km) (km) albedo (km per pixel)Nereid 551 170 ± 25 0.14 ± 0.035 43.31989N1 117.6 200 ± 10 0.060 ± 0.006 1.31989N2 73.6 95 ± 10 0.056 ± 0.012 4.11989N3 52.5 75 ± 15 0.054 ± 0.024 16.91989N4 62.0 90 ± 10* 18.41989N5 50.0 40 ± 8* 17.41989N6 48.0 27 ± 8* 23.6
*Assumes albedo equivalent to 1989N1 and 1989N2.
rings, like the Uranus X ring (1986U1R)and the Saturn F ring; diffuse dusty rings,perhaps similar to the Jupiter ring and Sat-urn G ring; azimuthally confined arcs em-bedded with a ring, reminiscent of Saturn'sF and Encke rings; and possibly a broadsheet of dust like that which is seen aroundUranus at high phase angles.An examination of Neptune's system of
satellites and its distribution with orbitalradius (Table 1) supports the generalitythat, as the distance from a giant planetdecreases, there is a gradual transition fromlarge, isolated satellites to families of morenumerous, smaller satellites and ring materi-al. The presence of relatively massive objects(for instance, satellites at Neptune, rings atSaturn) well within the outer planets'Roche limits, where structural stability de-pends on internal strength but where ac-cretion to radii of tens of kilometers isdifficult or impossible, supports the ideathat the parent objects of these outer plan-et ring-satellite systems migrated into theirrespective Roche zones from elsewherelong ago (37).
In comparing only Uranus with Neptune,we find that the reflectivities of the surfacesof their inner satellites are similar and verylow. Also, the agreement between our de-rived Neptune ring arc optical depths andthose obtained from ground-based stellaroccultation measurements supports equiva-lently low albedos for the ring particles,comparable to those found for Uranus.Compositionally, therefore, the Neptuneand Uranus ring-satellite systems appear tobe quite similar, suggesting chemical originsand/or evolutionary histories that proceededin tandem, histories that may well character-ize the outer solar system beyond Saturn.However, the dramatic differences also
call for our attention. The amount ofmass inNeptune's rings is approximately 10,000times less than that at Uranus and manyorders ofmagnitude less than that at Saturn,yet the inner Neptune satellites are signifi-cantly larger, and presumably more massive,than the bodies in similar locations in thering-satellite systems ofthe other giant plan-ets. At Neptune, the five satellites 1989N2
through 1989N6, with diameters rangingfrom approximately 55 to 190 kin, all fallwithin the Roche "liquid" limit at roughly77,000 km; at Uranus, the nine satellitesfalling within its Roche limit, 1986U1through 1986U9, range from about 25 to110 km in diameter (38). If we assume theoverall satellite-size distributions to be simi-lar among the outer planets, the relativelylarge number ofbig bodies close to Neptunemight lead one to expect a proportionatelylarge abundance of smaller moonlets in thering region. Yet, our search for satellites todate does not support the existence ofmorethan two objects (1989N5 and 1989N6)with diameters less than 100 km.
Evidently, the distribution ofmass amongthe inner satellites of each planet, and be-tween each planet's satellites and rings, isvery different. The absolute amount of masswithin these zones is also notably different:All the mass in Saturn's rings, which fillSaturn's Roche zone, can be contained with-in an icy body approximately the size ofMimas, 195 km in radius; in Neptune'sRoche zone, the rings' and satellites' massescan be contained within an icy body 130 kmin radius; and for Uranus, within an icybody 75 km in radius. It is interesting tocompare these differences with the variationin present-day cratering rates on the innersatellites of these three planets: The ratio forSaturn/Neptune/Uranus is roughly 3/50/100(39). It would appear that where bombard-ment is greatest, there is less overall mass.However, the present-day differences in thedistribution of mass around the giant plan-ets may reflect, in part, the varying degreesto which bombardment and collisional pro-cesses have combined to shape their ring-satellite systems.The presence and distribution of dust in
these systems may provide a direct indica-tion of the relative importance of theseprocesses today. The relatively large numberof microscopic particles spread throughoutthe Neptune rings (Fig. 20) is not unique;the Jupiter ring and the Saturn E ringcontain a fractional optical depth of 50% to80% in dust. However, the absolute abun-dance of dust in the Neptune system, which
is about two orders of magnitude largerthan the Jupiter and Saturn counterparts,presents a serious problem. Because micro-scopic particles are very short-lived (40),they must be continually replenished. Whenmaterial is in a state of dynamic balance,equilibrium abundances are maintained byequal rates of creation and destruction.
Different removal processes dominate indifferent environments: In the Uranus rings,microscopic material is removed primarilyby gas drag (41) and, in the Jupiter rings, byplasma drag (40). In the Neptune rings, inwhich dust has a relatively large opticaldepth (approximately 10-4) and which arerelatively free of plasma or neutral gas, sim-ple sweep-up on the surfaces ofmacroscopicparticles dominates dust removal.
If the source of the dust is meteoroidbombardment, as believed for the Jupiterring, the creation and removal processes areboth proportional to parent body opticaldepth. Consequently, the dust optical depthresulting from meteoroid bombardment isindependent of the large particle opticaldepth and depends instead on the meteoroidflux and impact yield parameters (40). Forheliocentric distances less than 15 to 20 AUobserved by the Pioneer 10 and 11 dustdetectors, a value of interplanetary meteor-oid flux of about 10-16 g cm-2 s-' isgenerally accepted. Given this value andejecta yields of about 104 [see, for example(42)], "Jupiter ring" dust optical depths onthe order of 10-6 are easily obtained. How-ever, dust optical depths in N42 and theplateau (and the Uranus dust bands) arearound 10-4 (Fig. 20), requiring a bom-barding flux roughly two orders of magni-tude larger than found at Jupiter and Saturn.This larger dust abundance is qualitativelyconsistent with the previously mentionedlarger estimated projectile population atUranus and Neptune. Although the esti-mate falls short by a factor of 3 to 10, thismay be within the uncertainty in the Nep-tune dust optical depths and in the estimat-ed projectile populations.However, the dust within the N53 and
N63 rings is orders ofmagnitude larger thancan be explained by the meteoroid bom-bardment mechanism. Therefore, we sus-pect that it is most likely generated locallythrough vigorous collisions between larger,unseen particles. In this mode, the equilibri-um dust optical depth depends in a morecomplicated and model-dependent way onthe optical depth of the parent bodies thatcreate it. The dust optical depth does tend toincrease with that of the colliding parents aslong as the latter is much less than unity andthe mass injected per collision is a constant.This creation of dust through interparticlecollisions, assuming relative velocities con-
SCIENCE, VOL. 246I4-36

sistent with radial excursions as large as theobserved ring widths, may explain the gen-erally large dust abundance in the Neptunerings, given reasonable assumptions aboutthe yield per impact (43). The brightening at57,500 km (1989N5R) near the outer edgeof the plateau is one Neptune ring featurewhich, by analogy with Uranus, may be themanifestation of a moonlet belt (1). The lackofother noticeable fine structure, in contrastto the nearly 100 belts revealed in theUranus rings or the internal structure of theSaturn D ring, may be due to long exposuretimes of the images and the correspondingsmear rather than to actual absence. Ofcourse, greatly increased optical depth willdiminish the dust population because theattendant large collision rate tends to dampthe relative velocities. For instance, in thelarge optical depth rings of both Saturn andUranus, the dust fraction is extremely small.For this reason, it is not clear whether theamount of dust in the Neptune arcs isconsistent with a relatively simple moonlet-belt model or whether additional stirring ofthe ring arc material by unseen perturbingbodies is implied. Nonetheless, it appearsoverall that the moonlet-belt hypothesis thathas been proposed for the Uranus rings (1)and recently modeled in more detail (44)may go a long way toward explaining someof the global characteristics seen in the Nep-tune ring system.While it seems clear that the 1989N1R
arcs are stable over an interval of at least 5years, a search for dynamical relationshipsbetween the Neptune rings, ring arcs, andthe new satellites found within the ringregion has demonstrated that none of thecurrent hypotheses based on the combinedaction of satellite corotation and Lindbladresonances can explain the persistence of thearcs. Confinement of the ring arcs through acombination of corotational and Lindbladresonances with a single satellite (27) can beeasily discounted on several grounds: (i)1989N4 has zero inclination and eccentrici-ty to within measurement uncertainties,thereby rendering it incapable ofcorotation-ally shepherding 1989N1R; (ii) the 3:2corotation resonances of 1989N6 fall some250 km outside 1989N1R, and the expectedscale for this resonance (about 60°) is toolarge; (iii) the 50 inclination of this satelliteis insufficient to allow it to confine a ring arc15 km wide, given its radius of 27 km and areasonable assumed density. The Lagrangepoint satellite shepherding model (26) canbe discounted because no Lagrange pointsatellite of sufficient mass has been found.The only relationships that hold some prom-ise for being significant are the standardouter Lindblad-type resonances of 1989N4on the N63 ring and 1989N3 on the N53
15 DECEMBER I989
E0,cm
00
2.0 Pluto v vTriton GanyrmedeAil Titania Callisto' Ttan
T Umbriel 4 t a n
Miranda- Dione o Rhea
Mimaso Enceladus1.0 _ Tethys _lpt
0.51100 1000
Radius (km)
ring, which might account for the locationsofthe inner edges of these rings in much thesame way as Cordelia shepherds the inneredge of the Uranus e and probably X(1986U1R) rings (45). Though both iner-tial and acoustic waves in Neptune wereproposed as a possible mechanism for theazimuthal confinement of arc material, thesemechanisms can now be discounted becausethe required planetary wave amplitudeswould have to be impossibly large to pro-duce arcs with the observed longitudinalscale of 120 (46). Moreover, acoustic modecorotation resonances at Neptune do not falloutside 28,000 km (47). At the presenttime, therefore, there are no theories ex-plaining ring arcs that are verified in Voyag-er imaging data.The effort to date that has focused on the
details of a longitudinal confinement mecha-nism for the arcs, while now clearly justified,does not address the larger question of theorigin of rings and ring arcs themselves.This question will require studies of cata-strophic disruptions and the subsequent dis-persal and distribution of collisional frag-ments, as well as the study of the coupledbehavior of ensembles of moonlets and ringmaterial, both under the influence of a varie-ty of ongoing processes, like tidal evolutionand meteoroid bombardment, which con-tinually sap orbital energy and angular mo-mentum from the system. However, know-ing as we do now the basic properties of thefour ring-satellite systems of the outer solarsystem, we can begin to explore comprehen-sive models of their undoubtedly complexevolution.
The Satellites of NeptunePrior to the Voyager 2 encounter, Nep-
tune's known satellite system consisted ofone large retrograde satellite, Triton, asmaller satellite, Nereid, in a direct buthighly eccentric orbit, and the tentativelyidentified satellite (22) in the vicinity of thering arcs. Triton was discovered in 1846 byLassel, immediately following the discovery
Fig. 22. Comparison of ra-dius and observed meandensity for outer solar sys-tem objects. Filled circles aresatellites of Jupiter, opencircles satellites of Saturn,triangles satellites of Ura-nus, and inverted trianglesPluto and Triton. The uppercurve represents a simplecompression model for asatellite with 60% water iceand 40% silicate (53); thelower curve is a pure water-ice model for comparison.
ofNeptune; Nereid was not discovered untilthe 20th century by Kuiper in 1949. Unsuc-cessful satellite searches using modem CCDcameras from ground-based telescopesplaced upper limits on the diameters ofadditional satellites. These limits rangedfrom about 40 km at 15 Neptune radii (RN)up to about 2000 km at 3 RN (48). Of thesix newly discovered satellites, two (1989N1and 1989N2) were imaged with sufficientresolution to study their surfaces.
Its proximity to Neptune and low relativebrightness make ground-based observationsof Triton difficult; many of its fundamentalproperties (diameter, albedo, mass, atmo-spheric pressure) remained obscure prior toVoyager's encounter (49). Spectroscopicstudies established the presence of methane(CH4) ice or gas (or both) but showed nowater-ice absorption features which are soprominent in the spectra of most outer-planet satellites. These studies also tentative-ly identified molecular nitrogen (N2) in thegaseous and condensed states on the basis ofa weak absorption band at 2.15 ,m (50).
Triton's physical properties. Triton's radius(1350 + 5 km), determined from limb mea-surements on the Voyager images, andmass, obtained from analysis of radio track-ing data (14), yield a density of about2.075 ± 0.019. With the exceptions of therocky satellites Io and Europa, Triton's den-sity is the highest observed for an outer-planet satellite and is very similar to that ofthe Pluto/Charon system; see Fig. 22 (51,52).
If these bodies are assumed to be com-posed chiefly of silicates and water ice, therock/ice mass fractions can be derived fromthe bulk density by using interior structuremodels (53). Two extreme cases are exam-ined here: differentiated (silicate core and icemantle) and homogeneous (uniform mix-ture ofsilicate and ice or clathrate). A silicatedensity of 3.361 g cm-3 was used (54); a"chondritic" value of 3.6, used in someother studies, would result in slightly lowersilicate mass fractions than those quotedhere.
In the case that Triton was melted and
REPORTS 1437

Table 2. Triton interior model parameters, where P, is the model central pressure in bars, Xjj is thesilicate mass fraction (assuming a model uncompressed silicate density of 3.361 g cm-3), and Pu is themodel uncompressed density of Triton in grams per cubic centimeter.
Silicate core Silicate core UndifferentiatedIce-I mantle Ice-I/Ice-II mantle Silicate + Ice-I + Ice-II
PC 20360 20150 11290Xr,ii 0.75 0.69 0.65Pu 2.01 1.83 1.74
completely differentiated, it would haveformed a silicate core approximately 1000km in radius overlain by an Ice-I mantleapproximately 350 km thick (Table 2, col-umn 1). As the interior cooled, a layer ofIce-II may have developed due to the verylow surface temperature. The existence andthickness of such a layer strongly depend onthe details of the Ice-I/Ice-II phase bound-ary, poorly known for these low tempera-tures. Ice-II also will not be present ifthe ammonia hydrate/water eutectic isreached and some of the interior is partiallymolten. Column 2 of Table 2 gives thecharacteristics of models for a mixture ofIce-I and Ice-II by means of the phaserelation given by Lupo (54). A homoge-neous undifferentiated model (Table 2, col-umn 3) would result in a layered structure ofsilicate mixed with Ice-I, Ice-II, and Ice-VIin the deep interior.The differentiated models are clearly the
most plausible. Triton is large enough thatradiogenic and accretional heating alonelikely resulted in differentiation. In addition,if Triton is a captured satellite, tidal evolu-tion of its orbit also would have producedsignificant heating and melting (55, 56).
Triton's extensive resurfacing is also incon-sistent with an inactive, homogeneous inte-rior.
Triton's estimated silicate fraction is high-er than those of the large icy satellites ofJupiter, Saturn, and Uranus, but similar tothat of the Pluto/Charon system; see Fig. 23(53). This is consistent with the hypothesisthat Triton was formed in the solar nebulaand subsequently captured by Neptune (55).These high densities have important impli-cations for the carbon chemistry ofthe outersolar nebula. If the nebular carbon weremostly in CO gas, the H20 abundancewould be depressed relative to that of thesilicates (53). Modifications to the simpleconcept ofCO-rich versus CH4-rich nebulaemay be required, however, in response torecently suggested revisions of the cosmiccarbon abundance (57) and to the lack ofdetected CO on Triton or Pluto.Another important aspect of these models
is the relatively high interior temperaturesexpected, even at the current epoch. If con-ductive heat transport alone is considered,with the radiogenic heat produced by a2000-km-diameter chondritic core, the eu-tectic melting point of ammonia hydrate
Triton Pluto/Charon
,1"",,, Uste,........................ I
t * ~~Satellite system averagesTitaniaI Oberon
Ariel/UmbrielI ________\\\\\\>\\\\X Uranus differentiated
JupiterLII ~~~~~~~~~~~~~Saturnjt assane(massaverage)
Rhea Uranus Homogeneous
* MirandaMd ~~~~SaturnCH4-Rich (object average)
Mimas j
I L Leaend- __ niffrnfntei Imril*1 IFig. 23. Comparison of model silicate mass fractions for several outer planet satellites and thePluto/Charon system (53, 54). Two types of satellite interior structure are given, a fully differentiatedbody with a silicate core and an ice mantle, and a homogeneous undifferentiated mix of water ice andsilicates. Radiogenic heating is taken into account in the current thermal structure of the interiors. Alsoshown are approximate values for silicate mass fraction for bodies formed in CO-rich and CH4-richnebular conditions and the system averages from several satellites as compiled in (51).
1438
*Bysullu. UIVR;Homogene UIo uudl I
Homogeneous model 2
CO-Rich
would be reached at a depth of only 200 to300 km; the melting point of water icewould be near the core-mantle boundary.Convective heat transport in sub-solidusconvection would cool the interior morerapidly than conduction alone, and morecomplicated models need to be considered.
Local topographic relief on cliffs, ridges,knobs, pits, and craters commonly exceeds-1 km over most of Triton's surface. Thisimplies that a rigid material, which wouldnot flow at the 40 to 50 K near-surfacetemperatures over billions of years, is re-quired to support them. The rheologies ofsolid N2 and CH4 are not well known atthese temperatures but it seems unlikely thata 1-km-high cliff could be supported overgeologic time in a material held at half totwo-thirds of its melting temperature. Suchrelief could easily be supported in water iceor water-dominated ammonia-water ice,however. We suspect that water ice is in factthe primary component of the near-surfacecrustal materials overlain by thin veneers ofnitrogen and methane ices and their deriva-tives.
Triton spectrophotometry. Clear-filter, nar-row-angle images acquired during the last 2weeks of approach were analyzed to deter-mine Triton's light curve (Fig. 24). Integral-disk brightness measurements were scaled toconstant distance from Triton and correctedfor the disk-averaged phase curve describedbelow. Confirmed by preliminary geodeticcontrol measurements, these data indicatesynchronous rotation. A Cassini state 2 rota-tion state (rotation axis not perpendicular tothe orbital plane) was suggested as a theo-retical possibility based on dynamical argu-ments (58) but is ruled out by the data. Thelight curve agrees well in magnitude andsense (leading side brighter-90° longitude,Figs. 24 and 25) with broadband V filtermeasurements, but telescopic measurementsat 890 nm show no light curve larger thanabout 2% (59). This suggests that the sur-face contrast at 890 nm is less than at visiblewavelength and implies that the chromo-phores (possibly silicates or hydrocarbons orboth) responsible for albedo and color varia-tions on Triton are more absorbing atshorter wavelengths.
Triton was imaged at phase angles be-tween 12 degrees and 156 degrees throughthe violet, green, and clear filters. These dataare combined with ground-based V band-pass data (similar to the green filter ineffective wavelength) in Fig. 26. Also shownare fits to the green and violet data usingHapke's photometric model; see (61) andTable 3. The phase curves display remark-able wavelength-dependent differences. Atsmall phase angles Triton is brighter in thegreen filter than in the violet; at large phase
SCIENCE, VOL. 246
0.8
0.7 F-
0.6 V
0.5 V
c0coU)0conE0
05U 0.4
0.3p11PI I
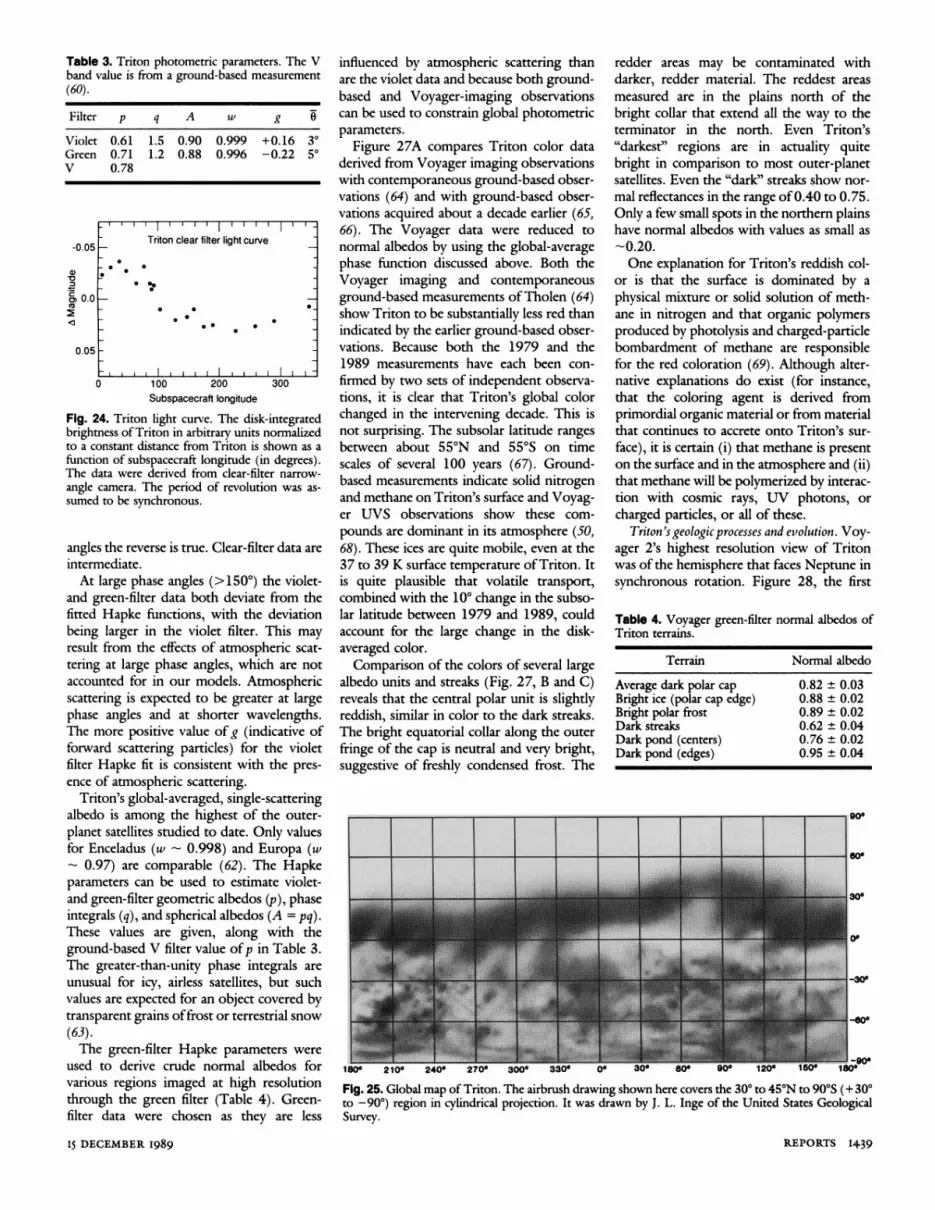
Table 3. Triton photometric parameters. The Vband value is from a ground-based measurement(60).
Filter p q A w g 0
Violet 0.61 1.5 0.90 0.999 +0.16 30Green 0.71 1.2 0.88 0.996 -0.22 5°V 0.78
-0.05
o,0.0
0.05
0 100 200 300Subspacecraft longitude
Fig. 24. Triton light curve. The disk-integratedbrightness of Triton in arbitrary units normalizedto a constant distance from Triton is shown as afunction of subspacecraft longitude (in degrees).The data were derived from clear-filter narrow-angle camera. The period of revolution was as-sumed to be synchronous.
angles the reverse is true. Clear-filter data are
intermediate.
At large phase angles (>150°) the violet-and green-filter data both deviate from thefitted Hapke functions, with the deviationbeing larger in the violet filter. This mayresult from the effects of atmospheric scat-tering at large phase angles, which are notaccounted for in our models. Atmosphericscattering is expected to be greater at largephase angles and at shorter wavelengths.The more positive value of g (indicative offorward scattering particles) for the violetfilter Hapke fit is consistent with the pres-
ence of atmospheric scattering.Triton's global-averaged, single-scattering
albedo is among the highest of the outer-
planet satellites studied to date. Only valuesfor Enceladus (w 0.998) and Europa (w
- 0.97) are comparable (62). The Hapkeparameters can be used to estimate violet-and green-filter geometric albedos (p), phaseintegrals (q), and spherical albedos (A = pq).These values are given, along with theground-based V filter value ofp in Table 3.The greater-than-unity phase integrals are
unusual for icy, airless satellites, but suchvalues are expected for an object covered bytransparent grains offrost or terrestrial snow(63).The green-filter Hapke parameters were
used to derive crude normal albedos forvarious regions imaged at high resolutionthrough the green filter (Table 4). Green-filter data were chosen as they are less
15 DECEMBER I989
influenced by atmospheric scattering thanare the violet data and because both ground-based and Voyager-imaging observationscan be used to constrain global photometricparameters.
Figure 27A compares Triton color dataderived from Voyager imaging observationswith contemporaneous ground-based obser-vations (64) and with ground-based obser-vations acquired about a decade earlier (65,66). The Voyager data were reduced tonormal albedos by using the global-averagephase function discussed above. Both theVoyager imaging and contemporaneousground-based measurements ofTholen (64)show Triton to be substantially less red thanindicated by the earlier ground-based obser-vations. Because both the 1979 and the1989 measurements have each been con-
firmed by two sets of independent observa-tions, it is clear that Triton's global colorchanged in the intervening decade. This isnot surprising. The subsolar latitude ranges
between about 55°N and 55°S on timescales of several 100 years (67). Ground-based measurements indicate solid nitrogenand methane on Triton's surface and Voyag-er UVS observations show these com-
pounds are dominant in its atmosphere (50,68). These ices are quite mobile, even at the37 to 39 K surface temperature ofTriton. Itis quite plausible that volatile transport,combined with the 100 change in the subso-lar latitude between 1979 and 1989, couldaccount for the large change in the disk-averaged color.Comparison of the colors of several large
albedo units and streaks (Fig. 27, B and C)reveals that the central polar unit is slightlyreddish, similar in color to the dark streaks.The bright equatorial collar along the outer
fringe of the cap is neutral and very bright,suggestive of freshly condensed frost. The
redder areas may be contaminated withdarker, redder material. The reddest areas
measured are in the plains north of thebright collar that extend all the way to theterminator in the north. Even Triton's"darkest" regions are in actuality quitebright in comparison to most outer-planetsatellites. Even the "dark" streaks show nor-
mal reflectances in the range of0.40 to 0.75.Only a few small spots in the northern plainshave normal albedos with values as small as
-0.20.One explanation for Triton's reddish col-
or is that the surface is dominated by a
physical mixture or solid solution of meth-ane in nitrogen and that organic polymersproduced by photolysis and charged-particlebombardment of methane are responsiblefor the red coloration (69). Although alter-native explanations do exist (for instance,that the coloring agent is derived fromprimordial organic material or from materialthat continues to accrete onto Triton's sur-
face), it is certain (i) that methane is presenton the surface and in the atmosphere and (ii)that methane will be polymerized by interac-tion with cosmic rays, UV photons, or
charged particles, or all of these.Triton's geologic processes and evolution. Voy-
ager 2's highest resolution view of Tritonwas of the hemisphere that faces Neptune insynchronous rotation. Figure 28, the first
Table 4. Voyager green-filter normal albedos ofTriton terrains.
Terrain Normal albedo
Average dark polar cap 0.82 0.03Bright ice (polar cap edge) 0.88 0.02Bright polar frost 0.89 0.02Dark streaks 0.62 ± 0.04Dark pond (centers) 0.76 ± 0.02Dark pond (edges) 0.95 ± 0.04
Fig. 25. Global map of Triton. The airbrush drawing shown here covers the 300 to 45°N to 90°S (+ 300to -90°) region in cylindrical projection. It was drawn by J. L. Inge of the United States GeologicalSurvey.
REPORTS I439
II
Triton clear filter light curve
0
* @0
0 0 0
. *
_ 111111 _' i

0)
0m
0 50 100Phase angle (a)
Fig. 26. Voyager camera violet-, grclear-filter phase curve for Triton. Manormalized at zero phase angle to-2.5loglo(p), where p is the geometrThe solid line represents the best-fit Irameters for the violet filter; the dashedthe green filter (see Table 3). Both cunBo = 0 (no opposition surge).
image to clearly show surface featFig. 29, a mosaic of higher resolutping frames, both show this heiLess than 40% ofTriton was imagcresolution; it should be kept in rour understanding of Triton's geolcesses and history is limited to thiBy comparison to most planetar)
Triton's appears geologically younand Europa, heavily cratered terabsent. All other outer-planet sateplay regions of heavily cratered terevidently date back to the early ptional bombardment. Triton's surfasistent with an object that was geactive and resurfaced well after theheavy bombardment.
Albedo patterns. Triton's color atpatterns can be broadly divided intof the brighter polar cap that occuthe entire southern hemispheresomewhat darker and redder plextend roughly from the equator nto the terminator (Fig. 25). Data cshow that all ofthese surfaces havealbedos (0.6 to 0.9); all are likely c
substantially of volatiles.In most cases the color/albedo
not correlate with geologic terraingraphic features, suggesting theythin veneers draped over the ten(Fig. 30). For example, clustersalbedo patterns with irregular,dark centers surrounded by brigh'occur near the eastern limb (Fig.right). A few impact craters can beand on them but they themselves cobvious topography. The intericpolar cap displays discrete boundirregular, patchy areas that appc"windows" in the bright reddish ic(Fig. 30, lower left). There are noing cases of relief along these discriwhich is again suggestive of thin
below the limits of detection.liolet fit The slightly darker streaks scattered overJreen fit the interior of the ice cap resemble the
ubiquitous martian "wind streaks" attribut-ed to eolian erosion and deposition. TheTriton streaks range in length from a few
IQo - 10's up to about 100 km. Often small,o darker, irregular patches a few kilometers\ across occur at the heads of the streaks; less
commonly a bright region also appears near150 the head. Although between roughly 100
and 30°S, the streaks are preferentially ori-reen-, and ented toward the northeast; farther to theignitude is south the directions are highly irregularicqalbedo with streaks crossing one another. In a fewHapke pa- cases streaks of opposite direction originatel line is for from the same point.ves assume Whether the streaks are modern or an-
cient features is difficult to say from theirsurface patterns alone. It seems unlikely that
ures, and they are older than very many Triton yearstion map- (that is, a few thousand years), because themisphere. dark particles of which they are probablyed at high formed would migrate deep into the icenind that deposits after multiple cycles of pole-to-polelogic pro- migration of the volatiles.Lssample. Transport of material by the winds iny surfaces, Triton's tenuous atmosphere seems requiredig; like Io as part of the explanation for the streaks. Asrrains are mentioned earlier, some methane will inev--llites dis- itably be converted to particles of dark com--rains that plex hydrocarbons that will be found inost-accre- Triton's surficial deposits. Those particlesace is con- that are fine enough (a few micrometers orologically less) can be suspended in the atmosphereperiod of and carried substantial distances downwind.
For Triton dust settling occurs in the Ep-nd albedo stein or kinetic regime as opposed to theo (i) units Stokes or viscous regime as the mean freeipy nearly path in the tenuous nitrogen atmosphere isand (ii) large compared to the particle size. From
lains that simple momentum transfer arguments, weiorthward estimate, for instance, that a 1-,um particle)fTable 4 would settle through the bottom scalevery high height (about 14 km) in about 5 days. Thecomposed basic question is how the dark particles
become airborne in the first place. Theunits do estimated threshold velocity for the surface
s or topo- wind to pick up particles a few micrometersrepresent in diameter could be as low as roughly 1rain units ms- . Such surface winds are quite conceiv-)f strange able. As discussed below, however, at leastrounded, two dark geyser-like plumes have been iden-t aureoles tified. In one, dark material is clearly erupt-30, lower ing nearly vertically to an altitude ofabout 8seen near km. Purely eolian explanations are not re-lisplay no quired unless the dark streaks are polygenet-:r of the ic.laries and Morphological units. The topography of theear to be central part of polar cap (br, bs, bst in Fig.cy deposit 31) is difficult to interpret owing to theconvinc- exceedingly complex albedo patterns. Only a
ete edges, few inarguable topographic landforms candeposits be distinguished in those units, all impact
1440
craters. Our descriptions of Triton's surfacemorphology are confined to the terrains tothe north (Fig. 31).An extensive unit termed the "canta-
loupe" terrain (ct) dominates the westernpart of the equatorial region. It consists of adense concentration of pits or dimples thatare crisscrossed by ridges ofviscous material
0 1.00m 0.80
20.600
* 0.40
C 0.20
0c
a)
-aE0
z
a1)0
-ac
z
u.uu I . . . ,
0.30 0.40 0.50 0.60 0.70Wavelength (jgm)
1.2B
1.0 _ Bright equatorial collarBright centralareas
0.8 Dark streak
0.6- Equatorial dark zone
0.40.3 0.4 0.5 0.6 0.7
Wavelength (gm)
c0.9 Brighter background
0.8 Streak 3-
0.7 _ Streak 2 _Streak 1
0.6 _
0.5 _
0.4 _
0.3 _Darkest spots
0.2- 0 VTMAP -
lI0.3 0.4 0.5
Wavelength (uim)
0.6
Fig. 27. Triton colors and albedos. (A) Ground-based spectra of Triton in the visual and near
infrared taken in 1979 as well as contemporane-ously with the Voyager encounter ofNeptune are
shown (64, 65). Plotted with the ground-baseddata are the Triton disk-averaged colors as ob-tained from Voyager narrow-angle camera im-ages. Note the substantial color change from1979 to 1989 shown by these data. (B) Normalreflectance of selected areas on the encounterhemisphere of Triton are shown (see text). (C)Normal reflectances of selected dark areas on
Triton are shown. The brighter background spec-trum is an average of bright areas adjacent to thedark streaks whose normal albedos are also plot-ted. The darkest spot is located north of theequator in the darker, redder plains.
SCIENCE, VOL. 246
0 I I
l~~~ ~ ~~~---
2 N* Earth-based V filter '
- o Voyager green filter4
A Voyager clear filter
o Voyager violet filter6
A. .. ......,.-A A
Cruikshank,et al.,19797
A Tholen, 1989- RBll et al.. 1979 -V' La'al C7& al#., 1,7u
0 VGR - ISS.... .... I... .
II
A

erupted into grabens. The grabens are glob-al in scale and organization, continuing intoother terrains to the east and south. Most ofthe dimples fall into two roughly uniformsize classes ofabout 5-km and 25-km diame-ter; the smaller ones are found dominantlyin the western part of the terrain. Both sizesare often organized into linear, equallyspaced sets. It is possible that none of thesefeatures is of impact origin. In fact, recogni-tion of any impact craters in the cantaloupeterrain is extremely uncertain. Seen at thehighest resolution (Fig. 30, upper left) thecantaloupe terrain displays an extremely rug-ged and mottled texture. Some combinationof viscous flow and collapse and deteriora-tion of the landforms by extensive sublima-tion of surface materials may have beenresponsible for the complex landscape ob-served here.A morphological sequence in the degree
of eruption into the grabens can be dis-cerned. The sequence begins with the U-shaped floor at the Y-shaped branch in thetop of Fig. 30, lower left. Farther northwestalong the valley floor, a narrow ridge isvisible that erupted along a section of thevalley floor and along an intersecting fault,crossing out into the plains to the south.Even farther north in the cantaloupe terrainand to the east limb along the equator,viscous material welled up in the valleyfloors forming ridges that stand above theadjacent plains (Fig. 29).
In contrast to the cantaloupe terrain, theeastern plains are dominated by a series ofmuch smoother units. The first of these isthe floor material (sv) in two "lake-like"features a few hundred kilometers acrosslocated near the terminator (Figs. 29 andFig. 30, upper right). The floors are ex-tremely flat compared to other plains units,embaying the scarp-rimmed margins andsurrounding numerous hills and knobs thatprotrude through the deposit. The floors areterraced, occurring at several levels separatedby scarps a few hundred meters high, sug-gesting multiple episodes of emplacement.A cluster of small irregular pits surroundinga large central pit, likely associated with aneruptive vent, is found in each of the floors.A single impact crater about 15 km indiameter shows that material that is rigid ongeologic time scales makes up the bulk ofthe floor material.Another smooth plains unit dominates
the region just south of the two flat-flooredlake-like depressions. It occurs as high-standing smooth plains (sh) that appear tohave erupted from large quasi-circular de-pressions; one can see that strings of irregu-lar rimless pits occur commonly in this unit(Fig. 31). Like the flat-floored deposits, thehigh-standing plains are quite smooth and
IS DECEMBER I989
have a very low density of superimposedimpact craters. In contrast, however, thesedeposits stand as thick masses extruded ontoand standing above preexisting terrains. Thedeposits terminate with rounded flow mar-gins partially burying subjacent landforms.In places these deposits appear to be a fewkilometers thick. Eruptions of comparablestyle, recognized on Ariel, are thought tohave been formed by highly viscous materi-al, such as partially crystalline ammonia-water mixtures (70).The third plains unit in the eastern region
is a hummocky plain (th). It appears to havebeen formed by extensive eruption of mate-rial along sections ofthe grabens that flowedout onto adjacent plains forming hum-mocky, rolling deposits and obliterating sec-tions of the graben entirely. Figure 29shows this unit to have the greatest abun-dance of impact craters.
In general, Triton's global fault systemevidences a tensional regime. Several fea-tures in the transition zone between thelake-like features and cantaloupe terrain,however, suggest lateral displacement alongstrike-slip faults. Some show an offset of afew kilometers, others up to 30 km. Thebest example is an irregular depression 100to 120 km (Fig. 32, left). It resembles manyother depressions so common in this region;by contrast its margins appear to have beenoffset along ridge-and-groove lineaments.We speculate that the feature was deformedby two subsequent strike-slip motions, eachwith an amplitude of about 30 km. Whenthe image is sheared along the hypothesizedfault lines, the outline of the feature isrestored to one typical of other cantaloupe
Fig. 28. Color image ofTri-ton acquired at a range of530,000 km with a resolu-tion of 10 km per line pair.Narrow angle images ob-tained with green, violet,and ultraviolet filters were
depressions (Fig. 32, right). Other truncat-ed features also appear to line up afterrestoration.
Impact crater abundances and relative ages. Atthe resolution of the global mapping imagesof Fig. 29 (1.5 to 3 km per line pair) impactcraters are generally rare. Craters with diam-eters from the limit of resolution up toabout 12 km display sharp rims and bowl-shaped interiors. Larger craters, ranging upto the largest (27-km diameter) are complex,having flat floors and central peaks. Thetransition diameter from simple to complexand depth/diameter ratios for Triton's cra-ters are similar to those observed on othersatellites whose crustal materials are thoughtto be dominantly water ice. Ejecta blanketsare not visible, probably due to inadequateresolution. The craters also do not have rays,probably because veneers of mobile surfacevolatiles mask them.
Impact crater statistics were collected forfour areas (Fig. 33, top). Area 1, the mostheavily cratered region, occurs in the leadinghemisphere ofTriton's rotation-locked, syn-chronous orbit. Area 2, the least cratered,coincides with units sv and sh. Area 3 is inthe cantaloupe terrain. Area 4 is a part of theice cap interior. Owing to difficulty of rec-ognizing impact craters with any confi-dence, crater statistics for the cantaloupeterrain have been excluded.
Figure 33, bottom, compares the crater-size frequency distribution for areas 1, 2,and 4 with those of the lunar highlands,typical lunar maria, and the fresh craterpopulation on Miranda's rolling crateredplains (1, 71). Triton's most heavily crateredterrain displays a population similar to that
used as the red, green, andblue components. High fre-quency information from aclear image, containing thegreatest detail, was mergedwith the color data.
REPORTS I441

V, n",~~~~~~~~~~~~~~~~~4

4

fact seen in the Triton images. These includeclouds above the limb and extending intothe terminator and an extensive opticallythin haze that appears to be uniformly dis-tributed around the disk. The haze is diffi-cult to detect in limb images due to scatteredlight from Triton's bright surface, but it iseasily seen in crescent images where it shows
an extension of the cusp beyond the termi-nator. It apparently extends to an altitude ofabout 30 km. more than two scale heights,and has an optical depth ofabout 2 x 10⁻⁴.We interpret it to be composed of photo-chemically generated smog-like particles de-scribed above.
Several clouds are seen in backscatter
EXPLANATION
- Contact-Dasd wheapproximae Grabens-I- Faultorscap-Balondownhownskn -4e - Rides
o Lar guladero Smal irregular depressions
Fig. 31. Sketch map ofTriton's terrains and south polar units. Units mapped are as follows: cantaloupeterrain-ct, smooth floor material-sv, high-standing smooth matenials-sh, hum rolling plains-th,linear ridge materials-ri, bright spotted polar unit-bs, bright streaked polar unit-bst, bright rugged polarunit-br.
I,oI 0
above both the east and west limbs (Fig.34). In places these clouds are clearly de-tached; in others they appear to extend tothe surface. The limb clouds appear abovediffuse bright regions seen on the limb,suggesting that they are composed of brightparticles that can be seen both in backscatteras well as in projection against the disk. Allofthe limb clouds so far detected are locatedover the subliming south polar ice cap.Brightness scans perpendicular to the limb
10 100Crater diameter (km)
Fig. 32. Possible strike-slip faulting on Triton. (Left) The irregular depression near the center of theview appears to have been distorted by lateral faulting. (Right) One possible reconstruction of thefeature shown in this view requires two episodes of strike-slip faulting, each with roughly 30 km ofdisplacement.
14441
Fig. 33. Impact crater statistics for various re-gions of Triton. (Top) The locations of regionsfor which data were collected indude: area 1, themost heavily cratered; area 2, lightly cratered; area3, cantaloupe terrain, and area 4, a plains regionjust outside the inner cap zone. The dash-endosedareas (6, 7, and 8) were analyzed to detect apossible gradient in the crater flux (see text).(Bottom) Triton crater size/frequency distribu-tion for area 1 (Triton HC), area 2 (Triton LC),and area 4 (Triton SH) compared with the freshcrater population on Miranda, the lunar high-lands, and the lunar post-mare. The curves werenormalized to a standard -2 cumulative distribu-tion power law as in (1).
SCIENCE, VOL. 246

on one of these images (Fig. 35) show acloud that extends from close to the surfaceto an altitude ofabout 4 kmi, above which itsbrightness sharply decreases. We interpretthis feature to be a nitrogen condensationcloud. The ubiquitous diffuse haze can bare-ly be discerned in the scans extending fromthe surface to an altitude of almost 30 km.
Because they are thin, the optical thick-ness of the limb clouds can be estimatedfrom their observed brightness. Assumingisotropic scattering (both of the direct andsurface-reflected sunlight), we estimate opti-cal depths of about 10-3. If more realisticparticle phase functions are used, the esti-mated optical depths are several times larger(73). Also, in some cases the brightness ofthe discrete clouds is as much as three timeslarger than shown in Fig. 35. Together thesefactors imply optical depths ranging up to10-2.
Bright clouds extending beyond the ter-minator are visible in a long sequence ofoutbound images of the opposite hemi-sphere to that seen in the mapping coverage(Fig. 36). The terminator is at roughly45°S; again the clouds are seen above thesouth polar cap. From the distance theyextend beyond the terminator, their alti-tudes are estimated to be in excess of 13kilometers. These clouds remained station-ary relative to the surface for the 2-dayperiod as they rotated through the termina-tor region. They appear to correlate withdark surface markings seen in the low reso-lution approach images 3 days prior toclosest approach.
Several east-west, elongated clouds canalso be seen over the illuminated part of thecrescent in a color image set acquired soonafter Triton closest approach at a phaseangle of approximately 1400 (Fig. 37). Bothclouds and surface detail can be discerned.The clouds apparently cast shadows, givinga very rough estimate of their altitudes of afew kilometers. Like the clouds associatedwith the geyser-like plumes described be-low, these elongated clouds are roughly 100kmn long and 10 km wide. They may also beassociated with erupting plumes, but nodirect evidence exists for plumes connectingthem to surface sources.
Triton's geyser-like plumes. The Voyager 2images of Triton were acquired over a suffi-ciently wide range of viewing angle thatmany regions can be studied stereoscopical-ly. The last global view of Triton, acquiredjust prior to closest approach to Neptune,was imaged from a sub-spacecraft latitude ofabout 15°S. Subsequent higher resolutionframes of the mapping coverage were ac-quired from latitudes ranging from about100 to 250N at about the same longitude.Through stereoscopic examination and by
projecting these images to a common per-spective onto a sphere, it was possible tostudy topographic landforms and search formaterial aloft. In this way two active geyser-like plumes have been confidently identified;several others are suspected. All are locatedwell inside the complex central zone of
Triton's south polar cap.The first of the two well-observed plumes
(termed here the west plume) is situated at3340E, 50°S (Fig. 38, top). West plume isvisible in at least four views, which haveemission angles of 370, 620, 670, and 750 atits location. The feature appears as an 8-km-
Fig. 34. Limb clouds above Triton's south polar cap. Each of the images is shown with two differentstretches to enhance the limb clouds and surface features separately. Dark pixels mark the best estimateof Triton's limb. (Top) Cloud on the west limb that extends about 100 km along the limb and appearsdetached over much of its length. (Bottom) Cloud imaged above the east limb that extends about 200km along the limb and is asymmetrical.
2000
Latitude Longitudei. 27.79 296.13
1500 _ ! \ ----- 28.28 296.33oC --- 31.15 297.59\o --- 13.66 291.55
1000 -
Fig. 35. Brightness scansacross sections of thecloud shown in Fig. 34,top. The latitudes andlongitudes of the scansare indicated.
1350 1360 1370 1380 1390Radius (km)
15 DECEMBER I989 REPORTS 1445
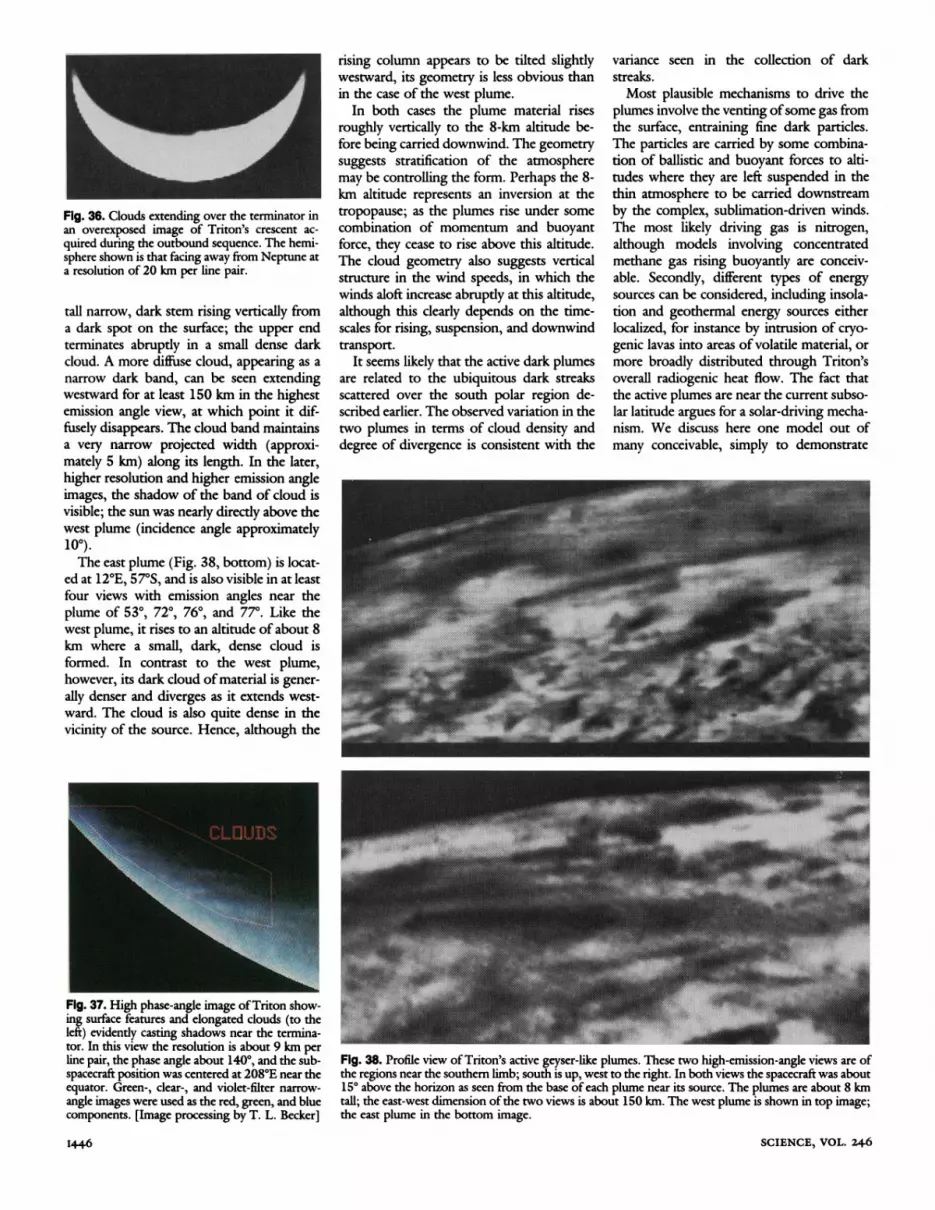
Fig. 36. Clouds extending over the terminator inan overexposed image of Triton's crescent ac-quired during the outbound sequence. The hemi-sphere shown is that facing away from Neptune ata resolution of 20 km per line pair.
tall narrow, dark stem rising vertically froma dark spot on the surface; the upper endterminates abruptly in a small dense darkcloud. A more diffuse cloud, appearing as anarrow dark band, can be seen extendingwestward for at least 150 km in the highestemission angle view, at which point it dif-fusely disappears. The cloud band maintainsa very narrow projected width (approxi-mately 5 km) along its length. In the later,higher resolution and higher emission angleimages, the shadow of the band of cloud isvisible; the sun was nearly directly above thewest plume (incidence angle approximately100).The east plume (Fig. 38, bottom) is locat-
ed at 12°E, 57°S, and is also visible in at leastfour views with emission angles near theplume of 530, 720, 76°, and 77°. Like thewest plume, it rises to an altitude of about 8km where a small, dark, dense cloud isformed. In contrast to the west plume,however, its dark cloud ofmaterial is gener-ally denser and diverges as it extends west-ward. The cloud is also quite dense in thevicinity of the source. Hence, although the
rising column appears to be tilted slightlywestward, its geometry is less obvious thanin the case of the west plume.
In both cases the plume material risesroughly vertically to the 8-km altitude be-fore being carried downwind. The geometrysuggests stratification of the atmospheremay be controlling the form. Perhaps the 8-km altitude represents an inversion at thetropopause; as the plumes rise under somecombination of momentum and buoyantforce, they cease to rise above this altitude.The cloud geometry also suggests verticalstructure in the wind speeds, in which thewinds aloft increase abruptly at this altitude,although this dearly depends on the time-scales for rising, suspension, and downwindtransport.
It seems likely that the active dark plumesare related to the ubiquitous dark streaksscattered over the south polar region de-scribed earlier. The observed variation in thetwo plumes in terms of cloud density anddegree of divergence is consistent with the
variance seen in the collection of darkstreaks.Most plausible mechanisms to drive the
plumes involve the venting ofsome gas fromthe surface, entraining fine dark particles.The particles are carried by some combina-tion of ballistic and buoyant forces to alti-tudes where they are left suspended in thethin atmosphere to be carried downstreamby the complex, sublimation-driven winds.The most likely driving gas is nitrogen,although models involving concentratedmethane gas rising buoyantly are conceiv-able. Secondly, different types of energysources can be considered, including insola-tion and geothermal energy sources eitherlocalized, for instance by intrusion of cryo-genic lavas into areas ofvolatile material, ormore broadly distributed through Triton'soverall radiogenic heat flow. The fact thatthe active plumes are near the current subso-lar latitude argues for a solar-driving mecha-nism. We discuss here one model out ofmany conceivable, simply to demonstrate
Fig. 37. High phase-angle image ofTriton show-ing surface features and elongated clouds (to theleft) evidently casting shadows near the ternina-tor. In this view the resolution is about 9 km perline pair, the phase angle about 1400, and the sub-spacecraft position was centered at 208°E near theequator. Green-, clear-, and violet-filter narrow-angle images were used as the red, green, and bluecomponents. [Image processing by T. L. Becker]
1446
Fig. 38. Profile view of Triton's active geyser-like plumes. These two high-emission-angle views are ofthe regions near the southern limb; south is up, west to the right. In both views the spacecraft was about15° above the horizon as seen from the base ofeach plume near its source. The plumes are about 8 kmtall; the east-west dimension ofthe two views is about 150 km. The west plume is shown in top image;the east plume in the bottom image.
SCIENCE, VOL. 246

that simple, plausible explanations do exist.The model we describe is for solar-drivennitrogen gas geysers.The insolation-driven mechanism in-
volves a "greenhouse" effect. A way to con-struct an extremely efficient greenhouse is tocover a dark absorbing layer with a relativelytransparent layer, which we propose to be alayer ofnitrogen ice, that is both volatile andhas a low thermal conductivity. Ground-based spectroscopic observations of Tritonshow an absorption feature at 2.15 pm thatwas attributed to nitrogen, requiring a pathlength in the nitrogen equivalent to a meteror more of solid or liquid (50). In this modelthe radiation is absorbed in a dark substratebeneath the nitrogen layer. The temperaturewill rise until the thermal gradient reaches apoint where the excess heat is conducted andreradiated back to the surface.The vapor pressure of nitrogen ice in-
creases rapidly with increasing temperature.A temperature rise of 10 degrees aboveTriton's 37 K surface temperature results inroughly a one hundred-fold increase in pres-sure. If the layer ofnitrogen is thick enough(>1 or 2 meters), sufficiently transparent,and locally seals off the subsurface, the sub-surface vapor pressure will increase, fillingpermeable subsurface reservoirs. Ifthe seal is
ruptured or if the pressurized gas migrateslaterally to an open vent it will rapidlydecompress, launching a plume of nitrogengas and ice, entraining dark particles en-countered in the exit nozzle, and carryingthem to altitude.
Small satellites. Of the newly discoveredsatellites (Table 1), only 1989N1 and1989N2 were well enough resolved to seesurface features (Fig. 39). As resolution wassufficient to measure radii directly for1989N1, 1989N2, and 1989N3, their albe-dos are also reasonably well determined.One color sequence acquired of 1989N1shows it to have a flat spectrum; violet-,green-, and clear-filter albedos all fall within10% of each other, similar to Voyager pho-topolarimetry observations for 1989N2(29).The low resolution view of Nereid pro-
vided only an approximate albedo; no sur-face or limb features were detectable (Fig.41). Nereid's spectral reflectivity (geometricalbedo in the violet, green, and clear filters)is flat within 10%. Clear-filter images usedto derive Nereid's phase curve between 250and 550 (Fig. 40) yield a linear phase coeffi-cient of 0.021 magnitudes per degree. Norotational effects were detected in the Nere-id images; the amplitude of its light curve isless than 10%. Inasmuch as the orientationof Nereid's pole is unknown, we cannotderive limitations of its shape from thesedata. The Voyager viewing direction dif-fered only by approximately 250 from that ofrecent ground-based observations (74) thatsuggested a large amplitude light curve. Wesee no evidence for an amplitude of morethan 10%. The rotation period remains un-known.
1989N1 and 1989N2 are irregularlyshaped; 1989N1 displays craters, one nearthe terminator about 150 kilometers across.1989N1 was resolved at several longitudesand is slightly elongated; topography ofabout 20 km can be seen on its limb. Theclosest view weakly shows linear features; nosubstantial albedo features are seen. Theirregular shape of 1989N1, which had adiameter of 400 kilometers, might seemsurprising. However, the internal strengthrequired to support such topography fallswithin the expected range even for an icyobject (75).
Collisional histories of satellites. Bombard-ment by comets over the last -3.5 billionyears probably accounts for most of thecraters observed on Triton and for the originof the small satellites 1989N5 and 1989N6by collisional fragmentation. The comet fluxclose to Neptune is dominated by cometscaptured into relatively short-period Nep-tune-crossing orbits by encounters with thatplanet. A rough estimate of the number ofthese Neptune family comets can be madeby extrapolation from the observed Jupiterfamily of short-period comets (76, 77). Onthe basis oftheoretical studies of the captureprocess (78), we infer that there is a fairlysteady population of the order of a millionNeptune family comet nuclei with absoluteB-magnitude greater than 18 (this corre-sponds approximately to diameters greaterthan about 2.5 kilometers). This estimate isconservative; if most short-period cometshave been derived from a region lying amoderate distance beyond Neptune or be-tween Uranus and Neptune (79), the popu-lation of Neptune family comets might be10 to 20 times higher. Long-period cometsalso strike the satellites ofNeptune, but theirimpact contributes, at most, only a fewpercent to the estimated production of cra-ters on Triton and on the small regularsatellites.
Sun
Fig. 39. Voyager 2's best views of 1989N1 and1989N2. (A) 1989N1 is shown in this image at aresolution of 7.9 km per pixel; (B) 1989N1 is at1.3 km per pixel; and (C) 1989N2 at 4.2 km perpixel. (D) Schematic of the viewing geometry.Arrows labeled S/C indicate spacecraft view; let-ters correspond to images A, B, and C.
IS DECEMBER I989 REPORTS 1447

Q~~~~~~~~Fig. 40. Voyager 2's best view of Nereid. (A) Acquired from a range of 4.7 million km at a phase angleof about 900, this image has a resolution of 43 km per pixel. (B) Schematic of viewing geometry.
0.0 l l llllNereid disk integrated brightness
10
c -1.0
-2.0
40 60 80Solar phase angle (degrees)
Fig. 41. Disk-integrated phase curve for Nereid.The photometric data were extracted from 15-sexposures taken through the narrow angle clearfilter during the last 12 days of approach.
The present cratering rates on the satel-lites, estimated from methods described ear-lier (76) and from the conservative estimateofthe Neptune family comet population, aregiven in Table 5. At Triton, the conserva-tively estimated present production of cra-ters >10 km in diameter is about half thepresent rate on Earth (80) and similar to theaverage rate on the Moon over the last 3.3billion years. At this rate, the craters ob-served on most of the sparsely crateredterrains (marked sv and sh in Fig. 31) ofTriton could all have been generated in thelast billion years or so.Even at the conservatively estimated cra-
tering rates, the small, innermost satellites1989N5 and 1989N6 are not likely to havesurvived intact over the last 3.5 billion years.These satellites are probably fragments pro-
duced by catastrophic disruption of a largerbody in the last 2 or so billion years, possi-bly even in the last half-billion years.1989N2, 1989N3, and 1989N4, on theother hand, might have escaped destructionby comet impact at the present rate, butwould almost certainly have been destroyedby collisions during an early period ofheavybombardment. The rate of cratering onthese satellites by comet impact is aboutthree to five times higher than on 1989N1;this result is independent of the estimate ofthe comet population. The large craters ob-served on 1989N1 suggest a fluence ofimpacting bodies that would have destroyed1989N2, 1989N3, and 1989N4. Most like-ly these satellites are the product of a disrup-tion of a body comparable in size to1989N1 near the end of the heavy bom-
Table 5. Estimated present cratering rates and past production of large craters on the satellites ofNeptune. The entries are as follows: P > 10 km is the estimated present rate of production of craters>10 km diameter in units of 10 to 14. Dmax is the diameter of the largest crater likely to have beenformed in 3.5 billion years at the current rate of cratering. Frsat is the frequency ofproduction ofcraterswith diameters larger than the radius ofthe satellite over a time period of 3.5 billion years. The columnheaded D > Rs.t gives the number of craters with diameters greater than the radius of the satellite thatwould have been formed while the observed craters on Ni were formed.
Present rate Ni equivalentSatellite Implications for
P > 10 km (kma) Frsat D > Rsat impact history
Nereid 0.06 8.8 0.0015 0.01 Little modification by comet impactsin last 3.5 billion years.
Triton 0.84 193 0.014 0.1 Oldest cratered surfaces probablyabout 3.5 billion years old.Youngest crater surfaces probablyless than 0.5 billion years old.
NI 5.7 81 0.14 1.0 Observed surface probably dates toperiod of heavy bombardment.
N2 16 66 0.44 3.2 These satellites probably wereN4 21 71 0.60 4.4 derived from fragmentation of aN3 29 70 0.85 6.2 larger body near the end of heavy
bombardment.
N5 41 46 1.4 10 Probably formed by fragmentationof larger parent body about 2 to
N6 50 35 1.8 13 2.5 billion years ago.
I448
bardment period or somewhat later. DistantNereid appears to have been almost immuneto collisional disruption by comet impact inthe period since heavy bombardment.
REFERENCES AND NOTES
1. B. A. Smith et al., Science 233, 43 (1986).2. B. A. Smith et al., ibid. 204, 951 (1979); ibid. 206,
927 (1979).3. J. W. Warwick et al., ibid. 246, 1498 (1989).4. H. B. Hammel et al., ibid. 245, 1367 (1989).5. B. A. Smith and G. E. Hunt, in Jupiter, T. Gehrels,
Ed. (Univ. of Arizona Press, Tucson, 1976), pp.564-585.
6. H. B. Hammel, Bull. Amer. Astron. Soc., in press.7. The Voyager images were processed with software
that greatly reduces limb darkening or limb bright-ening. Specifically, a Minnaert function was usedwith k = 0.7.
8. H. B. Hammel, K. H. Baines, J. T. Bergstralh, Icarus80, 416 (1989).
9. W. H. Smith, W. V. Schempp, K. H. Baines,Astrophys. J. 343, 450 (1989).
10. K. H. Baines and W. H. Smith, Icarus, in press.11. J. B. Pollack et al., ibid. 65, 442 (1986); J. B. Pollack
et al., J. Geophys. Res. 92, 15037 (1987).12. K. H. Baines and J. T. Bergstralh, Icanrs 65, 406
(1986).13. P. N. Romani and S. K. Atreya, Geophys. Res. Lett.
16, 941 (1989).14. G. L. Tyler et al., Science 246, 1466 (1989).15. The radiative transfer model was a multilayer model
based on the delta-Eddington approximation. Thebackground atmosphere contained stratosphericaerosols, a methane cloud, and an optically thickcloud whose top was at 3 bars. Parameters wereadjusted so the background model matched ground-based spectrophotometry in the visible and nearinfrared. A cloud layer was introduced to represent afeature; its optical depth and altitude were adjust-able parameters.
16. We assumed that the product ofthe single-scatteringalbedo and phase function was independent of alti-tude. This product, determined from the value ofthenearly constant brightness at low altitudes, wassignificantly greater (by a factor of 1.7) than thatexpected just from Rayleigh scattering, implyingthat scattering by stratospheric aerosols makes animportant contribution to the observed brightness.
17. H. G. Solberg, Planet. Space Sci. 17, 1573 (1969);L. A. Youngblood and R. F. Beebe, Nature 280, 771(1979).
18. B. A. Smith et al., Bull. Am. Astron. Soc. 11, 570(1979); R. J. Terrile and B. A. Smith, ibid. 16, 657(1984); H. B. Hammel, Icanrs 80, 14 (1989).
19. H. B. Hammel, Science 244, 1165 (1989).20. B. Conrath et al., ibid. 246, 1454 (1989).21. Another stability condition involves the potential
vorticity q which is given by (C + J)l/h, where ; is therelative vorticity (approximately -duldy), u is thezonal velocity, y is the northward coordinate,f is 2
SCIENCE, VOL. 246

Msingp, and h is the thickness (mass per unit area) ofthe atmospheric layer. A zonal flow is stable whenthe latitudinal gradient of q is positive everywhere.Although we do not know ; accurately, (; + j) islikely to vary as fi which is proportional to sin(p.Thus, 1; +fl is large at the poles and zero at theequator. Because the interior of Neptune rotatesfaster than the atmosphere at most latitudes, thepressure surfaces become more oblate with increas-ing depth below the cloud tops. This means that thethickness h of the layer just below the cloud tops isalso large at the poles and small at the equator. Thepotential vorticity q = (C + J)lh might then be near-ly constant in each hemisphere, merely changingsign at the equator. A constant-potential-vorticityatmosphere is marginally stable and is diagnostic ofhorizontal mixing [P. S. Marcus, Nature 331, 693(1988); T. E. Dowling and A. P. Ingersoll, J.Atmos. Sci., in press].
22. H. J. Reitsema et al., Science 215, 289 (1982); C. E.Couvault et al., Icarus 67, 126 (1986); W. B. Hub-bard et al., Nature 319,636 (1986); P. D. Nicholsonet al., in preparation.
23. B. A. Smith et al., Science 212, 163 (1981); B. A.Smith et al., ibid. 215,504 (1982); J. N. Cuzzi et al.,in Planetary Rings, R. Greenberg and A. Brahic, Eds.(Univ. of Arizona Press, Tucson, 1984), pp. 73-199.
24. A. L. Lane et al., Science 233, 65 (1986); J. Colwellet al., Icarus, in press.
25. P. Goldreich and S. Tremaine, Annu. Rev. Astron.Astrophys. 20,249 (1982); T. G. Northrop and J. E.P. Connerney, Icarus 70, 124 (1987); L. R. Doyle etal., ibid. 80, 104 (1989); J. N. Cuzzi and R. H.Durisen, ibid., in press; L. W. Esposito and J. E.Colwell, Nature 339, 605 (1989).
26. J. J. Lissauer, Nature 318, 544 (1985).27. P. Goldreich, S. Tremaine, N. Borderies, Astron. J.
92, 490 (1986).28. A. R. Dobrovolskis, Icarus 43, 222 (1980); N.
Borderies, ibid. 77, 135 (1989); A. Dobrovolskis, inpreparation.
29. A. L. Lane et al., Science 246, 1450 (1989).30. Two sets of images were included in the search,
yielding nearly full azimuthal coverage from anorbital radius of 34,000 km to 65,000 km, withpartial coverage out to 90,000 km. The first setconsisted of94 narrow angle images, taken with 61-s exposures and resolutions that varied from 76 to88 km per line pair. The second set had 40 narrowangle images, taken with an exposure of 15 s and aresolution of 37 km per line pair. For a point source,the change in resolution for the second set of datanearly compensates for the reduced exposure time.This results in both sets yielding virtually the samelimit of detectability.
31. M. Ockert et al., J. Geophys. Res. 92, 14969 (1987);L. R. Doyle et al., Icarus 80, 104 (1989); H. C.Dones, thesis, University of California, Berkeley,1989.
32. M. Ockert et al., Bull. Amer. Astron. Soc. 20, 854(1988); M. Showalter and J. Cuzzi, ibid., p. 855.
33. The equivalent width is defined as E = f(I/F)dr =[4w0)P(a)/cosO]fJrdr, where (ifthe incident solar fluxis irF) IIF is the ring reflectivity, equaling unity for aperfectly reflecting Lambert disk illuminated andviewed at normnal incidence. The IIF is defined interms of the particle single scattering albedo wo andphase function P(a), the viewing angle from the ringnormal 0, and the ring normal optical depth T. Thequantity fTdr is often referred to as the equivalentdepth. The optical depth and equivalent depth usedhere may differ by a factor of two from thosedetermined from ground-based stellar occultationmeasurements because of diffraction corrections.[For further discussion, see J. Cuzzi et al., in Plane-tary Rings, R. Greenberg and A. Brahic, Eds. (Univ.of Arizona Press, Tucson, 1984) pp. 73-199; and
R. G. French etal., in Uranus, J. Bergstralh and M. S.Matthews, Eds. (Univ. of Arizona Press, Tucson,1989), in press.]
34. N. Divine and P. Nicholson, private communica-tion.
35. P. Nicholson et al., in preparation.36. S. Dermott et al., Nature 284, 309 (1980); A.
Dobrovolskis, in preparation.37. A. W. Harris, in Planetary Rings, R. Greenberg and
A. Brahic, Eds. (Univ. of Arizona Press, Tucson,1984), pp. 641-659.
38. P. Thomas, C. Weitz, J. Veverka, Icarus 81, 92(1989).
39. Compare Table 5; Table 3 of B. A. Smith et al.,Science 233, 43 (1986); Table 2 ofB. A. Smith et al.,ibid. 215, 504 (1982).
40. J. A. Burns et al., Icarus 44, 339 (1980); J. A. Bumset al., in Planetary Rings, R. Grecnberg and A. Brahic,Eds. (Univ. of Arizona Press, Tucson, 1984), pp.200-272.
41. A. L. Broadfoot et al., Science 233, 74 (1986).42. W.-H. Ip, Icarus 60, 547 (1984); J. N. Cuzzi and R.
H. Durisen, ibid., in press.43. J. N. Cuzzi and J. A. Burns, ibid. 74, 284 (1988); J.
E. Colwell and L. E. Esposito, in preparation.44. L. W. Esposito and J. E. Colwell, Nature 339, 605
(1989); J. E. Colwell and L. W. Esposito, inpreparation.
45. C. C. Porco and P. Goldreich, Astron. J. 93, 724(1987); R. French et al., in Uranus, J. Bergstralh andM. S. Matthews, Eds. (Univ. Arizona Press, Tucson,1989), in press.
46. D. N. C. Lin et al., Mon. Not. Roy. Astron. Soc. 227,75 (1987); P. Goldreich, private communication.
47. M. S. Marley, W. B. Hubbard, C. C. Porco, Bull.Amer. Astron. Soc. 21, 913 (1989).
48. B. A. Smith, in Uranus and Neptune NASA CP-2330,J. T. Bergstralh, Ed. (National Aeronautics andSpace Administration, Washington, DC, 1984), pp.213-223.
49. D. P. Cruikshank and R. H. Brown, in Satellites, J.A. Bums and M. S. Matthews, Eds. (Univ. of Ariz.Press, Tucson, 1986), pp. 836-873.
50. D. P. Cruikshank, R. H. Brown, R. N. Clark, Icarus58,293 (1984); D. P. Cruikshank, R. H. Brown, L.P. Giver, A. T. Tokunaga, Science 245, 283 (1989).
51. R. H. Brown, T. V. Johnson, J. B. Pollack, inUranus, J. T. Bergstralh and M. S. Matthews, Eds.(Univ. of Ariz. Press, Tucson, in press).
52. D. J. Tholen and M. W. Buie, Bull. Amer. Astron.Soc. 20, 807 (1988).
53. T. V. Johnson, R. H. Brown, J. B. Pollack, J.Geophys. Res. 92, 14884 (1987); W. B. McKinnonand S. Mueller, Geophys. Res. Lett. 16, 591 (1989);D. P. Sirnonelli and J. B. Pollack, Icarus, in press.
54. M. J. Lupo, Icarus 52, 40 (1982).55. J. B. Pollack, J. A. Burns, M. E. Tauber, ibid. 37,
587 (1979); W. B. McKinnon and A. C. Leith, ibid.,in press.
56. P. Goldreich, N. Murray, P. Y. Longaretti, D.Banfield, Science 245, 500 (1989).
57. E. Anders and N. Grevesse, Geochem. CosmochimicaActa 53, 197 (1989).
58. D. G. Jankowski, C. F. Chyba, P. D. Nicholson,Icarus 80, 211 (1989).
59. 0. G. Franz, ibid. 45, 602 (1981).60. J. Goguen, H. B. Hammel, R. H. Brown, ibid. 77,
239 (1989).61. B. J. Hapke, J. Geophys. Res. 86, 3039 (1981);
Icanrs 59, 41 (1984); ibid. 67, 264 (1986). Anonlinear, least-squares approach was used to obtainbest-fit Hapke parameters [P. Helfenstein, ibid. (inpress)] 6(violet) = 30; w(green) = 0.996. It shouldalso be noted that the Voyager data indicate thatTriton's surface is photometrically heterogeneousand these represent global averages.
62. B. Buratti, Icarus 61, 208 (1985).63. A. Verbiscer and J. Veverka, Bull. Amer. Astron. Soc.
20, 872 (1988).64. D. J. Tholen, personal communication.65. J. F. Bell, R. N. Clark, T. B. McCord, D. P.
Cruikshank, Bull. Amer. Astron. Soc. 11, 570(1979).
66. D. P. Crnikshank, A. Stockton, H. M. Dyck, E. E.Becklin, W. Macy, Icarus 40, 104 (1979).
67. L. M. Trafton, in Uranus and Neptune NASA CP-2330, J. T. Bergstralh, Ed. (National Aeronauticsand Space Administration, Washington, DC, 1984),pp. 481-496.
68. L. Broadfoot et al., Science 246, 1459 (1989).69. W. R. Thompson, B. Murray, B. N. Khare, C.
Sagan, J. Geophys. Res. 92, 14933 (1987); L. J.Lanzerotti and W. L. Brown, in Proceedings of theNATO Advanced Research Workshop on Ices in theSolar System, Nice, France (1984); G. Strazzulla, L.Calcagno, G. Foti, Mon. Nat. Roy. Astron. Soc. 204,59 (1983).
70. J. S. Kargel and S. K. Croft, Lunar Planet. Sci. Conf:XX, 500 (1989); D. G. Jankowski and S. W.Squyres, Science 241, 1322 (1989); D. J. Stevensonand J. I. Lunine, Nature 323, 46 (1986).
71. S. K. Croft and L. A. Soderblom, in Uranus, J. T.Bergstralh and M. S. Matthews, Eds. (Univ. ofAriz.Press, Tucson, in press).
72. C. P. McKay, J. B. Pollack, A. P. Zent, D. P.Cruikshank, R. Courtin, Geophys. Res. Lett. 16, 973(1989).
73. J. B. Pollack and J. N. Cuzzi, J. Atmos. Sci. 37, 868(1980); K. N. Liou, Q. Cai, J. B. Pollack, J. N.Cuzzi, Appl. Opt. 22, 3001 (1983).
74. M. W. Schaefer and B. E. Schaefer, Nature 333, 436(1988).
75. T. V. Johnson and T. R. McGetchin, Icarus 18, 612(1973).
76. E. M. Shoemaker and R. F. Wolfe, in Satellites ofJupiter, D. Morrison, Ed. (Univ. of Ariz. Press,Tucson, 1982), pp. 277-339.
77. , C. S. Shoemaker, Lunar Planet. Sci. Conf:XVII, 799 (1986).
78. E. Everhart, Astrophys. J. 10, L131 (1972); E.Everhart, in Comets-Asteroids-Meteorites, A. H. Del-semme, Ed. (Univ. of Toledo Press, Toledo, 1977),pp. 99-104.
79. M. Duncan, T. Quinn, S. Tremaine, Astrophys. J.328, L169 (1988); M. Duncan, T. Quinn, S.Tremaine, Icarus, in press.
80. E. M. Shocmaker, C. S. Shoemaker, R. F. Wolfe, inGlobal Catastrophes in Earth History, Lunar and Plane-tary Science Institute Cont. 673, 174 (1988).
81. We gratefully acknowledge the skill, hard work, andgood cheer of all our colleagues who helped usduring this final Voyager encounter, especially theVoyager Spacecraft Team, for providing us with ahealthy, reliable, obedient, and stable spacecraft withwhich to perform our imaging experiments. Specialthanks go to H. Marderness, G. Hanover, and E.Wahl for designing the image motion compensa-tion; G. Masters, M. Urban, B. Cunningham, andD. Rice for extended exposure capability; and ourown E. Simien for making every image available. Wethank our fellow scientists J. Bums, C. Ferrari, D.M. Janes, F. Rocques, and the analysts at MIPL,coordinated and directed by C. Avis and S. Lavoie:G. Gameau, H. Mortensen, C. Stanley, L. Wynn, L.Wainio, G. Yagi, D. Alexander, C. Levine, E. Run-kle, J. Yoshimizu, R. Mortensen, and D. Jensen. Wethank those at the USGS in Flagstaff for their help:K. Edwards, E. Eliason, T. Becker, J. Swann, K.Hoyt, R. Batson, J. Inge, P. Bridges, and H.Morgan. We also thank P. Goldreich, P. Nicholson,D. Stevenson, and R. West for careful and thought-ful reviews of this manuscript.
6 November 1989; accepted 15 November 1989
IS DECEMBER I989 REPORTS 1449